modeling electroporation of the non-treated and vacuum impregnated heterogeneous tissue of spinach...
TRANSCRIPT
�������� ����� ��
Modeling electroporation of the non-treated and vacuum impregnated hetero-geneous tissue of spinach leaves
Katarzyna Dymek, Lea Rems, Barbara Zorec, Petr Dejmek, FedericoGomez Galindo, Damijan Miklavcic
PII: S1466-8564(14)00136-2DOI: doi: 10.1016/j.ifset.2014.08.006Reference: INNFOO 1217
To appear in: Innovative Food Science and Emerging Technologies
Received date: 24 May 2014Accepted date: 25 August 2014
Please cite this article as: Dymek, K., Rems, L., Zorec, B., Dejmek, P., Galindo, F.G.& Miklavcic, D., Modeling electroporation of the non-treated and vacuum impregnatedheterogeneous tissue of spinach leaves, Innovative Food Science and Emerging Technologies(2014), doi: 10.1016/j.ifset.2014.08.006
This is a PDF file of an unedited manuscript that has been accepted for publication.As a service to our customers we are providing this early version of the manuscript.The manuscript will undergo copyediting, typesetting, and review of the resulting proofbefore it is published in its final form. Please note that during the production processerrors may be discovered which could affect the content, and all legal disclaimers thatapply to the journal pertain.

ACC
EPTE
D M
ANU
SCR
IPT
ACCEPTED MANUSCRIPT
1
Modeling electroporation of the non-treated and vacuum impregnated heterogeneous tissue of spinach leaves
Katarzyna Dymek1*, Lea Rems2, Barbara Zorec2, Petr Dejmek1, Federico Gómez
Galindo1, Damijan Miklavčič2.
1Food Technology, Engineering and Nutrition, Lund University, Sweden. PO Box 124,
SE-221 00, Lund, Sweden.
2 Faculty of Electrical Engineering, University of Ljubljana, Trzaska 25, SI-1000
Ljubljana, Slovenia
*Corresponding author: Katarzyna Dymek, e-mail: [email protected],
Food Technology, Engineering and Nutrition, Lund University, Sweden. PO Box 124,
SE-221 00, Lund, Sweden, tel.: +46 462229806; fax: +46 4622 24622
Abstract
Uniform electroporation of the heterogeneous structure of spinach leaf cross section
is a technological challenge that is addressed in this investigation. Three dimensional
models were created with cells arranged in specific tissue types, considering a leaf
with its air fraction and a leaf where the air fraction was replaced by a solution of
known properties using vacuum impregnation. The models were validated before
electroporation, in the frequency domain, where an alternating voltage and current
signal at frequencies from 20 Hz to 1 MHz was used to measure conductivity of the
tissue. They were also validated through measurements of current during
electroporation when a single 250 µs rectangular pulse with amplitudes ranging from
50 to 500 V was applied. Model validations show that both the frequency depended
conductivity and electroporation are well predicted. The importance of the wax layer
and stomata in the model is thoroughly discussed.
ACC
EPTE
D M
ANU
SCR
IPT
ACCEPTED MANUSCRIPT
2
Key words: Spinach leaf, electroporation, numerical modeling
1. Introduction
Electroporation of a cell membrane is defined as an increase in its permeability
due to exposure of the cell to a sufficiently strong, external electric field (Kotnik,
Kramar, Pucihar, Miklavcic, & Tarek, 2012; Neumann & Rosenheck, 1972; Neumann,
Schaefer-Ridder, Wang, & Hofschneider, 1982; Zimmermann, Pilwat, & Riemann,
1974; Zimmermann & Vienken, 1982). Depending on the amplitude and duration of
the applied electric field, electroporation may occur in two forms: irreversible (Phillips,
Maor, & Rubinsky, 2011; Rowan, MacGregor, Anderson, Fouracre, & Farish, 2000)
or reversible (Glaser, Leikin, Chernomordik, Pastushenko, & Sokirko, 1988; Miklavčič
et al., 2012). For either purpose, theoretical studies coupled with experimental
investigation contribute to the understanding of events taking place in cells and
tissues during electroporation.
Theoretical studies of single cell electroporation have been conducted from
different perspectives. Aspects such as the dynamics of pore formation and the
transmembrane voltage distribution (DeBruin & Krassowska, 1999), electroporation
caused by bipolar pulses and dynamic pore radii (Talele, Gaynor, Cree, & van
Ekeran, 2010), the conductance of electroporated cell membrane (Suzuki et al.,
2011), the number of pores and pore radii in the cell membrane (Talele & Gaynor,
2010), the process of pore disappearance in the cell membrane (Saulis, 1997) and
the electroporation of intracellular membranes (Gowrishankar, Esser, Vasilkoski,
Smith, & Weaver, 2006; Retelj, Pucihar, & Miklavcic, 2013) have been widely studied
in the literature using single cell models. Electroporation was also studied by using a

ACC
EPTE
D M
ANU
SCR
IPT
ACCEPTED MANUSCRIPT
3
model of dense cell suspension (Mezeme, Pucihar, Pavlin, Brosseau, & Miklavčič,
2012).
Electroporation of tissues has attracted great attention. Electroporation is an
important technology used for medical purposes such as cancer treatment
(electrochemotherapy) (Yarmush, Golberg, Serša, Kotnik, & Miklavčič, 2014), where
the modeling of the electroporation process in the tissue becomes essential for
treatment planning (Pavliha, Kos, Zupanic, Marcan, Sersa, & Miklavcic, 2012;
Pavšelj & Miklavčič, 2008). In these models describing tissue electroporation, the
representation of the heterogeneity and anisotropy of the tissues becomes a
challenge. There are number of models describing electroporation in different types
of tissues such as tumors, muscle, liver and skin, where the heterogeneous tissue
layers are considered and the thermal effects of electroporation and transdermal drug
delivery are studied (Pavšelj & Miklavčič, 2011; Zorec, Becker, Reberšek, Miklavčič,
& Pavšelj, 2013). Electroporation of skin was also studied in terms of the effect of
bipolar pulses (Arena, Sano, Rylander, & Davalos, 2011). Three dimensional models
were used to evaluate the local electric field created in the anisotropic skeletal
muscle during the application of electric pulses (Corovic et al., 2010) and two
dimensional models of nerves, bloods vessels and ducts have been used to
theoretically analyze irreversible electroporation (Daniels & Rubinsky, 2009).
The models describing electroporation are however mostly focused on a
simplified geometry which shows the tissues as stacks of layers with specific bulk
properties. In this paper we use a three dimensional model, containing a well-defined
structure built from individual cells arranged in specific tissue types. Cells belonging
to a certain tissue possess shape, dimensions and location mimicking the tissues in
ACC
EPTE
D M
ANU
SCR
IPT
ACCEPTED MANUSCRIPT
4
the real spinach leaf. The entire cross section of the leaf was considered including
elements such as the cuticular wax and stomata.
Our aim was to investigate electroporation of the spinach leaf cross section by
developing a model which would enable us to meet the technological challenge of
achieving uniform electroporation in a highly heterogeneous structure in the context
of a process aimed at improving freezing stability of plant foods (Phoon, Gómez
Galindo, Vicente, & Dejmek, 2008; Shayanfar, Chauhan, Toepfl, & Heinz, 2013). The
influence of specific elements such as cell size, cell arrangement, cuticular wax layer
and stomata on the creation of pores (i.e. electroporation of the cell membranes
under different applied pulse parameters), was investigated. The effects of the
connections between cells and the air fraction in the tissue are also discussed. The
model was first analyzed in the frequency domain, where an alternating voltage and
current signal at frequencies from 20 Hz to 1 MHz was used to measure conductivity
in the tissue and validate the model.
2. Theoretical considerations
2.1. Spinach leaf structure
Spinach leaf has a typical thickness of 0.4 ± 0.1 mm. The cross section
of the leaf consists of different tissues arranged in four layers. The spinach cross
section is shown in Figure 1A, where leaves were incubated with fluorescein
diacetate as described by Dymek et. al (Dymek, Dejmek, & Gómez Galindo, 2014)
and examined under the microscope (Elipse Ti-U, Nikon, Japan). At the top of the
leaf cross section there is an upper epidermal tissue, which consists of a single layer
of star-shaped cells. Epidermal cells are covered by a cuticular wax layer.
Underneath the upper epidermis the palisade mesophyll is built from elongated cells

ACC
EPTE
D M
ANU
SCR
IPT
ACCEPTED MANUSCRIPT
5
which are formed by two cell layers. Below the palisade mesophyll, the spongy
mesophyll is located. It has a multi-cells layer structure characterized by round cells
distributed in a loose and apparently random structure. The majority of the
intercellular air fraction is located in the spongy mesophyll (Warmbrodt & Woude,
1990). The air fraction accounts for approximately 30% of the leaf volume (Winter,
Robinson, & Heldt, 1994). At the bottom, the lower epidermis is located.
2.2. Simplifications used to model the leaf
The model represents the internal tissues of a spinach leaf, restricting
the elements included in the model to the essential ones. The leaf tissue possesses
an extremely complex structure; therefore, the following simplifications were
introduced into the model.
Veins were not included in the model. Since obtaining a time-dependent,
finite-element solution for a 3D model with complex structure consisting of multiple
cells is relatively demanding with respect to computational time and random-access
memory requirement, only a small part of the leaf with area 107 μm × 107 μm was
modeled. In the spinach leaf the minor veins are located within the distance from 49
to 231 µm (Warmbrodt & Woude, 1990) and were neglected in the model.
In the leaf the majority of the air fraction is located in the spongy
mesophyll. Therefore, in the model, air fraction was neglected in the epidermal tissue
and palisade mesophyll. In these tissues the cells were completely surrounded by
extracellular liquid. However, in the spongy mesophyll the cells were surrounded by a
thin layer of extracellular liquid, which mimics the apoplastic pathway (space between
the cell membrane and the cell wall) and connects all the cells in the spongy

ACC
EPTE
D M
ANU
SCR
IPT
ACCEPTED MANUSCRIPT
6
mesophyll. This thin layer was then directly surrounded by air, avoiding the need to
specifically include the cell walls.
The shape of the epidermal cells was also simplified to avoid too
complex structure leading to excessive number of finite elements in the model and
meshing problems. In the spinach leaf, epidermal cells are star-shaped, whereas in
the model they are represented as blocks.
3. Numerical model
COMSOL Multiphysics 3.5a (COMSOL AB, Stockholm, Sweden),
commercial finite element software package, was used to perform calculations of the
leaf conductivity at different frequencies when AC voltage was applied, and to
simulate pore formation in the cell membranes when DC voltage (electroporative
electric pulse) was applied.
3.1. Geometry of the model
The model of the spinach leaf cross section was created based on
microscopic pictures from previously published papers (Warmbrodt & Woude, 1990;
Winter et al., 1994) as well as our observations and measurements.
The model represents a part of the spinach leaf with an area of 107 µm
× 107 µm and thickness of 420 µm. Figure 1B shows how the cells were arranged in
the four tissue layers: lower and upper epidermis and mesophyll differentiated into
palisade and spongy cells. The proportions of the tissues were based on the
micrographs (Warmbrodt & Woude, 1990; Winter et al., 1994). Epidermal cells were
presented as blocks with dimensions 45 µm × 45 µm × 27 µm (Figure 1D). There was
a single layer with four epidermal cells located at the bottom and top of the leaf.
Palisade mesophyll cells were presented as 54 µm long cylinders having a diameter

ACC
EPTE
D M
ANU
SCR
IPT
ACCEPTED MANUSCRIPT
7
of 50 µm (Figure 1E). They were arranged in two layers, each consisting of four cells.
Spongy mesophyll is the most irregularly structured tissue due to its high air fraction.
Therefore, to examine the influence of the cell distribution and size on the electrical
properties of the spinach leaf, three models with different arrangements of spongy
mesophyll cells were built, as shown in Figure 2. Model A contained two large spongy
mesophyll cells with diameter of 100 µm; model B contained 4 rows of cells having
diameter of 50 µm, with 4 cells placed in each of the rows; and model C contained
randomly located spongy mesophyll cells with two different diameters: 50 and 40 µm.
Additionally, model D was built, which had the same cell arrangement as
model B. However, at the top and bottom of the leaf there were also 0.3 µm thick
cuticular wax layers (Hardin, Jones, Weckler, Maness, Dillwith, & Madden, 2013;
Riederer & Schreiber, 2001) (Figure 1C). Both wax layers contained ellipsoidal holes
filled with air (10 µm long and 4.5 µm wide), which were extended further into the
epidermal tissue in the shape of elliptic cylinders, representing the stomata (Figure
1C and 1G, marked with green).
3.2. Connections between cells
The proper function of the whole plant organism is enabled by
connections between cells. Since the cells are surrounded by non-conductive air
fraction, their connections influence significantly the current flow through the tissues.
In the model, the air fraction was included only in the spongy mesophyll. To model
the connections between cells (the apoplastic pathway), in each of the different
models (A, B, C and D) the spongy mesophyll cells were surrounded by a thin layer
of extracellular fluid (shown in black in Figure 1C and also in white in side views of
the models in Figure 2). This layer was built by slightly increased and elongated
elements overlapping each other at the poles; the minimum thickness of the layer

ACC
EPTE
D M
ANU
SCR
IPT
ACCEPTED MANUSCRIPT
8
was 0.5 μm, whereas at the poles of the spongy cells, its thickness was increased to
4 μm, to allow connecting the cells. The rest of the volume in spongy mesophyll was
filled with air. The interface between the layer representing the apoplastic pathway
and the air then mimicked the cell walls.
Another model was built representing a vacuum impregnated leaf, where
the air fraction was removed and all cells were surrounded by an external solution of
known properties, resulting in a continuously conductive pathway trough the leaf. In
this case, the connections between cells were neglected. The cell walls could be
omitted as well, because they neither influence the electroporation process nor the
transport of small molecules (Kandušer, & Miklavčič, 2008).
3.3. Model parameters
To model the electrodes, an electric potential was assigned to the upper
and lower boundaries of the leaf model. One side was grounded and the other was
excited by a single, rectangular 250 µs pulse with amplitudes ranging from 50 to 500
V. The pulse was modeled as described by Retelj et al. (2013) using the COMSOL
function flc1hs. The pulse rise and fall times were set to 1 µs. The vertical sides of
the model were modeled as electrically insulated. Mathematical equations describing
electroporation of the cell membrane were taken from DeBruin and Krassowska
(DeBruin & Krassowska, 1999) and the method for calculating the induced
transmembrane voltage was adopted from Pucihar et. al. (Pucihar, Miklavcic, &
Kotnik, 2009). Electric potential was calculated by
(1)

ACC
EPTE
D M
ANU
SCR
IPT
ACCEPTED MANUSCRIPT
9
where and are the conductivity and dielectric permittivity, respectively. The cell
membrane was modeled using Distributed Impedance boundary condition by
(2)
where is the current density through the cell membrane, is the unit vector normal
to the membrane surface, and are the potentials on each side of the
membrane, is the membrane thickness, is the membrane conductivity and
is the membrane dielectric permittivity. A difference between the electric potential on
each side of the boundary gives the induced transmembrane voltage (ITV).
The differential equation describing the dynamics of pore formation is
(3)
where is the pore density, is the pore density in non-electroporated cell
membrane and and are electroporation parameters. Formation of pores
considerably increases the conductivity of the cell membrane. This increase in
conductivity due to electroporation can be calculated as (DeBruin & Krassowska,
1999)
(4)
where is the radius and is the internal conductivity of a pore.
is the nondimensional transmembrane voltage, where F is the Faraday constant,
R is the universal gas constant, and T is the temperature. Parameter represents
the length of pore entrance area, and accounts for the energy cost for moving an
ion from a region of high dielectric constant (water) to a small pore in the lipid bilayer

ACC
EPTE
D M
ANU
SCR
IPT
ACCEPTED MANUSCRIPT
10
with low dielectric constant. The total membrane conductivity, as used in (2), is then
calculated in each time step as the sum of the passive membrane conductivity (given
in Table 1) and .
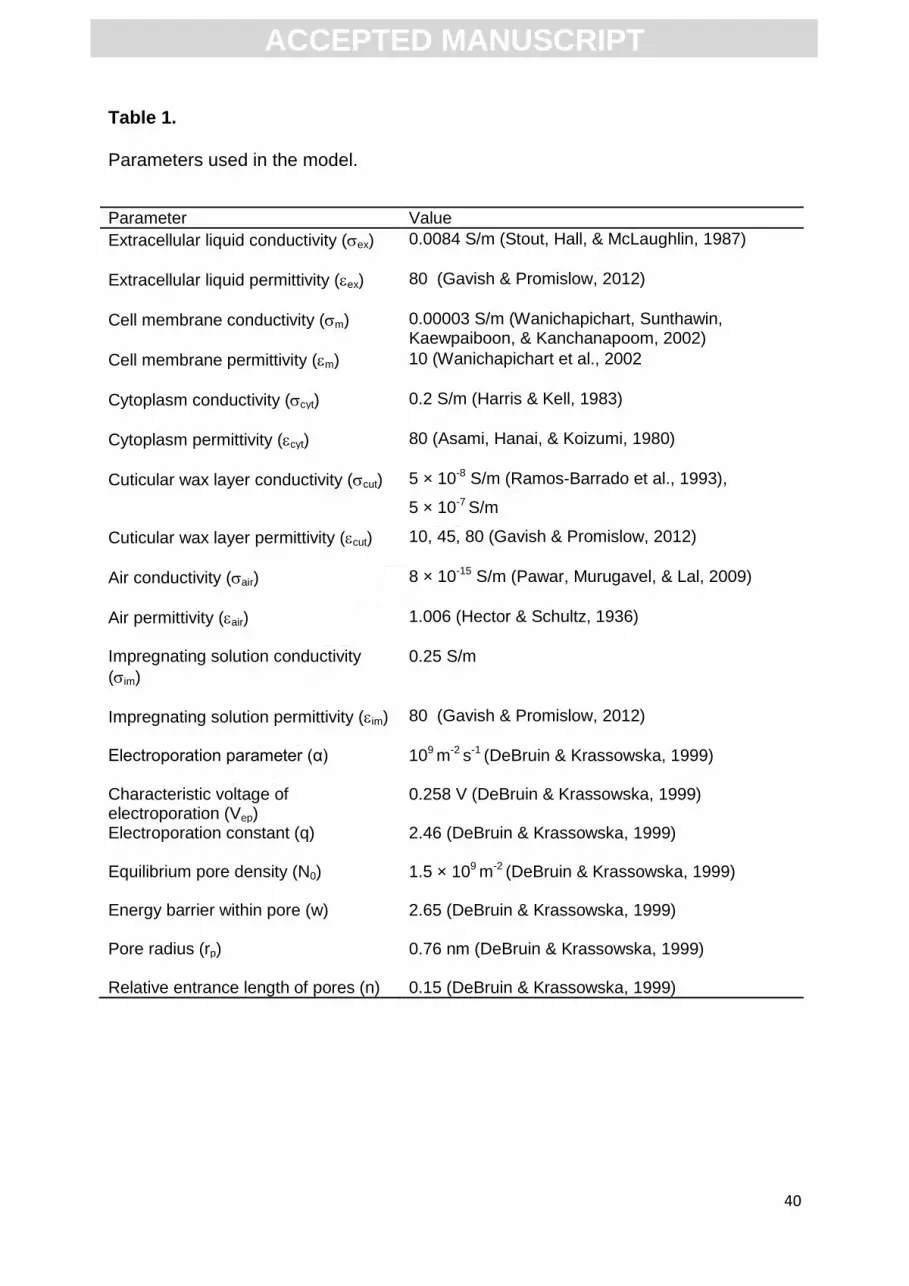
The conductivity and relative permittivity of the particular elements, such as
cytoplasm and cell membranes, were set according to the published data and are
listed in Table 1.
4. Measurements
4.1. Raw material
Spinach leaves were collected from the local supermarket. Leaves were
stored at 1-2 oC in closed plastic bags and used for experiments until the expiration
date established by the producer (9 days from the packaging date). Leaves of similar
size (6 ± 0.5 cm long and 2.5 ± 0.3 cm wide) were selected for the experiments.
4.2. Measurements of leaf electric conductivity
Samples (1 cm × 1 cm) were cut from the leaf. Each sample was cut in
the same spot at the center of the leaf, from the central vein towards the edge.
Samples were immersed in a 0.25 S/m PBS buffer (Phosphate Buffered Saline) and
placed between two flat stainless steel electrodes, which were smaller than the
sample, hence a leaf area of 64 mm2 was enclosed between the electrodes.
Conductivity of the PBS was measured with a conductivity meter (Orion 150, Orion
Research Inc., Jacksonville, FL, USA). Electrodes were squeezed with a plastic
clamp and connected to an Impedance Analyzer (4192A LF, Hewlett Packard,
California, USA). A sinusoidal signal of 1 V amplitude was applied to the leaf samples
and the resistance (in Ohms) was recorded at frequencies from 20 Hz to 1 MHz. The

ACC
EPTE
D M
ANU
SCR
IPT
ACCEPTED MANUSCRIPT
11
measurement was done for untreated samples (with air fraction) and for samples
after vacuum impregnation (without air fraction).
4.2.1. Evaluation of the effect of the air fraction on leaf electric conductivity
To determine the influence of the air fraction on the electrical properties
of the spinach leaf and to analyze the importance of its presence in the model, the air
fraction of the leaf was removed and replaced by an external solution using vacuum
impregnation.
Three leaves were immersed in 100 ml PBS buffer with conductivity of
0.25 S/m. Immersed leaves were placed in a vessel connected to a vacuum pump
and vacuum controller (S.I.A, Bologna, Italy) as described by Panarese et. al (2013).
The pressure was decreased to 150 mbars in 3.5 min. It was kept constant at 150
mbars for 1 min and increased for 4.5 min until atmospheric pressure was recorded.
Samples were kept under atmospheric pressure for 10 min. The entire cycle was
repeated twice (Demir, 2012). The relative increase in the leaf mass after vacuum
impregnation was 39 ± 5%.
4.3. Measurements of current changes during electroporation
Leaves were placed between two flat stainless steel electrodes. The gap
between electrodes was 4 mm and it was filled with PBS buffer of conductivity 0.25
S/m. The area of the leaf samples enclosed between the electrodes was 64 mm2. A
single electric pulse of 250 µs with amplitude of 50, 100, 200, 300, 400 or 500 V was
applied. The pulse was delivered by a CEPT® electroporator (ARC AROMA PURE,
Lund, Sweden). The current was recorded by a scopemeter (Fluke 123, Industrial
Scopemeter, Washington, USA) equipped with a current probe.

ACC
EPTE
D M
ANU
SCR
IPT
ACCEPTED MANUSCRIPT
12
5. Results and discussion
5.1. Influence of the cell size, cell arrangement, cuticular wax layer and stomata on
the frequency-dependent conductivity of the spinach leaf model
Results obtained using models A–C (Figure 2) were compared with
measurements of the frequency-dependent conductivity of the spinach leaves (Figure
3). When comparing models A–C with experimental measurements, it can be clearly
seen that the models resulted in higher conductivity values for frequencies lower than
10 kHz and failed to predict the increase in conductivity measured from 100 kHz to 1
MHz. Furthermore, results obtained from models A, B and C show that the influence
of the spongy mesophyll cell size and cell arrangement on the calculated conductivity
is not significant. Two large cells located in the spongy mesophyll (Figure 2, model A)
showed very similar conductivity (differed by 0.15 mS/m) as 16 cells located in the
spongy mesophyll (Figure 2, model B) at 10 Hz. Randomly located cells (Figure 2,
model C) resulted in slightly lower conductivities.
Model D (Figure 2) contains additional elements to model B: cuticular
wax layer and stomata, which has significant influence on the overall electrical
properties of the spinach leaf. Model D resulted in conductivity values increasing from
0.56 mS/m at 10 Hz to 4 mS/m at 1 MHz and was thus the only one able to predict
(at least qualitatively) the measured increase in conductivity with increasing
frequency. This clearly demonstrates that the electrical properties of the cuticular wax
layer predominantly determine the properties of the leaf in the observed frequency
range (stomata were filled with air and hence could not contribute to the calculated
increase in conductivity). This also explains why models A–C, although possessing
different cell size and arrangement, responded similarly; the polarization of cell

ACC
EPTE
D M
ANU
SCR
IPT
ACCEPTED MANUSCRIPT
13
membranes (known as the Maxwell-Wagner effect) does not considerably affect the
calculated overall conductivity of the leaf at this frequency range.
One can also note that at high frequencies (>10 kHz) model D with
cuticular wax layer gives similar results as models A, B and C without cuticular wax.
This means that at these frequencies, the cuticular wax becomes electrically
‘transparent’ and the rest of the leaf tissues determine the leaf conductivity. Since the
values predicted by the model are lower compared to the measured conductivity for
frequencies above 10 kHz, apparently the model underestimates the overall
conductivity of internal leaf tissues. This may be due to different factors such as the
number of cell membranes, cell volumes, as well as extra- and intracellular
conductivities. An important factor influencing the disagreement between the data
obtained theoretically and experimentally may also be the connections between the
cells. In the plant tissue all cells are connected by the plasmodesmata for the proper
functioning of the whole organism. The symplast, which is the continuum created by
the connected cytoplasms, is not included in the model, since the cells are modeled
as membrane-separated elements. The symplast may influence the electrical
properties of the tissue by creating additional conductive pathways to the apoplast.
The air fraction is clearly another factor influencing the disparity of the
theoretical and experimental results. The average amount of air in the tissue is
known, however the location and the size of the air spaces is not uniform in the highly
unorganized structure, while in the model the structure is simplified and symmetrical.
Moreover, there are assumptions made considering the conductivities of
the cytoplasm and extracellular liquid. The values are taken from previously
published data (Table 1), which may also introduce certain differences between the
theoretical and experimental data.
ACC
EPTE
D M
ANU
SCR
IPT
ACCEPTED MANUSCRIPT
14
5.2. Influence of the air fraction on the conductivity of the spinach leaf
To avoid the randomness introduced by the air fraction in plant tissues, a
model without the air fraction was created and investigated. The model of vacuum
impregnated leaf is simpler, and hence, less random than the model of non-treated
leaf as the connections between cells and the air fraction is removed. The air fraction
was exchanged with a solution of 0.25 S/m conductivity. The model was compared to
the experimental data obtained by investigating the conductivity of the leaf samples
after vacuum impregnation. For investigating the vacuum impregnated leaf, model D
was chosen (4 rows, 4 cells per row). Opened stomata after vacuum impregnation
(which were observed under the microscope – results not shown) suggest that they
were not fully flooded with buffer after the vacuum impregnation process (Sibbernsen
& Mott, 2010). Therefore, in the model representing the vacuum impregnated leaf
(without air fraction) stomata were filled with air.
In section 5.1. we stressed the important influence of the cuticular wax
layer on the overall conductivity of the leaf. However, to the best of our knowledge,
there are no studies describing the conductivity and permittivity of the spinach
cuticular wax layer. For this reason we tested different values of cuticular wax
conductivity and permittivity and compared the calculated results with experimental
measurements. The conductivity of tomato cuticular wax, 5 × 10⁻⁸ S/m, was taken as
a reference from the existing literature (Ramos-Barrado, Benavente, & Heredia,
1993), and in addition, higher conductivity of 5 × 10⁻⁷ S/m was also tested. The
relative permittivity of the cuticular wax was investigated in the range from 10 to 80,
since it is composed from a cuticle matrix with a relative permittivity of approximately

ACC
EPTE
D M
ANU
SCR
IPT
ACCEPTED MANUSCRIPT
15
10, containing aqueous pores filled with ionic solutes with relative permittivity of
approximately 80 (Schönherr, 2006).
Figure 4 shows the comparison of the theoretical and experimental data
of the vacuum impregnated leaf. The measured conductivity increases with frequency
(bold dashed line, Figure 4). All of the tested values of cuticular wax conductivity and
relative permittivity reasonably agreed with the measurements. However, the model
using 5 × 10⁻⁷ S/m (dashed line B, Figure 4) had the best prediction of the
conductivity values at low frequencies (10–1000 Hz). The final conductivity (at 1
MHz) is similar (90.2– 99.8 mS/m) for all tested conductivities and permittivities of the
wax layer, consistent with the previously noted observation that the cuticular wax
becomes electrically ‘transparent’ at this frequency, and its influence on the overall
leaf conductivity is negligible. The wider transition of the frequency-dependent
increase in the measured data compared to model predictions is also indicative of
multiple relaxation processes, which could be described by a constant phase
element, such as for tomato cuticle (Ramos-Barrado et al., 1993).
Indeed, the model of vacuum impregnated leaf even slightly
overestimates the measured conductivity at 1 MHz. In the model an ideal process of
vacuum impregnation (100% of the air is replaced by the solution) is considered,
which may have contributed to the observed discrepancy between the models and
experimental data. It was observed that when spinach leaves were impregnated with
a sugar solution and examined with micro X-ray tomography (Panarese, unpublished
data), random air pockets remained in the structure accounting for approximately 2–
3% of the total volume. These air pockets would decrease the general conductivity of
the leaf.
ACC
EPTE
D M
ANU
SCR
IPT
ACCEPTED MANUSCRIPT
16
5.3. Electroporation of the spinach leaf cross section
Electroporation of the vacuum impregnated spinach tissue was investigated
and compared with the theoretical results by measuring the electric current during the
pulse at applied voltages from 50 to 500 V (Figure 6). Since the leaf is covered with a
cuticular wax layer of high resistance, the stomata seem to play a critical role in the
electric field distribution within the leaf and the current flow through the leaf cross
section.
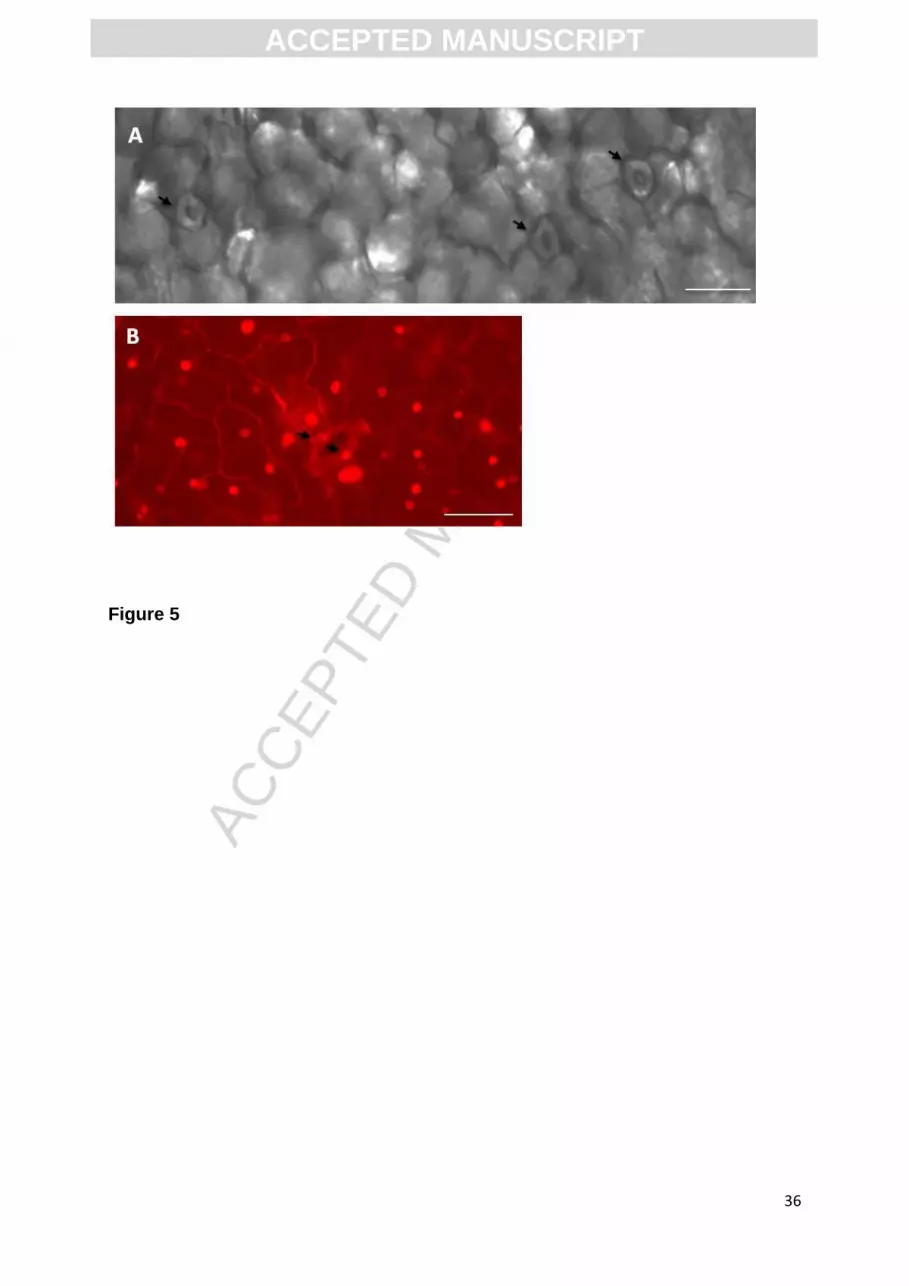
Stomata were investigated in two hypothetical situations (i) with air in the
stomata. This scenario is supported by microscopic observations (Figure 5 A), done
as described by Dymek et al. (2014), showing opened stomata (marked with arrows)
after vacuum impregnation. According to (Sibbernsen & Mott, 2010) stomata would
close if totally flooded with solution. (ii) It is assumed that electroporation provokes
leakage from electroporated cells with a consequent temporal wetting of the solution
of the guard cells of stomata. This scenario is supported by microscopic observations
(Figure 5 B) showing electroporated guard cells when propidium iodide was used as
an electroporation indicator (Dymek et al., 2014). With pulse amplitudes of 200 V –
500 V all the guard cells were uniformly electroporated within the leaf samples
(Figure 5 B). With pulse amplitude of 100 V, some of the guard cells in the leaf
sample were not electroporated and with pulse amplitude of 50 V, none of the
observed guard cells were electroporated. Electric current values obtained by the
models at 50 and 100 V are enclosed within the error bars of the measurements.
Cells wetting by electroporation may be regarded as temporal as it is well known that
a cell membrane that is partially damaged has the ability to recover even if the
damage has caused enhanced ion leakage. ATPase activity will help the cell to take
up leaked ions against the concentration gradient (Arora & Palta, 1991). We have

ACC
EPTE
D M
ANU
SCR
IPT
ACCEPTED MANUSCRIPT
17
here considered the application of a single pulse. It is worth to underline that if a train
of pulses would be applied to cause reversible permeabilization, the first pulse or
pulses affecting stomata will change the modeling situation from a tissue with air-
filled stomata to a tissue with stomata filled with cell sap.
In Figure 6, the current predicted for the two models based on the hypothetical
situations described above were compared with measured values of the current
during the application of the electric pulse. The model with cell sap in stomata shows
good agreement between theoretical and experimental values during the application
of electric pulses, whereas the model with air in stomata shows significantly lower
values than the measurements. The experimentally measured current increased from
0.1 A at 50 V to 4.5 A at 500 V. The model with air in stomata resulted in currents
from 0.00055 A at 50 V to 0.0054 at 500 V. The current obtained by solving the
model with solution in stomata was 0.33 A at 50 V and it increased up to 3.9 A at 500
V.
Figure 7 shows the calculated values of the resistance (i.e. inversed value of
conductance) of the spinach leaf cross section for voltages from 50 to 500 V. The
resistance was calculated from measured current by R = V/I, where R – resistance
(), V – voltage (V), I – current (A). The resistance decreased significantly as the
voltages applied were increased from 50 to 300 V and did not further decrease with
increasing amplitude of pulses from 300 V to 500 V. Electroporation of the cell
membranes causing the decrease of resistance is accompanied by the increasing
number of the average pore density calculated by the model (Figure 7). Figure 7 also
shows that pore density increases markedly in the range from 50 V to 300 V for both
models. At applied voltages in the range from 300 V to 500 V pore density however is
not further increased. We can conclude that the evolution of pore density
ACC
EPTE
D M
ANU
SCR
IPT
ACCEPTED MANUSCRIPT
18
corresponds well to the observed decrease in resistance as the function of the
applied pulse amplitude.
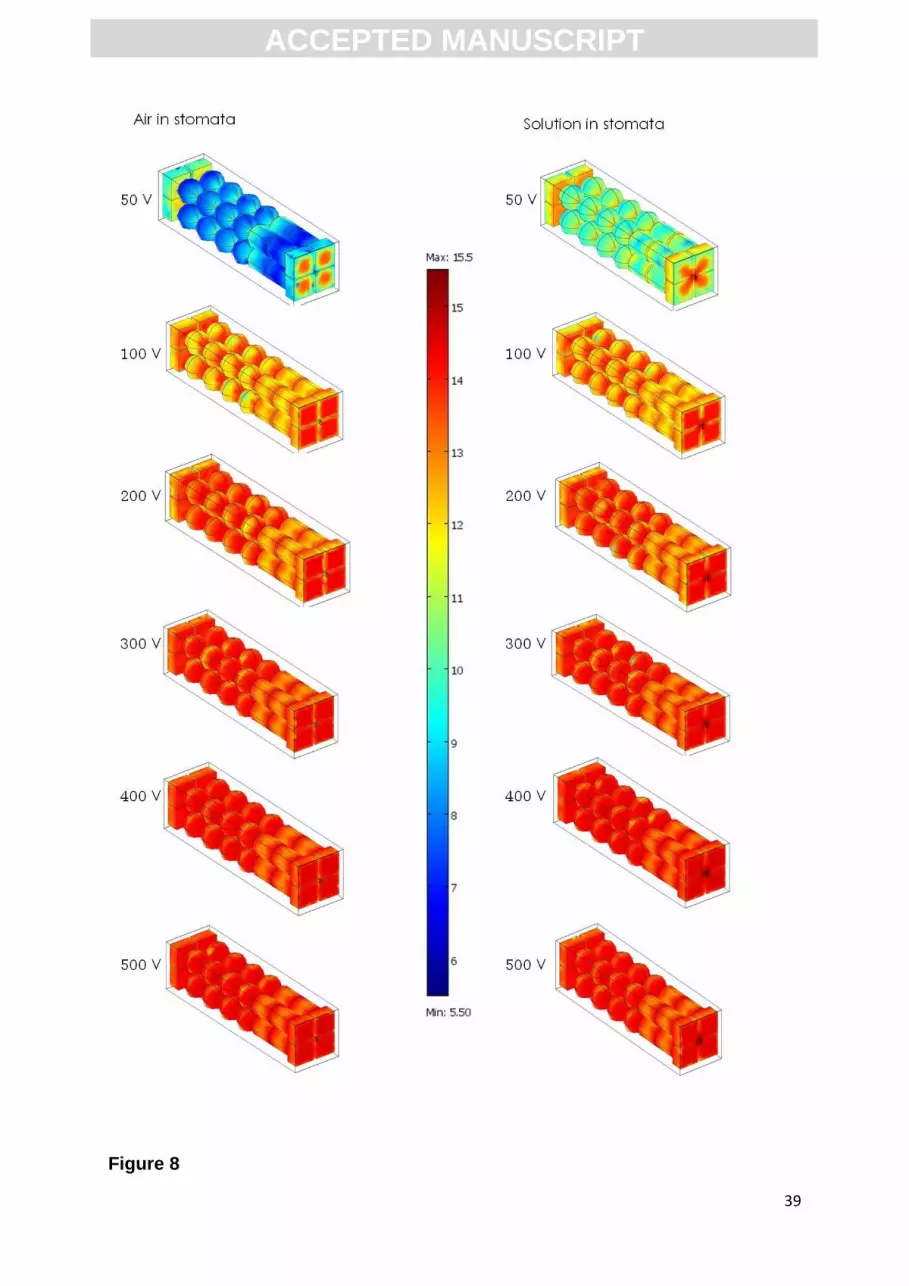
A detailed representation of pore density at various applied voltages,
indicating electroporation of the different types of cells in the entire cross section of
the leaf, was calculated as described by (DeBruin & Krassowska, 1999) and is shown
in Figure 8. The density of pores is compared between the model with air and the
model with cell sap in the stomata. The main difference in pore density can be seen
at 50 V, where the model with cell sap in the stomata results in higher pore density
than the model with stomata filled with air.
Even if the two tested models show very different results on the changes of
current with increasing voltage (Figure 6), the pore density in the range from 100 to
500 V is similar for the model with air in stomata and for the model with cell sap in
stomata (Figure 8). Since the resistance of the outer layers (upper and lower cuticular
wax) is significantly higher than the interior of the leaf cross section (epidermal,
mesophyll cells and solution surrounding the cells) the current is determined by the
stomata filled either with air or cell sap. However, the pore density is not influenced
by the change of settings in the models (air in stomata or cell sap in stomata) due to
the still significantly higher resistance of the cuticular wax layer from the internal
tissues, regardless of how stomata is filled.
At 50 V the model with air filled stomata is electroporated only at the external
surface of the epidermal cells, while the spongy and palisade mesophyll is slightly
electroporated. The model with solution in the stomata shows that at 50 V the
epidermal cells are electroporated mostly at the surface but also the internal tissues
(palisade and spongy mesophyll) are electroporated showing higher pore density
than that for the model with air in the stomata. Worth to highlight is the different

ACC
EPTE
D M
ANU
SCR
IPT
ACCEPTED MANUSCRIPT
19
pattern of pore formation at 50 V. For the model with stomata filled with air
electroporation starts at the central part of the epidermal cells surface, while in the
model with stomata filled with solution the pores are created around the stomata and
at the central part of the epidermal cells surface. With higher voltages (100 – 500 V)
the density of pore increases uniformly in all tissue types. Interesting, the progression
of pores density with higher applied voltage (from 100 V to 500 V) is similar for both
models. At 100 V the cells of all the tissue types are electroporated at the poles
facing the electric field direction. At 200 V it can be seen that the spongy mesophyll
cells are uniformly electroporated, while for the palisade mesophyll cells higher pores
density is still visible at the poles than at the sides. With higher voltages (300 – 500
V) the pores density becomes uniform for all the cells.
6. Conclusions
This study has focused on modelling electroporation of the complex
heterogeneous structure of spinach leaves. The following remarks underline
important findings:
1. In the model of vacuum impregnated leaf, the impregnating solution
considerably contributes to the conductive pathways through the leaf cross
section. The frequency-dependent conductivity obtained with the model of
vacuum impregnated leaf agrees well with the measurements. In the model of
nontreated leaf, however, the extent of conductive pathways was probably
underestimated.
2. The general conductivity of the leaf is significantly determined by the low
conductive wax layer. Since stomata are ‘holes’ in the wax layer, they play a
ACC
EPTE
D M
ANU
SCR
IPT
ACCEPTED MANUSCRIPT
20
crucial role in the current flow throughout the leaf cross section. The current
is, therefore, markedly affected if stomata are filled with air/gas or cell sap.
3. This theoretical investigation of electroporation shows that, under the
investigated PEF conditions, pores start to be created in the membranes of
epidermal cells at low voltages (50 V) and with higher voltages the pore
density becomes uniform in the entire leaf cross section.

ACC
EPTE
D M
ANU
SCR
IPT
ACCEPTED MANUSCRIPT
21
Acknowledgements:
This work was in part supported by the Slovenian Research Agency (ARRS) with program P2-0249 and IP-0510. Research was conducted within the scope of the European Associated Laboratory for Pulsed Electric Field Applications in Biology and Medicine (LEA EBAM). The article is a result of the networking efforts of COST Action TD1104 (www.electroporation.net). Part of the calculations and experimental work was performed during the Short-Term Scientific Mission (Grant ECOST-STSM-TD1104-030912-021795, to Katarzyna Dymek). The research leading to these results received funding from the European Community’s Seventh Framework Program (FP7/2007-2013) under grant agreement no. 245280, also known under the acronym PRESERF. Authors would also like to express their deep appreciation to Dr. Matej Reberšek and Dr. Nataša Pavšelj for initial help with measurements and modeling, respectively.
ACC
EPTE
D M
ANU
SCR
IPT
ACCEPTED MANUSCRIPT
22
REFERENCES
Arena, C. B., Sano, M. B., Rylander, M. N., & Davalos, R. V. (2011). Theoretical
considerations of tissue electroporation with high-frequency bipolar pulses.
IEEE Transactions on Biomedical Engineering, 58, 1474–1482.
Arora, R., & Palta, J. P. (1991). A loss in the plasma membrane ATPase activity and
its recovery coincides with incipient freeze-thaw Injury and postthaw recovery
in onion bulb scale tissue. Plant Physiology, 95, 846–852.
Asami, K., Hanai, T., & Koizumi, N. (1980). Dielectric approach to suspensions of
ellipsoidal particles covered with a shell in particular reference to biological
cells. Japanese Journal of Applied Physics, 19, 359–365.
Corovic, S., Zupanic, A., Kranjc, S., Al Sakere, B., Leroy-Willig, A., Mir, L. M. &
Miklavcic, D. (2010). The influence of skeletal muscle anisotropy on
electroporation: in vivo study and numerical modeling. Medical & Biological
Engineering & Computing, 48, 637–648.
Daniels, C., & Rubinsky, B. (2009). Electrical field and temperature model of
nonthermal irreversible electroporation in heterogeneous tissues. Journal of
Biomechanical Engineering, 131.
DeBruin, K. A., & Krassowska, W. (1999). Modeling electroporation in a single cell. I.
Effects of field strength and rest potential. Biophysical Journal, 77, 1213–1224.
Demir, E., (2012). Optimization of vacuum impregnation and pulsed electric field
parameters for improving the cryoprotecion of spinach leaves, Master Thesis,
Lund University.

ACC
EPTE
D M
ANU
SCR
IPT
ACCEPTED MANUSCRIPT
23
Dymek, K., Dejmek, P., & Gómez Galindo, F., (2014). Influence of pulsed electric
field protocols on the reversible permeabilization of rucola leaves. Food and
Bioprocess Technology, 7, 761–773.
Gavish, N., & Promislow, K. (2012). Dependence of the dielectric constant of
electrolyte solutions on ionic concentration. arXiv:1208.5169 [physics.chem-
ph]. Retrieved from http://arxiv.org/abs/1208.5169
Glaser, R., Leikin, S., Chernomordik, L., Pastushenko, V., & Sokirko, A. (1988).
Reversible electrical breakdown of lipid bilayers - formation and evolution of
pores. Biochimica et Biophysica Acta, 940, 275–287.
Gowrishankar, T.R., Esser, A.T., Vasilkoski, Z., Smith, K.C, & Weaver, J.C. (2006).
Microdosimetry for conventional and supra-electroporation in cells with
organelles. Biochemical and Biophysical Research Communications, 341,
1266–1276.
Harris, C. M., & Kell, D. B. (1983). The radio-frequency dielectric properties of yeast
cells measured with a rapid, automated, frequency-domain dielectric
spectrometer. Bioelectrochemistry and Bioenergetics, 11, 15–28.
Hector, L. G., & Schultz, H. L. (1936). The dielectric constant of air at
radiofrequencies. Physics, 7, 133–136.
Hardin, J.A., Jones, C.L., Weckler, P.R., Maness, N.O., Dillwith, J.W., & Madden,
R.D. (2013). Rapid quantification of spinach leaf cuticular wax using Fourier
transform infrared attenuated total reflectance spectroscopy. Transactions of
the ASABE, 56, 331–339.
Kandušer, M., & Miklavčič, D. (2008) Electroporation in biological cell and tissue:
an overview, In E. Vorobiev, & N. Lebovka (Eds.), Electrotechnologies for

ACC
EPTE
D M
ANU
SCR
IPT
ACCEPTED MANUSCRIPT
24
extraction from food plants and biomaterials food engineering series (pp. 1–
37). New York: Springer.
Kotnik, T., Kramar, P., Pucihar, G., Miklavcic, D., & Tarek, M. (2012). Cell membrane
electroporation – Part 1: The phenomenon. IEEE Electrical Insulation
Magazine, 28, 14–23.
Mezeme, M. E., Pucihar, G., Pavlin, M., Brosseau, C., & Miklavčič, D. (2012). A
numerical analysis of multicellular environment for modeling tissue
electroporation. Applied Physics Letters, 100, 143701.
Miklavčič, D., Serša, G., Brecelj, E., Gehl, J., Soden, D., Bianchi, G. et al. (2012).
Electrochemotherapy: technological advancements for efficient
electroporation-based treatment of internal tumors. Medical & Biological
Engineering & Computing, 50, 1213–1225.
Neumann, E., & Rosenheck. (1972). Permeability changes induced by electric
impulses in vesicular membranes. Journal of Membrane Biology, 10, 279–290.
Neumann, E., Schaefer-Ridder, M., Wang, Y., & Hofschneider, P. (1982). Gene
transfer into mouse lyoma cells by electroporation in high electric fields. EMBO
Journal, 1, 841–845.
Panarese, V., Dejmek, P., Rocculi, P., & Gómez Galindo, F. (2013). Microscopic
studies providing insight into the mechanisms of mass transfer in vacuum
impregnation. Innovative Food Science & Emerging Technologies, 18, 169–
176.
Pawar, S.D., Murugavel, P., & Lal, D.M. (2009). Effect of relative humidity and sea
level pressure on electrical conductivity of air over Indian Ocean. Journal of
Geophysical Research, 114, D02205.

ACC
EPTE
D M
ANU
SCR
IPT
ACCEPTED MANUSCRIPT
25
Pavliha, D., Kos, B., Zupanič, A., Marčan, M., Serša, G., & Miklavčič, D. (2012).
Patient-specific treatment planning of electrochemotherapy: procedure design
and possible pitfalls. Bioelectrochemistry, 87, 265–273.
Pavšelj, N., & Miklavčič, D. (2008). Numerical modeling in electroporation-based
biomedical applications. Radiology and Oncology, 42, 159–168.
Pavšelj, N., & Miklavčič, D. (2011). Resistive heating and electropermeabilization of
skin tissue during in vivo electroporation: A coupled nonlinear finite element
model. International Journal of Heat Mass Transfer, 54, 2294-2302.
Phillips, M., Maor, E., & Rubinsky, B. (2011). Principles of tissue engineering with
nonthermal irreversible electroporation. Journal of Heat Transfer-Transactions
of the Asme, 133, 011004.
Phoon, P. Y., Gómez Galindo, F., Vicente, A., & Dejmek, P. (2008). Pulsed electric
field in combination with vacuum impregnation with trehalose improves the
freezing tolerance of spinach leaves. Journal of Food Engineering, 88, 144–
148.
Pucihar, G., Miklavcic, D., & Kotnik, T. (2009). A time-dependent numerical model of
transmembrane voltage inducement and electroporation of irregularly shaped
cells. IEEE Transactions on Biomedical Engineering, 56, 1491–1501.
Ramos-Barrado, J., Benavente, J., & Heredia, A. (1993). Electrical conductivity of
differently treated isolated cuticular membranes by impedance spectroscopy.
Archives of Biochemistry and Biophysics, 306, 337–341.
Retelj, L., Pucihar, G., & Miklavcic, D. (2013). Electroporation of intracellular
liposomes using nanosecond electric pulses -- a theoretical study. IEEE
Transactions on Biomedical Engineering, 60, 2624–2635.

ACC
EPTE
D M
ANU
SCR
IPT
ACCEPTED MANUSCRIPT
26
Riederer, M., & Schreiber, L. (2001). Protecting against water loss: analysis of the
barrier properties of plant cuticles. Journal of Experimental Botany, 52, 2023–
2032.
Rowan, N. J., MacGregor, S. J., Anderson, J. G., Fouracre, R. A., & Farish, O.
(2000). Pulsed electric field inactivation of diarrhoeagenic Bacillus cereus
through irreversible electroporation. Letters in Applied Microbiology, 31, 110–
114.
Saulis, G. (1997). Pore disappearance in a cell after electroporation: theoretical
simulation and comparison with experiments. Biophysical Journal, 73, 1299–
1309.
Schönherr, J. (2006). Characterization of aqueous pores in plant cuticles and
permeation of ionic solutes. Journal of Experimental Botany, 57, 2471–2491.
Shayanfar, S., Chauhan, O., Toepfl, S., & Heinz, V. (2013). The interaction of pulsed
electric fields and texturizing - antifreezing agents in quality retention of
defrosted potato strips. International Journal of Food Science & Technology,
48, 1289–1295.
Sibbernsen, E., & Mott, K. A. (2010). Stomatal responses to flooding of the
intercellular air spaces suggest a vapor-phase signal between the mesophyll
and the guard cells. Plant Physiology, 153, 1435–1442.
Stout, D.G., Hall, J.W., McLaughlin, N.B. (1987). In vivo plant impedance
measurements and characterization of membrane electrical properties: The
influence of cold acclimation. Cryobiology, 24, 148-162
Suzuki, D. O. H., Ramos, A., Ribeiro, M. C. M., Cazarolli, L. H., Silva, F. R. M. B.,
Leite, L. D., & Marques, J. L. B. (2011). Theoretical and experimental analysis

ACC
EPTE
D M
ANU
SCR
IPT
ACCEPTED MANUSCRIPT
27
of electroporated membrane conductance in cell suspension. IEEE
Transactions on Biomedical Engineering, 58, 3310–3318.
Talele, S., & Gaynor, P. (2010). Modelling control of pore number and radii
distribution in single-cell electroporation. In K. Elleithy, T. Sobh, M. Iskander,
V. Kapila, M. A. Karim, & A. Mahmood (Eds.), Technological Developments in
Networking, Education and Automation (pp. 231–236). Springer Netherlands.
Talele, S., Gaynor, P., Cree, M. J., & van Ekeran, J. (2010). Modelling single cell
electroporation with bipolar pulse parameters and dynamic pore radii. Journal
of Electrostatics, 68, 261–274.
Wanichapichart, P., Bunthawin, S., Kaewpaiboon A., & Kanchanapoom, K. (2002).
Determination of cell dielectric properties using dielectrophoretic technique.
Science Asia, 28, 113-119.
Warmbrodt, R. D., & Woude, W. J. V. (1990). Leaf of Spinacia oleracea (Spinach):
ultrastructure, and plasmodesmatal distribution and frequency, in relation to to
Sieve-Tube Loading, American Journal of Botany, 77, 1361-1377.
Winter, H., Robinson, D. G., & Heldt, H. W. (1994). Subcellular volumes and
metabolite concentrations in spinach leaves. Planta, 193, 530–535.
Yarmush, M. L., Golberg, A., Serša, G., Kotnik, T., & Miklavčič, D. (2014).
Electroporation-based technologies for medicine: principles, applications, and
challenges. Annual Review of Biomedical Engineering, 16, 295-320.
Zimmermann, U., Pilwat, G., & Riemann, F. (1974). Dielectric breakdown of cell
membranes. Biophysical Journal, 14, 881–899.
Zimmermann, U., & Vienken, J. (1982). Electric field-induced cell-to-cell fusion.
Journal of Membrane Biology, 67, 165–182.

ACC
EPTE
D M
ANU
SCR
IPT
ACCEPTED MANUSCRIPT
28
Zorec, B., Becker, S., Reberšek, M., Miklavčič, D., & Pavšelj, N. (2013). Skin
electroporation for transdermal drug delivery: the influence of the order of
different square wave electric pulses. International Journal of Pharmaceutics,
457, 214–223.
ACC
EPTE
D M
ANU
SCR
IPT
ACCEPTED MANUSCRIPT
29
Figure Captions
Fig. 1. The geometry of the model. A, B. The geometry of the model representing the
whole spinach cross section is shown in relation with the microscopic picture. The
scale bar represents 100 µm. C. Side view of the model with connections between
cells marked with black. Stomata are marked in green and the cuticular wax layer in
black. The dimensions of the different elements included in the model are shown in:
D. epidermal cell, E. palisade mesophyll cell, F. spongy mesophyll cells, G. stoma.
Fig. 2. The geometry of investigated models of untreated spinach leaf cross section
with highlighted main differences between models. The three dimensional view as
well as the schematic side view of the models is shown. Model A. The model
represents the spinach leaf cross section with two large cells in the spongy mesophyll
tissue. Model B. The model represents the spinach leaf cross section with 16 cells in
the spongy mesophyll tissue arranged in the 4 rows with 4 cells per row. Model C.
The model represents the spinach leaf cross section with randomly located cells in
the spongy mesophyll tissue. Model D. The model represents the spinach leaf cross
section with 16 cells in the spongy mesophyll tissue arranged in the 4 rows with 4
cells per row, the same as model B, but in model D also the cuticular wax layers and
stomata are included.
Fig. 3. Comparison of the conductivity changes over the frequency range for
experimental measurements and 4 different models with different arrangements of
cells in the spongy mesophyll represented in Figure 2. Error bar represents standard
deviation of three replicates.
Fig. 4. The measured conductivity of vacuum impregnated spinach leaves compared
with the model solved for different values of the conductivity () and permitivitty () of

ACC
EPTE
D M
ANU
SCR
IPT
ACCEPTED MANUSCRIPT
30
the cuticular wax layer: I. = 80, = 5 × 10⁻⁷ S/m II. = 80, = 5 × 10⁻⁸ S/m III. =
45, = 5 × 10⁻⁷ S/m IV. = 10, = 5 × 10⁻⁷ S/m. Error bar represents standard
deviation of three replicates.
Fig. 5. Representative microscopic pictures showing: A. open stomata after vacuum
impregnation process (marked with arrows). B. electroporated guard cells of stomata
previously stained with propidium iodide as described in Dymek et. al (Dymek et al.,
2014). One 250 µm rectangular, monopolar pulse with amplitude of 200 V was
applied to previously vacuum impregnated leaf. The scale bars represent 20 µm.
Fig. 6. The measured electric current through vacuum impregnated spinach leaf at
different applied voltages, compared with the model solved for two different situations
in which stomata are either filled with air or with leaked cell sap from electroporated
guard cells. Error bar represents standard deviation of three replicates.
Fig. 7. Calculated average pore density from two models and change in resistance
with increasing voltage. The resistance at different applied voltages is plotted
together with calculated average pore density for the entire leaf section for two
models: air in stomata and call sap in stomata. Resistance was calculated from
measured current by R = V/I, where R – resistance (), V – voltage (V), I – current
(A).
Fig.8. Distribution of pore density in the electroporated cells investigated with the
model of vacuum impregnated spinach leaf after applying electric pulses with
different amplitudes. Models, where the stomata are either filled with solution or with
air, were investigated. The color scale is logarithmic, from dark blue representing low
ACC
EPTE
D M
ANU
SCR
IPT
ACCEPTED MANUSCRIPT
31
pore density, to dark red representing high pore density. Pore density is shown in
pores/m2.

ACC
EPTE
D M
ANU
SCR
IPT
ACCEPTED MANUSCRIPT
32
Figure 1

ACC
EPTE
D M
ANU
SCR
IPT
ACCEPTED MANUSCRIPT
33
Figure 2

ACC
EPTE
D M
ANU
SCR
IPT
ACCEPTED MANUSCRIPT
34
Figure 3

ACC
EPTE
D M
ANU
SCR
IPT
ACCEPTED MANUSCRIPT
35
Figure 4
ACC
EPTE
D M
ANU
SCR
IPT
ACCEPTED MANUSCRIPT
36
Figure 5

ACC
EPTE
D M
ANU
SCR
IPT
ACCEPTED MANUSCRIPT
37
Figure 6

ACC
EPTE
D M
ANU
SCR
IPT
ACCEPTED MANUSCRIPT
38
Figure 7
ACC
EPTE
D M
ANU
SCR
IPT
ACCEPTED MANUSCRIPT
39
Figure 8
ACC
EPTE
D M
ANU
SCR
IPT
ACCEPTED MANUSCRIPT
40
Table 1.
Parameters used in the model.
Parameter Value
Extracellular liquid conductivity (ex)
0.0084 S/m (Stout, Hall, & McLaughlin, 1987)
Extracellular liquid permittivity (ex)
80 (Gavish & Promislow, 2012)
Cell membrane conductivity (m)
0.00003 S/m (Wanichapichart, Sunthawin, Kaewpaiboon, & Kanchanapoom, 2002)
Cell membrane permittivity (m)
10 (Wanichapichart et al., 2002
Cytoplasm conductivity (cyt)
0.2 S/m (Harris & Kell, 1983)
Cytoplasm permittivity (cyt)
80 (Asami, Hanai, & Koizumi, 1980)
Cuticular wax layer conductivity (cut)
5 × 10⁻⁸ S/m (Ramos-Barrado et al., 1993),
5 × 10⁻⁷ S/m
Cuticular wax layer permittivity (cut)
10, 45, 80 (Gavish & Promislow, 2012)
Air conductivity (air)
8 × 10-15 S/m (Pawar, Murugavel, & Lal, 2009)
Air permittivity (air)
1.006 (Hector & Schultz, 1936)
Impregnating solution conductivity
(im)
0.25 S/m
Impregnating solution permittivity (im)
80 (Gavish & Promislow, 2012)
Electroporation parameter (α)
109 m-2 s-1 (DeBruin & Krassowska, 1999)
Characteristic voltage of electroporation (Vep)
0.258 V (DeBruin & Krassowska, 1999)
Electroporation constant (q)
2.46 (DeBruin & Krassowska, 1999)
Equilibrium pore density (N0)
1.5 × 10⁹ m-2 (DeBruin & Krassowska, 1999)
Energy barrier within pore (w)
2.65 (DeBruin & Krassowska, 1999)
Pore radius (rp)
0.76 nm (DeBruin & Krassowska, 1999)
Relative entrance length of pores (n) 0.15 (DeBruin & Krassowska, 1999)

ACC
EPTE
D M
ANU
SCR
IPT
ACCEPTED MANUSCRIPT
41
Highlights:
1. The three dimensional model of a non-treated and a vacuum impregnated spinach
leaf cross section was built.
2. Models were analysed in the frequency and the time domain.
3. The frequency depended conductivity and electroporation are well predicted by the tested models.