“mobile object recognition: what are the minimum criteria that are acceptable to museum...
TRANSCRIPT

Mobile Object Recognition: What are the Minimum Criteria that are Acceptable to Museum Visitors?
SUBMITTED IN PARTIAL FULLFILLMENT FOR THE DEGREE OF MASTER OF SCIENCE
Martine van den Berg
10833447
MASTER INFORMATION STUDIES
HUMAN-CENTERED MULTIMEDIA
FACULTY OF SCIENCE
UNIVERSITY OF AMSTERDAM
June 30, 2015
1st Supervisor 2nd Supervisor Dr. Jan van Gemert MSc. Morris Franken ISLA, UvA ISLA, UvA

Mobile Object Recognition: What are the Minimum Criteria that are Acceptable to Museum Visitors?
Martine van den Berg Information Studies – HCM University of Amsterdam
Science Park 904, Amsterdam [email protected]
ABSTRACT In this paper, the minimum requirements of object recognition (OR), to be acceptable to museum visitors are evaluated as a method to access background information on objects in mobile museum tour-guide apps by means of a field experiment. While previous work has already confirmed the technical improved usability and the prevalence of visitors using OR in museum tour-guide apps, it is still unclear what the minimal technical requirements are for mobile OR apps before they are acceptable to its intended users. A prototype museum tour-guide app featuring OR was developed, to let museum visitors follow a mobile museum guide tour in a museum in the Netherlands. User acceptance was measured while varying the OR speed and accuracy. While previous research has focused on making OR techniques as fast and accurate as possible, the results highlight that this not necessarily leads to higher user satisfaction. The OR speed of ≤ 2 sec. was measured as "sufficient" for ‘high’ user acceptance (SUS of >77,30). However, results revealed that visitors are more critical towards accuracy, only maximum accuracy has lead to high user acceptance. This research not only demonstrated ‘high’ user acceptance of OR in museum tour-guide apps. More importantly, it could serve as a guideline for museums and developers to consider when creating OR apps.
Categories and Subject Descriptors H5.2. [User Interfaces]: Information interfaces and presentation (e.g., HCI):
General Terms Algorithms, Performance, Design
Keywords Object Recognition, User Acceptance, Accuracy, Recognition Speed.
1. INTRODUCTION The rise of mobile phones, and mobile apps specifically, broadens access to the museums. Nevertheless many museums still present their exhibits using unimodel systems. A system, having a single channel, that is based on a single modality is termed as unimodel. These systems can be broadly classified into visual, audio and sensor based systems [9]. Audio systems for example, allows users to listen to information about museum objects after
manually typing in or scanning a code. The visitor has to search through a booklet to find the particular object on display. Looking for information in this way is a quite tedious procedure. Moreover, the information found does not always meet the visitor’s specific interests. Mobile tour-guide apps with Object Recognition (OR) do not have these drawbacks. OR enables museum visitors to obtain information about a particular object easily by scanning the object of interest with the camera of their smartphone. OR automatically recognizes objects by carrying out all computations directly on the smartphone [8]. Computer vision algorithms can detect local features from the object, match these with reference images in the database, and return corresponding information about the object of interest. Laboratory and field experiments have shown that museum objects can be recognized with a probability of over 96% and with a recognition speed of 0,6 sec. [7]. Previous work already confirmed the improved usability and the prevalence of visitors using OR in museum tour-guide apps [14].
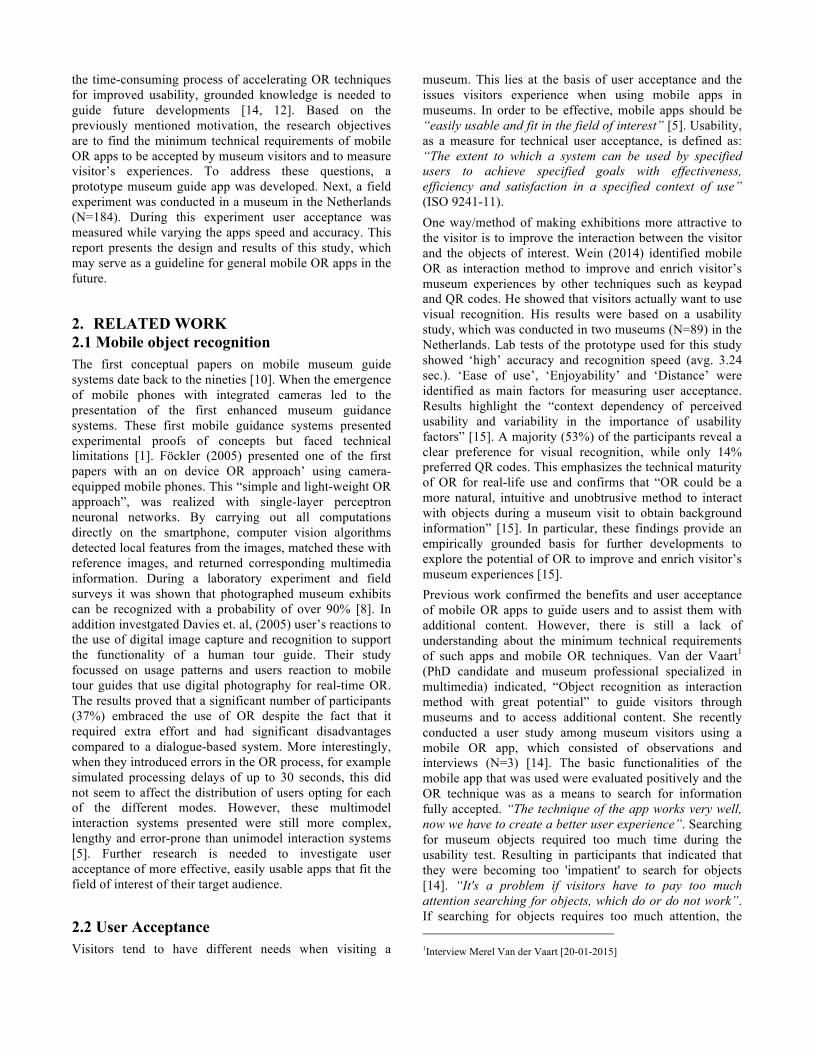
Figure 1 Museum visitors scanning objects in the Allard Pierson museum
However, it is still unclear what the minimal technical requirements are for mobile OR apps before they are accepted by its intended users. User acceptance is the extent to which apps can be used by museum visitors to access information about objects using OR with effectiveness, efficiency and satisfaction [4]. By the rising use of mobile apps, user acceptance and usability are receiving increasing attention. There have been discussions over the extent to which multimedia guides and information technology have produced benefits to museum visitors. Part of this debate revolves around the issue of whether museum apps are actually accepted by its intended users [12]. With these increased expectations, the need for accurate and fast mobile OR apps continues to grow. Given these issues and
the time-consuming process of accelerating OR techniques for improved usability, grounded knowledge is needed to guide future developments [14, 12]. Based on the previously mentioned motivation, the research objectives are to find the minimum technical requirements of mobile OR apps to be accepted by museum visitors and to measure visitor’s experiences. To address these questions, a prototype museum guide app was developed. Next, a field experiment was conducted in a museum in the Netherlands (N=184). During this experiment user acceptance was measured while varying the apps speed and accuracy. This report presents the design and results of this study, which may serve as a guideline for general mobile OR apps in the future.
2. RELATED WORK 2.1 Mobile object recognition The first conceptual papers on mobile museum guide systems date back to the nineties [10]. When the emergence of mobile phones with integrated cameras led to the presentation of the first enhanced museum guidance systems. These first mobile guidance systems presented experimental proofs of concepts but faced technical limitations [1]. Föckler (2005) presented one of the first papers with an on device OR approach’ using camera-equipped mobile phones. This “simple and light-weight OR approach”, was realized with single-layer perceptron neuronal networks. By carrying out all computations directly on the smartphone, computer vision algorithms detected local features from the images, matched these with reference images, and returned corresponding multimedia information. During a laboratory experiment and field surveys it was shown that photographed museum exhibits can be recognized with a probability of over 90% [8]. In addition investgated Davies et. al, (2005) user’s reactions to the use of digital image capture and recognition to support the functionality of a human tour guide. Their study focussed on usage patterns and users reaction to mobile tour guides that use digital photography for real-time OR. The results proved that a significant number of participants (37%) embraced the use of OR despite the fact that it required extra effort and had significant disadvantages compared to a dialogue-based system. More interestingly, when they introduced errors in the OR process, for example simulated processing delays of up to 30 seconds, this did not seem to affect the distribution of users opting for each of the different modes. However, these multimodel interaction systems presented were still more complex, lengthy and error-prone than unimodel interaction systems [5]. Further research is needed to investigate user acceptance of more effective, easily usable apps that fit the field of interest of their target audience.
2.2 User Acceptance Visitors tend to have different needs when visiting a
museum. This lies at the basis of user acceptance and the issues visitors experience when using mobile apps in museums. In order to be effective, mobile apps should be “easily usable and fit in the field of interest” [5]. Usability, as a measure for technical user acceptance, is defined as: “The extent to which a system can be used by specified users to achieve specified goals with effectiveness, efficiency and satisfaction in a specified context of use” (ISO 9241-11). One way/method of making exhibitions more attractive to the visitor is to improve the interaction between the visitor and the objects of interest. Wein (2014) identified mobile OR as interaction method to improve and enrich visitor’s museum experiences by other techniques such as keypad and QR codes. He showed that visitors actually want to use visual recognition. His results were based on a usability study, which was conducted in two museums (N=89) in the Netherlands. Lab tests of the prototype used for this study showed ‘high’ accuracy and recognition speed (avg. 3.24 sec.). ‘Ease of use’, ‘Enjoyability’ and ‘Distance’ were identified as main factors for measuring user acceptance. Results highlight the “context dependency of perceived usability and variability in the importance of usability factors” [15]. A majority (53%) of the participants reveal a clear preference for visual recognition, while only 14% preferred QR codes. This emphasizes the technical maturity of OR for real-life use and confirms that “OR could be a more natural, intuitive and unobtrusive method to interact with objects during a museum visit to obtain background information” [15]. In particular, these findings provide an empirically grounded basis for further developments to explore the potential of OR to improve and enrich visitor’s museum experiences [15]. Previous work confirmed the benefits and user acceptance of mobile OR apps to guide users and to assist them with additional content. However, there is still a lack of understanding about the minimum technical requirements of such apps and mobile OR techniques. Van der Vaart1 (PhD candidate and museum professional specialized in multimedia) indicated, “Object recognition as interaction method with great potential” to guide visitors through museums and to access additional content. She recently conducted a user study among museum visitors using a mobile OR app, which consisted of observations and interviews (N=3) [14]. The basic functionalities of the mobile app that was used were evaluated positively and the OR technique was as a means to search for information fully accepted. “The technique of the app works very well, now we have to create a better user experience”. Searching for museum objects required too much time during the usability test. Resulting in participants that indicated that they were becoming too 'impatient' to search for objects [14]. “It's a problem if visitors have to pay too much attention searching for objects, which do or do not work”. If searching for objects requires too much attention, the 1Interview Merel Van der Vaart [20-01-2015]

informative experience becomes secondary. Given these issues and the time-consuming process of accelerating techniques for improved usability, grounded knowledge is needed to guide future developments.
3. RESEARCH QUESTIONS The main hypothesis of this study is that decreasing recognition speed and accuracy can negatively influence user acceptance (H1-H4 in Fig. 2). User acceptance is defined as “The extent to which the mobile tour-guide can be used by museum visitors to access information about objects using object recognition with effectiveness, efficiency and satisfaction in the Allard Pierson museum” (ISO 9241-11) 2. When users are presented with a new mobile system, a number of factors influence their decision about how and when they will use it, namely (Brooke, 1996):
• Effectiveness - “The ability of users to complete tasks using the app, and the quality of output of those tasks”.
• Efficiency - “The extent to which the provided information about objects corresponds with the action expected by the user during the object recognition process”
• Satisfaction - “Users’ subjective reaction to using the prototype”.
Figure 2 Dependent and independent values with corresponding hypothesizes
In addition to the main hypothesis we will investigate if technical user acceptance is influenced by the three overlapping contexts, which are important for interaction and meaning making in a museum context: physical, socio-cultural and personal [6]:
• Do physical differences between museum visitors influence the perceived usability of the mobile app and object recognition?
• How do users perceive mobile object recognition
2http://www.iso.org/iso/iso_catalogue/catalogue_ics/catalogue_detail_ics.h
tm?csnumber=55486}
in relation to visit motivation and time constraints?
• Do differences between the user’s mobile app usage, previous experiences with mobile apps and object recognition in a museum context influence the perceived usability?
4. DESIGN PROTOTYPE To address the research questions a prototype app was developed to demonstrate the technical efficacy of OR during a museum guide tour. Recognition speed and accuracy were manipulated manually, to test technical acceptance of the OR technique. The prototype was designed for a field experiment in the AP museum in Amsterdam and the approach was to simulate a ‘real’ mobile museum tour guide as closely as possible.
4.1 Requirements Based on the research questions, interviews and literature review, the prototype had the following high-level requirements:
• Provide a museum tour-guide experience to museum visitors in the AP museum. Allow museum visitors to access information about objects of interest using OR and guide museum visitors thorough the exhibition.
• Include at least 10 different objects in the museum tour-guide to enable measuring different values independently from each other.
• Provide an option to the user to scan a misclassified object again.
• Allow touchscreen-based interaction. (For example by aligning the screen when users rotate the screen from a vertical to horizontal position).
• Provide settings to manually set accuracy values between 100-40 per cent on the device.
• Provide setting to manually set recognition speed values between 0-10 sec. on the device.
• Provide an activity log to on the device gather data about: Pre-set accuracy, pre-set recognition speed and total interaction times per participant/object.
For this study an existing mobile app has been made available3. The TombReader (TR) application has proven to be successful in recognizing museum objects and meets the above requirements [14].
4.2 TombReader Prototype The prototype is based on the TR app, developed by Franken and Van Gemert (2014). The application is designed to automatically recognize objects in museums by
3 www.tombreaderapp.com
*Recogntion Speed
*Accuracy
H1
H2
H3
H4
H1 Decreasing recognition speed negatively influences user acceptance. H2 Decreasing accuracy negatively influences user acceptance. H3 Decreasing accuracy negatively influences the user?s perceived effectiveness. H4 Decreasing recognition speed negatively influences the user?s perceived efficiency.
*Independent variable**Dependent variable
Other Information
**Satisaction
**PerceivedEfficiency
**PerceivedEffectiveness
**User Acceptance

pointing the camera of a smartphone at the object of interest, following the habitual movements of taking a picture. The Computer Vision algorithms that enable TR to recognize objects are first trained on a set of images from each object, capturing it from all angles and distances. During the training phase a model is created for each object, capturing the visual essence of the object including its most distinct visual properties that sets aside this particular object from the others. During the recognition phase, a single feature vector is created based on small segments in the image at various locations. The feature vector is then classified using support vector machines (SVM) to obtain the object ID. Multiple viewpoints of objects can by acquired by making a video with the camera of the smartphone. Museum objects or other object collections can be acquired in this way. The prototype app was developed as a native Android app, designed and optimized in Java / C++ for the Samsung Galaxy S34 and a HTC5 test devices and all the processing was performed locally on the device (the performance of the app was not dependent on Internet access). The OR technique was realized using an open source computer vision software library for classification. OpenCV and LIBLINEAR are standard open source libraries and provide a common infrastructure for the system 6 7. LibLinear is an algorithm that supports linear SVM. OpenCV provides access to fast and efficient computer vision algorithms. The prototype was developed with functionality to manually set accuracy and recognition speed on the device and was able to reduce accuracy from 100% to 0% and recognition speed from 0 to 10 sec. (Fig. 3). For example, if the accuracy is set to 80%, the app will randomly perform two out of 10 incorrect classifications. After receiving the randomly selected erroneous information, the user has the ability to scan the object again. After scanning the object for the second time, the app will display the correct information about the object. The overall classification of objects (3 classification frames) takes 0.6 sec. This is included in the calculation for the set recognition speed.
Figure 3 Settings and activity log
4 http://www.samsung.com/global/galaxys3/ 5 http://www.htc.com/nl/smartphones/htc-one-m7/ 6 http://www.csie.ntu.edu.tw/~cjlin/liblinear/ 7 http://opencv.org/opencv-3-0-alpha.html
The prototype was developed to be used in both in a horizontal and vertical position, as the screen aligns the displayed information while users rotate the device. After opening the app, a start-up screen with introduction was shown to the user. Besides the ‘Start’ and ‘Continue’ buttons, users were able to click on the ‘Back’ button of the smartphone to go back to the previous screen. The user interaction steps, try to simulate as close as possible a ‘real’ museum tour-guide (Fig. 4/5). To test user acceptance of the described prototype, a field experiment is conducted in the AP museum in the Netherlands.
Figure 4 User Interaction Screens
5. METHODS The decision to test user acceptance of OR during a mobile tour-guide in the Allard Pierson (AP) museum was two-fold. First, user acceptance and usability does not exist in any absolute sense and it can only be defined with reference to a specific context [3]. Secondly, to obtain reliable and comparable results we had to control the number of objects, which were scanned by participants. The AP museum offered the possibility to scan objects that were placed in one department and could be viewed from different angles. This made it possible to keep overview and to observe participants who were participating in the experiment. In addition, the TR application had proved to be successful in recognizing objects in this museum [14].
5.1 Experimental Setup To test technical acceptance at different values for OR speed and accuracy, participants were split in 17 sub-groups (Appendix A). Each group consisted of a minimum of ten participants. In each group only one different value of accuracy or recognition speed was changed. Values were measured in two ranges: recognition speed (0-10 sec.) and accuracy (40-100 per cent). Technical user acceptance per value was determined by a user survey.

5.2 Experimental Procedure After a pilot test, the experiment was conducted in 8 separate test sessions. The study was conducted as a field experiment in the AP museum. At the start of the experiment, participants were informed, asked to sign a consent form and requested to fill in a pre-experiment questionnaire. Questions were prepared in both English and Dutch. The pre-experiment questionnaire consisted of demographical and general questions about the participants’ motivation for visiting the museum and their mobile app usage. Questions about the participant’s motivation were based on three overlapping contexts, which are important for interaction and meaning making in a museum context physical, socio-cultural and personal [6]. Once the questionnaire was completed, participants were given a smartphone to start the museum tour-guide. In order to show the technical efficacy of OR, participants were asked to scan museum objects. Ten predetermined objects were labelled as part of the experiment. The prototype’s accuracy is reported as a percentage of the maximum possible number of correct objects. Participants were asked to follow the route in a particular order indicated on the mobile app. Objects were ranked following the habitual walking direction of museum visitors. The speed and accuracy during the ‘recognition process’ were manipulated to test technical user acceptance of recognition speed and accuracy at different values (Fig. 5). Data was gathered via a paper based survey and an activity log on the device. At the end participants were asked to complete a post-experiment questionnaire, to measure their experiences with the app and OR technique. Technical acceptance was measured, by 10 constructs based on Brooke’s System Usability Scale (SUS) [4] (Appendix A).
Figure 5 User interaction flow thorough the app
The SUS is a reliable tool for measuring usability. Answers were formulated in a five-point Likert Scale, with four questions being coded negatively (Likert, 1932). Technical user acceptance was measured by asking participants whether they found the OR technique accurate or too slow. User acceptance was measured by calculating the SUS [4].
5.3 Participants All participants were visitors of the AP museum and unfamiliar with the TR app. Participants were free to stop with the experiment whenever they want. One participant stopped the experiment, due to time constraints. The target group of the experiment consisted of visitors who are familiar with the use of a smartphone or a tablet. Other specific skills, characteristics, or habits were not taken into account during the selection process. Due to a restricted period of time and because we had to rely on volunteers, the participants were randomly asked to participate in the user test. We did not try to balance age, gender, cultural background or other specific criteria. The range of selection criteria in this group of museum visitors is too large to effectively balance. In total, 184 participants were recruited: 103 were female, 81 were male and both groups consisted of a wide range of ages (16-65+). Participants were distributed in age groups: 10% of the participants was between 16-20, 24% between 21-30, 23% between 16-20, 20% between 31-40, 16% between 41-50 and 7% was 65 years or older (Fig. 6). Some of the participants (140) followed the mobile tour-guide alone while others (44) followed the mobile tour-guide with other people. Nearly half of the group (49,46%) was familiar with the OR technique and 77,17% had visited a museum before in the past year. Males were significant more familiar with the OR technique (α=0,305**). In practice we did not notice a significant difference in behaviour between females and males when using the app.
Figure 6 Age Groups
Participants between 41-65 years old used significantly less frequently mobile apps per week than participants in younger age groups (α=-0,289**). In practice, was noticed that participants in younger age groups had a shorter learning curve than older people. It was remarkable that younger participants needed no or little explanation and almost ‘naturally’ knew how to accurately deal with the app and OR technique. Participants in older age groups needed more explanation and assistance during the experiment.
Last Object?
Scan object
End of the tour
Home Screen
Recognition Process
End Screen
Scan ObjectRecognize
Object
Correct?
Start Tour
Continue Yes
Object information
No
Yes
Try Again
No

5.4 Data Analysis The reliability and validity of the data were evaluated with SPSS228 and Python9, using reliability and convergent validity criteria. Following Brooke’s SUS calculations, a ‘system usability score’ (SUS) was calculated per participant [4]. The reliability of the questionnaire was established by calculating Pearson’s rho and a paired two-group t-test [11]. Besides the data of the questionnaire, average interaction times were calculated, using data gathered with the activity log on the device (Appendix A). During the analysis missing values were found at 16 of the 141 rounds. In this rounds the log did not register the interaction times of the last object correctly. These results are not captured in the calculations of the mean scores. In addition the app crashed at three participants (A12, A15, C26), these results were also not captured in the calculations.
6. RESULTS 6.1 Interaction Times Using OR, the participants accessed 10 distinct objects. Depending on the prototype’s pre-set accuracy, participants scanned the artwork once or multiple times. Four different bar charts summarize the results for the logged interaction times (Fig. 7). Interaction time per object is defined as the sum of ‘Scan Time’, ‘Recognition Time’ and ‘Read Time’:
• Scan time: The time a user spends on scanning the object (inc. the time it takes to complete the OR).
• Recognition time: The time it takes to OR to recognize the object.
• Read time: The time after displaying the object information, until the participant clicks on ‘Continue’ or ‘Try again’.
Participants interacted on average for 9 minutes and 48,73 sec. with the app. There was a significant deviation up to 11 minutes and 51,87 sec. in total. Participants interacted on average 79,94 sec. with object number one and 80,76 sec. with object number two. It is useful to take into account that some participants had already pressed the start button during the explanation of the experiment, which resulted in a large variety of scan times of the first object, on average 41,71 with a Standard Deviation (SD) of 116,85. As summarized in interaction times per object (Fig. 7), both interaction times were significant longer than interaction times with the other objects. Participants interacted the shortest with object No. 8, on average 25,58 sec. (SD 19,57). The longest interaction time (84 sec, SD 94,73) and scan time (124,86 sec) (SD 170,42) were observed for the last object ‘Tunis Sarcophagus’ (No.10). Some participants experienced difficulties finding the ‘Tunis Sarcophagus’, as it was placed at the end of the
8 https://www-01.ibm.com/support/docview.wss?uid=swg21646821 9 https://www.python.org/
exhibition. In practice, it was found that interaction times per object depend strongly on the personal context of the user. Some participants took plenty of time, while others tried to finish the tour as soon as possible. The importance of context was also noticeable, while measuring technical performance. For example if dark objects are placed against a dark background, the silhouettes are difficult to recognize. Silhouettes of objects that are placed behind glass are also difficult to extract, reflection of the light makes classifying the object more difficult for the algorithm.
Figure 7 Interaction times per object
6.2 User Acceptance The structural relationships between different variables, which may affect user acceptance, are displayed in Figure 8. This diagram indicates that the variance of user acceptance is explained by 10 different constructs for which is fairly high given that these factors may affect user acceptance [4]. Brooke claims that good systems receive between 70-80 points and exceptional systems receive 90 points or more [4]. An average SUS of 70,76 (SD) is calculated with scores of participants using the prototype with 100% accuracy and 0 sec. delay. This SUS can be interpreted as above average. Additionally, user acceptance may be influenced by the three overlapping contexts which are important for interaction and meaning making in a museum context: physical, socio-cultural and personal [6]. Pearson’s rho was computed to assess the relationships between all these different variables. According to Pearson’s rho, a measurement item correlates highly if its correlation coefficient is below 0,05. The correlations that were found significant at 0.01 level (2 tailed) are classified as a structural relationship for user acceptance (Fig. 8). The results show that the variance in user acceptance toward accepting OR can be explained by perceived Effectiveness (α=-0,349**), Efficiency (α=0,470**), Ease of Use OR (α=0,499**), Suitability OR (α=-0,376**) and Enjoyability OR (α=-0,523**), along with a relatively small proportion of physical and personal context (Fig. 8). No statistically significant relationships were found between the three overlapping contexts, which are important for interaction

and meaning making in a museum context and SUS.
Figure 8 Structural relationships between user acceptance variables
However, females seemed to be more critical. They were less satisfied about the accuracy of the OR technique (α=-0,161*, SEM=0,309) and ease of use of the app (α=-0,174*, SEM=0,003) than males, even though, no statistically significant differences were found between gender and total SUS. Variance in user acceptance toward the app can be explained by the perceived Usefulness App (α=-0,599**), Ease of Use App (α=0,444**), Suitability App (α=-0,518**), Learnability App (α=0,366**) and Satisfaction App (α=-0,548**). The strongest statistically significant relationships are found for both, technical acceptance of the OR technique and context related variables:
• Speed-Perceived Efficiency OR: A positive correlation (α=-0,760**) was calculated between OR Speed and the answers given to the construct: ‘OR was too slow’.
• Accuracy-Perceived Effectiveness OR: A positive correlation (α=-0,645**) was calculated between Accuracy and the answers given to the construct: ‘OR was accurate’.
• SUS-Perceived Ease of Use App: A positive correlation (α=-0,599**) was calculated between SUS and the answers given to ‘The mobile app distracted me from the exhibition’.
• SUS-Perceived Usefulness App: this positive correlation (α=-0,599**) was calculated between SUS and the answers given to the construct: ‘I found this mobile app useful in this context’.
The Standard Error Mean (SEM is calculated to determine the variability of a correlation and to see whether the results have a normal curve about the mean (Fig. 8) [11]. The SEM is equal to the Standard Deviation (SD) divided by the square root of the sample size (N=184) [11]. The SEM allows constructing a confidence interval within which the true population correlation will fall. SD values are significantly lower for accuracy (SD 13,65-27,92) than for OR recognition speed (SD 7,64-13,65) (Appendix A). These values reflects a large amount of variation, especially
in the groups in which accuracy has been manipulated. Feedback from participants also highlighted differences in interpretation. Some participants were very critical regarding accuracy, while others still answered “strongly agree” at the construct ‘OR was accurate’ after using the OR technique with a pre-set accuracy of 60 per cent. The participant noted, “The app didn’t classify all the objects correct, but it wasn’t such a big issue for me using the app”. To investigate these differences in user acceptance, analyses are preceded on SUS distinguishing perceived Effectiveness OR and perceived Efficiency OR.
6.3 User Acceptance Accuracy and OR speed 6.3.1 The Effect of OR Speed and Accuracy on User Acceptance (SUS) The average SUS is measure at 70,76 during the test rounds with ‘maximum’ values for both OR speed (0 sec.) and accuracy (100%). As expected beforehand, a statistically significant relationship was found between both, OR speed on SUS (α=-0,319**), and accuracy on SUS (α=-0,152*). Analyses were preceded on raw SUS, distinguishing different values for speed (0-10 sec.) and accuracy (40-100%). Increasing delay resulted in a negative correlation (α=-0,319**). Decreasing accuracy resulted in a positive correlation (α=-0,152*). The correlation between SUS and OR speed (α=-0,319**) was measured higher than the correlation between SUS and accuracy (α=-0,152*). This leads us to conclude that decreasing recognition speed has more effect on SUS than accuracy (Fig. 9/10). During the reduction of OR speed (-2 sec.), the influence on SUS was measured significantly lower (-0,90%) than during the reduction of accuracy. With 80% accuracy, SUS was measured significantly lower (-4,16%) at 75,68 (Fig. 10).
Figure 9 User Acceptance of OR Speed
This leads us to conclude that an OR Speed of ≤ 2 sec. is "sufficient" for ‘high’ user acceptance (SUS of >75,68) [4]. A faster recognition speed or a further improvement of the algorithm will not result in a higher user acceptance. Furthermore, in some cases the ‘maximum’ recognition speed of 0 sec. can even lead to lower usability. While testing the prototype in practice with a pre-set delay of 0
Perceived Effectiveness OR
Perceived Efficiency OR
User AcceptanceOR
Perceived Ease of Use App
Perceived Usefulness App
Perceived Learnability App
Perceived Enjoyability OR
Perceived Ease of use OR
User Acceptance App
*Accuracy*Speed
Fig. 10
Perceived Suitability App
Perceived Suitability OR Physical Context:
- Gender (? = 0,067)- Age (? = 0,100)
Socio-cultural Context:- Visit Motivation (? = -0,018)- Visit Frequency (? = 0,027)- Time Spend (? = -0,051)
Personal Context:- Motile App Usage (? = -0,100)- Museum App Usage (? = -0,056)- Familiarity OR (? = -0,033)
M = MeanSEM = Standard Error Mean? = Correlation Coefficient* = Independent Variable ** = Value is critical exceeding 2.32 at the 0.01 level of significance
Satisfaction App
Fig. 9
M = -0,696 SEM = 0,340 ? = -0,760**
User Acceptance
M = 86,033SEM = 1,48
? = -0,645**
M = 64,144 SEM = 1,062 ? = 0,499**
M = 64,742 SEM = 1,048 ? = 0,470**
M = 66,508 SEM = 1,129 ? = -0,349**
M = 66,726 SEM = 1,136 ? = -0,523**
M = 66,758 SEM = 1,119 ? = -0,376**
M = 66,06 SEM = 1,148 ? = -0,599**
M = 65,698 SEM = 1,140 ? = -0,548**
M = 64,296 SEM = 1,068 ? = 0,366**
M = 65,367 SEM = 1,148 ? = 0,444**
M = 65,698 SEM = 1,140 ? = -0,518**
= SUS Construct
= Not Statistically Significant
= Statistically Significant

seconds, 11 participants felt that the OR technique was too fast (B6, B60, C72, C35, B49, BB49, B53, A10, C11, B43, B37) and they would have preferred to have waited a bit longer before the prototype recognized the object.
Figure 10 User Acceptance of Accuracy
6.3.2 Recognition Speed and Perceived Efficiency User acceptance of recognition speed is based on ‘Perceived Efficiency’ of the OR technique. The answers given by participants at the construct ‘Object recognition was too slow’ are summarized in Figure 11. User acceptance at ‘maximum’ recognition speed (0 sec.) is measured at 100% (SD=0). During the experiment it was observed that, participants do not mind waiting a couple of seconds before the app provides them information about objects. In addition it was found that a ‘maximum’ OR speed does not always leads to a higher user satisfaction. During the test sessions with the app and a pre-set delay of 0 seconds, 11 participants felt that the OR technique was too fast. They noted independently form each other: “Object recognition already recognized the object before I had scanned the object itself”.
Figure 11 Perceived Efficiency of OR Speed Testing OR with a set delay of 1-4 sec. resulted in ‘high’ user acceptance, average score between 100% and 85,46% (SD 0%-18,09%). A significant degradation of the average user acceptance was measured after testing with a set delay of more than 4 sec. (Fig. 11). While testing with a pre-set
delay of ≥ 5 sec., participants started to assess OR speed significant lower. 18 participants commented that “They found OR too slow” after testing with a pre-set delay ≥ 5 sec. User acceptance was measured lowest (28%) during the experiment with a pre-set delay of 9 sec. (SD 13,98%). In terms of accuracy participants seemed to be more critical.
6.3.3 Accuracy and Perceived Effectiveness User acceptance of accuracy is based on perceived Effectiveness of the OR technique. The answers given by participants at the construct ‘Object recognition was accurate’ are summarized in Figure 12 below. The average user acceptance decreased faster when accuracy was reduced rather tan recognition speed. User acceptance at ‘maximum’ accuracy (100%) was measured significant lower (84%, SD 9,34) than maximum user acceptance at ‘maximum’ recognition speed (100%, SD 0). During the test sessions with a reduced accuracy (-10%), only 74% of the participants found the OR accurate (SD 22,01%). Merely 58,18% of the participants found the OR accurate after using the prototype with 80% accuracy (SD 25,73). In addition variances between user acceptances (SD 19,58%) were measured significant higher than variations between user acceptances for recognition speed (SD 16,28%). The results indicate that users are very critical towards accuracy and that it needs to be 100% for ‘high’ user acceptance (SUS of >77,30) [4]. While developing systems or accelerating techniques for high user acceptance, one should never compromise on accuracy.
Figure 12 Perceived Effectiveness of Accuracy
6.4 Qualitative Assessment Overall feedback regarding the experience using the OR technique was very positive. Nearly half of the participants (84) answered ‘Strongly Agree’ at construct ‘I enjoyed using OR in this context’. In addition 116 participants strongly agreed upon OR was easy to use. However, participants were less satisfied about the app. Only 37 participants found the app useful in this context and 27 would like to use the app more often. Next to these usability constructs, participants also had the ability to

indicate issues and comments. The qualitative assessment of the experienced issues revealed ‘no back button’ (40 times), ‘more information’ (34 times), ‘OR was too fast’ (11 times), ‘OR was too slow’ (18 times). ‘searching for objects required too much attention’ (16 times) and ‘wrong information’ (15 times). The qualitative assessment of participants’ comments revealed ‘more information’ (59 times), ‘nice for children’ (39 times), ‘add audio’ (10 times) and ‘create more interaction’ (8 times). Most recurring factors for improvement were ‘more information’, ‘nice for children’ and ‘no back button’. Further reasons were ‘the technique works very well’ (8 times) and ‘last object was difficult to find’ (6 times).
7. DISCUSSION 7.1 User Acceptance to Accuracy and OR Recognition Speed Both, actual usage and questionnaire results revealed that participants are more critical towards accuracy, than towards OR speed. User acceptance at ‘maximum’ accuracy (100%) is measured significant lower (84%, SD 9,34) than maximum user acceptance at ‘maximum’ recognition speed (100%, SD 0). Surprisingly, participants do not mind waiting ≤ 2 sec. before OR recognizes the object. A recognition speed of ≤ 2 sec. is measured as "sufficient" for ‘high’ user acceptance (SUS of >77,30) [4]. Even more, a ‘maximum’ OR speed does not always leads to a higher user satisfaction. During the test sessions with ‘high’ OR speed (0-1 sec.), 11 participants felt that the OR technique was too fast. One reason might be that participants were a bit ‘overwhelmed’ about the apps OR speed. The information was already displayed on the screen before they had scanned the complete object (11 times). Other reasons might be that some participants gave that the outcome probably would be better if the app should take a little longer. This might also be valuable information from a museum or developers perspective as they spend a lot of time at improving usability and accelerating techniques [12, 7]. A faster recognition speed than ≤ 2 sec. or a further improvement of the algorithm will not result in a higher user acceptance. These findings are the opposite of the findings concerning accuracy, whereby reductions directly seem to influence user acceptance. These results emphasizes the importance of ‘high’ (100%) accuracy for OR apps for real-life use and confirms the hypothesis that decreasing OR speed and accuracy, can negatively influences user acceptance. Nevertheless, actual usage and questionnaire results revealed also measurable differences in user acceptance among participants.
7.2 Variances in User Acceptance and Context Overall feedback regarding the OR technique was very positive. 84 participants enjoyed using OR in this context. In addition 116 participants found OR easy to use.
However, SD values were measured between 13,65-27,92 for user acceptance values for accuracy and between 7,64-13,65 for user acceptance values for recognition speed (Appendix A). These values reflects a large amount of variation, especially for accuracy values. Based on these results, experience in practice and previous literature, it was learned that user acceptance strongly depends on the personal context of the user [6]. Following the mobile museum tour-guide, some participants were very patient, while others tried to finish the tour as soon as possible. Received feedback also highlighted differences in interpretation. Some participants were very critical regarding accuracy, while others strongly agreed upon the accuracy after using the OR technique with a pre-set accuracy of 60 per cent. One participant (C62) commented: ‘OR didn’t classify all the objects correct, but it wasn’t such a big issue for me using the app’. One reason for this might be that females are more critical. They were less satisfied about the accuracy of the OR technique (α=-0,161*, SEM=0,309) and Ease of Use of the app (α=-0,174*, SEM=0,003) than males. However, no statistically significant differences were found between gender and total SUS. Physical differences between visitors are important factor in museums, but age for example is irrelevant for user acceptation of OR apps. Similarly, irrelevant for user acceptance of the app are socio-cultural related contexts as visit motivation and time spend. On the other hand personal differences as the user’s mobile app usage, previous experiences with mobile apps and OR in a museum context have a significant relationship with perceived satisfaction and suitability of the app (correlations between 0,149* and 0,238**). Evidence was found that visitors, which more often visit a museum, are relatively more satisfied about the app (α=0,149*) than other users. These results indicate that physical and social-cultural factors are less reliable indicators for perceived user acceptance than visitor’s personal factors.
7.3 Importance of Content It is remarkable that despite the high user acceptance of the OR technique, only 37 participants strongly agreed upon the usefulness of the app in this context and 27 participants would like to use the app more often. Frequently mentioned (93 times) are comments of visitors regarding the limited information about objects (only 10 objects were included). Visitors commented upon the strict order of the tour and preferred to arbitrarily scan objects:
‘I think that the provided information should be more in depth. The app should also include audio and more objects.
As I was browsing through the collection, I found some very interesting pieces that were not included. I have not
found any visual apps like this one in other museums, this a really original idea’ (C53).
Visitors also often commented that they would like to reed ‘extra’ information about objects on the app (e.g. information that is not available on the plates in the museum):
‘This is a nice app. I believe this can very be useful. However, the information is too general. The app should
show exclusive information, which makes it worth using the app. With the current information I'd rather read the signs.
It is even more interesting to show video or audio on the app. Reading images and text is also possible without this
app. Nevertheless, it is a fun and innovative way of watching art’ (B60).
Mobile OR and reading information on the screen of a smartphone was evaluated positively, as reading plates can be problematic in crowded spaces. OR might be a solution, as it enables museum visitors to read information directly on their devices after scanning the object of interest. Secondly, text can easily be translated into different languages for example for tourists. These findings might be valuable information for exhibit designers and the style of presenting information in museums in the future.
7.4 Study Limitations Notwithstanding all of the benefits of this study, we should be aware that the used research methods have some limitations. The prototype was designed to test the OR technique, the users perceived added value of the tested app is therefore still fairly limited. To get more insights in user acceptance of mobile OR apps, the prototype could be tested with optimized content and using multimodal interaction. While scanning objects with the mobile museum tour-guide, visitors had the option to click on the ‘Try Again’ button after receiving incorrect information about objects (decreased accuracy). The app was programmed to give the correct information, after scanning an object for the second time. This could result in higher results for perceived Effectiveness. In order to simulate a real life setting, the app should randomly provide incorrect classifications (e.g. not always the right). Other limitations of this study include the sample size. Despite the large size of the sample (N=184), we spitted the group in 17 sub-groups to test technical acceptance at different values for OR speed and accuracy. This resulted in smaller sub-groups to demonstrate feasibility. Another limitation, also related to the sample was the location. This research was performed, using a random sample within the AP museum. Other museums in Amsterdam are excluded. Including more visitors, from multiple museums, could have expanded the size. But due to time constraints we could not recruit more participants. We only had 3 months for this study. Lastly, the participants used the app for on average 9 minutes and 48,73 sec. Thus limiting the amount of data available and user acceptance information.
8. CONCLUSION This research not only demonstrated ‘high’ user acceptance of OR in museum tour-guide apps. More importantly, it could serve as a guideline for museums and developers to consider when creating OR apps. Given comparable performance indicators for speed and accuracy, factors such as perceived Effectiveness, perceived Efficiency and SUS [4]. The results suggest an evolution in the weight of these factors for user acceptance. While previous research has focused on making OR techniques as fast and accurate as possible, the results highlight that this does not necessarily leads to a higher user satisfaction. The OR speed of ≤ 2 sec. was measured as "sufficient" for ‘high’ user acceptance (SUS of >77,30). However, results revealed that visitors are more critical towards accuracy, only maximum accuracy has lead to high user acceptance. Furthermore, the results reflected a large amount of variation, this was caused by the context dependency of the perceived user acceptance. The need to re-evaluate the three overlapping contexts, which are important for interaction and meaning making in a museum were discussed as potentially generalizable implications. The OR technique in general was accepted very well. It is remarkable that despite the high user acceptance on the OR technique, only 37 participants strongly agreed upon the usefulness of the app in this context and 27 participants would like to use the app more often. One reason for this might be that the perceived added value of an app was still fairly limited. Visitors commented upon the strict order of the tour and preferred to arbitrarily scan objects. Visitors also often commented that they would like to read ‘extra’ information about objects on the app (e.g. information that is not available on the plates in the museum). These findings might be valuable information for museums and exhibit designers for presenting information in museums in the future.
9. FUTURE WORK Future work should be in the direction of deploying TombReader in a real-world context for further experimentation and evaluation. The app should be available in the app store, allowing visitors to download the app themselves. This makes it possible to test the application for a longer period of time, which may lead to interesting test results. Longer test sessions would also be an opportunity to obtain deeper insights into the relation on user acceptance and the personal context of the user. The presented results might also motivate developments to explore the potential of OR apps with multiple museum tour-guides, arbitrary scanning objects or to let visitors create quests themselves. In addition, should be explored how the app can be deployed for children, elderly and also for physically and visually handicapped visitors. We expect that the direct user interaction with the objects would stimulate children to read or listen to information about museum objects. At this stadia the added value of the app is still fairly limited, multimedia features of the smartphone

might provide added value to the user such as audio and video. Future work in mobile OR app design research should look into this to explore limitations and possibilities, from a museum, technological-, and social perspective.
10. ACKNOWLEDGMENTS I would like to thank everyone who has contributed to this report. Especially Jan van Gemert and Morris Franken for their valuable advice and the provision of the TombReader app. I’m also very grateful for the support of Merel van der Vaart, the Allard Pierson Museum and all 184 participants involved in the field experiments. Without their help, I had not been able to obtain this result. Also highly appreciated is the help of my colleagues: Sheilagh Douma and Yashvir Sewcharan.
11. REFERENCES [1] Albertini, A., Brunelli, R., Stock, O., & Zancanaro, M.
(2005, January). Communicating user's focus of attention by image processing as input for a mobile museum guide. In Proceedings of the 10th international conference on Intelligent user interfaces (pp. 299-301). ACM.
[2] Bay, H., Fasel, B., & Gool, L. V. (2006, May). Interactive museum guide: Fast and robust recognition of museum objects. In Proceedings of the first international workshop on mobile vision.
[3] Bentley, F., & Barrett, E. (2012). Building mobile experiences. MIT Press.
[4] Brooke, J. (2013). SUS: a retrospective. Journal of Usability Studies, 8(2), 29-40.
[5] Davies, N., Cheverst, K., Dix, A., & Hesse, A. (2005, September). Understanding the role of image recognition in mobile tour guides. InProceedings of the 7th international conference on Human computer interaction with mobile devices & services (pp. 191-198). ACM.
[6] Falk, J. H., & Dierking, L. D. (2012). Museum Experience Revisited. Left Coast Press.
[7] Franken, M., & van Gemert, J. C. (2013, October). Automatic egyptian hieroglyph recognition by retrieving images as texts. In Proceedings of the 21st ACM international conference on Multimedia (pp. 765-768). ACM.
[8] Föckler, P., Zeidler, T., Brombach, B., Bruns, E., & Bimber, O. (2005, December). PhoneGuide: museum guidance supported by on-device object recognition on mobile phones. In Proceedings of the 4th international conference on Mobile and ubiquitous multimedia (pp. 3-10). ACM.
[9] Karray, F., Alemzadeh, M., Saleh, J. A., & Arab, M. N. (2008). Human-computer interaction: Overview on state of the art.
[10] Long, S., Kooper, R., Abowd, G. D., & Atkeson, C. G. (1996, November). Rapid prototyping of mobile context-aware applications: The cyberguide case study. InProceedings of the 2nd annual international conference on Mobile computing and networking (pp. 97-107). ACM.
[11] Robson, C. (2002). Real world research: A resource for social scientists and practitioner-researchers (Vol. 2). Oxford: Blackwell.
[12] Taber, M. M. (2014). Use of Mobile Technology Among Museum Visitors: A Case Study.
[13] Sun, K. B., & Super, B. J. (2005, June). Classification of contour shapes using class segment sets. In Computer Vision and Pattern Recognition, 2005. CVPR 2005. IEEE Computer Society Conference on (Vol. 2, pp. 727-733). IEEE.
[14] Vaart, M. v. (2015). Informele gebruikstest Tomb Reader. Allard Pierson Museum - University of Amsterdam. Amsterdam: Allard Pierson Museum - University of Amsterdam.
[15] Wein, L. (2014, April). Visual recognition in museum guide apps: do visitors want it?. In Proceedings of the SIGCHI Conference on Human Factors in Computing Systems (pp. 635-638). ACM.

APPENDIX A
Ten usability constructs and corresponding questions No. Construct Question Phrasing
1 Usefulness App I found this mobile app useful in this context.
2 Learnability App (negative) It was difficult to become skilfull with the mobile app.
3 Suitability App Using the mobile app improved my experiences during the tour.
4 Ease of Use App (negative) The mobile app distracted me from the exhibition.
5 Satisfaction App I think that I will use this app more often.
6 Suitability OR OR is suitable to access information in this setting.
7 Ease of use OR (negative) OR was difficult to use.
8 Efficiency OR (negative) OR was too slow.
9 Effectiveness OR OR was accurate.
10 Enjoyability OR I enjoyed using OR in this context.
Average User Acceptance, Efficiency and Effectiveness OR Speed N Speed
(s) Perceived
Efficiency Perceived
Effectiveness UA
Speed SUS
Score SUS
SD
SUS
Sig. (α)
10 0 100% 84% 100% 78 13,65 0
10 0 90% 76% 90% 74,75 9,04 0
11 0 80% 58,18% 96,36% 75,68 10,25 0,091
11 0 70% 52,73% 94,55% 69,77 9,26 0
11 0 60% 52,73% 87,73% 69,09 7,64 1,162
10 0 50% 42% 90% 58,26 12,49 0,06
10 0 40% 25% 90% 60,75 10,63 0,004
Average User Acceptance, Efficiency, and Effectiveness Accuracy N Speed
(s) Perceived Efficiency
Perceived Effectiveness
UA Speed
SUS Score
SUS
SD
Sig. (α)
10 0 100% 84% 100% 78 13,65 0
14 1 100% 70% 94,29% 77,73 24,03 0
13 2 100% 72,31% 93,85% 77,30 24,27 0
10 3 100% 64% 86% 72,75 25,13 0,01
11 4 100% 72,73% 85,46% 71,59 24,29 0,01
11 5 100% 63,64% 52,72% 68,64 21,49 0,001
10 6 100% 74% 68% 77,50 27,92 0,076
10 7 100% 62% 60% 73,50 25,22 0,143
11 8 100% 68% 36% 56,14 18,69 0,002
10 9 100% 64% 28% 50,75 16,84 0
10 10 100% 66% 32% 51 13,76 0