mirsynergy: detecting synergistic mirna regulatory modules by overlapping neighbourhood expansion
TRANSCRIPT
Vol 30 no 18 2014 pages 2627ndash2635BIOINFORMATICS ORIGINAL PAPER doi101093bioinformaticsbtu373
Systems biology Advance Access publication June 3 2014
Mirsynergy detecting synergistic miRNA regulatory modules by
overlapping neighbourhood expansionYue Li12y Cheng Liang3y Ka-Chun Wong12 Jiawei Luo3 and Zhaolei Zhang1241Department of Computer Science 2The Donnelly Centre University of Toronto Toronto Ontario M5S 3E1 Canada3College of Information Science and Engineering Hunan University Changsha Hunan 410082 China and 4Banting andBest Department of Medical Research and Department of Molecular Genetics University of Toronto Toronto OntarioM5S 3E1 Canada
Associate Editor Ivo Hofacker
ABSTRACT
Motivation Identification of microRNA regulatory modules (MiRMs)
will aid deciphering aberrant transcriptional regulatory network in
cancer but is computationally challenging Existing methods are sto-
chastic or require a fixed number of regulatory modules
Results We propose Mirsynergy an efficient deterministic overlap-
ping clustering algorithm adapted from a recently developed frame-
work Mirsynergy operates in two stages it first forms MiRMs based
on co-occurring microRNA (miRNA) targets and then expands each
MiRM by greedily including (excluding) mRNAs into (from) the MiRM to
maximize the synergy score which is a function of miRNAndashmRNA and
genendashgene interactions Using expression data for ovarian breast and
thyroid cancer from The Cancer Genome Atlas we compared
Mirsynergy with internal controls and existing methods Mirsynergy-
MiRMs exhibit significantly higher functional enrichment and more
coherent miRNAndashmRNA expression anti-correlation Based on
KaplanndashMeier survival analysis we proposed several prognostically
promising MiRMs and envisioned their utility in cancer research
Availability and implementation Mirsynergy is implemented
available as an RBioconductor package at wwwcsutorontoca
yueliMirsynergyhtml
Contact yuelicstorontoedu zhaoleizhangutorontoca
Supplementary information Supplementary data are available at
Bioinformatics online
Received on February 14 2014 revised on May 28 2014 accepted
on May 29 2014
1 INTRODUCTION
MicroRNAs (miRNAs) are 22nt small non-coding RNA that
base pair with mRNAs primarily at the 30 untranslated region
(UTR) to cause mRNA degradation or translational repression
(Bartel 2009) Aberrant miRNA expression is implicated in
tumourigenesis (Spizzo et al 2009) Based on miRBase (release
20) (Kozomara and Griffiths-Jones 2014) the human genome
encodes 1872 (2578) precursor (mature) miRNAs which poten-
tially target majority of the human genes (Friedman et al 2009)
Although targets of individual miRNAs are significantly en-
riched for certain biological processes (Papadopoulos et al
2009 Tsang et al 2010) it is also likely that multiple miRNAs
are coordinated together to synergistically regulate one or more
pathways (Boross et al 2009 Krek et al 2005 Xu et al 2011)
Despite their limited number miRNAs may be in charge of more
evolutionarily robust and potent regulatory effects through coor-
dinated collective actions The hypothesis of miRNA synergism
is also parsimonious or biologically plausible because the number
of possible combinations of the 2578 human miRNAs is ex-
tremely large to potentially react to virtually countless environ-
mental changes Intuitively if a group of (miRNA) workers
perform similar tasks together then removing a single worker
will not be as detrimental as assigning each worker a unique task
(Boross et al 2009)Several related methods have been developed to study miRNA
synergism Some early methods were based on pairwise overlaps
(Shalgi et al 2007) or score-specific correlation (Xu et al 2011)
between predicted target sites of any given two (co-expressed)
miRNAs For instance Shalgi et al (2007) devised an overlap-
ping scoring scheme to account for differential 30UTR lengths of
the miRNA targets which may otherwise bias the results if
standard hypergeometric test was used Methods beyond pair-
wise overlaps have also been described These methods consider
not only the sequence-based miRNA-target site information but
also the respective miRNAndashmRNA expression correlation
(MiMEC) across various conditions to detect miRNA regulatory
modules (MiRMs)
Briefly Joung et al (2007) developed a probabilistic search
procedure to separately sample from the mRNA and miRNA
pools candidate module members with probabilities proportional
to their overall frequency of being chosen as the lsquofittestrsquo which is
determined by their target sites andMiMEC relative to the coun-
terparts The algorithm finds only a single best MiRM which
varies depending on the initial mRNA and miRNA set Peng
et al (2009) used a maximal bi-clique enumeration (MBE) tech-
nique to discover complete bipartite subgraphs where every
miRNA is connected with every mRNA The approach operates
on unweighted edges only which requires discretizing MiMEC
Moreover maximal bi-clique does not necessarily imply func-
tional MiRMs and vice versa Le and Bar-Joseph (2011)
developed GroupMiR to form MiRMs by assigning each
miRNA or mRNA (mmiRNA) one or more memberships
To whom correspondence should be addressedyThe authors wish it to be known that in their opinion the first twoauthors should be regarded as Joint First Authors
The Author 2014 Published by Oxford University Press All rights reserved For Permissions please e-mail journalspermissionsoupcom 2627
by guest on August 27 2016
httpbioinformaticsoxfordjournalsorg
Dow
nloaded from
based on a non-parametric Bayesian prior called Indian Buffet
Process Although GroupMiR is statistically sound it has time
complexity cubic to the number of observations and converges
slow on large datasets (Griffiths and Ghahramani 2005)
More recently Zhang et al (2011) described a framework of
sparse network-regularized multiple non-negative matrix factor-
ization (SNMNMF) to identify miRNAndashmRNA modules based
on the factorized coefficient matrices Importantly SNMNMF
uses not only the expression and target-site information but also
the genendashgene interaction (GGI) derived from proteinndashprotein
interaction (PPI) and transcription factor binding sites (TFBS)
To define the reduced dimensionality of the factorized matrices
however the SNMNMF approach requires a predefined number
of modules which may be data-dependent and difficult to deter-
mine beforehand Additionally the solution to NMF is often not
unique and the identified modules do not necessarily include
both miRNAs and mRNAs which makes reproducing and in-
terpreting the results difficult Similarly the regression-based
model called PIMiM (Protein Interaction-based MicroRNA
Modules) developed by Le and Bar-Joseph (2013) also requires
a fixed number of unique memberships and the non-convexity
of the algorithm leads to different outcomes with random
initializations Additionally both algorithms incur a time com-
plexity quadratic to both the number of miRNA and mRNA
multiplied by the (squared) total number of modules per iter-
ation We herein hypothesize that an intuitively simple and effi-
cient deterministic framework may serve as an attractive
alternative
In this article we propose a novel model called Mirsynergy
that integrates mmiRNA expression profiles target site infor-
mation and GGI to form MiRMs where an mmiRNA may
participate in multiple MiRMs and the module number is sys-
tematically determined given the predefined model parameters
The clustering algorithm of Mirsynergy adapts from
ClusterONE (Nepusz et al 2012) which was intended to identify
protein complex from PPI data The ultimate goal here however
is to construct a priori the MiRMs and exploit them to better
explain clinical outcomes such as patient survival rate We apply
Mirsynergy to ovarian (OV) breast (BRCA) and thyroid cancer
(THCA) datasets from TCGA (Cancer Genome Atlas Research
Network 2008) Comparing with alternative formalisms we find
that the Mirsynergy-based modules are more functionally en-
riched and exhibit more negative MiMEC Through Kaplanndash
Meier (KM) survival analysis we propose several prognostically
promising cancer-specific MiRMs as biomarkers
2 METHODS
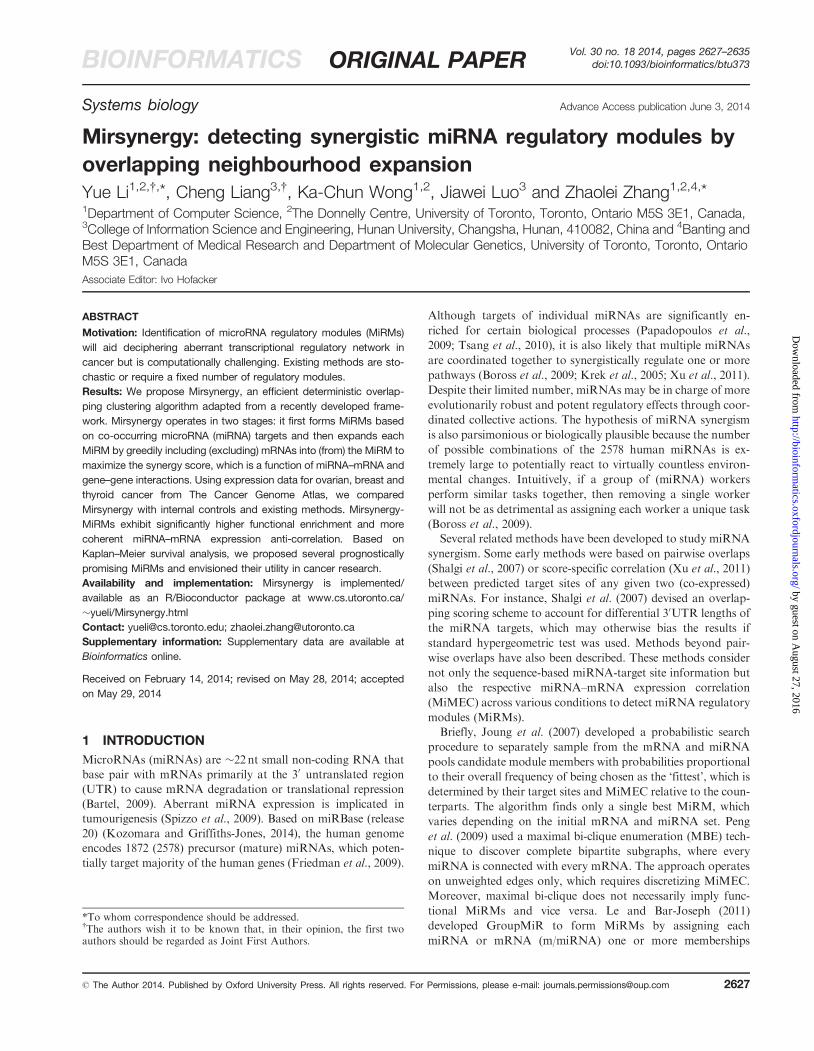
21 Mirsynergy model overview
We formulate the construction of synergistic MiRMs as an overlapping
clustering problem with two main stages Figure 1 depicts our model
schema Before the two clustering stages we first inferred miRNAndash
mRNA interaction weights (MMIW) (W) using mmiRNA expression
data and target site information (Section 22) At stage 1 we only cluster
miRNAs to greedily maximize miRNAndashmiRNA synergy which is pro-
portional to the correlation between miRNAs in terms of their MMIW
(See Section 22) At stage 2 we fix the MiRM assignments and greedily
add (remove) genes to (from) each MiRM to maximize the synergy score
which is defined as a function of the MMIW matrix and the genendashgene
interaction weight (GGIW) matrix (H) The underlying clustering algo-
rithm at both stages (Section 23) adapts from ClusterONE which was
originally developed for PPI network (Nepusz et al 2012)
22 Evaluation of expression-based prediction models
To compute MMIW as the edge-weight matrix for downstream cluster-
ing we first evaluated four prominent expression-based miRNA target
prediction algorithms namely Pearson correlation coefficient (PCC)
(Zhang et al 2011) GenMiR++ (Huang et al 2007) and two formu-
lations of LASSO (Lu et al 2011) Specifically PCC between each pair
of mmiRNA across T samples was computed using R built-in function
cor Targets with negative correlation were ranked at the top
GenMiR++ was ran in Matlab with default setting using as input the
binary target site matrix and the expression profiles We implemented two
versions of LASSO both using glmnet with =1 except that the best
was chosen using cross-validation function cvglmnet (Friedman et al
2010) For the first LASSO we used expression of miRNAs
k 2 f1 Mg that have non-zero target sites to model the corresponding
Fig 1 Mirsynergy workflow Given the inputs of mmiRNA expression
profiles and sequence-based target site information we first derive an
expression-based MMIW matrix W using L1-norm regularized linear re-
gression model (ie LASSO) We then compute miRNAndashmiRNA syner-
gistic scores S based on the MMIW matrix which is subsequently
provided as input to form miRNA clusters V0 at Stage 1 by an over-
lapping neighbourhood expansion clustering algorithm Next we fix the
MiRM assignments V0 and greedily add (remove) mRNA to (from) each
module that maximizes the synergy score where the edge weights are
defined by the MMIW matrix and GGIW matrix involving known
TFBS and PPI The end results are overlapping clustering assignments
of mmiRNAs (ie MiRMs)
2628
YLi et al
by guest on August 27 2016
httpbioinformaticsoxfordjournalsorg
Dow
nloaded from
mRNA expression i 2 f1 Ng across samples t 2 f1 Tg
xitwi0+P
k wikethzktcikTHORN where wi0 is the bias cik is the number of
target sites in mRNA i for miRNA k wik 2WNM is the fitted linear
coefficients used for the MMIW For the second LASSO namely
LASSO_RISC (RNA-induced silencing complex) we used target site
counts miRNA and Ago 1ndash4 mRNA expression as the input variable
xitwi0+P
k wikAgo2zktcik+P
k w0ikAgo134zkt The rationale behind
LASSO_RISC is that Ago2 is the only protein component known to
catalyse target mRNA degradation whereas the non-catalytic Ago 134
proteins may compete with Ago2 to bind to miRNAs thus the expres-
sion changes in the Ago 1 3 4 proteins will affect the ability of Ago2 to
bind to miRNAs (Lu et al 2011) For LASSO and LASSO_RISC inter-
actions associated with negative linear coefficients wik (ie MMIW) were
ranked at the top as the candidate interactions
Because of the scarcity of the validated miRNA targets conventional
power analysis such as ROC (receiver operating characteristic) cannot
distinguish the method performances Instead we assessed each method
by the number of validated interactions they identified among their top
ranked 1000ndash5000 targets (1000-interval) based on miRTarBase (Hsu
et al 2011) Among the four methods LASSO achieved the best overall
performance on our test data (Supplementary Fig S1) Accordingly we
adopted the linear coefficient matrix wik 2W from LASSO as the NM
MMIW matrix and set all of its positive coefficients to zero assuming
only negative miRNA regulation
23 Two-stage clustering
Let W denote the expression-based NM MMIW matrix obtained
from LASSO determined as the best performing target predic-
tion model in Section 22 where wik is the scoring weight for
miRNA k targeting mRNA i Similar to the lsquoMeetMinrsquo score defined
by Shalgi et al (2007) for binary interactions of co-occurring targets
of miRNA pairs we define an MM scoring matrix denoted as S
indicating miRNAndashmiRNA synergistic scores between miRNA j and k
(j 6frac14 k)
sjk=
XNi=1
wijwik
minXi
wijXi
wik
eth1THORN
Notably if W were a binary matrix Equation 1 became the ratio of
number of targets shared between miRNA j and k over the minimum
number of targets possessed by j or k which is essentially the original
lsquoMeetMinrsquo score
Similar to the cohesiveness defined by Nepusz et al (2012) we define
synergy score s(Vc) for any given MiRM Vc as follows Let winethVcTHORN denote
the total weights of the internal edges within the miRNA cluster
wboundethVcTHORN the total weights of the boundary edges connecting the
miRNAs within Vc to the miRNAs outside Vc and (Vc) the penalty
scores for forming cluster Vc The synergy of Vc (ie the objective func-
tion) is as follows
sethVcTHORN=winethVcTHORN
winethVcTHORN+wboundethVcTHORN+ethVcTHORNeth2THORN
where (Vc) reflects our limited knowledge on potential unknown targets
of the added miRNAs as well as the false-positive targets within the
cluster Presumably these unknown factors will affect our decision on
whether miRNA k belong to cluster Vc For instance miRNAs may
target non-coding RNAs and seedless targets which are the mRNAs
with no perfect seed-match (Helwak et al 2013) We currently consider
only mRNA targets with seed-match to minimize the number of false-
positive results By default we set ethVcTHORN=2jVcj where jVcj is the cardin-
ality of Vc Additionally we define two scoring functions to assess the
overlap ethVcVc0 THORN between Vc and Vc0 for c 6frac14 c0 and the density d1(Vc) of
any given Vc
ethVcVc0 THORN=jVc Vc0 j
2
jVcjjVc0 jeth3THORN
d1ethVcTHORN=2winethVcTHORN
methm 1THORNeth4THORN
where jVc Vc0 j is the total number of common elements in Vc and Vc0
and m is the number of miRNAs in Vc
The general solution for solving an overlapping clustering problem is
Non-deterministic Polynomial-time hard (NP-hard) (Barthelemy and
Brucker 2001) Thus we adapt a greedy-based approach (Nepusz
et al 2012) The algorithm can be divided into two major steps In
step 1 we select as an initial seedmiRNA k with the highest total weights
We then grow anMiRM Vt from seed k by iteratively including boundary
or excluding internal miRNAs to maximize the synergy s(Vt) (Equation 2)
until no more node can be added or removed to improve s(Vt) We then
pick another miRNA that has neither been considered as seed nor
included in any previously expanded Vt to form Vt+1 The entire process
terminates when all of the miRNAs are considered In step 2 we treat the
clusters as a graph with Vc as nodes and ethVcVc0 THORN as edges Here is
a free parameter Empirically we observed that most MiRMs are quite
distinct from one another in terms of ethVcVc0 THORN (before the merging)
(Supplementary Fig S2A) Accordingly we set to 08 to ensure merging
only similar MiRMs which avoids producing large MiRMs (when is
too small) We then perform a breath-first search to find all of the weakly
connected components (CC) each containing clusters that can reach dir-
ectlyindirectly to one another within the CC We merge all of the clusters
in the same CC and update the synergy score accordingly Algorithm 1
outlines the pseudocode
After forming MiRMs at stage 1 we perform a similar clustering pro-
cedure as in Algorithm 1 by adding (removing) only the mRNAs to (from)
each MiRM Different from stage 1 however we grow each existing
MiRM separately with no prioritized seed selection or cluster merging
which allows us to implement a parallel computation by taking advantage
of the multicore processors in the modern computers In growingcon-
tracting each MiRM we maximize the same synergy function (Equation
2) but changing the edge weight matrix from S to a (N+M) (N+M)
matrix by combining W (the NM MMIW matrix) and H (the NN
GGIW matrix) Notably here we assume miRNAndashmiRNA edges to be
zero Additionally we do not addremove miRNAs tofrom the MiRM
at each greedy step Finally we define a new density function because of
the connectivity change at stage 2
d2ethVcTHORN=winethVcTHORN
nethm+n 1THORNeth5THORN
where n (m) are the number of mRNAs (miRNAs) in Vc By default we
filter out MiRMs with d1ethViTHORN51e2 and d2ethVjTHORN55e3 at stage 1 and 2
respectively Both density thresholds were chosen based on our empirical
analyses (Supplementary Fig S2) For some datasets in particular we
found that our greedy approach tends to produce a large cluster involving
several hundred miRNAs or several thousand mRNAs at Stage 1 or 2
respectively which are unlikely to be biologically meaningful Despite the
ever increasing synergy (by definition) however the anomaly modules all
have low density scores which allows us to filter them out using the
above chosen thresholds
The time complexity of the algorithm is O(M(N+M)) stage 1 takes
O(M2) in the worst case scenario by checking every miRNA in forming
an MiRM using every miRNA as a seed given that the maximum
number of MiRMs is M stage 2 takes O(NM) In our actual implemen-
tation the total weights of each node is pre-computed so that the synergy
update is O(1) Moreover we maintain a sorted list using numbers to
represent mmiRNA nodes for efficient binary search of neighbour or
removable nodes
2629
Mirsynergy
by guest on August 27 2016
httpbioinformaticsoxfordjournalsorg
Dow
nloaded from
Algorithm 1 Mirsynergy stage 1 clustering procedure
1 l Step1 Grow MiRMs by overlapping neighbourhood expansion
2 V 1 K f1 Mg for M miRNAs
3 while K 6frac141 do
4 k arg maxk02K
Pj sk0j l k miRNA with max total synergistic scores
5 Vt fkg Vt 16 while Vt 6frac14 Vt do l Stop if cur cluster is same as prev cluster
7 Vt Vtl Choose the best neighbour miRNA to add
8 j0 arg maxj0=2Vt
frac12sethVt [ j0THORN where wj0 k 6frac14 0 for k 2 Vt
l Choose the best miRNA in the cluster to remove
9 j arg maxj2Vt
frac12sethVt n jTHORN
l Grow contract or do nothing whichever produces the highest synergy
10 if sethVt [ j0 THORN4max frac12sethVt n jTHORN sethVtTHORN then
11 Vt Vt [ fjg
12 else if sethVt n jTHORN4max frac12sethVt [ j0THORN sethVtTHORN then
13 Vt Vt n j
14 end if
15 end while
16 V V [ fVtg
17 K K n fk 2 Vtg
18 end while
19 l Step2 Merging MiRMs by breath-first search
20 for all Vc 2 V do
21 C fVcgV V n fVcg
l Compare each cluster Vc with every other cluster Vc0 (c 6frac14 c0)
22 for all Vc0 V do
23 if ethVcVc0 THORN then
24 C C [ fVc0 gV V n fVc0 g
25 end if
26 end for
27 Vt 1l Merge all of the clusters that are in C
28 for all Vk C do
29 Vt Vt [ Vk
30 end for
31 V V [ fVt g
32 end for
33 V V
34 return V
24 Method comparisons
To compare the performance of Mirsynergy we applied SNMNMF
(Zhang et al 2011) to the same testing data SNMNMF is one of the
most cited works in the recent literature and has been shown to outper-
form the MBE approach introduced earlier by Peng et al (2009)
SNMNMF was implemented in Matlab with source code available As
suggested by the authors we set the required module number to 50 and
used the default settings throughout the tests Additionally we also com-
pared our results (using the same test dataset) with the published results
from another recent algorithm called PIMiM developed by Le and Bar-
Joseph (2013) which was shown to outperform SNMNMF but the soft-
ware is not publicly available
25 Functional enrichment comparison
We examined whether the target genes in each MiRM are involved in
biologically meaningful Gene Ontology (GO) or pathways via functional
enrichment analysis Specifically GO terms in biological processes (BPs)
(GO-BPs) were downloaded using getBM function from R package
biomaRt where GO terms with fewer than five genes or with evidence
codes equal to Electronic Annotation Non-traceable Author Statement
or No biological Data available were discarded giving 2007 GO-BP
terms and 10315 unique genes The canonical pathways were down-
loaded from MSigDB (c2cpv40symbolsgmt) (Subramanian et al
2005) The list of Ensembl gene IDs for each MiRM was then subjected
to hypergeometric enrichment test for each GO-BP term or pathways
using R built-in function phyper The P-values were corrected for mul-
tiple testing by R function padjust to produce false discovery rates
(FDR)
26 Data collection and pre-processing
For the first test dataset we obtained the same ovarian cancer dataset
processed by the SNMNMF authors (Zhang et al 2011) The expression
data from this dataset were originally downloaded from TCGA along
with the target site information from MicroCosm (v5) and GGI from
TRANSFAC (Wingender et al 2000) The expression dataset contains
385 samples each measuring 559 miRNAs and 12456 mRNAs For the
second and third test datasets we downloaded the expression data for
BRCA and THCA from TCGA data portal The BRCA and THCA data
contain 331 and 543 samples respectively each measuring 710 miRNAs
and 13 306 mRNAs For both datasets processed (level 3) RNA-seq(V2)
and miRNA-seq data were used which record the RPKM (read per
kilobase of exon per million mapped reads) values for mRNAs and
RPM (reads per million miRNAs mapped) for miRNAs The data
were further log2-transformed and mean-centred Clinical information
for OV BRCA and THCA were also collected from TCGA
For the BRCA and THCA we used target site information from
TargetScanHuman 62 database (Friedman et al 2009) For each
mRNAndashmiRNA pair that have measured expression in TCGA data
we extracted the corresponding conserved target sites For multiple tran-
scripts of the same gene we used transcripts with the longest 30UTR
GGI data matrix H including TFBS and PPI data were processed from
TRANSFAC (Wingender et al 2000) and BioGrid (Stark et al 2011)
databases respectively Cancer-related miRNAs as oncomirs or tumour
suppressors (ie miRNAs highly or lowly expressed in cancers) were
downloaded from Spizzo et al (2009) and Koturbash et al (2011)
Tables 1 and 2 where 97 oncomirs have measured expression in the
TCGA data
3 RESULTS
31 Comparison of module sizes and connectivities
Mirsynergy identified 84 53 50 MiRMs in OV BRCA and
THCA datasets respectively (Table 1 Supplementary Table
S1) Intriguingly the overall synergy landscapes are distinct for
each cancer type at both clustering stages (Supplementary Fig
S3) Comparing with the MiRMs from SNMNMF however the
modules identified by Mirsynergy are clearly more densely con-
nected within and between MiRMs (Fig 2 Supplementary Figs
S4 S5) which are comparable with the module density asso-
ciated with PIMiM-MiRMs (on the same OV dataset) (Le and
Bar-Joseph 2013) and perhaps more consistent with the intricacy
of the underlying biological network Moreover Mirsynergy
identified more modules (84 53 50) than SNMNMF did (49
39 39) for OV BRCA and THCA respectively (Table 1)
Notably although we set K=50 for SNMNMF some modules
were empty and thus discarded by the algorithm For OV
BRCA and THCA datasets the respective averaged number of
miRNAs (genes) per module are 476 577 760 (757 2415
3226) for Mirsynergy and 412 262 223 (8137 7156 7482)
for SNMNMF (Table 1) For the BRCA and THCA datasets 8
39 modules from SNMNMF have only one miRNA (ie lsquostar-
shapersquo basic network structure) and 2039 modules have less than
three miRNAs In contrast all of the modules from Mirsynergy
have more than one miRNA and most modules have at least
2630
YLi et al
by guest on August 27 2016
httpbioinformaticsoxfordjournalsorg
Dow
nloaded from
three miRNAs (Supplementary Table S1) Moreover the max-
imum number of miRNAs in a single Mirsynergy-MiRM are 12
20 and 19 for OV BRCA and THCA respectively In contrast
PIMiM obtained at maximum eight miRNAs per module for
the OV dataset and the highest miRNA counts for the
SNMNMF modules are 9 5 and 7 for OV BRCA and
THCA respectively Notably there are considerably fewer
genes in the Mirsynergy-MiRMs than in modules identified
by SNMNMF and PIMiM This perhaps implies that each
MiRM identified by Mirsynergy is responsible for a more spe-
cific biological process or pathway which is supported by the
functional enrichment analysis described below Thus
Mirsynergy predictions are in better agreement with the notion
of miRNA synergistic regulation where a relatively large
number of miRNAs can engage in regulating a specialized
cohort of interconnected genes
32 Evaluating MiRMs by functional enrichments
As an internal control we first compared whether the nodes
included in each MiRM (ie internal nodes) tend to be more
functionally enriched than the boundary nodes which have
non-zero connections to the internal nodes but were either dis-
regarded or removed from the modules during the neighbour-
hood expansion As illustrated in Figure 3 (Supplementary
Fig S6) the number of significant GO-BP terms at
FDR5005 (upper panel) and the total enrichment scores
across all terms (lower panel) are significantly higher (P51e-3
one-sided Wilcoxon signed rank test) for the internal nodes
comparing with boundary nodes Interestingly we also observed
modestly positive Pearson correlations (OV=014
BRCA=028 THCA=039) between the synergy and enrich-
ment scores (Supplementary Fig S7) further supporting the bio-
logical function of the identified modulesTo compare functional enrichments of the predicted modules
from Mirsynergy and SNMNMF we counted as a function of
enrichment score the number of significant modules having at
least one significant canonical pathways (CPs) or GO-BPs and
the total number of significant CPs or GO-BPs across all mod-
ules As depicted in Figure 4 (Supplementary Fig S8) comparing
with SNMNMF Mirsynergy produced significantly higher
number of functionally meaningful MiRMs (upper panel)
(P5000781 000707 respectively one-sided Wilcoxon signed
rank test) which together contribute significantly higher
number of distinct CPs or GO-BPs (P5000781 000195 re-
spectively) Moreover Mirsynergy also compares favourably
with PIMiM which used the same ovarian dataset target site
information and GGI data based on the published results from
Le and Bar-Joseph (2013) (Fig 4A) Notably the averaged en-
richment scores over all of the Mirsynergy-MiRMs are also
higher than the scores from SNMNMF in all three test datasets
(Table 1)Examining enriched GO terms exclusive to Mirsynergy-
MiRMs (Supplementary Table S2) revealed several interesting
cancer-related processes eg lsquoDNA damage response signal
transduction by p53 class mediatorrsquo (GO0030330
FDR50016 OV-MiRM-4) which involves oncogene BCL3
(Forbes et al 2011) and OV-related oncomir miR-20a
(Koturbash et al 2011) lsquoovarian follicle developmentrsquo
Table 1 Performance summary of Mirsynergy SNMNMF and PIMiM
Cancer Method M miR mR GOES MiMEC Time
OV Mirsynergy 84 476 757 1564 ndash005 1
SNMNMF 49 412 8137 751 007 24+
PIMiMy 40 47 6780 NA ndash0013 NA
BRCA Mirsynergy 53 577 2415 874 ndash008 15
SNMNMF 39 262 7156 556 ndash004 24+
THCA Mirsynergy 50 760 3226 804 ndash008 2
SNMNMF 39 223 7482 673 ndash004 24+
Note M module number miR and mR average miRNA and mRNA per module GOES GO enrichment score (MG
XGg
logFDR) MiMEC miRNAndashmRNA expression
correlation Time number of hours took to run Notably LASSO alone took about an hour which is included in the above run time of Mirsynergy yThe results for PIMiM
were directly taken from the original paper (Le and Bar-Joseph 2013) where GOES and Time are not available (NA) The comparison here is fair because all of three methods
were applied to the same OV dataset used in Zhang et al (2011)
Fig 2 Network overview using ovarian dataset The networks from
SNMNMF (left) and Mirsynergy (right) were rendered by Cytoscape 3
(Shannon et al 2003) Edges represent either miRNAndashmRNA (solid red
line) or genendashgene interactions (dash blue line)
2631
Mirsynergy
by guest on August 27 2016
httpbioinformaticsoxfordjournalsorg
Dow
nloaded from
(GO0001541 FDR50022 OV-MiRM-58) involving an OV-
related oncomir miR-221 and lsquonegative regulation of epithelial
to mesenchymal transitionrsquo (GO0010719 FDR50037 BRCA-
MiRM-1 also see Supplementary Fig S9) which is known to be
associated with breast cancer (Davis et al 2013) It is also inter-
esting to note that the miR-30 family members hsa-miR-30a
(chr6 72113254-324) and miR-30e (chr1 41220027-118)
(Kozomara and Griffiths-Jones 2014) were both identified by
Mirsynergy to be involved in BRCA-MiRM-1 Moreover
miR-30 has been predicted to regulate a number of breast
cancer-associated genes in patients who are non-carriers of
BRCA12 mutations lending the possibility that familial breast
cancer may be caused by variation in these miRNAs (Kozomara
and Griffiths-Jones 2014) Additionally module 11 and 23 from
THCA data are respectively enriched for lsquothymus developmentrsquo
(GO0048538 FDR50012 Supplementary Figs S10 S11) and
lsquopositive regulation of natural killer cell mediated cytotoxicity
directed against tumour cell targetrsquo (GO0002860
FDR5000012) both of which are exclusive to Mirsynergy-
MiRMs Moreover module 11 and 23 involve THCA-related
oncomirs miR-17 and 197 respectively (Supplementary Table
S2) (Koturbash et al 2011)
33 Co-expression within MiRMs
We next examined the MiMEC involved in each predicted
MiRM from Mirsynergy comparing with the boundary nodes
(ie neighbour nodes of each MiRM) as the internal control
and MiRMs identified by SNMNMF Because miRNAs are
known to repress mRNAs the negativity of MiMEC is a rea-
sonable indicator of the MiRM quality In particular we used
OV BRCA and THCA expression data from TCGA to compute
for each module (or control) the averaged pairwise MiMEC We
then compared the cumulative density functions of the MiMEC
from each method We first compared the MiMEC between in-
ternal nodes (mmiRNAs within the modules) and boundary
nodes (neighbour mmiRNAs with non-zero connection to the
internal nodes) from each Mirsynergy-MiRMs Indeed miRNAs
involved in the MiRMs exhibit significantly more negative cor-
relation with the included mRNA targets for all three datasets
(Fig 5 left panels) [P5981e-10 335e-12 0 for OV BRCA
THCA respectively one-sided KolmogorovndashSmirnov (KS)
test] More impressively Mirsynergy-MiRMs exhibit signifi-
cantly higher MiMEC than SNMNMF-MiRMs (P5535e-12
00041 0013 for OV BRCA and THCA respectively) (Fig 5
right panels) As summarized in Table 1 the MiMEC averaged
over all of the Mirsynergy modules (ndash008 ndash008) are also twice
as more negative as those of SNMNMF (ndash004 ndash004) for BRCA
and THCA and almost four folds more negative than the pub-
lished result from PIMiM (Le and Bar-Joseph 2013) on the same
OV dataset
34 KM survival analyses of MiRMs
Based on the clinical data from TCGA we characterized the
level of associations of patient survival time from the date of
diagnosis to death with the discovered MiRMs by the averaged
miRNA expression levels After filtering out samples with un-
available survival time or not recorded in the expression data we
retained 376385 331331 and 259543 samples for OV BRCA
A
B
Fig 4 Functional enrichment comparison in ovarian cancer (A) The
number of significant modules (upper panel) and CPs (lower panel)
were plotted as a function of log10(FDR) where a significant module
was defined as a module containing at least one significant CPs We
compared the distributions from Mirsynergy (solid) and SNMNMF
(dash) by one-sided Wilcoxon signed rank test to obtain the P-values
displayed above Also we plotted the performance of PIMiM on the
same dataset based on the published results (Le and Bar-Joseph 2013)
(B) Same as A but for GO-BP terms enrichment comparison
Fig 3 Comparison of internal and boundary nodes of each MiRM in
ovarian cancer For each MiRM we calculated the number of significant
GO-BP terms (FDR5005 upper panel) and GO enrichment scores
(lower panel) using the internal nodes (solid) (ie nodes included in the
MiRMs) and boundary nodes (dash) (ie nodes connected to internal
nodes but disregarded or excluded from the MiRM to maximize synergy
score) P-values from one-sided Wilcoxon signed rank test of internal
nodes versus boundary nodes across all MiRMs are indicated in the
right margins
2632
YLi et al
by guest on August 27 2016
httpbioinformaticsoxfordjournalsorg
Dow
nloaded from
and THCA respectively (Supplementary Table S3) For each
module we divided the samples into two groups based on the
lower and higher MiRM-averaged miRNA expression levels
than the sample means We then used KM method using R
package survival to compare the survival characteristics of the
two groups with significance determined by the log-rank test
The resulting P-values were then corrected for multiple testing
using the BenjaminindashHochberg method over all of the MiRMs
(Benjamini and Hochberg 1995) As a result we found four one
and three MiRMs with FDR501 for OV BRCA and THCA
datasets respectively (Supplementary Fig S12) In contrast
when testing using individual miRNA expression profiles
alone none of the miRNAs survived the multiple testing correc-
tion highlighting the statistical power gained by our network
approach
For BRCA oncomir miR-100 is involved in the potential
prognostic module 31 For THCA we found oncomirs miR-
29a (MiRM-8) miR-215 (MiRM-40) and miR-23a191
(MiRM-45) Figure 6 illustrates the KM survival curves for mod-
ules 62 and 44 in ovarian cancer and the visualization of the two
clusters generated from Cytoscape (Shannon et al 2003)
Notably OV-MiRM-62 involves three oncogenes namely
BUB1B CDKN2A MYST4 (Forbes et al 2011) and an onco-
mir miR-125a-3p (Koturbash et al 2011) Moreover the two
modules share a common miRNA miR-768-3p Intriguingly
Jiang et al (2013) showed that downregulation miR-768-3p is
associated with MEKERK-mediated enhancement of protein
synthesis in melanoma cells Here we provided to our knowledge
the first evidence of the potential prognostic value of miR-768-3p
in the ovarian cancer network
4 DISCUSSION
Recent works on miRNA dysregulation prove useful in cancer
research (Koturbash et al 2011) To identify condition-specific
networks however most existing methods exploited only the
curated pathways or GO terms Methods for de novo network
reconstruction in some recent literatures operate only on
interactions involving differentially expressed genes (DEG) or
differentially expressed miRNA (Peng et al 2009) because the
corresponding solutions quickly become intractable with increas-
ing number of mmiRNAs However the DEGM-driven
approaches cannot capture subnetworks with accumulative
changes of mmiRNA that have been filtered out either by indi-
vidual hypothesis testings or by multiple testing correctionsIn this article we introduce Mirsynergy as a reasonable alter-
native approach Notably standard clustering methods such as
k-means or hierarchical clustering are not suitable for construct-
ing MiRMs as these methods assign each data point to a unique
B
A
Fig 6 KM survival analysis using MiRMs in ovarian cancer A Patients
with miRNA expression higher and lower than the sample average within
each MiRM were divided into lsquoHighrsquo (red dash) and lsquoLowrsquo (blue dot)
groups respectively Survival fractions as a function of time (days) be-
tween initial diagnosis and death were then plotted for the two groups
and the significant separation of the two curves were assessed by log-rank
test Module 62 and 44 with significant FDRs were displayed B The
corresponding network for Module 62 (red) and 44 (blue) miRNAs are
red diamonds and mRNAs are blue ellipses Solid red and dash blue
edges indicate the miRNAndashmRNA and genendashgene interactions
respectively
Fig 5 Cumulative density function of expression correlation between
miRNA and mRNA Averaged Pearson correlation coefficients for
each MiRM were plotted as a CDF for internal nodesMirsynergy
(solid) and boundary nodesSNMNMF outputs (dash) We observe a
significantly more negative MiMEC distribution for the internal nodes
or Mirsynergy-MiRMs as their curves are clearly located on the left of
the curves from the counterparts P-values were computed by one-sided
KS test
2633
Mirsynergy
by guest on August 27 2016
httpbioinformaticsoxfordjournalsorg
Dow
nloaded from
cluster A recently developed greedy-based clustering method
ClusterONE is more realistic because it allows overlap between
clusters (Nepusz et al 2012) However ClusterONE was de-
veloped with physical PPI in mind Mirsynergy extends from
ClusterONE to detecting MiRMs The novelty of our approach
resides in a two-stage clustering strategy with each stage max-
imizing a synergy score as a function of either the miRNA-
miRNA synergistic co-regulation or miRNAndashmRNAgenendash
gene interactions Several methods have incorporated GGI as
PPITFBS in predicting MiRMs (Le and Bar-Joseph 2013
Zhang et al 2011) which proved to be a more accurate ap-
proach than using miRNA-mRNA alone Comparing with
recent methods such as SNMNMF (Zhang et al 2011) and
PIMiM (Le and Bar-Joseph 2013) however an advantage of
our deterministic formalism is the automatic determination of
module number (given the predefined thresholds to merge and
filter low quality clusters) and efficient computation with theor-
etical bound reduced from O(K(T+N+M)2) per iteration to
onlyO(M(N+M)) for N (M) mRNAs (miRNAs) across T sam-
ples Because N is usually much larger than M and T our algo-
rithm runs orders of faster Based on our tests on a linux server
Mirsynergy took about 2h including the run time for LASSO to
compute OV (N=12456M=559 T=385) BRCA or THCA
(N=13306 M=710 T=331 or 543 respectively) whereas
SNMNMF took more than a day for each dataset More im-
portantly Mirsynergy-MiRMs are significantly more function-
ally enriched coherently expressed and thus more likely to be
biologically functionalThe success of our model is likely attributable to its ability to
explicitly leverage two types of information at each clustering
stage (i) the miRNAndashmiRNA synergism based on the correl-
ation of the inferred miRNA target score profiles from
MMIW matrix (ii) the combinatorial miRNA regulatory effects
on existing genetic network implicated in the combined MMIW
and GGIWmatrices We also explored other model formulations
such as clustering mmiRNAs in a single clustering stage or using
different MMIW matrices other than the one produced from
LASSO which tends to produce MiRMs each containing only
one or a few miRNAs or several large low-quality MiRMs
which were then filtered out by the density threshold in either
clustering stage Notably an MiRM containing only a single
miRNA can be directly derived from the MMIW without any
clustering approach Moreover Mirsynergy considers only
neighbour nodes with non-zero edges Thus our model works
the best on a sparse MMIW matrix such as the outputs from
LASSO which is the best performing expression-based methods
based on our comparison with other alternatives Nonetheless
the performance of Mirsynergy is sensitive to the quality of
MMIW and GGIW In this regard other MMIW or GGIW
matrices (generated from improved methods) can be easily incor-
porated into Mirsynergy as the function parameters by the users
of the Bioconductor package (please refer to the package vignette
for more details) In conclusion with large amount of mmiRNA
expression data becoming available we believe that Mirsynergy
will serve as a powerful tool for analysing condition-specific
miRNA regulatory networks
Funding YL is funded by Natural Sciences and Engineering
Research Council (NSERC) Canada Graduate Scholarship
and ZZ is supported by Ontario Research Fund - GlobalLeader (Round 2) and an NSERC grant JL is supported by
the National Natural Science Foundation of China (Grant NO
61240046) and Hunan Provincial Natural Science Foundation of
China (Grant NO13JJ2017)
Conflicts of Interest none declared
REFERENCES
BartelDP (2009) MicroRNAs target recognition and regulatory functions Cell
136 215ndash233
BarthelemyJP and BruckerF (2001) Np-hard approximation problems in over-
lapping clustering J Classif 18 159ndash183
BenjaminiY and HochbergY (1995) Controlling the false discovery rate a prac-
tical and powerful approach to multiple testing J R Stat Soc Ser B 57
289ndash300
BorossG et al (2009) Human microRNAs co-silence in well-separated groups and
have different predicted essentialities Bioinformatics (Oxford England) 25
1063ndash1069
Cancer Genome Atlas Research Network (2008) Comprehensive genomic charac-
terization defines human glioblastoma genes and core pathways Nature 455
1061ndash1068
DavisFM et al (2013) Induction of epithelial-mesenchymal transition (EMT) in
breast cancer cells is calcium signal dependent Oncogene 33 2307ndash2316
ForbesSA et al (2011) COSMIC mining complete cancer genomes in the
Catalogue of Somatic Mutations in Cancer Nucleic Acids Res 39 D945ndashD950
FriedmanJ et al (2010) Regularization paths for generalized linear models via
coordinate descent J Stat Softw 33 1ndash22
FriedmanRC et al (2009) Most mammalian mRNAs are conserved targets of
microRNAs Genome Res 19 92ndash105
GriffithsT and GhahramaniZ (2005) Infinite latent feature models and the Indian
buffet process In Advances in Neural Information Processing Systems (NIPS)
MIT Press Cambridge Massachusetts United States pp 475ndash482
HelwakA et al (2013) Mapping the human miRNA interactome by CLASH re-
veals frequent noncanonical binding Cell 153 654ndash665
HsuSD et al (2011) miRTarBase a database curates experimentally validated
microRNA-target interactions Nucleic Acids Res 39 D163ndashD619
HuangJC et al (2007) Using expression profiling data to identify human
microRNA targets Nat Methods 4 1045ndash1049
JiangCC et al (2013) Repression of microRNA-768-3p by MEKERK signalling
contributes to enhanced mRNA translation in human melanoma Oncogene 33
2577ndash2588
JoungJG et al (2007) Discovery of microRNA-mRNA modules via population-
based probabilistic learning Bioinformatics (Oxford England) 23 1141ndash1147
KoturbashI et al (2011) Small molecules with big effects the role of the
microRNAome in cancer and carcinogenesis Mutat Res 722 94ndash105
KozomaraA and Griffiths-JonesS (2014) miRBase annotating high confidence
microRNAs using deep sequencing data Nucleic Acids Res 42 D68ndashD73
KrekA et al (2005) Combinatorial microRNA target predictions Nat Genet 37
495ndash500
LeHS and Bar-JosephZ (2011) Inferring interaction networks using the ibp
applied to microrna target prediction In Advances in Neural Information
Processing Systems to appear
LeHS and Bar-JosephZ (2013) Integrating sequence expression and interaction
data to determine condition-specific miRNA regulation Bioinformatics
(Oxford England) 29 i89ndashi97
LuY et al (2011) A Lasso regression model for the construction of microRNA-
target regulatory networks Bioinformatics (Oxford England) 27 2406ndash2413
NepuszT et al (2012) Detecting overlapping protein complexes in protein-protein
interaction networks Nat Methods 9 471ndash472
PapadopoulosGL et al (2009) DIANA-mirPath Integrating human and mouse
microRNAs in pathways Bioinformatics (Oxford England) 25 1991ndash1993
PengX et al (2009) Computational identification of hepatitis C virus
associated microRNA-mRNA regulatory modules in human livers BMC
Genomics 10 373
ShalgiR et al (2007) Global and local architecture of the mammalian microRNA-
transcription factor regulatory network PLoS Comput Biol 3 e131
ShannonP et al (2003) Cytoscape a software environment for integrated models
of biomolecular interaction networks Genome Res 13 2498ndash2504
2634
YLi et al
by guest on August 27 2016
httpbioinformaticsoxfordjournalsorg
Dow
nloaded from
SpizzoR et al (2009) SnapShot MicroRNAs in cancer Cell 137 586ndash586e1
StarkC et al (2011) The BioGRID Interaction Database 2011 update Nucleic
Acids Res 39 D698ndashD704
SubramanianA et al (2005) Gene set enrichment analysis a knowledge-based ap-
proach for interpreting genome-wide expression profiles Proc Natl Acad Sci
USA 102 15545ndash15550
TsangJS et al (2010) Genome-wide dissection of MicroRNA functionsand cotar-
geting networks using gene set signatures Mol Cell 38 140ndash153
WingenderE et al (2000) TRANSFAC an integrated system for gene expression
regulation Nucleic Acids Res 28 316ndash319
XuJ et al (2011) MiRNA-miRNA synergistic network construction via co-regu-
lating functional modules and disease miRNA topological features Nucleic
Acids Res 39 825ndash836
ZhangS et al (2011) A novel computational framework for simultaneous integra-
tion of multiple types of genomic data to identify microRNA-gene regulatory
modules Bioinformatics (Oxford England) 27 i401ndashi409
2635
Mirsynergy
by guest on August 27 2016
httpbioinformaticsoxfordjournalsorg
Dow
nloaded from
based on a non-parametric Bayesian prior called Indian Buffet
Process Although GroupMiR is statistically sound it has time
complexity cubic to the number of observations and converges
slow on large datasets (Griffiths and Ghahramani 2005)
More recently Zhang et al (2011) described a framework of
sparse network-regularized multiple non-negative matrix factor-
ization (SNMNMF) to identify miRNAndashmRNA modules based
on the factorized coefficient matrices Importantly SNMNMF
uses not only the expression and target-site information but also
the genendashgene interaction (GGI) derived from proteinndashprotein
interaction (PPI) and transcription factor binding sites (TFBS)
To define the reduced dimensionality of the factorized matrices
however the SNMNMF approach requires a predefined number
of modules which may be data-dependent and difficult to deter-
mine beforehand Additionally the solution to NMF is often not
unique and the identified modules do not necessarily include
both miRNAs and mRNAs which makes reproducing and in-
terpreting the results difficult Similarly the regression-based
model called PIMiM (Protein Interaction-based MicroRNA
Modules) developed by Le and Bar-Joseph (2013) also requires
a fixed number of unique memberships and the non-convexity
of the algorithm leads to different outcomes with random
initializations Additionally both algorithms incur a time com-
plexity quadratic to both the number of miRNA and mRNA
multiplied by the (squared) total number of modules per iter-
ation We herein hypothesize that an intuitively simple and effi-
cient deterministic framework may serve as an attractive
alternative
In this article we propose a novel model called Mirsynergy
that integrates mmiRNA expression profiles target site infor-
mation and GGI to form MiRMs where an mmiRNA may
participate in multiple MiRMs and the module number is sys-
tematically determined given the predefined model parameters
The clustering algorithm of Mirsynergy adapts from
ClusterONE (Nepusz et al 2012) which was intended to identify
protein complex from PPI data The ultimate goal here however
is to construct a priori the MiRMs and exploit them to better
explain clinical outcomes such as patient survival rate We apply
Mirsynergy to ovarian (OV) breast (BRCA) and thyroid cancer
(THCA) datasets from TCGA (Cancer Genome Atlas Research
Network 2008) Comparing with alternative formalisms we find
that the Mirsynergy-based modules are more functionally en-
riched and exhibit more negative MiMEC Through Kaplanndash
Meier (KM) survival analysis we propose several prognostically
promising cancer-specific MiRMs as biomarkers
2 METHODS
21 Mirsynergy model overview
We formulate the construction of synergistic MiRMs as an overlapping
clustering problem with two main stages Figure 1 depicts our model
schema Before the two clustering stages we first inferred miRNAndash
mRNA interaction weights (MMIW) (W) using mmiRNA expression
data and target site information (Section 22) At stage 1 we only cluster
miRNAs to greedily maximize miRNAndashmiRNA synergy which is pro-
portional to the correlation between miRNAs in terms of their MMIW
(See Section 22) At stage 2 we fix the MiRM assignments and greedily
add (remove) genes to (from) each MiRM to maximize the synergy score
which is defined as a function of the MMIW matrix and the genendashgene
interaction weight (GGIW) matrix (H) The underlying clustering algo-
rithm at both stages (Section 23) adapts from ClusterONE which was
originally developed for PPI network (Nepusz et al 2012)
22 Evaluation of expression-based prediction models
To compute MMIW as the edge-weight matrix for downstream cluster-
ing we first evaluated four prominent expression-based miRNA target
prediction algorithms namely Pearson correlation coefficient (PCC)
(Zhang et al 2011) GenMiR++ (Huang et al 2007) and two formu-
lations of LASSO (Lu et al 2011) Specifically PCC between each pair
of mmiRNA across T samples was computed using R built-in function
cor Targets with negative correlation were ranked at the top
GenMiR++ was ran in Matlab with default setting using as input the
binary target site matrix and the expression profiles We implemented two
versions of LASSO both using glmnet with =1 except that the best
was chosen using cross-validation function cvglmnet (Friedman et al
2010) For the first LASSO we used expression of miRNAs
k 2 f1 Mg that have non-zero target sites to model the corresponding
Fig 1 Mirsynergy workflow Given the inputs of mmiRNA expression
profiles and sequence-based target site information we first derive an
expression-based MMIW matrix W using L1-norm regularized linear re-
gression model (ie LASSO) We then compute miRNAndashmiRNA syner-
gistic scores S based on the MMIW matrix which is subsequently
provided as input to form miRNA clusters V0 at Stage 1 by an over-
lapping neighbourhood expansion clustering algorithm Next we fix the
MiRM assignments V0 and greedily add (remove) mRNA to (from) each
module that maximizes the synergy score where the edge weights are
defined by the MMIW matrix and GGIW matrix involving known
TFBS and PPI The end results are overlapping clustering assignments
of mmiRNAs (ie MiRMs)
2628
YLi et al
by guest on August 27 2016
httpbioinformaticsoxfordjournalsorg
Dow
nloaded from
mRNA expression i 2 f1 Ng across samples t 2 f1 Tg
xitwi0+P
k wikethzktcikTHORN where wi0 is the bias cik is the number of
target sites in mRNA i for miRNA k wik 2WNM is the fitted linear
coefficients used for the MMIW For the second LASSO namely
LASSO_RISC (RNA-induced silencing complex) we used target site
counts miRNA and Ago 1ndash4 mRNA expression as the input variable
xitwi0+P
k wikAgo2zktcik+P
k w0ikAgo134zkt The rationale behind
LASSO_RISC is that Ago2 is the only protein component known to
catalyse target mRNA degradation whereas the non-catalytic Ago 134
proteins may compete with Ago2 to bind to miRNAs thus the expres-
sion changes in the Ago 1 3 4 proteins will affect the ability of Ago2 to
bind to miRNAs (Lu et al 2011) For LASSO and LASSO_RISC inter-
actions associated with negative linear coefficients wik (ie MMIW) were
ranked at the top as the candidate interactions
Because of the scarcity of the validated miRNA targets conventional
power analysis such as ROC (receiver operating characteristic) cannot
distinguish the method performances Instead we assessed each method
by the number of validated interactions they identified among their top
ranked 1000ndash5000 targets (1000-interval) based on miRTarBase (Hsu
et al 2011) Among the four methods LASSO achieved the best overall
performance on our test data (Supplementary Fig S1) Accordingly we
adopted the linear coefficient matrix wik 2W from LASSO as the NM
MMIW matrix and set all of its positive coefficients to zero assuming
only negative miRNA regulation
23 Two-stage clustering
Let W denote the expression-based NM MMIW matrix obtained
from LASSO determined as the best performing target predic-
tion model in Section 22 where wik is the scoring weight for
miRNA k targeting mRNA i Similar to the lsquoMeetMinrsquo score defined
by Shalgi et al (2007) for binary interactions of co-occurring targets
of miRNA pairs we define an MM scoring matrix denoted as S
indicating miRNAndashmiRNA synergistic scores between miRNA j and k
(j 6frac14 k)
sjk=
XNi=1
wijwik
minXi
wijXi
wik
eth1THORN
Notably if W were a binary matrix Equation 1 became the ratio of
number of targets shared between miRNA j and k over the minimum
number of targets possessed by j or k which is essentially the original
lsquoMeetMinrsquo score
Similar to the cohesiveness defined by Nepusz et al (2012) we define
synergy score s(Vc) for any given MiRM Vc as follows Let winethVcTHORN denote
the total weights of the internal edges within the miRNA cluster
wboundethVcTHORN the total weights of the boundary edges connecting the
miRNAs within Vc to the miRNAs outside Vc and (Vc) the penalty
scores for forming cluster Vc The synergy of Vc (ie the objective func-
tion) is as follows
sethVcTHORN=winethVcTHORN
winethVcTHORN+wboundethVcTHORN+ethVcTHORNeth2THORN
where (Vc) reflects our limited knowledge on potential unknown targets
of the added miRNAs as well as the false-positive targets within the
cluster Presumably these unknown factors will affect our decision on
whether miRNA k belong to cluster Vc For instance miRNAs may
target non-coding RNAs and seedless targets which are the mRNAs
with no perfect seed-match (Helwak et al 2013) We currently consider
only mRNA targets with seed-match to minimize the number of false-
positive results By default we set ethVcTHORN=2jVcj where jVcj is the cardin-
ality of Vc Additionally we define two scoring functions to assess the
overlap ethVcVc0 THORN between Vc and Vc0 for c 6frac14 c0 and the density d1(Vc) of
any given Vc
ethVcVc0 THORN=jVc Vc0 j
2
jVcjjVc0 jeth3THORN
d1ethVcTHORN=2winethVcTHORN
methm 1THORNeth4THORN
where jVc Vc0 j is the total number of common elements in Vc and Vc0
and m is the number of miRNAs in Vc
The general solution for solving an overlapping clustering problem is
Non-deterministic Polynomial-time hard (NP-hard) (Barthelemy and
Brucker 2001) Thus we adapt a greedy-based approach (Nepusz
et al 2012) The algorithm can be divided into two major steps In
step 1 we select as an initial seedmiRNA k with the highest total weights
We then grow anMiRM Vt from seed k by iteratively including boundary
or excluding internal miRNAs to maximize the synergy s(Vt) (Equation 2)
until no more node can be added or removed to improve s(Vt) We then
pick another miRNA that has neither been considered as seed nor
included in any previously expanded Vt to form Vt+1 The entire process
terminates when all of the miRNAs are considered In step 2 we treat the
clusters as a graph with Vc as nodes and ethVcVc0 THORN as edges Here is
a free parameter Empirically we observed that most MiRMs are quite
distinct from one another in terms of ethVcVc0 THORN (before the merging)
(Supplementary Fig S2A) Accordingly we set to 08 to ensure merging
only similar MiRMs which avoids producing large MiRMs (when is
too small) We then perform a breath-first search to find all of the weakly
connected components (CC) each containing clusters that can reach dir-
ectlyindirectly to one another within the CC We merge all of the clusters
in the same CC and update the synergy score accordingly Algorithm 1
outlines the pseudocode
After forming MiRMs at stage 1 we perform a similar clustering pro-
cedure as in Algorithm 1 by adding (removing) only the mRNAs to (from)
each MiRM Different from stage 1 however we grow each existing
MiRM separately with no prioritized seed selection or cluster merging
which allows us to implement a parallel computation by taking advantage
of the multicore processors in the modern computers In growingcon-
tracting each MiRM we maximize the same synergy function (Equation
2) but changing the edge weight matrix from S to a (N+M) (N+M)
matrix by combining W (the NM MMIW matrix) and H (the NN
GGIW matrix) Notably here we assume miRNAndashmiRNA edges to be
zero Additionally we do not addremove miRNAs tofrom the MiRM
at each greedy step Finally we define a new density function because of
the connectivity change at stage 2
d2ethVcTHORN=winethVcTHORN
nethm+n 1THORNeth5THORN
where n (m) are the number of mRNAs (miRNAs) in Vc By default we
filter out MiRMs with d1ethViTHORN51e2 and d2ethVjTHORN55e3 at stage 1 and 2
respectively Both density thresholds were chosen based on our empirical
analyses (Supplementary Fig S2) For some datasets in particular we
found that our greedy approach tends to produce a large cluster involving
several hundred miRNAs or several thousand mRNAs at Stage 1 or 2
respectively which are unlikely to be biologically meaningful Despite the
ever increasing synergy (by definition) however the anomaly modules all
have low density scores which allows us to filter them out using the
above chosen thresholds
The time complexity of the algorithm is O(M(N+M)) stage 1 takes
O(M2) in the worst case scenario by checking every miRNA in forming
an MiRM using every miRNA as a seed given that the maximum
number of MiRMs is M stage 2 takes O(NM) In our actual implemen-
tation the total weights of each node is pre-computed so that the synergy
update is O(1) Moreover we maintain a sorted list using numbers to
represent mmiRNA nodes for efficient binary search of neighbour or
removable nodes
2629
Mirsynergy
by guest on August 27 2016
httpbioinformaticsoxfordjournalsorg
Dow
nloaded from
Algorithm 1 Mirsynergy stage 1 clustering procedure
1 l Step1 Grow MiRMs by overlapping neighbourhood expansion
2 V 1 K f1 Mg for M miRNAs
3 while K 6frac141 do
4 k arg maxk02K
Pj sk0j l k miRNA with max total synergistic scores
5 Vt fkg Vt 16 while Vt 6frac14 Vt do l Stop if cur cluster is same as prev cluster
7 Vt Vtl Choose the best neighbour miRNA to add
8 j0 arg maxj0=2Vt
frac12sethVt [ j0THORN where wj0 k 6frac14 0 for k 2 Vt
l Choose the best miRNA in the cluster to remove
9 j arg maxj2Vt
frac12sethVt n jTHORN
l Grow contract or do nothing whichever produces the highest synergy
10 if sethVt [ j0 THORN4max frac12sethVt n jTHORN sethVtTHORN then
11 Vt Vt [ fjg
12 else if sethVt n jTHORN4max frac12sethVt [ j0THORN sethVtTHORN then
13 Vt Vt n j
14 end if
15 end while
16 V V [ fVtg
17 K K n fk 2 Vtg
18 end while
19 l Step2 Merging MiRMs by breath-first search
20 for all Vc 2 V do
21 C fVcgV V n fVcg
l Compare each cluster Vc with every other cluster Vc0 (c 6frac14 c0)
22 for all Vc0 V do
23 if ethVcVc0 THORN then
24 C C [ fVc0 gV V n fVc0 g
25 end if
26 end for
27 Vt 1l Merge all of the clusters that are in C
28 for all Vk C do
29 Vt Vt [ Vk
30 end for
31 V V [ fVt g
32 end for
33 V V
34 return V
24 Method comparisons
To compare the performance of Mirsynergy we applied SNMNMF
(Zhang et al 2011) to the same testing data SNMNMF is one of the
most cited works in the recent literature and has been shown to outper-
form the MBE approach introduced earlier by Peng et al (2009)
SNMNMF was implemented in Matlab with source code available As
suggested by the authors we set the required module number to 50 and
used the default settings throughout the tests Additionally we also com-
pared our results (using the same test dataset) with the published results
from another recent algorithm called PIMiM developed by Le and Bar-
Joseph (2013) which was shown to outperform SNMNMF but the soft-
ware is not publicly available
25 Functional enrichment comparison
We examined whether the target genes in each MiRM are involved in
biologically meaningful Gene Ontology (GO) or pathways via functional
enrichment analysis Specifically GO terms in biological processes (BPs)
(GO-BPs) were downloaded using getBM function from R package
biomaRt where GO terms with fewer than five genes or with evidence
codes equal to Electronic Annotation Non-traceable Author Statement
or No biological Data available were discarded giving 2007 GO-BP
terms and 10315 unique genes The canonical pathways were down-
loaded from MSigDB (c2cpv40symbolsgmt) (Subramanian et al
2005) The list of Ensembl gene IDs for each MiRM was then subjected
to hypergeometric enrichment test for each GO-BP term or pathways
using R built-in function phyper The P-values were corrected for mul-
tiple testing by R function padjust to produce false discovery rates
(FDR)
26 Data collection and pre-processing
For the first test dataset we obtained the same ovarian cancer dataset
processed by the SNMNMF authors (Zhang et al 2011) The expression
data from this dataset were originally downloaded from TCGA along
with the target site information from MicroCosm (v5) and GGI from
TRANSFAC (Wingender et al 2000) The expression dataset contains
385 samples each measuring 559 miRNAs and 12456 mRNAs For the
second and third test datasets we downloaded the expression data for
BRCA and THCA from TCGA data portal The BRCA and THCA data
contain 331 and 543 samples respectively each measuring 710 miRNAs
and 13 306 mRNAs For both datasets processed (level 3) RNA-seq(V2)
and miRNA-seq data were used which record the RPKM (read per
kilobase of exon per million mapped reads) values for mRNAs and
RPM (reads per million miRNAs mapped) for miRNAs The data
were further log2-transformed and mean-centred Clinical information
for OV BRCA and THCA were also collected from TCGA
For the BRCA and THCA we used target site information from
TargetScanHuman 62 database (Friedman et al 2009) For each
mRNAndashmiRNA pair that have measured expression in TCGA data
we extracted the corresponding conserved target sites For multiple tran-
scripts of the same gene we used transcripts with the longest 30UTR
GGI data matrix H including TFBS and PPI data were processed from
TRANSFAC (Wingender et al 2000) and BioGrid (Stark et al 2011)
databases respectively Cancer-related miRNAs as oncomirs or tumour
suppressors (ie miRNAs highly or lowly expressed in cancers) were
downloaded from Spizzo et al (2009) and Koturbash et al (2011)
Tables 1 and 2 where 97 oncomirs have measured expression in the
TCGA data
3 RESULTS
31 Comparison of module sizes and connectivities
Mirsynergy identified 84 53 50 MiRMs in OV BRCA and
THCA datasets respectively (Table 1 Supplementary Table
S1) Intriguingly the overall synergy landscapes are distinct for
each cancer type at both clustering stages (Supplementary Fig
S3) Comparing with the MiRMs from SNMNMF however the
modules identified by Mirsynergy are clearly more densely con-
nected within and between MiRMs (Fig 2 Supplementary Figs
S4 S5) which are comparable with the module density asso-
ciated with PIMiM-MiRMs (on the same OV dataset) (Le and
Bar-Joseph 2013) and perhaps more consistent with the intricacy
of the underlying biological network Moreover Mirsynergy
identified more modules (84 53 50) than SNMNMF did (49
39 39) for OV BRCA and THCA respectively (Table 1)
Notably although we set K=50 for SNMNMF some modules
were empty and thus discarded by the algorithm For OV
BRCA and THCA datasets the respective averaged number of
miRNAs (genes) per module are 476 577 760 (757 2415
3226) for Mirsynergy and 412 262 223 (8137 7156 7482)
for SNMNMF (Table 1) For the BRCA and THCA datasets 8
39 modules from SNMNMF have only one miRNA (ie lsquostar-
shapersquo basic network structure) and 2039 modules have less than
three miRNAs In contrast all of the modules from Mirsynergy
have more than one miRNA and most modules have at least
2630
YLi et al
by guest on August 27 2016
httpbioinformaticsoxfordjournalsorg
Dow
nloaded from
three miRNAs (Supplementary Table S1) Moreover the max-
imum number of miRNAs in a single Mirsynergy-MiRM are 12
20 and 19 for OV BRCA and THCA respectively In contrast
PIMiM obtained at maximum eight miRNAs per module for
the OV dataset and the highest miRNA counts for the
SNMNMF modules are 9 5 and 7 for OV BRCA and
THCA respectively Notably there are considerably fewer
genes in the Mirsynergy-MiRMs than in modules identified
by SNMNMF and PIMiM This perhaps implies that each
MiRM identified by Mirsynergy is responsible for a more spe-
cific biological process or pathway which is supported by the
functional enrichment analysis described below Thus
Mirsynergy predictions are in better agreement with the notion
of miRNA synergistic regulation where a relatively large
number of miRNAs can engage in regulating a specialized
cohort of interconnected genes
32 Evaluating MiRMs by functional enrichments
As an internal control we first compared whether the nodes
included in each MiRM (ie internal nodes) tend to be more
functionally enriched than the boundary nodes which have
non-zero connections to the internal nodes but were either dis-
regarded or removed from the modules during the neighbour-
hood expansion As illustrated in Figure 3 (Supplementary
Fig S6) the number of significant GO-BP terms at
FDR5005 (upper panel) and the total enrichment scores
across all terms (lower panel) are significantly higher (P51e-3
one-sided Wilcoxon signed rank test) for the internal nodes
comparing with boundary nodes Interestingly we also observed
modestly positive Pearson correlations (OV=014
BRCA=028 THCA=039) between the synergy and enrich-
ment scores (Supplementary Fig S7) further supporting the bio-
logical function of the identified modulesTo compare functional enrichments of the predicted modules
from Mirsynergy and SNMNMF we counted as a function of
enrichment score the number of significant modules having at
least one significant canonical pathways (CPs) or GO-BPs and
the total number of significant CPs or GO-BPs across all mod-
ules As depicted in Figure 4 (Supplementary Fig S8) comparing
with SNMNMF Mirsynergy produced significantly higher
number of functionally meaningful MiRMs (upper panel)
(P5000781 000707 respectively one-sided Wilcoxon signed
rank test) which together contribute significantly higher
number of distinct CPs or GO-BPs (P5000781 000195 re-
spectively) Moreover Mirsynergy also compares favourably
with PIMiM which used the same ovarian dataset target site
information and GGI data based on the published results from
Le and Bar-Joseph (2013) (Fig 4A) Notably the averaged en-
richment scores over all of the Mirsynergy-MiRMs are also
higher than the scores from SNMNMF in all three test datasets
(Table 1)Examining enriched GO terms exclusive to Mirsynergy-
MiRMs (Supplementary Table S2) revealed several interesting
cancer-related processes eg lsquoDNA damage response signal
transduction by p53 class mediatorrsquo (GO0030330
FDR50016 OV-MiRM-4) which involves oncogene BCL3
(Forbes et al 2011) and OV-related oncomir miR-20a
(Koturbash et al 2011) lsquoovarian follicle developmentrsquo
Table 1 Performance summary of Mirsynergy SNMNMF and PIMiM
Cancer Method M miR mR GOES MiMEC Time
OV Mirsynergy 84 476 757 1564 ndash005 1
SNMNMF 49 412 8137 751 007 24+
PIMiMy 40 47 6780 NA ndash0013 NA
BRCA Mirsynergy 53 577 2415 874 ndash008 15
SNMNMF 39 262 7156 556 ndash004 24+
THCA Mirsynergy 50 760 3226 804 ndash008 2
SNMNMF 39 223 7482 673 ndash004 24+
Note M module number miR and mR average miRNA and mRNA per module GOES GO enrichment score (MG
XGg
logFDR) MiMEC miRNAndashmRNA expression
correlation Time number of hours took to run Notably LASSO alone took about an hour which is included in the above run time of Mirsynergy yThe results for PIMiM
were directly taken from the original paper (Le and Bar-Joseph 2013) where GOES and Time are not available (NA) The comparison here is fair because all of three methods
were applied to the same OV dataset used in Zhang et al (2011)
Fig 2 Network overview using ovarian dataset The networks from
SNMNMF (left) and Mirsynergy (right) were rendered by Cytoscape 3
(Shannon et al 2003) Edges represent either miRNAndashmRNA (solid red
line) or genendashgene interactions (dash blue line)
2631
Mirsynergy
by guest on August 27 2016
httpbioinformaticsoxfordjournalsorg
Dow
nloaded from
(GO0001541 FDR50022 OV-MiRM-58) involving an OV-
related oncomir miR-221 and lsquonegative regulation of epithelial
to mesenchymal transitionrsquo (GO0010719 FDR50037 BRCA-
MiRM-1 also see Supplementary Fig S9) which is known to be
associated with breast cancer (Davis et al 2013) It is also inter-
esting to note that the miR-30 family members hsa-miR-30a
(chr6 72113254-324) and miR-30e (chr1 41220027-118)
(Kozomara and Griffiths-Jones 2014) were both identified by
Mirsynergy to be involved in BRCA-MiRM-1 Moreover
miR-30 has been predicted to regulate a number of breast
cancer-associated genes in patients who are non-carriers of
BRCA12 mutations lending the possibility that familial breast
cancer may be caused by variation in these miRNAs (Kozomara
and Griffiths-Jones 2014) Additionally module 11 and 23 from
THCA data are respectively enriched for lsquothymus developmentrsquo
(GO0048538 FDR50012 Supplementary Figs S10 S11) and
lsquopositive regulation of natural killer cell mediated cytotoxicity
directed against tumour cell targetrsquo (GO0002860
FDR5000012) both of which are exclusive to Mirsynergy-
MiRMs Moreover module 11 and 23 involve THCA-related
oncomirs miR-17 and 197 respectively (Supplementary Table
S2) (Koturbash et al 2011)
33 Co-expression within MiRMs
We next examined the MiMEC involved in each predicted
MiRM from Mirsynergy comparing with the boundary nodes
(ie neighbour nodes of each MiRM) as the internal control
and MiRMs identified by SNMNMF Because miRNAs are
known to repress mRNAs the negativity of MiMEC is a rea-
sonable indicator of the MiRM quality In particular we used
OV BRCA and THCA expression data from TCGA to compute
for each module (or control) the averaged pairwise MiMEC We
then compared the cumulative density functions of the MiMEC
from each method We first compared the MiMEC between in-
ternal nodes (mmiRNAs within the modules) and boundary
nodes (neighbour mmiRNAs with non-zero connection to the
internal nodes) from each Mirsynergy-MiRMs Indeed miRNAs
involved in the MiRMs exhibit significantly more negative cor-
relation with the included mRNA targets for all three datasets
(Fig 5 left panels) [P5981e-10 335e-12 0 for OV BRCA
THCA respectively one-sided KolmogorovndashSmirnov (KS)
test] More impressively Mirsynergy-MiRMs exhibit signifi-
cantly higher MiMEC than SNMNMF-MiRMs (P5535e-12
00041 0013 for OV BRCA and THCA respectively) (Fig 5
right panels) As summarized in Table 1 the MiMEC averaged
over all of the Mirsynergy modules (ndash008 ndash008) are also twice
as more negative as those of SNMNMF (ndash004 ndash004) for BRCA
and THCA and almost four folds more negative than the pub-
lished result from PIMiM (Le and Bar-Joseph 2013) on the same
OV dataset
34 KM survival analyses of MiRMs
Based on the clinical data from TCGA we characterized the
level of associations of patient survival time from the date of
diagnosis to death with the discovered MiRMs by the averaged
miRNA expression levels After filtering out samples with un-
available survival time or not recorded in the expression data we
retained 376385 331331 and 259543 samples for OV BRCA
A
B
Fig 4 Functional enrichment comparison in ovarian cancer (A) The
number of significant modules (upper panel) and CPs (lower panel)
were plotted as a function of log10(FDR) where a significant module
was defined as a module containing at least one significant CPs We
compared the distributions from Mirsynergy (solid) and SNMNMF
(dash) by one-sided Wilcoxon signed rank test to obtain the P-values
displayed above Also we plotted the performance of PIMiM on the
same dataset based on the published results (Le and Bar-Joseph 2013)
(B) Same as A but for GO-BP terms enrichment comparison
Fig 3 Comparison of internal and boundary nodes of each MiRM in
ovarian cancer For each MiRM we calculated the number of significant
GO-BP terms (FDR5005 upper panel) and GO enrichment scores
(lower panel) using the internal nodes (solid) (ie nodes included in the
MiRMs) and boundary nodes (dash) (ie nodes connected to internal
nodes but disregarded or excluded from the MiRM to maximize synergy
score) P-values from one-sided Wilcoxon signed rank test of internal
nodes versus boundary nodes across all MiRMs are indicated in the
right margins
2632
YLi et al
by guest on August 27 2016
httpbioinformaticsoxfordjournalsorg
Dow
nloaded from
and THCA respectively (Supplementary Table S3) For each
module we divided the samples into two groups based on the
lower and higher MiRM-averaged miRNA expression levels
than the sample means We then used KM method using R
package survival to compare the survival characteristics of the
two groups with significance determined by the log-rank test
The resulting P-values were then corrected for multiple testing
using the BenjaminindashHochberg method over all of the MiRMs
(Benjamini and Hochberg 1995) As a result we found four one
and three MiRMs with FDR501 for OV BRCA and THCA
datasets respectively (Supplementary Fig S12) In contrast
when testing using individual miRNA expression profiles
alone none of the miRNAs survived the multiple testing correc-
tion highlighting the statistical power gained by our network
approach
For BRCA oncomir miR-100 is involved in the potential
prognostic module 31 For THCA we found oncomirs miR-
29a (MiRM-8) miR-215 (MiRM-40) and miR-23a191
(MiRM-45) Figure 6 illustrates the KM survival curves for mod-
ules 62 and 44 in ovarian cancer and the visualization of the two
clusters generated from Cytoscape (Shannon et al 2003)
Notably OV-MiRM-62 involves three oncogenes namely
BUB1B CDKN2A MYST4 (Forbes et al 2011) and an onco-
mir miR-125a-3p (Koturbash et al 2011) Moreover the two
modules share a common miRNA miR-768-3p Intriguingly
Jiang et al (2013) showed that downregulation miR-768-3p is
associated with MEKERK-mediated enhancement of protein
synthesis in melanoma cells Here we provided to our knowledge
the first evidence of the potential prognostic value of miR-768-3p
in the ovarian cancer network
4 DISCUSSION
Recent works on miRNA dysregulation prove useful in cancer
research (Koturbash et al 2011) To identify condition-specific
networks however most existing methods exploited only the
curated pathways or GO terms Methods for de novo network
reconstruction in some recent literatures operate only on
interactions involving differentially expressed genes (DEG) or
differentially expressed miRNA (Peng et al 2009) because the
corresponding solutions quickly become intractable with increas-
ing number of mmiRNAs However the DEGM-driven
approaches cannot capture subnetworks with accumulative
changes of mmiRNA that have been filtered out either by indi-
vidual hypothesis testings or by multiple testing correctionsIn this article we introduce Mirsynergy as a reasonable alter-
native approach Notably standard clustering methods such as
k-means or hierarchical clustering are not suitable for construct-
ing MiRMs as these methods assign each data point to a unique
B
A
Fig 6 KM survival analysis using MiRMs in ovarian cancer A Patients
with miRNA expression higher and lower than the sample average within
each MiRM were divided into lsquoHighrsquo (red dash) and lsquoLowrsquo (blue dot)
groups respectively Survival fractions as a function of time (days) be-
tween initial diagnosis and death were then plotted for the two groups
and the significant separation of the two curves were assessed by log-rank
test Module 62 and 44 with significant FDRs were displayed B The
corresponding network for Module 62 (red) and 44 (blue) miRNAs are
red diamonds and mRNAs are blue ellipses Solid red and dash blue
edges indicate the miRNAndashmRNA and genendashgene interactions
respectively
Fig 5 Cumulative density function of expression correlation between
miRNA and mRNA Averaged Pearson correlation coefficients for
each MiRM were plotted as a CDF for internal nodesMirsynergy
(solid) and boundary nodesSNMNMF outputs (dash) We observe a
significantly more negative MiMEC distribution for the internal nodes
or Mirsynergy-MiRMs as their curves are clearly located on the left of
the curves from the counterparts P-values were computed by one-sided
KS test
2633
Mirsynergy
by guest on August 27 2016
httpbioinformaticsoxfordjournalsorg
Dow
nloaded from
cluster A recently developed greedy-based clustering method
ClusterONE is more realistic because it allows overlap between
clusters (Nepusz et al 2012) However ClusterONE was de-
veloped with physical PPI in mind Mirsynergy extends from
ClusterONE to detecting MiRMs The novelty of our approach
resides in a two-stage clustering strategy with each stage max-
imizing a synergy score as a function of either the miRNA-
miRNA synergistic co-regulation or miRNAndashmRNAgenendash
gene interactions Several methods have incorporated GGI as
PPITFBS in predicting MiRMs (Le and Bar-Joseph 2013
Zhang et al 2011) which proved to be a more accurate ap-
proach than using miRNA-mRNA alone Comparing with
recent methods such as SNMNMF (Zhang et al 2011) and
PIMiM (Le and Bar-Joseph 2013) however an advantage of
our deterministic formalism is the automatic determination of
module number (given the predefined thresholds to merge and
filter low quality clusters) and efficient computation with theor-
etical bound reduced from O(K(T+N+M)2) per iteration to
onlyO(M(N+M)) for N (M) mRNAs (miRNAs) across T sam-
ples Because N is usually much larger than M and T our algo-
rithm runs orders of faster Based on our tests on a linux server
Mirsynergy took about 2h including the run time for LASSO to
compute OV (N=12456M=559 T=385) BRCA or THCA
(N=13306 M=710 T=331 or 543 respectively) whereas
SNMNMF took more than a day for each dataset More im-
portantly Mirsynergy-MiRMs are significantly more function-
ally enriched coherently expressed and thus more likely to be
biologically functionalThe success of our model is likely attributable to its ability to
explicitly leverage two types of information at each clustering
stage (i) the miRNAndashmiRNA synergism based on the correl-
ation of the inferred miRNA target score profiles from
MMIW matrix (ii) the combinatorial miRNA regulatory effects
on existing genetic network implicated in the combined MMIW
and GGIWmatrices We also explored other model formulations
such as clustering mmiRNAs in a single clustering stage or using
different MMIW matrices other than the one produced from
LASSO which tends to produce MiRMs each containing only
one or a few miRNAs or several large low-quality MiRMs
which were then filtered out by the density threshold in either
clustering stage Notably an MiRM containing only a single
miRNA can be directly derived from the MMIW without any
clustering approach Moreover Mirsynergy considers only
neighbour nodes with non-zero edges Thus our model works
the best on a sparse MMIW matrix such as the outputs from
LASSO which is the best performing expression-based methods
based on our comparison with other alternatives Nonetheless
the performance of Mirsynergy is sensitive to the quality of
MMIW and GGIW In this regard other MMIW or GGIW
matrices (generated from improved methods) can be easily incor-
porated into Mirsynergy as the function parameters by the users
of the Bioconductor package (please refer to the package vignette
for more details) In conclusion with large amount of mmiRNA
expression data becoming available we believe that Mirsynergy
will serve as a powerful tool for analysing condition-specific
miRNA regulatory networks
Funding YL is funded by Natural Sciences and Engineering
Research Council (NSERC) Canada Graduate Scholarship
and ZZ is supported by Ontario Research Fund - GlobalLeader (Round 2) and an NSERC grant JL is supported by
the National Natural Science Foundation of China (Grant NO
61240046) and Hunan Provincial Natural Science Foundation of
China (Grant NO13JJ2017)
Conflicts of Interest none declared
REFERENCES
BartelDP (2009) MicroRNAs target recognition and regulatory functions Cell
136 215ndash233
BarthelemyJP and BruckerF (2001) Np-hard approximation problems in over-
lapping clustering J Classif 18 159ndash183
BenjaminiY and HochbergY (1995) Controlling the false discovery rate a prac-
tical and powerful approach to multiple testing J R Stat Soc Ser B 57
289ndash300
BorossG et al (2009) Human microRNAs co-silence in well-separated groups and
have different predicted essentialities Bioinformatics (Oxford England) 25
1063ndash1069
Cancer Genome Atlas Research Network (2008) Comprehensive genomic charac-
terization defines human glioblastoma genes and core pathways Nature 455
1061ndash1068
DavisFM et al (2013) Induction of epithelial-mesenchymal transition (EMT) in
breast cancer cells is calcium signal dependent Oncogene 33 2307ndash2316
ForbesSA et al (2011) COSMIC mining complete cancer genomes in the
Catalogue of Somatic Mutations in Cancer Nucleic Acids Res 39 D945ndashD950
FriedmanJ et al (2010) Regularization paths for generalized linear models via
coordinate descent J Stat Softw 33 1ndash22
FriedmanRC et al (2009) Most mammalian mRNAs are conserved targets of
microRNAs Genome Res 19 92ndash105
GriffithsT and GhahramaniZ (2005) Infinite latent feature models and the Indian
buffet process In Advances in Neural Information Processing Systems (NIPS)
MIT Press Cambridge Massachusetts United States pp 475ndash482
HelwakA et al (2013) Mapping the human miRNA interactome by CLASH re-
veals frequent noncanonical binding Cell 153 654ndash665
HsuSD et al (2011) miRTarBase a database curates experimentally validated
microRNA-target interactions Nucleic Acids Res 39 D163ndashD619
HuangJC et al (2007) Using expression profiling data to identify human
microRNA targets Nat Methods 4 1045ndash1049
JiangCC et al (2013) Repression of microRNA-768-3p by MEKERK signalling
contributes to enhanced mRNA translation in human melanoma Oncogene 33
2577ndash2588
JoungJG et al (2007) Discovery of microRNA-mRNA modules via population-
based probabilistic learning Bioinformatics (Oxford England) 23 1141ndash1147
KoturbashI et al (2011) Small molecules with big effects the role of the
microRNAome in cancer and carcinogenesis Mutat Res 722 94ndash105
KozomaraA and Griffiths-JonesS (2014) miRBase annotating high confidence
microRNAs using deep sequencing data Nucleic Acids Res 42 D68ndashD73
KrekA et al (2005) Combinatorial microRNA target predictions Nat Genet 37
495ndash500
LeHS and Bar-JosephZ (2011) Inferring interaction networks using the ibp
applied to microrna target prediction In Advances in Neural Information
Processing Systems to appear
LeHS and Bar-JosephZ (2013) Integrating sequence expression and interaction
data to determine condition-specific miRNA regulation Bioinformatics
(Oxford England) 29 i89ndashi97
LuY et al (2011) A Lasso regression model for the construction of microRNA-
target regulatory networks Bioinformatics (Oxford England) 27 2406ndash2413
NepuszT et al (2012) Detecting overlapping protein complexes in protein-protein
interaction networks Nat Methods 9 471ndash472
PapadopoulosGL et al (2009) DIANA-mirPath Integrating human and mouse
microRNAs in pathways Bioinformatics (Oxford England) 25 1991ndash1993
PengX et al (2009) Computational identification of hepatitis C virus
associated microRNA-mRNA regulatory modules in human livers BMC
Genomics 10 373
ShalgiR et al (2007) Global and local architecture of the mammalian microRNA-
transcription factor regulatory network PLoS Comput Biol 3 e131
ShannonP et al (2003) Cytoscape a software environment for integrated models
of biomolecular interaction networks Genome Res 13 2498ndash2504
2634
YLi et al
by guest on August 27 2016
httpbioinformaticsoxfordjournalsorg
Dow
nloaded from
SpizzoR et al (2009) SnapShot MicroRNAs in cancer Cell 137 586ndash586e1
StarkC et al (2011) The BioGRID Interaction Database 2011 update Nucleic
Acids Res 39 D698ndashD704
SubramanianA et al (2005) Gene set enrichment analysis a knowledge-based ap-
proach for interpreting genome-wide expression profiles Proc Natl Acad Sci
USA 102 15545ndash15550
TsangJS et al (2010) Genome-wide dissection of MicroRNA functionsand cotar-
geting networks using gene set signatures Mol Cell 38 140ndash153
WingenderE et al (2000) TRANSFAC an integrated system for gene expression
regulation Nucleic Acids Res 28 316ndash319
XuJ et al (2011) MiRNA-miRNA synergistic network construction via co-regu-
lating functional modules and disease miRNA topological features Nucleic
Acids Res 39 825ndash836
ZhangS et al (2011) A novel computational framework for simultaneous integra-
tion of multiple types of genomic data to identify microRNA-gene regulatory
modules Bioinformatics (Oxford England) 27 i401ndashi409
2635
Mirsynergy
by guest on August 27 2016
httpbioinformaticsoxfordjournalsorg
Dow
nloaded from
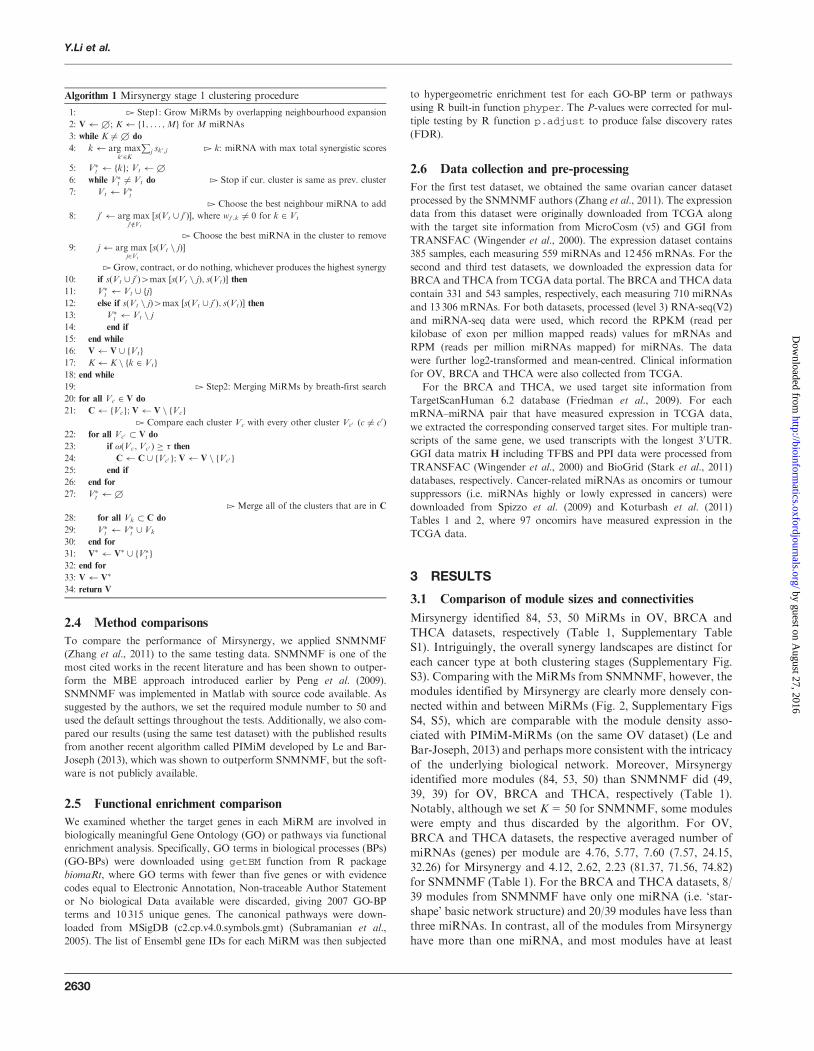
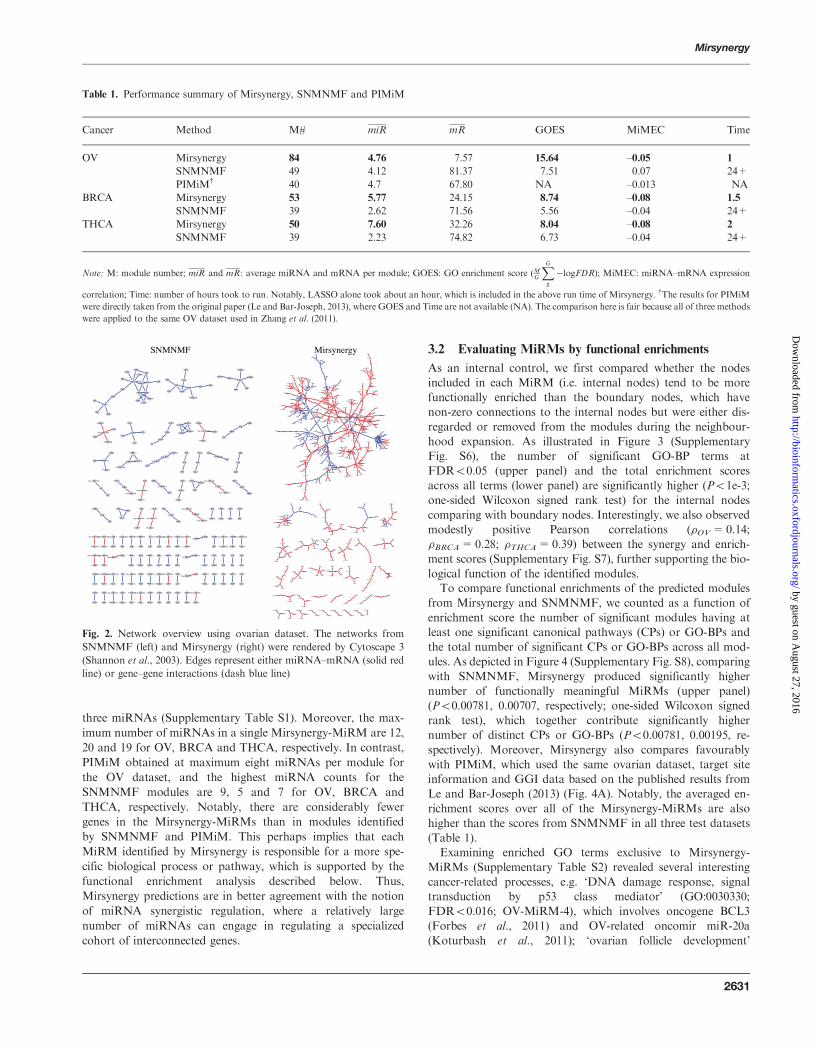
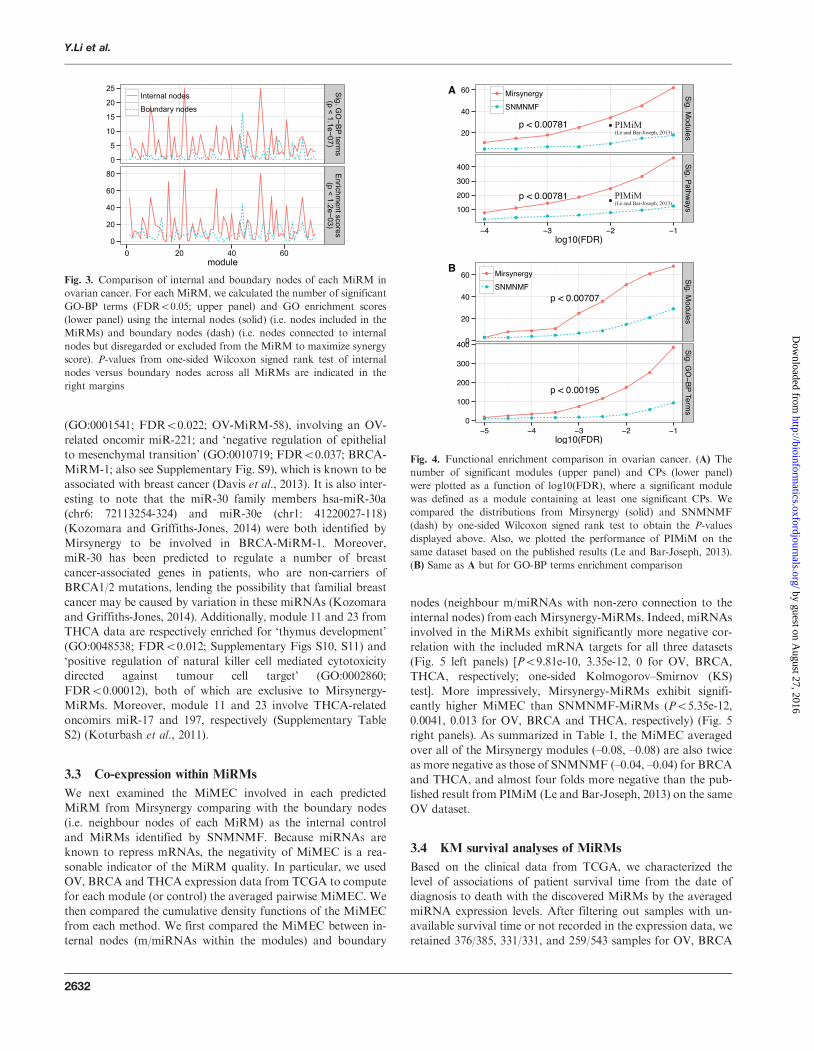
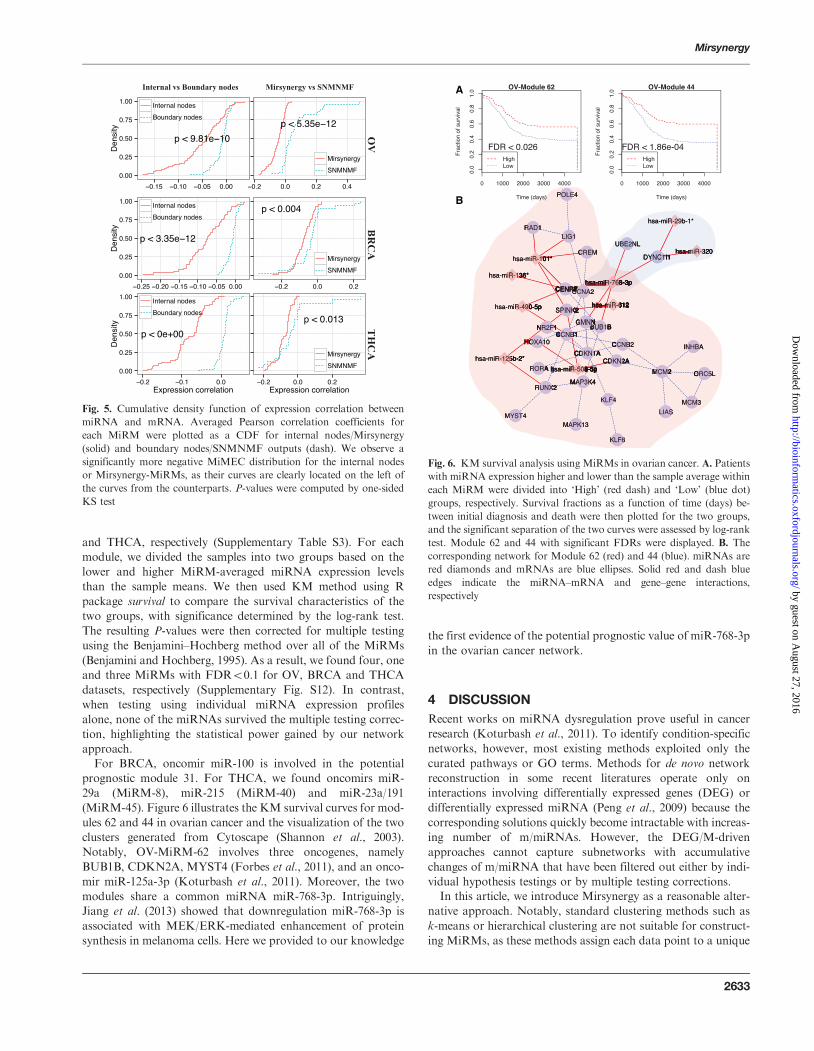
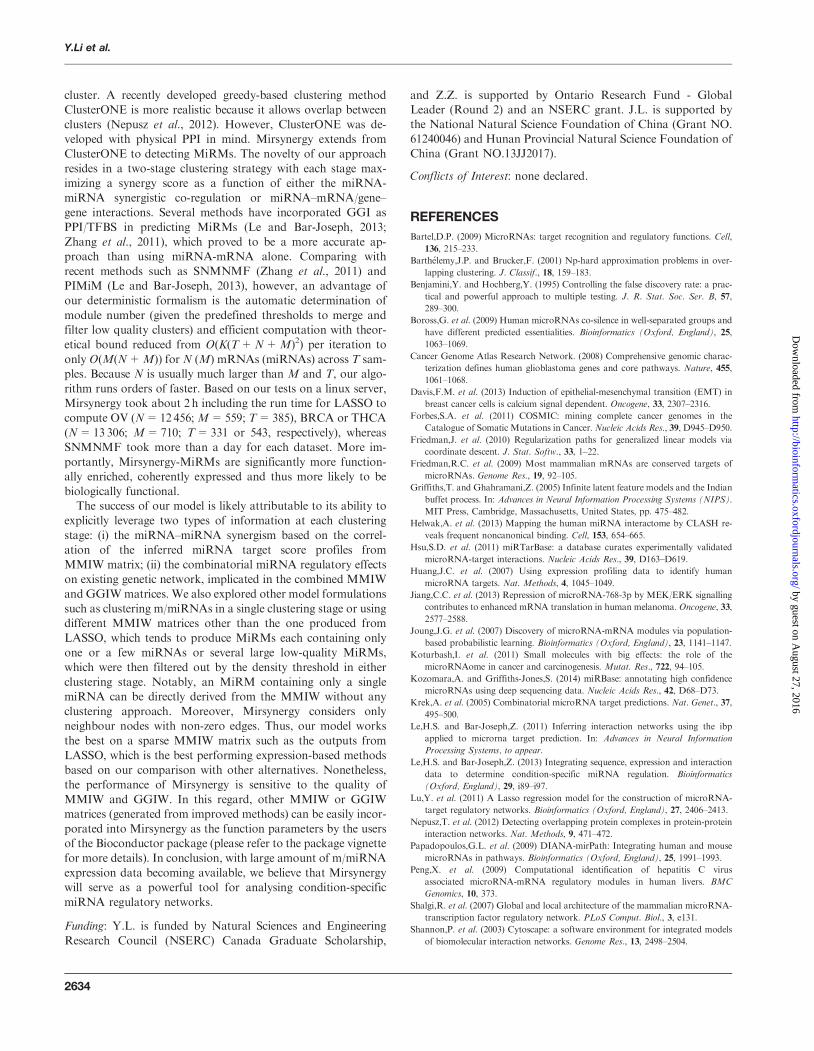