mineralogy of the swat kaolin deposits, pakistan
TRANSCRIPT
Muhammad Ashraf Siddiqui and Zulfiqar Ahmed
The Arabian Journal for Science and Engineering, Volume 30, Number 2A.July 2005 195
*Address for correspondence:KFUPM Box 5070King Fahd University of Petroleum & MineralsDhahran 31261, Saudi ArabiaFax : 966(3)860-2595e-mail : [email protected]
MINERALOGY OF THE SWAT KAOLIN DEPOSITS, PAKISTAN
Muhammad Ashraf SiddiquiInstitute of Geology, Punjab University
New Campus, Lahore
and
Zulfiqar Ahmed*Department of Earth Sciences
King Fahd University of Petroleum & MineralsDhahran, Saudi Arabia
الخالصــة
سوف تبين هذ� الدراسة الخصائص المعدنية والتركيبية (التكوينية) لرواسب من الكاولين (الصلصال) في باكستان، وصخور المصدر، والصخور المحطية بها. وقد تم تحديد التركيب المعدني لخام الكاولين من هذ� الرواسب األولية لتشمل عناصر الكاولينايت المختلفة، والباراجونايت (ميكا الصودا)، والكلينوكلور، واإلبيدوت، والعناصر الكلسية لأللبايت المختلفة، والكوارتز (المرو)، والكالسايت، والمونتموريلونايت، والهالوسايت. وقد وجدنا ضمن أجزاء الحجم الخمسة المجهزة في هذ� الدراسة (الخام، ٦٣ ميكرومتر،يتزايد الكاولين لمجموعة المعدني المحتوى أن ميكرومتر) ٢ من أقل ميكرومتر، ٥ ميكرومتر، ١٠في األجزاء األكثر دقة (األصغر حجمًا ). ووجدنا أن الرواسب تشتق من أنواع الصخور األولية الغنية بالفلدسبار التي غالبًا ما تكون من نوع الكالك - ألكاالين (كلسية – قلية ) لمرو الدايورايت، والتونااليتايات، SiO2 للـ (تناسب عكسي) البالجيوكاليز عالقات عكسية كيميائية وتبين والبجماتيات. والجرانيتانيات، مع Al2O3، وللـ CaO مع Na2O، كنتيجة للتبلور الجزئي أو االستبدال المائي الحراري، أو كليهما معًا. �التي تؤثر على االستخدام الصناعي لكاولين سوات في هذ المعدنية العناصر (العوامل) ولقد تم أبراز
الدراسة.

Muhammad Ashraf Siddiqui and Zulfiqar Ahmed
The Arabian Journal for Science and Engineering, Volume 30, Number 2A. July 2005196
ABSTRACT
This study provides the mineralogical and compositional characterization of the Swat kaolin deposits of Pakistan and their parent and enclosing rocks. The mineral assemblage of the raw kaolin of these primary deposits, has been determined to include disordered kaolinite, paragonite, clinochlore, epidote, disordered calcian albite, quartz, calcite, mont-morillonite, and halloysite. Amongst the five size-fractions prepared in this study (raw, <63µm, <10µm, <5µm, and <2 µm), the kaolin group mineral content increases in the finer fractions. The deposits are derived from feldspar-rich primary rock types that are mainly calc-alkaline quartz diorites, tonalites, granitoids, and pegmatites. Plagioclase chemistry exhibits negative correlations of SiO2 versus Al2O3, and CaO versus Na2O, due to either or both of fractional crystallization, and hydrothermal replacement. The mineralogical attributes that influence the industrial usage of Swat kaolin are highlighted.
Key Words: Kaolin, Swat District, Pakistan, Disordered kaolinite, Halloysite, China clay, Clay mineralogy.

Muhammad Ashraf Siddiqui and Zulfiqar Ahmed
The Arabian Journal for Science and Engineering, Volume 30, Number 2A.July 2005 197
MINERALOGY OF THE SWAT KAOLIN DEPOSITS, PAKISTAN
1. INTRODUCTIONThe Swat kaolin deposits lie in the low hilly terrain in
the eastern vicinity of Shah Dheri village (GPS: 34° 53′ 30″ N; 72° 14′ 02″ E), situated 20 km NW of Mingora city, Swat District, SW Himalayas, Pakistan (Figure 1a). These deposits are amongst the oldest known kaolin deposits of Pakistan. Previous studies, listed herein [1−7], consist of their economic evaluation, exploration, and industrial utilization. Kyotani et al. [1] described certain field relations of the deposits, while determining the feasibility of kaolin exploitation. They performed X-ray diffraction (XRD)-based mineral identifications, major elemental analyses, and particle-size analyses on a sample from Shah Dheri area, in addition to a trench sample representative of three of the kaolin lenses, which are named in the present work as lenses E, G, and J (Figure 1b). Faruqi and Ahmed [2] carried out laboratory work on 51 samples of the kaolin from Taghma, Shalhand, and Shah Dheri areas (Figure 1b) of Swat District. They analyzed major elements of the raw and washed (−200 mesh, 74 µm) samples by XRD, DTA, and wet-chemical analytical methods.
LEGEND X X SS PP
627290
+ +GNEISSES AMPHIBOLITE PERIDOITITE HORNBLENDITE SERPENTINITE PEGMATITES;CHINA CLAY
DIORITE
ALLUVIUMCONTACT ;
Probable CONTACTVILLAGE PEAK FOLIATION STREAM LENSE SAMPLING STATION
J 15
SHAHDHERI
72 14’ 30” 72 15’ 25 26 27 28 29 30 31 3276 20’
343302
34
55’
01
00
99
98
97
9634
72’ 20’323130’282726
72 15
MAHAK
SADA
CHAUTARMOHAMMAD BAIGMOHAMMAD BAIG
NARANGPORA
GAMPORA
YAKH TANGAI SAR
Deola
ikhawar
X
X
X
XX
XX
X
XX
+
+
+
++
+
+
+
+
+
+
S
NEELAWE BABA ZIARATNEELAWE BABA ZIARAT
74
66
57
56
62TARKANI
39
54
32
45
47
6058
43
62
56
64
73
8171
654228
S
S+
+22+
32
5585
54
40
5421
67
72
56
62
47
87
5685
54
59
59
62
60
5657
3692
67
4876
72
6464
73
50
4082
56
54
32
5689
40
78
71
62
46
55
64
56 69
57
54
X
P
X
XP
X
P
P
P
P
+
+
+
X
X
XX X
X
X
P
P
PP
P
PP
J
I
H
3
1
2
1
2
G
1
23
4
1
2 3
456
E
D
1211
15
6
14
910 2
1
45 12
3
134
78
9
10
6 2
1
2
3 4
5
6 7
8
N
B
C
F
A
1
2
3
4
5
6
789
1011
13
52
487
6
0 0.5 1 KM.SCALE
SHALHANDTAGHMA
Figure 1(b). Location map for the Swat district kaolin deposits; the kaolin lenses are marked by letters A through J, successively from east to west. The kaolin sample sites are shown numerically at each deposit.
Figure 1(a). Map of Pakistan showing location of Swat area.
Muhammad Ashraf Siddiqui and Zulfiqar Ahmed
The Arabian Journal for Science and Engineering, Volume 30, Number 2A. July 2005198
Faruqi et al. [3, 4] studied the chemical characteristics of the Swat kaolin, inclusive of the water-soluble content, pH, and cation exchange capacity. They compared these to the English china clay. Moosvi et al. [5] studied the geology of the Shah Dheri china clay deposits in the years 1964–65 AD, and later completed the geological mapping, exploratory pitting, trenching, and sampling. They described the dimensions, thickness, and overburden of the Swat kaolin bodies, quality of the clay, and particle size measurements. They suggested that the grade “A” of Swat deposits is suitable for use in the paper industry, ceramics, and the textile industries, and as filler in the rubber and plastic industries.
Ahmed et al. [6] prepared a detailed geological map of Shalhand, Taghma, Tarkani, and Chautar areas based on petrographic criteria and outlined the petrogenetic features of Taghma area and genesis of the kaolin deposits. Fujii [7] studied the mode of occurrence and mineralogical features of Swat kaolin deposits. His experimental study comprised only the XRD work on anorthositic rocks of Shalhand area. His results before and after heating to 300°C indicated that the main clayey component of the China clay is not kaolinite but halloysite. The earlier works had excluded detailed XRD analyses, optical, and scanning electron microscopy for identification of mineral phases in altered and partially altered rocks, X-ray fluorescence (XRF) analyses, or electron microprobe investigations of the minerals, except a few cases of rather brief study.
Kaolin finds diversified industrial applications including the paper-coating, paper-filler, ceramics, paint-extender, rubber-filler, plastics-filler, catalyst, fiberglass, ink extender, adhesives, enamels, and pharmaceutical industries. Knowledge of the mineralogical properties of clays plays a significant role in the determination of their suitability for industrial applications. The mineral content of kaolin is important in assessing its applications, its physical make-up and behavior, and in determining the beneficiation processes that may be required to convert it to a profitable product. Mineralogical characterizations of individual kaolin deposits would determine, at least partly, its optimal use and beneficiation aptitude.
The present study serves to characterize the mineral assemblage in more detail, and describes compositional and mineralogical aspects relevant to the genesis and assessment of Swat kaolin deposits. It is based on more detailed laboratory work than those undertaken previously. It is focused on mineralogical attributes of the deposits, and attempts to fill significant gap in the previous studies. It may also serve to provide data required for each kaolin deposit in view of their inhomogeneity [8]. Any single deposit would not serve all the diverse uses.
2. GEOLOGY OF SWAT KAOLIN DEPOSITS
The deposits (Figure 1) are named after their nearby village-names as follows: Chautar (GPS: 34° 53′ 52″ N; 72° 19′ 52″ E; altitude: 1350–1600 m); Muhammad Beg (GPS: 34° 53′ 55″ N; 72° 18′ 26″ E; altitude: 1332–1676 m); Shah Dheri (GPS: 34° 53′ 22″ N; 72° 14′ 30″ E; altitude: 1204–1234 m); Shalhand (GPS: 34° 53′ 51″ N; 72° 16′ 09″ E; altitude: 1189–1280 m); Taghma (GPS: 34° 53′ 51″ N; 72° 16′ 43″ E; altitude: 1280–1320 m); and Tarkani (GPS: 34° 53′ 49″ N; 72° 19′ 04″ E; altitude: 1300–1500 m).
To the south of these deposits, 1486 m high Gampora peak makes a prominent land feature. The deposits comprise many small bodies in an east–west trend that changes to a SW–NE trend between the villages of Taghma and Shalhand. Concentrations of relatively large lenses occur in Shah Dheri and Taghma areas; in addition to several sporadic minor lenticular bodies and patches (Figure 2) in the vicinity.
The Shah Dheri occurrence trends east from the Shah Dheri village and extends for about 700 m, with an average width of 84 m. It comprises five small lenses, labeled F, G, H, I, and J in Figure 1. The two eastern lenses are F (378 × 42–84 m), and G (273 × 42–84 m). The lens H is 126 m in length and 84 m in average width.
The Taghma occurrence comprises relatively larger bodies, which trend WSW. Five of the more prominent lenses are labeled A, B, C, D, and E from east to west (Figure 1). The Chautar occurrence lies east of Chautar village, and forms the eastern extremity of the china clay deposits.
The Swat kaolin deposits are derived from feldspar-rich “plutonic” host rocks, which are, in turn, enclosed in the regional metamorphic “country rocks”. These “country rocks” comprise an east–west trending belt of ortho-amphibolites and other equivalent grade metamorphic rocks that belong to the lower part of the Kohistan island arc sequence, often called “amphibolites”. The abundance of hornblende in these amphibolites earned them their earlier name “Upper Swat Hornblendic Group” [9]. These rocks were later termed “Kamila amphibolites” [10, 11] after a locality name. The kaolin

Muhammad Ashraf Siddiqui and Zulfiqar Ahmed
The Arabian Journal for Science and Engineering, Volume 30, Number 2A.July 2005 199
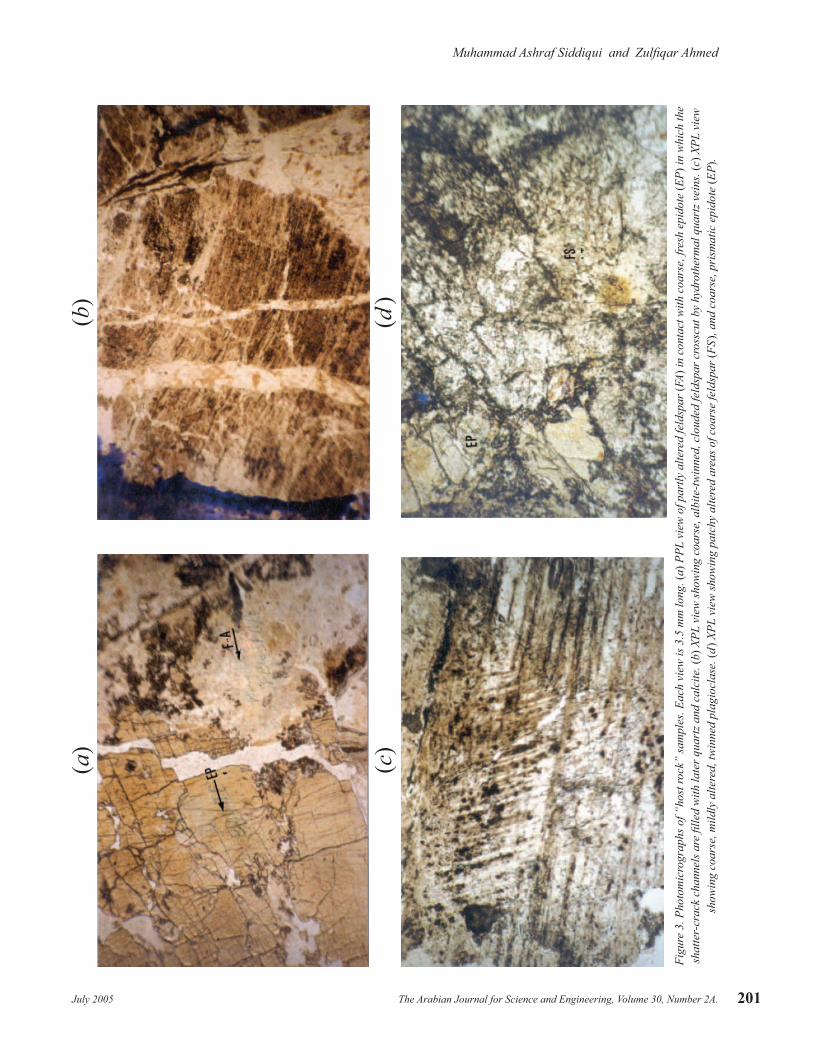
Figure 2. Field photos of Swat kaolin occurrences.(a) The metamorphic country rock outcrops show irregular, intrusive host rock at the base, which passes into a lens of white kaolin at the base.(b) The active open-pit mining of kaolin at Taghma area of Swat District.(c) The site of a channel sample of kaolin collected for this study.(d ) Pillar-like unweathered rock stands above the basal, more whitish, china clay deposit being quarried.(e) The host and country rocks remnants after mining of pod-like china clay deposit.
(a) (b)
(c) (d )
(e)
Muhammad Ashraf Siddiqui and Zulfiqar Ahmed
The Arabian Journal for Science and Engineering, Volume 30, Number 2A. July 2005200
deposits mainly lie in the southern part of this amphibolite belt, which comprised the epidote amphibolite facies. These rocks merge towards north into the proper amphibolite facies rocks. Metamorphic segregation banding is frequently present in these metamorphic rocks and the concentration of their major mafic component, hornblende, to ultramafic levels has locally produced hornblendites on a mesoscopic scale. Minor bodies of meladiorites occur widely within this belt. The “host rocks” at the immediate contact of the deposits include quartz diorites, tonalites, trondhjemites, granitoids, and pegmatites, as defined on the basis of their mineral composition following the IUGS classification [12].
Most of the Swat kaolin deposits are derived from plagioclase-rich quartz leucodiorite. This rock type occurs widespread in the form of variously sized patches, veins, layers and pods in amphibolite, migmatite, and hornblende–feldspar–quartz gneiss. In the amphibolite, it generally forms elongate bodies along the foliation planes, while in the migmatite and the gneiss, it occurs as irregular masses complexly interspersed with the enclosing rock.
Contacts of the individual bodies of China clay with the host rocks are generally gradational and manifest segregation of felsic and mafic constituents. Where enclosed by migmatites, the contact generally grades into the outer migmatite zone, at places showing a lit-par-lit injection of the felsic material. Within the migmatite and the gneiss the contact is almost indeterminable. Observation on the surface and in the exploratory pits and tunnels reveals that the China clay consists of patches, pods, and streaky or uniform layers with none or very little hornblende that is often altered to chlorite. There are also streaks and thin layers of quartz-rich rock. The deposits commonly depict relict texture of the amphibolite with alternation of mafic and felsic bands and elongated minerals, such as hornblende.
3. METHODS OF STUDY
Geological field mapping in the region was followed by the collection of kaolin samples from the deposits and trench stockpiles, including channel sampling from 12 kaolin lenses of Shah Dheri, Taghma, Tarkani, and Chutar areas (Figure 1). Each sample being a continuous sample for up to 2.5 m long vertical channel in clay along open pit and trench walls. Individual samples weighed from 20 to 30 kg; and were thoroughly mixed before their coning and quartering to obtain representative samples. At each sampling site, “parent rock” samples were also collected. For XRD and bulk mineralogy, the raw sample was powdered by agate mortar and agate tema mill.
Mineralogical techniques were employed such as the thin section microscopy, X-Ray diffraction (XRD), differential thermal analysis (DTA), scanning electron microscopy (SEM), and electron probe microanalysis (EPMA). DTA is carried out on 2 fractions (<63 µm and <5 µm) and SEM study on 3 fractions (raw, <5 µm, and <2 µm). Petrographic study (Figure 3) was also carried out on rocks surrounding and parental to the kaolin, in strongly altered and less altered, fresh state.
3.1. XRD Method
The identification of clay minerals and other alteration products was carried out by the powder diffraction method, which is well-known as an efficient technique for the analysis of clay minerals [13]. Five fractions were analyzed from each clay sample: the raw material, <63 µm, <10 µm, <5 µm, and <2 µm. Each fraction was analyzed after air-drying, glycolation, and heating to 500°C for 2 hours (Figure 4). Sedimentation under controlled conditions allowed oriented mounts to be made of the clay mineral fractions for better characterization and estimation of the degree of crystallinity of the kaolin minerals. The cavity mounts as well as the smear mounts were prepared.
The cavity mount method was used for the raw, and <63 µm, <10 µm, and <5 µm fractions. The raw sample was crushed using mortar and pestle and passed through 230 mesh ASTM. Powders were loaded in a rectangular aluminum sample holder. Every care was taken to avoid a preferred orientation of grains.
The Smear mount method was used for the <2 µm fraction, with the objective to produce a partially-orientated sample for clay-mineral identification. The material was disaggregated in water with an anticoagulent dipex (sodium hexametaphosphate) collecting the 2 µm fraction according to Stoke’s Law. The <2 µm fraction was dried on glass slides to orientate the clay particles. The air-dried samples were placed in a desiccator containing glycol and the desiccator was placed in an oven at 60°C for 16 hours; the samples were then run in order to identify the smectite group minerals, using the expansion on glycolation. The glycolated samples were heated at 550°C for 1 hour and 45 minutes. At this temperature, kaolinite and smectite structures collapse.
Muhammad Ashraf Siddiqui and Zulfiqar Ahmed
The Arabian Journal for Science and Engineering, Volume 30, Number 2A.July 2005 201
Figu
re 3
. Pho
tom
icro
grap
hs o
f “ho
st ro
ck”
sam
ples
. Eac
h vi
ew is
3.5
mm
long
. (a)
PPL
vie
w o
f par
tly a
ltere
d fe
ldsp
ar (F
A) in
con
tact
with
coa
rse,
fres
h ep
idot
e (E
P) in
whi
ch th
e sh
atte
r-cr
ack
chan
nels
are
fille
d w
ith la
ter q
uart
z and
cal
cite
. (b)
XPL
vie
w sh
owin
g co
arse
, alb
ite-tw
inne
d, c
loud
ed fe
ldsp
ar c
ross
cut b
y hy
drot
herm
al q
uart
z vei
ns. (
c) X
PL v
iew
sh
owin
g co
arse
, mild
ly a
ltere
d, tw
inne
d pl
agio
clas
e. (d
) XPL
vie
w sh
owin
g pa
tchy
alte
red
area
s of c
oars
e fe
ldsp
ar (F
S), a
nd c
oars
e, p
rism
atic
epi
dote
(EP)
.
(a)
(b)
(c)
(d)
Muhammad Ashraf Siddiqui and Zulfiqar Ahmed
The Arabian Journal for Science and Engineering, Volume 30, Number 2A. July 2005202
9.6
33
P
7.1
74
K
4.8
16
P
4.4
34
P
3.5
72
K
3.1
94
P
8 10 12 14 16 18 20 22 24 25 28
OrientatedGlycolatedHeated
K = KaoliniteP = Paragonite
4.0
30
P
( A )( B )( C )
16.1
8M
(G
lycola
ted
)
14.2
2(
Untr
eate
d)
9.5
68
P
7.1
62
K
4.8
16
P
4.4
44
P
3.5
79
K
3.2
06
P
2 4 6 8 10 12 14 16 18 20 22 24 26 28 30
GlycolatedUntreated
K = KaoliniteP = PalragoniteM = Montmorillonite
2 4 6 8 10 12 14 16 18 20 22 24 26 28 30
22.2
0
16.1
0
14.7
5
12.5
7
9.6
84
P
7.5
83
7.2
08
K
4.8
16
P
4.4
48
P
3.5
73
3.2
01
GlycolatedUntreatedK = KaoliniteP = ParagoniteM = Montmorillonite
M
K
P
(A)
(B)
(C )
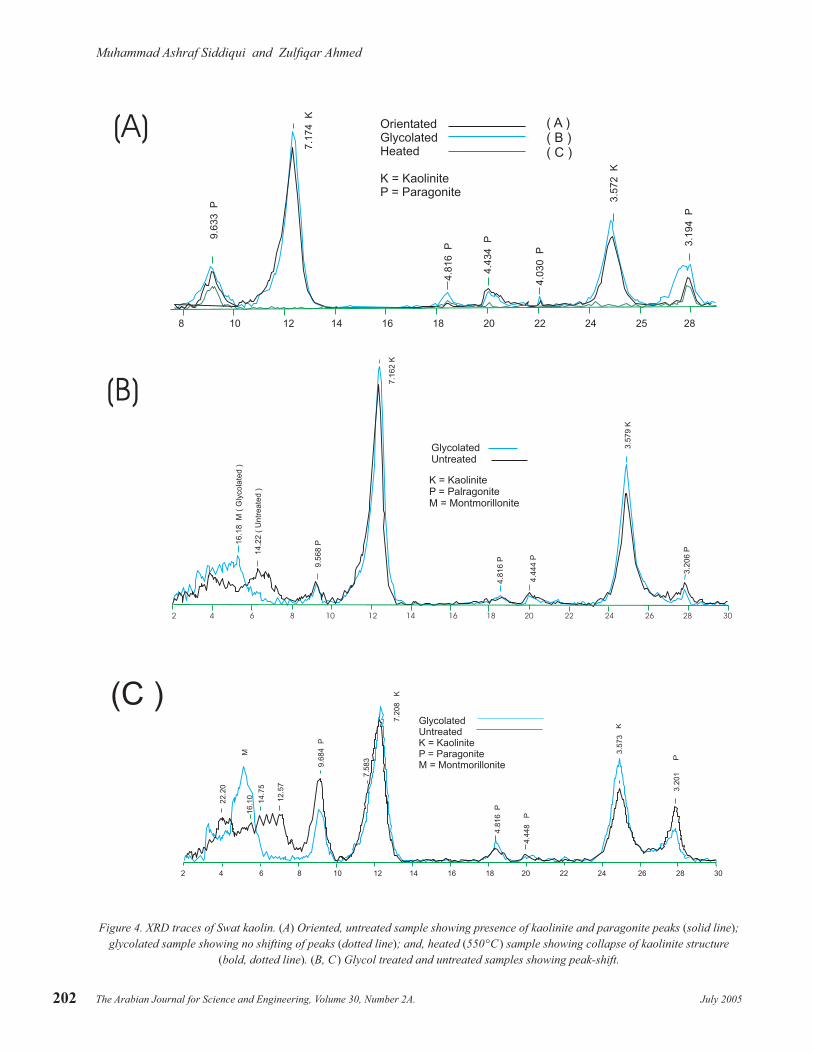
Figure 4. XRD traces of Swat kaolin. (A) Oriented, untreated sample showing presence of kaolinite and paragonite peaks (solid line); glycolated sample showing no shifting of peaks (dotted line); and, heated (550°C ) sample showing collapse of kaolinite structure
(bold, dotted line). (B, C ) Glycol treated and untreated samples showing peak-shift.

Muhammad Ashraf Siddiqui and Zulfiqar Ahmed
The Arabian Journal for Science and Engineering, Volume 30, Number 2A.July 2005 203
8 1 0 1 2 1 4 1 6 1 8 2 0 2 2 2 4 2 6 2 8 3 0
9.9
27
9.6
33
7.1
74
4.8
16
4.4
34
4.0
30
3.5
72
3.1
94
K
P
K
P P
5 1 0 1 5 2 0 2 5 3 0 3 5 4 0 4 5 5 0
9.6
59
4.8
54
3.1
92
P
P
P
P
Heated W ashed
K = Kaolinite
P = Paragonite
P = Paragonite
9.6
33
P
7.1
7 4
K
- 4.8
16
P
- 4.4
3 4
P
-
4.0
3 0
P
- 3.5
72
K
3.1
9 4
P
G - 3 = Orient ated G - 3 = Glycolated
6 8 10 12 14 16 18 20 22 24 26 28 30
-
-
-
K = Kaolinite
P = Paragonite
(D )
(E)
( F )
P
P
P P
(D) Oriented and glycolated samples showing no peak shift.(E) Oriented <2 µm unheated and heated to 550°C samples that show collapse of kaolinite structure.
(F) Orientated <2 µm heated sample with collapse of kaolinite structure.
Muhammad Ashraf Siddiqui and Zulfiqar Ahmed
The Arabian Journal for Science and Engineering, Volume 30, Number 2A. July 2005204
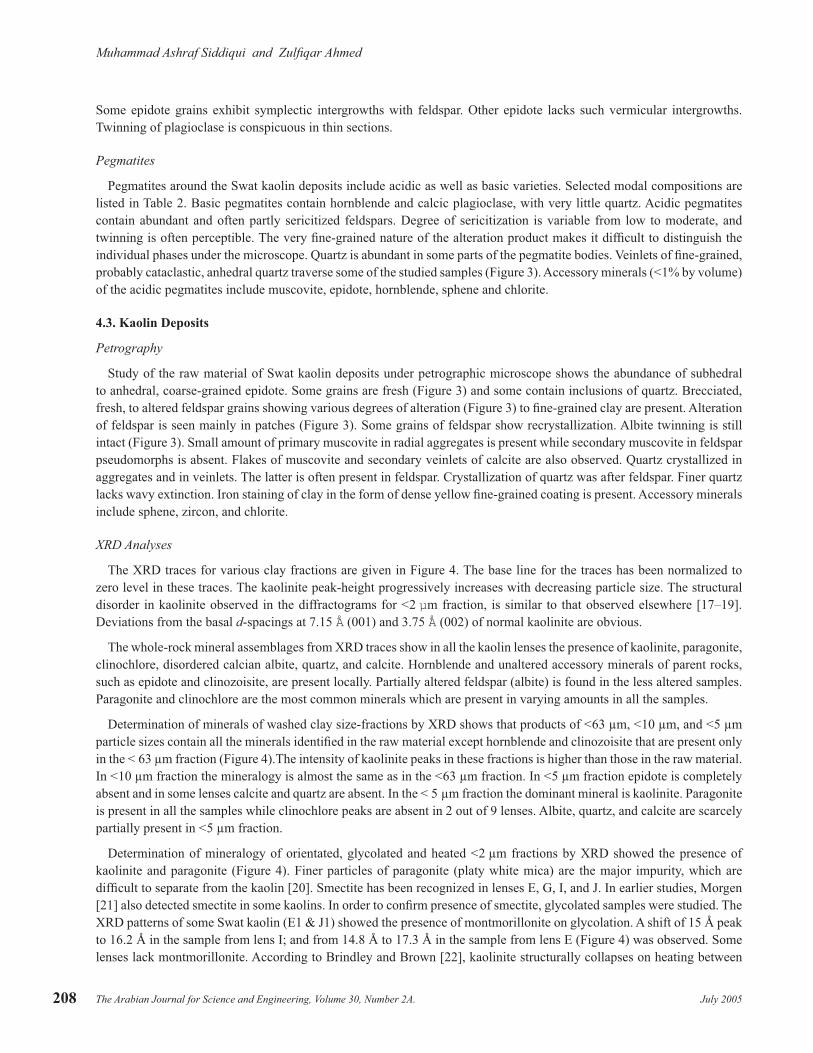
Samples were analyzed using the Siemens D-5000 diffractometer with Ni-filtered Cu-Kα radiation. The X-ray tube was operated at 40 kV and 30 mA beam current. The clays were examined over the range 3–35° 2θ at a scan speed of 2° 2θ/min and the raw sample, and <63 µm, <10 µm, and <5 µm fractions at the same rate over the range 05 to 60° 2θ. For the clay samples the divergent, receiving, and anti-scatter slits were set at 1°, 0.2 mm, and 1°, respectively.
Bulk samples and each particle size fraction were made into the bulk and random powder-mounts; and scanned for 0 to 65° 2θ for bulk mineralogy; and for 2θ, 0 to 30° at 1°/min scan speed for clay mineralogy.
3.2. SEM Method
This method was used for morphological examination of the clays (Figure 5). Selected samples were carbon-coated before loading onto the Hitachi SEM, Model S-2700, fitted with an Energy Dispersive X-ray Detector.
3.3. EPMA Method
For mineral chemistry, the parent rock samples were analyzed employing the Shimadzu EPMA-8705 Q-II microprobe provided with SE, BSE, and semi-conductor BSE imaging facility. The instrument was operated under an accelerating voltage of 15 kV, sample beam current of 10–9 mA, and probe diameter of 5.0 µm, and by using natural and synthetic oxides and silicates as standards.
(a) (b)
(c) (d )
0.857 µm 2.857 µm
28.57 µm 0.39 µm
KAOLINITE
HALLOYSITE C A L C I T E
C A L C I T E
PLATES
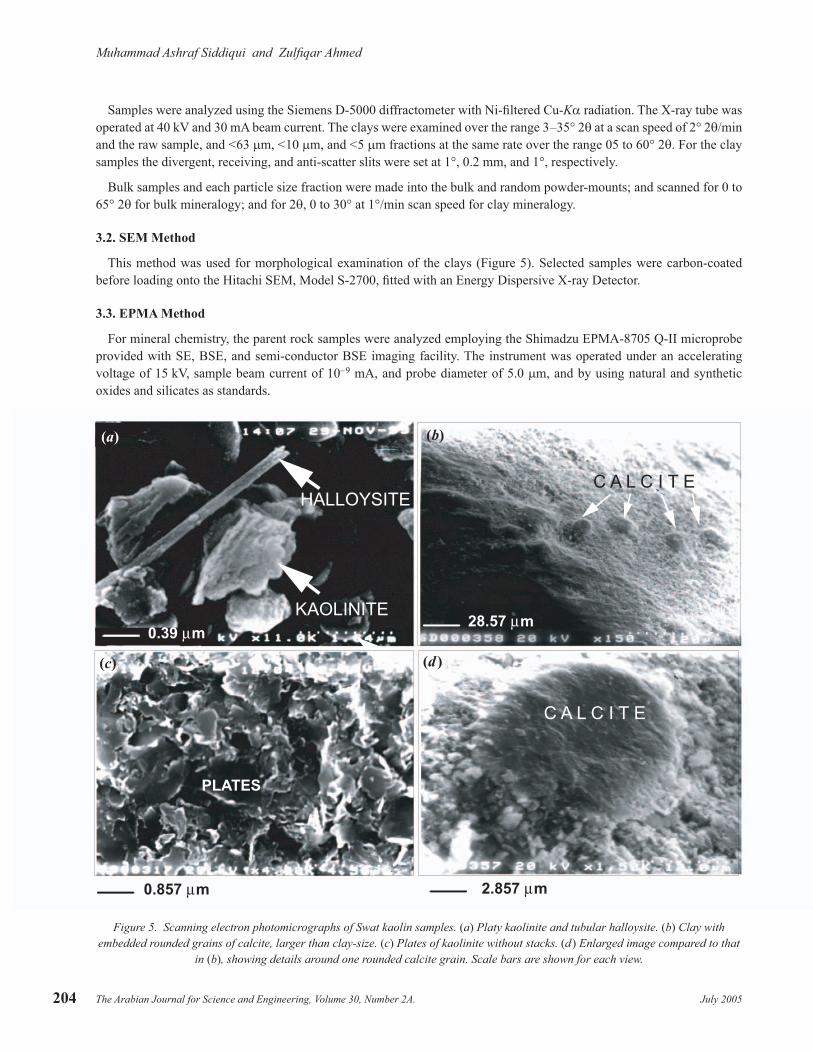
Figure 5. Scanning electron photomicrographs of Swat kaolin samples. (a) Platy kaolinite and tubular halloysite. (b) Clay with embedded rounded grains of calcite, larger than clay-size. (c) Plates of kaolinite without stacks. (d ) Enlarged image compared to that
in (b), showing details around one rounded calcite grain. Scale bars are shown for each view.

Muhammad Ashraf Siddiqui and Zulfiqar Ahmed
The Arabian Journal for Science and Engineering, Volume 30, Number 2A.July 2005 205
3.4. DTA, TG Methods
Both the differential thermal analysis (DTA) and thermogravimetric analysis (TG) were used to determine the purity level and to help identify contaminants or impurities. TG analysis allowed quantitative estimation of the kaolin minerals, based on the state-of-the-art methods [e.g. 14–16]. Determination of loss on ignition (LOI) provided an approximate cross check on the TG Figures. The DTA apparatus employed was model STA-1500, made by Rheumetric Scientific, UK. Observations were recorded from ambient temperatures to 1000°C at a heating rate of 10°C/minute and chart speed of 12 cm/hour.
4. PETROGRAPHY, MINERALOGY, AND GEOCHEMISTRY
4.1. “Country Rocks”
Epidote amphibolite is the most abundant rock around the Swat kaolin deposits. Metamorphic segregation banding into alternate mafic and felsic bands is a common feature. Hornblende is the major mafic phase (Table 1). It forms subhedral to euhedral prisms. Coarsely crystalline epidote is abundant in many of the studied rock samples. Plagioclase displays partial alteration with primary twinning still intact, that indicate oligoclase–labradorite compositions. Minor phases are quartz, chlorite, sphene, zircon, apatite, and magnetite. Epidote occurs both as elongated subhedral and cleaved crystals and as small anhedral granular aggregates with bright interference colors. Epidote grains locally form symplectite with quartz; and contains tiny finger-like inclusions of quartz. Epidote that forms veinlets crosscutting some of the rocks indicates its non-metamorphic origin. Anhedral quartz is present as inclusions in hornblende, epidote, and plagioclase. Sphene is generally developed along the fractures, cleavages, and grain boundries of hornblende. Sphene is pale yellow to brown and euhedral. Opaque minerals generally occur in the cores and at grain boundaries of the hornblende crystals. Chlorite shows anomalous blue interference tints. Iron oxide is very rare.
Hornblendite contains hornblende that exceeds 80% of rock volume; and minor epidote, plagioclase, sphene, zircon, rutile, quartz, and chlorite (Figure 3). Hornblende grains are strongly pleochroic from light to brownish green or dark green. Plagioclase is mostly twinned and cloudy, but fresh plagioclase is also present (Figure 3). It is generally interstitial to hornblende. Epidote occurs as granular aggregates in the interstices of hornblende crystals. Some hornblende-rich bands contain very little felsic minerals and are named here metamorphic hornblendite. These hornblendite samples contain hornblende, epidote, zircon, sphene, rutile, and muscovite.
Meladiorites exhibit non-foliated massive texture, and abundant mafic minerals, mainly hornblende. Smaller quantities of plagioclase are present. Alkali feldspar and quartz are absent.
4.2. Partially Altered “Host Rocks”
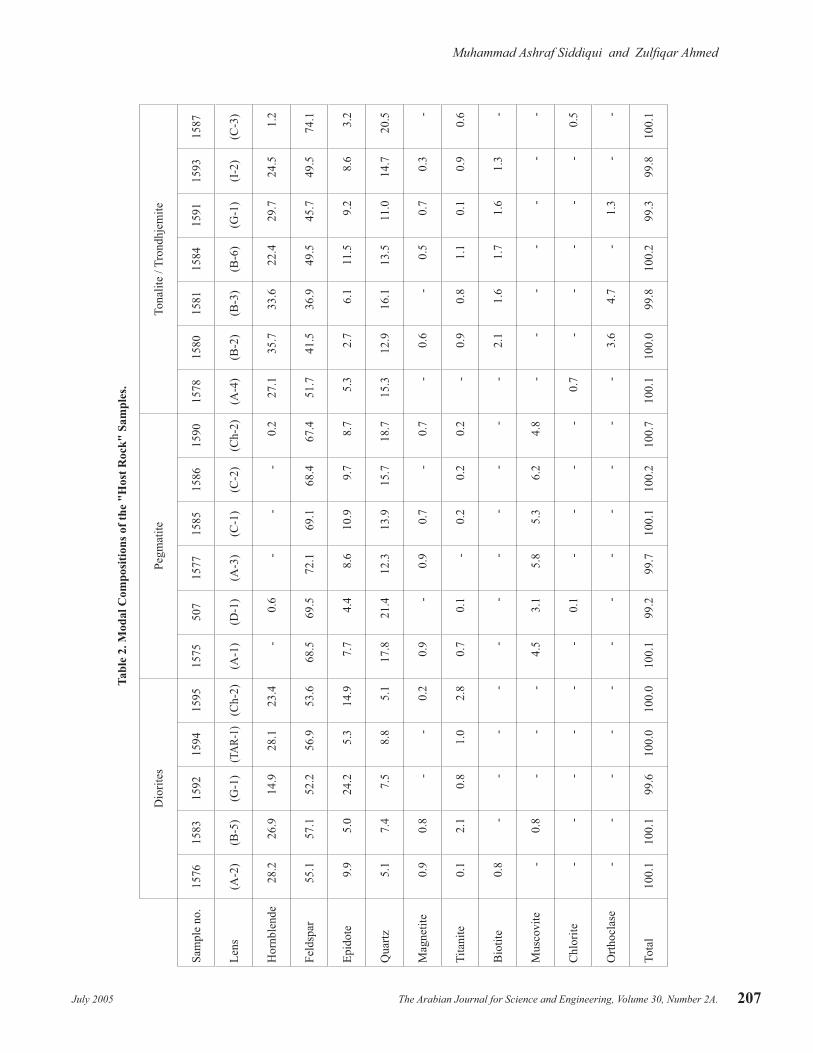
The mineral assemblages of “host rocks” are listed in Table 2. Most of the host rocks contain quartz. Plagioclase twinning indicates abundance of andesine composition. Hornblende, epidote, and sphene are minor phases. Among micas, which occur in accessory amounts, muscovite predominates whereas biotite is mostly absent. Other accessory phases are epidote and sphene. Some hornblende shows symplectitic intergrowth with quartz.
Tonalite
Based on variation in the proportion of quartz, the tonalites vary between quartz diorite and granodiorite. The composition of plagioclase ranges from oligoclase to andesine. Representative modal compositions are given in Table 2. Plagioclase is mostly unaltered, cleaved and exhibits well-developed twinning on albite, Carlsbad, and pericline laws (Figure 3). Some of the plagioclase grains show fine, dusty alteration product as thin, lenticular streaks along the cleavage traces. Hornblende prisms are strongly pleochroic, pervasively cleaved and some are also twinned. In additon to plagioclase, hornblende and quartz, some of the studied samples also contain epidote, which locally occurs in the form of symplectitic intergrowths with feldspar.
Quartz Diorite
Diorites containing a few percent of quartz are the frequent hosts of kaolin deposits. The plagioclase in these rocks is turbid and altered. Selected modal compositions are listed in Table 2. Anhedral quartz may form inclusions in hornblende.

Muhammad Ashraf Siddiqui and Zulfiqar Ahmed
The Arabian Journal for Science and Engineering, Volume 30, Number 2A. July 2005206
Tabl
e 1.
Min
eral
Ass
embl
age
of th
e "C
ount
ry R
ocks
" Sa
mpl
es.
Am
phib
olite
Epid
ote A
mph
ibol
iteH
ornb
lend
iteM
elad
iorit
e
Min
eral
sA
A-1
BB
-1C
C-1
TR-1
TR-2
CH
-1D
-1D
-4F-
2F-
3G
-3J-
2A
-1C
-1E-
1F-
1F-
3B
-1C
HA
-1
Hor
nble
nde
56.3
57.7
67.9
63.4
56.8
62.6
40.4
49.9
48.7
46.4
40.1
49.9
93.1
92.9
94.4
91.7
93.6
57.7
54.5
Epid
ote
12.5
19.8
4.4
8.2
24.2
28.8
28.9
25.2
29.6
28.3
31.0
27.2
0.9
2.1
1.1
-0.
47.
713
.7
Plag
iocl
ase
9.9
14.6
4.3
13.2
14.3
4.1
22.6
13.2
14.5
14.7
13.9
14.2
1.1
1.3
3.1
--
23.5
19.8
Qua
rtz17
.24.
218
.014
.02.
90.
51.
02.
20.
72.
82.
62.
70.
4-
--
-8.
68.
4
Tita
nite
1.5
1.8
3.5
2.1
0.6
3.0
3.1
3.9
2.8
3.7
4.1
2.8
2.1
1.1
0.4
2.2
2.0
2.8
3.7
Iron
ore
0.5
0.9
1.4
0.4
0.5
1.1
2.1
3.2
1.8
2.2
2.9
1.7
1.0
0.3
0.4
3.1
1.1
--
Chl
orite
0.4
0.4
0.2
-0.
20.
10.
30.
70.
90.
83.
10.
61.
11.
20.
81.
11.
9-
-
Gar
net
1.1
0.6
-0.
20.
6-
--
--
--
--
--
--
-
Rut
ile-
--
--
-0.
72.
10.
60.
82.
11.
01.
21.
10.
52.
10.
4-
-
Tota
l99
.410
0.0
99.7
101.
510
0.1
100.
299
.110
0.4
99.6
99.7
99.8
99.1
100.
999
.010
0.7
100.
299
.410
0.3
100.
1
Muhammad Ashraf Siddiqui and Zulfiqar Ahmed
The Arabian Journal for Science and Engineering, Volume 30, Number 2A.July 2005 207
Tabl
e 2.
Mod
al C
ompo
sitio
ns o
f the
"H
ost R
ock"
Sam
ples
.
Dio
rites
Pegm
atite
Tona
lite
/ Tro
ndhj
emite
Sam
ple
no.
1576
1583
1592
1594
1595
1575
507
1577
1585
1586
1590
1578
1580
1581
1584
1591
1593
1587
Lens
(A-2
)(B
-5)
(G-1
)(T
AR-1
)(C
h-2)
(A-1
)(D
-1)
(A-3
)(C
-1)
(C-2
)(C
h-2)
(A-4
)(B
-2)
(B-3
)(B
-6)
(G-1
)(I
-2)
(C-3
)
Hor
nble
nde
28.2
26.9
14.9
28.1
23.4
-0.
6-
--
0.2
27.1
35.7
33.6
22.4
29.7
24.5
1.2
Feld
spar
55.1
57.1
52.2
56.9
53.6
68.5
69.5
72.1
69.1
68.4
67.4
51.7
41.5
36.9
49.5
45.7
49.5
74.1
Epid
ote
9.9
5.0
24.2
5.3
14.9
7.7
4.4
8.6
10.9
9.7
8.7
5.3
2.7
6.1
11.5
9.2
8.6
3.2
Qua
rtz5.
17.
47.
58.
85.
117
.821
.412
.313
.915
.718
.715
.312
.916
.113
.511
.014
.720
.5
Mag
netit
e0.
90.
8-
-0.
20.
9-
0.9
0.7
-0.
7-
0.6
-0.
50.
70.
3-
Tita
nite
0.1
2.1
0.8
1.0
2.8
0.7
0.1
-0.
20.
20.
2-
0.9
0.8
1.1
0.1
0.9
0.6
Bio
tite
0.8
--
--
--
--
--
-2.
11.
61.
71.
61.
3-
Mus
covi
te-
0.8
--
-4.
53.
15.
85.
36.
24.
8-
--
--
--
Chl
orite
--
--
--
0.1
--
--
0.7
--
--
-0.
5
Orth
ocla
se-
--
--
--
--
--
-3.
64.
7-
1.3
--
Tota
l10
0.1
100.
199
.610
0.0
100.
010
0.1
99.2
99.7
100.
110
0.2
100.
710
0.1
100.
099
.810
0.2
99.3
99.8
100.
1
Muhammad Ashraf Siddiqui and Zulfiqar Ahmed
The Arabian Journal for Science and Engineering, Volume 30, Number 2A. July 2005208
Some epidote grains exhibit symplectic intergrowths with feldspar. Other epidote lacks such vermicular intergrowths. Twinning of plagioclase is conspicuous in thin sections.
Pegmatites
Pegmatites around the Swat kaolin deposits include acidic as well as basic varieties. Selected modal compositions are listed in Table 2. Basic pegmatites contain hornblende and calcic plagioclase, with very little quartz. Acidic pegmatites contain abundant and often partly sericitized feldspars. Degree of sericitization is variable from low to moderate, and twinning is often perceptible. The very fine-grained nature of the alteration product makes it difficult to distinguish the individual phases under the microscope. Quartz is abundant in some parts of the pegmatite bodies. Veinlets of fine-grained, probably cataclastic, anhedral quartz traverse some of the studied samples (Figure 3). Accessory minerals (<1% by volume) of the acidic pegmatites include muscovite, epidote, hornblende, sphene and chlorite.
4.3. Kaolin Deposits
Petrography
Study of the raw material of Swat kaolin deposits under petrographic microscope shows the abundance of subhedral to anhedral, coarse-grained epidote. Some grains are fresh (Figure 3) and some contain inclusions of quartz. Brecciated, fresh, to altered feldspar grains showing various degrees of alteration (Figure 3) to fine-grained clay are present. Alteration of feldspar is seen mainly in patches (Figure 3). Some grains of feldspar show recrystallization. Albite twinning is still intact (Figure 3). Small amount of primary muscovite in radial aggregates is present while secondary muscovite in feldspar pseudomorphs is absent. Flakes of muscovite and secondary veinlets of calcite are also observed. Quartz crystallized in aggregates and in veinlets. The latter is often present in feldspar. Crystallization of quartz was after feldspar. Finer quartz lacks wavy extinction. Iron staining of clay in the form of dense yellow fine-grained coating is present. Accessory minerals include sphene, zircon, and chlorite.
XRD Analyses
The XRD traces for various clay fractions are given in Figure 4. The base line for the traces has been normalized to zero level in these traces. The kaolinite peak-height progressively increases with decreasing particle size. The structural disorder in kaolinite observed in the diffractograms for <2 µm fraction, is similar to that observed elsewhere [17–19]. Deviations from the basal d-spacings at 7.15 Å (001) and 3.75 Å (002) of normal kaolinite are obvious.
The whole-rock mineral assemblages from XRD traces show in all the kaolin lenses the presence of kaolinite, paragonite, clinochlore, disordered calcian albite, quartz, and calcite. Hornblende and unaltered accessory minerals of parent rocks, such as epidote and clinozoisite, are present locally. Partially altered feldspar (albite) is found in the less altered samples. Paragonite and clinochlore are the most common minerals which are present in varying amounts in all the samples.
Determination of minerals of washed clay size-fractions by XRD shows that products of <63 µm, <10 µm, and <5 µm particle sizes contain all the minerals identified in the raw material except hornblende and clinozoisite that are present only in the < 63 µm fraction (Figure 4).The intensity of kaolinite peaks in these fractions is higher than those in the raw material. In <10 µm fraction the mineralogy is almost the same as in the <63 µm fraction. In <5 µm fraction epidote is completely absent and in some lenses calcite and quartz are absent. In the < 5 µm fraction the dominant mineral is kaolinite. Paragonite is present in all the samples while clinochlore peaks are absent in 2 out of 9 lenses. Albite, quartz, and calcite are scarcely partially present in <5 µm fraction.
Determination of mineralogy of orientated, glycolated and heated <2 µm fractions by XRD showed the presence of kaolinite and paragonite (Figure 4). Finer particles of paragonite (platy white mica) are the major impurity, which are difficult to separate from the kaolin [20]. Smectite has been recognized in lenses E, G, I, and J. In earlier studies, Morgen [21] also detected smectite in some kaolins. In order to confirm presence of smectite, glycolated samples were studied. The XRD patterns of some Swat kaolin (E1 & J1) showed the presence of montmorillonite on glycolation. A shift of 15 Å peak to 16.2 Å in the sample from lens I; and from 14.8 Å to 17.3 Å in the sample from lens E (Figure 4) was observed. Some lenses lack montmorillonite. According to Brindley and Brown [22], kaolinite structurally collapses on heating between

Muhammad Ashraf Siddiqui and Zulfiqar Ahmed
The Arabian Journal for Science and Engineering, Volume 30, Number 2A.July 2005 209
550° and 600°C. Samples of Swat kaolin heated to 550°C in the present study show the collapse of kaolinite structure. The paragonite peaks remain unaffected on heating.
SEM Analysis
SEM study of the Swat kaolin of <2 µm fraction shows the platy morphology and absence of vermicular kaolin particles (Figure 5). Under SEM their platy crystals are seen to have disorderly aggregated appearance (Figure 5a). The average size and size distribution of kaolinite plates varies for samples from different deposits.
Crystal stacks are rare, and many of them are expanded and open (Figure 5). Analysis of <2 µm fraction indicate that the kaolin present is very dominant. Typical kaolin EDX spectrum characterized by nearly equal peak height of Al, Si are diagnostic [23]. EDX spectrum from two points of 5 µm clay fraction of Swat kaolin shows the equal peak height of Al and Si that confirms the kaolinite (Figure 6).
Mineral phases in the Swat kaolin deposits identified on the basis of their morphology and semiquantitative chemical composition provided by the EDS analysis are platy kaolinite and tubular halloysite (Figure 5a). The SEM micrographs (Figure 5a) show minor amount of tubular, rod-like structure of halloysite occurring between kaolinite plates. EDS analysis of rod like structure shows the major constituent of Al and Si with minor amount of Ca. Halloysite is an elongate mineral that occurs in hydrated and dehydrated forms [24, 25].
SEM study of raw material and its energy-dispersive spectrum shows the presence of calcite also encountered during thin section petrography and XRD analysis of raw and washed material. The size of the calcite grain is between 27 µm and 30 µm (Figure 5b, c, and d ).
DTA and TG Analyses
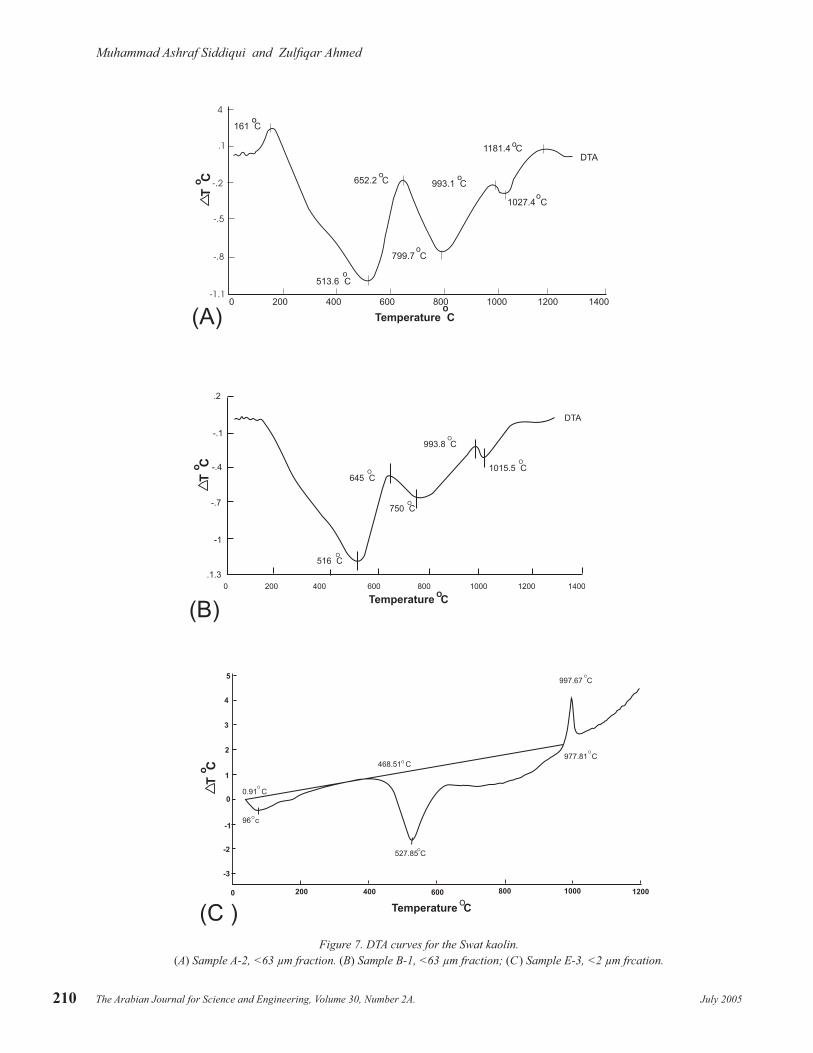
The DTA curves obtained from washed samples of the Swat kaolin (Figure 7) show almost similar behavior, and show three reactions. The first endothermic peak corresponds to absorbed water on the surface of the particles; the peak temperature lies at 96°C.
Figure 6. A typical energy-dispersive X-ray spectrum of kaolin particle from < 5 µm fraction.
Muhammad Ashraf Siddiqui and Zulfiqar Ahmed
The Arabian Journal for Science and Engineering, Volume 30, Number 2A. July 2005210
.2
-.1
-.4
-.7
-1
.1.3
0 200 400 600 800 1000 1200 1400
DTA
516 CO
645 CO
993.8 CO
1015.5 CO
750 CO
0 200 400 600 800 1000 1200 1400
Temperature CO
4
.1
-.2
-.5
-.8
-1.1
161 C
652.2 C
513.6 C
DTA
o
o
o
799.7 Co
993.1 Co
1181.4 Co
1027.4 Co
5
4
3
2
1
0
-1
-2
-3
0 200 400 600 800 1000 1200
0.91 C
96 c
468.51 C
997.67 C
977.81 C
527.85 C
O
O
O
O
O
O
Temperature CO
Temperature CO
TCo
TCo
TCo
(A)
(B)
(C )
Figure 7. DTA curves for the Swat kaolin.(A) Sample A-2, <63 µm fraction. (B) Sample B-1, <63 µm fraction; (C ) Sample E-3, <2 µm frcation.
Muhammad Ashraf Siddiqui and Zulfiqar Ahmed
The Arabian Journal for Science and Engineering, Volume 30, Number 2A.July 2005 211
3
1
-1
-3
-5
-7
-9
-11
3
1
-1
-3
-5
-7
-9
-11200 400 600 800 1000 1200 1400200 400 600 800 1000 1200 1400
-9.91
TG
-13.68
TG/%
1
-1
-3
-5
-7
-9
-11
-13
-150 200 400 600 800 1000 1200 1400
TG
10.2
10.0
9.8
9.6
9.4
9.2
9.0
TG/%
9.88
0 200 400 600 800 1000 1200TG/%
Temperature c
Temperature c
Temperature c
Weig
ht%
Weig
ht%
Weig
ht%
(A)
(B)
(C )
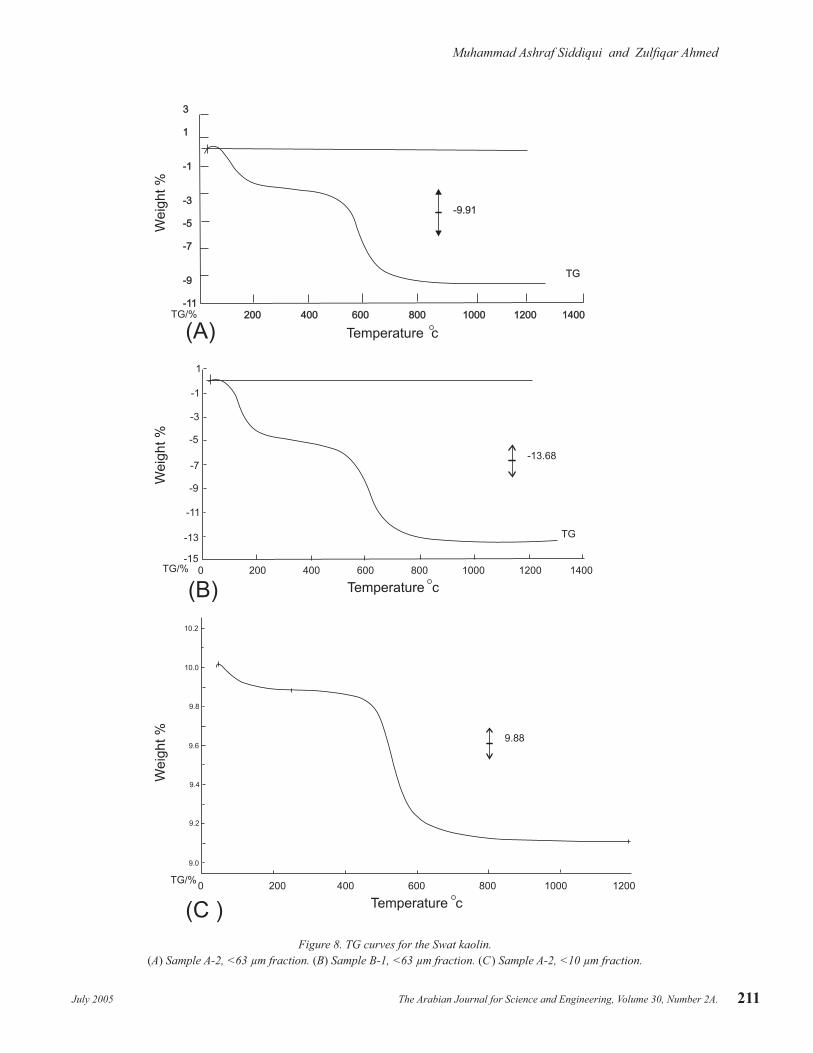
Figure 8. TG curves for the Swat kaolin.(A) Sample A-2, <63 µm fraction. (B) Sample B-1, <63 µm fraction. (C ) Sample A-2, <10 µm fraction.
Muhammad Ashraf Siddiqui and Zulfiqar Ahmed
The Arabian Journal for Science and Engineering, Volume 30, Number 2A. July 2005212
The second endothermic peak is the main peak and is associated with expulsion of the bulk of from minerals, with a corresponding weight loss and occurs in the 512°−652°C region. The third peak is exothermic at 993°C, and is associated with formation of mullite. For the <63 µm fractions, the endothermic peaks at temperature 513–516°C are broad, which indicate poor crystallinity. The exothermic peak due to mullite formation, at 993°C in the <63 µm fraction shows a kink. In the <10 µm fraction, this peak is very sharp and occurs at 998°C.
Thermogravimetric curves are exhibited in Figure 8. The weight loss due to hydroxylation at 500° to 600°C (Table 3) is used to determine the amount of kaolinite present [22]. Pure kaolinite loses approximately 14% weight [26], provided that other materials, which show weight loss in the same temperature range, are absent. The observed weight loss is expressed on a dry weight basis after multiplication by the factor 100/(100 − % absorbed H2O) [21].
The Swat kaolin minerals washed <63 µm fraction (A-2, A-5, B-1, & J-1, TAR-2) and A-2 <10 µm fraction show loss in the range of 6.14% to 9.84% (Table 3) indicate kaolin minerals constitute 44 to 71% of the samples.
Electron Microprobe Analyses
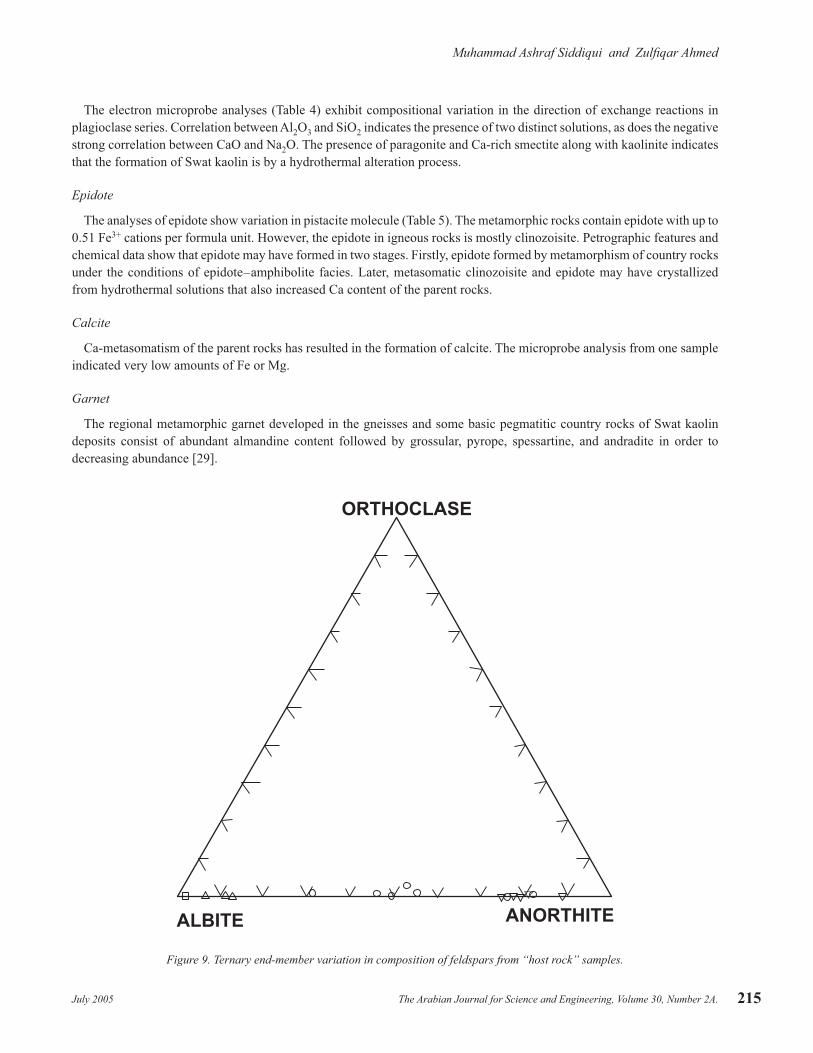
The results of the microprobe analyses are listed in Tables 4 and 5 and illustrated in Figure 9.
Kaolinite
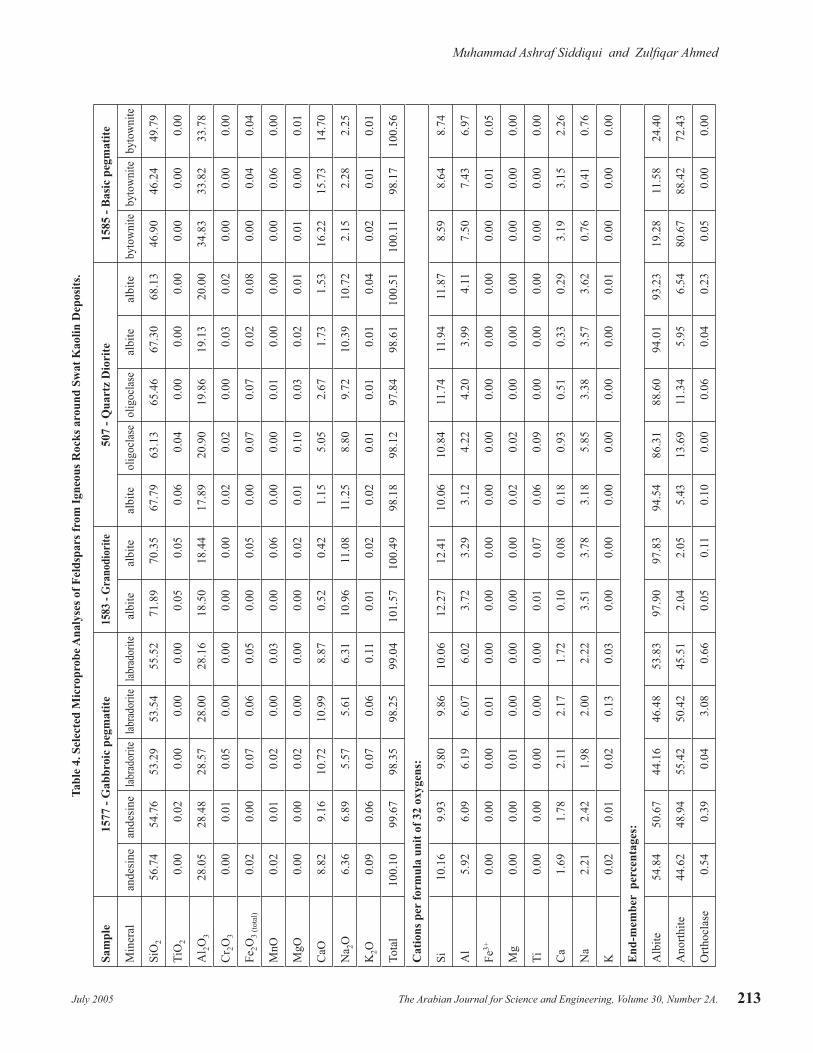
The microprobe analyses of a typical particle yielded SiO2, 44%; Al2O3, 40%; MgO, 0.5%; CaO, 0.4%; Na2O, 0.65%; K2O, 0.17%; Fe2O3 (total), 0.01%, and total oxides, 85.7%. The analysis closely approximates the pure end-member kaolinite [28].
Feldspar
Feldspars are the most abundant amongst the “host rock” minerals; and are important as precursors to the clay minerals, especially kaolinite. Amongst feldspars, potash feldspar is much less abundant compared to the plagioclase feldspars. Feldspar compositions from host rocks are plotted in Figure 9. There is a large variation in plagioclase composition between samples from different lenses. On the other hand, variation in plagioclase composition is smaller within each sample. More basic rocks carry higher anorthite contents reflective of an igneous rock suite solidified by fractional crystallisation. There are two strong correlations: between Na2O versus CaO, (Na2O + K2O) versus SiO2, and Al2O3 versus SiO2. The feldspar analyses show an ideal replacement reaction between Na2O and CaO and a strong negative correlation shows a higher degree of replacement.
Table 3. The Loss on Dehydroxylation and Kaolin Mineral Content in Swat Kaolin Samples.
Kaolin lensWeight % Loss on Dehydroxylation
Kaolin mineral %
<63µm fraction:
A-2 7.20% 51.42%
A-5 7.36% 52.57%
B-1 9.07% 64.78%
J-1 9.27% 65.21%
TAR-2 6.14% 43.85%
<10µm fraction:
A-2 9.84% 70.69%
Muhammad Ashraf Siddiqui and Zulfiqar Ahmed
The Arabian Journal for Science and Engineering, Volume 30, Number 2A.July 2005 213
Tabl
e 4.
Sel
ecte
d M
icro
prob
e Ana
lyse
s of F
elds
pars
from
Igne
ous R
ocks
aro
und
Swat
Kao
lin D
epos
its.
Sam
ple
1577
- G
abbr
oic
pegm
atite
1583
- G
rano
dior
ite50
7 - Q
uart
z D
iori
te15
85 -
Bas
ic p
egm
atite
Min
eral
ande
sine
ande
sine
labra
dorit
elab
rado
rite
labra
dorit
eal
bite
albi
teal
bite
olig
ocla
seol
igoc
lase
albi
teal
bite
byto
wni
teby
tow
nite
byto
wni
te
SiO
256
.74
54.7
653
.29
53.5
455
.52
71.8
970
.35
67.7
963
.13
65.4
667
.30
68.1
346
.90
46.2
449
.79
TiO
20.
000.
020.
000.
000.
000.
050.
050.
060.
040.
000.
000.
000.
000.
000.
00
Al 2O
328
.05
28.4
828
.57
28.0
028
.16
18.5
018
.44
17.8
920
.90
19.8
619
.13
20.0
034
.83
33.8
233
.78
Cr 2O
30.
000.
010.
050.
000.
000.
000.
000.
020.
020.
000.
030.
020.
000.
000.
00
Fe2O
3 (to
tal)
0.02
0.00
0.07
0.06
0.05
0.00
0.05
0.00
0.07
0.07
0.02
0.08
0.00
0.04
0.04
MnO
0.02
0.01
0.02
0.00
0.03
0.00
0.06
0.00
0.00
0.01
0.00
0.00
0.00
0.06
0.00
MgO
0.00
0.00
0.02
0.00
0.00
0.00
0.02
0.01
0.10
0.03
0.02
0.01
0.01
0.00
0.01
CaO
8.82
9.16
10.7
210
.99
8.87
0.52
0.42
1.15
5.05
2.67
1.73
1.53
16.2
215
.73
14.7
0
Na 2O
6.36
6.89
5.57
5.61
6.31
10.9
611
.08
11.2
58.
809.
7210
.39
10.7
22.
152.
282.
25
K2O
0.09
0.06
0.07
0.06
0.11
0.01
0.02
0.02
0.01
0.01
0.01
0.04
0.02
0.01
0.01
Tota
l10
0.10
99.6
798
.35
98.2
599
.04
101.
5710
0.49
98.1
898
.12
97.8
498
.61
100.
5110
0.11
98.1
710
0.56
Cat
ions
per
form
ula
unit
of 3
2 ox
ygen
s:
Si10
.16
9.93
9.80
9.86
10.0
612
.27
12.4
110
.06
10.8
411
.74
11.9
411
.87
8.59
8.64
8.74
Al
5.92
6.09
6.19
6.07
6.02
3.72
3.29
3.12
4.22
4.20
3.99
4.11
7.50
7.43
6.97
Fe3+
0.00
0.00
0.00
0.01
0.00
0.00
0.00
0.00
0.00
0.00
0.00
0.00
0.00
0.01
0.05
Mg
0.00
0.00
0.01
0.00
0.00
0.00
0.00
0.02
0.02
0.00
0.00
0.00
0.00
0.00
0.00
Ti0.
000.
000.
000.
000.
000.
010.
070.
060.
090.
000.
000.
000.
000.
000.
00
Ca
1.69
1.78
2.11
2.17
1.72
0.10
0.08
0.18
0.93
0.51
0.33
0.29
3.19
3.15
2.26
Na
2.21
2.42
1.98
2.00
2.22
3.51
3.78
3.18
5.85
3.38
3.57
3.62
0.76
0.41
0.76
K0.
020.
010.
020.
130.
030.
000.
000.
000.
000.
000.
000.
010.
000.
000.
00
End
-mem
ber
per
cent
ages
:
Alb
ite54
.84
50.6
744
.16
46.4
853
.83
97.9
097
.83
94.5
486
.31
88.6
094
.01
93.2
319
.28
11.5
824
.40
Ano
rthite
44.6
248
.94
55.4
250
.42
45.5
12.
042.
055.
4313
.69
11.3
45.
956.
5480
.67
88.4
272
.43
Orth
ocla
se0.
540.
390.
043.
080.
660.
050.
110.
100.
000.
060.
040.
230.
050.
000.
00
Muhammad Ashraf Siddiqui and Zulfiqar Ahmed
The Arabian Journal for Science and Engineering, Volume 30, Number 2A. July 2005214
There exists a strong negative correlation of Al2O3 versus SiO2 pointing out the presence of replacement or exchange reaction during crystallization or hydrothermal alteration. Deer et al. [27] described the alteration process in plagioclase feldspars which are more susceptible to the action of hydrothermal solutions, than the more sodic varieties.
Experimental work on the alteration of feldspar as mentioned in Deer et al. [27] shows that albite crystals suspended in an autoclave with pure water at 200°–350°C, at about 300 bars pressure, break down to colloidal-sized particles that constitute an alumina–silica gel, that subsequently forms crystals of zeolite (probably analcite). Hydrolysis equilibria involving albite and decomposition products in an aqueous chloride environment show that at temperatures higher than 400°C, and at total pressure of 1 kbar, albite is altered to paragonite plus quartz, which may later be converted to pyrophyllite. At lower temperatures; corresponding reactions are the decomposition of albite to montmorillonite and the alteration of montmorillonite to kaolinite.
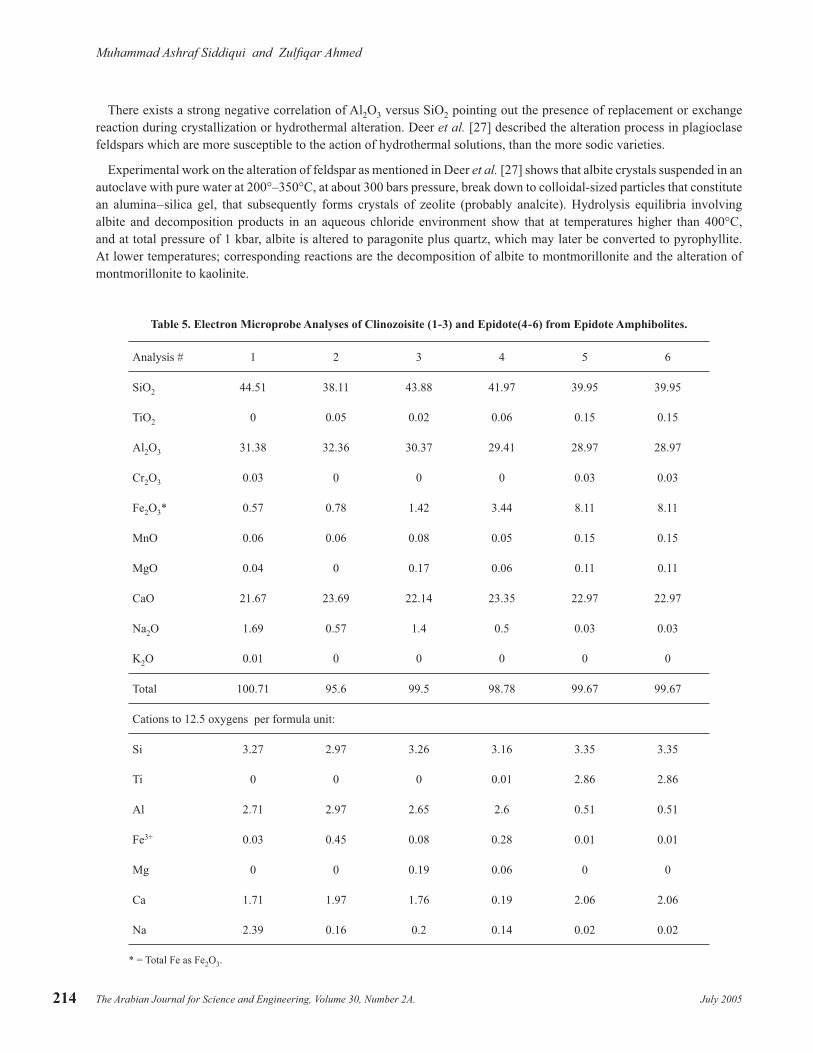
Table 5. Electron Microprobe Analyses of Clinozoisite (1-3) and Epidote(4-6) from Epidote Amphibolites.
Analysis # 1 2 3 4 5 6
SiO2 44.51 38.11 43.88 41.97 39.95 39.95
TiO2 0 0.05 0.02 0.06 0.15 0.15
Al2O3 31.38 32.36 30.37 29.41 28.97 28.97
Cr2O3 0.03 0 0 0 0.03 0.03
Fe2O3* 0.57 0.78 1.42 3.44 8.11 8.11
MnO 0.06 0.06 0.08 0.05 0.15 0.15
MgO 0.04 0 0.17 0.06 0.11 0.11
CaO 21.67 23.69 22.14 23.35 22.97 22.97
Na2O 1.69 0.57 1.4 0.5 0.03 0.03
K2O 0.01 0 0 0 0 0
Total 100.71 95.6 99.5 98.78 99.67 99.67
Cations to 12.5 oxygens per formula unit:
Si 3.27 2.97 3.26 3.16 3.35 3.35
Ti 0 0 0 0.01 2.86 2.86
Al 2.71 2.97 2.65 2.6 0.51 0.51
Fe3+ 0.03 0.45 0.08 0.28 0.01 0.01
Mg 0 0 0.19 0.06 0 0
Ca 1.71 1.97 1.76 0.19 2.06 2.06
Na 2.39 0.16 0.2 0.14 0.02 0.02
* = Total Fe as Fe2O3.
Muhammad Ashraf Siddiqui and Zulfiqar Ahmed
The Arabian Journal for Science and Engineering, Volume 30, Number 2A.July 2005 215
The electron microprobe analyses (Table 4) exhibit compositional variation in the direction of exchange reactions in plagioclase series. Correlation between Al2O3 and SiO2 indicates the presence of two distinct solutions, as does the negative strong correlation between CaO and Na2O. The presence of paragonite and Ca-rich smectite along with kaolinite indicates that the formation of Swat kaolin is by a hydrothermal alteration process.
Epidote
The analyses of epidote show variation in pistacite molecule (Table 5). The metamorphic rocks contain epidote with up to 0.51 Fe3+ cations per formula unit. However, the epidote in igneous rocks is mostly clinozoisite. Petrographic features and chemical data show that epidote may have formed in two stages. Firstly, epidote formed by metamorphism of country rocks under the conditions of epidote–amphibolite facies. Later, metasomatic clinozoisite and epidote may have crystallized from hydrothermal solutions that also increased Ca content of the parent rocks.
Calcite
Ca-metasomatism of the parent rocks has resulted in the formation of calcite. The microprobe analysis from one sample indicated very low amounts of Fe or Mg.
Garnet
The regional metamorphic garnet developed in the gneisses and some basic pegmatitic country rocks of Swat kaolin deposits consist of abundant almandine content followed by grossular, pyrope, spessartine, and andradite in order to decreasing abundance [29].
ORTHOCLASE
ALBITE ANORTHITE
Figure 9. Ternary end-member variation in composition of feldspars from “host rock” samples.
Muhammad Ashraf Siddiqui and Zulfiqar Ahmed
The Arabian Journal for Science and Engineering, Volume 30, Number 2A. July 2005216
7. DISCUSSION
Swat kaolin deposits are of primary origin as their parental rocks occur associated, and comprise feldspar-rich plutonic rocks such as quartz diorite, tonalite, granodiorite, trondhjemite, granitoids, and pegmatites. These “parent rocks” are themselves enclosed in metamorphic “country rocks” including epidote, amphibolite, and hornblendite. The major constituent phase of the “host rocks” is varyingly altered feldspar, dominated by andesine. These rocks also contain minor hornblende, epidote, sphene, and muscovite. The veinlets carrying epidote and calcite indicate solutions may have traversed through the parent rock, that contained Ca-released probably by the plagioclase reaction.
Detailed mineralogical studies performed on the raw kaolin and its washed products (<63 µm, <10 µm, <5 µm, and <2 µm fractions) resemble those of well-known commercial kaolins. The raw kaolin contains kaolinite, paragonite, clinochlore, calcian disordered albite, quartz, calcite, primary and secondary muscovite, hornblende, and accessory epidote or clinozoisite. Faruqi and Ahmed [1] reported that kaolinite in the raw samples varies from 15 to 20%, whereas in the water-washed –200 mesh (74 µm) samples, it varies from 50 to 60%. The thermal decomposition behavior of kaolinite and other clay minerals is well known and has been the subject of many investigations [e.g., 14–16].
XRD mineralogy of the <10 µm fraction is almost similar to that of the <63 µm fraction. Patterns of the <5 µm fraction show that kaolinite and paragonite are present in all the samples while albite, quartz, calcite, and clinochlore occur in some of them. This differs from the findings of Faruqi et al. [2, 3], who reported the presence of halloysite and montmorillonite clays in their 5 µm fraction.
The XRD traces of the <2 µm fractions indicate the presence of kaolinite, paragonite, and even smectite in some samples. Patterns of the <2 µm fractions heated at 550°C show that the structure of kaolinite collapses and only the peaks of paragonite remain. XRD traces of oriented mounts of the <2 µm fractions separated from the raw kaolin of the Swat deposits indicates a structural disorder in kaolinite. Since the 7Å d spacing of highly disordered kaolinite and of halloysite are similar [22], the unequivocal presence of halloysite is suggested by the SEM and TG study. However, kaolinite is the dominant mineral in both the <5 µm and <2 µm fractions.
Higher CEC of the finer fractions of the Swat kaolin than that of the coarse fractions [5] suggests probably due to the poor crystallinity of the clay crystals and the presence of such impurities as halloysite and montmorillonite.
Kyotani et al. [5] carried out their experimental work on two size-grades (–5µm and –44 µm). In their XRD mineralogy of the fine fractions, the presence of white mica (paragonite), clay minerals halloysite and montmorillonite was not obvious. Faruqui and Ahmed [1] and Faruqui et al. [2, 3] identified mica but not halloysite and montmorillonite.
The commercial use of kaolins is often evaluated by physical properties, which are, in turn, linked to mineralogy [e.g., 30, 31]. Mineral content may affect the yellowness and brightness of kaolin. Plasticity indices are lower for hydrothermal kaolins [32, 33] (Bain, 1971), like the Swat kaolin, as they possess relatively coarser particle size; and more non-clay minerals. The plasticity can be enhanced by increasing <2 µm size fraction and removing non-clay minerals. For ceramic use, shrinkage upon drying and firing depends on the clay mineral content as well, because it is clay minerals that shrink. Non-kaolinite minerals, especially smectite, influence the kaolin slurry viscosity. The Swat kaolin owes its higher viscosity to the presence of halloysite and smectite. Halloysite increases viscosity because of its rod-shaped particles that come with a higher swept volume than plates, and a tendency to tangle with each other [33].
There is only small variation in the brightness and yellowness values in the upper, middle, and lower parts of each clay lens (Table 4). It also reflects that the mineral content causing yellowness is more or less evenly spread out within each of the lenses.
The presence of mica, unaltered feldspar and Fe- and Ti-bearing minerals as minor impurities affects kaolin quality. Minor paragonite in the Swat kaolin, is unremovable, and may affect the chemistry and processing characteristics of the kaolin. The presence of feldspar may influence the rheological, brightness, and abrasion characteristics. Halloysite is considered deleterious in paper, ceramics, and some other applications due to its fibrous and rod-like habit.
Smectite expansion on hydration may affect the rheological properties and viscosity of kaolin for its use in paper-coating [34], even though it is present in small quantities. Processes have been developed to remove smectite from crude clay by
Muhammad Ashraf Siddiqui and Zulfiqar Ahmed
The Arabian Journal for Science and Engineering, Volume 30, Number 2A.July 2005 217
continuous centrifuging [35] or to modify them chemically. Alternatively, they can be converted to the non swelling form by the addition of positively charged aluminum–hydroxy species to a suspension of kaolin and then raising the pH to about 7. Under these conditions the smectite layers become attached to each other and to the kaolinite platelets [36].
8. CONCLUSIONS
The primary “host rocks” of Swat kaolin are mainly calc-alkaline quartz diorites, tonalite, granodiorite, trondhjemite, granitoids and pegmatites. The mineralogical attributes of Swat kaolin deposits, studied by microscopy, XRD, SEM, DTA, and EPMA, corroborate the presence of platy disordered kaolinite, paragonite, clinochlore, epidote, disordered calcian albite, quartz, calcite, montmorillonite, and tubular halloysite. There is a general increase of kaolin minerals in finer fractions, as shown by TG analyses that gave kaolin minerals content of 43.85 to 65.21% in <63 µm fraction and >70.69% in <10 µm fraction. Microprobe-determined compositions of plagioclase stretch over a large range, and exhibit strong negative correlations of Al2O3 versus SiO2, as well as CaO versus Na2O. This may be brought about by fractional crystallization and superimposed hydrothermal replacement. The latter being also indicated by the presence of paragonite and Ca-rich smectite along with kaolinite. For industrial use, chemical bleaching may be required in parts of the deposits to remove the yellowness caused by iron oxides.
ACKNOWLEDGEMENTS
The authors are grateful to Drs. Duane M. Moore, George R. McCormick, Yildrim Dilek, M.M. Hariri, Gabor Korvin, Akhter A Saleemi, and Imran Ahmed for reviews on a previous version of this research work. The anonymous reviewers of AJSE offered diligent comments that further improved the manuscript.
REFERENCES[1] F.A. Faruqi and M. Ahmad, “Mineralogy of Swat Kaolinite”, Pakistan Journal of Scientific & Industrial Research, 10(1) (1967),
p. 58.[2] F.A. Faruqi, M. Safdar, Azizul Haq, and M. Ahmed, “Ceramic Properties of Swat Clay; Part I — Physical Characteristics”,
Pakistan Journal of Scientific & Industrial Research, 12 (1970a), p. 466.[3] F.A. Faruqi, M. Safdar, Azizul Haq, M. Ahmed, and M. Aslam, “Ceramic Properties of Swat Clay. Part II — Chemical
Characteristics”, Pakistan Journal of Scientific and Industrial Research, 12 (1970b), p. 474.[4] A.T. Moosvi, S.M. Haque, and M. Muslim, “Geology of China Clay Deposits Shah Dheri (Swat) N.W.F.P. Pakistan”, Records of
the Geological Survey of Pakistan, 26 (1974), 28 pp. and 12 figures.[5] K. Kyotani, S. Miyaji, K. Yamado, and Y. Shigeyuki, “Report on the Feasibility Survey for the Development of Swat China Clay”,
Japan Consulting Institute, Unpublished Report for Pakistan Mineral Development Corporation, Karachi, (1967), 112 pp.[6] Z. Ahmed, M.R. Khan, and A. Rauf, “Petrology of the Taghma Area, Swat District, N.W.F.P., Pakistan”, Geological Bulletin of
the Punjab University, 15 (1978), p. 25.[7] N. Fujii, “Genesis of Clayey Deposits and Their Exploration: Focusing on Some Clay Deposits in Pakistan”, Proceedings of the
Geosciences Colloquium, Geoscience Lab., GSP., Pakistan, 12 (1995), pp. 23–40.[8] H.H. Murray, “Kaolins, Kaolins and Kaolins”, in Kaolin Genesis and Utilization. eds. H. Murray, W. Bundy, and C. Harvey.
Special Publication of the Clay Minerals Society, Colorado, 1993, vol. 1, p. 1–24.[9] N.R. Martin, S.F.A. Siddiqui, and B.H. King, “A Geological Reconnaissance of the Region between the Lower Swat and Indus
Rivers of Pakistan”, Geological Bulletin of the Punjab University, 2 (1962), p. 1.[10] R.A.K. Tahirkheli and M.Q. Jan, “Geology of Kohistan, Karakoram Himalaya, Northern Pakistan”, Geological Bulletin of the
Peshawar University, 11 (1979), p. 1.[11] M.Q. Jan, “Petrography of the Amphibolites of Swat and Kohistan”, Geological Bulletin of the Peshawar University 11 (1979),
p. 51.[12] R.W. Le Maitre (ed.), Igneous Rocks, A Classification and Glossary of Terms. Cambridge: Cambridge University Press, 2002.[13] D.M. Moore and R.C. Reynolds, Jr., X-Ray Diffraction and the Identification and Analysis of Clay Minerals, 2nd edn. Oxford:
Oxford University Press, 1997.[14] C.M. Earnest, “Thermogravimetry of Selected Clays and Clay Products”, in Compositional Analysis by Thermogravimetry.
ed. C.M. Earnest. ASTM STP 997, American Society for Testing and Materials, Philadelphia, 1988, pp. 272–287.[15] R.E. Grim, Clay Mineralogy, 1st edn. New York: Mc-Graw Hill, 1962, 384 pp.
Muhammad Ashraf Siddiqui and Zulfiqar Ahmed
The Arabian Journal for Science and Engineering, Volume 30, Number 2A. July 2005218
[16] W. Smykatz-Kloss, Differential Thermal Analyses. Berlin: Springer-Verlag, 1974. pp. 64−87.[17] H.H. Murray and S.C. Lyons, "Correlation of Paper Coating Quality with Degree of Crystal Perfection of Kaolinite", 4th National
Conference on Clays and Clay Minerals, National Academy of Sciences, National Research Council Publication, 45 (1956), pp. 31–40.
[18] D.N. Hinckley, “Variability in ‘Crystallinity’ Values among the Kaolin Deposits of the Coastal Plain of Georgia and South Carolina”, Clays and Clay Minerals, 11 (1963), pp. 229–235.
[19] A. Plancon, R.F. Giese, R. Snyder, V.A. Drits, and A.S. Bookin, “Stacking Faults in the Kaolin-Group Minerals: Defect Structures of Kaolinite”, Clays and Clay Minerals, 37 (1989), pp. 203–210.
[20] D.E. Highley, China Clay Mineral Dossier, 26 (1984). British Geol. Surv., U.K.[21] D.J. Morgen, “Clay Minerals Properties and Uses, CEC/ASEAN Training Course on Assessment Procedures for Clays and Ceramic
Materials, 1990. IPOH, Malaysia.[22] G.W. Brindley and G. Brown, Crystal Structures of Clay Minerals and their X-ray Identification. London: Mineralogical Society,
Monograph 5, 1980, 495 pp.[23] J.E. Wellton, SEM Petrology Atlas. Methods in Exploration Series. Tulsa, Oklahoma: The American Associate of Petroleum
Geologists, 1950.[24] Millot, Geology of the Clays, Translated by W.R. Forrand and H. Pacquet. New York: Springer-Verlag, 1970, 429 pp.[25] H.H. Murray, “Traditional and New Applications for Kaolin, Smectite, and Palygorskite: A General Overview”, Applied Clay
Science, 17 (2000), pp. 207–221.[26] W.D. Keller, “Kaolin — A Most Diverse Rock in Genesis, Texture, Physical Properties, and Uses”, Geological Society of America
Bulletin, 93 (1982), pp. 27–36.[27] W.A. Deer, R. A. Howie, and J. Zussman, An Introduction to the Rock Forming Minerals, 2nd edn. London: Longman Scientific &
Technical, 1992.[28] A.C.D. Newman and G. Brown, “The Chemical Constitution of Clays”, in: Chemistry of Clays and Clay Minerals. ed. A.C.D.
Newman. Mineralogical Society of London Monograph 6, 1987, pp. 1–128.[29] Z. Ahmed and S. Ahmad, “Garnets from the Upper Swat Hornblendic Group, Swat District, Pakistan. Part I, Garnets from Gneisses
and Pegmatites”, Mineralogical Magazine, 40 (1975), pp. 53–58.[30] H.H. Murray, “Diagonostic Test for Evaluation of Kaolin Physical Properties”, Acta Mineralogica-Petrograpica, XXIV (1980),
pp 67–76.[31] H.H. Murray, “Clays in Industry”, in: A Clay Odyssey. ed. E. A. Dominguez, G. R. Mas, and F. Cravero. Amsterdam: Elsevier
Science Publishers, 2003, p. 3–14.[32] J.A. Bain, “A Plasticity Chart as an Aid to Identification and Assessment of Industrial Minerals”, Clay Minerals, 9 (1971),
p.1–17.[33] A.J. Bloodworth, D.E. Highley, and C.J. Mitchell, “Kaolin”, British Geological Survey Technical Report WG/93/1, 1993, 76 pp.[34] M.S. Prasad, K.J. Reid, and H.H. Murray, “Kaolin: Processing, Properties, and Applications”, Applied Clay Science, 6(2) (1991),
pp. 87–119.[35] R.E. Bronciner, 1971, U.K. Patent 1,221,929.[36] R.W. Adams, J.I. Bidwell, and W.B. Jepson, 1977, U.K. Patent 1,481,118.
Paper Received 25 June 2003; Revised 3 March 2004; Accepted 3 April 2004.