mimo propagation channel characteristics in tunnels
TRANSCRIPT
MIMO propagation channel characteristics in
tunnelsYann Cocheril*, Pierre Combeaut, Marion Berbineau* and Yannis Poussett
*INRETS-LEOST - 20 rue Elis&e Reclus, BP 317 - 59666 Villeneuve d'Ascq Cedex - FranceEmail: {yann.cocheril, marion.berbineau}@inrets.fr
tSIC Lab. - Bat. SP2MI, Teleport 2 - BP 30179 - 86962 Futuroscope Chasseneuil Cedex - FranceEmail : {combeau, pousset}@sic.sp2mi.univ-poitiers.fr
Abstract-This paper deals with MIMO channels modeling intunnels. A full 3D ray-tracing based simulator is used to simulatethe MIMO channel in a 1-track tunnel for various antennas con-figurations at the transmitter and at the receiver. A parametricstudy is described. The main purpose consists in determiningcorrelation based MIMO channel statistical models and evalu-ating their performances in an empty tunnel. Channel modelsobtained with the Kronecker and the Weichselberger modelsare compared in terms of envelope of the matrix coefficientsdistribution and mean channel capacity. The best configurationswhich model correctly the channel while maximizing its capacitywill be given.
I. INTRODUCTION
Guided transport operators rely more and more on newtechnologies of communication and information, which arethe keys to optimize exploitation and maintenance costs, toenhance the friendliness, comfort and security feeling of publictransport. Today, a lot of driverless underground systems existall over the world. For some of them, ground-to-train wirelesscommunication systems carry control and command data usingfree propagation in tunnels. In addition, surveillance andpre-diagnostic systems required train-to-ground transmissionsperiodically or on demand [1]. In this context the wirelesssystem must be able to maximize data rate or robustnesswhile avoiding the increase in transmitting power and/or thetransmission bandwidth.Among the solutions able to answer the needs for robust
and high-data rate communications, the MIMO (Multiple-Input- Multiple-Output) systems appeared a few years ago.They rely on the joint use of antenna networks at bothtransmitting and receiving sides. In a multipath environment,they make possible an increase of data rate or robustnesswithout additional power or bandwidth consumption [2]. Whenusing such a system in a multipath environment, where all raysare uncorrelated, it is possible to identify several independentpropagation channels. The number of independent channelscorresponds to the rank of the channel matrix H [3], [4].The capacity of the channel depends on this rank. Withspatial correlation or "key hole" effect in the channel, theH matrix will be degenerated [5], [6]. Previous works haveshown the interest and efficiency of such a system in transportenvironments [7]. Nevertheless, in a tunnel environment whenthere is no train, the number of scatters is generally low aswell as the spread of the angle of arrival of the rays due to
the guided effect. In this context the use of MIMO systemsand their efficiency is not obvious.
Free propagation in the tunnel is possible when the trans-verse dimensions of a tunnel are large compared to thewavelength. In this case, the tunnel can be compared to alossy oversized waveguide. In this case, the modal theory [8]shows that the only modes able to propagate are hybrids modesdenoted EHmn where m and n stand for the mode order. Ithas been shown recently that the concept of spatial diversitymust be replaced by the concept of modal diversity [9].
In this paper, we investigate the 4 x 4 MIMO channel prop-erties for several antennas configurations in a tunnel and on thetrains. A full 3D ray-tracing based wave propagation simulator[10] is used to compute the deterministic wide band channelmatrix H. Because of its huge size, and in the objective to havea simple integration in a communication system like WiFi, westudy the interest to model the tunnel behavior in a global way,using the Kronecker [11] and the Weichselberger [12] MIMOmodels. This paper presents a comparative study between thesespecific models and the deterministic simulation results interms of coefficients distributions and capacity. The analysishighlights the best configuration obtained that maximizes thechannel capacity in a tunnel.
This paper is structured as follows. We first introduce inSection II the configurations and the different processing onthe simulated channel matrices H such as normalization andmodeling. Section III presents a detailed comparison betweenthe chosen models and the simulation results in terms ofenvelope of the matrix coefficient distributions and averagechannel capacity. In Section IV, the influence of the antennasconfigurations in a tunnel and on the trains on the channelcapacity is analyzed to determine the optimal configurationsthat maximize the channel capacity. We will then concludeand give the perspectives of these works.
II. MIMO CHANNEL SIMULATIONS
Firstly, we present all the antennas configurations in thetunnel and on the trains we simulated for the study presentedin this paper, thanks to a full 3D ray-tracing based wavepropagation software [10]. It computes all the possible pathsfollowed by an electromagnetic wave between a receiverand a transmitter, taking into account the reflection and thediffraction phenomena. Assuming electromagnetic parameters
1-4244-11 78-5/07/$25.00 ©2007 IEEE.

y #4.5 -
0d d±id 120 500
(a) side view
x3.0 4.5 y
(b) front view
Fig. 1. Shapes and dimensions of the studied tunnel and train
TABLE IELECTRICAL PROPERTIES USED IN THE CHANNEL SIMULATIONS FOR THE
TUNNEL AND TRAINS MATERIALS
relative permittivity E.
conductivity (S.m- 1)
tunnel
0
train10
0.012108
(relative permittivity and conductivity) for the objects con-sidered in the scene, the output of the software is a wideband impulse response (IR) for each couple of elements ofthe receiver and the transmitter antennas.
These IR are used to model the channel using existingMIMO channel models such as the Kronecker [11] and theWeichselberger [12] models. We will detail the differentcomputation stages to obtain the models.
A. Description of the tested configurationsSeveral realistic configurations related to railway traffic in
tunnels are simulated, varying the position of the trains in atunnel and the orientation of the transmitter and the receiverantennas. The tunnel dimensions for a unique track are asfollows: 4.5 x 4.5 x 500 meters (width x height x length), whilethe trains measure 3 x 4 x 120 meters. The Fig. 1 illustratesthis configuration. In addition, the TABLE I gives the relativepermittivity and the conductivity of the materials used in the3D ray-tracing model to obtain the channel simulations for thetunnel and the trains.
Both transmitter and receiver antennas are composed withfour elements disposed at various places as indicated in Fig. 2.The four transmitters are fixed on the tunnel roof and each el-ement is 1 meter spaced from the others. Three configurationsare tested (TP1, TP2 and TP3), varying the angle between theorientation of the transmitter axis and the main direction ofthe tunnel. On the contrary, the four receivers are fixed on theroof (65 cm separation between the elements) or on the backwindshield of the trains (elements are distributed in squareseparated by 1.30 m horizontally and 65 cm vertically). Theobjective is to study the influence of the axis orientation of thefour receivers according to the axis of the tunnel and also theinterest of using the vertical dimension to place the receivingor transmitting elements.
IR are computed for each couple of antennas from thereceiver and the transmitter on all the tunnel length (from 0to 500 m with a sampling computation distance equal to 0.5m).
0
y #
tunnel <train
TX
-
x
(a) TP1- top view
h tunnel L
0 TX
0-
x
(c) TP2 - top view
Y *
0
tunnel
TX
x
(e) TP3 - top view
0
tunnelttain
RX
x X
(b) RP1- top view
tunnel
0 x
(d) RP2 - top view
y
(f) RP3 - front view
Fig. 2. Confi gurations of the transmitter antennas in the tunnel (TPx) andthe receiver antennas on the trains (RPx)
B. Channel modelling
The development and the evaluation of new transmissionsystems need faithful channel models. A lot of models exist inthe literature, and they can be classified in two main categories[13].
"Physical models" are often based on an accurate geomet-rical description of the propagation environment. They canbe deterministic, when they use channel parameters deducedfrom measurement campaigns or simulated IR (with a 3Dray-tracing based simulator for example) [14]. In this case,the accuracy is high, but the cost in materials, human orcomputing resources too. To cancel the previous drawback,researchers have developed many statistical physical models,based on the characterization of the scatters present in thepropagation environment [15]. The most used for exampleare the one-ring and two-ring models [5] and the distributedscatters model [16]. The major drawback of these modelsremains the determination of the scatters distributions in theenvironment.
Y * Y *
"Analytical models" or "stochastic models" are independentof the environment description. They are based on the statis-tical properties of the channel such as the correlation com-puted from measurements or simulations. There are differentpossibilities to take into account the correlation between thearrays elements at the receiver and at the transmitter but alsoin the channel. Several stochastic models were compared in[13]. One of the simplest is the Kronecker model [1 1], whilethe coupling between the arrays elements can be taken intoaccount using the Weichselberger model [12].
The two models are based on the following decompositionof the channel matrix H, composed with complex coefficients,that can be written as follows:
H = RH G (1)
where RH and G are the correlation or the covariance matrixof the channel and a Rayleigh matrix respectively.
1) Kronecker model: The Kronecker model assumes acorrelation at the transmitter independent from the correlationat the receiver. So the total correlation of the channel RH canbe expressed as the Kronecker product ( ) of the correlationmatrices at the transmitter RTX and at the receiver RRX:
RH = RTX $ RRX (2)Thus, using (2) in (1), we obtain the following relation for
the Kronecker model:
TABLE IIMEAN m AND STANDARD DEVIATION U7 VALUES OF THE DELAY SPREAD
FOR ALL THE POSSIBLE ANTENNAS CONFIGURATIONS IN NS
\RXTX\
TP1TP2TP3
RP1m 7 (10-2)
2.842.822.82
1.342.552.89
RP2m 7 (10-2)
2.852.822.83
1.312.451.69
RP3m 7 (10-2)
2.842.822.83
2.102.505.14
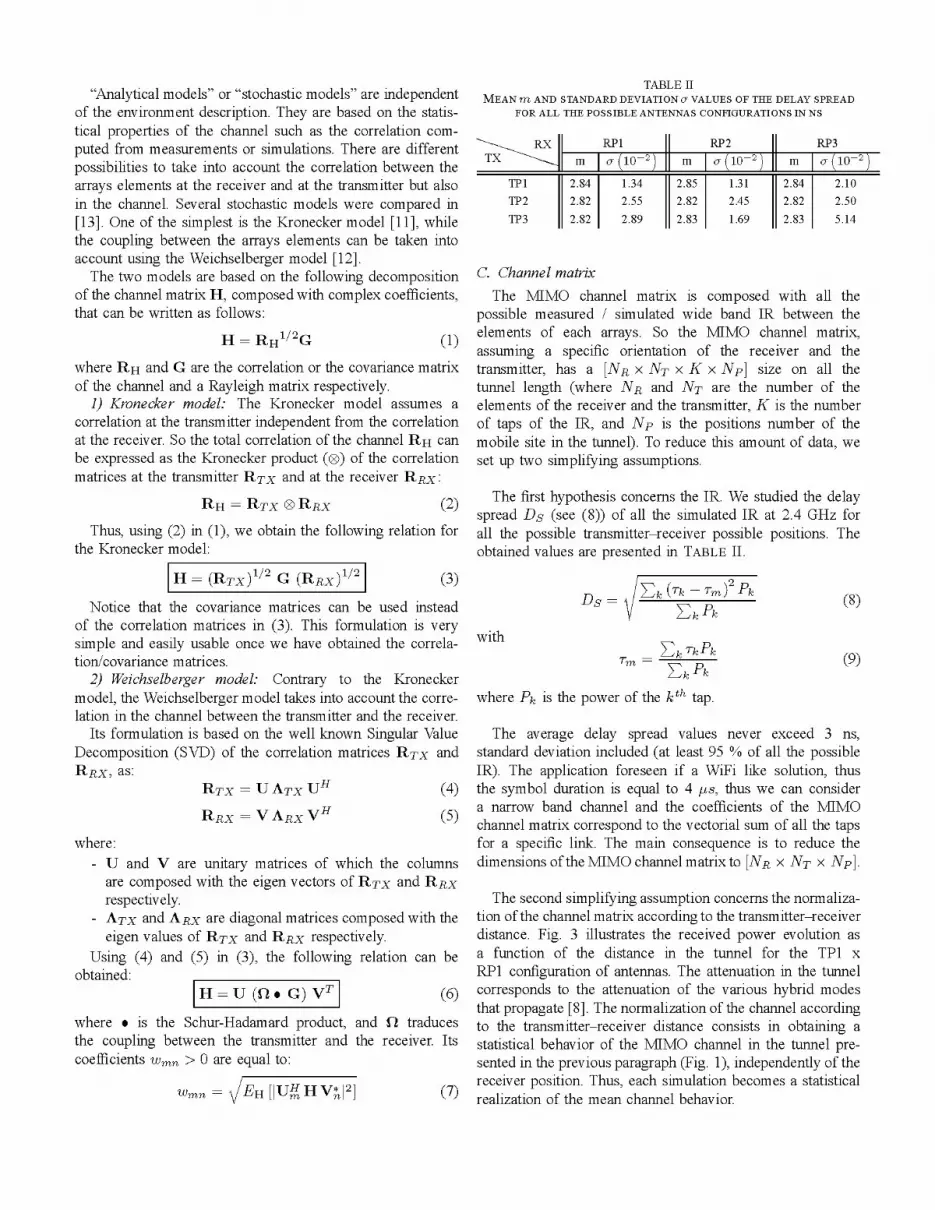
C. Channel matrixThe MIMO channel matrix is composed with all the
possible measured / simulated wide band IR between theelements of each arrays. So the MIMO channel matrix,assuming a specific orientation of the receiver and thetransmitter, has a [NR x NT x K x Np] size on all thetunnel length (where NR and NT are the number of theelements of the receiver and the transmitter, K is the numberof taps of the IR, and NP is the positions number of themobile site in the tunnel). To reduce this amount of data, weset up two simplifying assumptions.
The first hypothesis concerns the IR. We studied the delayspread DS (see (8)) of all the simulated IR at 2.4 GHz forall the possible transmitter-receiver possible positions. Theobtained values are presented in TABLE II.
H = (RTX) 1/2 G (RRX) 2
Notice that the covariance matrices can be used insteadof the correlation matrices in (3). This formulation is very
simple and easily usable once we have obtained the correla-tion/covariance matrices.
2) Weichselberger model: Contrary to the Kroneckermodel, the Weichselberger model takes into account the corre-
lation in the channel between the transmitter and the receiver.Its formulation is based on the well known Singular Value
Decomposition (SVD) of the correlation matrices RTX andRRX, as:
RTX = U ATX UH (4)
RRX = V ARX VH (5)
where:- U and V are unitary matrices of which the columns
are composed with the eigen vectors of RTX and RRXrespectively.
- ATX and ARX are diagonal matrices composed with the
eigen values of RTX and RRX respectively.Using (4) and (5) in (3), the following relation can be
obtained:H =U (Q G)VT
where * is the Schur-Hadamard product, z
the coupling between the transmitter and tcoefficients Wmn > 0 are equal to:
Wmn nEH[UfHV ]
and Q traducesthe receiver. Its
ZkTk Tm)2PkDs=ZkPk
withEkTkPk
(8)
(9)
where Pk is the power of the kth tap.
The average delay spread values never exceed 3 ns,
standard deviation included (at least 95 of all the possibleIR). The application foreseen if a WiFi like solution, thusthe symbol duration is equal to 4 Us, thus we can considera narrow band channel and the coefficients of the MIMOchannel matrix correspond to the vectorial sum of all the tapsfor a specific link. The main consequence is to reduce thedimensions ofthe MIMO channel matrix to [NR x NT x Np].
The second simplifying assumption concerns the normaliza-tion of the channel matrix according to the transmitter-receiverdistance. Fig. 3 illustrates the received power evolution as
a function of the distance in the tunnel for the TP1 x
RP1 configuration of antennas. The attenuation in the tunnelcorresponds to the attenuation of the various hybrid modesthat propagate [8]. The normalization of the channel accordingto the transmitter-receiver distance consists in obtaining a
statistical behavior of the MIMO channel in the tunnel pre-
sented in the previous paragraph (Fig. 1), independently of thereceiver position. Thus, each simulation becomes a statisticalrealization of the mean channel behavior.
(3)
/ /1[ 11Tr 11T

(Di
0.&-
0.4i
02~
0
-simiulatiQl-Rayleighl
KtroneckQerWeichselber
O06
0.4 /
0.2. -RayleighlRf ltt~~~~~roneckQer
WeichselbergernPs80 -1z0) -60 0 60 10 180o f(.
(a) CDF of the coeffi cients envelope (b) CDF of the coeffi cients phase
100 200 300 400 d (X3
Fig. 3. Attenuation profi le along the tunnel for the specifi c confi gurationsTP 1 x RP 1 and the fi rst elements h1 1 of each arrays
Fig. 4. Comparison between models and simulations - CDF of the modeledand simulated channel matrices for the TP1 x RP1 confi guration
EQAI (10RayleighKEronecker00We;chselbe
Two major methods exist to normalize the MIMO channelaccording to the distance. The first one consists in normalizingeach realization of the channel matrix by its mean power,in order to have a constant received power independently tothe distance. This solution does not take into account thedeep fading smoothing the variations observed in Fig. 3. Thesecond solution consists in cancelling the effect of the distancedividing each realization of the channel matrix by its LOSpower. In this case, the SNR (Signal Noise Ratio) is constantover all the tunnel length.
Finally, we consider the last solution. Thecorrelation/covariance matrices are averaged over all therealizations of the MIMO channel matrix, reducing the sizeto [NR X NT].
As suggested in [9], it could have been possible to normalizeas a function of the distance in the tunnel to take intoaccount the different behaviors due to the variations of thenumber of hybrid modes that propagate in the tunnel. Thiswill correspond to a next step in our analysis.
III. MODELING RESULTS
In this paragraph, we compare the two models (Kroneckerand Weichselberger) in terms of the envelope and the phasedistributions of the matrix coefficients and the mean channelcapacity. The different antennas configurations are computedto find the configuration that gives the lowest correlationdegree.
A. Coefficients distributionThe envelope and phase distributions of the channel ma-
trix coefficients are considered. Distributions using simulatedchannel matrices are compared to the Kronecker and Weich-selberger models, and also to the Rayleigh model, used asa reference. The Rayleigh model is a matrix composed ofcoefficients which follow a Rayleigh distribution as indicatedby (10):
(10)
where the coefficients of A and B follow a standard normaldistribution N(O, 1).
10
xl
-3Raylei3glI
2X;! 3x2 lx0 20 30 IxI72xl 3xl lx2 2X;! 3x2 lx0 20 3x0
(a) MSE of the coeffi cients envelope (b) MSE of the coeffi cients phase
Fig. 5. Comparison between models and simulations - MSE between theCDF of the modeled and simulated channel matrices for all the antennasconfi gurations
For each transmitter-receiver antennas configuration, thecumulative density function (CDF) of the envelope and ofthe phase of the simulated / modeled matrix coefficients areplotted. Fig. 4 gives an example of the results obtained for thespecific TP1 x RP1 configuration.
It is not possible to differentiate one model from another justusing the curves given in Fig. 4. To know if this behavior canbe generalized to all the possible antennas configurations, wecomputed the mean square error (MSE) between the modeledand the simulated results. The output are presented in Fig. 5.
Fig. 5(b) shows that the phase has not a significant influenceon the choice of a model for the studied tunnel and antennasconfigurations. Indeed, the MSE between all the models andthe simulated results for a given antennas configuration arealmost equivalent. The MSE results of the envelope CDFplotted in (Fig. 5(a)) bring more information: the Kroneckermodel gives a better agreement with the simulated results ingeneral. Indeed, the MSE values are the smallest with thismodel, but not significantly to discard other ones. In order torefine this choice of the Kronecker model, we compared themean channel capacity evolution versus SNR.
B. Channel capacityThe mean channel capacity Cmoy is defined by the follow-
ing expression:
Cmoy = E [log2 {det (IN, + pH REE HH) }] (1 1)
where REE is the covariance matrix at the transmitter and pis the SNR.
Att (d) TPl x RP1 (h )H1
-501
-60
-70
-80
-901
CDF
-100.
-1100
EQAI (10
Hrayleigh A + jB

Capacity (bht Uzl-simulation
correlatedKronecker
2 Weichselbergeruncorrelated211
15-i0
0 5 10 15 20 25sNR, (
Fig. 6. Comparison between models and simulations - mean capacities ofthe modeled and simulated channel for the TP1 x RP1 confi guration
We compared the Kronecker and the Weichselberger modelsto the simulated results and to a totally correlated channelHcorrelated expressed with relation (12) and an uncorrelatedchannel Huncorrelated obtained with relation (13). These twospecific channels give the minimal and maximal performanceslimit reachable with a 4 x 4 MIMO system.
Hcorrelated I vec (G) (12)
Huncorrelated J vec (G) (13)
where I, J and G are respectively the identity matrix, a matrixconsisting of all 1, and the Rayleigh matrix.As an example, Fig. 6 presents the mean MIMO channel
capacities as a function of the SNR for all the modelledand simulated results in the TP1 x RP1 configuration. Inthis case, the Kronecker model gives better results than theWeichselberger comparing to the simulated results. Moreover,we can notice that the mean channel capacity is far to beoptimal compared to the uncorrelated channel. The reasoncomes from the particular alignment of the arrays in the axisof the tunnel. Indeed, this specific alignment induce a highcorrelation level in the channel, so that the transmitted signalsseem to come from a unique element of the transmitter arrayand enforce the guided effect of the tunnel.
Then, we compute the MSE errors between the meanchannel capacity obtained with the four previous models (Kro-necker, Weichselberger, totally correlated and uncorrelated)and the simulated mean channel capacity. The correspondingcurves according to the antennas configurations are drawnin Fig. 7. This figure shows that the Kronecker model iswell suitable to model the channel because the MSE aresmall for all the antennas configurations comparing to theWeichselberger model which gives good results only in fourcases (TP2 x RP1, TP3 x RP1, TP2 x RP2 and TP3 xRP2). Nevertheless, the Weichselberger model leads to a greatdivergence of mean channel results in some cases, like TP1 xRP2 and TP1 x RP3.
It is very important to notice that the TP2 x RP2 andTP3 x RP2 configurations lead to a good modeling of thesimulated channel capacity using both the Kronecker and
EQM
10
.I01 correlated
KroneckerWeichselberger
-1 uncorrelatedIxI 2x1 3x1 1x2 2x2 3x2 ix, 2x3 3x3
Fig. 7. Comparison between models and simulations - MSE of the meanchannel capacity between the models and simulated results for all the antennasconfi gurations
the Weichselberger models. Moreover, with these specificconfigurations, the MSE between the uncorrelated channelresults and the simulated ones is the smaller too. It means that,in these specific antennas configurations, the mean channelcapacity is at the same time maximized and well modeled.
C. Preliminary conclusionsFor a specific antennas configuration, this study has shown
close results between the simulated and the modeled resultsusing the both Kronecker and Weichselberger models, makingthe choice between them difficult. The main difference con-cerns the dependence between the correlations at the receiverand at the transmitter, taken into account in the Weichselbergermodel thanks to the Q coupling matrix, contrary to theKronecker model. It's very interesting to study the validityof this assumption.
In this context, we compute the mean error over all theantennas configurations between the channel correlation ma-trix RH and its decomposition using the Kronecker productRRX X RTXThe mean error over all the antennas configurations is equal
to 34 %0, so we have to use the Kronecker model carefully.
IV. OPTIMAL CONFIGURATIONS CHOICE
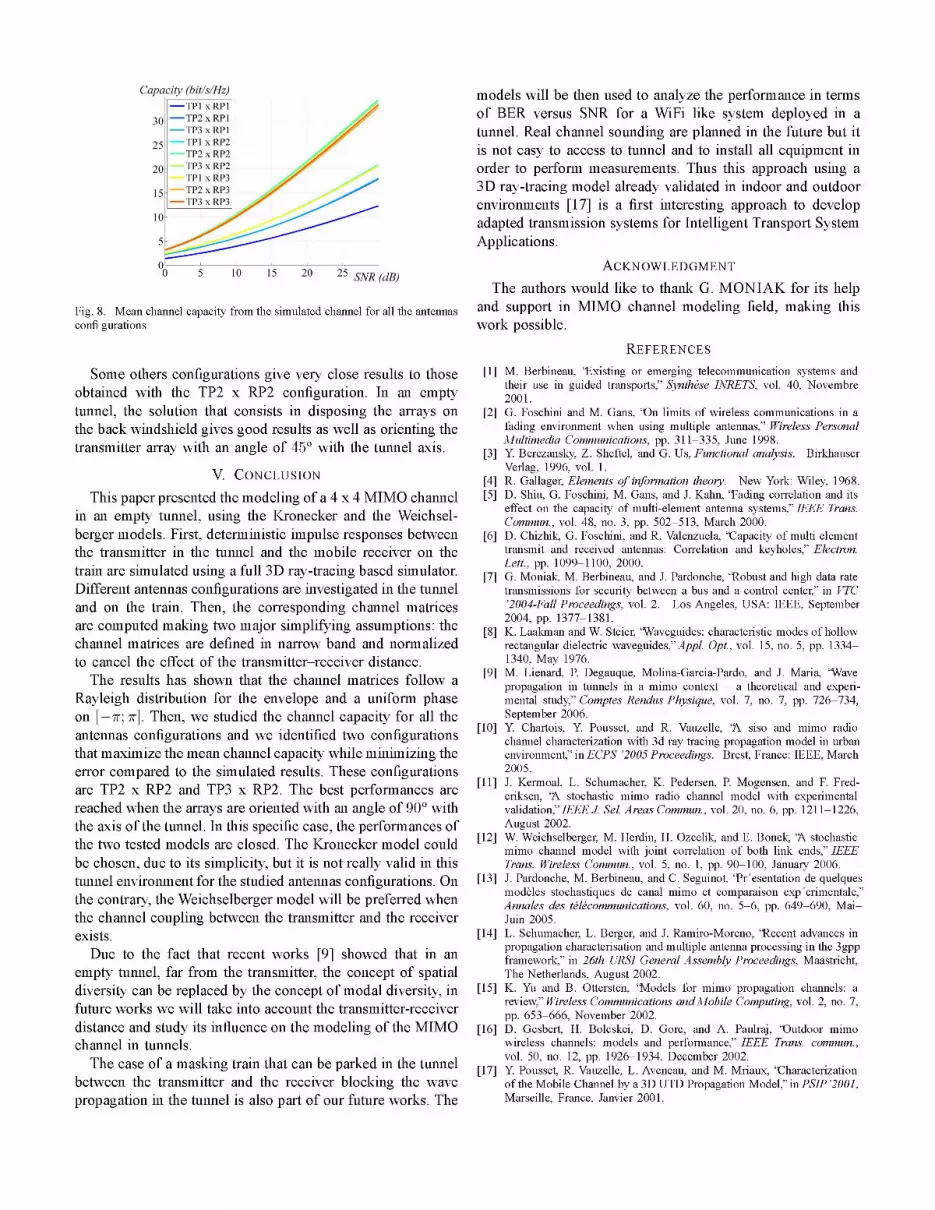
In the previous paragraph, we identified two configurationswhich lead to good results maximizing the mean channelcapacity: TP2 x RP2 and TP3 x RP2. This analysis is con-firmed by the observation of Fig. 8. This figure presents themean channel capacity obtained with the simulated channel forall the antennas configurations. We can notice that the meanchannel capacity is minimal when the antennas are oriented inthe axis of the tunnel in the tunnel and/or on the roof of thetrain corresponding to a high channel correlation.
The mean channel capacity increases with the angle of thearrays with the tunnel axis. The mean channel capacity isdoubled when the orientation with the tunnel axis of the arraysin the tunnel and on the trains changed from 0° (TP1 x RP1configuration) to 900 (TP2 x RP2 configuration). Notice thatthis last configuration gives the best mean channel capacityresults.
-.1
Capacity (bht s/Uz)TP \ RPITP2 x RPITP3 x RPI
25 TPI x RP2
20 TP2.x RP215 IP XRP3
.-1Px RP320'
0L0 5 10 15 20 25 sNR(d
Fig. 8. Mean channel capacity from the simulated channel for all the antennasconfi gurations
Some others configurations give very close results to thoseobtained with the TP2 x RP2 configuration. In an emptytunnel, the solution that consists in disposing the arrays on
the back windshield gives good results as well as orienting thetransmitter array with an angle of 450 with the tunnel axis.
V. CONCLUSION
This paper presented the modeling of a 4 x 4 MIMO channelin an empty tunnel, using the Kronecker and the Weichsel-berger models. First, deterministic impulse responses betweenthe transmitter in the tunnel and the mobile receiver on thetrain are simulated using a full 3D ray-tracing based simulator.Different antennas configurations are investigated in the tunneland on the train. Then, the corresponding channel matricesare computed making two major simplifying assumptions: thechannel matrices are defined in narrow band and normalizedto cancel the effect of the transmitter-receiver distance.
The results has shown that the channel matrices follow a
Rayleigh distribution for the envelope and a uniform phaseon [- ; w]. Then, we studied the channel capacity for all theantennas configurations and we identified two configurationsthat maximize the mean channel capacity while minimizing theerror compared to the simulated results. These configurationsare TP2 x RP2 and TP3 x RP2. The best performances are
reached when the arrays are oriented with an angle of 900 withthe axis of the tunnel. In this specific case, the performances ofthe two tested models are closed. The Kronecker model couldbe chosen, due to its simplicity, but it is not really valid in thistunnel environment for the studied antennas configurations. Onthe contrary, the Weichselberger model will be preferred whenthe channel coupling between the transmitter and the receiverexists.Due to the fact that recent works [9] showed that in an
empty tunnel, far from the transmitter, the concept of spatialdiversity can be replaced by the concept of modal diversity, infuture works we will take into account the transmitter-receiverdistance and study its influence on the modeling of the MIMOchannel in tunnels.
The case of a masking train that can be parked in the tunnelbetween the transmitter and the receiver blocking the wave
propagation in the tunnel is also part of our future works. The
models will be then used to analyze the performance in termsof BER versus SNR for a WiFi like system deployed in atunnel. Real channel sounding are planned in the future but itis not easy to access to tunnel and to install all equipment inorder to perform measurements. Thus this approach using a3D ray-tracing model already validated in indoor and outdoorenvironments [17] is a first interesting approach to developadapted transmission systems for Intelligent Transport SystemApplications.
ACKNOWLEDGMENTThe authors would like to thank G. MONIAK for its help
and support in MIMO channel modeling field, making thiswork possible.
REFERENCES
[1] M. Berbineau, 'Existing or emerging telecommunication systems andtheir use in guided transports," Synthese INRETS, vol. 40, Novembre2001.
[2] G. Foschini and M. Gans, 'On limits of wireless communications in afading environment when using multiple antennas," Wireless PersonalMultimedia Communications, pp. 311-335, June 1998.
[3] Y Berezansky, Z. Sheftel, and G. Us, Functional analysis. BirkhauserVerlag, 1996, vol. 1.
[4] R. Gallager, Elements of information theory. New York: Wiley, 1968.[5] D. Shiu, G. Foschini, M. Gans, and J. Kahn, 'Fading correlation and its
effect on the capacity of multi-element antenna systems," IEEE Trans.Commun., vol. 48, no. 3, pp. 502-513, March 2000.
[6] D. Chizhik, G. Foschini, and R. Valenzuela, 'Capacity of multi elementtransmit and received antennas: Correlation and keyholes," Electron.Lett., pp. 1099-1100, 2000.
[7] G. Moniak, M. Berbineau, and J. Pardonche, 'Robust and high data ratetransmissions for security between a bus and a control center," in VTC'2004-Fall Proceedings, vol. 2. Los Angeles, USA: IEEE, September2004, pp. 1377-1381.
[8] K. Laakman and W. Steier, 'Waveguides: characteristic modes of hollowrectangular dielectric waveguides,"Appl. Opt., vol. 15, no. 5, pp. 1334-1340, May 1976.
[9] M. Lienard, P. Degauque, Molina-Garcia-Pardo, and J. Maria, 'Wavepropagation in tunnels in a mimo context - a theoretical and experi-mental study," Comptes Rendus Physique, vol. 7, no. 7, pp. 726-734,September 2006.
[10] Y Chartois, Y Pousset, and R. Vauzelle, 'A siso and mimo radiochannel characterization with 3d ray tracing propagation model in urbanenvironment," in ECPS '2005 Proceedings. Brest, France: IEEE, March2005.
[11] J. Kermoal, L. Schumacher, K. Pedersen, P. Mogensen, and F. Fred-eriksen, 'A stochastic mimo radio channel model with experimentalvalidation," IEEE J Sel. Areas Commun., vol. 20, no. 6, pp. 1211-1226,August 2002.
[12] W. Weichselberger, M. Herdin, H. Ozcelik, and E. Bonek, 'A stochasticmimo channel model with joint correlation of both link ends," IEEETrans. Wireless Commun., vol. 5, no. 1, pp. 90-100, January 2006.
[13] J. Pardonche, M. Berbineau, and C. Seguinot, 'Pr'esentation de quelquesmodeles stochastiques de canal mimo et comparaison exp'erimentale,"Annales des tilicommunications, vol. 60, no. 5-6, pp. 649-690, Mai-Juin 2005.
[14] L. Schumacher, L. Berger, and J. Ramiro-Moreno, 'Recent advances inpropagation characterisation and multiple antenna processing in the 3gppframework," in 26th URSI General Assembly Proceedings, Maastricht,The Netherlands, August 2002.
[15] K. Yu and B. Ottersten, 'Models for mimo propagation channels: areview," Wireless Communications and Mobile Computing, vol. 2, no. 7,pp. 653-666, November 2002.
[16] D. Gesbert, H. Bolcskei, D. Gore, and A. Paulraj, 'Outdoor mimowireless channels: models and performance," IEEE Trans. commun.,vol. 50, no. 12, pp. 1926-1934, December 2002.
[17] Y Pousset, R. Vauzelle, L. Aveneau, and M. Mriaux, 'Characterizationof the Mobile Channel by a 3D UTD Propagation Model," in PSIP '2001,Marseille, France, Janvier 2001.