micromechanicals of halite investigated by 2d and 3d multiscale full field measurements, 48th us...
TRANSCRIPT

1. INTRODUCTION As a rock forming mineral with geotechnical and industrial applications, halite has been extensively studied over decades. Most studies are based on macroscopic mechanical testing in order to derive phenomenological constitutive relations [1], in view of safety assessments of industrial applications such as geological storage of liquid and gaseous hydrocarbons in deep caverns [2], or more recently, of compressed air in the context of temporary storage of “green energy” [3]. The limits of purely macroscopic and phenomenological constitutive relations to address long term safety issues associated with complex loading histories have however been recognized. As for many other natural or manufactured materials, the need for more micromechanical insight on the physical mechanisms of deformation and damage active at various microscopic scales and with various effects at macroscopic scale is now acknowledged [4], in view of the construction of more physically-based so-called “micromechanical” constitutive relations.
Within this point of view, a recent work on synthetic halite with up-to-date micromechanical experimental tools allowed us [5,6,7] to characterize the deformation modes of halite from centimeter down to micrometer
scales. These investigations were based on the combination of uniaxial compression at room temperature or at 350°C of halite samples with various microstructures, their observation with macroscopic and microscopic optical tools, or with Scanning Electron Microscopy (SEM), and the processing of the recorded images with Digital Image Correlation (DIC) tools.
These analyses have shown that, despite Crystal Slip Plasticity (CSP) is the major strain accommodation mechanism, Grain Boundary Sliding (GBS) was necessary to accommodate crystal plasticity incompatibilities due to the relative orientations of neighboring grains. Both mechanisms are always present and intimately linked, with a relative contribution of each that depends on microstructure, namely average grain size and grain size distribution, and on loading conditions, in particular temperature and possibly strain rate (though all tests had been performed at about 10-4 s-1 overall strain rate). These results were however essentially qualitative ones and based on observations of the surface of the samples.
The present contribution aims at, first, providing more quantitative data on the relative contribution of CSP and GBS, thanks to new image processing tools, and, second, to extend the analyses to the bulk of the materials, by means of 3D imaging of halite samples subjected to
ARMA 14-7473 Micromechanics of halite investigated by 2D and 3D multiscale full field measurements
Gaye, A., Bornert, M., Lenoir, N., and Sab, K. Laboratoire Navier, Université Paris-Est, UMR CNRS 8205, IFSTTAR, ENPC, 77455 Marne-la-Vallée, France Dimanov, A., Bourcier, M., Héripré, E., Raphanel, J., Gharbi, H., and Picard, D. Laboratoire de Mécanique des Solides, UMR CNRS 7649, École Polytechnique, 91128 Palaiseau Cedex, France Ludwig, W. Laboratoire MATEIS, UMR CNRS 5510 & European Synchrotron Radiation Facility, 38043 Grenoble Cedex, France
Copyright 2014 ARMA, American Rock Mechanics Association This paper was prepared for presentation at the 48th US Rock Mechanics / Geomechanics Symposium held in Minneapolis, MN, USA, 1-4 June 2014. This paper was selected for presentation at the symposium by an ARMA Technical Program Committee based on a technical and critical review of the paper by a minimum of two technical reviewers. The material, as presented, does not necessarily reflect any position of ARMA, its officers, or members. Electronic reproduction, distribution, or storage of any part of this paper for commercial purposes without the written consent of ARMA is prohibited. Permission to reproduce in print is restricted to an abstract of not more than 200 words; illustrations may not be copied. The abstract must contain conspicuous acknowledgement of where and by whom the paper was presented.
ABSTRACT: The deformation of synthetic halite is investigated at the scale of its polycrystalline microstructure. Images recorded during compression test performed in the chamber of a scanning electron microscope on centimeter sized samples are analyzed by Digital Image Correlation techniques and reveal the combined contribution of crystal slip plasticity and grain boundary sliding (GBS) and opening. Specifically developed processing routines allow us to quantify the relative contribution of both mechanisms to the overall strain, and its dependence with temperature. These surface measurements are complemented by full 3D analyses based on synchrotron X-Ray absorption computed tomography on similar samples. The analysis of the CT volumes at various load levels by Digital Volume Correlation routines, confirms the complex localization of deformation at the scale of the microstructure. Transverse cracks at grain boundaries are also observed in the bulk of the material, as indirect signs of GBS.
compression and the analysis of the obtained images by Digital Volume Correlation (DVC).
The synthetic material and the experimental procedure used in the earlier study are briefly recalled in next section. The technical details of the new image-processing tool to quantify the contribution of GBS have already been presented elsewhere [8]. Their main ideas are recalled in section 3 and the results obtained on a similar material tested at room temperature and at 350°C are presented and commented. Finally, the experimental procedure to quantify deformation mechanisms in the bulk of the material are presented in section 4, together with preliminary qualitative results, which confirm the existence of complex deformation patterns in 3D as well as the existence of active deformation mechanisms at grain boundaries, revealed by the opening of essentially transverse microcracks.
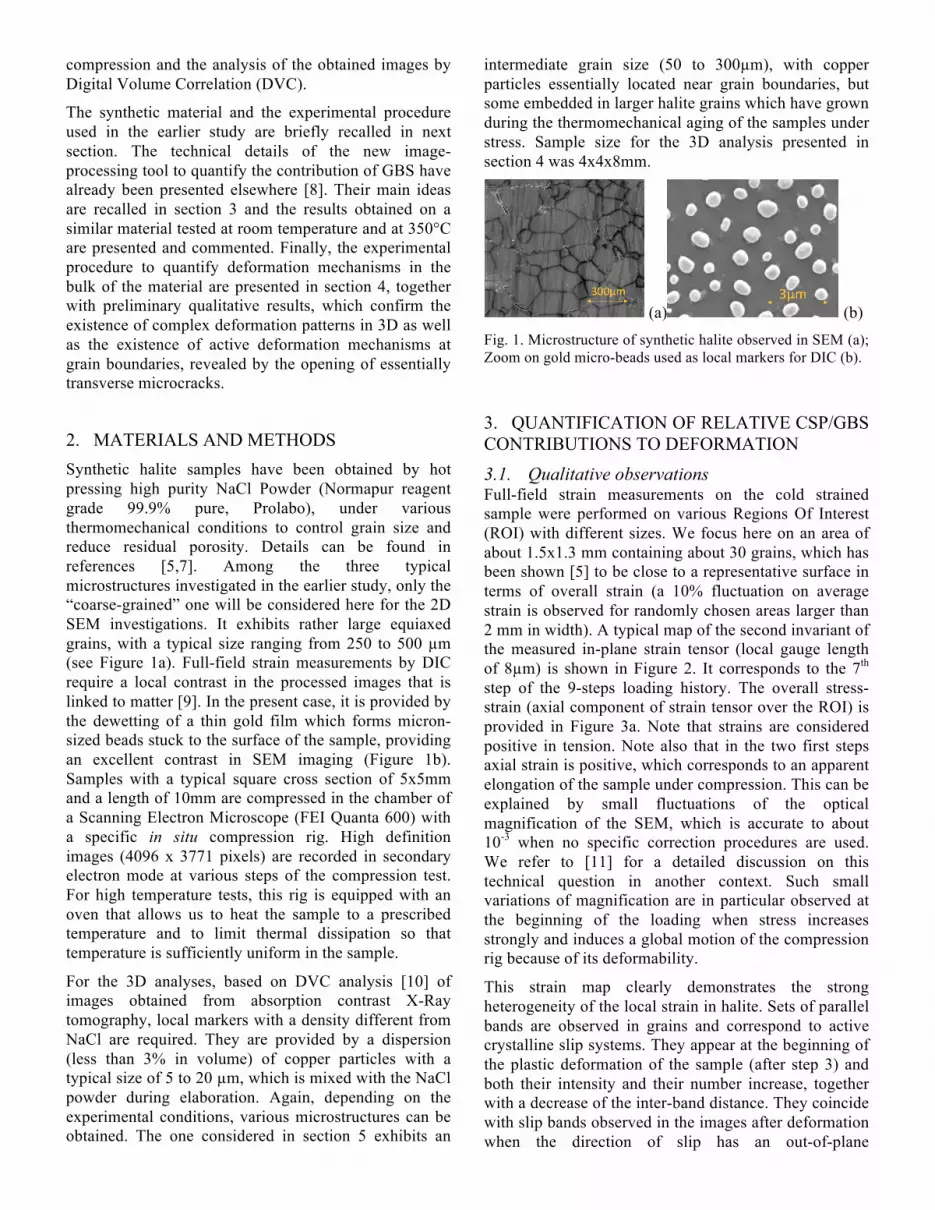
2. MATERIALS AND METHODS Synthetic halite samples have been obtained by hot pressing high purity NaCl Powder (Normapur reagent grade 99.9% pure, Prolabo), under various thermomechanical conditions to control grain size and reduce residual porosity. Details can be found in references [5,7]. Among the three typical microstructures investigated in the earlier study, only the “coarse-grained” one will be considered here for the 2D SEM investigations. It exhibits rather large equiaxed grains, with a typical size ranging from 250 to 500 µm (see Figure 1a). Full-field strain measurements by DIC require a local contrast in the processed images that is linked to matter [9]. In the present case, it is provided by the dewetting of a thin gold film which forms micron-sized beads stuck to the surface of the sample, providing an excellent contrast in SEM imaging (Figure 1b). Samples with a typical square cross section of 5x5mm and a length of 10mm are compressed in the chamber of a Scanning Electron Microscope (FEI Quanta 600) with a specific in situ compression rig. High definition images (4096 x 3771 pixels) are recorded in secondary electron mode at various steps of the compression test. For high temperature tests, this rig is equipped with an oven that allows us to heat the sample to a prescribed temperature and to limit thermal dissipation so that temperature is sufficiently uniform in the sample.
For the 3D analyses, based on DVC analysis [10] of images obtained from absorption contrast X-Ray tomography, local markers with a density different from NaCl are required. They are provided by a dispersion (less than 3% in volume) of copper particles with a typical size of 5 to 20 µm, which is mixed with the NaCl powder during elaboration. Again, depending on the experimental conditions, various microstructures can be obtained. The one considered in section 5 exhibits an
intermediate grain size (50 to 300µm), with copper particles essentially located near grain boundaries, but some embedded in larger halite grains which have grown during the thermomechanical aging of the samples under stress. Sample size for the 3D analysis presented in section 4 was 4x4x8mm.
(a) (b) Fig. 1. Microstructure of synthetic halite observed in SEM (a); Zoom on gold micro-beads used as local markers for DIC (b).
3. QUANTIFICATION OF RELATIVE CSP/GBS CONTRIBUTIONS TO DEFORMATION 3.1. Qualitative observations Full-field strain measurements on the cold strained sample were performed on various Regions Of Interest (ROI) with different sizes. We focus here on an area of about 1.5x1.3 mm containing about 30 grains, which has been shown [5] to be close to a representative surface in terms of overall strain (a 10% fluctuation on average strain is observed for randomly chosen areas larger than 2 mm in width). A typical map of the second invariant of the measured in-plane strain tensor (local gauge length of 8µm) is shown in Figure 2. It corresponds to the 7th step of the 9-steps loading history. The overall stress-strain (axial component of strain tensor over the ROI) is provided in Figure 3a. Note that strains are considered positive in tension. Note also that in the two first steps axial strain is positive, which corresponds to an apparent elongation of the sample under compression. This can be explained by small fluctuations of the optical magnification of the SEM, which is accurate to about 10-3 when no specific correction procedures are used. We refer to [11] for a detailed discussion on this technical question in another context. Such small variations of magnification are in particular observed at the beginning of the loading when stress increases strongly and induces a global motion of the compression rig because of its deformability.
This strain map clearly demonstrates the strong heterogeneity of the local strain in halite. Sets of parallel bands are observed in grains and correspond to active crystalline slip systems. They appear at the beginning of the plastic deformation of the sample (after step 3) and both their intensity and their number increase, together with a decrease of the inter-band distance. They coincide with slip bands observed in the images after deformation when the direction of slip has an out-of-plane
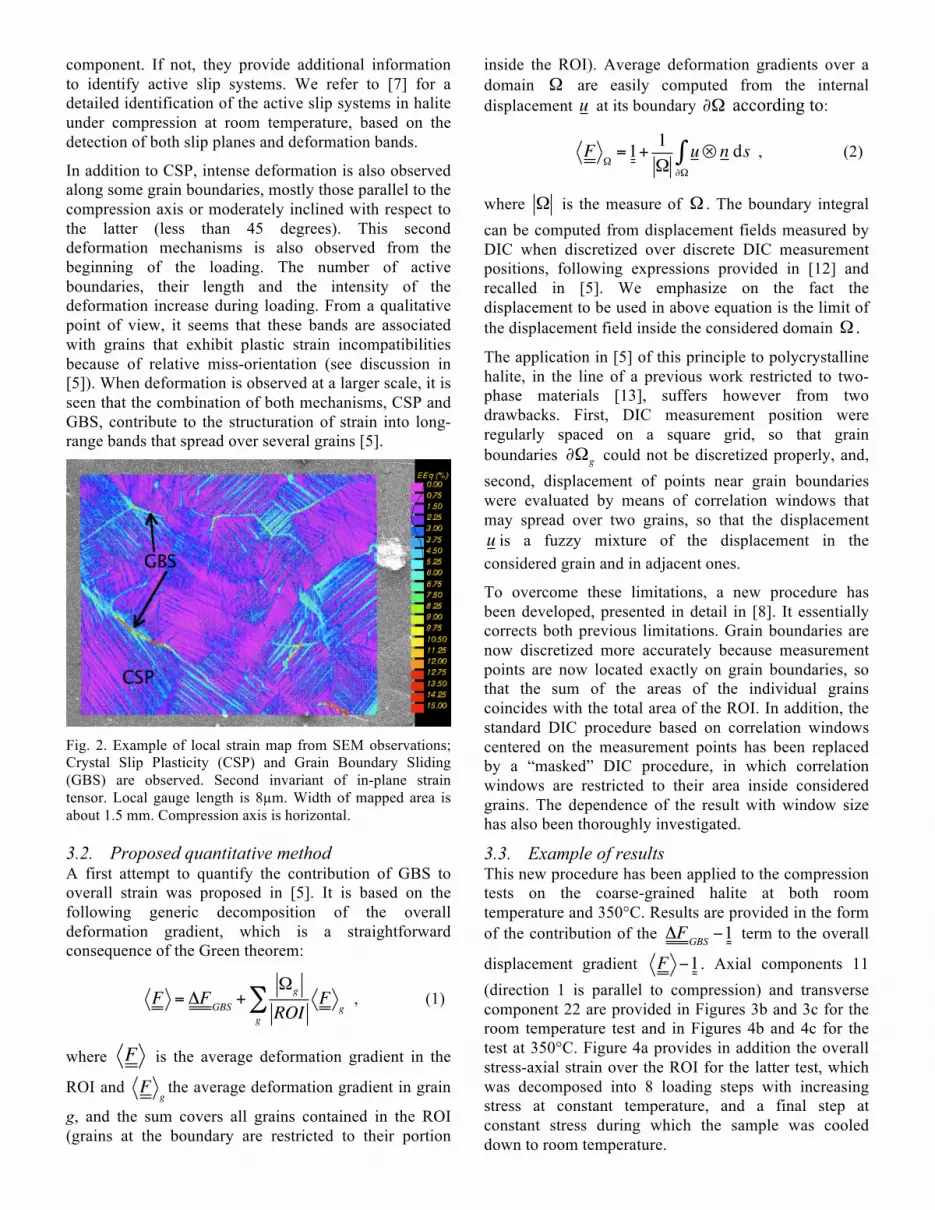
component. If not, they provide additional information to identify active slip systems. We refer to [7] for a detailed identification of the active slip systems in halite under compression at room temperature, based on the detection of both slip planes and deformation bands.
In addition to CSP, intense deformation is also observed along some grain boundaries, mostly those parallel to the compression axis or moderately inclined with respect to the latter (less than 45 degrees). This second deformation mechanisms is also observed from the beginning of the loading. The number of active boundaries, their length and the intensity of the deformation increase during loading. From a qualitative point of view, it seems that these bands are associated with grains that exhibit plastic strain incompatibilities because of relative miss-orientation (see discussion in [5]). When deformation is observed at a larger scale, it is seen that the combination of both mechanisms, CSP and GBS, contribute to the structuration of strain into long-range bands that spread over several grains [5].
Fig. 2. Example of local strain map from SEM observations; Crystal Slip Plasticity (CSP) and Grain Boundary Sliding (GBS) are observed. Second invariant of in-plane strain tensor. Local gauge length is 8µm. Width of mapped area is about 1.5 mm. Compression axis is horizontal.
3.2. Proposed quantitative method A first attempt to quantify the contribution of GBS to overall strain was proposed in [5]. It is based on the following generic decomposition of the overall deformation gradient, which is a straightforward consequence of the Green theorem:
F = ΔFGBS +Ωg
ROIF
gg∑ , (1)
where F is the average deformation gradient in the
ROI and Fg
the average deformation gradient in grain
g, and the sum covers all grains contained in the ROI (grains at the boundary are restricted to their portion
inside the ROI). Average deformation gradients over a domain Ω are easily computed from the internal displacement u at its boundary ∂Ω according to:
FΩ=1+ 1
Ωu⊗ n ds
∂Ω
∫ , (2)
where Ω is the measure of Ω . The boundary integral can be computed from displacement fields measured by DIC when discretized over discrete DIC measurement positions, following expressions provided in [12] and recalled in [5]. We emphasize on the fact the displacement to be used in above equation is the limit of the displacement field inside the considered domain Ω . The application in [5] of this principle to polycrystalline halite, in the line of a previous work restricted to two-phase materials [13], suffers however from two drawbacks. First, DIC measurement position were regularly spaced on a square grid, so that grain boundaries ∂Ωg could not be discretized properly, and, second, displacement of points near grain boundaries were evaluated by means of correlation windows that may spread over two grains, so that the displacement u is a fuzzy mixture of the displacement in the considered grain and in adjacent ones.
To overcome these limitations, a new procedure has been developed, presented in detail in [8]. It essentially corrects both previous limitations. Grain boundaries are now discretized more accurately because measurement points are now located exactly on grain boundaries, so that the sum of the areas of the individual grains coincides with the total area of the ROI. In addition, the standard DIC procedure based on correlation windows centered on the measurement points has been replaced by a “masked” DIC procedure, in which correlation windows are restricted to their area inside considered grains. The dependence of the result with window size has also been thoroughly investigated.
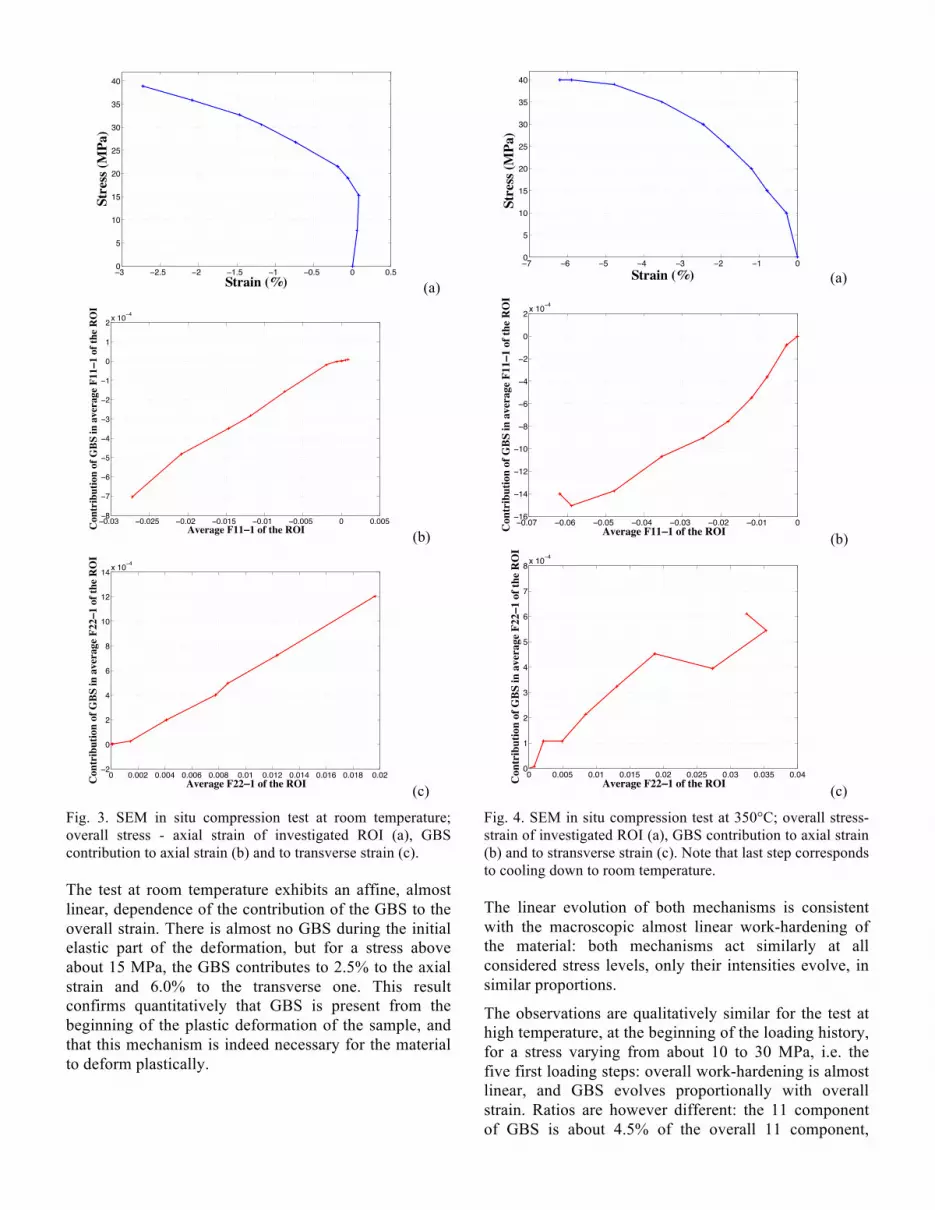
3.3. Example of results This new procedure has been applied to the compression tests on the coarse-grained halite at both room temperature and 350°C. Results are provided in the form of the contribution of the ΔFGBS −1 term to the overall
displacement gradient F −1 . Axial components 11 (direction 1 is parallel to compression) and transverse component 22 are provided in Figures 3b and 3c for the room temperature test and in Figures 4b and 4c for the test at 350°C. Figure 4a provides in addition the overall stress-axial strain over the ROI for the latter test, which was decomposed into 8 loading steps with increasing stress at constant temperature, and a final step at constant stress during which the sample was cooled down to room temperature.
−3 −2.5 −2 −1.5 −1 −0.5 0 0.50
5
10
15
20
25
30
35
40
Strain (%)
Stre
ss (M
Pa)
(a)
−0.03 −0.025 −0.02 −0.015 −0.01 −0.005 0 0.005−8
−7
−6
−5
−4
−3
−2
−1
0
1
2 x 10⁻⁴
Average F11ï1 of the ROICon
trib
utio
n of
GBS
in a
vera
ge F
11ï1
of t
he R
OI
(b)
0 0.002 0.004 0.006 0.008 0.01 0.012 0.014 0.016 0.018 0.02−2
0
2
4
6
8
10
12
14 x 10−4
Average F22ï1 of the ROICon
trib
utio
n of
GBS
in a
vera
ge F
22ï1
of t
he R
OI
(c) Fig. 3. SEM in situ compression test at room temperature; overall stress - axial strain of investigated ROI (a), GBS contribution to axial strain (b) and to transverse strain (c).
The test at room temperature exhibits an affine, almost linear, dependence of the contribution of the GBS to the overall strain. There is almost no GBS during the initial elastic part of the deformation, but for a stress above about 15 MPa, the GBS contributes to 2.5% to the axial strain and 6.0% to the transverse one. This result confirms quantitatively that GBS is present from the beginning of the plastic deformation of the sample, and that this mechanism is indeed necessary for the material to deform plastically.
−7 −6 −5 −4 −3 −2 −1 00
5
10
15
20
25
30
35
40
Strain (%)
Stre
ss (M
Pa)
(a)
−0.07 −0.06 −0.05 −0.04 −0.03 −0.02 −0.01 0−16
−14
−12
−10
−8
−6
−4
−2
0
2 x 10⁻⁴
Average F11ï1 of the ROICon
trib
utio
n of
GBS
in a
vera
ge F
11ï1
of t
he R
OI
(b)
0 0.005 0.01 0.015 0.02 0.025 0.03 0.035 0.040
1
2
3
4
5
6
7
8 x 10⁻⁴
Average F22ï1 of the ROICon
trib
utio
n of
GBS
in a
vera
ge F
22ï1
of t
he R
OI
(c) Fig. 4. SEM in situ compression test at 350°C; overall stress-strain of investigated ROI (a), GBS contribution to axial strain (b) and to stransverse strain (c). Note that last step corresponds to cooling down to room temperature.
The linear evolution of both mechanisms is consistent with the macroscopic almost linear work-hardening of the material: both mechanisms act similarly at all considered stress levels, only their intensities evolve, in similar proportions.
The observations are qualitatively similar for the test at high temperature, at the beginning of the loading history, for a stress varying from about 10 to 30 MPa, i.e. the five first loading steps: overall work-hardening is almost linear, and GBS evolves proportionally with overall strain. Ratios are however different: the 11 component of GBS is about 4.5% of the overall 11 component,

while the transverse 22 component contributes to 2.4% of the overall transverse strain. GBS is thus still necessary to accommodate CSP incompatibilities at high temperature, with even more GBS for the axial component, but less for the transverse one. As the latter reflects essentially the opening of transverse cracks at the grain boundary interfaces, this lower value probably indicates a lower damage level at high temperature.
In addition, for stresses higher than 30MPa, this tendency for a reduced contribution of GBS to transverse strain is emphasized with a clear change of the slope of the curve in figure 4c (with even a reduction of this component at the 7th step, which would however need additional investigations for confirmation). A similar tendency is observed on the axial component, though less pronounced, but clearly present: the slope of the curve in figure 4b is about 1.7% for the four last loading steps before cooling. This seems to indicate the activation of another deformation mechanism, probably another crystallographic slip system, which contributes more efficiently to the accommodation of the initial incompatibilities of CSP than GBS. This would be consistent with the nonlinear evolution of the overall stress-strain curve above 30MPa. Additional experimental investigation are however required to conform these observation. In particular, larger areas should be investigated at high temperature, as the here presented results were obtained from a probably too small area with a limited number of grains (about 10). To do so, the geometry of the oven to heat the sample will have to be modified for future investigations to that larger areas can be investigated.
4. FULL 3D INVESTIGATION 4.1. Synchrotron absorption contrast tomography
and ex-situ compression tests. Previous investigations are essentially 2D and focus on the mechanisms at the surface of the sample. Their representation with respect to the bulk behavior of halite might be biased by the free boundary condition on the observation surface. To address this question, additional investigations have been performed based on 3D imaging by means of X-Ray absorption computed microtomography (XRCT), performed on the ID19 beamline of the European Synchrotron Radiation Facility (ESRF) in Grenoble, France. Much lower spatial resolution is expected from XRCT than from SEM imaging, but these 3D observations are much less sensitive to potential surface bias. In order to apply DVC algorithms [10], a local contrast is required and is provided by copper particles embedded in the material as explained in section 2. This second phase might modify the behavior of pure halite, but on the other hand it mimics also impurities always present in natural halite.
A typical extract of a cross section of a XRCT volume of a marked halite sample is provided in Figure 5.
Fig. 5. Typical cross section through CT volume of polycrystalline halite with additional copper markers.
Preliminary attempts to perform in-situ compression tests [7] turned unfortunately out to be unsuccessful, because samples tent to break prematurely when compressed in situ during XRCT imaging. The comparison of the stress-strain curve of a same material under uniaxial compression, with and without preliminary exposition to intense X-Rays irradiation, showed that the mechanical behavior of halite is sensitive to X-Rays, probably because of the creation of punctual defects in the crystalline structure which modify the mobility of dislocations. Irradiated halite is much harder and small samples (required for XRCT imaging) might break under low deformation levels because of higher stress levels. Fortunately, it has also been observed that such defects can be removed by heating the sample for about 1h at 300°C, without modifying to strongly the overall behavior at room temperature (after cooling).
The experimental procedure to obtain the below presented results is thus the following. Marked halite was cut into 4x4x8mm samples from a larger sample preliminary imaged by laboratory CT to select undamaged zones. Precise polishing procedures were developed to ensure a good parallelism of the upper and lower surfaces to reduce stress concentrations during compression. Samples were then imaged with high resolution XRCT, to obtain several juxtaposed 2048x2048x1024 voxels volumes to cover the whole sample. Image resolution was 3.5 µm. Sample were then heated to 300°C at zero stress in the oven used for the SEM in situ tests, at a rate of 0.1°/s, maintained at 300°C for one hour and cooled down at the same rate. Compression test have then been performed with the rig used for SEM in situ tests. To control deformation of the sample, the whole sample was regularly photographed with a SLR camera (Olympus E3 + 50mm macro lens) and the obtained images processed by standard DIC to obtain the overall strain of the sample. The sample was then imaged by XRCT using the same conditions. This
150µm

procedure has been repeated four times up to 9% overall strain. Only the three first steps are presented here, as the sample was strongly damaged after the fourth step.
4.2. Overall response of sample; comparison with surface measurements
The overall stress-average strain (measured by 2D DIC on one face of the sample) is provided in Figure 6, which can be compared to the results of the SEM analysis in Figure 3a. One observes also an initial small apparent extension of the sample, which can again be explained by the overall motion of the sample and the induced magnification variations. The stress at which initial plasticity is observed is similar (17Mpa in the XRCT test versus some value inbetween 15 and 19MPa for the SEM test). Stress after 1% strain is also very identical (29MPa). The heating procedure however tends to reduce the plastic limit during reloading, but the higher work-hardening makes that the stress level quickly reaches levels similar to those in the SEM-test. It is thus expected that the heating procedure, required to remove short range irradiation defects, though imperfect, does not modify too strongly the overall behavior of the sample when sufficiently large intermediate loading steps are prescribed.
−6 −5 −4 −3 −2 −1 0 10
10
20
30
40
50
Strain (%)
Stre
ss (M
Pa)
Step 1Step 2Step 3
Fig. 6. Overall stress-strain curve of tested sample; strains are obtained from 2D overall DIC measurements on one lateral surface.
Table 1. Principal overall strain as measured by DVC
Step 1 Step 2 Step 3 e1 0.0080 0.0187 0.0327 e2 0.0075 0.0177 0.0312 e3 -0.0163 -0.0357 -0.0603 e1 + e2 + e3 -0.0007 0.0006 0.0036
The XRCT images have been processed with DVC routines using a 30 voxels pitch regular grid and correlation windows of same size, which is automatically increased when the local contrast is insufficient. The post-processing of the measured 3D displacement field gives first access to the three principal component of the overall strain tensor provided
in Table 1. It is observed that the 3D axial components are consistent with the 2D surface measurements, except for the first step for which the 2D analysis (-1%) underestimates notably the 3D measure (-1.6%). This can be explained, first, by the already mentioned optical magnification variations and, second, by the fact that at the beginning of the test the sample may undergo some bending because of an imperfect alignment.
Table 1 also provides the average volume strain, which is slightly negative after step 1, suggesting the closing of residual porosities and then increases with axial strain: 0.13% increase of volume strain between step 1 and 2, for an axial strain increase of 1.9%, and 0.3% volume increase for an axial strain of 2.5% from step 2 to 3. This positive volume change is the probable sign of damage occurring at microscale. This is confirmed by the observation of the strain fields in three dimensions.
4.3. Localization of strain in 3D Figure 7 provides through-sample views of both the deviatoric (standard von Mises strain) and volumetric (trace of strain tensor) components of the full local total strain tensor field for steps 2 and 3. Local gage length is 140µm, and thus notably smaller than average grain size. The strain fields in both increments are very similar, with an intensification of the strain levels in third step. Note that the strain field was somewhat different in the first step, not represented here, confirming the initial bending of the sample mentioned above.
(a) (b)
(c) (d)
Fig. 7. Map of von Mises equivalent strain (a) and volumetric strain (b) in second and third (c/d) loading steps. Compression axis is vertical and the local gauge length is 140 µm; sample side is about 4 mm.

Deviatoric strains maps exhibit a two-scale organization. At the overall scale of the sample, it is observed that strain is low in upper and lower cones near the contact surfaces, as a consequence of imperfect boundary conditions: contact surfaces have been lubricated but this was not sufficient to suppress totally tangential friction forces. In the central part of the sample, where strain is more intense, a second scale of structuration of the strain field is clearly seen: strains self-organizes itself into deformation bands, with a typical spacing of several hundreds of micrometers. These bands are seen in both configurations, with a rather reproducible spatial organization. These observations are very consistent with earlier optical surface full-field measurements on a similar material [5,7]. Individual deformation bands at the scale of the slip systems or at grains boundaries can however not be resolved as in SEM investigations, because spatial resolutions of these 3D strains fields is too coarse (140 µm instead of 8 µm in SEM strain maps).
4.4. Transverse cracks at grain-boundaries The GBS deformation mechanism can however be investigated indirectly through the local volume change as provided by Figures 7b and 7d. Theses fields appear rather noisy, but indeed also exhibit some reproducible features. A more detailed investigation shows that locations of intense volume change coincide with the nucleation and growth of microcracks with a typical size and orientation very consistent with those observed in the SEM experiment at room temperature. Figure 8 provides examples of such cracks, observed in cross sections through CT volumes along planes perpendicular and parallel to the direction of compression.
(a) (b)
(c) (d) Fig. 8. Observation of transverse cracks. Horizontal cross section normal to direction of compression in reference image (a) and at third loading step (b). Vertical cross section in reference image (c) and at third loading step (d); compression axis is vertical in (c) and (d). Width of images is about 800µm.
These cracks are not present in the reference images and are observed to progressively appear. Furthermore, comparison of deviatoric and volumetric strain maps at same deformation steps in Figure 7 confirms that GBS is more intense in areas where deviatoric strains are larger. These observations confirm, at least qualitatively, that GBS is present from the beginning of plastic strain in the bulk of the material and not only at its free surface and contribute as a second mechanism to accommodate incompatibilities of CSP.
5. CONCLUSIONS AND PERSPECTIVES Deformation of synthetic halite has been investigated at the scale of its polycrystalline microstructure. Crystal slip plasticity is the major deformation mechanism as is contributes to more than 94% of total strain. However grain boundary sliding is necessary to accommodate local CSP incompatibilities; this is true from the beginning of plastic deformation. The combined contribution of both mechanism leads to a structuration of the local deformation field into deformation bands with a typical size notably larger than grain size. Moreover, a quantitative evaluation of the contribution of both mechanisms to overall strain shows that the proportion of GBS to overall strain is constant in halite subjected to compression at low temperature. This holds also true at high temperature for moderate stress; at higher stress levels, the contribution of GBS seems to be lower, probably because additional CSP systems are activated. These surface measurements are confirmed, at least from a qualitative point of view by investigations in the bulk of the materials, where both mechanisms are also indirectly observed, with the same chronology. More advanced analyses of the 3D images are expected to provide a quantification of the contribution of crack openings to overall strain. Additional experiments on other microstructures such as those already considered in [5] will allow one to better characterizing the conditions for the activation of GBS or CSP. Finally, these data will serve to construct and validate multiscale analytical or numerical models for the behavior of halite under complex loading conditions. To do so, it will be very useful to combine strain measurements with 2D imaging of the polycrystalline structure by Electron BackScattered Diffraction, as in [14]. In addition, a similar mapping is also expected in 3D thanks to newly developed Diffraction Contrast Tomography procedures [15]. Such a work is underway.
ACKNOWLEDGEMENTS The present study was funded by the ANR project “MicroNaSel” under number ANR-10-BLAN-935.

ESRF beamtime has been allocated under proposal number MA-2034.
REFERENCES 1. Senseny, P. E., F. D. Hansen, J. E. Russell, N. L.
Carter, and J. W. Handin. 1992. Mechanical behaviour of rock salt: Phenomenology and micromechanisms, Int. J. Rock Mec. Min., 29(4), 363–378.
2. Bérest, P., P. A. Blum, J. P. Charpentier, H. Gharbi, and F. Valés. 2005. Very slow creep tests on rock samples, Int. J. Rock Mech. Min., 42(4), 569–576.
3. Crotogino, F., K-U. Mohmeyer, and R. Scharf. 2001. Huntorf CAES: More Than 20 Years of Successful Operation, In: Spring 2001 Meeting Orlando, Florida, USA 15-18 April 2001.
4. Desbois, G., P. Závada, Z. Schléder and J. L. Urai. 2010. Deformation and recrystallization mechanisms in actively extruding salt fountain: Microstructural evidence for a switch in deformation mechanisms with increased availability of meteoric water and decreased grain size (Qum Kuh, central Iran), J. Struct. Geol., 32(4), 580–594.
5. Bourcier, M., M. Bornert, A. Dimanov, E. Héripré, and J.L. Raphanel. 2013. Grain boundary sliding and crystal plasticity in halite. J. Geophys. Res. Solid Earth. 118: 511–526.
6. Bourcier, M., A. Dimanov, E. Héripré, J.L. Raphanel, M. Bornert and G. Desbois, 2012. Full field investigation of salt deformation at room temperature: cooperation of crystal plasticity and grain sliding. In: Proceedings of the 7th Conference on the Mechanical Behaviour of Salt, Paris, 16 - 19 April 2012, eds. P. Berest et al, 37-43.
7. Bourcier, M. 2012. Étude multi-échelle des mécanismes de déformation ductile de polycristaux synthétiques de chlorure de sodium. PhD thesis, École Polytechnique.
8. Gaye, A., M. Bourcier, E. Héripré, M. Bornert, A. Dimanov, J. Raphanel, and K. Sab. 2013. Quantitative investigation of grain boundary sliding in halite rock by sem in situ testing and full field strain measurements. Proceedings of Photomechanics 2013, Montpellier.
9. Sutton, M. A., J.-J. Orteu, and H. W. Schreier. 2009. Image correlation for shape, motion and deformation measurements: basic concepts, theory and applications. Springer Science+Business Media, New York.
10. Bornert M., J.M. Chaix, P. Doumalin, J.C. Dupré, T. Fournel, D. Jeulin, E. Maire, M. Moreaud and H. Moulinec. 2004. Mesure tridimensionnelle de champs cinématiques par imagerie volumique pour l’analyse des matériaux et des structures, Instr., Mes., Métrol., 3-4, 43-88.
11. Wang, L., M. Bornert, E. Héripré, S. Chanchole, and A. Tanguy. 2014. Full-field measurements on low-strained geomaterials using environmental scanning electron
microscopy and digital image correlation: improved imaging conditions, Strain, in press. doi: 10.1111/str.12076
12. Allais, L., M. Bornert, T. Bretheau, and D. Caldemaison. 1994. Experimental characterization of the local strain field in a heterogeneous elastoplastic material, Acta Metallurgica et materialia, 42(11), 3865–3880.
13. Rupin, N. 2007. Déformation à chaud de matériaux biphasés: modélisations théoriques et confrontations expérimentales. PhD thesis, École Polytechnique.
14. Héripré, É., M. Dexet, J. Crépin, L. Gélébart, A. Roos, M. Bornert and D. Caldemaison. 2007. Coupling between experimental measurements and polycrystal finite element calculations for micromechanical study of metallic materials, International Journal of Plasticity, Vol. 23/9, 1512-1539
15. Vigano, N., J. Batenburg and W. Ludwig, 2013. Discrete representation of local orientation in grains using diffraction contrast tomography, In: Proceedings of the 8th International symposium on image and signal processing and analysis (ISPA 2013)