microcracks pattern and the degree of weathering in granite
TRANSCRIPT
Microcracks Pattern and The Degree of Weathering in Granite
Husaini Omar Mountainous Terrain Development Research Center
Faculty of Engineering, UPM, Serdang 43400, Selangor, Malaysia Email: [email protected]
Nur Irfah Mohd Pauzi Department of Civil Engineering, UNITN
Jalan Kajang-Puchong, 43009 Kajang, Selangor, Malaysia Emai:l [email protected]
Mohammed Abu-Shariah Mountainous Terrain Development Research Center
, Faculty of Engineering, UPM, Serdang 43400, Selangor, Malaysia Email: [email protected]
Zainuddin Md. Yusof
Mountainous Terrain Development Research Center , Faculty of Engineering, UPM, Serdang 43400, Selangor, Malaysia
Email: [email protected]
Shukri b. Maail Civil Engineering Department, Faculty of Engineering,
UPM, Serdang 43400, Selangor, Malaysia Email: [email protected]
ABSTRACT Fractures in granite rocks can develop in many characters in terms of the density of fractures, complex composite microcrack systems are caused by different geologic processes under varying condition. The objective of the research is to study the relationship between microcrack pattern and the weathering degree of granite at Pos Selim area, Malaysia. The fractures on the sheared surface are measured based on the Scanning Electron Microscope (SEM) image. The microscopic aspects of fracture such as trans-granular crack, open cracks are measured using SEM before and after shearing test which is called pre-shear and post-shear respectively. Each of the fractured surfaces are measured and analyzed to come out with the fractured pattern of the weathered granite in different normal load and shear load. From the studies, the microcrack propagation patterns can be categorized into two type which are type A and type B. Type A is microcrack propagation pattern for granite grade II and type B is microcrack propagation pattern for granite grade III. Type A microcrack propagation pattern does not lead to failure and consists of minor crack surface. Type B material show microcrack pattern that propagates from the left side of the sample leading towards the right side of the sample which caused failure of the material. The relationship between the microcrack pattern and the shear strength parameters proves that an increase in shear stress
Vol. 14, Bund. F 2
and normal stress would result in increase of microcrack area, and intergranular cracks appears depend upon the mineralogy of the granite.
KEYWORDS: Granite, weathering degree, Microcrack Propagation and pattern, slope stability, Malaysia.
INTRODUCTION Granite can be characterized by microstructures including microcracks and microcavities.
Physical properties of rocks are not only affected by the constituent minerals and their preferred orientation, but also by the microcracks (Eberhardt et al, 1999).
The mechanism for microcrack of joint in granitic rock starts from the weathering processes on the rock surface and in open joints within the rock mass (Ehlen, 2002). As weathering progresses, small cracks first occur along grain boundaries before the mineral grains themselves begin to crack, possibly due to thermal expansion. Within the grain, micro-cracking occurs at different rates for the different minerals in the rock. Dark-colored minerals, particularly biotite, tend to crack earlier and longer, compared to light-colored minerals (Ehlen and Zen, 1986). These newly formed cracks are then filled with weathered material which is either weathered locally or washed in from the ground surface through the open joints. These filling materials are primarily clays, which may either contract or expand under changing thermal and moisture conditions. This volumetric change in turn, causes more within-grain micro-cracking and more expansion in rock fabric. Furthermore, erosion of the loosened fragments causes rounding of joint edges on the rock surface.
The change in shear strength of rock surface can occur because of the influence of weathering, surface roughness, and presence of water under pressure. Other than that, the microcracks patterns of rock surfaces are studied to know whether the increment in shear stress does contribute to the increment of microcrack pattern of the granitic rock in Malaysia.
Microcracks can also be related to the engineering properties such as the shear strength parameters. Many researches had done studies on the shear strength parameters of rock, three important factors that influence the rock slope stability are the geometry of the rock mass behind the slope face, the shear strength of potential failure surface and the groundwater flow in rock masses. The determination of reliable shear strength values is a critical part of a slope design because relatively small changes in shear strength can result in significant changes in the safe height or angle of a slope. It can be said that the presence or absence of discontinuities has a very important influence upon the stability of rock slopes and hence the detection of these geological features is a critical part of stability investigation. Shear stress mechanisms on the saw-cut surface which produce the crack surfaces after the shear stress is applied were studied. The presence of crack surfaces, porosity and fractured characteristic considered as microscopic flaws were observed microscopically with a Scanning Electron Microscope (SEM).
In this research, granitic core samples were tested. The two experiments done in this study were shear strength test and the microscopic fracture test. The shear strength test was carried out to obtain the shear strength parameters data and the microscopic fracture was investigated to

Vol. 14, Bund. F 3 determine the properties of crack fracture surface on sheared core sample using Scanning Electron Microscope (SEM).
MICROCRACK PROPAGATION An existing crack can propagate by various mechanisms depending upon a number of
parameters such as the loading conditions, temperature, geometry of the crack, and nature of the environment. Regardless of the mechanism by which an initially existing crack propagates, once it reaches a critical size, the cross-sectional area of the intact part is reduced to the extent that the applied stress exceeds the ultimate strength of the material leading to fracture. The final separation or fracture of the cracked part always occurs as a result of an overloading condition (Hani et. al., 2004) as shown in Figure 1.
Figure 1: Schematic diagram illustrating the mechanics of fracture. (a) An initial crack of size Co. (b) Crack propagation under the influence of a tensile load P; the crack reaches a critical size Cc and the part becomes overloaded because of the corresponding reduction in cross-sectional area
supporting the load. (c) Final separation due to an overloading condition. (Hani et. al., 2004)
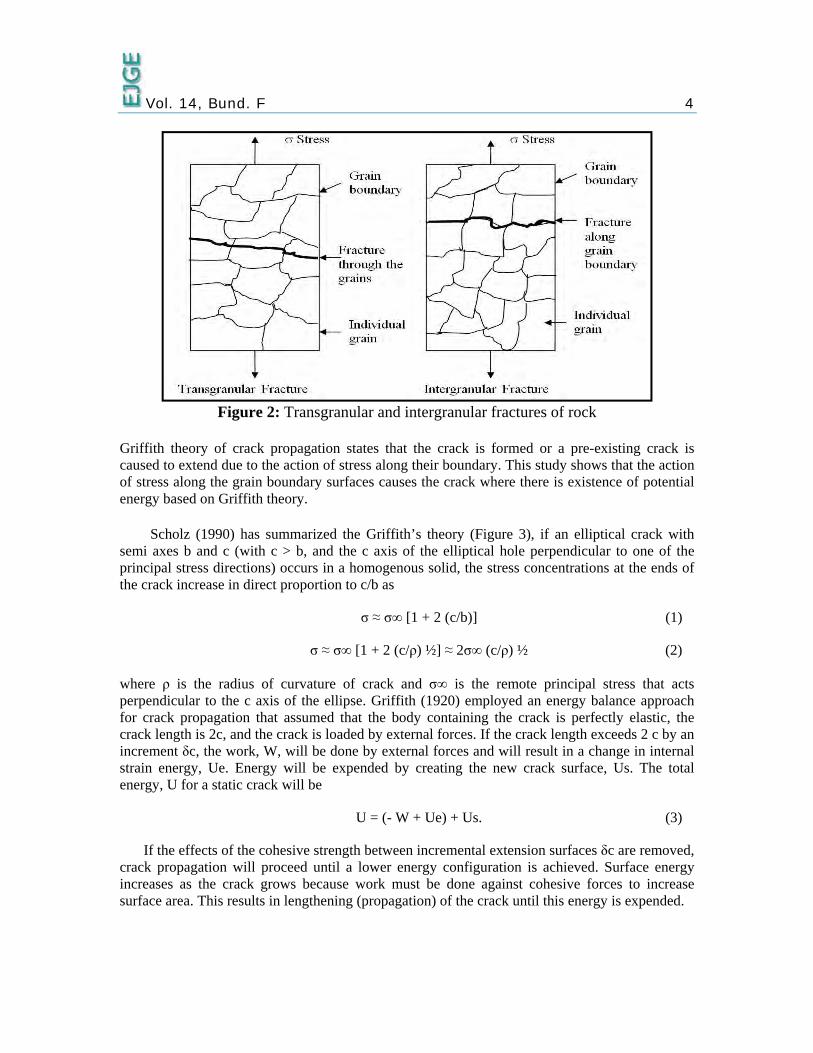
There are two different types of fractures on brittle rocks as shown in Fig. 2. They are, (i) transgranular fracture, where the fracture propagates through the grain of the material, and (ii) intergranular fracture, where the crack propagates along the grain boundaries.
The mechanism for microcrack of joint in granitic rock starts from the weathering processes on the rock surface and in open joints within the rock mass (Ehlen, 2002). As weathering occurs in the rock material, small cracks first occur along grain boundaries and then, mineral grains themselves begin to crack, possibly due to thermal expansion. Within grain, micro-cracking occurs at different rates for the different minerals in the rock. These new cracks fill with weathered material, perhaps local or perhaps washed in from the ground surface along open joints. These filling materials are primarily clays, which contract themselves and expand under changing thermal and moisture conditions. Volumetric change in turn, causes more within-grain micro-cracking and more expansion in rock fabric as well as rounding of joint edges on the rock surface due to erosion of the loosened fragments.
Vol. 14, Bund. F 4
Figure 2: Transgranular and intergranular fractures of rock
Griffith theory of crack propagation states that the crack is formed or a pre-existing crack is caused to extend due to the action of stress along their boundary. This study shows that the action of stress along the grain boundary surfaces causes the crack where there is existence of potential energy based on Griffith theory.
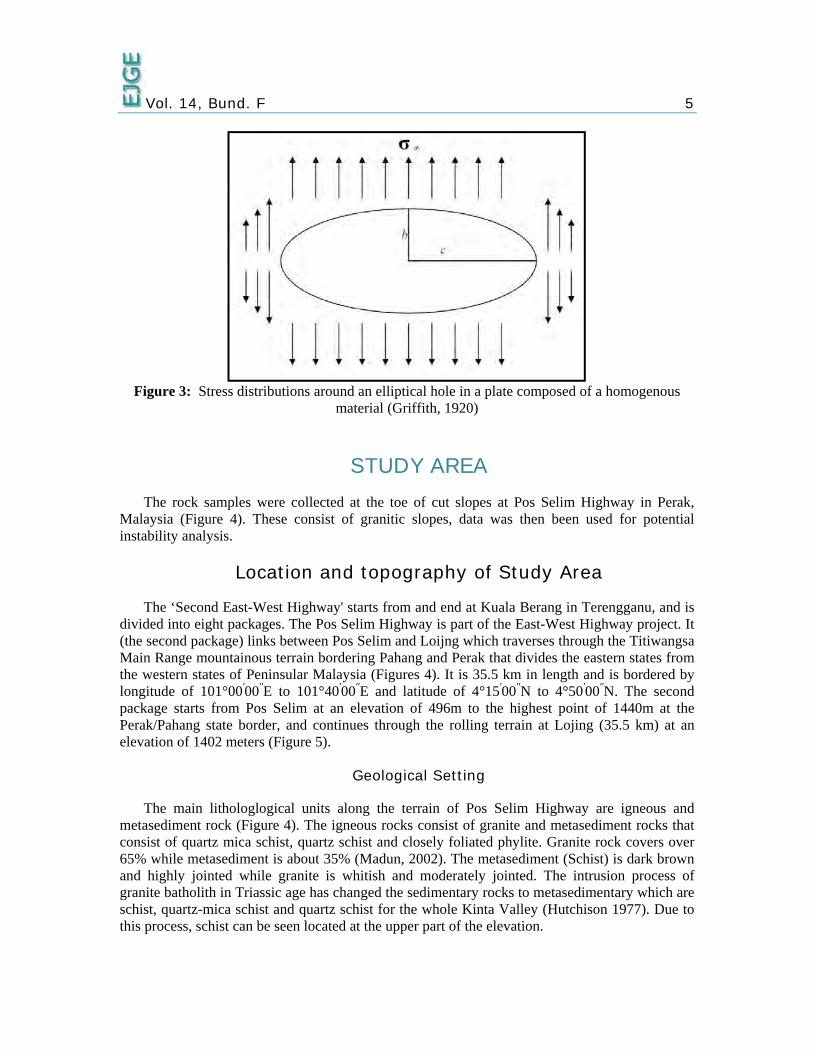
Scholz (1990) has summarized the Griffith’s theory (Figure 3), if an elliptical crack with semi axes b and c (with c > b, and the c axis of the elliptical hole perpendicular to one of the principal stress directions) occurs in a homogenous solid, the stress concentrations at the ends of the crack increase in direct proportion to c/b as
σ ≈ σ∞ [1 + 2 (c/b)] (1)
σ ≈ σ∞ [1 + 2 (c/ρ) ½] ≈ 2σ∞ (c/ρ) ½ (2)
where ρ is the radius of curvature of crack and σ∞ is the remote principal stress that acts perpendicular to the c axis of the ellipse. Griffith (1920) employed an energy balance approach for crack propagation that assumed that the body containing the crack is perfectly elastic, the crack length is 2c, and the crack is loaded by external forces. If the crack length exceeds 2 c by an increment δc, the work, W, will be done by external forces and will result in a change in internal strain energy, Ue. Energy will be expended by creating the new crack surface, Us. The total energy, U for a static crack will be
U = (- W + Ue) + Us. (3)
If the effects of the cohesive strength between incremental extension surfaces δc are removed, crack propagation will proceed until a lower energy configuration is achieved. Surface energy increases as the crack grows because work must be done against cohesive forces to increase surface area. This results in lengthening (propagation) of the crack until this energy is expended.
Vol. 14, Bund. F 5
Figure 3: Stress distributions around an elliptical hole in a plate composed of a homogenous
material (Griffith, 1920)
STUDY AREA The rock samples were collected at the toe of cut slopes at Pos Selim Highway in Perak,
Malaysia (Figure 4). These consist of granitic slopes, data was then been used for potential instability analysis.
Location and topography of Study Area
The ‘Second East-West Highway' starts from and end at Kuala Berang in Terengganu, and is divided into eight packages. The Pos Selim Highway is part of the East-West Highway project. It (the second package) links between Pos Selim and Loijng which traverses through the Titiwangsa Main Range mountainous terrain bordering Pahang and Perak that divides the eastern states from the western states of Peninsular Malaysia (Figures 4). It is 35.5 km in length and is bordered by longitude of 101°00′00′′E to 101°40′00′′E and latitude of 4°15′00′′N to 4°50′00′′N. The second package starts from Pos Selim at an elevation of 496m to the highest point of 1440m at the Perak/Pahang state border, and continues through the rolling terrain at Lojing (35.5 km) at an elevation of 1402 meters (Figure 5).
Geological Setting
The main lithologlogical units along the terrain of Pos Selim Highway are igneous and metasediment rock (Figure 4). The igneous rocks consist of granite and metasediment rocks that consist of quartz mica schist, quartz schist and closely foliated phylite. Granite rock covers over 65% while metasediment is about 35% (Madun, 2002). The metasediment (Schist) is dark brown and highly jointed while granite is whitish and moderately jointed. The intrusion process of granite batholith in Triassic age has changed the sedimentary rocks to metasedimentary which are schist, quartz-mica schist and quartz schist for the whole Kinta Valley (Hutchison 1977). Due to this process, schist can be seen located at the upper part of the elevation.

Vol. 14, Bund. F 6
Figure 4: Map shows the location of the study area and the cut slope.
Figure 5: Satellite image shows Pos Selim highway which traverses through the Titiwangsa Main
Range mountainous terrain.
GS2
GS1
1440 m
496m
S6-S10
S1-S5
V
Tfailurefailurewhileincrea
HI is frpresencorres(residSchmpropoweathIII (Ty
Afield testingmachiScanninstabmicroMalay
Vol. 14, Bu
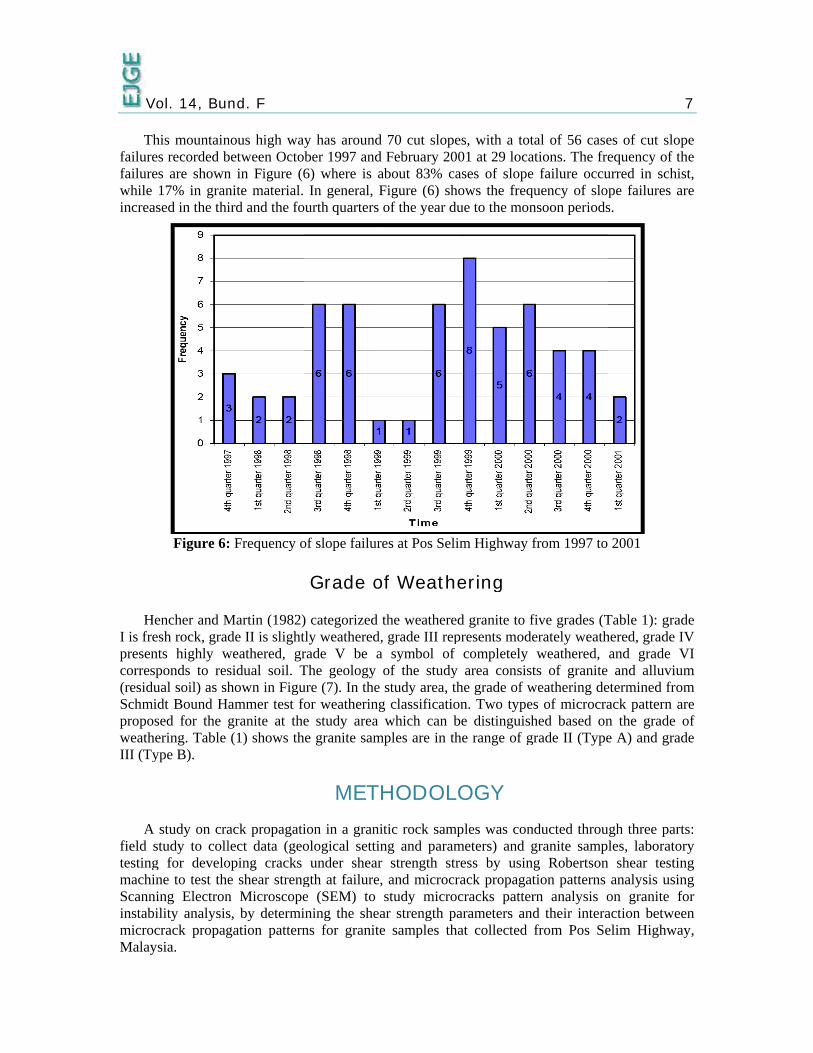
This mountaines recorded bes are shown 17% in granased in the thi
Figure 6:
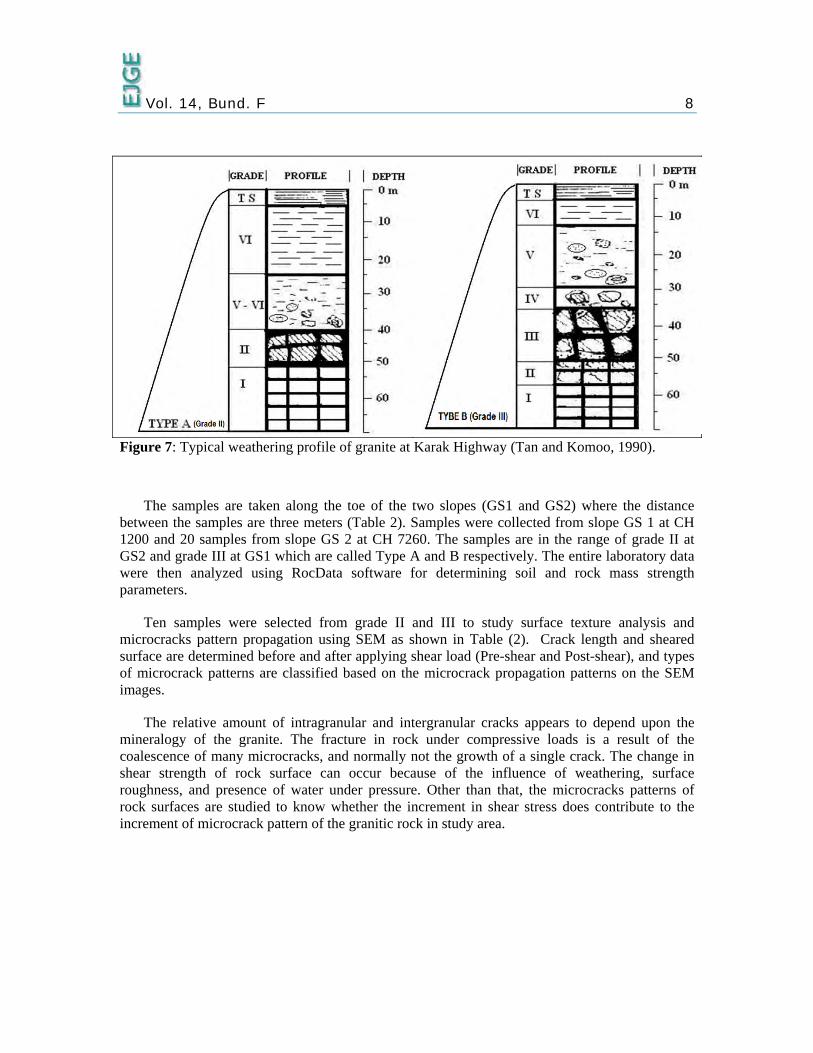
Hencher and Mesh rock, gradnts highly wsponds to res
dual soil) as shmidt Bound Hosed for the ghering. Table ype B).
A study on crastudy to collg for develoine to test thening Electronbility analysisocrack propagysia.
nd. F
nous high waybetween Octon in Figure (6nite material. ird and the fo
: Frequency o
Martin (1982)de II is slight
weathered, grsidual soil. Thown in Figuammer test fogranite at the(1) shows th
ack propagatilect data (geooping cracks e shear strengn Microscopes, by determigation pattern
y has aroundber 1997 and6) where is aIn general, F
ourth quarters
of slope failur
Grade o
) categorized tly weatheredrade V be aThe geology ure (7). In the for weatheringe study area
he granite sam
METion in a graniological settin
under sheargth at failuree (SEM) to ining the sheans for granite
d 70 cut sloped February 20about 83% caFigure (6) shof the year d
res at Pos Seli
of Weath
the weathere, grade III rep
a symbol of of the studystudy area, th
g classificatiowhich can b
mples are in th
HODOLitic rock samng and paramr strength str, and microcrstudy micro
ar strength pe samples th
es, with a tot001 at 29 locaases of slope
hows the freqdue to the mon
im Highway f
ering
ed granite to fpresents mode
completely y area consisthe grade of won. Two typebe distinguishhe range of g
LOGY mples was con
meters) and gress by usinrack propagat
ocracks patterarameters an
hat collected
tal of 56 caseations. The free failure occuquency of slopnsoon periods
from 1997 to
five grades (Terately weathweathered,
ts of granite weathering dees of microcrahed based on
grade II (Type
nducted througranite samp
ng Robertsontion patterns rn analysis od their interafrom Pos Se
es of cut slopequency of thurred in schispe failures ars.
2001
Table 1): gradhered, grade IVand grade Vand alluvium
etermined fromack pattern arn the grade oe A) and grad
ugh three partles, laborator shear testinanalysis usin
on granite foaction betweeelim Highway
7
pe he st, re
de V
VI m m re of de
ts: ry ng ng or en y,
Vol. 14, Bund. F 8
Figure 7: Typical weathering profile of granite at Karak Highway (Tan and Komoo, 1990).
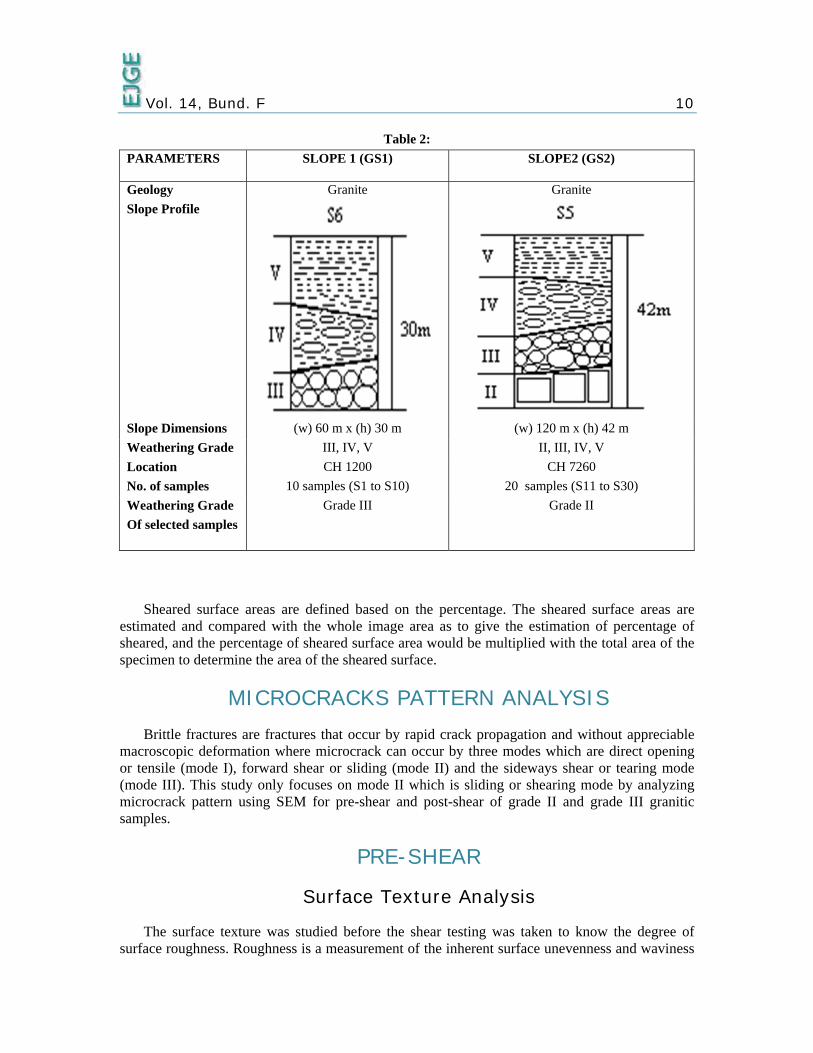
The samples are taken along the toe of the two slopes (GS1 and GS2) where the distance between the samples are three meters (Table 2). Samples were collected from slope GS 1 at CH 1200 and 20 samples from slope GS 2 at CH 7260. The samples are in the range of grade II at GS2 and grade III at GS1 which are called Type A and B respectively. The entire laboratory data were then analyzed using RocData software for determining soil and rock mass strength parameters.
Ten samples were selected from grade II and III to study surface texture analysis and microcracks pattern propagation using SEM as shown in Table (2). Crack length and sheared surface are determined before and after applying shear load (Pre-shear and Post-shear), and types of microcrack patterns are classified based on the microcrack propagation patterns on the SEM images.
The relative amount of intragranular and intergranular cracks appears to depend upon the mineralogy of the granite. The fracture in rock under compressive loads is a result of the coalescence of many microcracks, and normally not the growth of a single crack. The change in shear strength of rock surface can occur because of the influence of weathering, surface roughness, and presence of water under pressure. Other than that, the microcracks patterns of rock surfaces are studied to know whether the increment in shear stress does contribute to the increment of microcrack pattern of the granitic rock in study area.
Vol. 14, Bund. F 9
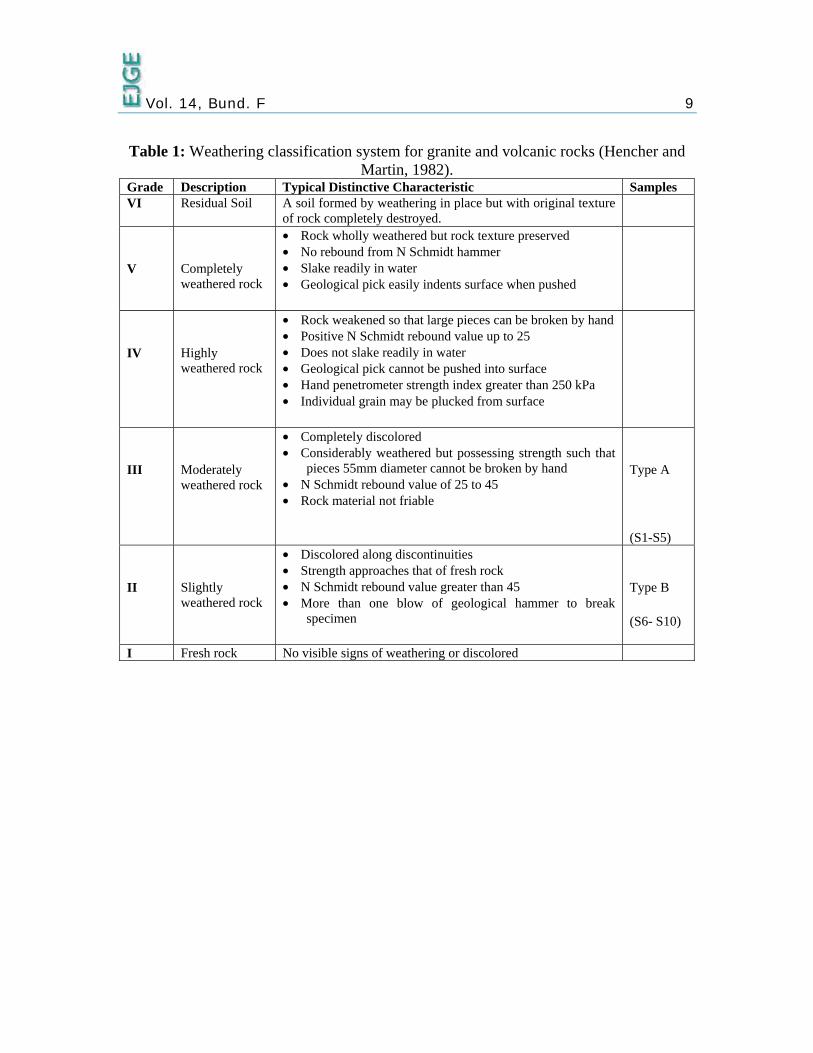
Table 1: Weathering classification system for granite and volcanic rocks (Hencher and Martin, 1982).
Grade Description Typical Distinctive Characteristic Samples VI Residual Soil A soil formed by weathering in place but with original texture
of rock completely destroyed.
V
Completely weathered rock
• Rock wholly weathered but rock texture preserved • No rebound from N Schmidt hammer • Slake readily in water • Geological pick easily indents surface when pushed
IV
Highly weathered rock
• Rock weakened so that large pieces can be broken by hand • Positive N Schmidt rebound value up to 25 • Does not slake readily in water • Geological pick cannot be pushed into surface • Hand penetrometer strength index greater than 250 kPa • Individual grain may be plucked from surface
III
Moderately weathered rock
• Completely discolored • Considerably weathered but possessing strength such that
pieces 55mm diameter cannot be broken by hand • N Schmidt rebound value of 25 to 45 • Rock material not friable
Type A
(S1-S5)
II
Slightly weathered rock
• Discolored along discontinuities • Strength approaches that of fresh rock • N Schmidt rebound value greater than 45 • More than one blow of geological hammer to break
specimen
Type B
(S6- S10)
I Fresh rock No visible signs of weathering or discolored
Vol. 14, Bund. F 10
Table 2:
Sheared surface areas are defined based on the percentage. The sheared surface areas are estimated and compared with the whole image area as to give the estimation of percentage of sheared, and the percentage of sheared surface area would be multiplied with the total area of the specimen to determine the area of the sheared surface.
MICROCRACKS PATTERN ANALYSIS Brittle fractures are fractures that occur by rapid crack propagation and without appreciable
macroscopic deformation where microcrack can occur by three modes which are direct opening or tensile (mode I), forward shear or sliding (mode II) and the sideways shear or tearing mode (mode III). This study only focuses on mode II which is sliding or shearing mode by analyzing microcrack pattern using SEM for pre-shear and post-shear of grade II and grade III granitic samples.
PRE-SHEAR
Surface Texture Analysis
The surface texture was studied before the shear testing was taken to know the degree of surface roughness. Roughness is a measurement of the inherent surface unevenness and waviness
PARAMETERS
SLOPE 1 (GS1) SLOPE2 (GS2)
Geology Granite Granite
Slope Profile
Slope Dimensions (w) 60 m x (h) 30 m (w) 120 m x (h) 42 m
Weathering Grade III, IV, V II, III, IV, V
Location CH 1200 CH 7260
No. of samples 10 samples (S1 to S10) 20 samples (S11 to S30)
Weathering Grade
Of selected samples
Grade III Grade II
Vol. 14, Bund. F 11 of the discontinuity related to its mean plane. It is a potentially important component of shear strength, especially in the case of dislocated and interlocked fractures (e.g. unfilled joints).This rough index is based on the percentage of joint surface in contact. The reviewed results show that the surface roughness increases the joint shear strength. Joint Roughness Coefficient (JRC) will be higher if the surface texture is rough and undulating. The surface texture affects the friction angle and cohesion since the roughness surface creates friction force and increase the shear stress on the discontinuity of the samples.
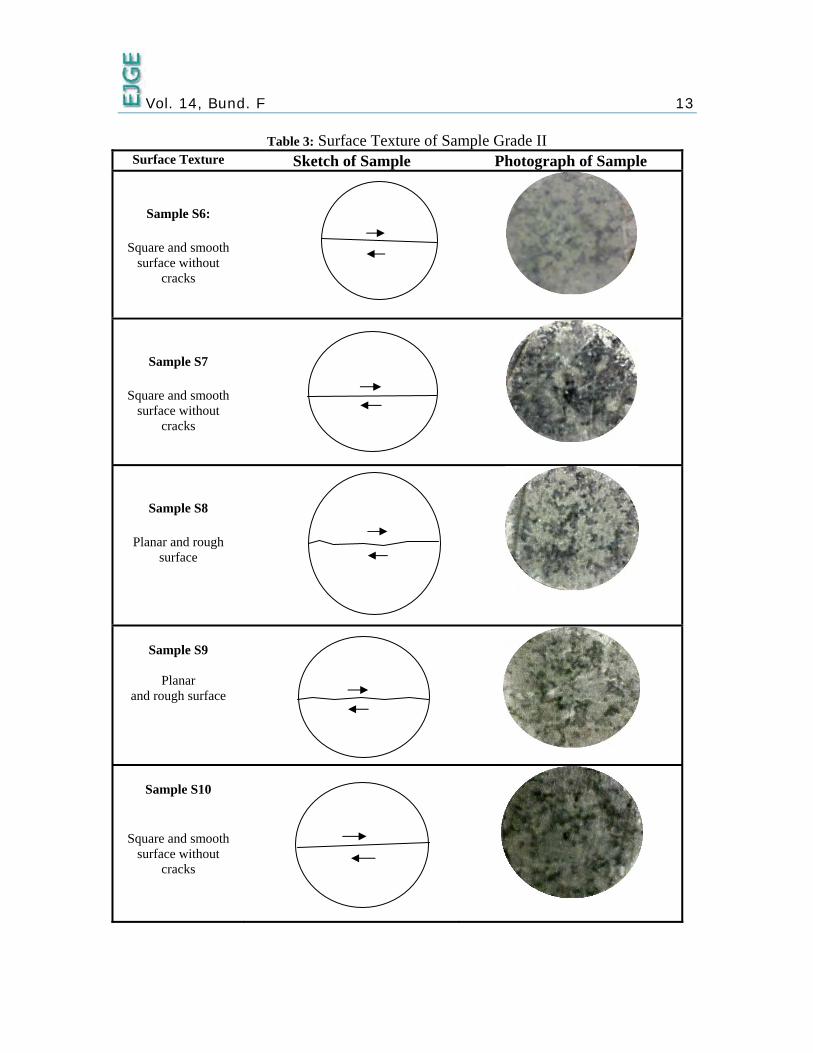
Three samples (S6, S7, and S10) are showing square, smooth and undulating surface texture without crack (Table 3). Two samples (S8 and S9) are showing planar and rough surface texture.
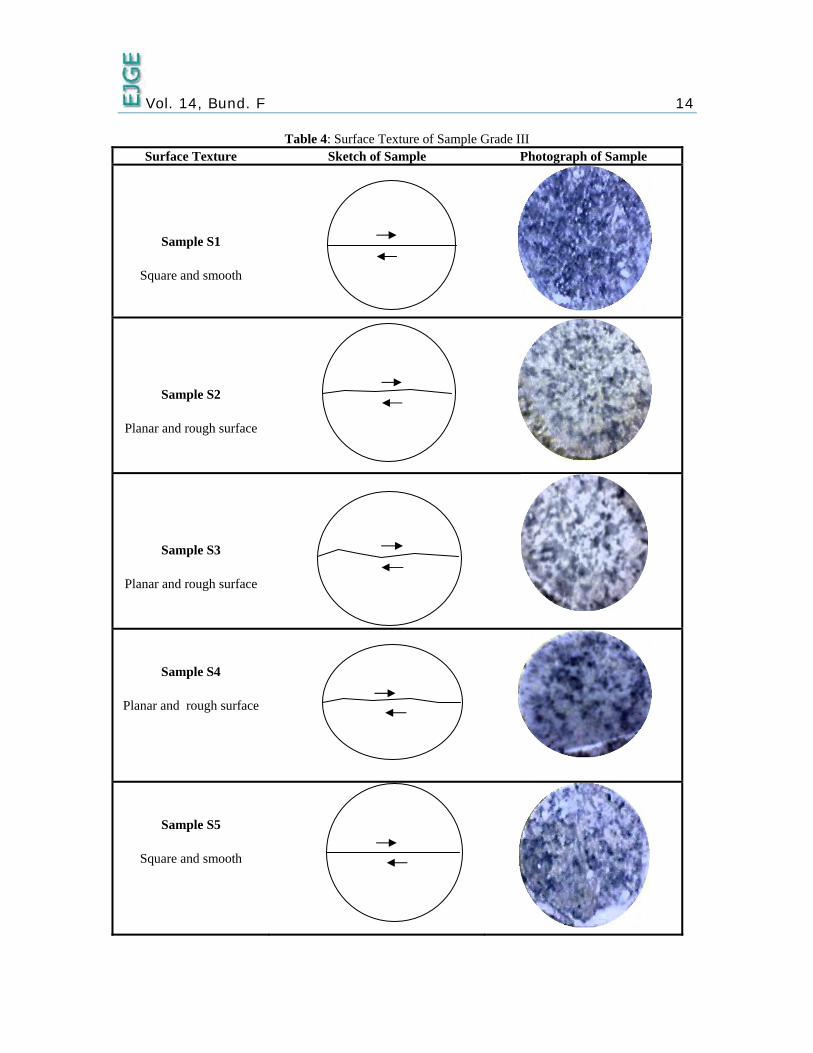
Table 4 shows the result of surface texture analysis for grade III samples. For Grade III samples, 3 samples show planar and rough surface and two samples show square and smooth surface. Sample S1 and S5 are easily sheared compared to sample S2, S3 and S4. Comparing grade II and grade III, grade II has more square and smooth surface since the surface are stronger compared to grade III. The stronger the rock means the more difficult for the surface of the rock to be eroded by the action of physical and chemical weathering.
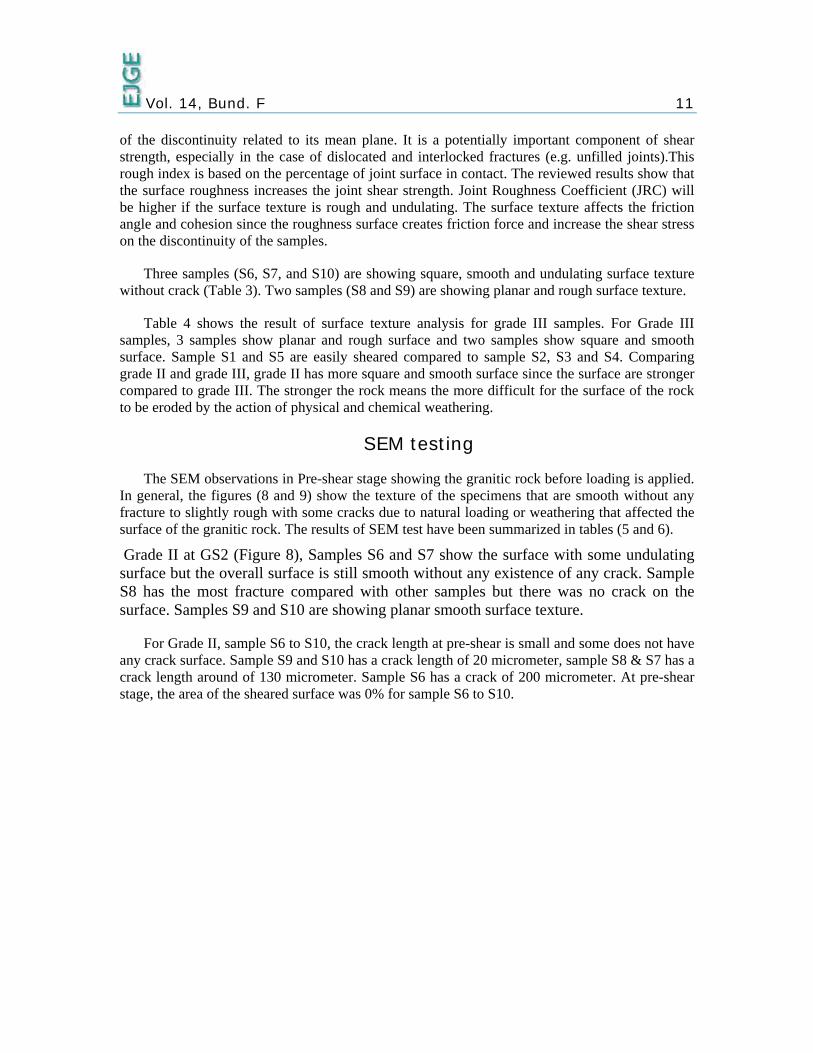
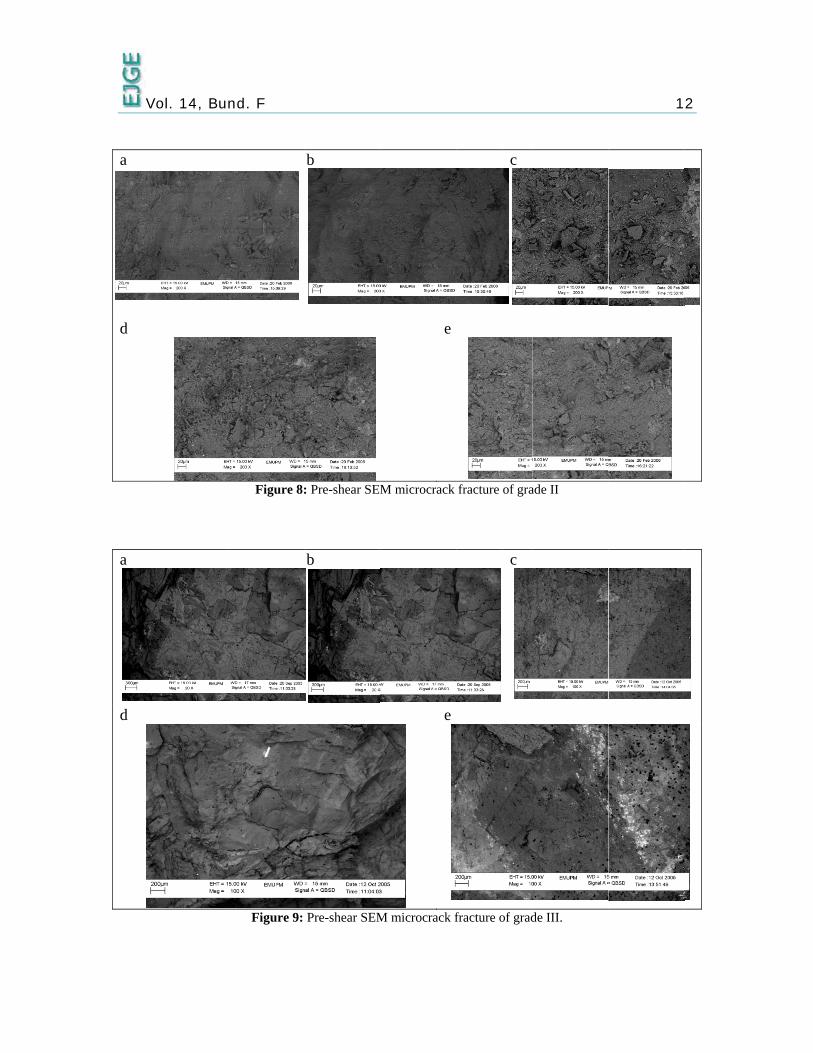
SEM testing
The SEM observations in Pre-shear stage showing the granitic rock before loading is applied. In general, the figures (8 and 9) show the texture of the specimens that are smooth without any fracture to slightly rough with some cracks due to natural loading or weathering that affected the surface of the granitic rock. The results of SEM test have been summarized in tables (5 and 6).
Grade II at GS2 (Figure 8), Samples S6 and S7 show the surface with some undulating surface but the overall surface is still smooth without any existence of any crack. Sample S8 has the most fracture compared with other samples but there was no crack on the surface. Samples S9 and S10 are showing planar smooth surface texture.
For Grade II, sample S6 to S10, the crack length at pre-shear is small and some does not have any crack surface. Sample S9 and S10 has a crack length of 20 micrometer, sample S8 & S7 has a crack length around of 130 micrometer. Sample S6 has a crack of 200 micrometer. At pre-shear stage, the area of the sheared surface was 0% for sample S6 to S10.
V a
d
a
d
Vol. 14, Bu
nd. F
Figure 8:
Figure 9:
b
: Pre-shear SEM
b
Pre-shear SEM
e
M microcrack
e
M microcrack f
c
fracture of gra
c
fracture of grad
ade II
de III.
12
Vol. 14, Bund. F 13
Table 3: Surface Texture of Sample Grade II Surface Texture Sketch of Sample Photograph of Sample
Sample S6:
Square and smooth surface without
cracks
Sample S7
Square and smooth surface without
cracks
Sample S8
Planar and rough surface
Sample S9
Planar
and rough surface
Sample S10
Square and smooth surface without
cracks
Vol. 14, Bund. F 14
Table 4: Surface Texture of Sample Grade III Surface Texture Sketch of Sample Photograph of Sample
Sample S1
Square and smooth
Sample S2
Planar and rough surface
Sample S3
Planar and rough surface
Sample S4
Planar and rough surface
Sample S5
Square and smooth
Vol. 14, Bund. F 15
Grade III samples, (Figure 9), has been tested with SEM testing where at pre-shear stage the microcrack fracture surface for sample S1has some undulating surface with existence of some crack. Sample S2 is also showing some rough undulating surface but without a presence of any cracks. Sample S3 and S4 are showing planar smooth surface texture. Sample S5 has undulating and rough surface. Therefore, Grade II samples are less weathered than grade III samples which show less fracture sand smooth surface.
The microcrack pattern analysis of pre-shear shows none of microcrack fractures was identified at this stage. However, grade II samples, surface is much smoother than grade III samples. Sample S1 to S5, the crack length at pre-shear stage does not exist in S1, S2 and S3 but S4 has a large crack with 800 micrometer and S5 with crack length of 400 micrometer. At pre-shear stage, the area of sheared surface is 0% for sample S1 to S5. Because grade II is less weathered and stronger than grade III samples which shows less fracture surface.
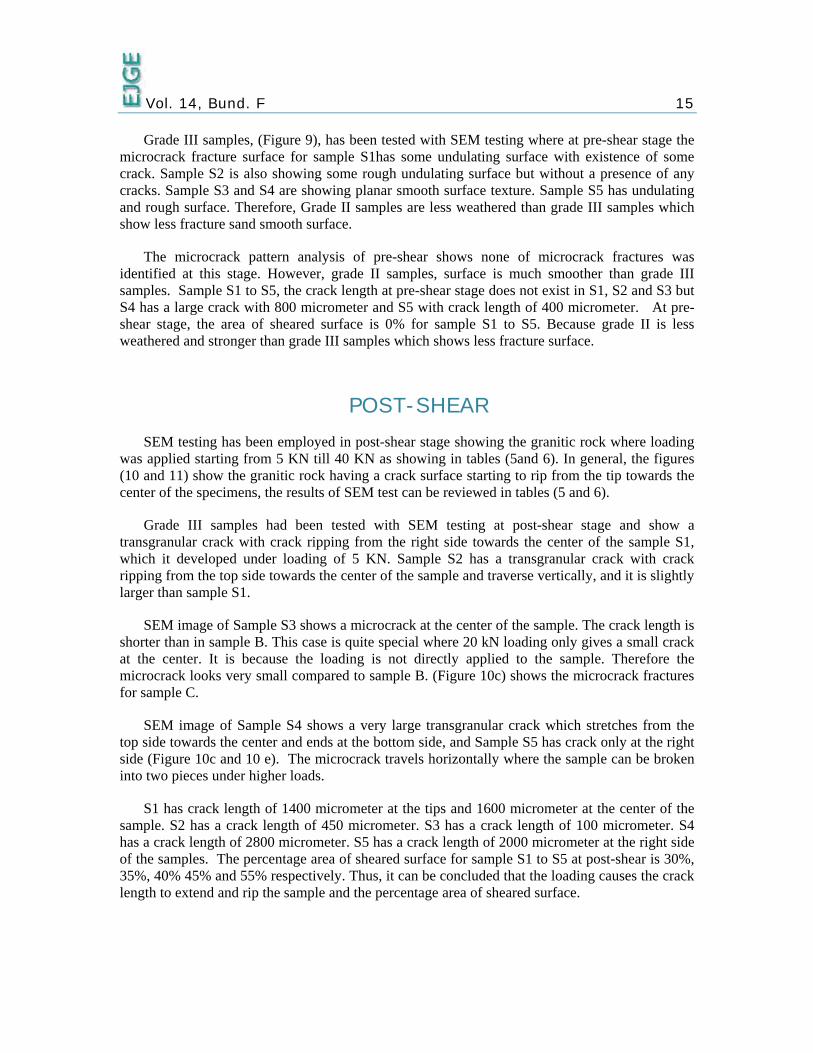
POST-SHEAR SEM testing has been employed in post-shear stage showing the granitic rock where loading
was applied starting from 5 KN till 40 KN as showing in tables (5and 6). In general, the figures (10 and 11) show the granitic rock having a crack surface starting to rip from the tip towards the center of the specimens, the results of SEM test can be reviewed in tables (5 and 6).
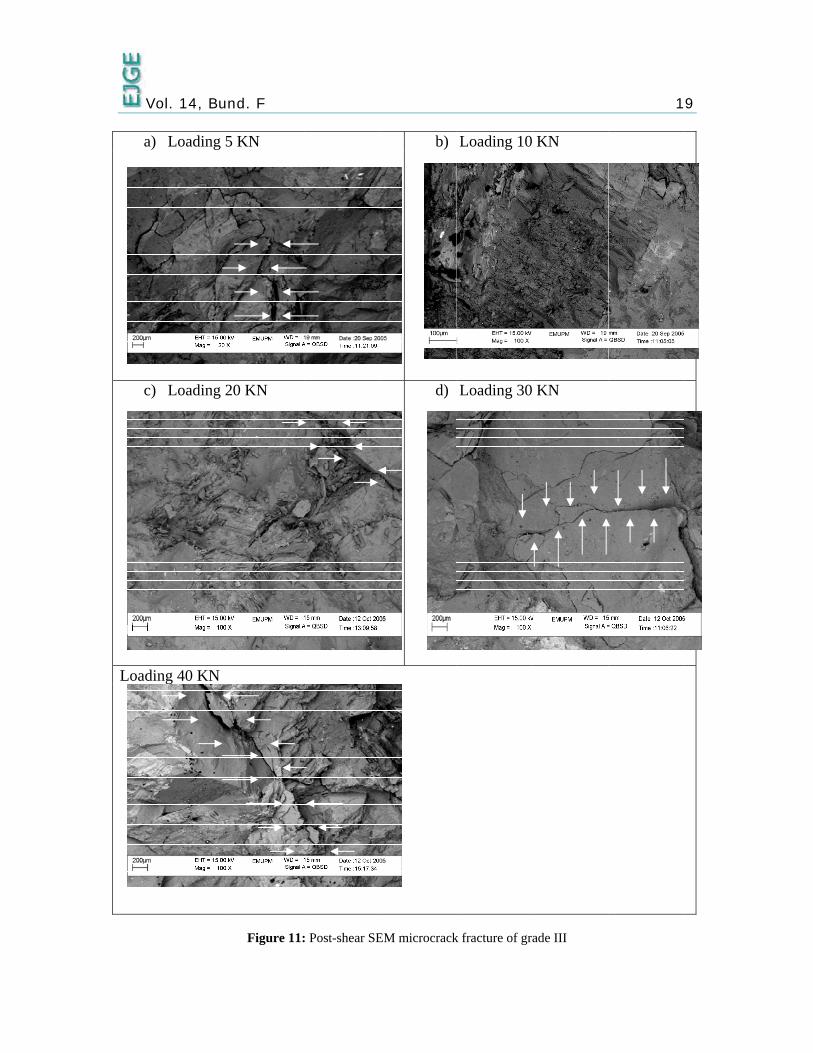
Grade III samples had been tested with SEM testing at post-shear stage and show a transgranular crack with crack ripping from the right side towards the center of the sample S1, which it developed under loading of 5 KN. Sample S2 has a transgranular crack with crack ripping from the top side towards the center of the sample and traverse vertically, and it is slightly larger than sample S1.
SEM image of Sample S3 shows a microcrack at the center of the sample. The crack length is shorter than in sample B. This case is quite special where 20 kN loading only gives a small crack at the center. It is because the loading is not directly applied to the sample. Therefore the microcrack looks very small compared to sample B. (Figure 10c) shows the microcrack fractures for sample C.
SEM image of Sample S4 shows a very large transgranular crack which stretches from the top side towards the center and ends at the bottom side, and Sample S5 has crack only at the right side (Figure 10c and 10 e). The microcrack travels horizontally where the sample can be broken into two pieces under higher loads.
S1 has crack length of 1400 micrometer at the tips and 1600 micrometer at the center of the sample. S2 has a crack length of 450 micrometer. S3 has a crack length of 100 micrometer. S4 has a crack length of 2800 micrometer. S5 has a crack length of 2000 micrometer at the right side of the samples. The percentage area of sheared surface for sample S1 to S5 at post-shear is 30%, 35%, 40% 45% and 55% respectively. Thus, it can be concluded that the loading causes the crack length to extend and rip the sample and the percentage area of sheared surface.

Vol. 14, Bund. F 16
Table 5: SEM analysis data for samples S1 to S5, Grade III
Sam
ple
No
N
orm
al L
oad
(kN
)
CRACK LENGTH
(Micrometer)
Percentage of sheared
surface (%)
Microscopic Fracture
Characteristics
Pre-shear
POST-SHEAR
Pre-shear Post-shear
POST-SHEAR
S1 5 0 1400 (outer) 1600(center)
0 30 The presence of open crack on the surface at the center and the tip
S2 10 0 450
0 35 Open crack at the outer of the specimen
S3 20 0 100
0 40 Presence of crack which starts from tip towards the center of the specimen
S4 30 800 2800 0 45 Presence of large crack at the center of the specimen
S5 40 400 2000
0 55 Open crack on the surface starts from tip towards the center of the specimen
Table 6: SEM analysis data for samples S6 to S10, Grade III.
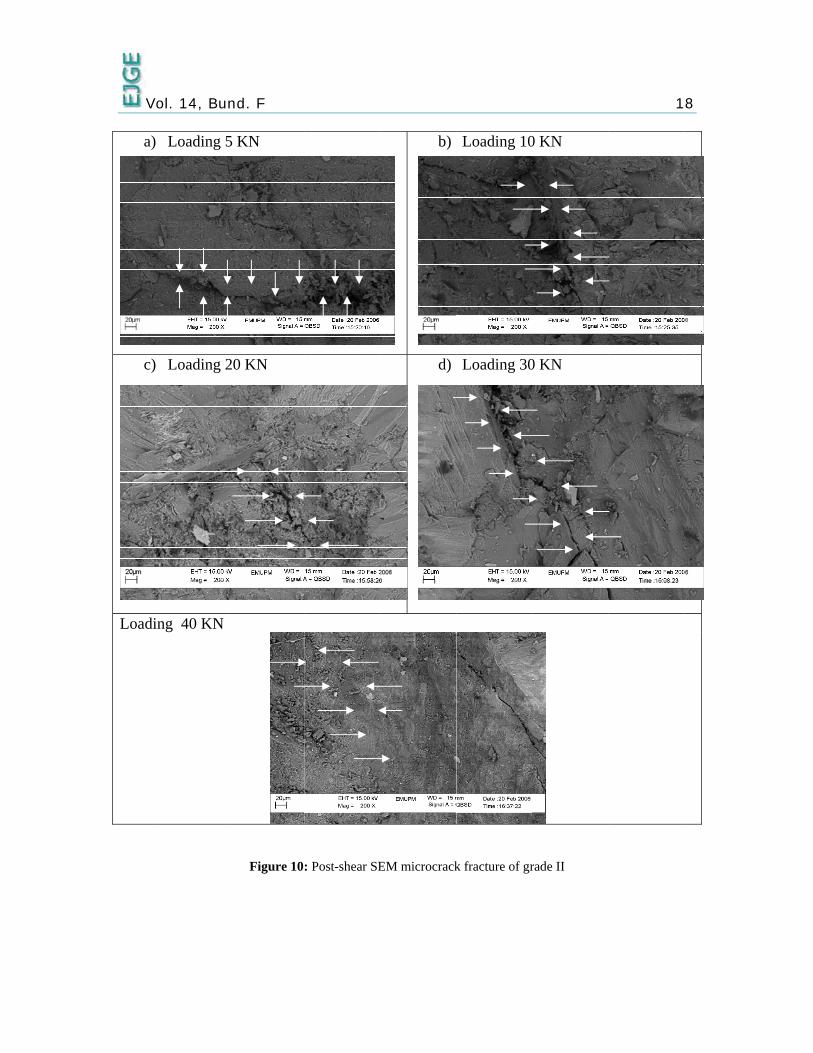
Grade II samples had been tested with SEM testing at post-shear stage and show a transgranular crack at the lower part of the sample S6 as shown in Figure 11(a), where the smaller crack can be observed at the tip and the surface texture is undulating. This may cause a difficulty for the surface to shear.
S
amp
le N
o
N
orm
al L
oad
(kN
)
CRACK LENGTH
(Micrometer)
Percentage of
sheared surface (%)
Microscopic Fracture
Characteristics
Pre-shear POST-SHEAR
Pre-shear
Post-shear POST-SHEAR
S6 5 0 100 0 0 The presence of open crack on the surface the side of the specimen, the surface is undulating
S7 10 0 40
0 20 A small crack at the tip of the specimen
S8 20 0 140
0 30 Presence of large open crack at the side of the specimen
S9 30 0 60 0 75 Presence of open crack at the outer of the specimen
S10 40 0 240(top) 180 (below)
0 80 Two large open crack on top and below the specimen
Vol. 14, Bund. F 17
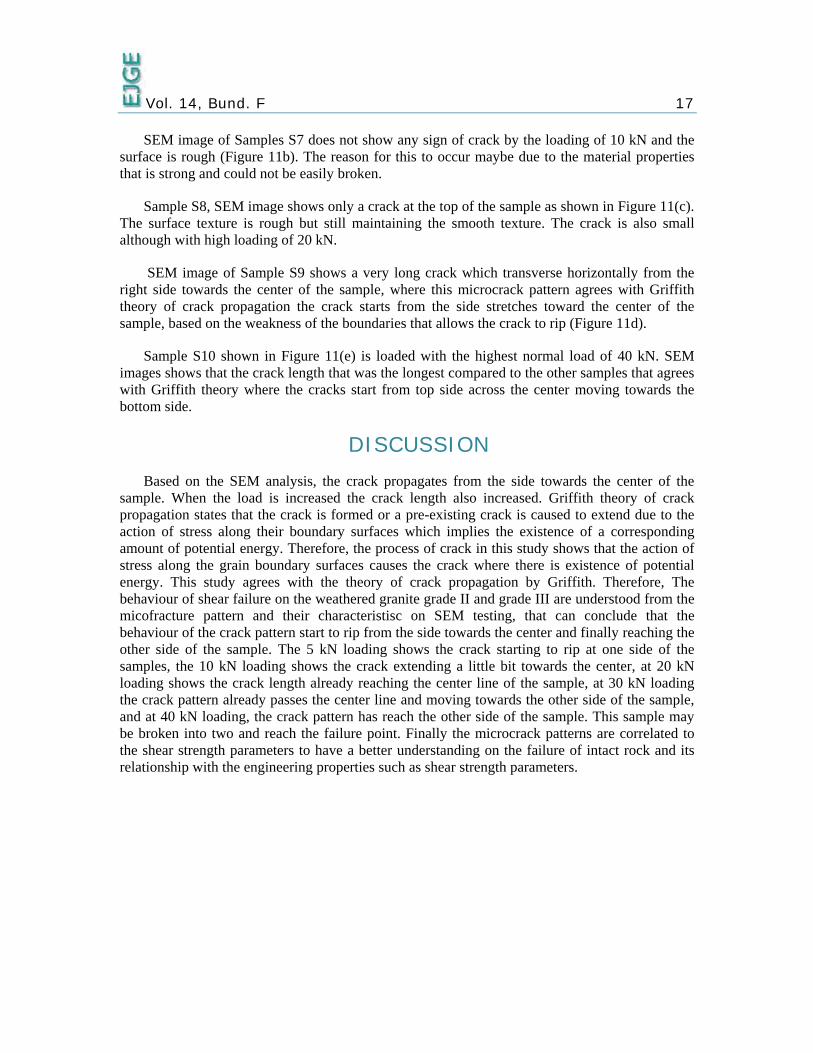
SEM image of Samples S7 does not show any sign of crack by the loading of 10 kN and the surface is rough (Figure 11b). The reason for this to occur maybe due to the material properties that is strong and could not be easily broken.
Sample S8, SEM image shows only a crack at the top of the sample as shown in Figure 11(c). The surface texture is rough but still maintaining the smooth texture. The crack is also small although with high loading of 20 kN.
SEM image of Sample S9 shows a very long crack which transverse horizontally from the right side towards the center of the sample, where this microcrack pattern agrees with Griffith theory of crack propagation the crack starts from the side stretches toward the center of the sample, based on the weakness of the boundaries that allows the crack to rip (Figure 11d).
Sample S10 shown in Figure 11(e) is loaded with the highest normal load of 40 kN. SEM images shows that the crack length that was the longest compared to the other samples that agrees with Griffith theory where the cracks start from top side across the center moving towards the bottom side.
DISCUSSION Based on the SEM analysis, the crack propagates from the side towards the center of the
sample. When the load is increased the crack length also increased. Griffith theory of crack propagation states that the crack is formed or a pre-existing crack is caused to extend due to the action of stress along their boundary surfaces which implies the existence of a corresponding amount of potential energy. Therefore, the process of crack in this study shows that the action of stress along the grain boundary surfaces causes the crack where there is existence of potential energy. This study agrees with the theory of crack propagation by Griffith. Therefore, The behaviour of shear failure on the weathered granite grade II and grade III are understood from the micofracture pattern and their characteristisc on SEM testing, that can conclude that the behaviour of the crack pattern start to rip from the side towards the center and finally reaching the other side of the sample. The 5 kN loading shows the crack starting to rip at one side of the samples, the 10 kN loading shows the crack extending a little bit towards the center, at 20 kN loading shows the crack length already reaching the center line of the sample, at 30 kN loading the crack pattern already passes the center line and moving towards the other side of the sample, and at 40 kN loading, the crack pattern has reach the other side of the sample. This sample may be broken into two and reach the failure point. Finally the microcrack patterns are correlated to the shear strength parameters to have a better understanding on the failure of intact rock and its relationship with the engineering properties such as shear strength parameters.
V
a)
c)
Load
Vol. 14, Bu
) Loading 5
) Loading 2
ding 40 KN
nd. F
5 KN
20 KN
Figure 10: Post-shear SE
b)
d)
EM microcrack
Loading 10
Loading 30
k fracture of gr
0 KN
0 KN
rade II
18
V
a)
c)
Load
Vol. 14, Bu
) Loading 5
) Loading 2
ding 40 KN
nd. F
5 KN
20 KN
Figure 11:: Post-shear SE
b)
d)
EM microcrack
Loading 10
Loading 30
k fracture of gr
KN
KN
ade III
19

Vol. 14, Bund. F 20
CONCLUSION Fractures in granite rocks can be progressed in many characters in terms of the density
networks of microcracks or microfractures which are caused by various geological processes under varying situations. The microcracks patterns of rock surfaces are studied to know whether the increment in shear stress does contribute to the increment of microcrack pattern of the weathering granitic rock at Pos Selim highway, Malaysia. The granitic rock specimens were sheared to failure, and mineral grains on the sheared surfaces of the failed specimens were analysed using petrographic microscope and scanning electron microscope (SEM). The microcrack propagation patterns can be categorized into two type which are type A and type B through this study. Type A is microcrack propagation pattern for granite grade II and type B is microcrack propagation pattern for granite grade III. Type A microcrack propagation pattern does not lead to failure and consists of minor crack surface, because type A material has higher strength compared to type B. Type B material show microcracks pattern system that propagates from the left side of the sample leading towards the right side of the sample which caused failure of the material. The relationship between the microcrack pattern and the shear strength parameters proves that an increase in shear stress and normal stress would result in increase of microcrack area. The results will be providing strategy planning for analyzing instability of rock slope by identifying the change in shear strength of rock surface based on the influence of weathering.
ACKNOWLEDGEMENTS The authors would like to extend their acknowledgement to the Minerals and Geoscience
Department of Malaysia, ZMS Consultant, Terratech Consultant for providing the necessary materials for this study. Also we would like to extend our appreciation to Research Management Center (RMC) - Universiti Putra Malaysia, and all the staff of Mountainous Terrain Development Research Centre (MTD-RC) for their support throughout this study.
REFERENCES 1. Barton, N., (1973) Review of a new shear strength criterion for rock joints, Engineering
Geology, Elsevier, Vol.7, 287-332
2. Eberhardt, E., Stead, D., and Stimpson, B., (1999), Quantifying progressive pre-peak brittle fracture damage in rock during uniaxial compression, Int. J. Rock Mech. Min. Sci. 36, 361-380
3. Ehlen J., (2002), Some effect of weathering on Joints in Granitic Rocks, CATENA, Volume 49, Number 1, pp. 91-109
4. Ehlen, J. and Zen, E., (1986), Petrographic factors affecting jointing in the Banded series, Stillwater Complex, Montana, J. Geol. 9, 575-584
5. Hani M. T., Anwar U., and Nureddin M.A., (2004), Practical Engineering Failure Analysis, Marcel Dekker, United States of America
Vol. 14, Bund. F 21
6. Hencher, S.R. and Martin, R.P., (1982), The Description and Classification of Weathered Rocks in Hong Kong for Engineering Purposes, Proceeding of 7th South East Asian Geotechnical Conference, Hong Kong, vol. 1, 125-142.
7. Hoek, E. and Bray, J. W., (1981), Rock Slope Engineering, 3rd editions, Institution of Mining and Metallurgy, London
8. Hutchison, C.S., (1977), Granite emplacement and tectonic subdivision of Peninsular Malaysia, Bulletin Geological Society Malaysia, No. 9, p 187-207
9. Komoo, I., Jamaluddin, T.A., Othman, M.A. and Singh, M., (2004), Engineering Geology of the Bukit Lanjan rock slope failure, Malaysia, Proceedings of the Malaysia-Japan Symposium on Geohazards and Geoenvironmental Engineering Recent Advances, Malaysia
10. Madun, A.: Stability Analysis of Weathered Rock Cut Slope using Geological Mapping and Laboratory Tests, Master thesis, Universiti Putra Malaysia, 2002.
11. Tan B.K. and Ibrahim Komoo, (1990), Urban geology: Case study of Kuala Lumpur, Malaysia, Engineering Geology, 28: 71-94
© 2009 ejge