metaeconomics approach \u0026 intellectual resources evaluation: multiple objective methods:...
TRANSCRIPT


METAECONOMICS APPROACH & INTELLECTUAL RESOURCES EVALUATION
1
Contents
About authors . . . . . . . . . . . . . . . . . . . . . . . . . . . . . . . . . . . . . . . . . . 5
List of schemes . . . . . . . . . . . . . . . . . . . . . . . . . . . . . . . . . . . . . . . . . . 7
List of tables . . . . . . . . . . . . . . . . . . . . . . . . . . . . . . . . . . . . . . . . . . . 8
Abbreviations . . . . . . . . . . . . . . . . . . . . . . . . . . . . . . . . . . . . . . . . . . 9
Preface . . . . . . . . . . . . . . . . . . . . . . . . . . . . . . . . . . . . . . . . . . . . . . 10
CHAPTER 1 . . . . . . . . . . . . . . . . . . . . . . . . . . . . . . . . . . . . . . . . . . . 12
Antanas Buracas
Metaeconomic Approach as Basis for Intellectual Assets Evaluation . . . . . . . 12
1.1. Metaeconomics and Knowledge Economy Researches . . . . . . . . . . . . . . . . . .13
1.2. Taxonomic interpretation of metaeconomic institutionalization . . . . . . . . . . . .17
1.3. Metaeconomic identification of social preferences and knowledge economics . . .23
1.4. Systemic meta approach to identification of intellectual potential components . . .29
Conclusions . . . . . . . . . . . . . . . . . . . . . . . . . . . . . . . . . . . . . . . . . . . . . . .37
References . . . . . . . . . . . . . . . . . . . . . . . . . . . . . . . . . . . . . . . . . . . . . . . .38
CHAPTER 2 . . . . . . . . . . . . . . . . . . . . . . . . . . . . . . . . . . . . . . . . . . . 42
Algis Zvirblis
Theoretical Framework of Multipe Criteria Evaluation of Country Intellectual
Resources . . . . . . . . . . . . . . . . . . . . . . . . . . . . . . . . . . . . . . . . . . . . 42
2.1. Introduction. . . . . . . . . . . . . . . . . . . . . . . . . . . . . . . . . . . . . . . . . . . . .43
2.2. Examination of promising multiple criteria evaluation methods . . . . . . . . . . . . .46
2.3. Basic intellectual resources components and indicator pillars . . . . . . . . . . . . . .54
2.4. Main multiple criteria evaluation principles and background models . . . . . . . . .56
Conclusions . . . . . . . . . . . . . . . . . . . . . . . . . . . . . . . . . . . . . . . . . . . . . . .61
References . . . . . . . . . . . . . . . . . . . . . . . . . . . . . . . . . . . . . . . . . . . . . . . .63

Antanas Buracas, Ilídio Tomás Lopes, Algis Zvirblis
2
CHAPTER 3 . . . . . . . . . . . . . . . . . . . . . . . . . . . . . . . . . . . . . . . . . . . 70
Ilídio Tomás Lopes
Between intangibles identification and their measurement and disclosure:
behind the value creation from innovation . . . . . . . . . . . . . . . . . . . . . . . 70
3.1. Introduction. . . . . . . . . . . . . . . . . . . . . . . . . . . . . . . . . . . . . . . . . . . . .71
3.2. Measurement and valuation of intangibles. . . . . . . . . . . . . . . . . . . . . . . . . .72
3.2.1. Models based on cost . . . . . . . . . . . . . . . . . . . . . . . . . . . . . . . . . . . . .72
3.2.2. Models based on market price . . . . . . . . . . . . . . . . . . . . . . . . . . . . . . . .73
3.2.3. Models based on expected returns . . . . . . . . . . . . . . . . . . . . . . . . . . . . .74
3.3. Particular cases . . . . . . . . . . . . . . . . . . . . . . . . . . . . . . . . . . . . . . . . . . .75
3.3.1. Intellectual property. . . . . . . . . . . . . . . . . . . . . . . . . . . . . . . . . . . . . . .75
3.3.2. Research and development . . . . . . . . . . . . . . . . . . . . . . . . . . . . . . . . . .76
3.3.3. Copyrights and trademarks . . . . . . . . . . . . . . . . . . . . . . . . . . . . . . . . . .77
3.3.4. Patents . . . . . . . . . . . . . . . . . . . . . . . . . . . . . . . . . . . . . . . . . . . . . . .78
3.3.5. Software development. . . . . . . . . . . . . . . . . . . . . . . . . . . . . . . . . . . . .79
3.3.6. Strategic alliances . . . . . . . . . . . . . . . . . . . . . . . . . . . . . . . . . . . . . . . .79
3.4. The intangibles reporting paradigm. . . . . . . . . . . . . . . . . . . . . . . . . . . . . .81
3.4.1. From its identification to its dissemination . . . . . . . . . . . . . . . . . . . . . . . . .81
3.5. Objectives and obstacles associated with intangibles recognition . . . . . . . . . . .86
3.6. Innovation as the core activity for sustainable turnover . . . . . . . . . . . . . . . . . .88
3.7. Final remarks . . . . . . . . . . . . . . . . . . . . . . . . . . . . . . . . . . . . . . . . . . . .93
References . . . . . . . . . . . . . . . . . . . . . . . . . . . . . . . . . . . . . . . . . . . . . . . .94
METAECONOMICS APPROACH & INTELLECTUAL RESOURCES EVALUATION
3
CHAPTER 4 . . . . . . . . . . . . . . . . . . . . . . . . . . . . . . . . . . . . . . . . . . 100
Antanas Buracas, Algis Zvirblis
Comparative Analysis & Complex Evaluation of the Intellectual Resources:
Baltic & Nordic Countries . . . . . . . . . . . . . . . . . . . . . . . . . . . . . . . . . 100
4.1. Comparative analysis of knowledge economy advancement: Baltic & Nordic countries . . . . . . . . . . . . . . . . . . . . . . . . . . . . . . . . . . . . . . . . . . . . . . . . 101
4.2. Impact of ITT on intellectual potential of Baltic & Nordic states . . . . . . . . . . . . 110
4.3. Complex Assessment of Intellectual Resources Development . . . . . . . . . . . . . 123
4.3.1. Multiple criteria assessment of intellectual resources: Lithuania‘s case . . . . . . . 123
4.3.2. Aggregate evaluation technique of intellectual resources determinants: case of Baltic States. . . . . . . . . . . . . . . . . . . . . . . . . . . . . . . . . . . . . . . . . . 129
Conclusions . . . . . . . . . . . . . . . . . . . . . . . . . . . . . . . . . . . . . . . . . . . . . . 133
References . . . . . . . . . . . . . . . . . . . . . . . . . . . . . . . . . . . . . . . . . . . . . . . 136
CHAPTER 5 . . . . . . . . . . . . . . . . . . . . . . . . . . . . . . . . . . . . . . . . . . 140
Algis Zvirblis
Multicriteria Reasoning of the Development Decisions of National
Intellectual Resources . . . . . . . . . . . . . . . . . . . . . . . . . . . . . . . . . . . 140
5.1. Introduction. . . . . . . . . . . . . . . . . . . . . . . . . . . . . . . . . . . . . . . . . . . . 141
5.2. Overview of multiple criteria decision making (MCDM) systems. . . . . . . . . . . . 142
5.3. MCDM framework for intellectual resources development strategy . . . . . . . . . 149
5.3.1. Conceptual approaches and reasoning models . . . . . . . . . . . . . . . . . . . . 149
5.3.2. Multicriteria evaluation technique for compatibility determinants . . . . . . . . . 152
Conclusions . . . . . . . . . . . . . . . . . . . . . . . . . . . . . . . . . . . . . . . . . . . . . . 159
References . . . . . . . . . . . . . . . . . . . . . . . . . . . . . . . . . . . . . . . . . . . . . . . 160
ANNEXES . . . . . . . . . . . . . . . . . . . . . . . . . . . . . . . . . . . . . . . . . . . 166

Antanas Buracas, Ilídio Tomás Lopes, Algis Zvirblis
4

METAECONOMICS APPROACH & INTELLECTUAL RESOURCES EVALUATION
5
Antanas Buracas
E-mail: [email protected]
Professor in Intellectual Economics & Banking, Internation-
al Business School at Vilnius University and Lithuanian Univer-
sity of Educational Sciences. Author of Reference Dictionary of
Banking and Commerce (1997-2010, 5 vol.) a/o scientific books
and articles in metaeconomics, regional multiple sector
forecasting, social infrastructure, economic terminology.
Ed.-in-chief, the scientific journal Intellectual economics; vice-
chairman of editing board, Universal Lithuanian Encyclopedia
(21/25 vol.).
About authors
The edition
METAECONOMICS APPROACH &
INTELLECTUAL RESOURCES EVALUATION:
was prepared with support of
International Business School at Vilnius University
Authors also thank the Faculty of Social Sciences,
Lithuanian University of Educational Sciences
for support at stage of final editing
Editor-in-chief
Antanas Buracas
2010–2012

Antanas Buracas, Ilídio Tomás Lopes, Algis Zvirblis
6
Algis Zvirblis
PhD, Habil. Dr., Full Professor in Economics and Man-
agement. The scientific activity is related to Lithuanian
University of Educational Sciences, Vilnius Gediminas Techni-
cal University, and Mykolas Romeris University; at times – to
International Business School at Vilnius University. Author
and co-author of more than 50 research papers, 2 scien-
tific monographs including Principles and Methodology of
Marketing Effectiveness Analysis (in Lithuanian).
The analytical and empirical research results were pre-
sented at international conferences in Lithuania, Bulgaria,
Greece, Latvia, Turkey, Ukraine, and Hungary. Research
interests: forecasting models in economics and business
finance, marketing control efficiency theory, quantitative
evaluation methodology of social-economical processes.
Ilídio Tomás Lopes
E-mail: [email protected]
Professor and Dean of School of Management and Tech-
nology (Polytechnic Institute of Santarém, Portugal). Gradu-
ate in Business Administration (Technical University of Lisbon,
Portugal, 1990), he obtained a Master Degree in Statistics and
Information Management (New University of Lisbon, Portu-
gal, 2001) and a PhD in Management, Specialization in Ac-
counting (University of Coimbra, Portugal, 2009). Researcher
in the fields of: Knowledge Management, Management and
Financial Accounting, Management Control Systems, and In-
novation. He is member of several scientific committees and
editorial boards. Currently he is also an associate researcher
at CCIM – Coimbra Centre for Innovative Management.

METAECONOMICS APPROACH & INTELLECTUAL RESOURCES EVALUATION
7
List of schemes
2.1. Main stages of multiple criteria evaluation 512.2. The scheme of evaluation procedures incorporating the common stra-
tegic framework for decision-making60
3.1 Lev´s value chain scoreboard 833.2 Complementary intangibles reporting 853.3 Main objectives related to intangibles recognition 863.4 Obstacles to intangibles recognition and measurement 873.5 R&D intensity in Europe, USA and Japan (1998–2010) 893.6 R&D intensity (% of GDP)and number (#) of patent registrations – 1998 903.7 R&D intensity and patent registrations – 2010 913.8 Innovation turnover 924.1 Main knowledge economy components in Baltic and Nordic countries 1034.2. Innovation objectives by groups of Baltic & Nordic States compared
with EU105
4.3 Comparison of competitiveness indicators by their effects on intellec-tual potential in Baltic and Nordic countries
109
4.4 Correlation between the companies capital and the organizational levels in the EU and innovative part of the service
112
4.5 Impact of ITT on intellectual potential of Baltic States 1164.6 Main pillars of CNR in Nordic & Baltic countries 1184.7 Expected impact of the EU Structural Funds on R&D spending in Lithua-
nia, 2007–2013122
4.8 Complex quantitative assessment of intellectual resources in determin-ing the country’s economic competitiveness
132
5.1 The procedure of strategic decision evaluation 1575.2 Scheme of strategic decisions reasoning and modeling the economic
development program indicators158
Antanas Buracas, Ilídio Tomás Lopes, Algis Zvirblis
8
List of tables
1.1. The system of indicators for measuring intellectual assets by main com-ponents
34–35
2.1 The underlying components and typical primary indicators 554.1. Knowledge economy component evaluations in Baltic and Nordic
countries 102
4.2. Innovation objectives in Baltic & Nordic States in 2006–2008 (as % of innovative enterprises)
104
4.3. The competitive surrounding of knowledge economy in Baltic and Nordic countries, 2011
106–107
4.4. Comparison of some ICT indicators in Baltic countries, Finland and Sweden, with EU, 2009
110
4.5. Human development indices and their components between the up-permiddle income group in Baltic and several Scandinavian countries, 2010
111
4.6. Indicators of competitiveness of the Baltic States interconnected with their intellectual potential (2009–2010)
113
4.7. Parameters of high technology development in Baltic countries and Poland
114
4.8. Part of Innovative companies adopted the new products or new pro-cesses in the Baltic countries, Poland and Finland (in %, 2008)
115
4.9. Enterprises with organizational and marketing innovations in the Baltic and Nordic States (in %, 2008)
115
4.10 Comparative networked readiness (CNR) indexes and their main pillars in Nordic & Baltic countries (2012)
117
4.11 The sustainable development goals in EU and Baltic countries at 2020 1214.12 Complex assessment results of Lithuania’s intellectual resources devel-
opment level index128
4.13 Expert examination of determinants and multiple criteria evaluation of the general IR index for Baltic States in 2011
130
METAECONOMICS APPROACH & INTELLECTUAL RESOURCES EVALUATION
9
Abbreviations
AHP Analytical Hierarchy Process
ARAS Additive Ratio Assessment
CNR Current Networked Readiness
COPRAS COmplex PRoportional ASsessment
CRM Customer Relationship Management
DMSS Decision Making Support Systems
DSS Decision Support System
EIS European Innovation Scoreboard
ERP Enterprise Resource Planning
GII Global Innovation Index
HDI Human Development Index
INSEAD – INStitut Européen d’ADministration des Affaires
KAM Knowledge Assessment Methodology
KE Knowledge Economy
K4D Knowledge for Development
MADM Multiple Attribute Decision Making
MCDM Multiple Criteria Decision Making
MIS Management InformationSystems
MODM Multiple Objective Decision Making
MOORA Multi-Objective Optimization by Ratio Analysis
MULTIMOORA Multi-Objective Optimization by Ratio Analysis plus Full Multiplicative Form
NRI Networked Readiness Index
OECD Organization of Economic Cooperation and Development
PERT Program Evaluation and Review Technique
PPB Planning Programming Budgeting
SAW Simple Additive Weighting
SCA Sustainable Competitive Advantage
SMAA Stochastic Multicriteria Acceptability Analysis
STOCKS – Strategic Tools to Capture Critical Knowledge and Skills
SWOT Strengths, Weaknesses/Limitations, Opportunities, and Threats
TOPSIS Technique for Order Preference by Similarity to Ideal Solution
UTADIS UTilités Additives Discriminants
VAIC Value Added Intellectual Coefficient
VAQMP Value Added Quality Management Processes
WBI World Bank Institute
WEF World Economic Forum
WIPO World Intellectual Property Organization
Antanas Buracas, Ilídio Tomás Lopes, Algis Zvirblis
10
Preface
The sustainable economic development in the newly EU countries has to be oriented
to definitive priorities of the competitive growth abilities as well as to creation of a modern
knowledge-based economy. This edition concerns the complex assessment principles of
the country’s knowledge economy advancement based on modern metaeconomic par-
adigm and intellectual resources (IR) evaluation by multiple criteria methods. The metae-
conomics specifies the interconnections between economic axiomatics & system of prin-
ciples and methods to be applied. The formulated theoretical backgrounds are focused
on the quantitative evaluation models, describing the direct influence of macro factors
and their interconnections (synergy effect) on IR development level. They are oriented to
applying the different significances of composite determinants, affecting the country’s IR
advancement.
On the one side, the World Bank expert evaluations of the essential country’s primary
indicators and their rating results are in detail analyzed by comparing the Baltic States
and Nordic countries. On the other side, the multiple criteria decision making system un-
der review applied Simple Additive Weighting, COmplex PRoportional ASsessment, Multi
Objective Optimization on basis of Ratio Analysis a/o modern methods integrated with
SWOT and qualitative analysis.
The reasoning principles of alternative strategic decisions and models, in particular,
were applied for detection of compatibility between the IR advancement strategy and
the countries’ economic development priorities also determinants of economic com-
petitiveness & opportunities of their (IR) development were created. According to the
proposed evaluation methodology, firstly, the determinants are examined quantifiably
by experts, with the significances of them established. Applying the Simple Additive
Weighting method, secondly, the general knowledge economy advancement index as a
consolidated measure has been determined. Baltic and Nordic comparative knowledge
economy advancement determinants have been evaluated according to the situation of
2011.

METAECONOMICS APPROACH & INTELLECTUAL RESOURCES EVALUATION
11
Antanas Buracas
12
Chapter 1
Metaeconomic Approach as Basis
for Intellectual Assets Evaluation
Antanas BuracasInternational Business School at Vilnius University
The metaeconomics as a systemic metatheoretical construct generalizing methodo-
logical approaches in the economic researches includes regulative principles concerning
so called knowledge economy or intellectual potential & ITT. In this context metaeco-
nomics determines the general and specific principles and criteria of economic sciences,
the order of their subordination and their distinction from other social sciences, interrela-
tions with management, sociology, psychology, demography and etc. The metaeconom-
ics specifies the interconnections between economic axiomatics & evaluation methodol-
ogy as a system of adequate principles and methods to be applied in its substantiation. It
conceptualizes the main epistemological and ontological positions (approaches) in terms
of relation between the economic activity and its researches. Some metaeconomic ap-
proaches are specified, in particular, interpreting social preferences within the economic
activity, determining the intellectual assets evaluations and intellectual capital efficiency.
They may constitute the principal suppositions for a system of knowledge economy pil-
lars and, in particular, determinants of measurement intellectual assets, intellectual re-
sources and intellectual potential (including other interconnected components).
Keywords: metaeconomics, economic methodology, social preferences, intellectual poten-
tial, knowledge economy, intellectual resources
JEL: A10, A13, B4, D83
METAECONOMIC APPROACH AS BASIS FOR INTELLECTUAL ASSETS EVALUATION
13
1.1. Metaeconomics and Knowledge Economy Researches
Metaeconomics is determined below as a systemic metatheoretical construct general-
izing the main predominating methodological approaches in economic sciences and re-
searches and, at the same time, as a system of specified approaches between the dynam-
ic real economy and its analytical researches within conventional economics. It includes
the conceptualization of theoretical criteria for the new conventional and hypothetical
problems and the new fields of economics, such as the measurement of intellectual capital
and the effect of creativity, or the efficiency of any social activity outside the traditional
economics & management (such as music, religion, sex and many other, cf. annual pro-
ceedings of the AEA) starting to become decisively important under the trends of glo-
balization. In such meaning, metaeconomics is interpreted as a system of a higher logical
order concerning economics, similar to metalogic (as a critical examination of the basic
concepts of logics abstracted from any meaning given to them in the systems studied,
metamathematics (as a logical syntax of mathematics, metaethics (discipline dealing with
the foundations of ethics specific with the nature of normative utterances and ethical
justification (Webster’s 3rd Intl. Dict.).
The dynamic changes in the structures of general and special economic methods have
to be conceptualized with regard to the hierarchies of socio-economic priorities and their
realization in the programming and forecasting processes. A special attention in this
approach must be given to the metatheoretical – both formal and substantive – criteria
of socio-economic constructs concerning material production and social infrastructure
as well as the co-measurability criteria of any creative activity. The last one is of a special
value within the modern world of highly industrialized economies mostly basing the sus-
tainable growth and reproduction of GNP on the accumulated intellectual wealth and
intellectual property.
The metatheoretical generalization has to include the postulates summarizing the in-
terdependence between the socio-economic activity and its conceptualizations with
the account on different social interests and motivations between the gnoseological and
normative conceptualization of constructs and the attribution inferences interpreting a
social development, and this is discussed below.
The metaeconomic attitudes have been maturated with some new trends in eco-
nomics, first-of-all in the political economy (cf. Keynes, 1891; Lange, 1959). The priority
Antanas Buracas
14
of introducing the term of metaeconomics belongs to Karl Menger who developed
the neowalrasian approach to the laws of return (Menger, 1936) and the mathematical
formalism of the neoclassical economics foundations.
The contemporary meaning of metaeconomics was conceptualized about 40 years ago
as a special metatheoretical system analyzing the taxonomical contents of economic
methods and criteria, also the nature of economic concepts and judgments through
the analysis of the logical and semantic aspects interconnected directly with methodol-
ogies of the economic sciences (cf. Buračas, 1967; 1968; 1973). Now the metaeconomics
as a study of the foundations of economics is presented by other authors (F. Parkinson,
Schumacher etc.).
The half of a century the term metaeconomics spread moderately over the conti-
nents: last ten years web searches presented about 180–200 addresses at 2000 and
about 3000–5000 now. The appropriate studies by Gary D. Lynne, prof. of Nebraska-Lin-
coln University (presenting various aspects of his changing opinion on metaeconomics
contents) are mostly widespread (http://agecon.unl.edu/lynne/metaeconomics.htm).
The popularity of the term is reflected even in its commercialization within the intel-
lectual resource fields (consultations, management, marketing): now is functioning
Metaeconomics Research Center (El Centro de Estudios de Metaeconomia, Madrid), also
Meta Economics Consulting Group (Canberra) as a private entities providing advisory and
consultancy services, as well as training and research on the development of real alter-
natives on economic and human development at the local, national and global levels
(www.metaeconomics.com; www.metaeconsult.com.au/ metaeconomics/Home.html;
www.reasnet.com/cgi/tablon/).
Some authors prefer to restrict themselves with the methodological categories of
system analysis or self-organization theory in economics when commenting some me-
tatheoretical aspects of continuous development within economic systems (Z. Lydeka
or economic cybernetics, USSR). In essence, many results of this point of view may be
integrated to and interpreted within wider context of metaeconomics.
The taxonomical structurization of the metaeconomics differ, consequently, the fol-
lowing metatheoretical components:
a theoretical paradigm of economic system and then base for solving the para-
digm (cf. the structural economics of unilateralism); or an abstract issues of eco-
nomic epistemology as itself (Peter G. Klein; www.mises.org). Usually exist various
•
METAECONOMIC APPROACH AS BASIS FOR INTELLECTUAL ASSETS EVALUATION
15
and discrepant paradigms of economic system at the same time; so the metaeco-
nomic approach has to find some informal methodological generalization fixing
its main constituents;
the system of economic principles, postulates, procedures and methods, both
general and special, their subordination, coordination and interpretation;
the criteria and principles of the taxonomical arrangement of the economic meth-
odology, the subordination of the economic sciences, subsystemic conceptualiza-
tion and optimization according to normalized aims and tasks of socioeconomic
development;
the criteria of construction, comparability and reliability of different economic the-
ories, hypotheses and doctrines as purposely ordered and determined regulative
entities of conceptual interpretations of the real socioeconomic phenomena, pro-
cesses and relations;
the criteria and principles of interconnectivity between economic researches and
other analytical fields of integral reality (such as sociology a/o social sciences, ecol-
ogy, ethics and so on).
The economic methodology includes, first-of-all, the systemic principles of conceptual
and doctrinal applicability of the approved methodological instrumentaria (Schumacher;
Parkinson) within socioeconomic researches – from different postulates to hypotheses
and theories as well – with account of changing socioeconomic reality in gnoseological
aspect. On the following stage it is necessary to show that metaeconomic approach is
esp. useful in evaluations of the perspective situations, such as globalization effects previ-
ously nonconceptualized, new developments of intellectual potential or the econometric
modeling of the global shocks impact. In this context, metaeconomics is interconnected
with alternative economies in order to transform it in more ecologic and human system of
constructive approaches (Zsolnai; Lynne). As noticed Ch. M. Quigley, “Rationality must re-
constitute itself with moralities, ethics and philosophy”, “To get out of… ”economic crisis”,
governments must start thinking in Meta-Economic modalities”1.
1 From there, some authors often interpret the metaeconomics in such its narrow meaning as:• an economic approach that makes ethics and the moral dimension explicit in economic reasoning (Lynne, 2003): “Metaeconomics in contrast to (neoclassical) microeconomics proposes to reintegrate ethics and economics (www.puaf.umd.edu/students/ecolecon; the modification of such approach is in: http://csf.colorado.edu/ecolecon/2000/); • or an economic theory seen from generalized philosophical view (Crosser, 1974),
•
•
•
•

Antanas Buracas
16
This approach is important and merits serious consideration but it exaggerates the de-
cisive role of moral constituents: the appropriate value systems and their subordination are
not adequate and can’t be adequate to the systems of various social interests when deter-
mining aims and behavior of economic agents.
The metaeconomics in other approaches is defined as influenced by the ecosystem and
the social system asserting and sometimes controlling over the individual (cf. Lynne, .E.F.
Schumacher a/o.:http://agecon.unl.edu/lynne/ metaover.htm; …/metapape.htm; http://
www.indiadevelopmentblog.com/2008/06/is-it-always-economics-vs-meta.html; http://
www.carbonmarketinstitute.org/membership/carbon-industry-participants/111320/) but
not necessarily in their interrelations with the economic system as itself as follows in my
opinion. So, the methodological accent of the metaeconomics is deflected in such ap-
proaches rather to the psychological or ecosystem aspects in the place of socioeconomic
contents that change substantially the individual motivations2.
At the same time the widespread cases are when the term metaeconomics is used by
some authors just to stress particular metatheoretical features of any economic research
in marketing, management, agricultural economics and so on. As some modification of
such approach is so named econophysics, last year’s pretending to physical understand-
ing or modeling in economics (Frank Schweitzer). But even rather preliminary approach
necessitate to doubt is it such approach: continuing presentation, many representatives
of the econophysics define it as an application of mathematical methods to societal
problems or even a statistical physics model; or complex network approach to analyze
financial systems (www.fractalgenomics.com).
• or an economic theory that sees human nature as not only egoistic-hedonistic but also potentially empathetic-sympathetic, and perhaps even compassionate-altruistic (also Lynne, 2003) or an eco-nomics changed in altered, transformed form (Lynne, 2003).
In about all these cases the term metaeconomics may be interpreted as an analytical engine for institutional and behavioral economics, drawing upon economic psychology, ethics and sociology and based on dichotomy: empathy-altruism simultaneously capable of egoism-hedonism (Gary D. Lynne). Under this approach, “metaeconomics theory ...is focused on the intrapersonal in contrast to the interpersonal relationships, the latter reflecting norms and relationships”. Consequently, this methodological position to metaeconomics is compatible with the conclusion that it “is by its na-ture empirical in its approach” p. 423). Under such an approach, the moral dimension has (relative) price content (http://agecon.unl.edu/ lynne/london_files/frame.htm).
2 Does metaeconomics sees the norms and shared values embedded in the Invisible Hand according to the opinion of Gary D. Lynne? Mostly yes, but not necessarily and not only it. We can expect any-way that metaeconomics substantiate the criteria interconnecting principles of economic subject and socio-economic activity.
METAECONOMIC APPROACH AS BASIS FOR INTELLECTUAL ASSETS EVALUATION
17
1.2. Taxonomic interpretation of metaeconomic institutionalization
The intellectual resources characterize first-of-all the social and information infrastruc-
ture of economics. The taxonomy supposes systemic regulation of totality of economic
principles and methods, also their subordination and corrections resulting under develop-
ing understanding of economic aims hierarchy also, alternatively, optimality or efficiency
within some structurization level or time period a/o when task criteria are fixed. Among
the decisive criteria of social development, the real systems of social and economic pref-
erences including management practice is of significant importance. They determine the
corresponding hierarchies of conceptual priorities taxonomically arranged that logically
transform the real criteria into about adequate abstract constructs. The cases of metae-
conomic rethinking of virtual methodological developments, p. ex., to the economic as-
pects of new activities or activities traditionally not included into economic evaluations,
may correct the taxonomy of these constructs under criteria influence, first of all, with
account of the macroeconomic efficiency of these activities to be included (as influence
of quotations or value of trademarks on the balance of companies’ assets).
The widespread proposition for years was that the real processes are changing per-
manently so any scientific research methodology has no practical sense; more softly it
sounds: “…no generally acknowledged methodology for economic systems investiga-
tion, or unified research methods and means have been created” (Lydeka, 2003). In fact,
various researchers are often using different research methods when studying the same
aspects of the economic reality but that do not deny the objective scientific meaning and
efficiency of systems of methods existing parallel. So, the approach to utilities’ measuring
does not deny the applicability and exceptional efficiency of labor value method (in ma-
terial production). Just first approach has some apriori advantages when evaluating the
non-material services in the social infrastructure or production of the creative labor. The
situational or stocks analysis in economics do not denies the flow research productivity,
the different methods in this case, like in previous, are complementary one to another.
On the contemporary level of general economic methodology, the common meth-
odological positions of scientific researches like deduction-induction mostly prevail.
However, the studies on the level of special methodology reveal the interconnection
not only of specific methods from various economic and other social sciences, but also
Antanas Buracas
18
natural sciences and interscience fields, such as theory of self-organization, entropic and
synergetic effects and similar cases.
The preferences revealing ranks in the satisfaction levels of needs or priorities between
the different ways and means of their satisfaction are substantially influenced by degree
of risk, by the relations between expenses and their productive effect, also between vari-
ous social activities, by the distribution of available resources, by different material inter-
ests of economic agents and so on. With account of this influence, the social criteria and
tasks may be arranged into consecutive conceptual system instituting its different levels
and with account of changing normative (or minimax) functions detailing admitted hier-
archies of those preferences at various periods of development. The normativity and ob-
jective preconditions, such as available natural and/or intellectual resources, productive
capacities and productive capital (including knowledge), disposable technologies and
managerial practices, ecological sustainability, determines and quantify the probability of
the achievement of those systemic aims and tasks of socioeconomic development.
Other specific problem is possible variety of socioeconomic concepts imitating or de-
picting the same real economic system: the methodological task then is to find non-con-
tradicting solution when interpreting the possible intersection of multilevel utility criteria
and different hierarchies (of social preferences, cf. 1.3). One of possible metaeconomic
approaches in such cases may be the formulation of metatheoretical constructs and ad-
equate typologies of higher rank to be a common ground for all this variety of the con-
cepts.
The metaeconomic approach is a normative mean for typological arrangement of so-
cial or regional differentiation of socioeconomic activity depending on productive, cul-
tural, technical, managerial, demographic a/o social functions or tasks and requirements.
The typologization as a normative basis helps to optimize the efficiency of any activity,
also to minimize the information noise when taking solutions or preparing programs in-
cluding the predictions of future trajectories and structural developments of the eco-
nomic systems.
So, any socioeconomic program integrates both the rank of criteria based on the com-
mon values and other rank differentiating the rational criteria, p. ex., public health, education
and cultural development,also nutrition, according to the national, ethnic, sexual a/o fea-
tures, depending of prevailing traditions, achieved level of development, geopolitical fac-
tors (climate also), cultural a/o behavioral stereotypes. Besides, a common situation is when

METAECONOMIC APPROACH AS BASIS FOR INTELLECTUAL ASSETS EVALUATION
19
normativity is modified as a result of, let say, changes in socioeconomic interests: for exam-
ple, a more desirable but less probable social decisions and solutions may be preferred to
those of less desirable but more probable within the determined limits of alternative risk.
The conceptual institualization under metaeconomic approach involves not only the
morphological or syntactic approaches to the mostly sustainable economic systems but
also semantic and pragmatic ones (with regard of social and historical character of their
dynamics as integral process).
From the syntactic aspect, the structure of a concepts or hypothesis on some constitu-
ents of the economic system is investigated and characterized with regard to their func-
tions – different for intellectual and material factors but interacting. In the semantic sense,
the gnoseological analogues are explored as an instrument for expressing and interpreting
their meaningful significance on different levels of abstraction. The sygmatic aspect con-
sists in the interpretation of the economic systems and structures as a means for express-
ing their conceptual significance (it is impossible to apply the same reproductive criteria,
say, for industries and informatics). In pragmatic aspect, the doctrinal or practical applicabil-
ity of analytical usage of conceptual patterns of the real socioeconomic systems is realized.
The praxeological approach covers mostly the analytical aspects to the economy as a self-
organizing system what is esp. important from managerial contents of the economy.
The regulative principles, procedures and postulates applicable to sphere of intellectual
economy are based both on account of apriori axiomatization and internal regularities of
socioeconomic systems, such as:
internal structuralism and complexity;
negantropical orientation, i. e. open morphology changing toward increasing or-
der;
nonlinearity, i. e. dynamic change of interrelations between different parts of the
economic system in the process, also change of systemic interactions with eco-
logic a/o environments (incl. development of inventions);
multiplicity of values and purposes determining the characteristics and levels of
non-material economic activity;
integrity of the system and coherence at all levels of its structural composition incl.
normativeness & innovation trends;
openness resulting from interregional and international division of labor & agree-
ments on web, DB, Facebook etc.;
•
•
•
•
•
•
Antanas Buracas
20
equifinality, i. e. purposeful predetermined ability to reach a specified final from
different initial states and by different ways using dynamic regulative mechanisms
& achievements in KE;
self-reproductability of structures, relations, productive, managerial, ecologic a/o
intellectual resources;
synergy, i. e. interactive integrity& resulting multiplicative efficiency;
evaluative congruity of socioeconomic systems;
descriptive consistency of socioeconomic systems;
sensitivity of socioeconomic systems to both structural displacements and external
disturbances and similar others.
Some of those objective regulative principles conceptualized into tenets of methodo-
logical range are peculiar not only to the socioeconomic researches but also to any really
functioning systems. The topology of metaeconomics integrates the iterative taxonomic ar-
rangement of all significant gnoseological levels and their phenomenological foundations.
Of special criteria characterizing the inner contents of the economic methodology
may be mentioned such as:
interactions between reistic categories and concepts, on the one side, and those
of socioeconomic interests, creative intellectual activity, on the other side;
fundamental impact of capital (including intellectual – managerial, information
etc.), under substantial endogenization of the sustainability and innovations crite-
ria, to the efficiency of the activity;
non-elasticity of information economy to traditional sectors in macroeconomic
growth but higher elasticity of intellectual assets and their higher dependence
from conjuncture shifts comparing with the main capital;
integration of non-material criteria of effectiveness and transition from traditional
wealth to criteria of personal needs’ satisfaction and creativity development;
systemic interrelations between dynamic socioeconomic regularities of strict de-
termination, on the one side, and those statistical regularities of stochastic charac-
ter, on the other side;
commensurability of the expenses of resources and activity, on the one side, and
the productive results, on the other side, based on commensurability of labor time
for producing definite utilities or effect, with account of dual character of labor
(syncretic and abstract, reproductive and creative);
•
•
•
•
•
•
•
•
•
•
•
•

METAECONOMIC APPROACH AS BASIS FOR INTELLECTUAL ASSETS EVALUATION
21
orientation to preconditions of dynamic sustainable equilibrium of economic sys-
tem within such its constituents as supply-demand for new intellectual services,
investments into knowledge assets and their efficiency evaluations;
asymmetries in dynamics of intellectual economy interconnected with dynamic po-
tential changes: intellectual needs’ satisfaction is worsening softer in cases of depres-
sive income diminishment than its proportional growth under booming incomes;
interactions between socioeconomic tendencies and counter-tendencies result-
ing from:
contradicting interests and aims of activity
or changing their direction under different social and historical conditions;
concerted interactions between structural ingredients of socioeconomic stere-
otypes and systems, such as institutions of various ranks, traditions, rules and
management techniques, stereotypes of production, distribution and allocation,
investment, consumption a/o;
interdependence between the socioeconomic reproductive relations and the lev-
els (and forms) of social division of labor (such as specialization, cooperation a/o);
consistency of traditional principles and aims of socioeconomic activity (their sub-
ordination or consecutive priority in cases of their contradictiveness), such as:
expense maximization under predetermined level of output production and its
quality,
or effect maximization in satisfying final predetermined needs (under available
resources);
or partial compatibility of some contradicting criteriatasks, as near to maximal
growth and near to minimal unemployment;
reflection of socioeconomic priorities and their subordination in behavioral con-
sumers’, investors’ a/o preferences and stereotypes so as decisions concerning
baskets differ in various social groups;
discount principle as a metaeconomic transitivity approach when going from
present to future estimates within value hierarchies and their alternative material
socioeconomic implications within consumer or investment, or managerial strate-
gies and stereotypes; it also helps to compare and/or combine current and future
socioeconomic interests;
and similar ones.
•
•
•
•
•
•
•
•
•
•
•
•
•
•

Antanas Buracas
22
As a result of objective character of metaeconomic principles, their diversity does not make
problemic the definitions of the economic systems which are, naturally, different in various
methodological or theoretical trends of economics3.
The institualization of extended conceptual criteria depends of the logical and chrono-
logical discursiveness of the social value hierarchies and their interdetermination, first of
all taking into account that social preferences reveal the changing lifestyles, in particu-
lar, under the influence of adaptable rationality in post-industrial societies. Consequently,
the understanding of rational activity evolved with development of the socioeconomic
formations and productive capacities of new technologies, growth of knowledge econo-
mies significance. They are determining consecutive orientation from accumulation of
material wealth to the volatility of financial capital and, later, to the intensively used intel-
lectual resources.
As a special field and aspect of the problematic under review, the influence of the
globalization can be mentioned within the context of metaeconomics. The concurrent
processes of the formation of the international global economics and adequate special
regulative principles of macroeconomics have to be mentioned between interconnected
aspects:
territorial intermediation of different regions of the world under new contents and
new criteria of the international division of economies with account of productive
significance of widespread innovations;
direct connections between interdependencies (internet a/o) of modern means of
productive interaction.
The conceptual transition from categories of world economic system to noospheric
understanding of global economic civilization determined the inclusion of costs of ex-
ploitation of non-renewable and intellectual resources, and other sustainable develop-
ment factors into modern comparison between results and common expenses, not only
direct, but total, of productivity. Characteristic example is changing outmeasure of eco-
3 It is why is difficult to agree with prof. Z. Lydeka (2003, p. 171–174) seeking for “universal quality defi-nition of an economic system”: such definition will be mostly different for the researcher of ecologi-cal sustainability and financial investor, for economic agents at diverse stages of life cycle or repre-sentatives of social strata with various motivations or material interests. At the same time, the criteria of such definitions may be objectively compatible and not contradicting one to other, just with changing priorities and depending from predetermined aims and tasks of the systemic research.
•
•
METAECONOMIC APPROACH AS BASIS FOR INTELLECTUAL ASSETS EVALUATION
23
nomic efficiency of nuclear energy: after revision of its risks and reevaluation of additional
sustainability costs (wastes etc.), its priority became not so obvious.
The metaeconomic aspects of intellectual resources evaluation are especially impor-
tant. The intellectual capital produces the main part of the GDP in most developed econ-
omies of the world (by various evaluations, from 3/5 up to 2/3 at the beginning of 21st
century) but it is still not measured adequately in official statistical data bases, as a result
of non-reliability of existing methodologies measuring their efficiency.
The interactive matrixes of the intellectual capital by components, their separated and
integrative impact to the results of activity with account of Scania and WBI criteria de-
velopments help to evaluate more precisely their expected and productive efficiency, to
fulfill the interbranch and interregional comparisons, and argumented their perspective
priorities. The progressive technologies of intellectual resources evaluation, such as SWOT,
PERT (Program Evaluation and Review Technique), PPPB, critical way, neuronal nets (paral-
lel solutions), operational scales of measurements based on them a/o, helped to see the
interconnected problems and metaeconomic aspects more widely and precisely from
methodological approach.
1.3. Metaeconomic identification of social preferences and knowledge economics
The taxonomically arranged hierarchies of social preferences are transformed into ab-
stract constructs of conceptual priority attitudes within specific economic, managerial or
econometric models. Usually they account ecologic, technical, productive, resource, sup-
ply a/o restrictions, as well as possible intersection of multilevel utility criteria and different
hierarchies (of those social preferences).
The determination of social priority ranks, with regard of probable risk, resources a/o
restrictions, helps to simplify the complicated decisions considering their vector optimiza-
tion solutions (when it is necessary to choose within the definite set of non-contradicting
strategies oriented to realize the normative typology of socioeconomic development).
The resulting alternative implies the compatibility of the productive and consumer crite-
ria, intellectual satisfaction, ecological sustainability and cultural efficiency a/o interrelated
environmental factors and psychological suggestions of the economic agents.
Antanas Buracas
24
The prediction of programmed socioeconomic dynamics turns out to be the impor-
tant component when preparing the multivariate context of preplan decisions concern-
ing the most acceptable perspective directions of social and economic development.
At this stage of the metatheoretical constructs, one of important problems is the se-
curing of unity between macrosystemic and regional, social and industrial approaches, in
particular, by coordinating social and territorial tasks, proportions, activities and decisions,
also normalizing the hierarchies of decisional criteria within preprogrammed socioeco-
nomic dynamics.
In this context it is important to guarantee the open character of territorial subsystems
determined by socioeconomic interrelations between regional units within existing so-
cial formations, resulting in the intensive interregional division of labor, considerable cross-
industrial, financial and cultural exchanges and flows. Many subsystemic economic a/o
criteria, such as priority to the rational utilization of local resources, equalization of slow
and outrun developing regions, endogenization of sustainability factors, equilibrium be-
tween productive, infrastructural and informative development and so on.
Nevertheless, the paradigms of intellectual assets require account of such specific as-
pects as their cardinal measurement difficulties, specific criteria of multiplication effects
of innovative software, management, educational a/o solutions (cf. Facebook, electronic
pursue etc.).
The taxonomic evaluation of social preferences include those concerning methodo-
logical positions of consumer choice imitation which is widely revealed in consumer eco-
nomics publications including many specific hypotheses, like lifecycle or permanent, ab-
solute and relative income concepts, also specific paradoxes, like Giffens’ or Veblen4, also
specific principles and other analytical instruments as elasticities, cross-sectional analysis
of family budgets a/o. This choice widespread outside of traditional consumer econom-
ics – with hierarchical choice within satisfaction of traditional needs (for food, shelter and
dressing), also supplementary satisfaction of some of them; or different means and/or
ways of satisfaction. The priorities of supplementary leisure (or free) time have to be taken
into account in the same context. The consumer choice extended when it included the
4 The Giffen’s paradox appears when income effect prevails on substitution effect in case of low elas-ticity of demand on the cheapest food products, such as bread or potatoes. The Veblen’s paradox or effect appears in cases of demonstration expenses of high income individuals.
METAECONOMIC APPROACH AS BASIS FOR INTELLECTUAL ASSETS EVALUATION
25
satisfaction of intellectual needs, parallel to those material ones, or, in other case, choice,
say, between purchase of additional car and upbringing of additional child in family.
Some specific methodic instruments and concepts, esp. in financial analytics, used for
researches of social preferences and intellectual resource efficiency are similar to con-
cepts and principles used in applied sciences (like minimax, elasticity, multiple criteria &
synergy evaluations). Charting as technical means of market conjuncture, process simula-
tive modeling is also widely used. Interesting attempts are concerning entropy concept
within organization development or budget analysis (Georgescu-Roegen, 1971). In last
case, equilibrium budget is compared with unchanging balance of energy (identical to
1st law of thermodynamics). Utility maximization as a basis for priority ranking may be
then compared with 2nd law of thermodynamics on growing entropy, with account of
effect of depletion of exhaustible resources. Utility functions are often interpreted, us-
ing the computational approach, as representing the homothetic individual preferences
grouped into hedonistic coalitions coordinating the satisfaction with utility maximization
(from the social point of view). Naturally, the task of metaeconomics is to control that
formal analytical means do not deviate some internal features of real socioeconomic phe-
nomena or processes esp. in the evaluation of intellectual assets functioning.
The taxonomic evaluation of socioeconomic preferences was widely used in dynamic
multisectoral regional modeling of developing economics with changing criteria of ef-
ficiency and optimality, and in particular with account of the creative activity in social
infrastructure. The complex assessment of the country’s entrepreneurship development
based on multiple criteria evaluation and modeling of selected primary indicators and
determinant pillars also was helpful for multiaspect approach to measurements of intel-
lectual potential (Zvirblis, Buracas, 2012).
The conceptualization of social prediction outcomes are based on the coordination
of general evaluations and principles with regional and interregional ones within multi-
variant development investigations (according to modified optimized hierarchies of aims
subordination). Necessary corrections to exclude negative outcomes have determined
the continuing process of prognostic iterations. Some of them may be mentioned be-
low:
complexity of aims determining regional development, improvement of produc-
tive arrangement and usage of territorial resources and capacities; and the subor-
dination or ranking of those aims and tasks;
•
Antanas Buracas
26
open character of territorial subsystems and interrelations between regional
units;
endogenization of global social, ecological and technical changes and mecha-
nisms on the levels of management and economic development of regional re-
production;
achievement of scale effect when displacing the capital within regional develop-
ment schemes;
and so on.
Naturally, many factors remain undetected, and the modeling of situations requires of
expert evaluation of such undetected impact.
The taxonomic ranking of the socioeconomic priorities in the multipurpose imitation
of economic aspects of social development presupposes the weighed comparability of
criteria functions on the qualitatively different levels – on the aspects of determining the
alternatives of optimization, also of multicriteria dynamic equilibrium, the preferable man-
agerial strategies (on adequate socioeconomic interpretation levels).
The logical and chronological discursiveness of the social value hierarchies within prog-
nostic systems of intellectual resources and assets are achieved by elaborating genetic
forecasting (reflecting revealed tendencies) and normative one (with account of neces-
sary structurization and determination of expected development under globalization and
international integration trends). So, the alternative scenarios have to be oriented to the
evaluation of costs for the social differentiation reducing, rationalization of interregional
and regional economic structures and social infrastructures, increase of knowledge effi-
ciency leverage.
The criteria ranking according to the socioeconomic priorities of multitask regional per-
spective development presupposes the combination of formalized metaeconomic pro-
cedures generalizing accumulated intellectual experience with heuristic expert estima-
tions, concerning expected changes in social satisfaction, reductions in scarce intellectual
resources, natural & web pollution elimination a/o.
The conceptualized sets of social and economic preferences fixed in specific knowl-
edge industry patterns are closely connected with the stages of decision-making (in the
process of prediction, planning or direct management). The expert evaluations of possible
systemic disturbances and / or undesirable (i.e. avoidable) consequences of perspective
socioeconomic activity are especially important. Besides, the sorting out of the alterna-
•
•
•
•
METAECONOMIC APPROACH AS BASIS FOR INTELLECTUAL ASSETS EVALUATION
27
tive solutions aimed to the utility maximization may be preferred if based on the expert
evaluations of the reliability of maximized activities’ effect.
In this technology, the exogenous information induced on the lower aggregation level,
is organized with regard of endogenous information from the more aggregated level. Be-
sides, the results of, say, sociometric imitation of income differentiation or requirements of
ecologic sustainability often could be used as restrictions for econometric constructs of
knowledge economy development. The values of parameters obtained in the modeling
on the more aggregated level are also used as restrictions in the process of disaggregated
predictive imitation (or on the sectorial level). The resource limitations are integrated into
a social prediction system usually on the intersectorial levels and determine the relations
arranged in perspective for every interval of the period to be forecasted.
The modeling based on socioeconomic preferences supposes the conceptualization
of the lifestyles and their changes. The lifestyle could be defined as the totality of stere-
otypes of human activity (working, household, family, leisure time), also stereotypes of
individual and collective intellectual potential incl. management practice, know-how a/o.
That is, a stereotype of lifestyle is a form of practical existence, as well as a form of vital
activity of personality, or its self-expression and social development at the same time. The
motivation of decisions is based on priorities determined within some lifestyles.
A precondition for the transformations in the metaeconomic positions for the mod-
eling of socioeconomic preferences is the transition between stages of lifestyles inves-
tigation different by levels of abstraction. So, the very same epistemological empiricism
which grants reality to the hypothetical constructs, may hinder in some degree the de-
velopment of the theoretical conceptions, esp. in cases when they are widely applied to
directly unobservable social institutes (value systems, nonmaterial intellectual products
etc.).
For instance, the priority ranks within consumer stereotype evaluating the interactions
between different personal attitudes may be regarded as elements of a subsystem inte-
grated into generalized stereotype of common preferences determined under the influ-
ence of various intellectual & sociocultural traditions and values, obligations and rights. In
the opposite cases, say, changes in the elasticities and preferences manifest themselves
more clearly in the cases of low or inelastic basic needs than in cases of intellectual per-
spective needs. That is important when imitating the hierarchies of changing preferences
of intellectual investments or consumer choice realizing some determined lifestyles. With
Antanas Buracas
28
the saturation of basic needs, the intellectual ones start to play more important role, and
the demand elasticity is widening for corresponding means helping to express and de-
velop creative activities. At the same time, as was mentioned, the modeling systems have
to account that consumers also must choose between supplementary material compen-
sation and supplementary satisfaction from intellectual services, free time, also between
the ways and expenses of different needs’ satisfaction.
Complicated multicriteria decisions are certainly often based on the preference of a
more probable and less risky socioeconomic alternative to a more desirable but less prob-
able and more risky one. At the same time, the economic rationalization of the mana-
gerial, investment or consumer solutions quite often may lead to socially unacceptable
limitations (p. ex., economies of scale in cases resulting in diminishing quality or assort-
ment of products and services, some deviations in time discount and economic leverage
criteria when allocating resources into social infrastructure).
Macroeconomic sustainable equilibrium under dynamic optimized development is
theoretically analyzed, first of all, with account of long-run statistical trends. The asymmet-
rical effects, such as those between growing and diminishing rates of intellectual needs’
satisfaction or between inflation and disinflation impact on consumer stereotypes, were
discovered mostly on the basis of integrated empirical cross-section and trend statistics
also with account of multiple criteria expert evaluations. The factors of continuing adap-
tation of consumer behavior to resource and technological restrictions when satisfying
new, perspective needs have to be analyzed with account of specific influence of intel-
lectualization and knowledge asset developments at the end of 20th - beginning of 21st
centuries.
It is important to indicate that measurement, on the one side, is not simply a matter
of observation but also result of socioeconomic conceptualization. On the other side,
data analysis conventions dictate the scale types to be used in forecasting of socioeco-
nomic development. In this context it is logically to ask – which principles help to decide
whether conceptualization or partial indicators best ascribe meaning to the social world?
(Pawson, 1984).
At the same time, if it would be possible to solve the problem of utility measurement
on a scientific criteria basis, this should be one of significant discoveries. The paradox
of the situation is the fact that every one of consumers is commeasuring and ranking
different utilities and their complexes in everyday practice quite effectively (and not so
METAECONOMIC APPROACH AS BASIS FOR INTELLECTUAL ASSETS EVALUATION
29
complicated) on the basis of and with account of unsatisfied needs comprising individual
and social preferences. This imitative (mostly market) and a posteriori approach however
is not suitable for the cases of cardinal changes in lifestyles (esp. long-term, using the
intellectual potential reserves) and when forming the stereotypes of time spending and
personal consumption or financial investments.
The comparative extrapolation of social and natural expenditure or investment struc-
tures is used as a mean for the corrections of more complex multisectoral macroeco-
nomic forecasts with account of the intellectual resources’ efficiency by social groups and
groups of countries – by development level. The asymmetrical effect may be statistically
revealed:
a) in the interconnected dynamics of personal incomes and consumer expenses esp.
devoted to intellectual services;
b) in the transition from lowest to highest income groups and vice versa;
c) in effect of inflation and disinflation onto changes within consumer stereotypes. Be-
sides, social limits of satisfaction of new, perspective needs are widened with some accel-
eration modifying adequately the ranks of consumer priorities what is direct component
of more general social progress effect. High elasticity of educational, leisure and cultural
needs is also a significant form of social progress under preconditions of nearly fixed per-
sonal & physiological needs (with historical limits or intervals of their saturation).
The attempts to define new, more precise principles of expense conversion when co-
measuring the creative and reproductive works in main service industries also have been
integrated into regional multisectoral modeling and forecasting macro systems.
1.4. Systemic meta approach to identification of intellectual potential components
Universal and specialized information networks, sets of professional management pro-
cedures and stochastic evaluations of financial investment alternatives – all these and
many other similar intellectual resources and applications play more and more important
role: in the technical analysis of financial markets, projecting and / or producing of com-
puting chips or biotechnologies and, at least, in the modern development of any tech-
nologies and growth of the national GNP. At the same time, the economic evaluations
Antanas Buracas
30
of their social utility and implementations are rather slowed down by development of
the measurement criteria systems of the disposable intellectual resources’ efficiency. The
paradox of the situation is in fact that the high developed economies are based at 3/5 or
even more on the knowledge potential but the statistical measurements still are oriented
to disposable mostly material resources and effect of manufacturing industries, informa-
tion technologies (IT) and material services so important until 80-ies of 20th century.
The last years more attention was given to the social evaluations, measurement and an-
alytical development of specific intellectual resources as a strategic objective determining
the dynamism and creativity of the intellectual technologies. At the time, their significance
for the perspective (strategic) and infrastructure decisions of innovations as well as their
commercial dissemination – marketing, implementation, and management in total – is dif-
ficult to overvalue. However special methodical developments of these technologies are
mostly beyond from accelerated systemic applications for the macro statistic evaluations
of the economic growth proportions and intellectual productive power impact.
Theoretical as well as empirical research works examine factors having an impact on
sustainable economic development in newly EU countries, highlight the importance of
knowledge factors for long-term economic growth, also assert that sustained invest-
ments in education, information and communication technologies, innovations as well
as in a favorable economic and institutional environment will lead to increases in the use
and creation of knowledge in economic production, and consequently result in sustained
growth of economic competitiveness.
By analyzing the intellectual resources (IR) on the basis of metaeconomics, in particular,
this means evaluation of organizationlevel and itsintellectual capital, also human capital,
intellectual property and some other intangible assets. Intellectual potential can be de-
fined by the availability of this property currently or in the future productive value chain
in accordance with the strategic decisions of the user’sproperty. Intellectual capital as
intangible assets, is the most financially untouchable, and his valuation is complicated.
However, it is necessary to reveal the structure and the factors influencing the value of
intellectual capital growth in order to determine its economic impact in shaping global
resources and increasing competitiveness.
The evaluations of the IR and, as a result, of their return on the level of various compa-
nies (and even some branches) based on changes in their market value quoted on the
stock exchanges or on the value of their intangible assets as a difference between their

METAECONOMIC APPROACH AS BASIS FOR INTELLECTUAL ASSETS EVALUATION
31
market capitalization and stockholders’ equity amount in the finance balance value (it
measures the value of brand and/or firm’s name, disposable patents, experience of man-
agement, clients loyalty and other undifferentiated factors) were mostly developed the
last quarter of a century. Many of the adopted methods for the evaluation of IR and their
economic effect are complicated, not reliable for longer period and, by the realistic rec-
ognition, require too many efforts (e. g., Karl-Erik Sveiby). Some opponents also mention a
large number of measures used in valuing the respective components of the IC (see: The
Intellectual Capital of the European Union).
So far, no consensus emerged on the intellectual capital and the interaction between its
structural parts. However, the consensus is that intellectual capital is the engine of modern
economies, leading to overall economic growth, high-tech development and motivation
to innovate in order to compete successfully in global markets. Efforts to reveal and explain
the structure of intellectual capital as well as to present the theoretical assumptions, which
would codify intellectual capital components, were done by theoreticians and interna-
tional institutions. Intellectual potential components and concepts can be found in various
proposals for possible ways of structuring. The intellectual capital of organizations usu-
ally includes first-of-all the field of intellectual property already well-established (copyright,
patents, trademarks, industrial designs), and the value of management, technological de-
velopment, information nets and DB, financial product innovation and so on more difficult
to set; Buračas, 2007). In last cases the market value of integrated intelligent innovations is
determined usually and most reliable through the company’s securities quotes.
The system of IC indicators is presented below in a modified form (some in direct indi-
cators not measuring the IC were not included, and few added, see table 1). It is based on
component-by-component evaluation of some existing indicators and grouping them
according to operational goals what is undoubtedly rational, aiming to deepen the analy-
sis of knowledge society development, as a result, deserves to be studied more carefully
and developed. This indicator system needs to be carefully re-evaluated from point of
main criterion: correctness in weighing IC in financial standards.
The work in this direction still continues: The Skandia group of researchers used up to
164 measures (91 new IC metrics plus 73 traditional ones) within the five areas making
up the Navigator model. Anyway it served in identifying, valuing, and leveraging the IC
on macro level. The systems of the innovation dimensions were successefully developed
on the basis of multiple criteria evaluation techniques by Innovation Union Scoreboard

Antanas Buracas
32
(Tables A1-A3) & INNO-Metrics (European Innovation Scoreboard & appraisals were sup-
ported according to the EU Competitiveness and Innovation Framework Programme, cf.
Fig. A2-A12). Group of INSEAD & WIPO researchers under direction of S. Dutta developed
interesting system of the Global Innovation index scoreboards & appraisals (Fig.1, Fig. 13;
system of indicators presented in Tables A4 – A10).
Those a/o groups of authors detailed the mentionned systems with account of reliabil-
ity results measuring main determinants (composite a/o indicators) of innovation pillars
including the statistics of intellectual resources of Baltic States (the main data of the In-
novation indices & scoreboards are presented in the Annex Tables and Figures at the end
of this edition). Some their productive indicators are less adaptable; data are not always
comparable with other presented (absent information on venture capital, entrepreneurial
attitude and some other indicators).
The measurements of knowledge economy (KE), also innovations and registration of
productive indicators of the information industry a/o IC parameters were developed by
the World Bank group on the basis of Knowledge assessment methodology (KAM). It consists
of 80 structural and qualitative variables to measure countries’ performance on the four
knowledge economy pillars: economic incentive and institutional regime, education, in-
novation, and information & communications technology. The KAM was designed by the
Knowledge for development program to proxy a country’s preparedness to compete in the
KE. The comparison is undertaken for a group of 128 (now widened up to 138) countries,
which includes the OECD economies and more than 90 developing countries. In fact it is
only approximation for the measuring rather complicated processes of IC influence to na-
tional economic potential. In fact, e. g., the development in value of IC assets depend not
only on the value of some employment indicators, the number of scientific publications
and the number of patents – but such intellectual assets as professional competences in
management or creative abilities are much more difficult to measure.
Many researchers of the knowledge economy and intellectual resources propose to
evaluate the approximate estimates of IC by comparing the value of company’s balance
value and its market value based on the stock exchange listing statistics by their compo-
nents. This method most promising at now is suitable for integration with data of national
statistics and sociological evaluations of IC but still appears to be much less applicable
in cases of lower market capitalization of the property and/or on macroeconomic level
esp. with inadequate account of shadow sector influence. In the EU statistics still now too
METAECONOMIC APPROACH AS BASIS FOR INTELLECTUAL ASSETS EVALUATION
33
much attention is given to the material components of the IC which are much easier to
evaluate. Even the broad meaning of the innovations does not exhaust the economic ef-
ficiency and productivity of the intellectual resources.
A systematic approach on the KE and its clusters content of regional innovation sys-
tems was presented by P. Cooke (2002), who considered the conditions and criteria for
examination of innovation activity, importance of institutional and organizational sup-
port from the private sector. Some publications detailed the influence of human resource
management on entreprising competitivity (Zvirblis, Buracas, 2011–2012), formation of in-
dividual competencies on strategic development (Chan, Lee, 2011), problemic aspects of
innovation efficiency evaluations (Geoff et al., 2009).
The important practical complex assessment of knowledge economy parameters lead-
ing to interstate rankings and fulfilled by K4D, affiliated with the World Bank experts, also
developed by other researches (Shapira, et al., 2006; Shapira, Youtie, 2006). In order to
facilitate the evaluations of the transition countries developing the knowledge economy
(KE), the KAM was designed to provide a basic assessment of countries’ readiness for the
KE, identifying the sectors or specific areas where more attention on future investments
is necessary. The KAM is currently being widely applied in different World Bank research
projects, and it frequently facilitates the discussions concerning the perspective priorities
of the country’s sustainable development.
This methodical approach was critically discussed by T. Berger and G. Bristow (2009), espe-
cially the validity of indices used to measure national economic performance and competi-
tiveness. As a result, a review of related researches has shown that the complex assessment of
the country’s knowledge-based economy determinants is not detailed enough analytically.
This paper highlights the importance of knowledge potential development for long-
term economic growth, the main determinants of contemporary KE, where human re-
sources and knowledge are the main engines of economic competitiveness (Buračas,
2007). The author detailed the KE framework asserting that sustained investments in edu-
cation, innovation, information and communication technologies, and a conductive insti-
tutional environment will lead to increases in the use and creation of knowledge impact
on the economic production, as consequently result in sustained economic growth. In
terms of method and technique (complex measurement construct), composite indices as
aggregate measures of complex development, furthermore, are generally additive ones
with equally weighted influence.
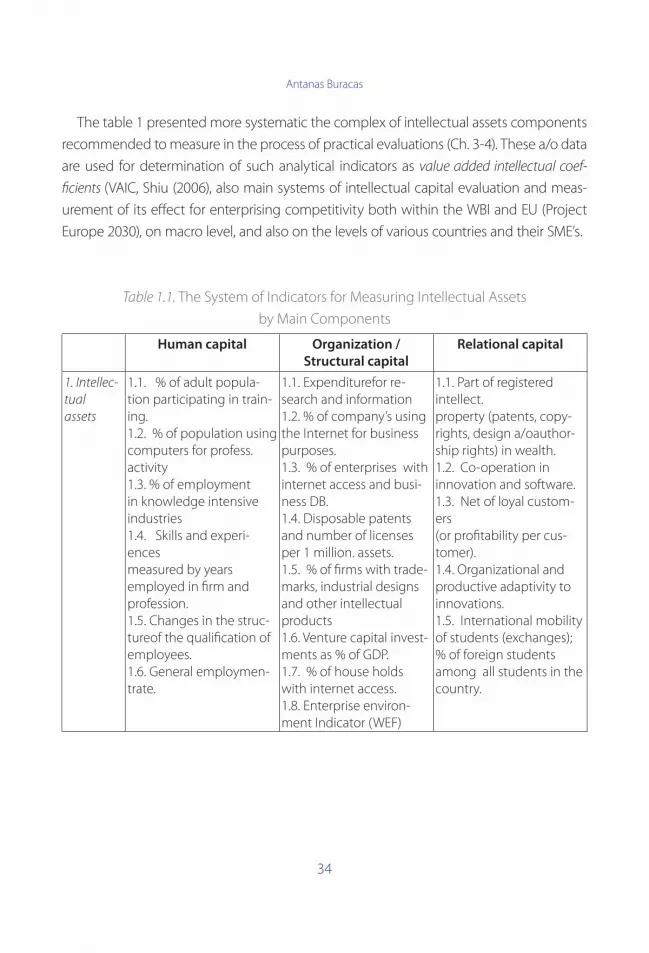
Antanas Buracas
34
The table 1 presented more systematic the complex of intellectual assets components
recommended to measure in the process of practical evaluations (Ch. 3-4). These a/o data
are used for determination of such analytical indicators as value added intellectual coef-
ficients (VAIC, Shiu (2006), also main systems of intellectual capital evaluation and meas-
urement of its effect for enterprising competitivity both within the WBI and EU (Project
Europe 2030), on macro level, and also on the levels of various countries and their SME’s.
Table 1.1. The System of Indicators for Measuring Intellectual Assets
by Main Components
Human capital Organization /
Structural capital
Relational capital
1. Intellec-
tual
assets
1.1. % of adult popula-tion participating in train-ing.1.2. % of population usingcomputers for profess. activity1.3. % of employment in knowledge intensive industries1.4. Skills and experi-encesmeasured by yearsemployed in firm and profession.1.5. Changes in the struc-tureof the qualification of employees.1.6. General employmen-trate.
1.1. Expenditurefor re-search and information1.2. % of company’s using the Internet for business purposes.1.3. % of enterprises with internet access and busi-ness DB.1.4. Disposable patents and number of licenses per 1 million. assets.1.5. % of firms with trade-marks, industrial designs and other intellectual products1.6. Venture capital invest-ments as % of GDP.1.7. % of house holds with internet access.1.8. Enterprise environ-ment Indicator (WEF)
1.1. Part of registered intellect.property (patents, copy-rights, design a/oauthor-ship rights) in wealth.1.2. Co-operation ininnovation and software.1.3. Net of loyal custom-ers(or profitability per cus-tomer).1.4. Organizational and productive adaptivity to innovations. 1.5. International mobility of students (exchanges);% of foreign students among all students in the country.
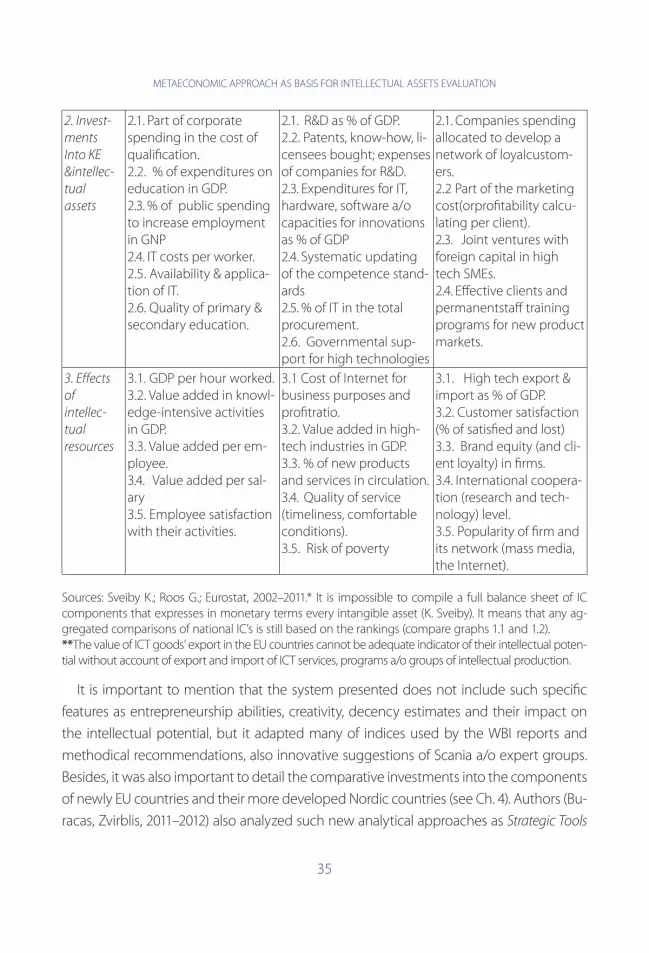
METAECONOMIC APPROACH AS BASIS FOR INTELLECTUAL ASSETS EVALUATION
35
2. Invest-
ments
Into KE
&intellec-
tual
assets
2.1. Part of corporate spending in the cost of qualification.2.2. % of expenditures on education in GDP.2.3. % of public spending to increase employment in GNP2.4. IT costs per worker.2.5. Availability & applica-tion of IT.2.6. Quality of primary & secondary education.
2.1. R&D as % of GDP.2.2. Patents, know-how, li-censees bought; expenses of companies for R&D.2.3. Expenditures for IT, hardware, software a/o capacities for innovations as % of GDP 2.4. Systematic updating of the competence stand-ards 2.5. % of IT in the total procurement.2.6. Governmental sup-port for high technologies
2.1. Companies spending allocated to develop a network of loyalcustom-ers.2.2 Part of the marketing cost(orprofitability calcu-lating per client).2.3. Joint ventures with foreign capital in high tech SMEs.2.4. Effective clients and permanentstaff training programs for new product markets.
3. Effects
of
intellec-
tual
resources
3.1. GDP per hour worked.3.2. Value added in knowl-edge-intensive activities in GDP.3.3. Value added per em-ployee.3.4. Value added per sal-ary 3.5. Employee satisfaction with their activities.
3.1 Cost of Internet for business purposes and profitratio.3.2. Value added in high-tech industries in GDP.3.3. % of new products and services in circulation.3.4. Quality of service (timeliness, comfortable conditions).3.5. Risk of poverty
3.1. High tech export & import as % of GDP.3.2. Customer satisfaction (% of satisfied and lost)3.3. Brand equity (and cli-ent loyalty) in firms.3.4. International coopera-tion (research and tech-nology) level.3.5. Popularity of firm and its network (mass media, the Internet).
Sources: Sveiby K.; Roos G.; Eurostat, 2002–2011.* It is impossible to compile a full balance sheet of IC components that expresses in monetary terms every intangible asset (K. Sveiby). It means that any ag-gregated comparisons of national IC’s is still based on the rankings (compare graphs 1.1 and 1.2).**The value of ICT goods’ export in the EU countries cannot be adequate indicator of their intellectual poten-tial without account of export and import of ICT services, programs a/o groups of intellectual production.
It is important to mention that the system presented does not include such specific
features as entrepreneurship abilities, creativity, decency estimates and their impact on
the intellectual potential, but it adapted many of indices used by the WBI reports and
methodical recommendations, also innovative suggestions of Scania a/o expert groups.
Besides, it was also important to detail the comparative investments into the components
of newly EU countries and their more developed Nordic countries (see Ch. 4). Authors (Bu-
racas, Zvirblis, 2011–2012) also analyzed such new analytical approaches as Strategic Tools
Antanas Buracas
36
to Capture Critical Knowledge and Skills (Chan & Lee, 2011) and interconnected methods of
Value Added Quality Management Processes evaluation. They suppose the consistent selec-
tion of intellectual capital indicators, determination of their priorities and theirsubordina-
tion based most often on the critical expert reevaluations of K. E. Sweiby, Scandia a/o
suggestions (see also Weziak, 2007; Stam & Andriessen, 2009).
The focus should be given to widespread differences in measurement between the
balance value of assets and their market value (the last one is often determined mostly
by the securities quotes). However, obvious shortcomings of this approach also have be
recognized – i. e. large stock market fluctuations in value, the difficulty in defining and dis-
tinguishing components of intellectual services, their specific quantitative contribution.
Furthermore, the innovative firms have maximum weight of intellectual capital, which are
often not quoted in the official market because of mandatory reliability requirements. The
modern multiple criteria methodology is still rarely applied for evaluation of the KE poten-
tial development and its foreground components in newly EU member states, and esp.
for shaping the insights of strategic development (to 2030) and increasing the country’s
economic competitiveness (Buračas, Žvirblis, 2009).
As was mentioned before,the most important innovation determinants & indicators
are carefully evaluated and taken into account in the EU Innovation Scoreboard and the
Innometrics barometers, also by INSEAD & WIPO. Their wery usefull system of the In-
novation performance in the European Countries included the multiple criteria search
functions, key innovation stakeholders in countries, product or process also organization-
al innovations per dimension,comparisions of countries - regional leaders). They can be
widely used as the EU’s strategy instruments of promoting partnerships between the
public and private sectors, facilitating access to funding and educating skilled workers,
reducing red tape and lowering the cost of patenting new ideas (The Global Innovation
Index 2011; Hollanders H.,2009; INNO-Appraisal, 2010; Innovation Scorecard: Country In-
novation Profiles, 2012 a/o). the main data of the Innovation Scoreboards are presented in
the Annex Tables and Figures at the end of this edition). More detailed analysis of these
methodological multiple criteria instruments, their benefits & possibilities are reviewed
in the Chapter 4 of this edition, in particular, commenting the peculiarities of intellectual
assets & resources development in the Baltic and Nordic countries.
The systemic multiple criteria evaluation of the national IR, their dynamics, factors of
changes and effect measurement are the necessary premises for their more adequate

METAECONOMIC APPROACH AS BASIS FOR INTELLECTUAL ASSETS EVALUATION
37
resourcing and more rational distribution of the means in perspective, necessary variant
transformations of their branch and sector structure, also for determination of economic
development strategy with account of intellectual potential & IR development criteria.
Conclusions
1. Metaeconomics, as a sum of methodological foundations of economics in its context
with other sciences, first-of-all, social, and with reality, facilitates the conceptualization of
economic researches incl. the intellectual resources and assets. They become more relia-
ble, more full and consistent understanding, and the fixation of main restrictions concern-
ing the value systems impact into management a/o decisions as a knowledge potential.
2. Metaeconomic approachis integrating new perspective aspects of the globalization
and social information nets, in particular, through intellectual assets efficiency evaluations.
Metaeconomics becomes esp. significant when formulating the aim hierarchies, or
choosing the optimization criteria (in cases of macroeconometric modeling), the restric-
tions and taxonomy of socioeconomic preferences. Metaeconomic systematics is found-
ing and clarifies the development of the intellectual economics but do not determine it.
3. It is appropriate to highlight the possibilities of the application of main multiple
criteria evaluation principles and methodology. The multiple criteria evaluation of the
national intellectual resources for their more adequate and more rational distribution in
perspective, necessary variant corrections of their branch and sectorial structure, also for
determination of economic development strategy with account of intellectual develop-
ment criteria – is important for the sustainable and competitive growth. Some sugges-
tions concerning the paradigm of economic significance of the intellectual potential, its
measurement, complex economic evaluation and perspective tasks for the professional
competence, management experience a/o indicators of the intellectual productivity were
attempted to present in thispublication.
4. The sustainable economic development in the newly EU countries must be oriented
to definitive priorities of the competitive growth abilities as well as to creation of a mod-
ern knowledge-based economy. A consistent solution of the problem requires, first, to
form an adequate intellectual resources assessment system, under which it is appropriate
to compare newly EU countries (between themselves) and their place in the EU economic
Antanas Buracas
38
area. It is also appropriateto highlight the possibilities of the application of multiple criteria
evaluation methods and modalities.
5. The analysis done below (Chapters 2–5) permits to substantiate the approach to
strategic programming of intellectual assets based on the multicriteria evaluation and
multitask optimization (with account of the possibilities of programmed alternatives) esp.
by applying the WEF pillar system for comparisons of Baltic & Nordic KE determinants,
their ITT impact on the intellectual potential. The suggested technique is recommended
to use when determining the competitive strength and rating of the newly EU countries
according to this approach. The strategic development insights of the intellectual po-
tential have stimulated the workout of alternatives, contributed to the general social and
economic transformations and diminish the emerging risks of innovations.
The author suggests for the renewing system of state statistical indicators for intel-
lectual development and, in particular, proposes to integrate more of them into national
social accounts system.
References
Allen, J. C., Bishop, R. C., Cordes, S., Lynne, G. D., Robison, L. J., Ryan, V. D., Shaffer, R. E.
(2000). A Metaeconomics Look at Social Capital, Power, and the Decision to Stay in a Rural
Community. // Working Paper. Lincoln: University of Nebraska, U.S.A.
Becchio, G. (2009). A Historical Note on the Original Meaning of Metaeconomics. Intel-
lectual Economics, Nr.1 (5).
Berger, T.; Bristow, G. (2009). Competitiveness and the Benchmarking of Nations – A
Critical Reflection. International Advances in Economic Research, Vol. 15, No 4: pp. 378–
392.
Buračas, A. (1968). O štrukturnosti metodologie a o socialnych funkciach ekonomick-
ych teorii (On Structure of Methodology and Social Functions of Economic Theories). //
Ekonomicky časopis, July, Nr. 7; Revised version in book: Соревнование двух систем.
Актуальные проблемы мировой экономики (Competition of Two Systems / Actual
Problems of World Economy, in Russian: Т. 6, Moscow, 1972, Acad. of Sciences, USSR.
Buračas, A. (1973). Contemporary Methodological Problems of Socio-Economic Research-
es // Vilnius University, in Russian, pp. 101–207, 313–343.
1.
2.
3.
4.
5.
METAECONOMIC APPROACH AS BASIS FOR INTELLECTUAL ASSETS EVALUATION
39
Buračas, A. (1985). Metatheoretical Conceptualization of Social Preferences // Science of
Science, No. 3-4 (19-20), Vol. 5, p. 265–286.
Buracas, A. (1986). Metaeconomic Institutionalization of Conceptual Criteria of Social
Development // 11th World Congress, ISA, New Delhi.
Buracas, A. (2007). The Competitiveness of the EU in the Context of the Intellectual
Capital Development. Intellectual Economics, vol. 1(1), p. 19–28.
Chan, P. Ch.; Lee, W. B. (2011). Knowledge Audit with Intellectual Capital in the Quality
Management Process: An Empirical Study in Electronics Company. The Electronic Jour-
nal of Knowledge Management, 9(2).
Chu, M. T., Shyu, J., Tzeng, G. H.; Khosla, R. (2007). Comparison among three analytical
methods for knowledge community’s group-decision analysis. Expert systems with ap-
plications, 33(4), 1011–1024.
Clower, R. W. (1995). Axiomatics in Economics. // Southern Economic Journal.
Cooke, P. (2002). Knowledge Economies. London: Routledge.
Crosser, P. K (1974). A Prolegomena to All Future Metaeconomics: Formation and Deforma-
tion of Economic Thought. Publ. by W. H. Green.
Debreu (1959). The Theory of Value // New York: Wiley and Sons.
European Innovation Scoreboard (2009). Comparative analysis of innovation perform-
ance. Pro Inno Europe Paper No. 15. European Commission, Enterprise and Industry.
Available at: http:www.proinno-europe.eu/sites/default/files/page/10/0371981-DG
ENTR-Report EIS.pdf, September 2011.
Geoff, S.; Brychan, C. T.; Gary. P. (2009).Opportunity and innovation: Synergy within an
entrepreneurial approach to marketing. The International Journal of Entrepreneurship
and Innovation, Vol. 10, No1, pp. 63–72.
Georgescu-Roegen, N. (1971). The Entropy Law and the Economic Processes // Cambridge
(Harvard).
The Global Competitiveness Report (2010–2011). Ed. by Klaus Schwab. Retrieved from:
http://www.weforum.org/en/media/publications/CompetitivenessReports/index.htm.
The Global Innovation Index 2011. Ed. by S. Dutta, INSEAD. Retrieved from: http://www.
globalinnovationindex.org/gii/main/fullreport/index.html
Hicks, J. (1982-83). Collected Essays on Economic Theory, Vol. I-III // Oxford: Blackwell.
Hollanders H. (2009). European Innovation Scoreboard (EIS): Evolution and Lessons
Learnt. Innovation Indicators for Latin America Workshop. OECD.
6.
7.
8.
9.
10.
11.
12.
13.
14.
15.
16.
17.
18.
19.
20.
21.
Antanas Buracas
40
INNO-Appraisal (2010). Understanding Evaluation of Innovation Policy in Europe. Annex
to Final Report. Retrieved from: http://www.proinno-europe.eu/appraisal.
Innovation Scorecard: Country Innovation Profiles (2012). Prepared for General Electric
by the Milken Institute.
Hicks, J. (1982-83). Collected Essays on Economic Theory, Vol. I–III // Oxford: Blackwell.
Intellectual Capital for Communities in the Knowledge Economy: Nations, Regions, Cities
and Emerging Communities (2005, 2006). World Bank Conferences.
Keynes, J. N. (1891). The Scope and Methodof Political Economy // London.
Kilvington, J. W. (2009). Metaeconomics: Market Evolution Intuited from Practical Les-
sons of the Past and Present.
Lange, O. (1959) Ekonomia polityczna // T.I. Zagadnienia ogólne, PWN, Warszawa.
Lydeka, Z. (2003). Main Concepts and Approaches of Economic System Research. Man-
agement of Organizations: Systematic Research, Vol. 25.
Lynne, G. D. (May 1999). Divided Self Models of the Socioeconomic Person: The Me-
taeconomics Approach. Journal of Socio-Economics. Vol. 28. No. 3.
Lynne, G. D. (2000). A Metaeconomics Look at the Case for a Multiple-Utility
Conception. // Review of Agricultural Economics, Vol.24, Nr. 2 (www.rural.social. sciences.
unl.edu/).
Lynne, G. D. (2003). Toward a Dual Motive Metaeconomics Theory. The Journal of So-
cio-Economics, Vol. 35.
Measuring Intellectual Capital at Skandia Group (1993). Retrieved from: <www.fpm.com/
script/UK/Jun93/930602.htm>
Menger, K. (1954). The Logic of Laws of Return: A Study in Meta-economics Economic
Activity Analysis, Ed. by O. Morgenstern.
Meta-economics. Science, Subjectivity Economic Policy. http://metaeconomics. word-
press.com/about/
Metaethics (2003). Encyclopedia Britannica. http://www.britannica.com/eb/ article?eu=53572.
Mizes L. von (1960). Epistemological Problems of Economics. Princeton.
Mantegna, R. N., Stanley, H. E. (2003). An Introduction to Econophysics: Correlations and
Complexity in Finance.
Ocić, Č. (1997). Metaekonomika kvareži, Beograd.
Parkinson, F. (2012) What is Metaeconomics? http://www.metaeconomics.co.uk/ me-
taeconomics.html
22.
23.
24.
25.
26.
27.
28.
29.
30.
31.
32.
33.
34.
35.
36.
37.
38.
39.
40.
METAECONOMIC APPROACH AS BASIS FOR INTELLECTUAL ASSETS EVALUATION
41
Pawson, R. (1984). On the Level: Measurement Scales and Sociological Theory / University
of Leeds. Preprint.
Quiqley, Ch. (2009). Meta Economics vs Quantitative Economics (http://www.marketora-
cle.co.uk/Article12218.html).
RICARDIS: Reporting Intellectual Capital to Augment Research, Development and Innova-
tion in SMEs (June 2006). European Commission. Retrieved from: http://ec.europa.eu/
invest-in-research/pdf/download_en/2006-2977_web1.pdf>
Roos, G. G. (2003). An Intellectual Capital Primer. www.euintangibles.net/library/ local-
files/Roos_AnIntellectualCapitalPrimer.PDF.
Samuelson, Paul A. (1947). Foundations of Economic Analysis, Harvard University Press.
Schmidt Ch. (1985). La sémantique économique en question. Recherche sur les fondements
de l’économie théorique. Calman-Levy.
Schumacher, F. (1973).Small is Beautiful: A Study of Economics as Though People Mattered.
Shapira, P.; Youtie, J. (2006). Measures for Knowledge-Based Economic Development:
Introducing Data Mining Techniques to Economic Developers in the State of Georgia
and the US South. Technological Forecasting and Social Change, Vol. 73, pp. 950-965.
Shapira, P., Youtie, J., Yogeesvaran, K, Jaafer, Z. (2006). Knowledge Economy Measure-
ment: Methods, Results and Insights from the Malaysian Knowledge Content Study.
Research Policy, Vol. 35, pp. 1522-1537.
Skandia Navigator. Intangibles Valuation (2011). Retrieved from: http://www.valuebased-
management.net/methods_skandianavigator.html.>
Stam C., Andriessen, D. (2009). Intellectual Capital of the European Union. 1IIrd Euro-
pean Conference of Intellectual Capital. Netherlands.
Sveiby, K.-E. 2004. Methods for Measuring Intangible Assets. <http://www.sveiby.com/
Portals/0/articles/IntangibleMethods.htm>
Underwood, D. A. (1997). Bringing the Economy - Ecology Interface into Economics // As-
sociation for Institutional Thought; the Western Social Science Association’s annual
meeting, Albuquerque, New Mexico.
Zsolnai, L. (2011). The Importance of Meta-Economics // Presentation at conference Re-
sponsibility in Economics – The Legacy of E.F. Schumacher, 22–23 Sept, Antwerp (http://
laszlo-zsolnai.net/content/importance-meta-economics).
Zvirblis, A., Buracas, A. (2012). Multiple Criteria Evaluation of Entrepreneurship Develop-
ment in Newly EU Countries. LAMBERT Academic Publishing GmbH & Co.
41.
42.
43.
44.
45.
46.
47.
48.
49.
50.
51.
52.
53.
54.
55.
Algis Zvirblis
42
Chapter 2
Theoretical Framework of Multipe Criteria Evaluation
of Country Intellectual Resources
Algis ZvirblisInternational Business School at Vilnius University
In the paper the idiosyncratic quantitative evaluation methods are analyzed, in par-
ticular, the most promising multiple criteria ranking, classification, evaluation and optimi-
zation methods and their applicability for assessing country‘s intellectual resources (IR).
According to the tasks of assessment and by character of those tasks, special attention is
given to COmplex PRoportional ASsessment (COPRAS), Simple Additive Weighting (SAW)
as well as Technique for Order Preference by Similarity to Ideal Solution (TOPSIS) methods
as most widespread. The application of these methods requests to formalize the investi-
gated process and to create the adequate evaluation criteria system.
The national IR evaluation must be focused on the national economic competitiveness
as a general criterion, also the idiosyncratic components and adequate primary indicators
have to be investigated. The principles and basic models for consolidated quantitative
evaluation of country intellectual resources development level are presented. The evalu-
ation process consists of the identification and expert examination, also quantifiable as-
sessment of essential primary indicators. Applying Simple Additive Weighting method, the
determination of component indexes (as partial criteria) and general level index of the IR
development, the modeling, also the optimization of the alternatives may be performed.
The relative impact of the different primary and partial criteria is taken into account by
establishing the integrated criterion, which allows us to evaluate more adequate differ-
ences in newly EU countries. The significance of multiple criteria and scenarios methods
synthesis was stressed evaluating them as an important methodic instrument increasing
the effectiveness of countries’ IR management in general.
Keywords: intellectual resources, development strategy, idiosyncratic components, multiple
criteria methods, background models
JEL: E60; O15; O32; C02; C61
THEORETICAL FRAMEWORK OF MULTIPE CRITERIA EVALUATION OF COUNTRY INTELLECTUAL RESOURCES
43
2.1. Introduction
The analysis of scientific works concerning the evaluation of intellectual resources (IR)
shown that mostly the methods focusing on company’s level were examined. Authors
revealed coherently the selection of IR indicators, their priorities and the subordination,
the contribution of IR components into added value. First-of-all, the attempts to reveal
and explain the structure of intellectual capital (IC) as well as present the theoretical as-
sumptions, which would systemize the IR components, were done. Some proposals can
be found in theoretical publications for possible ways of structuring IC. Theories can be
grouped according to the criteria that define the components of IR and IC as a whole;
according to the first criterion, its three components: human, structural and relationship
capital are identified. Second approach pursuant the criteria distinguishing two compo-
nents: human and structural capital; third approach distinguish four components: human,
structural, relational capital and intellectual property.
As was highlighted by P. C. W. Chan and W. B. Lee (2011) most of the IC assessment tools
are based on its measurement as the return on intangible assets interconnected with hu-
man capital (staff skills, innovativeness, working experience), structural capital (IT systems,
patents) and relational capital (relationship with customers and suppliers). Traditional as-
sessment tools aim at identifying useful knowledge that can create wealth for the organi-
zation in assessing the performance and value creation process. The knowledge audit is
the first step in determining how knowledge is handled in organization mission, in qual-
ity management processes. A knowledge audit provides an evidence based assessment
of the knowledge assets, however, there is a lack of a systematic approach in the way
knowledge audits are conducted. In the view of usefulness of the knowledge audit and
the deficiencies in the traditional methods of IC measurement, a structured knowledge
audit approach has been applied. Authors presented an integration of knowledge audit
and IC reporting approach which has been applied in Value Added Quality Management
(VAQM) processes (Chan, Lee, 2011).
As accented by A. Buracas (2007), intellectual assets (i. e. intellectual potential, IC and IR)
level measurement and esp. the complex assessment of their level reveal the better op-
portunities for more accurate cross-rating macro-structural changes, also IR productivity
in different economic sectors, regions and countries. Discussion goes on the criteria and
indicators system for assessing the IC and their potential development priorities in the
Algis Zvirblis
44
Baltic States, and problemic areas when distributing the financial funds for their growth.
Together, the revision of the statistical indicators determining intellectual potential and
the integration of additional important factors & indices was proposed. The problematic
issues related to intellectual potential economic importance and its performance indica-
tors were also discussed. The attention was given to EU’s Lisbon objectives whose re-
alization requires more efforts to compatibility of sustainable development of the vari-
ous intellectual and social development priorities (Buracas, 2007; Stam, Andriessen, 2009;
Parada Daza, 2009).
Theoretical as well as empirical research works examine IC factors having an impact
on sustainable economic development in newly EU countries, highlight the importance
of intellectual potential for long-term economic growth, detailed the influence of human
resource management on country economic competitiveness, on genesis of the main
metacharacteristics such as macro vs. micro, static vs. dynamic, positive vs. normative,
ex ante vs. ex post (Siggel, 2006; Brauers et al., 2007; Grundey, 2008; Melnikas, 2008; Sng
et al. 2009; Gries, Naude, 2010). Those papers also assert that sustained investments in
education, information and communication technologies, innovations as well as in an
infrastructure will lead to increases in the use and creation of knowledge in economic
production, and consequently result in sustained growth of economic competitiveness.
At the same time, the most important theoretical as well as empirical research works sup-
ported the analysis of substantive IR development problems.
So, the contribution of knowledge and innovations to economic growth and com-
petitiveness has attracted the increased attention. In contrast to the wide use of aggre-
gate measures of innovation, some authors presented disaggregated knowledge-based
approach into the policy and economic decision-making processes. The first case uses
information obtained from patents and publications to inform traditional out-of-area eco-
nomic development recruitment strategies in a more knowledge-oriented direction. The
second case exemplifies the use of data mining to identify top determinants of a strategic
state economic development. The third case illustrates how local knowledge-based ca-
pabilities can be identified in cities not traditionally viewed as innovative. Disaggregated
methods used in traditional strategies were most intuitively understood and used, but
new knowledge measures were found to encourage the state economic development
(Shapira, Youtie, 2006).

THEORETICAL FRAMEWORK OF MULTIPE CRITERIA EVALUATION OF COUNTRY INTELLECTUAL RESOURCES
45
A knowledge-based economy has traditionally been assessed on the basis of informa-
tion technology and telecommunications sector analysis. Knowledge economy index is
defined by the following four criteria:
economic and institutional environment;
education and human resources;
innovative systems;
information Infrastructure.
The World Bank proposals on development of knowledge economy can be divided
into six categories, which include policies and private initiatives: strengthening business
and public sector (including research and educational institutions) cooperation; support
for the restructuring of state institutions, promoting innovation, learning and develop-
ment of information society relations, reviewing old and introducing new tax assistance
measures; supporting labor market development (to encourage people to retrain or ac-
quire skills to meet market requirements, while reducing unemployment over the me-
dium term); strengthening of the legal framework.
Of course, having a significant impact on increasing the country’s economic develop-
ment as well as the competitiveness, the assessment of IR at national level is important
not only in the comparative analysis of different states or regions, or sectors, but also in
identifying the most important trends and factors that are slowing progress. However,
the complex evaluation of IR determinants and factors in the scientific literature lacks of
adequate focus, and quantitative assessment methodology is not applied.
A systematic approach on the idea and content of regional innovation systems, clus-
ters and the knowledge economy was presented by P. Cooke (2001) who considered the
conditions and criteria for examination of innovation activity, emphasized, that the future
will require widespread evolution of regional innovation systems along with stronger in-
stitutional and organizational support from the private sector.
The multiple criteria evaluation of new EU countries IR, integrated with a systematic
analysis, may ensure their whole system of management, direction and monitoring pro-
gram development, to base main alternatives to national development strategies. In de-
tecting the determinants of IR and population factors, of course, we must be to use the
databases accumulated by international organizations, taking into account their applied
expertise methodologies for assessing the determinants for ranking the world states and
business sectors (Bowen, Moesen, 2009). In analysis of prospects for multicriteria evalu-
•
•
•
•

Algis Zvirblis
46
ation methods, it is necessary to take account of the fact that it is important to identify
specific of the IR determinants in new EU countries, and adequately modify the underly-
ing indicators.
The features and possibilities of multiple criteria evaluation methods should be high-
lighted first, also procedures of assessment application. The methods to be applied are not
oriented to multiple criteria decision making systems (MCDM) when validating the stra-
tegic decisions of intellectual potential development but more connected with universal
alternative evaluations helping to choose more efficient programmed variants (Figueira,
J., Greco, S. & Ehrgott, M. eds., 2005; Mazumdar, 2009; Mazumdar, Datta, Mahapatra, 2010;
Zavadskas, Turskis, 2010).
The proposed evaluation methodology of the country’s intellectual resources permits
to integrate evaluation process into the national strategy programming; it also may be
applied for correction of the newly EU states ratings according to criteria of IR develop-
ment.
Aim of the study – to examine the promising multiple criteria evaluation methods and
to develop sophisticated IR assessment construct. The object of investigation is country’s
IR; the methods– analysis of special scientific literature on the application of multiple crite-
ria evaluation methods, also Simple Additive Weighting (SAW) method.
2.2. Examination of promising multiple criteria evaluation methods
It is appropriate to discuss the perspectives of a quantitative assessment, particularly
the general multicriteria evaluation methods that are widely used for solving similar as-
sessment tasks. Their choice is sophisticated as result of the complexity of problems and
solutions determined by widerange of evaluation criteria. The totality of multiple criteria
methods may be classified in to groups – ranking, classification, evaluation and optimiza-
tion (Dombi, Zsiros, 2005). According to the study subject and particular challenges, first-
of-all a group of evaluation methods used to measure and study selected objects under
investigation (by ranking objectives) have be examined. It depends on the amount of
ordinary places, and the geometric mean method, but more detailed if is appropriate to
analyze the sophisticated methods requiring careful justification for their use.
THEORETICAL FRAMEWORK OF MULTIPE CRITERIA EVALUATION OF COUNTRY INTELLECTUAL RESOURCES
47
Thus, the analysis of the Simple Additive Weighting (SAW), COmplex PRoportional As-
sessment (COPRAS), Technique for Order Preference by Similarity to Ideal Solution (TOP-
SIS) methods, the evaluation of the specificity of social processes were discussed by
C. L. Hwang, K. Yoon (1981), C. Parkan, M. Wu (2000), W. Zhang, H. Yang (2001), C. Macharis,
et al. (2004), R. Ginevicius, V. Podvezko (2007, 2009), V. Podvezko, A. Podvezko (2009), R.
Ginevicius et al. (2008), etc. The prospective multiple criteria methods of the quantitative
evaluation are suggested in the first place as applicable to the tasks solved by character of
those tasks (Hwang, Yoon, 1981, Zhang, Yang, 2001; Zapounidis, Doumpos, 2002a, 2002b;
Dombi, Zsiros, 2005; Peldschus, 2007; Turskis, 2008; Ginevicius, Podvezko, 2009). The ap-
plication of the multiple criteria evaluation methods requests to formulate the adequate
valuation criteria system which would be available to adapt the methodological frame-
work based on specifics of the problem solved.
Evaluating the social processes, especially in determining their integrated dimensions,
SAW method is used more widely (Hwang, Yoon, 1981; Zvirblis, Buracas, 2010). The main
advantage is the fact that, in principle, this method allows you to combine different types
of primary variables (factors) and the integrated size, but all indicators must be maximiz-
ing. The method of quantitative criteria accurately reflects the idea of multiple criteria
methods – integration of indicator values and their weights into one single magnitude. It
is applicable to the case when all the variables (factors) in the system are interdependent,
as well as in the case of variables (factors) interactions in the system and the interaction
effect on the integral size is not significant. In the latter case, experience shows that a
small number of identified factors can be accepted, given the variables (factors) are mu-
tually independent (Zhang, Yang; 2001; Zapounidis, Doumpos, 2002a; 2002b; Ginevicius,
Podvezko, 2007; Podvezko, 2007).
Feature is yet that significance of each criterion must be established. An important con-
dition: the impact parameter significance for integral coefficients must be equal to 1 or
100 percent (Zhang, Yang, 2001; Ginevicius, Podvezko, 2009). Important is also the quan-
titative evaluation with account of the SWOT analysis. The application of this approach
suppose that the key factors affecting significance can be determined solely on the basis
of objective information based on calculation scarried out, they can also be determined
by expert way (Chu etal., 2007; Burinskienė, Rudzkienė, 2009). Reliability of expert assess-
ments is achieved by concordance coefficient W and parameter χ2 (Kendall, 1979).
Algis Zvirblis
48
The basic model for the some complex evaluation object (by applying multiple criteria
SAW method) may be formulated by following way:
(2.1)
where – global index; – essential factors; − significances of factors direct influ-
ence on integral measure .
COPRAS method applied to determine the integrative measure, to join the different maxi-
mizing and minimizing evaluation criteria when all criteria (factors) are interdependent with-
in system as well as when the interaction of criteria (factors) in the system and its impact
to the integrative measure is insignificant (Zhang, Yang, 2001; Zavadskas et al., 2007, 2009;
Bindu Madhuri et al., 2010). It is noted that several criteria groups (described by the primary
criteria) and the global criterion are integrated by applying this method. It is also important
to define some partial sub-criteria determining the valued object; each of these sub-criteria
may be applied within different measurement & valuation systems. By COPRAS method, the
individually assessed maximizing & minimizing criteria (indicators) concern the generalized
result; if only maximized indicators are applied, calculation results by COPRAS method coin-
cide with the results obtained by the SAW method (Chu et al., 2007; Zavadskas et al., 2007).
Essential mathematic expression when using COPRAS method is:
; (2.2)
where – assessed value of - th alternative, and – the adequate sums of normal-
ized maximizing & minimizing indicators.
They are calculated by the formulas (2.3 and 2.4):
; (2.3)
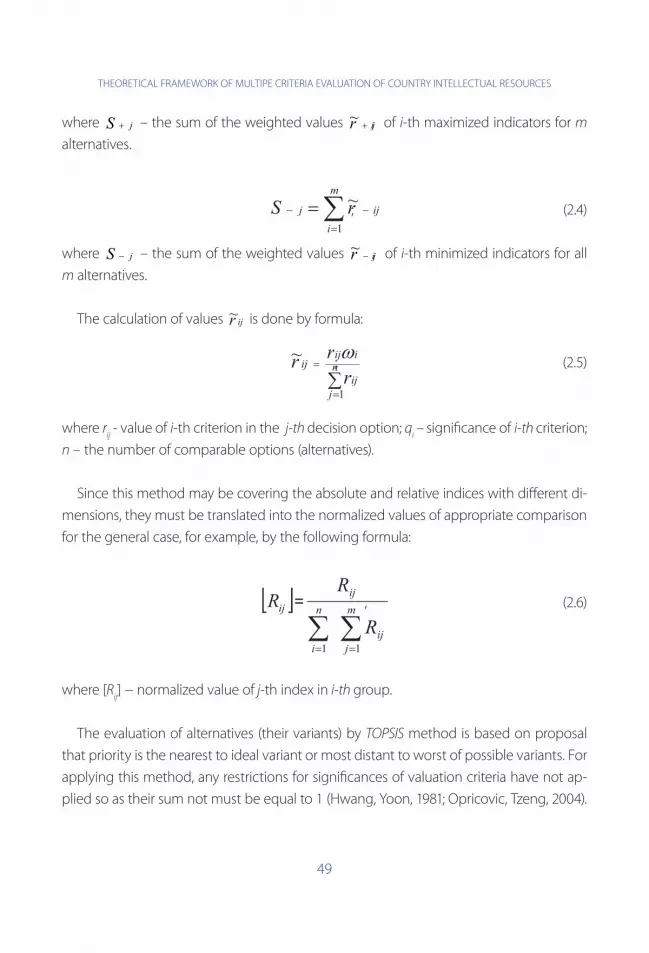
THEORETICAL FRAMEWORK OF MULTIPE CRITERIA EVALUATION OF COUNTRY INTELLECTUAL RESOURCES
49
where – the sum of the weighted values of i-th maximized indicators for m
alternatives.
; (2.4)
where – the sum of the weighted values of i-th minimized indicators for all
m alternatives.
The calculation of values is done by formula:
; (2.5)
where rij - value of i-th criterion in the j-th decision option; q
i – significance of i-th criterion;
n – the number of comparable options (alternatives).
Since this method may be covering the absolute and relative indices with different di-
mensions, they must be translated into the normalized values of appropriate comparison
for the general case, for example, by the following formula:
, (2.6)
where [Rij] − normalized value of j-th index in i-th group.
The evaluation of alternatives (their variants) by TOPSIS method is based on proposal
that priority is the nearest to ideal variant or most distant to worst of possible variants. For
applying this method, any restrictions for significances of valuation criteria have not ap-
plied so as their sum not must be equal to 1 (Hwang, Yoon, 1981; Opricovic, Tzeng, 2004).
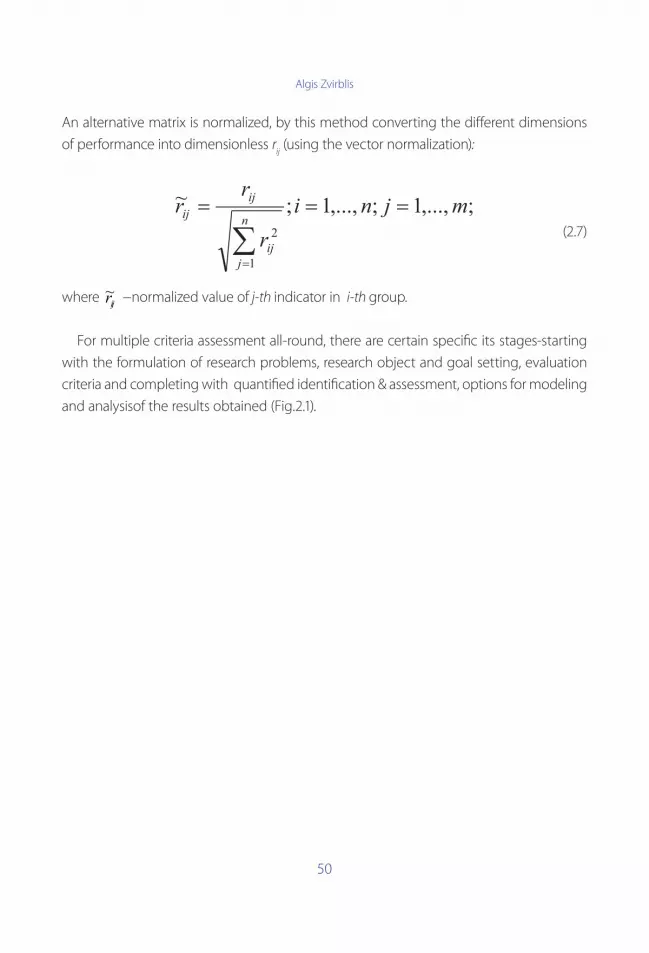
Algis Zvirblis
50
An alternative matrix is normalized, by this method converting the different dimensions
of performance into dimensionless rij (using the vector normalization):
(2.7)
where −normalized value of j-th indicator in i-th group.
For multiple criteria assessment all-round, there are certain specific its stages-starting
with the formulation of research problems, research object and goal setting, evaluation
criteria and completing with quantified identification & assessment, options for modeling
and analysisof the results obtained (Fig.2.1).

THEORETICAL FRAMEWORK OF MULTIPE CRITERIA EVALUATION OF COUNTRY INTELLECTUAL RESOURCES
51
Fig. 2.1. Main Stages of Multiple Criteria Evaluation

Algis Zvirblis
52
Briefly these steps are described as follows.
The first stage. The analysis of situation (in case – country’s IR components) and formu-
lation of the problems, the study object, the evaluation objectives, analysis of influence
factors are carried.
The second stage. The system of evaluation criteria formulation, basically describing
the object at the study; a large number of evaluation criteria have a negative side: it is dif-
ficult to formalize the system, also to assess their importance weight; it requires significant
time and financial costs.
The third stage. Identification of significant factors (indicators) by distinguishing only
evaluated factors having limited significance. In principle, the system of primary factors is
formulated.
The fourth stage. The assessment task is formalized, i. e. primary factors are described
formalized expression by their impact on valuation object.
The fifth stage. Determination of selected primary factors’ values and their normaliza-
tion by converting into nondimensional (comparable with each other) values . Those can
be expressed by points.
The sixth stage. Select the method for determining the significance of the phenom-
enon under study factors and determine the significance (weight) of factors.
The seventh stage. The indicators of the phenomenon selected are interconnected
into a generalized measure (calculations performed by multiple choice approach), i. e. the
total dimension is determined.
The eighth stage. Multivariate calculations of generalized measure are done by option
simulation. Evaluation results are analyzed on this basis.
At the same time, the methodological emphasis is necessary to distinguish, focusing
on the social relevance of the assessment process by multiple criteria evaluation and op-
timization techniques. It should be analyzed in detail:
Assessment tasks to address the volume of each method;
The applicability of methods for features of the situation;
The highest valued alternative number possible by using appropriate methods;
The maximum number of parameters that describe the alternative;
The opportunities of the formation of totality of primary and integrated evaluation
criteria;
The adequacy and reliability of information necessary for an objective evaluation;
•
•
•
•
•
•
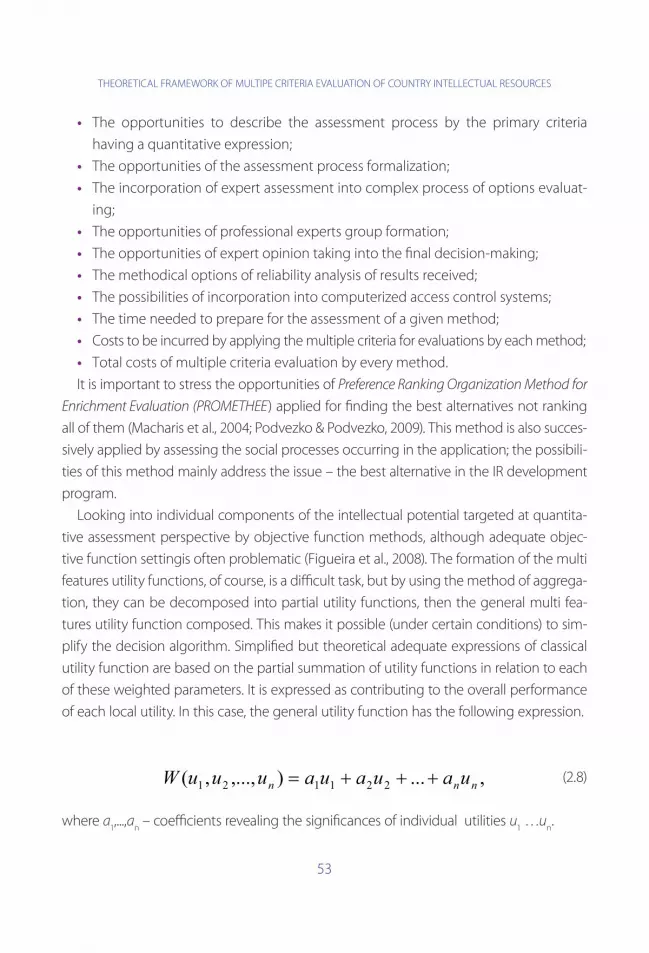
THEORETICAL FRAMEWORK OF MULTIPE CRITERIA EVALUATION OF COUNTRY INTELLECTUAL RESOURCES
53
The opportunities to describe the assessment process by the primary criteria
having a quantitative expression;
The opportunities of the assessment process formalization;
The incorporation of expert assessment into complex process of options evaluat-
ing;
The opportunities of professional experts group formation;
The opportunities of expert opinion taking into the final decision-making;
The methodical options of reliability analysis of results received;
The possibilities of incorporation into computerized access control systems;
The time needed to prepare for the assessment of a given method;
Costs to be incurred by applying the multiple criteria for evaluations by each method;
Total costs of multiple criteria evaluation by every method.
It is important to stress the opportunities of Preference Ranking Organization Method for
Enrichment Evaluation (PROMETHEE) applied for finding the best alternatives not ranking
all of them (Macharis et al., 2004; Podvezko & Podvezko, 2009). This method is also succes-
sively applied by assessing the social processes occurring in the application; the possibili-
ties of this method mainly address the issue – the best alternative in the IR development
program.
Looking into individual components of the intellectual potential targeted at quantita-
tive assessment perspective by objective function methods, although adequate objec-
tive function settingis often problematic (Figueira et al., 2008). The formation of the multi
features utility functions, of course, is a difficult task, but by using the method of aggrega-
tion, they can be decomposed into partial utility functions, then the general multi fea-
tures utility function composed. This makes it possible (under certain conditions) to sim-
plify the decision algorithm. Simplified but theoretical adequate expressions of classical
utility function are based on the partial summation of utility functions in relation to each
of these weighted parameters. It is expressed as contributing to the overall performance
of each local utility. In this case, the general utility function has the following expression.
(2.8)
where a1,...,a
n – coefficients revealing the significances of individual utilities u
1 …u
n.
•
•
•
•
•
•
•
•
•
•
Algis Zvirblis
54
Also UTilités Additives DIScriminantes (UTADIS) approach based on additive utility func-
tions and permitting to classify more correctly some objects under valuation also may be
applied in the case (Gaganis et al., 2006).
Besides, it is expedient to allow the influence of multitude quantitative indexes and
qualitative indicators as well as characteristics affecting the country’s IR development
level by evaluation of IR components. Undoubtedly different significances of evaluation
criteria have been recently used. This determines the multiple criteria evaluation and op-
timization of IR for solving specific, which in turn require the adaptation of these methods
to the challenges of similar tasks (Brauers, Zavadskas, 2008).
2.3. Basic intellectual resources components and indicator pillars
The evaluation of the national IR must be focused on the strengthening of national eco-
nomic competitiveness as general criterion. The accomplished principles of applying the
multiple criteria evaluation methods confirmed that it is useful to distinguish idiosyncratic IR
components and to construct the adequate pillars of essential macro factors essentially in-
fluencing the magnitude valuated by complex way. From the evaluation system approach,
there are partial criteria determining the advantages of different groups to the IR devel-
opment measure. Some of them may be measured quantifiable, besides the other have
qualitative expression. Those groups may be corrected periodically what is esp. actual in the
recession period. The expanded sets of typical indicators describing the components are
selected preliminary (on basis of accomplished analytical investigation and SWOT analysis).
As idiosyncratic IR components, such components may be revealed with account of
preliminary analysis and classifications of international institutions (Intellectual Capital for
Communities ..., 2006; RICARDIS: Reporting Intellectual Capital ...., 2006; Guthrie, Petty, 2000;
Shiu, 2006):
- The innovative capacity (E);
- Use of information technologies (T);
- Primary and secondary education quality (L);
- Company spending on R & D (S).
The sets of typical indicators having influence on the strategic IR development level are
presented in the table 2.1.
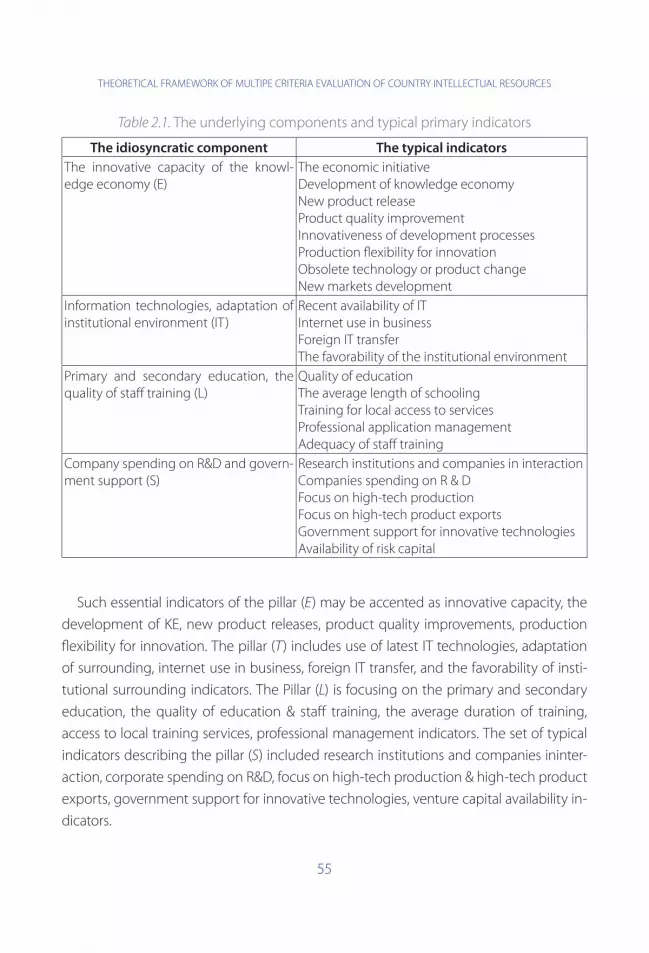
THEORETICAL FRAMEWORK OF MULTIPE CRITERIA EVALUATION OF COUNTRY INTELLECTUAL RESOURCES
55
Table 2.1. The underlying components and typical primary indicators
The idiosyncratic component The typical indicators
The innovative capacity of the knowl-edge economy (E)
The economic initiativeDevelopment of knowledge economyNew product releaseProduct quality improvementInnovativeness of development processes Production flexibility for innovationObsolete technology or product changeNew markets development
Information technologies, adaptation of institutional environment (IT)
Recent availability of ITInternet use in businessForeign IT transferThe favorability of the institutional environment
Primary and secondary education, the quality of staff training (L)
Quality of educationThe average length of schoolingTraining for local access to servicesProfessional application managementAdequacy of staff training
Company spending on R&D and govern-ment support (S)
Research institutions and companies in interactionCompanies spending on R & DFocus on high-tech productionFocus on high-tech product exportsGovernment support for innovative technologiesAvailability of risk capital
Such essential indicators of the pillar (E) may be accented as innovative capacity, the
development of KE, new product releases, product quality improvements, production
flexibility for innovation. The pillar (T) includes use of latest IT technologies, adaptation
of surrounding, internet use in business, foreign IT transfer, and the favorability of insti-
tutional surrounding indicators. The Pillar (L) is focusing on the primary and secondary
education, the quality of education & staff training, the average duration of training,
access to local training services, professional management indicators. The set of typical
indicators describing the pillar (S) included research institutions and companies ininter-
action, corporate spending on R&D, focus on high-tech production & high-tech product
exports, government support for innovative technologies, venture capital availability in-
dicators.

Algis Zvirblis
56
Most of these indicators are essentially composite determinants therefore their quanti-
tative assessment requires of independent methodology. This is true for the knowledge
level of economic development and cross-country assessment of the importance of set-
ting a capacity for innovation. Innovative activity is defined as the intensification of the
economic basis of scientific and technical progress in accelerating the social and cultural
development of the society. It contains links to creation, education and entrepreneurship.
More generally, it is appropriate to treat innovation activities as productive ones oriented
to transition of any system from a lower to a higher level. The purpose of the transition –
the changing needs of society. Hence, innovation activities have seen as a complex proc-
ess, a complex dynamic system, whose effectiveness is largely dependent on a number
of macro factors. Activation of innovative activities at national level is subject to a number
of challenges, including the scientific ones (the absence in new EU countries of adapted
scientifically-based national innovation and innovative performance management sys-
tem), practical-organizational absence of business innovation and inefficient use of in-
tellectual potential, innovation acceleration and management structures modernization
(Challenges and Opportunities…., 2009; Adekola, Korsakiene, Tvaronaviciene, 2008; Madura,
Ngo, 2008; Simmons, Thomas, Packham, 2009).
However, within the framework of this study, i. e., dealing with very broad cross-coun-
try assessment of IR, the problem is only appropriate to apply the primary indicators of
expert assessment technique.
2.4. Main multiple criteria evaluation principles and background models
The developed multiple criteria assessment principles are based on formalization of
the system of IR components and adequate sets of primary indicators (they may have
both quantitative and qualitative expression) determining the combined dimensions. For
describing the investigated system, the direct and indirect influence of primary criteria
are necessary to take into account. The essence of the principal approach to the complex
evaluation of the country’s IR lies in quantitative measure of IR level, i. e. determination of
general development level index using additive assessment methodology (Zvirblis, Bu-
racas, 2011a, b).
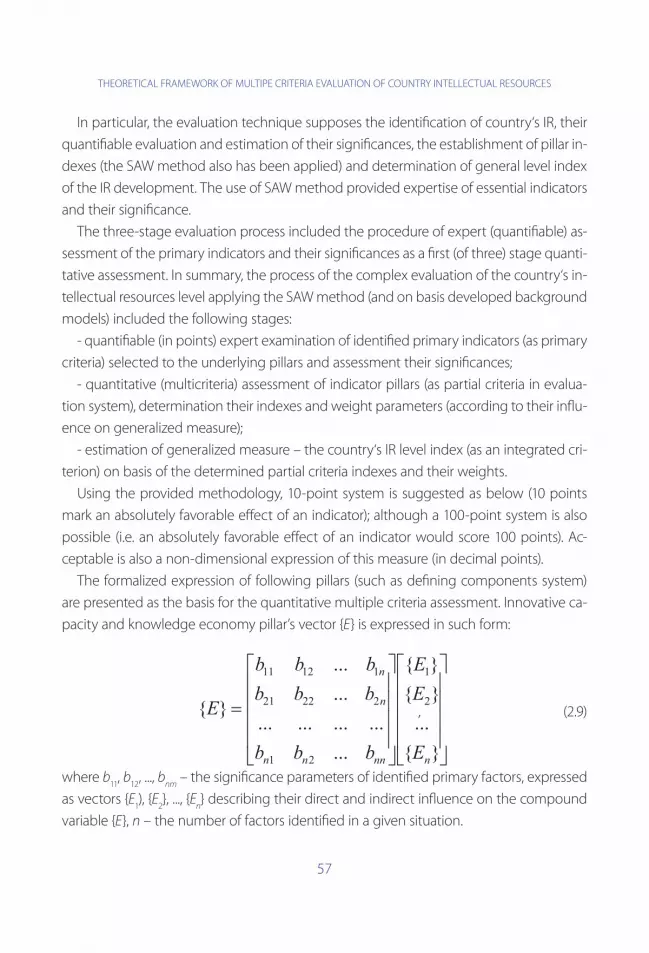
THEORETICAL FRAMEWORK OF MULTIPE CRITERIA EVALUATION OF COUNTRY INTELLECTUAL RESOURCES
57
In particular, the evaluation technique supposes the identification of country‘s IR, their
quantifiable evaluation and estimation of their significances, the establishment of pillar in-
dexes (the SAW method also has been applied) and determination of general level index
of the IR development. The use of SAW method provided expertise of essential indicators
and their significance.
The three-stage evaluation process included the procedure of expert (quantifiable) as-
sessment of the primary indicators and their significances as a first (of three) stage quanti-
tative assessment. In summary, the process of the complex evaluation of the country‘s in-
tellectual resources level applying the SAW method (and on basis developed background
models) included the following stages:
- quantifiable (in points) expert examination of identified primary indicators (as primary
criteria) selected to the underlying pillars and assessment their significances;
- quantitative (multicriteria) assessment of indicator pillars (as partial criteria in evalua-
tion system), determination their indexes and weight parameters (according to their influ-
ence on generalized measure);
- estimation of generalized measure – the country‘s IR level index (as an integrated cri-
terion) on basis of the determined partial criteria indexes and their weights.
Using the provided methodology, 10-point system is suggested as below (10 points
mark an absolutely favorable effect of an indicator); although a 100-point system is also
possible (i.e. an absolutely favorable effect of an indicator would score 100 points). Ac-
ceptable is also a non-dimensional expression of this measure (in decimal points).
The formalized expression of following pillars (such as defining components system)
are presented as the basis for the quantitative multiple criteria assessment. Innovative ca-
pacity and knowledge economy pillar’s vector {E} is expressed in such form:
, (2.9)
where b11
, b12
, ..., bnm
– the significance parameters of identified primary factors, expressed
as vectors {E1), {E
2}, ..., {E
n} describing their direct and indirect influence on the compound
variable {E}, n – the number of factors identified in a given situation.
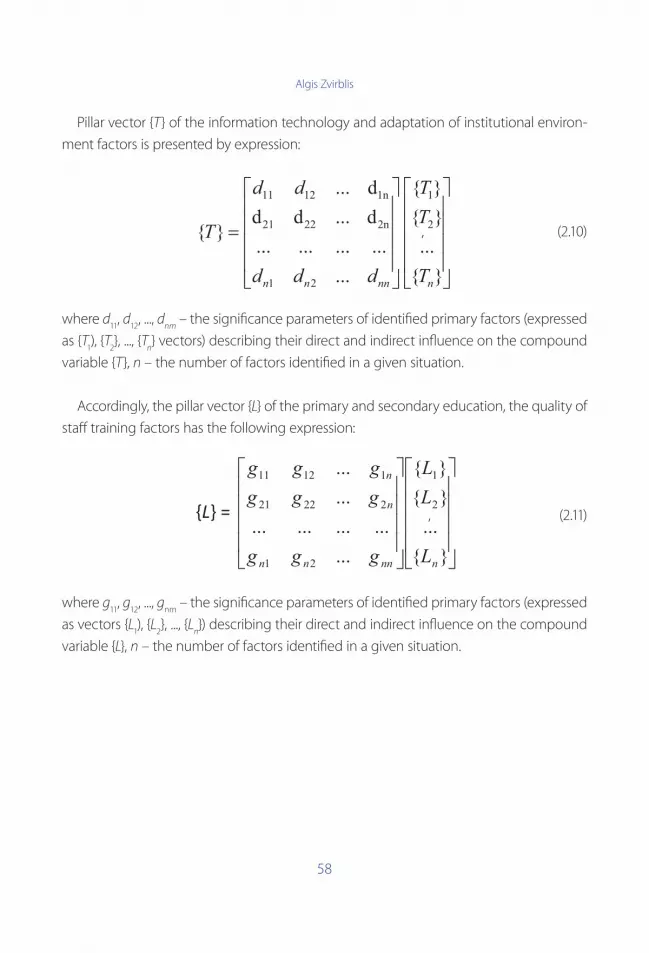
Algis Zvirblis
58
Pillar vector {T} of the information technology and adaptation of institutional environ-
ment factors is presented by expression:
, (2.10)
where d11
, d12
, ..., dnm
– the significance parameters of identified primary factors (expressed
as {T1), {T
2}, ..., {T
n} vectors) describing their direct and indirect influence on the compound
variable {T}, n – the number of factors identified in a given situation.
Accordingly, the pillar vector {L} of the primary and secondary education, the quality of
staff training factors has the following expression:
, (2.11)
where g11
, g12
, ..., gnm
– the significance parameters of identified primary factors (expressed
as vectors {L1), {L
2}, ..., {L
n}) describing their direct and indirect influence on the compound
variable {L}, n – the number of factors identified in a given situation.

THEORETICAL FRAMEWORK OF MULTIPE CRITERIA EVALUATION OF COUNTRY INTELLECTUAL RESOURCES
59
The pillar vector {S} of companies’ expenditure on R&D and government support fac-
tors may be expressed as:
, (2.12)
where c11
, c12
, ..., cnm
are the significance parameters of the primary factors (expressed as
vectors {S1), {S
2}, ..., {S
n}) describing their direct and indirect influence on the compound
variable {S}; n – the number of factors identified in a given situation.
The model for assessment of country‘s IR development level:
(2.13)
where ke1
, ..., ksn
are the significance parameters of direct and interactive impact of respec-
tive factor pillars described as vectors {E}, {T}, {L}, {S} on the general vector {M} of country‘s
IR development.
Practical application of these models, as was mentioned above, is associated with the
selection of assessment methods, the shaping of adequate primary indicator pillars for
the new EU countries (as well as for Lithuania) and the preparation of detailed evaluation
process algorithm.
The preparation of scenarios of every component as well as the scheming of general
development scenarios is clearly important; the synthesis of multiple criteria and scenario
methods has advantage. The methods of scenarios design or formation also are important
to detail. They are mostly descriptive however many authors are stressing their perspec-
tiveness esp. when applying for the forecasting of possible changes of investigated sys-

Algis Zvirblis
60
tem. Between them, the applications of scenario method for the describing the possible
programmed variants in interconnection with disposable resources, in particular, is also rel-
evant. The scenario method may be applied effectively in cases when the reliable informa-
tion is insufficient and, as result, the decisions with account of uncertain situation may re-
spond more correctly to the perspective changes. Besides, the scenario method is a mean
for directed monitoring helping operatively correct the strategy under review, in particular,
when analyzing the common influence of many various factors or their combinations on
the process under review. In the process of scenarios’ formation, their aims and tasks are
revealed, the substantiated factors and participants of interaction are determined, primary
and general scenarios generated (Ratcliffe, 2000, 2002; Drejeris, Zinkeviciute, 2009).
The scheme of process, which includes not only the IR assessment, but also the fore-
casting of prospective development parameters, as well as the substantiation procedures
of development program, that may be incorporated into decision support system (Gomes
da Silva et al., 2006), is presented in Fig. 2.2.
Fig 2.2. The scheme of evaluation procedures incorporating the common strategic framework for decision-making system
THEORETICAL FRAMEWORK OF MULTIPE CRITERIA EVALUATION OF COUNTRY INTELLECTUAL RESOURCES
61
The modeling also the optimization of development parameter alternatives and, finally,
reasoning of the strategic development decisions based on the criterion of the IR growth
may be realized.
Conclusions
As shown performed analysis, theoretical as well as empirical research works examine
factors having an impact on sustainable economic development in newly EU countries,
highlight the importance of country‘s intellectual potential for long-term economic growth,
detailed the influence of human resource management on country economic competitive-
ness. It highlights, that most of the intellectual capital assessment tools are based on the
return on intangible assets covering human capital, structural capital and relational capital.
Traditional assessment tools aim at identifying useful knowledge that can create wealth for
the organization in assessing the performance and value creation process.
At the same time, the research papers mostly supported the analysis of substantive IR
development problems. Those papers also assert that sustained investments in education,
information and communication technologies, innovations as well as in an infrastructure
will lead to increases in the use and creation of the IR in economic production.
Of course, the assessment of the IR development (particularly in the new EU countries)
level is not only important for the ranking, but also revealed the key trends and identified
the macro factors that are slowing progress. However, the lack of focus in the scientific lit-
erature on complex assessment of country’s IR determinants and not applicable quantita-
tive assessment methodology required to devote considerable attention to them. Mean
while, multiple criteria evaluation of IR, integrated with the SWOT analysis and their quali-
tative assessment can provide the management system as a whole, their development
direction. This is important as to justify an alternative to national development strategies,
as well as the measures of the program monitoring.
A knowledge-based economy examination has traditionally been based on ITT sector
analysis. Knowledge Economy Index (KEI) is basically a composite defined by four crite-
ria: economic and institutional environment, education and human resources, innovation
systems, information infrastructure. Defining the determinants of national IR and essential
factors, of course, must be based on accumulated data bases of international organi-
Algis Zvirblis
62
zations, taking into account their subject of expertized assessment methodologies, in
particular, focus on the determinants which are used for ranking of the world countries
and sectors. Analysis of multicriteria evaluation methods prospects revealed that first it is
important to identify determinants of IR more specific to the new EU countries, modify
them and review the underlying indicators.
Below is highly stressed how promising the quantitative evaluation is in general; there-
fore, the objectives of its application in social-economic processes evaluation are also
relevant. After all, this evaluation (applying quantitative methods and creating algorithms
for the evaluation process) may be incorporated into the general system of the strategic
IR management. Of course, it should first be highlighted the features of multiple criteria
evaluation methods and possibilities, algorithmic assessment of the scope. The applied
methods have to be oriented on multiple criteria decision making systems (MCDM) when
validating the strategic decisions of intellectual potential development at country level.
Multiple criteria evaluation techniques enabled the study to reveal their opportunities
when applying for the quantitative assessment of national IR. The basic multiple criteria
evaluation methods were defined in volving ranking, grouping, evaluation and optimiza-
tion highlighting the SAW, COPRAS, TOPSIS methods. These methods, in principle, can be
effectively applied to assess the intellectual potential of the development and authoriza-
tion of predicting changes in the strategic development of programmed policies.
The SAW method is especially applicable for the complex evaluation of substantially
different maximizing criteria having quantitative and qualitative parameters and deter-
mining the integral measure. The significance parameters of essential criteria (factor) im-
pact can be determined by calculations based on objective statistical information or by
expert way. The COPRAS method opens the possibility to join the different primary criteria
(factors) in case whereas both maximizing and minimizing criteria are included, and to
determine the general measure.
Analysis of multiple criteria evaluation methods prospects revealed that first it is impor-
tant to identify determinants of IR more specific to the new EU countries, modify them
and review the underlying indicators. Besides, by evaluation of IR components it is expe-
dient to allow the different significances of evaluation criteria that determine solution of
these methods adaptation for solving analogous tasks. The application of these methods
requests to formalize the investigated process and to create the adequate evaluation cri-
teria system.
THEORETICAL FRAMEWORK OF MULTIPE CRITERIA EVALUATION OF COUNTRY INTELLECTUAL RESOURCES
63
On basis of performed preliminary analysis, as well as the classification provisions of
international organizations adopted, as idiosyncratic IR components may be mentioned:
innovative capacity and state innovation policy, use of information technologies (ITT ap-
plication), quality of primary and secondary education, and expenditures of companies
on R & D. Those components are described by adequate primary indicators system, for-
mulated in the study; dealing with very broad cross-country assessment of IR issue, it is
appropriate to apply their expert assessment technique.
The developed multiple criteria assessment principles are based on formalization of the
system of IR components and adequate determinant sets taking into account their direct
influence as well as idiosyncratic interconnections, when may be warrant synergy effect.
The background models for quantitative evaluation of country IR determinants, presented
in the study, are applicable for the case evaluations. On this basis developed the three-
stage evaluation system included identification and expert examination, also quantifiable
assessment of essential primary indicators. The component indexes (as partial criteria) and
general level index of the IR development may be determined by applying SAW method.
The modeling, also the optimization of the alternatives as well as reasoning of economic
development decisions according to criterion of IR level on this basis may be performed.
The preparation of scenarios of every component as well as the scheming of general
development scenarios is clearly important, so as synthesis of multiple criteria and sce-
nario methods has advantage. An outline of the proposed evaluation construct is an im-
portant methodological tool for increasing the countries’ IR management in general, its
effectiveness. They are also applicable to more precise ranking of the Eastern European
countries under the criteria of IR development.
References
Adekola, A.; Korsakiene, R.; Tvaronaviciene, M. (2008). Approach to innovative activities
by Lithuanian companies in the current conditions of development. Technological and
Economic Development of Economy. vol. 14 (4), p. 595–611. doi: 10.3846/tede.2010.17.
Bindu Madhuri, Ch., Anand Chandulal, J.; Padmaja, M. (2010). Selection of best web site
by applying COPRAS-G method. International Journal of Computer Science and Informa-
tion Technologies, vol. 1(2), p. 138–146.
1.
2.

Algis Zvirblis
64
Bowen, H. P., Moesen, W. (2009). Composite Competitiveness Indicators with Endog-
enous Versus Predetermined Weights: An Application to the World Economic Forum’s
Global Competitiveness Index. McColl School of Business Discussion Paper Nr. 2.
Brauers, W. K. M.; Ginevičius, R.; Zavadskas, E. K.; Antuchevičienė, J. (2007). The European
Union in a transition economy. Transformations in Business & Economics, vol. 6(2), p. 21–37.
Brauers, W. K. M.; Zavadskas, E. K. (2008). Multiobjective optimization in local theo-
ry with a simulation for a department store. Transformations in Business & Economics,
vol. 7(3), p. 163–183.
Buracas, A. (2007). The Competitiveness of the EU in the context of the intellectual
capital development. Intellectual Economics, vol. 1(1), p. 19–28.
Burinskiene, M.; Rudzkiene, V. (2009). Future insights, scenarios and expert method ap-
plication in sustainable territorial planning. Technological and Economic Development
of Economy, vol. 15 (1), p. 10–25, doi: 10.3846/1392-8619.2009.15.10-25.
Challenges and Opportunities for a European Strategy in Support of Innovation in Services.
Fostering New Markets and Jobs through Innovation (2009). The European Union, Lux-
embourg. Retrieved from: http://ec.europa.eu/enterprise/policies/ innovation/files/
swd_services_en.pdf.
Chan, P. C. W.; Lee,W. B. (2011). Knowledge Audit with Intellectual Capital in the Quality
Management Process: An Empirical Study in Electronics Company. The Electronic Jour-
nal of Knowledge Management, vol. 9(2), p. 98–116.
Chu, M. T., Shyu, J., Tzeng, G. H.; Khosla, R. (2007). Comparison among three analytical
methods for knowledge communities’ group-decision analysis. Expert systems with ap-
plications, vol. 33(4), p. 1011–1024.
Cooke, P. (2001). Regional innovative systems, clusters and the knowledge economy.
Industrial and Corporate Change, vol. 10(4): p. 945–974. doi:10.1093/icc/10.4.945.
Dombi, J.; Zsiros, A. (2005). Learning multicriteria classification models from examples:
decision rules in continuous space. European Journal of Operational Research, vol. 160(3),
p. 663–675.
Drejeris, R.; Zinkeviciute, V. (2009). Modeling of a new service concept development
process. Current issues of business and law, vol. 4, p. 22–36.
Figueira, J., Greco, S. & Ehrgott, M. eds. (2005). Multiple criteria decision analysis – state
of the art surveys. Series: International Series in Operations Research & Management
Science, Vol. 78. Springer Verlag, Boston, Dordrecht, London, 1045 p.
3.
4.
5.
6.
7.
8.
9.
10.
11.
12.
13.
14.
THEORETICAL FRAMEWORK OF MULTIPE CRITERIA EVALUATION OF COUNTRY INTELLECTUAL RESOURCES
65
Figueira, J., Greco, S., Mousseau, V. & Slowinski, R. (2008). Interactive Multiobjective Op-
timization using a Set of Additive Value Functions. In J. Branke, K. Deb, K. Miettinen, and
R. Slowinski, editors, Multiobjective Optimization: Interactive and Evolutionary Ap-
proaches, p. 99–122.
Gaganis, C.; Pasiouras, F.; Zopounidis, C. (2006). A multicriteria decision framework for
measuring banks’ soundness around the world. Journal of Multi-Criteria Decision Analy-
sis, vol. 14(1-3): p. 103–111, doi: 10.1002/mcda.405.
Ginevicius, R.; Podvezko, V. (2007). Some problems of evaluating multicriteria decision
methods. International Journal of Management and Decision Making, vol. 8(5/6), p. 527–
539.doi:10.1504/IJMDM.2007.013415.
Ginevicius, R.; Podvezko, V. (2009). Evaluating the changes in economic and so-
cial development of Lithuanian counties by multiple criteria methods. Technologi-
cal and Economic Development of Economy, vol. 15(3), p. 418–436, doi: 10.3846/1392-
8619.2009.15.418- 436.
Ginevicius, R.; Podvezko, V.; Bruzge, Sh. (2008). Evaluating the effect of state aid to
business by multi-criteria methods. Journal of Business Economics and Management,
vol. 9(3), p. 167–180. doi:10.3846/1611- 1699.2008.9. 167–180.
Gomes da Silva, C.; Figueira, J.; Lisboa, J.; Barman, S. (2006). An interactive decision sup-
port system for an aggregate production planning model based on multiple criteria
mixed integer linear programming. Omega, vol. 34(2), p. 167–177.
Gries, T.; Naude, W. (2010). Entrepreneurship and structural economic transformation.
Small Business Economics, vol. 34(1), p. 13–29, doi: 10.1007/s11187-009-9192-8.
Grundey, D. (2008). Applying sustainability principles in the economy, Technologi-
cal and Economic Development of Economy, vol. 14 (2), p. 101–106, doi: 10.3816/1392-
8619.2008.14.101- 106.
Guthrie, J.; Petty, R. (2000). Intellectual capital: Australian annual reporting practices.
Journal of Intellectual Capital, vol. 1, p. 241-251.
Hwang, C. L.; Yoon, K. (1981). Multiple attribute decision-making. Methods and applica-
tions, Springer-Verlag, Berlin, New York, Heidelberg.
Intellectual Capital for Communities in the Knowledge Economy: Nations, Regions, Cities
and Emerging Communities (2006). World Bank Conferences.
Kendall, M. (1979). Rank correlation methods. London, Griffin and Co.
15.
16.
17.
18.
19.
20.
21.
22.
23.
24.
25.
26.
Algis Zvirblis
66
Macharis, C. et al. (2004). PROMETHEE and AHP: The design of operational synergies in
multi – criteria analysis: Strengthening PROMETHEE with ideas of AHP. European Jour-
nal of Operational Research, vol. 153(2): p. 307–317.
Madura, J.; Ngo, T. (2008). Clustered synergies in the takeover market. Journal of Finan-
cial Research, 31 (4), p. 333–356.
Mazumdar, A. (2009). Application of multi-criteria decision making (MCDM) approach-
es on teachers’ performance evaluation and appraisal. National Institute of Technol-
ogy, Rourkela, India, p. 40.
Mazumdar, A., Datta, S., & Mahapatra, S. S. (2010). Multicriteria decision-making models
for the evaluation and appraisal of teacher’ performance. International Journal of Pro-
ductity and Quality Management, 6(2): p. 213–230.
Melnikas, B. (2008). The Knowledge-based Economy in the European Union: Innova-
tions, Networking and Transformation Strategies. Transformations in Business & Eco-
nomics, vol. 7, No 3(15), p. 170–192.
Opricovic, S.; Tzeng, G.-H. (2004). Compromise solution by MCDM methods: A com-
parative analysis of VIKOR and TOPSIS. European Journal of Operational Research, vol.
156(2): p. 445–455.
Parada Daza, J. R. (2009). A valuation model for corporate social responsibility. Social
Responsibility Journal, vol. 5(3), p. 284–299.
Parkan, C.; Wu, M. L. (2000). Comparison of three modern multicriteria decisions – mak-
ing tools. International Journal of Systems Science, vol. 31(4), p. 497–517.
Peldschus, F. (2007). The effectiveness of assessment in multiple criteria decisions. In-
ternational Journal of Management and Decision Making, vol. 8 (5–6), p. 519–526.
Podvezko, V. (2007). Determining the level of agreement of expert estimates. Interna-
tional Journal of Management and Decision Making, vol. 8 (5/6), p. 586–600.
Podvezko, V.; Podvezko, A. (2009). PROMETHEE I method application for identification of
the best alternative. Business: Theory and Practice, vol.10(2), p. 84–92. doi: 10.3846/1648-
0627.2009.10.84-92.
Ratcliffe, J. (2000). Scenario building: a suitable method for strategic property plan-
ning. Property Management, vol. 18(2), p. 12–28.
Ratcliffe, J. (2002). Scenario planning: strategic interviews and conversations. Foresight,
vol. 4(1), p. 22–34.
27.
28.
29.
30.
31.
32.
33.
34.
35.
36.
37.
38.
39.
THEORETICAL FRAMEWORK OF MULTIPE CRITERIA EVALUATION OF COUNTRY INTELLECTUAL RESOURCES
67
RICARDIS: Reporting Intellectual Capital to Augment Research, Development and Innova-
tion in SMEs (June 2006). European Commission. Retrieved from: http://ec.europa.eu/
invest-in-research/pdf/download_en/2006-2977_web1.pdf.
Shapira, P.; Youtie, J. (2006). Measures for Knowledge-Based Economic Development:
Introducing Data Mining Techniques to Economic Developers in the State of Georgia
and the US South. Technological Forecasting and Social Change, vol. 73(8), p. 950–965.
Shiu, H.-J. (2006). The Application of the Value Added Intellectual Coefficient to Mea-
sure Corporate Performance: Evidence from Technological Firms. International Jour-
nal of Measurement. Retrieved from: http://findarticles.com/p/articles/mi_qa5440 /is_
200606/ ai_n21393124/.
Siggel, E. (2006). International Competitiveness and Comparative Advantage: A Survey
and a Proposal for Measurement. Journal of Industry, Competition and Trade, vol. 6(2),
p. 137–159.
Simmons, G.; Thomas, B. C.; Packham, G. (2009). Opportunity and innovation: Synergy
within an entrepreneurial approach to marketing. The International Journal of Entrepre-
neurship and Innovation, vol. 10 (1), p. 63–72.
Sng, H. Y.; Rahman, S.; Chia, W. M. (2009). Economic growth and transition: a stochastic
technological diffusion model. Journal of Economic Development, vol. 34 (2), p. 11–26.
Stam, C.; Andriessen, D. (2009). Intellectual Capital of the European Union 2008. 1rd Euro-
pean Conference of Intellectual Capital. Netherlands.
Turskis, Z. (2008). Multi-attribute contractors ranking method by applying ordering of
feasible alternatives of solutions in terms of preferability technique. Technological and
Economic Development of Economy, vol.14 (2), p. 224–239.
Zapounidis, C.; Doumpos, M. (2002a). Multicriteria classification and sorting methods:
A literature review. European Journal of Operational Research, vol. 138(2), p. 229–246.
Zapounidis, C.; Doumpos, M. (2002b). Multi-criteria decision aid in financial decision
making: methodologies and literature review. Journal of Multi-Criteria Decision Analysis,
vol. 11 (4-5), p. 167–186.
Zavadskas, E. K.; Kaklauskas, A.; Peldschus, F.; Turskis, Z. (2007). Multiattribute assess-
ment of road design solutions by using the COPRAS method. The Baltic Journal of
Road and Bridge Engineering, vol. 2 (4), p. 195–203.
Zavadskas, E. K.; Kaklauskas, A.; Turskis, Z.; Tamosaitienė, J. (2009). Multi-attribute deci-
sion-making model by applying grey numbers. Informatica, vol. 20(2), p. 305–320.
40.
41.
42.
43.
44.
45.
46.
47.
48.
49.
50.
51.

Algis Zvirblis
68
Zavadskas, E. K.; Turskis, Z. (2010). A new additive ratio assessment (ARAS) method in
multicriteria decision-making. Technological and Economic Development of Economy,
vol. 16 (2), p. 159–172.
Zhang, W.; Yang, H. (2001). A study of the weighting method for a certain type of mul-
ticriteria optimization problem. Computers and Structures, vol. 79(31), p. 2741–2749.
Zvirblis, A.; Buracas, A. (2010). The consolidated measurement of the financial markets
development: the case of transitional economies. Technological and economic devel-
opment of economy, vol. 16(2), p. 266–279, doi: 10.3846/tede.2010.17.
Zvirblis, A.; Buracas, A. (2011a). Multicriteria evaluation of national entrepreneur-
ship in newly EU countries. International Journal of Economic Sciences and Applied
Research, vol. 4(1), p. 79–94.
Zvirblis, A.; Buracas, A. (2011b). Examination of the Entrepreneurship Advantage De-
terminants Affecting Strategic Decisions. Management of Organizations: Systematic Re-
search, vol. 58, p. 31–41.
52.
53.
54.
55.
56.

THEORETICAL FRAMEWORK OF MULTIPE CRITERIA EVALUATION OF COUNTRY INTELLECTUAL RESOURCES
69
Ilídio Tomás Lopes
70
Chapter 3
Between intangibles identification
and their measurement and disclosure:
behind the value creation from innovation
Ilídio Tomás LopesPolytechnic Institute of Santarém, Portugal
Complexo Andaluz
Purpose – To invest in intellectual property and disclose it, internally and externally, is
a strategic decision towards the creation of a sustainable value added, at a firm or even
at a macroeconomic level. The multiple insights achieved reinforce the paradigm that
intangibles are the main structural support for economic growth. However, those intan-
gibles should be measured on a feasible basis towards the business comprehensiveness
as required by main accounting standards. Companies and countries should monitor and
report their innovation cycles in order to increase their turnovers.
Design/methodology/approach – Based on intellectual property literature review and on
data provided by Eurostat, regarding the investment intensity in research and development
(R&D), we focused on the developments occurred in Europe, for the period 1998-2010. Discus-
sion around measurement approaches were also stated out. We searched for a practical inter-
action between the number of patents effectively registered in the main international offices
and its innovation turnover rate. At a macroeconomic level, the intensity of R&D investment is
managed as a key issue which still drives the asymmetries between nations and regions.
Originality – An overview is provided concerning innovation expenditures and its con-
tribution to the intellectual property standards. Discovering and learning about intellec-
tual property can reflect the companies and nations adaptive capacity, both internally
and externally. However, the goal set out in the Lisbon’s strategy for 2010, is not aligned
with the year-to-date innovation turnover rates.
BETWEEN INTANGIBLES IDENTIFICATION AND THEIR MEASUREMENT AND DISCLOSURE: BEHIND THE VALUE CREATION FROM INNOVATION
71
Findings – Given the strong intensity and consistency in allocating resources (and their
spillovers), to invest in R&D stands for the most intensive step towards an integrated intel-
lectual property scorecard reporting.The income based approach is the one that better
matches the true return of innovation. At a macroeconomic level, Europe is still driving
innovation through an idiosyncratic policy on the way to a theoretical convergence and
tenuous innovation turnover standard.
Keywords –intellectual property, intangibles, financial reporting, innovation. measure-
ment
JEL Codes: M10; M20; M40
3.1. Introduction
Intangible assets are an important source of business value and are not generally in-
cluded in the standard financial reporting. Several models have been developed and
applied in order to better monitor these resources, particularly intellectual capital reports
(European Commission, 2010; Mouritsen et al., 2004; Edvinsson and Malone, 1997), com-
plementary financial reports and scoreboards (Eurostat, 2012; Lopes, 2010, 2009;Lev, 2001)
or Balanced Scorecard® programs (Kaplan and Norton, 1996). Broadly, intangibles are non-
monetary resources, without physical substance, but embodying relevant future econom-
ic benefits (International Accounting Standard n.º38 or Statement of Financial Accounting
Standardsn.º157). The disclosure of these resources can mitigate information asymmetry
and improve market liquidity (Boone and Raman, 2003).
According to IAS 38 (IASB, 2004), intangibles should be recognized in the financial
statements as intangibles assets if they can be separately identified from other aspects of
the business, if its use is controlled by the owner as a result of past events and actions, if
future economic benefits exist that flow for the company and if they can be measured on
a feasible basis. Intellectual property (IP), as a whole, typifies the most visible side of those
resources as embodiment of the integrated research and development effort. However,
business and market developments require their valuation and disclosure through addi-
tional reports as well as continuous diagnoses of their real benefits and returns.
This chapter aims to highlight the scope of intangible resources as key drivers in the
value creation process and economic growth, and to identify their main categories, their
Ilídio Tomás Lopes
72
measurement and disclosure approaches. It also aims to emphasize the need to monitor
the micro and macroeconomic innovation effort and diagnose its link age with business
returns. Innovation turnover analysis constitutes a basic approach about intellectual prop-
erty as a key driver towards better strategic and financial performance achievements.
3.2. Measurement and valuation of intangibles
Several approaches have been followed towards intangibles identification, measure-
ment and disclosures. Those methods are normally included in two different groups:
quantitative approaches or qualitative approaches (Lagrost et al., 2010; Reilly and Shweihs
(1999). Multiple categories were identified (e.g. through Edvinsson’s approach in the Skan-
dia Navigator framework), in particular human capital, structural capital, renewal capital
and relational capital (Edvinsson and Malone, 1997). However, those resources are identi-
fied as knowledge assets in the economic theory, as intellectual capital in the manage-
ment focus and as intangible assets from an accounting point of view.
3.2.1. Models based on cost
The cost-based approach has in its core the concept of cost, in particular the book cost
or the current replacement cost. Book cost (also mentioned as reproduction cost) refers
to the expenditures associated with the construction or acquisition of an exact replica
(disregarding the existence of any active markets and competition) of the intangible asset.
The replacement cost takes into account the expenditures associated with acquisition or
recreation. This approach tries to restore the level of satisfaction despite its inherent sub-
jectivity, adjusted for obsolescence whether physical, functional or economic.
In the costapproach, several components should be identified: raw materials, manpow-
er, overheads, and other costs. As mentioned before, obsolescence should be deducted
from its gross value in order to reflect its true value (note that replacement cost follows
the assumption that service capacity of the assets should be restored). Reilly and Shweihs
(1999:99) identify four types of amortization: 1) Physical deterioration resulting from its
use or destruction; 2) Functional obsolescence, associated with the assertion that asset no
longer fulfills its original function and therefore it may represent an important source of
market loss position; 3) Technological obsolescence, also considered a particularization of
BETWEEN INTANGIBLES IDENTIFICATION AND THEIR MEASUREMENT AND DISCLOSURE: BEHIND THE VALUE CREATION FROM INNOVATION
73
functional obsolescence, it arises when original function is no longer desirable according
technological developments; 4) Economic obsolescence (also mentioned as external ob-
solescence), it results from purely external factors extraneous to the intangible asset itself.
Using original cost to measure intangible assets often misses the web of complementa-
rities that adds value to intangibles (Cohen, 2005). Fair value, as a concept derived from
the market or income approaches, does not capture key value sources that effectively
contribute for sustainable companies’ returns.
3.2.2. Models based on market price
This approach commonly uses prices of market transactions involving identical (level
1) or similar (level 2) assets or liabilities as established in the fair value hierarchy. Through
this pricing methodology, two categories of procedures are normally followed (Cohen,
2005;Reilly and Shweihs, 1999): based on data collection about transactions made in an
active market (by selling or by licensing) or by accessing the market conditions which may
influence the price level. This is a complex analytical process in which old concepts (e. g.
acquisition or replacement cost, depreciation and amortization, etc.) are not ignored. The
foundations towards price level fixing are also based on cost or in revenue approaches.
The application of this approach is made through a systematic process that, according
to Reilly and Shweihs (1999:102-103), is developed into eight distinct steps: 1. Collection
and selection of market data (in this step several factors must be taken into account as
market efficiency, timing, adequacy of the intangible asset market and the relevance of
that specific market. Type of intangible assets, their use, industry in which asset performs
its function, expected date to consummate the transaction should be also considered);
2. Classification of selected data (in this stage, it is important to identify whether compa-
rable data was obtained or if, indeed, treat data obtained only supports a specific trans-
actional orientation); 3. Verification of selected data (checking data consistency namely if
data results from multiple market considerations and if those prices apply only to situa-
tions of actual sales, licensing processes or even to other transfer transactions); 4. Selec-
tion the measurement model used in comparisons (data translation in equivalent units
such as the price per customer, per contract, per subscriber, per line of code, by brand, per
employee, per patent, by formula. These examples are associated with a broader intangi-
ble assets categorization as intangible assets related to customers, to data processing and
technologies, to markets, to human capital or to intellectual property); 5. Quantification of

Ilídio Tomás Lopes
74
multiple pricing (the main objective in this stage is to achieve a common denominator);
6. Adjustments to multiple price (at this stage, we seek for differences in market condi-
tions as well as for mitigation of systemic changes deriving from market dynamics); 7. Ap-
plication of multiple prices (translation process of the adjusted prices according the units
that actually reflect the better comparison achieved. It is, in fact, a standardization process
used in comparables analysis); and 7. Reconciliation of values (this step is the measure-
ment of strengths and weaknesses associated to the quantity and quality of the entire
process, the magnitude of adjustments and their relative importance). Market multiples
pricing approach is quite interesting in the measurement of intangibles assets (Cohen,
2005; Koller et al., 2005), especially for intangibles included in the second level of fair value
concept. It can be applied for commodities and assets with attributes easily delineated
and actively traded.
3.2.3. Models based on expected returns
The key assertion for this approach states that intangible assets value is the present
value of their future economic returns (possible cash flows discounted at a risk-free rate),
managed by its owner or keeper. The discount rate required to estimate de present cash
flows, associated with the income forecasting techniques, is strongly imbued of risk and
uncertainty (Mardet al., 2007, Cohen, 2005; Reilly and Schweihs, 1999). In order to mitigate
that risk, several models have been followed by financial analysts such as the capital as-
set pricing model (CAPM), arbitrage pricing theory (APT) or the Fama-French Three Factor
Model.
To achieve unbiased expected cash flows for a particular intangible asset is not a fea-
sible and reasonable task. Intellectual property normally produces indirect cash flows
deriving from the entire business and not from a particular asset. It applies for patents,
trademarks, brands, except in the particular case of their external licensing. Depending of
the industry, and behind the inexistence of an active market, those outcomes are not duly
assigned to probabilities defined on a feasible basis.
These valuation approaches are strongly marked by current market expectations and,
derived from that, a deep subjectivity in the cash flows forecasting. Techniques such as
option-pricing models, binomial models, or the multi-period excess earnings model (as
also stated in SFAS 157), can be used to measure the gross income, the net operating
income, the net income after taxes, the operating cash flow, the net cash flow, among
BETWEEN INTANGIBLES IDENTIFICATION AND THEIR MEASUREMENT AND DISCLOSURE: BEHIND THE VALUE CREATION FROM INNOVATION
75
others. However, measures based on cash flows should be applied because they are not
influenced by accounting operations that do not originate any monetary flows such as
amortizations, provisions and other non-monetary adjustments.
3.3. Particular cases
3.3.1. Intellectual property
Intellectual property (patents, trademarks and copyrights, software, etc.), have been
seen by economic agents as no more than legal instruments or as basic tools for business.
Many companies have explored this type of asset, managing the intellectual property (IP)
portfolio as a potential competitive weapon and source of unexpected returns (Seldon,
2011; Lagrostet al., 2010; Germeraad, 2010; Taghaboni-Dutta et al., 2009; Ramanatyhan et
al., 2001; Rivette and Kline, 2000; Shapiro and Varian, 1999). The management of IP portfo-
lios became a key driver towards the financial and strategic positioning achievements. In
this scope, we emphasise the registered IP, as codified or un-codified organisational and
human capital (Contractor, 2001). Despite its legal protection, IP should be managed, as
mentioned by Germeraad (2010),as a strategic tool duly aligned and embedded with in-
novation strategy and goals.
The identification of competitive advantages emerging from IP claims for to identifi-
cation of certain key drivers, namely research and development expenditure indicators
and innovation processes inside the organizations. These drivers allow companies to gain
competitive advantages from a market and in financial perspective. According to Riv-
ette and Kline (2000), investing in IP allows companies to increase their expected future
returns and, aligned with other structural capital items, it allows companies to achieve
important strategic and financial returns (Edvinsson and Malone, 1997) which should flow
for its owner. Its translation into competitive advantage can:
Protect core technologies and business methods;
Tap patents for new revenues;
Boost research and development and branding effectiveness;
Anticipate market and technology shifts
Reduce costs; and
•
•
•
•
•
Ilídio Tomás Lopes
76
Attract new capital and enhance corporate value.
This assertion, broadly irrefutable, is gradually being assumed as a strategic principle,
drawing our attention to internal innovation activities and processes. Measuring it is not
an easy or feasible task. Several methods (quantitative or qualitative) have been followed
in order to complete that task: approaches based on income, in market or, at least, meas-
ured at its historical cost. The expected returns still remain the most important corollary,
enabling companies to include those assets in their financial statements, unless, as some-
times, they are used, only for internal purposes. However, uncertainty about intangibles
benefits, and the way how organizations capture their potential return, can not be ig-
nored or set out as unmanaged organizational drivers. Organizational creativity processes
are strongly embodied in innovation efforts. As referred by Lev (2001:37):“Intangibles such
as R&D, human capital, and organizational assets are the major inputs into firms innovation or
creativity processes. While our understanding of the origins, drivers, and circumstances condu-
cive to innovation process is in its infancy, it is widely recognized that innovation is highly risky
relative to other corporate activities, such as production, marketing and finance”.
3.3.2. Research and development
Expenditures on research and development (R&D) are probably the most cited and ex-
plored intangible resource in the literature (Chiesa et al., 2009; Abbody and Lev, 2003, Boone
and Raman, 2003;Brynjolfssonet al., 2002; Neiland Hickey, 2001). As with other intangibles
resources, some concerns arise related to their identifiably and separability. Hence, IAS38
(IASB, 2004) suggests that research expenditures should be recognized as expenses when
they occur while the development disbursements should be capitalized. The immediate
recognition of R&D as an expense will certainly lead to a gap time between the recogni-
tion accounting period, and the possible future return to the owner. That gap is targeted
by most authors as an inducer of asymmetric information since that return is not reflected
in the balance sheet of the organization nord is closed in the financial reporting.
Expenditures on R&D may also be reflected in internal gains, especially for compa-
nies that drive their strategies based on innovation activities. The evidence provided by
Aboody and Lev (2003) allow academics and practioners to conclude that the internal
gains are significantly higher in intensive organizations in R&D. In addition, it was also evi-
dent that there is a positive correlation between the reaction of investors and the public
disclosure of information about expenditure on R&D. Those authors also corroborate the
•

BETWEEN INTANGIBLES IDENTIFICATION AND THEIR MEASUREMENT AND DISCLOSURE: BEHIND THE VALUE CREATION FROM INNOVATION
77
evidence that there is an internal manipulation by managers regarding the public disclo-
sure of that information prior its impact on stake holders, mainly on current or potential
investors. Expense R&D in stead of capitalizing it, leads one of the major distortions in the
financial statements, although the poor evidence of a direct association between that
expenditure and its possible future return.
3.3.3. Copyrights and trademarks
Copyrights, trademarks, and patents are the category of intellectual property that has a
specific common characteristic: those items are, usually, legally protected. This legal pro-
tection acts, as expressed by Reilly and Schweihs (1999), as an important inducer factor of
innovation.
The copyright is in itself a set of legally protected rights that flow to the holder, cover-
ing a diversity of creative and artistic works. Thus, an organization may be the holder of
such works whose future economic benefits (by the way of sale or transfer, in whole or in
part) can flow for its owner directly. This is one of the main conditions to recognise those
items as intangible assets, according the referred IAS 38.
As already discussed in this chapter, the measurement approach for these items should
follow, in most cases, the cost based approach. However, severe limitations arise with
this approach because only the cost of creation really makes sense. Refer to replacement
costs should be applied only when the copyright, in itself, adopts a monopoly position.
The notion of replacement is, in this scope, devoid of any practical meaning. Therefore,
we emphasize the idea that the cost-based approach acts as an indicator of the minimum
value to be considered for measurement and valuation, based on its uniqueness.
The importance of brands is, as for the majority of intangible assets, and complementarily
to the measurement and valuation issues, their inclusion in the company’s financial state-
ments, namely the company’s balance sheet. The discussion emerged from this hypothesis
is purely instrumental because, as pointed out by Blackett (1993), investors, analysts, profes-
sionals, and managers drive their analysis to the identification of value drivers, including
the intangibles impact in the financial and strategic positioning. Although the regulations
would prevent the recognition, in the balance sheet, the brands internally developed, it
should be also considered for financial and management supplementary disclosures.
Regarding the valuation of trademarks and copyrights, valuation models follow, in
most cases, a market or income approaches once their value is intrinsically indexed to the
Ilídio Tomás Lopes
78
potential for future returns (Clement and Foster, 2003; Seetharaman et al., 2001; Schweihs
and Reilly, 1999; Smith, 1997).
3.3.4. Patents
The patenting process translates the effectiveness of R&D disbursements, apart of
their accounting treatment. According Cotropia (2009), patents as real options, are the
way for economic and financial leverages based on the knowledge embodied on it.
The most common method disclosed for the measurement of patents is based on the
determination of the pay off for the potential royalties associated with them. This is an
easy method of application which represents a feasible indicator of value. It can be used
in determining the value of a single invention or even to determine their relative value
in relation to the entire patent portfolio. In general, this method relies on the following
key inputs:
- Average remaining legal protection of the patent: it must be used or economic life of
the patent is lower than that for the purpose of predicting the expected revenues;
- Forecast in come: income exclusively associated with products or services that use the
patent under valuation;
- Royalty rate (e.g. by comparison with other licensing agreements or based on the cost
of invention patent)
- Tax rate (cash flows after taxes);
- Discount rate: reflects the risk associated to the cost of capital.
Usually, what exists in practice is a mere assignment of patent rights without transmis-
sion of any know-how or trade secrets. However, in particular cases it is possible to found,
in addition to those patent rights, technological rights and conditions that allow their
commercial promotion. In both cases, the measurement approach can follow the same
system as described above.
The previous approach is based on the yield and forecasted future returns. Other di-
mensions have been taken into consideration in the diagnosis of the importance of pat-
ents towards value creation in the organizations. In this scope, we cite Espina (2003:70),
concerning his work with in the pharmaceutical industry: “in order to achieve the economic
value of patents, a form of intellectual property, we focused on three dimensions that are fun-
damental for value creation. The first is a count of patents as an indicator of the ability to create,
develop and complete new inventions. Second, patent citation, which reflects the quality of in-
BETWEEN INTANGIBLES IDENTIFICATION AND THEIR MEASUREMENT AND DISCLOSURE: BEHIND THE VALUE CREATION FROM INNOVATION
79
tangible assets, and finally, the technology spectrum, offering the prospect of the technologies
covered by the actual discovery”.
3.3.5. Software development
Software internally developed can be measured through any of the approaches already
mentioned and explored. However, the approach based on cost is the one that has been
proven more adherences into practice (Reilly and Garland, 2001). We did not discuss, in
this scope, the reasons that drive the decision for the internal development of soft ware.
Broadly, we strongly believe that those reasons do not diverge from the key motivations
that support the investment in all other intangibles, namely commercial (even with an
indirect impact), financial and fiscal reasons, or just the desire to achieve a differentiated
position in relation to the other market participants.
From the owner’s perspective, the software externally acquired should be measured
at cost, which includes the prices pent on the acquisition (or the amount paid for his li-
censing) plus the specific costs associated with its modification for internal adaptation. In
case of software internally developed, and through models (e.g. useful life methods) and
engineering principles, the measurement must also include the expenditure charged in
this process, including in our opinion, some figurative costs. In this case, measurement
should be based on the useful life cycles which support the development of such soft-
ware, name life as ability studies, planning, software design, coding, testing, technical
documentation and expenditures associated with its implementation.
There are, however, methods that instead of focusing on the activities associated with
the process, take into account the number of lines of code actually produced. It seems
that the first perspective is the most faithful and adjusted if we deem. Internal informa-
tion (such as historical information contained in financial statements and budgets) and
external information (e.g. publications, prospects for salaries in industry, etc.) if we follow
an approach based on cost to software development measurement and valuation.
3.3.6. Strategic alliances
Strategic alliances are, according to several authors (Boronat-Navarro and Villar-López,
2010; Joia and Malheiros, 2009; Pana, 2003; Daset al., 1998) an important source of value,
although there actions of investors depend on several factors including the size of the
organizations involved in the process and the fields included in the alliance agreement.
Ilídio Tomás Lopes
80
The potential to create synergies through the sharing of common operations such as
R&D, production, distribution and sales has been recognized as a source of value where
the leverage effects are most valuable. The uncertainty among investors in creases when
alliances are announced at the marketing level, contrary to what happens when they deal
with technological aspects (Boronat-Navarro and Villar-López, 2010). The reason for this
evidence seems to be related to different levels of in tangibility. Alliances based on tech-
nological drivers seem to be more attractive to investors regarding future levels of return.
The same evidence can be achieved from the perspective of the SME. Investors react very
positively if a SME is involved in a technological alliance.
Koza and Lewin (2000) have referred to three types of strategic alliances: 1. Learning
alliances; 2. Partnership alliances, and 3. Hybrid business alliances. In the learning alliances,
the former aims to reduce information asymmetries between the partners involved and
seek for the common creation of new knowledge. In the second type (partnership alli-
ances), the partners are driven by targets mainly on use of competences and capabilities
rather than in its exploitation. Finally, hybrid strategies are those that have strong objec-
tives both in the exploration and in use of capabilities and competences.
Regarding its measurement, there is no strong empirical evidence that reflects the
value of such alliances, independently of the type under analysis. However, we are con-
vinced that an approach based on income would be the best approach to reflect the
potential return derived from them.Te same approach described for patents can be the
way ahead for alliances measurement and valuation, following the principles stated by
Reilly and Shweihs (1999) or even Lagrost et al. (2010).
Finally, we underline the assertion that development and promotion of intangible as-
sets is an activity based on risk: the internal identification and measurement of intangibles
can contribute for financial and strategic leverages but disclose them externally is the way
ahead for their imitation and appropriation. Nevertheless, we corroborate the assump-
tions of Stanko sky (2008) about the need to identify and assign names to the intangibles
that can be recognized and subsequently measured. However, the first step is their iden-
tification. Intangibles are, in its essence, strongly linked with innovative organizations. This
approach and view will be explored in a forthcoming section of this chapter.
BETWEEN INTANGIBLES IDENTIFICATION AND THEIR MEASUREMENT AND DISCLOSURE: BEHIND THE VALUE CREATION FROM INNOVATION
81
3.4. The intangibles reporting paradigm
3.4.1. From its identification to its dissemination
The issues surrounding the non-inclusion of intangibles in the companies’ financial
reports, despite its importance for investors in their investment decisions seems unques-
tionable (Griggs, 2008; Mardet al., 2007; Blair and Wallman, 2003; Lev and Zarowin, 2003).
Traditionally, the economic and financial developments around intangibles have been
focused on finding measures that might translate into monetary units their potential re-
turns. In some cases, the valuation process seems linear (e.g. development expenditures),
in other cases its measurement cannot be achieved on a feasible basis. Therefore, alterna-
tives to monitor and to disseminate them are required (Sveiby, 1997) such as intellectual
capital reports or some types of scoreboards.
Blair and Wallman (2003) refer to the fact that traditional models of accounting are de-
void of usefulness within the intangibles because they were designed and directed to the
registration of discrete and sequential facts as well as evidence of its cumulative effects. It
turns out that the major impact of intangibles is not consistent with this discrete and se-
quential impact, but rather results from the combined effect of investment in other types
of assets (tangibles and other intangibles). A copyright or trademark (Seethamraju, 2003;
Gobeli et al., 2001), expenditures on research and development (Boone and Raman, 2003;
Chan et al., 2003; Neil and Hickey, 2001), an alliance (Inkpen and Madhok, 2001), a license
(Aulakh, 2001), investments in workforce (King, 2001), Goodwill (Arnold et al. 1992), have a
total permeability to a discrete nature and behavior. Moreover, those examples embody
strong synergy effects, also embodying the creation of economic value added, an indica-
tor in itself that reflects the consolidated and sustainable competitive advantage.
The financial statements, in the narrow sense, include the company’s book value +/-
difference in the fair values of assets and liabilities recognized +/- the fair values of assets
and liabilities that do not meet the criteria of intangible assets and therefore are not rec-
ognized (e.g. patents developed internally through research and development processes).
In a broad sense (we assume the concept of integrated financial reporting), and according
IAS 38 and SFAS 157, additional information disclosures are required in order to comply
with business and operations comprehensiveness: fair values, impairment fluctuations,
valuation methods, opportunities, risks and even economic psychology factors. This re-
Ilídio Tomás Lopes
82
port would result in a special disclosure approach that indicates, in some cases, the entire
market capitalization.
It seems that the linear approach identified above, is provided towards the conver-
gence and alignment with international accounting standards, particularly with regard
to the business comprehensiveness (Griggs, 2008; Davison, 2008; Abdelsalam et al., 2007).
Traditional financial statements do not reflect, on a feasible basis, the key value drivers. The
search for non-financial metrics (indices, ratios, counts) may be an interesting approach in
order to improve the financial reporting and its usefulness for stakeholders (Lopes, 2010;
Griggs, 2008; Abdelsalam et al., 2007, Roos et al., 1997; Edvinsson and Malone, 1997).
In order to underline the main limitations of traditional financial statements, a set of
prepositions should be mentioned:
1. The orientation of traditional financial statements solely for historical aspects and
whose value emerges only from the assets and liabilities actually recorded;
2. The fact that the drivers of value are essentially non-financial and thus not filed in
financial reports;
3. Intangible assets are not recognized in financial statements when internally generated;
4. Financial reports are prepared especially for specific purposes, in particular fiscal purposes.
Lev and Zarowin (2001:488) highlight the decline of the reporting based on the results
in cash flows and asset values for supremacy of other activities, generally linked to invest-
ments in intangibles, particularly in research and development, information technology,
brands and human resources. Those authors show that investments in intangibles, partic-
ularly the research and development disbursements, are considered the major drivers of
innovation and hence the change in business embodied in the creation of new products,
franchises and process improvements. This approach contradicts the guidelines provided
by IAS 38: research costs are fully charged to the income statement, but development is
capitalized and amortized, with associated cash flows shown as investing activity. Howev-
er, and according US GAAP treatment, research and development costs are all expensed,
related cash flows are recognized in operating activities.
Lev`s research (2001), in particular its value chain scoreboard, has played an important
role in the extensive discussion around the limitations of traditional accounting systems
and financial reporting. In this scoreboard, nine categories of intangibles are identified.
In fact, the main key drivers are included in those categories and can contribute to value
creation through a cause and effect chain (Three phases approach: 1. Discovery and learn-

BETWEEN INTANGIBLES IDENTIFICATION AND THEIR MEASUREMENT AND DISCLOSURE: BEHIND THE VALUE CREATION FROM INNOVATION
83
ing; 2. Implementation; and 3. Commercialization).The comprehensiveness and relevance
of fi nancial statements should be improved through an integrated analysis of economic
and technological aspects, namely the intellectual property.
Source: Adapted from Lev (2001:111)
Figure 3.1. Lev´s value chain scoreboard
The fi rst phase – Discovery and Learning – is actually the base, because they refl ect the
adaptive capacity both internally and externally and therefore represent the beginning
of the value chain. Due to the strong intensity and consistency required in allocating re-
sources (and consequent spillovers), this phase represents the pillar/more intensive step.
The second phase – Implementation - refl ects the true conversion of knowledge (Nonaka
and Takeuchi, 1995) by the technological reliability of products, services and/or processes
under development. In our opinion, the greater risk mitigation is achieved in this phase.
The third and fi nal phase – Commercialization – represents the realization of the innova-
tion process, materialized and translated into fi nancial and non-fi nancial returns, particu-
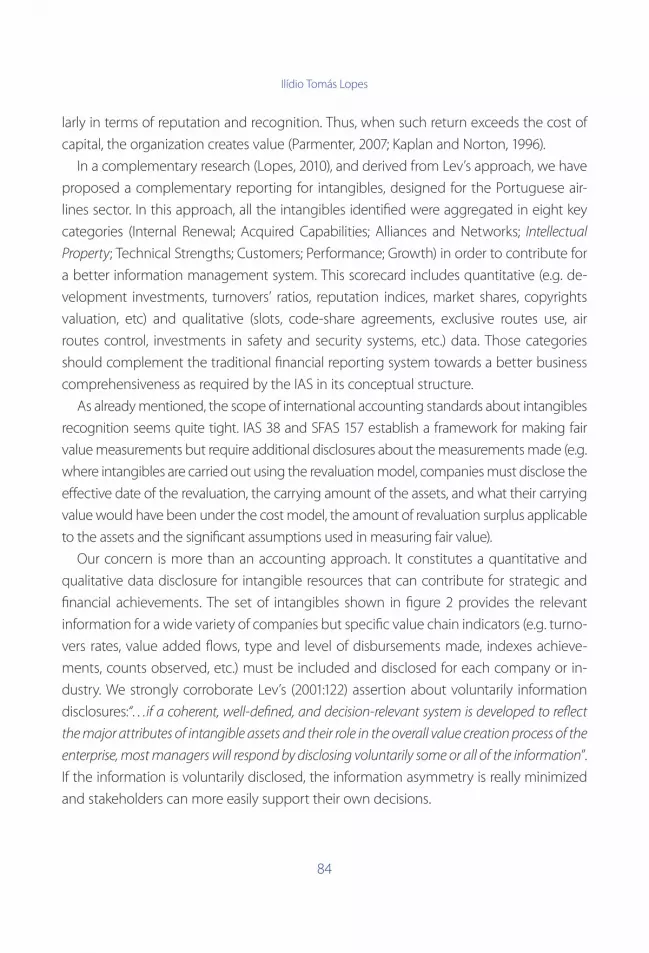
Ilídio Tomás Lopes
84
larly in terms of reputation and recognition. Thus, when such return exceeds the cost of
capital, the organization creates value (Parmenter, 2007; Kaplan and Norton, 1996).
In a complementary research (Lopes, 2010), and derived from Lev’s approach, we have
proposed a complementary reporting for intangibles, designed for the Portuguese air-
lines sector. In this approach, all the intangibles identified were aggregated in eight key
categories (Internal Renewal; Acquired Capabilities; Alliances and Networks; Intellectual
Property; Technical Strengths; Customers; Performance; Growth) in order to contribute for
a better information management system. This scorecard includes quantitative (e.g. de-
velopment investments, turnovers’ ratios, reputation indices, market shares, copyrights
valuation, etc) and qualitative (slots, code-share agreements, exclusive routes use, air
routes control, investments in safety and security systems, etc.) data. Those categories
should complement the traditional financial reporting system towards a better business
comprehensiveness as required by the IAS in its conceptual structure.
As already mentioned, the scope of international accounting standards about intangibles
recognition seems quite tight. IAS 38 and SFAS 157 establish a framework for making fair
value measurements but require additional disclosures about the measurements made (e.g.
where intangibles are carried out using the revaluation model, companies must disclose the
effective date of the revaluation, the carrying amount of the assets, and what their carrying
value would have been under the cost model, the amount of revaluation surplus applicable
to the assets and the significant assumptions used in measuring fair value).
Our concern is more than an accounting approach. It constitutes a quantitative and
qualitative data disclosure for intangible resources that can contribute for strategic and
financial achievements. The set of intangibles shown in figure 2 provides the relevant
information for a wide variety of companies but specific value chain indicators (e.g. turno-
vers rates, value added flows, type and level of disbursements made, indexes achieve-
ments, counts observed, etc.) must be included and disclosed for each company or in-
dustry. We strongly corroborate Lev’s (2001:122) assertion about voluntarily information
disclosures:“…if a coherent, well-defined, and decision-relevant system is developed to reflect
the major attributes of intangible assets and their role in the overall value creation process of the
enterprise, most managers will respond by disclosing voluntarily some or all of the information”.
If the information is voluntarily disclosed, the information asymmetry is really minimized
and stakeholders can more easily support their own decisions.
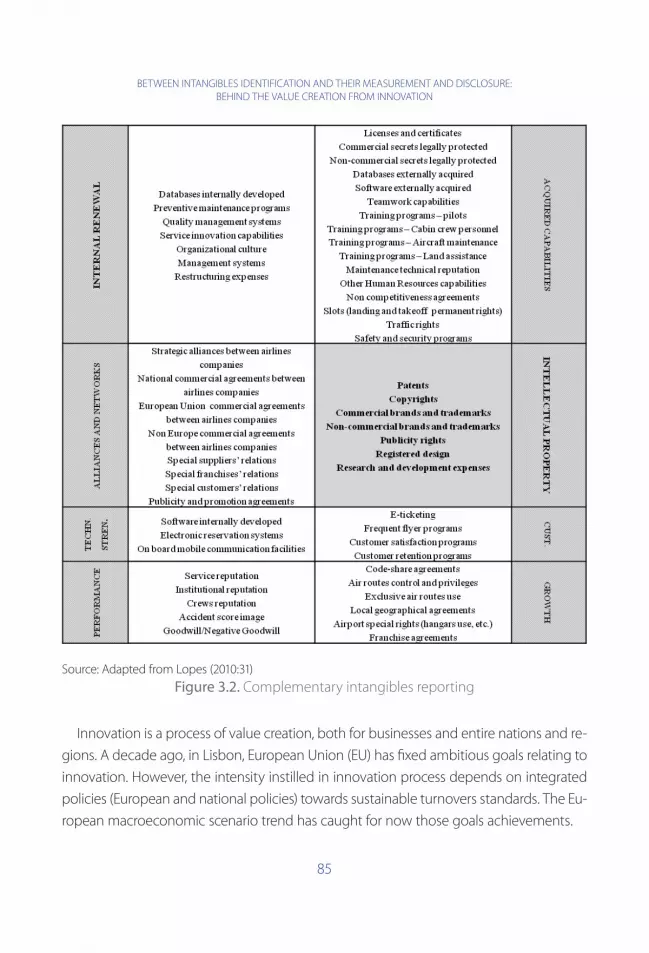
BETWEEN INTANGIBLES IDENTIFICATION AND THEIR MEASUREMENT AND DISCLOSURE: BEHIND THE VALUE CREATION FROM INNOVATION
85
Source: Adapted from Lopes (2010:31)
Figure 3.2. Complementary intangibles reporting
Innovation is a process of value creation, both for businesses and entire nations and re-
gions. A decade ago, in Lisbon, European Union (EU) has fi xed ambitious goals relating to
innovation. However, the intensity instilled in innovation process depends on integrated
policies (European and national policies) towards sustainable turnovers standards. The Eu-
ropean macroeconomic scenario trend has caught for now those goals achievements.
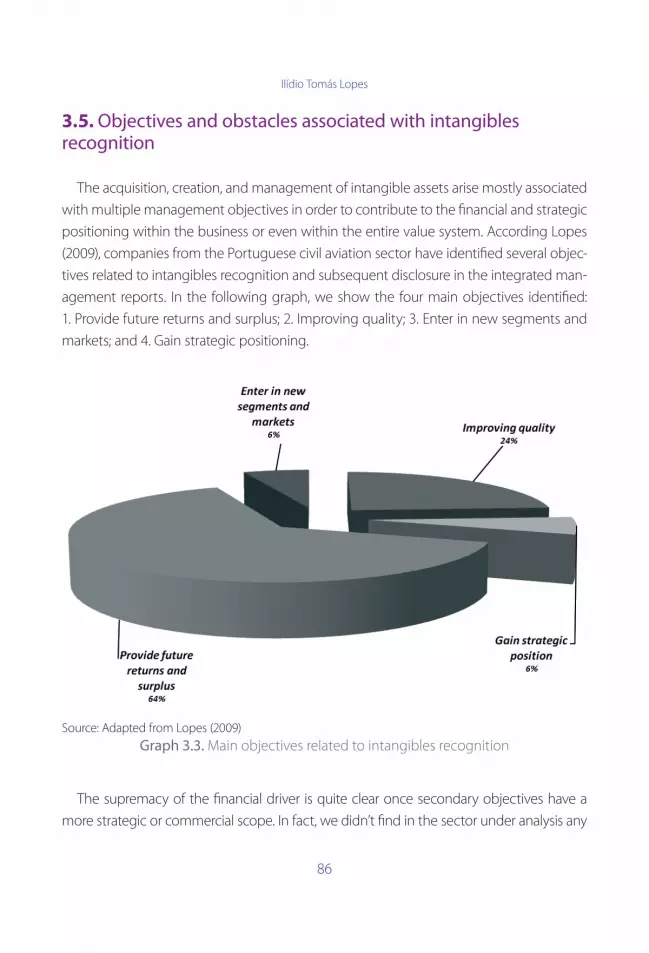
Ilídio Tomás Lopes
86
3.5. Objectives and obstacles associated with intangibles recognition
The acquisition, creation, and management of intangible assets arise mostly associated
with multiple management objectives in order to contribute to the fi nancial and strategic
positioning within the business or even within the entire value system. According Lopes
(2009), companies from the Portuguese civil aviation sector have identifi ed several objec-
tives related to intangibles recognition and subsequent disclosure in the integrated man-
agement reports. In the following graph, we show the four main objectives identifi ed:
1. Provide future returns and surplus; 2. Improving quality; 3. Enter in new segments and
markets; and 4. Gain strategic positioning.
Source: Adapted from Lopes (2009)
Graph 3.3. Main objectives related to intangibles recognition
The supremacy of the fi nancial driver is quite clear once secondary objectives have a
more strategic or commercial scope. In fact, we didn’t fi nd in the sector under analysis any
BETWEEN INTANGIBLES IDENTIFICATION AND THEIR MEASUREMENT AND DISCLOSURE: BEHIND THE VALUE CREATION FROM INNOVATION
87
signifi cant dependence between those objectives, and the characteristics of the compa-
nies involved in the research (in all cases, we didn’t reject the null hypothesis which states
that the objectives and the airlines companies characteristics are independent for a signifi -
cance level of 95%). This suggests that the aim identifi ed as “Provide future return or surplus”
is independent from the type of license issued by National Aviation Agency, from the type
of transportation granted by the airline company, from its integration (or not) in business
group, from the capital ownership, and from the companies dimension indicators.
As already mentioned, the recognition of intangibles and the initial and subsequent
measurement have several obstacles towards their inclusion in the fi nancial statements,
or in the complementary reports. In this scope we have also identifi ed several obstacles
towards more integrative management systems.
Source: Adapted from Lopes (2009)
Graph 3.4. Obstacles to intangibles recognition and measurement
Ilídio Tomás Lopes
88
The main obstacles mentioned in graph 2 are also independent from the characteristics
of the airlines companies. We are, therefore, behind a structural issue, which consolidates
the remark associated to the absence of a legal framework which requires the inclusion
and disclosure of intangibles in the financial reporting system. Another obstacle is the dif-
ficulty to achieve its intrinsic value. Some respondents have also referred that the models
available in the literature, while sharing the same origin and essence, are mere theoretical
postulates with low potential and linkage with operational procedures.
3.6. Innovation as the core activity for sustainable turnover
At a macroeconomic level, the intensity of research and development (R&D) invest-
ments also typifies a key innovation indicator that induces competitive advantages be-
tween nations or regions. Intellectual capital should also be measured at a country level,
as stated by Stahle and Stahle (2012).
In the last decade, in Europe, moderate increases have been observed, particularly in
the business enterprise sector. As stated by European Union in the Lisbon’s strategy, EU
members should increase its R&D expenditure to at least 3% of GDP in 2010 (average, in
1998: 1,4% of GDP). This type of expenditure is seen, in this scope, as the creative work de-
veloped on a systematic basis in order to achieve higher standards of knowledge by the
business enterprise sector. However, among those states above the European average,
the Nordic countries have been the leaders with regard to the intensity of R&D (% of GDP),
both in the business enterprise and public sectors (e.g. in higher education institutions).
As regards, the poor levels observed in the other countries, in particular for the ones that
have joined the European Union in the last decade, new and stronger macroeconomic
policies are required, that, in the medium and long run, can support the new business
models development and generate increased competitive advantage.
Patent registration is, probably, the most visible indicator of innovation management. Ac-
cording to Willigan (2001:35): “Companies wishing to exploit their intellectual assets may wish to
establish an incentive program for scientists and engineers to direct and motivate their invention ac-
tivity. The objectives of such an incentive program are to channel invention activity into areas where
the current patent portfolio needs improvement and to identify areas of future technology that com-
panies need to “play in” in order to be successful in the “knowledge-based” world of the future”.
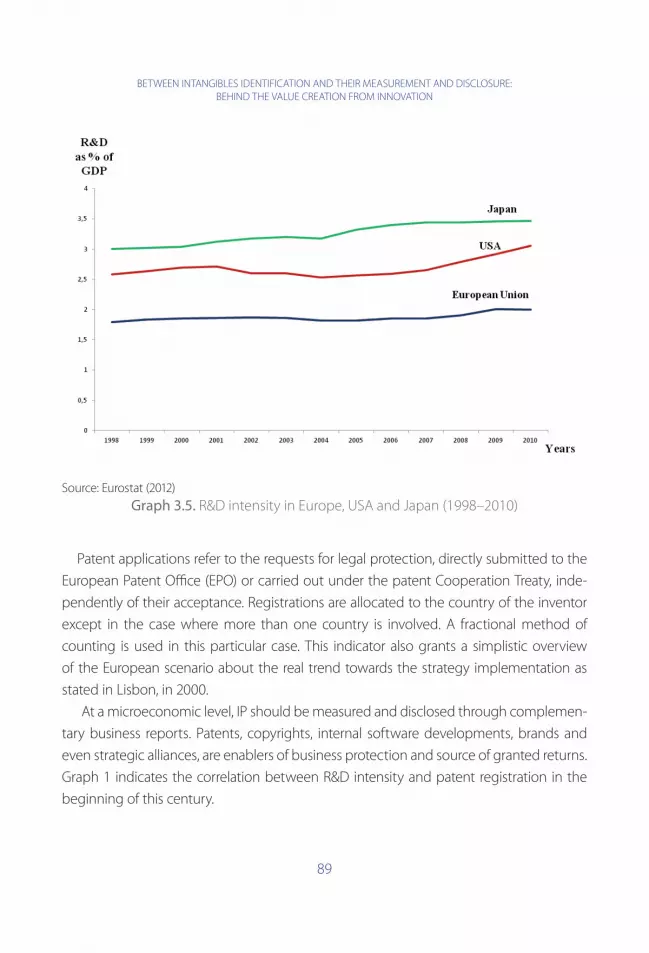
BETWEEN INTANGIBLES IDENTIFICATION AND THEIR MEASUREMENT AND DISCLOSURE: BEHIND THE VALUE CREATION FROM INNOVATION
89
Source: Eurostat (2012)
Graph 3.5. R&D intensity in Europe, USA and Japan (1998–2010)
Patent applications refer to the requests for legal protection, directly submitted to the
European Patent Offi ce (EPO) or carried out under the patent Cooperation Treaty, inde-
pendently of their acceptance. Registrations are allocated to the country of the inventor
except in the case where more than one country is involved. A fractional method of
counting is used in this particular case. This indicator also grants a simplistic overview
of the European scenario about the real trend towards the strategy implementation as
stated in Lisbon, in 2000.
At a microeconomic level, IP should be measured and disclosed through complemen-
tary business reports. Patents, copyrights, internal software developments, brands and
even strategic alliances, are enablers of business protection and source of granted returns.
Graph 1 indicates the correlation between R&D intensity and patent registration in the
beginning of this century.
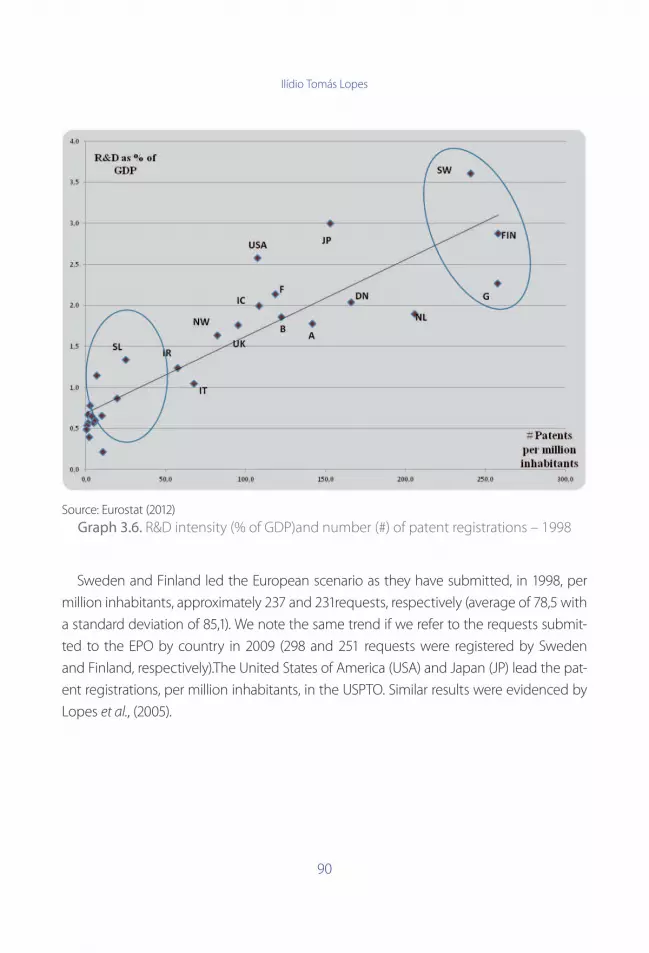
Ilídio Tomás Lopes
90
Source: Eurostat (2012)
Graph 3.6. R&D intensity (% of GDP)and number (#) of patent registrations – 1998
Sweden and Finland led the European scenario as they have submitted, in 1998, per
million inhabitants, approximately 237 and 231requests, respectively (average of 78,5 with
a standard deviation of 85,1). We note the same trend if we refer to the requests submit-
ted to the EPO by country in 2009 (298 and 251 requests were registered by Sweden
and Finland, respectively).The United States of America (USA) and Japan (JP) lead the pat-
ent registrations, per million inhabitants, in the USPTO. Similar results were evidenced by
Lopes et al., (2005).

BETWEEN INTANGIBLES IDENTIFICATION AND THEIR MEASUREMENT AND DISCLOSURE: BEHIND THE VALUE CREATION FROM INNOVATION
91
Source: Eurostat (2012)
Graph 3.7. R&D intensity and patent registrations – 2010
As expected, both in 1998 and in 20101, we found a statistical signifi cant correlation
between R&D investments and patents registered in the international offi ces (overall ad-
justed R2above 86%).These results are aligned with the assertions stated by Taghaboni-
Dutti (2009). Patent analysis can be used to monitor some trends in order to understand
the innovative activities developed inside the organizations, diagnose the internal weak-
nesses and strengths and interpret the market demand.
If we compare the information stated in graphs 4 and 5, the European scenario did
not change signifi cantly, since 1998. Research and Development ratio has not increase,
far away form the goal stated, from European Union, for 2010. The supremacy of the
Nordic countries (FIN and SW), USA and Japan becomes clear. Other European countries,
1 The data for 2010 was duly forecasted, based on the growth rate in observed for the last fi ve years.

Ilídio Tomás Lopes
92
in particular the last ones that have joined the European Union, still present weaknesses
that require technological innovation policies and procedures if they are to achieve a
fair and sustainable alignment. Without these developments, we shall continue to face
the diffi culties arising from a Europe developing at diff erent speeds. Moreover, potential
competitive advantage may be gradually and permanently lost in the digital and global
economy.
Source: Eurostat (2012)
Graph 3.8. Innovation turnover
Concerning the eff ectiveness of R&D intensity, we did not achieve a signifi cant correla-
tion between those expenditures and turnover from innovation (adjusted R2 of -0,203).
Turnover from innovation ratio indicates the % of total turnover derived from new prod-
ucts and services totally new for the market (it occurs when a new or signifi cantly im-
provement was introduced in product/service or in a process). This result seems consis-
BETWEEN INTANGIBLES IDENTIFICATION AND THEIR MEASUREMENT AND DISCLOSURE: BEHIND THE VALUE CREATION FROM INNOVATION
93
tent with evidences achieved by Chan et al. (2003) relating to the stock market valuation
derived from R&D expenditures. In fact, the evidence achieved does not support a direct
link between R&D expenditure (and even other intangibles as advertising) and future
returns. Different evidences were obtained by Lev and Sougiannis (1996) relating insider
gains. These gains in R&D intensive companies are significantly higher than insider gains
obtained in firms not strongly engaged in innovation expenditures. However, and as men-
tioned by Boone and Raman (2003), the disclosure of innovation activities can contribute
for the asymmetry information mitigation and liquidity rates, despite their poor impact in
the company’s periodical revenues.
When an analysis between innovation expenditures and turnovers rates is carried out,
some prudence should be considered: 1. Turnover ratios are normally obtained through
survey. Companies only account and disseminate direct turnover. Intellectual property
has primarily an indirect impact in the businesses turnover, except if royalties exist from
its licensing agreements; 2. Research expenditures are not capitalized. They are directly al-
located to the income statement, affecting negatively the period profit and loss financial
statement; 3. Significant gaps exist between R&D expenditures and turnover effective-
ness. Innovation cycle is, in some cases, structurally long; 4. Several weaknesses exist in
the patents effectiveness. Major part of patents registered in the national or international
offices never produce any return; 5. Innovation culture is not strong enough to ensure
higher turnover ratios. Further investigation is required in this topic in order to evidence
the real weaknesses in the innovation effectiveness process.
In the European scenario, the turnover derived from innovation seems quite residual,
except in some countries with poor rates of innovation intensity. Probably, the cycle of
innovation and its impact in the financial statements will take a long time to become ef-
fective. Or, the innovation effort is only the way ahead to achieve a strategic and leader-
ship positioning.
3.7. Final remarks
The intangible asset concept is, according international accounting and financial stand-
ards, associated with expected future returns. It is viewed as an identifiable non-mon-
etary asset without physical substance, controlled by companies and viewed as source of
Ilídio Tomás Lopes
94
future returns. Their measurement and valuation process is normally based on costs, on
market prices or on expected incomes. Additional disclosures about intangibles are re-
quired by stakeholders in order to mitigate the information asymmetry. Complementary
reports can be the way ahead to achieve the business comprehensiveness as required by
international accounting standards in their conceptual frameworks.
Intellectual property is probably the most visible source of intangible assets, namely
the patent registration effort, supported by the intensity of research and development
disbursements. This evidence is consolidated at a later date by the number of patents ef-
fectively registered and granted by the international agencies. Innovation management
is, therefore, a source of competitive advantage for national economies in general and for
the business sector in particular. However, especially in Europe, we have a lack of innova-
tive ideas and innovation effectiveness that will lead to broad application-based patents.
The European evidence in those domains clearly indicates the need for additional macr-
oeconomic policies towards a sustainable European knowledge economy. The European
scenario did not change, in substance, between 2000 and 2008 and the trend observed
indicates that the Lisbon’s goal for R&D in Europe was not achieved.
References
Abdelsalam, O. H.; Bryant, M. S.; Street, D. L. (2007). “An Examination of the Compre-
hensiveness of Corporate Internet Reporting Provided by London-Listed Companies”,
Journal of International Accounting Research, Vol. 6, nº 2, p. 1–33.
Aboody, David; Lev, Baruch (2003). “Information asymmetry, R&D, and Insider Gains”,
in John Hand and Baruch Lev (Eds.) Intangible Assets: Values, Measures, and Risks. New
York: Oxford University Press, p. 366–386.
Arnold, J.; Egginton, D.; Kirkkam, L.; Macve, R.; Peasnell, K. (1992). Goodwill and Other
Intangibles: Theoretical Considerations and Policy Issues, London: The Research Board.
Aulakh, P. S. (2001). “Compensation Structures in International Licensing Agreements:
An Agency Theory Perspective”, in: Farok J. Contractor (Ed.) Valuation of Intangible As-
sets in Global Operations, London: Quorum Books, p. 64–88.
Blackett, Tom (1993). “Brand and trademark valuation – What’s happening now?”, Mar-
keting Intelligence & Planning, 11(11), p. 28–30.
1.
2.
3.
4.
5.
BETWEEN INTANGIBLES IDENTIFICATION AND THEIR MEASUREMENT AND DISCLOSURE: BEHIND THE VALUE CREATION FROM INNOVATION
95
Blair, Margaret; Wallman, Steven (2003). “The Growing Intangibles Reporting Discrep-
ancy”, in John Hand and Baruch Lev (Eds.) Intangible Assets: Values, Measures, and Risks.
New York: Oxford University Press, p. 451–468.
Boone, Jeff P.; Raman, K. K. (2003). “Off-balance Sheet R&D Assets and Market Liquidity”,
Intangible Assets: Values, Measures, and Risks, John Hand and Baruch Lev (Eds.), Oxford:
Oxford University Press, pp. 335–365.
Brynjolfsson, Erik.; Hitt, Lorin. M.; Yang, Shinkyu (2002). “Intangible Assets: computers
and Organizational Capital”, Brookings Papers on Economic Activity, 1, p. 137–198.
Camisón-Zornova; Boronat-Navarro (2010). “Technological Strategic Alliances and Per-
formance: The Mediating Effect of Knowledge-Based Companies”, Journal of Strategic
Management Education, Vol. 6, N.º1, pp. 5–26.
Chan, Louis K. C.; Lakonishok, J.; Sougiannis, T. (2003). “The stock market valuation of
Research and Development Expenditures”, Intangible Assets: Values, Measures, and Risks,
John Hand and Baruch Lev (Eds.), Oxford: Oxford University Press, pp. 387–414.
Chiesa, Vittorio; Frattini, Federico; Lazzarotti, Valentina; Manzini, Raffaella (2009). “Per-
formance measurement of research and development activities”, European Journal of
Innovation Management, Vol. 12, N-º 1, pp. 25–61.
Cohen, Jeffrey A. (2005). Intangible Assets: Valuation and Economic Benefit, New Jersey:
John Wiley & Sons.
Contractor, Farok J. (2001) “Intangible Assets and Principles for Their Valuation”, Valua-
tion of Intangible Assets in Global Operations, Farok J. Contractor (Ed.), London: Quorum
Books.
Cotropia, Christopher A.(2009). “Describing Patents as Real Options”, The Journal of Cor-
poration Law, Vol. 34, N.º4, pp. 1127–1149.
Das, Somnath;Sen, Pradyot ; Sengupta, Sanjit (1998). “Impact of strategic alliances on
firm’s valuation”, Academy of Management Journal, Vol. 41, nº 1, p. 27–41.
Davison J. (2008). “Rhetoric, repetition, and the “dot.com” era: words, pictures, intangi-
bles”, Accounting, Auditing & Accountability Journal, Vol. 21, nº 6, Bradford, pp. 791–797.
Edvinsson; Leif; Malone, Michael S. (1997). Intellectual Capital: The proven way to establish
your company’s real value by measuring its hidden brainpower, London: Platkus.
EC – EUROPEAN COMMISSION (2010). “Intellectual Capital Statement – Made in Eu-
rope”, European ICS Guideline, DG Research under the EU 6th Framework Programme,
6.
7.
8.
9.
10.
11.
12.
13.
14.
15.
16.
17.
18.

Ilídio Tomás Lopes
96
Brussels, available online at http://www.inthekzone.com/pdfs/Intellectual_Capital_
Statement.pdf, accessed in 18 December 2010.
Espina, Maritza I. (2003). To Renew or Not to Renew …: An Empirical Study of Patent Valu-
ation and maintenance by the U.S. Pharmaceutical Industry, Dissertation of Doctor of
Philosophy, Ann Arbor: UMI.
EUROSTAT (2012). Statistics, available at http://epp.eurostat.ec.europa.eu/portal/page/
portal/statistics/themes, accessed in May 2012.
Financial Accounting Standards Board (FASB) (2006). Statement of Financial Account-
ing Standards N.º 157, Fair Value Measurements.
Germeraad, P. (2010). “Integration of intellectual property strategy with innovation
strategy”, Research Technology Management, pp. 10–18.
Gobeli, D. H.; Mishra, C. S.; Koenig, H. F. (2001). “Strategic Value of Technology and
Brand Equity for Multinational Firms”, in: Farok J. Contractor (Ed.) Valuation of Intangible
Assets in Global Operations, London: Quorum Books, p. 321–333.
Griggs, L. L. (2008). “The Advisory Committee on Improvements to Financial Report-
ing”, Insights, Vol. 22, nº 9, September, p. 17–25.
Inkpen, A. C.; Madhok, A. (2001). “The Valuation of Alliance Knowledge”, inFarok J. Con-
tractor (Ed.) Valuation of Intangible Assets in Global Operations, London: Quorum Books,
p.: 49-63.
International Accounting Standards Board (IASB) (2004), IAS 38 Intangible Assets, Inter-
national Accounting Standards Board, available at: www.iasb.org.uk (accessed in 21
December 2010).
Joia, Luís A.; Malheiros, Rodrigo (2009). “Strategic alliances and the intellectual capital
of firms”, Journal of Intellectual Capital, Vol. 10, N.º1, pp. 539–558.
Kaplan, R. S.; Norton, David P.(1996) The Balanced Scorecard: translating strategy into ac-
tion, Boston: Harvard Business School Press.
King, E. (2001). “Valuing an Assembled Workforce”, in: Farok J. Contractor (Ed.) Valuation
of Intangible Assets in Global Operations, London: Quorum Books, p. 264–279.
Koller, T.; Goedhart; Wessels, D. (2005). Valuation: Measuring and managing the Value of
Companies, New Jersey: John Wiley & Sons.
Koza, Mitchell; Lewin, Arie (2000). “Managing partnerships and strategic alliances: rais-
ing the odds of success”, European Management Journal, Vol. 18, nº 2, April, p. 146–151.
19.
20.
21.
22.
23.
24.
25.
26.
27.
28.
29.
30.
31.
BETWEEN INTANGIBLES IDENTIFICATION AND THEIR MEASUREMENT AND DISCLOSURE: BEHIND THE VALUE CREATION FROM INNOVATION
97
Lagrost, Céline; Martin, Donald; Dubois, Cyrille; Quazzotti (2010). “Intellectual property
valuation: how to approach the selection of an appropriate valuation method”, Jour-
nal of Intellectual Capital, Vol. 11, N-º10, pp. 481–503.
Lev, Baruch; Sougiannis T. (1996) “The capitalization, amortization, and value-relevance
of R&D”, Journal of Accounting and Economics, Nº21, pp. 107–138.
Lev, Baruch (2001) Intangibles: Management, Measurement, and Reporting, Washington:
Brooking Institution Press.
Lev, Baruch; Zarowin, Paul (2003). “The Boundaries of Financial Reporting and How to
Extend Them”, in John Hand and Baruch Lev (Eds.) Intangible Assets: Values, Measures,
and Risks. New York: Oxford University Press, p. 487–510.
Lopes, Ilídio T. (2010). “Towards a complementary intangibles reporting approach”,
Measuring Business Excellence, Emerald Publishing, Vol. 14, No.4, pp. 24–34.
Lopes, Ilídio T. (2009). “The problematic of Intangibles in the Portuguese Civil Aviation
Sector, PhD Thesis, University of Coimbra, Portugal.
Lopes, Ilídio; Martins, Maria do Rosário O.; Nunes, Miguel (2005). “Towards the Knowl-
edge Economy: the Technological Innovation and Education Impact in the Value
Creation Process”, The Electronic Journal of Knowledge Management, Volume 3, Issue 2,
pp. 129–138, available online at www.ejkm.com.
Mard, Michael J.; Hitchner, James R.; Hyden, Steven D. (2007). Valuation for Financial
Reporting: Fair Value Measurements and Reporting, intangibles Assets, Goodwill, and Im-
pairment, New Jersey: John Wiley & Sons.
Neil, D. J.; Hickey, N. A. (2001). “The Option Value of Investment in R&D”, in: Farok J. Con-
tractor (Ed.) Valuation of Intangible Assets in Global Operations, London: Quorum Books,
p. 125–146.
Mouritsen, Jan; Bukh, Per N.; Marr, Bernard (2004). ”Reporting on Intellectual capital:
why, what and how?”, Measuring Business Excellence, Emerald Group Publishing, Vol. 8,
No. 1, pp. 46–54.
Nonaka, Ikujiro; Takeuchi, Hirotaka (1995). The Knowledge – Creating Company, New
York: Oxford University Press.
Pana, Elisabeta (2003). Value Creation through Joint Venture and Strategic Alliance Forma-
tion, Dissertation of Doctor of Philosophy in the Financial Economics Program, Ann
Arbor: UMI.
32.
33.
34.
35.
36.
37.
38.
39.
40.
41.
42.
43.

Ilídio Tomás Lopes
98
Parmenter, D. (2007). Key Performance Indicators: Developing, Implementing, and Using
Winning KPIs, New Jersey: John Wiley & Sons.
Parr,Russel L. (2006). “Patent Valuation: using the Relief-from-royalty Method”, Valua-
tion Strategies, Vol. 9, N.º4, March/April, pp. 4–16.
Ramanathan, K.; Seth, A.; Thomas, H. (2001). “The value of new knowledge-based in-
tangible assets: an examination in the global Pharmaceutical Industry”, Valuation of
Intangible Assets in Global Operations, Farok J. Contractor (Editor), London: Quorum
Books, Chapter 15, pp. 280–301.
Reilly, R. F.; Garland, P. J. (2001). “The Valuation of Data Processing Intangible Assets”,
in: Farok J. Contractor (Ed.) Valuation of Intangible Assets in Global Operations, London:
Quorum Books, p. 205–232.
Reilly, R. F.; Schweihs, R. P. (1999). Valuing intangible Assets, New York: McGraw-Hill.
Rivette, Kevin; Kline, G. (2000) “Discovering new value in intellectual property”, Harvard
Business Review, January – February, pp. 18–19.
Roos, Johan; Roos, G ran; Dragonetti, Nicola C.; Edvinsson, Leif (1997). Intellectual Capi-
tal: navigating the new business landscape, London: Macmillan Press.
Seethamraju, Chandrakanth (2003). “The Value Relevance of Trademarks”, in John Hand
and Baruch Lev (Eds.) Intangible Assets: Values, Measures, and Risks. New York: Oxford
University Press, p. 228–247.
Seetharaman, A.; Nadzir, Zainal A. B. M.; Gunalan, S. (2001). “A conceptual study on brand
valuation”, The Journal of Product and Brand Management, Vol. 10, nº 4, p. 243–256.
Seldon, Therese (2011). “Beyond patents: Effective intellectual property strategy in bio-
technology”, Innovation: Management, Policy & Practice, Volume 13, Issue 1, pp. 55–61.
Shapiro, Carl; Varian, Hal R. (1999) Information Rules: A Strategic Guide to the Network
Economy, Boston: Harvard Business School Press.
Smith, Gordon V. (1997). Trademark Valuation, New York: John Wiley & Sons.
Stahle, Sten; Stahle, Pirjo (2012). “Towards measures of national intellectual capital: an
analysis of the CHS model”, Journal of Intellectual Capital, Vol. 13, N.º2, pp. 164–167.
Stankosky, M. (2008). “Knowledge management and intellectual capital”, 5th Interna-
tional Conference on Intellectual Capital and Knowledge Management”, New York, Octo-
ber.
Sveiby, Kark Erik (1997). The New Organizational Wealth: managing and measuring knowl-
edge-based assets, San Francisco, CA: Berrett-Kowhler Publishers.
44.
45.
46.
47.
48.
49.
50.
51.
52.
53.
54.
55.
56.
57.
58.

BETWEEN INTANGIBLES IDENTIFICATION AND THEIR MEASUREMENT AND DISCLOSURE: BEHIND THE VALUE CREATION FROM INNOVATION
99
Taghaboni-Dutta, F.; Trappey, Amy J. C.; Wu, Hsin-Ying (2009). “An exploratory RFID pat-
ent analysis”, Management Research News, Vol. 32, No. 12, pp. 1163–1176.
Willigan, Walter L. (2001) “Leveraging your Intellectual Property: A Proven Path to Value
Extraction”, Valuation of Intangible Assets in Global Operations, Farok J. Contractor (Edi-
tor), London: Quorum Books.
59.
60.

Antanas Buracas, Algis Zvirblis
100
Chapter 4
Comparative Analysis & Complex Evaluation
of the Intellectual Resources: Baltic & Nordic Countries
Antanas Buracas, Algis ZvirblisInternational Business School at Vilnius University
The most actual problems of intellectual potential formation strategy in Lithuania a/o
Baltic States are interconnected with the undervalued professional analytical reasoning
of the ways and means within perspective strategic programs. The development of intel-
lectual resources (IR) must be based on the sophisticated multiple criteria evaluation of
the globalization processes and their interactions, new ICR technologies and integrative
process in the European Union area. At the time, the statistics of the IR and interconnected
indices (ICR) in the Baltic States usually is published too late and not detailed sufficient for
analytical evaluations of the efficiency of intellectual potential components in the working
activity of enterprises; so it do not helped to present argumented recommendations for
redistributing resources and amelioration of the companies’ competitivity (Buracas, 2007).
The systemic multiple criteria evaluation of the national IR, their dynamics, factors of
changes and effect measurement are the necessary premises for their more adequate
resourcing and more rational distribution of the means in perspective, necessary transfor-
mations of their branch and sector structure, also for determination of economic devel-
opment strategy with account of intellectual development criteria. Analysis of prospects
on multiple criteria evaluation methods requested to take account of the fact that it is
important first to identify the determinants of IR specific for new EU countries, modify
them and the underlying indicators. In determining the indicators of IR and population
factors, of course, the accumulated databases of international organizations, their exper-
tise assessment methodologies must be accounted. The methods to be applied mostly
are oriented to multiple criteria decision making (MCDM) systems and opportunities of
reasoning the strategic IR development decisions, helping to choose more efficient pro-
grammed variants (Zvirblis, Buracas, 2011a,b).
COMPARATIVE ANALYSIS & COMPLEX EVALUATION OF THE INTELLECTUAL RESOURCES: BALTIC & NORDIC COUNTRIES
101
In particular, first, it is important to evaluate the structural changes in the renewed
production functions, with the changing productive contribution of the IR within differ-
ent sectors, regions and countries (cf. Regional Innovation Scoreboard, 2009). Second, it is
necessary to integrate the more important estimates of IR and IC into national social accounts.
Third, the strategic development insights of the intellectual potential have stimulated the
workout of alternatives, contributed to the general social and economic transformations
and diminished the emerging risks of innovations.
As a result of the study, the important conclusion was done about the urgent necessity
to integrate the intellectual potential indices both in programming of the competitive
economy development and in renewing official statistic DB. The analysis done in the re-
view permits to substantiate the new approach to strategic programming of sustainable
economic development including its parts and alternatives based on the multiple criteria
evaluation and multitask optimization (with account of the possibilities of programmed al-
ternatives). The suggested technique is used when determining the competitive strength
and rating of the Lithuania (and other countries) in EU according to the criterion of the
intellectual potential growth.
Object of the study – the state IR. Methods– critical review of special literature & statis-
tics concerning strategic IR development analysis, summary of expert evaluations, multi-
ple criteria evaluation, SAW and COPRAS methods. Tasks – to analyze the Baltic foreground
IR components and to evaluate the IR development.
4.1. Comparative analysis of knowledge economy advancement: Baltic & Nordic countries
The descriptive analysis of knowledge economy advancement in various, first-of-all in
Baltic and Nordic, countries could help to detail the comparative KE development lev-
els, their components and indicators, determining positive changes, also tendencies and
bottlenecks. According to The Innovation Union Scoreboard 2011, Latvia & Lithuania are
betweenthe modest innovators (see Fig. A4 in the Annex at the end of this edition). The
European Commission also gives big attention to human capital as main component of
Knowledge Economy (KE) in the projects of the EU‘s strategic programs such as (p. 21–24)
as well as US CIA – in their evaluations of global development trends (Global Trends 2025).
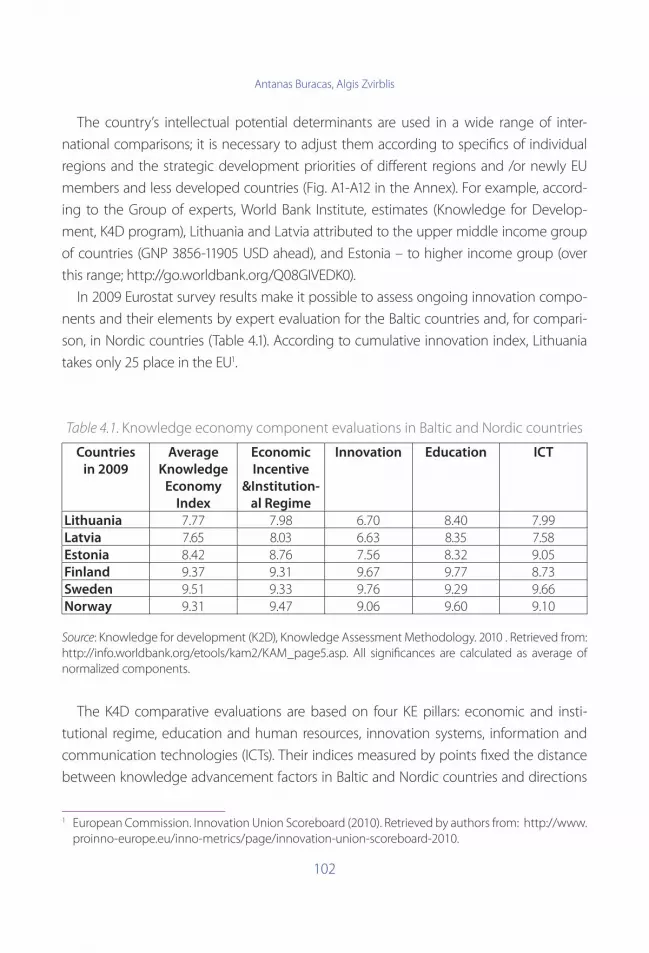
Antanas Buracas, Algis Zvirblis
102
The country’s intellectual potential determinants are used in a wide range of inter-
national comparisons; it is necessary to adjust them according to specifics of individual
regions and the strategic development priorities of different regions and /or newly EU
members and less developed countries (Fig. A1-A12 in the Annex). For example, accord-
ing to the Group of experts, World Bank Institute, estimates (Knowledge for Develop-
ment, K4D program), Lithuania and Latvia attributed to the upper middle income group
of countries (GNP 3856-11905 USD ahead), and Estonia – to higher income group (over
this range; http://go.worldbank.org/Q08GIVEDK0).
In 2009 Eurostat survey results make it possible to assess ongoing innovation compo-
nents and their elements by expert evaluation for the Baltic countries and, for compari-
son, in Nordic countries (Table 4.1). According to cumulative innovation index, Lithuania
takes only 25 place in the EU1.
Table 4.1. Knowledge economy component evaluations in Baltic and Nordic countries
Countries
in 2009
Average
Knowledge
Economy
Index
Economic
Incentive
&Institution-
al Regime
Innovation Education ICT
Lithuania 7.77 7.98 6.70 8.40 7.99Latvia 7.65 8.03 6.63 8.35 7.58Estonia 8.42 8.76 7.56 8.32 9.05Finland 9.37 9.31 9.67 9.77 8.73Sweden 9.51 9.33 9.76 9.29 9.66Norway 9.31 9.47 9.06 9.60 9.10
Source: Knowledge for development (K2D), Knowledge Assessment Methodology. 2010 . Retrieved from: http://info.worldbank.org/etools/kam2/KAM_page5.asp. All significances are calculated as average of normalized components.
The K4D comparative evaluations are based on four KE pillars: economic and insti-
tutional regime, education and human resources, innovation systems, information and
communication technologies (ICTs). Their indices measured by points fixed the distance
between knowledge advancement factors in Baltic and Nordic countries and directions
1 European Commission. Innovation Union Scoreboard (2010). Retrieved by authors from: http://www.proinno-europe.eu/inno-metrics/page/innovation-union-scoreboard-2010.

COMPARATIVE ANALYSIS & COMPLEX EVALUATION OF THE INTELLECTUAL RESOURCES: BALTIC & NORDIC COUNTRIES
103
where the retardation was more substantial especially in the fi eld of innovations (Fig. 4.1).
At the same time, the diff erences in expert evaluations of education levels were only
within one point interval (at 10 point system).
Fig. 4.1. Main knowledge economy componentsin Baltic and Nordic countries
The data presented by K4D show comparative progress made by various countries, the
ratio both within and between aggregate indicators of the knowledge economy: accord-
ing to economic initiative and institutional environment Lithuania’s situation in scores
rose from 5.2 to nearly 8, similar to Latvia – from 5.64 to 8.03 and Poland – from 4.84 to
7.48; Estonia progress was not such signifi cant (ranging from 7.94 to 8.76). Information
Technology Development score rose from 5.7 to about 8 in Lithuania; similar progress was
in other Baltic countries (in Estonia, the estimate has in creased from around 8 to 9.05).
Latvia noted progress by the summary index of the KE and in particular in innovative-
ness because the estimates became closer to the neighboring Baltic countries. However,
the crisis again deepened the innovative backwardness of Latvia in 2008–2010; in Estonia
and Poland, the release of new products or new markets is slightly behind by the EU aver-
age but the lag was signifi cantly higher in Lithuania and Latvia (Table 4.2).

Antanas Buracas, Algis Zvirblis
104
Table 4.2. Innovation objectives in Baltic & Nordic States in 2006–2008
(as % of innovative enterprises)
Nature of innovation EU-27 Estonia Latvia Lithua-
nia
Den-
mark
Finland Norway Swe-
den
Increase range of goods or services
52.2 36.5 12.2 30.3 25.0 41.2 49.3 43.9
Replace outdatedproducts or processes
34.5 35.8 9.3 26.4 27.7 29.3 39.1 32.0
Enter new markets 39.6 24.1 11.3 26.5 23.8 29.6 36.6 28.3Increase market share 42.4 32.3 8.9 32.8 33.4 37.9 60.8 45.2Improve quality of goods or services
56.6 50.8 12.6 42.8 30.3 43.0 71.6 45.2
Improve flexibility for producing goods or services
33.9 31.1 7.4 26.6 18.8 30.2 37.7 28.3
Increase capacity for producing goods or services
31.7 33.9 10.3 27.7 18.5 23.7 34.5 25.5
Improve health and safety
24.9 18.7 8.0 17.6 11.1 13.1 49.2 16.1
Reduce labor costs per unit output
28.1 21.3 6.9 28.3 30.0 30.2 37.6 34.1
Source: Eurostat online data code: inn_cis6_obj. Retrieved from: http://epp.eurostat.ec.europa.eu/portal/page/portal/product_details/publication?p_product_code=KS-31-11-118.Table 5.8.
The comparative interrelations of main components under review can be seen in the
charts below by groups of selected countries (Fig. 4.2). Both the table 4.2. data and charts
show substantial retardation of Latvia (esp. in replace of outdated products / processes;
also reducing labor costs per unit output) and some lagging of Lithuania behind of EU-27
in main innovation objectives; but indicates vary also in Nordic countries.
So, Norway is leading in increasing market rate and improving quality of goods and
services, also improving health and safety, but other Nordic countries are not prevailing
so much by most of indicators comparing with EU-27.
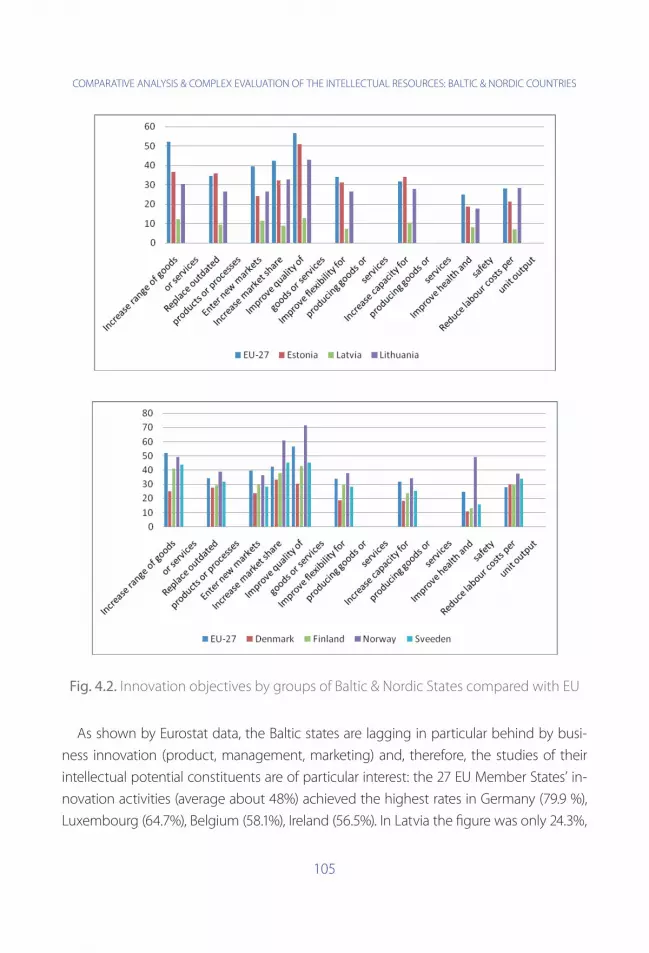
COMPARATIVE ANALYSIS & COMPLEX EVALUATION OF THE INTELLECTUAL RESOURCES: BALTIC & NORDIC COUNTRIES
105
Fig. 4.2. Innovation objectives by groups of Baltic & Nordic States compared with EU
As shown by Eurostat data, the Baltic states are lagging in particular behind by busi-
ness innovation (product, management, marketing) and, therefore, the studies of their
intellectual potential constituents are of particular interest: the 27 EU Member States’ in-
novation activities (average about 48%) achieved the highest rates in Germany (79.9 %),
Luxembourg (64.7%), Belgium (58.1%), Ireland (56.5%). In Latvia the fi gure was only 24.3%,
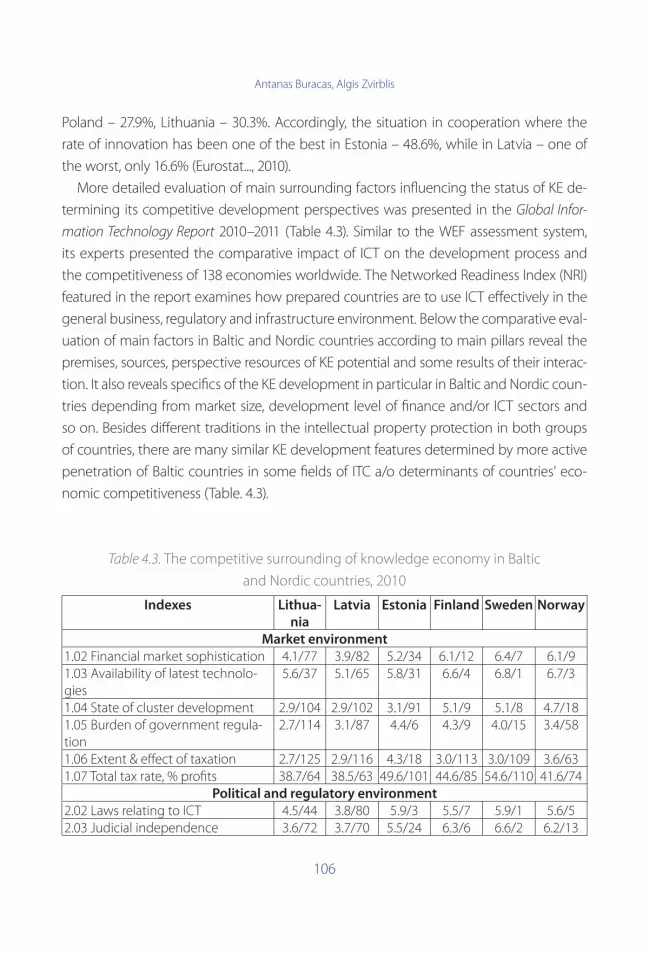
Antanas Buracas, Algis Zvirblis
106
Poland – 27.9%, Lithuania – 30.3%. Accordingly, the situation in cooperation where the
rate of innovation has been one of the best in Estonia – 48.6%, while in Latvia – one of
the worst, only 16.6% (Eurostat..., 2010).
More detailed evaluation of main surrounding factors influencing the status of KE de-
termining its competitive development perspectives was presented in the Global Infor-
mation Technology Report 2010–2011 (Table 4.3). Similar to the WEF assessment system,
its experts presented the comparative impact of ICT on the development process and
the competitiveness of 138 economies worldwide. The Networked Readiness Index (NRI)
featured in the report examines how prepared countries are to use ICT effectively in the
general business, regulatory and infrastructure environment. Below the comparative eval-
uation of main factors in Baltic and Nordic countries according to main pillars reveal the
premises, sources, perspective resources of KE potential and some results of their interac-
tion. It also reveals specifics of the KE development in particular in Baltic and Nordic coun-
tries depending from market size, development level of finance and/or ICT sectors and
so on. Besides different traditions in the intellectual property protection in both groups
of countries, there are many similar KE development features determined by more active
penetration of Baltic countries in some fields of ITC a/o determinants of countries’ eco-
nomic competitiveness (Table. 4.3).
Table 4.3. The competitive surrounding of knowledge economy in Baltic
and Nordic countries, 2010
Indexes Lithua-
nia
Latvia Estonia Finland Sweden Norway
Market environment
1.02 Financial market sophistication 4.1/77 3.9/82 5.2/34 6.1/12 6.4/7 6.1/91.03 Availability of latest technolo-gies
5.6/37 5.1/65 5.8/31 6.6/4 6.8/1 6.7/3
1.04 State of cluster development 2.9/104 2.9/102 3.1/91 5.1/9 5.1/8 4.7/181.05 Burden of government regula-tion
2.7/114 3.1/87 4.4/6 4.3/9 4.0/15 3.4/58
1.06 Extent & effect of taxation 2.7/125 2.9/116 4.3/18 3.0/113 3.0/109 3.6/631.07 Total tax rate, % profits 38.7/64 38.5/63 49.6/101 44.6/85 54.6/110 41.6/74
Political and regulatory environment
2.02 Laws relating to ICT 4.5/44 3.8/80 5.9/3 5.5/7 5.9/1 5.6/52.03 Judicial independence 3.6/72 3.7/70 5.5/24 6.3/6 6.6/2 6.2/13

COMPARATIVE ANALYSIS & COMPLEX EVALUATION OF THE INTELLECTUAL RESOURCES: BALTIC & NORDIC COUNTRIES
107
Indexes Lithua-
nia
Latvia Estonia Finland Sweden Norway
2.04 Efficiency of legal system in set-tling disputes
3.5/76 2.9/116 4.3/40 5.5/7 6.1/2 5.8/4
2.06 Property rights 4.3/67 4.3/70 5.3/33 6.4/2 6.3/5 6.1/92.07 Intellectual property protection 3.5/68 3.6/63 4.6/34 6.2/2 6.2/1 5.6/162.08 Software piracy rate, % software installed
54/40 56/45 50/37 25/5 25/5 29/15
2.11 Internet & telephony competi-tion, 0–6 (best)
5/62 6/1 5/62 6/1 6/1 6/1
Business readiness
5.03 Expenditures, R & D 3.1/57 2.7/93 3.3/46 5.4/5 6.0/1 4.4/17Government readiness6.01 Gov’t prioritization of ICT 4.5/76 4.0/107 5.6/14 6.1/5 6.1/7 5.4/276.02 Gov’t procurement of advanced tech.
3.2/103 3.1/110 4.1/42 4.7/6 4.5/13 4.2/33
6.03 Importance of ICT to gov’t vi-sion
3.9/73 3.3/113 5.0/19 4.9/21 5.4/8 4.8/24
Individual usage
7.03 Households w/ personal com-puter,%
57.3/40 60.1/38 65.1/33 80.1/16 87.5/5 87.6/4
7.04 Broadband Internet subscrib-ers/100 pop
19.3/32 18.6/34 22.5/24 28.8/15 31.8/8 34.0/4
7.05 Internet users/100 pop 59.8/34 66.8/28 72.5/22 82.5/8 90.8/3 92.1/27.06 Internet access in schools 5.5/27 5.4/30 6.4/2 6.1/11 6.4/3 5.9/157.07 Use of virtual social networks 5.5/45 5.2/66 5.7/31 6.2/7 6.5/2 6.3/47.08 Impact of ICT on access to basic services
4.9/43 4.2/89 5.5/18 5.3/25 6.2/1 5.5/16
Business usage
8.01 Firm-level technology absorp-tion
5.0/55 4.5/88 5.3/42 6.0/12 6.4/2 6.2/6
8.02 Capacity for innovation 3.3/48 3.1/57 3.6/34 5.6/5 5.7/3 4.7/138.03 Extent of business Internet use 6.3/5 5.4/37 6.3/2 5.9/19 6.6/1 6.0/128.06 High-tech exports, % goods exports
5.9/39 5.3/44 6.8/33 14.2/21 12.1/24 4.1/54
Source: Compiled by authors with use of WEF data: http://www.weforum.org/reports/global-informa-tion-technology-report-2010-2011-0. All evaluations are presented in points; after slash / place rating between 138 countries. The Networked Readiness Index (NRI) featured in the report examines how prepared countries are to use ICT effectively by three dimensions: the general business, regulatory and infrastructure environment for ICT; the readiness of the three key societal actors – individuals, businesses and governments – to use and benefit from ICT; and their actual usage of available ICT.

Antanas Buracas, Algis Zvirblis
108
The comparison of innovation indicators in Baltic and Nordic countries by their effects
on the competitiveness in 2010-11 does not show significant differences: the maximum
gap between them was in high technology transfer and capacity for innovations, also in
business expenditures for R & D, in gov’t procurement of advanced technologies. Much
less differences can be seen between Nordic States (except high technology transfer in
Norway; in this aspect even Estonia evaluation is higher than Norway). By all innovation
indicators, the Estonian situation is somewhat better than in Latvia and Lithuania (it is very
close to a competitive advantage by the EU).
According to the WEF evaluations, Baltic States achieved some progress when amelio-
rating the economic and institutional surrounding but there are not enough of substan-
tial achievements within directions of innovative system, human resource and education
developments (Figures 4.3, A2-A6).
The diagrams under review reveal the most problemic indicators and successfully de-
veloping areas determining the competitiveness of Baltic countries under influence of
the KE factors. In particular, within period under review the growth of government debt
burden, also low capacity for innovation become the bottleneck factors for Lithuania and
Latvia. The sophistication of manufacturing processes and compliance levels between
productivity and reward improved mostly in Lithuania.
The additional indicators evaluations can be added in the following research depend-
ing of the particular tasks of the examination of country economic competitiveness. How-
ever, the WEF methodology not suppose of the possibility to evaluate more adequately
the different influence of various indicators on global competitiveness in the newly de-
veloping countries when the predetermined fixed weight values are applied for selected
indicators. Besides, the WEF evaluations do not present comparative evaluation of com-
pound value (using the multiple criteria evaluation methods) according to the totality of
the state’s economic competitiveness indicators.
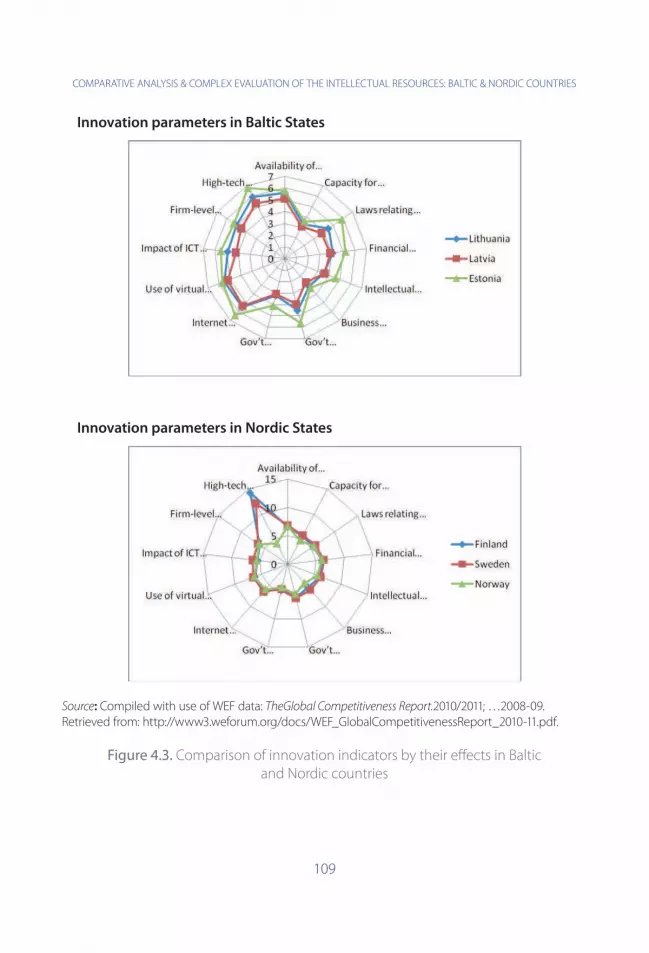
COMPARATIVE ANALYSIS & COMPLEX EVALUATION OF THE INTELLECTUAL RESOURCES: BALTIC & NORDIC COUNTRIES
109
Innovation parameters in Baltic States
Innovation parameters in Nordic States
Source: Compiled with use of WEF data: TheGlobal Competitiveness Report.2010/2011; …2008-09. Retrieved from: http://www3.weforum.org/docs/WEF_GlobalCompetitivenessReport_2010-11.pdf.
Figure 4.3. Comparison of innovation indicators by their eff ects in Baltic and Nordic countries
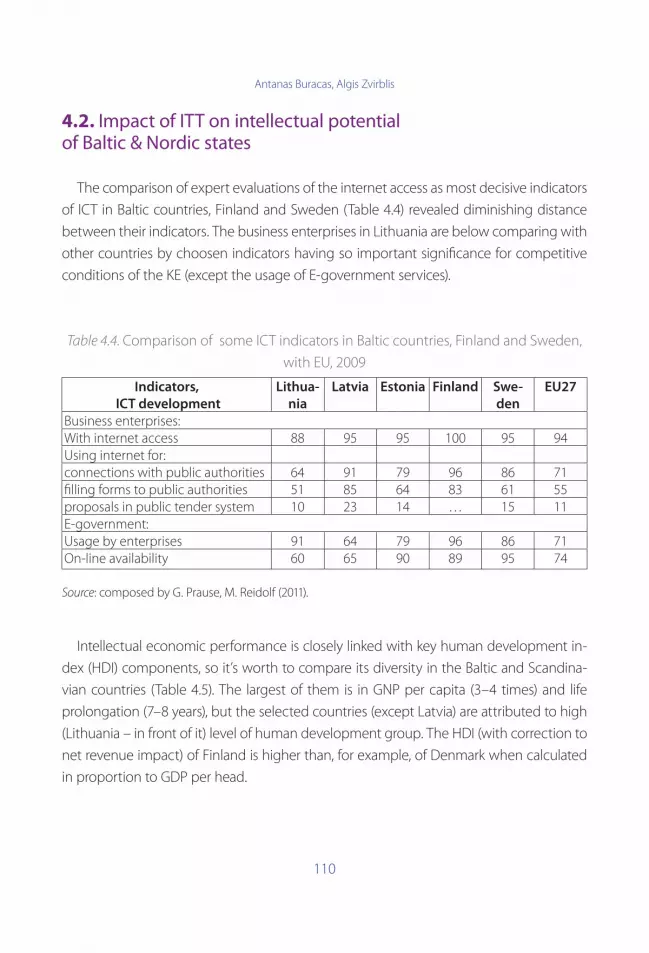
Antanas Buracas, Algis Zvirblis
110
4.2. Impact of ITT on intellectual potential of Baltic & Nordic states
The comparison of expert evaluations of the internet access as most decisive indicators
of ICT in Baltic countries, Finland and Sweden (Table 4.4) revealed diminishing distance
between their indicators. The business enterprises in Lithuania are below comparing with
other countries by choosen indicators having so important significance for competitive
conditions of the KE (except the usage of E-government services).
Table 4.4. Comparison of some ICT indicators in Baltic countries, Finland and Sweden,
with EU, 2009
Indicators,
ICT development
Lithua-
nia
Latvia Estonia Finland Swe-
den
EU27
Business enterprises:With internet access 88 95 95 100 95 94Using internet for:connections with public authorities 64 91 79 96 86 71filling forms to public authorities 51 85 64 83 61 55proposals in public tender system 10 23 14 … 15 11E-government:Usage by enterprises 91 64 79 96 86 71On-line availability 60 65 90 89 95 74
Source: composed by G. Prause, M. Reidolf (2011).
Intellectual economic performance is closely linked with key human development in-
dex (HDI) components, so it’s worth to compare its diversity in the Baltic and Scandina-
vian countries (Table 4.5). The largest of them is in GNP per capita (3–4 times) and life
prolongation (7–8 years), but the selected countries (except Latvia) are attributed to high
(Lithuania – in front of it) level of human development group. The HDI (with correction to
net revenue impact) of Finland is higher than, for example, of Denmark when calculated
in proportion to GDP per head.

COMPARATIVE ANALYSIS & COMPLEX EVALUATION OF THE INTELLECTUAL RESOURCES: BALTIC & NORDIC COUNTRIES
111
Table 4.5. Human development indices and their components between the upper
middle income group in Baltic and Scandinavian countries, 2010
State, its
rank
HDI Life years Average
length of
schooling,
years
GNP per
head.*
HDI without
income im-
pact
1. Norway 0,938 81 12,6 58810 0,954
9. Sweden 0,885 81,3 11,6 36936 0,911
16. Finland 0,871 80,1 10,3 33872 0,897
19. Denmark 0,866 78,7 10,3 36404 0,883
34. Estonia 0,812 73,7 12 17168 0,864
44. Lithuania 0,783 72,1 10,9 14824 0,832
48. Latvia 0,769 73 10,4 12944 0,822
*According to PPP at 2008 prices. Source of compilation: Human Development Report, 2010.
More detailed comparison of indices in the Baltic countries (Table 4.6) shows why Esto-
nia (33 place in the world) stands out among its neighbors, particularly comparing with
Latvia (70 seats) in competitiveness. First-of-all, the differences are in the impact of judi-
cial system on business (Estonia – 40 place, and Lithuania – 91 , Latvia – even 118 place),
and they are substantial in levels of business infrastructure, education quality, professional
management application, access to venture capital, foreign technology transfer, Internet
use in schools (in Estonia is one of the best in the world) and others. Experts estimate
Latvia and Lithuania government support for innovative technologies have considerably
behind the EU average, more comparable to the situation in developing countries (Esto-
nia – 43 place, Lithuania – 104, Latvia – 111 place).
According to published comparative data of the Eurostat on companies applying intel-
lectual technologies extensively, and their scope of services, the macroeconomic indica-
tors allow the comparison of their impact on economic development in selected coun-
tries. The most active innovative activities in the EU-27 were registered in Germany (79.9%),
Luxembourg (64.7%), Belgium (58.1%), Portugal (57.8%) and Ireland (56.5%). At least it was
developed in Latvia (24.3%), Poland (27.9%), Hungary (28.9%) and Lithuania (30.3 %). Lithua-
nia was behind the EU average by the development of innovative services and according
to the company’s capital and organizational interfaces (see left lower quadrant in Fig. 4.4).

Antanas Buracas, Algis Zvirblis
112
Figure 4.4. Correlation between the company’s capital and the organizational levels in the EU, and innovative part of the service
Abscissae – the company’s capital and organizational performance, ordinate axis – in novative services. Impact of correlation r = 0,6009, p = 0065. Source: Challenges and Opportunities for a European Strategy in Support of Innovation in Services, p. 46.
More detailed competitiveness indicators influenced by the components of the intel-
lectual potential in the Baltic States are presented in Table 4.6.

COMPARATIVE ANALYSIS & COMPLEX EVALUATION OF THE INTELLECTUAL RESOURCES: BALTIC & NORDIC COUNTRIES
113
Table 4.6. Indicators of competitiveness of the Baltic States interconnected with their
intellectual potential (2009–2010)
Sectors & indicators Lithuania Latvia Estonia
Cumulative Competitiveness Index 47 70 33
Intellectual Property Protection 69 64 34
Legal effectiveness of the system 91 118 40
Quality of infrastructure 41 51 28
Initial quality of education 44 46 16
Secondary education 29 32 26
Quality of the education system 70 64 42
Training for local access to services 38 68 33
Adequacy of staff training 64 76 48
Dominance in market 97 70 38
Customer orientation 34 73 40
Customer network complexity 105 86 78
Payment and productivity 18 42 8
Professional management application 54 76 29
Brain drain 110 93 57
Availability of risk capital 103 101 30
Access to latest technology 37 65 31
Technological renovation of firms 56 89 42
Foreign technology transfer 62 94 40
Mobile phone use 10 60 2
Internet use in business 36 29 25
Internet access in schools 27 30 2
Sophistication of production 51 72 41
Competitive advantages 43 49 53
Amount of marketing 46 69 61
The innovative capacity 48 57 34
Company spending on R & D 57 94 46
Government support for innovative technologies 104 111 43
Patents per 1 million people 55 41 40
*Rank between 139 states. Source: The Global Competitiveness Report (2010–2011), p. 153, 210–211, 218–219.
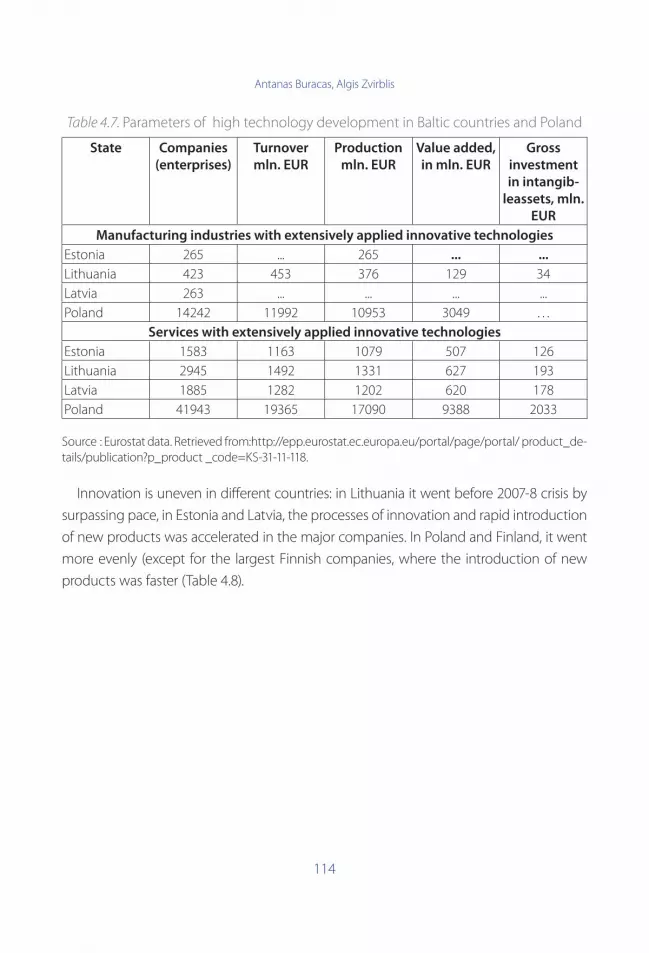
Antanas Buracas, Algis Zvirblis
114
Table 4.7. Parameters of high technology development in Baltic countries and Poland
State Companies
(enterprises)
Turnover
mln. EUR
Production
mln. EUR
Value added,
in mln. EUR
Gross
investment
in intangib-
leassets, mln.
EUR
Manufacturing industries with extensively applied innovative technologies
Estonia 265 ... 265 ... ...
Lithuania 423 453 376 129 34
Latvia 263 ... ... ... ...
Poland 14242 11992 10953 3049 …
Services with extensively applied innovative technologies
Estonia 1583 1163 1079 507 126
Lithuania 2945 1492 1331 627 193
Latvia 1885 1282 1202 620 178
Poland 41943 19365 17090 9388 2033
Source : Eurostat data. Retrieved from:http://epp.eurostat.ec.europa.eu/portal/page/portal/ product_de-tails/publication?p_product _code=KS-31-11-118.
Innovation is uneven in different countries: in Lithuania it went before 2007-8 crisis by
surpassing pace, in Estonia and Latvia, the processes of innovation and rapid introduction
of new products was accelerated in the major companies. In Poland and Finland, it went
more evenly (except for the largest Finnish companies, where the introduction of new
products was faster (Table 4.8).
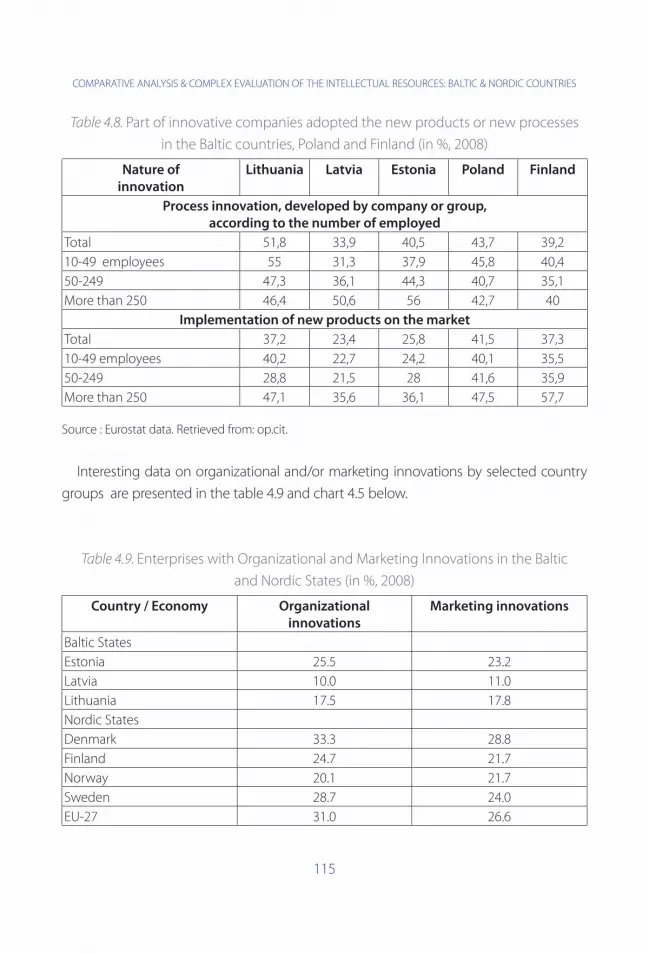
COMPARATIVE ANALYSIS & COMPLEX EVALUATION OF THE INTELLECTUAL RESOURCES: BALTIC & NORDIC COUNTRIES
115
Table 4.8. Part of innovative companies adopted the new products or new processes
in the Baltic countries, Poland and Finland (in %, 2008)
Nature of
innovation
Lithuania Latvia Estonia Poland Finland
Process innovation, developed by company or group,
according to the number of employed
Total 51,8 33,9 40,5 43,7 39,2
10-49 employees 55 31,3 37,9 45,8 40,4
50-249 47,3 36,1 44,3 40,7 35,1
More than 250 46,4 50,6 56 42,7 40
Implementation of new products on the market
Total 37,2 23,4 25,8 41,5 37,3
10-49 employees 40,2 22,7 24,2 40,1 35,5
50-249 28,8 21,5 28 41,6 35,9
More than 250 47,1 35,6 36,1 47,5 57,7
Source : Eurostat data. Retrieved from: op.cit.
Interesting data on organizational and/or marketing innovations by selected country
groups are presented in the table 4.9 and chart 4.5 below.
Table 4.9. Enterprises with Organizational and Marketing Innovations in the Baltic
and Nordic States (in %, 2008)
Country / Economy Organizational
innovations
Marketing innovations
Baltic States
Estonia 25.5 23.2
Latvia 10.0 11.0
Lithuania 17.5 17.8
Nordic States
Denmark 33.3 28.8
Finland 24.7 21.7
Norway 20.1 21.7
Sweden 28.7 24.0
EU-27 31.0 26.6
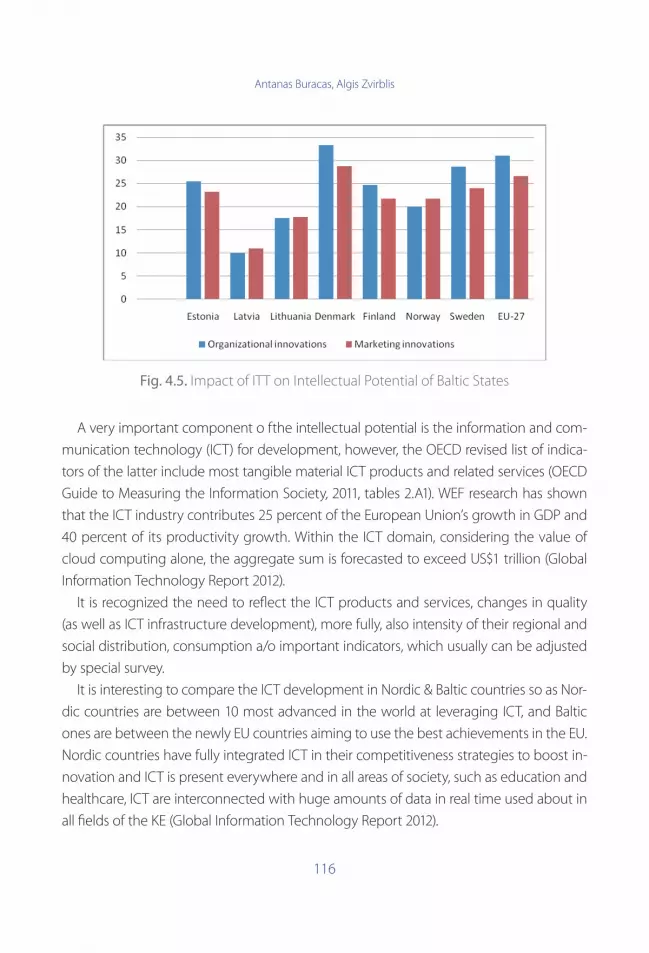
Antanas Buracas, Algis Zvirblis
116
Fig. 4.5. Impact of ITT on Intellectual Potential of Baltic States
A very important component o fthe intellectual potential is the information and com-
munication technology (ICT) for development, however, the OECD revised list of indica-
tors of the latter include most tangible material ICT products and related services (OECD
Guide to Measuring the Information Society, 2011, tables 2.A1). WEF research has shown
that the ICT industry contributes 25 percent of the European Union’s growth in GDP and
40 percent of its productivity growth. Within the ICT domain, considering the value of
cloud computing alone, the aggregate sum is forecasted to exceed US$1 trillion (Global
Information Technology Report 2012).
It is recognized the need to refl ect the ICT products and services, changes in quality
(as well as ICT infrastructure development), more fully, also intensity of their regional and
social distribution, consumption a/o important indicators, which usually can be adjusted
by special survey.
It is interesting to compare the ICT development in Nordic & Baltic countries so as Nor-
dic countries are between 10 most advanced in the world at leveraging ICT, and Baltic
ones are between the newly EU countries aiming to use the best achievements in the EU.
Nordic countries have fully integrated ICT in their competitiveness strategies to boost in-
novation and ICT is present everywhere and in all areas of society, such as education and
healthcare, ICT are interconnected with huge amounts of data in real time used about in
all fi elds of the KE (Global Information Technology Report 2012).
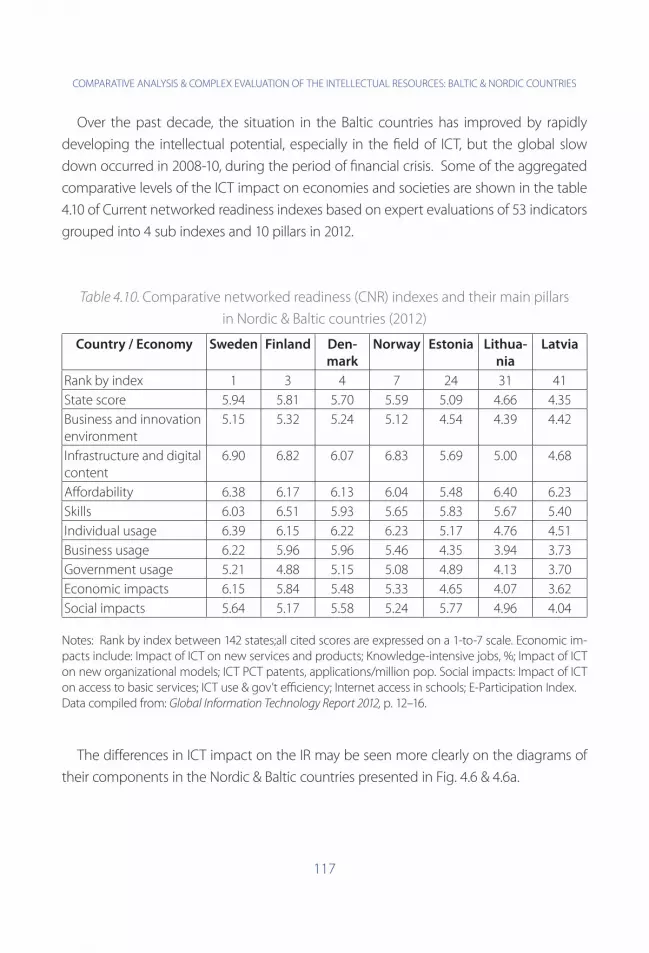
COMPARATIVE ANALYSIS & COMPLEX EVALUATION OF THE INTELLECTUAL RESOURCES: BALTIC & NORDIC COUNTRIES
117
Over the past decade, the situation in the Baltic countries has improved by rapidly
developing the intellectual potential, especially in the field of ICT, but the global slow
down occurred in 2008-10, during the period of financial crisis. Some of the aggregated
comparative levels of the ICT impact on economies and societies are shown in the table
4.10 of Current networked readiness indexes based on expert evaluations of 53 indicators
grouped into 4 sub indexes and 10 pillars in 2012.
Table 4.10. Comparative networked readiness (CNR) indexes and their main pillars
in Nordic & Baltic countries (2012)
Country / Economy Sweden Finland Den-
mark
Norway Estonia Lithua-
nia
Latvia
Rank by index 1 3 4 7 24 31 41
State score 5.94 5.81 5.70 5.59 5.09 4.66 4.35
Business and innovation environment
5.15 5.32 5.24 5.12 4.54 4.39 4.42
Infrastructure and digital content
6.90 6.82 6.07 6.83 5.69 5.00 4.68
Affordability 6.38 6.17 6.13 6.04 5.48 6.40 6.23
Skills 6.03 6.51 5.93 5.65 5.83 5.67 5.40
Individual usage 6.39 6.15 6.22 6.23 5.17 4.76 4.51
Business usage 6.22 5.96 5.96 5.46 4.35 3.94 3.73
Government usage 5.21 4.88 5.15 5.08 4.89 4.13 3.70
Economic impacts 6.15 5.84 5.48 5.33 4.65 4.07 3.62
Social impacts 5.64 5.17 5.58 5.24 5.77 4.96 4.04
Notes: Rank by index between 142 states;all cited scores are expressed on a 1-to-7 scale. Economic im-pacts include: Impact of ICT on new services and products; Knowledge-intensive jobs, %; Impact of ICT on new organizational models; ICT PCT patents, applications/million pop. Social impacts: Impact of ICT on access to basic services; ICT use & gov’t efficiency; Internet access in schools; E-Participation Index.Data compiled from: Global Information Technology Report 2012, p. 12–16.
The differences in ICT impact on the IR may be seen more clearly on the diagrams of
their components in the Nordic & Baltic countries presented in Fig. 4.6 & 4.6a.

Antanas Buracas, Algis Zvirblis
118
Fig. 4.6. Main pillars of CNR in Nordic & Baltic countries
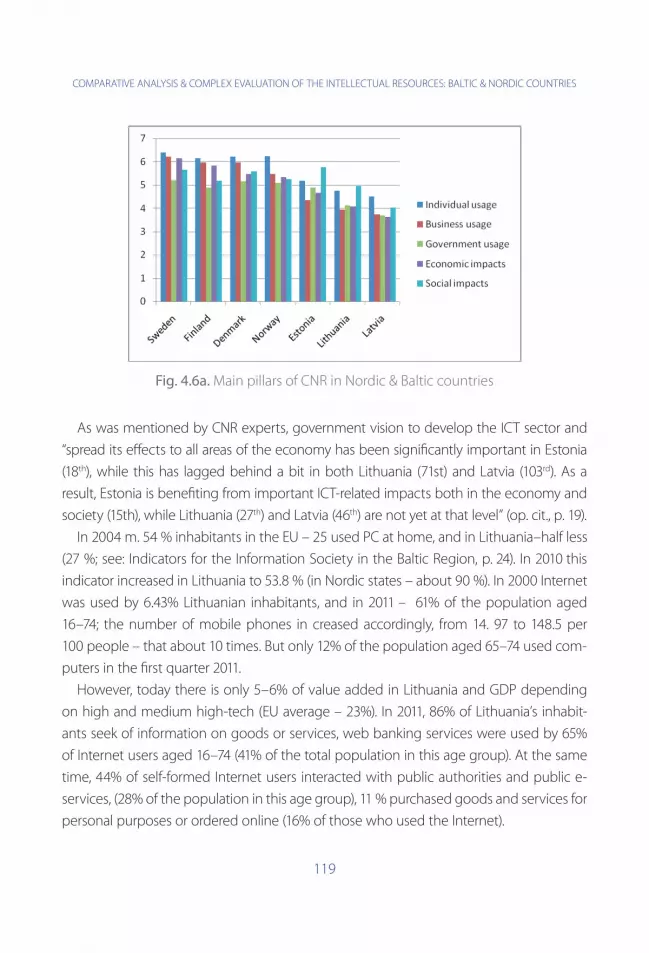
COMPARATIVE ANALYSIS & COMPLEX EVALUATION OF THE INTELLECTUAL RESOURCES: BALTIC & NORDIC COUNTRIES
119
Fig. 4.6a. Main pillars of CNR in Nordic & Baltic countries
As was mentioned by CNR experts, government vision to develop the ICT sector and
“spread its eff ects to all areas of the economy has been signifi cantly important in Estonia
(18th), while this has lagged behind a bit in both Lithuania (71st) and Latvia (103rd). As a
result, Estonia is benefi ting from important ICT-related impacts both in the economy and
society (15th), while Lithuania (27th) and Latvia (46th) are not yet at that level” (op. cit., p. 19).
In 2004 m. 54 % inhabitants in the EU – 25 used PC at home, and in Lithuania–half less
(27 %; see: Indicators for the Information Society in the Baltic Region, p. 24). In 2010 this
indicator increased in Lithuania to 53.8 % (in Nordic states – about 90 %). In 2000 Internet
was used by 6.43% Lithuanian inhabitants, and in 2011 – 61% of the population aged
16–74; the number of mobile phones in creased accordingly, from 14. 97 to 148.5 per
100 people – that about 10 times. But only 12% of the population aged 65–74 used com-
puters in the fi rst quarter 2011.
However, today there is only 5–6% of value added in Lithuania and GDP depending
on high and medium high-tech (EU average – 23%). In 2011, 86% of Lithuania’s inhabit-
ants seek of information on goods or services, web banking services were used by 65%
of Internet users aged 16–74 (41% of the total population in this age group). At the same
time, 44% of self-formed Internet users interacted with public authorities and public e-
services, (28% of the population in this age group), 11 % purchased goods and services for
personal purposes or ordered online (16% of those who used the Internet).
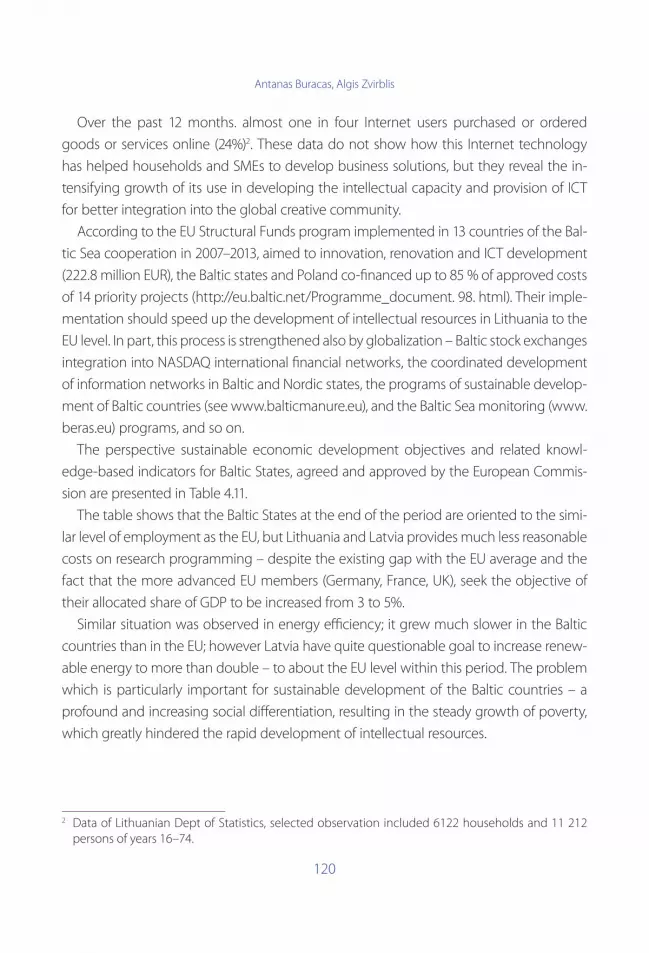
Antanas Buracas, Algis Zvirblis
120
Over the past 12 months. almost one in four Internet users purchased or ordered
goods or services online (24%)2. These data do not show how this Internet technology
has helped households and SMEs to develop business solutions, but they reveal the in-
tensifying growth of its use in developing the intellectual capacity and provision of ICT
for better integration into the global creative community.
According to the EU Structural Funds program implemented in 13 countries of the Bal-
tic Sea cooperation in 2007–2013, aimed to innovation, renovation and ICT development
(222.8 million EUR), the Baltic states and Poland co-financed up to 85 % of approved costs
of 14 priority projects (http://eu.baltic.net/Programme_document. 98. html). Their imple-
mentation should speed up the development of intellectual resources in Lithuania to the
EU level. In part, this process is strengthened also by globalization – Baltic stock exchanges
integration into NASDAQ international financial networks, the coordinated development
of information networks in Baltic and Nordic states, the programs of sustainable develop-
ment of Baltic countries (see www.balticmanure.eu), and the Baltic Sea monitoring (www.
beras.eu) programs, and so on.
The perspective sustainable economic development objectives and related knowl-
edge-based indicators for Baltic States, agreed and approved by the European Commis-
sion are presented in Table 4.11.
The table shows that the Baltic States at the end of the period are oriented to the simi-
lar level of employment as the EU, but Lithuania and Latvia provides much less reasonable
costs on research programming – despite the existing gap with the EU average and the
fact that the more advanced EU members (Germany, France, UK), seek the objective of
their allocated share of GDP to be increased from 3 to 5%.
Similar situation was observed in energy efficiency; it grew much slower in the Baltic
countries than in the EU; however Latvia have quite questionable goal to increase renew-
able energy to more than double – to about the EU level within this period. The problem
which is particularly important for sustainable development of the Baltic countries – a
profound and increasing social differentiation, resulting in the steady growth of poverty,
which greatly hindered the rapid development of intellectual resources.
2 Data of Lithuanian Dept of Statistics, selected observation included 6122 households and 11 212 persons of years 16–74.
COMPARATIVE ANALYSIS & COMPLEX EVALUATION OF THE INTELLECTUAL RESOURCES: BALTIC & NORDIC COUNTRIES
121
Table 4.11. The sustainable development goals in the EU and Baltic countries at 2020
Tasks for
EU and
States-
mem-
bers
Employ-
ment %
R&D as
% of
GNP
Reduc-
tion,
CO2
emis-
sions
Renew-
able
resourc-
es
energy
Ener-
gycon-
sump-
tion
reduc-
tion
School
drop-
out
people
reduc-
tion
People
with
higher
educa-
tion
Poverty
reduc-
tion
Main EU task
75 % 3% 20% 20% 20% 10% 40% 20 mln.people
Estonia 76 3 11 25 0,71 9,5 40Lithuania 72,8 1,9 15 23 1,14 9 40Latvia 73 1,5 17 40 0,67 13,4 34-36
Source: Challenges and Opportunities for a European Strategy in Support of Innovation in Services – Fostering New Markets and Jobs through Innovation . 2009, p.34. Retrieved from: http://ec.europa.eu/ enterprise/ policies/innovation/files/swd_services_en.pdf
By 2009 Eurostat data, Baltic countries were among the nine poorest EU member states
according to adjusted real household gross income per head, and taking into account
the purchasing power capacity. The ratio between the 20% highest and lowest income
households in the EU average was 4.9 times, while in Latvia – 7.3, in Lithuania – 6.3 times.
This is partly explained by social tax policy mostly favorable to big business and resulting
in their main burden be transferred to medium and lower income strata. Unfavorable
factor is also a small high-tech production relative weight in national income product &
national dominance of low value-added industries.
Paralelly, it is necessary to mention the significant role of EU structural funds for mini-
mizing the lagging behind EU medium level on R&D spending level what was clearly
shown in Fig. 4.7 by A. Ivaschenko (WB, May 2009).
The multiple aspect evaluations of intellectual potential in the Baltic States, its underly-
ing determinants and processes clearly revealed the complex absence of the criteria ap-
plicable and insufficience of available statistics. As a result, it is necessary to apply much
more wide the multiple criteria evaluation of this potential, to integrate the quantitative
and qualitative expert assessments, as is done by the World Bank institutions, and the
related Knowledge for development (K4D), also in the reports of world business scom-
petitiveness and other conferences.
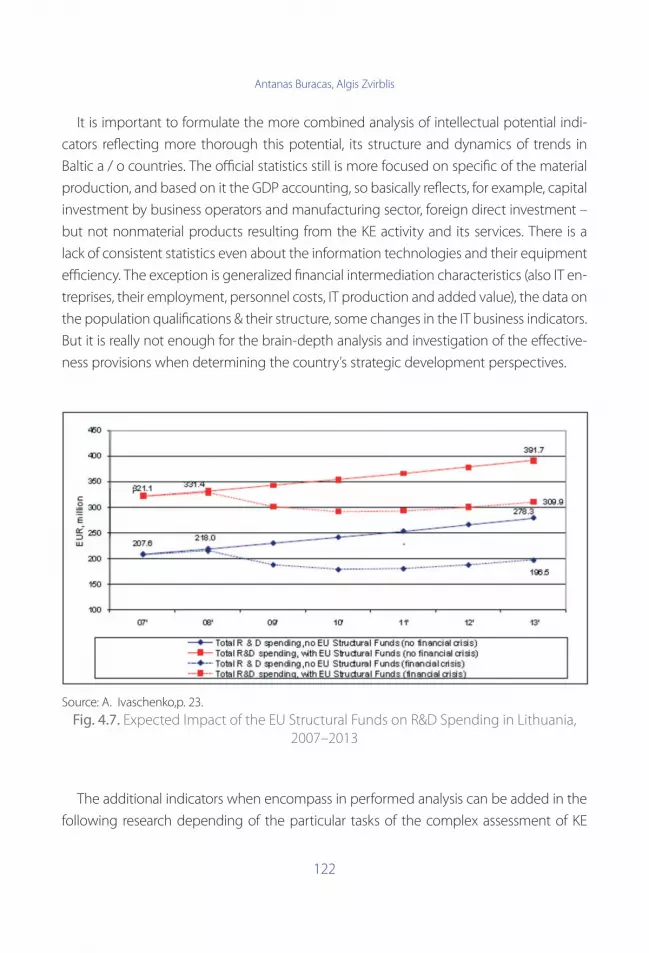
Antanas Buracas, Algis Zvirblis
122
It is important to formulate the more combined analysis of intellectual potential indi-
cators reflecting more thorough this potential, its structure and dynamics of trends in
Baltic a / o countries. The official statistics still is more focused on specific of the material
production, and based on it the GDP accounting, so basically reflects, for example, capital
investment by business operators and manufacturing sector, foreign direct investment –
but not nonmaterial products resulting from the KE activity and its services. There is a
lack of consistent statistics even about the information technologies and their equipment
efficiency. The exception is generalized financial intermediation characteristics (also IT en-
treprises, their employment, personnel costs, IT production and added value), the data on
the population qualifications & their structure, some changes in the IT business indicators.
But it is really not enough for the brain-depth analysis and investigation of the effective-
ness provisions when determining the country’s strategic development perspectives.
Source: A. Ivaschenko,p. 23.
Fig. 4.7. Expected Impact of the EU Structural Funds on R&D Spending in Lithuania, 2007–2013
The additional indicators when encompass in performed analysis can be added in the
following research depending of the particular tasks of the complex assessment of KE
COMPARATIVE ANALYSIS & COMPLEX EVALUATION OF THE INTELLECTUAL RESOURCES: BALTIC & NORDIC COUNTRIES
123
advancement, nevertheless the assessment system has to be formed on the basis of con-
ceptual criteria. Therefore, these countries’ indicators still not involved into the WEF pillars
must be taken into account (or presented further). However as was mentioned before, the
World Bank methodology do not permits of the possibility to evaluate more adequately
the different influence of various indicators on KE advancement in the newly developing
countries when the predetermined fixed weight values are applied for the same selected
indicators. Besides, the World Bank evaluations do not present comparative evaluation of
compound value (using the multiple criteria evaluation methods) according to the totality
of the state’s KE indicators. Also, the KE indicators typical for most of the countries not de-
pending from their development stage are divided between various pillars, and that fact
complicates their joint evaluation in the WEF Reports.. It is expedient to apply the esti-
mated rather than predetermined weights of primary indicators, and the more adequate
differentiate the significance levels for the indicator groups.
4.3. Complex Assessment of Intellectual Resources Development
4.3.1. Multiple criteria assessment of intellectual resources: Lithuania‘s case
The developed multiple criteria assessment technique is based on adopted back-
ground models for applying the SAW method in case evaluation and on the formed
system of intellectual resources components as well as adequate sets of primary indica-
tors. Besides, by assessing it is expedient to include the different impact significances
of primary indicators and intellectual resources components as primary and integrative
evaluation criteria. The application of this method when direct influence of primary
indicators is taking into account determine not only the specificity of multiple criteria
evaluation model but also requests to create the adequate three-level evaluation criteria
system (Ginevičius, Podvezko, 2004; Dombi, Zsiros, 2005; Ginevicius, Podvezko, Bruzge,
2008; Marr, 2008; Ginevicius, Podvezko, 2009; Mazumdar, Datta, Mahapatra, 2010).
The essential primary indicators have to be identified for the complex evaluation and
indicator pillars determining the component indexes (as partial criteria) formulated; on
this basis the component indexes (as partial integrated criteria) were determined and
integral criteria – general level index of the IR development as generalized measure-
Antanas Buracas, Algis Zvirblis
124
was defined. In detail, the process of the consolidated estimation of the IR level using
justified multiple criteria methods included the following stages:
- quantifiable (in points) expert examination of identified primary indicators (as primary
criteria) as well as their significances and listing according to the underlying pillars, estab-
lishment of indicator significances;
- quantitative (multicriteria) assessment of idiosyncratic indicator pillars (as partial crite-
ria in evaluation system) and determination of the pillar indexes and weights (according
to their influence on generalized measure);
- determination of generalized measure – the IR level index (as an integrated criterion)
on basis of the determined index values of partial criteria and their weights.
The expanded sets of primary indicators are selected for the case of Lithuania and oth-
er Baltic countries on basis of classification regulations of international institutions, as well
as accomplished analytical investigation and SWOT analysis according to the approach
within context of very broad cross-country IR assessment. As idiosyncratic IR components
may be mentioned: innovative capacity, the use ofinformation technology, quality of pri-
mary and secondary education, corporate spending on R & D and government policy.
Those components are necessary to include as partial criteria in evaluation system (Za-
pounidis, Doumpos, 2002; Cooke, 2001; Weziak, 2007;Buracas, 2007; Adekola, Korsakiene,
Tvaronaviciene, 2008; Choong, 2008; Stam, Andriessen, 2009; Brannstrom et al., 2009;
Guthrie, Petty, 2000; Chan, Lee, 2011).
The sets of primary indicators presented in the Table 4.12 may be characterized as follows:
the essential indicators of the pillar (F) determining innovative capacity & develop-
ment of the KE are such as economic initiative, the development of KE, new prod-
uct release and quality improvements, innovative production flexibility, creation of
new value-added.
The pillar (E) of ITT application & surrounding adaptation include access to new IT
technologies, Internet use in business, foreign IT technology transfer, indicator of
institutional environment favorability.
The pillar (S) of primary and secondary education quality & staff training is focusing
on the quality of education, the average duration of training, local training, access
to local services, indicator of the professional management.
The set of typical indicators describing the pillar (P) determining company’s spend-
ing on R & D & government support include research institutions and corporate in-
•
•
•
•

COMPARATIVE ANALYSIS & COMPLEX EVALUATION OF THE INTELLECTUAL RESOURCES: BALTIC & NORDIC COUNTRIES
125
teraction, corporate spending on R & D focus on high-techproduction, focuses
on high-tech product exports, government support for innovative technologies,
venture capital availability.
Of course some primary indicators may be measured quantifiably besides the evalu-
ation in points, however their integrated measurement is preferred within point system
unified for evaluation process.
Most of these indicators are essentially composite determinants and therefore requires a
quantitative assessment by an independent methodology. This is true about the KE devel-
opment and cross-country assessment, also the importance of innovation capacity. Innova-
tive activity is defined as the precondition for intensification of the economic, scientific and
technical progress, also in accelerating the social and cultural development. It contains links
between the creation, education and entrepreneurship. More generally, it is appropriate to
treat the innovation activities as a productive one determining any system transition from a
lower to a higher level. The purpose of the transition is to satisfy the changing needs of so-
ciety. Hence, innovation activities have seen as a complex dynamic system, whose effective-
ness is largely dependent on a number of macrofactors. Activation of innovative activities at
national level is subject to a number of challenges, including the scientific & theoretical (miss-
ing of the adapted innovation and innovative performance management system in new EU
countries), also practical & organizational (absence of business innovation, in novation accel-
eration and strategic management structures), in efficient use of intellectual potential (Marr,
Moustaghfir, 2005; Adekola, Korsakiene, Tvaronaviciene, 2008; Navarro et al. 2011).
The background adopted models (oriented to SAW or COPRAS methods) to be applied
for the establishment of pillars indexes are presented below with account of these pri-
mary indicators and their significance coefficients. In determining the significance pa-
rameters of the primary indicators, it must be taken into account that according to the
selected evaluation method the sum of these parameters in pillar must be equal to 1
(Zvirblis, Buracas, 2011a, 2011b).
To estimate the pillar index F(I) (as the first partial criterion), the equation (4.1) was applied:
(4.1)
where − the significance coefficient of direct impact of primary indicators men-
tioned above on the level index .
Antanas Buracas, Algis Zvirblis
126
To estimate the pillar index E(I) (as the second partial criterion), the following equation
(4.2) was applied:
(4.2)
where − the significance coefficient of direct impact of primary indicators on level
index E(I).
To estimate the pillar index S(I) (the third partial criterion), the equation (4.3) was applied:
(4.3)
where − the significance coefficient of direct impact of primary indicators on level
index S(I).
To estimate the pillar index E(I) (as the fourth partial criterion), the following equation
(4.4) was applied:
(4.4)
where − the significance coefficient of direct impact of primary indicators on level
index P(I).
The equation for establishment of general level index La (I) for the Lithuania’s IR the ad-
ditive assessment method is suggested to be applied:
(4.5)
where k − the weights of direct impact of partial criteria , , , on level index
.
The primary indicators, the indicator pillar levels and IR development level were evalu-
ated within 100 point system. Thus 50 point corresponds to medium favorable evalua-
tion, higher levels – to good or very good (more than 70 points) evaluation, and lower
COMPARATIVE ANALYSIS & COMPLEX EVALUATION OF THE INTELLECTUAL RESOURCES: BALTIC & NORDIC COUNTRIES
127
levels – to week or bad (less than 30 points) evaluation. The significance parameters of
primary indicators (in the non-dimensional expression) were determined by expert way.
Expert examination procedure must be implemented applying the widely known con-
cordance methods (including coefficient W, its significance parameter χ2) according to
published formulas (Kendall, 1979; Podvezko, 2007). The procedure evaluating the primary
indicator values and their significances is a first (of three) stage of quantitative (multicrite-
ria) assessment.
Intellectual resources development level assessment presented below permits the in-
vestigation (as well as using SWOT analysis of the Lithuania’s situation in 2011 and deriva-
tive quantifiable indices, corresponding to the assessed primary indicators) according to
the four components (Table 4.12). Expert examination of the expanded set of primary in-
dicators and their significance parameters was performed by expert team of professionals
(International Business School at Vilnius University). The significance of the identified pri-
mary indicators in the preliminary investigation was evaluated with account of establish-
ment of determinative primary indicators by every pillar; in outcome were listed (as could
be seen in Table 4.12 number of the determinative primary criteria by pillars n = 4–6) and
the significance parameters for listed primary indicators were established.
On this basis, the pillar indexes (Table 4.12) were established according to equations
4.1–4.4; the general level index La (I) was established according to equation (4.5).
When generalize the results of performed examination and assessment of Lithuania’s
IR level, it may be stressed that general index is equal 49 point. Fairly average index value
is mainly due to development of KE, new value-added creation, foreign IT technology
transfer, corporate spending on R & D, focus on high-tech production and exports, re-
search institutions and corporate interaction. The values of partial indexes are at compa-
rable medium levels: 46–53 points.
The amelioration of the some low scored primary indicators as production and export
of high-tech goods, corporate spending on R & D, production flexibility for innovation –
are foremost expected in the future.
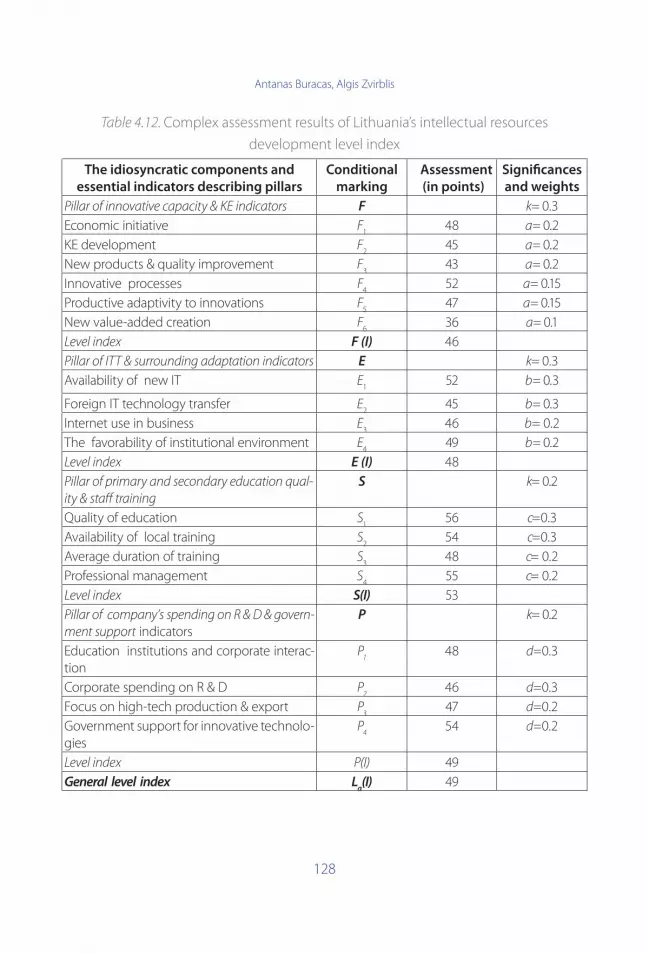
Antanas Buracas, Algis Zvirblis
128
Table 4.12. Complex assessment results of Lithuania’s intellectual resources
development level index
The idiosyncratic components and
essential indicators describing pillars
Conditional
marking
Assessment
(in points)
Significances
and weights
Pillar of innovative capacity & KE indicators F k= 0.3
Economic initiative F1
48 a= 0.2
KE development F2
45 a= 0.2
New products & quality improvement F3
43 a= 0.2
Innovative processes F4
52 a= 0.15
Productive adaptivity to innovations F5
47 a= 0.15
New value-added creation F6
36 a= 0.1
Level index F (I) 46
Pillar of ITT & surrounding adaptation indicators E k= 0.3
Availability of new IT E1
52 b= 0.3
Foreign IT technology transfer E2
45 b= 0.3
Internet use in business E3
46 b= 0.2
The favorability of institutional environment E4
49 b= 0.2
Level index E (I) 48
Pillar of primary and secondary education qual-
ity & staff training
S k= 0.2
Quality of education S1
56 c=0.3
Availability of local training S2
54 c=0.3
Average duration of training S3
48 c= 0.2
Professional management S4
55 c= 0.2
Level index S(I) 53
Pillar of company’s spending on R & D & govern-
ment support indicatorsP k= 0.2
Education institutions and corporate interac-tion
P1
48 d=0.3
Corporate spending on R & D P2
46 d=0.3
Focus on high-tech production & export P3
47 d=0.2
Government support for innovative technolo-gies
P4
54 d=0.2
Level index P(I) 49
General level index La(I) 49
COMPARATIVE ANALYSIS & COMPLEX EVALUATION OF THE INTELLECTUAL RESOURCES: BALTIC & NORDIC COUNTRIES
129
The multiple criteria evaluation of IR in Lithuania (and other states) enables to draw
the sectorial structure, based on the development of alternative national strategies for
2020 and 2030, their strategic management priorities. When simulating the effects of
challenges, the modeling also the optimization of the alternatives as well as economic
development substantiation on basis of the intellectual potential development may be
performed, also the multivariate reasoning and / or ex-post controlling may be realized.
4.3.2. Aggregate evaluation technique of intellectual resources determinants:
case of Baltic States
In determining the relative development level of the IR in the neighboring countries, it is
appropriate to apply the aggregated (qualitative and quantitative) assessment technique
according to the exclusive IR determinants, focusing on the of multiple criteria evaluation
procedures. Appropriate determinants firstly have to be described and evaluation model
have to be adapted. Ready multiple criteria evaluation process provides on the first stage
the identification of the IR determinants and their expert assessment (quantitative scoring
in points), as well as their weighting.
Given the above data and the results of research of the foreground IR components
carried out in Latvia, Lithuania and Estonia by the authors, the IR determinant complex,
consisting of 12 complex valued determinants (Table 4.13) is presented. Thus, focusing
on the background model (4.5) and considering the determinants being independent of
each other, the equation for SAW method based assessment (scoring IR general index)
may be expressed:
(4.6)
where E(I) – general index of the IR development (in scores).
As can be seen, the essential feature is that it includes both of each: the key IR determinants
examination results (their values ) and different significance parameters of each of their impact.
Conducted in the Baltic countries, a complex assessment of the IR determinants in 2011 is pre-
sented. As a basis of expert quantifiable evaluations of the identified determinants, the 10 points
rating system was applied. This means that the 10 – point evaluation is adequate to perfect,
6–7 – to high level, 5–6 scores- an average, 4–5 points – weak, and the 3–4 score – low marks.
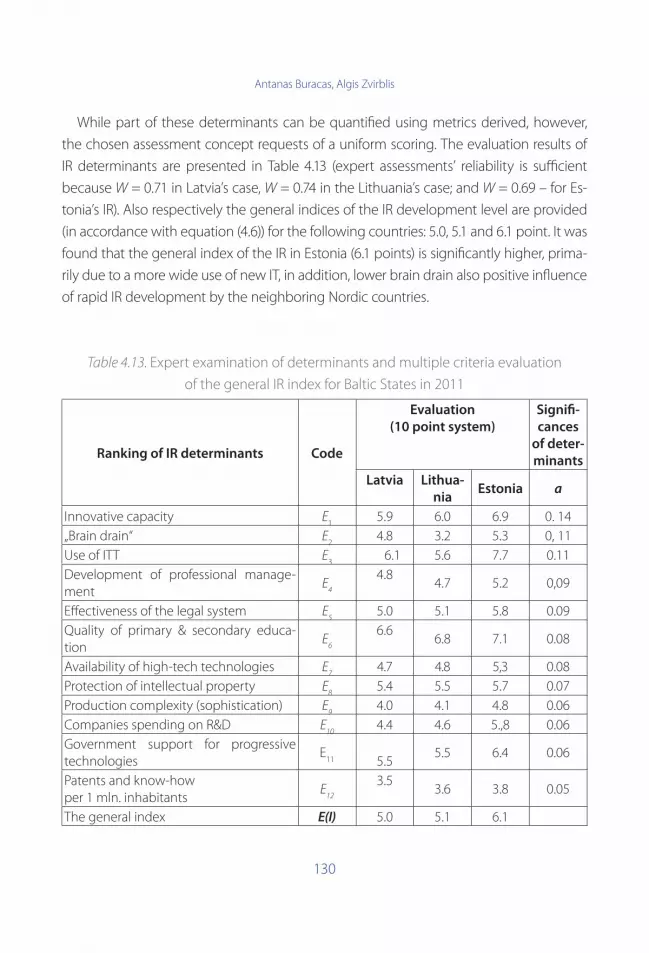
Antanas Buracas, Algis Zvirblis
130
While part of these determinants can be quantified using metrics derived, however,
the chosen assessment concept requests of a uniform scoring. The evaluation results of
IR determinants are presented in Table 4.13 (expert assessments’ reliability is sufficient
because W = 0.71 in Latvia’s case, W = 0.74 in the Lithuania’s case; and W = 0.69 – for Es-
tonia’s IR). Also respectively the general indices of the IR development level are provided
(in accordance with equation (4.6)) for the following countries: 5.0, 5.1 and 6.1 point. It was
found that the general index of the IR in Estonia (6.1 points) is significantly higher, prima-
rily due to a more wide use of new IT, in addition, lower brain drain also positive influence
of rapid IR development by the neighboring Nordic countries.
Table 4.13. Expert examination of determinants and multiple criteria evaluation
of the general IR index for Baltic States in 2011
Ranking of IR determinants Code
Evaluation
(10 point system)
Signifi-
cances
of deter-
minants
Latvia Lithua-
niaEstonia a
Innovative capacity E1
5.9 6.0 6.9 0. 14
„Brain drain“ E2
4.8 3.2 5.3 0, 11
Use of ITT E3
6.1 5.6 7.7 0.11
Development of professional manage-ment
E4
4.84.7 5.2 0,09
Effectiveness of the legal system E5
5.0 5.1 5.8 0.09
Quality of primary & secondary educa-tion
E6
6.66.8 7.1 0.08
Availability of high-tech technologies E7
4.7 4.8 5,3 0.08
Protection of intellectual property E8
5.4 5.5 5.7 0.07
Production complexity (sophistication) E9
4.0 4.1 4.8 0.06
Companies spending on R&D E10
4.4 4.6 5.,8 0.06
Government support for progressive technologies
E11 5.5
5.5 6.4 0.06
Patents and know-how per 1 mln. inhabitants
E12
3.53.6 3.8 0.05
The general index E(I) 5.0 5.1 6.1
COMPARATIVE ANALYSIS & COMPLEX EVALUATION OF THE INTELLECTUAL RESOURCES: BALTIC & NORDIC COUNTRIES
131
The multiple criteria assessment algorithm of country’s IR is incorporated into deci-
sion support system of intellectual potential development strategy, see Fig. 4.8. You can
specify some of the enhanced features of the evaluation process. First, after identification
of a greater number of determinants (as a primary criterion) in a given situation, it is ap-
propriate to form the 2–3 blocks of primary determinants (as partly integrated criteria; in
this case, all the primary determinants form a single block). In this case, the general index
is determined by the index values of partially integrated criteria and their significances by
applying additive multiple criteria evaluation method. As can be seen, the process en-
compass the modeling of various their (determinants) combinations affecting the general
index.
The development decisions may be based on this process when modeling the pro-
gram alternatives (according to the likely development scenarios), by primary indicator
of both target groups, as well as under the exclusive determinants. Prepared technique
is also applicable for rating of Eastern European countries by the intellectual potential
development criteria.

Antanas Buracas, Algis Zvirblis
132
Fig. 4.8. Complex quantitative assessment of intellectual resources in determining
the country’s economic competitiveness

COMPARATIVE ANALYSIS & COMPLEX EVALUATION OF THE INTELLECTUAL RESOURCES: BALTIC & NORDIC COUNTRIES
133
Conclusions
Advancement of knowledge-based economy and growth of national economic com-
petitiveness in the newly EU Member States are the priorities of the sustainable devel-
opment. The review of research works concerning the IR development shows that it is
important to clarify the indicators with regard to their reliability and objectivity as well
as the specifics of individual regions, countries, also size of national markets. At the same
time, the application of WEF pillar system for comparisons of Baltic & Nordic intellectual
resources determinants, their ITT impact on the intellectual potential revealed some prac-
tical weakness of applied technique. The last one was resulting from the fact that it is
used uniformly to all countries on basis of the system of predetermined and fixed indica-
tor weight values (applied to all range of countries). However, the World Bank methodol-
ogy do not permits of the possibility to evaluate more adequately the different influence
of various indicators on KE advancement in the newly developing countries when the
predetermined fixed weight values are applied for the same selected indicators. It also
revealed the lack of attention for complex multiple criteria evaluation of determinants of
the country’s intellectual potential.
To address this research problem, it is important first to identify an adequate determi-
nants for Baltic and other new EU countries, to examine the possibilities of quantitative
evaluation methods. Examination of the IR development in Lithuania and neighboring
countries, the most important progress factors were revealed: especially low assess was
for innovative business activity, technology updates. The differences may be seen in the
ICT impact on the IR development of the Nordic & Baltic countries.
A systematic examination of the IR development under the expert evaluations revealed
important trends in the development of intellectual potential and permitted to identify
better the factors that are hampering progress in the Baltic countries. In particular, Lithua-
nia and Latvia have low rating for innovative business activity, insufficient temps of tech-
nology and product innovation. Although these countries are lagging behind the EU’s by
business, management and marketing innovation indicators, they, especially Estonia, are
leading ahead of EU average by many components of the information technology index
and Current Networked Readiness development.
Similarly is with energy efficiency - it grew much slower in the Baltic countries than in
the EU; however Latvia have quite questionable goal to increase renewable energy to
Antanas Buracas, Algis Zvirblis
134
more than double – to about the EU level within this period. The problem which is par-
ticularly important for sustainable development of the Baltic countries – a profound and
increasing social differentiation, resulting in the steady growth of poverty, which greatly
hindered the rapid development of the IR.
It is important to form an adequate assessment of the IR components for Baltic coun-
tries, clarifying some of their IR, their characteristic features and effects of change more
important for these states as newly EU members. It is also appropriate to highlight the
possibilities of multiple criteria evaluation methods and consistent procedures of its ap-
plication for the productive complex assessment.
Meanwhile, both the predetermined parameters of the intellectual potential evaluation
and their subjective estimates lead to different assessment results in the Baltic countries
and other international comparisons. The application of different significances of com-
posite determinants determining the country’s IR development is discussed comparing
their parameters characterizing the Nordic and Baltic states and measuring the distance
of the last retardation.
Main primary KE indicators used by the WEF for determining the ultimate rank of a
country, the average estimates of the values obtained in applying methods under review
are important. The proposed technique allows the multiple criteria evaluation of various
countries’ IR determinants oriented to the national strategic priorities, regional competi-
tiveness. Besides, the World Bank evaluations do not present comparative evaluation of
compound value (using the multiple criteria evaluation methods) according to the totality
of the state’s IR components. Also, the IR indicators typical for most of the countries not
depending from their development stage are divided between various pillars, and that
fact complicates their joint evaluation.
It was found that it is appropriate to define the surpassing intellectual potential de-
velopment priorities for the Baltic countries in the period 2013–2020, by all prospective
programs and their implementation directions, with account of the perspective EU aid
policies.
A consistent solution of the problem in the Baltic countries, requires, first, to form an
adequate IR assessment indicator system, under which it is appropriate to compare the
Baltic countries, their place in the EU and the world. It is also appropriate to highlight the
possibilities of multiple criteria evaluation methods and fields of assessment procedures
application. The multiple criteria evaluation of intellectual potential in Baltic countries,
COMPARATIVE ANALYSIS & COMPLEX EVALUATION OF THE INTELLECTUAL RESOURCES: BALTIC & NORDIC COUNTRIES
135
combined with a systematic econometric analysis, would enhance its use as a unified
whole, also the development and rational distribution of resources by branch and / or
sectorial structure, based on national alternative strategies. The multiple criteria evalu-
ation of intellectual potential in Lithuania and other Baltic countries, combined with its
systematic econometric analysis, would enhance its more adequate complex evaluation
in dynamic changes as a unified whole, also would suggest the ways of more rational
distribution of limited resources, the rational changes in sectorial structure and alternative
national strategies.
Adopting the multiple criteria evaluation methods, as highlighted by a study of their
application characteristics, can be effectively applied to a comprehensive assessment of
the whole country’s IR and their development indicators. Analyzing of the prospects of
multiple criteria evaluation methods, it is important to take account of the fact that it is
important first to identify IR components specific to Baltic countries in foreground, mod-
ify them and the underlying indicators ( by the three levels of evaluation).
The presented background adopted models to be applied for the establishment of
pillars indexes with account of these primary indicators and their significance coefficients
when applying the SAW and COPRAS methods. The general level index may be deter-
mined according to equation oriented on additive assessment method.
The highlights of the proposed assessment process - basic indicators of the country’s
IR, identification of quantifiable assessment by points for each of the expert determination
significance. Thus, the level of general IR development index can be determined by using
the adapted models. So, the overall index is determined by assessing both the values of
different primary indicators, as well as their significances. At the same time, alternatives to
both the primary indicator, as well as to target groups, can be simulated in addition, ac-
cording to their different impact on the significances of the parameters.
A comprehensive assessment of the IR, integrating the primary indicator of expert
evaluations and quantitative multiple criteria evaluation process, methodology is an im-
portant tool for ranking the states according to their more sophisticated & more accurate
development substantiation. In principle, it allows (at the level of insight), to ground a new
strategic approach to economic development programs in general and, in particular, the
IR development programs involving the evaluation by multiple criteria decision technique
and procedures (including alternative modeling and optimization).
Antanas Buracas, Algis Zvirblis
136
References
Adekola, A.; Korsakiene, R.; Tvaronaviciene, M. (2008). Approach to innovative activities
by Lithuanian companies in the current conditions of development. Technological and
Economic Development of Economy. vol. 14 (4), p. 595–611. doi: 10.3846/tede.2010.17.
Brannstrom, D; Catasus, B.; Giuliani, M.; Grojer, J.E. (2009). Construction of intellectual
capital – the case of purchase analysis. Journal of Human Resource Costing and Account-
ing, vol. 13, p. 61-76.
Buracas, A. (2007). The Competitiveness of the EU in the context of the intellectual
capital development. Intellectual Economics, vol. 1(1), p. 19–28.
Challenges and Opportunities for a European Strategy in Support of Innovation in Services.
Fostering New Markets and Jobs through Innovation (2009). The European Union, Lux-
embourg. Retrieved from: http://ec.europa.eu/enterprise/policies/innovation/ files/
swd_services_en.pdf.
Chan, P. C. W.; Lee,W. B. (2011). Knowledge Audit with Intellectual Capital in the Quality
Management Process: An Empirical Study in Electronics Company. The Electronic Jour-
nal of Knowledge Management, vol. 9(2), 98–116.
Cooke, P. (2001). Regional innovative systems, clusters and the knowledge economy.
Industrial and Corporate Change, vol. 10(4): 945–974.doi:10.1093/icc/10.4.945.
Choong, K. K. (2008). Intellectual capital: Definitions, categorization and reporting
models. Journal of Intellectual Capital, vol.9, p. 609-638.
Dombi, J.; Zsiros, A. (2005). Learning multicriteria classification models from examples:
decision rules in continuous space. European Journal of Operational Research, vol. 160(3),
p. 663–675.
Digital Lithuania (2009). Retrieved from:http://www.infobalt.lt/sl/add/sl_2009_300.pdf
Dreher, A. (2010). KOF Index of Globalisation, Zurich. Retrieved from: http://globalization.
kof.ethz.ch
Europe 2030 (2010), ed. D. Benjamin, Brookings Institution Press.
Ginevičius, R. & Podvezko, V. (2004). Complex evaluation of the use of information
technologies in the countries of Eastern and Central Europe. Journal of Business Eco-
nomics and Management, 5(4): 183–192.
Ginevicius, R.; Podvezko, V. (2009). Evaluating the changes in economic and social
development of Lithuanian counties by multiple criteria methods. Technological
1.
2.
3.
4.
5.
6.
7.
8.
9.
10.
11.
12.
13.
COMPARATIVE ANALYSIS & COMPLEX EVALUATION OF THE INTELLECTUAL RESOURCES: BALTIC & NORDIC COUNTRIES
137
and Economic Development of Economy, vol. 15 (3), p. 418–436, doi: 10.3846/1392-
8619.2009.15.418-436.
Ginevicius, R.; Podvezko, V.; Bruzge, Sh. (2008). Evaluating the effect of state aid to
business by multi-criteria methods. Journal of Business Economics and Management,
vol. 9(3), p. 167–180. doi:10.3846/1611- 1699.2008.9.167-180.
The Global Competitiveness Report (2011). Ed. by Klaus Schwab. Retrieved from: http://
www.weforum.org/en/media/publications/CompetitivenessReports/index.htm.
Globalisation Indicators (2010). Eurostat. Retrieved from: <http://epp.eurostat.ec.europa.
eu/portal/page/portal/globalisation/indicators.
Global Governance 2025: At a Critical Juncture (2010). Retrieved from: http://www.dni.
gov/nic/PDF_2025/2025_Global_Governance.pdf.
The Global Innovation Index 2011. Ed. by S. Dutta, INSEAD. Retrieved from: http://www.
globalinnovationindex.org/gii/main/fullreport/index.html
Global Trends 2025: A Transformed World (2008). Retrieved from: http://www.dni.gov/
nic/PDF_2025/2025_Global_Trends_Final_Report.pdf.
Guthrie, J.; Petty, R. (2000). Intellectual capital: Australian annual reporting practices.
Journal of Intellectual Capital, vol. 1, p. 241-251.
Hollanders H.(2009). European Innovation Scoreboard (EIS): Evolution and Lessons Learnt.
Innovation Indicators for Latin America Workshop. OECD.
Human Development Report, 2010. Retrieved from: http://hdr.undp.org/en/media/
HDR_2010_EN_Table1_reprint.pdf.
INNO-Appraisal (2010). Understanding Evaluation of Innovation Policy in Europe. Annex
to Final Report. Retrieved from: http://www.proinno-europe.eu/appraisal.
Innovation Scorecard: Country Innovation Profiles (2012). Prepared for General Electric by
the Milken Institute.
Intellectual Capital for Communities in the Knowledge Economy: Nations, Regions, Cities
and Emerging Communities (2005, 2006). World Bank Conferences.
Intellectual Capital Services (2011). Retrieved from: http://www.intcap.com/our_ap-
proach.php.
IvaschenkoA. (2009). Lithuania’s Research, Development and Innovation System -
Benchmarking & Effectiveness Analysis. The World Bank.
Kaufmann, L.; Schneider, Y. (2004). Intangibles: A synthesis of current research. Journal
of Intellectual Capital, vol. 5, p. 366–388.
14.
15.
16.
17.
18.
19.
20.
21.
22.
23.
24.
25.
26.
27.
28.

Antanas Buracas, Algis Zvirblis
138
Kendall, M. (1979). Rank correlation methods. London, Griffin and Co.
Kikas, T. (2011). National Spatial Plan „Estonia 2030+“. Retrieved from: http://www.vasab.
org/files/documents/events/Annual_conference_2011/7_TK_EE.pdf.
Knowledge for Development (K4D), The World Bank Group (2011). Retrieved from: http://
info.worldbank.org/etools/kam2/KAM_page1.asp; http://info.worldbank.org/etools/
kam2/KAM_page5.asp.
Lopes I. T. (2011). The Boundaries of Intellectual Property Valuation: Cost, Market, In-
come Based Approaches and Innovation Turnover. Intellectual Economics, Nr 1 (9).
Marr, B. (2008). Disclosing the invisible: Publishing intellectual capital statements. CMA
Management, August/September, p. 35-49.
Marr, B.; Moustaghfir, K. (2005). Defining intellectual capital: A three-dimensional ap-
proach. Management Decision, vol. 43, p. 1114-1128.
Mazumdar, A., Datta, S., & Mahapatra, S. S. (2010). Multicriteria decision-making models
for the evaluation and appraisal of teacher’ performance. International Journal of Pro-
ductity and Quality Management, 6(2): 213–230.
Measuring Intellectual Capital at Skandia Group (FPM, 1993). Retrieved from: <www.fpm.
com/script/UK/Jun93/930602.htm>.
Mitchell, S. W. (2000). Is a company’s intellectual capital performance and intellectual
capital disclosure practices related? University of Calgary. Retrieved from: <www.vaic-
on.net/ downloads/Paper1.pdf>.
Navarro J. L. A. et al. (2011). Estimation of intellectual capital in the European Union
using a knowledge model. Proceedings of Rijeka Faculty of Economics.– Journal of
Economics and Business, Vol. 29.
OECD Guide to Measuring the Information Society (2011). Retrieved from: www.oecd.
org/sti/measuring-infoeconomy/guide; http://browse.oecdbookshop.org/oecd/pdfs/
free/9311021e.pdf .
Poland 2030. Development Challenges Report. Board of Strategic Advisers to the Prime
Minister of Poland. Retrieved from: http://www.Polska2030.pl.
Podvezko, V. (2007). Determining the level of agreement of expert estimates.Interna-
tionalJournal of Management and Decision Making, vol. 8 (5/6), p. 586–600.
Project Europe 2030 (2010). Challenges and Opportunities.A report to the European
Council. Retrieved from: http://www.consilium.europa.eu/uedocs/cmsUpload/en_
web.pdf.
29.
30.
31.
32.
33.
34.
35.
36.
37.
38.
39.
40.
41.
42.
COMPARATIVE ANALYSIS & COMPLEX EVALUATION OF THE INTELLECTUAL RESOURCES: BALTIC & NORDIC COUNTRIES
139
Regional Innovation Scoreboard. Methodology report (2009). Ed. by H. Hollanders et al.,
Innometrics.
RICARDIS: Reporting Intellectual Capital to Augment Research, Development and Innova-
tion in SMEs (June 2006). European Commission. Retrieved from: http://ec.europa.eu/
invest-in-research/pdf/download_en/2006-2977_web1.pdf.
Saeima of the Republic Latvia (2010). Sustainable Development Strategy of Latvia until
2030. Retrieved from: http://www.nap.lv/upload/latvija2030_en.pdf.
Science, technology and innovation in Europe, 2011.
Skandia Navigator. Intangibles Valuation (2011). Retrieved from: http://www.valuebased-
management.net/methods_skandianavigator.html.
Stam, C. & Andriessen, D. (2009). Intellectual Capital of the European Union 2008. 1rd
European Conference of Intellectual Capital. Netherlands.
The Strategic Economic Plan: Towards A Developed Nation. Retrieved from: http://app.
mti.gov.sg/data/pages/885/doc/NWS_plan.pdf.
Weziak, D. (2007). Measurement of national intellectual capital application to EU coun-
tries. – An Integrated Research Infrastructure in the Socio-economic Sciences, Nr. 13. Re-
trieved from: /http://iriss.ceps.lu/documents/irisswp81.pdf.
The World Bank Group (Oct. 2009). Knowledge in Development Notes, Retrieved from:
http://siteresources.worldbank.org/INTRES/Resources/KinD2009_impact_evaluation.pdf.
World Economic Forum 2010 Report. Retrieved from: http://www.weforum.org/pdf/ Fi-
nancialDevelopmentReport/Report2009.pdf.
World Telecommunication/ICT Indicators Database (2011). Retrieved from: http://www.
itu.int/ITU-D/ict/statistics/.
Zapounidis, C.; Doumpos, M. (2002). Multicriteria classification and sorting methods: A
literature review. European Journal of Operational Research, vol. 138(2), p.229-246.
Zvirblis, A.; Buracas, A. (2011a).Multicriteria evaluation of national entrepreneur-
ship in newly EU countries. International Journal of Economic Sciences and Applied
Research, vol. 4(1), p. 79-94.
Zvirblis, A.; Buracas, A. (2011b). Examination of the Entrepreneurship Advantage De-
terminants Affecting Strategic Decisions. Management of Organizations: Systematic Re-
search, vol. 58, p. 31–41.
43.
44.
45.
46.
47.
48.
49.
50.
51.
52.
53.
54.
55.
56.
Algis Zvirblis
140
Chapter 5
Multicriteria Reasoning of the Development Decisions
of National Intellectual Resources
Algis ZvirblisInternational Business School at Vilnius University
The paper deals with theoretical framework and technique for reasoning the strategic
development decisions and programmed indicators of the national intellectual resources
(IR) in the newly EU countries using the multiple criteria decision making (MCDM) meth-
ods. The theoretical basis can be applied when developing the decision support sys-
tems as well as computer-aided controlling systems. The evaluation criteria and adequate
methods determining the evaluation of alternatives and justification of the decision proc-
ess are defined on the basis of MCDM and applicable evaluation methods (its algorithm
presented). The importance of multiple criteria evaluation methods and the scenario syn-
thesis is stressed. The assessment principles for evaluation of alternative strategic deci-
sion and models, in particular, applicable for detection of compatibility between the IR
advancement strategy, on the one side, and the country’s economic development priori-
ties, also determinants of economic competitiveness, national opportunities and directive
indicators for their (IR) development, on the other side, are created. These are important
methodological tools for increasing the countries’ overall IR management effectiveness.
Keywords: intellectual resources, advancement strategy, decision making system, compat-
ibility dimension, multiple criteria methods
JEL: E60; O15; O32; C02; C61
MULTICRITERIA REASONING OF THE DEVELOPMENT DECISIONS OF NATIONAL INTELLECTUAL RESOURCES
141
5.1. Introduction
The concept of the national development strategy programme for increase in the eco-
nomic competitiveness is formulated at the stage of the development priorities estab-
lishment. The country’s economic development strategy must forecast the main new
competitive advantage-oriented changes and foresee the effective attitudes also de-
velopment indicators determining the growth of economic competitiveness as well as
knowledge economy. As concern the country (country’s region) economic competitive-
ness, it is purposeful, first of all, to interpret it as a multidimensional phenomenon. Second,
it depends on the priority fields of economic activity dominating in the country (region).
The economic development has to be aimed accordingly to the prospective develop-
ment programme oriented to the national economic resources.
The directions for the development of country’s IR, development of their components
and preferential funding can be identified as a priority. The common EU knowledge econ-
omy and innovation development program oriented to strengthen its competitiveness
and sustainable development has impact to consecutive development of adequate na-
tional development strategies (Melnikas, 2008; Grundey, 2008; Simmons et al., 2009). The
formulation of the national development policies of IR, taking into account many aspects
of the problem, and the program’s implementation and monitoring, also systemic cor-
rections of a development program according by changing situation actually calls for an
integrated application of complex assessment systems (Marr, Moustaghfir, 2005; Shapira
et al., 2006; Weziak, 2007). The creating of such systems is of paramount importance. The
review of research works dedicated to IR development processes shows that the atten-
tion given to complex decisions reasoning is not adequate to its importance.
Thoroughly, the IR development trends as well as strategic decisions priorities may be
identified in developing economies as follows:
- enhancement of innovations capabilities, manufacturing and export of high-tech
production, organizational flexibility for innovations, entrance into new markets;
- development of human resources, advancement of life quality parameters according
to human development index components;
- development of knowledge economy, enhancement of competitiveness;
- ITT development in businesses and households, recent availability of IT;
- grow of business expenditures for R&D;

Algis Zvirblis
142
- grow of quality of primary and secondary education, development of staff training;
- technological transfer, foreign IT transfer, production sophistication,
- grow of the institutional environment favorability;
- availability to the risk capital;
- government support for innovative technologies,
- investments into intellectual potential components;
- priority on sustainable IR development;
- protection of the intellectual property, modernization of the legal basis.
The analysis of the country’s economic development strategy as a totality and iden-
tification of the important characteristics of individual areas (on basis of SWOT analysis),
show that they are determined by the major diversity of the strategic indicators charac-
terizing the development of programmed justification objectives. Among other things,
it must be oriented towards the improvement of institutional frameworks, as well as the
actual funding opportunities, in other words, a multidisciplinary approach to the strat-
egy development (to include new challenges arising as a result the focus) and the pro-
grammed substantiation for itsindicators are required. So, it is essential to improve the
decision-making and substantiation of national IR development process (Guthrie, Petty,
2000; Bivainis, Zinkeviciute, 2006; Buracas, 2007; Vasiliauskas, 2007; Choong, 2008; Navarro
et al. 2011; Chan, Lee, 2011).
The task of this research is to formulate the principles for the multiple criteria reason-
ing to the strategic IR development decisions and programed indicators. The research
methods include the systemic analysis of special MCDM systems and substantiation, also
adapted methods of multiple criteria evaluation and optimization.
The multiple criteria evaluation and substantiation technique permits to receive more
effectiveness in national programs for the IR strategic development especially in the new-
ly EU countries.
5.2. Overview of multiple criteria decision making (MCDM) systems
The important steps for strategic decisions related to IR development and formation of
the state development program in the newly EU countries, is the conception and formula-
MULTICRITERIA REASONING OF THE DEVELOPMENT DECISIONS OF NATIONAL INTELLECTUAL RESOURCES
143
tion of development policies, decision-making alternatives, their evaluation and justification
of complex decisions using contemporary methodology. Integrated assessment procedures
permit the quantitative evaluation of alternative solutions based on multiple objectives and
criteria, as well as turning them into computerized decision support systems.
Firstly, it is appropriate to examine in greater detail the general theoretical and meth-
odological potential of available decisions generalization. The decision-making science
offers many versatile methods to assess the alternatives according to their characteristics
and common objectives, which allows for efficient, or at least the best compromise solu-
tion. In discussing these techniques, you can specify that the relative & functional models
are applied mostly, and the evaluation of conditions may be deterministic or undeter-
mined.
In the latter case there is some uncertainty, which may be of such a type: unknown
significance for assessing criteria; criteria are predetermined, however, an alternative per-
formance of those criteria is not known or it is stochastic. Many authors emphasize the
generalization of strategic decisions aimed to evaluation of their importance, however,
brings together the related test problems for evaluation criteria (in particular, an alterna-
tive point of view of comparative advantage).
Decisions are based on the general on such approaches as Genetic algorithm, Gradient
projection, Mathematical programming, Discriminant function, Objective function, Decision
trees, Neural Networks, Data envelopment analysis (DEA), Preference disaggregation analysis
methods. Notable are such highlights of methods: choice (the best alternative of n), break-
down (n alternatives divided into relatively homogeneous groups, which can be sorted by
priority), ranking (ratings of n alternatives from best to worst), description (determine the
main features of each option). As a priority, of course, it is possible to specify a multicriteria
decision-making, which covers quite a wide range of quantification (especially multiple
criteria) of evaluation methods and systems (Peldschus, 2007; Datta et al., 2009; Mazum-
dar, 2009; Mazumdar et al., 2010).
Based on preliminary analysis of conceptual works, the multicriteria decision methods
that could potentially be much more widely used in strategic decision making related to
the development of country IR were chosen for more detailed investigation. Of course,
the classical methods specific to the tasks chosen should be targeted for adaptation.
Solving similar tasks, the criteria system that adequately & objectively define the rel-
evance of alternative solutions and implementation of performance targets, should be
Algis Zvirblis
144
formed, which include both qualitative (non-definite unambiguous quantitative expres-
sion, including the integral ones) and quantitative criteria. In principle, the widest possible
range of evaluation criteria, the more detailed and comprehensive assessment of possible
alternative solutions, but as in many other cases, reliability of the large-scale information,
the variation in significance of criteria in the assessment procedures and costs, forcing the
optimal search in criteria range.
The evaluation of strategic decisions may be formed of equal significance criteria
system or evaluation criteria can be differentiated according to their significance. In the
first case, if any of the options (the decision variant) is not satisfied with any of the as-
sessment criteria, it must be rejected. In the second case, which is undoubtedly more
flexible criteria for differentiation, thus establishing a priority criteria, and then alterna-
tives should be rejected that do not meet the priority criteria (or one of them). Depend-
ing on which method is used, alternative criteria may be quantitative or qualitative, and
they in turn can be divided into objective and subjective (mainly qualitative criteria).
Therefore, alternative solutions must be analyzed and evaluated on the basis of the
criteria system, ranked and determined those who received the best ratings and, finally
,the priority decision.
Recently developed MCDM systems, which allow the assessment of alternative solu-
tions based on multiple objectives and criteria according to the nature of the issues ad-
dressed are divided into two categories: Multiple Objective Decision Making (MODM) and
Multiple Attribute Decision Making (MADM), and has been extensively discussed (Opri-
covic, Tzeng, 2004; Figueira et al., 2005; Peldschus, 2007; Figueira et al., 2008; Datta et al.,
2009; Mazumdar, 2009; Zavadskas et al., 2009; Mazumdar et al. 2010; Podvezko, 2011).
The multipurpose analysis and optimization of alternative systems, use ful strategic
decision support systems in general, the adoption of IR in the development of strategic
decision-making capabilities – it is also appropriate to discuss in more detail. First of all,
Multi-Objective Optimization on the Basis of Ratio Analysis (MOORA) have to be mentioned
that is based on the ratio analysis, on the one side, and on basic reference point theory
(method), on the other side. In this case a matrix of responses A of different alternatives to
different objectives, which the typical expression (5.1) is presented; it has as many rows as
there are alternatives, and as many columns as there are objectives.
In the first stage dimensionless numbers (within interval [0; 1] or interval [0; ∞]) originate
from a non-subjective analysis inside the existing system. In the second stage reference
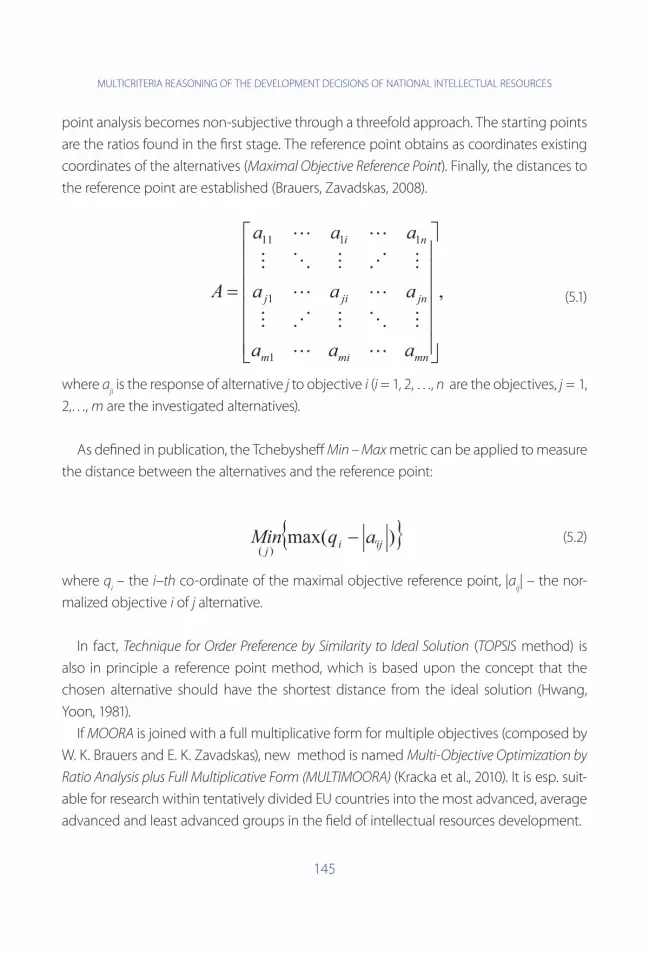
MULTICRITERIA REASONING OF THE DEVELOPMENT DECISIONS OF NATIONAL INTELLECTUAL RESOURCES
145
point analysis becomes non-subjective through a threefold approach. The starting points
are the ratios found in the first stage. The reference point obtains as coordinates existing
coordinates of the alternatives (Maximal Objective Reference Point). Finally, the distances to
the reference point are established (Brauers, Zavadskas, 2008).
(5.1)
where aji is the response of alternative j to objective i (i = 1, 2, …, n are the objectives, j = 1,
2,…, m are the investigated alternatives).
As defined in publication, the Tchebysheff Min – Max metric can be applied to measure
the distance between the alternatives and the reference point:
, (5.2)
where qi – the i–th co-ordinate of the maximal objective reference point, |a
ij| – the nor-
malized objective i of j alternative.
In fact, Technique for Order Preference by Similarity to Ideal Solution (TOPSIS method) is
also in principle a reference point method, which is based upon the concept that the
chosen alternative should have the shortest distance from the ideal solution (Hwang,
Yoon, 1981).
If MOORA is joined with a full multiplicative form for multiple objectives (composed by
W. K. Brauers and E. K. Zavadskas), new method is named Multi-Objective Optimization by
Ratio Analysis plus Full Multiplicative Form (MULTIMOORA) (Kracka et al., 2010). It is esp. suit-
able for research within tentatively divided EU countries into the most advanced, average
advanced and least advanced groups in the field of intellectual resources development.
Algis Zvirblis
146
In this context, the applicability of scenario approach also has to be taken into account,
although the nature of this approach is descriptive. Recently published scientific works
mainly for the use of this method for evaluation of the external environment situation
(their perspective trends) and provide strategic alternatives (taking into account both the
expected changes, as well as to some possible combinations of factors) to define.
Where there is a shortage of reliable information and a high degree of uncertainty,
scenario method increases the likelihood that decisions meet more prospective develop-
ments in the situation. This can be modeled by the potential changes in these factors
(and especially their combinations) influence. This highlights the use of scenarios to ad-
dress important strategic management, and hence the development of IR, improving
efficiency in decision-making problems (Ratcliffe, 2002; Burinskiene, Rudzkiene, 2009).
Trying to deal with multipurpose decision support at the problem of information uncer-
tainty, when traditional methods are not always practicable, so some authors analyze the
ability of TOPSIS method for adapting them for use in decision-making uncertain environ-
ment (Antuchevicienė et al., 2010). One more group of decisive approaches to solving this
problem of uncertain information could be mentioned is the Stochastic multicriteria accept-
ability analysis (SMAA) developed in more works (Figueira et al., 2005; Tervonen, Lahdelma,
2007; Tervonen, Figueira, 2008). Of course, the addition of the above-discussed methods to
stochastic parameter estimates may also be present, including the evaluation process on
each decision-making stage and probabilistic characteristics of the alternative estimations.
The reliability of any management system valuation can be more substantiated by
applying Utility Additives DIScriminantes (UTADIS) classification method, which is based on
additive utility function, reflecting the cumulative effect, i. e. includes partial results corre-
sponding to each individual criterion. This allows take into account many factors groups –
control (supervision), the institutional framework, the macro impact on the environment,
and specifically highlighting control systems and the importance of monitoring. This of
course requires a target of data collection, their grouping, and also scoring system in-
cluded into identification of indicators (with adequate procedures) and their significance
level setting (Gaganis, Pasiouras, Zopounidis, 2006).
It is also necessary to examine the opportunity of an application of additive meth-
ods – extended simple additive and a new Additive Ratio Assessment (ARAS) – for various
multiaspect challenges (in particular, to find the best alternative to the satisfaction of
certain conditions). This method can be effective when each alternative is characterized,
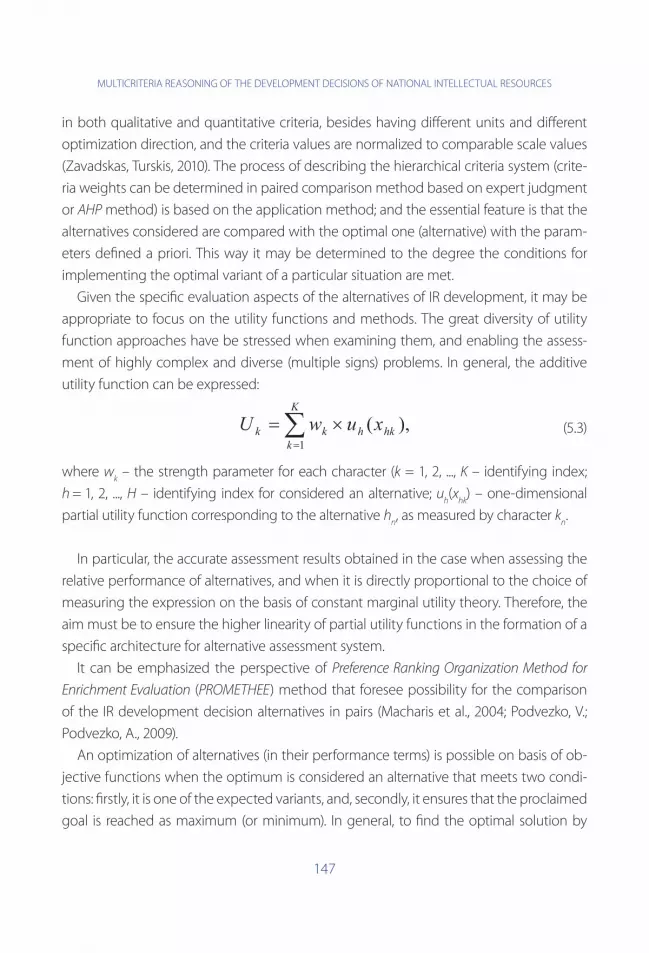
MULTICRITERIA REASONING OF THE DEVELOPMENT DECISIONS OF NATIONAL INTELLECTUAL RESOURCES
147
in both qualitative and quantitative criteria, besides having different units and different
optimization direction, and the criteria values are normalized to comparable scale values
(Zavadskas, Turskis, 2010). The process of describing the hierarchical criteria system (crite-
ria weights can be determined in paired comparison method based on expert judgment
or AHP method) is based on the application method; and the essential feature is that the
alternatives considered are compared with the optimal one (alternative) with the param-
eters defined a priori. This way it may be determined to the degree the conditions for
implementing the optimal variant of a particular situation are met.
Given the specific evaluation aspects of the alternatives of IR development, it may be
appropriate to focus on the utility functions and methods. The great diversity of utility
function approaches have be stressed when examining them, and enabling the assess-
ment of highly complex and diverse (multiple signs) problems. In general, the additive
utility function can be expressed:
(5.3)
where wk – the strength parameter for each character (k = 1, 2, ..., K – identifying index;
h = 1, 2, ..., H – identifying index for considered an alternative; uh(x
hk) – one-dimensional
partial utility function corresponding to the alternative hn, as measured by character k
n.
In particular, the accurate assessment results obtained in the case when assessing the
relative performance of alternatives, and when it is directly proportional to the choice of
measuring the expression on the basis of constant marginal utility theory. Therefore, the
aim must be to ensure the higher linearity of partial utility functions in the formation of a
specific architecture for alternative assessment system.
It can be emphasized the perspective of Preference Ranking Organization Method for
Enrichment Evaluation (PROMETHEE) method that foresee possibility for the comparison
of the IR development decision alternatives in pairs (Macharis et al., 2004; Podvezko, V.;
Podvezko, A., 2009).
An optimization of alternatives (in their performance terms) is possible on basis of ob-
jective functions when the optimum is considered an alternative that meets two condi-
tions: firstly, it is one of the expected variants, and, secondly, it ensures that the proclaimed
goal is reached as maximum (or minimum). In general, to find the optimal solution by
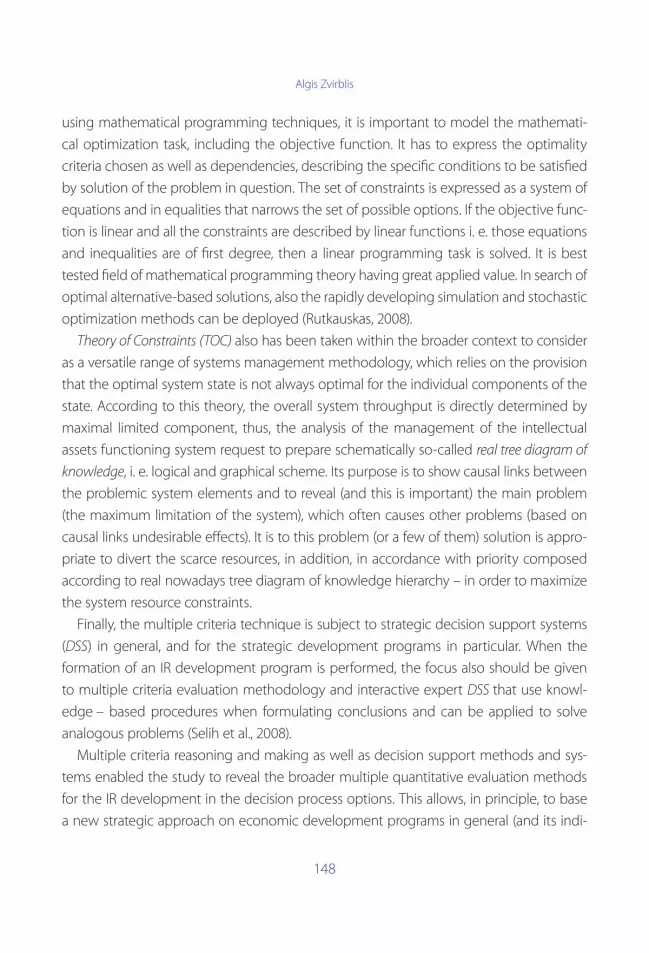
Algis Zvirblis
148
using mathematical programming techniques, it is important to model the mathemati-
cal optimization task, including the objective function. It has to express the optimality
criteria chosen as well as dependencies, describing the specific conditions to be satisfied
by solution of the problem in question. The set of constraints is expressed as a system of
equations and in equalities that narrows the set of possible options. If the objective func-
tion is linear and all the constraints are described by linear functions i. e. those equations
and inequalities are of first degree, then a linear programming task is solved. It is best
tested field of mathematical programming theory having great applied value. In search of
optimal alternative-based solutions, also the rapidly developing simulation and stochastic
optimization methods can be deployed (Rutkauskas, 2008).
Theory of Constraints (TOC) also has been taken within the broader context to consider
as a versatile range of systems management methodology, which relies on the provision
that the optimal system state is not always optimal for the individual components of the
state. According to this theory, the overall system throughput is directly determined by
maximal limited component, thus, the analysis of the management of the intellectual
assets functioning system request to prepare schematically so-called real tree diagram of
knowledge, i. e. logical and graphical scheme. Its purpose is to show causal links between
the problemic system elements and to reveal (and this is important) the main problem
(the maximum limitation of the system), which often causes other problems (based on
causal links undesirable effects). It is to this problem (or a few of them) solution is appro-
priate to divert the scarce resources, in addition, in accordance with priority composed
according to real nowadays tree diagram of knowledge hierarchy – in order to maximize
the system resource constraints.
Finally, the multiple criteria technique is subject to strategic decision support systems
(DSS) in general, and for the strategic development programs in particular. When the
formation of an IR development program is performed, the focus also should be given
to multiple criteria evaluation methodology and interactive expert DSS that use knowl-
edge – based procedures when formulating conclusions and can be applied to solve
analogous problems (Selih et al., 2008).
Multiple criteria reasoning and making as well as decision support methods and sys-
tems enabled the study to reveal the broader multiple quantitative evaluation methods
for the IR development in the decision process options. This allows, in principle, to base
a new strategic approach on economic development programs in general (and its indi-
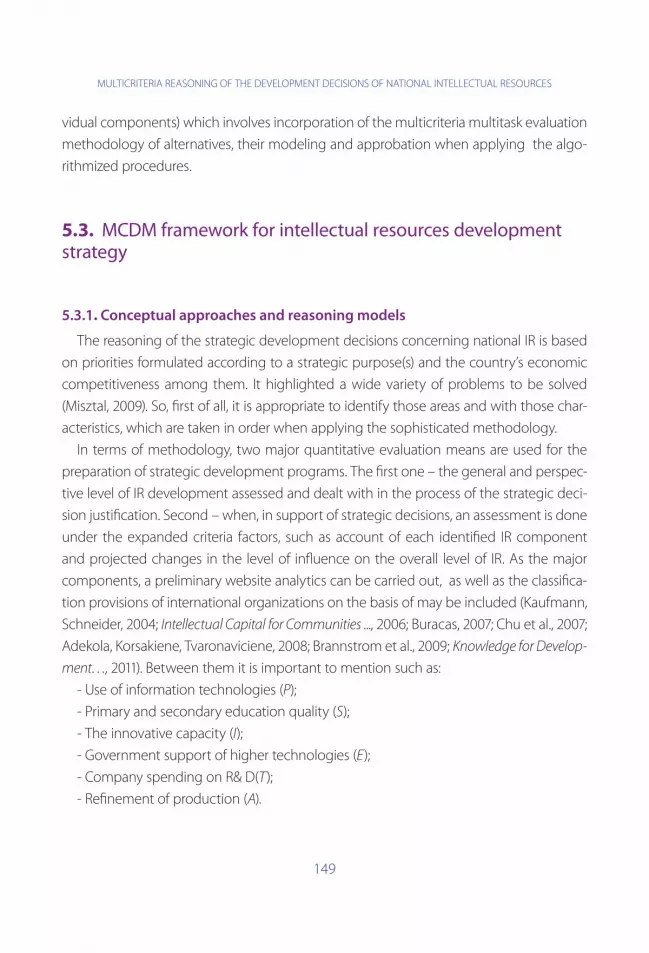
MULTICRITERIA REASONING OF THE DEVELOPMENT DECISIONS OF NATIONAL INTELLECTUAL RESOURCES
149
vidual components) which involves incorporation of the multicriteria multitask evaluation
methodology of alternatives, their modeling and approbation when applying the algo-
rithmized procedures.
5.3. MCDM framework for intellectual resources development strategy
5.3.1. Conceptual approaches and reasoning models
The reasoning of the strategic development decisions concerning national IR is based
on priorities formulated according to a strategic purpose(s) and the country’s economic
competitiveness among them. It highlighted a wide variety of problems to be solved
(Misztal, 2009). So, first of all, it is appropriate to identify those areas and with those char-
acteristics, which are taken in order when applying the sophisticated methodology.
In terms of methodology, two major quantitative evaluation means are used for the
preparation of strategic development programs. The first one – the general and perspec-
tive level of IR development assessed and dealt with in the process of the strategic deci-
sion justification. Second – when, in support of strategic decisions, an assessment is done
under the expanded criteria factors, such as account of each identified IR component
and projected changes in the level of influence on the overall level of IR. As the major
components, a preliminary website analytics can be carried out, as well as the classifica-
tion provisions of international organizations on the basis of may be included (Kaufmann,
Schneider, 2004; Intellectual Capital for Communities ..., 2006; Buracas, 2007; Chu et al., 2007;
Adekola, Korsakiene, Tvaronaviciene, 2008; Brannstrom et al., 2009; Knowledge for Develop-
ment…, 2011). Between them it is important to mention such as:
- Use of information technologies (P);
- Primary and secondary education quality (S);
- The innovative capacity (I);
- Government support of higher technologies (E);
- Company spending on R& D(T);
- Refinement of production (A).
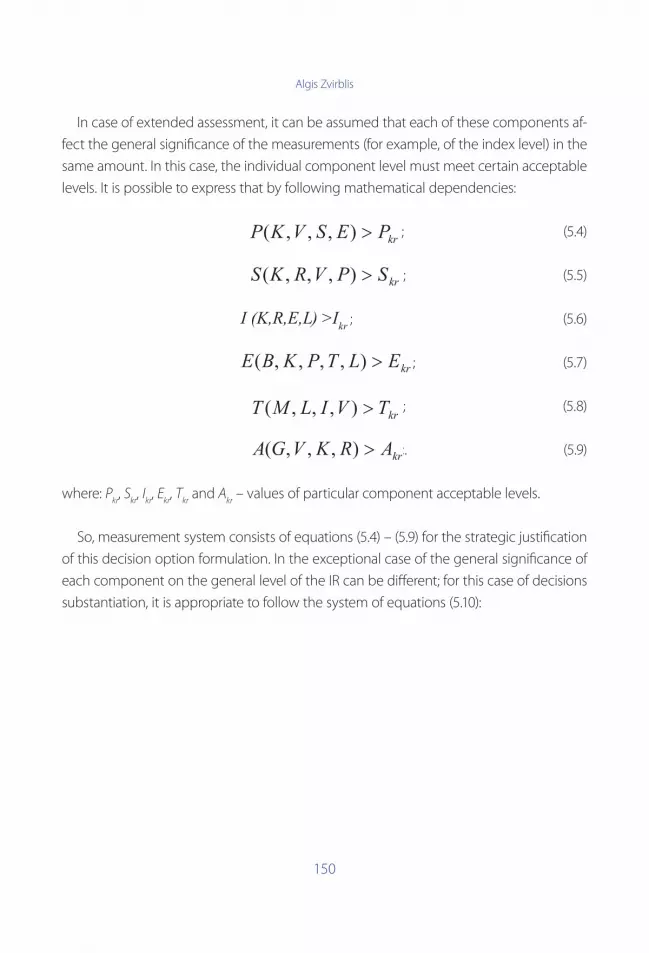
Algis Zvirblis
150
In case of extended assessment, it can be assumed that each of these components af-
fect the general significance of the measurements (for example, of the index level) in the
same amount. In this case, the individual component level must meet certain acceptable
levels. It is possible to express that by following mathematical dependencies:
; (5.4)
; (5.5)
; (5.6)
; (5.7)
; (5.8)
;. (5.9)
where: Pkr, S
kr, I
kr, E
kr, T
kr and A
kr – values of particular component acceptable levels.
So, measurement system consists of equations (5.4) – (5.9) for the strategic justification
of this decision option formulation. In the exceptional case of the general significance of
each component on the general level of the IR can be different; for this case of decisions
substantiation, it is appropriate to follow the system of equations (5.10):
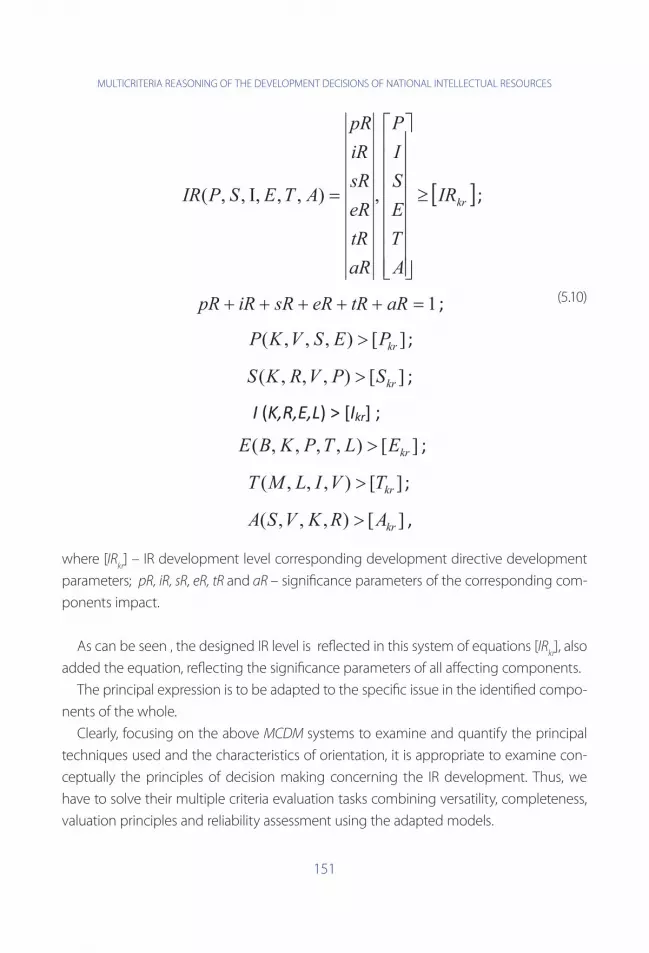
MULTICRITERIA REASONING OF THE DEVELOPMENT DECISIONS OF NATIONAL INTELLECTUAL RESOURCES
151
(5.10)
where [IRkr] – IR development level corresponding development directive development
parameters; pR, iR, sR, eR, tR and aR – significance parameters of the corresponding com-
ponents impact.
As can be seen , the designed IR level is reflected in this system of equations [IRkr], also
added the equation, reflecting the significance parameters of all affecting components.
The principal expression is to be adapted to the specific issue in the identified compo-
nents of the whole.
Clearly, focusing on the above MCDM systems to examine and quantify the principal
techniques used and the characteristics of orientation, it is appropriate to examine con-
ceptually the principles of decision making concerning the IR development. Thus, we
have to solve their multiple criteria evaluation tasks combining versatility, completeness,
valuation principles and reliability assessment using the adapted models.
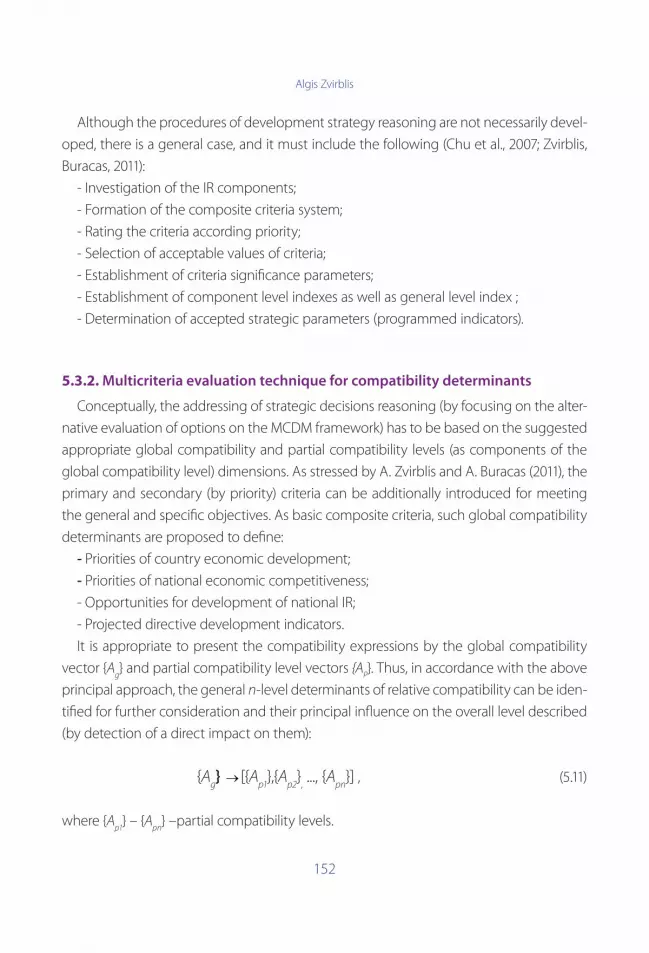
Algis Zvirblis
152
Although the procedures of development strategy reasoning are not necessarily devel-
oped, there is a general case, and it must include the following (Chu et al., 2007; Zvirblis,
Buracas, 2011):
- Investigation of the IR components;
- Formation of the composite criteria system;
- Rating the criteria according priority;
- Selection of acceptable values of criteria;
- Establishment of criteria significance parameters;
- Establishment of component level indexes as well as general level index ;
- Determination of accepted strategic parameters (programmed indicators).
5.3.2. Multicriteria evaluation technique for compatibility determinants
Conceptually, the addressing of strategic decisions reasoning (by focusing on the alter-
native evaluation of options on the MCDM framework) has to be based on the suggested
appropriate global compatibility and partial compatibility levels (as components of the
global compatibility level) dimensions. As stressed by A. Zvirblis and A. Buracas (2011), the
primary and secondary (by priority) criteria can be additionally introduced for meeting
the general and specific objectives. As basic composite criteria, such global compatibility
determinants are proposed to define:
- Priorities of country economic development;
- Priorities of national economic competitiveness;
- Opportunities for development of national IR;
- Projected directive development indicators.
It is appropriate to present the compatibility expressions by the global compatibility
vector {Ag} and partial compatibility level vectors {A
P}. Thus, in accordance with the above
principal approach, the general n-level determinants of relative compatibility can be iden-
tified for further consideration and their principal influence on the overall level described
(by detection of a direct impact on them):
{Ag} [{A
p1},{A
p2}, ..., {A
pn}] , (5.11)
where {Ap1
} – {Apn
} –partial compatibility levels.
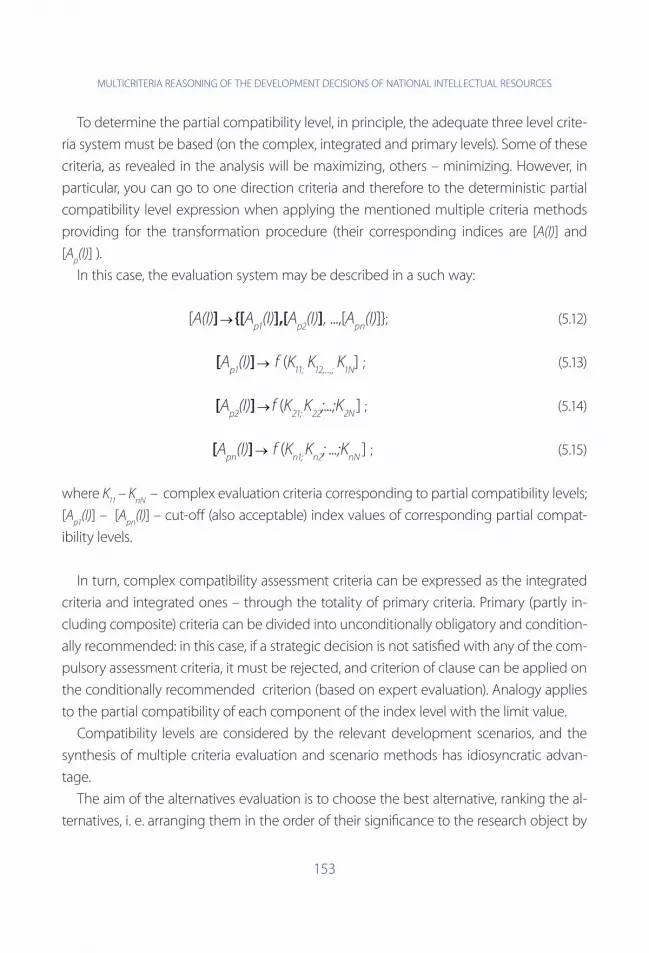
MULTICRITERIA REASONING OF THE DEVELOPMENT DECISIONS OF NATIONAL INTELLECTUAL RESOURCES
153
To determine the partial compatibility level, in principle, the adequate three level crite-
ria system must be based (on the complex, integrated and primary levels). Some of these
criteria, as revealed in the analysis will be maximizing, others – minimizing. However, in
particular, you can go to one direction criteria and therefore to the deterministic partial
compatibility level expression when applying the mentioned multiple criteria methods
providing for the transformation procedure (their corresponding indices are [A(I)] and
[Ap(I)] ).
In this case, the evaluation system may be described in a such way:
[A(I)] {[Ap1
(I)],[Ap2
(I)], ...,[Apn
(I)]}; (5.12)
[Ap1
(I)] f (K11;
K12,...,;
K1N
] ; (5.13)
[Ap2
(I)] f (K21;
K22
;...;K2N
] ; (5.14)
[Apn
(I)] f (Kn1;
Kn2
; ...;KnN
] ; (5.15)
where K11
– KnN
– complex evaluation criteria corresponding to partial compatibility levels;
[Ap1
(I)] – [Apn
(I)] – cut-off (also acceptable) index values of corresponding partial compat-
ibility levels.
In turn, complex compatibility assessment criteria can be expressed as the integrated
criteria and integrated ones – through the totality of primary criteria. Primary (partly in-
cluding composite) criteria can be divided into unconditionally obligatory and condition-
ally recommended: in this case, if a strategic decision is not satisfied with any of the com-
pulsory assessment criteria, it must be rejected, and criterion of clause can be applied on
the conditionally recommended criterion (based on expert evaluation). Analogy applies
to the partial compatibility of each component of the index level with the limit value.
Compatibility levels are considered by the relevant development scenarios, and the
synthesis of multiple criteria evaluation and scenario methods has idiosyncratic advan-
tage.
The aim of the alternatives evaluation is to choose the best alternative, ranking the al-
ternatives, i. e. arranging them in the order of their significance to the research object by
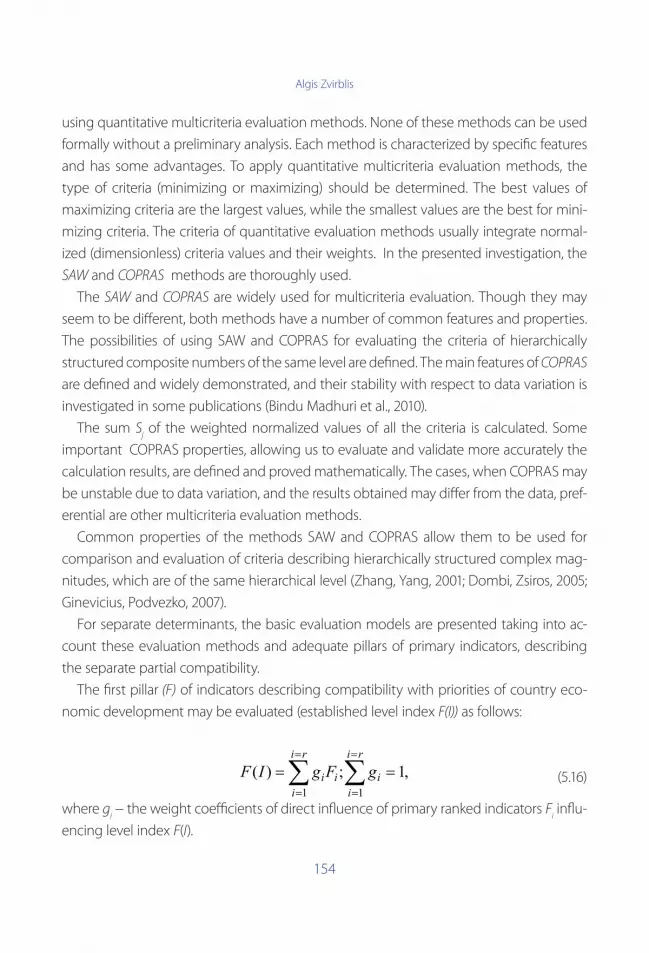
Algis Zvirblis
154
using quantitative multicriteria evaluation methods. None of these methods can be used
formally without a preliminary analysis. Each method is characterized by specific features
and has some advantages. To apply quantitative multicriteria evaluation methods, the
type of criteria (minimizing or maximizing) should be determined. The best values of
maximizing criteria are the largest values, while the smallest values are the best for mini-
mizing criteria. The criteria of quantitative evaluation methods usually integrate normal-
ized (dimensionless) criteria values and their weights. In the presented investigation, the
SAW and COPRAS methods are thoroughly used.
The SAW and COPRAS are widely used for multicriteria evaluation. Though they may
seem to be different, both methods have a number of common features and properties.
The possibilities of using SAW and COPRAS for evaluating the criteria of hierarchically
structured composite numbers of the same level are defined. The main features of COPRAS
are defined and widely demonstrated, and their stability with respect to data variation is
investigated in some publications (Bindu Madhuri et al., 2010).
The sum Sj of the weighted normalized values of all the criteria is calculated. Some
important COPRAS properties, allowing us to evaluate and validate more accurately the
calculation results, are defined and proved mathematically. The cases, when COPRAS may
be unstable due to data variation, and the results obtained may differ from the data, pref-
erential are other multicriteria evaluation methods.
Common properties of the methods SAW and COPRAS allow them to be used for
comparison and evaluation of criteria describing hierarchically structured complex mag-
nitudes, which are of the same hierarchical level (Zhang, Yang, 2001; Dombi, Zsiros, 2005;
Ginevicius, Podvezko, 2007).
For separate determinants, the basic evaluation models are presented taking into ac-
count these evaluation methods and adequate pillars of primary indicators, describing
the separate partial compatibility.
The first pillar (F) of indicators describing compatibility with priorities of country eco-
nomic development may be evaluated (established level index F(I)) as follows:
(5.16)
where gi − the weight coefficients of direct influence of primary ranked indicators F
i influ-
encing level index F(I).
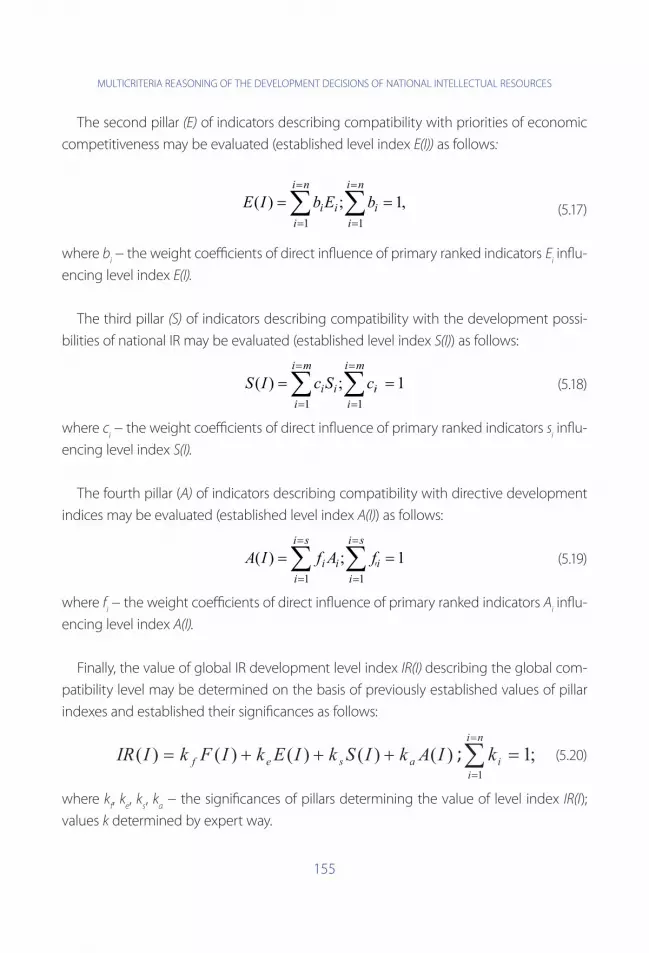
MULTICRITERIA REASONING OF THE DEVELOPMENT DECISIONS OF NATIONAL INTELLECTUAL RESOURCES
155
The second pillar (E) of indicators describing compatibility with priorities of economic
competitiveness may be evaluated (established level index E(I)) as follows:
(5.17)
where bi − the weight coefficients of direct influence of primary ranked indicators E
i influ-
encing level index E(I).
The third pillar (S) of indicators describing compatibility with the development possi-
bilities of national IR may be evaluated (established level index S(I)) as follows:
, (5.18)
where ci − the weight coefficients of direct influence of primary ranked indicators s
i influ-
encing level index S(I).
The fourth pillar (A) of indicators describing compatibility with directive development
indices may be evaluated (established level index A(I)) as follows:
, (5.19)
where fi − the weight coefficients of direct influence of primary ranked indicators A
i influ-
encing level index A(I).
Finally, the value of global IR development level index IR(I) describing the global com-
patibility level may be determined on the basis of previously established values of pillar
indexes and established their significances as follows:
(5.20)
where kf, k
e, k
s, k
a − the significances of pillars determining the value of level index IR(I);
values k determined by expert way.
Algis Zvirblis
156
When applying these basic models, the specific primary indicators according to the
real state of transitional and newly EU member countries in every particular pillar can be
taken into account.
The proposed procedure of complex reasoning solutions (evaluation procedures) is
shown schematically in fig. 5.1. Key decision alternative assessment procedures, in princi-
ple, the sequence is as follows:
a) generation, development, selection of possible alternatives to meet the objective;
b) analysis of possible evaluation criteria and rejection of related indicators;
c) the formation of the evaluation criteria system;
d) the setting of each criterion weight (by significance or priority);
e) the determination of criteria describing options;
f) the counting of the criteria integrated values ;
g) an assessment of alternatives under review;
h) the analysis of the evaluation results;
i) the determination of most preferred (optimal) alternative.
If none of the alternatives examined meet the criteria, the search for additional alterna-
tives and evaluation cycle is repeated.
Turning to the Decision Support System (DSS) which support, but not replace the deci-
sion-making process, it is necessary to indicate that various descriptions of them as intel-
ligent systems can be found. In essence, this intelligent information systems that process
data and knowledge in a variety of mathematical and logical methods, decision analysis
and evaluation of alternatives based on decision maker, provides the necessary information
(Zapounidis, Doumpos, 2002, Gomes da Silva et al., 2006; Peldschus, 2007; Zavadskas, Tur-
skis, 2010). They are located in a great systems variety, so the researchers first produce the
business Management Information Systems (MIS), Enterprise Resource Planning (ERP), relations
(communications), Customer Relationship Management (CRM), data processing (analysis) a/o
systems. On other approach, the Decision Making Support Systems (DMSS), as information
systems that interactively support the decision making process of individuals and groups in
life, public, and private organizations, and other entities, include Decision Support Systems
(DSS), Executive Information Systems (EIS), Expert Systems (ES), Knowledge Based Systems
(KBS), and Creativity Enhancing Systems (CES). Other DMSS, such as Executive Support sys-
tems (ESS), Management Support Systems (MSS), Artificially Intelligent Decision Support
Systems (IDSS), and Decision Technology Systems (DTS) may be stressed.

MULTICRITERIA REASONING OF THE DEVELOPMENT DECISIONS OF NATIONAL INTELLECTUAL RESOURCES
157
Fig. 5.1. The procedures of strategic decision evaluation
Within DSS (as combining local data systems), the expert systems, neural networks and
genetic algorithms, data and knowledge mining system, software agents and multi-agent
systems, group decision support systems, natural language processing technology, and
voice technology can be mentioned.
Advanced are the expert support system that uses knowledge and formulate conclu-
sions based on the procedures to be applied to solve complex problems, they may de-
cide and specify the reasons which led to it. Algorithm of this process and the proposed
principles may be also included into DSS for strategic planning and strategic develop-
ment programs.
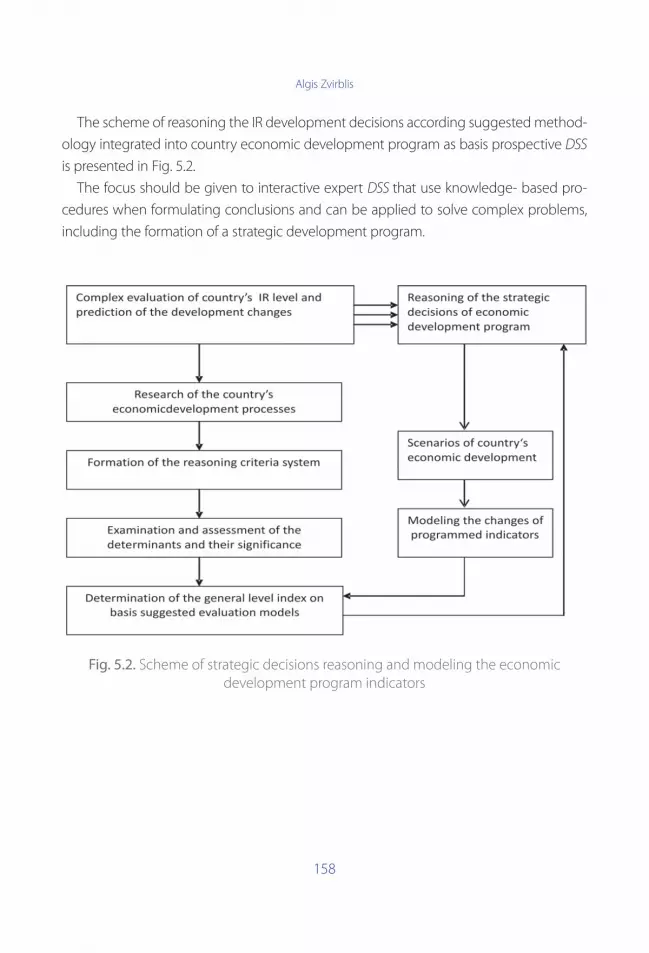
Algis Zvirblis
158
The scheme of reasoning the IR development decisions according suggested method-
ology integrated into country economic development program as basis prospective DSS
is presented in Fig. 5.2.
The focus should be given to interactive expert DSS that use knowledge- based pro-
cedures when formulating conclusions and can be applied to solve complex problems,
including the formation of a strategic development program.
Fig. 5.2. Scheme of strategic decisions reasoning and modeling the economic development program indicators

MULTICRITERIA REASONING OF THE DEVELOPMENT DECISIONS OF NATIONAL INTELLECTUAL RESOURCES
159
Conclusions
A prospective orientation is an application of decision complex reasoning methods in
general and their incorporation into computerized decision support systems. The reason-
ing techniques for multiple criteria strategic decisions and the study of support systems
enabled to reveal the broad opportunities for multiple criteria methods; the spectrum
of evaluation systems and methods was defined for the effective application to assess
the expected intellectual potential indicators and authorization for the strategic develop-
ment program attitudes.
Recently, the Multiple Criteria Decision Making (MCDM) methodology, which allows the
assessment of alternative solutions based on multiple objectives and criteria, was devel-
oped. Reasoning of the decisions in certain situations, are possible as well as using Genetic
Algorithms, PROMETHEE group methods. The Multi Objective Optimization on basis of Ratio
Analysis (MOORA) and Multi-Objective Optimization by Ratio Analysis plus Full Multiplicative
Form (MULTIMOORA) techniques can be revealed.
The strategic decisions can be based in principle (mostly on insight level) on a new
approach to strategic management in general and especially to the economic develop-
ment programs (their individual parts) which involves multicriteria evaluation and sub-
stantiation of multi purpose solutions (including alternative modeling and optimization
of programmed indicators) methods and algorithmized procedures.
Conceptually, the multiple assessment tasks have be solved in the process of quantita-
tive decision substantiation options according to the versatility, reliability, completeness
and valuation principles. It is appropriate to introduce the global compatibility level and
the partial compatibility level (as relative to the global compatibility level) dimensions.
The main assessment and strategic decisions reasoning principles are primarily based on
the composite compatibility determinants: the country’s economic development priori-
ties, the determinants of economic competitiveness, national capabilities for the IR devel-
opment and directive development indicators.
The above formalization of IR components is a theoretical expression for determining
the adequacy of foreground IR component level as well as the general level to wider
changes in the programmed and acceptable country’s development levels. The possi-
bility for application of the principles studied above not only upon authorization of the
development programs, but also modeling programmed monitoring alternatives was
Algis Zvirblis
160
highlighted. The option of as witch to computerized control systems is by algorithmic
approach to this process.
The methods SAW and COPRAS are widely used for multicriteria evaluation of IR devel-
opment decisions partial compatibility level. Common properties of the methods SAW
and COPRAS allow them to be used for comparison and evaluation of criteria describing
hierarchically structured complex magnitudes, which are of the same hierarchical level.
The possibilities of using SAW and COPRAS for evaluating the criteria of hierarchically
structurized composite numbers of the same level are defined. For separate IR determi-
nants, the basic evaluation models are presented taking into account these evaluation
methods and adequate pillars of primary indicators, describing the separate partial com-
patibility.
The proposed evaluation methodology (the theoretical framework and the tech-
nique of the multiple criteria assessment) is recommended to apply by the developing
the DSS as well as computer-aided control systems. By the formation of a development
program in the newly EU countries the focus also should be given to multiple criteria
evaluation methodology and interactive expert DSS that use knowledge-based pro-
cedures when formulating conclusions and can be applied to solve complex develop-
ment problems.
References
Adekola, A.; Korsakiene, R.; Tvaronaviciene, M. (2008). Approach to innovative activities
by Lithuanian companies in the current conditions of development. Technological and
Economic Development of Economy. vol. 14 (4), p. 595–611. doi: 10.3846/tede. 2010.17.
Antuchevicienė, J.; Zavadskas, E. K.; Zakarevicius, A. (2010). Multiple criteria construc-
tion management decisions considering relations between criteria. Technological and
economic development of economy, vol. 16(1): p. 109–125.
Bindu Madhuri, Ch., Anand Chandulal, J. & Padmaja, M. (2010). Selection of best web
site by applying COPRAS-G method. International Journal of Computer Science and In-
formation Technologies, vol. 1(2), p. 138–146.
Bivainis, J.; Zinkeviciute, V. (2006). Reasoning of business strategic decisions selection.
Technological and Economic Development of Economy, vol. 12(2), p. 99–107.
1.
2.
3.
4.
MULTICRITERIA REASONING OF THE DEVELOPMENT DECISIONS OF NATIONAL INTELLECTUAL RESOURCES
161
Brauers, W. K. M.; Zavadskas, E. K. (2008). Multiobjective optimization in local theory
with a simulation for a department store, Transformations in Business & Economics, vol.
7(3), p. 163–183.
Brannstrom, D; Catasus, B.; Giuliani, M.; Grojer, J.E. (2009). Construction of intellectual
capital – the case of purchase analysis. Journal of Human Resource Costing and Account-
ing, vol. 13, p. 61–76.
Buracas, A. (2007). The Competitiveness of the EU in the context of the intellectual
capital development. Intellectual Economics, vol. 1(1), p. 19–28.
Burinskiene, M.; Rudzkiene V. (2009). Future insights, scenarios and expert method ap-
plication in sustainable territorial planning. Technological and Economic Development
of Economy, vol. 15 (1), p. 10–25, doi: 10.3846/1392-8619.2009.15.10-25.
Chan, P. Ch.; Lee,W. B. (2011). Knowledge Audit with Intellectual Capital in the Quality
Management Process: An Empirical Study in Electronics Company. The Electronic Jour-
nal of Knowledge Management, 9(2).
Choong, K. K. (2008). Intellectual capital: Definitions, categorization and reporting
models. Journal of Intellectual Capital, vol.9, p. 609–638.
Chu, M. T., Shyu, J., Tzeng, G. H.; Khosla, R. (2007). Comparison among three analytical
methods for knowledge communities’ group-decision analysis. Expert systems with ap-
plications, vol. 33(4), p. 1011–1024.
Datta, S., Beriha, G. S., Patnaik, B.; Mahapatra, S. S. (2009). Use of compromise ranking
method for supervisor selection: A multi-criteria decision making (MCDM) approach.
International Journal of Vocational and Technical Education, vol. 1(1), p. 7–13.
Dombi, J.; Zsiros, A. (2005). Learning multicriteria classification models from exam-
ples: Decision rules in continuous space. European Journal of Operational Research, vol.
160(3), p. 663–675.
Figureira, J.; Greco, S.; Ehrgott, M. (2005). Multiple criteria decision analysis. Springer
Science + Business Media, Inc. Boston, USA.
Figueira, J. et al. (2008). Interactive Multiobjective Optimization using a Set of Additive
Value Functions. In J. Branke, K. Deb, K. Miettinen, and R. Slowinski, editors, Multiobjec-
tive Optimization: Interactive and Evolutionary Approaches, p. 99–122.
Gaganis, C.; Pasiouras, F.; Zopounidis, C. (2006). A multicriteria decision framework for
measuring banks’ soundness around the world. Journal of Multi-Criteria Decision Analy-
sis, vol. 14(1-3), p. 103–111, doi: 10.1002/mcda.405.
5.
6.
7.
8.
9.
10.
11.
12.
13.
14.
15.
16.
Algis Zvirblis
162
Ginevicius, R.; Podvezko, V. (2007). Some problems of evaluating multicriteria decision
methods. International Journal of Management and Decision Making, vol. 8(5/6), p. 527–
539. doi:10.1504/IJMDM.2007.013415.
Gomes da Silva, C.; Figueira, J.; Lisboa, J.; Barman, S. (2006). An interactive decision sup-
port system for an aggregate production planning model based on multiple criteria
mixed integer linear programming. Omega, vol. 34(2), p. 167–177.
Grundey, D. (2008).Applying sustainability principles in the economy. Technologi-
cal and Economic Development of Economy, vol.14(2), p. 101–106, doi: 10.3816/1392-
8619.2008.14.101- 106.
Guthrie, J.; Petty, R. (2000). Intellectual capital: Australian annual reporting practices.
Journal of Intellectual Capital, vol. 1, p. 241–251.
Intellectual Capital for Communities in the Knowledge Economy: Nations, Regions, Cities
and Emerging Communities (2006). World Bank Conferences.
Hwang, C. L.; Yoon, K. (1981). Multiple Attribute Decision Making-Methods and Applica-
tions. A State of the Art Survey. Springer Verlag, Berlin, Heidelberg, New York.
Kaufmann, L.; Schneider, Y. (2004). Intangibles: A synthesis of current research. Journal
of Intellectual Capital, vol. 5, p. 366–388.
Knowledge for Development (K4D), The World Bank Group (2011). Retrieved from: http://
info.worldbank.org/etools/kam2/KAM_page1.asp; http://info.worldbank.org/etools/
kam2/KAM_page5.asp.
Kracka, M.; Brauers, W. K. M.; Zavadskas, E. K. (2010). Ranking Heating Losses in a Build-
ing by Applying the MULTIMOORA. Engineering Economics, vol. 21(4), p. 352–359.
Macharis, C. et al. (2004). PROMETHEE and AHP: The design of operational synergies in
multi –criteria analysis: Strengthening PROMETHEE with ideas of AHP. European Jour-
nal of Operational Research, vol. 153(2), p. 307–317.
Marr, B.; Moustaghfir, K. (2005). Defining intellectual capital: A three-dimensional ap-
proach. Management Decision, vol. 43, p. 1114–1128.
Mazumdar, A. (2009). Application of multi-criteria decision making (MCDM) approach-
es on teachers’ performance evaluation and appraisal. National Institute of Technol-
ogy, Rourkela, India, p. 40.
Mazumdar, A., Datta, S., & Mahapatra, S. S. (2010). Multicriteria decision-making models
for the evaluation and appraisal of teacher’ performance. International Journal of Pro-
ductity and Quality Management, 6(2), p. 213–230.
17.
18.
19.
20.
21.
22.
23.
24.
25.
26.
27.
28.
29.

MULTICRITERIA REASONING OF THE DEVELOPMENT DECISIONS OF NATIONAL INTELLECTUAL RESOURCES
163
Melnikas, B. (2008). The Knowledge-based Economy in the European Union: Innova-
tions, Networking and Transformation Strategies. Transformations in Business & Eco-
nomics, vol. 7, No 3(15), p. 170–192.
Misztal, P. (2009). International competitiveness of the Baltic states in the transforma-
tion period: Lithuania, Latvia and Estonia. Transformations in Business & Economics,
vol.8(3), p. 21–35.
Navarro, J. L. A. et al. (2011). Estimation of intellectual capital in the European Union
using a knowledge model. Proceedings of Rijeka Faculty of Economics – Journal of
Economics and Business, 29.
Opricovic, S.; Tzeng, G.-H. (2004). Compromise solution by MCDM methods: A compar-
ative analysis of VIKOR and TOPSIS. European Journal of Operational Research, vol. 156(2),
p. 445–455.
Parada Daza, J. R. (2009). A valuation model for corporate social responsibility. Social
Responsibility Journal, vol. 5(3), p. 284–299.
Peldschus, F. (2007). The effectiveness of assessment in multiple criteria decisions. In-
ternational Journal of Management and Decision Making, vol. 8(5–6), p. 519–526.
Podvezko, V.; Podvezko, A. (2009). PROMETHEE I method application for identifica-
tion of the best alternative. Business: Theory and Practice, vol. 10(2), p. 84–92. doi:
10.3846/1648-0627.2009.10.84-92.
Podvezko, V. (2011). The Comparative Analysis of MCDA Methods SAW and COPRAS.
Engineering Economics, vol. 22(2), p. 134–146.
Ratcliffe, J. (2002). Scenario planning: strategic interviews and conversations. Foresight,
vol. 4(1), p. 19–30.
Rutkauskas, A. V. (2008). On the sustainability of regional competitiveness development
considering risk. Technological and Economic Development of Economy, vol. 14(1), p. 89–99.
Selih, J., Kne, A., Srdic, M., Zura, M. (2008). Multiple-criteria decision support system in
highway infrastructure management. Transport, vol. 23(4), p. 299–305.
Shapira, P., Youtie, J., Yogeesvaran, K, Jaafer, Z. (2006). Knowledge Economy Measure-
ment: Methods, Results and Insights from the Malaysian Knowledge Content Study.
Research Policy, vol. 35, p. 1522–1537.
Simmons, G.; Thomas, B. C.; Packham, G. (2009). Opportunity and innovation: Synergy
within an entrepreneurial approach to marketing. The International Journal of Entrepre-
neurship and Innovation, vol. 10 (1), p. 63–72.
30.
31.
32.
33.
34.
35.
36.
37.
38.
39.
40.
41.
42.
Algis Zvirblis
164
Tervonen, T.; Lahdelma, R. (2007). Implementing stochastic multicriteria acceptability
analysis. European Journal of Operational Research, vol. 178(2), p. 500–513.
Tervonen, T.; Figueira, J. R. (2008). A survey on stochastic multicriteria acceptability
analysis methods. Journal of Multi-Criteria Decision Analysis, p. 15(1-2), p. 1–14.
Vasiliauskas, A. (2007). Priorities of economic growth, competitiveness and strategic man-
agement of Lithuanian economy development, in 9th International Scientific Conference
Management Horizons: Visions and Challenges, 2007. Selected papers. Eds. P. Zakarevičius-
Chairman. September 27–28, 2007. Kaunas, Lithuania. VMU Press: 433-442.
Weziak, D. (2007). Measurement of national intellectual capital application to EU coun-
tries. – An Integrated Research Infrastructure in the Socio-economic Sciences, No 13.
Retrieved from: /http://iriss.ceps.lu/documents/irisswp81.pdf.
Zapounidis, C.; Doumpos, M. (2002). Multi-criteria decision aid in financial decision
making: methodologies and literature review. Journal of Multi-Criteria Decision Analysis,
vol.11 (4-5), p. 167–186.
Zavadskas, E. K.; Kaklauskas, A.; Turskis, Z.; Tamosaitienė, J. (2009). Multi-attribute deci-
sion-making model by applying grey numbers. Informatica, vol. 20(2), p. 305–320.
Zavadskas, E. K.; Turskis, Z. (2010). A new additive ratio assessment (ARAS) method in
multicriteria decision-making. Technological and Economic Development of Economy,
vol. 16(2), p. 159–172.
Zhang, W., Yang, H. (2001), A study of the weighting method for a certain type of mul-
ticriteria optimization problem. Computers and Structures, vol. 79(31), p. 2741–2749.
Zvirblis, A.; Buracas, A. (2011). Multicriteria evaluation of national entrepreneur-
ship in newly EU countries. International Journal of Economic Sciences and Applied
Research, vol. 4(1), p. 79–94.
43.
44.
45.
46.
47.
48.
49.
50.
51.

MULTICRITERIA REASONING OF THE DEVELOPMENT DECISIONS OF NATIONAL INTELLECTUAL RESOURCES
165

Antanas Buracas, Algis Zvirblis
166
ANNEXES
List of tables
A1 Innovation Dimensions used in Innovation Union Scoreboard 167A2 European Innovation Scoreboard indicators, sources (earlier version) 168A3 Measuring Average Innovation Performance Using Composite Indicators:
Methodology
169
A4 The Global Innovation Index: Institutions Pillar 170A5 The Global Innovation Index: Human Capital & Research Pillar 171A6 The Global Innovation Index: Infrastructure Pillar 172A7 The Global Innovation Index: Market Sophistication Pillar 173A8 The Global Innovation Index: Business Sophistication Pillar 174A9 The Global Innovation Index: Scientific Output Pillar 175
A10 The Global Innovation Index: Creative Outputs Pillar 176

ANNEXES
167
Table A1. Innovation Dimensions used in Innovation Union Scoreboard
Retrieved from: http://hollanders.unu-merit.nl/RIS%20Methodology%20report%209%20March%202012.pdf
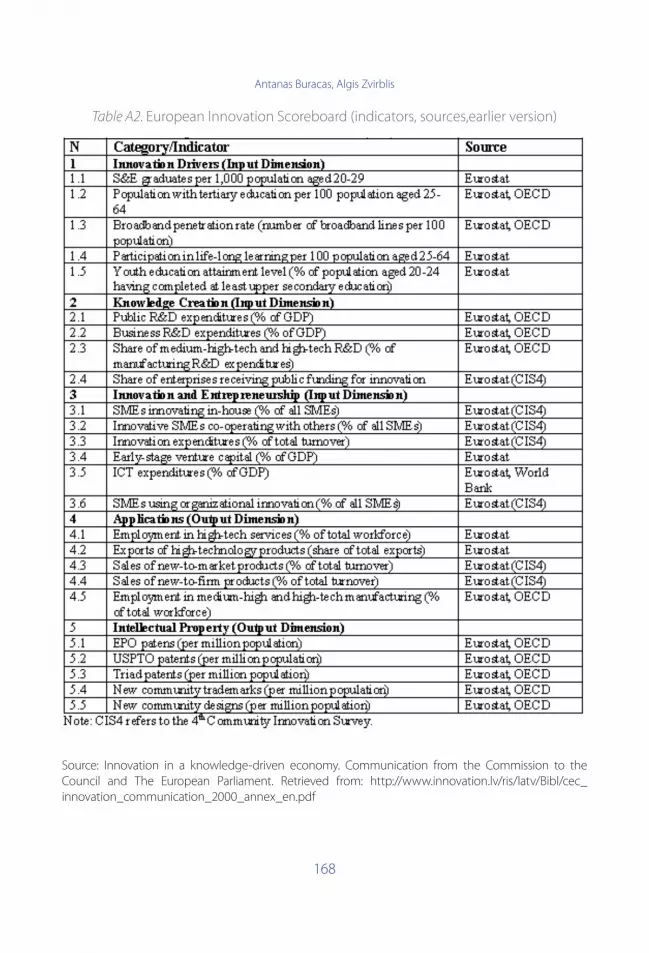
Antanas Buracas, Algis Zvirblis
168
Table A2. European Innovation Scoreboard (indicators, sources,earlier version)
Source: Innovation in a knowledge-driven economy. Communication from the Commission to the Council and The European Parliament. Retrieved from: http://www.innovation.lv/ris/latv/Bibl/cec_innovation_communication_2000_annex_en.pdf
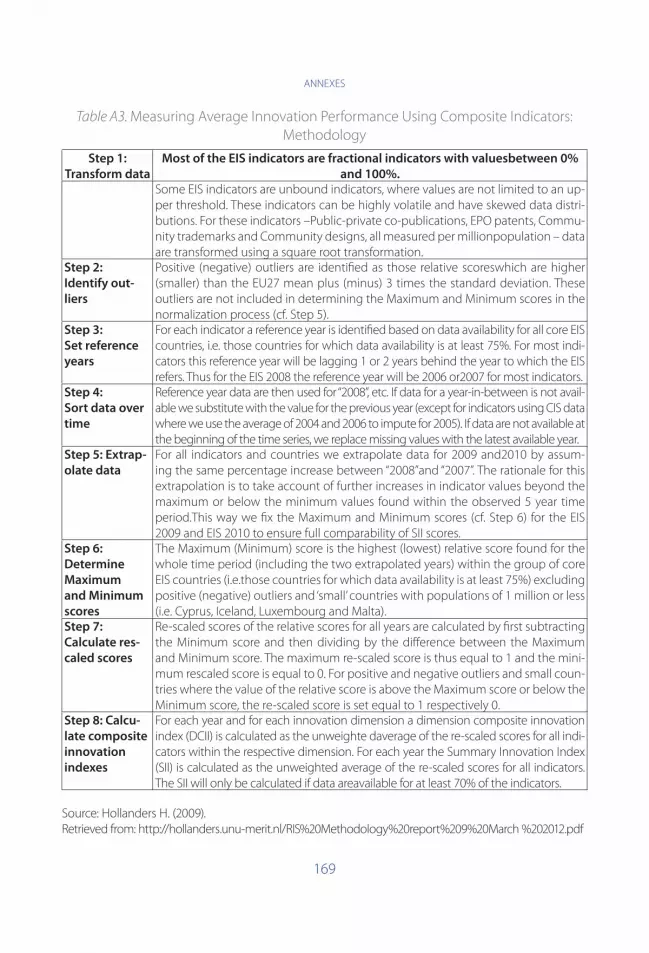
ANNEXES
169
Table A3. Measuring Average Innovation Performance Using Composite Indicators: Methodology
Step 1:
Transform data
Most of the EIS indicators are fractional indicators with valuesbetween 0%
and 100%.Some EIS indicators are unbound indicators, where values are not limited to an up-per threshold. These indicators can be highly volatile and have skewed data distri-butions. For these indicators –Public-private co-publications, EPO patents, Commu-nity trademarks and Community designs, all measured per millionpopulation – data are transformed using a square root transformation.
Step 2:
Identify out-
liers
Positive (negative) outliers are identified as those relative scoreswhich are higher (smaller) than the EU27 mean plus (minus) 3 times the standard deviation. These outliers are not included in determining the Maximum and Minimum scores in the normalization process (cf. Step 5).
Step 3:
Set reference
years
For each indicator a reference year is identified based on data availability for all core EIS countries, i.e. those countries for which data availability is at least 75%. For most indi-cators this reference year will be lagging 1 or 2 years behind the year to which the EIS refers. Thus for the EIS 2008 the reference year will be 2006 or2007 for most indicators.
Step 4:
Sort data over
time
Reference year data are then used for “2008”, etc. If data for a year-in-between is not avail-able we substitute with the value for the previous year (except for indicators using CIS data where we use the average of 2004 and 2006 to impute for 2005). If data are not available at the beginning of the time series, we replace missing values with the latest available year.
Step 5: Extrap-
olate data
For all indicators and countries we extrapolate data for 2009 and2010 by assum-ing the same percentage increase between “2008”and “2007”. The rationale for this extrapolation is to take account of further increases in indicator values beyond the maximum or below the minimum values found within the observed 5 year time period.This way we fix the Maximum and Minimum scores (cf. Step 6) for the EIS 2009 and EIS 2010 to ensure full comparability of SII scores.
Step 6:
Determine
Maximum
and Minimum
scores
The Maximum (Minimum) score is the highest (lowest) relative score found for the whole time period (including the two extrapolated years) within the group of core EIS countries (i.e.those countries for which data availability is at least 75%) excluding positive (negative) outliers and ‘small’ countries with populations of 1 million or less (i.e. Cyprus, Iceland, Luxembourg and Malta).
Step 7:
Calculate res-
caled scores
Re-scaled scores of the relative scores for all years are calculated by first subtracting the Minimum score and then dividing by the difference between the Maximum and Minimum score. The maximum re-scaled score is thus equal to 1 and the mini-mum rescaled score is equal to 0. For positive and negative outliers and small coun-tries where the value of the relative score is above the Maximum score or below the Minimum score, the re-scaled score is set equal to 1 respectively 0.
Step 8: Calcu-
late composite
innovation
indexes
For each year and for each innovation dimension a dimension composite innovation index (DCII) is calculated as the unweighte daverage of the re-scaled scores for all indi-cators within the respective dimension. For each year the Summary Innovation Index (SII) is calculated as the unweighted average of the re-scaled scores for all indicators. The SII will only be calculated if data areavailable for at least 70% of the indicators.
Source: Hollanders H. (2009).Retrieved from: http://hollanders.unu-merit.nl/RIS%20Methodology%20report%209%20March %202012.pdf
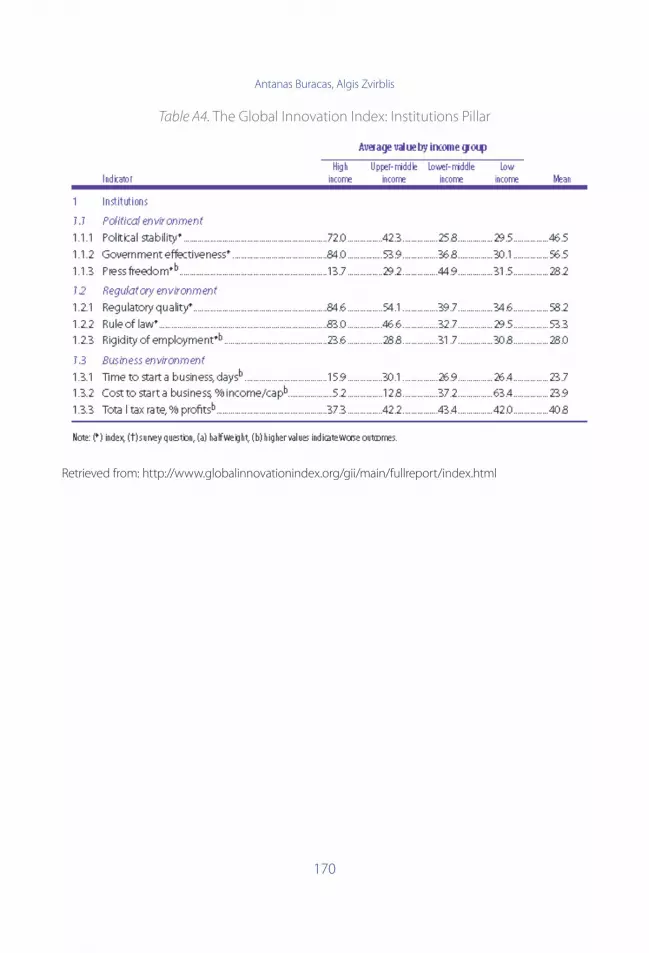
Antanas Buracas, Algis Zvirblis
170
Table A4. The Global Innovation Index: Institutions Pillar
Retrieved from: http://www.globalinnovationindex.org/gii/main/fullreport/index.html
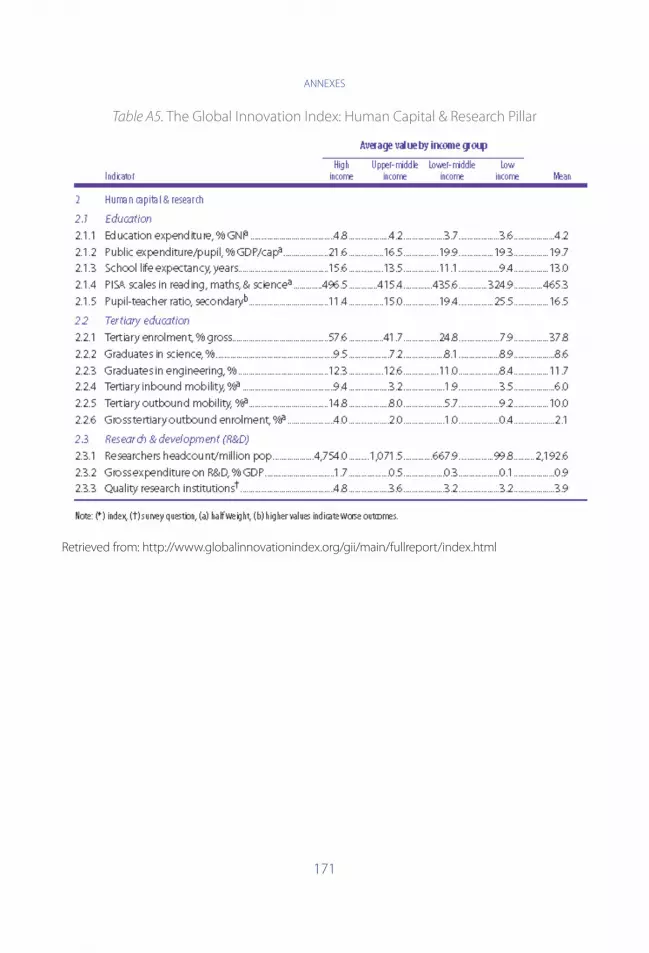
ANNEXES
171
Table A5. The Global Innovation Index: Human Capital & Research Pillar
Retrieved from: http://www.globalinnovationindex.org/gii/main/fullreport/index.html
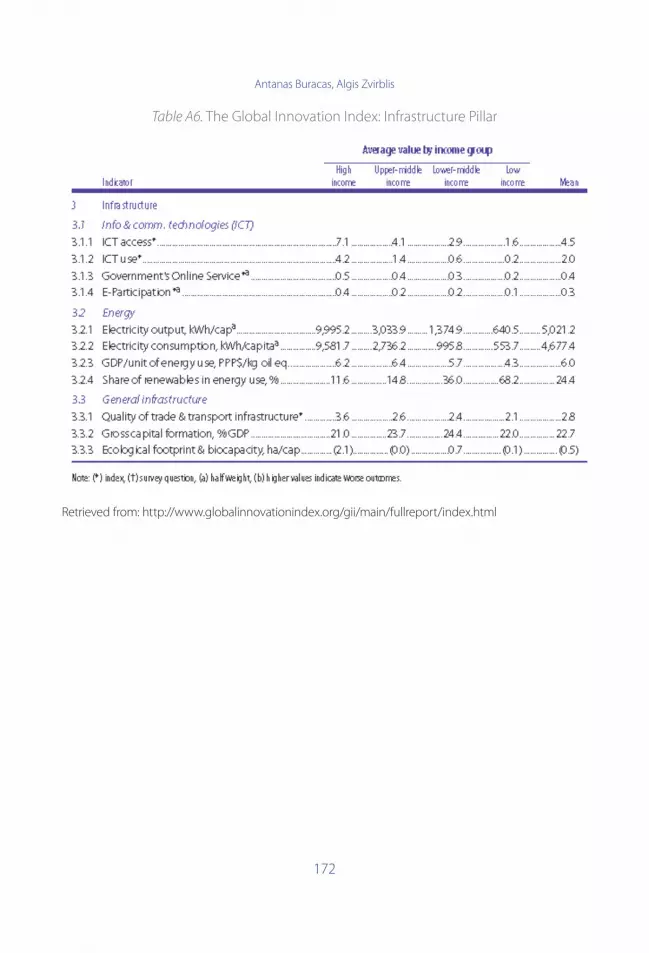
Antanas Buracas, Algis Zvirblis
172
Table A6. The Global Innovation Index: Infrastructure Pillar
Retrieved from: http://www.globalinnovationindex.org/gii/main/fullreport/index.html

ANNEXES
173
Table A7. The Global Innovation Index: Market Sophistication Pillar
Retrieved from: http://www.globalinnovationindex.org/gii/main/fullreport/index.html
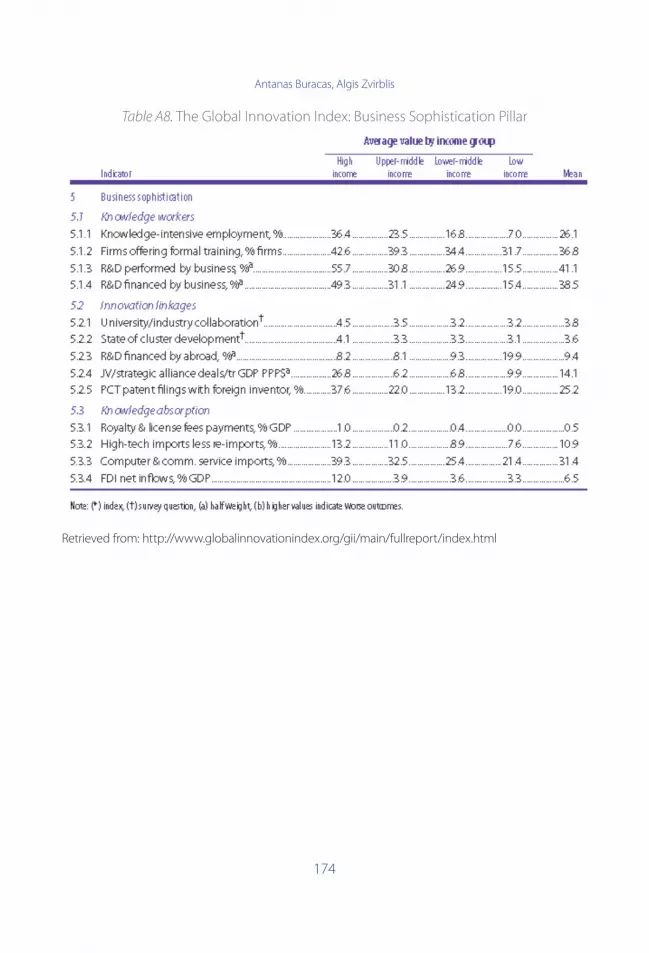
Antanas Buracas, Algis Zvirblis
174
Table A8. The Global Innovation Index: Business Sophistication Pillar
Retrieved from: http://www.globalinnovationindex.org/gii/main/fullreport/index.html
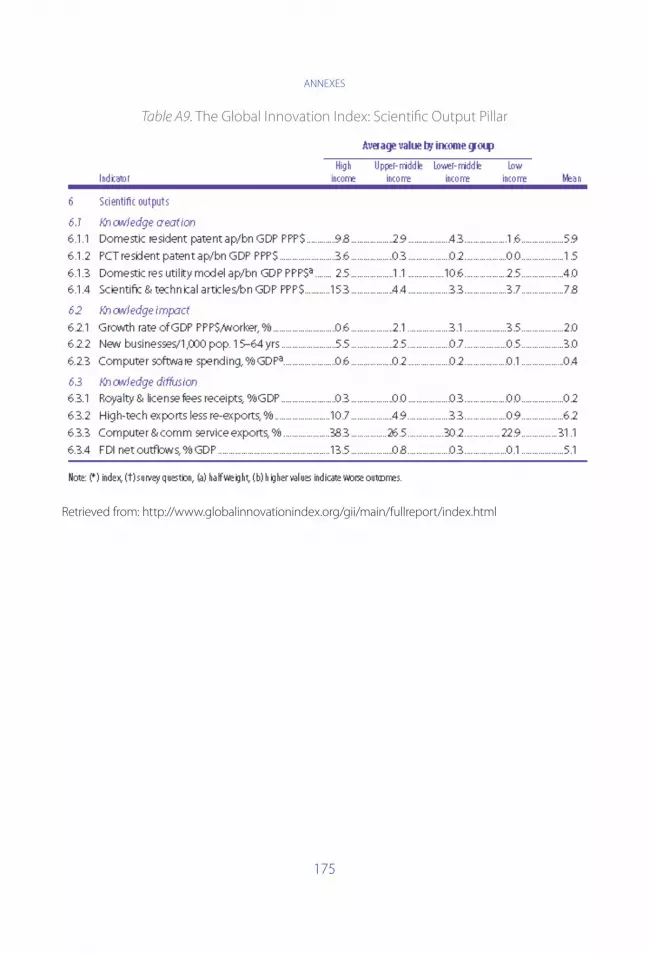
ANNEXES
175
Table A9. The Global Innovation Index: Scientific Output Pillar
Retrieved from: http://www.globalinnovationindex.org/gii/main/fullreport/index.html
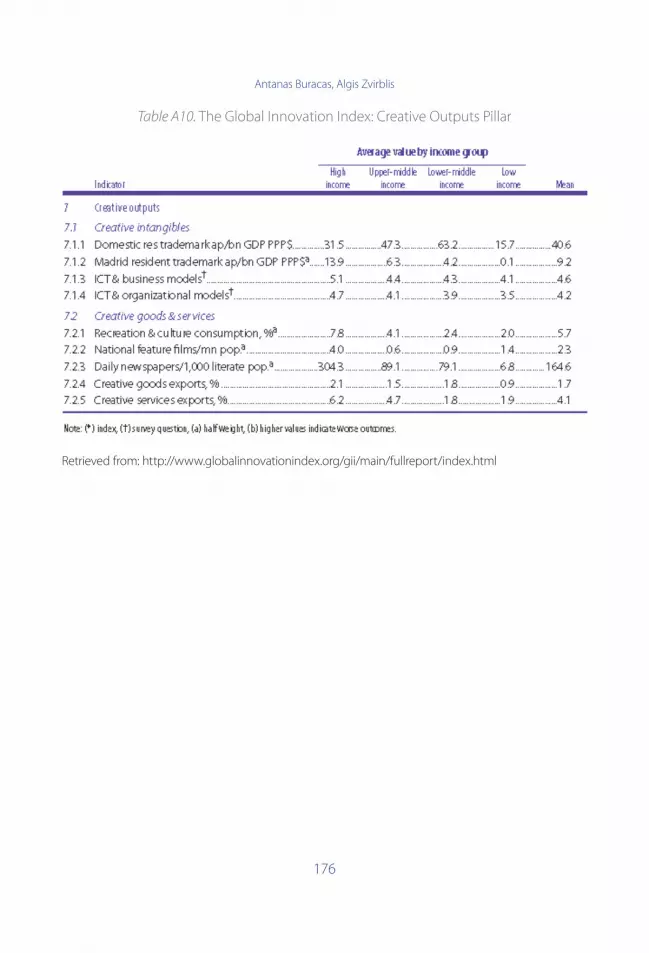
Antanas Buracas, Algis Zvirblis
176
Table A10. The Global Innovation Index: Creative Outputs Pillar
Retrieved from: http://www.globalinnovationindex.org/gii/main/fullreport/index.html
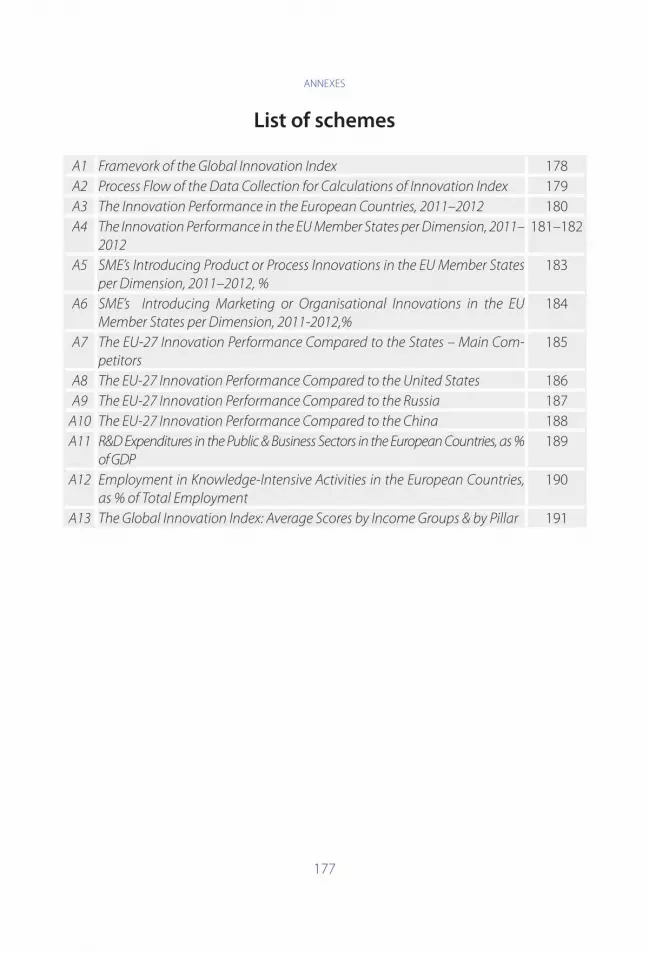
ANNEXES
177
List of schemes
A1 Framevork of the Global Innovation Index 178A2 Process Flow of the Data Collection for Calculations of Innovation Index 179A3 The Innovation Performance in the European Countries, 2011–2012 180A4 The Innovation Performance in the EU Member States per Dimension, 2011–
2012
181–182
A5 SME’s Introducing Product or Process Innovations in the EU Member States
per Dimension, 2011–2012, %
183
A6 SME’s Introducing Marketing or Organisational Innovations in the EU
Member States per Dimension, 2011-2012,%
184
A7 The EU-27 Innovation Performance Compared to the States – Main Com-
petitors
185
A8 The EU-27 Innovation Performance Compared to the United States 186A9 The EU-27 Innovation Performance Compared to the Russia 187
A10 The EU-27 Innovation Performance Compared to the China 188A11 R&D Expenditures in the Public & Business Sectors in the European Countries, as %
of GDP
189
A12 Employment in Knowledge-Intensive Activities in the European Countries,
as % of Total Employment
190
A13 The Global Innovation Index: Average Scores by Income Groups & by Pillar 191
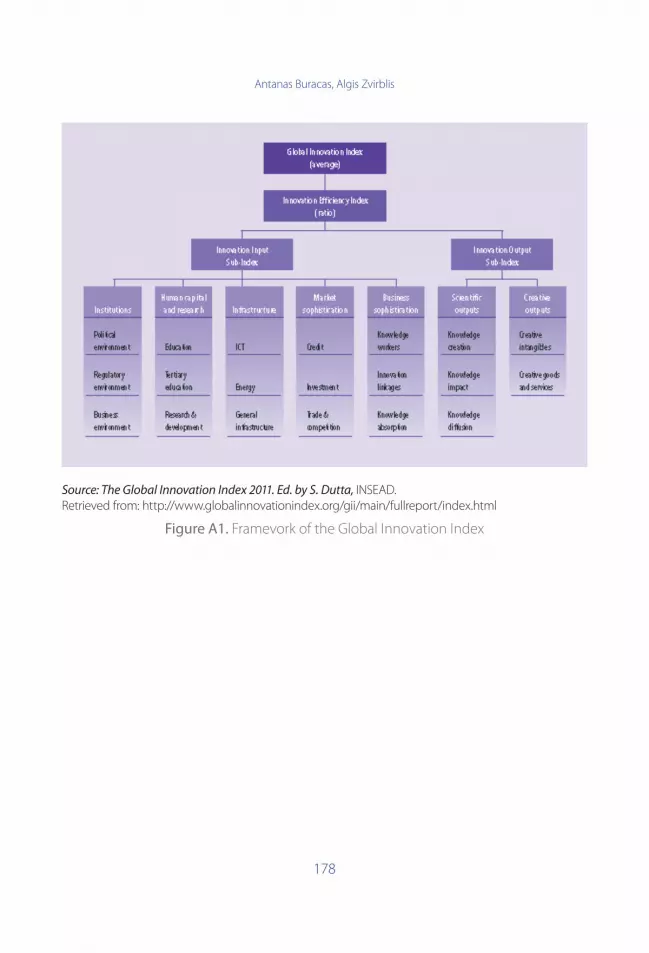
Antanas Buracas, Algis Zvirblis
178
Source: The Global Innovation Index 2011. Ed. by S. Dutta, INSEAD. Retrieved from: http://www.globalinnovationindex.org/gii/main/fullreport/index.html
Figure A1. Framevork of the Global Innovation Index
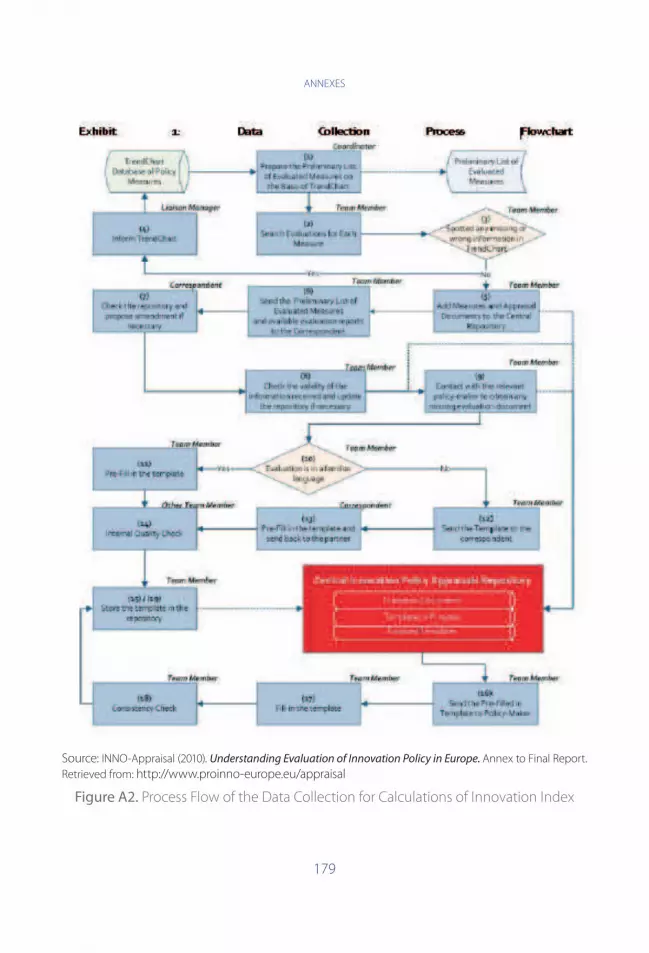
ANNEXES
179
Source: INNO-Appraisal (2010). Understanding Evaluation of Innovation Policy in Europe. Annex to Final Report. Retrieved from: http://www.proinno-europe.eu/appraisal
Figure A2. Process Flow of the Data Collection for Calculations of Innovation Index

Antanas Buracas, Algis Zvirblis
180
Source: European Commission. Industrial Innovation.Note: Average performance is measured using a composite indicator building on data for 24 indicators going from a lowest possible performance of 0 to a maximum possible performance of 1. Average per-formance in 2010 reflects performance in 2008/2009 due to a lag in data availability.Retrieved from:http://www.proinno-europe.eu/inno-metrics/page/41-comparison-eu-rest-europe
Figure A3. The Innovation Performance in the EuropeanCountries, 2011–2012
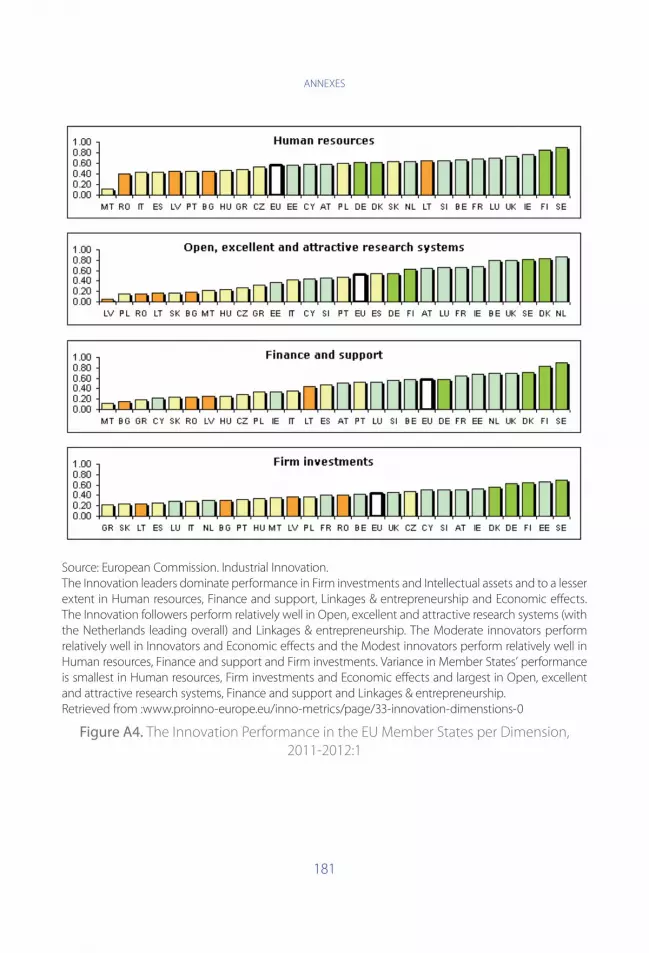
ANNEXES
181
Source: European Commission. Industrial Innovation.The Innovation leaders dominate performance in Firm investments and Intellectual assets and to a lesser extent in Human resources, Finance and support, Linkages & entrepreneurship and Economic effects. The Innovation followers perform relatively well in Open, excellent and attractive research systems (with the Netherlands leading overall) and Linkages & entrepreneurship. The Moderate innovators perform relatively well in Innovators and Economic effects and the Modest innovators perform relatively well in Human resources, Finance and support and Firm investments. Variance in Member States’ performance is smallest in Human resources, Firm investments and Economic effects and largest in Open, excellent and attractive research systems, Finance and support and Linkages & entrepreneurship.Retrieved from :www.proinno-europe.eu/inno-metrics/page/33-innovation-dimenstions-0
Figure A4. The Innovation Performance in the EU Member States per Dimension, 2011-2012:1
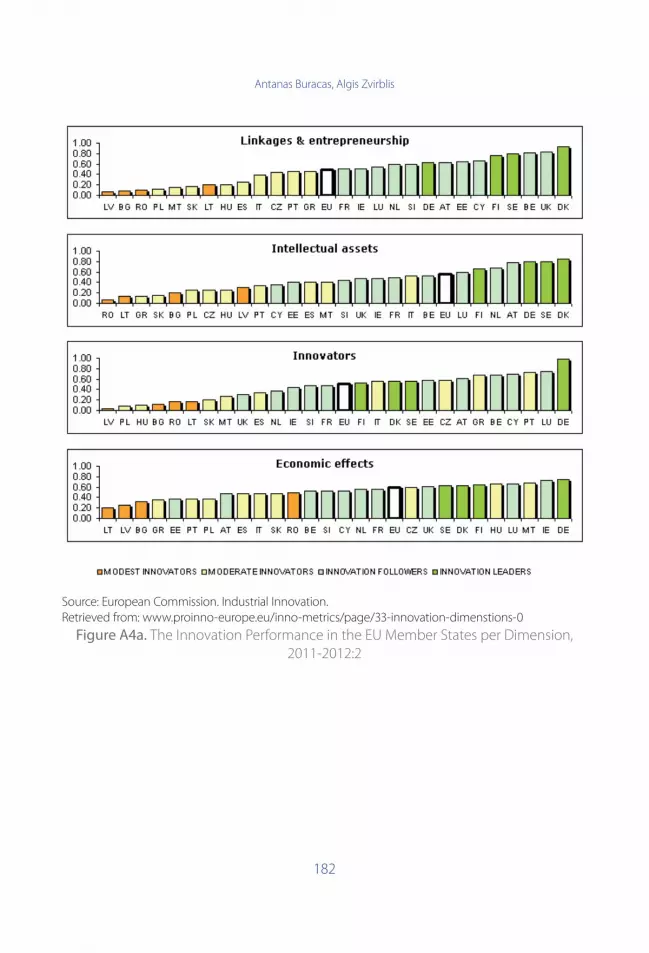
Antanas Buracas, Algis Zvirblis
182
Source: European Commission. Industrial Innovation.Retrieved from: www.proinno-europe.eu/inno-metrics/page/33-innovation-dimenstions-0
Figure A4a. The Innovation Performance in the EU Member States per Dimension, 2011-2012:2
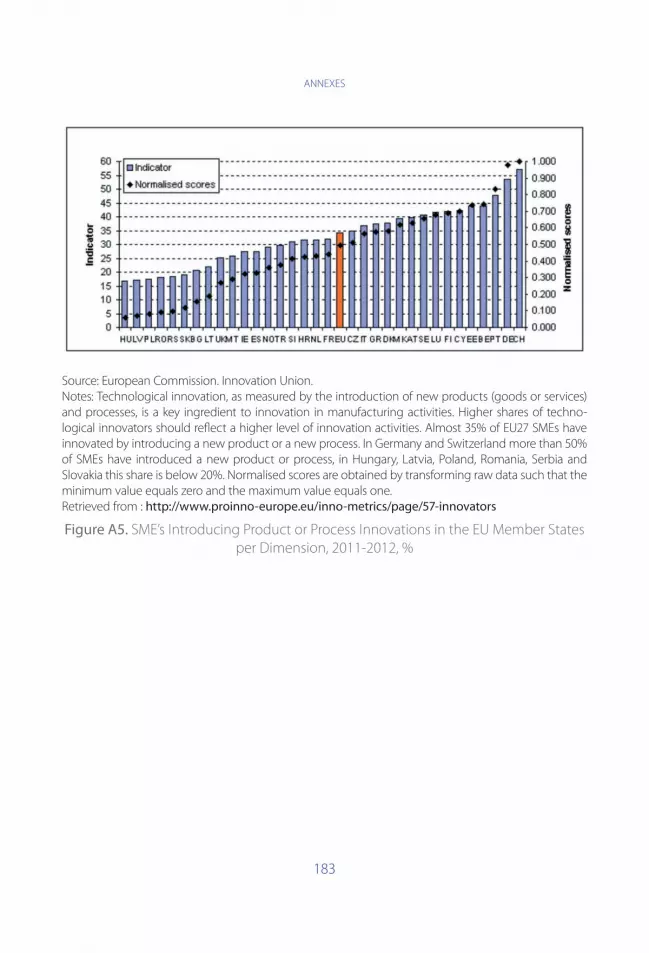
ANNEXES
183
Source: European Commission. Innovation Union.Notes: Technological innovation, as measured by the introduction of new products (goods or services) and processes, is a key ingredient to innovation in manufacturing activities. Higher shares of techno-logical innovators should reflect a higher level of innovation activities. Almost 35% of EU27 SMEs have innovated by introducing a new product or a new process. In Germany and Switzerland more than 50% of SMEs have introduced a new product or process, in Hungary, Latvia, Poland, Romania, Serbia and Slovakia this share is below 20%. Normalised scores are obtained by transforming raw data such that the minimum value equals zero and the maximum value equals one.Retrieved from : http://www.proinno-europe.eu/inno-metrics/page/57-innovators
Figure A5. SME’s Introducing Product or Process Innovations in the EU Member States per Dimension, 2011-2012, %
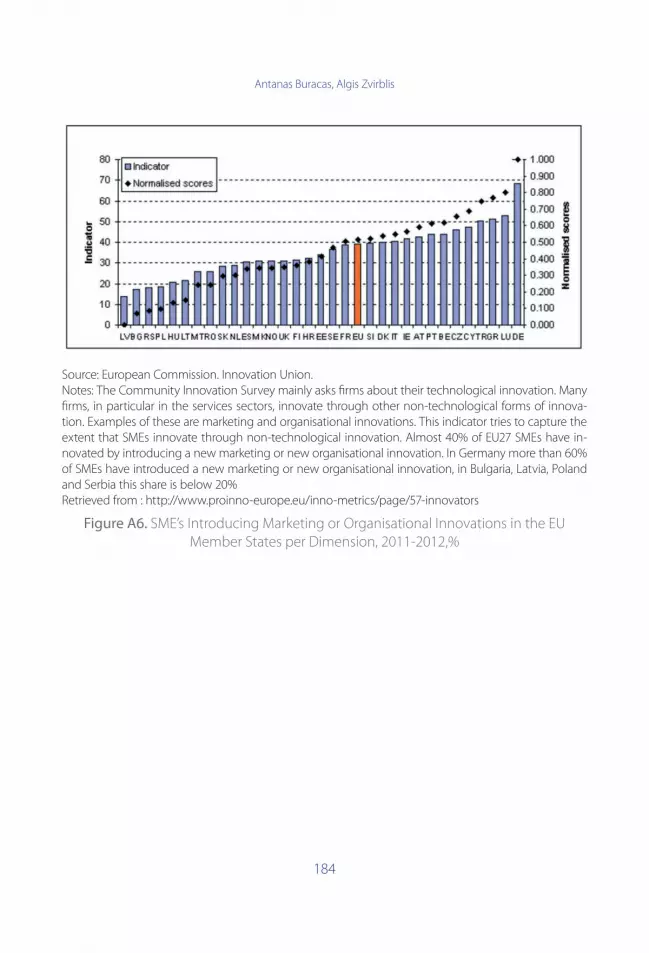
Antanas Buracas, Algis Zvirblis
184
Source: European Commission. Innovation Union.Notes: The Community Innovation Survey mainly asks firms about their technological innovation. Many firms, in particular in the services sectors, innovate through other non-technological forms of innova-tion. Examples of these are marketing and organisational innovations. This indicator tries to capture the extent that SMEs innovate through non-technological innovation. Almost 40% of EU27 SMEs have in-novated by introducing a new marketing or new organisational innovation. In Germany more than 60% of SMEs have introduced a new marketing or new organisational innovation, in Bulgaria, Latvia, Poland and Serbia this share is below 20%Retrieved from : http://www.proinno-europe.eu/inno-metrics/page/57-innovators
Figure A6. SME’s Introducing Marketing or Organisational Innovations in the EU Member States per Dimension, 2011-2012,%
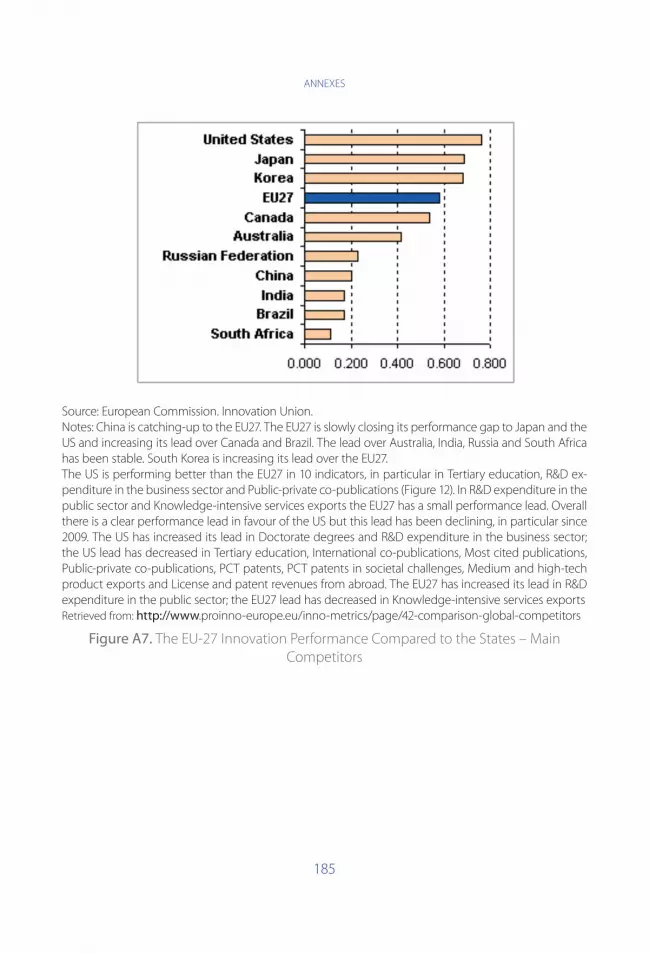
ANNEXES
185
Source: European Commission. Innovation Union.Notes: China is catching-up to the EU27. The EU27 is slowly closing its performance gap to Japan and the US and increasing its lead over Canada and Brazil. The lead over Australia, India, Russia and South Africa has been stable. South Korea is increasing its lead over the EU27.The US is performing better than the EU27 in 10 indicators, in particular in Tertiary education, R&D ex-penditure in the business sector and Public-private co-publications (Figure 12). In R&D expenditure in the public sector and Knowledge-intensive services exports the EU27 has a small performance lead. Overall there is a clear performance lead in favour of the US but this lead has been declining, in particular since 2009. The US has increased its lead in Doctorate degrees and R&D expenditure in the business sector; the US lead has decreased in Tertiary education, International co-publications, Most cited publications, Public-private co-publications, PCT patents, PCT patents in societal challenges, Medium and high-tech product exports and License and patent revenues from abroad. The EU27 has increased its lead in R&D expenditure in the public sector; the EU27 lead has decreased in Knowledge-intensive services exportsRetrieved from: http://www.proinno-europe.eu/inno-metrics/page/42-comparison-global-competitors
Figure A7. The EU-27 Innovation Performance Compared to the States – Main Competitors
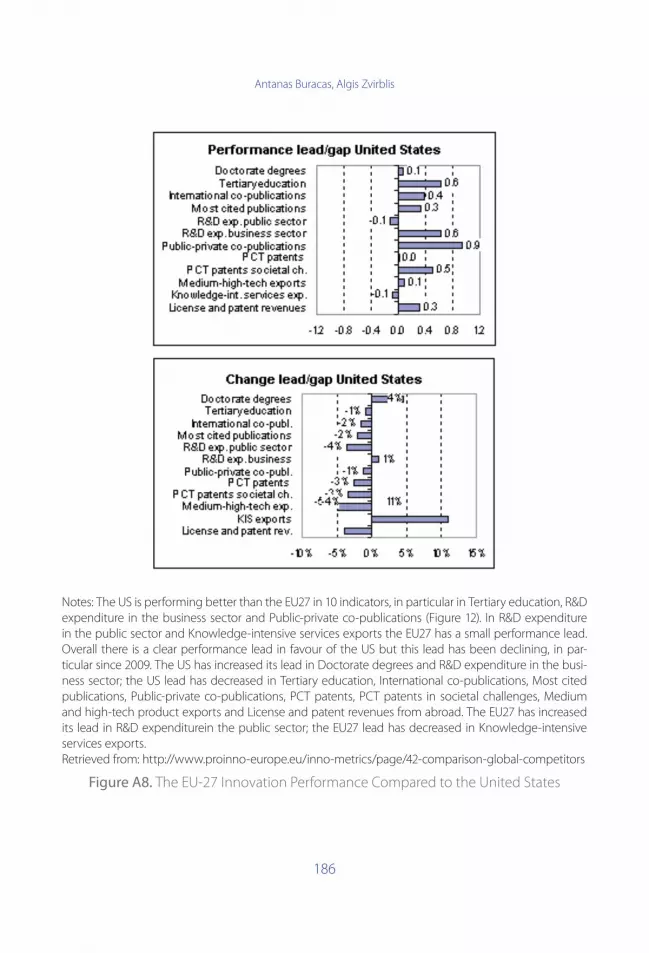
Antanas Buracas, Algis Zvirblis
186
Notes: The US is performing better than the EU27 in 10 indicators, in particular in Tertiary education, R&D expenditure in the business sector and Public-private co-publications (Figure 12). In R&D expenditure in the public sector and Knowledge-intensive services exports the EU27 has a small performance lead. Overall there is a clear performance lead in favour of the US but this lead has been declining, in par-ticular since 2009. The US has increased its lead in Doctorate degrees and R&D expenditure in the busi-ness sector; the US lead has decreased in Tertiary education, International co-publications, Most cited publications, Public-private co-publications, PCT patents, PCT patents in societal challenges, Medium and high-tech product exports and License and patent revenues from abroad. The EU27 has increased its lead in R&D expenditurein the public sector; the EU27 lead has decreased in Knowledge-intensive services exports.Retrieved from: http://www.proinno-europe.eu/inno-metrics/page/42-comparison-global-competitors
Figure A8. The EU-27 Innovation Performance Compared to the United States

ANNEXES
187
Notes: The EU27 has a clear performance lead compared to all five BRICS countries. This lead has decreased with China, remained stable with India, Russia and South Africa and has increased with Brazil. The EU27 is perform-ing better than Russia in most indicators. Only in Tertiary education Russia is performing much better. Russia is lagging most in Public-private co-publications, PCT patent applications, PCT patent applications in societal chal-lenges and License and patent revenues from abroad. Russia’s lead in Tertiary education has decreased. Russia has decreased its gap in R&D expenditure in the public sector and License and patent revenues from abroad; Russia’s gap has increased for International co-publications, Most cited publications, Public-private co-publica-tions, PCT patents and Knowledge-intensive services exports.A country has a performance lead if the relative score for the indicator is below 0 and a performance lead in the relative score is above 0. The EU27 has a performance lead if the relative score for the indicator is below 0 and a performance lead if the relative score is above 0. Relative annual growth as compared to that of the EU27 over a 5-year period.Retrieved from: http://www.proinno-europe.eu/inno-metrics/page/42-comparison-global-competitors
Figure A9. The EU-27 Innovation Performance Compared to the Russia
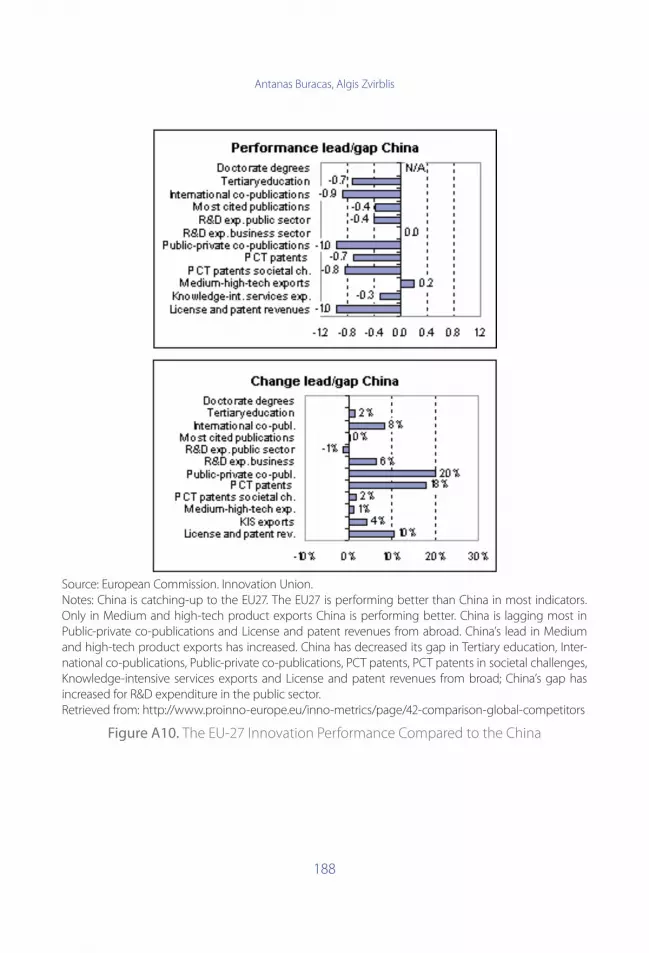
Antanas Buracas, Algis Zvirblis
188
Source: European Commission. Innovation Union.Notes: China is catching-up to the EU27. The EU27 is performing better than China in most indicators. Only in Medium and high-tech product exports China is performing better. China is lagging most in Public-private co-publications and License and patent revenues from abroad. China’s lead in Medium and high-tech product exports has increased. China has decreased its gap in Tertiary education, Inter-national co-publications, Public-private co-publications, PCT patents, PCT patents in societal challenges, Knowledge-intensive services exports and License and patent revenues from broad; China’s gap has increased for R&D expenditure in the public sector.Retrieved from: http://www.proinno-europe.eu/inno-metrics/page/42-comparison-global-competitors
Figure A10. The EU-27 Innovation Performance Compared to the China
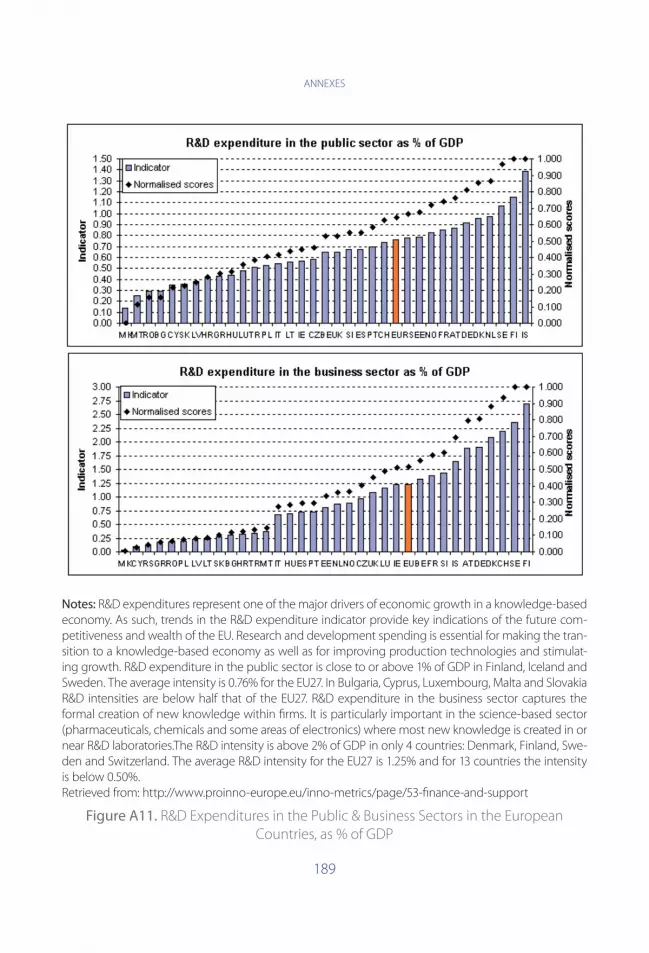
ANNEXES
189
Notes: R&D expenditures represent one of the major drivers of economic growth in a knowledge-based economy. As such, trends in the R&D expenditure indicator provide key indications of the future com-petitiveness and wealth of the EU. Research and development spending is essential for making the tran-sition to a knowledge-based economy as well as for improving production technologies and stimulat-ing growth. R&D expenditure in the public sector is close to or above 1% of GDP in Finland, Iceland and Sweden. The average intensity is 0.76% for the EU27. In Bulgaria, Cyprus, Luxembourg, Malta and Slovakia R&D intensities are below half that of the EU27. R&D expenditure in the business sector captures the formal creation of new knowledge within firms. It is particularly important in the science-based sector (pharmaceuticals, chemicals and some areas of electronics) where most new knowledge is created in or near R&D laboratories.The R&D intensity is above 2% of GDP in only 4 countries: Denmark, Finland, Swe-den and Switzerland. The average R&D intensity for the EU27 is 1.25% and for 13 countries the intensity is below 0.50%.Retrieved from: http://www.proinno-europe.eu/inno-metrics/page/53-finance-and-support
Figure A11. R&D Expenditures in the Public & Business Sectors in the European Countries, as % of GDP
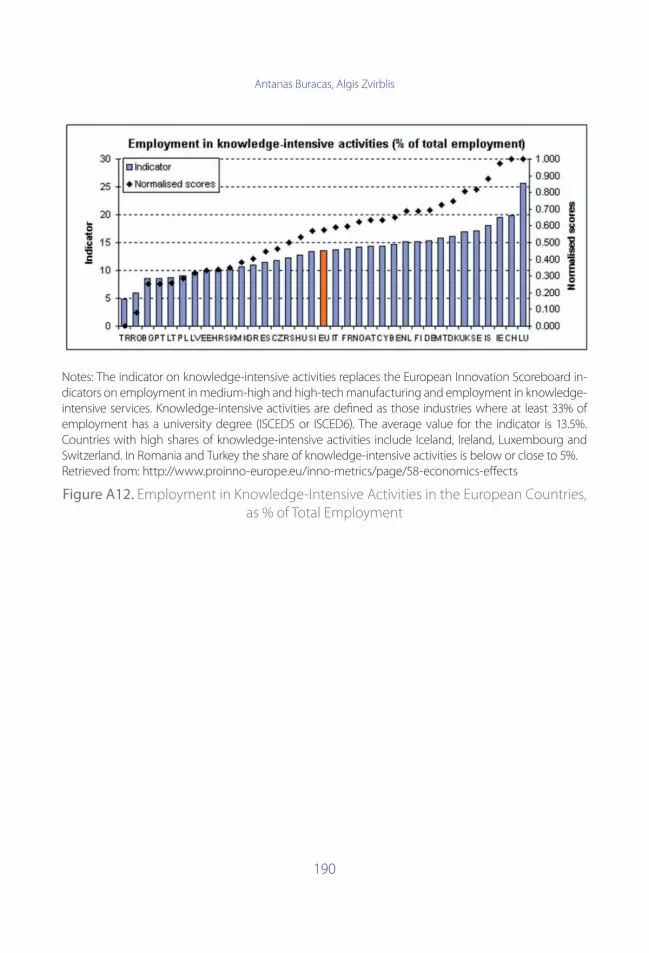
Antanas Buracas, Algis Zvirblis
190
Notes: The indicator on knowledge-intensive activities replaces the European Innovation Scoreboard in-dicators on employment in medium-high and high-tech manufacturing and employment in knowledge-intensive services. Knowledge-intensive activities are defined as those industries where at least 33% of employment has a university degree (ISCED5 or ISCED6). The average value for the indicator is 13.5%. Countries with high shares of knowledge-intensive activities include Iceland, Ireland, Luxembourg and Switzerland. In Romania and Turkey the share of knowledge-intensive activities is below or close to 5%.Retrieved from: http://www.proinno-europe.eu/inno-metrics/page/58-economics-effects
Figure A12. Employment in Knowledge-Intensive Activities in the European Countries, as % of Total Employment
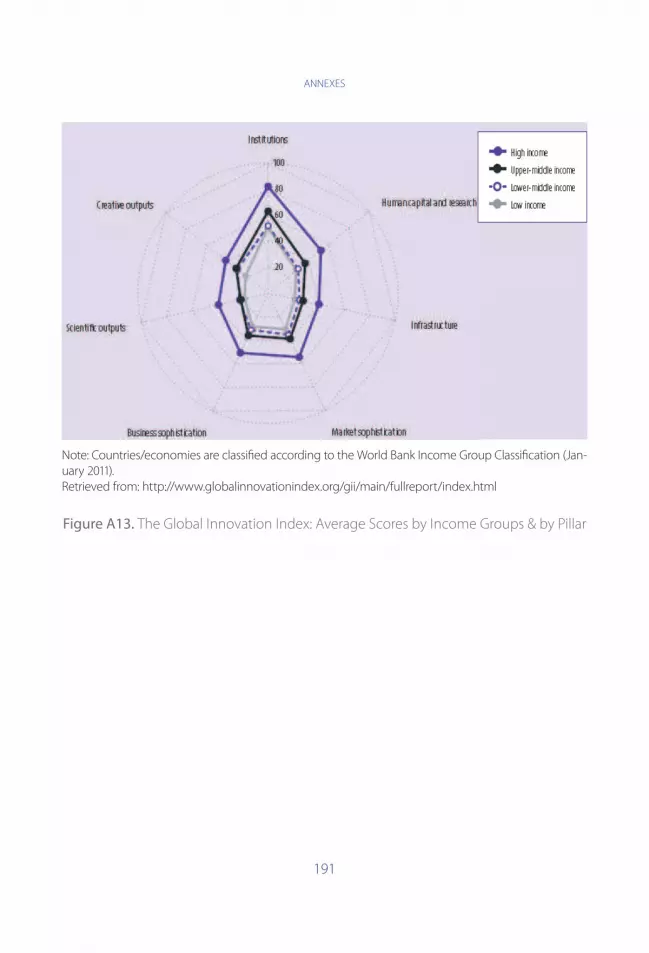
ANNEXES
191
Note: Countries/economies are classified according to the World Bank Income Group Classification (Jan-uary 2011).Retrieved from: http://www.globalinnovationindex.org/gii/main/fullreport/index.html
Figure A13. The Global Innovation Index: Average Scores by Income Groups & by Pillar

Antanas Buracas, Algis Zvirblis
192
METAECONOMICS APPROACH & INTELLECTUAL RESOURCES EVALUATION
Antanas Buracas, Ilídio Tomás Lopes, Algis Zvirblis
LAMBERT Academic Publishing GmbH & Co, 2012. (Nr. 55389)
ISBN: 978-3-659-14196-6
ANNOTATION
The study concerns the complex assessment framework of the country’s intellectual resources (IR)
based on modern metaeconomic paradigm and multiple criteria evaluation methods. The metaeco-
nomics specifies the interconnections between economic axiomatics& system of principles and methods
to be applied in its substantiation. The WB a/o expert evaluations of the essential country’s IR indicators
and rating results are critically analyzed comparing Baltic States and Nordic countries. Multiple criteria
decision making system under review integrated Simple Additive Weighting, COmplex PRoportional AS-
sessment, Multi Objective Optimization on basis of Ratio Analysis a/o modern methods integrated& ap-
plied withSWOT and qualitative analysis. Thereasoning principles of alternativestrategic decisionsand
models,in particular, applicable for detection of compatibility between the IR advancement strategy, on
the one side, and the country’seconomic developmentpriorities, also determinantsof economic competi-
tiveness andnationalopportunities fortheir(IR)development, on the other side, were created.


Buy your books fast and straightforward online - at one of world’s
fastest growing online book stores! Environmentally sound due to
Print-on-Demand technologies.
Buy your books online at
www.get-morebooks.com
Kaufen Sie Ihre Bücher schnell und unkompliziert online – auf einer
der am schnellsten wachsenden Buchhandelsplattformen weltweit!
Dank Print-On-Demand umwelt- und ressourcenschonend produzi-
ert.
Bücher schneller online kaufen
www.morebooks.deVDM Verlagsservicegesellschaft mbH
Heinrich-Böcking-Str. 6-8 Telefon: +49 681 3720 174 [email protected] - 66121 Saarbrücken Telefax: +49 681 3720 1749 www.vdm-vsg.de
