meta-analysis of phosphorus balance data from growing pigs
TRANSCRIPT
France M. Schulin-Zeuthen, E. Kebreab, W. J. J. Gerrits, S. Lopez, M. Z. Fan, R. S. Dias and J.
Meta-analysis of phosphorus balance data from growing pigs
published online Apr 27, 2007; J Anim Sci
http://jas.fass.orgthe World Wide Web at:
The online version of this article, along with updated information and services, is located on
www.asas.org
by on May 14, 2011. jas.fass.orgDownloaded from
Meta-analysis of P balance data 1
2
Meta-analysis of phosphorus balance data from growing pigs 3
4
M. Schulin-Zeuthen,* E. Kebreab,*1 W. J. J. Gerrits,† S. Lopez,‡ M. Z. Fan,* R. S. Dias,* 5
and J. France* 6
7
*Centre for Nutrition Modelling, Department of Animal and Poultry Science, University of 8
Guelph, ON, N1G 2W1, Canada; †Animal Nutrition Group, Wageningen Institute of Animal 9
Sciences, Wageningen University, 6709 PG Wageningen, The Netherlands; ‡Departamento de 10
Produccion Animal, Universidad de León, 24071 Leon, Spain 11
12
13
14
15
16
_______________ 17
1Corresponding author: [email protected] 18
Page 1 of 31 Journal of Animal Science
Published Online First on April 27, 2007 as doi:10.2527/jas.2006-715 by on May 14, 2011. jas.fass.orgDownloaded from
2
ABSTRACT: Many studies have highlighted concerns over current methods of determining 19
endogenous phosphorus (P) losses and P requirements in growing pigs. Therefore, a database 20
containing observations on 350 pigs was assembled from various studies. Four functions for 21
analyzing P balance data were considered: straight line, a diminishing returns function 22
(monomolecular), a sigmoidal function with a fixed point of inflection (Gompertz), and a 23
sigmoidal function with a flexible point of inflection (Richards). The nonlinear functions were 24
specifically re-parameterized to assign biological meaning to parameters. Meta-analysis of the 25
data was conducted to estimate endogenous P excretion, maintenance requirement and efficiency 26
of utilization. Phosphorus retention was regressed against either available P intake or total P 27
intake (all variables scaled by metabolic BW (BW0.75)). There was evidence of nonlinearity in the 28
data and the monomolecular provided the best fit of the data. The Richards function did not fit 29
the data well and appeared over-parameterized. Estimates of endogenous P excretion of 14 and 30
17 mg/(kg BW0.75⋅ d) based on available and total P analysis, respectively, were predicted by the 31
monomolecular, which were within the range reported in the literature. Maintenance requirement 32
values of 15 mg available P/(kg BW0.75⋅ d) and 37 mg total P/(kg BW0.75⋅ d) were obtained, based 33
on the monomolecular function. Average efficiencies of conversion of dietary P to retained P 34
were 65 and 36% for available and total P, respectively, with greater efficiency values calculated 35
for low P intakes. Although the monomolecular fitted the data best, more observations at high P 36
intakes/kg BW0.75 are required to determine conclusively whether P retention scaled by metabolic 37
BW is linearly related to available or total P intake. 38
39
Key words: endogenous P excretion, mathematical models, P balance, P maintenance 40
requirement, pigs 41
Page 2 of 31Journal of Animal Science
by on May 14, 2011. jas.fass.orgDownloaded from
3
42
INTRODUCTION 43
Phosphorus (P) is the third most expensive nutrient after carbohydrate and protein in swine 44
nutrition (Honeyman, 1993). In many countries, diets have been formulated traditionally to 45
maximize growth without any consideration given to the amount of P excreted. However, there 46
are economic and environmental reasons to reduce P excretion. The National Research Council 47
(1998) suggested that P rather than N will limit land application of manure in intensive swine 48
producing areas and the success of management strategies for reducing P excretion is dependent 49
on an accurate estimate of P requirements for a given level of performance (Ekpe et al., 2002). 50
Therefore, in recent years research has focused on improving efficiency of conversion of dietary 51
P into animal products and on accurate estimation of P requirement by the animal. 52
Availability of P in feed ingredients for pigs is commonly evaluated using digestibility 53
studies or the slope-ratio assay technique (Jongbloed et al., 1991). Digestibility studies estimate P 54
availability by measuring its digestive utilization; whereas, the slope-ratio assay provides a 55
combined estimate of digestive and post-absorptive utilization of P at the tissue level (Jongbloed 56
et al., 1991). Apparent digestibility values underestimate the true digestibility of P, therefore, true 57
P digestibility values were recommended by Fan et al. (2001). In digestibility studies, 58
determination of true P digestibility requires measurement of endogenous P excretion. Fan et al. 59
(2001) developed a linear regression analysis approach to determine true P digestibility and 60
endogenous P excretion that was subsequently applied to corn-based (Shen et al., 2002) and 61
soybean meal-based (Ajakaiye et al., 2003) diets for growing pigs. A concern with this method is 62
whether there is a linear relationship between endogenous P output and dietary P intake. 63
Furthermore, Moughan et al. (1998) stated that endogenous estimates are constrained by the 64
Page 3 of 31 Journal of Animal Science
by on May 14, 2011. jas.fass.orgDownloaded from
4
mathematical model fitted, which is accepted a priori, and estimated values tend to have high 65
standard errors. However, little attention has been given to nonlinear models. Biological 66
responses are rarely linear and at high doses, nonlinearity of regression is almost inevitable for 67
any kind of response (Finney, 1978). 68
The objectives of the present study were to collect data from P balance studies with 69
growing pigs, and to evaluate alternative mathematical functions to estimate biological 70
determinants of P utilization with attention to endogenous P excretion, maintenance requirement, 71
and efficiency of dietary P conversion into animal products. The null hypothesis was that the 72
relationship between retained P and dietary P is linear. 73
MATERIALS AND METHODS 74
The Database 75
A database containing P balance data for 350 pigs in 14 experiments was assembled from 76
the literature. The database contained information on diet, dietary P intake, BW, P retention, and 77
in some instances available P content. In the studies that reported available P content, the values 78
were based on NRC (1998) bioavailability values for corn-soybean meal diets. Therefore, in this 79
study available P values are based on NRC (1998) values for swine diets. For consistency and to 80
minimize the effect of different types of diets on P utilization, we have selected studies that used 81
diets based on corn and soybean meal. Table 1 shows details of diet composition for the trials 82
used to construct the database. The range of data included is summarized in Table 2. 83
The database contained information where available P intake (i.e., the amount of P intake 84
that is potentially available for absorption by the animal) was not given. Therefore, 3 analyses 85
were conducted using 2 datasets. Dataset 1 contained all the data (n = 350) and Dataset 2 was a 86
subset containing only data where available P was reported (n = 76). In the first and second 87
Page 4 of 31Journal of Animal Science
by on May 14, 2011. jas.fass.orgDownloaded from
5
analyses, a relationship between retained, and total and available P using Datasets 1 and 2, 88
respectively, was established. In the third analysis, Dataset 2 was used to determine a relationship 89
between available and total P intake (i.e., the total amount of P fed to the animals and includes 90
both potentially available and unavailable P), and the resultant availability coefficient using in 91
conjunction with Dataset 1 to estimate instantaneous efficiencies at various P intakes. 92
Various units are used to express the key parameters of P requirements in the literature. 93
Rodehutscord et al. (1998) showed that endogenous P excretion was related with BW but not 94
DMI, therefore, in this study, the analysis was conducted scaling daily P intake (total and 95
available) and P retention by metabolic BW [g/(kg BW0.75⋅ d)]. 96
Candidate Functions 97
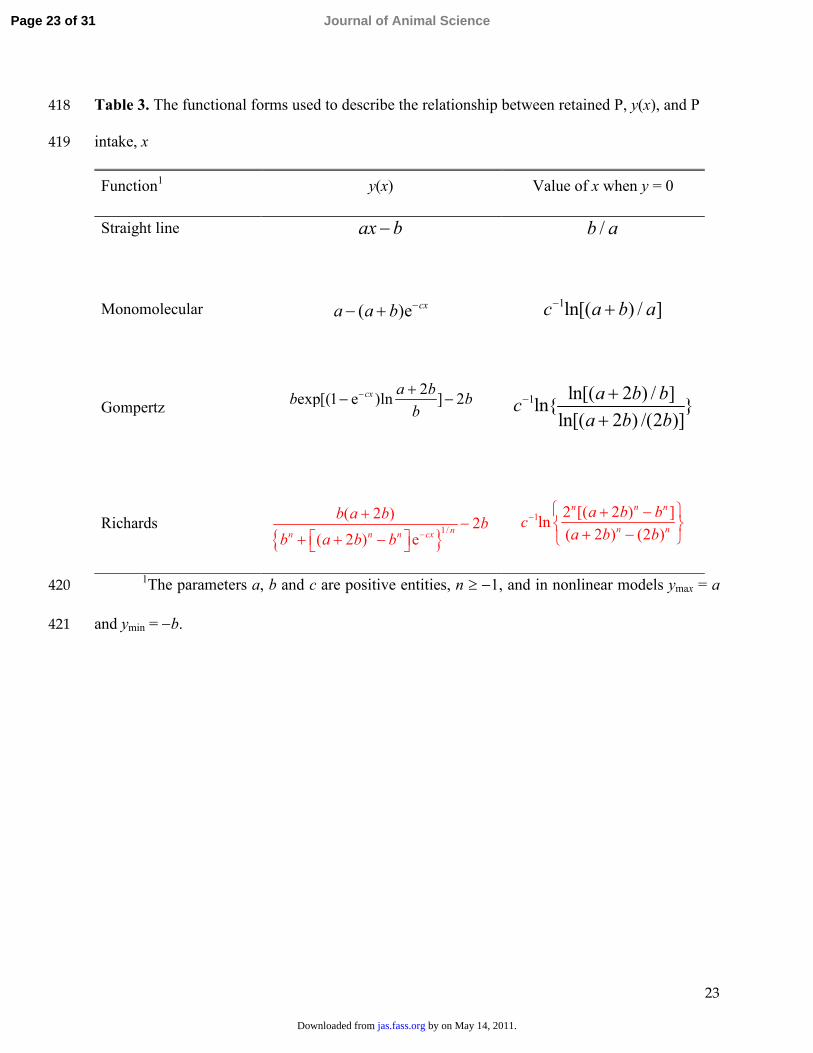
In addition to the traditional straight line analysis used for determining P requirements, 3 98
other candidate functions were evaluated (Table 3). These were a function exhibiting diminishing 99
returns behavior (monomolecular); a function exhibiting sigmoidal behavior with a fixed point of 100
inflection (Gompertz), and a sigmoidal function with a flexible point of inflection (Richards, 101
Table 3). The functions were specifically re-parameterized for balance study analysis so that the 102
parameters a, b, and c are positive entities, with ymax = a (upper asymptote) in the nonlinear 103
models, and -b is the y-intercept (value of f(x) when x = 0) in all functions including the linear 104
model (Kebreab et al., 2003). The Richards function has an extra parameter, n, which is a 105
constant that determines the shape of the response curve (Thornley and France, 2007). The P 106
requirement for maintenance was calculated by setting f(x) equal to zero and solving for x.107
Endogenous P excretion was estimated by the intercept on the y-axis. Figure 1 shows graphically 108
the calculations of key parameters using the monomolecular equation, which are discussed 109
further below. 110
Page 5 of 31 Journal of Animal Science
by on May 14, 2011. jas.fass.orgDownloaded from
6
Comparison of candidate functions (discussed below, Table 3) suggested the 111
monomolecular was a good descriptor of the relationship between P retention (R) and available P 112
intake (Ia). For example: 113
( )e acIR a a b −= − + , [1] 114
where a is theoretical maximum P retention, b is endogenous P excretion and c is a shape 115
parameter. The instantaneous efficiency of conversion (kg) of available P to retained P at any 116
given Ia is then: 117
d ( ) edacI
ga
Rk a b cI−= = + [2] 118
Available P intake at maintenance can be calculated by putting R = 0 in Eq. [1] and re-arranging. 119
The corresponding relationship between retained P and total P intake and the instantaneous 120
efficiency dR/dIt are also given by equation forms [1] and [2], respectively. 121
The relationship between total P and available P intake was tested using the linear 122
relationship: 123
a tI Iα β= + , [3] 124
where α is the intercept and β is the slope (i.e. P availability coefficient). The MIXED procedure 125
(SAS, Inst., Inc., Cary, NC) was used for regression to take account of the random effect of 126
experiments. Equation [2] may be written: 127
d d dd d d
tg
a t a
R R Ik I I I= = × 128
From Eq. [3]: 129
dd
a
t
II β=130
Page 6 of 31Journal of Animal Science
by on May 14, 2011. jas.fass.orgDownloaded from
7
1dd
t
a
II β −∴ = ,131
thus, as an alternative to direct calculation, instantaneous efficiency of utilization of available P 132
intake can be calculated indirectly by multiplying the instantaneous efficiency of utilization of 133
total P intake by the factor 1/β.134
The average efficiency of conversion of available or total P to retained P ( k ) between 2 135
intakes (I and I + ∆I, Figure 1) was calculated according to Darmani Kuhi et al. (2003): 136
Rk I∆= ∆137
Statistical Analyses 138
The database contained information collected from several experiments, and in some 139
instances multiple observations were made on the same pig at different periods. Therefore, a 140
meta-analytical approach was used for data analysis. Trial was coded as a random effect (because 141
the experiments represent a random sample of a larger population) and random effects of pigs and 142
period within experiments were added to the model. Pig breed/genotype, sex, and year of study 143
were added into the model as fixed effect variables. Pig breed/genotype and year of study were 144
not significant in the model but sex was marginally significant so it was left in the model. The 145
MIXED (for linear) and NLMIXED (for nonlinear functions) procedures of SAS were used for 146
analysis (Littell et al., 1996; St-Pierre, 2001). 147
Distribution of random effects was assumed to be normal and the dual quasi-Newton 148
technique was used for optimization with adaptive Gaussian quadrature as the integration 149
method. Performance of the models was evaluated using significance level of the parameters 150
estimated, variance of error estimate and its approximate standard error. Comparison of functions 151
was made using Bayesian Information Criterion (BIC), which are model order selection criteria 152
Page 7 of 31 Journal of Animal Science
by on May 14, 2011. jas.fass.orgDownloaded from
8
based on parsimony and impose a penalty on more complicated models for inclusion of 153
additional parameters. The BIC combines the maximum likelihood (data fitting) and the choice of 154
model by penalizing the (log) maximum likelihood with a term related to model complexity as 155
follows: 156
BIC = −2 log(Ĵ) + Klog (N), 157
where Ĵ is the maximum likelihood, K is the number of free parameters in the model and N is the 158
sample size (Leonard & Hsu, 2001). A smaller numerical value of BIC indicates a better fit when 159
comparing models. 160
RESULTS 161
P Retention vs. Total P Intake 162
The 4 functions were used on Dataset 1 to describe the relationship between P retained in 163
the body and total P intake (Table 4). In all cases, there was a good relationship between P 164
retention and total P intake. Based on BIC and SE of the models, the monomolecular equation 165
gave the best fit followed by the Gompertz, Richards, and the straight line, respectively (Table 4). 166
Two parameter estimates from the Richards and one from monomolecular and Gompertz 167
functions were not significant. 168
Estimates of endogenous P excretion ranged from 17 to 123 mg P/(kg BW0.75⋅ d) (parameter 169
b, Table 4). The monomolecular equation estimate was 17 mg P/(kg BW0.75⋅ d), and the straight 170
line and Richards estimates were similar to this value. Estimates of total P requirement for 171
maintenance ranged from 30 to 173 mg/(kg BW0.75⋅ d), with values from Richards and the 172
monomolecular at the lower end and Gompertz at the higher end. The P requirement for 173
maintenance generated by this analysis also includes unavailable P. 174
P Retention vs. Available P Intake 175
Page 8 of 31Journal of Animal Science
by on May 14, 2011. jas.fass.orgDownloaded from
9
The 4 functions were fitted to the data on P retention and recorded available P intake 176
(Dataset 2). The non-linear functions showed a good fit to these data based on BIC and SE of the 177
model and were all an improvement on the straight line function (Table 5). Parameters a and b178
can be ascribed biological meaning and refer to theoretical maximum P retention and endogenous 179
P excretion, respectively. Parameters c and n are constants that determine the shape of the curve. 180
The SE of parameter a was significant for all functions except the monomolecular and parameter 181
b was significant only for monomolecular and Gompertz functions. Parameter c was significant 182
in all equations but n was not significant for the Richards. 183
Estimates of endogenous P excretion (b) ranged from 3.8 to 14 mg/(kg BW0.75⋅ d; Table 5). 184
Available P requirement for maintenance ranged from 7 to 19 mg/(kg BW0.75⋅ d). Average 185
estimated efficiencies of conversion of available P to retained P over the total range of P intakes 186
were close for the non-linear functions evaluated, ranging from 54 to 65% (Table 5). 187
Estimation of Available P from Total P 188
A mixed linear regression model given by Eq. [3] was applied to Dataset 2 and the 189
following relationship was established: 190
Ia = 0.0006 (SE 0.005) + 0.47 (SE 0.095)It (r2 = 0.71) [4] 191
The intercept was not significantly different from zero, but the slope (measure of P 192
availability) was highly significant. Based on Eq. [1] through [4], available P values were 193
calculated for data points where only total P was measured. Retained P was then regressed 194
against calculated available P and the parameter estimates from the monomolecular function were 195
compared to the fit using reported available P values shown in Table 5. Parameters a, b, and c in 196
the monomolecular function for data using calculated available P were 0.59 (SE = 0.24), 0.015 197
(SE = 0.005) and 1.61 (SE = 0.09), respectively. None of these parameter estimates were 198
Page 9 of 31 Journal of Animal Science
by on May 14, 2011. jas.fass.orgDownloaded from
10
significantly different from those estimated using Dataset 2. The maintenance requirements and 199
average efficiency values based on calculated available P intake were also similar (maintenance = 200
16 mg/(kg BW0.75⋅d); k = 0.66). 201
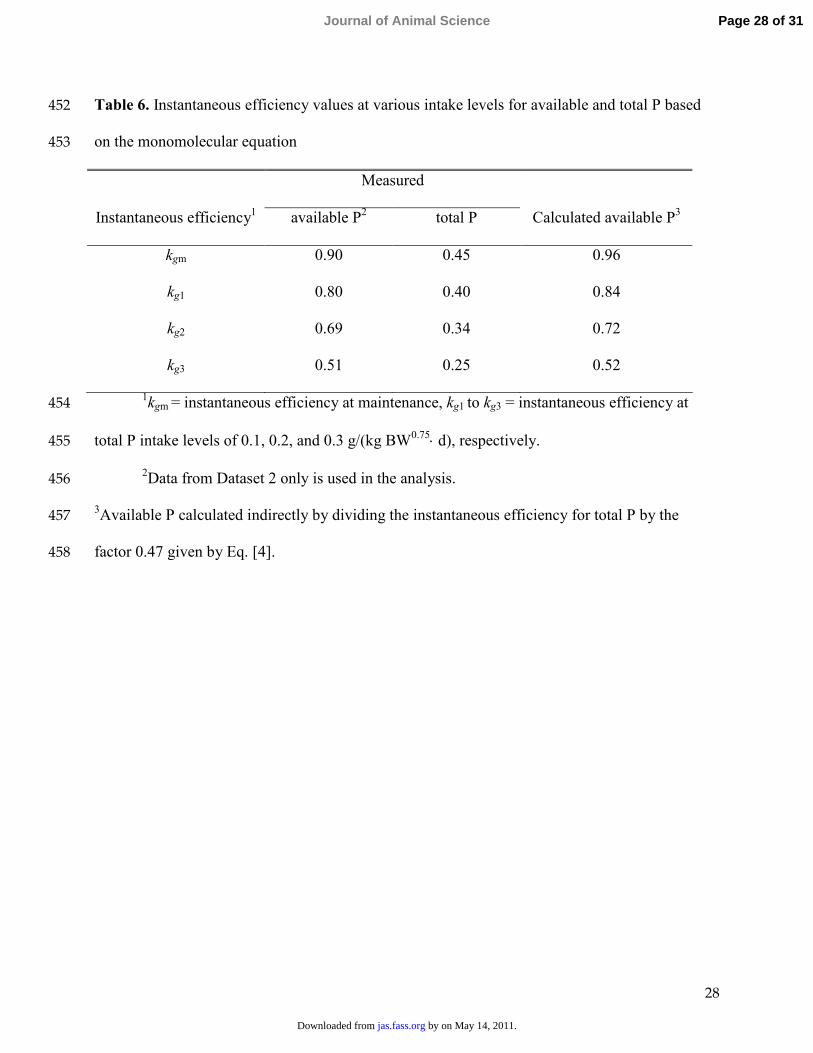
Estimates of instantaneous efficiency of utilization kg based on the monomolecular equation 202
are shown in Table 6. The estimates resulting from using calculated (i.e. Eq. [4]) and measured 203
available P were in close agreement (Table 6). 204
DISCUSSION 205
In this study, linearity of the relationship between P retention and dietary P intake was 206
challenged by comparing 4 candidate functions. Available P was not always reported for the 207
literature data collected, so it was necessary to use 2 datasets; one containing total P intake 208
(reported with or without available P) and another limited to those values with reported available 209
P only. Using the candidate functions, first, a relationship between retained P and total P intake 210
was established. Second, retained P was related to available P and third, available P was 211
regressed against total P intake. Finally, information obtained using dataset 2 was applied to the 212
composite data in order to extract information on key determinants of P requirement and the 213
nature of the relationship between P retention and intake. 214
Endogenous P Excretion 215
Although there was evidence of nonlinearity, the lack of sufficient data above 0.7 g of total 216
and 0.4 g of available P intake/(kg BW0.75⋅d) indicated that parameter a was not well estimated 217
for the diminishing returns function and parameters b, c, and n for sigmoidal functions when 218
retained P was regressed against total or available P intake. The case for monomolecular as the 219
most suitable candidate was strengthened because as parameter n approaches particular values, 220
the Richards equation encompasses other simpler models, such as the monomolecular (n = –1), 221
Page 10 of 31Journal of Animal Science
by on May 14, 2011. jas.fass.orgDownloaded from
11
Gompertz (n = 0) and logistic (n = 1). In our analysis, the parameter n was always negative, 222
tending to the monomolecular. 223
We assumed that endogenous P excretion is equal to excretion at zero P intake. However, it 224
is uncertain what happens when net retention becomes negative. There may be a different pattern 225
of response from the body when its need for P is not met. However, it is expected that the 226
efficiency of utilization will increase as digestion and absorption proportionally increase due to 227
less supply of dietary P, thus creating greater utilization is achieved when the capacity for 228
digestion and absorption, or both is not reached. This would lead to a lower intercept on the y-229
axis due to a steeper slope. On the other hand, metabolism might decrease in order to spare the 230
reserves and the continuing re-cycling from body stores would lessen, leading to a decrease in 231
endogenous excretion. This implies a greater intercept. This balance would further change if 232
insufficient supply is continued for a prolonged time. 233
When P retained is regressed against P intake, endogenous P excretion is given by net 234
retention at zero P intake. Estimates based on total P compared to available P would be expected 235
to yield greater endogenous excretion because the data from which it is derived would include 236
undigestible P. Better estimates are achieved when available P is used to predict endogenous P 237
excretion. The monomolecular equation predicted it to be 14 mg/(kg BW0.75⋅ d), based on 238
reported available P values and 17 mg/(kg BW0.75⋅ d) based on total P values, which after 239
accounting for metabolic BW was close to the range suggested by Jongbloed (1987) who 240
documented values of 2.9 to 24.5 mg/(kg BW⋅d) for pigs weighing 15 to 140 kg (with P in the 241
diet ranging from 0.33 to 0.83%). Variable endogenous P loss values were reported for growing 242
pigs fed a semi-purified diet (0.07 g/kg DMI or 3.2 mg/(kg BW⋅d), Petersen and Stein, 2006; 7.3 243
to 9.3 mg/(kg BW0.75⋅ d), Pettey et al., 2006), corn-based diet (0.67 g/kg DMI or 30.2 mg/(kg 244
Page 11 of 31 Journal of Animal Science
by on May 14, 2011. jas.fass.orgDownloaded from
12
BW⋅d), Shen et al., 2002) and soybean meal-based diet (0.45 g/kg DMI or 20.3 mg/(kg BW⋅d), 245
Ajakaiye et al., 2003). Our estimate was very close to that reported by Rodehutscord et al. (1998) 246
who showed that endogenous P excretion to be 15.5 mg of P/(kg BW0.75⋅d) based on regression 247
analysis of 66 P balance studies. Dilger and Adeola (2006) summarized estimates of endogenous 248
P excretion values reported in the literature. They concluded that the endogenous P loss in pigs 249
was likely to be less than 20 mg (kg BW0.75⋅ d) which agrees well with the results of our study 250
based on monomolecular function. Estimates of endogenous P excretion predicted by the 251
straight-line function was close to estimates reported by Pettey et al. (2006) and Dilger and 252
Adeola (2006) who also used a straight line approach to estimate endogenous P excretion. 253
A nonlinear equation is expected to provide greater estimates of endogenous P excretion 254
compared to standard straight line analysis because it assumes that the efficiency of P conversion 255
to retained P is not fixed as is the case with the straight line analysis. The endogenous P excretion 256
obtained by the monomolecular equation in this study included fecal endogenous P output and 257
urinary metabolic endogenous loss. Total urinary P excretion accounted for only a small fraction 258
of the whole body total P excretion in growing pigs fed within P requirement levels (Rideout and 259
Fan, 2004). Thus, it is conceivable that fecal endogenous P output is the primary component of 260
endogenous P excretion estimated by the monomolecular equation in this study. 261
Phosphorus Requirement for Maintenance (Pm)262
The functions predicted a range of available Pm values, with the best fitting model, the 263
monomolecular function, giving 15 and 16 mg/(kg BW0.75⋅d) using either reported or calculated 264
available P values, respectively. These values are slightly greater than the basal endogenous P 265
loss and therefore suggest that the maintenance requirement mostly accounts for the basal loss of 266
P from the animal. 267
Page 12 of 31Journal of Animal Science
by on May 14, 2011. jas.fass.orgDownloaded from
13
Despite the flexible nature of the function, the Richards did not improve upon the variation 268
explained by either of the simpler nonlinear models. This is partly because the Richards appears 269
over-parameterized for the data presented, which was illustrated by non-significant values of 2 of 270
its 4 parameter estimates. Generally, the supply of other nutrients such as Ca and vitamin D are 271
also known to influence P metabolism (NRC, 1998) thus influencing the behavior of the curve 272
and maintenance requirement. The concentration of Ca and vitamin D was not considered in the 273
present analysis. However, the supply of these nutrients was considered normal in the 274
experiments examined to derive the data sets used for the parameterization of equations. 275
Calculations for assessing requirements of other nutrients including energy for growing pigs 276
included separate estimates for maintenance and production. However, P requirements are 277
usually expressed as the sum of obligatory loss (urine plus feces P) and retention (ARC, 1981; 278
Jongbloed et al. 1999). Therefore, comparison of Pm values obtained in this study with other work 279
is difficult due to the scarcity of reported Pm figures. Different recommendation tables (NRC, 280
1998; ARC, 1981, Jorgensen & Tybirk, 2005) only provide total P requirements and do not 281
allocate it into maintenance and growth requirements. For example, NRC (1998) recommends an 282
available P requirement of 3.2 g/d for the 10- to 20-kg pig. This requirement includes 283
maintenance P, which in our study was estimated to be 0.14 g/d for the 20-kg pig, and growth 284
which will be utilized at 65% efficiency according to our results. The estimated retention of 285
approximately 2 g available P/d is consistent with values reported by Hastad et al. (2004) for pigs 286
with similar BW. 287
Efficiency of P Utilization 288
Greater efficiency coefficients are expected when using available rather than total P because 289
calculations based on total P also includes inefficiency or incomplete digestion or absorption of 290
Page 13 of 31 Journal of Animal Science
by on May 14, 2011. jas.fass.orgDownloaded from
14
dietary P. Efficiency was generally greatest at low available P intake and became decreased as 291
intake increased (Table 5 and 6). Changes in efficiency were greatest for the sigmoidal functions 292
because of their inherent shape. Biologically, it is unlikely that there is a lag phase where 293
minimum changes in efficiency occur at lower intakes as predicted by the Gompertz equation. 294
However, the monomolecular function gives a diminishing return in efficiency as intake 295
increases, which is biologically more sensible. 296
When total P intake was scaled by metabolic BW, average efficiency of P utilization was 297
between 34 and 45%, which is in the range reported in the literature (e.g., Revy et al., 2004). For 298
pigs fed corn and soybean based diets, Adeola et al. (2004) reported efficiency of utilization of P 299
in control animals was an average of 46% which was close to estimates from the straight line and 300
Gompertz functions. Furthermore, Dilger and Adeola (2006) reported efficiency values ranging 301
from 30 to 42% which is within the range of estimates given by the straight line, monomolecular, 302
and Richards functions. Results for efficiency of conversion of dietary to retained P, evaluated at 303
various intake ranges using the diminishing returns model, showed efficiency was greatest at low 304
P intake followed by a decrease in efficiency as P intake increased. This was not the case for the 305
sigmoidal function because of shallower slopes at the beginning of the curve, which rose sharply 306
towards mid P intake values. In reality, this is an unlikely scenario as the animals would have a 307
greater efficiency when P deficient while more P would be excreted as their capacity to absorb P 308
is saturated at high P intakes. However, it is difficult to say if the P retention curve shows 309
sigmoidicity at dietary values very close to zero before following diminishing returns behavior 310
after a low point of inflection. Nothing in the present data elucidates this. 311
Based on the meta-analyses conducted in this study, fitting the monomolecular equation to 312
the data more accurately accounted for variation compared with fitting any of the other functions 313
Page 14 of 31Journal of Animal Science
by on May 14, 2011. jas.fass.orgDownloaded from
15
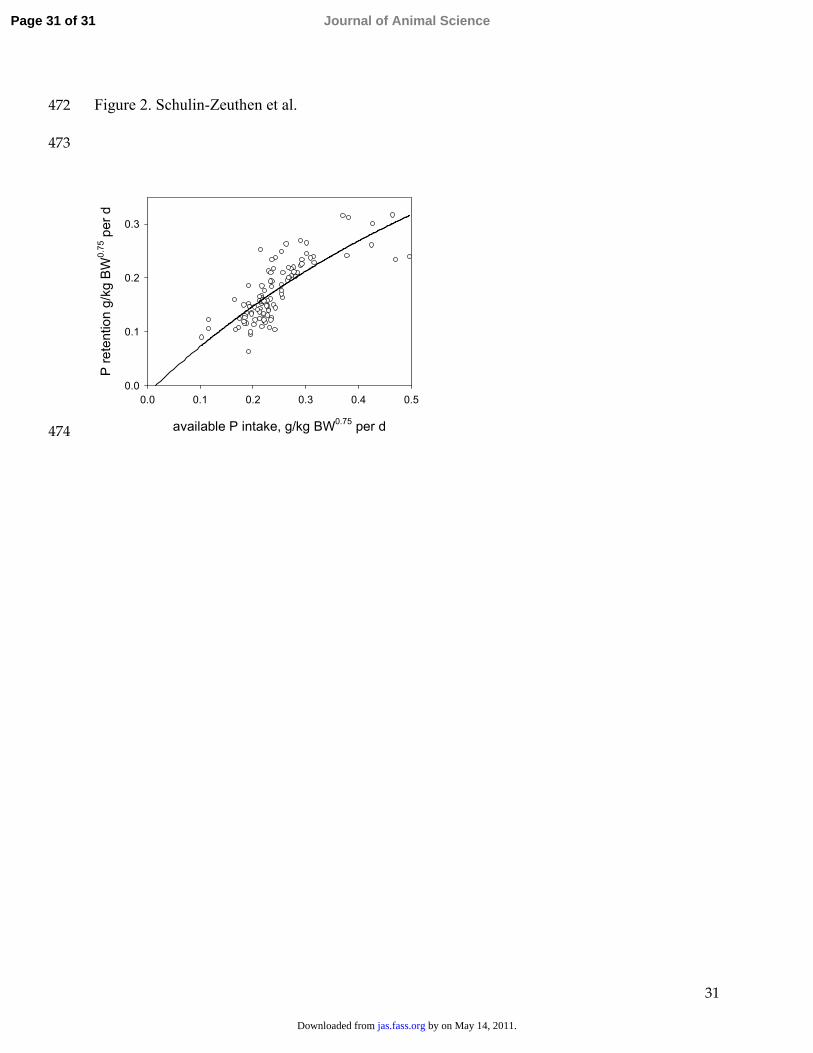
(including the straight line, which represented the null hypothesis in this study). Figure 2 shows 314
the relationship between P retention and intake (both total and available) obtained with the 315
monomolecular equation. Biologically, it is more plausible that efficiency of P utilization is 316
greater when pigs consume P below their maintenance requirement and decreases as intake 317
increases, which is the situation described by the monomolecular or Richards, but not by the 318
Gompertz. Scarcity of observations approaching the asymptote made estimating parameter a319
(maximum P retention) difficult, particularly in the analysis with available P. The monomolecular 320
could also be used to investigate the effects of diets or Ca:P ratio, particularly if sufficient data on 321
different weight groups were available. 322
In summary, a meta-analytical approach to evaluating various functions describing the 323
relationship between P retention and available P (and total P) in growing pigs revealed that the 324
monomolecular equation consistently described the data better than linear, Gompertz and 325
Richards equations. The monomolecular indicated that endogenous P excretion was 14 mg/(kg 326
BW0.75⋅ d) based on available P analysis. Maintenance requirements was 15 mg available P/(kg 327
BW0.75⋅ d). Average efficiencies of utilization above maintenance were 65 and 36% for available 328
and total P, respectively. Therefore, requirements can be estimated by adding the P needed for 329
maintenance and body retention, assuming normal ranges of dietary Ca:P ratios and vitamin D 330
concentrations. 331
Page 15 of 31 Journal of Animal Science
by on May 14, 2011. jas.fass.orgDownloaded from
16
LITERATURE CITED 332
ARC. 1981. The Nutrient Requirements of Pigs. Commonwealth Agric. Bureaux, Slough, UK. 333
Adeola, O., J. S. Sands, P. H. Simmins, and H. Schulze. 2004. The efficacy of an Eschericia coli-334
derived phytase preparation. J. Anim. Sci. 82:2657-2666. 335
Ajakaiye, A., M. Z. Fan, T. Archbold, R. R. Hacker, C. W. Forsberg, and J. P. Phillips. 2003. 336
Determination of true digestive utilization of phosphorus and the endogenous phosphorus 337
outputs associated with soybean meal for growing pigs. J. Anim. Sci. 81:2766-2775. 338
Carter, S. D., G. L. Cromwell, G. Colombo, and P. Fanti. 1999. Effects of porcine somatotropin 339
on calcium and phosphorus balance and markers of bone metabolism in finishing pigs. J. 340
Anim. Sci. 77:2163-2171. 341
Darmani Kuhi, H., E. Kebreab, S. Lopez, and J. France. 2003. A comparative evaluation of 342
functions for the analysis of growth in male broilers. J. Agric. Sci. 140:451-459. 343
Dilger, R. N., and Adeola, O. 2006. Estimation of true phosphorus digestibility and endogenous 344
phosphorus loss in growing pigs fed conventional and low-phytate soybean meals. J. Anim. 345
Sci. 84: 627-634. 346
Ekpe, E. D., R. T. Zijlstra, and J. F. Patience. 2002. Digestible phosphorus requirement of grower 347
pigs. Can. J. Anim. Sci. 82:541-549. 348
Fan, M. Z., T. Archbold, W. C. Sauer, D. Lackeyram, T. Rideout, Y. Gao, C. F. de Lange, and R. 349
R. Hacker. 2001. Novel methodology allows simultaneous measurement of true phosphorus 350
digestibility and the gastrointestinal endogenous phosphorus outputs in studies with pigs. J. 351
Nutr. 131:2388-2396. 352
Finney, D. J. 1978. Statistical Methods in Biological Assay. 3rd ed. Charles Griffin & Company, 353
Ltd., High Wycombe, UK. 354
Page 16 of 31Journal of Animal Science
by on May 14, 2011. jas.fass.orgDownloaded from
17
Hastad, C. W., S. S. Dritz, M. D. Tokach, R. D. Goodband, J. L. Nelssen, J. M. DeRouchey, R. 355
D. Boyd, and M. E. Johnston. 2004. Phosphorus requirements of growing-finishing pigs 356
reared in a commercial environment. J. Anim. Sci. 82:2945-2952. 357
Honeyman, M. S. 1993. Environment-friendly swine feed formulation to reduce nitrogen and 358
phosphorus excretion. Am. J. Alt. Agric. 8:128-132. 359
Jongbloed, A. W. 1987. Phosphorus in the feeding of pigs: effect of diet on the absorption and 360
retention of phosphorus by growing pigs. Ph.D. Diss., Wageningen Agric. Univ., The 361
Netherlands. 362
Jongbloed, A. W., H. Everts, & P. A. Kemme. 1991. Phosphorus availability and requirements in 363
pigs. Pages 65–80 in Recent Advances in Animal Nutrition. E. R. Heiemann, ed. 364
Butterworth, London, UK. 365
Jongbloed, A. W., H. Everts, P. A. Kemme, and Z. Mroz. 1999. Quantification of absorbability 366
and requirements of macroelements. Pages 275-298 in Quantitative Biology of the Pig. I. 367
Kyriazakis, ed. CABI Publishing, Wallingford, U.K. 368
Jorgensen, L., and P. Tybirk. 2005. Normer for næringsstoffer. [Nutrient requirements]. Natl. 369
Comm. for Pigs, Danske Slagterier, Copenhagen, Denmark. 370
Kebreab, E., J. France, R. E. Agnew, T. Yan, M. S. Dhanoa, J. Dijkstra, D. E. Beever, and C. K. 371
Reynolds. 2003. Alternatives to linear analysis of energy balance data from lactating dairy 372
cows. J. Dairy Sci. 86:2904-2913. 373
Leonard, T., and S. J. Hsu. 2001. Bayesian Methods: An Analysis for Statisticians and 374
Interdisciplinary Researchers. Cambridge Series in Statistical & Probabilistic Mathematics. 375
Cambridge University Press, Cambridge, UK. 376
Page 17 of 31 Journal of Animal Science
by on May 14, 2011. jas.fass.orgDownloaded from
18
Littell, R. C., G. A. Milliken, W. W. Stroup, and R. D. Wolfinger. 1996. SAS® System for 377
Mixed Models. SAS Institute Inc., Cary, NC. 378
Moughan, P. J., W. B. Souffrant, and S. M. Hodgkinson. 1998. Physiological approaches to 379
determining gut endogenous amino acid flows in the mammal. Arc. Anim. Nutr. 51:237-380
252. 381
NRC. 1998. Nutrient Requirements of Swine. 10th ed. Natl. Acad. Press, Washington, DC. 382
Petersen, G. I., and H. H. Stein. 2006. Novel procedure for estimating endogenous losses and 383
measurement of apparent and true digestibility of phosphorus by growing pigs. J. Anim. 384
Sci. 84:2126-2132. 385
Pettey, L. A., G. L. Cromwell, and M. D. Lindemann. 2006. Estimation of endogenous 386
phosphorus loss in growing and finishing pigs fed semi-purified diets. J. Anim. Sci. 84:618-387
626. 388
Revy, P., S. C. Jondreville, J. Y. Dourmad, and Y. Nys. 2004. Effect of zinc supplemented as 389
either an organic or an inorganic source and of microbial phytase on zinc and other minerals 390
utilisation by weanling pigs. Anim. Sci. Tech. 116:93-112. 391
Rideout, T. C., and M. Z. Fan. 2004. Nutrient utilization in responses to chicory inulin 392
supplementation in studies with pigs. J. Sci. Food Agric. 84:1005-1012. 393
Rodehutscord, M., R. Haverkamp, and E. Pfeffer. 1998. Inevitable losses of phosphorus in pigs, 394
estimated from balance data using diets deficient in phosphorus. Arch. Anim. Nutr. 51:27-38. 395
SAS. 2000. SAS/STAT User’s Guide (Release 8). SAS Inst. Inc., Cary, NC. 396
Shen, Y., M. Z. Fan, A. Ajakaiye, and T. Archbold. 2002. Use of the regression analysis 397
technique to determine the true phosphorus digestibility and the endogenous phosphorus 398
output associated with corn in growing pigs. J. Nutr. 132:1199-1206. 399
Page 18 of 31Journal of Animal Science
by on May 14, 2011. jas.fass.orgDownloaded from
19
Spencer, J. D., G. L. Allee, and T. E. Sauber. 2000. Phosphorus bioavailability and digestibility 400
of normal and genetically modified low-phytate corn for pigs. J. Anim. Sci. 78:675-681. 401
St-Pierre, N. R. 2001. Invited review: Integrating quantitative findings from multiple studies 402
using mixed model methodology. J. Dairy Sci. 84:741-755. 403
Thornley, J. H. M., and J. France. 2007. Mathematical Models in Agriculture. 2nd ed. CAB 404
International, Wallingford, UK. 405
Veum, T. L., D. R. Ledoux, V. Raboy, and D. S. Ertl. 2001. Low-phytic acid corn improves 406
nutrient utilization for growing pigs. J. Anim. Sci. 79:2873-2880. 407
Veum, T. L., D. R. Ledoux, D. W. Bollinger, V. Raboy, and A. Cook. 2002. Low-phytic acid 408
barley improves calcium and phosphorus utilization and growth performance in growing 409
pigs. J. Anim. Sci. 80:2663-2670. 410
411
Page 19 of 31 Journal of Animal Science
by on May 14, 2011. jas.fass.orgDownloaded from
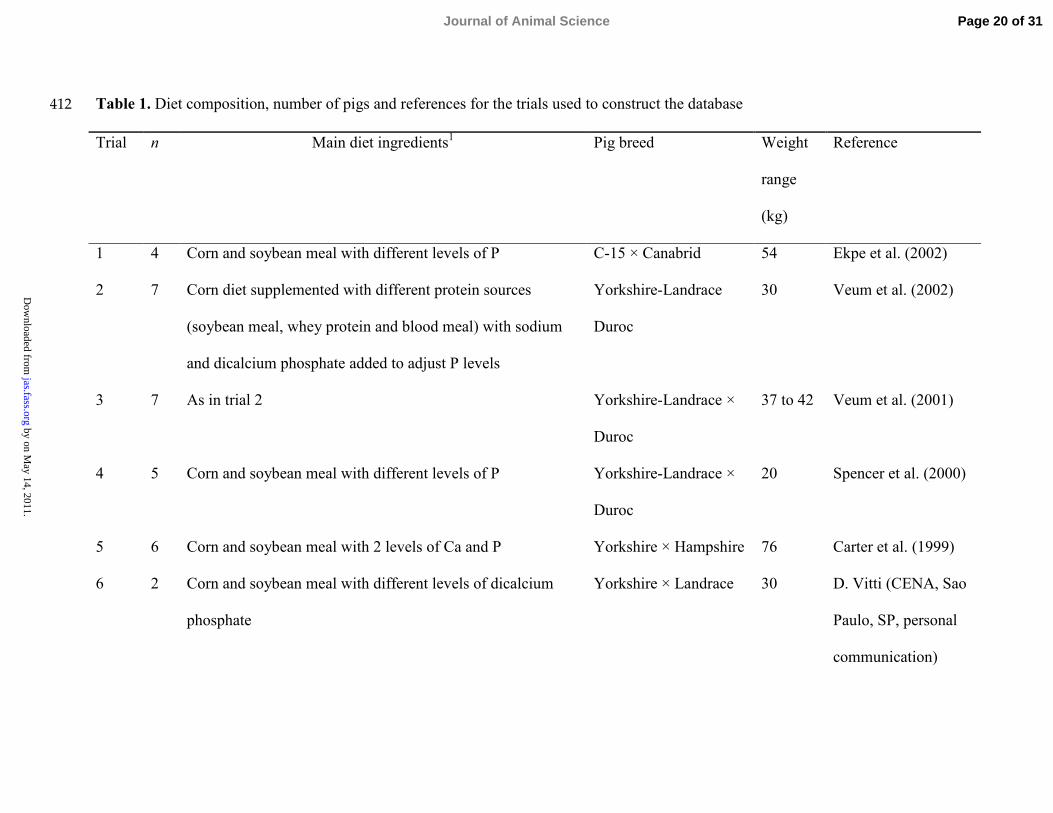
Table 1. Diet composition, number of pigs and references for the trials used to construct the database412
Trial n Main diet ingredients1 Pig breed Weight
range
(kg)
Reference
1 4 Corn and soybean meal with different levels of P C-15 × Canabrid 54 Ekpe et al. (2002)
2 7 Corn diet supplemented with different protein sources
(soybean meal, whey protein and blood meal) with sodium
and dicalcium phosphate added to adjust P levels
Yorkshire-Landrace
Duroc
30 Veum et al. (2002)
3 7 As in trial 2 Yorkshire-Landrace ×
Duroc
37 to 42 Veum et al. (2001)
4 5 Corn and soybean meal with different levels of P Yorkshire-Landrace ×
Duroc
20 Spencer et al. (2000)
5 6 Corn and soybean meal with 2 levels of Ca and P Yorkshire × Hampshire 76 Carter et al. (1999)
6 2 Corn and soybean meal with different levels of dicalcium
phosphate
Yorkshire × Landrace 30 D. Vitti (CENA, Sao
Paulo, SP, personal
communication)
Page 20 of 31Journal of Animal Science
by on May 14, 2011.
jas.fass.orgD
ownloaded from
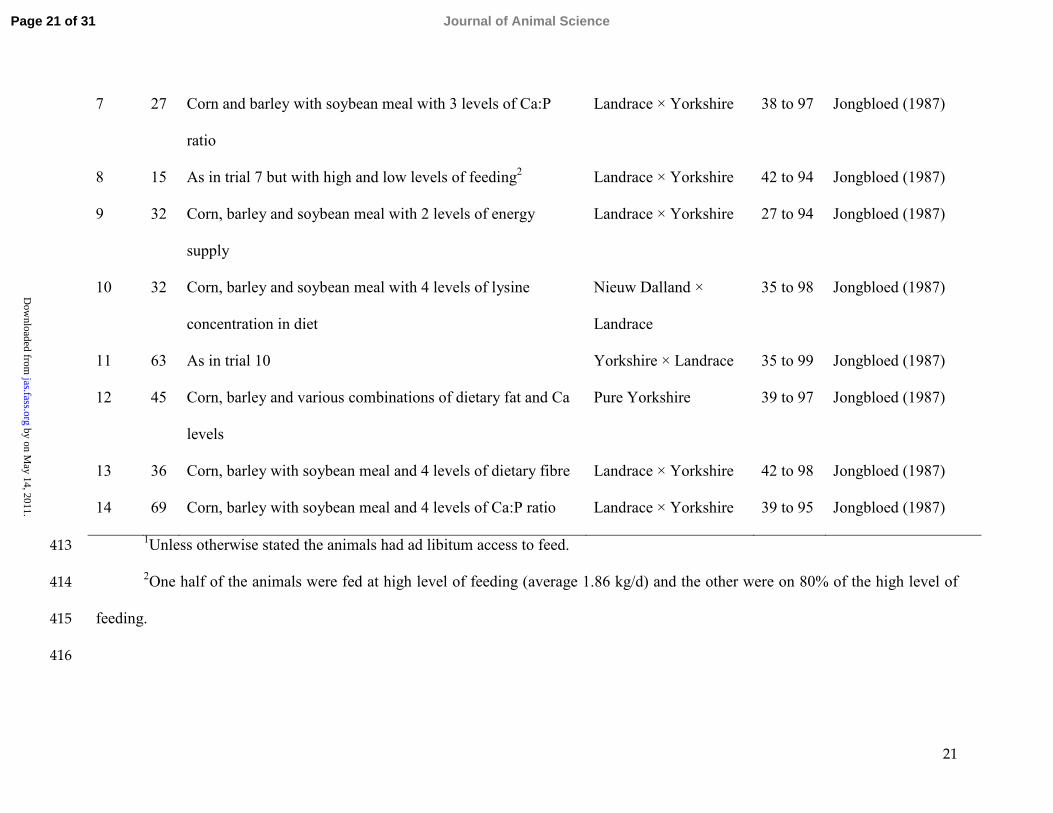
21
7 27 Corn and barley with soybean meal with 3 levels of Ca:P
ratio
Landrace × Yorkshire 38 to 97 Jongbloed (1987)
8 15 As in trial 7 but with high and low levels of feeding2 Landrace × Yorkshire 42 to 94 Jongbloed (1987)
9 32 Corn, barley and soybean meal with 2 levels of energy
supply
Landrace × Yorkshire 27 to 94 Jongbloed (1987)
10 32 Corn, barley and soybean meal with 4 levels of lysine
concentration in diet
Nieuw Dalland ×
Landrace
35 to 98 Jongbloed (1987)
11 63 As in trial 10 Yorkshire × Landrace 35 to 99 Jongbloed (1987)
12 45 Corn, barley and various combinations of dietary fat and Ca
levels
Pure Yorkshire 39 to 97 Jongbloed (1987)
13 36 Corn, barley with soybean meal and 4 levels of dietary fibre Landrace × Yorkshire 42 to 98 Jongbloed (1987)
14 69 Corn, barley with soybean meal and 4 levels of Ca:P ratio Landrace × Yorkshire 39 to 95 Jongbloed (1987)1Unless otherwise stated the animals had ad libitum access to feed.413
2One half of the animals were fed at high level of feeding (average 1.86 kg/d) and the other were on 80% of the high level of414
feeding.415
416
Page 21 of 31 Journal of Animal Science
by on May 14, 2011.
jas.fass.orgD
ownloaded from
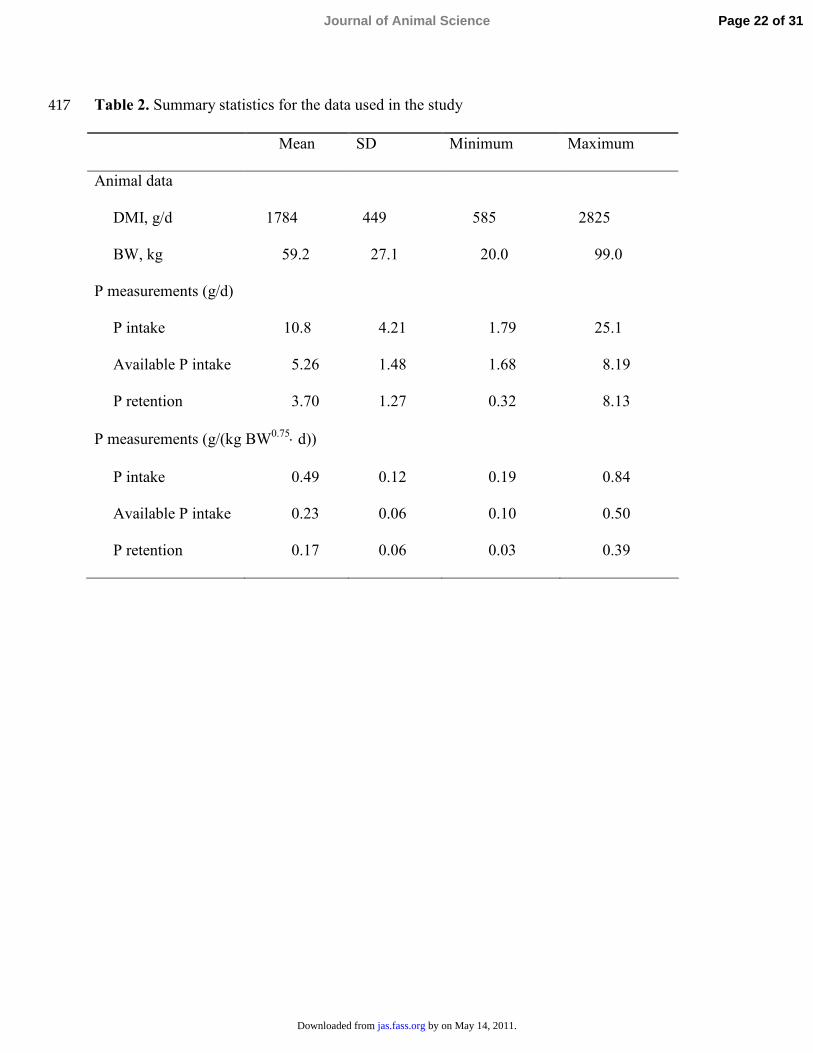
Table 2. Summary statistics for the data used in the study 417
Mean SD Minimum Maximum
Animal data
DMI, g/d 1784 449 585 2825
BW, kg 59.2 27.1 20.0 99.0
P measurements (g/d)
P intake 10.8 4.21 1.79 25.1
Available P intake 5.26 1.48 1.68 8.19
P retention 3.70 1.27 0.32 8.13
P measurements (g/(kg BW0.75⋅ d))
P intake 0.49 0.12 0.19 0.84
Available P intake 0.23 0.06 0.10 0.50
P retention 0.17 0.06 0.03 0.39
Page 22 of 31Journal of Animal Science
by on May 14, 2011. jas.fass.orgDownloaded from
23
Table 3. The functional forms used to describe the relationship between retained P, y(x), and P 418
intake, x419
Function1 y(x) Value of x when y = 0
Straight line ax b− /b a
Monomolecular ( )e−− + cxa a b 1ln[( ) / ]c a b a− +
Gompertz 2exp[(1 e )ln ] 2cx a bb bb
− +− − 1 ln[( 2 ) / ]ln{ }ln[( 2 ) /(2 )]a b bc a b b
− ++
Richards { }1/( 2 ) 2
( 2 ) e nn n n cxb a b b
b a b b −+ − + + −
1 2 [( 2 ) ]ln ( 2 ) (2 )
n n n
n na b bc a b b
− + − + − 1The parameters a, b and c are positive entities, n ≥ −1, and in nonlinear models ymax = a420
and ymin = −b.421
Page 23 of 31 Journal of Animal Science
by on May 14, 2011. jas.fass.orgDownloaded from
24
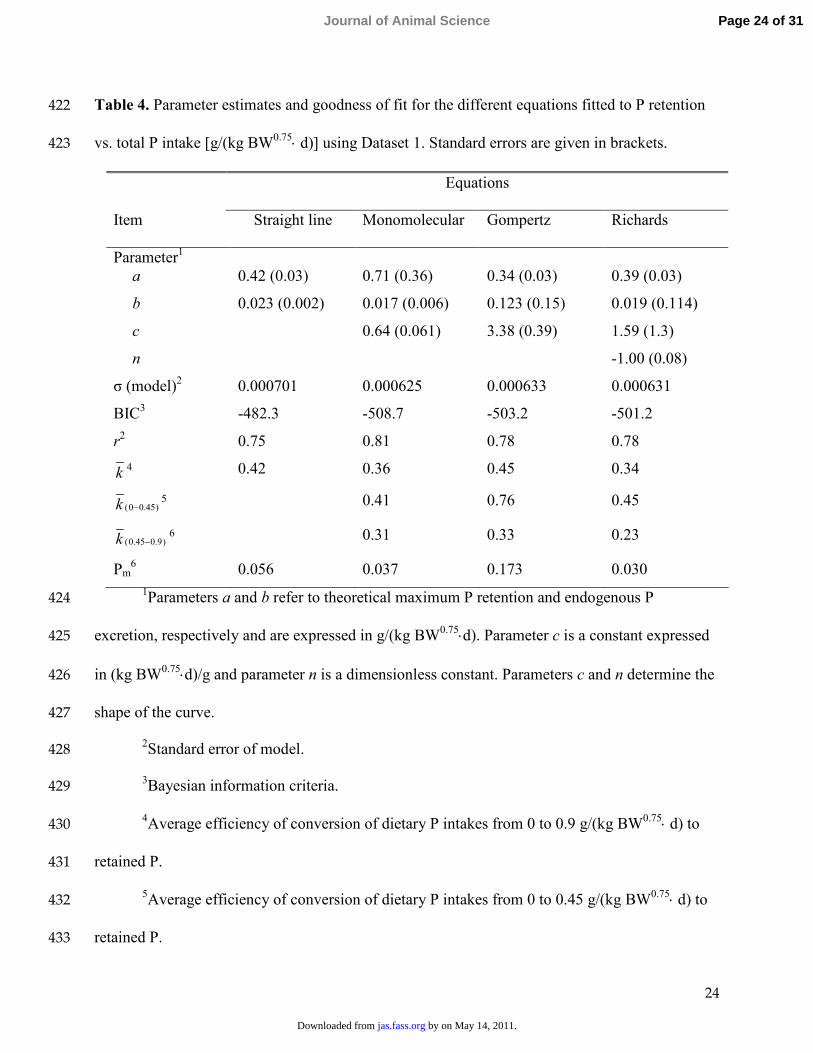
Table 4. Parameter estimates and goodness of fit for the different equations fitted to P retention 422
vs. total P intake [g/(kg BW0.75⋅ d)] using Dataset 1. Standard errors are given in brackets. 423
Equations
Item Straight line Monomolecular Gompertz Richards
Parameter1
a 0.42 (0.03) 0.71 (0.36) 0.34 (0.03) 0.39 (0.03) b 0.023 (0.002) 0.017 (0.006) 0.123 (0.15) 0.019 (0.114) c 0.64 (0.061) 3.38 (0.39) 1.59 (1.3) n -1.00 (0.08)
σ (model)2 0.000701 0.000625 0.000633 0.000631 BIC3 -482.3 -508.7 -503.2 -501.2 r2 0.75 0.81 0.78 0.78 k 4 0.42 0.36 0.45 0.34
)45.00( −k 5 0.41 0.76 0.45
)9.045.0( −k 6 0.31 0.33 0.23 Pm6 0.056 0.037 0.173 0.030
1Parameters a and b refer to theoretical maximum P retention and endogenous P 424
excretion, respectively and are expressed in g/(kg BW0.75⋅d). Parameter c is a constant expressed 425
in (kg BW0.75⋅d)/g and parameter n is a dimensionless constant. Parameters c and n determine the 426
shape of the curve. 427
2Standard error of model. 428
3Bayesian information criteria. 429
4Average efficiency of conversion of dietary P intakes from 0 to 0.9 g/(kg BW0.75⋅ d) to 430
retained P. 431
5Average efficiency of conversion of dietary P intakes from 0 to 0.45 g/(kg BW0.75⋅ d) to 432
retained P. 433
Page 24 of 31Journal of Animal Science
by on May 14, 2011. jas.fass.orgDownloaded from
25
6Average efficiency of conversion of dietary P intakes from 0.45 to 0.9 g/(kg BW0.75⋅ d) to 434
retained P. 435
7Total P requirement for maintenance [g/(kg BW0.75⋅ d)]. 436
Page 25 of 31 Journal of Animal Science
by on May 14, 2011. jas.fass.orgDownloaded from
26
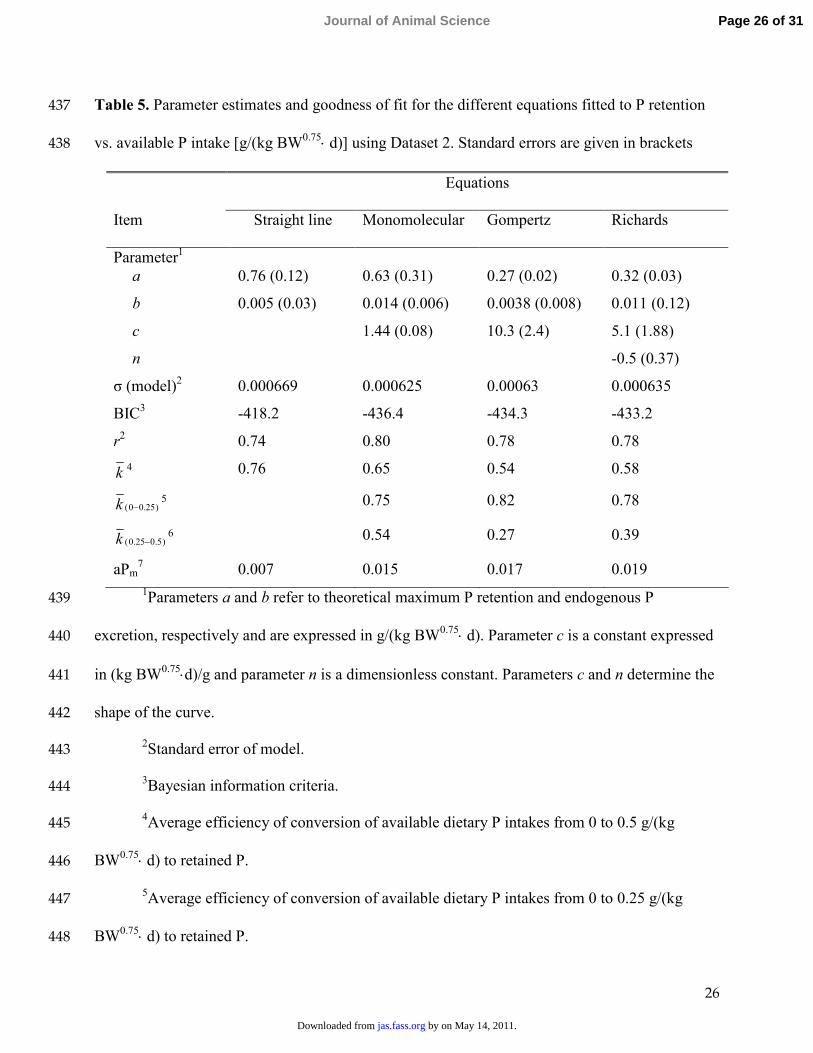
Table 5. Parameter estimates and goodness of fit for the different equations fitted to P retention 437
vs. available P intake [g/(kg BW0.75⋅ d)] using Dataset 2. Standard errors are given in brackets 438
Equations
Item Straight line Monomolecular Gompertz Richards
Parameter1
a 0.76 (0.12) 0.63 (0.31) 0.27 (0.02) 0.32 (0.03) b 0.005 (0.03) 0.014 (0.006) 0.0038 (0.008) 0.011 (0.12) c 1.44 (0.08) 10.3 (2.4) 5.1 (1.88) n -0.5 (0.37)
σ (model)2 0.000669 0.000625 0.00063 0.000635 BIC3 -418.2 -436.4 -434.3 -433.2 r2 0.74 0.80 0.78 0.78 k 4 0.76 0.65 0.54 0.58
)25.00( −k 5 0.75 0.82 0.78
)5.025.0( −k 6 0.54 0.27 0.39 aPm7 0.007 0.015 0.017 0.019
1Parameters a and b refer to theoretical maximum P retention and endogenous P 439
excretion, respectively and are expressed in g/(kg BW0.75⋅ d). Parameter c is a constant expressed 440
in (kg BW0.75⋅d)/g and parameter n is a dimensionless constant. Parameters c and n determine the 441
shape of the curve. 442
2Standard error of model. 443
3Bayesian information criteria. 444
4Average efficiency of conversion of available dietary P intakes from 0 to 0.5 g/(kg 445
BW0.75⋅ d) to retained P. 446
5Average efficiency of conversion of available dietary P intakes from 0 to 0.25 g/(kg 447
BW0.75⋅ d) to retained P. 448
Page 26 of 31Journal of Animal Science
by on May 14, 2011. jas.fass.orgDownloaded from
27
6Average efficiency of conversion of available dietary P intakes from 0.25 to 0.5 g/(kg 449
BW0.75⋅ d) to retained P. 450
7Available P requirement for maintenance [g/(kg BW0.75⋅ d)]. 451
Page 27 of 31 Journal of Animal Science
by on May 14, 2011. jas.fass.orgDownloaded from
28
Table 6. Instantaneous efficiency values at various intake levels for available and total P based 452
on the monomolecular equation 453
Measured
Instantaneous efficiency1 available P2 total P Calculated available P3
kgm 0.90 0.45 0.96
kg1 0.80 0.40 0.84
kg2 0.69 0.34 0.72
kg3 0.51 0.25 0.52 1kgm = instantaneous efficiency at maintenance, kg1 to kg3 = instantaneous efficiency at 454
total P intake levels of 0.1, 0.2, and 0.3 g/(kg BW0.75⋅ d), respectively. 455
2Data from Dataset 2 only is used in the analysis. 456
3Available P calculated indirectly by dividing the instantaneous efficiency for total P by the 457
factor 0.47 given by Eq. [4]. 458
Page 28 of 31Journal of Animal Science
by on May 14, 2011. jas.fass.orgDownloaded from
29
Figure legends: 459
460
Figure 1. Schematic representation of endogenous P excretion, P requirement for maintenance 461
and efficiencies of P conversion using the monomolecular equation. Axes are in units of g/(kg 462
BW0.75⋅ d). 463
464
Figure 2. Relationship between P retention and available P intake scaled by metabolic BW 465
(BW0.75) in growing pigs using the monomolecular function. The solid line is given by the 466
equation 0.63 – (0.63 + 0.014)e-1.44(available P intake) 467
Page 29 of 31 Journal of Animal Science
by on May 14, 2011. jas.fass.orgDownloaded from
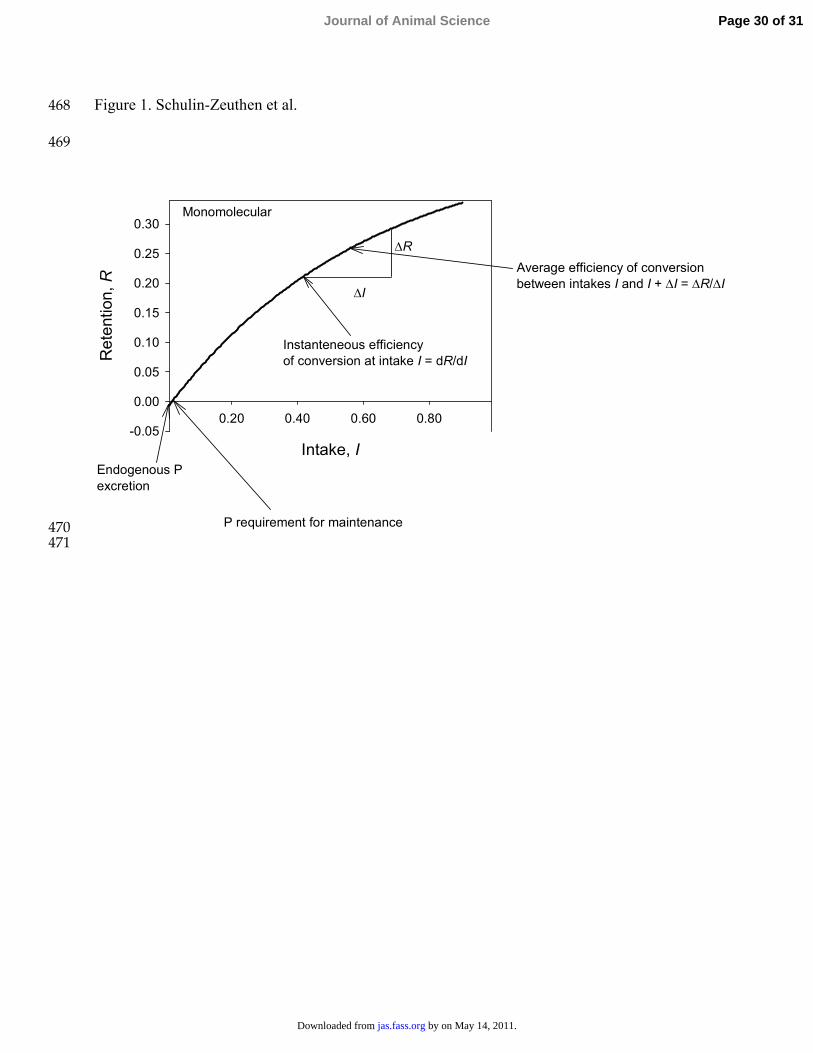
Figure 1. Schulin-Zeuthen et al. 468
469
Col 1 vs Col 2 Col 1 vs Col 2
Monomolecular
Intake, I0.20 0.40 0.60 0.80
Reten
tion,R
-0.05
0.00
0.05
0.10
0.15
0.20
0.25
0.30
Instanteneous efficiencyof conversion at intake I = dR/dI
P requirement for maintenance
Endogenous Pexcretion
Average efficiency of conversion between intakes I and I + ∆I = ∆R/∆I
∆R
∆I
470 471
Page 30 of 31Journal of Animal Science
by on May 14, 2011. jas.fass.orgDownloaded from
31
Figure 2. Schulin-Zeuthen et al. 472
473
available P intake, g/kg BW0.75 per d0.0 0.1 0.2 0.3 0.4 0.5
Pret
entio
ng/kg
BW0.7
5pe
rd
0.0
0.1
0.2
0.3
474
Page 31 of 31 Journal of Animal Science
by on May 14, 2011. jas.fass.orgDownloaded from

Citations http://jas.fass.org#otherarticles
This article has been cited by 1 HighWire-hosted articles:
by on May 14, 2011. jas.fass.orgDownloaded from