mechanisms of programmed nutrition in finishing cattle
TRANSCRIPT

University of Kentucky University of Kentucky
UKnowledge UKnowledge
Theses and Dissertations--Animal and Food Sciences Animal and Food Sciences
2022
Mechanisms of Programmed Nutrition in Finishing Cattle Mechanisms of Programmed Nutrition in Finishing Cattle in Vivo in Vivo
and Ruminal Parameters of Amaize Supplementation and Ruminal Parameters of Amaize Supplementation in Vitro in Vitro
Amanda Pesqueira Schiff University of Kentucky, [email protected] Digital Object Identifier: https://doi.org/10.13023/etd.2022.028
Right click to open a feedback form in a new tab to let us know how this document benefits you. Right click to open a feedback form in a new tab to let us know how this document benefits you.
Recommended Citation Recommended Citation Schiff, Amanda Pesqueira, "Mechanisms of Programmed Nutrition in Finishing Cattle in Vivo and Ruminal Parameters of Amaize Supplementation in Vitro" (2022). Theses and Dissertations--Animal and Food Sciences. 136. https://uknowledge.uky.edu/animalsci_etds/136
This Doctoral Dissertation is brought to you for free and open access by the Animal and Food Sciences at UKnowledge. It has been accepted for inclusion in Theses and Dissertations--Animal and Food Sciences by an authorized administrator of UKnowledge. For more information, please contact [email protected].

STUDENT AGREEMENT: STUDENT AGREEMENT:
I represent that my thesis or dissertation and abstract are my original work. Proper attribution
has been given to all outside sources. I understand that I am solely responsible for obtaining
any needed copyright permissions. I have obtained needed written permission statement(s)
from the owner(s) of each third-party copyrighted matter to be included in my work, allowing
electronic distribution (if such use is not permitted by the fair use doctrine) which will be
submitted to UKnowledge as Additional File.
I hereby grant to The University of Kentucky and its agents the irrevocable, non-exclusive, and
royalty-free license to archive and make accessible my work in whole or in part in all forms of
media, now or hereafter known. I agree that the document mentioned above may be made
available immediately for worldwide access unless an embargo applies.
I retain all other ownership rights to the copyright of my work. I also retain the right to use in
future works (such as articles or books) all or part of my work. I understand that I am free to
register the copyright to my work.
REVIEW, APPROVAL AND ACCEPTANCE REVIEW, APPROVAL AND ACCEPTANCE
The document mentioned above has been reviewed and accepted by the student’s advisor, on
behalf of the advisory committee, and by the Director of Graduate Studies (DGS), on behalf of
the program; we verify that this is the final, approved version of the student’s thesis including all
changes required by the advisory committee. The undersigned agree to abide by the statements
above.
Amanda Pesqueira Schiff, Student
Dr. David L. Harmon, Major Professor
Dr. David L. Harmon, Director of Graduate Studies

MECHANISMS OF PROGRAMMED NUTRITION IN FINISHING CATTLE IN VIVO AND RUMINAL PARAMETERS OF AMAIZE SUPPLEMENTATION IN VITRO
_____________________________________________
DISSERTATION
_____________________________________________
A dissertation submitted in partial fulfillment of the requirements for the degree of Doctor of Philosophy in the
College of Agriculture, Food and Environment at the University of Kentucky
By
Amanda Pesqueira Schiff
Lexington, Kentucky
Director: Dr. David L. Harmon, Professor of Animal and Food Sciences
Lexington, Kentucky
2022
Copyright © Amanda Pesqueira Schiff 2022

ABSTRACT OF DISSERTATION
MECHANISMS OF PROGRAMMED NUTRITION IN FINISHING CATTLE IN VIVO
AND RUMINAL PARAMETERS OF AMAIZE SUPPLEMENTATION IN VITRO
Programmed Nutrition Beef Program (Alltech Inc.) is a dietary supplement that contains Aspergillus oryzae fermentation extract with α-amylase activity that could reduce the use of feed additives such as monensin and tylosin in conventional feedlot diets. This study examines the changes in rumen fermentation resulting from feeding monensin/tylosin and Programmed Nutrition Beef Finisher. The goal was to determine if these shifts in rumen fermentation contribute to the Programmed Nutrition response observed in vivo. This study also analyzes how different levels of α-amylase (Amaize) supplementation impacts feedstuff degradation and utilization in vitro. In vivo experiment used eight steers in a replicated 4 x 4 Latin square design, and measured heat production, ruminal pH, and ruminal volatile fatty acid (VFA) concentrations for 48 hours. The in vivo study measured by urine and fecal output; dietary digestibility, nitrogen balance, 15N-glycine protein turnover, and energy balance. In vitro experiment used rumen fluid from three cannulated steers to measure in vitro gas production, rate of degradation, and starch degraded for different feedstuffs with or without Amaize. In vivo study determined that inclusion of Programmed Nutrition did not increase average daily gain, ruminal pH, ruminal VFA production, nitrogen digestibility, or methane production. Feeding Programmed Nutrition with monensin and tylosin can decrease acid detergent fiber (ADF) digestibility. In vitro study determined that in vitro gas production after 24-h increases when dry rolled barley is incubated with Amaize. Rate of degradation increases when dry rolled corn, corn steam-flaked at 26 lb/bu, retrograde steam-flaked corn, and steam-flaked barley are incubated with Amaize. Starch degraded after 2-h incubation increases when steam-flaked corn and retrograded steam-flaked corn are incubated with Amaize.
KEYWORDS: Programmed Nutrition, monensin, tylosin, α-amylase, Amaize

Amanda Pesqueira Schiff
January, 10th 2022 Date

MECHANISMS OF PROGRAMMED NUTRITION IN FINISHING CATTLE IN VIVO AND RUMINAL PARAMETERS OF AMAIZE SUPPLEMENTATION IN VITRO
By
Amanda Pesqueira Schiff
Dr. David L. Harmon Director of Dissertation
Dr. David L. Harmon Director of Graduate Studies
January, 10th 2022

iii
ACKNOWLEDGEMENTS
I would like to thank my advisor Dr. David L. Harmon for allowing me to pursuit
my graduate degrees as his student, and for always pushing me to present the best version
of my work. For being helpful, patient, and supportive as a mentor. I would also like to
show my gratitude to my dissertation committee members, Dr. Kyle McLeod, Dr. James
L. Klotz, Dr. Vaughn Holder, and Dr. Brian Stevenson.
I also want to thank the staff at our laboratory and animal research center beef unit
for always helping in my research projects, Winston Lin, Adam Bohannon, Cynthia
Roberts, Kirk Vanzant, and Lauren Clark.
To my great friends Dr. Suelen Avila Haynes and Dr. Cleisy Ferreira do
Nascimento, for helping me throughout my graduate studies and life. I could not endure
the long days of sample collection and the difficulties of graduate school without their
friendship and support.
To my husband, Joseph Morgan Schiff. To my parents, Eliana Ionara de Oliveira
Pesqueira and Dalton dos Santos Pesqueira. To my sister Juliana Pesqueira Gonzalez, and
to my brother-in-law Leonardo Gonzalez. Thank you for you love, guidance, and
motivation. I could never complete this phase of my life without your unconditional
support.
Finally, to my research animals, Baby, Marvin, Milagre, Bruno, Fred, Bob, Gisele,
Lindo, Jasper, Cocoa, Toffee, Miso, Peanut and Candy.

iv
TABLE OF CONTENTS
Acknowledgments………………………………………………………………………..iii
List of tables………………………………………………………………….….…....….vii
List of figures……………………………………………………………………………..ix
Frequently used abbreviations…………………………………………………………......x
Chapter 1. Introduction……………………………………………………………….……1
Chapter 2. Literature Review……………………………………………………………....3
2.1. Metabolism of carbohydrates by rumen microorganisms…………....…….….3
2.2. Ruminant animal metabolism of carbohydrates and fermentation products…..9
2.3. Metabolic impacts of a high-grain diet in cattle………………………..…….11
2.4. Monensin…………………………………………………………………….12
2.5. Tylosin……………………………………...…………………………..……14
2.6. Lactobacillus acidophilus and Enterococcus faecium………………….....…15
2.7. Aspergillus oryzae fermentation extract with α-amylase activity………....…17
2.8. Vitamins and minerals………………………………………………….....…18
2.9. Conclusions..………………………………………………………………...26
Chapter 3. Mechanisms of Programmed Nutrition in finishing cattle in vivo…………......27
3.1. Introduction………………………………………………………………….27
3.2. Materials and Methods………………………………………………………31
3.2.1. Animals and Experimental Design…………………………….…..31
3.2.2. Intake and Body Weight………………………..…………....….…32

v
3.2.3. Ruminal Metabolism……..………………………………………..32
3.2.4. Digestibility, Nitrogen, and Energy Balance……..………...….…..33
3.2.5. Protein Turnover……………………………………..…….………36
3.2.6. Blood Plasma Analysis……………..…………………….…...…...38
3.2.7. Statistical Analysis……………..………………………………….39
3.3. Results……………………………………………………………………….39
3.3.1. Intake, Digestibility, and Gain…………………………..…….…...39
3.3.2. Ruminal Metabolism…………………………………………..…..40
3.3.3. Nitrogen Balance…………………………….……………....…….41
3.3.4. Indirect Calorimetry and Energy Balance……………….……....…41
3.3.5. Protein Turnover…………………………………………….…......42
3.3.6. Blood Plasma Insulin…………………………………………........43
3.4. Discussion…………………………………………………………………...43
3.5. Conclusions………………………………………………………………….51
Chapter 4. In vitro ruminal fermentation patterns of Aspergillus oryzae fermentation extract
with α-amylase activity……………………………………………………………….….67
4.1. Introduction………………………………………………………………….67
4.2. Material and Methods…………………………………………………....…..71
4.2.1. Donor animals and diet………………………………………….....71
4.2.2. Assay development……….………………………….…………….72
4.2.3. In vitro gas production and starch degradation of different
feedstuff……………………………………………………………….....77
vi
4.2.4. Calculations………………………………………………………..83
4.2.5. Statistical Analysis……………………….………………………..88
4.3. Results…………………………………………………………………….…89
4.3.1. Assay development………….……………………………………..89
4.3.2. In vitro gas production and starch degradation of different
feedstuffs………………………………………………..………………..90
4.4. Discussion………………………………………………………………...…95
4.5. Conclusion…………………………………………………….……………102
Chapter 5. Summary and Conclusions…………………………………………………..114
Bibliography………………………………………….………………………………...118
Vita……………………………………………………………………………………...147

vii
LIST OF TABLES
Table 3.1. Composition of treatments Control (C; conventional trace mineral supplement),
Program Nutrition (PN; Beef Nutritional Program Finisher; Alltech Inc., Nicholasville,
KY), Monensin + Tylosin (MT; Elanco Animal Health, Greenfield, IN), and Program
Nutrition + Monensin + Tylosin (PNMT) offered to animals on an as-fed basis (75
g/head/day)…………………………………………………………………………….....53
Table 3.2. Timeline for each experimental period (4 periods total) of in vivo study……...54
Table 3.3. Composition of diet offered to animals at 2.0 x NEm in in vivo study……...…55
Table 3.4. Least square means of feed intake and digestibility parameters, water intake and
average daily gain in steers supplemented with Program Nutrition Finisher (Beef
Nutritional Program Finisher; Alltech Inc., Nicholasville, KY) and Monensin + Tylosin
(Elanco Animal Health, Greenfield, IN) at 75 g/head/day……………………………..…56
Table 3.5. Least square means for neutral detergent fiber (NDF) and acid detergent fiber
(ADF) parameters in steers supplemented with Program Nutrition Finisher (Beef
Nutritional Program Finisher; Alltech Inc., Nicholasville, KY) and Monensin + Tylosin
(Elanco Animal Health, Greenfield, IN) at 75 g/head/day…………………………..…....57
Table 3.6. Least square means for rumen pH parameters in steers supplemented with
Program Nutrition Finisher (Beef Nutritional Program Finisher; Alltech Inc., Nicholasville,
KY) and Monensin + Tylosin (Elanco Animal Health, Greenfield, IN) at 75
g/head/day..........................................................................................................................58
Table 3.7. Least square means for rumen volatile fatty acids (VFA) in steers supplemented
with Program Nutrition (Beef Nutritional Program Finisher; Alltech Inc., Nicholasville,
KY) and Monensin + Tylosin (Elanco Animal Health, Greenfield, IN) at 75
g/head/day..........................................................................................................................59
Table 3.8. Least square means of nitrogen balance in steers supplemented with Program
Nutrition Finisher (Beef Nutritional Program Finisher; Alltech Inc., Nicholasville, KY) and
Monensin + Tylosin (Elanco Animal Health, Greenfield, IN) at 75 g/head/day………….60

viii
Table 3.9. Least square means of energy balance in steers supplemented with Program
Nutrition Finisher (Beef Nutritional Program Finisher; Alltech Inc., Nicholasville, KY) and
Monensin + Tylosin (Elanco Animal Health, Greenfield, IN) at 75 g/head/day………….61
Table 3.10. Least square means for protein metabolism in steers supplemented with Program Nutrition (Beef Nutritional Program Finisher; Alltech Inc., Nicholasville, KY) and Monensin + Tylosin (Elanco Animal Health, Greenfield, IN) at 75 g/head/day……...62
Table 3.11. Least square means for blood plasma insulin in steers supplemented with
Program Nutrition (Beef Nutritional Program Finisher; Alltech Inc., Nicholasville, KY)
and Monensin + Tylosin (Elanco Animal Health, Greenfield, IN) at 75 g/head/day...…....63
Table 4.1. Composition of diet fed ad libitum to rumen fluid donor animals in in vitro
study………………………………………………………………………………..…...104
Table 4.2. Starch content and availability on a dry-matter basis (%) of substrates used for
in vitro gas production analysis and starch degradation (Experiment 1, 2 and 3)……......105
Table 4.3. Effects of substrate and α-amylase (Amaize) inclusion on in vitro gas production
parameters and starch degradation between corn steam-flaked at 26 and 32 lb/bushel, dry
rolled barley and steam-flaked barley (Experiment 1)…………………………………..106
Table 4.4. Effects of corn type and α-amylase (Amaize) inclusion on in vitro gas production
parameters and starch degradation between dry rolled corn, high moisture corn and steam-
flaked at 27 lb/bushel (Experiment 2)………………………………………..107
Table 4.5. Effects of flake density on in vitro gas production parameters and starch
degradation between steam-flaked corn and retrograde steam-flaked corn at 23, 25, 27, 29,
and 31 lb/bushel (Experiment 3)……………………………………………………...…108
Table 4.6. Effects of retrogradation and α-amylase (Amaize) inclusion on in vitro gas
production and starch degradation between steam-flaked corn and retrograde steam-flaked
corn (Experiment 3)……………………………………………………………...……...109
ix
LIST OF FIGURES
Figure 3.1. Treatment average rumen pH over time in steers supplemented with Program
Nutrition (Beef Nutritional Program Finisher; Alltech Inc., Nicholasville, KY) and
Monensin + Tylosin (Elanco Animal Health, Greenfield, IN) at 75 g/head/day……….....64
Figure 3.2. Treatment average of ruminal butyrate molar proportion (moles/100 moles)
over time in steers supplemented with Program Nutrition (Beef Nutritional Program
Finisher; Alltech Inc., Nicholasville, KY) and Monensin + Tylosin (Elanco Animal Health,
Greenfield, IN) at 75 g/head/day…………………………………………………….…...65
Figure 3.3. Treatment average of ruminal butyrate concentration (mM) over time in steers
supplemented with Program Nutrition (Beef Nutritional Program Finisher; Alltech Inc.,
Nicholasville, KY) and Monensin + Tylosin (Elanco Animal Health, Greenfield, IN) at 75
g/head/day…………………………………………………………………………….….66
Figure 4.1. In vitro gas production curve of corn steam-flaked at 26, corn steam-flaked at
32 lb/bushel, dry rolled barley, and steam-flaked barley after 24-hour incubation
(Experiment 1)………………………………………………………………………….110
Figure 4.2. In vitro gas production curve of dry rolled corn, high moisture corn, and corn
steam-flaked at 27 lb/bushel after 24-hour incubation (Experiment 2)………………….111
Figure 4.3. Effects of corn type on in vitro starch degradation after 2 hour incubation
between dry rolled corn, high moisture corn, and corn steam-flaked at 27 lb/bushel
(Experiment 2)………………………………………………………………………….112
Figure 4.4. In vitro gas production curve of steam-flaked corn and retrograde steam-flaked
corn at 23, 25, 27, 29, and 31 lb/bushel after 24-hour incubation (Experiment
3)………………………………………………………………………………………..113

x
FREQUENTLY USED ABBREVIATIONS
ADF Acid Detergent Fiber
ADG Average Daily Gain
AF As-Fed
ATP Adenosine triphosphate
BW Body Weight
CH4 Methane
CO2 Carbon Dioxide
CP Crude Protein
d Day
DE Digestible Energy
DM Dry Matter
DMI Dry Matter Intake
DRB Dry Rolled Barley
DRC Dry Rolled Corn
h Hour
HMC High Moiusture Corn
HP Heat Production
IU International Units
M Monensin
min Minute
ME Metabolizable Energy
MT Conventional trace mineral supplement + Monensin + Tylosin
N Nitrogen
NDF Neutral Detergent Fiber
O2 Oxygen
OM Organic Matter
OMI Organic Matter Digestibility
PN Programmed Nutriton Beef Finisher
PNMT Programmed Nutrition Beef Finisher + Monensin + Tylosin

xi
RE Retained Energy
Retro Retrograde steam-flaked corn
SEM Standard Error of the Mean
SFB Steam-Flaked Barley
SFC Steam-Flaked Corn
T Tylosin
VFA Volatile Fatty Acid

1
CHAPTER 1.
Introduction
Beef cattle usually consume forage-based diets prior to entry in the feedlot, where
they are finished on high-grain or high-concentrate diets. These high-grain diets are offered
to cattle because of their high energy content. The transition from a forage-based diet to a
grain-based diet can create metabolic disorders that cause negative impacts on animal
health and performance. One of the metabolic disorders associated with grain-based diets
is ruminal acidosis, driven by rapid hydrolysis of starch by rumen microorganisms. The
consumption of rapidly fermentable carbohydrates can cause an accumulation of volatile
fatty acids and lactate in the rumen, depressing rumen pH and inducing rumen acidosis.
Monensin and tylosin are commonly fed in feedlots to prevent these negative
impacts that can occur during the transition phase. Monensin is an ionophore antibiotic that
can prevent decreases in rumen pH by reducing lactic acid production and increasing
propionate production in the rumen. Tylosin is a macrolide antibiotic that has been shown
to reduce liver abscess by inhibiting Fusobacterium necrophorum growth, the primary
microorganism associated with liver abscess when animals experience rumen acidosis.
Programmed Nutrition (Beef Finisher; Alltech Inc.) is a blend of proteinated trace
minerals, Aspergillus oryzae fermentation extract, Lactobacillus acidophilus, and
Enterococcus faecium fermentation products. Previous studies have shown that
Programmed Nutrition can promote animal feedlot performance similar to conventional

2
feedlot feed additive systems. This product aims to improve animal health and productivity
without using ionophore and antibiotic feed additives such as monensin and tylosin.
Aspergillus oryzae fermentation extract with α-amylase activity (Amaize) is one of
the Programmed Nutrition Beef Finisher components. The effects Aspergillus oryzae on
the rumen can vary greatly. Some studies observed differences in rumen variables, while
others reported no changes. There is no clear understanding of the mechanisms of action
of Aspergillus oryzae fermentation extract with α-amylase activity and how it affects
feedstuffs in the rumen.
The goal of this dissertation was to understand how Programmed Nutrition Beef
Finisher compares to a traditional feedlot program nutrition (monensin + tylosin) when
analyzing ruminal and whole-body variables in vivo. Since Aspergillus oryzae fermentation
extract with α-amylase activity (Amaize) is a Programmed Nutrition Beef Finisher
component, we evaluated its effects on in vitro activity when incubated with different
feedstuffs. This would allow a better understanding of how Amaize impacts ruminal
fermentation and starch degradation of different grain types.
effects of
Copyright © Amanda Pesqueira Schiff 2022

3
CHAPTER 2.
Literature Review
2.1. Metabolism of carbohydrates by rumen microorganisms
Microorganisms in the rumen can digest structural and non-structural
carbohydrates present in the feed (Schofield et al., 1994; Dai et al., 2015). Via anaerobic
fermentation, rumen microbes utilize carbohydrates to generate energy for maintenance
and growth (Baldwin and Allison, 1983). Microbial enzymes break down polysaccharides
such as cellulose, hemicellulose, pectin, and starch to monosaccharides such as glucose,
fructose, and xylose. Lignin is not degraded during anaerobic fermentation since it is a
hydrophobic polymer with aromatic phenolic residues that require oxygen for its
degradation (White et al., 2014). Cellulose is a straight-chain polymer composed of
repeating glucose units linked via β-1,4-glycoside bonds (Schwarz, 2001). This linear chain
allows the formation of hydrogen bonds within the polymer, which gives structural rigidity
to the molecule (Bayer et al., 1998). Hemicellulose is also a linear chain formed by xylose
chains with arabinose, galactose, and uronic acids. Pectins are linear chains composed of
galacturonic acid with other sugars within or as side chains (Schwarz, 2001). Starch is
composed of amylose and amylopectin, where the first is a mostly linear α-1,4-glucan, and
the second is an α-1,4-glucan with α-1,6-linkages at the branch point (Bastioli et al., 2014).

4
Rumen microorganisms attach to feed particles via specific and nonspecific
adhesion mechanisms (Pell and Schofield, 1993). Generalized low-affinity forces such as
van der Waals forces are involved in nonspecific adhesion, which can be reversible or
irreversible governed by Brownian motion (Staat and Peyton, 1984; Busscher and
Weerkamp, 1987). Specific adhesion occurs via ligands or lectin-like adhesions on the
bacterial cell surface and receptors on the feed particle (Gibbons, 1984). Bacteria can
present different adhesions, allowing attachment to other surface receptors (Van der Mei
et al., 1987). The affinity of bacterial starch surface receptors decreases when starch is
treated with mixtures of alcohol and HCl, which indicates that cereal grains treated with
similar compounds can have lower starch digestion rates due to lower bacterial attachment
(McAllister et al., 1994).
Starch-degrading rumen bacteria produce enzymes with α-amylase activity that
generates specific groups of oligosaccharides (Cotta, 1988). Enzymes of starch-degrading
bacteria can be located in the bacterial periplasm or cytoplasm, where starch is transported
across the outer membrane to these sites via cell-surface proteins (Anderson and Salyers,
1989a, 1989b). Starch-degrading bacteria produce enzymes capable of starch digestion but
do not produce the variety of enzymes required to digest the entire cereal grain, so they
must rely on other bacterial species enzyme activities to gain access to starch granules
(Cotta, 1988; McAllister et al., 1994). Bacteria and fungi access the readily digestible inner
tissues via vulnerable regions of the plant tissues such as the stomata and damaged areas
(McAllister et al., 1994).
Fungi can reach regions of the plant that bacteria can’t due to their ability to
penetrate the plant tissue and generate additional sites for bacterial attachment and produce

5
extracellular enzymes that degrade the plant cell wall (Pell and Schofield, 1993). Fungi
zoospores rapidly attach to feed particles, encyst, introduce their hyphae into the plant
tissue and further grow rhizoids into the plant cell wall, which weakens the plant tissue and
facilitates bacterial attachment (Bauchop, 1981; Akin, 1986). Rumen conditions affect the
anaerobic fungi population. Zoospore production and attachment to feed particles
decreases when rumen pH is below 5.5, and reduction of acetate:propionate ratio causes a
decline in the fungal population (Grenet et al., 1989).
Microorganisms metabolize pentoses by converting three pentoses into two
hexoses and one triose, via transaldolase and transketolase (Wallnofer et al., 1966; Baldwin
and Allison, 1983). The Embden-Meyerhof pathway is the primary pathway utilized by
microbes to generate energy (ATP) during hexose fermentation. In glycolysis, hexoses can
be converted to 2 pyruvate molecules via H2-forming/electron-donating reactions, utilizing
2 NADH and 2 ADP, and generating 2 NAD+ and 2 ATP molecules (Baldwin and Allison,
1983). Carbohydrate anaerobic fermentation generates microbial protein and metabolites
that can be utilized by the animal host (Ceconi et al., 2015). Volatile fatty acids (VFA),
lactate, methane (CH4), CO2, and H+ are byproducts of the microbial synthesis of adenosine
triphosphate (ATP) (Thauer et al., 1977). Formation of byproducts occurs to maintain the
hydrogen balance in the system via H2-consuming/Electron-accepting and H2-
forming/Electron-donating partial reactions (Baldwin and Allison, 1983).
Volatile fatty acids (VFA), also called short-chain fatty acids (SCFA), are weak
acids (pKa ≤ 4.8) that can exist in the dissociated anion or ionized state. In the rumen, these
acids include formate (C1), acetate (C2), propionate (C3), butyrate (C4), valerate (C5),
isobutyrate (C4), isovalerate (C5), and 2-methylbutyrate (C5) (Bergman, 1990). Acetate is

6
produced when pyruvate is converted to acetyl-CoA, which has its CoA group replaced by
a phosphate (Pi) forming acetyl-P that can be converted to acetate by donating its phosphate
group to ADP to generate ATP (Thauer et al., 1977). Propionate can be produced by
succinate or acrylate pathways. In the succinate pathway, pyruvate is converted to
oxaloacetate using one ATP, which is reduced to malate that is later converted to fumarate,
and succinate is formed from fumarate by oxidizing NADH. Succinate can be converted to
succinyl-CoA by utilizing the CoA group from propionyl-CoA, releasing propionate. The
last cycle can be repeated since succinyl-CoA can be rearranged to form methylmalonyl-
CoA, which can be converted to propionyl-CoA and reutilized in the previous reaction.
The acrylate pathway occurs when pyruvate is reduced to lactate, a mechanism used to
remove intracellular H+ and control intracellular pH (Baldwin and Allison, 1983). To
regenerate NAD+ used in glycolysis, pyruvate can be converted to lactate by microbial
lactate dehydrogenase via H2-consuming/electron-accepting process where pyruvate
accepts electrons from NADH. Once lactate is formed, it can be used to produce lactyl-
CoA, using an acetyl-CoA and releasing an acetate. Lactyl-CoA is dehydrated, forming
acryloyl-CoA that is reduced to propionyl-CoA, that can be used with an acetate to produce
propionate. Butyrate (VFA) is generated by converting two molecules of acetyl-CoA to
acetoacetyl-CoA, which is reduced to β-hydroxybutyryl-CoA, dehydrated to crotonyl-CoA
and reduced to butyryl-CoA. The CoA group is then replaced by a phosphate (Pi), forming
butyryl-P, which is dephosphorylated into butyrate, releasing an ATP (Thauer et al., 1977).
Lactate is an organic acid (pK = 3.86) that can be synthesized from pyruvate, as mentioned
previously. Lactate in the rumen can be converted to propionate via acrylate pathway, to

7
acetate and to butyrate by being oxidized back to pyruvate (Johns, 1951a, 1952; Jayasuriyal
and Hungate, 1959; Satter and Esdale, 1968; Russell, 1998; Mills et al., 2014).
Gaseous H2 is produced during the oxidation of NADH to NAD+ by enzymes
present in the bacterial membrane. Synthesis of two molecules of pyruvate from glucose
via Embden-Meyerhof pathway yields two H2, and production of one molecule of acetate
from pyruvate yields one H2 and one CO2. Other reactions serve as H2 sinks, where
conversion of one pyruvate to one propionate consumes two H2. Conversion of two acetyl-
CoA to one butyrate consumes two H2. Methanogenic bacteria can utilize four H2 and one
CO2 to synthesize one methane (CH4) and two H2O (Hino and Russell, 1985; Moss et al.,
2000; White et al., 2014).
It has long been desired of researchers to acquire control of rumen microbial
metabolism in order to optimize metabolite utilization by the animal and improve economic
feedback. Ruminal fermentation modifiers such as monensin and tylosin have been used to
manipulate rumen function for many years. Some effects of monensin on rumen
fermentation pattern are well established, but its complete mode of action is not yet clearly
understood. Monensin can affect rumen fermentation patterns by inhibiting the growth of
gram-positive organisms, increasing the molar proportion of propionate, and decreasing
acetate (Richardson et al., 1976). This effect of monensin on VFA proportions can increase
feed efficiency since the microbial synthesis of propionate is more energetically
advantageous (Hungate, 1966). The impact of monensin on the rumen microbial population
has been studied previously, and its changes on the rumen microbiome can vary. It has
been shown that monensin can decrease ruminal protozoal numbers (Guan et al., 2006),
while other studies did not detect changes in the protozoal population (Dinius et al., 1976).
8
These differences could be due to the levels of monensin supplementation and the capacity
of protozoal populations to adapt to the ionophore. The effects of monensin on ruminal
bacterial have also been reported, where monensin has been found to inhibit formate-
producing, hydrogen-producing, and lactic acid-producing bacteria, while stimulating
succinate-producing and propionate-producing bacteria (Chen and Wolin, 1979; Dennis et
al., 1981). Dennis et al. (1981) reported that monensin only inhibited four out of seven
different lactic-acid producing bacteria but did not affect three strains of bacteria that
convert lactate to propionate. These findings suggest that monensin may decrease lactate
synthesis in the rumen without affecting lactate to propionate metabolization.
Direct-fed microbials also have been used to manipulate rumen microbial
fermentation patterns. Bacterial strains from the genera Propionibacterium and
Lactobacillus have the potential to reduce CH4 synthesis by converting lactate to
propionate in the rumen (Jeyanathan et al., 2016; Vyas et al., 2016). These improvements
in CH4 might not be observed when animals consume grain-based diets once propionate
levels are already high with increased rapidly fermented carbohydrate intake (Vyas et al.,
2014). The reduction in CH4 production is not always accompanied by changes in
propionate synthesis (Vyas et al., 2014; Jeyanathan et al., 2016), which indicates that H+
availability is not the only factor in CH4 synthesis. Direct-fed microbials have the potential
capacity to modify methanogenic bacterial and archaeal profiles (Janssen and Kirs, 2008;
Poulsen et al., 2013). The capacity of direct-fed microbials to modify the rumen microbial
environment is correlated to the extent of their ruminal survival and activity (McAllister et
al., 2011; Jeyanathan et al., 2016). The reason why direct-fed microbials are usually fed on
a daily basis is that they have difficulties integrating permanently with the rumen microbial

9
community, even if the direct-fed microbials are originated from rumen sources
(McAllister et al., 2011). One of the factors influencing the integration of direct-fed
microbials in the rumen is quorum sensing, the release of small signal molecules as a
method of communication between bacterial cells (Mitsumori et al., 2003). It is not known
currently if direct-fed microbials use the same set of signal molecules to communicate as
the microorganisms present in the rumen.
Direct-fed microbials fed to ruminants often combine lactic acid-producers and
lactic acid-utilizers. The rationale for this system is that lactic acid synthesis in the rumen
promotes the growth of lactic-acid utilizing bacteria, generally converting lactic acid to
propionate (McAllister et al., 2011). The additional population of lactic-acid utilizers fed
via direct-fed microbials would ensure all lactic acid produced in the rumen is rapidly
metabolized. This would avoid possible metabolic disorders caused by lactic acid
accumulation in the rumen (Owens et al., 1998; Krause and Oetzel, 2006). A decrease in
ruminal lactate does not always occur with the supplementation of direct-fed microbials.
Kenney et al. (2015a) reported no differences in the ruminal rate of lactate disappearance
when supplementing a direct-fed microbial containing primarily Lactobacillus acidophilus
and Enterococcus faecium indicating that potentially not all species of lactate-producing
direct-fed microbials alter ruminal dynamics in the same fashion.
2.2. Ruminant animal metabolism of carbohydrates and fermentation products
The majority of carbohydrates in the feed ingested by the animal are fermented in
the rumen, generating microbial mass and other byproducts as described previously. Most

10
animal energy requirements are met via absorption of VFA produced during anaerobic
fermentation in the rumen (Hungate, 1966; Baird et al., 1980). Volatile fatty acids are
mainly absorbed via passive diffusion by the rumen epithelium (> 90%), and a small
portion can escape the rumen and be absorbed in the small intestine (Harfoot, 1978).
Rumen epithelial cells metabolize mostly butyrate, to some extent propionate, and
negligent amounts of acetate (Pennington, 1951; Bergman, 1990). All three VFAs can be
oxidized via the Krebs Cycle in the mitochondria of rumen epithelial cells. A small portion
of propionate can also be converted to lactate (Weekes, 1974) and alanine (Bergman,
1990). Butyrate can also be converted to ketone bodies (β-hydroxybutyrate and
acetoacetate) in the mitochondria of the rumen epithelial cell (Pennington, 1951; Leighton
et al., 1983).
The portion of products that were not metabolized by the rumen epithelial cells are
transported to the bloodstream, reaching the liver via the hepatic portal vein (Baird et al.,
1980; Harmon et al., 1988; Bergman, 1990; Kristensen and Harmon, 2004). Acetate is
usually not metabolized to a great extent by hepatocytes. It is utilized as an energy source
mostly by the peripheral tissues and some by the portal-drained viscera (gastrointestinal
tract, pancreas, spleen, and associated omental and mesenteric fat) (Holdsworth et al.,
1964; Bergman and Wolff, 1971; Demigne et al., 1986; Seal and Reynolds, 1993).
Propionate is mainly converted to glucose by the hepatocytes and released into the
bloodstream to other tissues (Bergman, 1990; Harmon et al., 1993; Reynolds, 2002).
Butyrate is converted to β-hydroxybutyrate, similarly to the rumen epithelial cells. The
ketone bodies produced by the rumen epithelial cells also reach the hepatic portal vein,
where acetoacetate is converted to β-hydroxybutyrate by the hepatocytes. The β-

11
hydroxybutyrate present in the liver is then transported to the hepatic vein, where it can
reach peripheral tissues (Bergman, 1970; Demigne et al., 1986; Reynolds, 2002).
The gases CO2 and CH4 are released via eructation, but a small portion of CH4 can
be absorbed by the rumen epithelium, transported by the bloodstream to the lungs, where
it is expired into the environment (Johnson and Johnson, 1995; Freetly and Brown-Brandl,
2013). The fraction of carbohydrates that did not ferment in the rumen can flow into the
small intestine, where it is hydrolyzed by pancreatic and intestinal enzymes to produce
glucose that is absorbed (Owens et al., 1986; Shirazi-Beechey et al., 1991a).
2.3. Metabolic impacts of grain-based diets in cattle
High-grain diets promote a greater concentration of glucose in the rumen due to the
cleavage of starch by microorganisms. This glucose accumulation can lead to the rapid
growth of microbial populations, which promotes VFA and lactate production (Owens et
al., 1998; Sutton et al., 2003; Penner et al., 2009). An increase in starch and other rapidly
fermentable carbohydrates consumption can lead to the accumulation of these organic
acids, which can depress rumen pH (Owens et al., 1998; Vasconcelos and Galyean, 2008).
Lactate and VFA absorption through the rumen wall are higher when protonated and rumen
pH is low (Bergman, 1990). Lactate is a stronger acid and less protonated than VFA,
leading to an easier accumulation of this metabolite in the rumen (Mills et al., 2014).
Ruminal acidosis can be classified as subacute (SARA) when rumen pH is below
5.5 for a minimum of 3 hours. Acute acidosis is characterized by a rumen pH below 5.0
(Owens et al., 1998; Krause and Oetzel, 2006). Subacute acidosis is characterized by the

12
accumulation of VFA in the rumen, while lactate accumulation is the main factor driving
acute acidosis (Therion et al., 1982; Krause and Oetzel, 2006; Nagaraja and Titgemeyer,
2006). Lactate-utilizing microorganisms are sensitive to low pH, but lactate-producers are
not, promoting lactate accumulation in the rumen when pH is low (Owens et al., 1998).
For this reason, during subacute acidosis, lactate-utilizing bacteria are actively
metabolizing lactate which avoids an accumulation of this acid (Goad et al., 1998). But as
pH drops even further, the growth of lactate-utilizers is inhibited, causing lactate
accumulation (Krause and Oetzel, 2006; Nagaraja and Titgemeyer, 2006).
When the metabolite concentration in the rumen increases rumen, osmolarity
increases, moving water from the blood through the rumen wall to the rumen lumen. This
water movement can cause damage to the rumen epithelium (rumenitis), which can later
be a port of entry for microorganisms that cause rumen and liver abscesses (Nagaraja and
Chengappa, 1998; Steele et al., 2011). The repair of the damaged rumen wall can cause
thickening of the tissue (parakeratosis) which can reduce VFA absorption, ultimately
causing its accumulation in the rumen lumen (Harris, 1965).
2.4. Monensin
Monensin is a monovalent carboxylic polyether ionophore antibiotic produced by
Streptomyces cinnamonensis bacteria (Agtarap et al., 1967; Day et al., 1973; Pressman and
deGuzman, 1976; Butaye et al., 2003). This ionophore structure comprises a
hydrophobic/lipophilic alkyl backbone and an internal oxygen-rich polar cavity that can
bind to metal ions while shielding their charge. This structure allows the antibiotic to

13
transport alkali metal cations Na+ > K+ > Rb+ > Li+ > Cs+ (affinity order) across biological
membranes, disrupting the ion transport system and permeability of prokaryotes and
eukaryotes cells. Factors affecting cation affinity to monensin are cation size, ligand
distribution, and ionophore flexibility. In normal conditions, the concentration of Na+ is
high in the extracellular environment, and of K+ is high intracellularly. Monensin can
penetrate the cell membrane, disrupt this cation balance, and cause cell death (Lutz et al.,
1971; Pressman and deGuzman, 1976; Pangborn et al., 1987; Dorkov et al., 2008; Kevin
II et al., 2009). The ionic gradient imbalance triggers Na+/K+-ATPase that uses ATP to
pump Na+ from the cytoplasm. The energy expenditure required to maintain ion balance
within the cell leads to inhibition in cell growth and later cell death (Ferguson et al., 2006;
Wang et al., 2006; Newbold et al., 2013). Due to its high molecular weight, monensin can
penetrate the membrane of gram-positive but usually not gram-negative bacteria. The outer
membrane present in gram-negative bacteria is impermeable to hydrophobic/lipophilic
compounds, preventing monensin from entering the cell (Alleaume and Hicke, 1972;
Guyot et al., 1993; Kevin II et al., 2009).
Monensin is a sodium salt can be used as a dietary supplement for cattle to increase
feed efficiency, decrease fasting heat production, improve dry matter digestibility and
nitrogen balance. Ruminal parameters are also enhanced with monensin, where the
reduction of lactic acid production aids in maintaining a greater rumen pH (Steen et al.,
1978; Goodrich et al., 1984; Duffield et al., 2012). Monensin also increases the ruminal
molar percentage of propionic acid while decreasing acetic and butyric acid. Which leads
to a higher glucose supply from gluconeogenesis of propionate in the liver (Richardson et
al., 1976; Prange et al., 1978; Lomax et al., 1979; Baird et al., 1980).

14
Monensin can be used to prevent the negative impacts of diets high in rapidly
fermentable carbohydrates in ruminants. This antibiotic can allow a higher intake of rapidly
fermented carbohydrates without causing metabolic disturbances (Burrin and Britton,
1986; Burrin et al., 1988). Monensin and tylosin can aid ruminal adaptation during the
transition from a low grain to a high grain diet, reducing daily intake variances and
improving animal performance (Burrin et al., 1988). When monensin and tylosin are fed
to feedlot cattle consuming grain-based diets, it can improve gain:feed by reducing dry
matter intake (Potter et al., 1985; Stock et al., 1995). It has been reported that when
monensin is fed to feedlot cattle, it can cause 1.6% faster weight gain, increase ribeye area
by 0.61%, reduce animal energy requirements, improve dietary energy values and improve
apparent digestibility by 6.5% (Goodrich et al., 1984).
2.5. Tylosin
Tylosin is a macrolide antibiotic formed by a 16-member lactone ring with one
monosaccharide formed by a mycinose residue at position 14 and two disaccharides formed
by mycaminose and mycarose residues at positions 5 and 16. This macrolide also contains
a reactive acetaldehyde group at position 6 (Sumbatyan et al., 2003; Aronson, 2016;
Papich, 2016). Tylosin affects gram-positive and some gram-negative bacteria, causing cell
death by inhibiting bacterial protein synthesis. It causes mechanical obstruction to the
nascent polypeptide chain. The macrolide binds approximately 20Å from the peptidyl
transferase center in the 50S bacterial ribosome, placing its lactone ring orthogonally to the
ribosomal tunnel, where nascent polypeptide chains emerge during protein synthesis
15
(Schlunzen et al., 2001; Hansen et al., 2002; Sumbatyan et al., 2003). The wide use of
Tylosin raises concerns due to acquired resistance observed in potential human pathogens
such as Enterococcus faecium (Aronson, 2016).
Liver abscesses can occur when the animal is experiencing rumen acidosis. It is
characterized as a pus-filled capsule with necrotic centers containing degenerated
hepatocytes and leukocytes. Fusobacterium necrophorum is the primary ruminal
microorganism associated with liver abscesses in cattle. This gram-negative bacteria is
resistant to monensin and can gain access to the bloodstream and the liver when the rumen
epithelial wall is damaged during acidosis (Tan et al., 1996; Narayanan et al., 1997;
Nagaraja and Chengappa, 1998; Nagaraja et al., 2005; Steele et al., 2011; Amachawadi et
al., 2017). Tylosin can be included in the diet of ruminants to reduce the growth of
Fusobacterium necrophorum in the rumen and liver (Lechtenberg et al., 1998; Nagaraja
and Chengappa, 1998; Nagaraja et al., 1999; Amachawadi et al., 2017).
2.6. Lactobacillus acidophilus and Enterococcus faecium
Gram-positive lactate-producing bacteria Lactobacillus acidophilus and
Enterococcus faecium are commonly supplemented as antibiotic alternatives to ruminants.
These probiotics can be used to assist microbial adaptation to the presence of lactic acid in
the rumen. Low and sustained production of lactic acid by lactate-producing bacteria can
stimulate the growth of lactic acid-utilizing bacteria, which would stabilize rumen pH when
an accumulation of lactic acid occurs in later stages of acidosis (Owens et al., 1998;

16
Ghorbani et al., 2002; Nocek et al., 2002; Callaway and Ricke, 2012). Higher rumen pH
can lead to higher DMI and feed digestibility (Nocek et al., 2003; Nocek and Kautz, 2006).
Outcomes can vary when supplementing probiotics to cattle due to differences in
diet composition, animal characteristics, and probiotic dosage. Vasconcelos et al. (2008)
observed in steers a 2 to 3% increase in feed efficiency when supplementing gram-positive
lactate-utilizer Propionibacterium freudenreichii (1 x 10⁹ cfu/steer/d) with Lactobacillus
acidophilus at low (1 x 10⁷ cfu/steer/d) and high (1 x 10⁹ cfu/steer/d), but not at medium
(1 x 10⁸ cfu/steer/d) doses. Timmerman et al. (2005) observed an increase in ADG and feed
efficiency when supplementing calves with a calf-specific multistrain probiotic containing
Lactobacillus acidophilus and Enterococcus faecium. Dawson et al. (1990) observed an
increase in rumen pH when supplementing steers with yeast Saccharomyces cerevisiae
(2.04 x 10⁹ cfu/g), Lactobacillus acidophilus (1.31 x 10⁸ cfu/g), and Enterococcus faecium
(7.5 x 10⁵ cfu/g). Kenney et al. (2015a) did not observe differences in DMI, ADG, growth
efficiency, DM digestibility, nitrogen digestibility, rumen pH, and rumen lactate
disappearance when supplementing steers with Lactobacillus acidophilus, Enterococcus
faecium, Pediococcus acidilactici, Lactobacillus brevis, and Lactobacillus plantarum (1 x
109 cfu/steer/d). However, Kenney et al. (2015b) demonstrated that degradable intake
protein content in the animal diet influences the response to probiotic supplementation. In
Kenney et al. (2015b) study, animals receiving a mixed bacterial culture consisting
primarily of Lactobacillus acidophilus and Enterococcus faecium (1 x 10⁹ cfu/steer/d)
presented a cubic increase in ADG when consuming degradable intake protein above the
calculated animal requirement. Their data suggests that greater degradable protein content
in the diet might be required to maximize the benefits of probiotic supplementation.

17
2.7. Aspergillus oryzae fermentation extract with α-amylase activity
The yeast Aspergillus oryzae can produce starch-degrading enzymes (amylase and
amyloglucosidase) and proteolytic enzymes (Fogarty and Kelly, 1979; Boing, 1983).
Adding of this yeast to the rumen environment can modify the microorganism population
and fermentation pattern (Newbold, 1996). Yeast can remove oxygen from the rumen
preventing toxicity to anaerobe microorganisms (Newbold et al., 1993, 1996). Lactic acid
utilization can be improved with yeast supplementation since many anaerobic bacteria are
lactate-utilizers (Nisbet and Martin, 1990, 1991; Williams et al., 1991; Martin and Nisbet,
1992). A drop in rumen pH can be avoided by preventing lactate accumulation in the
rumen, leading to enhanced growth of pH-sensitive microorganisms (Owens et al., 1998).
Results regarding changes in ruminal fermentation with Aspergillus oryzae
supplementation can vary. An increase in total VFA concentrations has been observed
(Nisbet and Martin, 1991; Varel and Kreikemeier, 1994b) and increased molar proportions
of acetate and propionate (Harrison et al., 1988; Nisbet and Martin, 1991). In contrast, other
studies obtained no differences in VFA (Carro et al., 1992; Caton et al., 1993; Fiems et al.,
1993; Higginbotham et al., 1994). The reason of why theses discrepancies in response to
VFA metabolism occurs are not yet well understood. Aspergillus oryzae can improve
cellulose digestion by stimulating increase in concentration of fibrolytic bacteria in vivo
(Wiedmeier et al., 1987; Harrison et al., 1988; Newbold et al., 1992; Newbold, 1996) and
in vitro (Dawson et al., 1990; Newbold et al., 1991).
Aspergillus oryzae can supply limiting amino acids required for the growth of
specific microbial populations, improving microbial protein synthesis (Erasmus et al.,
18
1992; Newbold, 1996). Other studies have found no difference in ruminal microbial
populations with Aspergillus oryzae supplementation (Oellermann et al., 1990; Varel and
Kreikemeier, 1994b), indicating that this effect can vary depending on feed ingredients
used in the animal diet. Overall, an increase in microbial populations in the rumen can
increase feed digestibility which can increase passage rate, leading to a higher intake and
gain (Newbold, 1996). Increases in ADG have been observed when supplementing steers
with Aspergillus oryzae (Allison and McCraw, 1989). Calves supplemented with this yeast
were weaned one week earlier and presented higher numbers of ruminal bacteria and rumen
fermentation activity (Beharka et al., 1991).
2.8. Vitamins and minerals
Vitamin and mineral supplements are used in the diet of cattle to meet the animal
and microbial requirements. Vitamins A, D, E, and K are classified as lipid-soluble.
Choline, biotin, folic acid, niacin, riboflavin, thiamin, vitamin C, B12, B5, and B6 are
classified as water-soluble. Minerals calcium (Ca), phosphorous (P), magnesium (Mg),
potassium (K), sodium (Na), chloride (Cl), and sulfur (S) are classified as macrominerals
and are required by beef cattle in grams/day. Meanwhile, cobalt (Co), copper (Cu), iodine
(I), manganese (Mn), iron (Fe), molybdenum (Mo), zinc (Zn), and selenium (Se) are
classified as microminerals or trace minerals, and their requirements are in milligrams or
micrograms/day. Supplementation of some of these vitamins and minerals is often
necessary to meet the requirements due to being insufficient in feedstuffs (NRC, 2016).

19
Vitamin C is not required in the diet of ruminants since it can be synthesized by the
animal. Likewise, vitamin K and water-soluble vitamins can be synthesized by ruminal
bacteria and absorbed by the animal in the small intestine. Vitamin E supplementation for
nonstressed mature beef cattle is likely not necessary as its requirements are low and often
met through feedstuffs in the diet (NRC, 2016). Vitamin A is stored in the liver (Hayes et
al., 1967), is involved in the maintenance of epithelial tissues (Perry and Cecava, 1995),
synthesis of retinaldehyde required for dim light vision (Moore, 1939, 1941; Byers et al.,
1956), and it is essential for bone development, growth and reproduction (NRC, 2016).
Vitamin A toxicity in ruminants is uncommon since microorganisms can degrade it in the
rumen (Rode et al., 1990).
Vitamin D exists in two forms, ergocalciferol (vitamin D2) derived from ergosterol
(plant steroid) and cholecalciferol (vitamin D3) derived from precursor 7-
dehydrocholesterol present in animal tissues and products. Mammals store a limited
amount of vitamin D in tissues (NRC, 2016). Cattle can synthesize vitamin D from 7-
dehydrocholesterol present in the skin with exposure to sunlight. Supplementation of this
vitamin is necessary when cattle populate an area with low levels of sunlight, such as closed
confinement. Vitamin D is required to absorb calcium and phosphorous from the gut
(DeLuca, 1979), bone mineralization, and calcium mobilization from the bone. A limited
amount of this vitamin can be stored in the liver, kidney, and lungs. Vitamin D toxicity can
occur, causing decreases in DMI, calcification of soft tissues, and bone demineralization
(NRC, 2016).
There is a limited amount of information about how monensin and direct-fed
microbials affect vitamin metabolism in ruminants. Agustinho et al. (2021) reported lower
20
somatic cell count when multiparous Holstein dairy cows were fed monensin and vitamin
A, likely due to the capacity of monensin to improve immune function due to better
utilization of endogenous energy sources. High-grain diets can cause a decrease in the
synthesis of true vitamin B12 in the rumen and increase the synthesis of vitamin B12 analogs,
where these analogs cannot act as enzyme cofactors (Sutton and Elliott, 1972). Monensin
supplementation in high-grain diets could decrease liver vitamin B12 status, where true
vitamin B12 synthesis is affected by ruminal propionate synthesis (Sutton and Elliott, 1972;
Daugherty et al., 1986). Daugherty et al. (1986) did not observe improvements in animal
performance when supplementing vitamin B12 and monensin to lambs but reported a
decrease in fumarate and malate production by 50%. They hypothesized that monensin and
vitamin B12 on fumarate and malate production was due to monensin inhibitory effect on
enzymes of the Krebs cycle. Wiedmeier et al. (1987) observed a 27% increase in the
ruminal cellulolytic bacteria when supplementing Aspergillus oryzae fermentation extract.
They hypothesized this growth occurred due to stimulatory factors produced by Aspergillus
oryzae such as B vitamins.
Calcium is primarily present in the bones and teeth (98%), with a small amount
(2%) present in soft tissues and extracellular fluids. Calcium is absorbed mainly from the
duodenum and jejunum via passive diffusion and active transport (McDowell, 2003).
Calcium is required for membrane permeability, muscle contraction, nerve impulse
transmission, hormone secretion, enzyme activity, blood clotting, and cardiac regulation
(NRC, 2016). Phosphorous is found in soft tissue (20%), bone and teeth (80%). It is part
of the structure of DNA and RNA, ATP/ADP/AMP, phospholipids, nucleoproteins,
21
riboflavin-phosphate enzyme complex, diphosphothiamin, pyridoxal phosphate, and
phosphoric acid esters of carbohydrates (Perry and Cecava, 1995; NRC, 2016).
Magnesium is a macromineral present in the bones (65-70%), muscle (15%), other
soft tissues (15%), and extracellular fluid (1%) (Mayland, 1988). It is primarily absorbed
from the rumen via an active sodium-like process (Grace et al., 1974; Martens and
Rayssiguier, 1980; Greene et al., 1983; Greene et al., 1989). Magnesium is required to
activate many enzymes as it is part of the Mg-ATP complex, and it maintains the electrical
potential of membranes of muscle and nerve cells (Perry and Cecava, 1995; NRC, 2016).
Potassium is the cation in higher concentration intracellularly. It is involved in some
enzymatic reactions, acid-base regulation, osmolarity, nerve impulse transmission and
muscle contraction. This mineral is absorbed from the rumen, omasum, and intestine
(NRC, 2016). The major minerals in the extracellular fluid of the cells are the cation sodium
and the anion chlorine (Cl). They are involved in regulating water balance, acid-base
balance, and osmotic pressure within the cell. Sodium is absorbed from the small intestine,
and it is required for glucose and amino acid transport, nerve impulse transmission, and
muscle contraction. Chlorine is absorbed primarily in the intestine and is present in the
hydrochloric acid portion of the gastric juice (Perry and Cecava, 1995; NRC, 2016).
Sulfur is a macromineral in organic compounds such as methionine, cysteine,
cystine (amino acids), thiamin and biotin (vitamin B). Ruminal microorganisms can utilize
inorganic sulfur to synthesize all animal-required organic sulfur-containing compounds.
Sulfur can be toxic in high concentrations (> 0.4% of the diet), causing a reduction in dry

22
matter intake (DMI), slow growth, diarrhea, muscle twitching, and even death (Perry and
Cecava, 1995; NRC, 2016).
Cobalt is utilized by bacteria to synthesize vitamin B12, which is required by
vitamin B12-dependent enzymes methylmalonyl CoA mutase and 5-methyltetrahydrofolate
homocysteine methyltransferase (Smith, 1987). Metalloenzymes ribonucleotide reductases
which reduce ribonucleoside diphosphates (NDP) and triphosphate (NTP) during DNA
synthesis and requires the transition metals Co and Fe (Mulliez and Fontecave, 1997).
Cobalt deficiency can cause weight loss, fatty degeneration of the liver, anemia, and
impaired ability to fight infections (Smith, 1987; MacPherson et al., 1988). Cobalt toxicity
is unlikely to occur since cattle can tolerate up to 100 times its requirement (NRC, 2016).
Copper acts as a component of several enzymes such as cytochrome oxidase and
superoxide dismutase (McDowell, 2003). Its requirement varies depending on the
concentration of antagonistic Mo and S in the diet. Thiomolybdates are formed in the
rumen via molybdate and sulfide interactions (Suttle, 1991). These compounds can form
insoluble complexes with Cu. which affects the absorption and metabolism of this mineral
(Gooneratne et al., 1989). Iodine is mostly present in the thyroid gland (70-80%) as
inorganic iodine, a constituent of the thyroid hormones thyroxine (T4) and triiodothyronine
(T3), and other iodinated compounds (Mertz, 1986). Iodine is mostly absorbed in the rumen
(70-80%), also being absorbed in the small and large intestine. The abomasum is a site of
endogenous secretion (Miller et al., 1973; Miller et al., 1974; Miller et al., 1988).
Manganese functions as both a constituent of metalloenzymes and as an enzyme
activator (McDowell, 2003). It is a component of the enzymes arginase, pyruvate
carboxylase, and superoxide dismutase (Hurley and Keen, 1987). Manganese is also

23
required for the activation of many enzymes such as kinases, decarboxylases, transferases,
and hydrolases (Groppel and Anke, 1971; NRC, 2016). Absorption of Mn is poor and
occurs in the small intestine. In cattle, about 1% of the ingested Mn is absorbed (Abrams
et al., 1977). In ruminants, Mn deficiency can lead to poor soft tissue and bone growth,
muscular weakness, and excess body fat (Thomas, 1970; Hidiroglou, 1980).
Iron is a component of many proteins such as hemoglobin and myoglobin which
are involved in oxygen transport and utilization, cytochromes, and Fe-S proteins which
participate in the electron transport chain. Iron is also required to activate many mammalian
enzymes (McDowell, 2003; NRC, 2016). Iron homeostasis is mainly regulated via
absorption in the gastrointestinal tract due to the limited capacity of Fe excretion by
animals (McDowell, 2003). Iron availability is highest in the ferrous (Fe2+) state (NRC,
2016). Hydrochloric acid present in the abomasum promotes denaturation of protein-
bound Fe, and reduction of ferric (Fe3+) to ferrous state (Fe2+). Cysteine and ascorbic acid
present in the feed can also enhance Fe absorption by assisting the reduction to ferrous
state (Cook and Reddy, 2001). Hemoglobin contains most of the total body Fe (60%), and
the liver is the primary site (60%) of Fe stored in tissues as ferritin protein complex (Beard
and Dawson, 1997; McDowell, 2003).
The role of molybdenum in the metabolism is only partially understood, and its
requirements for cattle are not yet established (NRC, 2016). Molybdenum can improve
microbial metabolism in the rumen, and it is a component of the enzymes xanthine oxidase,
sulfite oxidase, and aldehyde oxidase (Underwood, 1977; Mills and Davis, 1987). Copper
and sulfur are antagonists to Mo, where interactions in the rumen can result in decreased
Mo absorption, limit Cu retention, and alter Mo postabsorptive metabolism (Dick, 1953;
24
Mills and Davis, 1987). High levels of Mo intake can lead to toxicity in cattle, causing
diarrhea, anorexia, stiffness, and changes in hair color (Ward, 1978; Kessler et al., 2012).
Zinc is a component of metalloenzymes and is required to activate some enzymes
involved in protein, carbohydrate, lipid, and nucleic acid metabolism (Hambidge et al.,
1986; Graham, 1991; McDowell, 2003). Zinc is also required by the immune system for
lymphocyte production, antibody response, cytokine synthesis, neutrophil function, T-cell
development and function, and others (Fraker et al., 1977; Hambidge et al., 1986; Fraker
and King, 1998; Shi et al., 1998). In ruminants, Zn is absorbed in the abomasum and the
small intestine (Miller and Cragle, 1965; Arora et al., 1969). Zinc deficiency can
compromise the cellular DNA repair mechanism, which can lead to unrepaired DNA
damage (Mertz, 1986; McDowell, 2003). Zinc is involved in hormone production,
secretion and storage, as well as in the efficiency of receptor response. Its deficiency can
affect testosterone, insulin, and adrenal corticosteroid hormones production and secretion
(McDowell, 2003). Decreases in DMI, growth, feed efficiency, excessive salivation,
listlessness, swollen feet, parakeratotic lesions, impaired wound healing, and alopecia are
observed in cattle consuming a Zn deficient diet (NRC, 2016).
Selenium is a metalloid with similar chemical properties to sulfur, and it is mainly
absorbed in the duodenum and cecum (Wright and Bell, 1966; McDowell, 2003).
Selenometalloenzymes are enzymes that contain Se at the active site and catalyze reactions
involved in thyroid hormone metabolism (iodothyronine 5’-deiodinase), redox control, and
antioxidant defense systems (glutathione peroxidase) (Mertz, 1986; Arthur et al., 1990;
Arthur and Beckett, 1994; Foster and Sumar, 1997; McDowell, 2003). Chronic Se toxicity
causes lameness, anorexia, deformed hoofs, liver cirrhosis, loss of tail hair, nephritis, and

25
emaciation (Rosenfeld and Beath, 1964). Acute Se toxicity can cause diarrhea, ataxia,
difficulty breathing, respiratory failure, and death (NRC, 2016).
Monensin supplementation has the potential to affect mineral metabolism in
ruminants. Monensin can increase sodium-potassium pump activity due to its strong
affinity for Na and K ions (Pressman and deGuzman, 1976; Smith and Rozengurt, 1978).
Monensin fed to steers consuming a grain-based diet can increase apparent absorption of
Mg, P, Na, and increase Mg and P retention (Starnes et al., 1984). Monensin can also
increase apparent absorption of Ca, Mg, K, and P in steers consuming forage-based diets
(Spears et al., 1989). These findings indicate that monensin has the potential to reduce
some mineral requirements of cattle consuming either a grain-based or a forage-based diet.
Kirk et al. (1985a) reported that monensin can alter Na and K metabolism in lambs fed a
high-grain diet. They observed that apparent absorption of Na and K increased when lambs
were fed monensin. They also reported that monensin decreased ileal Na concentrations by
13.8% but did not affect K tissue retention. Kirk et al. (1985b) fed monensin to lambs
consuming a high-grain diet and reported that monensin could increase apparent retention
of Mg by 52.4%, and apparent retention of Zn by 45%. Kirk et al. (1985b) proposed that
the increase in Mg could be due to increased sodium-potassium ATPase-dependent Mg
absorption mechanism, once monensin can drive sodium-potassium pumps. The increase
in Mg absorption and retention driven by monensin could help prevent hypomagnesemia
due to the low content and availability of Mg in forages (Kirk et al., 1985b).
The influence of direct-fed microbials on mineral metabolism is not yet clearly
understood. Gordon et al. (2013) reported no improvements in digestibility of Cu, Zn, Mn,
Co, and Se when horses were fed yeast cultures and direct-fed microbials. Abas et al.

26
(2007) observed that supplementation of direct-fed microbial to lambs could cause an
increase in serum Zn levels. Swyers (2007) reported increased Cu and Fe digestibility when
horses were fed lactic acid bacteria-based direct-fed microbial. Latorre et al. (2015)
observed improvements in bone breaking strength and bone composition when
supplementing direct-fed microbial to broiler chicken. These studies demonstrate the
potential for improvements in mineral absorption, utilization, and digestibility with direct-
fed microbial supplementation.
2.9. Conclusion
There is a growing concern and limitation on the use of antibiotic feed additives. It
is crucial to find alternative supplements to reduce and replace the use of antibiotics while
maintaining animal and economic advancements. Programmed Nutrition Beef Finisher
utilizes microbial fermentation extracts as a possible alternative supplement for antibiotics.
It appears that factors such as type of diet, grain processing method, intake level, duration
of supplementation, and level of supplementation are some of the factors influencing the
response to microbial supplements. More studies are required to better understand the range
of responses obtained when utilizing microbial products in vivo and in vitro.
Copyright © Amanda Pesqueira Schiff 2022

27
CHAPTER 3.
Mechanisms of Programmed Nutrition in finishing cattle in vivo
3.1. Introduction
Programmed Nutrition Beef Program (Alltech Biotechnology Inc., Nicholasville,
KY) is a nutritional program consisting of Programmed Nutrition Beef Receiver and
Programmed Nutrition Beef Finisher, which are formulated to contain proteinated trace
minerals, ascorbic acid, selenium-yeast, Lactobacillus acidophilus and Enterococcus
faecium fermentation products, and either Aspergillus niger (Beef Receiver) or Aspergillus
oryzae (Beef Finisher) fermentation extracts.
Programmed Nutrition Beef Program can potentially reduce the use of feed
additives in conventional feedlot diets such as monensin, an ionophore antibiotic that alters
fermentation and controls coccidiosis (Stock et al., 1995) and Tylosin which decreases the
incidence of liver abscess (Potter et al., 1985). Rumensin® (monensin) and Tylan®
(Tylosin) when fed in combination can reduce dry matter intake (DMI) by 5% and improve
feed conversions by 7% (Elanco Study, 2012). Programmed Nutrition consists of
supplementing Programmed Nutrition Beef Receiver during the step-up period (14
g/head/day) and Programmed Nutrition Beef Finisher (20 g/head/day) during the remainder
of the finishing period. Our study focused on studying the effects of Programmed Nutrition
Beef Finisher once this product is used for a longer period of time during the nutritional

28
program concept and would be more beneficial to understand its mechanism of action. It
was observed that Programmed Nutrition could increase body and carcass weight without
compromising carcass quality and increase DMI while maintaining feed:gain compared to
conventional feed additive programs. However, liver abscess incidence increased in steers
consuming Programmed Nutrition (Jennings, 2013; Phelps et al., 2014; Phelps et al., 2015;
Swingle and Holder, 2015). The mechanism of these effects is unknown and needs to be
better understood.
Phelps et al. (2015) observed that Programmed Nutrition with or without exogenous
growth promotants (ExGP) generates similar feedlot performance, carcass characteristics,
and fatty acid profiles when compared to conventional feedlot systems (Khan et al., 2009),
indicating that it could be an organic alternative to antibiotics. Steers consuming
Programmed Nutrition had greater DMI (Programmed Nutrition /EGP-: 9.85 kg/d;
Programmed Nutrition /EGP+: 11.09 kg/d) compared to Control (Control/EGP-: 9.86kg/d;
Control/EGP+: 10.69 kg/d), but average daily gain (ADG) was not affected (Khan et al.,
2009). However, steers fed Programmed Nutrition had a greater incidence of total liver
abscess than Control (22.5% vs. 12.6%). Jennings et al. (2014) observed that Programmed
Nutrition heifers consumed 0.23 kg/d (8.95 vs. 8.73 kg/d) more than Control animals, and
had a 3% lower feed conversion, but presented similar final body weight (Control: 504 kg;
Programmed Nutrition: 504 kg) and average daily gain (Control: 1.3 kg/d; Programmed
Nutrition: 1.29 kg/d). Liver abscess incidence was similar between the Control (12.5%)
and Programmed Nutrition (18.6%), with a higher incidence score of “A” in the
Programmed Nutrition (2.5% vs 0.7%).

29
In a conventional feedlot setting, Swingle and Holder (2015) compared
Programmed Nutrition with a contemporary diet using 1928 steers consuming steam-flaked
corn and wet distillers grain-based diet. Programmed Nutrition (PN) steers had higher
average carcass weights (PN: 417 kg vs Contemporary: 410 kg), dressed yield (PN: 64.91%
vs Contemporary: 64.45%), longissimus muscle area (PN: 96.3 cm2 vs Contemporary: 92.5
cm2), carcass-adjusted final BW (PN: 644 kg vs Contemporary: 634 kg), carcass adjusted
ADG (PN: 1.75 kg/d vs Contemporary: 1.70 kg/d) and liver abscess prevalence (PN: 26.5%
vs Contemporary: 13.6%).
Supplementing α-amylase to finishing beef cattle can increase weight gain and
improve carcass characteristics. Potentially by shifting the production of volatile fatty acids
(VFA), increasing butyrate production at the expense of propionate. This shift may occur
due to a change in the ruminal microbial population, increasing butyrate-producing bacteria
and reducing starch-utilizing bacteria. Elolimy et al. (2018) supplemented 24 crossbreed
(Simental x Angus) steers with α-amylase (Amaize; Alltech Inc., Nicholasville, KY) at 5
grams/head/d for 140 days in a finishing diet. Alpha-amylase supplementation modified
the gene expression of 21 genes in skeletal muscle, where 14 were up-regulated (NR4A3,
PPARGC1A, ATF3, ABRA, FOXO1, ELL2, DKK2, FNIP2, SLC25A33, LLRN1,
ZNF385B, SYT4, CYTH1, and MPZ) and 7 down-regulated (MIR186, MIR1-1,
LOC100299180, LOC788067, IRF2BPL, LOC785630, and LOC784741) compared to the
control group. Similarly, Graugnard et al. (2015) fed 135 cross-bred yearling steers
consuming a steam-flaked corn diet supplemented with α-amylase (Amaize) at 5
grams/head/d for 160 days. Adipose tissue was collected from 15 steers at days 70 and 160,
and RNA was isolated for analysis. Amaize affected gene expression in the adipose tissue,

30
down-regulating the gene network associated with beta-hydroxybutyrate metabolism. On
day 70, Amaize upregulated growth hormone receptor (GHR) by 1.43-fold, and
peroxisome proliferator-activated receptor gamma coactivator 1 α (PGC1α) by 1.42-fold,
which regulates genes involved in energy metabolism. This indicates that Amaize affects
gene expression related to metabolism and cellular development in the adipose tissue,
which could improve animal performance or affect carcass quality.
These results suggest that the Programmed Nutrition beef program produces growth
responses similar to a conventional feedlot program using Rumensin + Tylan. Also, results
suggest it produces greater carcass weight with no differences in feed efficiency. While
nutritional management that influences carcass growth without affecting animal
performance presents a challenging paradigm to study, we hypothesize that Programmed
Nutrition may influence rumen fermentation since performance is equivalent to monensin,
a known fermentation modifier. Programmed Nutrition may increase butyrate production
at the expense of propionate in the rumen, and differences in carcass weight could be
caused by differences in carcass repartitioning. Monensin feeding produces pronounced
changes in ruminal fermentation that are responsible for the increase in feed efficiency
associated with ionophore feeding.
The objective of this study was to determine the impact of Programmed Nutrition
Beef Finisher versus traditional feedlot additives (Monensin + Tylosin) on ruminal
metabolic changes impacting diet utilization in steers fed a high concentrate diet. The study
focused on rumen metabolism, whole-body nutrient balance, and diet utilization.

31
3.2. Materials and Methods
3.2.1. Animals and Experimental Design
Eight rumen-cannulated Holstein steers (BW = 363 ± 22 kg) were used in a
replicated 4 x 4 Latin square design experiment. The treatments were arranged in a 2 x 2
factorial structure with or without Programmed Nutrition Beef Finisher or
Monensin/Tylosin. Animals received control (conventional trace mineral supplement),
Programmed Nutrition (PN; Programmed Nutrition Beef Finisher), control + Monensin +
Tylosin (MT; Elanco Animal Health, Greenfield, IN), or Programmed Nutrition +
Monensin + Tylosin (PNMT) (Table 3.1). Treatment supplements were added to the diet
at 75 g/head/day. Each experimental period was composed of 27 days (Table 3.2). The
steers were fed a conventional feedlot diet consisting of high moisture corn (60.8%), corn
silage (15%), corn gluten feed (11%), dry distiller grains (8.6%) and a supplement (4.6%)
(Table 3.3). Diet offered started at 2.0 x NEm and intake was equalized during the
adaptation period based on the intake of the lowest consuming treatment. To avoid
metabolic disorders such as liver abscesses (Nagaraja et al., 2005) and rumen acidosis
(Penner et al., 2007; Steele et al., 2009a) steers were adapted to this diet gradually over 21
days on a common control diet receiving control mineral supplement. All steers received a
Revalor S implant (Intervet, Summit, NJ) containing 200 mg of trenbolone acetate and 40
mg estradiol at the beginning of the experiment to stimulate growth and increase nitrogen
retention.

32
3.2.2. Intake and Body Weight
During adaptation (days 1-14) and the sample collection period (days 15-27) steers
were fed once daily (0700). Fourteen day treatment adaptation was performed to allow
rumen microbiome adjustment. Feed for each experimental period was mixed in a single
batch, and stored in barrels in the cooler (4ºC). Dry matter intake (DMI) was determined
daily by weighing the feed offered and the orts remaining for each animal. Feedstuffs and
orts were sampled daily and stored at 0°C. During the adaptation period intakes were
equalized based on the intake of the lowest consuming treatment. Bodyweight (BW) was
determined at the start of the experiment and the end of each experimental period.
3.2.3. Ruminal Metabolism
On days 15 and 16 ruminal pH was continuously measured (every 1 min) using the
LRCpH data logger system (model LRCpH T5; Dascor, Escondido, CA). Loggers were
calibrated using pH buffers 4 and 7 at the beginning and end of each measurement period
as described by (Penner et al., 2006). Rumen fluid (50 mL) was collected for 48h at 2h
intervals and analyzed for volatile fatty acid (VFA) concentrations, starting at 0800 on day
15 and 0700 on day 16. For VFA concentrations, 5 mL samples of ruminal fluid were
placed into centrifuge tubes and 0.5 mL 85 mM 2-ethylbutyrate internal standard was
added followed by 0.5 mL 50% metaphosphoric acid. The tubes were then capped, mixed,
and frozen overnight (-4ºC). The following day the samples were thawed and centrifuged
at 39,000 × g for 20 min before transferring to injection vials. The VFA concentrations
were determined using gas chromatography with a flame ionization detector (Agilent
33
HP6890 Plus GC with Agilent 7683 Series Injector and Auto Sampler; Agilent
Technologies, Santa Clara, CA) using a Supelco 25326 Nukol Fused Silica Capillary
Column (15 m × 0.53 mm × 0.5 µm film thickness; Sigma/Supelco, Bellefonte, PA). To
accomplish the analysis, 0.2 µL of the sample was injected at 110ºC with a 2:1 split. After
a 1 min hold, the temperature was increased at 5 ºC /min to 125 ºC for 2 min, and the inlet
and injector were set at 260 ºC.
3.2.4. Digestibility, Nitrogen, and Energy Balance
The steers hair was clipped to facilitate the attachment of the urine collection
harness and to minimize hair contamination in the fecal samples. On day 17 of each period,
animals were moved to individual metabolism stalls and adapted for 1 day. Steers were
fitted with urine collection harnesses on day 18 and adapted to total urine and feces
collection during day 19. Complete urine and fecal collections were performed for 7 days
beginning on day 20 at 0700. Urine was collected by continuous suction using a rubber
funnel system attached to the ventral portion of the abdomen to allow the collection of
urine into a plastic collection vessel. Urine acidity was reduced to pH < 3 by adding 1 L of
a 23.5% solution of H3PO4 to the collection vessel to prevent ammonia N loss. Urine
output weight was recorded daily. Five percent of the urine was subsampled to contribute
approximately 250 g to a composite for each period and steer, which was stored at 0°C
until analysis. Fecal collection was accomplished by scraping fecal excretions into a trough
behind each animal several times daily. The wet weight of fecal output was recorded at
0700 daily for each steer. Each day’s collection was mixed thoroughly, and a subsample

34
was taken at ten percent to give approximately 500 g wet matter per day. At the end of each
sample collection period, feces attached to the animal and the harness were scrapped and
collected. After steers are removed from the metabolic stalls, feces attached to the stalls
were also scrapped and collected to ensure total fecal collection. Feces scrapped were
included in the total fecal output of the last day of sampling. Daily fecal samples were
frozen at 0°C until the end of the period then composited by period and steer using a Hobart
mixer (Model H-600, Hobart Manufacturing Co, Troy, OH) and stored at 0°C until
analysis. On days 20 to 22 animals were placed into indirect calorimetry headbox units to
evaluate heat production over 48h as described by Koontz et al. (2010). Inspired and
expired air were analyzed for O2, CO2, and CH4 concentrations at 9 min intervals, and
whole-body heat production was calculated (Brouwer, 1965). Energy retained in protein
was calculated using the N-balance and heat production data, by multiplying retained crude
protein (N x 6.25; g/d) by heat combustion of protein (23.8 kJ/g). Energy retained in fat
was determined by subtracting total retained energy (RE) and energy retained as protein
(McLeod and Baldwin VI, 2000).
Feed and fecal samples were dried at 55°C in a forced-air oven for 48 hours, ground
through a 1 mm screen in a Wiley Mill (Model 4; Thomas Scientific, Swedesboro, NJ),
and dry matter digestibility was calculated. Dry ground feed and fecal samples were
analyzed for dry matter and ash content (procedure 930.15; AOAC, 2005), and for fiber to
determine acid detergent fiber (ADF) and neutral detergent fiber (NDF) using the detergent
analysis system (Goering and Van Soest, 1970a) modified for the ANKOM 200 fiber unit
(ANKOM Technology Corporation, Fairport, NY). Feed and fecal samples were ground
frozen along with dry ice through a 1 mm screen in a Wiley Mill (Model 4; Thomas

35
Scientific, Swedesboro, NJ) to reduce loss of N as ammonia, loss of VFA, and lactic acid.
Urine, freeze ground feed and feces were analyzed for carbon and N content using the N:C
method on an Elementar varioMAX (Elementar Analysen system, Hanau, Germany)
(procedure 990.03; (AOAC, 2005), and for the heat of combustion using bomb calorimetry
(Parr 1281 Bomb Calorimeter, Moline, IL). Before combustion, urine samples were oven-
dried for 2 days at 55°C soaked on polyethylene bags (Jeb Plastics Inc., Wilmington, DE)
where the heat of combustion per gram of polyethylene bag was subtracted from the total
heat of combustion to determine urine gross energy (Wilkerson et al., 1997).
Calculations N-Balance:
• Absorbed N (g/d) = Intake N – Fecal N
• Excreted N (g/d) = Fecal N + Urine N
• Retained N (g/d) = Intake N – Excreted N
• Digestible N (%) = [(Intake N (g/d) – N Feces (g/d)) / Intake N (g/d)] * 100
Calculations Energy Balance:
• O2 consumption (L/kg BW0.75/d) = O2 consumed (L/d) / BW0.75
• CO2 production (L/kg BW0.75/d) = CO2 produced (L/d) / BW0.75
• CH4 production (L/kg BW0.75/d) = CH4 produced (L/d) / BW0.75
• Heat production (kcal/d) = 3.869 (LO2) + 1.195 (LCO2) - 0.516 (LCH4) - 1.431
(Urine N; g/d)
• Heat production (kJ/ kg BW0.75/d) = Heat production (kJ/d) / BW0.75
• Respiration Quotient (RQ) = CO2 produced (L/d) / O2 consumed (L/d)
• Intake Energy (kJ/BW0.75/d) = [Intake E (g/d) * Feed E (kJ/g)] / BW0.75
• Fecal Energy (kJ/BW0.75/d) = [Fecal Output (g/d) * Fecal E (kJ/d)] / BW0.75

36
• Digestible Energy (kJ/BW0.75/d) = [Intake E - Fecal E] / BW0.75
• Digestibility Energy (%) = [(Intake E - Fecal E) / Intake E] * 100
• Gas Energy (kJ/BW0.75/d) = [(CH4 (L/d) * 9.45) * 4.184] / BW0.75
• Urine Energy (kJ/BW0.75/d) = [Urine Output (g/d) * Urine E (kJ/d)] / BW0.75
• Metabolizable Energy (kJ/BW0.75/d) = [Digestible E - (Urine E + Gas E)] / BW0.75
• Retained E (kJ/BW0.75/d) = [Metabolizable E (kJ/d) - Heat production (kJ/d)] /
BW0.75
• Energy retained in protein (kJ/BW0.75/d) = [(N Retained (g/d) * 6.25) * 23.8] /
BW0.75
• Energy retained in fat (kJ/BW0.75/d) = [Retained E - Energy retained in protein] /
BW0.75
3.2.5. Protein Turnover
Protein turnover was estimated using the 15N-glycine end-product method
described previously (Wessels et al., 1997). On day 18, the animals were fitted with the
urine collection harnesses, at 1500 an aliquot of urine was saved for background 15N
analysis. On day 19 at 0700 (same time as feeding) each steer received a single dose (5
mg/kg BW) of 15N-glycine (Andover, MA, Cambridge Isotope Laboratories, Inc.) in 100
mL of water administered abomasally, and flushed with an additional 200mL of water after
dosing to ensure complete infusion. From day 20 at 0700 through day 23 at 0700 an
additional 100 grams (maximum) of acidified urine from each steer was sampled and
frozen for later analysis of 15N urea at each 24 h collection.
Urea nitrogen content of urine samples obtained for 15N analysis was analysed
using the Technicon Auto-Analyzer (Bran + Luebbe, Buffalo Grove, IL, USA) as described
previously by Marsh et al. (1965). After determination of urea content, individual urine

37
samples collected from day 20 through day 23 were processed and analysed for 15N
enrichment as described previously by Reeder et al. (2011) with modifications, to ensure
80% or more urea recovery from the column. Briefly, after determination of the urea
content of the samples, the urine was centrifuged for 10 minutes at 1,000 x g at 4˚C. An
aliquot of urine containing approximately 100 μmol of urea was mixed with 4.0 mL of
water, the pH was adjusted to 2.5, and it was poured onto a 1.8 mL AG 50W-X8, 100-200
mesh, and H+ form (Bio-Rad Laboratories, Richmond, CA, USA) cation exchange column.
The first 10 mL of filtrate was discarded and then 30 mL of water was added to the column
and the eluent collected. The samples were then dried for 3 days in a 55˚C oven and
reconstituted with 2mL 0.1 M pH 7.0 phosphate buffer. Following reconstitution, 100uL
of the sample was placed in a 25 mL Erlenmeyer flask with 3 mL of 0.1 M pH 7.0 phosphate
buffer. A 5 x 25mm strip of Whatman 934-AH filter paper was placed in a stopper cup
(VWR International, Radnor, PA, USA) and 30 µL of 2.5 M KHSO4 was added to the filter
paper to trap ammonia. Urease (Sigma urease type III from Jack Beans 680unit/mL; 0.2
mL 100 unit/mL) was then added, and the flask was immediately stoppered. The flasks
were incubated for 1 hour at 25˚C in a Dubnoff shaking incubator. Two hundred
microliters of 3 N NaOH were injected through the stopper into the flask and the flasks
were shaken for an additional hour and then allowed to stand for 24 hours. The stoppers
were then removed and placed in a desiccator containing an open container of concentrated
H2SO4 and allowed to dry for an additional 24 hours. When the filter papers were dry, they
were placed in an opened Sn cup and the cup was folded around the filter papers in
preparation for analysis. Samples were then sent to the University of California, Davis
Stable Isotope Facility and placed in a PDZ Europa Anca Sample Preparation Unit to be

38
analyzed for 15N using a PDZ Europa 20-20 Isotope Ratio Mass Spectrometer. Protein
turnover was calculated using 15N-glycine as a marker as described previously (Waterlow
et al., 1978)
Calculations Protein Turnover:
• Urea excreted in urine (g/d) = [(urea urine; mmol/L) * (60.06 g; urea molecular
weight) * (urine output; L)] / 1000
• N excreted as urea in urine (g N/d) = [(urea urine; mmol/L) * (28 g; 2 N per urea
molecule; 14 g N molecular weight) * (urine output; L)] / 1000
• 15N atom excess (%) = (15N atom excess) – (15N atom excess background)
• 15N urine (g/d) = [(15N atom excess; %) * (urea excreted in urine; g/d)] / 100
• Cumulative 15N urine (g/d) = average 15N urine (g/d) days 20 to 23
• Corrected 15N-glycine dose (g/d) = 15N-glycise dose * (0.18421; 18.421% N in
glycine)
• 15N Fractional recovery = (Corrected 15N-glycine dose; g/d) / (Cumulative 15N urine
average days 20 to 23; g/d)
• Protein turnover (g N/d) = (N excreted as urea in urine average days 20 to 23; g
N/d) / (15N Fractional recovery)
• Protein synthesis (g N/d) = (Protein turnover; g N/d) – (Urine urea N; g N/d)
• Protein degradation (g N/d) = (Protein turnover; g N/d) – (Absorbed N; g N/d)
3.2.6. Blood Plasma Analysis
On day 26 at 1400 animals were fitted with a jugular catheter (14 gauge, 6 inch) for
blood sample collection and analysis of plasma insulin. On day 27 blood samples were
collected at 0h, 2h, 4h and 6h post-feeding into a heparinized syringe and stored in
vacutainers (Becton, Dickson and Co., Franklin Lakes, NJ), immediately placed on ice,

39
centrifuged at 1,200 × g for 25 min at 4°C and stored at −20°C until further analysis. Plasma
insulin was analyzed in duplicate using 125I-labeled insulin radioimmunoassay (RIA) kit
(P1-12K; Millipore Corporation, Billerica, MA) (DiCostanzo et al., 1999). The assay was
validated via linearity of dilution and recovery of spiked samples for variation within and
between assays. Intra-assay and inter-assay coefficient of variation (CV) were respectively
3.67% and 1.30%.
3.2.7. Statistical Analysis
The experimental model used was a replicated Latin square design analyzed with
mixed models of SAS (SAS version 9.4; SAS Inst. Inc., Cary, NC), where steer was the
experimental unit. Volatile fatty acid, rumen pH and blood plasma insulin data were
analyzed using PROC MIXED with repeated measures over time. Mean differences were
analyzed using least significant difference (LSD) feature of SAS. Treatments and
interactions were considered different when P < 0.05 and a trend when P < 0.10.
3.3. Results
3.3.1. Intake, Digestibility, and Gain
There was no difference (P > 0.05) between treatments in dry matter (DM) intake
and digestibility, organic matter (OM) intake and digestibility, dry matter and organic
matter fecal output, water intake, urine output, and average daily gain (ADG) (Table 3.4).

40
Neutral detergent fiber (NDF) intake and fecal output did not differ, but there was
a tendency for lower NDF digestibility in animals consuming PN when compared to MT
(PN; P = 0.0955). Animals consuming MT had 9.15% higher NDF digestibility than
animals consuming PNMT (Table 3.5). There was a tendency for higher acid detergent
fiber (ADF) fecal output for PNMT (PN x MT; P = 0.0815). Similar to NDF digestibility,
ADF digestibility was lower (PN x MT; P = 0.0342) in animals consuming PNMT, where
ADF digestibility was 16.84% higher in MT when compared to PNMT (Table 3.5).
3.3.2. Ruminal Metabolism
Rumen pH was not different among treatments (P > 0.05), varying between 6.21 to
5.71 (Table 3.6) (Figure 3.1). Time below rumen pH 5.6 (MT; P = 0.0081) and 5.3 (MT; P
= 0.0242) were significantly higher when MT was present, where PNMT stayed below
ruminal pH 5.6 and 5.3 longer than the other treatments. Treatment PNMT stayed below
rumen pH 5.6 for 24.81 hours (1488.75 minutes) and below rumen pH 5.3 for 11.31 hours
(678.75 minutes) (Table 3.6). Rumen total volatile fatty acid (VFA) concentration and
acetate:propionate were not different between treatments (P = 0.7409) (Table 3.7). There
was a significant treatment effect for rumen valerate concentration (P = 0.0125) and molar
proportion (P = 0.0235) (Table 3.7). Control had the highest valerate concentration (3.95
mM) and valerate molar proportion (3.27 moles/ 100 moles), while MT had the lowest
(2.32 mM and 1.99 moles/100 moles) (Table 3.7). There was a significant Treatment x
Time interaction for butyrate molar proportion (P = 0.0010) (Table 3.7) (Figure 3.2), with
a trend for Treatment x Time interaction for butyrate concentration (P = 0.0601) (Table

41
3.7) (Figure 3.3). Treatment MT presented the highest butyrate molar proportion at time of
feeding (9.24 moles/100 moles). Compared to other treatments, PNMT had the lowest
butyrate molar proportion 8 to 18 hours (hour 15 to 1) after feeding (hour 7), with a rapid
increase at the next feeding time (hour 7). Meanwhile, Control had the highest butyrate
molar proportion 4 to 14 hours after feeding (hour 11 to 21), with a rapid decrease at the
next feeding time (hour 7).
3.3.3. Nitrogen Balance
There was no difference in N intake across treatments (P > 0.05) (Table 3.8).
Nitrogen digestibility obtained was 32.58% for MT, 33.12% for Control, 34.38% for PN,
and 39.53% for PNMT (P > 0.05) (Table 3.8). Although MT inclusion lowered fecal N
output (P = 0.0092), there were no differences in N excreted, N absorbed, N retained, or N
digestibility between treatments (P > 0.05) (Table 3.8).
3.3.4. Indirect Calorimetry and Energy Balance
Oxygen (O2) consumption and carbon dioxide (CO2) production had significant PN
x MT interactions (P < 0.001) (Table 3.9). These parameters were higher when MT or PN
were consumed separately but were lower when consumed in combination (PNMT).
Consumption of O2 was 11.29% higher for PN than Control, and production of CO2 was
12.21% higher for MT than Control (Table 3.9). There were no differences in CH4
production between the treatments (P > 0.05) (Table 3.9). There was also a significant PN
42
x MT interaction (P < 0.001) for heat production, which was highest for PN followed by
MT, but lower for PNMT (Table 3.9). Respiration quotient (RQ) was significantly higher
when MT was present (P 0.0008) (Table 3.9).
There were no differences between treatments on intake energy, digestible energy,
gas energy, metabolizable energy, and energy retained in protein (P > 0.05) (Table 3.9).
Fecal energy tended to be lower when MT was present (P = 0.0833) (Table 3.9). There was
also a tendency for PN x MT interaction in urine energy (P = 0.0811), where PNMT
presented the lowest energy in urine (Table 3.9). Retained energy presented a significant
PN x MT interaction (P = 0.0035), where PNMT was 17.37% greater than PN and 17.74%
greater than MT (Table 3.9). There was also a significant PN x MT interaction (P = 0.0026)
for energy retained in fat, which was 20.16% higher in PNMT than PN, and 18.39% higher
in PNMT than MT (Table 3.9).
3.3.5. Protein Turnover
There were no differences between treatments on 15N fractional recovery and
protein synthesis (P > 0.05) (Table 3.10). There was a higher urea excretion rate when
animals consumed MT (P = 0.0384), where the rate was 18.68% higher for MT than
Control (Table 3.10). There was a tendency for higher N excreted as urea was observed
when animals consumed MT (P = 0.0674) (Table 3.10). There was a tendency for a PN x
MT interaction for protein turnover (P = 0.0715) and protein degradation (P = 0.0825)
(Table 3.10).
43
3.3.6. Blood Plasma Insulin
There were no significant Treatment or Treatment x Time differences in blood
plasma insulin concentration among treatments (P > 0.05) (Table 3.11). Blood plasma
insulin obtained was 38.90 uU/mL for PNMT, 38.93 uU/mL for MT, 40.45 uU/mL for PN,
and 50.02 uU/mL for Control (P > 0.05) (Table 3.11).
3.4. Discussion
Dry matter intake (DMI) was not different among treatments, which was due to the
equalization of intake at 2.0 x NEm. The inclusion of Programmed Nutrition Beef Finisher
at 75 g/head/day did not generate differences in average daily gain (ADG). This is in
agreement with Jennings et al. (2014) and Phelps et al. (2015), where no differences in
final body weight were observed when supplementing cattle with Programmed Nutrition
Beef Finisher. A meta-analysis on the effects of monensin in beef cattle on feed efficiency
concluded that in forage-based diets, monensin might affect average daily gain without
reducing dry matter intake. However, in finishing diets with higher energy concentration
than forage-based diets, monensin might have less of an effect on improving average daily
gain and more of an effect reducing dry matter intake (Duffield et al., 2012). In our study,
the lack of increase in average daily gain in monensin supplemented animals is in
agreement with the results demonstrated in the meta-analysis (Duffield et al., 2012).
Dry matter and organic matter digestibility did not differ between the treatments,
which was also observed by Meyer et al. (2009) when supplementing steers with monensin
and tylosin in combination. Muntifering et al. (1980) supplemented monensin to steers fed

44
a high-concentrate and high-protein diet, and DM digestibility was not different between
the monensin supplemented and the control group. This was attributed to the high level of
protein in the diet and equalized intakes. Wedegaertner and Johnson (1983) detected an
increase in DM digestibility when supplementing steers with monensin, but this increase
was mostly driven by a rise in neutral detergent fiber (NDF) digestibility. In this study, we
did not obtain an increase in NDF digestibility when animals were fed monensin and
tylosin, which could have contributed to the absence of higher DM digestibilities.
In this study, ADF digestibility was higher when monensin and tylosin (MT) were
supplemented to the animals, but lowest when monensin and tylosin were supplemented in
combination with Programmed Nutrition (PNMT). The effects of microbial
supplementation in ruminal and animal performance parameters can vary greatly,
depending on the type of diet, level of intake, and even time of the year (Dawson et al.,
1990; Oellermann et al., 1990; Newbold et al., 1992a; Beharka and Nagaraja, 1993; Caton
et al., 1993). Varel and Kreikemeier (1994a) did not observe differences in NDF
digestibility when supplementing Aspergillus oryzae fermentation extract fed to cows
consuming alfalfa and bromegrass diets. Even though Aspergillus oryzae contains a high
level of fibrolytic enzymes, which should improve fiber digestion in the rumen, the
fibrolytic effect of Aspergillus oryzae could differ depending on the structure of the
carbohydrates present in the diet (Newbold et al., 1992a). Meanwhile, Caton et al. (1993)
reported a decrease in NDF and ADF digestibility when supplementing steers with
Aspergillus oryzae fermentation extract in June and August, but an increase in NDF and
ADF digestibility occurred when supplementing in July. The reasons for differences in
45
response according to the time of the year are unclear, which emphasizes how these
supplements can generate inconsistent responses.
No differences in rumen pH between treatments were observed in this study, but
the time below rumen pH 5.6 and 5.3 increased when PNMT was supplemented. Felix et
al. (2012) obtained similar results where increasing levels of monensin (0, 22, 33, and 44
mg/kg DM) did not improve ruminal pH over time. It was surprising that this study did not
detect higher pH values when monensin was supplemented. It has been demonstrated that
this ionophore can maintain higher ruminal pH, where Nagaraja et al. (1981) administered
monensin intraruminally twice at 1.3 mg/kg BW, and Burrin and Britton (1986) fed
monensin at 0, 150, or 300 mg/head/day. Other studies observed no change in ruminal pH
and time below rumen pH 5.6 when supplementing monensin to cattle (28.6 mg/kg DM)
(Erickson et al., 2003). The differences in response could be due to different levels of
monensin supplemented, as studies that observed higher rumen pH offered monensin at
higher rates.
The effect of microbial fermentation extracts on ruminal pH can also vary.
Nascimento et al. (2017) did not observe differences in ruminal pH when supplementing
Aspergillus oryzae to feedlot cattle. Nocek et al. (2002) demonstrated that Enterococcus
faecium and Lactobacillus supplementation to early lactation cows could increase rumen
pH. The presence of these lactate-producing bacteria could potentially cause the rumen
microorganisms to adapt to the lactic acid in the rumen.
Monensin can improve ruminal fermentation efficiency by reducing energy lost
during VFA production (Poos et al., 1979). By shifting the VFA profile to propionate,
46
monensin can decrease the energy lost as CH4 during acetate and butyrate synthesis
(Hungate, 1966). Richardson et al. (1976) observed that increasing concentrations of
monensin did not change total VFA concentrations but decreased valerate concentrations
while increasing propionate concentrations both in vitro and in vivo. No differences in total
VFA (mM) were observed between the treatments in this study, but there was a significant
decrease in valerate concentration and molar proportion when monensin and tylosin were
supplemented. Previous studies also observed a depression in valerate production when
supplementing monensin to cattle (Raun et al., 1976; Utley et al., 1977; Horton et al., 1980;
Wood et al., 2016; Polizel et al., 2017). Decreases in valerate concentration and molar
proportion could be correlated to the metabolism of cellulolytic bacteria, once isoacids like
valerate are consumed by these bacteria in the rumen (Bentley et al., 1955; Andries et al.,
1987). In this study, monensin did not cause an increase in propionate. Although monensin
generally causes a reduction in rumen butyrate proportion (Burrin and Britton, 1986), we
observed higher butyrate molar proportions over time when MT or PN was fed, with a
decrease in this parameter when fed in combination (PNMT). There is a high variation in
the monensin response to ruminal butyrate concentrations (Ellis et al., 2012). Differences
in ruminal microbial population and the inhibitory effect of monensin upon these
populations could contribute to the varying butyrate responses (Henderson et al., 1981;
Dijkstra, 1994; Johnson and Johnson, 1995; Ellis et al., 2012). Kenney et al. (2015a)
observed that supplementing steers with a mixed bacterial culture that consisted primarily
of Lactobacillus acidophilus and Enterococcus faecium did not change total VFA
concentrations, but significantly increased acetate proportion. Beauchemin et al. (2003)
also did not observe differences in total VFA concentrations when supplementing steers

47
with Enterococcus faecium. They did not observe an increase in acetate concentration, but
detected an increase in propionate concentration and a decrease in butyrate concentration.
These effects were attributed to the capacity of lactate-producing bacteria to stimulate the
growth of lactic acid-utilizing bacteria, which produce propionate.
Monensin can inhibit the growth of lactate-producing bacteria (Poos et al., 1979),
which are components of Programmed Nutrition. Studies using Aspergillus oryzae
fermentation extract generally do not detect differences in total VFA concentration and
VFA profile (Oellermann et al., 1990; Newbold et al., 1991; Varel and Kreikemeier, 1994a;
Varel and Kreikemeier, 1994b).
Nitrogen balance was generally not affected by treatment in this study. Only fecal
N output was reduced when monensin and tylosin were present. Monensin can reduce
ruminal protein degradation in vitro (Van Nevel and Demeyer, 1996). This effect is
attributed to the inhibitory effect of monensin on amino acid-fermenting bacteria (Krause
and Russell, 1996). Monensin can also decrease microbial protein flow to the small
intestine due to its inhibitory effect on rumen protein degradation (Bergen and Bates,
1984). Beede et al. (1986) obtained higher apparent N digestibility when supplementing
growing steers fed a low-protein diet (8.72% CP, DM-basis). Muntifering et al. (1980) did
not observe differences in N balance when supplementing monensin to steers consuming a
sorghum-based diet (11.7% CP, DM-basis). These diets were not designed to be protein
deficient (15.4% CP, DM-basis), which could have led to the lack of improvement in N
digestibility by monensin. Monensin can improve N retention and digestibility by reducing
urinary and fecal N excretion and increasing protein absorption from the small intestine
(Dinius et al., 1976; Joyner Jr. et al., 1979; Russell and Strobel, 1989).

48
Effects of monensin on heat production (HP) can vary; some studies reported an
increase in HP (Wedegaertner and Johnson, 1983), while others did not detect any
differences (Thornton and Owens, 1981; Rumpler et al., 1986; Boardman et al., 2016;
Hemphill et al., 2018) when supplementing monensin to cattle. Joyner Jr. et al. (1979)
observed higher digestible energy and HP when wethers were supplemented with 20 ppm
of monensin but not when supplemented with 10 ppm. Our study observed an increase in
heat production when monensin and tylosin (MT) or Programmed Nutrition (PN) was
supplemented, with a decrease in this parameter when PNTM was supplemented.
It has been hypothesized that lactate-producing bacteria would stimulate the growth
of lactate-utilizing bacteria, generating an increase in propionate production and
consequently reducing CH4 production (Piveteau, 1999). However, Jeyanathan et al.
(2016) demonstrated that Lactobacillus bulgaricus can decrease CH4 production without
changing propionate concentrations in vitro, but this effect was not observed for
Lactobacillus pentosus. The decrease in CH4 production without affecting propionate
concentrations observed by Jeyanathan et al. (2016) suggests that other factors could
influence the CH4 response. Various responses were reported with different Lactobacillus
species, indicating that distinct species can have several effects on CH4 and VFA dynamics
in the rumen. Although monensin can reduce CH4 production (Wedegaertner and Johnson,
1983; Hemphill et al., 2018), the microbial population can adapt to monensin after 9 days
of feeding, where there is no longer a reduction in CH4 concentrations (Dinius et al., 1976).
Our study used a replicated Latin Square design with 14-day diet adaptation period, which
creates a possibility of ruminal adaptation to monensin over time.

49
Respiration quotients (RQ) greater than 1.0 indicate an accumulation of fat by the
animal (Blaxter and Wainman, 1966; Ebert et al., 2017). This study observed that monensin
and tylosin (MT) increased RQ when fed with or without Programmed Nutrition (PN). This
differs from Thornton and Owens (1981), where no effect of monensin on RQ was
observed. Our data did not support a shift towards more fat-deposition by the animal with
supplementation of monensin, as we did not detect differences in energy retained as
protein, and detected lower fat deposition when animals were supplemented with monensin
and tylosin compared to control. This reduction in energy retained in fat compared to
control was lower when monensin and tylosin were supplemented in combination with
Programmed Nutrition. The differences in heat production could be a result of numerically
differences in urine energy among treatments. Although monensin and tylosin produced a
tendency for lower fecal energy loss, the treatments supplemented in this study did not
produce differences in gaseous energy, digestible energy (DE), or metabolizable energy
(ME). Control presented the highest retained energy (RE) and energy retained in fat when
compared to the other treatments. Retained energy and energy retained in fat parameters
decreased when animals were supplemented with monensin and tylosin or Programmed
Nutrition, but this reduction was less acute when they were fed in combination (PNMT).
These results is not in agreement with Joyner Jr. et al. (1979) where monensin increased
DE, RE, and ME in lambs, but is in agreement with Boardman (2015) and Hemphill et al.
(2018) where no differences in gaseous energy, DE, and ME were detected when
supplementing cattle with monensin.
Protein turnover estimates are based on the metabolism of all amino acids in the
body when using 15N-labeled tracers (Waterlow et al., 1978). When Programmed Nutrition

50
Beef Finisher was fed in combination with monensin and tylosin, there was a tendency for
lower whole-body protein turnover and protein degradation rates. An unbalanced supply
of amino acids can limit protein synthesis (Everson et al., 1989), but this effect is rarely a
concern in cattle-fed high-grain diets (Wright and Loerch, 1988; Hussein and Berger,
1995). Increases in protein supply above the requirement have a minimal impact on protein
turnover (Salter et al., 1990). Our study offered a diet to animals containing 60% high-
moisture corn and was not designed to be limiting in amino acid content, so these factors
should not influence the differences in protein estimates observed. The higher levels of
urea excretion in urine when monensin and tylosin were supplemented did not cause
changes in 15N fractional recovery, protein turnover, protein synthesis, or protein
degradation. Feeding N above requirements can increase urea excretion (Reynolds and
Kristensen, 2008).
The effect of direct-fed microbials on whole-body protein turnover is not yet clearly
understood. In this study, feeding microbial fermentation extracts increased protein
turnover rate numerically but not statistically. However, feeding these microbials in
combination with monensin and tylosin caused a decrease in these parameters, which could
result from the inhibitory effect monensin has on specific microbial populations. Monensin
has the potential to inhibit lactate-producing bacteria, such as Lactobacillus acidophilus
and Enterococcus faecium, both of which are components of Programmed Nutrition. Other
studies have hypothesized the inhibitory effect of monensin on the ruminal microbial
population. Poos et al. (1979) reported a reduction in bacterial nitrogen flow to the
abomasum when monensin was fed. Hanson and Klopfenstein (1979) hypothesized that
the observed protein-sparing action with monensin supplementation could be due to a

51
reduction in ruminal microbial activity. In our study, plasma insulin levels were not altered
by the addition of Programmed Nutrition or monensin and tylosin. Similar to our findings,
Vendramini et al. (2015) did not detect differences in plasma insulin levels when
supplementing heifers with monensin. However, Raun et al. (1976) observed increased
plasma insulin when cattle were fed monensin at 22 ppm but not when fed 2.7, 5.5, 11, 33,
44, or 88 ppm. The increase in plasma insulin could be expected if propionate, butyrate, or
valerate production in the rumen were increased (Bergen and Bates, 1984). In this study,
addition of MT or PN did not change propionate in the rumen, and caused a decrease in
ruminal valerate concentration. Higher energy intake is associated with higher circulating
insulin levels (Cappellozza et al., 2014). As previously mentioned, dry matter intake was
equalized across treatments in this study, which eliminates the possibility of higher energy
intake among treatments. These factors could explain the lack of differences in insulin
concentration across the treatments.
3.5. Conclusions
Supplementing Programmed Nutrition Beef Finisher, monensin and tylosin, or their
combination, did not improve dry matter digestibility, average daily gain, ruminal total
VFA production, nitrogen digestibility, methane production, and blood plasma insulin
levels. Programmed Nutrition Beef Finisher has the potential to decrease NDF digestibility
when supplemented to steers consuming a high-grain diet. Supplementing Programmed
Nutrition Beef Finisher in combination with monensin and tylosin can cause a reduction in
ADF digestibility. Still, this parameter can be improved when only Programmed Nutrition

52
Beef Finisher is supplemented. Programmed Nutrition Beef Finisher does not enhance
overall rumen pH. Feeding this supplement in combination with monensin and tylosin can
increase the time rumen pH is below 5.6 and 5.3, which could lead to adverse effects of
ruminal acidosis. When fed in combination with monensin and tylosin, Programmed
Nutrition Beef Finisher can decrease the rate of protein turnover, protein synthesis, and
protein degradation.

53
Table 3.1. Composition of treatments Control (C; conventional trace mineral supplement),
Program Nutrition (PN; Beef Nutritional Program Finisher; Alltech Inc., Nicholasville,
KY), Monensin + Tylosin (MT; Elanco Animal Health, Greenfield, IN), and Program
Nutrition + Monensin + Tylosin (PNMT) offered to animals on an as-fed basis (75
g/head/day).
C: Control; conventional trace mineral supplement MT: Control + Monensin + Tylosin PN: Programmed Nutrition Beef Finisher PNMT: Programmed Nutrition Beef Finisher + Monensin + Tylosin 1Control ingredients: Calcium carbonate, rice hulls, zinc sulfate, manganese sulfate, copper sulfate, mineral oil, grain products, sodium selenite, vitamin A supplement, vitamin D3 supplement, calcium iodate, cobalt sulfate. 2Programmed Nutrition ingredients: Calcium carbonate, hydrolyzed yeast, plant protein products, selenium yeast, zinc proteinate, manganese proteinate, cobalt proteinate, processed grain by-products, hydrated sodium calcium aluminosilicate, copper proteinate, ascorbic acid (vitamin C), dried Aspergillus oryzae fermentation extract, calcium iodate, dried Lactobacillus acidophilus fermentation product, dried Enterococcus faecium fermentation product, rice hulls, mineral oil, grain products, vitamin A supplement, vitamin D3 supplement.

54
Table 3.2. Timeline for each experimental period (4 periods total) of in vivo study.

55
Table 3.3. Composition of diet offered to animals at 2.0 x NEm in in vivo study.

56
57

58

59

60

61

62

63
64
65

66

67
CHAPTER 4.
In vitro ruminal fermentation patterns of Aspergillus oryzae fermentation extract
with α-amylase activity
4.1. Introduction
Starch represents a major energy ingredient in many ruminant production systems.
Although starch fermentation occurs rapidly in the rumen, its digestion is usually
incomplete, leading to the escape of starch to the small intestine (Theurer, 1986). High
amounts of starch flowing to the small intestine can result in starch reaching the large
intestine, where digestive efficiency is low (Harmon and McLeod, 2001). Thus, improving
starch utilization in the rumen and small intestine is crucial when animals are fed high-
grain diets. Programmed Nutrition Beef Program (Alltech Inc.) contains Aspergillus oryzae
fermentation extract which provides α-amylase activity (Amaize, Alltech Inc.,
Nicholasville, KY) which has the potential to alter gene expression of canonical pathways
involved in amino acid and lipid metabolism (Graugnard et al., 2015; Elolimy et al., 2018)
Alpha-Amylase from Aspergillus oryzae has an optimum pH between 5.4 and 6.0
and an optimum temperature of 40°C (Klingerman et al., 2009). This enzyme cleaves α-
(1,4)-glucosidic linkages present in starch releasing maltodextrin oligosaccharides to non-
amylolytic ruminal microorganisms that produce acetate and butyrate (Erratt and Douglas,
1984). The addition of Aspergillus oryzae α-amylase can alter ruminal VFA molar
proportions by increasing acetate and butyrate while decreasing propionate in vivo and in
vitro (Tricarico et al., 2008). Ruminal starch digestion does not increase with α-amylase

68
supplementation, but rather it modifies the microbial population and metabolism in the
rumen (Tricarico et al., 2005; Tricarico et al., 2008). Rumen fermentation is altered by
exogenous α-amylase when feed is ground into smaller (<750 μm) particle sizes (Gallo et
al., 2016). Substrate availability is also increased where additional sites for bacterial
attachment are exposed, which can lead to an increased feed digestion rate (Gomez-
Alarcon et al., 1990; Varel and Kreikemeier, 1994b; Colombatto et al., 2003b).
Supplementation of α-amylase and its effect on average daily gain varies with
different diets. Tricarico et al. (2007) observed an increase in average daily gain with
Aspergillus oryzae α-amylase supplementation in steers consuming steam-flaked corn with
cottonseed hulls, cracked corn with corn silage, and high-moisture corn with corn silage.
However, no differences in gain were observed when steers consumed steam-flaked corn
with alfalfa hay. DiLorenzo et al. (2011) did not observe differences in average daily gain
between steers supplemented with α-amylase fed dry-rolled corn or steam-flaked corn.
These differences suggest that there are nutrient interactions and differences in microbial
populations that impact the ruminal effectiveness of the enzyme.
Barley and wheat are rapidly fermented in the rumen as they are highly digestible
starch sources. The endosperm cell wall of these grains presents high levels of β-glucan
soluble fiber, a structure that is easily penetrated and digested by cellulolytic bacteria in
the rumen (Orskov, 1986; McAllister et al., 1993b). If β-glucans are not completely
digested in the rumen they can decrease nutrient absorption in the small intestine, due to
changes in intestinal pH and digesta viscosity which affects digestive enzyme activity and
gastrointestinal hormone release (Hristov et al., 2000).

69
Corn and sorghum are not as rapidly fermented in the rumen because their
endosperm is composed of a floury region and a horny region. In the floury region, starch
associates with protein in a fashion similar to the endosperm of barley and wheat.
Meanwhile in the horny region starch is tightly embedded in the protein matrix, making
the region resistant to microbial attachment (McAllister et al., 1994; McAllister and Cheng,
1996). Fungi are the only ruminal microorganisms capable of penetrating the horny region
of these grains due to the specific activity of its amylases and proteases (McAllister et al.,
1993a). Protozoa can impact the rate of starch digestion in the rumen since protozoa can
degrade starch by engulfing starch granules, which can take up to 36 h for complete
metabolism (Coleman, 1986b). Protozoa can also predate on amylolytic bacteria
decreasing the rate of starch digestion (Kurihara et al., 1968).
The effects of Aspergillus oryzae fermentation extract supplementation on rumen
metabolism and animal performance have been inconsistent across studies. Nisbet and
Martin (1990) observed that supplementation with Aspergillus oryzae fermentation extract
in vitro could increase lactate uptake by Selenomonas ruminantium, causing an increase in
the production of total VFA, and an increase in acetate and propionate molar proportions
with a decrease in the acetate:propionate. Tricarico et al. (2005) supplemented different
levels of Aspergillus oryzae fermentation extract to lactating cows, steers, and in in vitro
using continuous culture. There were no differences in ruminal total VFA concentrations,
but a quadratic increase in acetate:propionate was seen, with an increase of acetate and
butyrate and a decrease in propionate molar proportions. Meanwhile, Wiedmeier et al.
(1987) fed nonlactating cows chopped alfalfa hay and rolled barley supplemented with
70
Aspergillus oryzae fermentation extract. No changes in ruminal total VFA concentrations,
acetate:propionate, or VFA molar proportions were detected.
The level of Aspergillus oryzae fermentation extract supplementation also affects
the animal metabolic response. Varel and Kreikemeier (1994b) fed 0, 3, 9, and 27 g/d
Aspergillus oryzae fermentation extract to nonlactating cows and determined that total
VFA concentration increased at the higher levels of supplementation. Tricarico et al.
(2005) demonstrated that milk production and blood serum beta-hydroxbutyrate (BHBA)
concentration increased when lactating cows were supplemented with α-amylase at 240
DU/kg TMR, but milk production decreased at 480 and 720 DU/kg TMR. Denigan et al.
(1992) did not observe any differences in milk yield when supplementing Aspergillus
oryzae fermentation extract to lactating cows at 0, 1.5, 3, and 6 g/d, but dry matter intake
(DMI) was higher at 1.5 g/d. Takiya et al. (2017) also did not detect differences in milk
yield when supplementing lactating cows with Aspergillus oryzae fermentation extract at
0, 150, 300, or 450 DU/kg DM, but they observed that crude protein digestibility increased
linearly with increasing supplementation. In contrast, Oellermann et al. (1990) obtained no
differences in crude protein digestibility when supplementing nonlactating cows with
Aspergillus oryzae fermentation extract at 0, 1, 2, 4, and 6 g/d.
The difference responses reported across studies when supplementing Aspergillus
oryzae fermentation extract could be due to the different types of substrates present
(DiLorenzo et al., 2011), substrate particle size (Gallo et al., 2016), enzyme source
(Wallace et al., 2001), enzyme dosage (Tricarico et al., 2005; Tricarico et al., 2008; Takiya
et al., 2017), shifts in rumen fluid pH (Klingerman et al., 2009) and animal physiological
status (Tricarico et al., 2008). It is possible that Amaize increases acetate and butyrate
71
ruminal molar proportions by increasing bacterial attachment to feed particles and releasing
different maltodextrin oligosaccharides that can be used as a substrate by non-amylolytic
microorganisms, which would shift the rumen microbiome dynamics. We hypothesize that
the addition of Aspergillus oryzae fermentation extract incubated in vitro with different
substrates results in different profiles of maltodextrin oligosaccharides that can be used by
non-amylolytic microorganisms to produce acetate and butyrate at the expense of
propionate, and increase total VFA concentration.
We hypothesize that α-amylase (Amaize) supplementation increases in vitro starch
degradation of different feedstuffs. Retrogradation and flake density of steam-flaked corn
could decrease in response to Amaize supplementation due to a higher degree of
crystallization and gelatinization of starch, respectively. The objective of this study was to
determine the effect of Amaize supplementation on substrate degradation and metabolic
parameters impacting feedstuff utilization in vitro. Substrates were selected to examine
known factors impacting starch utilization such as grain source, degree of processing and
retrogradation and to compare these effects on starch availability and gas production, in
vitro.
4.2. Material and Methods
4.2.1. Donor animals and diet

72
Three ruminally cannulated steers were housed in outside pens and fed once a day
a diet with 57% rye silage and 34% cracked corn (Table 4.1) ad libitum, with no Aspergillus
oryzae extract α-amylase (Amaize) added.
4.2.2. Assay development
Assay development was accomplished in two phases. In the first phase, we
analyzed multiple substrate inclusions without the addition of Amaize to determine the
optimal substrate inclusion. The targeted substrate inclusion provided adequate feedstuff
to saturate starch hydrolysis without depletion of the starch substrate during the incubation
period. Typical substrate amounts employed for in vitro gas production (0.25 g) are chosen
so that fermentation reaches a plateau during the incubation and starch is rapidly depleted.
Our goal was to develop a system where starch would not be depleted to more effectively
study the impact of enzyme addition.
The second phase was composed of a dose-response trial to determine the optimal
amount of Amaize. The targeted Amaize dosage must provide enough enzyme to compete
for substrate with the microbial enzymes present in the rumen digesta.
Dry-rolled corn was used as the substrate, dried at 55°C for 48 hours, and ground
with a Wiley Mill to pass through a 1-mm screen. In all comparisons, Ankom fermentation
vessels were run in duplicate per substrate inclusion level and incubation time. Substrate
amounts incubated were 0.25, 0.5, 1, 2.5, and 5 g, based on the manufacturer’s
recommended substrate inclusion of 0.25 g for highly fermentable substrates (Ankom,
73
2013). The vessels were incubated for 0, 2, 4, 6, 8, 10, 12, or 24-hour, and analyzed for in
vitro gas production and starch content. In vitro gas production was measured using Ankom
fermentation vessels with remote automatic pressure transducers (Ankom Wireless Gas
Production System, Ankom Technology, Macedon, NY). Starch content analysis was
performed at each time point.
Ruminal contents (400 mL) from each steer were collected one hour after feeding,
combined, and blended for two minutes under a CO2 headspace. The blended contents were
strained through four layers of cheesecloth into an insulated flask and transported to the
laboratory. Rumen buffer, rumen micromineral, rumen macromineral, and reducing
solutions were prepared as described by (Goering and Van Soest, 1970b). The rumen buffer
solution was prepared by adding 2 g of ammonium bicarbonate and 17.5 g of sodium
bicarbonate to 500 mL of water. The rumen micromineral solution was prepared by adding
1.32 g of calcium chloride dihydrate (CaCl2 • 2H2O), 1 g of manganese chloride
tetrahydrate (MnCl2 • 4H2O), 0.1 g of cobalt chloride hexahydrate (CoCl2 • 6H2O), and 0.8
g of ferric chloride hexahydrate (FeCl3 • 6H2O) to a 100 mL volumetric flask and adjusting
the volume with water. The rumen macromineral solution was prepared by adding 2.85 g
of sodium phosphate dibasic (Na2HPO4 anhydrous), 3.1 g of potassium phosphate
monobasic (KH2PO4 anhydrous), and 0.3 g of magnesium sulfate heptahydrate (MgSO4 •
7H2O) to 500 mL of water. The reducing solution was prepared by adding, in the following
sequence, 1.25 g cysteine•HCl, 8 mL 1 N sodium hydroxide (NaOH), and 1.25 g sodium
sulfide nonahydrate (Na2S•9H2O) to a 200 mL volumetric flask and adjusting the volume
with water.
74
The media solution was prepared by adding, in the following sequence, 4 g of
trypticase, (BBLTM TypticaseTM Peptone pancreatic digest of casein; Becton, Dickson and
Company, Sparks, MD), 800 mL of water, 0.2 mL of micromineral solution, 400 mL of
buffer solution, 400 mL of micromineral solution, and 2 mL of resazurin (0.1% w/v). The
media solution was placed in a 39°C water bath, and a CO2 hose was inserted into the
solution and CO2 was bubbled slowly. After which, 200 mL of the reducing solution was
prepared and added to the media solution. The media solution is reduced once it changes
from red color (oxidized) to colorless (reduced). Once the media solution was colorless,
400 mL of filtered rumen fluid was added (total 2200 mL).
Prior to analysis, the volume of each Ankom fermentation vessel (300 mL) was
determined by filling it with water and weighing for volume calculations (eq. 1). To each
fermentation vessel was added, in the following sequence, the corresponding substrate
amount to be tested, 2 mL of water, 100 mL of media solution, followed by 20 seconds of
CO2 gas. The fermentation vessels were then sealed with the remote automatic pressure
transducers. Ankom fermentation vessels were incubated in a 39°C water bath, where the
gas pressure was measured at 5-minute intervals.
At the end of the incubation period, remote automatic pressure transducers were
replaced by caps to seal and each vessel was processed immediately for starch content.
Starch content analysis (Knudsen, 1997) with adaptations by Richards et al. (1995) was
performed on the contents of the vessels. Briefly, 50 mL of cold 1.2 M acetate buffer
containing 0.2% (w/v) benzoic acid was added followed by 400 μL of heat-stable α-
amylase (Spezyme Fred, Genencor International, Inc.; Palo Alto, CA). Vessels were
capped, mixed, and placed in a 100°C water bath for 1 h. Caps were left slightly loose for

75
the first 10 min of incubation to release pressure and then tightened for the remaining time
of the incubation. Vessels were gently swirled for 10, 30, and 50 min. After incubation, the
vessels were cooled in water, and 2 mL of amyloglucosidase (Genencor International, Inc.)
were added. Vessels were placed in a 55°C oven for 2 h, gently swirled after 1 h and at the
end of the incubation. Once the vessels were cooled, the weight of the vessels with contents
and cap were recorded for volume content determination (eq. 5). An aliquot of the solution
was then transferred to microcentrifuge tubes and centrifuged at 12,000 x g for 10 minutes
at 23°C. The supernatant was analyzed for glucose content using the Konelab 20XTi
clinical analyzer and a glucose-hexokinase kit (Thermo Fisher Scientific Inc., Beverly,
MA). The standard curve was determined using a standard stock solution (1000 mg/dL
glucose), prepared by adding 1 g of oven-dried dextrose, 10 mL of 1% sodium azide,
diluted with water to 100 mL. Vessels with no substrate added (reagent blank) were used
to calculate free glucose from reagents (eq. 6). Vessels with substrate added but no starch
enzyme added (enzyme blank) were used to calculate free glucose (eq. 7). The glucose
content of all samples was corrected for free glucose from reagents and substrate (eq. 9),
and the starch percentage of each vessel was calculated using the weight of the substrate
incubated (eq. 10).
After determining the optimal substrate inclusion, a dose-response trial was
performed. The kinetic determination of Amaize α-amylase activity was accomplished to
aid dosage determination and ensure enzyme activity throughout incubation periods.
Amaize was serially diluted and assayed for α-amylase activity. The α-amylase activity
was measured using a reagent set (Teco Diagnostics, Anaheim, CA) adapted to a Synergy
HTX multi-mode plate reader pre-heated to 39°C (BioTek, Winooski, VT). The Teco

76
reagent was reconstituted with 6 mL of water and further diluted with 18 mL of water. The
diluted reagent was placed in a 39°C water bath. A blank of saline (5 μL), a control dilution
factor to ensure plate repeatability (5 μL), and the multiple dilutions of Amaize (5 μL) were
added to a 96-well plate. After samples were loaded, 200 μL of heated (39°C) Teco reagent
was added using a multichannel pipette. The α-amylase activity was measured every 30
seconds for 15 minutes (eq. 13).
After determining the α-amylase activity, multiple Amaize dosages were incubated
in Ankom fermentation vessels with substrate and rumen inoculum. The substrate used was
dry-rolled corn, dried at 55°C for 48 hours and ground with a Wiley Mill to pass through a
1-mm screen. The Amaize dosages included 0, 10, 15, and 20 IU/100 mL inoculum.
Amaize was pipetted into the Ankom fermentation vessels after substrate adding, followed
by adding inoculum. The ruminal contents and media solution were prepared as described
previously, adjusted to the required final volume. To each Ankom fermentation vessel was
added 2.5 g of substrate, 2 mL of water containing the corresponding Amaize dosage level
(blanks received 2 mL of water without Amaize added), and 100 mL of inoculum, was
added to each Ankom fermentation vessel which was then followed by 20 seconds of CO2
gas and sealed with screw caps. Glucose content from the supplemental enzyme was
accounted for by including a fermentation jar without substrate added for each Amaize
dosage (Amaize blank). The fermentation jars were incubated for 0, 2, 8, and 10 hours. To
ensure enzyme activity was detected throughout incubation times, a 5 μL aliquot was
obtained from the fermentation vessels at the end of each incubation period and analyzed
for amylase activity as previously described.

77
To further test the selected dosage level and optimal fermentation time,
amylopectin (1 g and 1.8 g) and dry rolled corn (1.5 g and 2.5 g) were incubated with
Amaize at 0 or 15 IU/100 mL inoculum for 0, 1, 2, 4, 6, 8, 10, and 16-hour across multiple
runs.
4.2.3. In vitro gas production and starch degradation of different feedstuffs
Experiment 1
Dry rolled barley, Steam-flaked barley, Corn steam-flaked at 26 and 32 lb/bushel
Corn steam-flaked at 26 lb/bu (335 g/L), or 32 lb/bu (412 g/L), dry rolled barley
(438 g/L), and steam-flaked barley (357 g/L) were used as substrates. All substrates were
dried for 48 hours in a 55°C oven, and ground with a Wiley Mill to pass through a 1-mm
screen.
Starch Content and Availability
Total starch, available starch, and starch availability were determined as described
by Xiong et al. (1990b) with adaptations by Hall (2009). These measurements were
replicated on three separate runs performed on the same day.
78
Available Starch
Available starch was determined by adding 0.4 g of substrate, 30 mL of acetate
buffer solution (4.1 g/L anhydrous sodium acetate; 4.1 mL/L glacial acetic acid; pH =
4.50), and 1 mL of amyloglucosidase working solution (200 U/mL; AMIGASE GA 400L;
Centerchem, Inc., Norwalk, CT) to 50-mL glass vials with screw tops. Available starch-
free glucose (amyloglucosidase blanks) were used to account for free glucose present in
the substrates. Available starch-free glucose was determined by adding 0.4 g of substrate
and 30 mL of acetate buffer solution (4.1 g/L anhydrous sodium acetate; 4.1 mL/L glacial
acetic acid; pH = 4.50) to 50-mL glass vials with screw tops. No amyloglucosidase working
solution was added to available starch-free glucose vials. Available starch and available
starch-free glucose vials were capped, mixed, and placed in a 40°C water bath for 60
minutes. The vials were shaken vigorously during incubation at 10, 20, 30, 40, 50, and 60
minutes. The vials were removed from the water bath then, 4 mL of zinc sulfate solution
(10% (w/v); 100 g/L zinc sulfate heptahydrate ZnSO4 • 7 H2O) and 2 mL of sodium
hydroxide solution (0.5 N; 20 g/L sodium hydroxide) were immediately added to the vials,
followed by dilution to a final volume of 50 mL with water. Then, the vials were capped
and mixed. Standard glucose solution was prepared at 7.8125, 15.625, 31.25, 62.5, 125,
250, and 500 mg/dL using a standard stock solution (1000 mg/dL glucose). A blank saline,
standard glucose solution and samples were loaded (5 μL) to a 96-well plate in replicate.
Next, 250 μL of glucose hexokinase liquid stable reagent (InfinityTM Glucose Hexokinase;
Fisher Diagnostics, LLC; Middletown, VA) was added to all wells. Glucose concentration
was measured using a Synergy HTX multi-mode plate reader pre-heated to 39°C (BioTek,
Winooski, VT) read at 340 nm. Starch availability was calculated as described (eq. 14).
79
Total Starch
Total starch was determined by adding 0.2 g of substrate and 30 mL of acetate
buffer solution to 50-mL glass vials with screw tops. Total starch-free glucose
(amyloglucosidase blanks) was used to account for free glucose present in the substrates.
Total starch-free glucose was determined by adding 0.2 g of substrate and 30 mL of acetate
buffer solution to 50-mL glass vials with screw tops. Total starch and total starch-free
glucose vials were capped and placed in a 94°C water bath for 75 minutes, hand-swirled
every 15 minutes. The vials were removed from the water bath, cooled in running water
for 15 minutes. Once vials were cooled, 1 mL of amyloglucosidase working solution (200
U/mL) was added to total starch vials only. No amyloglucosidase working solution was
added to total starch-free glucose vials. All vials were capped, mixed, and placed in a 40°C
water bath for 60 minutes. The vials were vigorously shaken every 10 minutes during
incubation. The vials were removed from the water bath then, 4 mL of zinc sulfate solution
(10% (w/v) and 2 mL of sodium hydroxide solution (0.5 N) were immediately added to the
vials followed by dilution to a final volume of 50 mL with water. Then, the vials were
capped and mixed. Standard glucose solution was prepared as previously described above.
A blank saline, standard glucose solution and samples were loaded (5 μL) to a 96-well plate
in replicate. Next, 250 μL of glucose hexokinase liquid stable reagent (InfinityTM Glucose
Hexokinase) was added to all wells. Glucose concentration was measured using a Synergy
HTX multi-mode plate reader pre-heated to 39°C (BioTek, Winooski, VT) read at 340 nm.
Total starch values were used to calculate starch availability as described (eq. 14).

80
Gas Production
In vitro gas production was measured for 24 hours using Ankom fermentation
vessels with remote automatic pressure transducers as previously described. These
measurements were replicated on five separate days. To each fermentation vessel was
added 2.5 g of ground substrate, 1.5 mL of water containing the corresponding Amaize
dosage level (0 IU or 15 IU/100 mL inoculum), and 100 mL of inoculum, followed by 20
seconds of CO2 gas. Vessels were sealed with remote automatic pressure transducers
(Ankom Wireless Gas Production System, Ankom Technology, Macedon, NY) and
incubated in a 39°C water bath for 24 hours. Two-hour gas production was calculated using
gas produced at the 2 hour incubation time point. Ruminal contents and media solution
were prepared as described previously, and adjusted for the final volume.
Starch Degradation
For each incubation the percent starch degraded after 2-hour incubation was
measured. At the end of the 2-hour incubation time, 50 mL of cold 1.2 M acetate buffer in
0.2% (w/v) benzoic acid was added. Starch analysis was performed as previously described
above. Starch remaining in the vessel was calculated (eq. 11) and these values were used
to calculate the percent starch degraded (eq. 12).

81
Experiment 2
Dry Rolled Corn, High moisture Corn and Corn steam-flaked at 27 lb/bushel
Dry rolled corn, high moisture corn, and corn steam-flaked at 27 lb/bu (347 g/L)
were used as substrates. All substrates were dried for 48 hours in a 55°C oven, and ground
with a Wiley Mill to pass through a 1-mm screen.
Starch Content and Availability
Total starch and starch availability of substrates were determined as previously
described above.
Gas Production
Gas production was measured for 24 hours using Ankom fermentation vessels with
remote automatic pressure transducers as previously described for five separate days.
Ruminal contents and media solutions were prepared as described previously. Substrates
were incubated with Amaize at 0 or 15 IU/100 mL.
Starch Degradation
Starch degradation was measured in 100 mL-glass culture tubes with PTFE lined
screw caps (32 mm x 200 mm, Aldrich®, Sigma-Aldrich Co.). To each culture tube was

82
added 0.625 g of ground substrate, 0.375 mL of water containing the corresponding
Amaize dosage level (0 IU or 15 IU/100 mL inoculum), and 25 mL of inoculum, followed
by 20 seconds of CO2 gas. Tubes were capped and incubated in a 39°C water bath for 2
hours. At the end of the 2-hour incubation time, 12.5 mL of cold 1.2 M acetate buffer in
0.2% (w/v) benzoic acid was added. Starch analysis was performed as previously described
above. Starch remaining in the vessel was calculated (eq. 11) and these values were used
to calculate starch degraded after incubation (eq. 12).
Experiment 3
Corn steam-flaked at 23, 25, 27, 29, and 31 lb/bushel with or without retrogradation
Steam-flaked corn and retrograde steam-flaked corn with five different flake
densities were used as substrates. Flake densities of both retrograde and non-retrograde
steam-flaked corn were 23 lb/bu (296 g/L), 25 lb/bu (322 g/L), 27 lb/bu (347 g/L), 29 lb/bu
(373 g/L), and 31 lb/bu (399 g/L). Retrogradation was achieved by exposing steam-flaked
corn to 55°C in heat-sealed foil bags, as described by Trotta et al. (2021a). All substrates
were dried for 48 hours in a 55°C oven, and ground with a Wiley Mill to pass through a 1-
mm screen.
Starch Content and Availability

83
Total starch and starch availability of substrates were determined as described
previously.
Gas Production
Gas production was measured for 24 hours using Ankom fermentation vessels with
remote automatic pressure transducers as previously described for five separate days.
Ruminal contents and media solutions were prepared as described previously. Substrates
were incubated with Amaize at 0 or 15 IU/100 mL.
Starch Degradation
Starch degradation was measured in 100 mL-glass culture tubes with PTFE lined
screw caps (32 mm x 200 mm, Aldrich®, Sigma-Aldrich Co.) as described previously.
Substrates were incubated with Amaize at 0 or 15 IU/100 mL.
4.2.4. Calculations
In Vitro Gas Production
The Ankom pressure transducer system measures pressure (psi) changes from
baseline. Cumulative gas pressure measured was converted to moles of gas produced at

84
standard pressure and temperature using the ideal gas law (eq. 1). Moles of gas produced
was converted to mL of gas produced Avogadro's law, where at atmospheric pressure (1
psi = 6.894757293 kPa) 1 mole occupies 22.4 L at 0°C, so 1 mole occupies 25.6 L at 39°C
(312°K) (eq. 2). Both concepts were used to calculate the volume of gas produced (eq. 3).
Data were fit into multiple models described by Pitt et al. (1999) using MatLab (MatLab
Software Version R2021b, The MathWorks, Inc., Natick, MA) for the best-fit
determination. Nonlinear gas production models tested were Cone, Fitzhugh, Gompertz,
Weibull, France, Richards, Cauchy, Exponential, Logistic and Feller. Cone function
presented the highest coefficient of determination (r2) and lowest root mean square error
(RMSE). Data were analyzed using the Cone cumulative gas production function (eq. 4)
described by Pitt et al. (1999) with the assumption that no gas is produced until a discrete-
time lag has elapsed. Accumulated pressure data was used to calculate the rate, lag time,
total gas produced, and plateau with the application of the Cone model using MatLab (Pitt
et al., 1999)
Ideal gas law (eq. 1)
• V = (Vvessel – Wgtcontents) / 1000
• n = p (V/ RT)
V : headspace volume in fermentation vessel (L)
Vvessel : weight of each fermentation vessel full of water (mL)
Wgtcontents : weight of contents added to each fermentation vessel (g)
n : gas produced (moles)
p : pressure (kPa)
T : temperature (K)
R : gas constants (8.314472 L kPa/K/mol)

85
Avogrado’s law (eq. 2)
• gas produced (mL) = n * 25.6 * 1000
n : gas produced (moles)
Volume of gas produced (eq. 3)
• P = (Patm / 14.696) * 101.325
• ΔV = (ΔP * V / P) * 1000
P : atmospheric pressure in kPa adjusted to STP (101.325 kPa = 14.696 psi at STP)
Patm : average of the background atmospheric pressure (in)
ΔV : gas produced at standard atmospheric pressure (mL)
ΔP : plateau pressure produced during fermentation (kPa)
V : headspace volume in fermentation vessel (L)
Cone cumulative gas production function (eq. 4)
• F(t) = 1 / (1 + (r * t)(-n))
r : rate constant
t : time (h)
n : discrete time lag (h)
• Rate of Degradation (%/h) = k * 100
k: rate of degradation
Volume remaining in vessel after starch analysis (eq. 5)
• Each vessel contained a different ΔVfinal, which was used to calculate glucose and
starch content of the corresponding substrate contained in the vessel.
• ΔVfinal = ((Wf – Wi) / 0.998) / 100
ΔVfinal : volume remaining in vessel after starch analysis (dL)
Wf : weight vessel with contents and cap after starch analysis (g)
Wi : weight vessel with substrate, media solution and cap before in vitro incubation (g)

86
Starch Degradation
Free glucose from reagent blank (eq. 6)
• Glucosereagent = GCreagent * ΔVfinal
Glucosereagent: free glucose from reagent blank (mg)
GCreagent : glucose concentration in reagent blank (mg/dL)
ΔVfinal : volume remaining in vessel after starch analysis (dL)
Free glucose from enzyme blank (eq. 7)
• Glucosesubstrate = GCsubstrate * ΔVfinal
Glucosesubstrate: free glucose from enzyme blank (mg)
GCsubstrate: glucose concentration in enzyme blank (mg/dL)
ΔVfinal : volume remaining in vessel after starch analysis (dL)
Glucose content from Amaize (eq.8)
• GlucoseAmaize = (GCAmaize * ΔVfinal) – Glucosereagent
GlucoseAmaize : glucose content from Amaize blank (mg)
GCAmaize: glucose concentration in Amaize blank (mg/dL)
ΔVfinal : volume remaining in vessel after starch analysis (dL)
Glucosereagent: free glucose from reagent blank (mg)
Amount of glucose in sample (eq. 9)
• Glucosesample = (GCsample * ΔVfinal) – Glucosereagent – (GCsubstrate * Wgtsubstrate)
• Glucosesample = (GCsample * ΔVfinal) – Glucosereagent – (GCsubstrate * Wgtsubstrate) -
GlucoseAmaize
Glucosesample : glucose content in sample (mg)
GCsample: glucose concentration in sample (mg/dL)
ΔVfinal : volume remaining in vessel after starch analysis (dL)
Glucosereagent: free glucose from reagent blank (mg)
Glucosesubstrate: free glucose from starch enzymes (mg)
Wgtsubstrate: weight of substrate added to vessel prior to in vitro gas production (mg)

87
GlucoseAmaize : glucose content from Amaize blank (mg)
Starch percentage in sample (eq. 10)
• % Starch = [(Glucosesample / 1.110) / (Wgtsubstrate * DM)] * 100
% Starch : sample starch content on a dry-matter basis (%, DM)
Glucosesample : glucose content in sample (mg)
1.110 : correction factor for glucose recovery from starch
Wgtsubstrate : weight of substrate added to vessel prior to in vitro gas production (mg)
DM: Dry Matter (%)
Starch remaining in Vessel (eq. 11)
• Starch in vessel (mg) = (% Starch / 100) * Wgtsubstrate
Starch in vessel (mg): starch content in the vessel at incubation time
% Starch : sample starch content on a dry-matter basis (%, DM)
Wgtsubstrate: weight of substrate added to vessel prior to in vitro gas production (mg)
Starch degraded after incubation (eq. 12)
• Starch degraded (mg) = Starch in vessel at hour 0 – Starch in vessel at hour 2
Starch in vessel at hour 0 (mg): starch content in vessel at 0 hour incubation time
Starch in vessel at hour 0 (mg): starch content in vessel at 2 hour incubation time
Biotek Plate Reader
Amylase Activity (IU/mL) (eq. 13)
• Amylase Activity (IU/mL) = [[(Max V / 1000)*0.205]/[(8.5*0.005*0.6018)]]*DF
Max V: plate reader output
DF: Dilution Factor Amaize
Available starch, total starch, and starch availability (eq. 14)
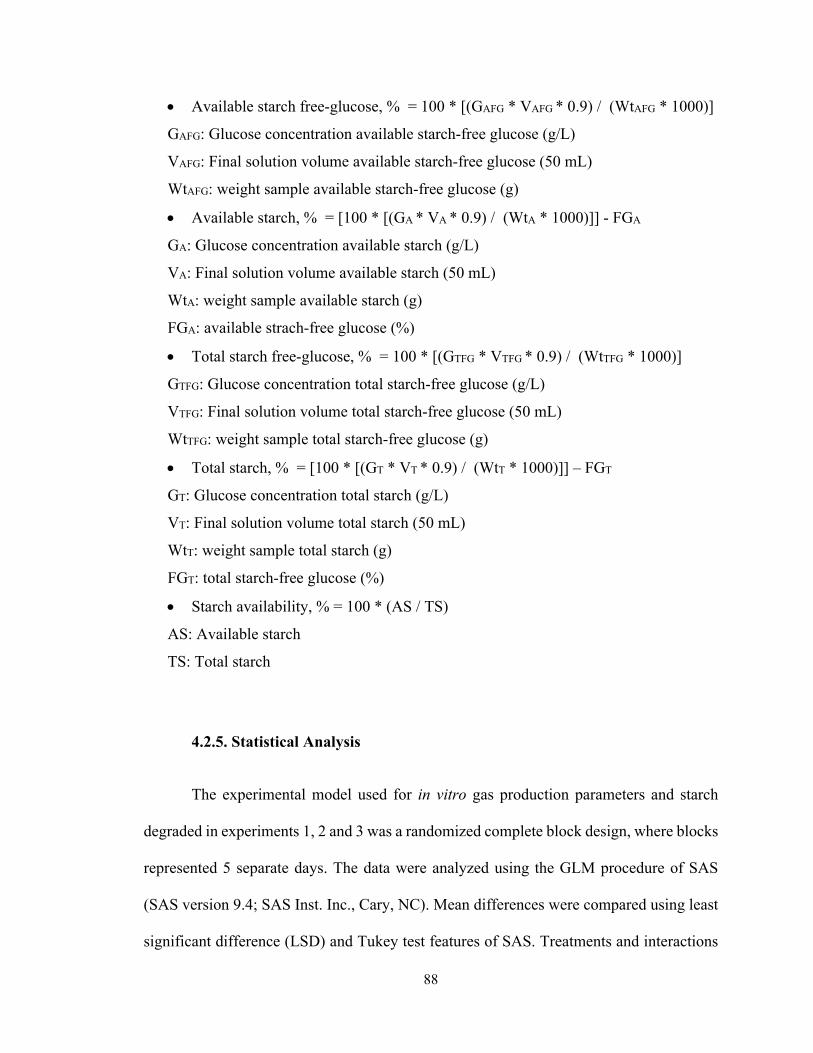
88
• Available starch free-glucose, % = 100 * [(GAFG * VAFG * 0.9) / (WtAFG * 1000)]
GAFG: Glucose concentration available starch-free glucose (g/L)
VAFG: Final solution volume available starch-free glucose (50 mL)
WtAFG: weight sample available starch-free glucose (g)
• Available starch, % = [100 * [(GA * VA * 0.9) / (WtA * 1000)]] - FGA
GA: Glucose concentration available starch (g/L)
VA: Final solution volume available starch (50 mL)
WtA: weight sample available starch (g)
FGA: available strach-free glucose (%)
• Total starch free-glucose, % = 100 * [(GTFG * VTFG * 0.9) / (WtTFG * 1000)]
GTFG: Glucose concentration total starch-free glucose (g/L)
VTFG: Final solution volume total starch-free glucose (50 mL)
WtTFG: weight sample total starch-free glucose (g)
• Total starch, % = [100 * [(GT * VT * 0.9) / (WtT * 1000)]] – FGT
GT: Glucose concentration total starch (g/L)
VT: Final solution volume total starch (50 mL)
WtT: weight sample total starch (g)
FGT: total starch-free glucose (%)
• Starch availability, % = 100 * (AS / TS)
AS: Available starch
TS: Total starch
4.2.5. Statistical Analysis
The experimental model used for in vitro gas production parameters and starch
degraded in experiments 1, 2 and 3 was a randomized complete block design, where blocks
represented 5 separate days. The data were analyzed using the GLM procedure of SAS
(SAS version 9.4; SAS Inst. Inc., Cary, NC). Mean differences were compared using least
significant difference (LSD) and Tukey test features of SAS. Treatments and interactions

89
were considered different when P < 0.05 and a trend when P < 0.10. Experiment 1
compared the effects of the substrates corn steam-flaked at 26 lb/bu, corn steam-flaked at
32 lb/bu, dry rolled barley, and steam-flaked barley with and without Amaize
supplementation. Experiment 2 analyzed the effects of different corn types (dry rolled corn,
high moisture corn, and corn steam-flaked at 27 lb/bu) with or without Amaize
supplementation. Experiment 3 analyzed the effects of different steam-flaked corn flake
densities (23, 25, 27, 29, and 31 lb/bu) and the effect of retrogradation, with or without
Amaize supplementation.
4.3. Results
4.3.1. Assay development
It was determined that 2, 4, 6, 8, 10, and 12-hour incubation times did not provide
adequate time to reach a gas production plateau (data not shown). Substrate inclusion at
0.25 and 0.5 g was rapidly fermented, producing inconsistent starch content results (data
not shown). The results of this assay demonstrated that a substrate inclusion at 2.5 g
generated the most consistent linear decrease in starch content over time (data not shown).
Substrate inclusion at 2.5 g allows detection of fermentation pattern changes before a
maximum response is achieved without complete substrate depletion (data not shown).
On average, there was a 4.07 % increase in starch remaining in the vessel between
Amaize at 0 and 15 IU/100 mL inoculum after 8, 10, and 16-hour incubations (data not

90
shown). The greatest increase in starch content resulting from Amaize addition was
detected at the 2-hour incubation time, with an average of a 12.20% increase in starch
disappearance using 2.5 g of dry rolled corn as substrate (data not shown).
Amaize α-amylase activity diluted at 0.8, 1.6, and 4 IU/mL did not produce a linear
response in starch hydrolysis, indicating that the enzyme concentration was too low for
accurate measurements. Amaize amylase activity diluted at 0.2, 0.27, 0.32, and 0.4 IU/mL
generated a linear response and averaged at 400 IU/mL (data not shown).
This assay determined that Amaize added at 15 IU/100 mL inoculum incubated
with 2.5 g of substrate for 2 hours produced the greatest increase in percent starch
degradation (data not shown). We felt this would be the most sensitive combination to
study its impact on starch degradation. These measures in combination with 24 hour
fermentations allows the determination of gas production to estimation both kinetics and
the extent of digestion. These conditions were selected to study the in vitro gas production
and starch degradation of different feedstuffs (experiments 1, 2 and 3).
4.3.2. In vitro gas production and starch degradation of different feedstuffs
Experiment 1
Dry rolled barley, Steam-flaked barley, Corn steam-flaked at 26 and 32 lb/bushel

91
Starch availability was lower for dry rolled barley, followed by steam-flaked barley,
corn steam-flaked at 26 lb/bushel, and corn steam-flaked at 32 lb/bushel (Table 4.2). In
vitro gas production approached plateau faster for dry rolled barley than for steam-flaked
barley, corn steam-flaked at 26 lb/bushel, and corn steam-flaked at 32 lb/bushel (Figure
4.1).
Although no differences in gas production after 2-hour incubation were detected,
the percent starch degraded at 2 h was increased 1.5% and 3.5% by Amaize addition to
corn steam-flaked at 26 and 32 lb/bu whereas Amaize did not increase starch degradation
for barley (Substrate x Amaize; P = 0.0002) (Table 4.3).
There was a decrease in gas production after 24-hour when Amaize was added for
steam-flaked barley, but there was an increase in gas production for dry rolled barley when
Amaize was present (Substrate x Amaize; P < 0.001) (Table 4.3). The inclusion of Amaize
did not change in vitro gas production after 24-hour for corn steam-flaked at 26 and 32
lb/bushel (Substrate x Amaize; P < 0.001) (Table 4.3). Amaize inclusion increased the rate
of degradation for corn steam-flaked at 26 lb/bushel and steam-flaked barley (Substrate x
Amaize; P < 0.001) (Table 4.3). No differences in the rate of degradation were detected
when Amaize was incubated with corn steam-flaked at 32 lb/bushel and dry-rolled barley
(Substrate x Amaize; P < 0.001) (Table 4.3).
Experiment 2
Dry Rolled Corn, High moisture Corn and Corn steam-flaked at 27 lb/bushel

92
Starch availability was lower for dry rolled corn, followed by high moisture corn
and corn steam-flaked at 27 lb/bushel (Table 4.2).
While curves appear visually similar (Figure 4.2), gas production after 24 hours
was significantly higher for high moisture corn than corn steam-flaked at 27 lb/bu and dry
rolled corn (Corn type x Amaize; P = 0.0297) (Table 4.4). The effect of different grain
processing and α-amylase supplementation can be observed in the gas production curves
of dry rolled corn, high moisture corn, and corn steam-flaked at 27 lb/bushel incubated
with and without Amaize for 24 hours (Figure 4.2). The curves demonstrate that among
the three substrates, high moisture corn generates the most gas over the 24 hour incubation
period, while dry rolled corn produces the least (Figure 4.2).
There were no differences in the gas produced after 2-hour incubation between the
three substrates (Corn type; P = 0.8454) (Table 4.4); however, the starch degraded after a
2-hour incubation was higher for high moisture corn than dry rolled corn (Corn type; P =
0.0123) (Figure 4.3) (Table 4.4). Dry rolled corn had a higher rate of degradation when
Amaize was included (Corn type x Amaize; P < 0.001) (Table 4.4). Amaize inclusion
decreased the rate of degradation when corn steam-flaked at 27 lb/bushel was the substrate
(corn type x Amaize; P < 0.001) (Table 4.4).
Experiment 3
Corn steam-flaked at 23, 25, 27, 29, and 31 lb/bushel with or without retrogradation

93
Enzymatic starch availability decreased with retrogradation and as flake density
increased, being highest for corn steam-flaked at 23 lb/bu and lowest for retrograded corn
steam-flaked at 31 lb/bu (Table 4.2).
Due to the retrogradation effect, retrograded steam-flaked corn took longer to reach
a gas production plateau than non-retrograded steam-flaked corn across all flake densities
(Figure 4.4). Non-retrograded steam-flaked corn appears to achieve plateau earlier in the
incubation than their corresponding retrograded flake densities (Figure 4.4). Although
retrograded steam-flaked corn might take longer to reach a plateau, it appears that gas
production of retrograded steam-flaked corn surpasses that of non-retrograded steam-
flaked corn towards the end of the 24 hour incubation period (Figure 4.4). Amaize inclusion
appears to increase gas production of retrograded steam-flaked corn throughout the 24
incubation period, with a higher impact on retrograded corn steam-flaked at 25 lb/bu
(Figure 4.4).
Flake density quartically affected in vitro gas production after 24- (quartic; P =
0.0109) and 2-hour (quartic; P = 0.0007) incubations, and the rate of degradation (quartic;
P = 0.0004) (Table 4.5). Corn steam-flaked at 27 lb/bu presented numerically lower gas
production after 2- (quartic; P = 0.0007) and 24- hour (quartic; P = 0.0109) incubations
than any other flake density (Table 4.5). Gas production at 2-hour was numerically higher
for corn steam-flaked at 23 lb/bu, followed by corn steam-flaked at 25 lb/bu, corn steam-
flaked at 29 lb/bu, and corn steam-flaked at 31 lb/bu (quartic; P = 0.0007) (Table 4.5). Gas
production after 24-hour was highest for corn steam-flaked at 23 lb/bu, followed by corn
steam-flaked at 31 lb/bu, corn steam-flaked at 29 lb/bu, and corn steam-flaked at 25 lb/bu
(quartic; P = 0.0109) (Table 4.5). Starch degraded after a 2-hour incubation was highest

94
for corn steam-flaked at 23 lb/bu and numerically decreased as flake density increased,
with the exception of corn steam-flaked at 27 lb/bu which presented the lowest percent
starch degradation (quadratic; P < 0.001) (Table 4.5). The rate of degradation behaved in
a unique manner, where it was highest for corn steam-flaked at 27 lb/bu, followed by corn
steam-flaked at 25 lb/bu, corn steam-flaked at 29 lb/bu, corn steam-flaked at 23 lb/bu, and
corn steam-flaked at 31 lb/bu (quartic; P = 0.0004) (Table 4.5).
The impact of retrogradation could be seen in the gas production measures collected
at 2 and 24 h (Table 4.6). Steam-flaked corn produced greater amounts of gas after a 2-
hour incubation than retrograded steam-flaked corn without Amaize supplementation
(Retrogradation x Amaize; P = 0.0383) (Table 4.6). Amaize inclusion increased gas
production at 2-hour for retrograded steam-flaked corn but did not affect non-retrograded
steam-flaked corn (Retrogradation x Amaize; P = 0.0383) (Table 4.6). Steam-flaked corn
had higher starch degradation than retrograded steam-flaked corn, where Amaize
supplementation improved percent starch degradation for both retrograde and non-
retrograde steam-flaked corn (Retrogradation x Amaize; P = 0.0138) (Table 4.6). Gas
production after 24-hour was higher for retrograded steam-flaked corn than non-
retrograded steam-flaked corn, with or without Amaize supplementation (Retrogradation x
Amaize; P = 0.0003) (Table 4.6). Although Amaize increased gas production after the 24-
hour incubation for retrograded steam-flaked corn, it did not improve gas production after
24-hour for non-retrograded steam-flaked corn (Retrogradation x Amaize; P = 0.0003)
(Table 4.6). The rate of degradation was higher for non-retrograded steam-flaked corn than
retrograded steam-flaked corn (Retrogradation x Amaize; P = < 0.001) (Table 4.6). Amaize
inclusion increased the rate of degradation for retrograded steam-flaked corn but did not

95
affect it for non-retrograded steam-flaked corn (Retrogradation x Amaize; P < 0.001)
(Table 4.6).
4.4. Discussion
Cereal grains used in feedlot diets can vary in ruminal and post-ruminal
digestibility, where grain processing can improve these parameters (Huntington, 1997).
Feedlot finishing diets use steam-flaked corn most often due to its higher starch availability
and rate of ruminal starch fermentation (Zinn et al., 2002). Flake density is determined by
the separation distance of the rolls when the corn is processed, where the most commonly
recommended flake density is 27 lb/bu (Vasconcelos and Galyean, 2007). Steam-flaked
grains can retrograde when exposed to high temperatures above 55°C. The elevated
temperature causes retrogradation because of the reassociation of dispersed starch
molecules. This generates a reduction in porosity of the starch matrix, which reduces starch
availability and limits enzyme access (Zinn et al., 2002; McAllister et al., 2006). The
degree of starch gelatinization is commonly measured using enzymatic starch availability
procedures, where high levels of starch availability can indicate rapid ruminal starch
fermentation rates (Vasconcelos and Galyean, 2007; Schwandt et al., 2016).
In vitro gas production can be used to study feedstuff digestibility, where in vitro
gas production generally increases as substrate disappearance increases, indicating a
positive relationship between feedstuff degradation and in vitro gas production (Theodorou
et al., 1994). During assay development, our data indicated that the effects of Amaize likely
occur early during the incubation. In this study, starch degradation of different feedstuffs

96
was measured after a 2-hour incubation period; since we observed the highest impact of
Amaize supplementation on starch degradation at this time point.
Barley is slowly colonized and digested by ruminal bacteria due to its cuticular
outer surface of the husk (Cheng et al., 1980; Cheng et al., 1981; Huntington, 1997). Cracks
present in the husk allow microbial access to the inner surface where more digestible
nutrients are present, permitting microbial proliferation and biofilm development (Cheng
et al., 1981; Cheng et al., 1983/84; Rode et al., 1986). By processing grains via dry rolling
or steam-flaking, microbes can access and digest starch granules within the endosperm at
faster rates (Cheng et al., 1973; Theurer, 1986; McAllister et al., 1990; Offner et al., 2003;
Hoffman et al., 2012). In this study, we observed that steam-flaked barley without Amaize
supplementation generates higher in vitro gas production after 24-hour and starch
degradation at 2 h than dry rolled barley, corn steam-flaked at 26 lb/bu and corn steam-
flaked at 32 lb/bu. In our data, the gas production curve for steam-flaked barley visually
appears to be linear with no apparent plateau. However, there was no overestimation of the
data during plateau prediction in that the last point recorded at 24-hour incubation was
similar to the estimated plateau. Mathison et al. (1991) reported similar results to our study,
where the rate of starch degradation was higher in steam-flaked barley than dry-rolled corn.
Trei et al. (1970) reported that in vitro gas production increased when barley was steam-
flaked, producing more gas than untreated barley. Our study results agree with the findings
of Zinn (1993), who reported that ruminal organic matter and starch digestibility were
greater for steam-rolled barley, followed by steam-flaked corn and dry-rolled barley. The
improvements in in vitro gas production and starch degradation with steam-flaking
observed in our study could be a result of grain processing, generating higher microbial

97
access to starch granules and increasing enzyme accessibility with starch gelatinization
(Galyean et al., 1976; Galyean et al., 1981; Nocek and Tamminga, 1991; Beauchemin et
al., 1994; Mathison, 1996). In this study, the rate of degradation was highest for dry rolled
barley and lowest for steam-flaked barley, which could have been a result of more rapidly
fermented fine particles (< 1 mm) present in dry-rolled barley (Engstrom et al., 1992).
The hydrolytic capacity of α-amylase is correlated to the physical state of starch,
where its effect on native starch is limited (Walker and Hope, 1963). In this study, there
was an increase in in vitro gas production after 24-hour incubation with no changes in the
rate of degradation when dry rolled barley was incubated with Amaize. Meanwhile, there
was a decrease in in vitro gas production after 24-hour incubation with an increase in the
rate of degradation when Amaize was incubated with steam-flaked barley. Enzymatic
accessibility to starch granules increases when starch is exposed to temperatures between
55°C to 60°C, due to degradation of the outer layer and reduction in the crystallization of
starch granules (Lauro et al., 1963). Dry rolling is a cold processing method, while steam-
flaking exposes the grain to moisture and heat to gelatinize the starch (Van Soest, 1994).
This study observed an increased rate of degradation when Amaize was incubated with
steam-flaked barley and corn steam-flaked at 26 lb/bu, which could result from higher
enzymatic access of the less crystallized starch granule. The lack of change in the rate of
degradation for corn steam-flaked at 32 lb/bu and dry rolled barley could be due to the less
available starch present in dry rolled and high flake density steam-flaked corn. Our data
demonstrates that Amaize has the potential to improve starch degradation of corn steam-
flaked at 26 and at 32 lb/bu. Chai et al. (2004) demonstrated that gas production could be
used to accurately estimate starch degradation once fermentation of starch and other non-
98
soluble components occurs simultaneously. It is important to emphasize that in our study
the effect of Amaize was detected at 2-hour, in which the impact of starch degradation and
Amaize supplementation in vivo may depend on ruminal retention time and passage rate.
Xiong et al. (1990a) used reconstituted steam-flake sorghum with five different
flake densities to compare enzymatic glucose release and in vitro gas production to estimate
ruminal starch availability; the study determined that both methods can be used as a
quantitative measurement of grain processing effects on ruminal starch availability. Our
data shows that starch availability does not always reflect starch degradation after 2-hour
incubation for different feedstuffs. In our study, starch availability was numerically higher
for corn steam-flaked at 27 lb/bu, followed by high moisture corn and dry rolled corn.
Meanwhile, starch degraded at 2-hour was numerically higher for high moisture corn,
followed by corn steam-flaked at 27 lb/bu and dry-rolled corn. Gas production curves may
depict a more complete picture of ruminal starch availability, where high moisture corn
had the highest cumulative gas production after 24 hours, followed by corn steam-flaked
at 27 lb/bu, and dry rolled corn.
Grain processing such as steam-flaking can improve grain digestibility (Orskov et
al., 1969; McKnight et al., 1973; Galyean et al., 1976; Lee et al., 1982; Stock et al., 1987).
In this study, high moisture corn presented higher in vitro gas production after 24 hours
and rate of degradation than dry rolled corn. These results are in agreement with Stock et
al. (1987), where high moisture corn was rapidly degraded in the rumen, while dry rolled
corn was slowly degraded. Galyean et al. (1976) demonstrated the effect of grain
processing when in vitro gas production and in vivo starch digestibility were higher for
steam-flaked corn, followed by high-moisture corn and dry rolled corn.

99
The α-amylase enzyme acts on starch substrates in a multi-attack mechanism,
where the enzymes bind to the substrate forming a complex to generate the first cleavage.
After the first cleavage, the enzyme remains with the fragment of the original starch
structure and catalyzes the hydrolysis of additional bonds yielding oligosaccharides before
its dissociation (Robyt and French, 1967). The rate which amylase acts on starch substrates
can vary depending on starch source, grain processing, granule size, amylose/amylopectin
ratio, degree of crystallization, and other factors (Kayisu and Hood, 1979; Snow and
O’Dea, 1981; Dreher et al., 1984; Hoover and Sosulski, 1985; Wursch et al., 1986; Ring et
al., 1987; Ring et al., 1988). By grinding all substrates to 1 mm, we controlled the effect of
particle size in this study. Our study demonstrated that the inclusion of Amaize can
significantly increase the rate of degradation of different types of corn. In this study, the
rate of degradation significantly increased when dry rolled corn was incubated with
Amaize. Meanwhile, these parameters decreased when corn steam-flaked at 27 lb/bu was
the substrate incubated with Amaize. These results were not expected since α-amylase has
a lower hydrolytic capacity on crystalline starch than gelatinized starch (Hoover and
Sosulski, 1985; Ring et al., 1987; Ring et al., 1988; Zinn et al., 2002). Processed grains
typically have lower crystalline starch content and higher gelatinized starch content than
dry rolled grains due to disruption of the crystalline starch granules during its heat
processing (Baldwin et al., 1994). These differences in starch structure and availability
might not be the factors driving the effects of Amaize on different types of processed corn.
Starch availability measures the difference between enzymatically-available starch
and the total starch content of feedstuffs, where it can determine the degree of starch
gelatinization and potentially estimate ruminal starch digestion (Schwandt et al., 2016;

100
Trotta et al., 2021a, 2021b). In this study, starch availability decreased as flake density
increased and was lower for retrograded steam-flaked corn than non-retrograded steam-
flaked corn, as expected. Schwandt et al. (2016) obtained similar results to our study, where
starch availability of steam-flaked corn linearly decreased as flake density increased,
ranging from 65% (24 lb/bu) to 37% (31 lb/bu). In agreement with the results of this study,
Trotta et al. (2021a) and Trotta et al. (2021b) observed that enzymatic starch availability
of steam-flaked corn decreases with retrogradation and increasing flake densities.
Increasing flake density of steam-flaked corn generally decreases ruminal and total
tract starch digestibility (Theurer et al., 1999; Zinn et al., 2002; Ponce et al., 2013). In our
study gas production and percent starch degraded at 2-hour of incubation were numerically
higher for corn steam-flaked at 23 lb/bu, followed by corn steam-flaked at 25 lb/bu, corn
steam-flaked at 29 lb/bu, corn steam-flaked at 31 lb/bu, and corn steam-flaked at 27 lb/bu.
Meanwhile, available starch was numerically higher for corn steam-flaked at 23 lb/bu,
followed by corn steam-flaked at 25 lb/bu, corn steam-flaked at 29 lb/bu, corn steam-flaked
at 27 lb/bu, and corn steam-flaked at 31 lb/bu. Our data demonstrate that available starch
did not accurately describe starch degradation across the different feedstuffs and steam-
flaked corn with varying flake densities, suggesting that in vitro gas production might be a
better tool to estimate ruminal starch digestion than enzymatic starch availability. In vitro
gas production after 24-hour incubation and starch degraded after 2-hour incubation
decreased as flake density increased except for density 27 lb/bu, in which these parameters
were lower than expected. These results could be due to the lower starch availability this
flake density presented since starch availability correlates to the rate of ruminal starch
fermentation (Schwandt et al., 2016).

101
In our study, retrograded steam-flaked corn had a lower rate of degradation than
non-retrograded steam-flaked corn, but conversely, it had higher in vitro gas production
after 24-hour incubation. Our data suggests that ruminal digestibility of steam-flaked corn
may not be constrained by starch retrogradation but rather, changes in rate and passage
may be the primary constraints. Our data also indicate that starch retrogradation reduces
the ruminal rate of degradation, possibly increasing the amount of starch that escapes the
rumen and enters the small intestine (Theurer, 1986; Theurer et al., 1999; Owens et al.,
2016; Trotta et al., 2021b). Retrogradation creates rigidity and crystallization of starch
which can reduce the amylase rate of hydrolysis (Miles et al., 1985; Zhang and Jackson,
1992; Biliaderis, 1998). The reduction in amylase hydrolysis rate could be the reason why,
in our study, we observed lower starch degraded and in vitro gas production after the 2-
hour incubation in retrograded steam-flaked corn when compared to non-retrograded
steam-flaked corn.
When analyzing the effects of Amaize in retrograded and non-retrograded steam-
flaked corn, we observed that the rate of degradation and in vitro gas production after 2-
hour incubation increased when retrograde steam-flaked corn was incubated with Amaize.
It is possible that Amaize did not improve rate of degradation for non-retrograde steam-
flaked corn due to its already high starch availability content and greater susceptibility to
microbial enzymatic attack (Rooney and Pflugfelder, 1986; Zinn et al., 2002). The effect
of α-amylase in ruminal starch degradation can vary. Noziere et al. (2013) reported
improvements in ruminal starch digestion when supplementing first-lactating cows with
exogenous amylase. Rojo et al. (2005) also observed an increase in ruminal starch digestion
when supplementing amylase from direct-fed microbial to lambs. Tricarico et al. (2008)

102
did not detect improvements in ruminal starch digestion when comparing studies that
supplemented Aspergillus oryzae extract containing α-amylase activity to ruminants in vivo
and in vitro. In our study, Amaize increased the percent starch degraded after 2-hour
incubation for both retrograded and non-retrograded steam-flaked corn. Our data imply
that Amaize could be used to increase the amount of starch degraded in the rumen, possibly
reducing the starch flow to the small intestine when feeding retrograded or non-retrograded
steam-flaked corn to cattle.
In summary, in vitro gas production appears to more accurately estimate ruminal
starch degradation of different feedstuffs than starch availability. Grain processing
improves in vitro gas production and starch degradation parameters of multiple feedstuffs.
Amaize can potentially increase ruminal in vitro rate of degradation and starch degradation
of different feedstuffs. Corn steam-flaked at lower flake densities present higher ruminal
in vitro gas production and starch degradation. Ruminal digestibility of steam-flaked corn
after 24-hour incubation is not limited by starch retrogradation. Starch retrogradation
reduces the ruminal rate of degradation, possibly increasing the amount of starch that
escapes the rumen and enters the small intestine.
4.5. Conclusion
Starch availability increases with steam-flaking of grains, and decreases with
retrogradation and increasing flake density. In vitro gas production after 24-hour
incubation increases when Amaize is incubated with dry rolled barley but decreases when
the substrates are steam-flaked barley and retrograded steam-flaked corn. Amaize

103
supplementation does not cause any changes in in vitro gas production after 24-hour
incubation when the substrates are dry rolled corn, high moisture corn, and steam-flaked
corn. Amaize increases in vitro rate of degradation when incubated with corn steam-flaked
at 26 lb/bu, steam-flaked barley, dry rolled corn, and retrograde steam-flaked corn. But
Amaize decreases this parameter when incubated with corn steam-flaked at 27 lb/bu. In
vitro percent starch degraded increased when Amaize was incubated with steam-flaked
corn and retrograded steam-flaked corn, but no changes occurred when incubated with dry
rolled corn, high moisture corn, dry rolled barley, and steam-flaked barley. Our study
suggests that in vitro gas production might be a more descriptive tool to estimate starch
degradation in the rumen than enzymatic starch availability measurements. Our data also
indicate that Amaize can increase the in vitro rate of degradation and starch degradation of
different substrates with different grain processing methods, potentially increasing starch
degraded in the rumen and lowering starch flow to the small intestine.

104
Table 4.1. Composition of diet fed ad libitum to rumen fluid donor animals in in vitro
study.

105

106

107
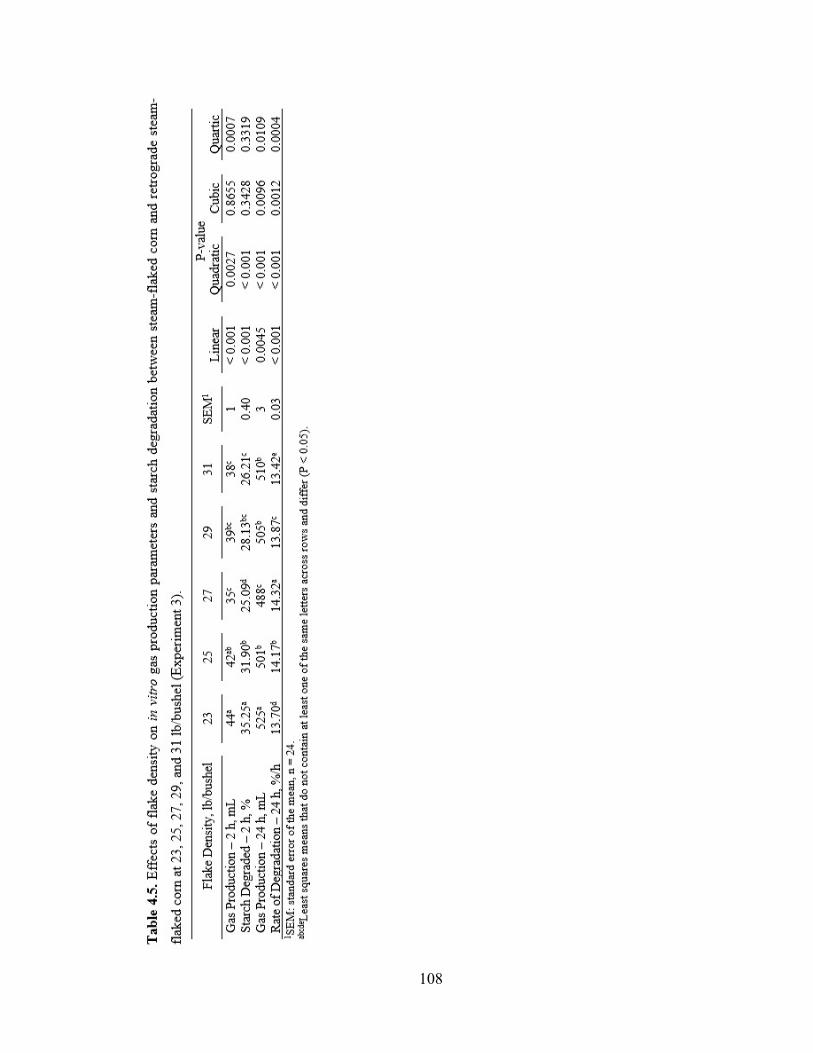
108

109

110

111

112

113

114
CHAPTER 5.
Summary and Conclusions
Metabolic disorders can occur in ruminants during the transition period from a
high-forage diet to a high-grain diet. Finishing diets typically used in feedlots are high in
concentrate which can increase the risk for rumen acidosis and liver abscess. Dietary
antibiotics such as monensin and tylosin can be used to prevent these physiological
complications. Due to growing concerns over the use of antibiotics in agriculture,
alternative products have been developed with the goal to mitigate digestive distress that
might occur when cattle consume a high-concentrate diet. This dissertation aimed to
understand the physiological mechanisms of Programmed Nutrition Beef Finisher and
Amaize (α-amylase) supplementation in the rumen and whole-body of cattle.
To accomplish these goals, measurements of animal metabolism and performance
were conducted in vivo, and changes in rumen metabolism were determined in vitro. The
first portion of this dissertation compared the effects of Programmed Nutrition Beef
Finisher versus traditional feedlot additives monensin and tylosin in vivo. The study
demonstrated that dry matter digestibility and average daily gain does not improve with
the supplementation of monensin and tylosin, Programmed Nutrition Beef Finisher, or their
combination. These results indicate that Programmed Nutrition Beef Finisher is not
recommended to enhance animal performance.
Monensin and tylosin can improve acid detergent fiber (ADF) digestibility,
meanwhile supplementing steers with a combination of Programmed Nutrition Beef

115
Finisher, monensin and tylosin can lead to a decrease in acid detergent fiber digestibility.
It is important to emphasize that in this study animals consumed a high-grain diet, where
different responses could be obtained if animals were consuming a high-forage diet due to
potential microbial population adaptation towards a more fibrolytic rumen environment. It
was also shown that feeding the combination of these additives can increase the time rumen
pH remains below 5.6 and 5.3, which can lead to the negative effects of rumen acidosis.
When rumen pH remains below 5.3 for a prolonged period of time it increases the risk of
occurring rumen wall damage.
Programmed Nutrition Beef Finisher would not be recommended to reduce
methane emissions in animals consuming a finishing feedlot diet, since no differences in
methane production were detected among treatments. The control treatment presented
greater retained energy and energy retained in fat than monensin and tylosin, Programmed
Nutrition Beef Finisher, and their combination. Our results indicate that these additives do
not increase energy deposited as fat in cattle consuming a high-grain diet when compared
to a conventional trace mineral supplement. Similarly, no differences in energy retained in
protein, protein turnover, or protein synthesis were detected among the treatments. Our
data demonstrates that Programmed Nutrition Beef Finisher would not improve muscle
synthesis and deposition when supplemented to cattle consuming a diet composed
primarily of high moisture corn and corn silage.
The second portion of this dissertation analyzed the effects of Amaize (α-amylase)
supplementation, grain processing, grain flake density, and grain retrogradation on rumen
metabolism and starch degradation in vitro. Our data demonstrate that in vitro gas
production better predicted starch degradation in the rumen than enzymatic starch
116
availability measurements, indicating that in vitro gas production might be a more accurate
method to predict ruminal starch degradation.
In our study, Amaize improved in vitro gas production after 24-hour incubation for
dry rolled barley but caused a reduction in gas production for steam-flaked barley and
retrograded steam-flaked corn. This indicates that Amaize could potentially increase
ruminal degradation of dry rolled grains that are slowly colonized and digested in the
rumen. Amaize increases in vitro rate of degradation of corn steam-flaked at 26 lb/bu,
steam-flaked barley, dry rolled corn, and retrograde steam-flaked corn. Our results
establish that Amaize can be used to increase the ruminal rate of degradation across a range
of grain types and processing methods. Amaize could be used to improve the ruminal rate
of degradation when animals are fed grains that are processed with heat (steam-flaking)
and no heat (dry rolling).
Our data indicate that Amaize can be used to increase in vitro percent starch
degraded in both steam-flaked corn and retrograded steam-flaked corn. These results imply
that the degree of starch crystallization and gelatinization might not limit the effectiveness
of Amaize on these parameters. Overall, our data suggest that Amaize can potentially be
used to increase ruminal substrate and starch degradation across a range of grain types with
different processing methods.
In conclusion, Programmed Nutrition does not appear to be an adequate
replacement for monensin and tylosin to alleviate the negative effects of a high-grain diet
in the rumen or to improve animal performance. Amaize could be used to improve ruminal
substrate digestibility over 24 hours, increase ruminal substrate rate of degradation, and
percent starch degraded in the rumen across multiple grain types submitted to different

117
processing methods. It is important to emphasize that these results are limited to cattle
consuming high-grain diets with limited adaptation periods to treatments. By better
understanding the mechanisms of these supplements across a range of diets and substrates
we can optimize their response in animal health and performance.
Copyright © Amanda Pesqueira Schiff 2022
118
BIBLIOGRAPHY
Abas, I., H. C. Kutay, R. Kahraman, N. Y. Toker, D. Ozcelik, F. Ates, and A. Kacakci. 2007. Effects of organic acid and bacterial direct-feed microbial on fattening performance of Kivircik-male yearling lambs. Pakistan Journal of Nutrition 6(2):149-154.
Abrams, E., J. W. Lassiter, W. J. Miller, M. W. Neathery, R. P. Gentry, and D. M. Blackmon. 1977. Effect of normal and high manganese diets on the role of bile in manganese metabolism of calves. Journal of Animal Science 45:1108-1113.
Agtarap, A., J. W. Chamberlin, M. Pinkerton, and L. Steinrauf. 1967. The Structure of monensic acid, a new biologically active compound. Journal of the American Chemical Society:359-362.
Agustinho, B. C., K. C. Ramsey, C. Moore, C. Y. Tsai, C. M. Scholte, M. A. McGuire, and P. Rezaman. 2021. Effect of different combinations of dietary vitamin a, protein levels, and monensin on inflammatory markers and metabolites, retinol-binding protein, and retinoid status in periparturient dairy cows. Animals 11(2605-2621)
Akin, D. E. 1986. Interaction of ruminal bacteria and fungi with southern forages. Journal of Animal Science 63:962-977.
Alleaume, M., and D. Hicke. 1972. Crystal structure of the thallium salt of the antibiotic grisorixin. Journal of the Chemical Society:175-176.
Allison, B. C., and R. L. McCraw. 1989. Efficacy of Vita-Ferm Formula for Stocker Calves. Animal Science Deptartment Newsletter. North Carolina State University.
Amachawadi, R. G., T. J. Purvis, B. V. Lubbers, J. W. Homm, C. L. Maxwell, and T. G. Nagaraja. 2017. Bacterial flora of liver abscesses in crossbred beef cattle and Holstein steers fed finishing diets with or without tylosin. Journal of Animal Science 95:3425-3434.
Anderson, K. L., and A. A. Salyers. 1989a. Biochemical evidence that starch breakdown by Bacteroide thetaiotaomicron involves outer membrane starch-binding sites and periplasmic starch-degrading Enzymes. Journal of Bacteriology 171(6):3192-3198.
Anderson, K. L., and A. A. Salyers. 1989b. Genetic evidence that outer membrane binding of starch is required for starch utilization by Bacteroides thetaiotaomicron. Journal of Bacteriology 171(6):3199-3204.
Andries, J. I., F. X. Buysse, D. L. De Brabander, and B. G. Cottyn. 1987. Isoacids in ruminant nutrition: Their role in ruminal and intermediary metabolism and possible influences on performances - A review. Animal Feed Science and Technology 18:169-180.

119
Ankom. 2013. Operator’s Manual. Ankom Gas Production System. Macedom, NY
AOAC. 2005. Official Methods of Analysis. Assoc. Anal. Chem. 18th ed. Arlington, VA
Aronson, J. K. 2016. Tylosin. In: Meyler’s Side Effects of Drugs. 16th ed:233.
Arora, S. P., E. E. Hatfield, U. S. Garrigus, T. G. Lohman, and B. B. Doane. 1969. Zinc-65 uptake by rumen tissue. The Journal of Nutrition 97(1):25-28.
Arthur, J. R., and G. J. Beckett. 1994. New metabolic roles for selenium. Proceedings of the Nutrition Society 53:61-624.
Arthur, J. R., F. Nicol, and G. J. Beckett. 1990. Hepatic iodothyronine 5'-deiodinase. Biochemical Journal 272:537-554.
Baird, G. D., M. A. Lomax, H. W. Symonds, and S. R. Shaw. 1980. Net hepatic and splanchnic metabolism of lactate, pyruvate and propionate in dairy cows in vivo in relation to lactation and nutrient supply. Biochemical Journal 186:47-57.
Baldwin, P. M., J. Adler, M. C. Davies, and C. D. Melia. 1994. Holes in starch granules: confocal, SEM and light microscopy studies of starch granule structure. Starch 46:341-346.
Baldwin, R. L., and M. J. Allison. 1983. Rumen Metabolism. Journal of Animal Science 57(2):461-477.
Bastioli, C., P. Magistrali, and S. G. Garcia. 2014. Starch. Bio-Based Plastics: Materials and Applications 1:9-33.
Bauchop, T. 1981. The anaerobic fungi in rumen fibre digestion. Agriculture and Environment 6:339-348.
Bayer, E. A., H. Chanzyt, R. Lamed, and Y. Shoham. 1998. Cellulose, cellulases and cellulosomes. Current Opinion in Structural Biology 8:548-557.
Beard, J. L., and H. D. Dawson. 1997. Iron. In: Handbook of Nutritionally Essential Mineral Elements. CRC Press, NY:275.
Beauchemin, K. A., T. A. McAllister, Y. Dong, and K. J. Cheng. 1994. Effects of mastication on digestion of whole cereal grains by cattle. Journal of Animal Science 72:236-246.
Beauchemin, K. A., W. Z. Yang, D. P. Morgavi, G. R. Ghorbani, W. Kautz, and J. A. Z. Leedle. 2003. Effects of bacterial direct-fed microbials and yeast on site and extent of digestion, blood chemistry, and subclinical ruminal acidosis in feedlot cattle. Journal of Animal Science 81:1628-1640.

120
Beede, D. K., G. T. Schelling, G. E. Mitchell Jr., R. E. Tucker, W. W. Gill, S. E. Koenig, and T. O. Lindsey. 1986. Nitrogen utilization and digestibility by growing steers and goats of diets that contain monensln and low crude protein. Journal of Animal Science 62:857-863.
Beharka, A. A., and T. G. Nagaraja. 1993. Effect of Aspergillus oryzae fermentation extract (Amaferm®) on in vitro fiber degradation. Journal of Dairy Science 76:812-818.
Beharka, A. A., T. G. Nagaraja, and J. L. Morrill. 1991. Performance and ruminal function development of young calves fed diets with Aspergillus oryzae fermentation extract. Journal of Dairy Science 74:4326-4336.
Bentley, O. G., R. R. Johnson, T. V. Hershberger, J. H. Cline, and A. L. Moxon. 1955. Cellulolytic-factor activity of certain short-chain fatty acids for rumen microorganisms in vitro: Two figures. The Journal of Nutrition, Volume 57, Issue 3, November 1955, Pages 389–400, 57(3):389-400.
Bergen, W. G., and D. B. Bates. 1984. Ionophores: Their effect on production efficiency and mode of action. Journal of Animal Science 58(6):1465-1483.
Bergman, E. N. 1970. Hyperketonemia-ketogenesis and ketone body metabolism. Journal of Dairy Science 54(6):936-948.
Bergman, E. N. 1990. Energy contributions of volatile fatty acids from the gastrointestinal tract in various species. Physyological Reviews 70(2):567-590.
Bergman, E. N., and J. E. Wolff. 1971. Metabolism of volatile fatty acids by liver and portal-drained viscera in sheep. American Journal of Physiology 221(2):586-592.
Biliaderis, C. G. 1998. Structures and phase transitions of starch polymers. In: Polysaccharide association structures in food, Marcel Dekker, Inc., NY:57-168.
Blaxter, K. L., and K. L. Wainman. 1966. The fasting metabolism of cattle. British Journal of Nutrition 20:103-111.
Boardman, C. J. 2015. Effects of monensin and dietary energy intake on maintenance requirements in beef cows. Master of Science Thesis. College Station, Texas A&M University
Boardman, C. J., T. A. Wickersham, L. A. Trubenbach, and J. E. Sawyer. 2016. Effects of monensin and dietary energy intake on maintenance requirements in beef cows. Journal of Animal Science 94(Suppl 1):42.
Boing, J. T. P. 1983. Enzyme Production. 4th ed. In: Industrial Microbiology. Westport, CT

121
Brouwer, E. 1965. Report of sub-committee on constants and factors. In: Proc. 3rd Int. Symp. on Energy Metabolism of Farm Animals. EAAP Publ. Troon Academic Press, London—New York. 11:441-443.
Burrin, D. G., and R. A. Britton. 1986. Response to monensin in cattle during subacute acidosis. Journal of Animal Science 63:888-893.
Burrin, D. G., R. A. Stock, and R. A. Britton. 1988. Monensin level during grain adaptation and finishing performance in cattle. Journal of Animal Science 66:513-521.
Busscher, J. H., and A. H. Weerkamp. 1987. Specific and non-specific interactions in bacterial adhesion. Federation of European Microbiological Societies Microbiology Reviews 46:165-173.
Butaye, P., L. A. Devriese, and F. Haesebrouck. 2003. Antimicrobial growth promoters used in animal feed: effects of less well known antibiotics on gram-positive bacteria. Clinical Microbiology Reviews 16(2):175-188.
Byers, J. H., I. R. Jones, and J. F. Bone. 1956. Carotene in the ration of dairy cattle. II: The influence of suboptimal levels of carotene intake upon the microscopic aspect of selected organs Journal of Dairy Science:1556-1564.
Callaway, T. R., and S. C. Ricke. 2012. Direct-fed microbials and prebiotics for animals. Springer, NY
Cappellozza, B. I., R. F. Cooke, M. M. Reis, P. Moriel, D. H. Keisler, and D. W. Bohnert. 2014. Supplementation based on protein or energy ingredients to beef cattle consuming low-quality cool-season forages: II. Performance, reproductive, and metabolic responses of replacement heifers. Journal of Animal Science 92:2725–2734.
Carro, M. D., P. Lebzien, and K. Rohr. 1992. Effects of yeast culture on rumen fermentation, digestibility and duodenal flow in dairy cows fed a silage based diet. Livestock Production Science 32:219-229.
Caton, J. S., D. O. Erickson, D. A. Carey, and D. L. Ulmer. 1993. Influence of Aspergillus oryzae fermentation extract on forage intake, site of digestion, in situ degradability, and duodenal amino acid flow in steers grazing cool-season pasture. Journal of Animal Science 71:779-787.
Ceconi, I., M. J. Ruiz-Moreno, N. DiLorenzo, A. DiCostanzo, and G. I. Crawford. 2015. Effect of urea inclusion in diets containing corn dried distillers grains on feedlot cattle performance, carcass characteristics, ruminal fermentation, total tract digestibility, and purine derivatives-to creatinine index. Journal of Animal Science 93:357-369. doi: 10.2527/jas2014-8214

122
Chai, W. Z., A. H. Van Gelder, and J. W. Cone. 2004. Relationship between gas production and starch degradation in feed samples. Animal Feed Science and Technology 114:195-204.
Chen, M., and M. J. Wolin. 1979. Effect of monensin and lasalocid-sodium on the growth of methanogenic and rumen saccharolytic bacteria. Applied and Environmental Microbiology 38(1):72-77.
Cheng, K. J., J. P. Fay, R. N. Coleman, L. P. Milligan, and J. W. Costerton. 1981. Formation of bacterial microcolonies on feed particles in the rumen. Applied and Environmental Microbiology 41(1):298-305.
Cheng, K. J., J. P. Fay, R. E. Howart, and J. W. Costerton. 1980. Sequence of events in the digestion of fresh legume leaves by rumen bacteria. Applied and Environmental Microbiology 40(3):613-625.
Cheng, K. J., R. Hironaka, D. W. Roberts, and J. W. Costerton. 1973. Cytoplasmic glycogen inclusions in cells of anaerobic gram-negative rumen bacteria. Canadian Journal of Animal Science 19:1501-1506.
Cheng, K. J., C. S. Stewart, D. Dinsdale, and J. W. Costerton. 1983/84. Electron microscopy of bacteria involved in the digestion of plant cell walls. Animal Feed Science and Technology 10:93-120.
Coleman, G. S. 1986b. The metabolism of rumen ciliate protozoa. Federation of European Microbiological Societies Microbiology Reviews 39:321-344.
Colombatto, D., F. L. Mould, M. K. Bhat, D. P. Morgavi, K. A. Beauchemin, and E. Owen. 2003b. Influence of fibrolytic enzymes on the hydrolysis and fermentation of pure cellulose and xylan by mixed ruminal microorganisms in vitro. Journal of Animal Science 81:1040–1050.
Cook, J., and M. B. Reddy. 2001. Effect of ascorbic acid intake on nonheme-iron absorption from a complete diet. American Journal of Clinical Nutrition 73:93-98.
Cotta, M. A. 1988. Amylolytic activity of selected species of ruminal bacteria. Applid and Environmental Microbiology 54(3):772-776.
Dai, X., Y. Tian, J. Li, Y. Luo, D. Liu, H. Zheng, J. Wang, Z. Dong, S. Hu, and L. Huang. 2015. Metatranscriptomic analyses of plant cell wall polysaccharide degradation by microorganisms in the cow rumen. Applied and Environmental Microbiology 81(4):1375-1386. doi: 10.1128/AEM.03682-14
Daugherty, M. S., M. L. Galyean, D. M. Hallford, and J. H. Hageman. 1986. Vitamin B12 and monensin effects on performance, liver and serum vitamin B12 concentrations and activity of propionate metabolizing hepatic enzymes in feedlot lambs. Journal of Animal Science 62:452-463.

123
Dawson, K. A., K. E. Newman, and J. A. Boling. 1990. Effects of microbial supplements containing yeast and lactobacilli on roughage-fed ruminal microbial activities. Journal of Animal Science 68:3392-3398.
Day, L. E., J. W. Chamberlin, E. Z. Gordee, S. Chen, M. Gorman, R. L. Hamill, T. Ness, R. E. Weeks, and R. Stroshane. 1973. Biosynthesis of monensin. Antimicrobial Agents and Chemotherapy 4(4):410-414.
DeLuca, H. F. 1979. The vitamin D system in the regulation of calcium and phosphorus metabolism. Nutrition Reviews 37:161-193.
Demigne, C., C. Yacoub, C. Remesy, and P. Fafournoux. 1986. Propionate and butyrate metabolism in rat or sheep hepatocytes Biochemica et Biophysica Act 875:535-542.
Denigan, M. E., J. T. Huber, G. A. Alhadhrami, and A. Al-Degneh. 1992. Influence of feeding varying levels of Amaferm on performance of lactating dairy cows. Journal of Dairy Science 75:1616-1621.
Dennis, S. M., T. G. Nagaraja, and E. E. Bartley. 1981. Lasalocid or monensin on lactate-producing or -using rumen bacteria. Journal of Animal Science 52(2):418-426.
Dick, A. T. 1953. The control of copper storage in the liver of sheep by inorganic sulphate and molybdenum. The Australian Veterinary Journal 29(9):233-239.
DiCostanzo, A., J. E. Williams, and D. H. D. H. Keisler. 1999. Effects of short- or long-term infusions of acetate or propionate on luteinizing hormone, insulin, and metabolite concentrations in beef heifers. Journal of Animal Science 77:3050–3056.
Dijkstra, J. 1994. Simulation of the dynamics of protozoa in the rumen. British Journal of Nutrition 72:679-699.
DiLorenzo, N., D. R. Smith, M. J. Quinn, M. L. May, C. H. Ponce, W. Steinberg, M. A. Engstrom, and M. L. Galyean. 2011. Effects of grain processing and supplementation with exogenous amylase on nutrient digestibility in feedlot diets. Livestock Science 137(1-3):178-184.
Dinius, D. A., M. E. Simpson, and P. B. Marsh. 1976. Effect of monensin fed with forage on digestion and the ruminal ecosystem of steers. Journal of Animal Science 42(1):229-234.
Dorkov, P., I. N. Pantcheva, W. S. Sheldrick, H. Mayer-Figge, R. Petrova, and M. Mitewa. 2008. Synthesis, structure and antimicrobial activity of manganese(II) and cobalt(II) complexes of the polyether ionophore antibiotic sodium monensin A. Journal of Inorganic Biochemistry 102:26-32.
124
Dreher, M. L., C. J. Dreher, and J. W. Berry. 1984. Starch digestibility of foods: A nutritional perspective. CRC Critical Reviews in Food Science and Nutrition 20(1):47-71.
Duffield, T. F., J. K. Merrill, and R. N. Bagg. 2012. Meta-analysis of the effects of monensin in beef cattle on feed efficiency, body weight gain, and dry matter intake. Journal of Animal Science 90:4583-4592.
Ebert, P. J., E. A. Bailey, A. L. Shreck, J. S. Jennings, and N. A. Cole. 2017. Effect of condensed tannin extract supplementation on growth performance, nitrogen balance, gas emissions, and energetic losses of beef steers. Journal of Animal Science 95:1345-1355.
Elanco Study. 2012. Effect of Rumensin and Tylan fed separately or in combination on feed efficiency and liver abscesses and the resulting effects on carcass characteristics of feedlot steers. 0509
Ellis, J. L., J. Dijkstra, A. Bannink, E. Kebreab, S. E. Hook, S. Archibeque, and J. France. 2012. Quantifying the effect of monensin dose on the rumen volatile fatty acid profile in high-grain-fed beef cattle. Journal of Animal Science 90:2717–2726.
Elolimy, A. A., S. J. Moisa, K. M. Brennan, A. C. Smith, D. Graugnard, D. W. Shike, and J. Loor. 2018. Skeletal muscle and liver gene expression prodiles in finishing steers supplemented with Amaize. Animal Science Journal 89:1107-1119.
Engstrom, D. F., G. W. Mathison, and L. A. Goonewarden. 1992. Effect of β-glucan, starch, and fibre content and steam vs. dry rolling of barley grain on its degradability and utilisation by steers. Animal Feed Science and Technology 37:33-46.
Erasmus, L. J., P. M. Botha, and A. Kistner. 1992. Effect of yeast culture supplement on production, rumen fermentation, and duodenal nitrogen flow in dairy cows. journal of dairy science. Journal of Dairy Science 75:3056-3065.
Erickson, G. E., C. T. Milton, K. C. Fanning, R. J. Cooper, R. S. Swingle, J. C. Parrott, G. Vogel, and T. J. Klopfenstein. 2003. Interaction between bunk management and monensin concentration on finishing performance, feeding behavior, and ruminal metabolism during an acidosis challenge with feedlot cattle. Journal of Animal Science:2869–2879.
Erratt, J. A., and P. E. Douglas. 1984. The induction of α-amylase by starch in Aspergillus oryzae: evidence for controlled mRNA expression. Canadian Journal of Biochemistry and Cell Biology 62:678-690.
Everson, W. V., K. E. Flaim, D. M. Susco, S. R. Kimball, and L. S. Jefferson. 1989. Effect of amino acid deprivation on initiation of protein synthesis in rat hepatocytes. American Journal of Physiology 256:C18-C27.

125
Felix, T. L., N. A. Pyatt, and S. C. Loerch. 2012. Effects of monensin supplementation on ruminal metabolism of feedlot cattle fed diets containing dried distillers grains. Journal of Animal Science 90:3905–3913.
Ferguson, S. A., S. Keis, and G. M. Cook. 2006. Biochemical and molecular characterization of a Na+-Translocating F1Fo-ATPase from the thermoalkaliphilic bacterium Clostridium paradoxum. Journal of Bacteriology 188(14):5045-5054. doi: doi:10.1128/JB.00128-06
Fiems, L. O., B. G. Cottyn, L. Dussert, and J. M. Vanacker. 1993. Effect of viable yeast culture on digestibility and rumen fermentation in sheep fed different types of diets. Reproduction Nutrition Development 33:43-49.
Fogarty, W. M., and C. T. Kelly. 1979. Developments in microbial extracellular enzymes. In: Topics in enzymes and fermentation biotechnology. Halsted Press, NY
Foster, L. H., and S. Sumar. 1997. Selenium in health and disease: A review. Critical Reviews in Food Science and Nutrition 37(3):211-228.
Fraker, P., and L. King. 1998. Changes in regulation of lymphopoiesis and myelopoiesis in the zinc-deficient mouse Nutrition Reviews 56(1):S65-S69.
Fraker, P. J., S. M. Haas, and R. W. Luecke. 1977. Effect of zinc deficiency on the immune response of the young adult A/J mouse. The Journal of Nutrition 107(10):1889-1895. doi: 10.1093/jn/107.10.1889
Freetly, H. C., and T. M. Brown-Brandl. 2013. Enteric methane production from beef cattle that vary in feed efficiency. Journal of Animal Science 91:4826-4831.
Gallo, A., G. Giuberti, S. Duval, M. Moschini, and F. Masoero. 2016. The effect of an exogenous enzyme with amylolytic activity on gas production and in vitro rumen starch degradability of small and large particles of corn or barley meals. Journal of Dairy Science 99(5):3602-3606.
Galyean, M. L., D. G. Wagner, and R. R. Johnson. 1976. Site and extent of starch digestion in steers fed processed corn rations. Journal of Animal Science 43(5):1088-1094.
Galyean, M. L., D. G. Wagner, and F. N. Owens. 1981. Dry matter and starch disappearance of corn and sorghum as influenced by particle size and processing. Journal of Dairy Science 64:1804-1812.
Ghorbani, G. R., D. P. Morgavi, K. A. Beauchemin, and J. A. Z. Leedle. 2002. Effects of bacterial direct-fed microbials on ruminal fermentation, blood variables, and the microbial populations of feedlot cattle. Journal of Animal Science 80:1977–1986.
Gibbons, R. J. 1984. Adherent interactions which may affect microbial ecology in the mouth. Journal of Dental Research 63(3):378-385.
126
Goad, D. W., C. L. Goad, and T. G. Nagaraja. 1998. Ruminal microbial and fermentative changes associated with experimentally induced subacute acidosis in steers. Journal of Animal Science 76:234-241.
Goering, H. K., and P. J. Van Soest. 1970a. Forage fiber analyses (apparatus, reagents, procedures, and some applications). ARS-USDA, Washington, DC
Goering, H. K., and P. J. Van Soest. 1970b. Forage fiber analysis. Agric. Handbook No. 379. ARS USDA.
Gomez-Alarcon, R. A., C. Dudas, and J. T. Huber. 1990. Influence of cultures of Aspergillus oryzae on rumen and total tract digestibility of dietary components. Journal of Dairy Science 73:703-710.
Goodrich, R. D., J. E. Garrett, D. R. Gast, M. A. Kirick, D. A. Larson, and J. C. Meiske. 1984. Influence of monensin on the performance of cattle. Journal of Animal Science 58(6):1484-1498.
Gooneratne, S. R., W. T. Buckley, and D. A. Christensen. 1989. Review of copper deficiency and metabolism in ruminants. Canadian Journal of Animal Science 69:819-845.
Gordon, M. E., M. S. Edwards, C. R. Sweeney, and M. L. Jerina. 2013. Effects of added chelated trace minerals, organic selenium, yeast culture, direct-fed microbials, and Yucca schidigera extract in horses. Part I: Blood nutrient concentration and digestibility. Journal of Animal Science 91:3899-3908.
Grace, N. D., M. J. Wyatt, and J. C. Macrae. 1974. Quantitative digestion of fresh herbage by sheep. III. The movement of Mg, Ca, P, K, and Na in the digestive tract. Journal of Agricultural Science 82:321-330.
Graham, T. W. 1991. Trace element deficiencies in cattle. Veterinary Clinics of North America: Food Animal Practice 7(1):153-215. doi: 10.1016/s0749-0720(15)30816-1
Graugnard, D. E., K. M. Brennan, J. J. S., and J. J. Wagner. 2015. Adipose gene expression patterns in finishing steers fed steam-flaked corn. Journal of Animal Science 90(Suppl. 1):589.
Greene, L. W., J. F. Baker, and P. F. Hardt. 1989. Use of animal breeds and breeding to overcome the incidence of grass tateny: A review. Journal of Animal Science 67:3463-3469.
Greene, L. W., K. E. Webbe Jr., and J. P. Fontenot. 1983. Effect of potassium level on site of absorption of magnesium and other macroelements in sheep. Journal of Animal Science 56:1214–1221.
127
Grenet, E., A. Breton, P. Barry, and G. Fonty. 1989. Rumen anaerobic fungi and plant substrate colonization as affected by diet composition. Animal Feed Science and Technology 26:55-70.
Groppel, G., and M. Anke. 1971. Manganese deficiency in ruminants. Arch. Veterinaermed. 25:779.
Guan, H., K. M. Wittenberg, K. H. Ominski, and D. O. Krause. 2006. Efficacy of ionophores in cattle diets for mitigation of enteric methane. Journal of Animal Science 84:1896–1906.
Guyot, J., G. Jeminet, M. Prudhomme, M. Sancelme, and R. Meiniel. 1993. Interaction of the calcium ionophore A. 23187 (calcimycin) with Bacillus cereus and Escherichia coli. . Letters in Applied Microbiology 16(4):192-195. doi: https://doi.org/10.1111/j.1472-765X.1993.tb01394.x
Hall, M. B. 2009. Determination of starch, including maltooligosaccharides in animal feeds: comparison methods and method recommended for AOAC collaborative study. AOAC 92(1):42-49.
Hambidge, K. M., C. E. Casey, and N. F. Krebs. 1986. Zinc. In: Trace Elements in Human and Animal Nutrition. Academic Press, NY 2:1-137.
Hansen, J. L., N. Ban, P. B. Moore, J. A. Ippolito, P. Nissen, and T. A. Steitz. 2002. The structures of four macrolide antibiotics bound to the large ribosomal subunit. Molecular Cell 10:117-128.
Hanson, T. L., and T. Klopfenstein. 1979. Monensin, protein source and protein levels for growing steers. Journal of Animal Science 48(3):474-479.
Harfoot, C. G. 1978. Anatomy, physiology and microbiology of the ruminant digestive tract. Progress in Lipid Research 17:1-19.
Harmon, D. L., T. B. Avery, G. B. Huntington, and P. J. Reynolds. 1988. Influence of ionophore addition to roughage and high concentrate diets on portal blood flow and net nutrient flux in cattle. Canadian Journal of Animal Science 68(419-429)
Harmon, D. L., K. K. Kreikemeier, and K. L. Gross. 1993. Influence of addition of monensin to an alfalfa hay diet on net portal and hepatic nutrient flux in steer. Journal of Animal Science 71:218-225.
Harmon, D. L., and K. R. McLeod. 2001. Glucose uptake and regulation by intestinal tissues: Implications and whole-body energetics. Journal of Animal Science 79:E59-E72.
Harris, B. 1965. Studies on ruminal parakeratosis in dairy calves. Doctor of Phylosophy Dissertation. Oklahoma State University

128
Harrison, G. A., R. W. Hemken, K. A. Dawson, K. B. Barker, and R. J. Harmon. 1988. Influence of addition of yeast culture supplement to diets of lactating cows on ruminal fermentation and microbial populations. Journal of Dairy Science 71:2967-2975.
Hayes, B. W., C. E. Mitchell Jr, C. O. Little, and H. B. Sewell. 1967. Turnover of liver vitamin A in steers. Journal of Animal Science 26:855-857.
Hemphill, C. N., T. A. Wickersham, J. E. Sawyer, T. M. Brown-Brandl, H. C. Freetly, and K. E. Hales. 2018. Effects of feeding monensin to bred heifers fed in a drylot on nutrient and energy balance. Journal of Animal Science 96:1171-1180.
Henderson, C., C. S. Stewart, and F. V. Nekrep. 1981. The effect of monensin on pure and mixed cultures of rumen bacteria. The Journal of Applied Bacteriology 51:159-169.
Hidiroglou, M. 1980. Zinc, copper and manganese deficiencies and the ruminant skeleton: a review. Canadian Journal of Animal Science 60(3):579-590.
Higginbotham, G. E., C. A. Collar, M. S. Aseltine, and D. L. Bath. 1994. Effect of yeast culture and Aspergillus oryzae extract on milk yield In a commercial dairy herd. Journal of Dairy Science 77:343-348.
Hino, T., and J. B. Russell. 1985. Effect of reducing-equivalent disposal and NADH/NAD on deamination of amino acids by intact rumen microorganisms and their cell extracts. Applied and Environmental Microbiology 50(6):1368-1374.
Hoffman, P. C., D. R. Mertens, J. Larson, W. K. Coblentz, and R. D. Shaver. 2012. A query for effective mean particle size in dry and high-moisture corns. Journal of Dairy Science 95:3467–3477.
Holdsworth, E. S., E. Neville, C. Nader, I. G. Jarrett, and O. H. Filsell. 1964. The metabolism of acetate in the sheep. Biochimica et Biophysica Acta 86:240-249.
Hoover, R., and F. W. Sosulski. 1985. Studies on the functional characteristics and digestibility of starches from Phaseolus vulgaris biotypes. Starch 37:181-191.
Horton, G. M. J., K. A. Bassendowski, and E. H. Keeler. 1980. Digestion and metabolism in lambs and steers fed monensin with different levels of barley. Journal of Animal Science 50(6):997-1007.
Hristov, A. N., T. A. McAllister, and K. J. Cheng. 2000. Intraruminal supplementation with increasing levels of exogenous polysaccharide-degrading enzymes: Effects on nutrient digestion in cattle fed a barley grain diet. Journal of Animal Science 78:477–487.
Hungate, R. E. 1966. The rumen and its microbes. Academic Press, NY

129
Huntington, G. B. 1997. Starch utilization by ruminants: From basics to the bunk. Journal of Animal Science 75:852-867.
Hurley, L. S., and C. L. Keen. 1987. Manganese. In: Trace Elements in Human and Animal Nutrition. Academic Press, NY 1:185-223.
Hussein, H. S., and L. L. Berger. 1995. Feedlot performance and carcass characteristics of Holstein steers as affected by source of dietary protein and level of ruminally protected lysine and methionine. Journal of Animal Science 73:3503-3509.
Janssen, P. H., and M. Kirs. 2008. Structure of the archaeal community of the rumen. Applied and Environmental Microbiology 74:3619-3625.
Jayasuriyal, G. C. N., and R. E. Hungate. 1959. Lactate conversions in the bovine rumen. Archives of Biochemistry and Biophysics 82:274-287.
Jennings, J., T. D. Jennings, B. D. Dicke , J. S. Drouillard, and B. E. Depenbusch. 2014. Evaluation of Program Nutrition on growth performance, animal health, and carcass characteristics of yearling heifers. Alltech Evaluation Report
Jennings, T. D. 2013. Beef Marketing Group Program Nutrition Trial – 13-E-9527 Final High Plans Research and Consulting
Jeyanathan, J., C. Martin, and D. P. Morgavi. 2016. Screening of bacterial direct-fed microbials for their antimethanogenic potential in vitro and assessment of their effect on ruminal fermentation and microbial profiles in sheep. Journal of Animal Science 94:739-750.
Johns, A. T. 1951a. Isolation of a bacterium, producing propionic acid, from the rumen of sheep. The Journal of General Microbiology 5:317-325.
Johns, A. T. 1952. The mechanism of propionic acid formation by Clostridium propionicum. The Journal of General Microbiology 6:123-127.
Johnson, K. A., and D. E. Johnson. 1995. Methane emissions from cattle. Journal of Animal Science 73:2483-2492.
Joyner Jr., A. E., L. J. Brown, T. J. Fogg, and R. T. Rossi. 1979. Effect of monensin on growth, feed efficiency and energy metabolism of lambs. Journal of Animal Science 48(5):1065-1069.
Kayisu, K., and L. F. Hood. 1979. Effects of dehydration and storage conditions on the α-pancreatic α-amylase susceptibility of various starches. Journal of Food Science 44:1728-1731.
Kenney, N. M., E. S. Vanzant, D. L. Harmon, and K. R. McLeod. 2015a. Direct-fed microbials containing lactate-producing bacteria influence ruminal fermentation
130
but not lactate utilization in steers fed a high-concentrate diet. Journal of Animal Science 93:2336-2348.
Kenney, N. M., E. S. Vanzant, D. L. Harmon, and K. R. McLeod. 2015b. Effect of direct-fed microbials on utilization of degradable intake protein in receiving steers. Canadian Journal of Animal Science 95:93-102.
Kessler, K. L., K. C. Olson, C. L. Wright, K. J. Austin, P. S. Johnson, and K. M. Cammack. 2012. Effects of supplemental molybdenum on animal performance, liver copper concentrations, ruminal hydrogen sulfide concentrations, and the appearance of sulfur and molybdenum toxicity in steers receiving fiber-based diets. Journal of Animal Science 90:5005-5012.
Kevin II, D. A., D. A. F. Meujo, and M. T. Hamann. 2009. Polyether ionophores: broad-spectrum and promising biologically active molecules for the control of drug-resistant bacteria and parasites. Expert Opinion on Drug Discovery 4(2):109-146. doi: doi:10.1517/17460440802661443
Khan, N. A., J. W. Cone, and W. H. Hendriks. 2009. Stability of fatty acids in grass and maize silages after exposure to air during the feed out period. Animal Feed Science and Technology 154(3-4):183-192. doi: 10.1016/j.anifeedsci.2009.09.005
Kirk, D. J., L. W. Greene, G. T. Schelling, and F. M. Byers. 1985a. Effects of monensin on monovalent ion metabolism and tissue concentrations in lambs. Journal of Animal Science 60(6):1479-1484.
Kirk, D. J., L. W. Greene, G. T. Schelling, and F. M. Byers. 1985b. Effects of monensin on Mg, Ca, P and Zn metabolism and tissue concentrations in lambs. Journal of Animal Science 60(6):1485-1490.
Klingerman, C. M., W. Hu, E. E. McDonell, M. C. DerBedrosian, and L. Kung, Jr. 2009. An evaluation of exogenous enzymes with amylolytic activity for dairy cows. Journal of Dairy Science 92(3):1050-1059.
Knudsen, K. E. B. 1997. Carbohydrate and lignin contents of plant materials used in animal feeding. Animal Feed Science Technology 67:319-338.
Koontz, A. F., S. W. El-Kadi, D. L. Harmon, E. S. Vanzant, J. C. Matthews, J. A. Boling, and K. R. McLeod. 2010. Effect of rac- topamine on whole body and splanchnic energy metabolism in Holstein steers. Can. J. Anim. Sci. 90:77-85.
Krause, D. O., and J. B. Russell. 1996. An rRNA approach for assessing the role of obligate amino acid-fermenting bacteria in ruminal amino acid deamination. Applied and Environmental Microbiology 62(3):815-821.
Krause, M. K., and G. R. Oetzel. 2006. Understanding and preventing subacute ruminal acidosis in dairy herds: A review. Animal Feed Science and Technology 126:215–236.

131
Kristensen, N. B., and D. L. Harmon. 2004. Splanchnic metabolism of volatile fatty acids absorbed from the washed reticulorumen of steers. Journal of Animal Science 82:2033-2042.
Kurihara, Y., J. M. Eadie, P. N. Hobson, and S. O. Mann. 1968. Relationship between bacteria and ciliate protozoa in the sheep rumen. The Journal of General Microbiology 51:267-288.
Latorre, J. D., X. Hernandez-Velasco, L. R. Bielke, J. L. Vicente, R. Wolfenden, A. Menconi, B. M. Hargis, and G. Tellez. 2015. Evaluation of a Bacillus direct-fed microbial candidate on digesta viscosity, bacterial translocation, microbiota composition and bone mineralisation in broiler chickens fed on a ryebased diet. British Poultry Science 56:723–732.
Lauro, M., T. Suortti, K. Autio, P. Linko, and K. Poutanen. 1963. Accessibility of barley starch granules to α-amylase during different phases of gelatinization. Journal of Cereal Science 17:125-136.
Lechtenberg, K. F., T. G. Nagaraja, and M. M. Chengappa. 1998. Antibiotic susceptibility of Fusobacterium necrophorum isolated from liver abscesses. American Journal of Veterinary Research 59:44-48.
Lee, R. W., M. L. Galyean, and G. P. Lofgreen. 1982. Effects of mixing whole shelled and steam flaked corn in finishing diets on feedlot performance and site and extent of digestion in beef steers. Journal of Animal Science 55(3):475-483.
Leighton, B., A. R. Nicholas, and C. I. Pogson. 1983. The pathway of ketogenesis in rumen epithelium of the sheep. Biochemical Journal 216:769-772.
Lomax, M. A., G. D. Baird, C. B. Mallinson, and H. W. Symonds. 1979. Differences between lactating and non-lactating dairy cows in concentration and secretion rate of insulin. Biochemical Journal 180:281-289.
Lutz, W. K., F. K. Winker, and J. D. Dunitz. 1971. Crystal structure of the antibiotic monensin similarities and differences between free acid and metal complex. Helvetica Chimica Acta 54(4):1103-1108.
MacPherson, A., G. Fisher, and J. E. Paterson. 1988. Effect of cobalt deficiency on the immune function of ruminants. In: Trace Elements in Man and Animals. Plenum Press, NY 6:397-398.
Marsh, W. H., B. Fingerhut, and H. Miller. 1965. Automated and manual direct methods for the determination of blood urea. Clin. Chem. 11:624-627.
Martens, H., and Y. Rayssiguier. 1980. Magnesium metabolism and hypo-magnesaemia. In: Digestive Physiology and Metabolism in Ruminants. Press Limited:447-466.

132
Martin, S. A., and D. J. Nisbet. 1992. Effect of direct-fed microbials on rumen microbial fermentation. Journal of Dairy Science 75:1736-1744.
Mathison, G. W. 1996. Effects of processing on the utilization of grain by cattle. Animal Feed Science and Technology 58:113-125.
Mathison, G. W., R. Hironaka, B. K. Kerriganr, I. Vlach, L. P. Milligan, and R. D. Weisenburge. 1991. Rate of starch degradation, apparent digestibility andtate and efficiency of steei gain as influenced by barley grain volumeweight and processing method. Canadian Journal of Animal Science 71:867-878.
Mayland, H. F. 1988. Grass tetany. In: The Ruminant Animal-Digestive Physiology and Nutrition. Prentice Hall, NJ:511-522.
McAllister, T. A., H. D. Bae, G. A. Jones, and K. J. Cheng. 1994. Microbial attachment and feed digestion in the rumen. Journal of Animal Science 72:3004-3018.
McAllister, T. A., K. A. Beauchemin, A. Y. Alazzeh, J. Baah, R. M. Teather, and K. Stanford. 2011. 2011. Review: The use of direct fed
microbials to mitigate pathogens and enhance production in
cattle. Can. J. Anim. Sci. 91:193–211. Canadian Journal of Animal Science 91:193-211.
McAllister, T. A., and K. J. Cheng. 1996. Microbial strategies in the ruminal digestion of cereal grains. Animal Feed Science Technology 62:29-36.
McAllister, T. A., Y. Dong, L. J. Yankeh, D. Bae, and K. J. Cheng. 1993a. Cereal grain digestion by selected strains of ruminal fungi. Canadian Journal of Microbiology 39:367-376.
McAllister, T. A., D. J. Gibb, K. A. Beauchemin, and W. Y. 2006. Starch type, structure, and ruminal digestion. In: Proceedings of the Cattle Grain Processing Symposium, OK:30-41.
McAllister, T. A., R. C. Phillippe, L. M. Rode, and K. J. Cheng. 1993b. Effect of the protein matrix on the digestion of cereal grains by ruminal microorganisms. Journal of Animal Science 71(1):205-212.
McAllister, T. A., L. M. Rode, K. J. Cheng, D. M. Shaefer, and J. W. Costerton. 1990. Morphological study of the digestion of barley and maize grain by rumen microorganisms. Animal Feed Science and Technology 30:91-105.
McDowell, L. R. 2003. Minerals in Animal and Human Nutrition. Elsevier, Netherlands 2nd ed
McKnight, D. R., G. K. MacLeod, J. G. Buchanan-Smith, and D. N. Mowat. 1973. Utilization of ensiled or acid-treated high moisture shelled corn by cattle. Canadian Journal of Animal Science 53:491-496.

133
McLeod, K. R., and R. L. Baldwin VI. 2000. Effects of diet forage:concentrate ratio and metabolizable energy intake on visceral organ growth and in vitro oxidative capacity of gut tissues in sheep. Journal of Animal Science 78:760 - 770.
Mertz, W. 1986. Trace elements in human and animal nutrition. Academic Press, NY 5th ed:139-208.
Meyer, N. F., G. E. Erickson, T. J. Klopfenstein, M. A. Greenquist, M. K. Luebbe, P. Williams, and M. A. Engstrom. 2009. Effect of essential oils, tylosin, and monensin on finishing steer performance, carcass characteristics, liver abscesses, ruminal fermentation, and digestibility. Journal of Animal Science 87:2346–2354. doi: 10.2527/jas.2008-1493
Miles, M. J., V. J. Morris, P. D. Orford, and S. G. Ring. 1985. The roles of amylose and amylopectin in the gelation and retrogradation of starch. Carbohydrate Research 135:271-281.
Miller, J. K., and R. G. Cragle. 1965. Gastrointestinal sites of absorption and endogenous secretion of zinc in dairy cattle Journal of Dairy Science 48:370-373.
Miller, J. K., N. Ramsey, and F. C. Madsen. 1988. The trace elements. In: The Ruminant Animal. Digestive Physiology and Nutrition. Prentice Hall, NJ:342-401.
Miller, J. K., E. W. Swanson, W. A. Lyke, B. R. Moss, and W. F. Byrne. 1973. Effect of thyroid status on digestive tract fill and flow rate of undigested residues in cattle. Journal of Dairy Science 57(2):193-197.
Miller, J. K., E. W. Swanson, and G. E. Spalding. 1974. Iodine absorption, excretion, recycling, and tissue distribution in the dairy cow Journal of Dairy Science 58(10):1578-1593.
Mills, C. F., and G. K. Davis. 1987. Molybdenum. In: Trace Elements in Human and Animal Nutrition. Academic Press, NY 1:429-463.
Mills, J. A. N., L. A. Crompton, J. L. Ellis, J. Dijkstra, A. Bannink, S. Hook, C. Benchaar, and J. France. 2014. A dynamic mechanistic model of lactic acid metabolism in the rumen. Journal of Dairy Science 97:2398–2414.
Mitsumori, M., L. Xu, H. Kajikawa, M. Kurihara, K. Tajima, J. Hai, and A. Takenaka. 2003. Possible quorum sensing in the rumen microbial community: detection of quorum-sensing signal molecules from rumen bacteria. Federation of European Microbiological Societies Microbiology Letters 219:47-52.
Moore, L. A. 1939. Carotene intake, level of blood plasma carotene, and the development of papillary edema and nyctalopia in calves. Journal of Dairy Science 22:803-812.
Moore, L. A. 1941. Some ocular changes and deficiency manifestations in mature cows fed a ration deficient in vitamin A. Journal of Dairy Science 24:893.

134
Moss, A. R., J. P. Jouany, and J. Newbold. 2000. Methane production by ruminants: its contribution to global warming. Annales de Zootechnie 49:231-253.
Mulliez, E., and M. Fontecave. 1997. Structure and reactivity of the metal centers of ribonucleotide reductases. Chemische Berichte 130:317-321.
Muntifering, R. B., B. Theurer, R. S. Swingle, and W. H. Hale. 1980. Effect of monensin on nitrogen utilization and digestibility of concentrate diets by steers. Journal of Animal Science 50(5):930-936.
Nagaraja, T. G., G. B. Avery, E. E. Bartley, S. J. Galitzer, and A. D. Dayton. 1981. Prevention of lactic acidosis in cattle by lasalocid or monensin. Journal of Animal Science 53(1):206-216.
Nagaraja, T. G., A. B. Beharka, M. M. Chengappa, L. H. Carroll, A. P. Raun, S. B. Laudert, and J. C. Parrott. 1999. Bacterial flora of liver abscesses in feedlot cattle fed tylosin or no tylosin. Journal of Animal Science 77:979-978.
Nagaraja, T. G., and M. M. Chengappa. 1998. Liver abscesses in feedlot cattle: A review. Journal of Animal Science 76:287-298.
Nagaraja, T. G., S. K. Narayanan, G. C. Stewart, and M. M. Chengappa. 2005. Fusobacterium necrophorum infections in animals: pathogenesis and pathogenic mechanisms. Anaerobe 11(4):239-246. doi: 10.1016/j.anaerobe.2005.01.007
Nagaraja, T. G., and E. C. Titgemeyer. 2006. Ruminal acidosis in beef cattle: the current microbiological and nutritional outlook. Journal of Dairy Science 90(E. Suppl.):E17–E38.
Narayanan, S., T. G. Nagaraja, O. Okwumabua, J. Staats, M. M. Chengappa, and R. D. Oberst. 1997. Ribotyping to compare Fusobacterium necrophorum isolates from bovine liver abscesses, ruminal walls, and ruminal contents. Applied and Environmental Microbiology 63:4671-4678.
Nascimento, C. F., L. L. Oliveira, N. C. D. Silva, F. D. Santos, H. V. B., J. E. Pettigrew, G. R. Siqueira, and F. D. D. Resende. 2017. Nellore metabolism receiving exogenous amylase in high-concentrate diets. Journal of Animal Science 95(4):318.
Newbold, C. J. 1996. Probiotics for ruminants. Annales de Zootechnie 45(Suppl 1):329-335.
Newbold, C. J., R. Brock, and R. J. Wallace. 1991. Influence of autoclaved or irradiated Aspergillus oryzae fermentation extract on fermentation in the rumen simulation technique (Rusitec). The Journal of Agricultural Science 116(1):159-162. doi: https://doi.org/10.1017/S0021859600076267
135
Newbold, C. J., R. Brock, and R. J. Wallace. 1992. The effect of Aspergillus oryzae fermentation extract on the growth of fungi and ciliate protozoa in the rumen. Letters in Applied Microbiology 15(3):109-112.
Newbold, C. J., R. Brock, and R. J. Wallace. 1992a. The effect of Aspergillus oryzae fermentation extract on the growth of fungi and ciliate protozoa in the rumen. Letters in Applied Microbiology 15:109-112.
Newbold, C. J., R. J. Wallace, and F. M. McIntosh. 1993. The stimulation of rumen bacteria by Saccharomyces cerevisiae is dependent on the respiratory activity of the yeast. Journal of Animal Science 71(Suppl 1):280.
Newbold, C. J., R. J. Wallace, and F. M. McIntosh. 1996. Mode of action of the yeast Saccharomyces cerevisiae as a feed additive for ruminants. British Journal of Nutrition 76(2):249-261. doi: https://doi.org/10.1079/BJN19960029
Newbold, C. J., R. J. Wallace, and N. D. Walker-Bax. 2013. Potentiation by metal ions of the efficacy of the ionophores, monensin and tetronasin, towards four species of ruminal bacteria. Federation of European Microbiological Societies Microbiology Letters 338:161-167. doi: DOI: 10.1111/1574-6968.12044
Nisbet, D. J., and S. A. Martin. 1990. Effect of dicarboxylic acids and Aspergillus oryzae fermentation extract on lactate uptake by the ruminal bacterium Selenomonas ruminantium. Applied and Environmental Microbiology 56(11):3515-3518.
Nisbet, D. J., and S. A. Martin. 1991. The effect of Saccharomyces cerevisiae culture on lactate utilization by the ruminal bacterium Selenomonas ruminantium. Journal of Animal Science 69:4628-4633.
Nocek, J. E., and W. P. Kautz. 2006. Direct-fed microbial supplementation on ruminal digestion, health, and performance of pre- and postpartum dairy cattle. Journal of Dairy Science 89:260–266.
Nocek, J. E., W. P. Kautz, J. A. Z. Leedle, and J. G. Allman. 2002. Ruminal supplementation of direct-fed microbials on diurnal pH variation and in situ digestion in dairy cattle. Journal of Dairy Science 85:429–433.
Nocek, J. E., W. P. Kautz, J. A. Z. Leedle, and E. Block. 2003. Direct-fed microbial supplementation on the performance of dairy cattle during the transition period. Journal of Dairy Science 86:331–335.
Nocek, J. E., and S. Tamminga. 1991. Site of digestion of starch in the gastrointestinal tract of dairy cows and its effect on milk yield and composition Journal of Dairy Science 74:3598-3629.
Noziere, P., W. Steinberg, M. Silberberg, and D. P. Morgavi. 2013. Amylase addition increases starch ruminal digestion in first-lactation cows fed high and low starch diets. Journal of Dairy Science 97:2319-2328.

136
NRC. 2016. Nutrient Requirements of Beef Cattle. National Research Council. National Academy Press, DC 8th ed.
Oellermann, S. O., M. J. Arambel, B. A. Kent, and J. L. Walters. 1990. Effect of graded amounts of Aspergillus oryzae fermentation extract on ruminal characteristics and nutrient digestibility in cattle. Journal of Dairy Science 73:2413-2416.
Offner, A., A. Bach, and D. Sauvant. 2003. Quantitative review of in situ starch degradation in the rumen. Animal Feed Science and Technology 106:81-93.
Orskov, E. R. 1986. Starch digestion and utilization in ruminants. Journal of Animal Science 63:1624-1633.
Orskov, E. R., C. Fraser, and R. N. B. Kay. 1969. Dietary factors influencing the digestion of starch in the rumen and small and large intestine of early weaned lambs. British Journal of Nutrition 23:217-226.
Owens, C. E., R. A. Zinn, A. Hassen, and F. N. Owens. 2016. Mathematical linkage of total tract digestion of starch and neutral detergent fiber to their fecal concentrations and the effect of site of starch digestion on extent of digestion and energetic efficiency of cattle. The Professional Animal Scientist 32:531-549. doi: dx.doi.org/10.15232/pas.2016-01510
Owens, F. N., D. S. Secrist, W. J. Hill, and D. R. Gill. 1998. Acidosis in cattle: A review. Journal of Animal Science 76:275-286.
Owens, F. N., R. A. Zinn, and Y. K. Kim. 1986. Limits to starch digestion in the ruminant small intestine Journal of Animal Science 63:1634-1648.
Pangborn, W., W. Duax, and D. Langs. 1987. The hydrated potassium complex of the ionophore monensin A. Journal of the American Chemical Society 109:2163-2165.
Papich, M. G. 2016. Tylosin. In: Saunders Handbook of Veterinary Drugs 4th ed:826-827.
Pell, A. N., and P. Schofield. 1993. Microbial adhesion and degradation of plant cell walls. Forage Cell Wall Structure and Digestibility 16:397-423.
Penner, G. B., K. A. Beauchemin, and T. Mutsvangwa. 2007. Severity of ruminal acidosis in primiparous Holstein cows during the periparturient period. Journal of Dairy Science 90:365–375.
Penner, G. B., M. Taniguchi, L. L. Guan, K. A. Beauchemin, and M. Oba. 2006. Effect of dietary forage to concentrate ratio on volatile fatty acid absorption and the expression of genes related to volatile fatty acid absorption and metabolism in ruminal tissue. Journal of Dairy Science 92:2767–2781.
Penner, G. B., M. Taniguchi, L. L. Guan, K. A. Beauchemin, and M. Oba. 2009. Effect of dietary forage to concentrate ratio on volatile fatty acid absorption and the

137
expression of genes related to volatile fatty acid absorption and metabolism in ruminal tissue. Journal of Dairy Science 92(6):2767-2781. doi: 10.3168/jds.2008-1716
Pennington, R. J. 1951. The metabolism of short-chain fatty acids in the sheep. Fatty acid utilization and ketone body production by the rumen epithelium and other tissues. Biochemical Journal 51:251-258.
Perry, T. W., and M. J. Cecava. 1995. Beef cattle feeding and nutrition. Academy Press, NY 2nd ed
Phelps, K. J., J. S. Drouillard, J. S. Jennings, B. E. Depenbusch, C. L. Van Bibber-Krueger, K. A. Miller, M. A. Vaughn, D. D. Burnett, S. M. Ebarb, T. A. Houser, S. E. Johnson, and J. M. Gonzalez. 2014. Effects of the Programmed Nutrition Beef Program on meat quality characteristics. Journal of Animal Science 92(4):1780-1791. doi: 10.2527/jas.2013-7231
Phelps, K. J., J. S. Drouillard, J. S. Jennings, B. E. Depenbusch, C. L. Van Bibber-Krueger, K. A. Miller, M. A. Vaughn, D. D. Burnett, and J. M. Gonzalez. 2015. Evaluation of EPNIX on growth performance, animal health and carcass characteristics of feedlot cattle. Journal of Animal Science 93doi: 10.2527/jas2014-8661
Pitt, R. E., T. L. Cross, A. N. Pell, P. Schofield, and P. H. Doane. 1999. Use of in vitro gas production models in ruminal kinetics. Mathematical Biosciences 159:145-163.
Piveteau, P. 1999. Metabolism of lactate and sugars by dairy propionibacteria: A review. Lait 79:23-41.
Polizel, D. M., M. F. Westphalen, A. A. Miszura, M. V. C. Ferraz Junior, A. V. Bertoloni, G. B. Oliveira, L. G. M. Gobato, J. P. R. Barroso, and A. V. Pires. 2017. Effects of monensin or narasin on rumen metabolism of steers during the period of adaptation to high-concentrate diet. Journal of Animal Science 95(Suppl. 4):319.
Ponce, C. H., E. M. Domby, U. Y. Anele, J. S. Schutz, K. K. Gautam, and M. L. Galyean. 2013. Effects of bulk density of steam-flaked corn in diets containing wet corn gluten feed on feedlot cattle performance, carcass characteristics, apparent total tract digestibility, and ruminal fermentation. Journal of Animal Science 91:3400–3407.
Poos, M. I., T. L. Hanson, and T. J. Klopfenstein. 1979. Monensin effects on diet digestibility, ruminal protein bypass and microbial protein synthesis. Journal of Animal Science 48(6):1516-1524.
Potter, E. L., M. I. Wray, R. D. Muller, H. P. Grueter, J. McAskill, and D. C. Youn. 1985. effect of monensin and tylosin on average dally gain, feed efficiency and liver abscess incidence in feedlot cattle. Journal of Animal Science 61:1059-1065.

138
Poulsen, M., C. Schwab, B. B. Jensen, R. M. Engberg, A. Spang, N. Canibe, O. Hojberg, G. Milinovich, L. Fragner, C. Schleper, W. W., P. Lund, A. Schramm, and T. Urich. 2013. Methylotrophic methanogenic Thermoplasmata implicated in reduced methane emissions from bovine rumen. Nature Communications 4:1428-.
Prange, R. W., C. L. Davis, and J. H. Clark. 1978. Propionate production in the rumen of Holstein steers fed either a control or monensin supplemented diet. Journal of Animal Science 46(4):1120-1124.
Pressman, B. C., and N. T. deGuzman. 1976. Biological applications of ionophores: theory and practice. In: Permeation mechanism across biological membranes. Annals New York Academy of Sciences:373-386.
Raun, A. P., C. O. Cooley, E. L. Potter, R. P. Rathmacher, and L. F. Richardson. 1976. Effect of monensin on feed efficiency of feedlot cattle. Journal of Animal Science 43(3):670-677.
Reeder, T., G. Hibbard, K. R. McLeod, and D. L. Harmon. 2011. Dietary lysine:calorie ratios and their influence on nitrogen metabolism and digestibility in moderately obese mature dogs. Amer. J. Anim. Vet. Sci. 6:45-54.
Reynolds, C. K. 2002. Economics of visceral energy metabolism in ruminants: Toll keeping or internal revenue service? Journal of Animal Science 80(2 (E. Suppl.)):E74–E84.
Reynolds, C. K., and N. B. Kristensen. 2008. Nitrogen recycling through the gut and the nitrogen economy of ruminants: An asynchronous symbiosis. Journal of Animal Science 86 (E. Suppl.):E293–E305.
Richards, C. J., J. F. Pedersen, R. A. Britton, R. A. Stock, and C. R. Krehbiel. 1995. In vitro starch disappearance procedure modifications. Animal Feed Science and Technology 55:35-45.
Richardson, L. F., A. P. Raun, E. L. Potter, C. O. Cooley, and R. P. Rathmacher. 1976. Effect of monensin on rumen fermentation in vitro and in vivo. Journal of Animal Science 43(3):657-664.
Ring, S. G., P. Colonna, K. J. I'Anson, M. T. Kalkhevsky, M. J. Miles, V. J. Morris, and P. D. Orford. 1987. The gelation and crystallization of amylopectin. Carbohydrate Research 162:277-293.
Ring, S. G., J. M. Gee, M. Whittam, P. Orford, and I. T. Johnson. 1988. Resistant starch: its chemical form in food stuffs and effects on digestibility in vitro. Food Chemistry 28:97-109.
Robyt, J. F., and D. French. 1967. Multiple attack hypothesis of α-amylase action: action of porcine pancreatic, human salivary, and Aspergillus oryzae α-amylases. Archives of Biochemistry and Biophysics 122:8-16.

139
Rode, L. M., K. J. Cheng, and J. W. Costerton. 1986. Digestion by cattle of urea-treated, ammonia-treated, or rolled high-moisture barley. Canadian Journal of Animal Science 66:711-721.
Rode, L. M., T. A. McAllister, and K. J. Cheng. 1990. Microbial degradation of vitamin A in rumen fluid from steers fed concentrate, hay, or straw diets. Canadian Journal of Animal Science 70:227–233.
Rojo, R., G. D. Mendoza, S. S. Gonzalez, L. Landois, R. Barcena, and M. M. Crosby. 2005. Effects of exogenous amylases from Bacillus licheniformis and Aspergillus niger on ruminal starch digestion and lamb performance. Animal Feed Science and Technology 123(124):655–665.
Rooney, L. W., and R. L. Pflugfelder. 1986. Factors affecting starch digestibility with special emphasis on sorghum and corn. Journal of Animal Science 63:1607-1623.
Rosenfeld, I., and O. A. Beath. 1964. Selenium. Academic Press, NY
Rumpler, W. V., D. E. Johnson, and D. B. Bates. 1986. The effect of high dietary cation concentration on methanogenesis by steers fed diets with and without ionophores. Journal of Animal Science 62:1737-1741.
Russell, J. B. 1998. Strategies that ruminal bacteria use to handle excess carbohydrate. Journal of Animal Science 76:1955-1963.
Russell, J. B., and H. J. Strobel. 1989. Effect of ionophores on ruminal fermentation. Applied and Environmental Microbiology 55(1):1-6.
Salter, D. N., A. I. Montgomery, A. Hudson, D. B. Quelch, and R. J. Elliott. 1990. Lysine requirements and whole-body protein turnover in growing pigs. British Journal of Nutrition 63:503-513.
Satter, L. D., and W. J. Esdale. 1968. In vitro lactate metabolism by ruminal ingesta. Applied Microbiology 16(5):680-688.
Schlunzen, F., R. Zarivach, J. Harms, A. Bashan, A. Tocilj, R. Albrecht, A. Yonath, and F. Franceschi. 2001. Structural basis for the interaction of antibiotics with the peptidyl transferase centre in eubacteria. Nature 413:814-821.
Schofield, P., R. E. Pitt, and A. N. Pell. 1994. Kinetics of fiber digestion from in vitro gas production. Journal of Animal Science 72(2980-2991)
Schwandt, E. F., M. E. Hubbert, D. U. Thomson, C. I. Vahl, S. J. Bartle, and C. D. Reinhardt. 2016. A survey of starch availability of steam-flaked corn in commercial feedlots evaluating roll size and flake density. The Professional Animal Scientist 32:550-560. doi: dx.doi.org/ 10.15232/pas.2015-01496

140
Schwarz, W. H. 2001. The cellulosome and cellulose degradation by anaerobic bacteria. Applied and Environmental Microbiology 56(5-6):634-649. doi: 10.1007/s002530100710
Seal, C. J., and C. K. Reynolds. 1993. Nutritional implications of gastrointestinal and liver metabolism in ruminants. Nutrition Research Reviews 6(1):185-208. doi: 10.1079/NRR19930012
Shi, H. N., M. E. Scott, M. M. Stevenson, and K. G. Koski. 1998. Energy restriction and zinc deficiency impair the functions of murine T cells and antigen-presenting cells during gastrointestinal nematode infection The Journal of Nutrition 128:20-27.
Shirazi-Beechey, S. P., B. A. Hirayama, Y. Wang, D. Scott, S. M. W., and E. M. Wright. 1991a. Ontogenic development of lamb intestinal sodium-glucose co-transporter is regulated by diet. Journal of Physiology 437:699-709.
Smith, J. B., and E. Rozengurt. 1978. Serum stimulates the Na+,K+ pump in quiescent fibroblasts by increasing Na+ entry. Proceedings of the National Academy of Sciences of the United States of America Cell Biology 75(11):5560-5564.
Smith, R. M. 1987. Cobalt. In: Trace Elements in Human and Animal Nutrition. Academic Press, NY
Snow, P., and K. O’Dea. 1981. Factors affecting the rate of hydrolysis of starch in food. The American Journal of Clinical Nutrition 34:2721-2727.
Spears, J. W., B. R. Schricker, and J. C. Burns 1989. Influence of lysocellin and monensin on mineral metabolism of steers fed forage-based diets. Journal of Animal Science 67:2140-2149.
Staat, R. H., and J. C. Peyton. 1984. Adherence of oral Streptococci: Evidence for nonspecific adsorption to saliva-coated hydroxylapatite surfaces. Infection and Immunity 44(3):653-659.
Starnes, S. R., J. W. Spears, M. A. Froetschel, and W. J. Croom Jr. 1984. Influence of monensin and lasalocid on mineral metabolism and ruminal urease activity in steers. The Journal of Nutrition 114:518-525.
Steele, M. A., O. AlZahal, S. E. Hook, J. Croom, and B. W. McBride. 2009a. Ruminal acidosis and the rapid onset of ruminal parakeratosis in a mature dairy cow: a case report. Acta Veterinaria Scandinavica 51:39-45. doi: 10.1186/1751-0147-51-39
Steele, M. A., J. Croom, M. Kahler, O. AlZahal, S. E. Hook, K. Plaizier, and B. W. McBride. 2011. Bovine rumen epithelium undergoes rapid structural adaptations during grain-induced subacute ruminal acidosis. The American Journal of Physiology-Regulatory, Integrative and Comparative Physiology 300:R1515–R1523.

141
Steen, W. W., N. Gay, J. A. Boling, N. W. Bradley, J. W. McCormick, and L. C. Pendlum. 1978. Effect of monensin on performance and plasma metabolites in growing-finishing steers. Journal of Animal Science 46(2):350-355.
Stock, R. A., D. R. Brink, R. T. Brandt, J. K. Merrill, and K. K. Smith. 1987. Feeding combinations of high moisture corn and dry corn to finishing cattle. Journal of Animal Science 65:282-289.
Stock, R. A., S. B. Laudert, W. W. Stroup, E. M. Larson, J. C. Parrot, and R. A. Britton. 1995. Effect of monensin and monensin and tylosin combination on feed intake variation of feedlot steers. Journal of Animal Science 73:39-44.
Sumbatyan, N. V., G. A. Korshunova, and A. A. Bogdanov. 2003. Peptide derivatives of antibiotics tylosin and desmycosin, protein synthesis inhibitors. Biochemistry 68(10):1156-1158.
Suttle, N. F. 1991. The interaction between copper, molubdenum and sulfur in ruminant nutrition. British Journal of Nutrition 11:121-140.
Sutton, A. L., and J. M. Elliott. 1972. Effect of ratio of roughage to concentrate and level of feed intake on ovine ruminal vitamin B12 production The Journal of Nutrition 102(10):1341-1346.
Sutton, J. D., M. S. Dhanoa, S. V. Morant, J. France, D. J. Napper, and E. Schuller. 2003. Rates of production of acetate, propionate, and butyrate in the rumen of lactating dairy cows given normal and low-roughage diets. Journal of Dairy Science 86:3620-3633.
Swingle, S., and V. Holder. 2015. Evaluation of EPNIX on growth performance, animal health and carcass characteristics of feedlot cattle. Executive Summary
Swyers, K. L. 2007. Effects of direct-fed microbial supplementation on digestibility and fermentation end-products in horses fed low- and high-starch concentrates. Master of Science Thesis. University of Maryland, MD
Takiya, C. S., G. D. Calomeni, T. H. Silva, T. H. A. Vendramini, G. G. Silva, C. E. C. Consentini, J. C. Bertoni, E. M. C. Zilio, and F. P. Rennó. 2017. Increasing dietary doses of an Aspergillus oryzae extract with alpha-amylase activity on nutrient digestibility and ruminal fermentation of lactating dairy cows. Animal Feed Science and Technology 228:159-167.
Tan, Z. L., T. G. Nagaraja, and M. M. Chengappa. 1996. Fusobacterium necrophorum infections: Virulence factors, pathogenic mechanism and control measures. Veterinary Research Communications 20:113-140.
Thauer, R. K., K. Jungermann, and K. Decker. 1977. Energy conservation in chemotrophic anaerobic bacteria. Bacteriological Reviews 41(1):100-180.
142
Theodorou, M. K., B. A. Williams, M. S. Dhanoa, A. B. McAllan, and J. France. 1994. A simple gas production method using a pressure transducer to determine the fermentation kinetics of ruminant feeds. Animal Feed Science and Technology 48:185-197.
Therion, J. J., A. Kistner, and J. H. Kornelius. 1982. Effect of pH on growth rates of rumen amylolytic and lactilytic bacteria. Applied and Environmental Microbiology 44(2):428-434.
Theurer, C. B. 1986. Grain processing effects on starch utilization by ruminants. Journal of Animal Science 63:1649-1662.
Theurer, C. B., O. Lozano, A. Alio, A. Delgado-Elorduy, M. Sadik, J. T. Huber, and R. A. Zinn. 1999. Steam-processed corn and sorghum grain flaked at different densities alter ruminal, small intestinal, and total tract digestibility of starch by steers. Journal of Animal Science:2824–2283.
Thomas, J. W. 1970. Metabolism of iron and manganese. Journal of Dairy Science 53(8):1107-1123.
Thornton, J. H., and F. N. Owens. 1981. Monensin supplementation and in vivo methane production by steers. Journal of Animal Science 52(3):628-634.
Timmerman, H. M., L. Mulder, H. Everts, D. C. van Espen, E. van der Wal, G. Klaassen, S. M. Rouwers, H. Hartemink, F. M. Rombouts, and A. C. Beynen. 2005. Health and growth of veal calves fed milk replacers with or without probiotics. Journal of Dairy Science 88:2154-2165.
Trei, J., W. H. Hale, and B. Theurer. 1970. Effect of grain processing on in vitro gas production. Journal of Animal Science 30:825-831.
Tricarico, J. M., M. D. Abney, M. L. Galyean, J. D. Rivera, K. C. Hanson, K. R. McLeod, and D. L. Harmon. 2007. Effects of a dietary Aspergillus oryzae extract containing α-amylase activity on performance and carcass characteristics of finishing beef cattle. Journal of Animal Science 85(3):802-811.
Tricarico, J. M., J. D. Johnston, and K. A. Dawson. 2008. Dietary supplementation of ruminant diets with an Aspergillus oryzae α-amylase. Animal Feed Science and Technology 145(1-4):136-150.
Tricarico, J. M., J. D. Johnston, K. A. Dawson, K. C. Hanson, K. R. McLeod, and D. L. Harmon. 2005. The effects of an Aspergillus oryzae extract containing alpha-amylase activity on ruminal fermentation and milk production in lactating Holstein cows. Animal Science 81:365-374.
Trotta, R. J., K. K. Kreikemeier, R. F. Royle, T. Milton, and D. L. Harmon. 2021a. Influence of air equilibration time, sampling techniques, and storage temperature

143
on enzymatic starch availability of steam-flaked corn. Journal of Animal Science 99(7):1-8.
Trotta, R. J., K. K. Kreikemeier, R. F. Royle, T. Milton, and D. L. Harmon. 2021b. Effective ruminal degradability of steamflaked corn is influenced by flake density and starch retrogradation. Journal of Animal Science 99(Suppl. S3):296.
Underwood, E. J. 1977. Trace Elements in Human and Animal Nutrition. Academic Press, NY 4th ed:430-433.
Utley, P. R., G. L. Newton, D. M. Wilson, and W. C. McCormick. 1977. Dry and propionic acid treated-high moisture corn fed with and without monensin to feedlot heifers. Journal of Animal Science 45(1):154-159.
Van der Mei, H. C., A. H. Weerkamp, and H. J. Busscher. 1987. Physico-chemical surface characteristics and adhesive properties of Streptococcus salivarius strains with defined cell surface structures. Federation of European Microbiological Societies Microbiology Letters 40:15-19.
Van Nevel, C. J., and D. I. Demeyer. 1996. Control of rumen methanogenesis. Environmental Monitoring and Assessment 42:73-97.
Van Soest, P. J. 1994. Nutritional ecology of the ruminant. Cornell University Press, NY 2nd ed
Varel, V. H., and K. K. Kreikemeier. 1994a. Influence of feeding Aspergillus oryzae fermentation extract (Amaferm) on in situ fiber degradation, ruminal fermentation, and microbial protein synthesis in nonlactating cows fed alfalfa or bromegrass hay. Journal of Animal Science 72(1814-1822)
Varel, V. H., and K. K. Kreikemeier. 1994b. Response to various amounts of Aspergillus oryzae fermentation extract on ruminal metabolism in cattle. Journal of Dairy Science 77:3081-3086.
Vasconcelos, J. T., N. A. Elam, M. M. Brashears, and M. L. Galyean. 2008. Effects of increasing dose of live cultures of Lactobacillus acidophilus (Strain NP 51) combined with a single dose of Propionibacterium freudenreichii (Strain NP 24) on performance and carcass characteristics of finishing beef steers. Journal of Animal Science 86:756-762.
Vasconcelos, J. T., and M. L. Galyean. 2007. Nutritional recommendations of feedlot consulting nutritionists: The 2007 Texas Tech University survey. Journal of Animal Science 85:2772-2781.
Vasconcelos, J. T., and M. L. Galyean. 2008. ASAS Centennial Paper: contributions in the Journal of Animal Science to understanding cattle metabolic and digestive disorders. Journal of Animal Science 86(7):1711-1721. doi: 10.2527/jas.2008-0854

144
Vendramini, J. M. B., J. M. D. Sanchez, R. F. Cooke, A. D. Aguiar, P. Moriel, W. L. da Silva, O. F. R. Cunha, P. D. S. Ferreira, and A. C. Pereira. 2015. Stocking rate and monensin supplemental level effects on growth performance of beef cattle consuming warm-season grasses. Journal of Animal Science 93:3682–3689.
Vyas, D., A. Alazzeh, S. M. McGinn, T. A. McAllister, O. M. Harstad, H. Holo, and K. A. Beauchemin. 2016. Enteric methane emissions in response to ruminal inoculation of Propionibacterium strains in beef cattle fed a mixed diet. Animal Production Science 56:1035-1040.
Vyas, D., E. J. McGeough, S. M. McGinn, T. A. McAllister, and K. A. Beauchemin. 2014. Effect of Propionibacterium spp. on ruminal fermentation, nutrient digestibility, and methane emissions in beef heifers fed a high-forage diet. Journal of Animal Science 92:2192–2201.
Walker, G. J., and P. M. Hope. 1963. The action of some α-amylases on starch granules. Biochemical Journal 86:452-462.
Wallace, R. J., S. J. A. Wallace, N. McKain, V. L. Nsereko, and G. F. Hartnell. 2001. Influence of supplementary fibrolytic enzymes on the fermentation of corn and grass silages by mixed ruminal microorganisms in vitro. Journal of Animal Science 79:1905–1916.
Wallnofer, P., R. L. Baldwin, and E. Stagno. 1966. Conversion of C14-labeled substrates to volatile fatty acids by the rumen microbiota. Applied Microbiology 14(6):1004-1010.
Wang, Z., X. Suo, X. Xia, and J. Shen. 2006. Influence of monensin on cation influx and Na⁺-K⁺-ATPase activity of Eimeria tenella sporozoites in vitro. The Journal of Parasitology 92(5):1092-1096.
Ward, G. M. 1978. Molybdenum toxicity and hypocurprosis in ruminants: A review. Journal of Animal Science 46(4):1078-1085.
Waterlow, J. C., M. H. Golden, and P. J. Garlick. 1978. Protein turnover in man measured with 15N: Comparison of end products and dose regimes. American Journal of Physiology 235(2):E165-E174.
Wedegaertner, T. C., and D. E. Johnson. 1983. Monensin effects on digestibility, methanogenesis and heat increment of a cracked corn-silage diet fed to steers. Journal of Animal Science 57(1):168-177.
Weekes, T. E. C. 1974. The in vitro metabolism of propionate and glucose by the rumen epithelium. Comparative Biochemistry and Physiology 49B:393-406.
Wessels, R. H., E. C. Titgemeyer, and G. St Jean. 1997. Effect of amino acid supplementation on whole-body protein turnover in Holstein steers. Journal of Animal Science 75:3066-3073.

145
White, B. A., R. Lamed, E. A. Bayer, and H. J. Flint. 2014. Biomass utilization by gut microbiomes. Annual Review of Microbiology 68:279-296. doi: 10.1146/annurev-micro-092412-155618
Wiedmeier, R. D., M. J. Arambel, and J. L. Walters. 1987. Effect of yeast culture and Aspergillus oryzae fermentation extract on ruminal characteristics and nutrient digestibility. Journal of Dairy Science 70:2063-2068.
Wilkerson, V. A., B. P. Glenn, and K. R. McLeod. 1997. Energy and nitrogen balance in lactating cows fed diets containing dry or high moisture corn in either rolled or ground form. J. Dairy Sci. 80:2487-2496.
Williams, P. E. V., C. A. G. Tait, G. M. Innes, and C. J. Newbold. 1991. Effects of the inclusion of yeast culture (Saccharomyces cerevisiae plus growth medium) in the diet of dairy cows on milk yield and forage degradation and fermentation palterns in the rumen of steers. Journal of Animal Science 69:3016-3026.
Wood, K. M., A. C. J. Pinto, D. D. Millen, R. Kanafany Guzman, and G. B. Penner. 2016. The effect of monensin concentration on dry matter intake, ruminal fermentation, short-chain fatty acid absorption, total tract digestibility, and total gastrointestinal barrier function in beef heifers. Journal of Animal Science 94:2471–2478.
Wright, M. D., and S. C. Loerch. 1988. Effects of rumen-protected amino acids on ruminant nitrogen balance, plasma amino acid concentrations and performance. Journal of Animal Science 66:2014-2027.
Wright, P. L., and M. C. Bell. 1966. Comparative metabolism of selenium and tellurium in sheep and swine. American Journal of Physiology 211(1):6-10.
Wursch, P., S. Dal Vedovo, and B. Koellreuter. 1986. Cell structure and starch nature as key determinants of the digestion rate of starch in legume. The American Journal of Clinical Nutrition 43:25-29.
Xiong, Y., S. J. Bade, R. L. Preston, and Q. Meng. 1990a. Estimating starch availability and protein degradation of steam-flaked and reconstituted sorghum grain through a gas production technique. Journal of Animal Science 68:3880-3885.
Xiong, Y. L., S. J. Bartle, and R. L. Preston. 1990b. Improved enzymatic method to measure processing effects and starch availability in sorghum grains. Journal of Animal Science 63:3861-3870.
Zhang, W., and D. S. Jackson. 1992. Retrogradation behavior of wheat starch gels with differing molecular profiles. Journal of Food Science 57:1428-1432.
Zinn, R. A. 1993. Influence of processing on the comparative feeding value of barley for feedlot cattle. Journal of Animal Science 71:3-10.
146
Zinn, R. A., F. N. Owens, and R. A. Ware. 2002. Flaking corn: Processing mechanics, quality standards, and impacts on energy availability and performance of feedlot cattle. Journal of Animal Science 80:1145-1156.
Copyright © Amanda Pesqueira Schiff 2022

147
VITA
Amanda Pesqueira Schiff was born in São Paulo, São Paulo, Brazil. She received her
Animal Science Degree from the State University of Maringá - Brazil, in January 2013.
During her studies as an undergraduate, she completed an internship in ruminant nutrition
at the University of Kentucky where she published her research at the Journal of Animal
Science. In 2013 she obtained North America and Global 1st place undergraduate winner
at the Alltech Young Scientist Competition. She got her Master of Science degree in
Animal Science from the University of Kentucky in May 2016, working with ruminant
nutrition. During her M. S. studies she was awarded the Omega 3 Protein Award by the
American Society of Animal Science, and 1st place M. S. category at the University of
Kentucky Animal and Food Sciences Poster Symposium. She initiated her Ph.D. Graduate
Studies in Ruminant Nutrition at the University of Kentucky in August 2016, working as
a graduate research assistant with the Animal and Food Sciences Department.