measures of stereotyping and prejudice 1 measures of stereotyping and prejudice: barometers of bias
TRANSCRIPT
Measures of Stereotyping and Prejudice 1
Measures of Stereotyping and Prejudice: Barometers of Bias
Susan T. Fiske* and Michael S. North
Princeton University
Department of Psychology
Princeton University
Princeton NJ 08540
[email protected], [email protected]
609 258 0655
609 258 1113
*corresponding author
Running title: Measures of Stereotyping and Prejudice
Gregory J. Boyle, Donald H. Saklofske, & Gerald Matthews (Eds.), Measures of Personality and Social
Psychological Constructs (Elsevier/Academic)
For helpful feedback and permissions to reproduce their scales, we thank Mahzarin Banaji, Amy Cuddy,
Jack Dovidio, Russell Fazio, Maryann Fraboni, Peter Glick, Tony Greenwald, P. J. Henry, Felicia Pratto,
Jim Sidanius, David Sears, Janet Swim, and Francine Tougas.
Measures of Stereotyping and Prejudice 2
Abstract
Twenty-first century intergroup biases are more automatic, ambivalent, and ambiguous than were old-
fashioned biases such as authoritarianism and overt racism, which overtly expressed intergroup hostility.
Beyond traditional self-report measures of ethnocentrism and hostile sexism, current measures tap more
subtle manifestations of bias. Social dominance orientation assesses beliefs about the desirability of
group hierarchies and predicts social attitudes such as ethnocentrism. The stereotype content model maps
societal groups’ stereotypes, based on perceived social structure, predicting emotional prejudices and
discriminatory tendencies. Recent racism measures tap modern policy-related attitude configurations,
relatively automatic associations between groups and evaluations, and indirect indicators of intergroup
attitudes. Current sexism scales assess modern versions oriented toward policies and an ambivalent
version separating benevolence and hostility. Ageism scales measure both modern beliefs and
prescriptive ambivalence toward older people. Current measures are less direct than earlier ones,
consistent with 21st century patterns.
Key Words: stereotypes, prejudice, racism, sexism, ageism, intergroup bias
Measures of Stereotyping and Prejudice 3
Social psychologists have measured racial and ethnic bias since the field’s origins (Fiske, 1998,
reviews): assessing intergroup social distance (Bogardus, 1927) and stereotype contents (Katz & Braly,
1933). More specific measures soon followed. Sparked by the Holocaust, the Authoritarian Personality
predicted anti-Semitism and other ethnocentrism (Adorno et al., 1950), while surveys after World War II
through the present have reported racial and ethnic attitudes (for reviews, see Kinder & Schuman, 2004;
Schuman et al., 1985). With the rise of the civil rights movement, racial attitudes became more
complicated than self-reports could always detect, so nonverbal indicators became useful (Crosby et al.,
1980). Confronting veiled forms of prejudice informed work on policy-oriented symbolic and modern
racism (McConahay & Hough, 1976; Sears & Kinder, 1971). Modern forms pick up this thread; each
measure best fits its sociocultural period. An earlier version of this volume (Robinson, Shaver, &
Wrightsman, 1999) covered these new racisms (Biernat & Crandall, 1999), and another early version
covered prior and then-current indicators of authoritarianism and related ethnocentrism constructs
(Christie, 1991; Robinson et al., 1991). This review focuses on indirect, modern forms of racism and
ethnocentrism, as well as other indirect forms of intergroup bias.
Nonracial biases have been slower to elicit focused measures. Gender bias research began in
earnest only after the 1970’s women’s movement, when gender-role measures emerged (Lenny, 1991,
reviews). Early sexism measures were direct, assessing overt anti-female biases. Subsequently, measures
of ageism, sexual prejudice, and classism have been even slower to develop, when each reaches public
and scientific consciousness. This review covers indirect, modern forms of sexism and ageism.
Measures Reviewed Here
This chapter focuses on several measures in the most established areas of intergroup bias
research: ethnocentrism in general societal intergroup relations (group dominance, stereotype content), as
well as racism, sexism, and ageism.
Measures of Stereotyping and Prejudice 4
1. Social Dominance Orientation (Pratto et al., 1994)
2. Stereotype Content Model (Fiske et al., 2002)
3. Symbolic Racism Scale (Henry & Sears, 2002)
4. Implicit Association Test (Race) (Greenwald et al., 1998)
5. Indirect Priming Measure of Racism (Fazio et al., 1995)
6. Aversive Racism Measure (Dovidio et al., 1986)
7. Modern Sexism Scale (Swim et al., 1995)
8. Neo-sexism Scale (Tougas et al., 1995)
9. Ambivalent Sexism Inventory (Glick & Fiske, 1996)
10. Fraboni Scale of Ageism (Fraboni et al., 1990)
11. Succession, Identity, and Consumption Scale of Prescriptive Ageism (North & Fiske, 2013b)
Note. Due to space limitations, some measures are not reviewed here, for example: mental illness stigma
(Link et al., 2004), anti-fat prejudices (Crandall, 1994), ableism (Dovidio et al., 2011), anti-Asian bias
(Lin et al., 2005), and sexual prejudice (Herek & Lemore, 2013).
Overview of the Measures
All these measures assess category-based biases. The methods vary from survey questionnaires to
reaction-time measures. The first two scales, Social Dominance Orientation and the Stereotype Content
Model, assess attitudes toward hierarchies across a variety of societal groups.
The next four scales focus on racial biases. Starting in the 1970s, subtle new-wave approaches
replaced explicit indicators of blatant old-fashioned racism: Modern forms explore symbolic, modern,
ambivalent, implicit, indirect, and aversive racism. Each addresses the cultural shifts in expressions of
racism, from more unabashed hatred to perhaps well-intentioned but clueless, or at least self-conscious
Measures of Stereotyping and Prejudice 5 and norm-abiding forms that nevertheless have damaging consequences. Of these forms, this chapter
defers to an earlier review (Biernat & Crandall, 1999) for coverage of modern racism (McConahay,
1986), ambivalent racism (Katz & Haas, 1988), and subtle prejudice (Pettigrew & Meertens, 1995), to
focus here on more recent measures.
In this review, the next three scales focus on gender biases. After the original, overt Attitudes
Toward Women Scale (Spence et al., 1973), several approaches tackled more subtle forms of sexism (for
a review, see McHugh & Frieze, 1997). Building on modern forms of racism, three highly cited sexism
scales—modern sexism, neo-sexism, and ambivalent sexism—each take a related but distinct approach to
gender attitudes, focusing on anti-female sexism as either gender-relevant policy preferences (modern
sexism and neosexism) or hostile/benevolent prescriptive opinions (ambivalent sexism).
The review’s final two scales focus on age biases, an area less often studied. Both measures
examine stereotypes and prejudices relevant to the 21st century context, one scale more policy-oriented
and the other more prescriptive opinions. Together, all 11 scales illustrate the current landscape of major
barometers of bias.
Social Dominance Orientation (SDO)
(Pratto et al., 1994)
Variable
Social dominance orientation is an individual-difference variable expressing preference for
unequal relationships among categories of people; contexts also vary in social dominance, as the broader
theory indicates (Sidanius & Pratto, 1999). People who score highly on this measure believe that group
hierarchies are natural, unavoidable, and desirable. For them, the “dog-eat-dog” world requires group
Measures of Stereotyping and Prejudice 6 competition, so dominance is only realistic and adaptive. A socially dominant person might endorse the
inevitability of patriarchy, older-generation authority, white racial dominance, and upper-class
hegemony.
Description
The 16-item SDO scale elicits agreement-disagreement with statements such as: “Inferior groups
should stay in their place” and “No one group should dominate in society [reverse-scored]” (Pratto et al.,
1994). The SDO assesses social dominance, as opposed to individual dominance or self-esteem (Pratto et
al., 1994).
Sample
The original samples comprised 1,977 students from Stanford, University of California-Berkeley,
and San Jose State University, ages 17 to 59, about half women. Across 13 samples, Euro-Americans
ranged from 19 to 59%, Asian-Americans 16-51%, Hispanics 4-17%, Blacks 2-15%, and Arab-
Americans 0-8%. Modal family income, when measured, ranged across samples from under $20K up to
$100K per annum.
Later samples from every continent support generalizability across cultures (Lee et al., 2011;
Pratto et al., 2000). One meta-analysis from 27 societies (n= 50,971; 95 samples) found reliable
measurement and meaningful associations with societal variables (Fischer et al., 2012; cf. Lee et al.,
2011).
Reliability
Internal Consistency
Measures of Stereotyping and Prejudice 7
The Cronbach alpha coefficient in 13 samples averaged .83, ranging from .80 to.89 (Pratto et al.,
1994).
Test-Retest
Two test-retest reliability studies over three months exhibited significant correlations of .81 and
.84 (Pratto et al., 1994).
Validity
Convergent/Concurrent
SDO correlates with various hierarchy-enhancing attitudes, .32-.47 in a meta-analysis (Lee et al.,
2011). Besides predicting theoretically relevant attitudes, SDO converges with other enduring status-
maintaining ideologies. For example, social dominance orientation, Protestant work ethic (PWE), just
world beliefs, and right-wing authoritarianism (RWA) all correlate (Christopher et al., 2008), but each
specializes. Most relevant here, SDO converges with PWE on the centrality of work and the rejection of
leisure. Just-world beliefs and SDO also play similar roles in moderating the system-justifying,
hierarchy-enhancing belief that higher-status people are simply more competent than lower-status people
(Oldmeadow & Fiske, 2007).
Divergent/Discriminant
The measures most often compared with SDO are RWA and conservatism. RWA and SDO both
predict ethnic prejudices, but SDO focuses on group hierarchies relevant to resource competition, while
RWA focuses on group conflict over values. RWA focuses more on PWE values, morality, and self-
reliance (Christopher et al., 2008). RWA derives from the earlier work on authoritarianism (Christie,
1991) but focuses on hierarchy-enhancing values for subordinate submission, authoritarian aggression,
Measures of Stereotyping and Prejudice 8 and conventionalism (Altemeyer, 1988). RWA subordinates the individual to strongly-identified group
membership, demanding group cohesion, under value-threat from other groups (Duckitt, 1992), while
SDO endorses group-level resource inequality and superiority. The combination of high SDO and high
RWA predicts support for armed anti-government militias (Altemeyer, 2004).
Political conservatism correlates with SDO (.27 median r across eight samples, range .11-.72), but
controlling for conservatism does not eliminate correlations between SDO and hierarchy-enhancing
attitudes, which hover around .30 across issues and samples (Pratto et al., 1994). SDO’s correlations with
conservatism (.30) and racism (.47) explain their persistent correlation with each other; r=.29 drops to -
.05, controlling for SDO; Sidanius et al., 1996). These links undermine the principled conservatism
account of prejudice.
Gender differences in SDO distinguish between group-motivated dominance (men) and equality-
motivated (women) orientations (see below), catalyzing subfactors, SDO-D and SDO-E (Ho et al., 2012).
Social dominance theory predicts that hegemonic groups will support and subordinated groups
will resist group hierarchies. The most consistent finding has been a gender gap, with men supporting
group-based hierarchy more than women do (Lee et al., 2011). In the original work, SDO’s modal
correlation with gender hovered about .30 (Pratto et al., 1994). As the higher-status gender, men might
reasonably want to maintain that arrangement. Men’s higher average SDO explains gender differences in
more specific attitudes toward social compassion, women’s and gay/lesbian rights, and the military
(Pratto et al., 1997). Although men show more support for conservatism and group-based dominance,
their SDO best predicts their under-endorsing women’s rights (Eagly et al., 2004). Men endorse equality
in general less than women do, consistent with their higher SDO. Men’s SDO itself is moderated by how
intensely they identify with their gender (Dambrun et al., 2004). SDO justifies the system for the high-
status gender by decreasing their ambivalence, but SDO has the opposite effect for women, the lower-
status gender (Jost & Burgess, 2000).
Measures of Stereotyping and Prejudice 9
Whites, who are high-status among ethnicities, likewise score higher on SDO, tolerate inequality,
endorse hierarchy-maintaining ideologies, and are more conservative than Blacks (Davis, 2005; Fang et
al., 1998; Sidanius et al., 2001). Income and status also correlate positively with SDO and conservative
ideologies (e.g., meta-analysis of various dominant-subordinate societal groups reports d=.15, Lee et al.,
2011; cf. Sidanius & Pratto, 1999). Higher-status groups naturally support their own legitimacy. The
belief that “people generally deserve what they get” fits both just world theory (i.e., outcomes are fair;
Lerner & Miller, 1978) and social dominance theory (i.e., hierarchies are inevitable and desirable;
Sidanius & Pratto, 1999).
Construct/Factor Analytic
The original and subsequent papers used SDO as a unidimensional construct. Both exploratory
principal-components analysis (13 original samples, N=1,932) and confirmatory maximum-likelihood
(N=446) factor analysis of the 14-item scale inter-correlations favored a single-dimension, while the 16-
item scale includes two sub-dimensions, SDO-Dominance (SDO-D), preferring some groups to
dominate, and SDO-Egalitarianism (SDO-E), preferring (non)egalitarian intergroup structures.
Criterion/Predictive
From the outset, SDO has correlated with endorsing belief systems that support or reject group
dominance structures (respectively, hierarchy-enhancing ideologies or hierarchy-attenuating ideologies;
see above and Pratto et al., 1994). High SDO correlates with choosing hierarchy-enhancing roles such as
law, policing, politics, and business, whereas low SDO correlates with choosing hierarchy-attenuating
roles such as social work or counseling (Pratto et al., 1994; Sidanius et al., 1991). Meta-analysis across
cultures links SDO negatively to hierarchy-attenuating legitimizing ideologies and gender empowerment
(Fischer, Hanke, & Sibley, 2012). In American and Israeli samples, SDO-D especially relates to old-
Measures of Stereotyping and Prejudice 10 fashioned racism, zero-sum competition, and aggressive intergroup attitudes, whereas SDO-E especially
predicts less obvious legitimating ideologies, such as opposition to redistributive social policies (Ho et al.
2012).
Although correlations are causally ambiguous, SDO does guide responses to new social and
political attitudes (Pratto et al., 1994), consistent with its status as an enduring individual difference with
a causal role. SDO operates via attitudes toward hierarchy-enhancing assimilation, as well as hierarchy-
attenuating multiculturalism and colorblindness, which mediate its relationship with prejudice. SDO
consistently correlates with prejudices, especially toward immigrants and minorities when assimilation
norms are primed (Levin et al., 2012).
Location
Pratto, F., Sidanius, J., Stallworth, L. M., & Malle, B. F. (1994). Social dominance orientation: A
personality variable predicting social and political attitudes. Journal of Personality and Social
Psychology, 67(4), 741-763. (Appendix C, 16-item version)
For subscales, see:
Ho, A. K., Sidanius, J., Pratto, F., Levin, S., Thomsen, L., Kteily, N., & Sheehy-Skeffington, J. (2012).
Social dominance orientation: Revisiting the structure and function of a variable predicting social
and political attitudes. Personality and Social Psychology Bulletin, 38(5), 583-606.
Results and Comments
SDO is an established, useful, and distinctive measure embedded in a comprehensive theory of
societal structures that encourage intergroup biases favoring high-status groups. Broader than a simple
stereotyping or prejudice scale, it nonetheless predicts a variety of ethnocentric and gender biases, as well
as overall system endorsement. SDO is particularly suited to measuring bias caused by perceived
Measures of Stereotyping and Prejudice 11 intergroup competition, economic threat, for example. Its cousin, RWA (Altemeyer, 2004), is more suited
to measuring bias caused by perceived intergroup value inconsistency, norm threat, for example.
Together, they combine to assess the most virulent ethnocentrism.
Social Dominance Orientation
Instructions: “Which of the following objects or statements do you have a positive or negative
feeling towards? Beside each object or statement, place a number from '1' to '7' which represents the
degree of your positive or negative feeling." The scale was labeled very positive (7), positive (6), slightly
positive (5), neither positive nor negative (4), slightly negative (3), negative (2), and very negative (1).
1. Some groups of people are simply inferior to other groups.
2. In getting what you want, it is sometimes necessary to use force against other groups.
3. It's OK if some groups have more of a chance in life than others.
4. To get ahead in life, it is sometimes necessary to step on other groups.
5. If certain groups stayed in their place, we would have fewer problems.
6. It's probably a good thing that certain groups are at the top and other groups are at the bottom.
7. Inferior groups should stay in their place.
8. Sometimes other groups must be kept in their place.
9. It would be good if groups could be equal.
10. Group equality should be our ideal.
11. All groups should be given an equal chance in life.
12. We should do what we can to equalize conditions for different groups.
13. Increased social equality.
14. We would have fewer problems if we treated people more equally.
15. We should strive to make incomes as equal as possible.
Measures of Stereotyping and Prejudice 12 16. No one group should dominate in society.
Notes.
Items 9-16 reverse scored.
Copyright APA. Reproduced by permission.
Stereotype Content Model (SCM)
(Fiske et al., 2002)
Variable
The SCM measures specific biases directed toward systematic clusters of groups across society
(Cuddy et al., 2008; Fiske et al., 2002; 2007). The first dimension, perceived warmth, reflects the group’s
apparent intention for good or ill (friend-foe), and the second dimension, perceived competence, reflects
the group’s apparent ability to enact that intent (capability). Among the univalent combinations, the most
obvious ingroups and societal reference groups (e.g., middle class, citizens) appear high on both
dimensions, whereas extreme outgroups (drug addicts, homeless people) appear low on both dimensions.
Among the ambivalent combinations, some appear competent but cold (rich people, outsider
entrepreneurs) and others warm but incompetent (older people, disabled people). These quadrants vary in
the groups they contain across societies, but the two dimensions are predicted to array groups across
space in a variety of settings. This is not an individual-difference measure, but a description of reported
intergroup reactions at the level of a society.
Description
Measures of Stereotyping and Prejudice 13
SCM research proceeds in two steps. In Phase 1, a preliminary sample (n= ~30) from a given
society lists groups to three prompts (Fiske et al., 2002). In Phase 2, the most important measures are the
groups’ trait images (stereotypes) on the fundamental dimensions of perceived warmth (warm, friendly,
sincere, trustworthy) and perceived competence (competent, capable, skilled, intelligent). These then
generate the two-dimensional liking (warmth) x respect (competence) space, with some groups typically
high on both, others low on both, and still others high on one but low on the other (originally the SCM
used a subset of the listed traits, but recent work by Kervyn et al., under review, suggests improved
psychometrics with the additional ones included here). The Phase 1 group-listing task established a
method of selecting groups mentioned by at least 15-20% of the initial sample, to assure that the groups
are commonly known. In Phase 2, trait ratings were factor analyzed across participants, all of whom rated
a given group, for each of 6-24 groups.
Sample
The first samples included 346 undergraduates from two state universities (Massachusetts and
Colorado, average age 19-20 years), as well as 207 nonstudent adults from Massachusetts, Wisconsin,
Illinois, and Florida (mean age 35-78 years). Samples averaged 50-75% female, 66-84% White, and
middle-class (where measured).
Sometimes (see articles’ methods), to prevent fatigue, randomly assigned participants have each
rated half the listed groups. Because group-level results are most relevant (each group receiving warmth
and competence ratings means), randomly assigned participants rate different groups and then the
combined data sets are analyzed together, especially feasible given the lack of individual differences on
these measures of societal beliefs (see below).
An American adult representative sample (n=571; Cuddy et al., 2007) generalized beyond earlier
student and nonstudent convenience samples. The two dimensions of intergroup perception appear to be
Measures of Stereotyping and Prejudice 14 universal across more than 30 nations (Cuddy et al., 2009; Durante et al., 2013) and 75 years (Bergsieker
et al., 2012; Durante et al., 2010), as well as targets that are individuals, subgroups, groups, nations,
corporations, and species (Brambilla et al., 2011; Clausell & Fiske, 2005; Cuddy et al., 2009; Eckes,
2002; Fiske et al., 2009; Kervyn et al., 2012; Lee & Fiske, 2006; Malone & Fiske, 2013; Sevillano &
Fiske, under review).
Reliability
Internal Consistency
Cronbach alpha coefficients averaged .86, ranging from .94 to .67 (Fiske et al., 2002).
Test-Retest
Test-retest reliability at the level of individual participants was not tested, but stereotype content
stability has been tested at the level of groups in American society over time (Bergsieker et al., 2012).
Consistent with changing norms about expressing prejudices, the negative dimensions for each group are
no longer mentioned, but the positive dimension (warmth or competence or both) is remarkably stable
over 75 years, and the outgroups mostly locate in the same warmth-X-competence quadrant over time.
Validity
Convergent/Concurrent
Several frameworks and measures propose related dimensions for individual person perception
(Fiske et al., 2007): social versus task dimensions for personality traits (Rosenberg et al., 1968), morality
versus competence for self and other descriptions (Wojciszke, 1994), trustworthiness versus dominance
in spontaneous trait inferences from faces (Willis & Todorov, 2006). Together, these two dimensions
account for 82% of the variance in interpersonal impressions (Wojciszke et al., 1998). Others propose
Measures of Stereotyping and Prejudice 15 similar dimensions for intergroup and inter-nation relations (respectively, Alexander et al., 1999; Phalet
& Poppe, 1997; see Cuddy et al., 2008, for a discussion of the distinctions).
Not an individual-difference measure, SCM relates less clearly to known-groups analyses.
However, observers often wonder whether the SCM space depends on the respondent’s own group
membership, the most plausible prediction being ingroup-favoritism. In the original research, 280 F tests
(on rated competence, warmth, status, and competition) across two-dozen groups per sample revealed
only 8% significant differences by gender and ethnicity of participants (Fiske et al., 2002). Subsequent
analysis of students’ favoring the ingroup students (where mentioned) revealed slight ingroup favoritism
in American and Belgian samples but not East Asian samples (Cuddy et al., 2009). EU samples rating
each other showed slight ingroup favoritism on their own nation’s more positive dimension (Cuddy et al.,
2009). Because respondents report societal stereotypes, consensus is mostly high.
Divergent/Discriminant
Although early SCM research included some negative as well as positive traits, to offset
acquiescence response bias, patterns across each separate group’s factor analyses showed negative items’
inconsistent use in describing societal stereotypes (see Bergsieker et al., 2012). Order of presentation
makes no detectable differences (Fiske et al., 2002).
The most frequently proposed alternative model comprises the semantic differential dimensions
of evaluation, potency, and activity (EPA; Osgood et al., 1957). A multi-dimensional scaling of 26
societal groups found that one-, two-, and three-dimensional solutions were better predicted by SCM than
EPA dimensions (Kervyn et al., in press). Moreover, correlational and experimental designs predicted
and demonstrated that the two main EPA dimensions (evaluation and potency) run across stereotype
content model quadrants at roughly 45˚ angles.
Measures of Stereotyping and Prejudice 16 Construct/Factor Analytic
In each study, two types of cluster analysis described the structure of the two-dimensional space.
Following Hair et al. (1995), first, hierarchical cluster analyses determine the best-fit number of clusters,
using agglomeration statistics. Second, k-means cluster analyses (parallel threshold method) assign
groups to clusters (cf. Blashfield & Aldenderfer, 1988). The first 2002 study had used traits derived from
the Conway et al. (1996) gender-stereotype study of communality and agency: five competence traits
(competent, intelligent, confident, competitive, independent) and four warmth traits (sincere, good
natured, warm, tolerant). Even in the original SCM (2002) paper, items developed over studies, to
increase reliability, but most often became warm, friendly versus competent, capable.
Related research (see convergent validity) identified the dimensions as competence (similar
items) and morality, using terms such as trustworthy, honest, and sincere. Because some early SCM
studies focused on warmth as friendliness but others included morality-related terms such as tolerance
and sincerity (Fiske et al., 1999), a psychometric project examined these two correlated
sociability/morality dimensions (Kervyn et al., under review). Ingroup perception emphasizes morality
over sociality (Leach et al., 2007), and related person perception research refers to communality (which
includes both) as the primary dimensions (Wojciszke, 1994). Kervyn et al. compared these two warmth
dimensions, finding morality and sociality to be highly correlated.
Criterion/Predictive
According to the SCM, perceived societal structures (competition and status) predict stereotypes
(respectively, warmth and competence) (e.g., Cuddy et al., 2009; Durante et al., 2012; Fiske et al., 2002).
Specific combinations predict emotional prejudices of pride, pity, disgust, and envy. Emotions in turn
predict active and passive help and harm (Cuddy et al., 2008; Fiske et al., 2007).
Measures of Stereotyping and Prejudice 17
The first predicted correlation, between social structure and stereotypes, averages .80 for status-
competence and -.77 for competition-warmth (Kervyn et al., under review). Competition-warmth
correlations were initially lower than status-competence ones, but improve when (a) operationalizing
competition over both tangible resources and cultural values (based on research from Integrated Threat
Theory; Stephan & Stephan, 2000), and (b) including both sub-dimensions of warmth (see above section
titled “dimensions: items”) (Kervyn et al., under review). The non-predicted structure-trait correlations
(status-warmth, competition-competence) do not typically differ from zero. Experimental scenario
studies manipulating status and competitive relations between fictive social groups also support the
structure-stereotype predictions, as well as the indirect link between social structure and prejudiced
emotions (Caprariello et al., 2009).
The second prediction, from trait stereotypes to prejudiced emotions, is tested as an interaction of
the warmth-competence dimensions predicting distinct emotions for each quadrant, as 3:1 contrasts
(distinct emotions for each cluster; Cuddy et al., 2007; Fiske et al., 2002). Moreover, neuroscience
evidence, targeting specific quadrants, shows neural and muscular activations consistent with some of the
predicted emotions (see Fiske et al., 2013).
The third prediction, from stereotypes and emotions to behavior, suggests a more direct, robust
emotion-behavior relationship and a more indirect, mediated stereotype-emotion-behavior relationship
(Cuddy et al., 2007).
Location
Fiske, S. T., Cuddy, A. J., Glick, P., & Xu, J. (2002). A model of (often mixed) stereotype content:
Competence and warmth respectively follow from perceived status and competition. Journal of
Personality and Social Psychology, 82(6), 878-902.
Measures of Stereotyping and Prejudice 18 Results and Comments
The SCM usefully identifies a perceived warmth-by-competence space differentiating among
societies’ groups in nations around the world and over 75 years, as well across social-group subtypes
(e.g., kinds of women), species, and corporations. Because it is not an individual-difference measure but
instead a report of societal consensus around positions of various groups, future directions include the
challenge to understand individual variations in personal endorsement of these societal warmth-by-
competence maps.
Stereotype Content Model
Phase 1:
1. Off the top of your head, what various types of people do you think today’s society categorizes
into groups (i.e., based on ability, age, ethnicity, gender, occupation, race, religion, etc.)?
2. What groups are considered to be of very low status by [nation’s] society?
3. What groups, based on the same kinds of criteria used in the first question, do you consider
yourself to be a member of?
Notes.
Participants may list up to 30 groups for each question, with a minimum of three answers for Question 1
and a minimum of one answer each for Questions 2 and 3.
Question 2 encourages listing ignored or unmentionable groups, and Question 3 encourages listing of
own groups; both are categories people sometimes neglect. If these two questions bias the groups listed,
it is only toward conventional ingroups and outgroups, not toward the SCM’s innovative mixed
quadrants; only Question 1 allows the listing of the SCM’s signature ambivalent outgroups.
Measures of Stereotyping and Prejudice 19 Phase 2:
Instructions: “We would like to invite you to participate in a study about impressions of different
types of groups in society. We intend to investigate the way different groups are viewed by American
society. Thus, we are not interested in your personal beliefs, but in how you think these groups are
viewed by others.
Please answer the following questions, using the 5-point scales (1, not at all, to 5, extremely)
shown in the pages to follow.
Finally, we remind you that the questionnaire is anonymous, and the data collected will be used
for scientific purpose only.”
Note: The questionnaire appears as a groups x items matrix, with group names appearing as column
headers and the following items as row labels, with respondents inserting a number from 1 to 5 in each
cell of the matrix.
Warmth Items
To what extent do most Americans view members of this group as friendly?
…sincere?
Competence Items
…capable?
…competent?
Status Predictors
How prestigious are the jobs generally held by …?
How economically successful have … been?
Cooperation-Competition Predictors
Measures of Stereotyping and Prejudice 20 If resources go to …, to what extent does that take resources away from the rest of society?
The values and beliefs of … are NOT compatible with the beliefs and values of most Americans.
Notes.
Items usually appear in rows and group in columns, with respondents inserting a number form 1 (not at
all) to 5 (extremely).
All items are answered from the perspective of respondents’ society, its name inserted for each warmth
and competence items. Groups’ names are inserted for predictor items derived from Fiske et al. (2002),
and updated by Kervyn et al. (under review).
Reproduced with permission.
Symbolic Racism Scale (SRS)
(Henry & Sears, 2002)
Variable
Symbolic racism theory developed one of the earliest and widely used measures of the new
racisms (see Biernat & Crandall, 1999; Sears & Henry, 2005 for reviews). From a cultural perspective,
old-fashioned racism became less influential in the 1970s. Instead, research revealed that real and
perceived threats to Whites’ personal lives were less powerful than other forms of racial beliefs in
predicting opposition to Black politicians and policies. Sears and colleagues argued that some Whites’
early socialization created a blend of negative affect toward Blacks and traditional conservative values,
resulting in racial antipathy.
Measures of Stereotyping and Prejudice 21 Description
The SRS, cobbled together from existing survey questions (Sears & Kinder, 1971), included items
suggesting Black Americans could get by without welfare if they tried, should not push themselves where
not wanted, and get too much attention from city officials; these items predicted voting preferences for a
White versus Black Los Angeles mayoral candidate, for liberals and conservatives alike, suggesting a
factor other than political identity at work here. Evolving over the next decades, almost always using
representative sample surveys, the current 8-item form (Henry & Sears, 2002) includes items such as
“How much discrimination against blacks do you feel there is in the United States today, limiting their
chances to get ahead?” and “Irish, Italian, Jewish, and many other minorities overcame prejudice and
worked their way up. Blacks should do the same.”, as well as variants on the earlier items.
Sample
The most frequent samples have come from the National Election Studies representative surveys.
Generalizability is not an issue, as the most frequent respondents have been U.S. representative samples.
The scale does operate the best for Whites, even across education levels (Henry & Sears, 2002; Sears &
Henry, 2005).
Reliability
Internal Consistency
Median Cronbach alpha coefficients for White respondents have been reported as .75, and .79 in
the most recent version (Henry & Sears, 2002). However, other ethnicities also can exhibit moderate
alpha coefficients (in the two samples: Blacks, .55 and .85; Asians, .74 and .60; and Latinos, .42 and .73,
respectively).
Measures of Stereotyping and Prejudice 22 Test-Retest
Test-retest reliability was .68 over two years in a national sample (Kinder & Sanders, 1996)
showing high overall stability from voting age through late middle age (Henry & Sears, 2009).
Validity
Convergent/Concurrent
SRS has concentrated on predicting Whites’ racial attitudes (beta=.41-.50 in three studies; Henry
& Sears, 2002). Most compelling is that endorsement of Black individualism (responsibility) predicts
symbolic racism (beta ~.40), which in turn predicts racial policy preferences (~.50), with a much smaller
direct path from endorsing Black individualism to racial policy preferences (~.15) (Sears & Henry,
2005). SRS represents racial attitudes and political conservatism to an equal degree in confirmatory
factor analysis, but regressions from three studies each demonstrate significant increase in R2 adding SRS
to those two measures in predicting Whites’ opposition to racial policies (Henry & Sears, 2002).
Divergent/Discriminant
The current 8-item measure varies its scaling, having not only agree and disagree items but also
several other response modes (e.g., a-lot/none-at-all, and others). Social desirability to a predecessor
scale (McConahay, 1986) shows weak and inconsistent correlations.
Discriminant validity suggests that symbolic racism differs clearly from both older racial attitudes
and from political conservatism (see previous paragraph), although its base in both has led to controversy
(e.g., Sniderman et al., 2000) (see Henry & Sears, 2002; Sears & Henry, 2005).
Divergence among known groups shows that Blacks, not surprisingly, score lower (Ms = .24 to
.36) than Whites (Ms = .40 to .49), but also lower than Asians (Ms = .44 to .53), and Latinos (Ms =.34 to
.51). The new immigrants maintain ethnic identity as a result of recency of arrival (Sears et al., 2003),
Measures of Stereotyping and Prejudice 23 perhaps explaining why they do not identify with Black Americans as another minority group, therefore
scoring closer to Whites.
The theory was designed to explain White racial policy attitudes. Whites’ personal self-interest is
arguably not the reason (Kinder & Sears, 1981), nor is White group identity or group interest necessarily
the key (Sears & Henry, 2005). Instead, the origins of White symbolic racism blend anti-Black affect and
conservative values into overall endorsement prescribing Black individualism (blame, responsibility,
required effort) (see Sears & Henry, 2003, for items). These patterns cohere in individual development by
voting age, and consolidate across the lifespan, but reduce with cognitive decline in older age, however
not responding strongly to sociocultural change (Henry & Sears, 2009).
Construct/Factor Analytic
Although the scale has appeared variable across methods and samples in its number of
dimensions, even when more than one subfactor appears, the two-factor model dimensions correlate
highly, from r=.49 (Henry & Sears, 2002) to r=.96 (Sears & Henry, 2005). For example, the dominant
ideology dimension contains items denying discrimination, seeing change, and endorsing hard work,
whereas the political resentment dimension views Blacks as undeserving, getting too much attention, and
being too pushy. Conceptually crucial themes are: denial of continuing discrimination, endorsing effort
and responsibility, rejecting excessive demands, and resenting undeserved advantage (Sears & Henry,
2005).
Criterion/Predictive
From the outset, symbolic racism has predicted racial policy preferences that each disadvantage
Black Americans, independent of ideology, party identification, nonracial values, and more traditional
racial attitudes (see above; Sears & Henry, 2005). Some argue that such policy preferences are based on
Measures of Stereotyping and Prejudice 24 perceived or actual realistic group conflict (Bobo, 1983) or on the particulars of each policy (Sniderman
et al., 2000). Whatever the impact of those variables on policy preferences, symbolic racism clearly has
predictive effects (Henry & Sears, 2002).
Location
Henry, P. J., & Sears, D. O. (2002). The Symbolic Racism 2000 Scale. Political Psychology, 23(2), 253-
283.
Results and Comments
Although its theoretical origin in early childhood experience is less than established, the survival
and utility of the symbolic racism measure is impressive. The SRS qualifies as modern and symbolic
because it manifests in a racially biased pattern of policy references rather than self-reported prejudices
against Black people as a group. The SRS is the self-report benchmark for comparing all other forms of
contemporary racial prejudice, which are measured by even less direct methods.
Symbolic Racism Scale
Blacks Should Work Harder
1. It's really a matter of some people not trying hard enough; if blacks would only try harder, they
could be just as well off as whites. (1, strongly agree; 2, somewhat agree; 3, somewhat disagree;
4, strongly disagree)
Measures of Stereotyping and Prejudice 25
2. Irish, Italian, Jewish, and many other minorities overcame prejudice and worked their way up.
Blacks should do the same without any special favors. (1, strongly agree; 2, somewhat agree; 3,
somewhat disagree; 4, strongly disagree)
Demands for Special Favors
1. Some say that black leaders have been trying to push too fast. Others feel that they haven't pushed
fast enough. What do you think? (1, trying to push too fast; 2, going too slowly; 3, moving at
about the right speed)
2. How much of the racial tension that exists in the United States today do you think blacks are
responsible for creating? (1, all of it; 2, most; 3, some; 4, not much at all)
Denial of Continuing Racial Discrimination
1. How much discrimination against blacks do you feel there is in the United States today, limiting
their chances to get ahead? (R) (1, a lot; 2, some; 3, just a little; 4, none at all)
2. Generations of slavery and discrimination have created conditions that make it difficult for blacks
to work their way out of the lower class. (R) (1, strongly agree; 2, somewhat agree; 3, somewhat
disagree; 4, strongly disagree)
Undeserved Outcomes
1. Over the past few years, blacks have gotten less than they deserve (R) (1, strongly agree; 2,
somewhat agree; 3, somewhat disagree; 4, strongly disagree)
2. Over the past few years, blacks have gotten more economically than they deserve. (1, strongly
agree; 2, somewhat agree; 3, somewhat disagree; 4, strongly disagree)
Notes.
Items were originally embedded in several larger social survey questionnaires, so no specific instructions
appear in print.
Measures of Stereotyping and Prejudice 26 The symbolic racism items from Henry & Sears (2002) appear here, organized by themes.
(R) Reverse scored item.
Copyright Wiley. Reproduced with permission.
Implicit Association Test (Race) (IAT)
(Greenwald et al., 1998)
Variable
Immediate, spontaneous evaluative associations inform one subtle measure of racial bias, the
racial IAT, which is a subset of the broader theory and instrument for a variety of biases (Greenwald et
al., 1998, 2002). Although this review focuses on race, the IAT has assessed an impressive variety of
evaluative links between own group and positive associations, but another group and negative ones
(Fazio & Olson, 2003): for example, gender, race, age, religion, nationality (Rudman et al., 1999), and
even minimal, arbitrary group memberships (Ashburn-Nardo et al., 2001). All these IAT versions suggest
that people like themselves, associate themselves with their ingroup, and favor ingroup accordingly. IAT
research generally argues that implicit associations – millisecond differences in speed of responding to
evaluatively linked items – reveal prejudice that may not be consciously accessible. Some controversy
has ensued about whether to call the IAT a measure of attitudes, hence the narrower name, “association,”
linked to its operationalization.
Description
The IAT requires participants to pair like-valenced and unlike-valenced concepts by responding to
one type of pair on a left-hand key and the other pair on a right-hand key, for example: implicitly pairing
Measures of Stereotyping and Prejudice 27 one concept (e.g., words denoting Black people) and one evaluation (e.g., unpleasant words, such as
cancer) by responding with the left-hand key, but pairing White-related words and positive words on the
right (see below).
White people are fast to respond to racial categories sharing a valence, when subjective positives
and negatives are on opposite sides (on one side, a mixed list of White or good words versus on the other,
Black or bad words); they are slow to respond to inconsistent categories sharing a side (White or bad on
one side versus Black or good on the other) (Greenwald et al., 1998).
The initial race IAT (Greenwald et al., 1998, Study 3) asked one condition to pair 25
stereotypically White American names (e.g., Adam, Chip, Harry) or 25 positive words (e.g., caress,
freedom, health) on one side but 25 stereotypically Black American names (Alonzo, Jamel, Lerone) or
negative words (abuse, crash, filth) on the other. In another condition, the valence-pairings reversed
(White or bad; Black or good). Other versions used male or female, Black or White names, and, for
Asian participants, Korean and Japanese names. Participants responded significantly faster to ethnic
ingroup-positive and ethnic outgroup-negative pairings.
Sample
The original race IAT involved 26 University of Washington undergraduates. The IAT rapidly
went beyond student samples to a website and papers that analyzed literally millions of on-line responses
(Nosek et al., 2002, 2007). Regarding race specifically, the web samples all paired more positive terms
with White than Black social-category-related stimuli. All racial/ethnic groups (Whites, Asian, Hispanics,
native Americans, multi-racials) except Blacks favored Whites implicitly; the effect for Blacks was
neutral, neither racial ingroup nor Whites being favored. Regardless of participant race, effect sizes
favoring Whites were large (overall d=.77), a pattern shown by 68% of all respondents, while only 14%
Measures of Stereotyping and Prejudice 28 showed Black favoritism. Among social category biases tested by the IAT, only age showed bigger
effects.
Reliability
Internal Consistency
Based on an overview across types of target categories that go beyond race (Schnabel et al.,
2008), Cronbach alpha coefficients for the IAT have been reported ranging from .53 to .90 (Cunningham
et al., 2001; Hofmann et al., 2005; Nosek et al., 2005; Olson & Fazio, 2003).
Test-Retest
The IAT test-retest reliabilities over a variety of intervals are lower than the alphas: a median of
.56 (Nosek et al., 2005; see also Cunningham et al., 2001; Fazio & Olson, 2003, p. 211). The IAT
performs best under a revised scoring system that uses data from its practice trials, takes account of
individual differences in variability of response latency, and penalizes response latency for error trials
(Greenwald et al., 2003).
Validity
Convergent/Concurrent
Entirely compatible indirect techniques predated the IAT (e.g., the MODE model and aversive
racism below; Fazio & Olson, 2003); the IAT correlations with indirect measures are surprisingly weak
(up to .38) unless latent-variable analysis removes measurement error (.55) (Fazio & Olson, 2003).
Unsatisfactory reliabilities on either predictors or criterion may contribute (Schnabel et al., 2008).
The IAT framework suggests modest correlations with explicit measures, higher in less
controversial domains. Across domains (self-concept, attitude, stereotype IATs), meta-analyses report
Measures of Stereotyping and Prejudice 29 IAT/explicit-self-report correlations averaging .24 (Hofmann et al., 2005) and .37 (Nosek, 2005). Higher
correlations emerge when concepts are strong and subjectively important, bipolar rather than unipolar,
individually distinctive, and introspectively accessible (Nosek, 2005).
Thus the IAT is especially suited to intergroup bias and other socially sensitive topics that do not
necessarily yield reliable self-report. Explicit self-reports are well suited to uncontroversial political and
consumer concepts, presumably topics that do not raise social anxieties. When participants are indeed
willing to report their racial prejudices explicitly, implicit measures correlate with them (Wittenbrink et
al., 1997). Correlations increase for spontaneous self-reports and conceptually similar implicit measures..
Overall, the IAT has particular utility for racial attitudes that people do not often report explicitly.
Divergent/Discriminant
From the outset, the IAT has aimed to differentiate itself from rival concepts. For example, racial
ingroup preference is not a function of sheer unfamiliarity with outgroup names and faces (Dasgupta et
al., 2000). Similarly, according to critics, the IAT might mix personal and cultural beliefs (Arkes &
Tetlock, 2004; Karpinski & Hilton, 2001; Kihlstrom, 2004; Olson & Fazio, 2004a; Uhlmann et al., 2006).
However, because attitudes do partially originate in culture, even when people disagree with the culture,
the IAT should detect the difference between attitudes and cultural influences (Banaji et al., 2004;
Lowery et al., 2001).
Comparing to other indirect measures, the IAT as a measure requires conscious pairing and
sometimes awareness of the evaluative association among the categories involved, but the IAT does not
as much involve control over response latencies (Dasgupta et al., 2000). Other priming techniques
(below) do not necessarily include even awareness of the stimuli.
As noted, Black Americans on average show less White favoritism and relatively more Black
favoritism (or at least neutrality) than do participants from other racial-ethnic groups, whereas Whites
Measures of Stereotyping and Prejudice 30 show the most White favoritism of all racial groups (e.g., Nosek et al., 2007). As noted, Whites’ ingroup
preference (and relative Black outgroup disfavor) is lessened after diversity training (Rudman et al.,
2001). The IAT also picks up Asians’ degrees of Asian versus European-American self-reported identify
and immersion (Greenwald et al., 1998).
Some critics suggest the IAT is not automatic or unconscious, and its creators do not insist that it
is purely so. Nevertheless, this debate has sparked research on how flexible IAT responses really are; if it
is malleable, how implicit is it? Most relevantly here, Whites who practice associating self with Blacks
then diminish their IAT racial bias (Phills et al., 2011; see also Devine et al., 2002). IAT race-prejudice
scores decrease with a variety of relevant experiences: exposure to positive minority and negative
majority role models (Dasgupta & Greenwald, 2001; but see Joy-Gaba & Nosek, 2010), diversity training
(Rudman et al., 2001), counter-stereotypic images (Wittenbrink et al., 2001b), context (Mitchell et al.,
2003), and social influence (Lowery et al., 2001). Also, race-IAT data depend on whether people are
aware that it assesses racism, potentially increasing self-defeating control efforts by well-intentioned
respondents, as well as picking up the biases of automatically bigoted ones (Frantz et al., 2004; Siegel et
al., 2012). However, faking is potentially detectable (gender and nationality IATs: Cvencek et al., 2010).
Construct/Factor Analytic
The IAT often simplifies bias down to a bipolar positive-negative evaluative association, though
other associations (e.g., women & humanities, men & math/science) sometimes appear. No
commentators imply that the associations are not evaluative, though their origin (personal or cultural) is
disputed (see above).
Criterion/Predictive
Measures of Stereotyping and Prejudice 31
According to a meta-analysis, the IAT predicts related interpersonal affect, social judgment, and
behavior, acting like an attitude (Greenwald et al., 2009). It also correlates with physiological response,
including a palpable sense of the ease of certain (e.g., prejudiced) pairings over others (Ashburn-Nardo et
al., 2001), allowing a teachable moment in seminars. The IAT’s predictive validity for behavior often
fares better than explicit self-reports, especially on interracial responses and other socially sensitive
issues. The IAT, like other indirect measures (see below) tends to predict interpersonal nonverbal
behaviors, such as observers’ molar impressions of friendliness, smiling, speech hesitation, speech errors,
and talking time (McConnell & Leibold, 2001). On a similar nonverbal level, Whites’ implicit
associations predict their own early detection of threatening facial expressions in Black but not White
faces (Hugenberg & Bodenhausen, 2003), as well as immediate judgments of trustworthiness (Stanley et
al., 2011).
Various neural regions have been implicated in racial IAT responses and in more general
interracial perception (amygdala, perhaps related to vigilance and motivational importance; anterior
cingulate cortex, perhaps related to discrepancy in social cognition; dorsolateral prefrontal cortex,
perhaps related to cognitive control, and the fusiform face area; Kubota et al., 2012).
Behaviorally, the IAT also predicts deliberate behavior: vote in the 2008 McCain-Obama election
(Greenwald et al., 2009), as well as intergroup economic choices (Rudman & Ashmore, 2007; Stanley et
al., 2011; see also meta-analysis collapsing across behavior, judgment, affect, and physiology, Greenwald
et al., 2009).
Location
Greenwald, A. G., McGhee, D. E., & Schwartz, J. L. K. (1998). Measuring individual differences in
implicit cognition: The implicit association test. Journal of Personality and Social Psychology,
74(6), 1464-1480.
Measures of Stereotyping and Prejudice 32
Note. For on-line examples, stimuli, and programs, see https://implicit.harvard.edu/implicit/ or
http://faculty.washington.edu/agg/iat_materials.htm.
Results and Comments
Implicit real-world attitudes may originate in a durable, simple, slow-learning memory system,
whereas explicit attitudes may originate in a flexible, context-sensitive, fast-learning memory system
(DeCoster et al., 2006). Implicit attitudes are primarily associations, perhaps from early preverbal
experiences, affective experiences, cultural associations, and cognitive-consistency principles (Rudman,
2004; Sinclair et al., 2005). In contrast, explicit attitudes may be later-acquired verbal propositions
subjectively judged as true (Gawronski & Bodenhausen, 2006). Implicit associations now form an
important teaching, assessment, and research tool, causing less controversy than when the IAT first
appeared.
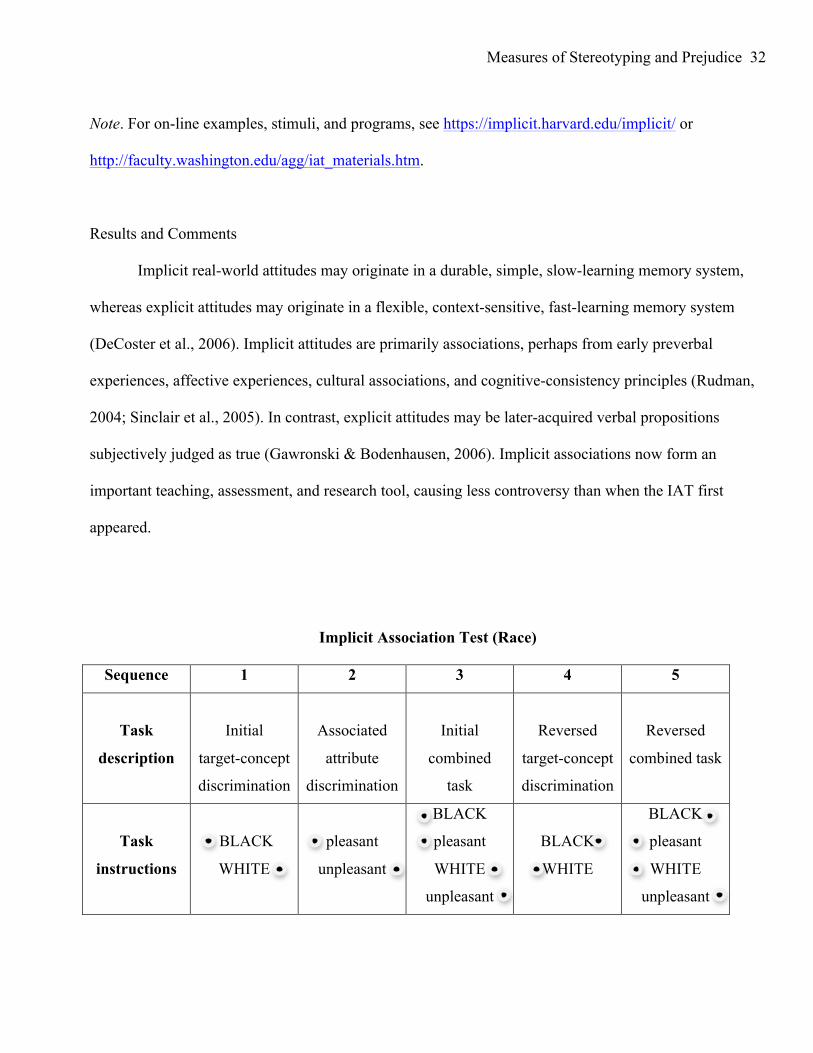
Implicit Association Test (Race)
Sequence 1 2 3 4 5
Task
description
Initial
target-concept
discrimination
Associated
attribute
discrimination
Initial
combined
task
Reversed
target-concept
discrimination
Reversed
combined task
Task
instructions
BLACK
WHITE
pleasant
unpleasant
BLACK
pleasant
WHITE
unpleasant
BLACK
WHITE
BLACK
pleasant
WHITE
unpleasant
Measures of Stereotyping and Prejudice 33
Sample
stimuli
Meredith
Latonya
Shavonn
Heather
Tashika
Katie
Betsy
Ebony
lucky
honor
poison
grief
gift
disaster
happy
hatred
Jasmine
pleasure
Peggy
evil
Colleen
miracle
Temeka
bomb
Courtney
Stephanie
Shereen
Sue-Ellen
Tia
Sharise
Megan
Nichelle
peace
Latisha
filth
Lauren
rainbow
Shanise
accident
Nancy
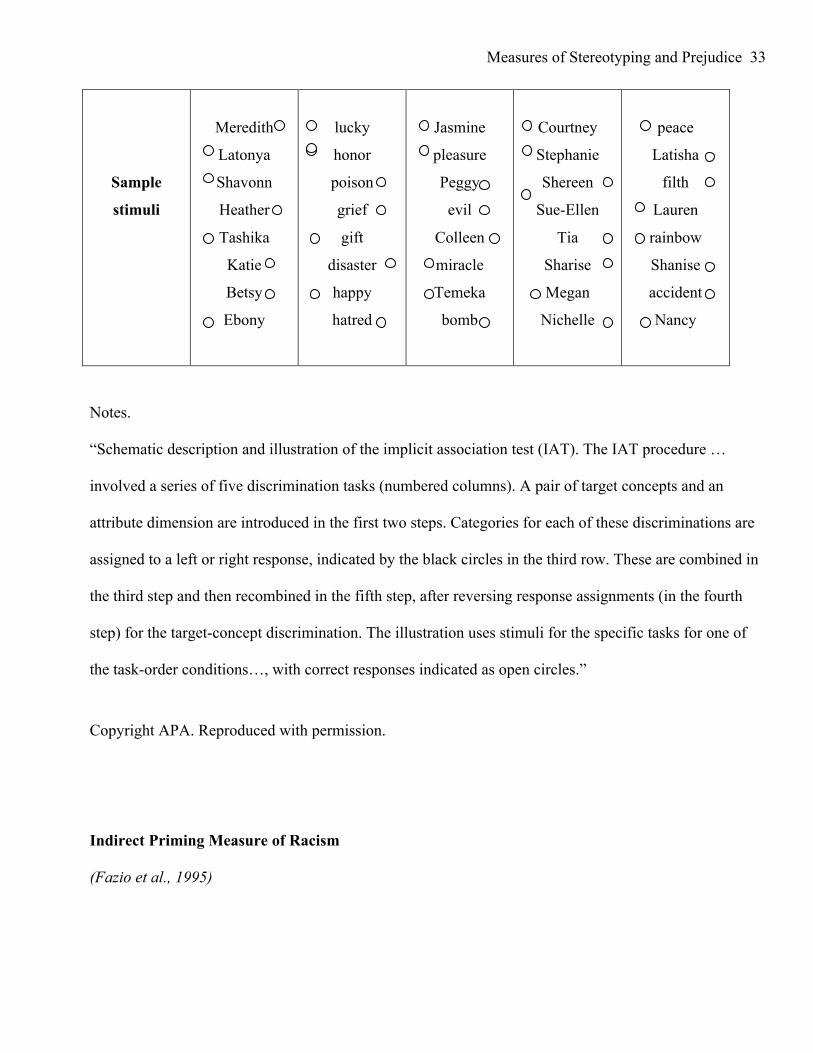
Notes.
“Schematic description and illustration of the implicit association test (IAT). The IAT procedure …
involved a series of five discrimination tasks (numbered columns). A pair of target concepts and an
attribute dimension are introduced in the first two steps. Categories for each of these discriminations are
assigned to a left or right response, indicated by the black circles in the third row. These are combined in
the third step and then recombined in the fifth step, after reversing response assignments (in the fourth
step) for the target-concept discrimination. The illustration uses stimuli for the specific tasks for one of
the task-order conditions…, with correct responses indicated as open circles.”
Copyright APA. Reproduced with permission.
Indirect Priming Measure of Racism
(Fazio et al., 1995)
Measures of Stereotyping and Prejudice 34 Variable
Although other measures predated the IAT, they have proved less controversial. Five other
measures appear in one review (Fazio & Olson, 2003), but this section focuses on one, based on the
MODE (motivation-and-opportunity-determine) model (Fazio, 1990; Fazio & Towles-Schwen, 1999).
The concept holds that attitudes can influence responses by more automatic or more controlled routes, the
latter when motivation and resources allow more deliberation. For present purposes, the attendant
measurement focuses on the relatively automatic, spontaneous, or indirect racial-attitude measure. This
involves priming participants with Black or White-related stimuli and measuring the facilitated speed of
response to similarly evaluated race-unrelated stimuli.
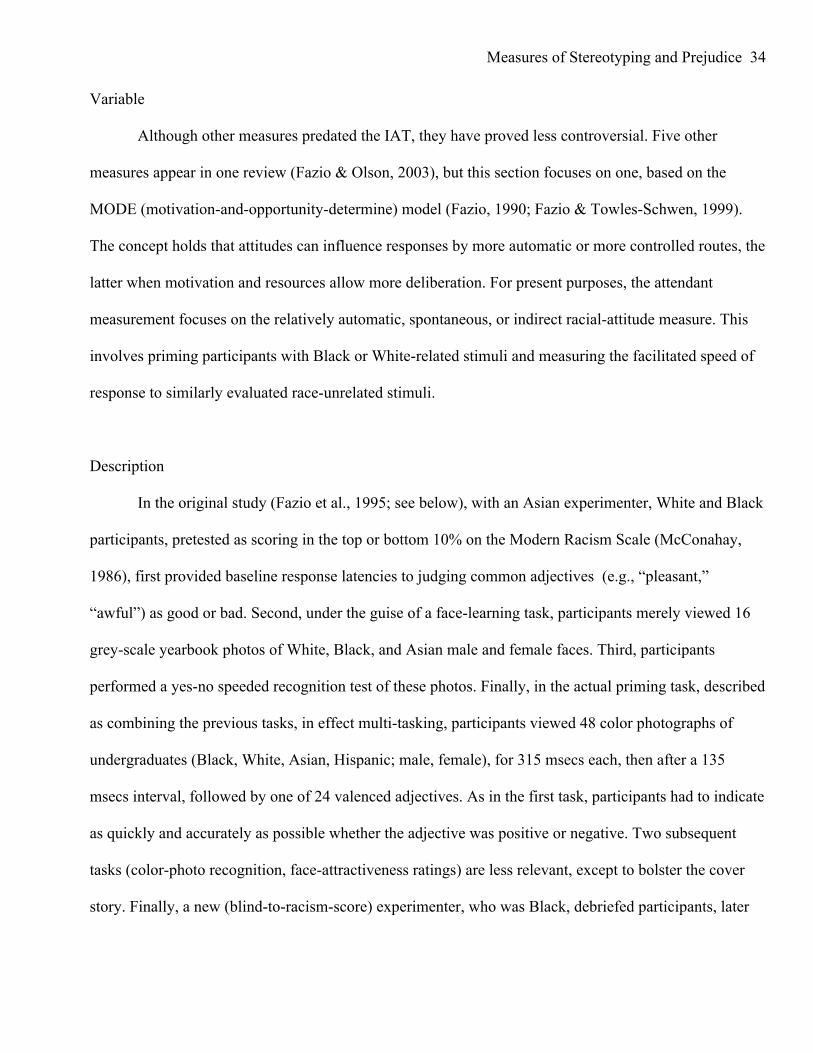
Description
In the original study (Fazio et al., 1995; see below), with an Asian experimenter, White and Black
participants, pretested as scoring in the top or bottom 10% on the Modern Racism Scale (McConahay,
1986), first provided baseline response latencies to judging common adjectives (e.g., “pleasant,”
“awful”) as good or bad. Second, under the guise of a face-learning task, participants merely viewed 16
grey-scale yearbook photos of White, Black, and Asian male and female faces. Third, participants
performed a yes-no speeded recognition test of these photos. Finally, in the actual priming task, described
as combining the previous tasks, in effect multi-tasking, participants viewed 48 color photographs of
undergraduates (Black, White, Asian, Hispanic; male, female), for 315 msecs each, then after a 135
msecs interval, followed by one of 24 valenced adjectives. As in the first task, participants had to indicate
as quickly and accurately as possible whether the adjective was positive or negative. Two subsequent
tasks (color-photo recognition, face-attractiveness ratings) are less relevant, except to bolster the cover
story. Finally, a new (blind-to-racism-score) experimenter, who was Black, debriefed participants, later
Measures of Stereotyping and Prejudice 35 rating their friendliness and interest, and finally asking them to take an allegedly unrelated survey about
race-related riots in Los Angeles.
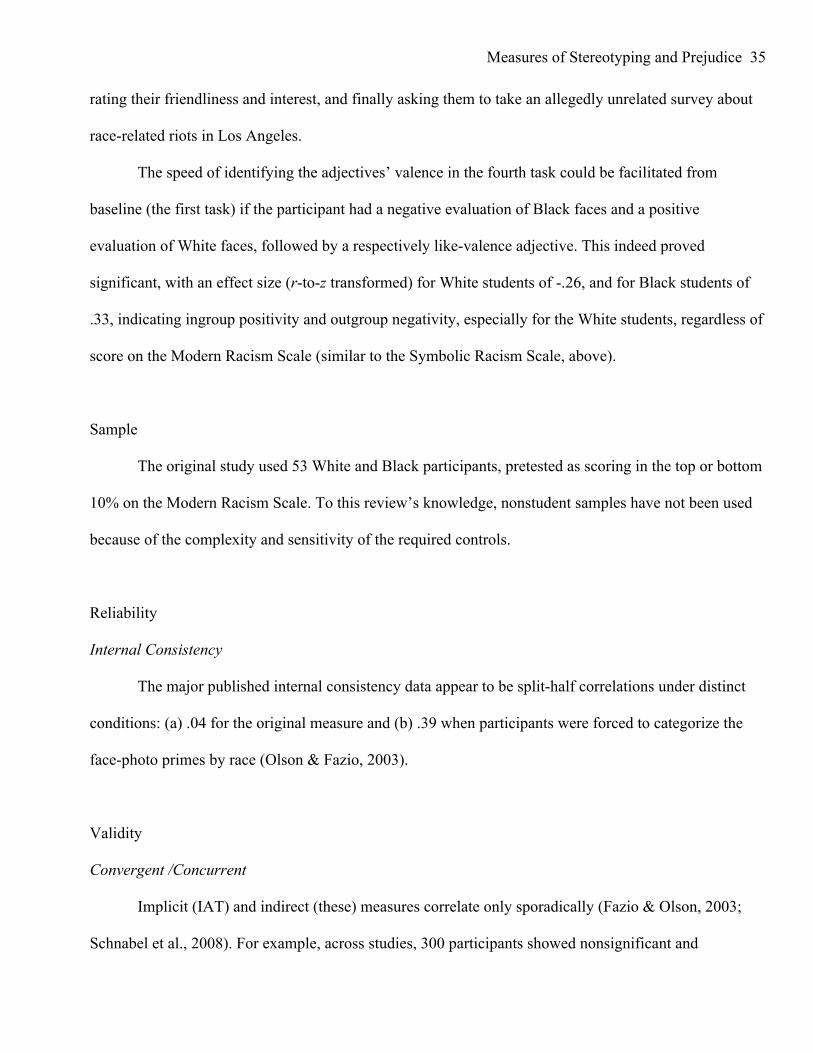
The speed of identifying the adjectives’ valence in the fourth task could be facilitated from
baseline (the first task) if the participant had a negative evaluation of Black faces and a positive
evaluation of White faces, followed by a respectively like-valence adjective. This indeed proved
significant, with an effect size (r-to-z transformed) for White students of -.26, and for Black students of
.33, indicating ingroup positivity and outgroup negativity, especially for the White students, regardless of
score on the Modern Racism Scale (similar to the Symbolic Racism Scale, above).
Sample
The original study used 53 White and Black participants, pretested as scoring in the top or bottom
10% on the Modern Racism Scale. To this review’s knowledge, nonstudent samples have not been used
because of the complexity and sensitivity of the required controls.
Reliability
Internal Consistency
The major published internal consistency data appear to be split-half correlations under distinct
conditions: (a) .04 for the original measure and (b) .39 when participants were forced to categorize the
face-photo primes by race (Olson & Fazio, 2003).
Validity
Convergent /Concurrent
Implicit (IAT) and indirect (these) measures correlate only sporadically (Fazio & Olson, 2003;
Schnabel et al., 2008). For example, across studies, 300 participants showed nonsignificant and
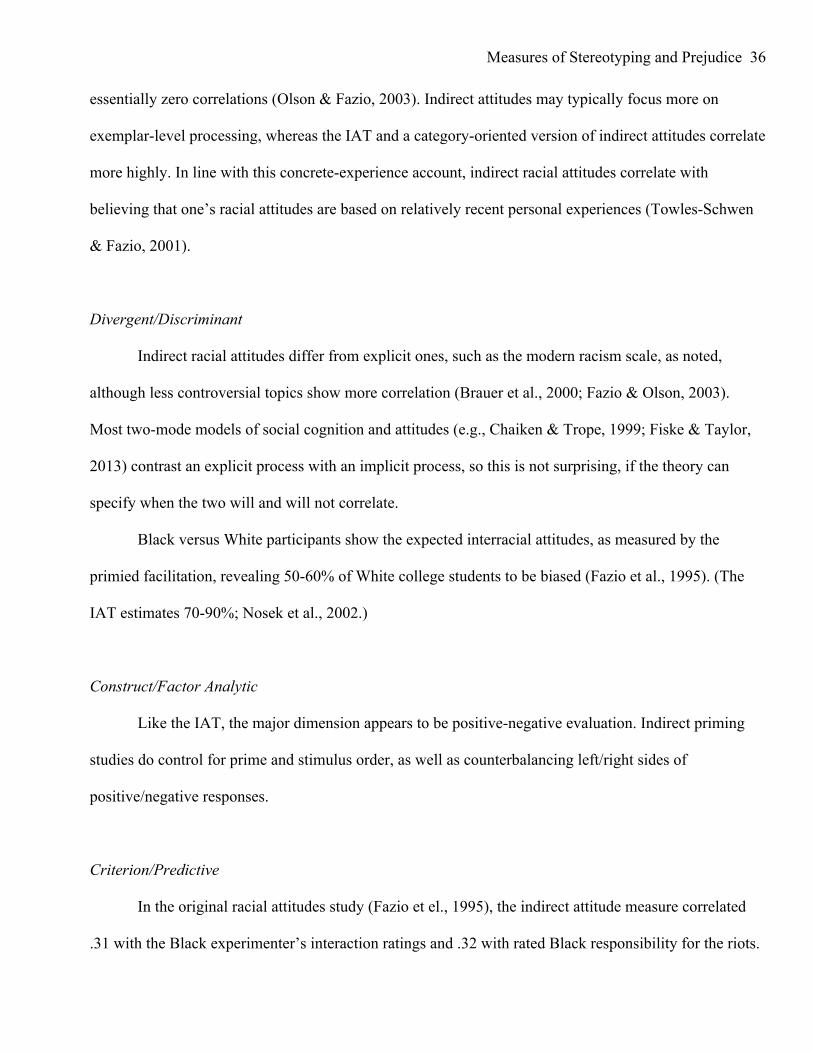
Measures of Stereotyping and Prejudice 36 essentially zero correlations (Olson & Fazio, 2003). Indirect attitudes may typically focus more on
exemplar-level processing, whereas the IAT and a category-oriented version of indirect attitudes correlate
more highly. In line with this concrete-experience account, indirect racial attitudes correlate with
believing that one’s racial attitudes are based on relatively recent personal experiences (Towles-Schwen
& Fazio, 2001).
Divergent/Discriminant
Indirect racial attitudes differ from explicit ones, such as the modern racism scale, as noted,
although less controversial topics show more correlation (Brauer et al., 2000; Fazio & Olson, 2003).
Most two-mode models of social cognition and attitudes (e.g., Chaiken & Trope, 1999; Fiske & Taylor,
2013) contrast an explicit process with an implicit process, so this is not surprising, if the theory can
specify when the two will and will not correlate.
Black versus White participants show the expected interracial attitudes, as measured by the
primied facilitation, revealing 50-60% of White college students to be biased (Fazio et al., 1995). (The
IAT estimates 70-90%; Nosek et al., 2002.)
Construct/Factor Analytic
Like the IAT, the major dimension appears to be positive-negative evaluation. Indirect priming
studies do control for prime and stimulus order, as well as counterbalancing left/right sides of
positive/negative responses.
Criterion/Predictive
In the original racial attitudes study (Fazio et el., 1995), the indirect attitude measure correlated
.31 with the Black experimenter’s interaction ratings and .32 with rated Black responsibility for the riots.
Measures of Stereotyping and Prejudice 37 In contrast, the Modern Racism Scale correlated with Black responsibility and with rated (un)fairness of
the Rodney-King trial verdict, as well as rated (un)attractiveness of the Black photos, but not with the
interaction ratings.
Subsequent research shows indirect racial-attitude measures predicting longevity of interracial
roommate relationships (Towles-Schwen & Fazio, 2006), affective reactions to expressed prejudice
(Fazio & Hilden, 2001), use of racial categories (Fazio & Dunton, 1997), and for certain level of
motivation to control prejudice, anticipated comfort in cross-racial interaction (Towles-Schwen & Fazio,
2003) (see Fazio & Olson, 2003, for others related to this and similar indirect attitudes measures).
Location
Fazio, R. H., Jackson, J. R., Dunton, B. C., & Williams, C. J. (1995). Variability in automatic activation
as an unobtrusive measure of racial attitudes: A bona fide pipeline? Journal of Personality and
Social Psychology, 69(6), 1013-1027.
Olson, M. A., & Fazio, R. H. (2009). Implicit and explicit measures of attitudes: The perspective of the
MODE model. In R. E. Petty, R. H. Fazio, & P. Briñol (Eds.), Attitudes: Insights from the new
implicit measures (pp. 19-63). New York, NY: Psychology Press.
Results and Comments
Indirect priming methods have the advantage of being less obvious to participants, but the
disadvantage of being more difficult to export outside the well-controlled laboratory. Nevertheless, this
technique adds critical evidence to individual differences in the spontaneity of ingroup-positive and
outgroup-negative evaluative associations. Also developed in the context of correlating attitudes with
behavior, it has useful predictive validity.
Measures of Stereotyping and Prejudice 38
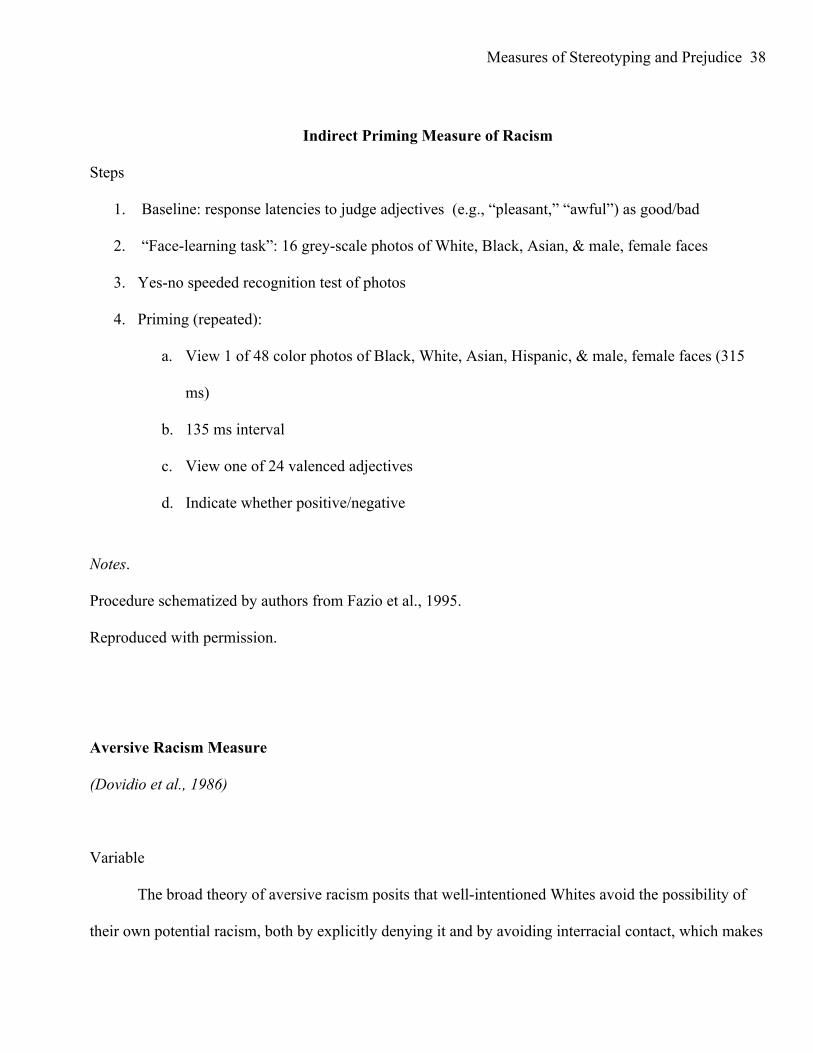
Indirect Priming Measure of Racism
Steps
1. Baseline: response latencies to judge adjectives (e.g., “pleasant,” “awful”) as good/bad
2. “Face-learning task”: 16 grey-scale photos of White, Black, Asian, & male, female faces
3. Yes-no speeded recognition test of photos
4. Priming (repeated):
a. View 1 of 48 color photos of Black, White, Asian, Hispanic, & male, female faces (315
ms)
b. 135 ms interval
c. View one of 24 valenced adjectives
d. Indicate whether positive/negative
Notes.
Procedure schematized by authors from Fazio et al., 1995.
Reproduced with permission.
Aversive Racism Measure
(Dovidio et al., 1986)
Variable
The broad theory of aversive racism posits that well-intentioned Whites avoid the possibility of
their own potential racism, both by explicitly denying it and by avoiding interracial contact, which makes
Measures of Stereotyping and Prejudice 39 them uncomfortable, but only when they can find a nonracial excuse for avoidance (e.g., Gaertner &
Dovidio, 1986). Most relevant to measurement is the associated priming measure, perhaps the earliest
latency measure of racism, but relevant here because, like the indirect priming measure, it was not
covered in either earlier edition of this volume (Robinson et al., 1991, 1999). In this measure, Whites
have to identify words and nonword letter strings as words or nonwords; they are faster to identify
positive traits (“smart”) as words when primed with “Whites” than with “Blacks” (Dovidio et al., 1986;
Gaertner & McLaughlin, 1983; Perdue et al., 1990). Ingroup positivity effects can be separated from
outgroup negativity effects, unlike the standard IAT, and ingroup favoritism proves stronger.
Description
In one illustrative case (Dovidio et al., 1986; see below), male and female undergraduates were
told to think about the typical member of the primed category on practice trials using male, female, and
house. Then, on the main task, having thought about typical members of the categories “black,” “white,”
or “house,” participants were primed for 2 secs with “black,” “white,” or “house,” and after .5 secs, had
to answer whether each of 16 adjectives, yes, “could ever be true” of or no, were “always false” about the
primed category. Of the test words, eight referred solely to objects (drafty, metallic), and eight were
racially stereotypic: White positive (ambitious, practical), Black positive (musical, sensitive), White
negative (conventional, stubborn), and Black negative (lazy, imitative). Each term was paired twice with
each prime, for a total of 96 trials. Stereotypic associations were faster. These methods and results
resemble contemporaneous work (Gaertner & McLaughlin, 1983; Perdue et al., 1990).
Sample
In the above illustrative example, 36 undergraduates participated. To our knowledge, nonstudent
samples have not been used because of the complexity and sensitivity of the required controls.
Measures of Stereotyping and Prejudice 40
Reliability
Test-Retest
Using both more and different race-related primes (stereotypic adjectives), as well as more and
different racial stimuli (yearbook photos), a Black-White categorization task elicited rapid, racial
associations that recurred reliably over times from one hour to two weeks (r averaging .51). A subliminal
variation showed similar stability over a three-week period (Kawakami & Dovidio, 2001).
Validity
Divergent/Discriminant
Dovidio et al. (1986) matched items across race for consensus and favorability, and the nature of
the response to Black and White stereotypic adjective was held constant (“yes,” “could ever be true”), so
as to unconfound race and the nature of the response. The sides for the yes-no keys were
counterbalanced. In many of the relevant studies, categorization errors (typically fewer than 3-5%) and
response times more than three standard deviations above the mean are eliminated.
Having just introduced indirect priming, a comparison of the tasks is in order. They are similar in
that both present racial primes. They differ in the target after the prime and in the required response. In
the aversive racism measure, ingroup-outgroup primes precede positive-negative racially stereotypic
words as targets. Control words are sometimes nonhuman object-related words or a meaningless string of
letters, with respectively an ever-true/never-true decision or a word/nonword decision, each speeded by
matches between racial primes and relevant stereotypic words. Here, conceptual meaning (as well as
valence) matters.
In the just-covered indirect-prime measure, the prime precedes a target word unrelated to race,
merely positive or negative, to which the required response is good-bad. Here, only evaluative match
Measures of Stereotyping and Prejudice 41 matters. Conceptual and evaluative priming do indeed differ (Wittenbrink et al., 2001a). For example,
conceptual biases include stereotyping, judgment, and impressions, whereas evaluative biases include
affect, preferences, and social distance (Amodio & Devine, 2006).
Although evaluation is a critical dimension, the primary aversive-racism dimension appears to
differentiate racial ingroup-outgroup, as these effects are independent (e.g., Dovidio et al., 1986).
Criterion/Predictive
This kind of priming measure tends to predict nonverbal behavior in interracial interactions
(Dovidio, Gaertner et al., 2002; Dovidio, Kawakami et al., 2002; Dovidio et al., 1997). (Overt attitudes
predict overt verbal behavior.) Priming measures also predict selection biases, especially in ambiguous
cases (Dovidio & Gaertner, 2000; Dovidio, Gaertner et al., 2002).
Location
Dovidio, J. F., Evans, N., & Tyler, R. B. (1986). Racial stereotypes: The contents of their cognitive
representations. Journal of Experimental Social Psychology, 22(1), 22–37.
Results and Comments
Each of the response-time measures (IAT, evaluative priming, conceptual priming) contributes to
the evidence for barely-conscious racial ingroup favoritism and sometimes outgroup dis-favoritism. Each
has acceptable psychometric properties, so the choice to use them depends on the researcher’s purposes.
Focused on different levels, the IAT may operate more categorically, the indirect priming measure more
evaluatively, and the aversive racism measure more as ingroup-outgroup distinction.
Measures of Stereotyping and Prejudice 42
Aversive Racism Measure
Steps
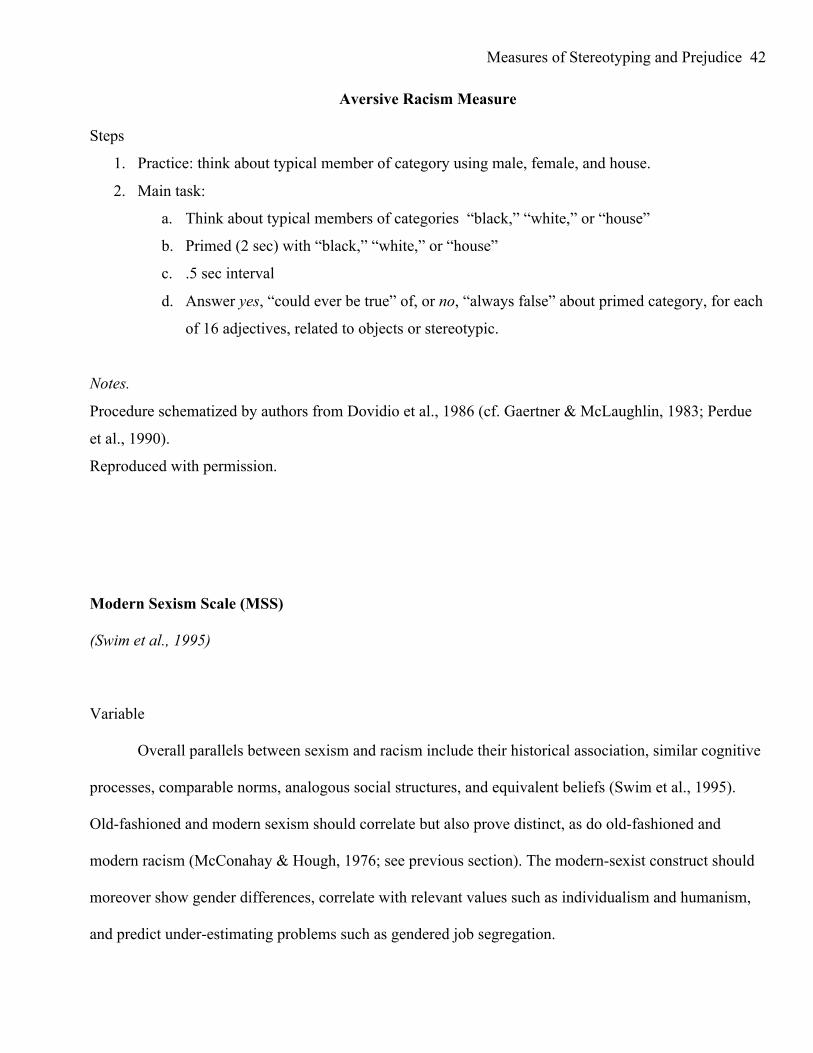
1. Practice: think about typical member of category using male, female, and house.
2. Main task:
a. Think about typical members of categories “black,” “white,” or “house”
b. Primed (2 sec) with “black,” “white,” or “house”
c. .5 sec interval
d. Answer yes, “could ever be true” of, or no, “always false” about primed category, for each
of 16 adjectives, related to objects or stereotypic.
Notes.
Procedure schematized by authors from Dovidio et al., 1986 (cf. Gaertner & McLaughlin, 1983; Perdue
et al., 1990).
Reproduced with permission.
Modern Sexism Scale (MSS)
(Swim et al., 1995)
Variable
Overall parallels between sexism and racism include their historical association, similar cognitive
processes, comparable norms, analogous social structures, and equivalent beliefs (Swim et al., 1995).
Old-fashioned and modern sexism should correlate but also prove distinct, as do old-fashioned and
modern racism (McConahay & Hough, 1976; see previous section). The modern-sexist construct should
moreover show gender differences, correlate with relevant values such as individualism and humanism,
and predict under-estimating problems such as gendered job segregation.
Measures of Stereotyping and Prejudice 43
Description
Participants completed a packet of racism questionnaires and an unspecified number of items
designed to reflect old-fashioned and modern sexism on 5-point strongly-agree to strongly-disagree
Likert-type response scales.
Sample
Psychology undergraduates (n= 418 women, 265 men; mostly White) completed the first study. A
second study (n= 477 women, 311 men) replicated the confirmatory factor analysis. Subsequent work has
generalized somewhat from the original American student samples. Good results obtain with Canadian
college students (25% non-European origin; Campbell et al., 1997), German students (Eyssel & Bohner,
2007), Swedish students (Akrami et al., 2011), Dutch students (Barreto & Ellemers, 2005), and
nonstudent German women (Becker & Wagner, 2009), but more variable results with a small sample
(n=46) of female White and Black firefighters (Yoder & McDonald, 1997), which obtained some
sporadic item correlations with race, education, and age (not corrected for large numbers of correlations
calculated). Both older and more educated nonstudent women rejected modern sexism more than did
younger and less educated ones in a larger German sample (n=250; Becker & Wagner, 2009).
Reliability
Internal Consistency
In both the original studies (Swim et al., 1995), Cronbach alpha coefficients were reported for
both modern (.84, .75) and old-fashioned (.66, .65) sexism. In subsequent modern sexism studies, alpha
coefficients were comparable (.84, Becker & Wagner, 2009; .80, Eyssel & Bohner, 2007; .78, Swim et
Measures of Stereotyping and Prejudice 44 al., 2005; .65, Campbell et al., 1997) or lower (.08, Yoder & McDonald, 1997, although testing
conditions were less than ideal: mailed surveys, 1-2 years after an initial survey).
Validity
Convergent/Concurrent
MSS correlates moderately with hostile sexism (.31) and benevolent sexism (.42), described
below, as well as traditional gender-role preference (.30) (Becker & Wagner, 2009). Modern sexism and
the Attitudes toward Women Scale (AWS; Spence et al., 1973) do correlate (phi = .35 for men, .48 for
women; Swim & Cohen, 1997). But MSS operates at a more subtle level than the AWS’s blatant self-
report, the MSS instead correlating better, for example, with judged sexual harassment (.18-.50,
controlling for gender; Swim & Cohen, 1997). MSS correlates as part of a package of measures that
indicate acceptance of stereotyping, dominance, authoritarianism, traditional roles, unemotional
processing, and more fixed, uncomplicated cognitive style, all more true for White and male participants
than Black and female ones (Table 3, Carter et al., 2006). Big-five personality traits agreeableness and
openness to experience also relate to MSS (Akrami et al., 2011).
Divergent/Discriminant
As indicated, modern sexism diverges from the more blatant forms of sexism. For example, MSS
loads separately from both AWS and old-fashioned sexism in a factor analysis (Swim & Cohen, 1997).
The mean judged sexism of items on such measures indicate their degree of overt sexism (Swim et al.,
2005): beliefs from the AWS are the highest on rated overt sexism, followed by traditional gender role
behaviors, actively hostile sexist beliefs, benevolent sexist beliefs (see below), unwanted sexual attention,
and MSS items as the least obviously sexist.
Measures of Stereotyping and Prejudice 45
In the original study (Swim et al., 1995), modern sexism correlates negatively with egalitarian
values by female (-.29) and male (-.16) respondents, as does old-fashioned sexism (-.16, -.29,
respectively). Individualistic values do not correlate with either form of sexism for either gender (-.01-
.08), except for men on MS (.19).
In both original studies (Swim et al., 1995), men scored higher than women on both old-fashioned
and modern sexism. Progressive, gender-identified women score lower than women more traditionally
identified or less identified overall (Becker & Wagner, 2009). All other studies that assess both genders
report men scoring higher than women on modern sexism.
Social desirability does not correlate with MSS (.08, Campbell et al., 1997).
Construct/Factor Analytic
Exploratory principal components analysis eliminated several items double-loading on both the
intended modern and old-fashioned dimensions, resulting in eight modern sexism items (five for denial of
continuing sexism, two for antagonism toward women's demands, and one for resentment of special
favors for women; see scale below). All the eliminated double-loading items came from the second two
components of the scale. A confirmatory factor analysis on the selected items showed by several indices
that a two factor-solution fit better than a one-factor solution, separately by gender and for the combined
sample.
Most of the published work differentiates subtle modern sexism from old-fashioned sexism and
other more blatant measures, such as the AWS (Swim et al., 1995; Swim & Golden, 1997; but see Yoder
& McDonald, 1997). Some finds MSS having one dimension, whereas others find two dimensions,
separating beliefs about current discrimination and gender-equality policy (Morrison et al., 1999).
Criterion/Predictive
Measures of Stereotyping and Prejudice 46
In the original study (Swim et al., 1995), although all respondents over-estimated the percentage
of women in male-dominated fields, high versus low MSS scores predicted additional over-estimation of
women’s percentage in gender-segregated “male” jobs (unexpectedly, the reverse pattern held for old-
fashioned sexism). In the second study, MSS predicted lower ratings of gendered job segregation as
caused by gender prejudice, tradition, and socialization, but higher ratings for biology as a cause. Old-
fashioned sexism did not show these patterns. MSS also predicted preferring a then-current male Senate
candidate over the female one, whereas old-fashioned sexism and respondent gender did not. MSS
predicts less collective feminist action (r = .40, Becker & Wagner, 2009), judging everyday sexist
behaviors as less sexist (-.35, Swim et al., 2005), less positive attitudes toward gay and lesbian people
(.26, Campbell et al., 1997), less support for the women’s movement (-.53, Campbell et al., 1997), as
well as expressing more gender harassment and gender bias (in experimental simulation, Hitlan et al.,
2009), more appreciation of sexist humor (.34 to .44, Eyssel & Bohner, 2007), and both more use and
detection of sexist language (.44, Parks & Roberton, 2004; Swim et al., 2004).
Location
Swim, J. K., Aikin, K. J., Hall, W. S., & Hunter, B. A. (1995). Sexism and racism: Old-fashioned and
modern prejudices. Journal of Personality and Social Psychology, 68(2), 199-214.
Results and Comments
One of the first next-generation sexism scales, the modern sexism scale is especially useful for its
links to political, employment, and harassment attitudes. It shows good cross-cultural applicability and
good psychometric properties, especially predictive validity of gender-related attitudes.
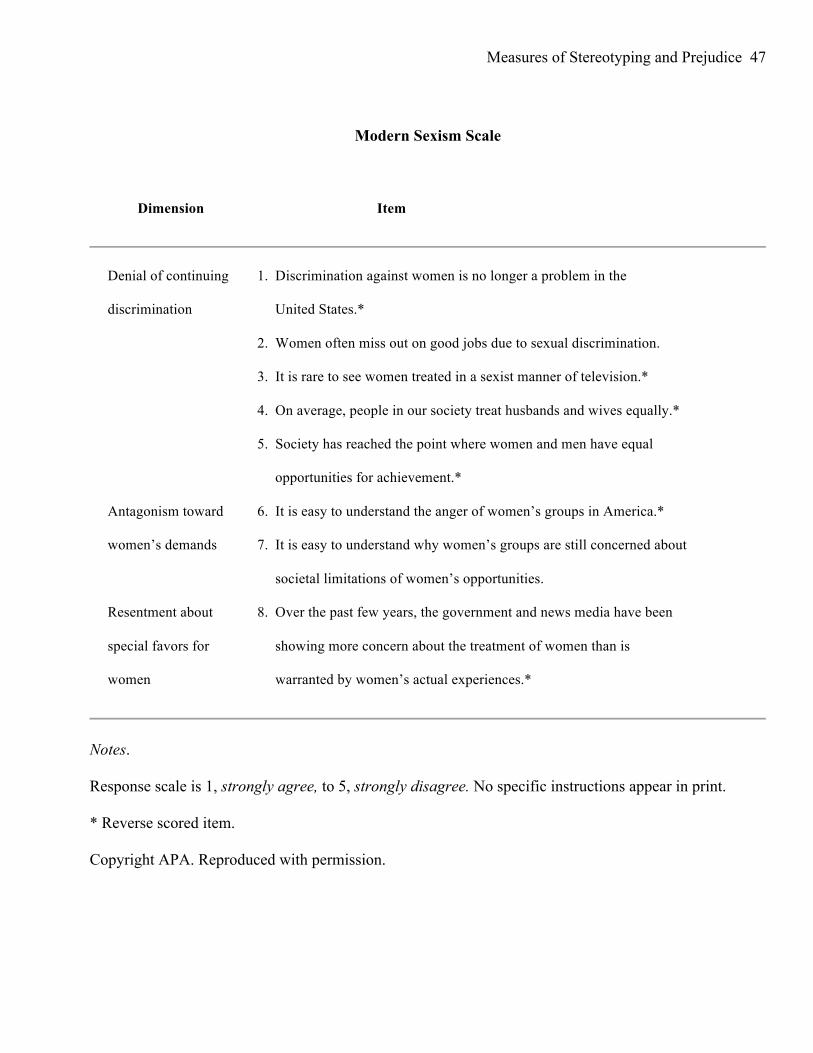
Measures of Stereotyping and Prejudice 47
Modern Sexism Scale
Dimension Item
Denial of continuing 1. Discrimination against women is no longer a problem in the
discrimination United States.*
2. Women often miss out on good jobs due to sexual discrimination.
3. It is rare to see women treated in a sexist manner of television.*
4. On average, people in our society treat husbands and wives equally.*
5. Society has reached the point where women and men have equal
opportunities for achievement.*
Antagonism toward 6. It is easy to understand the anger of women’s groups in America.*
women’s demands 7. It is easy to understand why women’s groups are still concerned about
societal limitations of women’s opportunities.
Resentment about 8. Over the past few years, the government and news media have been
special favors for showing more concern about the treatment of women than is
women warranted by women’s actual experiences.*
!
Notes.
Response scale is 1, strongly agree, to 5, strongly disagree. No specific instructions appear in print.
* Reverse scored item.
Copyright APA. Reproduced with permission.
Measures of Stereotyping and Prejudice 48
Neosexism Scale (NS)
(Tougas et al., 1995)
Variable
The conceptual background for the NS is the same parallel to modern racism as the MSS
proposes, but with an added emphasis on reactions to affirmative action as a function of men’s collective
interest.
Description
The original study (Tougas et al., 1995) adapted items from modern, symbolic, and aversive
racism measures (above).
Sample
The original sample comprised 130 male French- and English-speaking Canadian undergraduates.
Going beyond student samples, reliability and predictive validity are comparable to the original student
sample. Study 2 of that paper (Tougas et al., 1995) contacted 281 male workers at a large Canadian firm,
with 149 returning questionnaires. Another study successfully used the scale among female secretaries at
a Canadian federal agency (Tougas et al., 1999). Besides the original French and English Canadian
samples, neosexism scales and translations have been run in, for example, Australia, Belgium, Croatia,
Slovenia, Spain, Turkey, and United States samples (Dardenne et al., 2006; Frieze et al., 2003; Moya et
al., 2003).
Reliability
Measures of Stereotyping and Prejudice 49 Internal Consistency
Cronbach alpha coefficients have been reported (e.g., Tougas et al., 1995, for original two studies
.78 and .76; Cameron, 2001, .80; Campbell et al., 1997, .76).
Test-Retest
The test-retest coefficient in the original sample was .84 over a time interval of one month
(Tougas et al., 1995).
Validity
Convergent/Concurrent
The original two studies reported significant positive correlations with old-fashioned sexism (.64,
Study 1 only), men’s collective interest (.50, .18), negative reactions to affirmative action (-.48, -.33), and
negative judgments of women’s competence (-.35, Study 2 only). Neosexism correlates with hostile
sexism (.52 to .81 in three samples (Masser & Abrams, 1999).
Divergent/Discriminant
Neosexism and subjectively benevolent sexism (see below) do not correlate consistently (-.04 to
.48 across genders and samples; Masser & Abrams, 1999). NS does not correlate with social desirability
(.08, Campbell et al., 1997). Men score higher than women (e.g., Cameron, 2001; Campbell et al., 1997;
Frieze et al., 2003). Item order was varied on the original studies, and 2 of 11 items are reverse-scored.
Construct/Factor Analytic
The original study reports that an exploratory, principal-components analysis resulted in “no
definite structure” (p. 845), suggesting a single-dimension scale.
Measures of Stereotyping and Prejudice 50
Criterion/Predictive
As with the modern sexism scale, neosexism correlates with accepting sexist language (.53),
mediating gender differences (Parks & Roberton, 2004). Neosexism also predicts: less feminist-
movement support, negative attitudes toward lesbians and gay men, lower humanitarian-egalitarian
values (respectively, -.52, .41, -.22, Campbell et al., 1997); negative attitudes toward women’s rights (-
.56; Masser & Abrams, 1999), negative attitudes toward lesbians’ and gay men’s rights (-,40; Masser &
Abrams, 1999); negative attitudes toward humanitarian-egalitarian values (-.21; Masser & Abrams,
1999); negative attitudes toward affirmative action (beta = -.24, Tougas et al., 1999); as well as perceived
discrimination against own-group gender, higher for high-scoring men (.20) but lower instead for high-
scoring women (-.41, Cameron, 2001). The more women felt their gender group was deprived, the less
they personally endorsed neosexism items (-.18, Tougas et al., 1999). For women, NS correlates with
lower ingroup ties and affect (-.25, -.29, Cameron, 2001); men show no such relationship. Men score
more highly on NS when they feel threatened (.45), view women as intrusive (.24), and estimate higher
percentages of women in their job class (.25); neosexism then correlates with pro-male bias in evaluating
women's and men's competence (.41), as well as unwillingness to support women (-.35, Beaton et al.,
1996).
Location
Tougas, F., Brown, R., Beaton, A. M., & Joly, S. (1995). Neosexism: Plus ça change, plus c'est pareil.
Personality and Social Psychology Bulletin, 21(8), 842-849.
Results and Comments
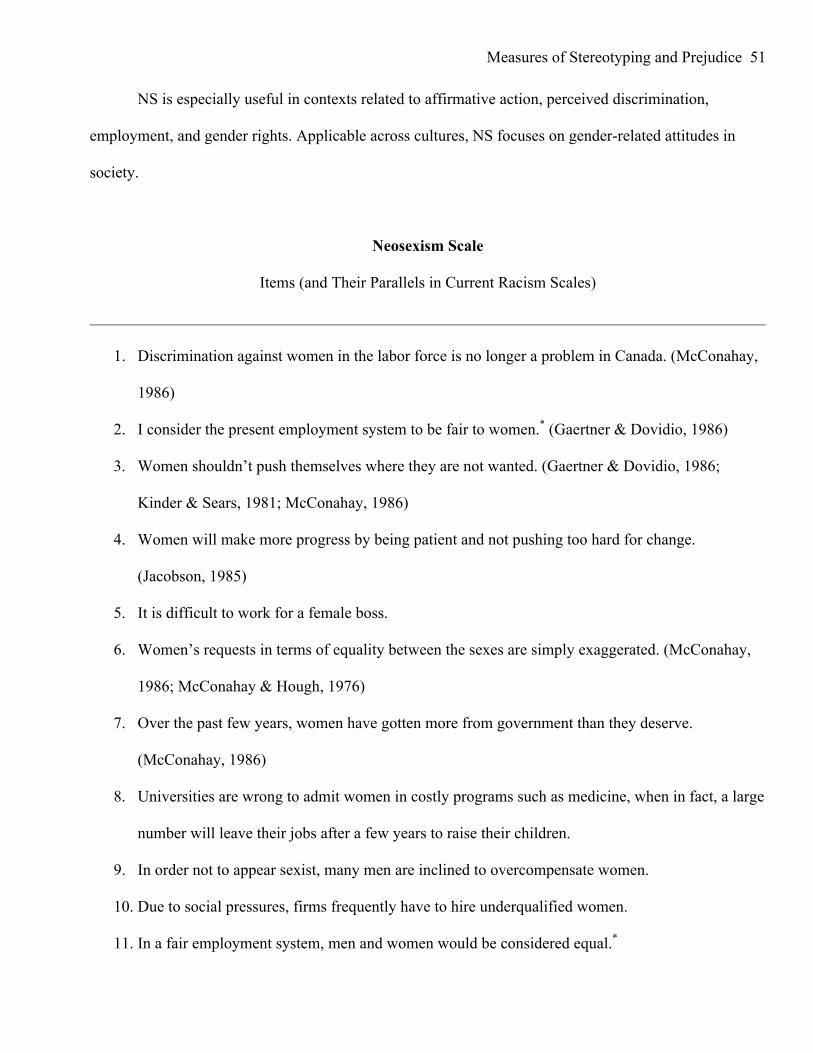
Measures of Stereotyping and Prejudice 51
NS is especially useful in contexts related to affirmative action, perceived discrimination,
employment, and gender rights. Applicable across cultures, NS focuses on gender-related attitudes in
society.
Neosexism Scale
Items (and Their Parallels in Current Racism Scales)
1. Discrimination against women in the labor force is no longer a problem in Canada. (McConahay,
1986)
2. I consider the present employment system to be fair to women.* (Gaertner & Dovidio, 1986)
3. Women shouldn’t push themselves where they are not wanted. (Gaertner & Dovidio, 1986;
Kinder & Sears, 1981; McConahay, 1986)
4. Women will make more progress by being patient and not pushing too hard for change.
(Jacobson, 1985)
5. It is difficult to work for a female boss.
6. Women’s requests in terms of equality between the sexes are simply exaggerated. (McConahay,
1986; McConahay & Hough, 1976)
7. Over the past few years, women have gotten more from government than they deserve.
(McConahay, 1986)
8. Universities are wrong to admit women in costly programs such as medicine, when in fact, a large
number will leave their jobs after a few years to raise their children.
9. In order not to appear sexist, many men are inclined to overcompensate women.
10. Due to social pressures, firms frequently have to hire underqualified women.
11. In a fair employment system, men and women would be considered equal.*
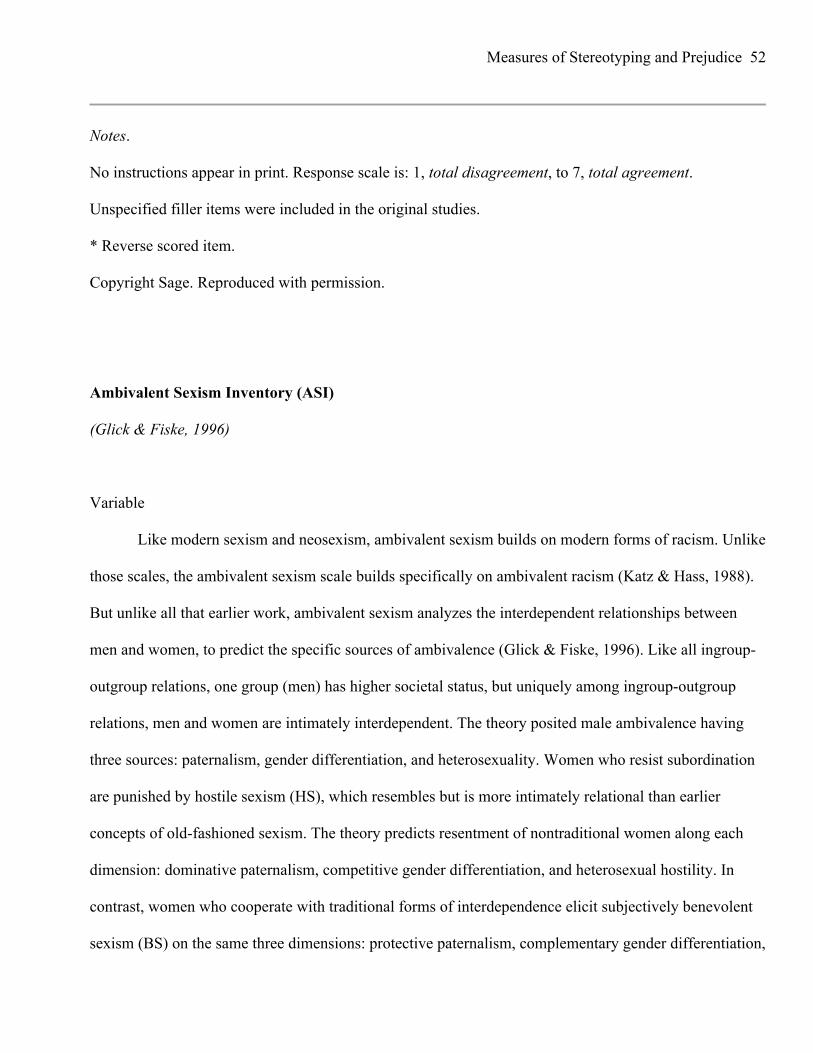
Measures of Stereotyping and Prejudice 52
Notes.
No instructions appear in print. Response scale is: 1, total disagreement, to 7, total agreement.
Unspecified filler items were included in the original studies.
* Reverse scored item.
Copyright Sage. Reproduced with permission.
Ambivalent Sexism Inventory (ASI)
(Glick & Fiske, 1996)
Variable
Like modern sexism and neosexism, ambivalent sexism builds on modern forms of racism. Unlike
those scales, the ambivalent sexism scale builds specifically on ambivalent racism (Katz & Hass, 1988).
But unlike all that earlier work, ambivalent sexism analyzes the interdependent relationships between
men and women, to predict the specific sources of ambivalence (Glick & Fiske, 1996). Like all ingroup-
outgroup relations, one group (men) has higher societal status, but uniquely among ingroup-outgroup
relations, men and women are intimately interdependent. The theory posited male ambivalence having
three sources: paternalism, gender differentiation, and heterosexuality. Women who resist subordination
are punished by hostile sexism (HS), which resembles but is more intimately relational than earlier
concepts of old-fashioned sexism. The theory predicts resentment of nontraditional women along each
dimension: dominative paternalism, competitive gender differentiation, and heterosexual hostility. In
contrast, women who cooperate with traditional forms of interdependence elicit subjectively benevolent
sexism (BS) on the same three dimensions: protective paternalism, complementary gender differentiation,
Measures of Stereotyping and Prejudice 53 and heterosexual intimacy. Together hostile and benevolent sexism form a coherent ideology that
punishes some women and rewards others, so they co-exist.
Description
The original survey used 140-items about “attitudes toward men and women and their
relationships in contemporary society.” Items were designed to tap the six theorized dimensions. Items
with extreme means or low variance were deleted, leaving 112 items, further selected by exploratory and
confirmatory factor analyses (including ones on new samples). Finally, three additional principles guided
paring items down to the 22 items in the ASI (11 HS, 11 BS; see below): (a) the items that highly and
consistently loaded on HS and BS factors in men’s and women’s separate factor analyses, (b) diversity
across various aspects of sexism, and (c) consistent item performance in later studies (Glick & Fiske,
1996).
Sample
The first of six original studies sampled 833 students (480 women; 76%–86% White) at three
colleges (Amherst College, Lawrence University, University of Massachusetts at Amherst). Across about
two-dozen countries, tens of thousands of respondents have completed the ASI in their own languages
(Glick et al., 2000, 2004), as well as nonstudent samples in the original studies (Glick & Fiske, 1996) and
subsequent ones (e.g., Belgium: Roets et al., 2012; Sweden: Zakrisson et al., 2012). In the first cultural
comparison across 19 nations (Glick et al., 2000), 15,000 men and women showed that HS and BS
correlate positively across nations, as well as demonstrating other forms of validity (below).
Reliability
Internal consistency
Measures of Stereotyping and Prejudice 54
In the original six studies, Cronbach alpha coefficients for the overall scale ranged from .83 to
.92, for the HS subscale ranged from .80 to .92, and for BS ranged from .73 to .85. Other researchers
have obtained comparable results (e.g., in Germany, respectively, .88, .84, .88; Eyssel & Bohner, 2007).
Likewise, Sakalli-Uğurlu (2002) reported a Cronbach alpha coefficient of .85.
Test-Retest
To this review’s knowledge, the only test-retest reliability was assessed in Turkish in a Turkish
sample, where the stability coefficient was .87 (Sakalli-Uğurlu, 2002).
Validity
Convergent/Concurrent
The ASI correlates with other measures of sexism, but as would be expected, HS especially
correlates with AWS (.68), old-fashioned sexism (.48), MSS (.65), and rape-myth acceptance (.61), even
controlling for social desirability or BS. In contrast, BS, controlling for HS, does not (-.03, -.04, Glick &
Fiske, 1996). HS also correlates with NS (.52 to .81 in three samples, Masser & Abrams, 1999). ASI,
especially HS, likewise correlates with modern racism (MRS with ASI .38 to .51, HS controlling for BS
.35 to .42, BS controlling for HS, .01 to .24, Glick & Fiske, 1996). ASI tends to correlate with acceptance
of stereotyping in a variety of ways: measures across groups, authoritarianism, SDO, fixed and
uncomplicated cognitive style (Carter et al., 2006, Table 3; Glick & Fiske, 1996, Tables 11-14).
Recognition of racial discrimination correlates with HS and less so with BS.
Divergent/Discriminant
Measures of Stereotyping and Prejudice 55
From the outset, men have scored higher on the ASI, especially on HS, but also on BS (Glick &
Fiske, 1996; Glick et al., 2000). Women especially reject HS relative to men in more sexist cultures.
Highly gender-identified women especially reject both ASI subfactors (Becker & Wagner, 2009).
Only the BS subfactor captures the subjectively benevolence of protective, complementary,
intimate sexism, according to Masser and Abrams (1999).
The ASI has 6 out of 22 items reverse-scored. The social-desirability self-deception scale does not
correlate with the overall scale, with HS, or with BS (-.01-.07, Glick & Fiske, 1996). ASI correlates
weakly (.26-.31) with its impression-management subscale, but that reduces (.13-.18) when isolating the
unique variance of HS and BS, each controlling for the other.
Construct/Factor Analytic
From the outset, the ASI most consistently shows two correlated but distinct primary dimensions,
HS and BS, with BS breaking down into the three predicted subfactors (complementary gender
differentiation, heterosexual intimacy, and protective paternalism), but with HS remaining a single
dimension (Glick & Fiske, 1996, 2001, 2011). In the original studies, after the initial study to select items
(above), the two-factor model fit five samples’ confirmatory factor analyses better than the single-factor
model. The full model (with three BS subfactors) yielded acceptable fit indices. Altogether, ASI research
consistently shows that BS and HS correlate positively, but not redundantly, often in the .4 to .5 range
across individual respondents (Glick & Fiske, 1996, 2001, 2011). The ASI’s 2-factor structure (HS and
BS) replicates over a diverse array of nations. Across cultures, the HS-BS correlations within nations
suggest a coherent sexist cultural ideology, yielding correlations approaching .9 (Glick et al., 2000,
2004).
Criterion/Predictive
Measures of Stereotyping and Prejudice 56
In the original studies (Glick & Fiske, 1996, Tables 11-14), overall ASI scores predicted
ambivalent attitudes and stereotypes toward women, the HS scale correlating with negative ones, and the
BS scale (for nonstudent men) with subjectively positive ones. Cross-nationally (Glick et al., 2000), HS
predicts attributing to women negative stereotypes (median -.25, range -.12 to -.43) and BS attributing
positive ones (median .21, .11 to .33). HS and BS apparently represent complementary ideologies
supporting gender inequality, given that national averages on both scales predict United Nations’ indices
of national gender inequality in structural power, resources, and outcomes (men’s HS, -.47, -.53; men’s
BS, -.40, -.43; women’s HS, .03, -.38; women’s BS, -.32, -.42; Glick et al., 2000).
In the context of other recent sexism scales, the unique feature of the ASI is the utility of its BS
dimensions, illustrated by BS predictive validity, independent of HS: Male BS predicts blaming a victim
of acquaintance rape if she violated feminine purity norms (Abrams et al., 2003). Male BS in China
predicts a preference for women returning to domestic duties (Li et al., 2012) and for preferring
submissive, home-oriented mates (Chen et al., 2009).
Even more so, women’s BS predicts system-maintaining ideology and behavior. Meta-analysis
(32 samples, half male, half female; n = 5,459) found high-BS women preferring high-resource partners
(.24, Sibley & Overall, 2011; replicated for Chinese women, Chen et al., 2009). High-BS women accept a
partner’s protective but sexist and restrictive paternalism (Moya et al., 2007), and also expect husbands to
react with threat and violence to a wife’s workplace success (Expósito et al., 2010). Women’s egalitarian
beliefs do in fact predict partner violence (Karakurt & Cumbie, 2012). Women expecting workplace BS
perform worse because of distracting intrusive thoughts about their own potential weakness (Dardenne et
al., 2007; Dumont et al., 2010). Priming BS activates women’s tendency to justify the existing system
and undermines their resisting inequality (Jost & Kay, 2005).
On the hostile side of the equation, meta-analysis indicates that men’s HS predicts preferences for
physically attractive partners (.20, Sibley & Overall, 2011). In China and the U.S., men’s HS predicts
Measures of Stereotyping and Prejudice 57 marriage norms favoring female subservience, male dominance, and acceptance of male violence (Chen
et al, 2009). Outside of marriage, HS, with its combative view of gender relations, predicts a variety of
dehumanizing reactions to sexualized (scantily clad) women: Men in general deny these women’s agency
but view them as objects of the male viewer’s actions, remembering their bodies but not their faces, and
high-HS men deactivate the brain’s social-cognition network (Cikara et al., 2011). Although ASI and BS
both predict appreciating sexist jokes (.38-.52, .28-.32), HS especially does so (.34-.54, Eyssel & Bohner,
2007).
Location
Glick P., & Fiske S. T. (1996). The Ambivalent Sexism Inventory: Differentiating hostile and benevolent
sexism. Journal of Personality and Social Psychology, 70(3), 491–512.
Results and Comments
The ASI appears uniquely to measure subjective benevolence in some aspects of sexism. Relative
to MSS and NS, ASI focuses on more intimate, relational aspects of sexism, consistent with its analysis
of male-female interdependence. Applicable across cultures, it shows good psychometric properties.
Ambivalent Sexism Inventory
Relationships between Men and Women
Below is a series of statements concerning men and women and their relationships in contemporary
society. Please indicate the degree to which you agree or disagree with each statement using the
following scale:
0 – disagree strongly; 1 – disagree somewhat; 2 – disagree slightly; 3 – agree slightly; 4 – agree
somewhat; 5 – agree strongly.
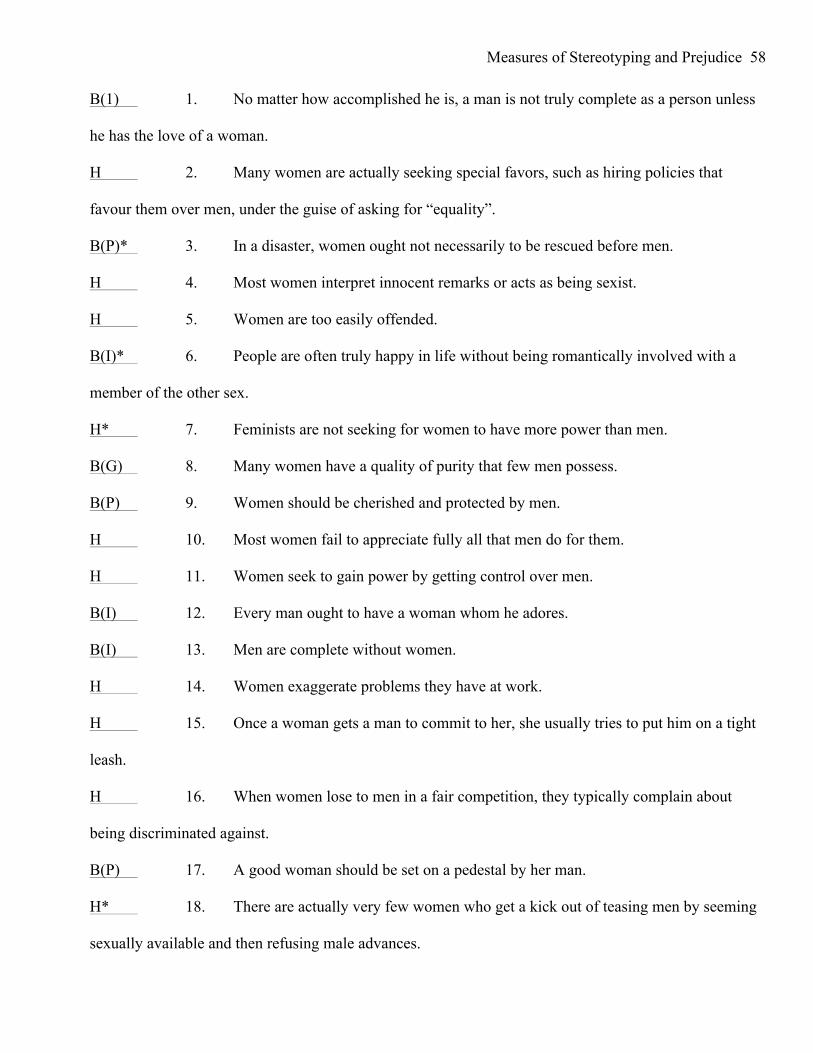
Measures of Stereotyping and Prejudice 58 B(1) 1. No matter how accomplished he is, a man is not truly complete as a person unless
he has the love of a woman.
H 2. Many women are actually seeking special favors, such as hiring policies that
favour them over men, under the guise of asking for “equality”.
B(P)* 3. In a disaster, women ought not necessarily to be rescued before men.
H 4. Most women interpret innocent remarks or acts as being sexist.
H 5. Women are too easily offended.
B(I)* 6. People are often truly happy in life without being romantically involved with a
member of the other sex.
H* 7. Feminists are not seeking for women to have more power than men.
B(G) 8. Many women have a quality of purity that few men possess.
B(P) 9. Women should be cherished and protected by men.
H 10. Most women fail to appreciate fully all that men do for them.
H 11. Women seek to gain power by getting control over men.
B(I) 12. Every man ought to have a woman whom he adores.
B(I) 13. Men are complete without women.
H 14. Women exaggerate problems they have at work.
H 15. Once a woman gets a man to commit to her, she usually tries to put him on a tight
leash.
H 16. When women lose to men in a fair competition, they typically complain about
being discriminated against.
B(P) 17. A good woman should be set on a pedestal by her man.
H* 18. There are actually very few women who get a kick out of teasing men by seeming
sexually available and then refusing male advances.
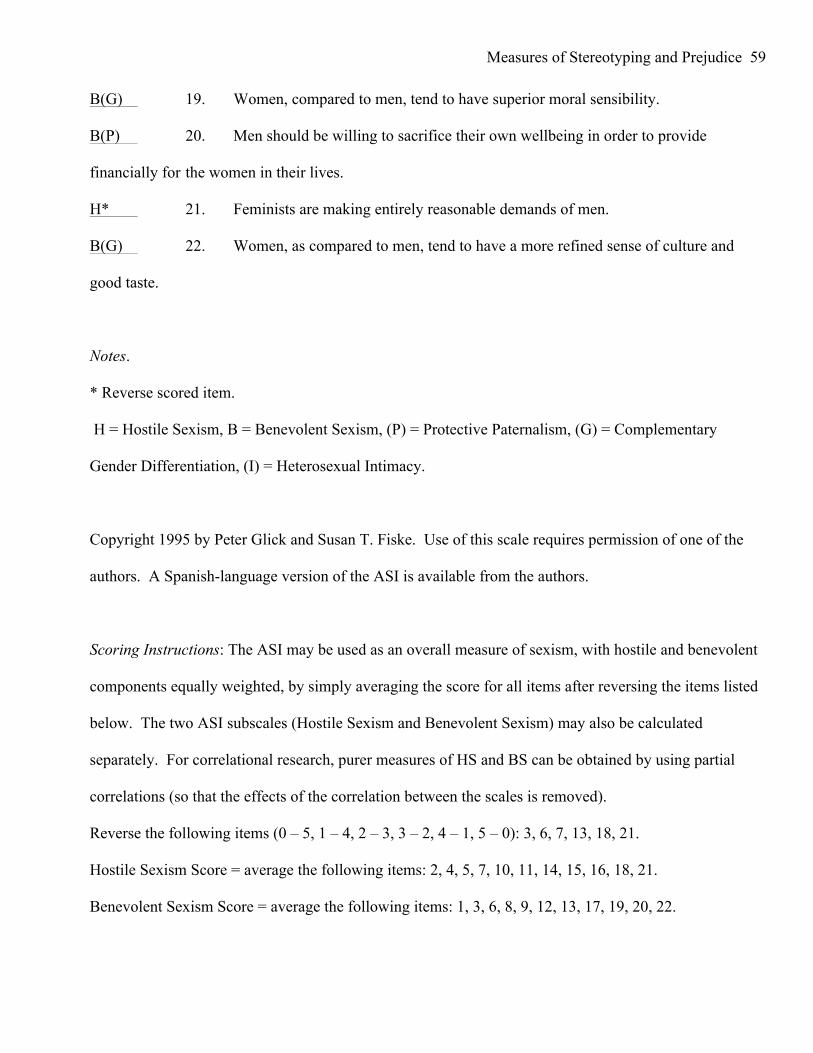
Measures of Stereotyping and Prejudice 59 B(G) 19. Women, compared to men, tend to have superior moral sensibility.
B(P) 20. Men should be willing to sacrifice their own wellbeing in order to provide
financially for the women in their lives.
H* 21. Feminists are making entirely reasonable demands of men.
B(G) 22. Women, as compared to men, tend to have a more refined sense of culture and
good taste.
Notes.
* Reverse scored item.
H = Hostile Sexism, B = Benevolent Sexism, (P) = Protective Paternalism, (G) = Complementary
Gender Differentiation, (I) = Heterosexual Intimacy.
Copyright 1995 by Peter Glick and Susan T. Fiske. Use of this scale requires permission of one of the
authors. A Spanish-language version of the ASI is available from the authors.
Scoring Instructions: The ASI may be used as an overall measure of sexism, with hostile and benevolent
components equally weighted, by simply averaging the score for all items after reversing the items listed
below. The two ASI subscales (Hostile Sexism and Benevolent Sexism) may also be calculated
separately. For correlational research, purer measures of HS and BS can be obtained by using partial
correlations (so that the effects of the correlation between the scales is removed).
Reverse the following items (0 – 5, 1 – 4, 2 – 3, 3 – 2, 4 – 1, 5 – 0): 3, 6, 7, 13, 18, 21.
Hostile Sexism Score = average the following items: 2, 4, 5, 7, 10, 11, 14, 15, 16, 18, 21.
Benevolent Sexism Score = average the following items: 1, 3, 6, 8, 9, 12, 13, 17, 19, 20, 22.
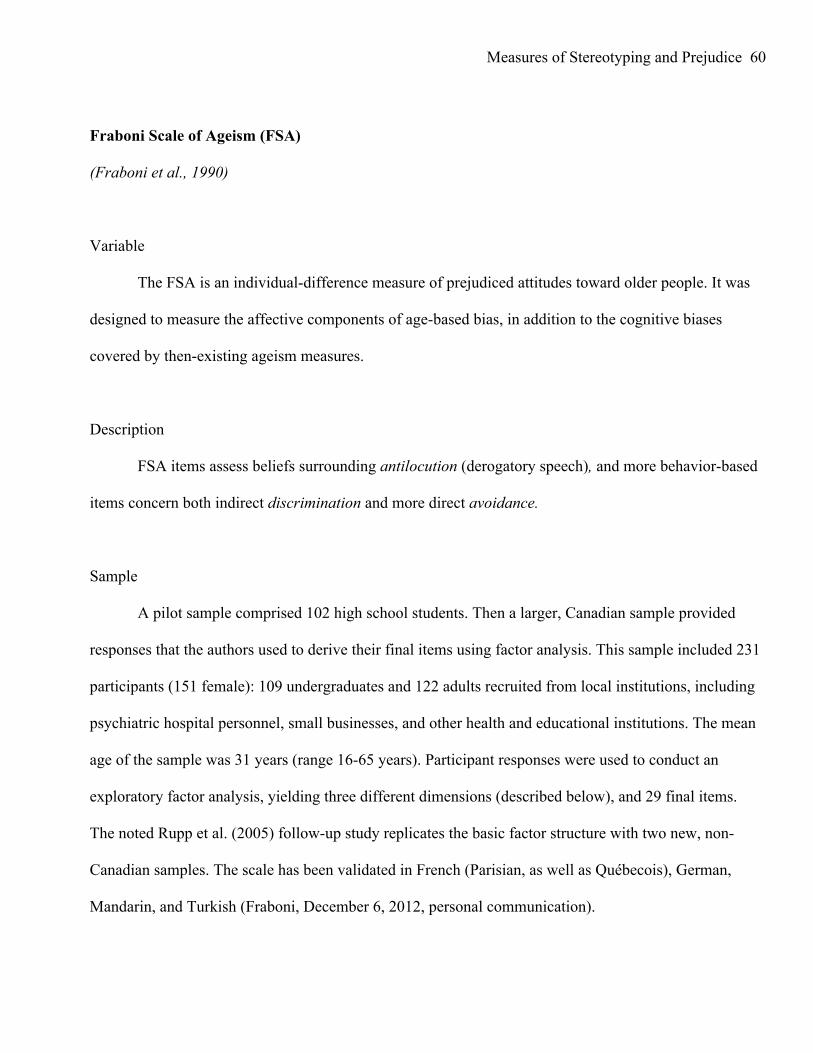
Measures of Stereotyping and Prejudice 60
Fraboni Scale of Ageism (FSA)
(Fraboni et al., 1990)
Variable
The FSA is an individual-difference measure of prejudiced attitudes toward older people. It was
designed to measure the affective components of age-based bias, in addition to the cognitive biases
covered by then-existing ageism measures.
Description
FSA items assess beliefs surrounding antilocution (derogatory speech), and more behavior-based
items concern both indirect discrimination and more direct avoidance.
Sample
A pilot sample comprised 102 high school students. Then a larger, Canadian sample provided
responses that the authors used to derive their final items using factor analysis. This sample included 231
participants (151 female): 109 undergraduates and 122 adults recruited from local institutions, including
psychiatric hospital personnel, small businesses, and other health and educational institutions. The mean
age of the sample was 31 years (range 16-65 years). Participant responses were used to conduct an
exploratory factor analysis, yielding three different dimensions (described below), and 29 final items.
The noted Rupp et al. (2005) follow-up study replicates the basic factor structure with two new, non-
Canadian samples. The scale has been validated in French (Parisian, as well as Québecois), German,
Mandarin, and Turkish (Fraboni, December 6, 2012, personal communication).
Measures of Stereotyping and Prejudice 61 Reliability
Internal Consistency
The Cronbach alpha coefficient for the overall scale was .86 for the scale development study.
Alpha coefficients for the three factors were .76, .65, and .77, respectively (Fraboni et al., 1990).
A subsequent validation study, by different authors (Rupp et al., 2005), found similar alpha
coefficients for each of the three factors (.75, .61, and .77). Partly because subscale alphas were lower
than the overall alpha, these authors proposed a slightly modified version, increasing the alpha
coefficients somewhat (to .79, .76, and .70) and better reflecting the authors’ original intent to measure
both affective and cognitive bases of ageism.
Validity
Convergent/Concurrent
The original study reported significant correlation (r = .40) between the FSA and the Acceptance
of Others Scale (AOS; Fey, 1955), as well as a significant negative correlation with the Facts on Aging
Quiz (FAQ; Palmore 1977). This latter result suggests that increased ageist attitudes predict lower
knowledge of elders, which is in line with other work showing that prejudice derives from a lack of
target-group knowledge (Pettigrew & Tropp, 2008).
Divergent/Discriminant
Men score more highly than women on the FSA (Fraboni et al., 1990). Additionally, younger
raters score higher than older raters (Rupp et al., 2005).
The original study showed that the FSA does not correlate with the Marlow-Crowne (1964) scale
of social desirability. In follow-up work (Rupp et al., 2005), the FSA cognitive components correlated
more strongly with pre-existing ageism measures than did the affective components, supporting the
Measures of Stereotyping and Prejudice 62 original authors’ claim that the FSA represents a more complete (i.e., both affective and cognitive)
measure. Six of the 29 total items were reverse-coded, presumably to minimize response bias.
Construct/Factor Analytic
As per Fraboni et al. (1990), three factors underlie the FSA structure: attitudinal beliefs
surrounding antiloction, and more behavior-based items concerning indirect discrimination, and more
direct avoidance. The authors did suggest that the use of subscales may not be completely warranted,
given a lack of independence between the three factors, as well as their representing “theoretically
additive constructs.”
The separate study by Rupp et al. (2005) mostly validated the three-factor measure, via
confirmatory factor analysis. AS noted, this study proposed a slightly revised version, with fewer items
and modified factor names labeled respectively, “stereotypes,” “separation,” and “affective attitudes.”
Rupp et al. argued that these changes would better reflect the original authors’ intent to measure
cognitive and affective bases of ageism.
Criterion/Predictive
The FSA has been used primarily as a dependent variable, gauging a reduction in ageist attitudes
over a period of time. Typically such studies involve an aging, adult-development, or gerontology
education program, aimed at increasing aging awareness and reducing age-based prejudices (e.g.,
Boswell, 2012).
Location
Fraboni, M., Saltstone, R., & Hughes, S. (1990). The Fraboni Scale of Ageism (FSA): An attempt at a
more precise measure of ageism. Canadian Journal of Aging, 9(1), 56-66.
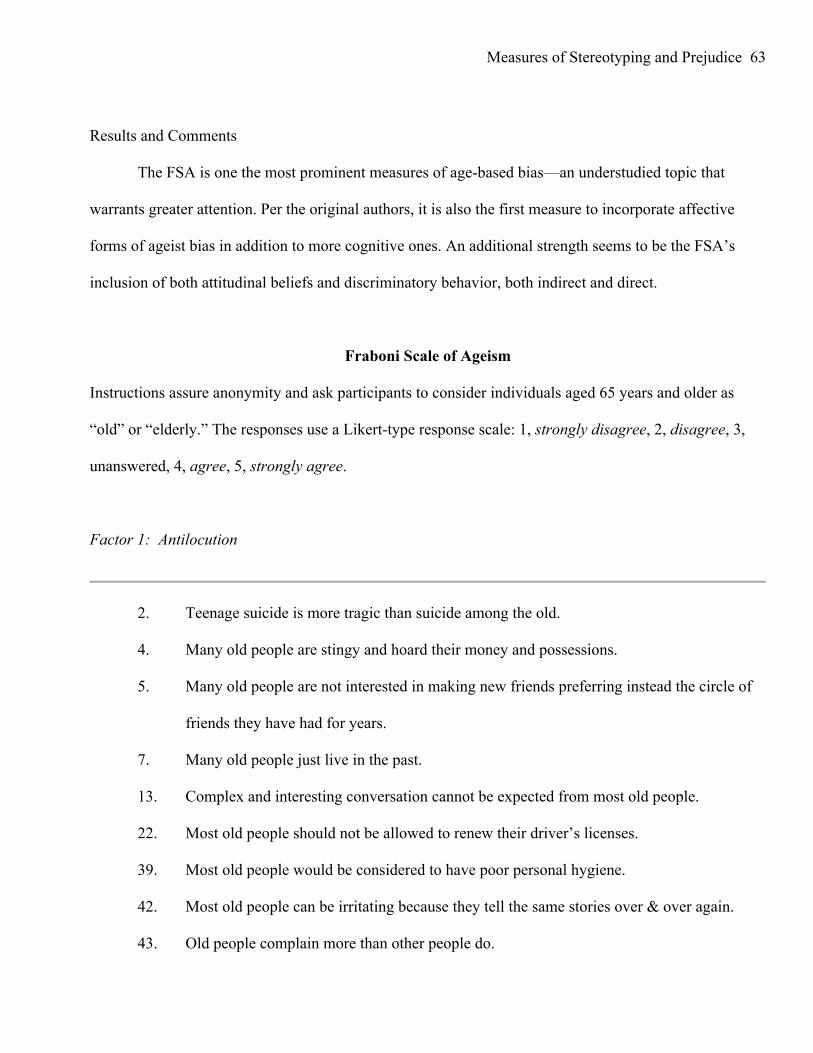
Measures of Stereotyping and Prejudice 63
Results and Comments
The FSA is one the most prominent measures of age-based bias—an understudied topic that
warrants greater attention. Per the original authors, it is also the first measure to incorporate affective
forms of ageist bias in addition to more cognitive ones. An additional strength seems to be the FSA’s
inclusion of both attitudinal beliefs and discriminatory behavior, both indirect and direct.
Fraboni Scale of Ageism
Instructions assure anonymity and ask participants to consider individuals aged 65 years and older as
“old” or “elderly.” The responses use a Likert-type response scale: 1, strongly disagree, 2, disagree, 3,
unanswered, 4, agree, 5, strongly agree.
Factor 1: Antilocution
2. Teenage suicide is more tragic than suicide among the old.
4. Many old people are stingy and hoard their money and possessions.
5. Many old people are not interested in making new friends preferring instead the circle of
friends they have had for years.
7. Many old people just live in the past.
13. Complex and interesting conversation cannot be expected from most old people.
22. Most old people should not be allowed to renew their driver’s licenses.
39. Most old people would be considered to have poor personal hygiene.
42. Most old people can be irritating because they tell the same stories over & over again.
43. Old people complain more than other people do.
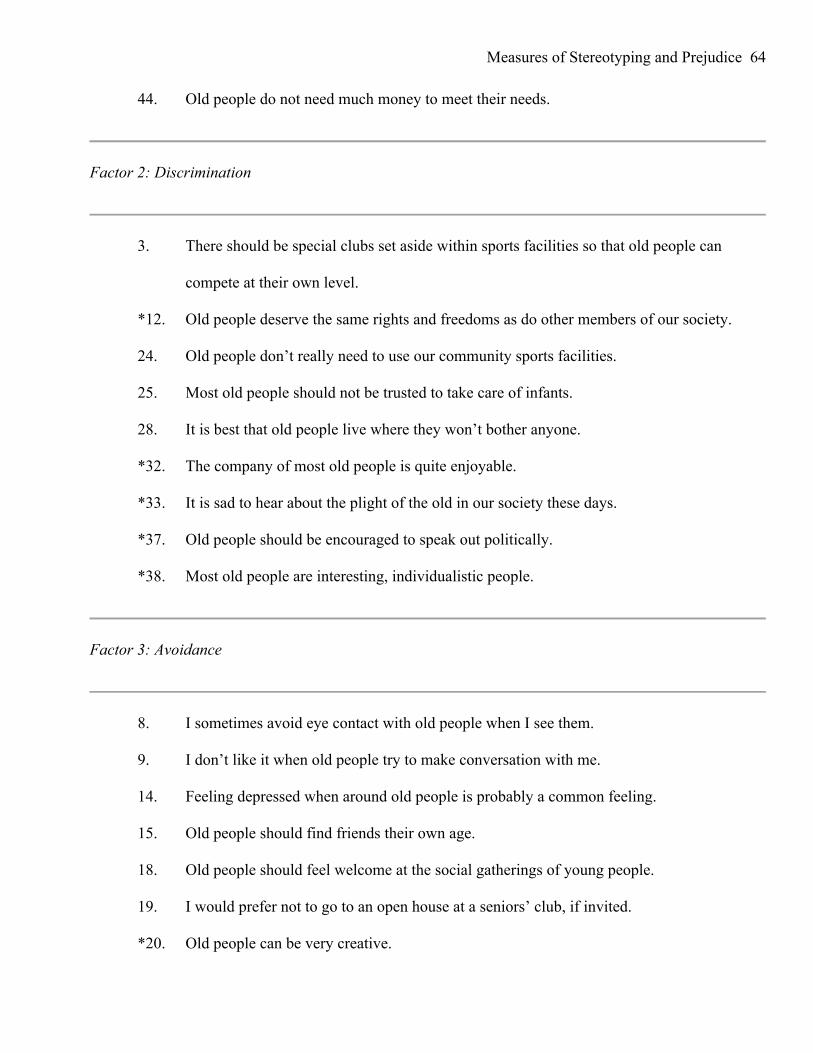
Measures of Stereotyping and Prejudice 64 44. Old people do not need much money to meet their needs.
Factor 2: Discrimination
3. There should be special clubs set aside within sports facilities so that old people can
compete at their own level.
*12. Old people deserve the same rights and freedoms as do other members of our society.
24. Old people don’t really need to use our community sports facilities.
25. Most old people should not be trusted to take care of infants.
28. It is best that old people live where they won’t bother anyone.
*32. The company of most old people is quite enjoyable.
*33. It is sad to hear about the plight of the old in our society these days.
*37. Old people should be encouraged to speak out politically.
*38. Most old people are interesting, individualistic people.
Factor 3: Avoidance
8. I sometimes avoid eye contact with old people when I see them.
9. I don’t like it when old people try to make conversation with me.
14. Feeling depressed when around old people is probably a common feeling.
15. Old people should find friends their own age.
18. Old people should feel welcome at the social gatherings of young people.
19. I would prefer not to go to an open house at a seniors’ club, if invited.
*20. Old people can be very creative.
Measures of Stereotyping and Prejudice 65 21. I personally would not want to spend much time with an old person.
26. Many old people are happiest when they are with people their own age.
41. I would prefer not to live with an old person.
Notes.
* Reverse scored item (5 through 1).
Copyright Cambridge. Reproduced with permission.
Succession, Identity, and Consumption Scale of Prescriptive Ageism (SIC)
(North & Fiske, 2013b)
Variable
Ageism research typically focuses on default elder stereotypes of perceived incompetence, illness,
and irrelevance. Though useful, this approach ignores society’s “graying” demographic trends, which are
fast ushering in a more visible, healthy, and influential older age. Also overlooked are the potential
(though not inevitable) intergenerational tensions that might result from an enlarged older population use
of resources (North & Fiske, 2012).
Similarly, ageism measures tend to focus on descriptive content concerning what older people are
allegedly like. By contrast, a prescriptive approach centers on expectations concerning what older people
allegedly should do (North & Fiske, 2013-a). This theory-based measure thus centers the idea that age
groups are interdependent, and emphasizes intergenerational tensions over practical and symbolic
Measures of Stereotyping and Prejudice 66 resources. In this vein, its perspective echoes classic social psychological theories of prejudice
emphasizing intergroup resource competition.
Description
The SIC taps three domains of intergenerational resource tension: facilitating active,
intergenerational succession of enviable resources (e.g., retiring from jobs, ceding wealth), limiting
passive consumption of shared resources (e.g., minimizing healthcare dollars, expediting highway
traffic), and avoiding symbolic youth identity resources (e.g., popular music, fashion).
Sample
Four samples (totaling 2,010 participants) forged the SIC (North & Fiske, 2013b). In its
development, the scale has been administered to over 2,000 participants across the U.S., ranging in age
from 16 to 81 years. Also, recent (North & Fiske, under review) work has collected scale responses from
a large, adult sample in India (n = 801). Preliminary results indicate that Indians score significantly
higher on the measure than do Americans, suggested a greater level of prescriptive ageism in at least one
Eastern culture (see North & Fiske, under review, for a meta-analysis of East-West differences).
Reliability
Internal consistency
Cronbach alphas coefficients across the four samples ranged from .90 to .91 for the total scale.
Alpha coefficients for the three subscales were: succession (.84 to .85), identity (.83 to .87), and
consumption (.75 to .86) across the four samples (North & Fiske, 2013b). Likewise, analyses on Indian
responses (North & Fiske, under review) also resulted in acceptable alphas (.80 to .86).
Measures of Stereotyping and Prejudice 67 Validity
Convergent/Concurrent
The SIC scale converges strongly with the FSA (r = .70), then more moderately with symbolic
racism and the ASI (r= .32 to .40). The measure also correlates moderately with intergroup-hierarchy-
focused SDO (Pratto et al., 1994), r = .31.
Divergent/Discriminant
The scale does not correlate significantly with intergroup-value-conflict-based RWA (Altemeyer,
1998), r = .15. The scale also does not correlate with political orientation (r < .02).
Though SIC does correlate strongly with FSA, an experimental paradigm (in which participants
were presented with prescription-violating elders) found that SIC predicted resentment toward the
various targets, even controlling for FSA. However, the reverse was nonsignificant, suggesting that a
prescriptive ageist orientation—not the FSA’s descriptive, affective/cognitive one—underlies this bias
(North & Fiske, 2013b).
Central to the scale’s intergenerational focus, rater age consistently predicts SIC, with younger
people scoring the highest on the total scale (β = -.31) and all three subscales: Succession (β = -.37),
Identity (β = -.22), and Consumption (β = -.17; North & Fiske, 2013b). Additionally, men score higher
than women, as in other prejudice measures.
Unexpected ethnic differences emerge as well: specifically, South- and East Asian-Americans
score higher than White, Latino, and Black Americans. These initial findings—in addition to the Indian
data cited above—suggest that Eastern cultures are not as reverent of their elders as lay beliefs would
suggest (North & Fiske, under review).
Construct/Factor Analytic
Measures of Stereotyping and Prejudice 68
The first sample (n = 437) rated their agreement with 41 prescriptive statements targeting older
people. An exploratory factor analysis found a 3-factor solution, best fitting 20 items. Additionally,
confirmatory factor analysis measures (RMSEA, IFI, CFI, NLI) indicated a 3-factor model to be a good
fit for the data. Responses from the next three samples replicated these trends, in addition to adding
supplemental demographic (above) and predictive results (below). As noted, each of the three factors
emphasizes prescriptive, “should”-based beliefs concerning elders’ use of social resources, each likely to
be endorsed particularly by younger people.
Criterion/Predictive
As noted an experimental paradigm presented participants with older targets who either adhered
to or violated prescriptive, SIC-based stereotypes (such as refusing to retire). As expected, SIC scores
significantly predicted reactions toward the prescription-violating targets, such that participants who
scored higher were more resentful (North & Fiske, 2013b).
Location
North, M. S., & Fiske, S. T. (2013b). A prescriptive, intergenerational-tension ageism scale: Succession,
Identity, and Consumption. Psychological Assessment, 25(3), 706-713..
Results and Comments
The first prescriptive, intergenerational-tension ageism measure, SIC departs from existing scales,
in both focus (prescriptive “shoulds” instead of content-based “ares”) and findings (consistent participant
age trends do not emerge with other ageism measures). In gauging stances on emergent issues—such as
those surrounding mandatory retirement, Social Security, and healthcare—the scale also offers greater
contemporary societal relevance than do existing measures.
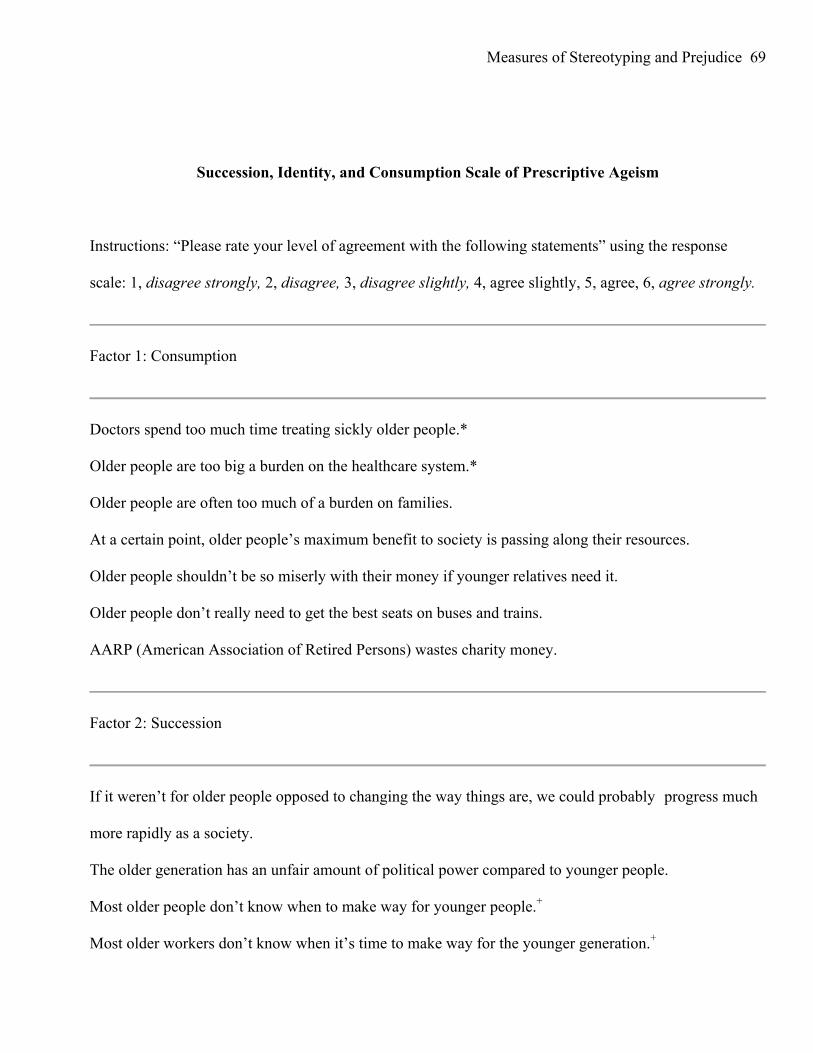
Measures of Stereotyping and Prejudice 69
Succession, Identity, and Consumption Scale of Prescriptive Ageism
Instructions: “Please rate your level of agreement with the following statements” using the response
scale: 1, disagree strongly, 2, disagree, 3, disagree slightly, 4, agree slightly, 5, agree, 6, agree strongly.
Factor 1: Consumption
Doctors spend too much time treating sickly older people.*
Older people are too big a burden on the healthcare system.*
Older people are often too much of a burden on families.
At a certain point, older people’s maximum benefit to society is passing along their resources.
Older people shouldn’t be so miserly with their money if younger relatives need it.
Older people don’t really need to get the best seats on buses and trains.
AARP (American Association of Retired Persons) wastes charity money.
Factor 2: Succession
If it weren’t for older people opposed to changing the way things are, we could probably progress much
more rapidly as a society.
The older generation has an unfair amount of political power compared to younger people.
Most older people don’t know when to make way for younger people.+
Most older workers don’t know when it’s time to make way for the younger generation.+
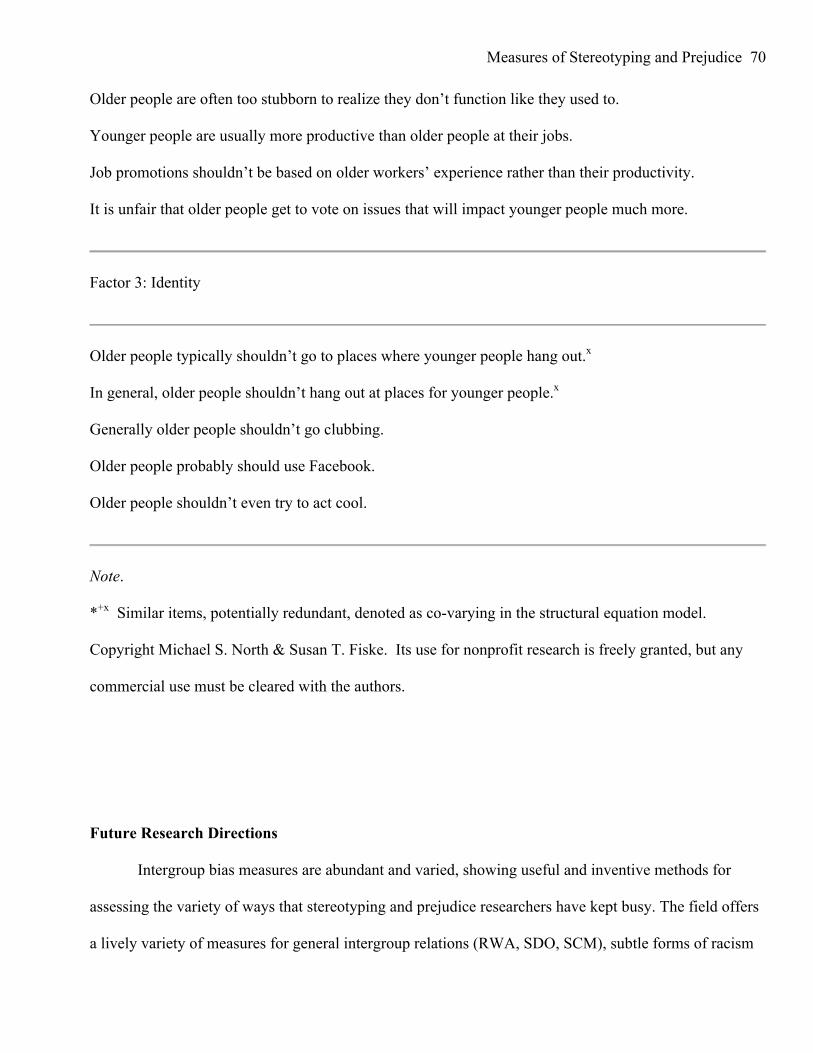
Measures of Stereotyping and Prejudice 70 Older people are often too stubborn to realize they don’t function like they used to.
Younger people are usually more productive than older people at their jobs.
Job promotions shouldn’t be based on older workers’ experience rather than their productivity.
It is unfair that older people get to vote on issues that will impact younger people much more.
Factor 3: Identity
Older people typically shouldn’t go to places where younger people hang out.x
In general, older people shouldn’t hang out at places for younger people.x
Generally older people shouldn’t go clubbing.
Older people probably should use Facebook.
Older people shouldn’t even try to act cool.
Note.
*+x Similar items, potentially redundant, denoted as co-varying in the structural equation model.
Copyright Michael S. North & Susan T. Fiske. Its use for nonprofit research is freely granted, but any
commercial use must be cleared with the authors.
Future Research Directions
Intergroup bias measures are abundant and varied, showing useful and inventive methods for
assessing the variety of ways that stereotyping and prejudice researchers have kept busy. The field offers
a lively variety of measures for general intergroup relations (RWA, SDO, SCM), subtle forms of racism
Measures of Stereotyping and Prejudice 71 (SRS, IAT, indirect priming, aversive racism measure), subtle forms of sexism (MSS, NS, ASI), and
subtle forms of ageism (FSA, SIC). Each has more-than-adequate psychometric properties, and most
apply across cultures.
Compared with previous stereotyping and prejudice measures reported in earlier editions of this
volume, these measures of bias focus on unexamined rather than overt indicators. Some measures rely on
relatively automatic processes (reaction times in the IAT, indirect priming of racism, aversive racism
measure) that indicate underlying cognitive-evaluative associations. Some measures tap seemingly
impersonal societal beliefs (SDO, SCM), so they may seem ambiguous to respondents as evidence of
bias, although they predict stereotyping, prejudice, and discrimination. Some measures rely on seemingly
independent policy preferences whose pattern happens to predict ingroup favoritism (SRS, MSS, NS,
FSA), again apparently ambiguous to respondents. Still other measures assess ambivalent beliefs (SCM,
ASI, SIC); these are evaluatively mixed across dimensions, not overtly univalent—all negative or all
positive—reactions to ingroups and outgroups. This automaticity, ambiguity, and ambivalence allows
researchers to identify contemporary forms of bias that often differ in kind from more overt, old-
fashioned forms.
More research is needed, of course. Not all measures provide complete psychometric profiles, for
example, test-retest reliability or nonstudent samples. Not all measures show the expected convergent or
predictive validity; more evidence is needed.
Finally, societal categories are evolving, and some are neglected by bias measures (e.g., social
class, religion). Many categories intersect, and we do not know how this tempers or exaggerates
individual differences in bias. Indeed categories are becoming more volatile, uncertain, complex, and
ambiguous (Bodenhausen & Peery, 2009), so measures of bias will have to respond with the times. Stay
tuned.
Measures of Stereotyping and Prejudice 72
References
Adorno, T. W., Frenkel-Brunswik, E., Levinson, D. J., & Sanford, R. N. (1950). The authoritarian
personality. Oxford, England: Harper.
Akrami, N., Ekehammar, B., & Yang-Wallentin, F. (2011). Personality and social psychology factors
explaining sexism. Journal of Individual Differences, 32(3), 153-160.
Alexander, M. G., Brewer, M. B., & Hermann, R. K. (1999). Images and affect: A functional analysis of
out-group stereotypes. Journal of Personality and Social Psychology, 77(1), 78-93.
Altemeyer, B. (1988). Enemies of freedom: Understanding right-wing authoritarianism. San Francisco:
Jossey-Bass.
Altemeyer, B. (1998). The other “authoritarian personality.” In M. P. Zanna (Ed.), Advances in
Experimental Social Psychology, (Vol. 30, pp. 47-92). San Diego, CA: Academic.
Altemeyer, B. (2004). Highly dominating, highly authoritarian personalities. Journal of Social
Psychology, 144(4), 421-447.
Amodio, D. M., & Devine, P. G. (2006). Stereotyping and evaluation in implicit race bias: Evidence for
independent constructs and unique effects on behavior. Journal of Personality and Social
Psychology, 91(4), 652–661.
Arkes, H. R., & Tetlock, P. E. (2004). Attributions of implicit prejudice, or “Would Jesse Jackson ‘fail’
the implicit association test?” Psychological Inquiry, 15(4), 257–278.
Ashburn-Nardo, L., Voils, C. I., & Monteith, M. J. (2001). Implicit associations as the seeds of
intergroup bias: How easily do they take root? Journal of Personality and Social Psychology,
81(5), 789–799.
Banaji, M. R., Nosek, B. A., & Greenwald, A. G. (2004). No place for nostalgia in science: A response to
Arkes and Tetlock. Psychological Inquiry, 15(4), 279-310.
Measures of Stereotyping and Prejudice 73 Barreto, M. & Ellemers, N. (2005). The perils of political correctness: men’s and women’s responses to
old-fashioned and modern sexist views. Social Psychology Quarterly, 68(1), 75-88.
Beaton, A. M., Tougas, F., & Joly, S. (1996). Neosexism among male managers: Is it a matter of
numbers? Journal of Applied Social Psychology, 26(24), 2189-2203.
Becker, J. C., & Wagner, U. (2009). Doing gender differently—The interplay of strength of gender
identification and content of gender identity in predicting women's endorsement of sexist beliefs.
European Journal of Social Psychology, 39(4), 487-508.
Bergsieker, H. B., Leslie, L. M., Constantine, V. S., & Fiske, S. T. (2012). Stereotyping by omission:
Eliminate the negative, accentuate the positive. Journal of Personality and Social Psychology,
102(6), 1214-1238.
Biernat, M., & Crandall, C. S. (1999). Racial attitudes. In J. P. Robinson, P. R. Shaver, & L. S.
Wrightsman (Eds.), Measures of social psychological attitudes, Vol. 2. Measures of political
attitudes (pp. 297-411). San Diego, CA: Academic.
Blashfield, R. K., & Aldenderfer, M. S. (1988). The methods and problems of cluster analysis. In J. R.
Nesselroade & R. B. Cattell (Eds.), Handbook of multivariate experimental psychology (pp. 447–
473). New York: Plenum.
Bobo, L. (1983). Whites' opposition to busing: Symbolic racism or realistic group conflict? Journal of
Personality and Social Psychology, 45(6), 1196-1210.
Bodenhauen, G. V., & Peery, D. (2009). Social categorization and stereotyping in vivo: The VUCA
challenge. Social and Personality Psychology Compass 3/2, 133–151.
Bogardus, E. S. (1927). Race friendliness and social distance. Journal of Applied Sociology, 11, 272-287.
Boswell, S. S. (2012). “Old people are cranky”: Helping professional trainees' knowledge, attitudes,
aging anxiety, and interest in working with older adults. Educational Gerontology, 38(7), 465-
472.
Measures of Stereotyping and Prejudice 74 Brambilla, M., Carnaghi, A., & Ravenna, M. (2011). Status and cooperation shape lesbian stereotypes:
Testing predictions from the stereotype content model. Social Psychology, 42(2), 101-110.
Brauer, M., Wasel, W., & Niedenthal, P. (2000). Implicit and explicit components of prejudice. Review of
General Psychology, 4(1), 79-101.
Cameron, J. E. (2001). Social identity, modern sexism, and perceptions of personal and group
discrimination by women and men. Sex Roles, 45(11-12), 743-766.
Hitlan, B., Schellenberg, E. G., & Senn, C. Y. (1997). Evaluating measures of contemporary sexism.
Psychology of Women Quarterly, 21(1), 89-101.
Caprariello, P. A., Cuddy, A. J. C., & Fiske, S. T. (2009). Social structure shapes cultural stereotypes
and emotions: A causal test of the stereotype content model. Group Processes and Intergroup
Behavior, 12(2), 147–155.
Carter, J. D., Hall, J. A., Carney, D. R., & Rosip, J. C. (2006). Individual differences in the acceptance of
stereotyping. Journal of Research in Personality, 40(6), 1103-1118.
Chaiken, S., & Trope, Y. (Eds.). (1999). Dual-process theories in social psychology. New York:
Guilford.
Chen, Z., Fiske, S. T., & Lee, T. L. (2009). Ambivalent sexism and power-related gender-role ideology in
marriage. Sex Roles, 60(11-12), 765-778.
Christie, R. (1991). Authoritarianism and related constructs. In J. P. Robinson, P. R. Shaver, & L. S.
Wrightsman (Eds.), Measures of social psychological attitudes, Vol. 1. Measures of personality
and social psychological attitudes (pp. 501-571). San Diego, CA: Academic.
Christopher, A. N., Zabel, K. L., Jones, J. R., & Marek, P. (2008). Protestant ethic ideology: Its
multifaceted relationships with just world beliefs, social dominance orientation, and right-wing
authoritarianism. Personality and Individual Differences, 45(6), 473-477.
Measures of Stereotyping and Prejudice 75 Cikara, M., Eberhardt, J. L., & Fiske, S. T. (2011). From agents to objects: Sexist attitudes and neural
responses to sexualized targets. Journal of Cognitive Neuroscience, 23(3), 540-551.
Clausell, E., & Fiske, S. T. (2005). When do the parts add up to the whole? Ambivalent stereotype
content for gay male subgroups. Social Cognition, 23(2), 157-176.
Conway, M., Pizzamiglio, M. T., & Mount, L. (1996). Status, communality, and agency: Implications for
stereotypes of gender and other groups. Journal of Personality and Social Psychology, 71(1), 25–
38.
Crandall, C. S. (1994). Prejudice against fat people: Ideology and self-interest. Journal of Personality
and Social Psychology, 66(5), 882-894.
Crosby, F., Bromley, S., & Saxe, L. (1980). Recent unobtrusive studies of Black and White
discrimination and prejudice: A literature review. Psychological Bulletin, 87(3), 546-563.
Crowne, D., & Marlowe, D. (1964). The approval motive. New York: Wiley.
Cuddy, A. J. C., Fiske, S. T., & Glick, P. (2007). The BIAS map: Behaviors from intergroup affect and
stereotypes. Journal of Personality and Social Psychology, 92(4), 631-648.
Cuddy, A. J. C., Fiske, S. T., & Glick, P. (2008). Competence and warmth as universal trait dimensions
of interpersonal and intergroup perception: The Stereotype Content Model and the BIAS Map. In
M. P. Zanna (Ed.), Advances in Experimental Social Psychology (Vol. 40, pp. 61-149). New
York: Academic.
Cuddy, A. J. C., Fiske, S. T., Kwan, V. S. Y., Glick, P., Demoulin, S., Leyens, J-Ph., Bond, M. H.,
Croizet, J-C., Ellemers, N., Sleebos, E., Htun, T. T., Yamamoto, M., Kim, H-J., Maio, G., Perry,
J., Petkova, K., Todorov, V., Rodríguez-Bailón, R., Morales, E., Moya, M., Palacios, M., Smith,
V., Perez, R., Vala, J., & Ziegler, R. (2009). Stereotype content model across cultures: Towards
universal similarities and some differences. British Journal of Social Psychology, 48, 1-33.
Measures of Stereotyping and Prejudice 76 Cunningham, W. A., Preacher, K. J., & Banaji, M. R. (2001). Implicit attitude measures: Consistency,
stability, and convergent validity. Psychological Science, 12(2), 163-170.
Dambrun, M., Duarte, S., & Guimond, S. (2004). Why are men more likely to support group-based
dominance than women? The mediating role of gender identification. British Journal of Social
Psychology, 43(2), 287-297.
Dardenne, B., Delacollette, N., Grégoire, C., & Lecocq, D. (2006). Structure latente et validation de la
version française de l'Ambivalent Sexism Inventory: L'échelle de sexisme ambivalent [Latent
structure of the French validation of the ambivalent sexism inventory: Échelle de sexisme
ambivalent]. L'Année Psychologique, 106(2), 235-264.
Dardenne, B., Dumont, M., & Bollier, T. (2007). Insidious dangers of benevolent sexism: Consequences
for women's performance. Journal of Personality and Social Psychology, 93(5), 764-779.
Dasgupta, N., & Greenwald, A. G. (2001). On the malleability of automatic attitudes: Combating
automatic prejudice with images of admired and disliked individuals. Journal of Personality and
Social Psychology, 81(5), 800-814.
Dasgupta, N., McGhee, D. E., Greenwald, A. G., & Banaji, M. R. (2000). Automatic preference for
White Americans: Eliminating the familiarity explanation. Journal of Experimental Social
Psychology, 36(3), 316-328.
Davis, T. J., Jr. (2005). The political orientation of Blacks and Whites: Converging, diverging, or
remaining constant? The Social Science Journal, 42(4), 487-498.
DeCoster, J., Banner, M. J., Smith, E. R., & Semin, G. R. (2006). On the inexplicity of the implicit:
Differences in the information provided by implicit and explicit tests. Social Cognition, 24(1), 5–
21.
Measures of Stereotyping and Prejudice 77 Devine, P. G., Plant, E. A., Amodio, D. M., Harmon-Jones, E., & Vance, S. L. (2002). The regulation of
explicit and implicit race bias: The role of motivations to respond without prejudice. Journal of
Personality and Social Psychology, 82(5), 835-848.
Dovidio, J. F., Evans, N., & Tyler, R. B. (1986). Racial stereotypes: The contents of their cognitive
representations. Journal of Experimental Social Psychology, 22(1), 22–37.
Dovidio, J. F., & Gaertner, S. L. (2000). Aversive racism and selection decisions: 1989 and 1999.
Psychological Science, 11(4), 315–319.
Dovidio, J. F., Gaertner, S. E., Kawakami, K., & Hodson, G. (2002). Why can't we just get along?
Interpersonal biases and interracial distrust. Cultural Diversity and Ethnic Minority Psychology,
8(2), 88-102.
Dovidio, J. F., Kawakami, K., Johnson, C., Johnson, B., & Howard, A. (1997). On the nature of
prejudice: Automatic and controlled processes. Journal of Experimental Social Psychology, 33(5),
510–540.
Dovidio, J. F., Pagotto, L., & Hebl, M. R. (2011). Implicit attitudes and discrimination against people
with physical disabilities. In R. L. Wiener & S. L. Willborn (Eds.), Disability and aging
discrimination: Perspectives in law and psychology (pp. 157-183).
Dumont, M., Sarlet, M., & Dardenne, B. (2010). Be too kind to a woman, she’ll feel incompetent:
Benevolent sexism shifts self-construal and autobiographical memories toward incompetence. Sex
Roles, 62(7-8), 545-553.
Durante, F., Fiske, S. T., Cuddy, A. J. C., Kervyn, N. et al. (2013). Nations’ income inequality predicts
ambivalence in stereotype content: How societies mind the gap. British Journal of Social
Psychology, in press.
Measures of Stereotyping and Prejudice 78 Durante, F., Volpato, C., & Fiske, S. T. (2010). Using the Stereotype Content Model to examine group
depictions in Fascism: An archival approach. European Journal of Social Psychology, 40(3), 465-
483.
Eagly, A. H., Diekman, A. B., Johannesen-Schmidt, M. C., & Koenig, A. M. (2004). Gender gaps in
sociopolitical attitudes: A social psychological analysis. Journal of Personality and Social
Psychology, 87(6), 796-816.
Eckes, T. (2002). Paternalistic and envious gender stereotypes: Testing predictions from the stereotype
content model. Sex Roles, 47(3-4), 99-114.
Expósito, F., Herrera, M. C., Moya, M., & Glick, P. (2010). Don't rock the boat: Women's benevolent
sexism predicts fears of marital violence. Psychology of Women Quarterly, 34(1), 36-42.
Eyssel, F., & Bohner, G. (2007). The rating of sexist humor under time pressure as an indicator of
spontaneous sexist attitudes. Sex Roles, 57(9-10), 651-660.
Fang, C. Y., Sidanius, J., & Pratto, F. (1998). Romance across the social status continuum: Interracial
marriage and the ideological asymmetry effect. Journal of Cross-Cultural Psychology, 29(2),
290-305.
Fazio, R. H. (1990). Multiple processes by which attitudes guide behavior: The MODE model as an
integrative framework. In M. P. Zanna (Ed.), Advances in experimental social psychology (Vol.
23, pp. 75-109). San Diego, CA: Academic.
Fazio, R. H., & Dunton, B. C. (1997). Categorization by race: The impact of automatic and controlled
components of racial prejudice. Journal of Experimental Social Psychology, 33(5), 451-470.
Fazio, R. H., & Hilden, L. E. (2001). Emotional reactions to a seemingly prejudiced response: The role of
automatically activated racial attitudes and motivation to control prejudiced reactions. Personality
and Social Psychology Bulletin, 27(5), 538-549.
Measures of Stereotyping and Prejudice 79 Fazio, R. H., Jackson, J. R., Dunton, B. C., & Williams, C. J. (1995). Variability in automatic activation
as an unobtrusive measure of racial attitudes: A bona fide pipeline? Journal of Personality and
Social Psychology, 69(6), 1013-1027.
Fazio, R. H., & Olson, M. A. (2003). Implicit measures in social cognition research: Their meaning and
use. Annual Review of Psychology, 54, 297–327.
Fazio, R. H., & Towles-Schwen, T. (1999). The MODE model of attitude-behavior processes. In S.
Chaiken & Y. Trope (Eds.), Dual-process theories in social psychology (pp. 97-116). New York:
Guilford.
Fey, W. F. (1955). Acceptance by others and its relation to acceptance of self and others: A revaluation.
Journal of Abnormal and Social Psychology, 50(2), 274-276.
Fischer, R., Hanke, K., & Sibley, C. G. (2012). Cultural and institutional determinants of social
dominance orientation: A cross-cultural meta-analysis of 27 societies. Political Psychology, 33
(4), 437–467.
Fiske, S. T. (1998). Stereotyping, prejudice, and discrimination. In D. T. Gilbert, S. T. Fiske, & G.
Lindzey (Eds.), The handbook of social psychology (4th ed.) (Vol. 2, pp. 357-411). New York:
McGraw-Hill.
Fiske, S. T., Ames, D. L., Cikara, M., & Harris, L. T. (in press). Scanning for scholars: Using social
neuroscience as converging evidence for interpersonal stratification. In B. Derks, D. Scheepers, &
N. Ellemers (Eds.), Neuroscience of prejudice. Psychology Press.
Fiske, S. T., Bergsieker, H., Russell, A. M., & Williams, L. (2009). Images of Black Americans: Then,
“them” and now, “Obama!” DuBois Review: Social Science Research on Race, 6(1), 83-101.
Fiske, S. T., Cuddy, A. J. C., & Glick, P. (2007). Universal dimensions of social perception: Warmth and
competence. Trends in Cognitive Science, 11(2), 77-83.
Measures of Stereotyping and Prejudice 80 Fiske, S. T., Cuddy, A. J., Glick, P., & Xu, J. (2002). A model of (often mixed) stereotype content:
Competence and warmth respectively follow from perceived status and competition. Journal of
Personality and Social Psychology, 82(6), 878-902.
Fiske, S. T., & Taylor, S. E. (2013). Social cognition: From brains to culture (2nd ed.). London: Sage.
Fiske, S. T., Xu, J., Cuddy, A. C., & Glick, P. (1999). (Dis)respecting versus (dis)liking: Status and
interdependence predict ambivalent stereotypes of competence and warmth. Journal of Social
Issues, 55(3), 473-491.
Frantz, C. M., Cuddy, A. J. C., Burnett, M., Ray, H., & Hart, A. (2004). A threat in the computer: The
race implicit association test as a stereotype threat experience. Personality and Social Psychology
Bulletin, 30(12), 1611-1624.
Fraboni, M., Saltstone, R., & Hughes, S. (1990). The Fraboni Scale of Ageism (FSA): An attempt at a
more precise measure of ageism. Canadian Journal of Aging, 9(1), 56-66.
Frieze, I. H., Ferligoj, A., Kogovšek, T., Rener, T., Horvat, J., & Šarlija, N. (2003). Gender-role attitudes
in university students in the United States, Slovenia and Croatia. Psychology of Women
Quarterly, 27(3), 256-261.
Gaertner, S. L., & Dovidio, J. F. (1986). The aversive form of racism. In J. F. Dovidio & S. L. Gaertner
(Eds.), Prejudice, discrimination, and racism (pp. 61–90). Orlando, FL: Academic.
Glick P., & Fiske S. T. (1996). The Ambivalent Sexism Inventory: Differentiating hostile and benevolent
sexism. Journal of Personality and Social Psychology, 70(3), 491–512.
Glick, P. & Fiske, S. T. (2001). Ambivalent sexism. In M. P. Zanna (Ed.), Advances in experimental
social psychology (Vol. 33, pp 115-188). Thousand Oaks, CA: Academic.
Glick, P., & Fiske, S. T. (2011). Ambivalent sexism revisited. Psychology of Women Quarterly, 35(3),
530-535.
Measures of Stereotyping and Prejudice 81 Glick, P., Fiske, S. T., Mladinic, A., Saiz, J. L., Abrams, D., Masser, B., Adetoun, B., Osagie, J. E.,
Akande, A., Alao, A., Brunner, A., Willemsen, T. M., Chipeta, K., Dardenne, B., Dijksterhuis,
A., Wigboldus, D., Eckes, T., Six-Materna, I., Expósito, F., Moya, M., Foddy, M., Kim, H-J.,
Lameiras, M., Sotelo, M. J., Mucchi-Faina, A., Romani, M., Sakalli, N., Udegbe, B., Yamamoto,
M., Ui, Ferreira, M. C. & López López, W. (2000). Beyond prejudice as simple antipathy: Hostile
and benevolent sexism across cultures. Journal of Personality and Social Psychology, 79(5), 763-
775.
Glick, P., Lameriras, M., Fiske, S. T., Eckes, T., Masser, B., Volpato, C., Manganelli, A. M., Pek, J.,
Huang, L-l., Sakalli-Ugurlu, N., Rodriguez Castro, Y. R., D’Avila Pereira, M. L., Willemsen, A.
B., Six-Materna, I., & Wells, R. (2004). Bad but bold: Ambivalent attitudes toward men predict
gender inequality in 16 nations. Journal of Personality and Social Psychology, 86(5), 713-728.
Greenwald, A. G., Banaji, M. R., Rudman, L. A., Farnham, S. D., Nosek, B. A., & Mellott, D. S. (2002).
A unified theory of implicit attitudes, stereotypes, self-esteem, and self-concept. Psychological
Review, 109(1), 3–25.
Greenwald, A. G., McGhee, D. E., & Schwartz, J. L. K. (1998). Measuring individual differences in
implicit cognition: The implicit association test. Journal of Personality and Social Psychology,
74(6), 1464-1480.
Greenwald, A. G., Nosek , B. A., & Banaji, M. R. (2003). Understanding and using the Implicit
Association Test: I. An improved scoring algorithm. Journal of Personality and Social
Psychology, 85(3), 197-216.
Greenwald, A. G., Poehlman, T. A., Uhlmann, E., & Banaji, M. R. (2009). Understanding and using the
Implicit Association Test: III. Meta-analysis of predictive validity. Journal of Personality and
Social Psychology, 97(1), 17–41.
Measures of Stereotyping and Prejudice 82 Greenwald, A. G., Smith, C. T., Sriram, N., Bar-Anan, Y., & Nosek, B. A. (2009). Implicit race attitudes
predicted vote in the 2008 U.S. Presidential election. Analyses of Social Issues and Public Policy
(ASAP), 9(1), 241-253.
Hair, J. E. Jr., Anderson, R. E., Tatham, R. L., & Black, W. C. (1995). Multivariate data analysis (4th
ed.). Upper Saddle, NJ: Prentice-Hall.
Henry, P. J., & Sears, D. O. (2002). The Symbolic Racism 2000 Scale. Political Psychology, 23(2), 253-
283.
Henry, P. J., & Sears, D. O. (2009). The crystallization of contemporary racial prejudice across the
lifespan. Political Psychology, 30(4), 569-590.
Herek, G. M., & Lemore, K. (2013). Sexual prejudice. Annual Review of Psychology, 64, 309-333.
Hitlan, R. T., Pryor, J. B., Hesson-McInnis, M. S., & Olson, M. (2009). Antecedents of gender
harassment: An analysis of person and situation factors. Sex Roles, 61(11-12), 794-807.
Ho, A. K., Sidanius, J., Pratto, F., Levin, S., Thomsen, L., Kteily, N., & Sheehy-Skeffington, J. (2012).
Social dominance orientation: Revisiting the structure and function of a variable predicting social
and political attitudes. Personality and Social Psychology Bulletin, 38(5), 583-606.
Hofmann, W., Gawronski, B., Gschwendner, T., Le, H., & Schmitt, M. (2005). A meta-analysis on the
correlation between the implicit association test and explicit self-report measures. Personality and
Social Psychology Bulletin, 31(10), 1369-1385.
Hugenberg, K., & Bodenhausen, G. V. (2003). Facing prejudice: Implicit prejudice and the perception of
facial threat. Psychological Science, 14(6), 640-643.
Jost, J. T., & Burgess, D. (2000). Attitudinal ambivalence and the conflict between group and system
justification motives in low status groups. Personality and Social Psychology Bulletin, 26(3), 293-
305.
Measures of Stereotyping and Prejudice 83 Jost, J. T., & Kay, A. C. (2005). Exposure to benevolent sexism and complementary gender stereotypes:
Consequences for specific and diffuse forms of system justification. Journal of Personality and
Social Psychology, 88(3), 498-509.
Joy-Gaba, J. A., & Nosek, B. A. (2010). The surprisingly limited malleability of implicit racial
evaluations. Social Psychology, 41(3), 137-146.
Karakurt, G., & Cumbie, T. (2012). The relationship between egalitarianism, dominance, and violence in
intimate relationships. Journal of Family Violence, 27(2), 115-122.
Karpinski, A., & Hilton, J. L. (2001). Attitudes and the implicit association test. Journal of Personality
and Social Psychology, 81(5), 774–788.
Katz, D., & Braly, K. (1933). Racial stereotypes of one hundred college students. Journal of Abnormal
and Social Psychology, 28(3), 280-290.
Katz, I., & Hass, R. G. (1988). Racial ambivalence and American value conflict: Correlational and
priming studies of dual cognitive structures. Journal of Personality and Social Psychology, 55(6),
893-905.
Kawakami, K., & Dovidio, J. F. (2001). The reliability of implicit stereotyping. Personality and Social
Psychology Bulletin, 27(2), 212–225.
Kervyn, N., Fiske, S. T., & Malone, C. (2012). Brands as intentional agents framework: Warmth and
competence map brand perception, Target Article, Journal of Consumer Psychology, 22(2), 166-
176.
Kervyn, N., Fiske, S. T., & Yzerbyt, Y. (in press). Integrating the Stereotype Content Model (warmth
and competence) and Osgood’s Semantic Differential (evaluation, potency, and activity).
European Journal of Social Psychology, in press.
Measures of Stereotyping and Prejudice 84 Kervyn, N., Fiske, S. T., & Yzerbyt, Y. (under review). Why is the primary dimension of social cognition
so hard to predict? Symbolic and realistic threats together predict warmth in the stereotype
content model. Unpublished manuscript available from Fiske.
Kihlstrom, J. F. (2004). Implicit methods in social psychology. In C. Sansone, C. C. Morf, & A. T. Panter
(Eds.), The Sage handbook of methods in social psychology (pp. 195–212). Thousand Oaks, CA:
Sage.
Kinder, D. R., & Sanders, L. M. (1996). American politics and political economy. Divided by color:
Racial politics and democratic ideals. Chicago: University of Chicago Press.
Kinder, D. R., & Schuman, H. (2004). Racial attitudes: Developments and divisions in survey research.
In J. S. House, F. T. Juster, R. L. Kahn, H. Schuman, & E. Singer (Eds.), A telescope on society:
Survey research and social science at the University of Michigan and beyond (pp. 365-392). Ann
Arbor, MI: University of Michigan Press.
Kinder, D. R., & Sears, D. O. (1981). Prejudice and politics: Symbolic racism versus racial threats to the
good life. Journal of Personality and Social Psychology, 40(3), 414-431.
Kubota, J. T., Banaji, M. R., & Phelps, E. A. (2012). The neuroscience of race. Nature Neuroscience,
15(7), 940-948.
Leach, C. W., Ellemers, N., & Barreto, M. (2007). Group virtue: the importance of morality (vs.
competence and sociability) in the positive evaluation of in-groups. Journal of Personality and
Social Psychology, 93(2), 234-249.
Lee, I-C., Pratto, F., & Johnson, B. T. (2011). Intergroup consensus/disagreement in support of group-
based hierarchy: An examination of socio-structural and psycho-cultural factors. Psychological
Bulletin, 137(6), 1029-1064.
Lee, T. L., & Fiske, S. T. (2006). Not an outgroup, but not yet an ingroup: Immigrants in the stereotype
content model. International Journal of Intercultural Relations, 30(6), 751-768.
Measures of Stereotyping and Prejudice 85 Lenney, E. (1991). Sex roles: The measurement of masculinity, femininity, and androgyny. In J. P.
Robinson, P. R. Shaver, & L. S. Wrightsman (Eds.), Measures of social psychological attitudes,
Vol. 1. Measures of personality and social psychological attitudes (pp. 573-660). San Diego, CA:
Academic.
Lerner, M. J., & Miller, D. T. (1978). Just world research and the attribution process: Looking back and
ahead. Psychological Bulletin, 85(5), 1030-1051.
Levin, S., Matthews, M., Guimond, S., Sidanius, J., Pratto, F., Kteily, N., Pitpitan, E. V., & Dover, T.
(2012). Assimilation, multiculturalism, and colorblindness: Mediated and moderated relationships
between social dominance orientation and prejudice. Journal of Experimental Social Psychology,
48(1), 207-212.
Li, Q., Huang, D., & Cui, M. (2012). Should women return home? The interactive effects of sexism and
economic confidence. Social Behavior and Personality, 40(3), 527-528.
Lin, M. H., Kwan, V. S. Y., Cheung, A., & Fiske, S. T. (2005). Stereotype content model explains
prejudice for an envied outgroup: Scale of Anti-Asian American Stereotypes. Personality and
Social Psychology Bulletin, 31(1), 34-47.
Link, B. G., Yang, L. H., Phelan, J. C., & Collins, P. Y. (2004). Measuring mental illness stigma.
Schizophrenia Bulletin, 30(3), 511-541.
Lowery, B. S., Hardin, C. D., & Sinclair, S. (2001). Social influence effects on automatic racial
prejudice. Journal of Personality and Social Psychology, 81(5), 842-855.
Malone, C., & Fiske, S. T. (2013). The human brand: How we relate to people, products, and companies.
San Francisco: Wiley/Jossey Bass.
Masser, B., & Abrams, D. (1999). Contemporary sexism: The relationships among hostility,
benevolence, and neosexism. Psychology of Women Quarterly, 23(3), 503-517.
McConahay, J. B., & Hough, J. C. (1976). Symbolic racism. Journal of Social Issues, 32(2), 23-45.
Measures of Stereotyping and Prejudice 86 McConnell, A. R., & Leibold, J. M. (2001). Relations among the implicit association test, discriminatory
behavior, and explicit measures of racial attitudes. Journal of Experimental Social Psychology,
37(5), 435–442.
McHugh, M. C., & Frieze, I. H. (1997). The measurement of gender-role attitudes: A review and
commentary. Psychology of Women Quarterly, 21(1), 1-16.
Mitchell, J. P., Nosek , B. A., & Banaji, M. R. (2003). Contextual variations in implicit evaluation.
Journal of Experimental Psychology: General, 132(3), 455-469.
Morrison, M. A., Morrison, T. G., Pope, G. A., & Zumbo, B. D. (1999). An investigation of measures of
modern and old-fashioned sexism. Social Indicators Research, 48(1), 39-50.
Moya, M., Glick, P., Expósito, F., de Lemus, S., & Hart, J. (2007). It's for your own good: Benevolent
sexism and women's reactions to protectively justified restrictions. Personality and Social
Psychology Bulletin, 33(10), 1421-1434.
Moya, M., Morales, E., & Expósito, F. (2001). Nuevas formas, viejos intereses: Neosexismo en varones
españoles [New forms, old interests: Neosexism among Spanish men]. Psicothema, 13(4), 643-
649.
North, M. S., & Fiske, S. T. (2012). An inconvenienced youth? Ageism and its potential intergenerational
roots. Psychological Bulletin, 138(5), 982-997.
North, M. S., & Fiske, S. T. (2013-a). Act your (old) age: Prescriptive, ageist biases over succession,
identity, and consumption. Personality and Social Psychology Bulletin, in press.
North, M. S., & Fiske, S. T. (2013-b). A prescriptive, intergenerational-tension ageism scale: Succession,
Identity, and Consumption. Psychological Assessment, in press.
Nosek, B. A., Banaji, M., & Greenwald, A. G. (2002). Harvesting implicit group attitudes and beliefs
from a demonstration web site. Group Dynamics: Theory, Research, and Practice, 6(1), 101-115.
Measures of Stereotyping and Prejudice 87 Nosek, B. A., Greenwald, A. G., & Banaji, M. R. (2005). Understanding and using the Implicit
Association Test: II. Method variables and construct validity. Personality and Social Psychology
Bulletin, 31(2), 166-180.
Nosek, B. A. Smyth, F. L., Hansen, J. J., Devos, T., Lindner, N. M., Ranganath, K. A., & Smith, C. T.
(2007). Pervasiveness and correlates of implicit attitudes and stereotypes. European Review of
Social Psychology, 18, 36-88.
Oldmeadow, J., & Fiske, S. T. (2007). System-justifying ideologies moderate status = competence
stereotypes: Roles for belief in a just world and social dominance orientation. European Journal
of Social Psychology, 37(6), 1135-1148.
Olson, M. A., & Fazio, R. H. (2003). Relations between implicit measures of prejudice: What are we
measuring? Psychological Science, 14(6), 636-639.
Olson, M. A., & Fazio, R. H. (2004). Reducing the influence of extrapersonal associations on the implicit
association test: Personalizing the IAT. Journal of Personality and Social Psychology, 86(5),
653–667.
Olson, M. A., & Fazio, R. H. (2009). Implicit and explicit measures of attitudes: The perspective of the
MODE model. In R. E. Petty, R. H. Fazio, & P. Briñol (Eds.), Attitudes: Insights from the new
implicit measures (pp. 19-63). New York, NY: Psychology Press.
Osgood, C. E., Suci, G. J., & Tannenbaum, P. H. (1957) The measurement of meaning. Urbana IL:
University of Illinois Press.
Palmore, E. (1977). Facts on Aging: A short quiz. Gerontologist, 17(4), 315-320.
Parks, J. B., & Roberton, M. A. (2004). Attitudes toward women mediate the gender effect on attitudes
toward sexist language. Psychology of Women Quarterly, 28(3), 233-239.
Pettigrew, T. F., & Meertens, R. W. (1995). Subtle and blatant prejudice in Western Europe. European
Journal of Social Psychology, 25(1), 57-75.
Measures of Stereotyping and Prejudice 88 Pettigrew, T.F., & Tropp, LR. (2008). How does intergroup contact reduce prejudice? Meta-analytic tests
of three mediators. European Journal of Social Psychology, 38(6), 922-934.
Phalet, K., & Poppe, E. (1997). Competence and morality dimensions of national and ethnic stereotypes:
A study in six eastern-European countries. European Journal of Social Psychology, 27(6), 703-
723.
Phills, C. E., Kawakami, K., Tabi, E., Nadolny, D., & Inzlicht, M. (2011). Mind the gap: Increasing
associations between the self and blacks with approach behaviors. Journal of Personality and
Social Psychology, 100(2), 197–210.
Pratto, F., Liu, J. H., Levin, S., Sidanius, J., Shih, M., Bachrach, H., & Hegarty, P. (2000). Social
dominance orientation and the legitimization of inequality across cultures. Journal of Cross-
Cultural Psychology, 31(3), 369-409.
Pratto, F., Sidanius, J., Stallworth, L. M., & Malle, B. F. (1994). Social dominance orientation: A
personality variable predicting social and political attitudes. Journal of Personality and Social
Psychology, 67(4), 741-763.
Pratto, F., Stallworth, L. M., & Sidanius, J. (1997). The gender gap: Differences in political attitudes and
social dominance orientation. British Journal of Social Psychology, 36(1), 49-68.
Robinson, J. P., Shaver, P. R., & Wrightsman, L. S. (Eds.). (1999). Measures of social psychological
attitudes, Vol. 2. Measures of political attitudes. San Diego, CA: Academic.
Robinson, J. P., Shaver, P. R., & Wrightsman, L. S. (Eds.). (1991). Measures of social psychological
attitudes, Vol. 1. Measures of personality and social psychological attitudes. San Diego, CA:
Academic.
Roets, A., Van Hiel, A., & Dhont, K. (2012). Is sexism a gender issue? A motivated social cognition
perspective on men's and women's sexist attitudes toward own and other gender. European
Journal of Personality, 26(3), 350-359.
Measures of Stereotyping and Prejudice 89 Rosenberg, S., Nelson, C., & Vivekananthan, P. S. (1968). A multidimensional approach to the structure
of personality impressions. Journal of Personality and Social Psychology, 9(4), 283-294.
Rudman, L. A. (2004). Sources of implicit attitudes. Current Directions in Psychological Science, 13(2),
79–82.
Rudman, L. A., & Ashmore, R. D. (2007). Discrimination and the Implicit Association Test. Group
Processes & Intergroup Relations, 10(3), 359-372.
Rudman, L. A., Ashmore, R. D., & Gary, M. L. (2001). "Unlearning" automatic biases: The malleability
of implicit prejudice and stereotypes. Journal of Personality and Social Psychology, 81(5), 856-
868.
Rudman, L. A., Greenwald, A. G., Mellott, D. S., & Schwartz, J. L. K. (1999). Measuring the automatic
components of prejudice: Flexibility and generality of the implicit association test. Social
Cognition, 17(4), 437–465.
Rupp, D.E., Vodanovich, S.J., & Credé, M. (2005). The multidimensional nature of ageism: Construct
validity and group differences. The Journal of Social Psychology, 145(3), 335-362.
Sakalli-Uğurlu, N. (2002). Çelişk Duygulu Cinsiyetçilik Ölçeği: Geçerlik ve güvenirlik ģalişmasi
[Ambivalent sexism inventory: A study of reliability and validity]. Türk Psikoloji Dergisi, 17(49),
47-61.
Sakalli-Uğurlu, N. (2003). Cinsiyetçilik: Kadinlara ve Erkeklere İlişkin Tutumlar ve Çelişik Duygulu
Cinsiyetçilik Kurami [Sexism: Attitudes towards women and men and ambivalent sexism theory].
Türk Psikoloji Yazilari, 6(11-12), 1-20.
Schnabel, K., Asendorpf, J. B., & Greenwald, A. G. (2008). Assessment of individual differences in
implicit cognition: A review of IAT measures. European Journal of Psychological Assessment,
24(4), 210-217.
Measures of Stereotyping and Prejudice 90 Schuman, H., Steeh, C., & Bobo, L. (1985). Social trends in the United States. Racial attitudes in
America: Trends and interpretations. Cambridge, MA: Harvard University Press.
Sears, D. O., Fu, M., Henry, P. J., & Bui, K. (2003). The origins and persistence of ethnic identity among
the "new immigrant" groups. Social Psychology Quarterly, 66(4), 419-437.
Sears, D. O., & Henry, P. J. (2003). The origins of symbolic racism. Journal of Personality and Social
Psychology, 85(2), 259-275.
Sears, D. O., & Henry, P. J. (2005). Over thirty years later: A contemporary look at symbolic racism. In
M. P. Zanna (Ed.), Advances in experimental social psychology, Vol. 37, pp. 95-150). San Diego,
CA: Academic.
Sears, D. O., & Kinder, D. R. (1971). Racial tensions and voting in Los Angeles. In W. Z. Hirsch (Ed.),
Los Angeles: Visibility and prospects for metropolitan leadership. New York: Praeger.
Sevillano, V., & Fiske, S. T. (under review). Animal collective: Social perception of animals.
Unpublished manuscript available from Fiske.
Sibley, C. G., & Overall, N. C. (2011). A dual process motivational model of ambivalent sexism and
gender differences in romantic partner preferences. Psychology of Women Quarterly, 35(2), 303-
317
Sidanius, J., Levin, S., Federico, C. M., & Pratto, F. (2001). Legitimizing ideologies: The social
dominance approach. In J. T. Jost & B. Major (Eds.), The psychology of legitimacy: Emerging
perspectives on ideology, justice, and intergroup relations (pp. 307-331). New York: Cambridge
University Press.
Sidanius, J., & Pratto, F. (1999). Social dominance: An intergroup theory of social hierarchy and
oppression. New York: Cambridge University Press.
Measures of Stereotyping and Prejudice 91 Sidanius, J., Pratto, F., & Bobo, L. (1996). Racism, conservatism, Affirmative Action, and intellectual
sophistication: A matter of principled conservatism or group dominance? Journal of Personality
and Social Psychology, 70(3), 476-490.
Siegel, E. F., Dougherty, M. R., & Huber, D. E. (2012). Manipulating the role of cognitive control while
taking the implicit association test. Journal of Experimental Social Psychology, 48(5), 1057-1068.
Sinclair, S., Dunn, E., & Lowery, B. S. (2005). The relationship between parental racial attitudes and
children’s implicit prejudice. Journal of Experimental Social Psychology, 41(3), 283–289.
Sniderman, P. M., Crosby, G. C., & Howell, W. G. (2000). The politics of race. In D. O. Sears, J.
Sidanius, & L. Bobo (Eds.), Racialized politics: The debate about racism in America (pp. 236-
279). Chicago: University of Chicago Press.
Spence, J. T, Helmreich, R., & Stapp, J. (1973). A short version of the Attitudes Toward Women Scale
(AWS). Bulletin of the Psychonomic Society, 2(4), 219-220.
Stanley, D. A., Sokol-Hessner, P., Banaji, M. R., & Phelps, E. A. (2011). Implicit race attitudes predict
trustworthiness judgments and economic trust decisions. PNAS Proceedings of the National
Academy of Sciences of the United States of America, 108(19), 7710-7775.
Stephan, W. G., & Stephan, C. W. (2000). An integrated threat theory of prejudice. In S. Oskamp (Ed.),
Reducing prejudice and discrimination (pp. 23-46). Hillsdale, NJ: Erlbaum.
Swim, J. K., Aikin, K. J., Hall, W. S., & Hunter, B. A. (1995). Sexism and racism: Old-fashioned and
modern prejudices. Journal of Personality and Social Psychology, 68(2), 199-214.
Swim, J. K., & Cohen, L. L. (1997). Overt, covert, and subtle sexism: A comparison between the
Attitudes Toward Women and Modern Sexism Scales. Psychology of Women Quarterly, 21(1),
103-118.
Measures of Stereotyping and Prejudice 92 Swim, J. K., Mallett, R., Russo-Devosa, Y., & Stangor, C. (2005). Judgments of sexism: A comparison of
the subtlety of sexism measures and sources of variability in judgments of sexism. Psychology of
Women Quarterly, 29(4), 406-411.
Swim, J. K., Mallett, R., & Stangor, C. (2004). Understanding subtle sexism: Detection and use of sexist
language. Sex Roles, 51(3-4), 117-128.
Tougas, F., Brown, R., Beaton, A. M., & Joly, S. (1995). Neosexism: Plus ça change, plus c'est pareil.
Personality and Social Psychology Bulletin, 21(8), 842-849.
Tougas, F., Brown, R., Beaton, A. M., & St-Pierre, L. (1999). Neosexism among women: The role of
personally experienced social mobility attempts. Personality and Social Psychology Bulletin,
25(12), 1487-1497.
Towles-Schwen, T., & Fazio, R. H. (2001). On the origins of racial attitudes: Correlates of childhood
experiences. Personality and Social Psychology Bulletin, 27(2), 162-175.
Towles-Schwen, T., & Fazio, R. H. (2003). Choosing social situations: The relation between
automatically activated racial attitudes and anticipated comfort interacting with African
Americans. Personality and Social Psychology Bulletin, 29(2), 170-182.
Towles-Schwen, T., & Fazio, R. H. (2006). Automatically activated racial attitudes as predictors of the
success of interracial roommate relationships. Journal of Experimental Social Psychology, 42(5),
698-705.
Uhlmann, E. L., Brescoll, V. L., & Paluck, E. L. (2006). Are members of low status groups perceived as
bad, or badly off? Egalitarian negative associations and automatic prejudice. Journal of
Experimental Social Psychology, 42(4), 491–499.
Willis, J., & Todorov, A. (2006). First impressions: Making up your mind after a 100-ms exposure to a
face. Psychological Science, 17(7), 592-598.
Measures of Stereotyping and Prejudice 93 Wittenbrink, B., Judd, C. M., & Park, B. (1997). Evidence for racial prejudice at the implicit level and its
relationship with questionnaire measures. Journal of Personality and Social Psychology, 72(2),
262-274.
Wittenbrink, B., Judd, C. M., & Park, B. (2001a). Evaluative versus conceptual judgments in automatic
stereotyping and prejudice. Journal of Experimental Social Psychology, 37(3), 244–252.
Wittenbrink, B., Judd, C. M., & Park, B. (2001b). Spontaneous prejudice in context: Variability in
automatically activated attitudes. Journal of Personality and Social Psychology, 81(5), 815-827.
Wojciszke, B. (1994). Multiple meanings of behavior: Construing actions in terms of competence or
morality. Journal of Personality and Social Psychology, 67(2), 222-232.
Yoder, J. D., & McDonald, T. W. (1997). The generalizability and construct validity of the Modern
Sexism Scale: Some cautionary notes. Sex Roles, 36(9-10), 655-663.
Zakrisson, I., Anderzén, M., Lenell, F., & Sandelin, H. (2012). Ambivalent sexism: A tool for
understanding and improving gender relations in organizations. Scandinavian Journal of
Psychology, 53(1), 64-70.