measurement of initial motion of a flying golf ball with multi-exposure images for screen-golf
TRANSCRIPT
Contributed Paper Manuscript received April 14, 2010 Current version published 06 29 2010;Electronic version published 07 06 2010. 0098 3063/10/$20.00 © 2010 IEEE
Measurement of Initial Motion of a Flying Golf Ball with Multi-Exposure images for Screen-golf
Jaewook Jung, Student Member, IEEE, Hanbit Park, Shin Kang, Seungwoo Lee and Minsoo Hahn
Abstract — Recently, realistic sports games have been one
of the growth industries of the indoor entertainment field. In particular, screen-golf, which is played indoors with real golf clubs and balls, has shown an outstanding growth rate in South Korea. It consists of a sensor, a computer graphics engine, an interior, and other elements. The sensor is the most essential component among them. It measures the initial conditions of a flying golf ball, the velocity, the horizontal angle, and the vertical angle. Until 2008, most commercialized products were infrared LED type sensors, but these are associated with relatively low accuracy and a narrow measurement range compared to those that utilize a camera. In spite of the better performance, camera-based screen-golf sensors are not broadly employed in the screen-golf market because they remain expensive compared with other screen-golf sensors. In this study, a new type of camera-based sensor system that captures multi-exposure images and ball tracking algorithms are suggested. These measure the initial condition of a flying golf ball from captured images. The suggested system was verified in an environment equal to that of a real screen-golf store1.
Index Terms — Multi-exposure image, Ball tracking, Vision sensor, Golf simulator, and Screen-golf.
I. INTRODUCTION People love ball sports, such as soccer, baseball, basketball,
volleyball, tennis, golf and others. In proportion to the popularity, the sports industry has a large market, including clothes, equipment, broadcasting, and computer games for sports. In contrast, the consumer electronics market had a small portion of the consumer markets. However, with the rapid development of the entertainment industry, there has been a considerable amount of research that has analyzed various ball sports [2], [3] and simulated them with a computer [16]. In the early period, development focused on the analysis of physical movement by precise measurements by manufacturers of balls or golf club. Recently, however, there have been attempts to apply these sensor systems to a realistic sports game such as screen-golf. Screen-golf has already achieved great commercial success. The commercial scale reached $1 billion in 2009 in South Korea.
Screen-golf is a realistic sports game that is played indoors
1Jaewook Jung, Hanbit Park, Shin Kang, Seungwoo Lee, and Minsoo Hahn
are with the Digital Media Lab, KAIST, Seoul, South Korea. (e-mail: [email protected], [email protected], [email protected], and [email protected], [email protected]).
with real golf clubs and a ball, as in real golf. It consists of a graphic simulation engine, an interior, networking, and a sensor. The sensor measures the initial conditions of a flying golf ball, including the velocity, horizontal angle and vertical angle. Among the components, the sensor is the most important component to simulate the ball trajectory from the measured initial conditions of a flying ball [1].
To measure the initial conditions, there are various sensor systems, including infrared (IR) LED types, radar types, laser types, and camera types. Originally, golf equipment companies developed radar-type sensors to check the performance of golf clubs and balls outside. These systems have high measurement resolution and are robust to poor lighting conditions, but they are expensive. IR LED and laser sensors can comprise a low-cost sensor system and be installed easily [4], [5]. At the beginning of the screen-golf industry, most screen-golf company’s employed IR LED type sensors. This type has a narrow detection range for a flying golf ball as well as low accuracy. In the beginning, consumers were satisfied playing golf regardless of the time and weather. Moreover, it is cheaper than playing golf at an outdoor golf course. In East Asia, golf is an expensive sport on account of the few golf courses there. However, consumers now require better accuracy and a broader measurement range. As a result, screen-golf companies have challenged the market to develop advanced IR LED type sensors and camera-type sensors.
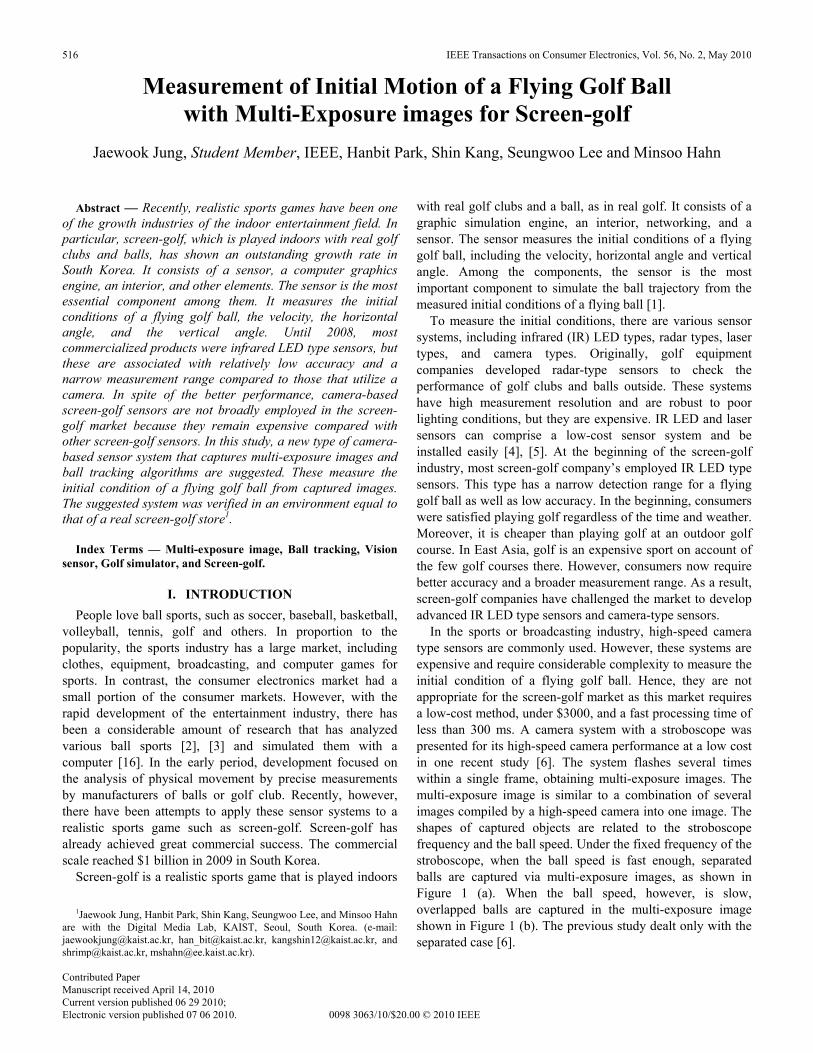
In the sports or broadcasting industry, high-speed camera type sensors are commonly used. However, these systems are expensive and require considerable complexity to measure the initial condition of a flying golf ball. Hence, they are not appropriate for the screen-golf market as this market requires a low-cost method, under $3000, and a fast processing time of less than 300 ms. A camera system with a stroboscope was presented for its high-speed camera performance at a low cost in one recent study [6]. The system flashes several times within a single frame, obtaining multi-exposure images. The multi-exposure image is similar to a combination of several images compiled by a high-speed camera into one image. The shapes of captured objects are related to the stroboscope frequency and the ball speed. Under the fixed frequency of the stroboscope, when the ball speed is fast enough, separated balls are captured via multi-exposure images, as shown in Figure 1 (a). When the ball speed, however, is slow, overlapped balls are captured in the multi-exposure image shown in Figure 1 (b). The previous study dealt only with the separated case [6].
516 IEEE Transactions on Consumer Electronics, Vol. 56, No. 2, May 2010
(a) (b)
Fig. 1. Multi-exposure images captured by the proposed system. (a) A separated case (Velocity = 57.3 m/s), and (b) An overlapped case (Velocity = 9.5 m/s). The yellow circle indicates the ball area.
In the separated case, the captured balls have nearly a circle shape. There are many previous studies [7], [8] that detected such circles and suggested faster methods [9], [10]. However, the processing time of many circle detection algorithms, including CHT and its variations, increases dramatically when the radius of the circle used in the detection is not fixed. Due to these limitations, existing methods are not suitable for application to a screen-golf environment.
In the overlapped case, the captured image is similar to a blurred image under a non-stroboscopic environment. Previous studies reconstructed the 3D path of the ball movement from a single perspective image [11], [12]. They used high-resolution images in which the diameter of the ball was approximately 80 pixels. A high resolution is not appropriate for a screen-golf system due to the cost and the processing time for commercialization.
In multi-exposure images, a stroboscope generates shade on the flying ball [6]. Therefore, using a circle fitting over the contour extracted from the shaded image was inherently inaccurate. To solve the shade phenomenon, one study [14] found that the border of the side on which the light is coming is clearer on the ball. Two sides of a rectangle in which the light came in were used as a tracking window to locate the ball. However, a method to find the light direction was not included, and the direction of the light was reduced to four sides of a rectangle. Another study [15] used a mask to detect the ball by adjusting the mask according to a given light direction. However, as in another study [14], the authors of that study failed to calculate and apply the light direction from their images dynamically.
The aforementioned systems and studies are not suitable for a screen-golf sensor system because the screen-golf market requires a low level of time complexity, a low cost, high accuracy, and ball tracking algorithms for both separated images and overlapped images.
The present study introduces a camera-based sensor system with two ball tracking algorithms to measure the velocity, the horizontal angle, and the vertical angle of a flying golf ball. The proposed sensor system consists of two mono cameras, one stroboscope, and one synchronizing controller. Initially, the synchronizing controller simultaneously triggers two cameras and one stroboscope and captures multi-exposure images from two cameras at the same time. Second, the proposed algorithms extract the 2D center points of balls from
the separated image and the overlapped image. The former includes the estimated solution of the direction of the light for the shade phenomenon, and the latter measures the overlapped images of various shapes. Finally, the system reconstructs 3D positions by applying the Direct Linear Transformation (DLT) method to the extracted 2D points, thus measuring the initial conditions [13].
The sensor system was installed and the accuracy, the processing time, and the shot detection rate were verified under the same environmental conditions of commercialized screen-golf. It was also installed in conjunction with an actual commercialized game engine of a screen-golf company in South Korea and the performance there was verified in actual commercialized game situations.
II. THE PROPOSED SENSOR SYSTEM The suggested sensor system with two algorithms can
capture a multi-exposure image of a flying golf ball and measures initial conditions from the multi-exposure image. The suggested camera system consists of two mono cameras, one stroboscope, and one synchronizing module.
As an imaging device, a CCD type mono camera was employed in the proposed system. It provides a frame resolution of 320 by 240 pixel resolution, an internal shutter, and a hardware trigger port for multi-camera synchronization. A stroboscope was used to capture a multi-exposure image with two cameras. It consists of one hundred LED pieces with an intensity of 2000 lx at a distance 3 m from itself. The frequency of the stroboscope was fixed at 330 Hz. Under the fixed frequency, the captured multi-exposure images were divided into two types, the separated cases in Figure 1 (a) and the overlapped cases in Figure 1 (b). A separated case usually occurred when the ball speed exceeded 25 m/s and the captured balls are separated precisely in one frame. An overlapped case occurred when the speed was under 25 m/s; the captured balls in this case become a single blob in one frame. There are two suggested algorithms, the separated ball tracking (SBT) algorithm and the overlapped ball tracking (OBT) algorithm. If the system can change the stroboscope frequency and always acquires one type of image, a single algorithm is sufficient to measure all ranges of ball speeds. However, a variable frequency is not suitable for screen-golf, as the system cannot correctly predict the ball velocity of the players. Players’ shots will be different, even if the game conditions, the course or the weather are identical.
The synchronizing controller provides the hardware trigger signal to each camera and to the stroboscope. Therefore, two cameras can simultaneously capture images under the same lighting conditions. Synchronization is very important so as to reconstruct the 3D position precisely using the 2D points acquired from the two cameras. The synchronizing controller operates at 75 Hz to trigger the stroboscope and the two cameras at the same time, as shown in Figure 2. In the stroboscope, a 100 μs-long flash is internally triggered three times by one triggering signal and a multi-exposure image is
J. Jung et al.: Measurement of Initial Motion of a Flying Golf Ball with Multi-Exposure images for Screen-golf 517
captured. In Figure 2, the each strobe flash (second row) inside one frame (third row) has a gap of 3.03 ms with a gap of 7.16 ms between different frames. This operation method was the developed for the first version. A critical problem, however, revolved around the intensity of the light. The light intensity was measured at 47 actual screen-golf stores. The stores employed IR LED type sensors without a stroboscope. The average intensity of the light was 205 lx, and the brightest store was 605 lx. In the brightest condition, the proposed system experiences nearly 30 % light noise because the developed stroboscope has an intensity of 2000 lx. In the second version, an internal shutter of a camera was employed to ensure a more robust system to bright lighting conditions. In Figure 2, the internal shutter of the camera (fourth row) is synchronized with the stroboscope. As a result, the acquired images are exposed for only three times at 100 μs-long within one frame of 13.33 ms. This has an effect on preventing light noise.
Fig. 2. Timing. (First row) The timing of the triggering signal by the synchronizing controller, (Second row) The flash timing of stroboscope, (Third row) The timing of camera shutter in the first version, and (Fourth row) The timing of the camera shutter in the second version.
The proposed sensor system captures sequential multi-
exposure images of a flying ball and measures the initial conditions in 3D by extracting 2D points from the captured images. This process has seven steps. First, the sensor system synchronizes the two cameras and the stroboscope using a synchronizing controller. Second, the system starts to capture sequential frames after a successful synchronization. Third, the system checks weather or not a ball is placed on the swing plate. If a ball is present, the system measures the initial ball position. Fourth, the system monitors the point of the placed ball to detect a swing and captures 9 frames after the swing. Thus 18 frames are captured by two cameras. Fifth, the SBT algorithm and the OBT algorithm are applied to the captured images. The SBT algorithm uses 5 frames and the OBT algorithm uses 9 frames; a ball travelling at a speed greater than 25 m/s is not captured after the fifth frame among 9
frames. As a result of the application of two algorithms, the system extracts the 2D center points of a flying golf ball from the multi-exposure image. Sixth, the 3D positions are then constructed through the DLT method, and the initial condition of the flying golf ball, the velocity, the horizontal angle, and the vertical angle are measured. Finally, the system selects the proper initial conditions as measured by the OBT algorithm and the SBT algorithm.
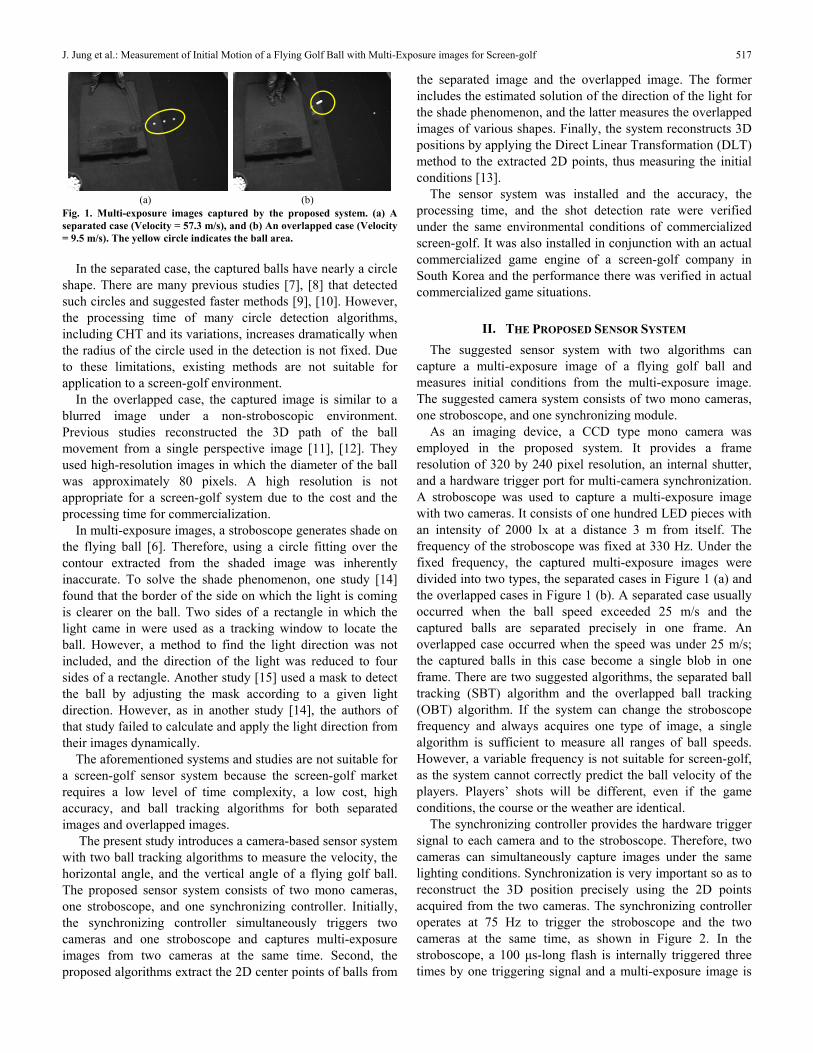
Fig. 3. Installation of the proposed system. The environment is equal to the commercialized screen-golf store. The gray rectangle is used to hide the company logo on the bottom-right of the projected screen.
The proposed system was installed in an environment
identical to that used at a commercialized screen-golf store, as shown in Figure 3. The room has 5 components consisting of the proposed camera systems, a PC, a beam projector, a screen, and a swing plate. One wall of the room serves as the screen, and a beam projector projects simulated graphics onto this. On the swing plate, a player places a golf ball and hits the ball. Two cameras are positioned on the ceiling and are filming downward. The angle of view and the installed position of the two cameras are different, as shown in Figure 3. The stroboscope is positioned on top of the ceiling over the player’s head. It tilts slightly toward the screen to provide more light for the flying ball. The space area is comprised a space of approximately 4 m from the swing plate to the screen, a height of 3 m from the swing plate to the ceiling, and a width of 4 m. This is the average size of a screen-golf room in South Korea.
III. SEPARATED BALL TRACKING ALGORITHM In the separated case, a captured multi-exposure image has
three separate balls because the stroboscope flashes three times during one frame, as shown in Figure 4 (a). Additionally, each ball is shaded by the lighting. The acquired ball does not display a circular shape but has an ellipse shape owing to the shade phenomenon.
The separated ball tracking (SBT) algorithm detects the ball area; extracts the center points from the balls; and measures the initial conditions of a flying golf ball, the velocity, the horizontal angle, and the vertical angle. The SBT algorithm has 6 steps. The first step allows the captured images to find moving objects easier. The second step generates two types of images applying different threshold values from the acquired image in the first step. The third step detects the ball regions using the two images generated in the previous step. The fourth step estimates the light direction from the stroboscope by solving the shade phenomenon. This enhances the accuracy. The fifth step uses half circle fitting to extract the center point from the acquired multi-exposure images. Finally, the sixth step reconstructs the 3D positions by applying the DLT method to the extracted 2D points obtained in the fifth step. As a result, the proposed sensor system measures the initial conditions from the separated images.
518 IEEE Transactions on Consumer Electronics, Vol. 56, No. 2, May 2010
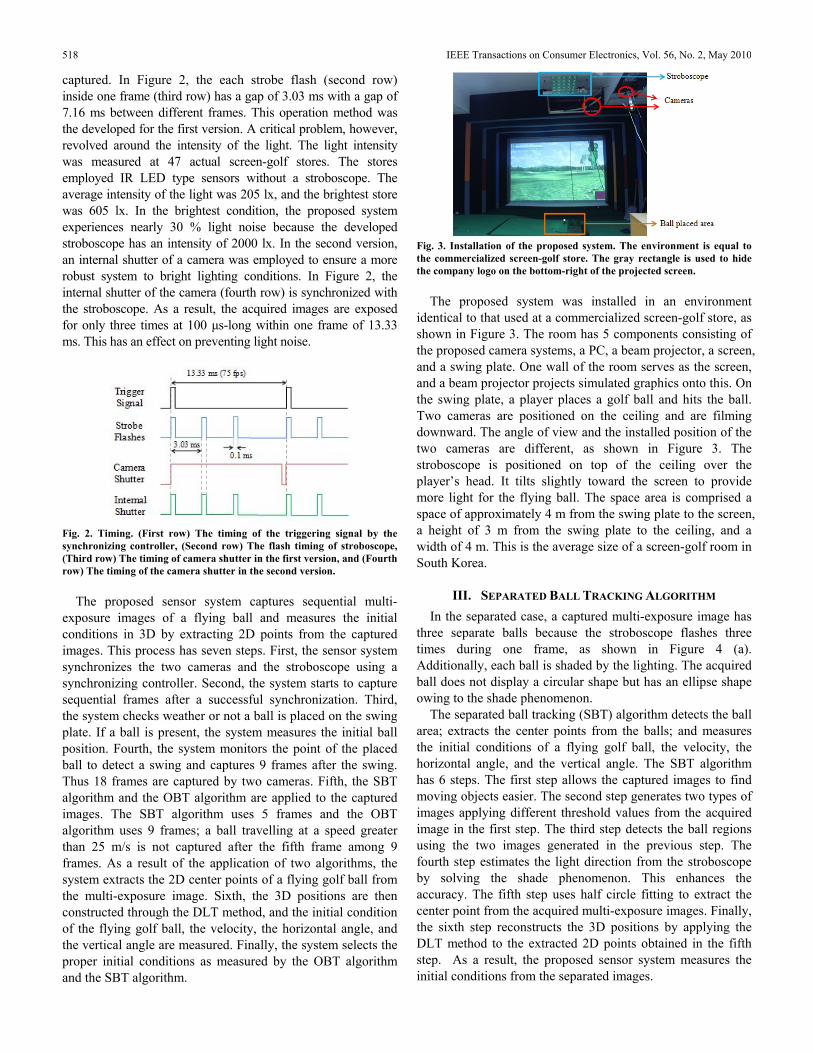
(a) (b) (c)
Fig. 4. The first step. (a) Captured image, (b) Background image, and (c) Difference image from the original image to the background image.
In the first step, the SBT algorithm eliminates the background information by subtracting a prepared background image from captured images. Figure 4 (b) shows a background image containing unmoving objects ,whereas Figure 4 (a) displays a captured image containing the moving objects of the flying golf ball, the club and the player’s body. The objective of the subtraction process is to retain the moving objects and eliminate the unmoving objects. Figure 4 (c) shows the subtraction result. It includes only the moving objects, the club and the golfer’s body with three separated balls.
(a) (b)
(c) (d)
Fig. 5. The second step. (a) Type A image, (b) Type B image, (c) The magnification ball area of the type A image, and (d) Ball area of the type B image. The blue circle is the body of the golfer, the red circle is the clubface, and the yellow circle is the ball.
In the second step, the SBT algorithm preprocesses the difference image and creates two types of images by adopting two threshold values. During the preprocessing procedure, the SBT algorithm adopts Gaussian blurring and normalization to retain only the white golf balls. However, most of the results also retain other objects, and this obstructs the finding of the ball regions within the image and decreases the accuracy of the measurements. To solve this problem, the SBT algorithm generates two types of images, the Type A image shown in Figure 5 (a) and the Type B shown in Figure 5 (b). The Type A image applies a low threshold value of 20 (near the 8 % level) and weak Gaussian blurring, whereas the Type B image applies a high threshold value of 55 (near the 22% level) and strong Gaussian blurring. As a result, the Type A image retains most of the information. Therefore, it is used to obtain precise center points upon further processing, as shown in Figure 5 (a), (c). The Type B image excludes most objects except golf balls, but the ball data are also damaged, as shown in Figure 5 (b), (d).
The third step sets the region of interest (ROI), including the ball candidates, using the Type B images. The ball data are damaged in Type B images but other objects are mostly excluded. Therefore, the use of a Type B image is feasible for finding the areas containing the balls. Initially, the SBT algorithm extracts contours from Type B images and checks all acquired contours as to whether or not they are ball candidate regions. There are two rules to estimate contours. The first is the contour size and the second is the width-height ratio of a circumscribed rectangle to the contour. Consequently, unfeasible contours which are too big or too small as well as those that have too wide or too narrow a ratio are excluded. If a contour satisfies the two rules, the SBT algorithm assumes that a contour is a ball candidate area. Secondly, the SBT algorithm extracts center points from the selected contour in the Type B images. Finally, it sets a ROI in a Type A image because Type B images experience a loss of information in the second step. In this step, a general algorithm cannot be used to detect ball candidates such as a CHT owing to the high level of time complexity.
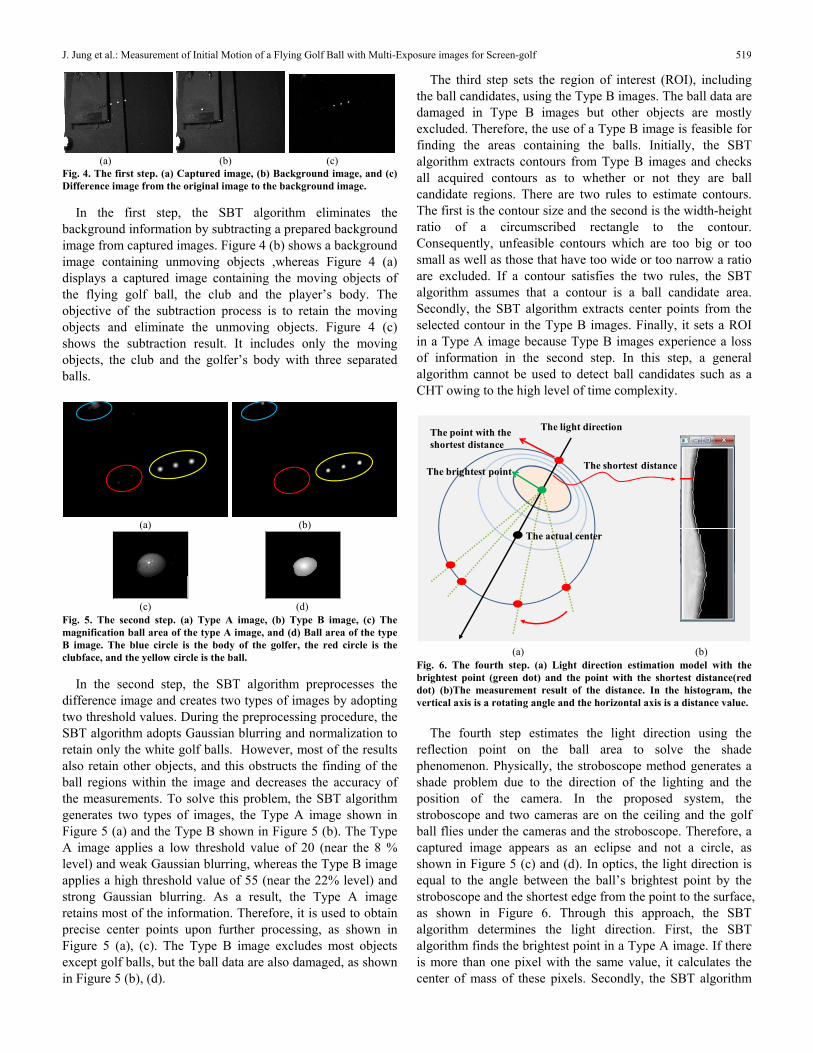
The shortest distance
The actual center
The light direction
The brightest point
The point with the shortest distance
(a) (b)
Fig. 6. The fourth step. (a) Light direction estimation model with the brightest point (green dot) and the point with the shortest distance(red dot) (b)The measurement result of the distance. In the histogram, the vertical axis is a rotating angle and the horizontal axis is a distance value.
The fourth step estimates the light direction using the
reflection point on the ball area to solve the shade phenomenon. Physically, the stroboscope method generates a shade problem due to the direction of the lighting and the position of the camera. In the proposed system, the stroboscope and two cameras are on the ceiling and the golf ball flies under the cameras and the stroboscope. Therefore, a captured image appears as an eclipse and not a circle, as shown in Figure 5 (c) and (d). In optics, the light direction is equal to the angle between the ball’s brightest point by the stroboscope and the shortest edge from the point to the surface, as shown in Figure 6. Through this approach, the SBT algorithm determines the light direction. First, the SBT algorithm finds the brightest point in a Type A image. If there is more than one pixel with the same value, it calculates the center of mass of these pixels. Secondly, the SBT algorithm
J. Jung et al.: Measurement of Initial Motion of a Flying Golf Ball with Multi-Exposure images for Screen-golf 519
measures the distance from the brightest point to the ball’s contour with 360° rotation around the brightest point. Finally, it determines the point that has the shortest distance from the brightest point, as shown in Figure 6. The angle between the two points is the light direction.
(a) (b) (c) (d)
Fig. 7. The fifth step. (a) Shaded ball, (b) Inaccurate half circle fitting, (c) Rotating the shaded ball using the light direction, and (d) Accurate half circle fitting. The red circle is the brightest point, and the white arrow is the light direction. The green dot is the extracted center point.
The fifth step utilizes half circle fitting with the light
direction for the ball candidates and extracts the center point of a flying golf ball. If it uses half circle fitting without considering the light direction, the system extracts the inaccurate center points of the golf ball due to the shade shown in Figure 7 (b). First, the SBT algorithm rotates the ball candidate through a difference angle between the light direction and the vertical axis, as shown in Figure 7 (c). Second, it uses half circle fitting and extracts the center points of the flying golf ball, as shown in Figure 7 (d).
Finally, the sensor system can measure the initial conditions of a flying golf ball from the separated multi-exposure images by using the suggested SBT algorithm.
IV. OVERLAPPED BALL TRACKING ALGORITHM In the overlapped case, a captured multi-exposure image
has one blob consisting of three connected golf balls owing to the low speed of less than 25 m/s, as shown in Figure 8 (a). The overlapped images have various shapes of blobs, as shown in Figure 9 (a)-(c). Moreover, interference occurs due to objects such as the golf club, as shown in Figure 9 (d) and the clubface has higher intensity than the golf ball, as shown in Figure 9 (e).
The overlapped ball tracking (OBT) algorithm also measures the initial conditions of a flying golf ball, but a different method is suggested compared to that used with the SBT algorithm due to the different properties of the overlapped images, as shown in Figure 9. The OBT algorithm has 8 steps. The first step makes the captured images suitable for detecting moving objects. The second step generates a binary image with a high threshold value to determine the direction of the flight of the ball. The third step finds the direction of the flight of the ball via two methods. The fourth step sets the ROI and the fifth step checks whether or not the ROI is usable. The sixth step extracts two center point candidate by half circle fitting and the seventh step adjusts the candidates more precisely. The final step reconstructs the 3D positions by DLT and measures the initial conditions.
(a) (b) (c)
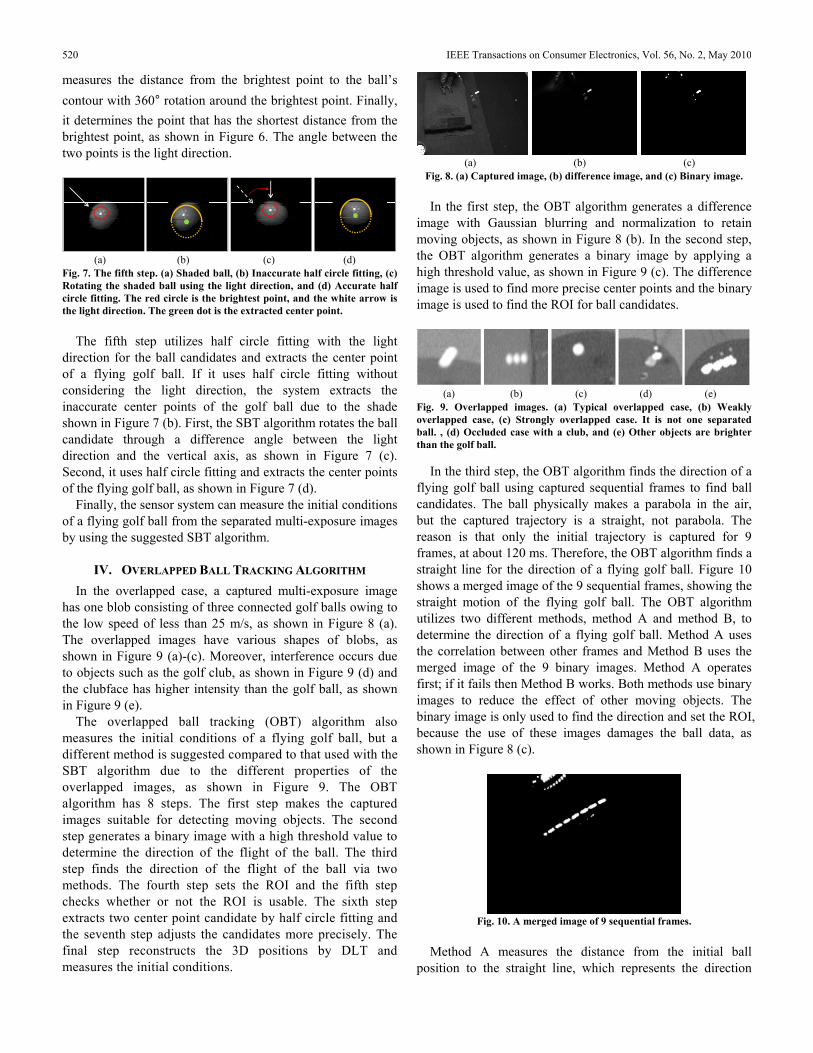
Fig. 8. (a) Captured image, (b) difference image, and (c) Binary image. In the first step, the OBT algorithm generates a difference
image with Gaussian blurring and normalization to retain moving objects, as shown in Figure 8 (b). In the second step, the OBT algorithm generates a binary image by applying a high threshold value, as shown in Figure 9 (c). The difference image is used to find more precise center points and the binary image is used to find the ROI for ball candidates.
(a) (b) (c) (d) (e)
Fig. 9. Overlapped images. (a) Typical overlapped case, (b) Weakly overlapped case, (c) Strongly overlapped case. It is not one separated ball. , (d) Occluded case with a club, and (e) Other objects are brighter than the golf ball.
In the third step, the OBT algorithm finds the direction of a flying golf ball using captured sequential frames to find ball candidates. The ball physically makes a parabola in the air, but the captured trajectory is a straight, not parabola. The reason is that only the initial trajectory is captured for 9 frames, at about 120 ms. Therefore, the OBT algorithm finds a straight line for the direction of a flying golf ball. Figure 10 shows a merged image of the 9 sequential frames, showing the straight motion of the flying golf ball. The OBT algorithm utilizes two different methods, method A and method B, to determine the direction of a flying golf ball. Method A uses the correlation between other frames and Method B uses the merged image of the 9 binary images. Method A operates first; if it fails then Method B works. Both methods use binary images to reduce the effect of other moving objects. The binary image is only used to find the direction and set the ROI, because the use of these images damages the ball data, as shown in Figure 8 (c).
Fig. 10. A merged image of 9 sequential frames.
Method A measures the distance from the initial ball
position to the straight line, which represents the direction
520 IEEE Transactions on Consumer Electronics, Vol. 56, No. 2, May 2010
candidate of a flying golf ball. First, Method A finds all center point candidates from the 9 binary images and merges all of these points into one frame, as shown in Figure 11 (a). Secondly, it draws all possible straight lines between the points, as shown in Figure 11 (b). The number of possible lines is n C2 , and ‘n’ is the number of point candidates. Third, the OBT algorithm checks the perpendicular distance between the line and the initial ball position. This is shown in Figure 11 (c). The line with the shortest distance is determined as the direction candidate of a flying golf ball due to the straight moving characteristic from the initial position. If the selected shortest distance is greater than the size of one ball, the OBT determines that method A is fails and adopts method B.
(a) (b) (c)
Fig. 11. Method A. (a) All points candidate (White) and the initial ball point (Yellow), (b) All possible straight lines, and (c) The most closed line (Orange). It is the direction of a flying golf ball.
Method B merges 9 sequential captured fames into one image, as shown in Figure 10, and draws a scanning line with the initial ball point as an anchor point as shown in Figure 12 (a). The scanning line measures the pixel intensity on each line while rotating from -100° to +100°, as shown in Figure 12 (a), and the OBT algorithm determines the line with the highest value as the direction of the flying golf balls, as shown in Figure 12 (b).
(a) (b)
Fig. 12. Method B. (a) Scanning for finding the direction, and (b) The line with the highest value (Orange) which is the direction of a flying ball.
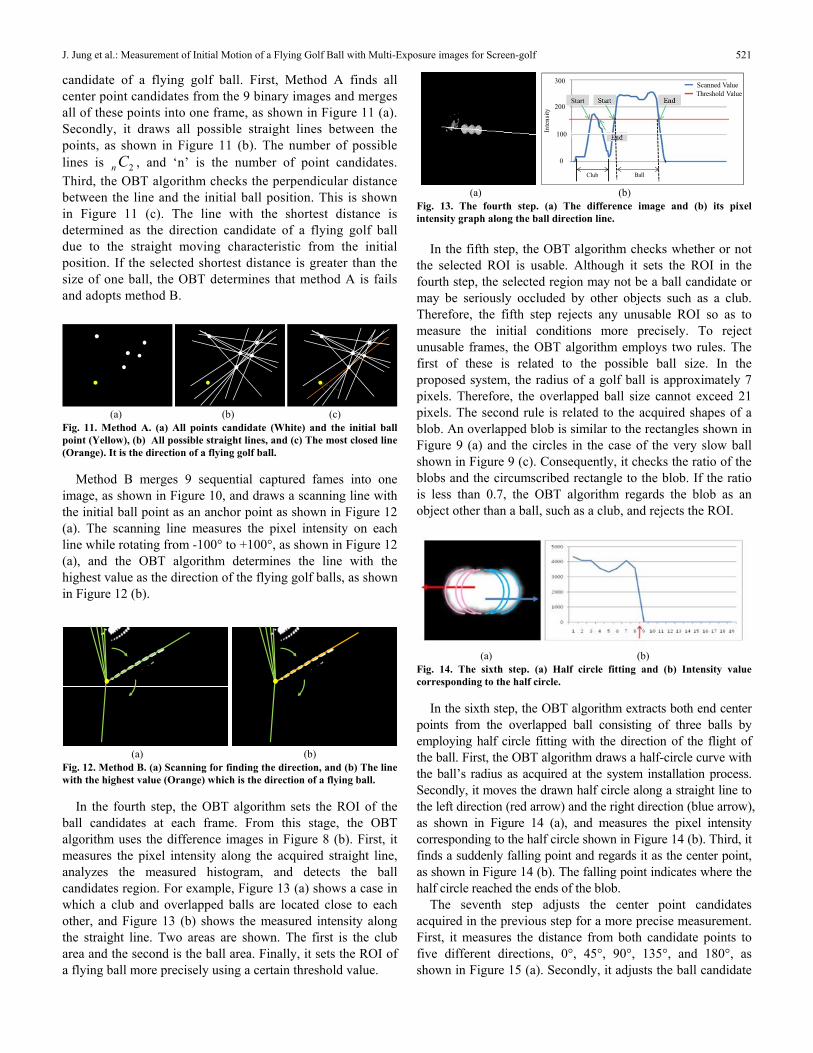
In the fourth step, the OBT algorithm sets the ROI of the ball candidates at each frame. From this stage, the OBT algorithm uses the difference images in Figure 8 (b). First, it measures the pixel intensity along the acquired straight line, analyzes the measured histogram, and detects the ball candidates region. For example, Figure 13 (a) shows a case in which a club and overlapped balls are located close to each other, and Figure 13 (b) shows the measured intensity along the straight line. Two areas are shown. The first is the club area and the second is the ball area. Finally, it sets the ROI of a flying ball more precisely using a certain threshold value.
Club
0
100
200Start
300
Threshold ValueScanned Value
Ball
Inte
nsity
(a) (b)
Fig. 13. The fourth step. (a) The difference image and (b) its pixel intensity graph along the ball direction line.
In the fifth step, the OBT algorithm checks whether or not
the selected ROI is usable. Although it sets the ROI in the fourth step, the selected region may not be a ball candidate or may be seriously occluded by other objects such as a club. Therefore, the fifth step rejects any unusable ROI so as to measure the initial conditions more precisely. To reject unusable frames, the OBT algorithm employs two rules. The first of these is related to the possible ball size. In the proposed system, the radius of a golf ball is approximately 7 pixels. Therefore, the overlapped ball size cannot exceed 21 pixels. The second rule is related to the acquired shapes of a blob. An overlapped blob is similar to the rectangles shown in Figure 9 (a) and the circles in the case of the very slow ball shown in Figure 9 (c). Consequently, it checks the ratio of the blobs and the circumscribed rectangle to the blob. If the ratio is less than 0.7, the OBT algorithm regards the blob as an object other than a ball, such as a club, and rejects the ROI.
(a) (b)
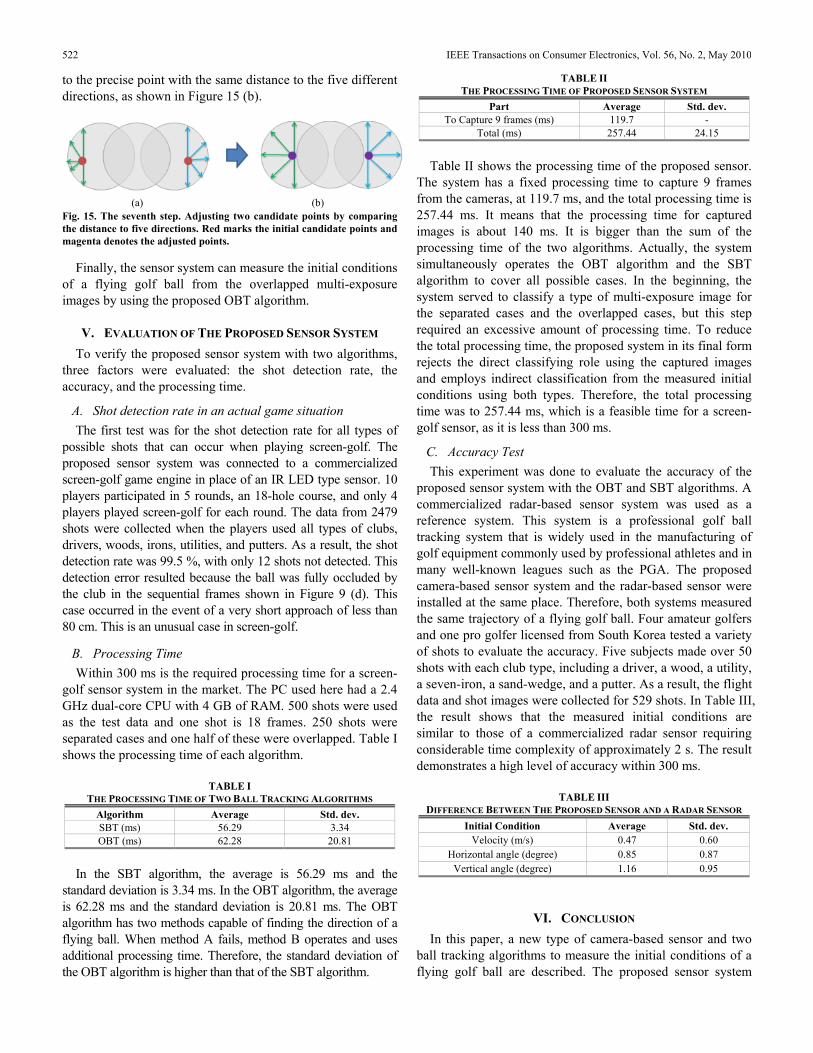
Fig. 14. The sixth step. (a) Half circle fitting and (b) Intensity value corresponding to the half circle.
In the sixth step, the OBT algorithm extracts both end center points from the overlapped ball consisting of three balls by employing half circle fitting with the direction of the flight of the ball. First, the OBT algorithm draws a half-circle curve with the ball’s radius as acquired at the system installation process. Secondly, it moves the drawn half circle along a straight line to the left direction (red arrow) and the right direction (blue arrow), as shown in Figure 14 (a), and measures the pixel intensity corresponding to the half circle shown in Figure 14 (b). Third, it finds a suddenly falling point and regards it as the center point, as shown in Figure 14 (b). The falling point indicates where the half circle reached the ends of the blob.
The seventh step adjusts the center point candidates acquired in the previous step for a more precise measurement. First, it measures the distance from both candidate points to five different directions, 0°, 45°, 90°, 135°, and 180°, as shown in Figure 15 (a). Secondly, it adjusts the ball candidate
J. Jung et al.: Measurement of Initial Motion of a Flying Golf Ball with Multi-Exposure images for Screen-golf 521
to the precise point with the same distance to the five different directions, as shown in Figure 15 (b).
(a) (b)
Fig. 15. The seventh step. Adjusting two candidate points by comparing the distance to five directions. Red marks the initial candidate points and magenta denotes the adjusted points.
Finally, the sensor system can measure the initial conditions of a flying golf ball from the overlapped multi-exposure images by using the proposed OBT algorithm.
V. EVALUATION OF THE PROPOSED SENSOR SYSTEM To verify the proposed sensor system with two algorithms,
three factors were evaluated: the shot detection rate, the accuracy, and the processing time.
A. Shot detection rate in an actual game situation The first test was for the shot detection rate for all types of
possible shots that can occur when playing screen-golf. The proposed sensor system was connected to a commercialized screen-golf game engine in place of an IR LED type sensor. 10 players participated in 5 rounds, an 18-hole course, and only 4 players played screen-golf for each round. The data from 2479 shots were collected when the players used all types of clubs, drivers, woods, irons, utilities, and putters. As a result, the shot detection rate was 99.5 %, with only 12 shots not detected. This detection error resulted because the ball was fully occluded by the club in the sequential frames shown in Figure 9 (d). This case occurred in the event of a very short approach of less than 80 cm. This is an unusual case in screen-golf.
B. Processing Time Within 300 ms is the required processing time for a screen-
golf sensor system in the market. The PC used here had a 2.4 GHz dual-core CPU with 4 GB of RAM. 500 shots were used as the test data and one shot is 18 frames. 250 shots were separated cases and one half of these were overlapped. Table I shows the processing time of each algorithm.
TABLE I
THE PROCESSING TIME OF TWO BALL TRACKING ALGORITHMS Algorithm Average Std. dev. SBT (ms) 56.29 3.34 OBT (ms) 62.28 20.81
In the SBT algorithm, the average is 56.29 ms and the
standard deviation is 3.34 ms. In the OBT algorithm, the average is 62.28 ms and the standard deviation is 20.81 ms. The OBT algorithm has two methods capable of finding the direction of a flying ball. When method A fails, method B operates and uses additional processing time. Therefore, the standard deviation of the OBT algorithm is higher than that of the SBT algorithm.
TABLE II THE PROCESSING TIME OF PROPOSED SENSOR SYSTEM
Part Average Std. dev. To Capture 9 frames (ms) 119.7 -
Total (ms) 257.44 24.15
Table II shows the processing time of the proposed sensor. The system has a fixed processing time to capture 9 frames from the cameras, at 119.7 ms, and the total processing time is 257.44 ms. It means that the processing time for captured images is about 140 ms. It is bigger than the sum of the processing time of the two algorithms. Actually, the system simultaneously operates the OBT algorithm and the SBT algorithm to cover all possible cases. In the beginning, the system served to classify a type of multi-exposure image for the separated cases and the overlapped cases, but this step required an excessive amount of processing time. To reduce the total processing time, the proposed system in its final form rejects the direct classifying role using the captured images and employs indirect classification from the measured initial conditions using both types. Therefore, the total processing time was to 257.44 ms, which is a feasible time for a screen-golf sensor, as it is less than 300 ms.
C. Accuracy Test This experiment was done to evaluate the accuracy of the
proposed sensor system with the OBT and SBT algorithms. A commercialized radar-based sensor system was used as a reference system. This system is a professional golf ball tracking system that is widely used in the manufacturing of golf equipment commonly used by professional athletes and in many well-known leagues such as the PGA. The proposed camera-based sensor system and the radar-based sensor were installed at the same place. Therefore, both systems measured the same trajectory of a flying golf ball. Four amateur golfers and one pro golfer licensed from South Korea tested a variety of shots to evaluate the accuracy. Five subjects made over 50 shots with each club type, including a driver, a wood, a utility, a seven-iron, a sand-wedge, and a putter. As a result, the flight data and shot images were collected for 529 shots. In Table III, the result shows that the measured initial conditions are similar to those of a commercialized radar sensor requiring considerable time complexity of approximately 2 s. The result demonstrates a high level of accuracy within 300 ms.
TABLE III DIFFERENCE BETWEEN THE PROPOSED SENSOR AND A RADAR SENSOR
Initial Condition Average Std. dev. Velocity (m/s) 0.47 0.60
Horizontal angle (degree) 0.85 0.87 Vertical angle (degree) 1.16 0.95
VI. CONCLUSION In this paper, a new type of camera-based sensor and two
ball tracking algorithms to measure the initial conditions of a flying golf ball are described. The proposed sensor system
522 IEEE Transactions on Consumer Electronics, Vol. 56, No. 2, May 2010

captures a flying golf ball to a multi-exposure image using a stroboscope and shows performance similar to that of a high-speed camera. From the captured multi-exposure images, two algorithms measure the initial conditions of a flying golf ball to simulate a ball trajectory in a screen-golf setting. The separated ball tracking (SBT) algorithm estimates the light direction to solve the shade phenomenon and tracks a fast ball in a separated multi-exposure image. The overlapped ball tracking (OBT) algorithm tracks a slow ball from an overlapped multi-exposure image with various shapes and when it is occluded by other objects.
In an experiment, the proposed system and algorithms were verified in an environment equal to that of a commercialized screen-golf store. First, the performance of shot detection was tested in an actual game situation with the proposed sensors connected to a commercialized screen-golf graphic engine. The detection rate result was 99.5%. Secondly, the measurement accuracy was compared to that of a commercialized radar-type sensor typically used by golf equipment companies. There was little difference between two systems. Finally, the response time was also enough as fast as the screen-golf sensor.
This study focused on a low-cost camera-based sensor system with low time complexity and a highly accurate algorithm for multi-exposure images to measure the initial conditions of a flying golf ball. The measurement of a club path to infer ball spin is a necessary future work.
REFERENCES [1] K. Masuda, K. Yataka, Y. Chujo, K. Kondo and K. Iijima,
"Measurement of initial conditions of a flying golf ball," Proc. IEEE Int. Conf. Instrumentation and Measurement Technology, pp.344-347, 1994.
[2] B. Han, Y. Hu, G. Wang, W. Wu, and T. Yoshigahara, "Enhanced Sports Video Shot Boundary Detection Based on Middle Level Features and a Unified Model," IEEE Transactions on Consumer Electronics, vol.53, Issue.3, pp.1168-1176, 2007.
[3] H.G. Kim, J. Jeong, J.H. Kim, and J. Kim, "Real-time highlight detection in baseball video for TVs with time-shift function," IEEE Transactions on Consumer Electronics, vol.54, no.2, pp.831-838, 2008.
[4] J. E. Bae, G. T. Park, J. W. Kim, H. S. Park and H. J. Kim, "Extraction of golf ball features based on perpendicular planar sensor," Proc. IEEE Intl. Conf. on Consumer Electronics, pp.515-516, 2010.
[5] J.E. Bae, J.W. Kim, H.J. Kim and H. S. Park, "Estimation of 3-D Trajectory of the Golf Ball Using Dual Linear Sensor," Proc. Int. Conf. on INC, IMS and IDC, pp.2024-2030, 2009.
[6] C. Theobalt, I. lbrecht, J. Haber, M. Magnor, and H.P. Scidel, "Pitching a baseball - tracking high-speed motion with multi-exposure images," ACM Transactions on Graphics, vol. 23, Issue. 3, pp.540-547, 2004.
[7] D. Ben-Tzvi and M.B. Sandler, “A combinatorial Hough transform,” Pattern Recognition Letters, vol. 11, Issue. 3, pp.167-174, 1990.
[8] T.C. Chen and K.L. Chung, “An efficient randomized algorithm for detecting circles,” Computer Vision and Image Understanding, vol. 83, Issue. 2, pp.172-191, 2001.
[9] A.A. Rad, K. Faez and N. Qaragozlou, “Fast circle detection using gradient pair vectors,” Proc. Conf. Digital Image Computing: Techniques and Applications, pp.879-887, 2003.
[10] S. Zhilin and Q. Feihu, “A novel algorithm for fast circle detection using randomized Hough transform,” Computer Engineering, China, vol. 29, Issue. 6, pp.87-89, 2003.
[11] G. Boracchi, V. Caglioti and A. Giusti, "Ball Position and Motion Reconstruction from Blur in a Single Perspective Image," Proc. Int. Conf. on Image Analysis and Processing, pp.87-92, 2007.
[12] V. Caglioti and A. Giusti, "Recovering ball motion from a single motion-blurred image,” Computer Vision and Image Understanding, vol. 113, Issue. 5, pp.590-597, 2009.
[13] H. Hatze, “High-precision three-dimensional photogrammetric calibration and object space reconstruction using a modified DLT-approach”, Journal of Biomechanics, vol. 21, Issue. 7, pp.533-538, 1988.
[14] H. Shum and T. Komura, "Tracking the translational and rotational movement of the ball using high-speed camera movies," Proc. IEEE Int. Conf. on Image Processing, vol. 3, pp.1084-1087, 2005.
[15] T. D. Orazio, N. Ancona, G. Cicirelli and M. Nitti, "A ball detection algorithm for real soccer image sequences," Proc. Int. Conf. on Pattern Recognition, vol. 1, pp.210-213, 2002.
[16] S.H. Lee, Y.I. Yoon, J.H. Choi, C.W. Lee, J.T. Kim and J.S. Choi, "AR Squash Game,” Proc. IEEE Int. Conf. on Information Reuse and Integration, pp.579-584, 2006.
BIOGRAPHIES
Jaewook Jung received B.S. degree in electronics engineering from Ajou University, Suwon, South Korea, in 2004. He received the M.S. degree from the Korea Advanced Institute of Science and Technology (KAIST), Daejeon, South Korea in 2006. In 2007, he joined the National Institute of Information and Communications Technology (NICT), Japan, where he was involved in
research on a home energy management system. Currently, he is pursuing his Ph.D. at the Korea Advanced Institute of Science and Technology (KAIST), Daejeon, South Korea. His research interests include human-computer interaction, sensor based user interface, entertainment computing and sports simulator.
Hanbit Park received B.S. degree in Information and Communications engineering from Korea University of Technology and Education, Cheonan, South Korea, in 2008. Currently, he is pursuing his M.S. at the Korea Advanced Institute of Science and Technology (KAIST), Daejeon, South Korea. His research interests include user interface, physical computing and tangible media.
Shin Kang received B.S. degree in computer and information engineering from INHA University, Incheon, South Korea, in 2008. He received the M.S. degree from the Korea Advanced Institute of Science and Technology (KAIST), Daejeon, South Korea, in 2010. Since 2010, he has been a researcher at Ineducator, Seoul, South Korea. His research interests include image processing, human-
computer interaction and augmented reality.
Seungwoo Lee received B.S. degree in computer science from Ajou University, Suwon, South Korea, in 2007. He received the M.S. degree from the Korea Advanced Institute of Science and Technology (KAIST), Daejeon, South Korea, in 2010. Since 2010, he has been a researcher at Satrec Initiative. His research interests include augmented reality and interactive environment
Minsoo Hahn received the B.S. and the M.S. degrees in electrical engineering from Seoul National University, Seoul, South Korea, in 1979 and 1981, respectively, and the Ph.D. degree in electrical and electronics engineering from the University of Florida, Florida, U.S.A., in 1989. From 1982 to 1985, he was with the Korea Research Institute of Standards and Science (KRISS), Daejeon,
South Korea. From 1990 to 1997, he was with the Electronics and Telecommunications Research Institute (ETRI), Daejeon, South Korea. In 1998, he became a faculty member of the School of Engineering, Information and Communications University. Currently, he is a Full Professor and a Director in the Digital Media Laboratory, KAIST. His research interests include speech and audio coding, speech synthesis, noise reduction, and VoIP.
J. Jung et al.: Measurement of Initial Motion of a Flying Golf Ball with Multi-Exposure images for Screen-golf 523