measurement of heat and mechanical losses in
TRANSCRIPT
Sudan University of science and technology
COLLEGE OF ENGINEERING
School of mechanical engineering
DEPARTMENT OF POWER
A Project Submitted In Partial Fulfillment for the Requirement
of the Degree of B.Sc. (Honor) In Mechanical Engineering
Measurement of Heat and
Mechanical Losses in Internal
Combustion engines
Prepared by:
1. Fayad Idris Ahmed Mohammed.
2. Mohammed Taj Elser Ali Abdallah.
3. M men Hassan Abdelrahman Taha.
Supervised by:
Eltayeb Hassan Elshaikh
(September 2015)

-I-
قال تعالى :

-II-
DEDICATION
We dedicate this research to all our friends and families, our
great teachers, and brothers in 27 mech.

-III-
صاحب انشكس و انعسفا انعزز اناانحد هلل أوال و أخسا
وانصالة وانسالو عهى يعهى انبشست و صاحب انخهق انسفع
عهه و عهى آل بته و أصحابه أتى انصالة و انتسهى
انطب حس انشخ \انشكس يىصىل نألستاذ
انري كا نه د انفضم بعد اهلل عز وجم بتىجهه وزعاته نهرا انبحث
أضا ندزست انهدست انكاكتوانشكس يىصىل
يثهت ف أساترتها انكساو
و ألساترة وزشت انسازاث بقسى انقدزة
وكم ي ساهى ف إخساج هرا انبحث
-IV-
ABSTRACT
This thesis focuses on measurement of the heat and mechanical losses
in I.C.engines based on a gasoline engine data operated on different engine
speeds. The objective is to determine the classic and modern methods of
measurement the heat and mechanical losses. The transfer of energy is
measured for losses to the engine coolant and exhaust, usable power output, as
well as friction losses. A major part of the energy is lost with the exhaust
gases. In addition, another major part of energy input is rejected in the form of
heat via the cooling system. Energy loss increases with increasing engines
speed and load and thus the mechanical efficiency decreases. Future
improvements to obtain distinguishable results are outlined.

-V-
انتجسدة
ف يحزكاث انكاكتزارت تزكش ذ األطزحت عهى قباص انفقداث انح
اندف ي ذ األطزحت دراست األسانب انطزق انقدت .اإلحتزاق انداخه
انحدثت نقاص انفقداث انحزارت انكاكت ف يحزكاث اإلحتزاق انداخه . نحزك
،ادة انقدرة انفزيهت انستف ،دشل تى قاص انفقداث بسبب انتبزد غاساث انعادو
باإلضافت إنى جشء ،انقدرة اإلحتكاكت . جشء كبز ي انطاقت تى فقدا ف غاساث انعادو
كبز أضا باسطت ياة انتبزد .
انفقداث انحزارت انكاكت تشد بشادة انسزعت اندرات نهحزك يا ؤدي
اث ف انستقبم نهحصل عه تائج إنى قصا انكفاءة انكاكت . ال بد ي تحس
أفضم .
-VI-
LIST OF CONTENTS
Content Page
I االت
DEDICATION II
III شكز عزفا
ABSTRACT IV
V انتجزدة
LIST OF CONTENTS VI
LIST OF FIGURES VIII
LIST OF TABLES IX
CHAPTER ONE
INTRODUCTION
1.1 Research Importance 2
1.2 Research Problem 3
1.3 Research Objective 3
1.4 Research Methodology 3
CHAPTER TWO
LITERATURE REVIEW
2.1 Introduction 5
2.2 Internal combustion engines 5
2.3 Engine performance 7
2.4 Calorific value of fuels 8
2.5 Performance Parameters 9
Previous studies 15
CHAPTER THREE
METHODS OF MEASUREMENT OF HEAT AND
MECHANICAL LOSSES
3.1 Measurement of Heat Losses 23
3.1.1 Heat Balance Sheet 23
3.2 Measurement of mechanical losses 27
3.2.1 Measurement of brake power 27
-VII-
3.2.2 Important types of dynamometers 28
Content Page
3.2.3 Methods of measurement of mechanical losses 36
3.2.3.1 The Willan‘s line method 36
3.2.3.2 The Morse test 38
3.2.3.3 Motoring test 38
3.2.3.4 Difference between I.P. and B.P. 40
3.3 Engine Test cells 42
3.3.1 Overall size of individual test cells 44
3.3.2 General purpose automotive engine test cells 46
3.3.3 Research and development engine and
Power-train test cells
48
3.3.4 Automotive engine production test cells
(hot test)
50
3.3.5 Cold testing in production 51
3.3.6 Engine handling systems 52
CHAPTER FOUR
PRACTICAL TRAILS
4.1 Morse test 55
4.2 Engine heat balance sheet 61
CHAPTER FIVE
CONCLUSION AND RECOMMENDATION
5.1 Conclusion 66
5.2 Recommendations 67
References 68
-VIII-
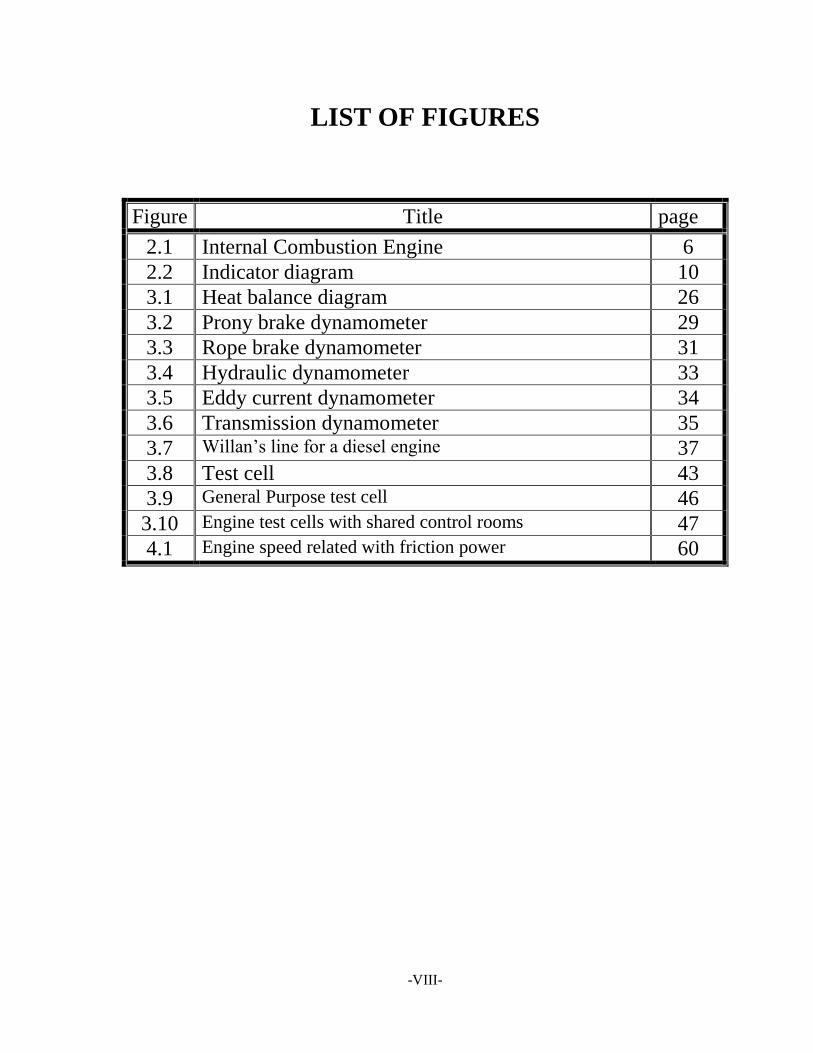
LIST OF FIGURES
Figure Title page
2.1 Internal Combustion Engine 6
2.2 Indicator diagram 10
3.1 Heat balance diagram 26
3.2 Prony brake dynamometer 29
3.3 Rope brake dynamometer 31
3.4 Hydraulic dynamometer 33
3.5 Eddy current dynamometer 34
3.6 Transmission dynamometer 35
3.7 Willan‘s line for a diesel engine 37
3.8 Test cell 43
3.9 General Purpose test cell 46
3.10 Engine test cells with shared control rooms 47
4.1 Engine speed related with friction power 60
-IX-
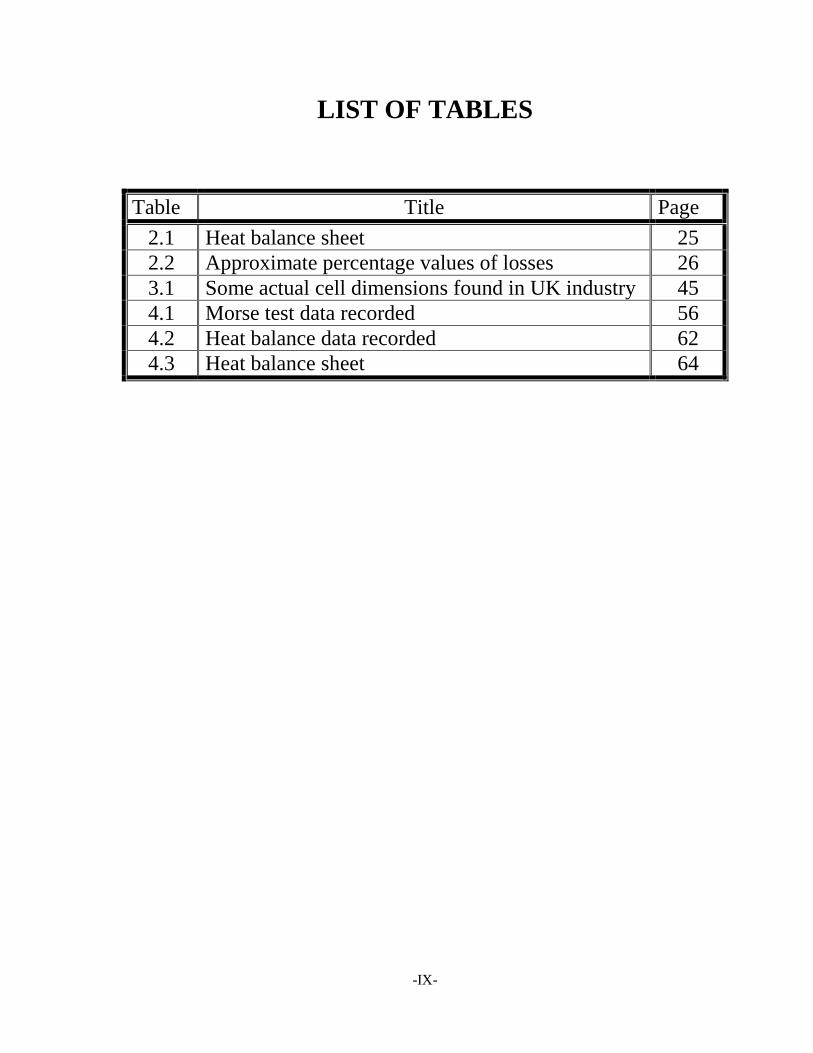
LIST OF TABLES
Table Title Page
2.1 Heat balance sheet 25
2.2 Approximate percentage values of losses 26
3.1 Some actual cell dimensions found in UK industry 45
4.1 Morse test data recorded 56
4.2 Heat balance data recorded 62
4.3 Heat balance sheet 64

CHAPTER ONE
-2-
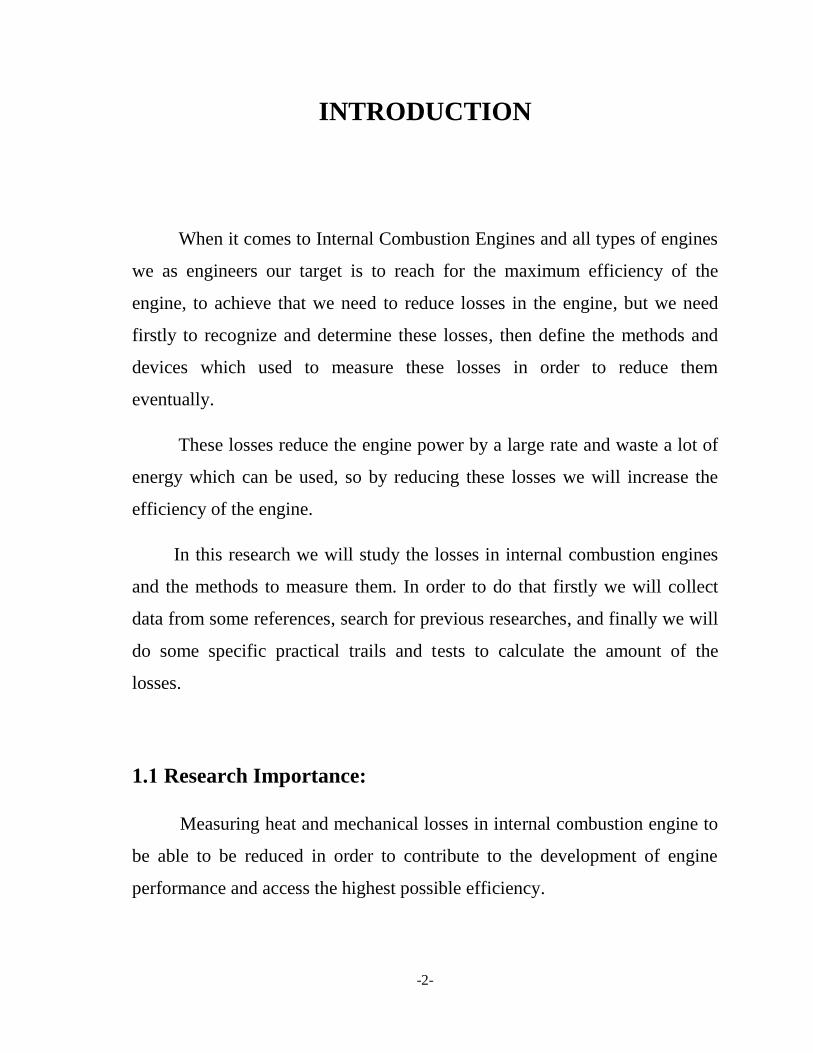
INTRODUCTION
When it comes to Internal Combustion Engines and all types of engines
we as engineers our target is to reach for the maximum efficiency of the
engine, to achieve that we need to reduce losses in the engine, but we need
firstly to recognize and determine these losses, then define the methods and
devices which used to measure these losses in order to reduce them
eventually.
These losses reduce the engine power by a large rate and waste a lot of
energy which can be used, so by reducing these losses we will increase the
efficiency of the engine.
In this research we will study the losses in internal combustion engines
and the methods to measure them. In order to do that firstly we will collect
data from some references, search for previous researches, and finally we will
do some specific practical trails and tests to calculate the amount of the
losses.
1.1 Research Importance:
Measuring heat and mechanical losses in internal combustion engine to
be able to be reduced in order to contribute to the development of engine
performance and access the highest possible efficiency.
-3-
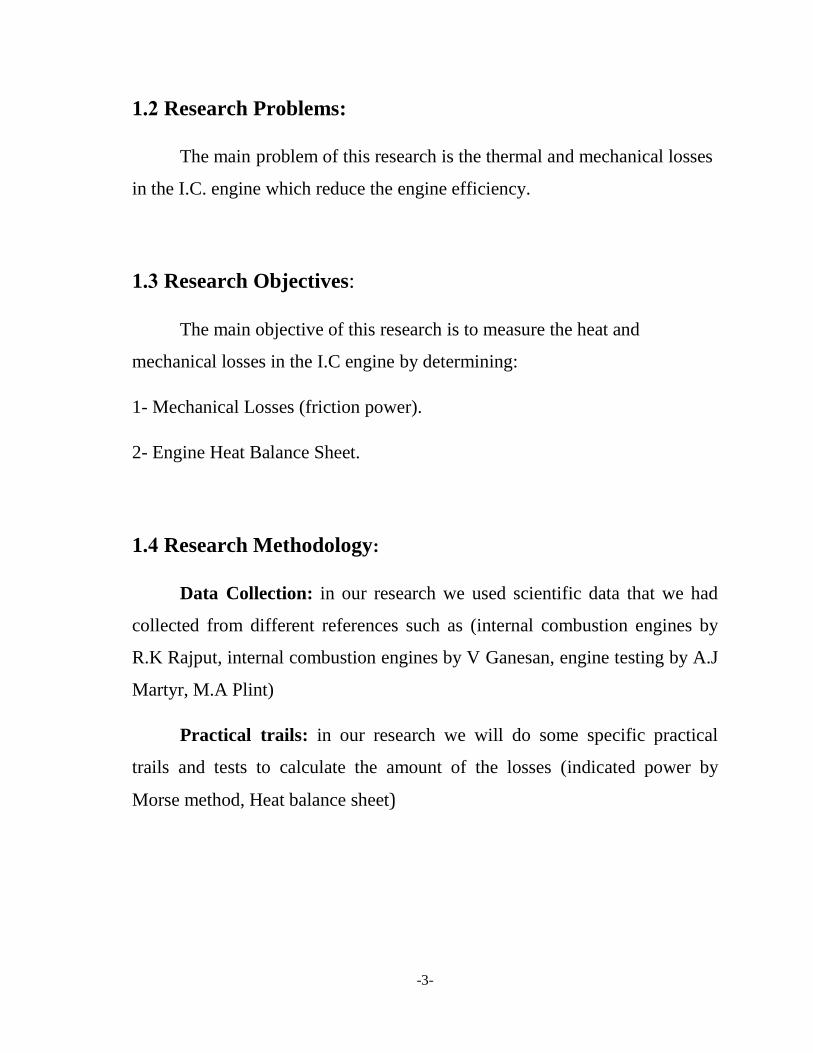
1.2 Research Problems:
The main problem of this research is the thermal and mechanical losses
in the I.C. engine which reduce the engine efficiency.
1.3 Research Objectives:
The main objective of this research is to measure the heat and
mechanical losses in the I.C engine by determining:
1- Mechanical Losses (friction power).
2- Engine Heat Balance Sheet.
1.4 Research Methodology:
Data Collection: in our research we used scientific data that we had
collected from different references such as (internal combustion engines by
R.K Rajput, internal combustion engines by V Ganesan, engine testing by A.J
Martyr, M.A Plint)
Practical trails: in our research we will do some specific practical
trails and tests to calculate the amount of the losses (indicated power by
Morse method, Heat balance sheet)

CHAPTER TWO
-5-
LITERATURE REVIEW
2.1 Introduction:
Generally we define heat engines as any type of engine or machine
which derives heat energy from the combustion of fuel or any other source
and convert this energy into mechanical work.
Heat engines may be classified into two main classes as follow:
I. External combustion engines.
II. Internal combustion engines.
2.2 Internal combustion engines:
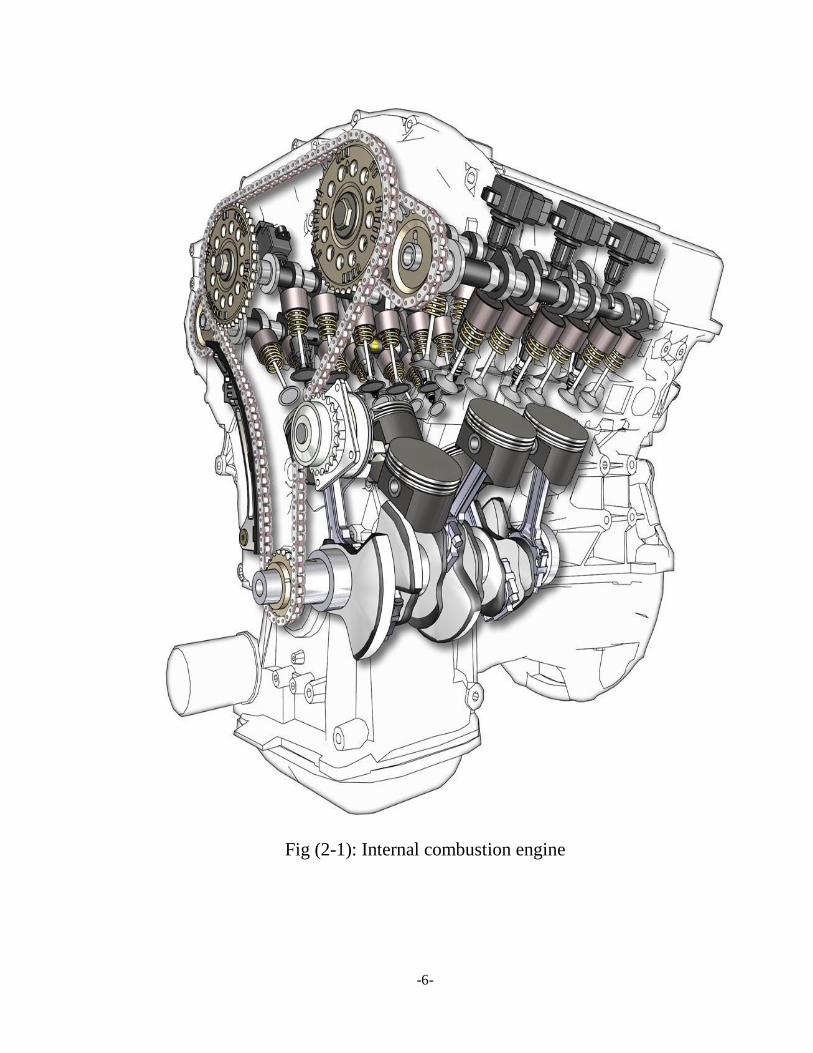
In this case, combustion of fuel with oxygen of air occurs within the
cylinder of the engine. The internal combustion engines group includes
engines employing mixtures of combustible gases and air, known as gas
engines, those using lighter liquid fuel or spirit known as petrol engines and
those using heavier liquid fuels known as oil compression ignition or diesel
engines.
-6-
Fig (2-1): Internal combustion engine
-7-
2.3 Engine performance:
One ultimate measure of the performance of an internal combustion
engine is the proportion of the heat of combustion of the fuel that is turned
into useful work at the engine coupling. The thermal efficiency at full load of
internal combustion engines ranges from about 20 per cent for small gasoline
engines up to more than 50 per cent for large slow-running diesel engines,
which are the most efficient means currently available of turning the heat of
combustion of fuel into mechanical power.
It is useful to have some idea of the theoretical maximum thermal
efficiency that is possible, as this sets a target for the engine developer.
Theoretical thermodynamics allows us, within certain limitations, to predict
this maximum value. The proportion of the heat of combustion that is not
converted into useful work appears elsewhere: in the exhaust gases, in the
cooling medium and as convection and radiation from the hot surfaces of the
engine. In addition, there may be appreciable losses in the form of unburned
or late burning fuel. It is important to be able to evaluate these various losses.
Of particular interest are losses from the hot gas in the cylinder to the
containing surfaces, since these directly affect the indicated power of the
engine. The so-called ‗adiabatic engine‘ seeks to minimize these particular
losses.
-8-
2.4 Calorific value of fuels:
The calorific value of a fuel is defined in terms of the amount of heat
liberated when a fuel is burned completely in a calorimeter.
Since all hydrocarbon fuels produce water as a product of combustion,
part of these products (the exhaust gas in the case of an I.C.Engine) consists
of steam. If, as is the case in a calorimeter, the products of combustion are
cooled to ambient temperature, this steam condenses, and in doing so gives up
its latent heat. The corresponding measure of heat liberated is known as the
higher or gross calorific value (also known as gross specific energy). If no
account is taken of this latent heat we have the lower or net calorific value
(also known as net specific energy). Since there is no possibility of an internal
combustion engine making use of the latent heat, it is the invariable practice
to define performance in terms of the lower calorific value.
-9-
2.5 Performance Parameters:
The basic performance parameters of internal combustion engine
(I.C.E) may be summarized as follows:
2.5.1 Indicated power (I.P.):
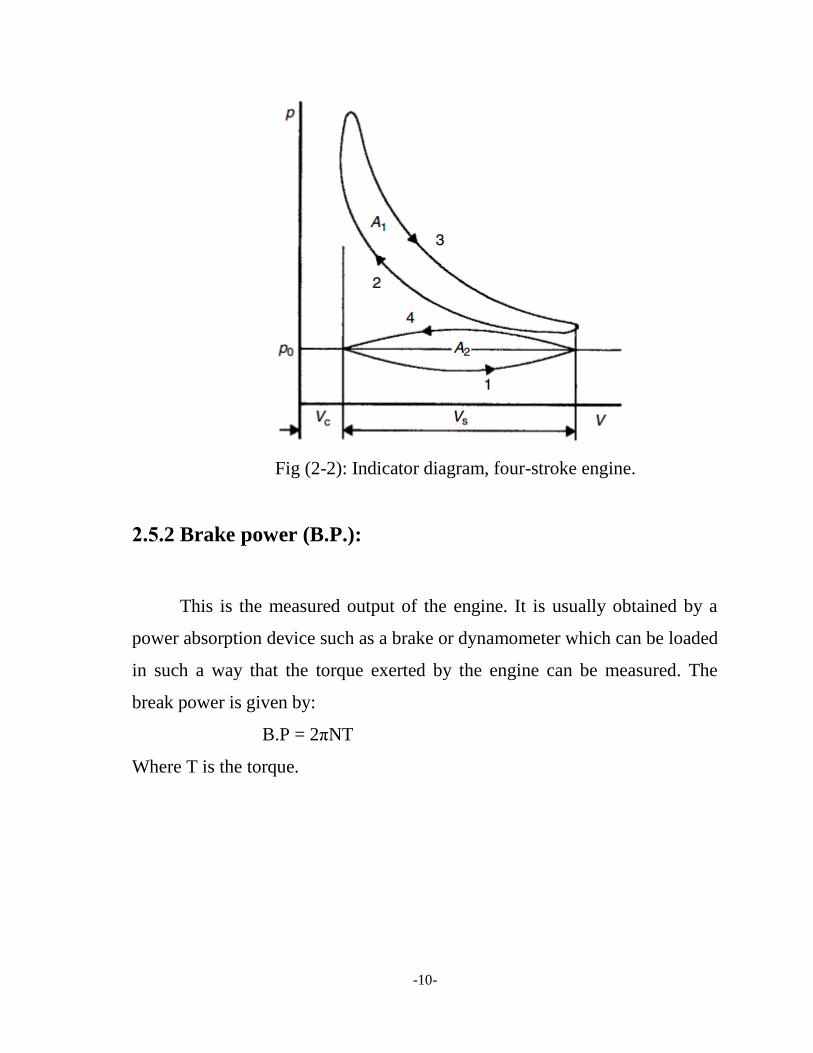
It is the actual rate of work done by the working fluid on the piston. As
its name implies, the I.P. can be determined from an "indicator diagram" as
show in figure (1), by subtracting the pumping loop area (- ve) from the
positive area of the main diagram. I.P. power could be estimated by
performing a Morse test on the engine. The physical equation for the I.P. is:
I.P = PmLAN
Where N is the number of machine cycles per unit times, which is 1/2
the rotational speed for a four- stroke engine, and the rotational speed for a
two- stroke engine.
-10-
Fig (2-2): Indicator diagram, four-stroke engine.
2.5.2 Brake power (B.P.):
This is the measured output of the engine. It is usually obtained by a
power absorption device such as a brake or dynamometer which can be loaded
in such a way that the torque exerted by the engine can be measured. The
break power is given by:
B.P = 2πNT
Where T is the torque.
-11-
2.5.3 Friction power (F.P.) and Mechanical efficiency (ηm):
The difference between the I.P. and the B.P. is the friction power (F.P)
and is that power required to overcome the frictional resistance of the engine
parts,
F.P. = I.P. – B.P.
The mechanical efficiency of the engine is defined as:
ηm =
ηm is usually between 80% and 90%.
2.5.4 Indicated mean effective pressure (IMEP):
It is a hypothetical pressure which if acting on the engine piston during
the working stroke would results in the indicated work of the engine. This
means it is the height of a rectangle having the same length and area as the
cycle plotted on a p- v diagram.
IMEP (Pi) =
× Indicator scale
Consider one engine cylinder:
Work done per cycle = Pi AL
Where: A = area of piston; L = length of stroke
-12-
Work done per min. = work done per cycle × active cycles per min.
I.P. = Pi AL× active cycles/ min
To obtain the total power of the engine this should be multiplied by the
number of cylinder n, i.e.:
Total I.P. = PiALNn/2 ) four- stroke engine (
And
= PiALNn ) Two- stroke engine (
2.5.5 Brake mean effective pressure (BMEP) and brake thermal
efficiency:
The BMEP (B.P) may be thought of as that mean effective pressure
acting on the pistons which would give the measured B.P., i.e.
B.P. = Pb AL × active cycles/ min
The overall efficiency of the engine is given by the brake thermal efficiency:
ηBT =
Where mf is the mass of fuel consumed per unit time, and Qnet is the lower
calorific value of the fuel.
-13-
2.5.6 Specific fuel consumption (S.F.C):
It is the mass of fuel consumed per unit power output per hour, and is a
criterion of economic power production.
Low values of S.F.C. are obviously desired. Typical best values of
B.S.F.C. for SI engines are about 270g/kw.h, and for C.I. engines are about
200g/kw.h.
2.5.7 Indicated thermal efficiency (ηIT):
It is defined in a similar way to ηBT
Dividing ηBT by ηIT gives
-14-
2.5.8 Volumetric efficiency (ηv):
Volumetric efficiency is only used with four- stroke cycle engines. It is
defined as the ratio of the volume if air induced, measured at the free air
conditions, to the swept volume of the cylinder:
The air volume may be refereed to N.T.P. to give a standard
comparison.
The volumetric efficiency of an engine is affected by many variables such as
compression ratio, valve timing, induction and port design, mixture strength,
latent heat of evaporation of the fuel, heating of the induced charge, cylinder
pressure, and the atmospheric conditions.
-15-
2.6 Previous Studies:
Here are some examples of previous studies in Measurement of Heat
and Mechanical Losses in I.C.Engines:
2.6.1 First Study:
Title:
MEASUREMENT OF MECHANICAL LOSSES IN THE COMBUSTION
ENGINES
By:
Andre Drab, Stanislav Beroun, Robert Vozenilek (Technical University of
Liberec, Department of Vehicles and Engines /2011)
As the basis of the testing station for measuring mechanical losses in
piston combustion engine by induced revolution there serves a regulating
induction motor of the firm SIEI, type MA 133 K-62, with the output 28
kW/6000 1/min. The torque during induced revolution is measured by a shaft
pick-up HBM of the type T20WN (100 Nm, 0.2%, 10000 1/min), or by a
pick-up HBM T5 (50 Nm, 0.1%, 4000 1/min) – both pick-ups can be
overloaded statically to 200% of nominal value of Mt. Because of the required
range of r. p.m., the basic configuration of the testing rig is equipped with the
pick-up T20WN.
-16-
Measurement system:
The testing rig for induced revolution of the engine is coupled with a data
logger MGC plus (Hottinger), allowing to record 2.400 samples of data per
second in the 8-channel version of the amplifier. Each sample comprehends
the data from the pick-up of the torque (Mt and revolutions) and from 13
temperature pick-ups (Pt 100 and thermocouples). The number of sensed
temperatures can be increased according to measuring needs. From the
effective values of the measured torque and r. p.m., the power loss is
calculated.
The operational environment for measuring passive resistances is generated
by means of the SW CAM-tan Easy. During measuring, on the PC monitor
there are displayed graphical values of measured temperatures and the time
courses of Mt and n. The values of all measured quantities (Mt, n and
temperatures) for each measured regime are established by statistic data
processing (as mean values of the data file in chosen time interval).
Results of measurement:
For the comparison of courses of the torque loss, two temperature
regimes have been chosen as the first temperature regime, 35° C have been
chosen for both media (lubrication oil and coolant/water) – for cold engine,
and as the second one, 90° C for both media (lubrication oil and
coolant/water) – for warm engine. The combustion engine has been resolved
in the range of 1.500 – 5.500 r. p.m. The step of a change of r. p.m. has been
chosen to amount to 250 r. p.m. The value at the highest measured velocity
5.500 r. p.m. is considered in the diagrams as 100 %, and other values of
-17-
measured torque loss have been related to this value. The diagrams allow
noticing the tendency of the measured torque loss to increase with increasing
r. p.m. of the revolved combustion engine. With a cold combustion engine, the
measured torque loss for the highest measured r. p.m. (5.500 r. p.m.) is 1.82
time higher than at the lowest measured velocity (1.500 r. p.m.). With a
warmed-up combustion engine (warm engine – 90o C), the difference of the
measured torque loss between 1.500 r. p.m. and 5.500 r. p.m. increases to as
much as 2.13 multiple.
Conclusion:
The verifying measuring of mechanical losses of a piston combustion
engine by means of induced revolution on the testing rig have proved full
functionality of the testing rig, both concerning the requirement to measure
the torque loss with high precision and repeatability, and maintaining stable
temperature conditions during measuring by means of regulation of
temperatures of coolant and lubrication oil. The results of measuring carried
out until now show that by means of the testing station for measuring
mechanical losses in piston combustion engines by induced revolution it is
also possible to study such characteristics of the engine that other (calculation
or experimental) procedures do not show.
-18-
2.6.2 Second Study:
Title:
ENERGY LOSSES IN A VEHICLE
Only about 15 percent of the energy from the fuel you put in your tank
gets used to move your car down the road or run useful accessories, such as
air conditioning. The rest of the energy is lost to engine and driveline
inefficiencies and idling. Therefore, the potential to improve fuel efficiency
with advanced technologies is enormous.
Engine Losses - 62.4 percent
In gasoline-powered vehicles, over 62 percent of the fuel's energy is
lost in the internal combustion engine (ICE). ICE engines are very inefficient
at converting the fuel's chemical energy to mechanical energy, losing energy
to engine friction, pumping air into and out of the engine, and wasted heat.
Advanced engine technologies such as variable valve timing and lift, turbo
charging, direct fuel injection, and cylinder deactivation can be used to reduce
these losses.
In addition, diesels are about 30-35 percent more efficient than gasoline
engines, and new advances in diesel technologies and fuels are making these
vehicles more attractive.
Idling Losses - 17.2 percent
In urban driving, significant energy is lost to idling at stop lights or in traffic.
Technologies such as integrated starter/generator systems help reduce these
-19-
losses by automatically turning the engine off when the vehicle comes to a
stop and restarting it instantaneously when the accelerator is pressed.
Accessories - 2.2 percent
Air conditioning, power steering, windshield wipers, and other
accessories use energy generated from the engine. Fuel economy
improvements of up to 1 percent may be achievable with more efficient
alternator systems and power steering pumps.
Driveline Losses - 5.6 percent
Energy is lost in the transmission and other parts of the driveline.
Technologies, such as automated manual transmission and continuously
variable transmission, are being developed to reduce these losses.
Aerodynamic Drag - 2.6 percent
A vehicle must expend energy to move air out of the way as it goes
down the road—less energy at lower speeds and progressively more as speed
increases. Drag is directly related to the vehicle's shape. Smoother vehicle
shapes have already reduced drag significantly, but further reductions of 20-
30 percent are possible.
Rolling Resistance - 4.2 percent
Rolling resistance is a measure of the force necessary to move the tire
forward and is directly proportional to the weight of the load supported by the
tire. A variety of new technologies can be used to reduce rolling resistance,
-20-
including improved tire tread and shoulder designs and materials used in the
tire belt and traction surfaces.
For passenger cars, a 5-7 percent reduction in rolling resistance
increases fuel efficiency by 1 percent. However, these improvements must be
balanced against traction, durability, and noise.
Overcoming Inertia; Braking Losses - 5.8 percent
To move forward, a vehicle's drive train must provide enough energy to
overcome the vehicle's inertia, which is directly related to its weight. The less
a vehicle weights, the less energy it takes to move it. Weight can be reduced
by using lightweight materials and lighter-weight technologies (e.g.,
automated manual transmissions weigh less than conventional automatics).
In addition, any time you use your brakes, energy initially used to
overcome inertia is lost.
Source: www.fueleconomy.gov/feg/atv.shtml
Comment:
This study about ENERGY LOSSES in vehicles as general, because it
deals with all energy losses in vehicle at all, but our research is about heat and
mechanical losses in internal combustion engine only which mean energy
losses inside the engine.
-21-
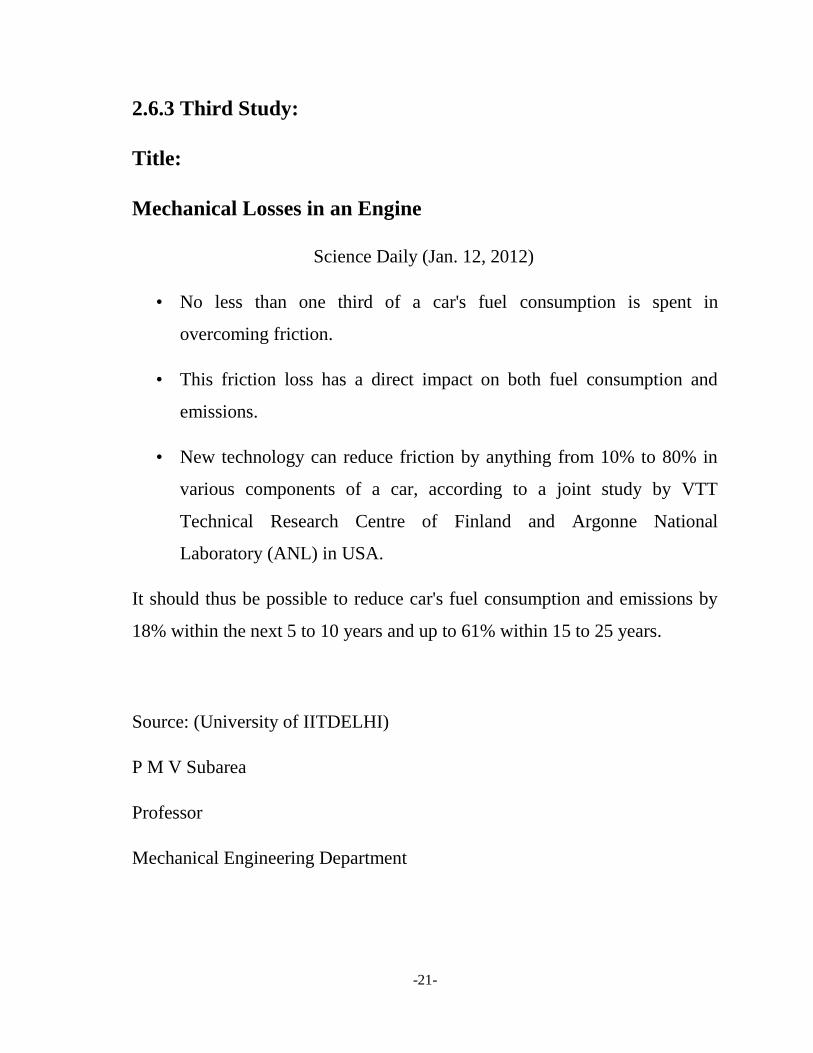
2.6.3 Third Study:
Title:
Mechanical Losses in an Engine
Science Daily (Jan. 12, 2012)
• No less than one third of a car's fuel consumption is spent in
overcoming friction.
• This friction loss has a direct impact on both fuel consumption and
emissions.
• New technology can reduce friction by anything from 10% to 80% in
various components of a car, according to a joint study by VTT
Technical Research Centre of Finland and Argonne National
Laboratory (ANL) in USA.
It should thus be possible to reduce car's fuel consumption and emissions by
18% within the next 5 to 10 years and up to 61% within 15 to 25 years.
Source: (University of IITDELHI)
P M V Subarea
Professor
Mechanical Engineering Department

CHAPTER THREE
-23-
METHODS OF MEASUREMENT OF HEAT
AND MECHANICAL LOSSES
3.1 Measurement of Heat Losses:
The thermal performance of an engine is usually studied by heat
balance-sheet.
3.1.1 Heat Balance Sheet:
The main components of the heat balance are:
• Heat equivalent to the effective (brake) work of the engine,
• Heat rejected to the cooling medium,
• Heat carried away from the engine with the exhaust gases, and
• Unaccounted losses.
The unaccounted losses include the radiation losses from the various
parts of the engine and heat lost due to incomplete combustion. The friction
loss is not shown as a separate item to the heat balance-sheet as the friction
loss ultimately reappears as heat in cooling water, exhaust and radiation.
To draw heat balance sheet for I.C.E, it is run at constant load. Indicator
diagram is obtained with the help of indicator. The quantity of fuel used in a
given time and its calorific value, the amount, inlet and outlet temperature of
cooling water and the weight of exhaust gases are recorded. After calculating
I.P. and B.P. the heat in different items is found as follows:
-24-
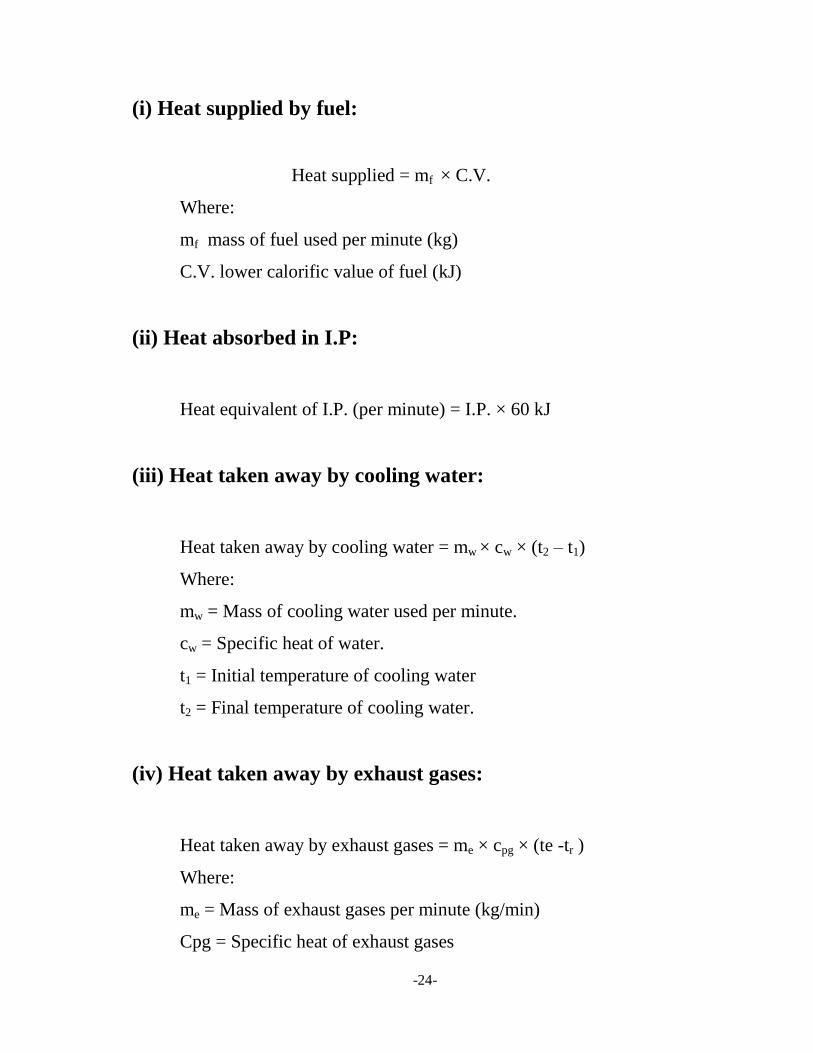
(i) Heat supplied by fuel:
Heat supplied = mf × C.V.
Where:
mf mass of fuel used per minute (kg)
C.V. lower calorific value of fuel (kJ)
(ii) Heat absorbed in I.P:
Heat equivalent of I.P. (per minute) = I.P. × 60 kJ
(iii) Heat taken away by cooling water:
Heat taken away by cooling water = mw × cw × (t2 – t1)
Where:
mw = Mass of cooling water used per minute.
cw = Specific heat of water.
t1 = Initial temperature of cooling water
t2 = Final temperature of cooling water.
(iv) Heat taken away by exhaust gases:
Heat taken away by exhaust gases = me × cpg × (te -tr )
Where:
me = Mass of exhaust gases per minute (kg/min)
Cpg = Specific heat of exhaust gases
-25-
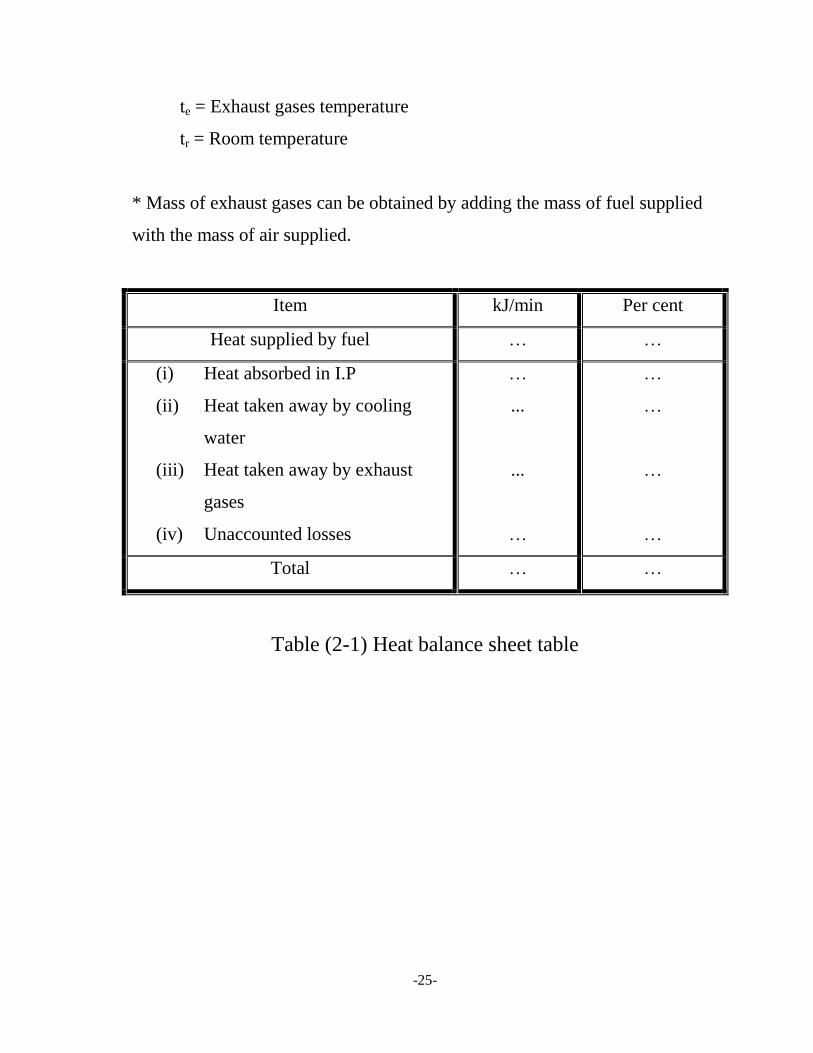
te = Exhaust gases temperature
tr = Room temperature
* Mass of exhaust gases can be obtained by adding the mass of fuel supplied
with the mass of air supplied.
Item kJ/min Per cent
Heat supplied by fuel … …
(i) Heat absorbed in I.P
(ii) Heat taken away by cooling
water
(iii) Heat taken away by exhaust
gases
(iv) Unaccounted losses
…
...
...
…
…
…
…
…
Total … …
Table (2-1) Heat balance sheet table
-26-
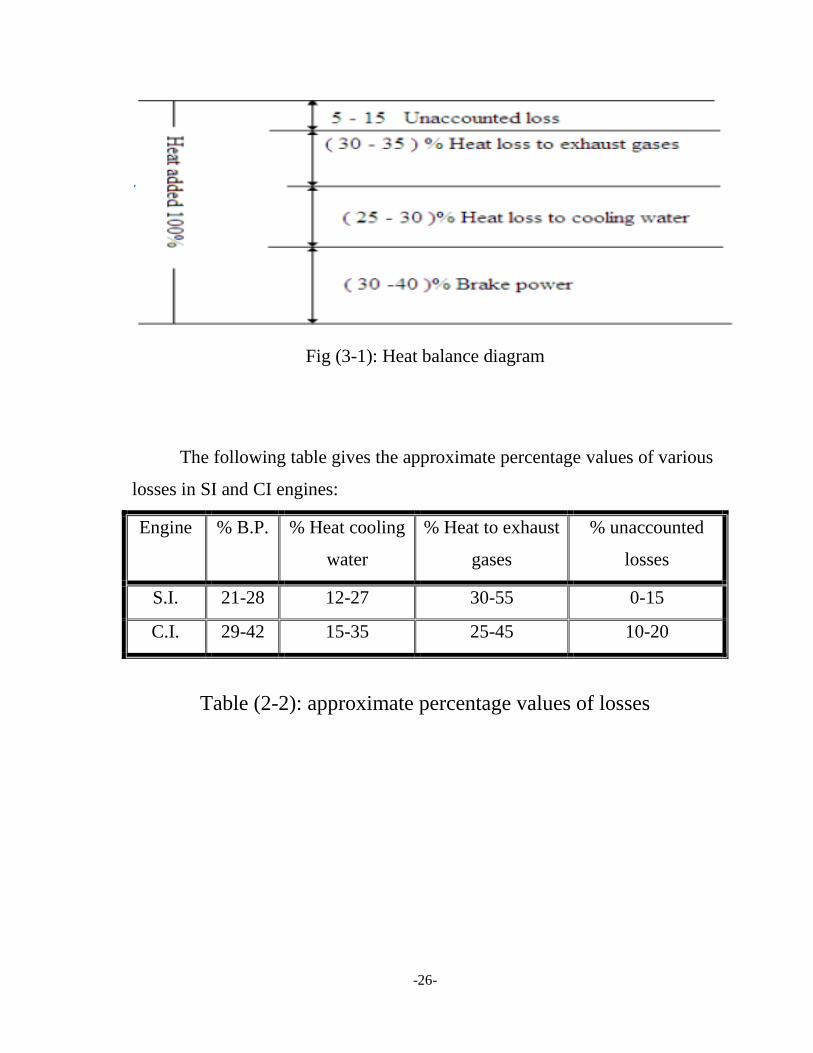
Fig (3-1): Heat balance diagram
The following table gives the approximate percentage values of various
losses in SI and CI engines:
Engine % B.P. % Heat cooling
water
% Heat to exhaust
gases
% unaccounted
losses
S.I. 21-28 12-27 30-55 0-15
C.I. 29-42 15-35 25-45 10-20
Table (2-2): approximate percentage values of losses
-27-
3.2 Measurement of mechanical losses:
It is a curious fact that, in the long run, all the power developed by all the
road vehicle engines in the world is dissipated as friction: either mechanical
friction in the engine and transmission, rolling resistance between vehicle and
road or wind resistance.
Mechanical efficiency, a measure of friction losses in the engine, is
thus an important topic in engine development and therefore engine testing. It
may exceed 80 per cent at high power outputs, but is generally lower and is of
course zero when the engine is idling.
To measure friction loss we have to measure both of indicated and
brake power.
3.2.1 Measurement of brake power:
Brake power is the power output of the engine or the power developed
in crankshaft. To measure brake power we need to measure the torque and
angular speed of the engine.
The device which we use to measure the torque is called Dynamometer,
the Dynamometer is always be loaded then we can measure the generated
torque
-28-
3.2.2 Important types of dynamometers:
A- Absorption Dynamometers :
These dynamometers measure and absorb the power output of the engine
to which they are coupled. The power absorbed is usually dissipated as heat
by some means. Example of such dynamometers is Prony brake rope brake,
hydraulic dynamometer, etc.
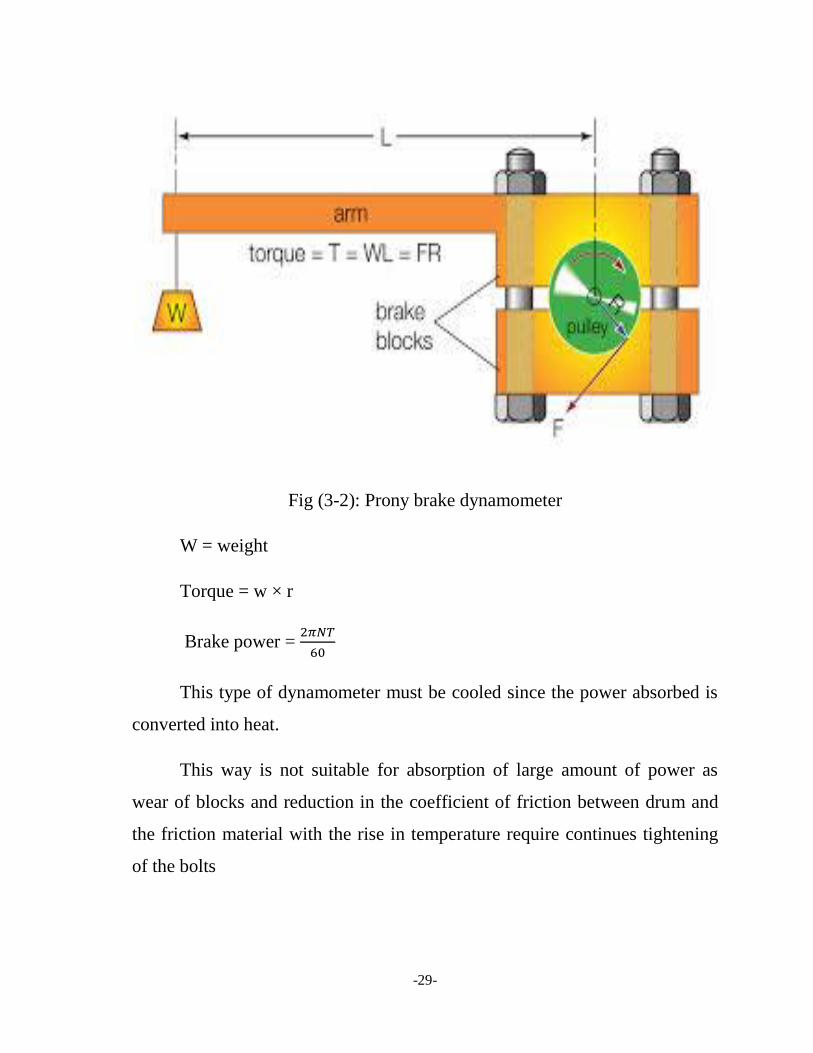
1- Prony brake:
This type is consist of frame with brake shoes , often made of two
blocks of wood , each of which embraces slightly less than one-half of the
rotating drum rim . The drum is attached to the output shaft of the engine. The
two blocks can be drawn together by means of nuts and bolts, cushioned by
springs, so as to increase the pressure on the drum. A load bar extends from
the top of the brake and a weight is hanged to the end of the load bar.
-29-
Fig (3-2): Prony brake dynamometer
W = weight
Torque = w × r
Brake power =
This type of dynamometer must be cooled since the power absorbed is
converted into heat.
This way is not suitable for absorption of large amount of power as
wear of blocks and reduction in the coefficient of friction between drum and
the friction material with the rise in temperature require continues tightening
of the bolts
-30-
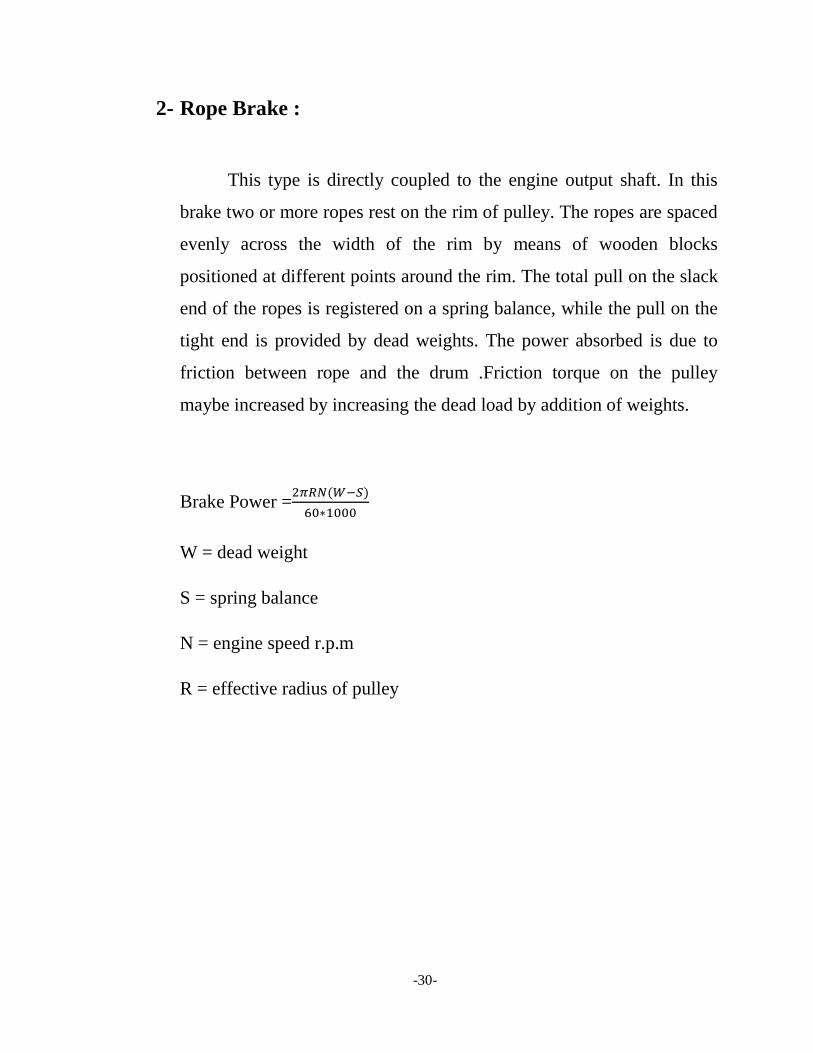
2- Rope Brake :
This type is directly coupled to the engine output shaft. In this
brake two or more ropes rest on the rim of pulley. The ropes are spaced
evenly across the width of the rim by means of wooden blocks
positioned at different points around the rim. The total pull on the slack
end of the ropes is registered on a spring balance, while the pull on the
tight end is provided by dead weights. The power absorbed is due to
friction between rope and the drum .Friction torque on the pulley
maybe increased by increasing the dead load by addition of weights.
Brake Power =
W = dead weight
S = spring balance
N = engine speed r.p.m
R = effective radius of pulley
-31-
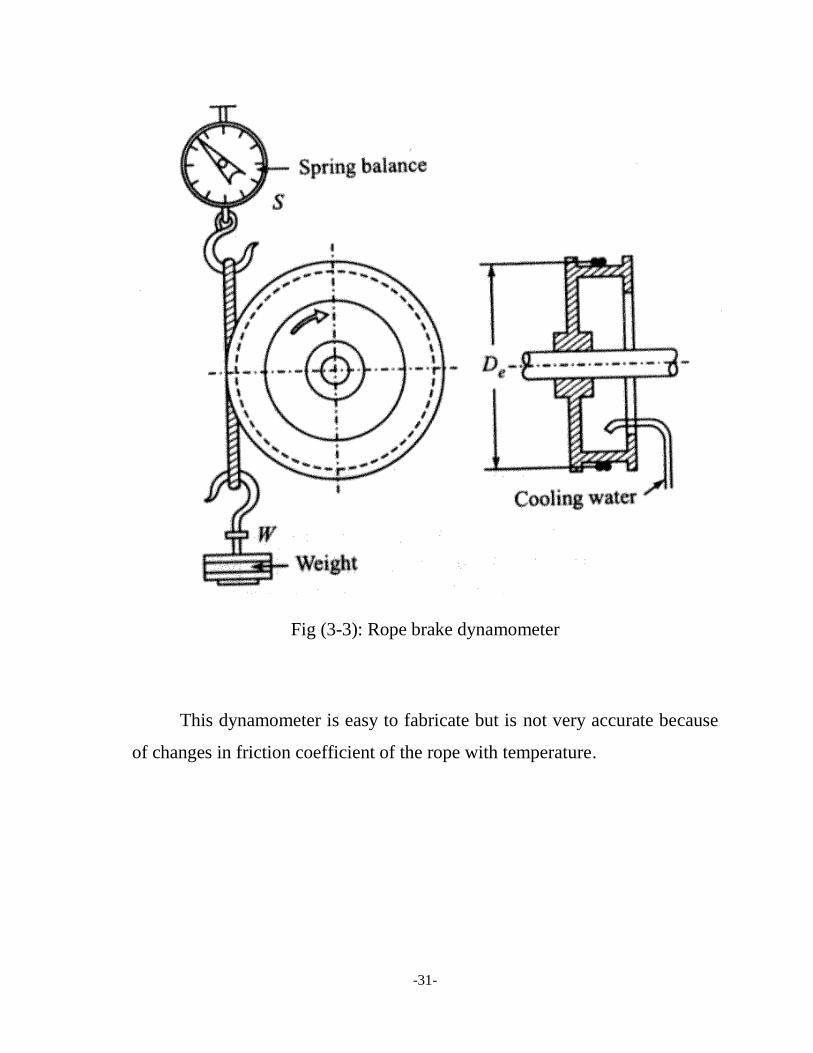
Fig (3-3): Rope brake dynamometer
This dynamometer is easy to fabricate but is not very accurate because
of changes in friction coefficient of the rope with temperature.
-32-
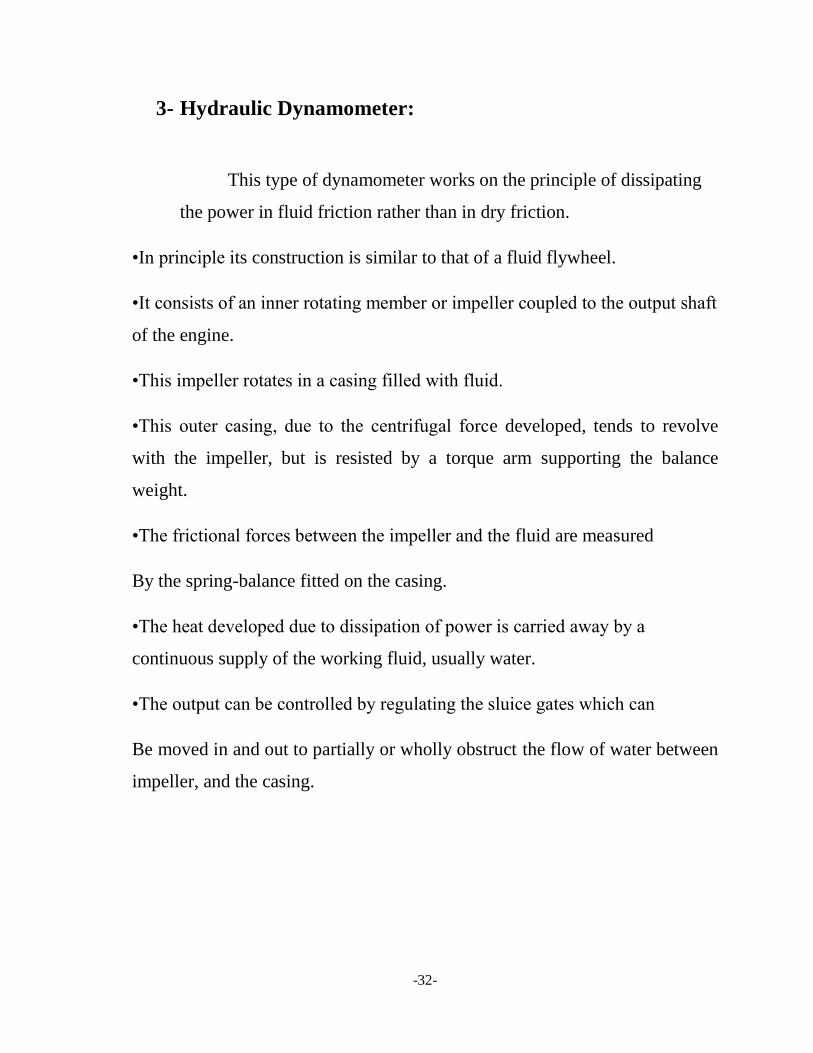
3- Hydraulic Dynamometer:
This type of dynamometer works on the principle of dissipating
the power in fluid friction rather than in dry friction.
•In principle its construction is similar to that of a fluid flywheel.
•It consists of an inner rotating member or impeller coupled to the output shaft
of the engine.
•This impeller rotates in a casing filled with fluid.
•This outer casing, due to the centrifugal force developed, tends to revolve
with the impeller, but is resisted by a torque arm supporting the balance
weight.
•The frictional forces between the impeller and the fluid are measured
By the spring-balance fitted on the casing.
•The heat developed due to dissipation of power is carried away by a
continuous supply of the working fluid, usually water.
•The output can be controlled by regulating the sluice gates which can
Be moved in and out to partially or wholly obstruct the flow of water between
impeller, and the casing.
-33-
Fig (3-4): Hydraulic Dynamometer
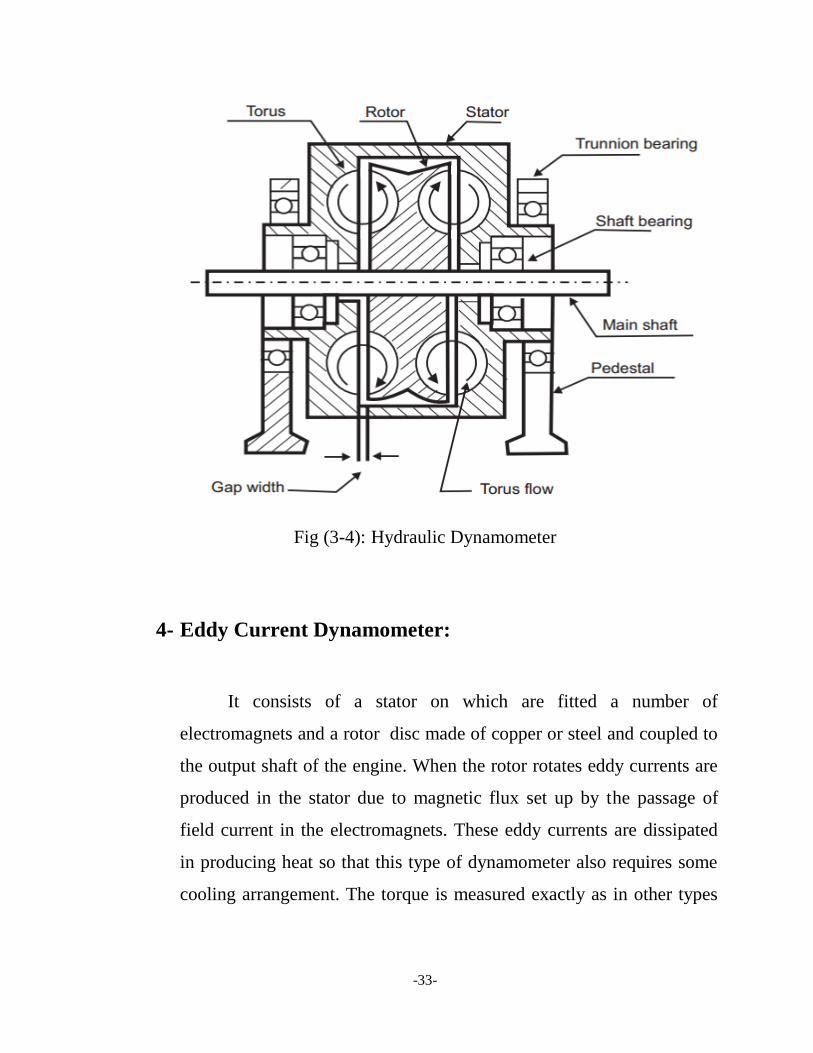
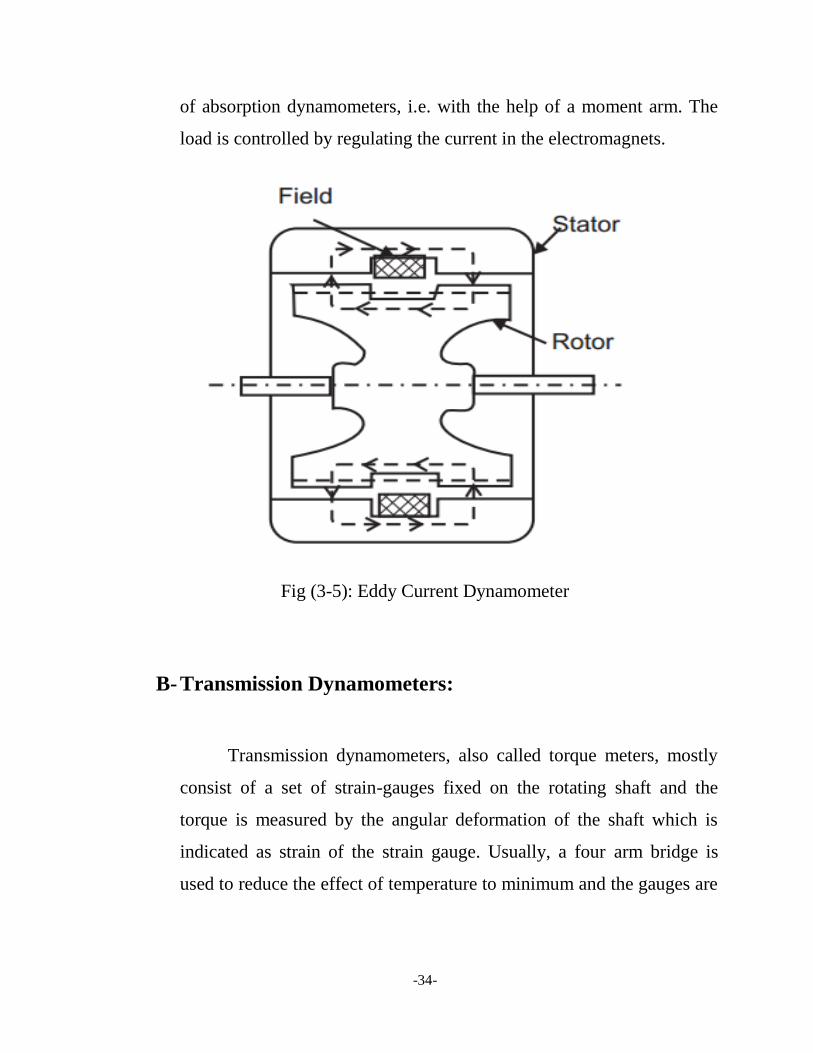
4- Eddy Current Dynamometer:
It consists of a stator on which are fitted a number of
electromagnets and a rotor disc made of copper or steel and coupled to
the output shaft of the engine. When the rotor rotates eddy currents are
produced in the stator due to magnetic flux set up by the passage of
field current in the electromagnets. These eddy currents are dissipated
in producing heat so that this type of dynamometer also requires some
cooling arrangement. The torque is measured exactly as in other types
-34-
of absorption dynamometers, i.e. with the help of a moment arm. The
load is controlled by regulating the current in the electromagnets.
Fig (3-5): Eddy Current Dynamometer
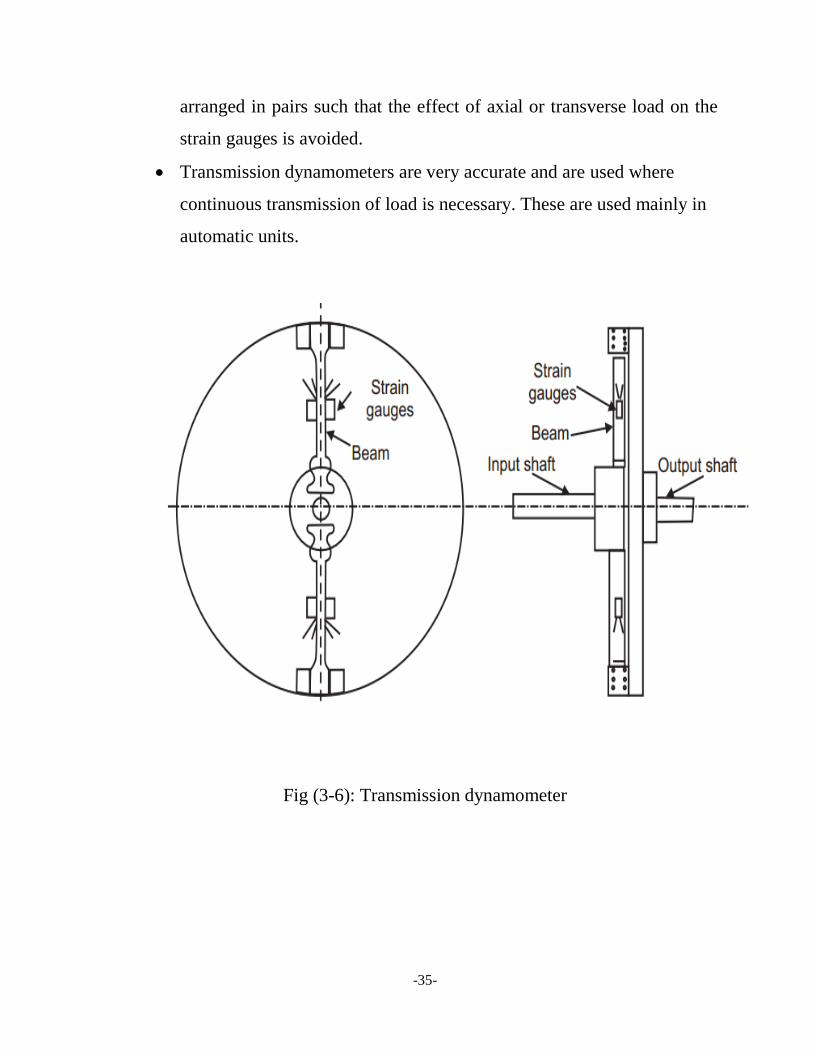
B- Transmission Dynamometers:
Transmission dynamometers, also called torque meters, mostly
consist of a set of strain-gauges fixed on the rotating shaft and the
torque is measured by the angular deformation of the shaft which is
indicated as strain of the strain gauge. Usually, a four arm bridge is
used to reduce the effect of temperature to minimum and the gauges are
-35-
arranged in pairs such that the effect of axial or transverse load on the
strain gauges is avoided.
Transmission dynamometers are very accurate and are used where
continuous transmission of load is necessary. These are used mainly in
automatic units.
Fig (3-6): Transmission dynamometer
-36-
3.2.3 Methods of Measurement of Mechanical Losses:
The friction force power of an engine is determined by the following
methods:
(a)Willan‘s line method.
(b) Morse test.
(c) Motoring test.
(d) Difference between Indicated power and Brake power.
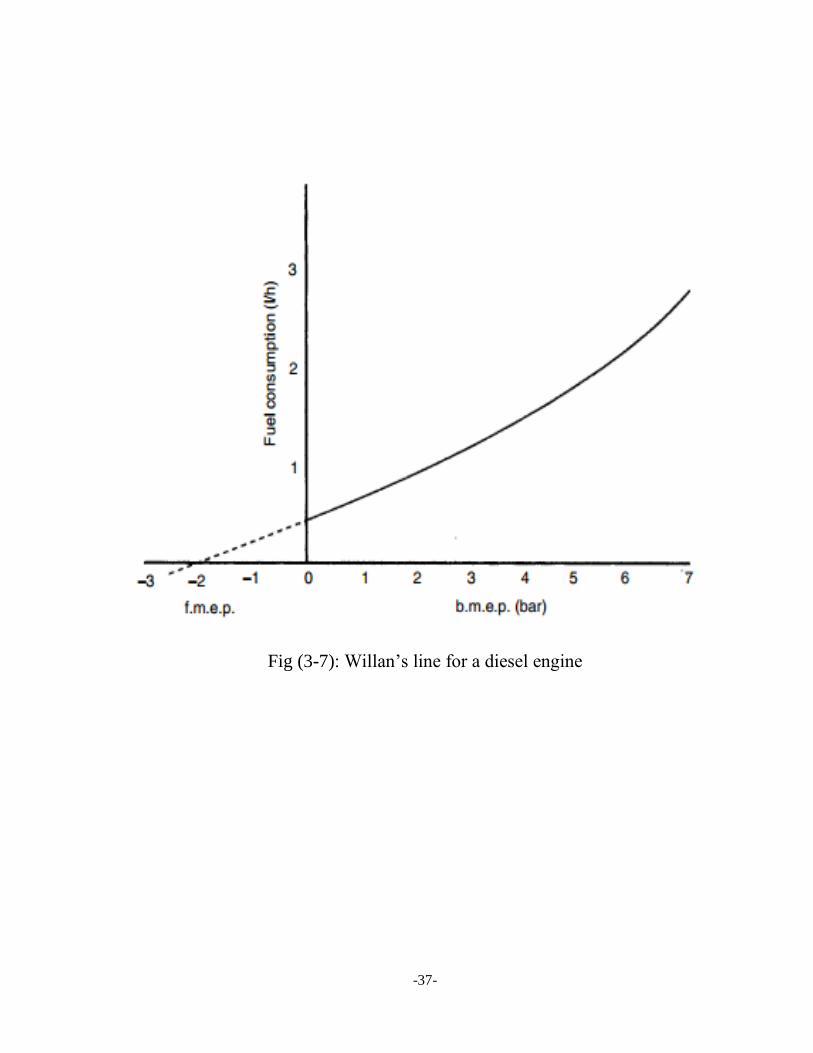
3.2.3.1 The Willan’s line method:
This is applicable only to un-throttled compression ignition engines.
It is a matter of observation that a curve of fuel consumption rate against
torque or B.M.E.P. at constant speed plots quite accurately as a straight line
up to about 75 per cent of full power, This suggests that for the straight line
part of the characteristic, equal increments of fuel produce equal increments
of power combustion efficiency is constant.
At zero power output from the engine, all the fuel burned is expended
in over-coming the mechanical losses in the engine, and it is a reasonable
inference that an extrapolation of the Willan‘s line to zero fuel consumption
gives a measure of the friction losses in the engine. Strictly speaking, the
method only allows an estimate to be made of mechanical losses under no-
load conditions. When developing power the losses in the engine will
undoubtedly be greater.
-37-
Fig (3-7): Willan‘s line for a diesel engine
-38-
3.2.3.2 The Morse test
In this test, the engine is run under steady conditions and ignition or
injection is cut off in each cylinder in turn: it is of course only applicable to
multi-cylinder engines.
On cutting out a cylinder, the dynamometer is rapidly adjusted to restore
the engine speed and the reduction in power measured. This is assumed to be
equal to the indicated power contributed by the non-firing cylinder. The
process is repeated for all cylinders and the sum of the reductions in power is
taken to be a measure of the indicated power of the engine.
A modification of the Morse test makes use of electronically controlled
unit injectors, allowing the cylinders to be disabled in different ways and at
different frequencies, thus keeping temperatures and operating conditions as
near normal as possible.
3.2.3.3 Motoring Test:
• In the motoring test, the engine is first run up to the desired speed by
its own power and allowed to remain at the given speed and load conditions
for some time so that oil, water, and engine component temperatures reach
stable conditions.
• The power of the engine during this period is absorbed by a swinging
field type electric dynamometer, which is most suitable for this test.
-39-
• The fuel supply is then cut-off and by suitable electric-switching
devices the dynamometer is converted to run as a motor to drive for ‗motor‘
the engine at the same speed at which it was previously running.
• The power supply to the motor is measured which is a measure of the
F.H.P of the engine. During the motoring test the water supply is also cut-off
so that the actual operating temperatures are maintained.
• This method, though determines the F.P. at temperature conditions
very near to the actual operating temperatures at the test speed and load, does,
not give the true losses occurring under firing conditions due to the following
reasons.
(a) The temperatures in the motored engine are different from those in a
firing engine because even if water circulation is stopped the incoming air
cools the cylinder. This reduces the lubricating oil temperature and increases
friction increasing the oil viscosity. This problem is much more severing in
air-cooled engines.
(b) The pressure on the bearings and piston rings is lower than the firing
pressure. Load on main and connecting road bearings are lower.
(c) The clearance between piston and cylinder wall is more (due to cooling).
This reduces the piston friction.
(d) The air is drawn at a temperature less than when the engine is firing
because it does not get heat from the cylinder (rather loses heat to the
cylinder). This makes the expansion line to be lower than the compression line
on the P-v diagram. This loss is however counted in the indicator diagram.
-40-
(e) During exhaust the back pressure is more because under motoring
conditions sufficient pressure difference is not available to impart gases the
kinetic energy is necessary to expel them from exhaust.
Motoring method, however, gives reasonably good results and is very
suitable for finding the losses due to various engine components. This insight
into the losses caused by various components and other parameters is obtained
by progressive stripping-off of the under progressive dismantling conditions
keeping water and oil circulation intact. Then the cylinder head can be
removed to evaluate, by difference, the compression loss. In this manner
piston ring, piston etc. can be removed and evaluated for their effect on
overall friction.
3.2.3.4 Difference between I.P and B.P.:
(a) The method of finding the F.P by computing the difference between
I.P, as obtained from an indicator diagram, and B.P., as obtained by a
dynamometer, is the ideal method. However, due to difficulties.
(b) In obtaining accurate indicator diagrams, especially at high engine
speeds, this method is usually only used in research laboratories. Its use at
commercial level is very limited.
-41-
Comments on Methods of Measuring F.P.:
• The Willan‘s line method and Morse tests are very cheap and easy to
conduct.
• However, both these tests give only an overall idea of the losses
whereas motoring test gives a very good insight into the various causes of
losses and is a much more powerful tool.
• As far as accuracy is concerned the I.P– B.P method is the most
accurate if carefully done.
• Motoring method usually gives a higher value for F.H.P as compared
to that given by the Willian‘s line method.
The four standard methods of estimating mechanical losses in an
engine and its auxiliaries have been briefly described. No great accuracy can
be claimed for any of these methods and it is instructive to apply as many of
them as possible and compare the results. Measurement of mechanical losses
in an engine is still something of an ‗art’.
-42-
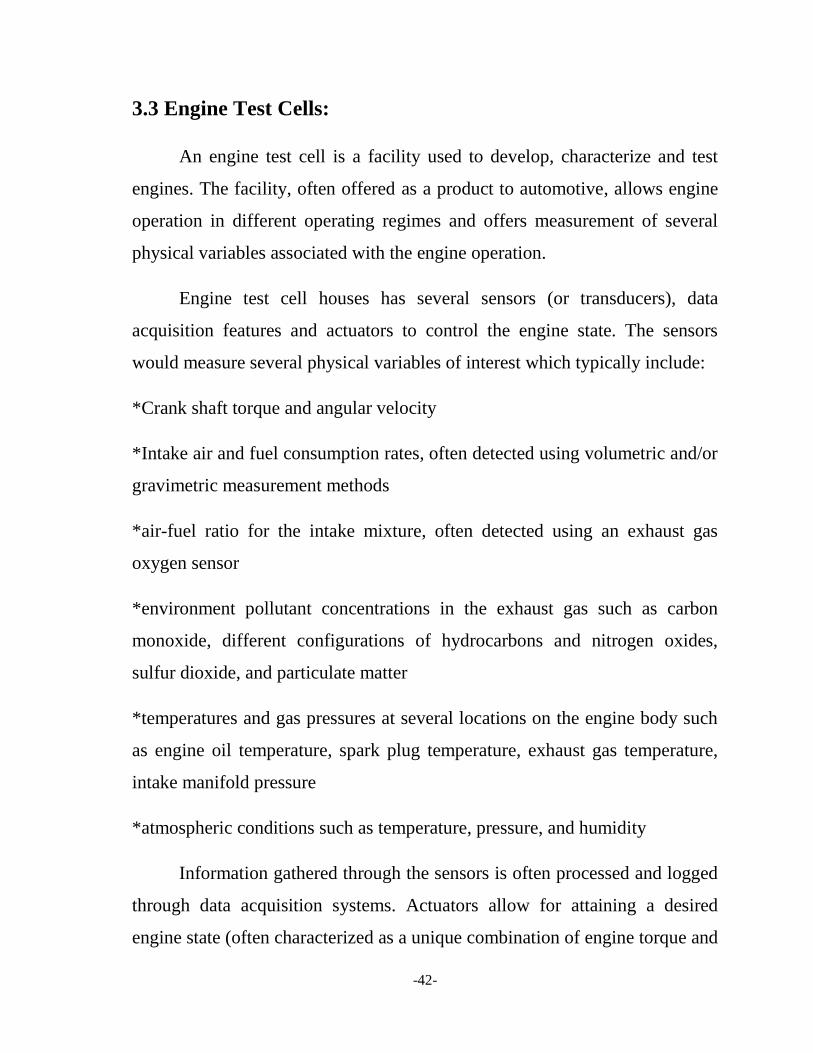
3.3 Engine Test Cells:
An engine test cell is a facility used to develop, characterize and test
engines. The facility, often offered as a product to automotive, allows engine
operation in different operating regimes and offers measurement of several
physical variables associated with the engine operation.
Engine test cell houses has several sensors (or transducers), data
acquisition features and actuators to control the engine state. The sensors
would measure several physical variables of interest which typically include:
*Crank shaft torque and angular velocity
*Intake air and fuel consumption rates, often detected using volumetric and/or
gravimetric measurement methods
*air-fuel ratio for the intake mixture, often detected using an exhaust gas
oxygen sensor
*environment pollutant concentrations in the exhaust gas such as carbon
monoxide, different configurations of hydrocarbons and nitrogen oxides,
sulfur dioxide, and particulate matter
*temperatures and gas pressures at several locations on the engine body such
as engine oil temperature, spark plug temperature, exhaust gas temperature,
intake manifold pressure
*atmospheric conditions such as temperature, pressure, and humidity
Information gathered through the sensors is often processed and logged
through data acquisition systems. Actuators allow for attaining a desired
engine state (often characterized as a unique combination of engine torque and
-43-
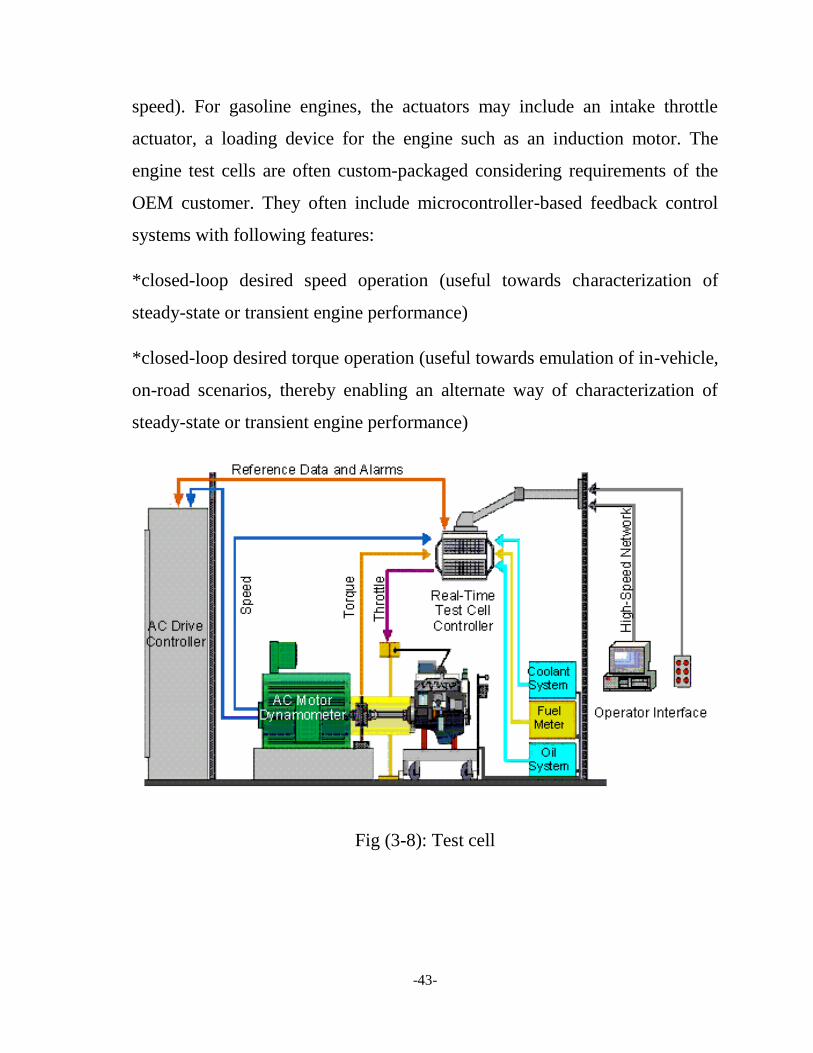
speed). For gasoline engines, the actuators may include an intake throttle
actuator, a loading device for the engine such as an induction motor. The
engine test cells are often custom-packaged considering requirements of the
OEM customer. They often include microcontroller-based feedback control
systems with following features:
*closed-loop desired speed operation (useful towards characterization of
steady-state or transient engine performance)
*closed-loop desired torque operation (useful towards emulation of in-vehicle,
on-road scenarios, thereby enabling an alternate way of characterization of
steady-state or transient engine performance)
Fig (3-8): Test cell

-44-
3.3.1 Overall size of individual test cells:
One of the early considerations in planning a new test facility will be
the space required. The areas to be separately considered are
• The engine or power train test cell;
• The control room;
• The space required for services and support equipment;
• The support workshop or engine rig and derig area;
• The storage area required for engine rig items and consumables.
A cramped cell, in which there is not room to move around in comfort,
is a permanent source of danger and inconvenience. The smaller the volume
of the cell the more difficult it is to control the ventilation system under
conditions of varying load .As a rule of thumb, there should be an
unobstructed walkway 1 meter wide all round the test engine. Cell height is
determined by a number of factors including the provision or not of a crane
beam in the structure. In practice, most modern automotive cells are between
4 and 4.5 meters internal height.
-45-
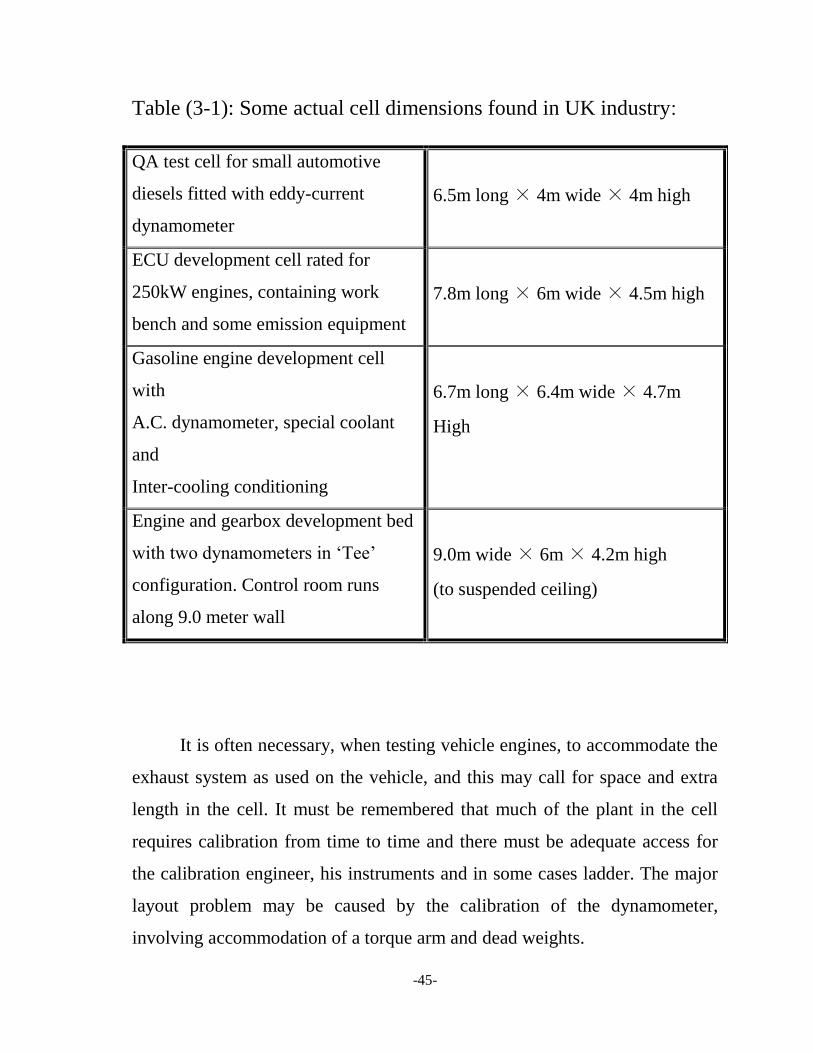
Table (3-1): Some actual cell dimensions found in UK industry:
QA test cell for small automotive
diesels fitted with eddy-current
dynamometer
6.5m long × 4m wide × 4m high
ECU development cell rated for
250kW engines, containing work
bench and some emission equipment
7.8m long × 6m wide × 4.5m high
Gasoline engine development cell
with
A.C. dynamometer, special coolant
and
Inter-cooling conditioning
6.7m long × 6.4m wide × 4.7m
High
Engine and gearbox development bed
with two dynamometers in ‗Tee‘
configuration. Control room runs
along 9.0 meter wall
9.0m wide × 6m × 4.2m high
(to suspended ceiling)
It is often necessary, when testing vehicle engines, to accommodate the
exhaust system as used on the vehicle, and this may call for space and extra
length in the cell. It must be remembered that much of the plant in the cell
requires calibration from time to time and there must be adequate access for
the calibration engineer, his instruments and in some cases ladder. The major
layout problem may be caused by the calibration of the dynamometer,
involving accommodation of a torque arm and dead weights.
-46-
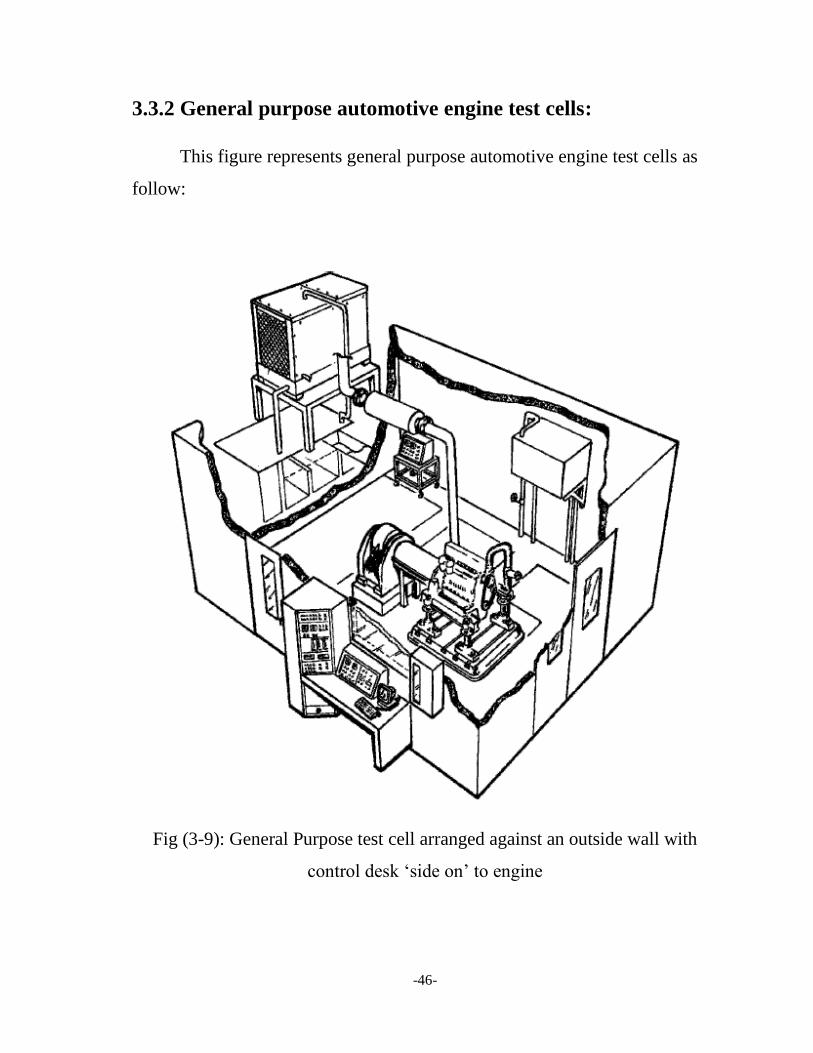
3.3.2 General purpose automotive engine test cells:
This figure represents general purpose automotive engine test cells as
follow:
Fig (3-9): General Purpose test cell arranged against an outside wall with
control desk ‗side on‘ to engine
-47-
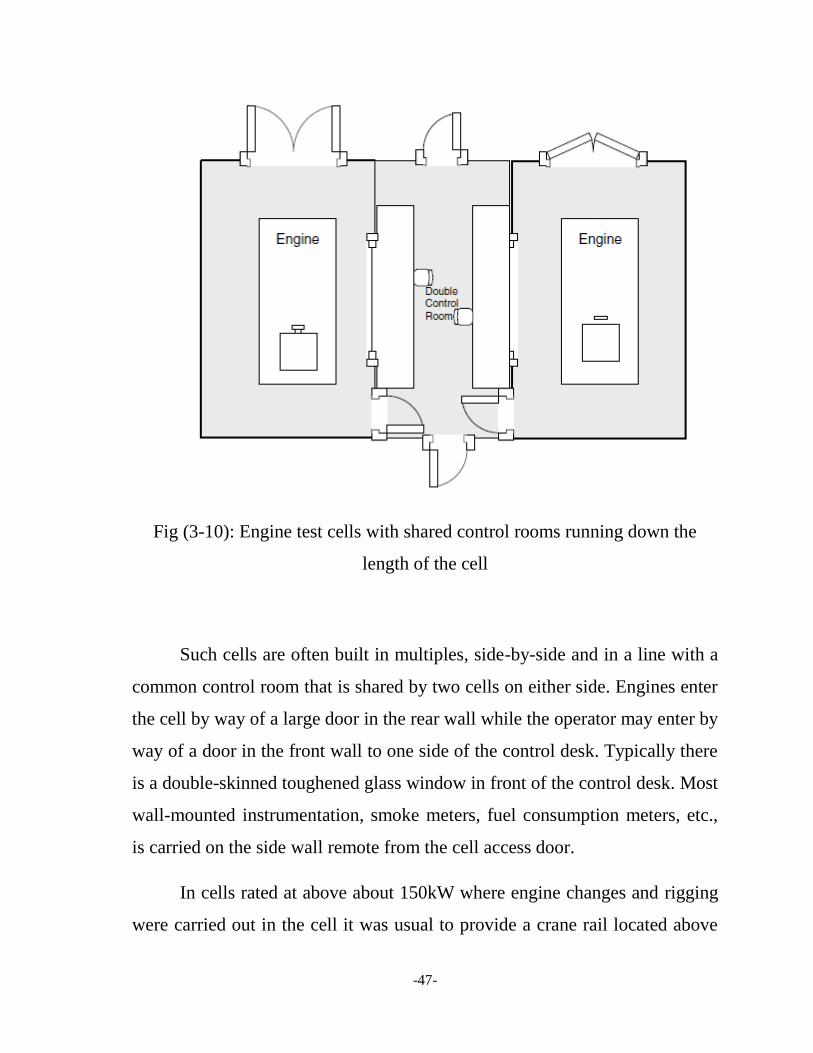
Fig (3-10): Engine test cells with shared control rooms running down the
length of the cell
Such cells are often built in multiples, side-by-side and in a line with a
common control room that is shared by two cells on either side. Engines enter
the cell by way of a large door in the rear wall while the operator may enter by
way of a door in the front wall to one side of the control desk. Typically there
is a double-skinned toughened glass window in front of the control desk. Most
wall-mounted instrumentation, smoke meters, fuel consumption meters, etc.,
is carried on the side wall remote from the cell access door.
In cells rated at above about 150kW where engine changes and rigging
were carried out in the cell it was usual to provide a crane rail located above
-48-
the test bed axis with a hoist of sufficient capacity to handle engines and
dynamometer. The penalty of such a lifting beam is that the structure has to be
built to take the full rated crane load plus its plant support load. In modern
cells where the engine is rigged outside the cell and trolley or pallet mounted,
in-cell cranes are not usually included as the cost benefit of a crane structure
may be judged as marginal.
3.3.3 Research and development engine and power-train test
cells:
The term ‗power-train‘ testing is used to cover engine plus direct
mounted transmission, but does not cover vehicle transmissions complete with
vehicle shafting; these are considered as ‗transmission test rigs‘.
Power-train rigs are often designed to be able to take up different
configurations, on a large bedplate, as required by the unit under test (UUT).
The typical configurations catered for are:
• Transverse engine plus gearbox driving two dynamometers;
• In-line engine and gearbox driving one dynamometer;
• In-line engine plus gearbox driving two dynamometers (‗Tee‘ set-up).
To allow fast transition times, the various UUT have to be pallet
mounted in a system that presents a common height and alignment to the cell
interface points.
Automotive engine test and development facilities built since the mid-
1990s will have the following features, additional to those found in general
purpose cells:
-49-
1. Exhaust gas analysis equipment.
2. Dedicated combustion air treatment plant.
3. Ability to run ‗in vehicle‘ exhausts systems.
4. High dynamic four-quadrant dynamometers.
Such requirements increase both the volume of the cell and of the space
required to house plant such as combustion air treatment equipment and the
electrical drive cabinets associated with the A.C. dynamometers. The
positioning and condition in which such ‗service‘ plant operates is as
important and as demanding as those of the contents of the test cell.
While plant such as the A.C. drive cabinets are usually positioned
outside the cell, for reasons of ambient temperature and noise, they need to be
as close to the dynamometer as practical to avoid higher than necessary costs
for the connecting power cable.
Modern dynamometer drive cabinets tend to be large, heavy and
difficult to maneuver within restricted building spaces. Therefore, expert
planning is required, as is anti-condensation heating if there is a long period
between installation and commissioning. Combustion air units also need to be
close to the engine to prevent heat loss or gain through the delivery trucking.
They are often positioned in the service room immediately above the engine,
with the delivery duct running via a fire damper through the cell ceiling to a
flexible duct attached to the engine as part of the rigging process. If the
humidity of the combustion air is being controlled, the unit will require
condensation and steam drains out of the building or into foul water drains.
-50-
Typical applications are:
• Development departments of vehicle and engine manufacturers and major
oil companies;
• Motor-sport developers;
• Specialist consultancy companies;
• Government testing and monitoring laboratories.
3.3.4 Automotive engine production test cells (hot test):
These cells are highly specialized installations forming part of an
automation system lying outside the scope of this research. The objective is to
check, in the minimum possible process time, that the engine is complete and
runs. Typical ‗floor-to-floor‘ times for small automotive engines range
between 5 and 8 minutes.
The whole procedure – engine handling, rigging, clamping, filling,
starting, draining and the actual test sequence – is highly automated, with
interventions, if any, by the operator limited to dealing with fault
identification. Leak detection may be difficult in the confines of a hot test
stand therefore it is often carried out at a special (black-light) station
following test.
The test cell is designed to read from identity codes on the engine and
recognize variants to adjust the pass or fail criteria accordingly.
Typical measurements made during a production test include:
• Time taken for engine to start.
-51-
• Cranking torque.
• Time taken for oil pressure to reach normal level.
• Exhaust gas composition.
Most gasoline engines are no longer loaded by any form of
dynamometer during a hot test, but in the case with diesel engines load is
applied with power output measured and recorded.
3.3.5 Cold testing in production:
In addition to rotational testing in processes of subassemblies, cold
testing is sometimes applied to (near) completely built engines. This is a
highly automated process.
Cold test rigs are invariably situated within the assembly process line
fed by a ‗power and free‘ or similar conveyor system. The mechanical layout,
based on docking on to a drive motor and transducer pick-up system, is
physically simpler than a hot test cell since it does not require fuel supplies or
hot gas and fluid evacuation.
Cold test areas also have the cost advantage of being without any
significant enclosure other than safety guarding.
3.3.6 Engine handling systems:
A considerable number of connections must be made to any engine
before testing can proceed. These include the coupling shaft, fuel, cooling
water, exhaust and a wide range of transducers and instrumentation. It is
-52-
obviously cost-effective when dealing with high throughput of small
automotive units to carry out such work in a properly equipped workshop
rather than use expensive test cell space. Once rigged the engines have to be
transported to the cell.
The degree of complexity of the system adopted for transporting,
installing and removing the engine within the cell naturally depends on the
frequency with which the engine is changed. In some research or lubricant test
cells the engine is more or less a permanent fixture, but at the other extreme
the test duration for each engine in a production cell will be measured in
minutes, and the time taken to change engines must be cut to an absolute
minimum.
There is a corresponding variation in the handling systems:
• Simple arrangements when engine changes are comparatively infrequent.
The engine is either craned into the cell and rigged in situ or mounted on a
suitable stand such as that shown in Fig. 4.4 which is then lifted, by crane or
forklift, into the cell. All connections are made subsequently by skilled staff
with workshop back-up.
• The pre-rigged engine is mounted on a wheeled trolley or truck maneuvered
pallet carrying various transducers and service connections which are coupled
to the engine before it is moved into the cell. An engine rigging workshop
needs to be fitted with a dummy test cell station that presents datum
connection points identical in position and detail to those in the cells,
particularly the dynamometer shaft in order for the engine to be pre-aligned.
Clearly to gain maximum benefit, each cell in the facility needs to be built
with critical fixed interface items in identical positions from a common
-53-
datum. These positions should be repeated by dummy interface points in any
pre-rigging stand, in the workshop.
• For production test beds it is usual to make all engines to pallet connections
prior to the combined assembly entering the cell. An automatic docking
system permits all connections (including in some cases the driving shaft) to
be made in seconds and the engine to be filled with liquids.
Workshop support in the provision of suitable fittings and adaptors
should always be made available. All pipe connections should be flexible and
exhaust connections can be particularly troublesome and short-lived at high
temperatures; they should be treated as consumable items.
Rigging of exhaust systems often requires a welding bay; this must
obey regulations concerning shielding. Electrical arc welding must not be
allowed within the test cell because of the danger of damage to
instrumentation by stray currents.
The workshop area used for derigging should be designed to deal with
the inevitable spilled fluids and engine wash activities. Floor drains should
run into an oil intercept unit.

CHAPTER FOUR

-55-
PRACTICAL TRAILS
In this chapter we will discuss the practical trails that we have done
and show the results of these tests.
4.1 Morse test:
Tools:
1-Diesel Engine:
(4stroke engine, 4cylender)
2-Dynamometer:
(Hydraulic Dynamometer/ H-P-A TEST)
3-Water Pump:
(0.5HP)
4-Water Tank
Theory:
Brake Power =
I1 = B.P – B1
Where:
B1 = B.P. when cylinder 1 is cut off.
-56-
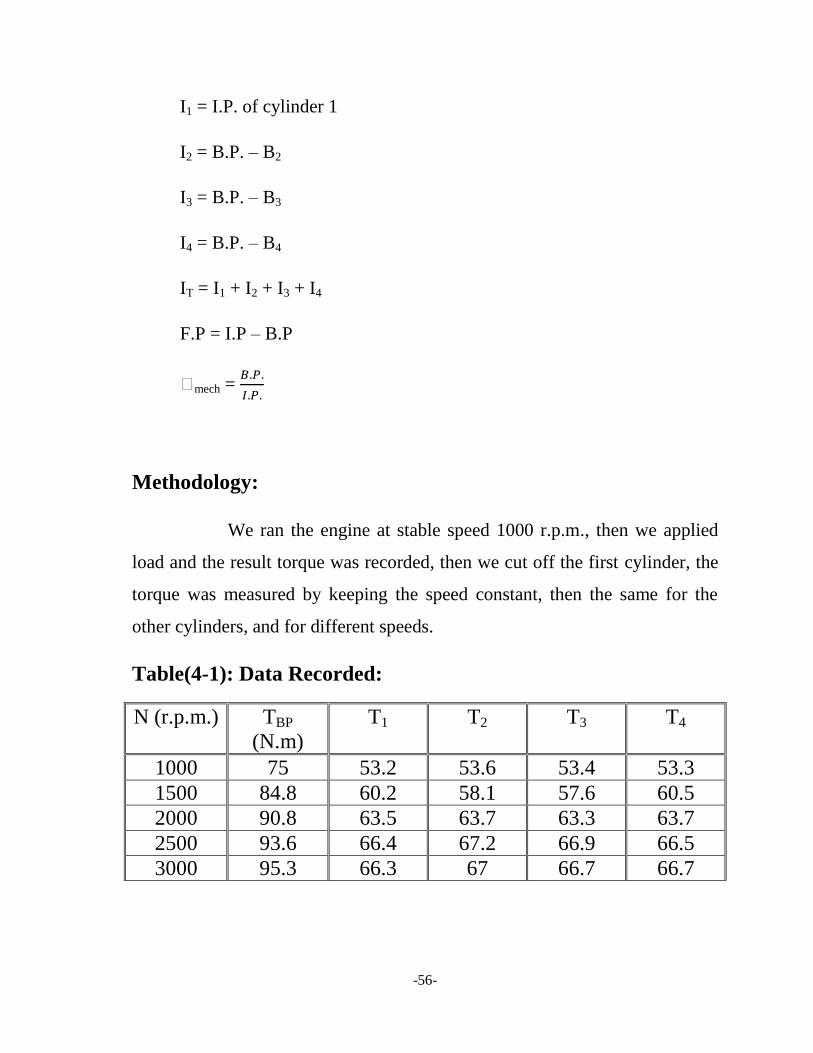
I1 = I.P. of cylinder 1
I2 = B.P. – B2
I3 = B.P. – B3
I4 = B.P. – B4
IT = I1 + I2 + I3 + I4
F.P = I.P – B.P
Ƞmech =
Methodology:
We ran the engine at stable speed 1000 r.p.m., then we applied
load and the result torque was recorded, then we cut off the first cylinder, the
torque was measured by keeping the speed constant, then the same for the
other cylinders, and for different speeds.
Table(4-1): Data Recorded:
N (r.p.m.) TBP
(N.m)
T1 T2 T3 T4
1000 75 53.2 53.6 53.4 53.3
1500 84.8 60.2 58.1 57.6 60.5
2000 90.8 63.5 63.7 63.3 63.7
2500 93.6 66.4 67.2 66.9 66.5
3000 95.3 66.3 67 66.7 66.7
-57-
Calculations:
1- At 1000 r.p.m:
B.P. =
=
= 7.86 kW
B1 =
=
= 5.57 kW
B2 =
=
= 5.61 kW
B3 =
=
= 5.59 kW
B4 =
=
= 5.58 kW
I1 = B.P. – B1= 2.29 kW
I2 = B.P. – B2 = 2.25 kW
I3 = B.P. – B3 = 2.27 kW
I4 = B.P. – B4 = 2.28 kW
IT = I1 + I2 + I3 + I4 = 9.09 kW
F.P. = I.P. – B.P.
= 9.09 – 7.86 = 1.23 kW
-58-
Ƞmech =
=
= 86.46 %
2- at 2000 r.p.m:
B.P. =
=
= 19.02 kW
B1 =
=
= 13.3 kW
B2 =
=
= 13.34 kW
B3 =
=
= 13.26 kW
B4 =
=
= 13.34 kW
I1 = B.P. – B1= 5.72 kW
I2 = B.P. – B2 = 5.68 kW
I3 = B.P. – B3 = 5.76 kW
-59-
I4 = B.P. – B4 = 5.68 kW
IT = I1 + I2 + I3 + I4 = 22.84 kW
F.P. = I.P. – B.P.
= 22.84 – 19.02 = 3.82 kW
Ƞmech =
=
= 83.27 %
3- at 3000 rpm:
B.P. =
=
= 29.94 kW
B1 =
=
= 20.83 kW
B2 =
=
= 21.05 kW
B3 =
=
= 20.95 kW
B4 =
=
= 20.95 kW
I1 = B.P. – B1= 9.11 kW
I2 = B.P. – B2 = 9.89 kw
-60-
I3 = B.P. – B3 = 8.99 kW
I4 = B.P. – B4 = 8.99 kW
IT = I1 + I2 + I3 + I4 = 36.98 kW
F.P. = I.P. – B.P.
= 36.98 – 29.94 = 7.04 kW
Ƞmech =
=
= 80.96 %
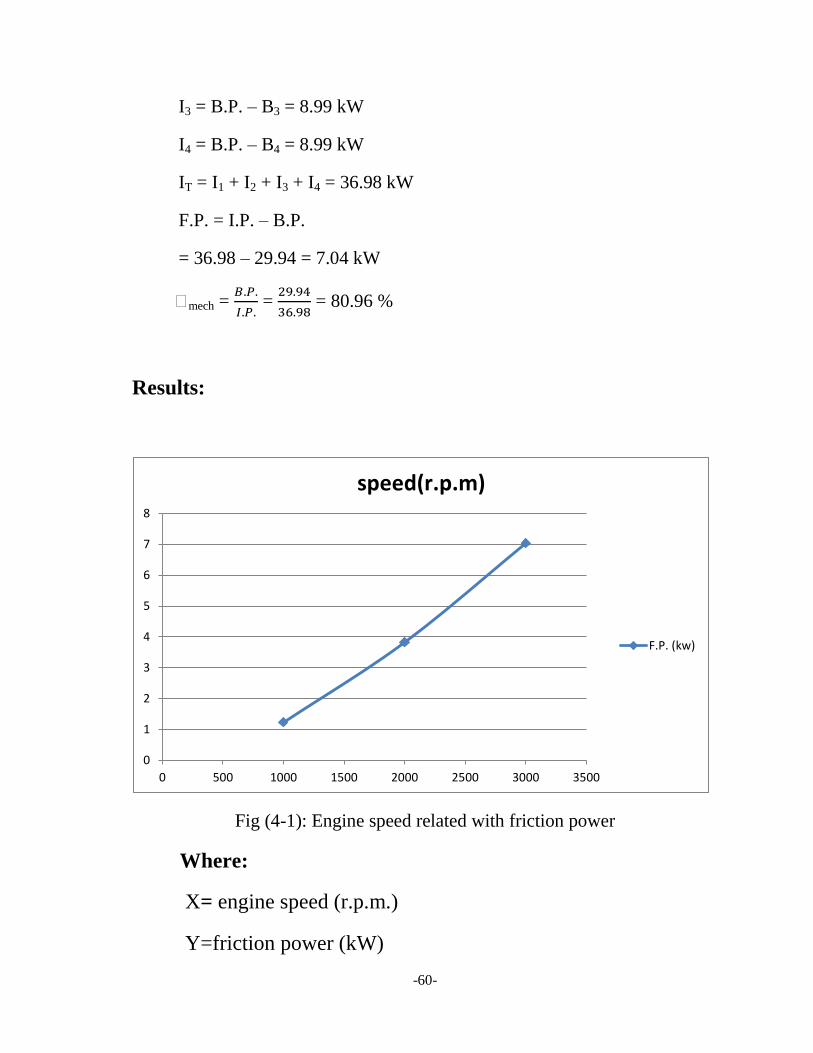
Results:
Fig (4-1): Engine speed related with friction power
Where:
X= engine speed (r.p.m.)
Y=friction power (kW)
0
1
2
3
4
5
6
7
8
0 500 1000 1500 2000 2500 3000 3500
speed(r.p.m)
F.P. (kw)
-61-
4-2 Engine Heat Balance Sheet:
*On this experiment we only calculated the loss by cooling water.
Tools:
1-Diesel Engine:
(4stroke engine, single cylinder, 499C.C. srtoke 80mm, bore 85mm,
5.5kW, Cr 17.5/1, 28.5Nm)
2-D.C. Generator:
(320V, 8.0kW)
3-Water Pump:
(0.5HP)
4-Water Tank
5-Thermometer
6-Stop Watch
Theory:
Brake Power =
Heat supplied by fuel = mf × C.V.
Heat equivalent of B.P. = B.P. × 60
Heat carried away by cooling water = mw × cpw × (tw2 – tw1)
-62-
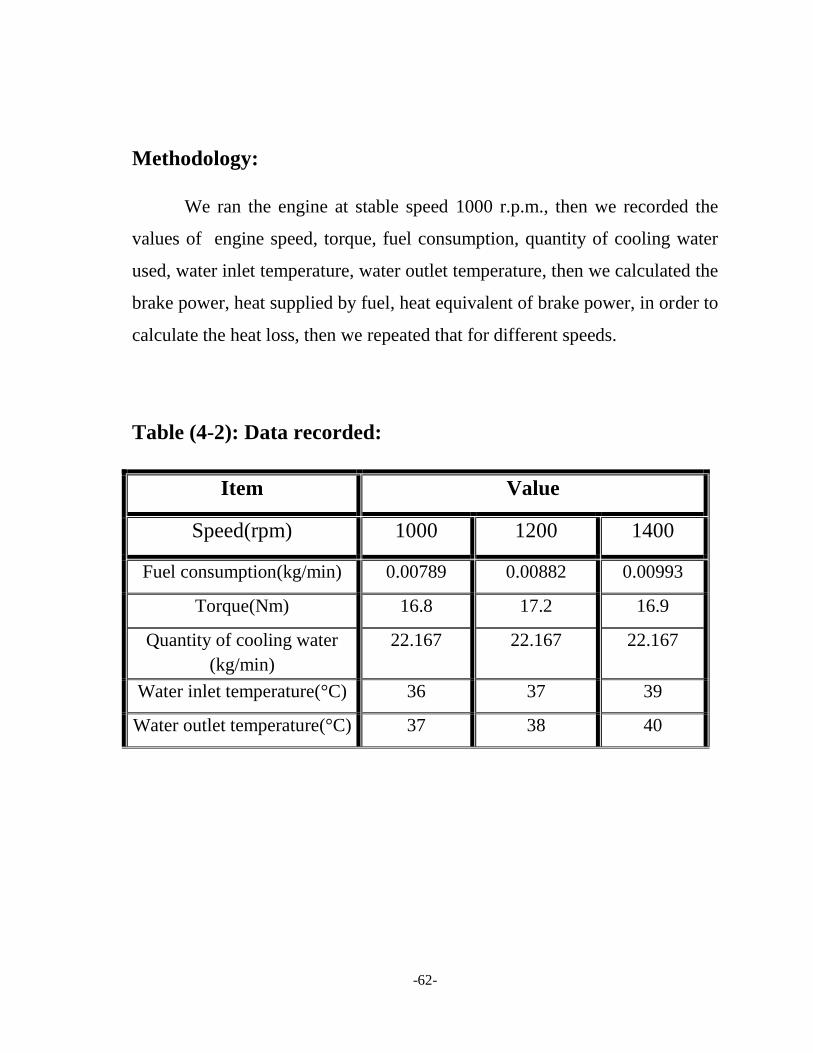
Methodology:
We ran the engine at stable speed 1000 r.p.m., then we recorded the
values of engine speed, torque, fuel consumption, quantity of cooling water
used, water inlet temperature, water outlet temperature, then we calculated the
brake power, heat supplied by fuel, heat equivalent of brake power, in order to
calculate the heat loss, then we repeated that for different speeds.
Table (4-2): Data recorded:
Item Value
Speed(rpm) 1000 1200 1400
Fuel consumption(kg/min) 0.00789 0.00882 0.00993
Torque(Nm) 16.8 17.2 16.9
Quantity of cooling water
(kg/min)
22.167 22.167 22.167
Water inlet temperature(°C) 36 37 39
Water outlet temperature(°C) 37 38 40
-63-
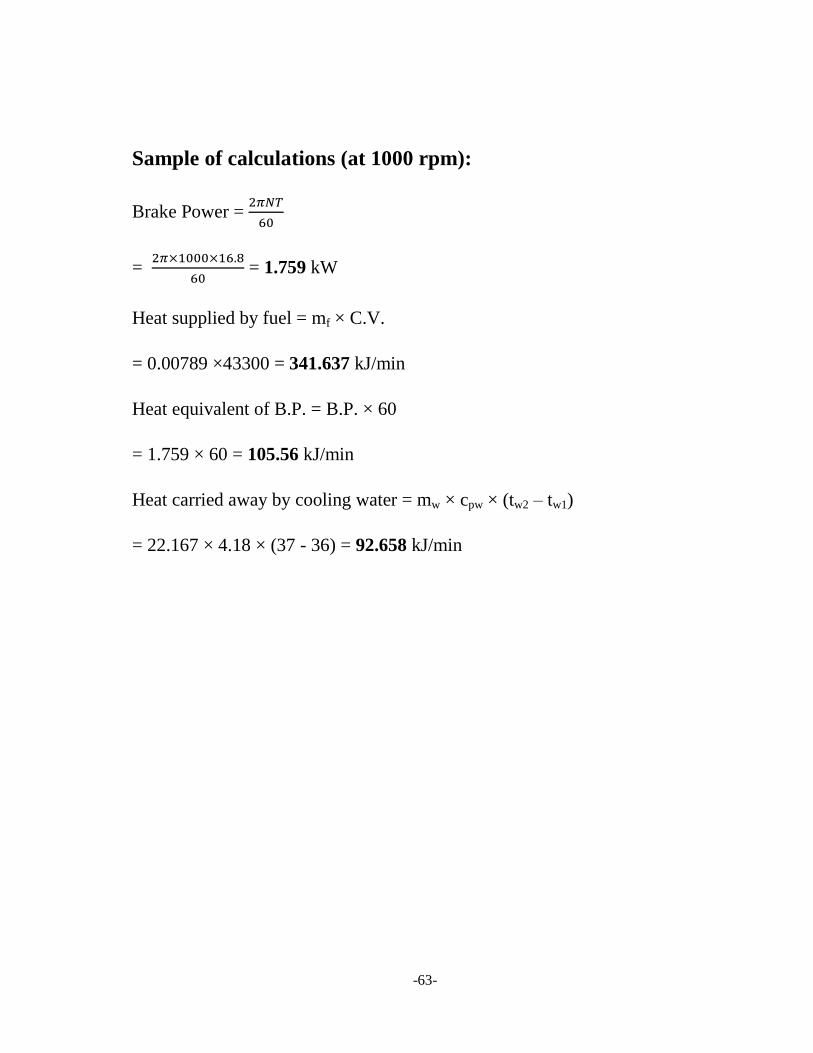
Sample of calculations (at 1000 rpm):
Brake Power =
=
= 1.759 kW
Heat supplied by fuel = mf × C.V.
= 0.00789 ×43300 = 341.637 kJ/min
Heat equivalent of B.P. = B.P. × 60
= 1.759 × 60 = 105.56 kJ/min
Heat carried away by cooling water = mw × cpw × (tw2 – tw1)
= 22.167 × 4.18 × (37 - 36) = 92.658 kJ/min
-64-
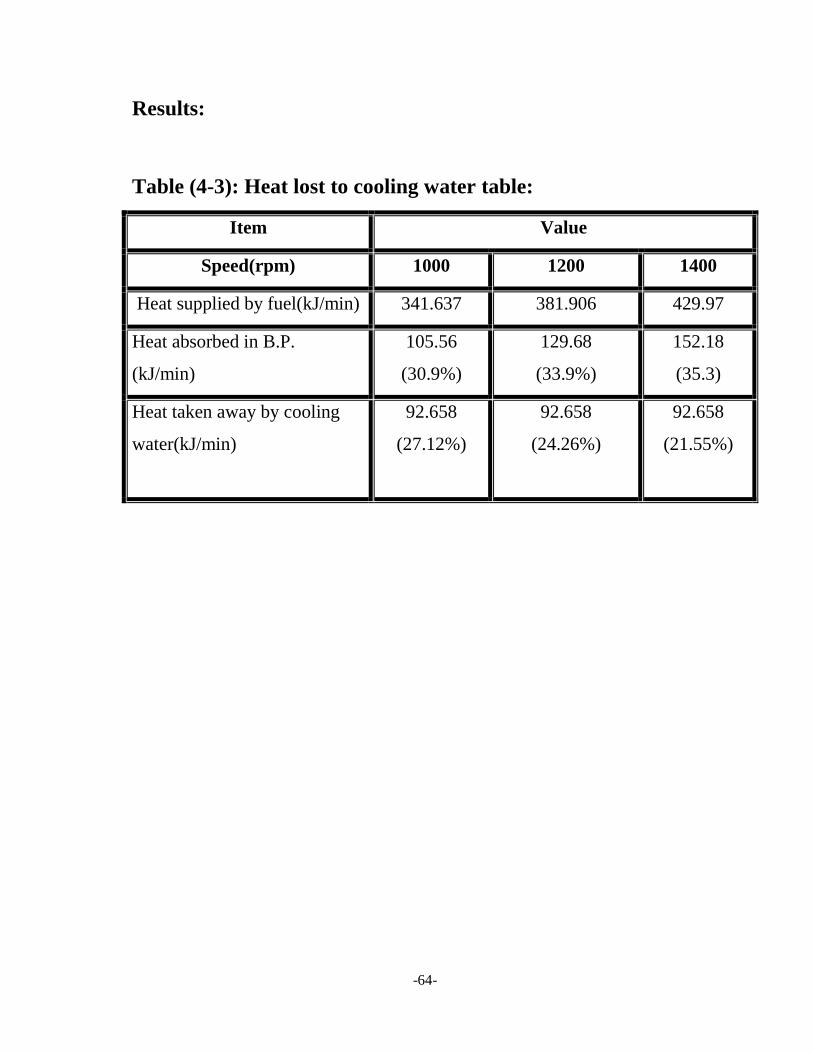
Results:
Table (4-3): Heat lost to cooling water table:
Item Value
Speed(rpm) 1000 1200 1400
Heat supplied by fuel(kJ/min) 341.637 381.906 429.97
Heat absorbed in B.P.
(kJ/min)
105.56
(30.9%)
129.68
(33.9%)
152.18
(35.3)
Heat taken away by cooling
water(kJ/min)
92.658
(27.12%)
92.658
(24.26%)
92.658
(21.55%)

CHAPTER FIVE
-66-
CONCLUSION AND RECOMMENDATIONS
5.1. Conclusion:
We had studied the methods of measuring the thermal and mechanical
losses in I.C.engines, and then we calculated these losses practically, the
mechanical efficiency was 83.56% in average.
And the heat lost to cooling water were (27.12% at 1000 r.p.m)
,(24.26% at 1200 r.p.m.) ,(21.55% at 1400 r.p.m.).
-67-
5.2. Recommendations:
In order to reduce the thermal and mechanical losses in I.C.engines we
have to make sure about the fuel quality, and the purity of air used, and the
suitable lubricant of engine, also we recommend with the periodic
maintenance of injectors to avoid delay period in combustion.
We also have to avoid over tying in engine parts such as crankshaft to
reduce the power losses.
-68-
REFERENCES
[1] A.J. Martyr and M.A. Plint, ―Engine Testing Theory and Practice‖,
Elsevier, Oxford, 2007.
[2] V Ganesan, ―Internal combustion engines‖, McGraw-Hill, India, 2006.
[3] R.K. Rajput, ―Internal combustion engines‖, Laxmi Publications, India,
2007.