mccoy ~2 pdf
TRANSCRIPT

International Association for Ecology
Size Correction: Comparing Morphological Traits among Populations and EnvironmentsAuthor(s): Michael W. McCoy, Benjamin M. Bolker, Craig W. Osenberg, Benjamin G. Miner,James R. VoneshSource: Oecologia, Vol. 148, No. 4 (Jul., 2006), pp. 547-554Published by: Springer in cooperation with International Association for EcologyStable URL: http://www.jstor.org/stable/20445943 .Accessed: 26/07/2011 13:21
Your use of the JSTOR archive indicates your acceptance of JSTOR's Terms and Conditions of Use, available at .http://www.jstor.org/page/info/about/policies/terms.jsp. JSTOR's Terms and Conditions of Use provides, in part, that unlessyou have obtained prior permission, you may not download an entire issue of a journal or multiple copies of articles, and youmay use content in the JSTOR archive only for your personal, non-commercial use.
Please contact the publisher regarding any further use of this work. Publisher contact information may be obtained at .http://www.jstor.org/action/showPublisher?publisherCode=springer. .
Each copy of any part of a JSTOR transmission must contain the same copyright notice that appears on the screen or printedpage of such transmission.
JSTOR is a not-for-profit service that helps scholars, researchers, and students discover, use, and build upon a wide range ofcontent in a trusted digital archive. We use information technology and tools to increase productivity and facilitate new formsof scholarship. For more information about JSTOR, please contact [email protected].
Springer and International Association for Ecology are collaborating with JSTOR to digitize, preserve andextend access to Oecologia.
http://www.jstor.org

Oecologia (2006) 148: 547-554 DOI 10. 1007/s00442-006-0403-6
Michael W. McCoy * Benjamin M. Bolker Craig W. Osenberg * Benjamin G. Miner James R. Vonesh
Size correction: comparing morphological traits among populations and environments
Received: 26 May 2005/ Accepted: 15 February 2006 /Published online: 8 April 2006 ? Springer-Verlag 2006
Abstract Morphological relationships change with overall body size and body size often varies among populations. Therefore, quantitative analyses of indi vidual traits from organisms in different populations or environments (e.g., in studies of phenotypic plasticity) often adjust for differences in body size to isolate changes in allometry. Most studies of among population variation in morphology either (1) use analysis of covariance (ANCOVA) with a univariate measure of body size as the covariate, or (2) compare residuals from ordinary least squares regression of each trait against body size or the first principal component of the pooled data (shearing). However, both approaches are prob lematic. ANCOVA depends on assumptions (small variance in the covariate) that are frequently violated in this context. Residuals analysis assumes that scaling relationships within groups are equal, but this assump tion is rarely tested. Furthermore, scaling relationships obtained from pooled data typically mischaracterize within-group scaling relationships. We discuss potential biases imposed by the application of ANCOVA and residuals analysis for quantifying morphological differ
ences, and elaborate and demonstrate a more effective alternative: common principal components analysis combined with Burnaby's back-projection method.
Keywords Analysis of covariance Common principal components * Residuals * Size correction * Shearing
lntroduction
Individuals can differ markedly in morphology within and between populations, due (for example) to genetic variation, environmental effects on development, or sexual dimorphism. Whether we are interested in developmental mechanisms, their ecological implica tions, or the evolution of morphological variation, we
must be able to reliably estimate the magnitude of phenotypic differences among populations. Most devel opmental processes and morphological traits increase with body size, but researchers often want to separate differences in shape from differences in body size, and
must therefore perform some kind of size-corrected analysis. Unfortunately, many of the statistical tech niques currently used for size correction in ecological studies have serious flaws that appear to be unappreci ated by many investigators. In this paper, we discuss traditional techniques for size correction and introduce an alternative approach.
The issues we discuss apply to many topics in ecology where size correction (or correction for any set of mul tivariate covariates) is required. Differences in pheno typic traits within or among populations can change the rate and direction of evolution, influence population dynamics, and determine the outcome of ecological interactions (Tollrian and Harvell 1999; Bolker et al. 2003; Werner and Peacor 2003), but we must measure phenotypic differences appropriately in order to determine their causes and effects. For example, sea urchin larvae increase the size of their feeding structures when reared at low food concentrations compared to larvae reared with higher food concentrations
Electronic Supplementary Material Supplementary material is available for this article at http://www.dx.doi.org/10.1007/s00442 006-0403-6 and is accessible for authorized users.
Communicated by Diethart Matthies
M. W. McCoy (CZ) - B. M. Bolker C. W. Osenberg B. G. Miner * J. R. Vonesh Department of Zoology, University of Florida, Gainesville, FL 32611-8525, USA E-mail: [email protected] Tel.: + 1-352-3921685 Fax: + 1-352-3923704
Present address: B. G. Miner Biology Department, Western Washington University, Bellingham, WA 98255-9160, USA
Present address: J. R. Vonesh Department of Biology, Washington University, St. Luis, MO 63130, USA

548
(Boidron-Metarion 1988; Miner 2005). These differences may result either from overall differences in body size or from disproportionately longer arms relative to the expected scaling with body size. Because these two hypotheses lead to different conclusions about sea urchin ecology and evolution, it is critical to separate differences in body size per se from differences in size corrected morphology.
Three approaches are routinely used to control for the effects of size in ecological research: residuals anal ysis, shearing (a multivariate analogue of residuals analysis), and analysis of covariance (ANCOVA). Be cause most developmental and physiological processes increase as a power of body size, these analyses are typically performed on log transformed data. In resid uals analysis, data for traits of interest are first regressed against a univariate description of body size (e.g., mass). The residuals from the regression are then compared across treatment groups using, for example, analysis of variance (ANOVA; e.g., Relyea and Hoverman 2003; Relyea 2004). Shearing is a specific form of residuals analysis that uses a multivariate description of body size.
Measurements of multiple traits (typically all increasing with body size) are pooled across treatment groups and analyzed with a principal components analysis (PCA) to yield the first principal component, PCI, which is as sumed to represent "body size" (i.e., a common allom etry shared among groups: Somers 1986; Jolicoeur 1963; Humphries et al. 1981; Bookstein 1991). As in residuals analysis, traits are then regressed against this (multi variate) measure and the residuals compared using ANOVA (e.g., Van Buskirk and Relyea 1998; Relyea 2001). ANCOVA uses a univariate descriptor of body size as a covariate (e.g., Dahl and Peckarsky 2002), but
differs from residuals analysis in using a pooled within group regression coefficient (i.e., estimating a common slope for multiple groups) instead of using a regression coefficient obtained from pooled data (i.e., ignoring group structure by aggregating data: Winer et al; 1991; Sokal and Rohlf 1995; Garcia-Berthou 2001). Unfortu nately, all three techniques have flaws .that limit their use in analyses of size-corrected morphology. Despite these limitations, all three approaches are frequently applied in analyses of morphometric data. For example, the
majority of papers published in Ecology, Oecologia, and Oikos between 1993 and 2004 that used body size cor rection to analyze morphological responses to environ
mental conditions used either residuals analysis (10/82, 12.2%), shearing (20/82, 24.4%), or ANCOVA (42/82, 51.2%: Table 1).
In the first part of this paper, we review the flaws
implicit in standard approaches to size correction in ecology. We then develop an approach described by Klingenberg (1996) that combines common principal components analysis (CPCA) with Burnaby's back projection method (BBPM). In addition, we develop and evaluate appropriate error propagation techniques that overcome the problems of both pooled regression approaches (such as residuals analysis and shearing)
and Model I regression approaches (including AN COVA).
Shortcomings of sbndard methods
By characterizing the (assumed) shared allometry of multiple groups using pooled data, residuals analyses confound within- and between-group patterns and underestimate effect sizes when the dependent and con founding variables are correlated, which is typically true in studies where size correction is needed (Darlington and Smulders 2001). Although it has not previously been noted, shearing (a multivariate residuals approach) similarly underestimates effect sizes (see below). PCA provides a multivariate description of allometry for a single group, not multiple groups; when data from
multiple groups are pooled, PCI does not necessarily reflect the underlying scaling relationships within any of the original groups (Fig. lb, c). In studies that use size corrected data, researchers are typically looking for changes in allometry (characterized by between-group differences) over and above those related to size (often characterized by within-group variation), and thus the working hypothesis is that within- and between-group principal components are different. Shearing (one of the most commonly used multivariate size-correction tech niques) fails under these circumstances, and the only situation in which the within-group relationship (PC1I)
will be the same as the pooled relationship (PCIp) is when groups are only displaced along a single axis of allometric variation (Fig. la). In such cases, traits differ between groups only because organisms differ in overall size. Therefore, shearing is only appropriate in the case
where size-correction cannot reveal any other differences among groups.
Analysis of covariance resolves some of the problems associated with residuals analysis (and shearing). Al though ANCOVA also requires an estimate of a shared allometric axis, it tests for differences in allometry by testing for heterogeneity of slopes and it estimates this slope by pooling within-group regression coefficients rather than by obtaining a single regression coefficient from pooled data. ANCOVA also reduces the associated degrees of freedom by one because the slopes of the
within-group regression lines are estimated from the data (Garcia-Berthou 2001). Size correction is a partic
ularly interesting application of ANCOVA because size (the covariate) is an inherent part of the morphological
measurements (which comprise the response variables). However, in all applications, ANCOVA assumes the covariate is measured without error and that its distri bution is similar among groups (Huitema 1980; Sokal and Rohlf 1995). When the distribution varies among groups and the covariate is measured with error, which is presumably true in most studies of size correction,
ANCOVA may produce biased estimates of effect sizes (Huitema 1980; Sokal and Rohlf 1995). This bias occurs because ANCOVA is based on Model I regression,

549
Table 1 Summary of the quantitative techniques used to analyze morphological response variables and perform size correction in studies of phenotypic plasticity
Method Pooled dataa Sizeb Error modelc No. of Percentage of Percentage of studies univariate studies multivariate studies
Residuals analysis Yes Univariate Type I 10 18 ANCOVA No Univariate Type I 41 73 Otherd Yes Univariate Type I 5 9 Shearing Yes Multivariate Type I 19 - 73 ANCOVA No Multivariate Type I 1 - 4 CPC/BBPM No Multivariate Type II 0 - 0 Other e Yes/No Multivariate - 6 - 23
We focused on phenotypic plasticity because it is a common ecological context in which morphology is compared among different groups. Data were obtained from a review of 82 papers published in Ecology, Oecologia, and Oikos between 1993 and 2004 aIndicates whether analyses were based on pooled data without respect to group identity bSize was either a univariate measure (e.g., mass) or multivariate (e.g., from PCA) cType I error (no error in the size measure); Type II (assumes error in X and Y) dIncludes ratio and regression analyses eIncludes use of PCA and thin spline multiple warp analyses
which attributes all error to the dependent variable (for a detailed discussion of the effects of violating ANCO VA assumptions, see Appendix I). Sokal and Rohlf (1995, p. 519) have warned that ANCOVA's assump tions are frequently violated in biological applications and they did not recommend its use in situations where the covariate cannot be measured exactly until Model II regression techniques (which allow for error in both the dependent and independent variables) are developed.
We present such methods here. We advocate a size-correction approach that over
comes these three shortcomings of prior methods: it (1) uses a multivariate measure of body size; (2) avoids pooling (and residual analysis); and (3) uses a Model II approach that incorporates error in the measurement of body size. In particular, we describe CPCA as a method to test assumptions of shared allometry and estimate allometric axes common to multiple groups (Flury 1988; Klingenberg 1996; Phillips and Arnold 1999) and BBPM as a tool for size correction (sensu Burnaby 1966; Klingenberg 1996). We also provide improved estima tion procedures using back-projection that account for error in the estimation of the allometric patterns de scribed using CPCA. We compare results obtained from simulated datasets using shearing (the most common
multivariate approach to date), ANCOVA, and CPCA/ BBPM.
Although some of the techniques presented here have been recognized and widely used in morphometric and evolutionary genetic studies to compare variance covariance matrices, they have rarely been used to esti
mate magnitudes of change and are apparently un
known to ecologists quantifying differences in morphological traits (e.g., Klingenberg and Spence 1993; Klingenberg 1996). We hope this discussion and subsequent applications of CPCA/BBPM will improve ecologists' approaches to size correction and estimation of morphological differences among groups: e.g., in studies of phenotypic plasticity where the use of poten tially problematic approaches is the norm (Table 1).
Estimating an allometnc axis
Common principal components analysis
Common principal components analysis is a general ization of PCA to applications involving more than one group. It can be used to test multivariate relationships among groups (i.e., to determine if covariance matrices are similar and to what degree) and can thus be used to
infer if groups share common patterns of allometry. CPCA provides a test analogous to the test for homo
geneity of slopes in ANCOVA-checking whether a common scaling relationship exists. CPCA has become popular in evolutionary biology for comparing pheno typic and genotypic covariance matrices (Steppan 1997a, b; Arnold and Phillips 1999; Phillips and Arnold 1999) and has also been applied to problems in multivariate allometry, although less frequently (Klingenberg and Spence 1993; Klingenberg and Zimmerman 1992).
Common principal components analysis defines levels of similarity among covariance matrices (Flury 1988; Phillips and Arnold 1999). For most studies of
morphological plasticity and size correction, it is only the first CPC (CPCl) that is of interest because it describes the general scaling of traits with body size. For our purposes, Flury's (1988) hierarchical test of similarities can be reduced to three cases: (1) equality or proportionality of all principal components (i.e., all principal components are identical among groups, although the variances of the data in any particular dimension may differ among groups); (2) equality or proportionality of eigenvectors for CPC 1, but not necessarily other components; and (3) dissimilarity among covariance matrices (covariance matrices do not share CPC 1).
If the first principal components are not shared (Fig. Ic), then the patterns of morphological variation are so fundamentally different that there can be no
globally applied size correction because "size" does not
550
a Differences in size but not shape
WihnGroup pci
b Differences in size and shape /cPci
\ / /~0 ?/ 0
cm v Pooled
I
/ -A / Size Invariant
/ / / NZ_~~Within Groiup \ln
CNo shared allometry
/ 7 Pooled
Trait 1
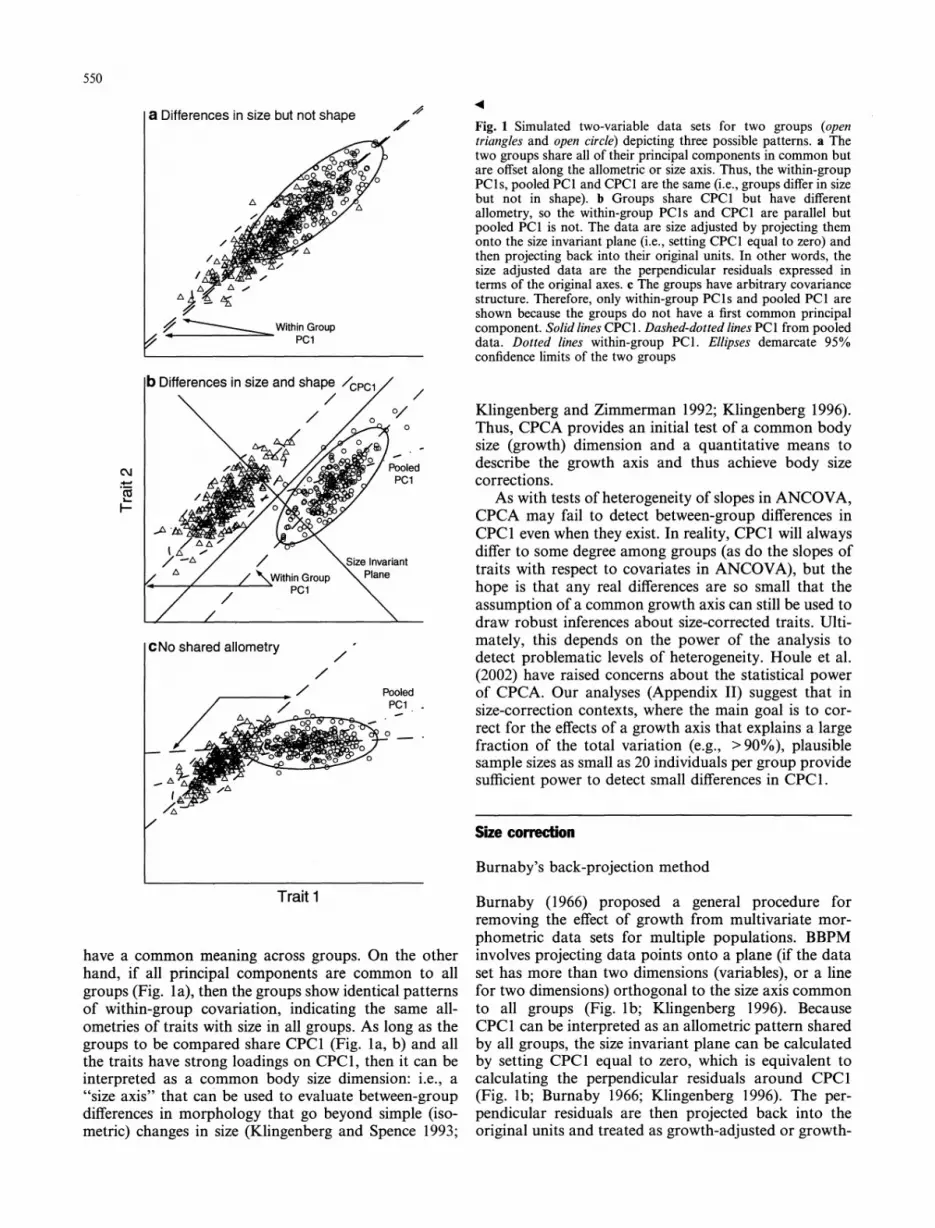
have a common meaning across groups. On the other hand, if all principal components are common to all groups (Fig. la), then the groups show identical patterns of within-group covariation, indicating the same all ometries of traits with size in all groups. As long as the
groups to be compared share CPC1 (Fig. la, b) and all
the traits have strong loadings on CPC1, then it can be
interpreted as a common body size dimension: i.e., a ''size axis" that can be used to evaluate between-group
differences in morphology that go beyond simple (iso metric) changes in size (Klingenberg and Spence 1993;
.4
Fig. 1 Simulated two-variable data sets for two groups (open triangles and open circle) depicting three possible patterns. a The two groups share all of their principal components in common but are offset along the allometric or size axis. Thus, the within-group PC Is, pooled PCI and CPC1 are the same (i.e., groups differ in size but not in shape). b Groups share CPC1 but have different allometry, so the within-group PCIs and CPC1 are parallel but pooled PCI is not. The data are size adjusted by projecting them onto the size invariant plane (i.e., setting CPC1 equal to zero) and then projecting back into their original units. In other words, the size adjusted data are the perpendicular residuals expressed in terms of the original axes. c The groups have arbitrary covariance structure. Therefore, only within-group PCIs and pooled PCI are shown because the groups do not have a first common principal component. Solid lines CPC1. Dashed-dotted lines PCI from pooled data. Dotted lines within-group PCI. Ellipses demarcate 95% confidence limits of the two groups
Klingenberg and Zimmerman 1992; Klingenberg 1996). Thus, CPCA provides an initial test of a common body size (growth) dimension and a quantitative means to describe the growth axis and thus achieve body size corrections.
As with tests of heterogeneity of slopes in ANCOVA, CPCA may fail to detect between-group differences in CPC1 even when they exist. In reality, CPC1 will always differ to some degree among groups (as do the slopes of traits with respect to covariates in ANCOVA), but the
hope is that any real differences are so small that the
assumption of a common growth axis can still be used to
draw robust inferences about size-corrected traits. Ulti mately, this depends on the power of the analysis to detect problematic levels of heterogeneity. Houle et al. (2002) have raised concerns about the statistical power of CPCA. Our analyses (Appendix II) suggest that in size-correction contexts, where the main goal is to cor
rect for the effects of a growth axis that explains a large
fraction of the total variation (e.g., >90%), plausible sample sizes as small as 20 individuals per group provide sufficient power to detect small differences in CPC1.
Size correction
Burnaby's back-projection method
Burnaby (1966) proposed a general procedure for removing the effect of growth from multivariate mor phometric data sets for multiple populations. BBPM involves projecting data points onto a plane (if the data set has more than two dimensions (variables), or a line
for two dimensions) orthogonal to the size axis common to all groups (Fig. lb; Klingenberg 1996). Because
CPC1 can be interpreted as an allometric pattern shared
by all groups, the size invariant plane can be calculated by setting CPC1 equal to zero, which is equivalent to
calculating the perpendicular residuals around CPC1 (Fig. lb; Burnaby 1966; Klingenberg 1996). The per pendicular residuals are then projected back into the original units and treated as growth-adjusted or growth

551
invariant data (Klingenberg 1996) and can be analyzed via standard MANOVA or ANOVA techniques.
These growth-adjusted data can be calculated using the method developed by Burnaby (1966):
X(I - t(P'P)-'P' (1)
where X is an nxp data matrix (n is the number of
observations and p the number of traits/variables mea sured), I is a pxp identity matrix and i is a p-element vector representing the growth axis (i.e., CPC1). Because CPCA components are normalized vectors with p'p = 1, this equation can be simplified to X(I - pp') (Klingen berg 1996). We can break up this equation to see that the first multiplication Xp projects X onto the first principal direction (calculating a scalar that is the score for CPC 1) and the second multiplication (multiplying by ii') translates principal component scores back into the original coordinate system (Burnaby 1966).
Materals and methods
To investigate how CPCA/BBPM may change analyses of morphological differences among groups, we simu lated 300 three-dimensional data sets and analyzed them using (1) PCA and shearing, (2) ANCOVA, and (3) CPCA/BBPM. Because ANCOVA is a univariate anal ysis we illustrate the comparison for the second and third traits using trait one as the covariate (i.e., the
measure of body size) because trait one had the highest correlation with the true size axis (Appendix I provides a detailed discussion of the conditions under which the use of ANCOVA may be inappropriate).
Simulated data sets illustrate scenarios that might be expected in empirical studies: (1) two groups that share all of their principal components in common (identical covariance matrices) but are offset (1Ox) along the al lometric axis (i.e., the groups differ in overall size but not in size-corrected shape: Fig. la); (2) data from two groups with common covariance structure but with one group offset along the CPC2 axis (20x; note-the data depicted in Fig. lb are only offset by 10 along the CPC2 axis) (i.e., the groups differ in size-corrected shape: Fig. I b); and (3) data from two groups with arbitrary covariance structure (i.e., the groups share no common allometry: Fig. Ic).
Data were randomly drawn from a multivariate normal distribution using specified covariance matrices (Appendix III). Therefore, true differences in our simu lated data were known, permitting us to compare the estimates of effect size in our analyses with true differ ences. For each of 300 simulations per scenario, we drew 200 values per group and applied shearing and CPC/ BBPM. We repeated simulations for a wide set of con ditions [e.g., up to eight traits, and varying offsets along CPC 1 (overall size differences) and perpendicular to CPC1 (size-corrected differences in morphology)]. For simulations where there was no difference in shape
(scenario 1 above), we determined Type I error rates by performing a one-way ANOVA on the back-projected data values for a particular trait (variable), but replacing the uncorrected sum of squares in the denominator of the F-ratio with the sum of the uncorrected and back projection sums of squares (Appendix IV). Under all cases CPC/BBPM yielded Type I error rates close to the nominal value of 5%.
All analyses were performed using the R statistical programming environment (R Development Core Team 2004; http://www.R-project.org). Our program code (as an R library), which includes BBPM, the CPCA pro gram developed by Patrick Phillips (Phillips and Arnold 1999) and a variety of other functions is available at http://www.zoo.ufl.edu/bolker/R/windows/ (see Appen dix III).
Error propagation
Error in estimates of the magnitude of morphological divergence using CPCA incorporates both among-indi vidual variation within groups (standard errors of group
means) and additional variation caused by error in the estimated value of CPC1 used to size-correct the data. Both sources of error should be included in confidence intervals of back-projected trait values (Appendix IV); ignoring error in CPC 1 will lead to inappropriately narrow confidence intervals (the depictions of CPCA in Fig. 1 ignore this second source of variation, but the confidence intervals presented in Fig. 2 incorporate it).
Results
Differences in body size only
When groups shared the same primary axis of variation (Fig. la), pooled PCA and CPCA both provided the same estimate of the allometric axis, as expected. Fur thermore, analysis of size-corrected data using both PCA/shearing and CPCA/BBPM found no difference in size-corrected traits for the two groups (Fig. 2a). In this scenario, both PCA/shearing and CPCA/BBPM led to the correct conclusion that the groups differed only in
overall size and not in shape (Fig. 2a). In contrast, ANCOVA incorrectly identified differences in traits 2 and 3. These differences stemmed from the error in the covariate that resulted from the lack of perfect correla tion between the covariate and the true size axis (the observed bias would decrease if the groups were more
broadly overlapping in size or if we used a covariate more correlated with true size: Appendix I).
Differences in size-corrected shape
When groups shared a common size axis, but were offset from this primary axis of variation (Fig. ib), all three

552
a Differences in size but not shape
LC)
_ CPC/BBPM
A Sheanng
* ANCOVA
c, b Differences in size and shape
coi
N (D_
CD
O- A A,
CD C No shared allometry
Trait 1 Trait 2 Trait 3
Fig. 2 Results-from analyses of simulated data sets representing three scenarios (Fig. 1) using CPC/BBPM, ANCOVA, and
shearing. Results illustrate the average difference from 300
simulations (? i1 standard deviation), for CPC/BBMP (filled square), shearing (filled circle), and ANCOVA (filled triangle).
Dashed lines give the true differences between the two groups. a
Results for groups that differed in size but not shape (Fig. Ila). The
true difference in size corrected traits between the two groups
equaled zero for all traits. b- Results for groups that differed in size
and shape (Fig. I b). For illustration we have presented the negative of the effect size for Trait 2 in panel b. True differences in size
corrected traits between the two groups were: Trait I = 3.6, Trait
2 = -6.4, and Trait 3 =18.6. c Results for groups that did not
share CPCI. Because groups did not share CPCI we have only shown the results from shearing. In this case the correct conclusion
is that the scaling of traits was different between the two groups. No size corrected comparisons were possible (i.e., there is no size
corrected difference to be estimated) and thus BBPM was not
aple
techniques detected significant differences in size-cor rected morphology between groups. However, the ap proaches gave grossly different estimates of these differences. Only CPCA/BBPM provided estimates of between-group differences that were accurate and unbi ased. In contrast, shearing severely underestimated the true effect sizes (Fig. 2b: although very small (< 1), the differences were significantly different from zero).
ANCOVA performed better than shearing, but under estimated the magnitude of differences in trait 2 while over-estimating the differences in trait 3. These biases stemmed from the imperfect correlation between the covariate and the true size (Appendix I, Fig. Al).
No common body size axis
When the groups did not share a common growth axis, the inferences based on shearing were qualitatively inconsistent with those of CPCA/BBPM (and ANCO
VA) and quantitatively biased with respect to the true differences between the groups. Although the differences in Fig. 2c are significant, shearing generated the spuri ous conclusion that the groups were not very different
morphologically. Conversely, analyzing these data using CPCA/BBPM or ANCOVA resulted in the correct conclusion that the two groups did not share a common
size axis and therefore no further analysis of size-cor rected morphological traits was possible-there was no single way to adjust for size that is applicable to both
groups, so such an attempt would be invalid (Fig. 1c). In this scenario, one would conclude that the groups are divergent in the allometric relationships among traits, and that the scaling of traits (e.g., the exponents in power functions that relate two traits) and not their offset (i.e., coefficients in the power functions) is heter ogeneous among populations. CPCA/BBPM (and AN COVA to a lesser degree) allows investigators to separately evaluate these two different forms of mor phological divergence. For example, if CPCl differs among groups (i.e., there is no common, single measure of "body size"), then further analysis should focus on the heterogeneity of the scaling relationships themselves (e.g., how the exponents in the power functions vary among groups). For these cases, one could apply an
approach described by Krzanowski (1979, 1988) and Blows et al. (2004) to quantify the degree to which groups differ and to what extent individual traits con tribute to differences in allometry.
Discussion
Pooled PCA and shearing (or other forms of residuals analysis) are frequently used to estimate and correct for size in groups of organisms. For example, in our review of recent papers on phenotypic plasticity, 76% that used a multivariate estimate of body size used pooled data,

553
while only one used CPCA and none used CPCA/ BBPM. Because the application of PCA to multiple groups (and residuals analysis in general) tacitly assumes that groups have identical allometries, results derived from PCA/shearing or residuals analyses will often be biased (e.g., Fig. Ib, 2b). ANCOVA was used in 73 % of
the studies that used a univariate estimate of body size. This technique is preferable to shearing/residuals anal ysis; however, it can also lead to considerable bias and elevated Type I and Type II error rates (Fig. 2a, b,
Appendix I). The problems with PCA and shearing that we have
identified result from the basic mathematical assump tions of these techniques. PC1 describes the axis that incorporates the greatest amount of variance in the data.
Therefore, when calculated for pooled data, it is influ enced by variation both within and among groups and thus may confound interpretation of allometry with among-group variation (Klingenberg 1996). The prob lem of confounding within and among group variance is
most severe when groups have arbitrary covariance structure (Fig. Ic). Similar problems arise in residuals analyses in which univariate measures of body size are used to represent the allometric axis (Smith 1999; Dar lington and Smulders 2001; Garcia-Berthou 2001).
Common principal components analysis is clearly more powerful, and appropriate, than PCA for sum marizing common allometry for multiple groups and as a mechanism for testing assumptions of similarity of covariance matrices. In addition, the use of CPCA in conjunction with BBPM provides an effective tool for comparing the size of specific traits among groups and for quantifying differences in shape. As more studies are added to the literature, it also becomes possible to use
meta-analysis (Osenberg et al. 1999) to compare the magnitude of variation in morphology among different taxa, cues, or environments (e.g., Van Buskirk 2002).
However, our results raise cautions about using existing studies that have used residuals or shearing analyses for quantitative syntheses of the literature. Additionally, the use of different analytic tools (PCA/shearing vs CPCA/ BBPM) is likely to introduce significant variation to the literature that is unrelated to the biology being investi gated (see Osenberg et al. 1997, 1999 for related cau
tions). Furthermore, restricting meta-analyses to the most common approaches (e.g., shearing) will give se verely biased results that may obscure real patterns. Indeed, some recent studies have demonstrated sub stantial survival and growth consequences resulting from (apparently) very small differences in morphology (e.g., Relyea and Hoverman 2003; Van Buskirk and
McCollum 2000). However, these studies typically used shearing or residuals analysis and therefore it is likely that the true morphological differences among groups
were far greater than was originally estimated (e.g., Fig. 2b). More accurate estimates of effect size in studies of morphology (through the application of CPC/BBPM) will allow us to better compare variation among studies and link functional responses with fitness consequences.
Acknowledgments We thank members of the St. Mary-Osenberg Bolker lab group and two anonymous reviewers for helpful dis cussions and comments on previous drafts of this manuscript. We also thank Brian Langerhans and Jonathan Losos for their com
ments on an earlier draft. We thank Rich Kiltie for pointing us to the literature on CPCA. This work was partially funded by NSF (OCE 0325028 to S. Morgan and B.G.M. and OCE 0242312 to
C.W.O., B.M.B. and C. St. Mary) and EPA (STAR Fellowship to J.R.V.). Contribution number 2307 Bodega Marine Laboratory, University of California, Davis, USA.
References
Arnold SJ, Phillips PC (1999) Hierarchical comparison of genetic variance covariance matrices. II. Coastal inland divergence in
the garter snake, Thamnophis elegans. Evolution 53:1516-1527
Blows MW, Chenoweth SF, Hi?e E (2004) Orientation of the
genetic variance-covariance matrix and the fitness surface for
multiple male sexually selected traits. Am Nat 163:329-340
Boidron-M?tairon IF (1988) Morphological plasticity in labora
tory-reared chinoplutei of Dendraster excentricus (Eschscholtz) and Lytechinus variegatus (Lamarck) in response to food
conditions. J Exp Mar Biol Ecol 119:31-41 Bolker BM, Holyoak M, Krivan V, Rowe L, Schmitz O (2003)
Connecting theoretical and empirical studies of trait-mediated
interactions. Ecology 84:1101-1114
Bookstein FL (1991) Morphometric tools for landmark data: geometry and biology. Cambridge University Press, New York, 435 pp
Burnaby TP (1966) Growth-invariant discriminant functions and
generalized distances. Biometrics 22:96-107
Dahl J, Peckarsky BL (2002) Induced morphological defenses in the wild: predator effects on a mayfly, Drunella coloradensis.
Ecology 83:1620-1634 Darlington RB, Smulders TV (2001) Problems with residuals
analysis. Anim Behav 62:599-602
Flury B (1988) Common principal components and related multi variate models. Wiley, New York
Garcia-Berthou E (2001) On the misuse of residuals in ecology:
testing regression residuals vs. the analysis of covariance. J
Anim Ecol 70:708-711 Houle, D, Mezey, J, Galpern, P (2002) Interpretation of the results
of common principal components analyses. Evolution 56:433
440 Huitema BE (1980) The analysis of covariance and alternatives.
Wiley, New York
Humphries JM, Bookstein FL, Chernoff B, Smith GR, Elder RL, Elder SG (1981) Multivariate discrimination by shape in rela
tion to size. Syst Zool 30:291-308
Jolicoeur P (1963) The multivariate generalization of the allometry
equation. Biometrics 19:497-499
Klingenberg CP (1996) Multivariate allometry. In: Marcus LF, Corti M, Loy A, Naylor GJP, Slice DE (eds) Advances in morphometrics. Plenum Press, New York, pp 23-49
Klingenberg CP, Spence JR (1993) Heterochrony and allome
try?lessons from the water strider genus Limnoporus. Evolu
tion 47:1834-1853 Klingenberg CP, Zimmerman M (1992) Static, ontogenetic and
evolutionary allometry: a multivariate comparison in 9 species of water striders. Am Nat 140:601-620
Krzanowski WJ (1979) Between-group comparisons of principal
components. J Am Stat Assoc 74:703-707
Krzanowski WJ (1988) Principles of multivariate analysis: a user's
perspective. Clarendon, Oxford
Miner BG (2005) Evolution of feeding structure plasticity in marine invertebrate larvae: a possible trade-off between arm length and
stomach size. J Exp Mar Biol Ecol 315:117-125 Osenberg CW, Sarnelle O, Cooper SD (1997) Effect size in eco
logical experiments: the application of biological models in
meta-analysis. Am Nat 150:798-812

554
Osenberg CW, Sarnelle O, Cooper SD, Holt RD (1999) Resolving ecological questions through meta-analysis: goals, metrics and
models. Ecology 80:1105-1117
Phillips PC, Arnold SJ (1999) Hierarchical comparison of genetic variance covariance matrices. I. Using the Flury hierarchy. Evolution 53:1506-1515
Relyea RA (2001) Morphological and behavioral plasticity of lar val anurans in response to different predators. Ecology 82:523
540
Relyea R (2004) Fine-tuned phenotypes: tadpole plasticity under 16 combinations of predators and competitors. Ecology 85:172
179 Relyea RA, Hoverman JT (2003) The impact of larval predators
and competitors on the morphology and fitness of juvenile
treefrogs. Oecologia 134:596-604
Smith RJ (1999) Statistics of sexual size dimorphism. J Hum Evol 36:423^59
Sokal RR, Rohlf FJ (1995) Biometry: the principles and practice of statistics in biological research, 3rd edn. Freeman, New York
Somers KM (1986) Multivariate allometry and removal of size with principal components analysis. Syst Zool 35:359-368
Steppan SJ (1997a) Phylogenetic analysis of phenotypic covariance
structure. 1. Contrasting results from matrix correlation and common principal component analyses. Evolution 51:571-586
Steppan SJ (1997b) Phylogenetic analysis of phenotypic co variance structure. 2. Reconstructing matrix evolution. Evolution
51:587-594 Tollrian RR, Harvell CD (1999) The ecology and evolution of
inducible defenses. Princeton University Press, New Jersey Van Buskirk J (2002) A comparative test of the adaptive plasticity
hypothesis: relationships between habitat and phenotype in anuran larvae. Am Nat 160:87-102
Van Buskirk J, McCollum SA (2000) Functional mechanisms of an inducible defense in tadpoles: morphology and behavior influ
ence mortality risk from pr?dation. J Evol Biol 13:336-347 Van Buskirk J, Relyea RA (1998) Natural selection for phenotypic
plasticity: predator-induced morphological responses in tad
poles. Biol J Linn Soc 65:301-328 Werner EE, Peacor SD (2003) A review of trait-mediated indirect
interactions in ecological communities. Ecology 84:1083?1100
Winer BJ, Brown DR, Michels KM (1991) Statistical principles in experimental design. McGraw Hill, New York