master thesis - lund university publications
TRANSCRIPT
Department of Human Geography Supervisor: Ola Hall
SGEM02 Master thesis 30hp Examiner: Jerker Moodysson
Spring term 2011
A longitudinal analysis on the
development of regional railway
systems in Skåne
Author: Erik Lundh

1 | P a g e
Foreword I would like to thank some persons that have helped me during this process. First of all, I want
to thanks my supervisor Ola Hall, who has helped me with study process during this semester.
I also want to send my regards to Kristoffer Levin at the infrastructural office at Region Skåne
who has supplied me with statistical data for my study and helped me with questions
regarding my thesis. Without him and his co-workers I would not have been able to do this
study. I also want thanks my fellow students, especially Jakob Klasander, friends and family
who have supported me with knowledge, motivation and required coffee breaks.
2 | P a g e
Abstract During the last two decades a new administrative level between municipality and national has
occurred, most referred as regions. Regions should work as a tool for intergrading and achieve
growth in the concept of sustainable development (economic, social and environmental
sustainable) in a specific area. In order to attain this and to integrate a whole region, even the
areas in the periphery, it is needed to have well–designed infrastructural network of nodes and
links for both cars and other alternative methods of transportations. During the last decades
this development has been questioned mostly because of environmental challenges. This issue
together with the concept of regional integration and expansion have done that one today
could distinguish a development of alternative and more environmental friendly transportation
methods. One of the most discussed solutions of this is regional public railways. In this thesis
I have chosen to focus on the development of regional railways in the region of Skåne, which
is located in southern Sweden.
The purpose was to analyze if there are any patterns in the development of regional railways
when it comes to factors of population, travelling and commuting in and between
municipalities, station cities and villages. Furthermore I wanted to connect the factors of
population and commuting to a regional concept of regional development, regional expansion,
sustainable development and mobility. The results showed that development of regional
railways has different impact on a region depending on the distance from a regional centre
and that the crucial factor is mobility and accessibility.
The results shows that station cities and municipalities located less than 20 minutes one-way
to a regional center are not affected by introduction of a regional railway station more than on
marginal level. Station cities located within 20 -50 minutes from a region center have a
positive development and areas that are located outside of this crucial time limit are barley not
affected at all by investments of new regional railway station when it comes to factors of
sustainability, regional expansion and regional development.
Keywords Regional infrastructure, regional development, mobility, regional railway networks, Skåne
3 | P a g e
Table of Contents Abstract ....................................................................................................................................... 2
Keywords ..................................................................................................................................... 2
1. Introduction.......................................................................................................................... 7
1.1 Regions -concept and regulation ............................................................................................. 7
1.2 Railbound traffic ...................................................................................................................... 9
1.3 Purpose of the study ............................................................................................................. 10
1.4 Delimitations of the study ..................................................................................................... 10
1.5 Disposition ............................................................................................................................. 11
2. Research questions ............................................................................................................. 12
3. Region of Skåne .................................................................................................................. 12
3.1 Processes of regional development ...................................................................................... 12
3.2 Regional infrastructural conditions ....................................................................................... 14
4. Theoretical Framework ....................................................................................................... 15
4.1 Regional development .......................................................................................................... 15
4.1.1 Regional expansion ........................................................................................................ 16
4.1.2 Central place theory or polycentric network model ..................................................... 17
4.1.3 Regional rail bound traffic ............................................................................................. 18
4.1.4 Regional commuting ...................................................................................................... 20
4.2 Freedom of mobility and accessibility ................................................................................... 21
4.3 Sustainable development in a regional context .................................................................... 23
5. Methodology ...................................................................................................................... 25
5.1 Scientific approach ................................................................................................................ 25
5.2 Choice of method .................................................................................................................. 25
5.3 Collection and visualization of empirical data ....................................................................... 26
5.4 Critique of method ................................................................................................................ 27
6. Empirical results ................................................................................................................. 29
6.1 Spatial Conditions in Skåne ................................................................................................... 29
6.2 Ystadbanan ............................................................................................................................ 29
6.3 Södra Stambanan .................................................................................................................. 31
6.4 Västkustbanan ....................................................................................................................... 32
6.5 Rååbanan ............................................................................................................................... 33
6.6 Skånebanan ........................................................................................................................... 34
6.7 Commuting patterns into regional centers ........................................................................... 35
4 | P a g e
6.8 Future investments ............................................................................................................... 35
6.8.1 Cities with new investments 2011 -2014 ...................................................................... 35
6.9 No future investments .......................................................................................................... 36
6.9.1 Southwest ...................................................................................................................... 36
6.9.2 Northeast ....................................................................................................................... 36
6.9.3 Northwest ...................................................................................................................... 36
6.9.4 Mid Skåne ...................................................................................................................... 36
7. Analysis .............................................................................................................................. 37
7.1 Research question 1 .............................................................................................................. 37
7.2 Research question 2 .............................................................................................................. 38
7.3 Research question 3 .............................................................................................................. 41
8. Conclusion .......................................................................................................................... 43
4 Further research ................................................................................................................. 44
Bibliography ............................................................................................................................... 45
Appendix 1 ................................................................................................................................. 50
Figure 1.1Map of Skåne ................................................................................................................. 50
Appendix 2 ................................................................................................................................. 51
Figure 2.1 Map of Ystadbanan....................................................................................................... 51
Figure 2.2 Population in the municipalities ................................................................................... 51
Figure 2.3 Numbers of travellers Svedala ..................................................................................... 52
Figure 2.4 Number of travellers Skurup ........................................................................................ 52
Figure 2.5 Number of travellers Rydsgård ..................................................................................... 52
Figure 2.6 Number of travellers Svarte ......................................................................................... 53
Figure 2.7 Number of travellers Ystad ........................................................................................... 53
Figure 2.8 Number of travellers Köpingebro ................................................................................. 53
Figure 2.9 Number of travellers Tomelilla ..................................................................................... 54
Figure 2.10 Number of travellers Lunnarp .................................................................................... 54
Figure 2.11 Number of travellers Smedstorp ................................................................................ 54
Figure 2.12 Number of travellers Gärsnäs..................................................................................... 55
Figure 2.14 Numbers of travellers Simrishamn ............................................................................. 55
Figure 2.15 Number of commuters out from the municipalities .................................................. 55
Figure 2.6 Number of commuters into the municipalities ............................................................ 56
Appendix 3 ................................................................................................................................. 57
Figure 3.1 Map of Södra Stambanan ............................................................................................. 57
5 | P a g e
Figure 3.2 Population in the municipalities ................................................................................... 57
Figure 3.3 Number of travellers Burlöv ......................................................................................... 58
Figure 3.4 Number of travellers Åkarp .......................................................................................... 58
Figure 3.5 Number of travallers Hjäup .......................................................................................... 58
Figure 3.6 Number of travellers Stångby....................................................................................... 59
Figure 3.7 Number of travellers Örtofta........................................................................................ 59
Figure 3.8 Number of travellers Eslöv .......................................................................................... 59
Figure 3.9 Numbers of travellers Stehag ....................................................................................... 60
Figure 3.10 Number of travellers Höör ......................................................................................... 60
Figure 3.11 Number of commuters out from the municipalities .................................................. 61
Figure 3.12 Number of commuters into the muncipalites ............................................................ 61
Appendix 4 ................................................................................................................................. 62
Figure 4.1 Map of Västkustbanan ................................................................................................. 62
Figure 4.2Population ...................................................................................................................... 62
Figure 4.3 Number of travellers Kävlinge ...................................................................................... 63
Figure 4.4 Number of travellers Döjesbro ..................................................................................... 63
Figure 4.5 Number of travellers Hjälarp ........................................................................................ 63
Figure 4.6 Number of travellers Glumslöv .................................................................................... 64
Figure 4.7 Number of travellers Rydebäck .................................................................................... 64
Figure 4.8 Number of travellers Landskrona ................................................................................. 64
Figure 4.9 Number of travellers Ödåkra ........................................................................................ 65
Figure 4.10 Numbers of travellers Kattarp .................................................................................... 65
Figure 4.11 Number of travellers Ängelholm ................................................................................ 65
Figure 4.12 Number of commuters out from the muncipalites .................................................... 66
Figure 4.13 Number of commuters into municipalities ................................................................ 66
Appendix 5 ......................................................................................................................................... 67
Figure 5.1 Map of Rååbanan ......................................................................................................... 67
Figure 5.2 Population .................................................................................................................... 67
Figure 5.3 Number of travellers Teckomatorp ............................................................................. 68
Figure 5.4 Number of travellers Billieberga .................................................................................. 68
Figure 5.5 Number of travellers Tågarp ........................................................................................ 68
Figure 5.6 Number of travellers Vallåkra ...................................................................................... 69
Figure 5.7 Number of travellers Gantofta ..................................................................................... 69
Figure 5.8 Number of commuters into the municipalities ............................................................ 69
6 | P a g e
Figure 5.9 Number of commuters out from the municipalities ........................................................ 70
Appendix 6 ................................................................................................................................. 71
Figure 6.1 Skånebanan .................................................................................................................. 71
Figure 6.2 Population .................................................................................................................... 71
Figure 6.3 Population .................................................................................................................... 72
Figure 6.4 Number of travellers Påarp .......................................................................................... 72
Figure 6.5 Number of travellers Mörarp ....................................................................................... 72
Figure 6.6 Number of travellers Bjuv ............................................................................................ 73
Figure 6.7 Number of travellers Åstorp ......................................................................................... 73
Figure 6.8 Number of travellers Klippan ....................................................................................... 73
Figure 6.9 Number of travellers Perstorp ...................................................................................... 74
Figure 6.10 Number of travellers Tyringe ..................................................................................... 74
Figure 6.11 Number of travellers Hässleholm ............................................................................... 74
Figure 6.12 Number of travellers Vinslöv ...................................................................................... 75
Figure 6.13 Number of travellers Kristianstad .............................................................................. 75
Figure 6.14 Numbers of commuters out from the municipalities................................................. 75
Figure 6.15 Numbers commuters into the municipalities ............................................................. 76
Appendix 7 ................................................................................................................................. 77
Figure 7.1 Number of commuters into Helsingborg ..................................................................... 77
Figure 7.2 Numbers of commuters into Malmö ............................................................................ 77
Appendix 8 ................................................................................................................................. 78
Figure 8.1 New regional station cites and municipalities without future investments ................ 78
Figure 8.2 Population in new station cities ................................................................................... 78
Figure 8.3 Municipalities in southwest Skåne ............................................................................... 79
Figure 8.4 Municipalities in Northeast Skåne ................................................................................ 79
Figure 8.5 Municipalities in Northwest Skåne ............................................................................... 79
Figure 8.6 Municipalities in mid Skåne .......................................................................................... 80
7 | P a g e
1. Introduction
Today, there is an ongoing debate that we stand in position of changing our mode of
transportation; from oil based mode, towards a more environmental friendly alternative. In
other words, one could argue that we face a change in the discourse of transportation. This is
however a complex and large scaled global issue. But simultaneously there are local and
regional aspects that one needs to understand in order create a working sustainable long
lasting mode of transportation. This concern of shifting mode of transportation is needed to be
handled by all decisionmakes from a global level down to a local level and vice versa.1 The
question is; how we as a population wants the society to act like in the future and sadly, we
could not wait and hope for the best. We are at this moment at a critical edge were
environmental issues together with increased price and decreased supply of oil have made that
a change is needed. It is all about planning, planning for the future, a sustainable future.
Campbell & Fainstain argue that there are three choices for how our planning process should
be developed in the future; the great metropolitan, a moderate decentralization or extreme
decentralization, each one having both pros and cons and a broad range of choices.2 This
development process is of course depending on different factors, and I will not discuss all of
them in this thesis. However, one of the most important factors in this discussion of the
development of our future society is the choice of transportations. The above stated argument
about environmental issues has started a debate that there is a need of changing our mode of
transportation in a more sustainable direction. In this debate, regional railway systems and the
expansion of those have come to be one solution of this issue. When one discusses
development of regional railway systems one needs to understand what a region is, and what
lies behind the development of regions.
1.1 Regions -concept and regulation Regional development has come to be one of the most important factors during the last two
decades for achieving an economic, social and environmental sustainable future.3 Regional
development as a concept have been taking place in the western advanced economy, as a
result of higher population concentration, an expansion of our spatial room due to increased
transportation opportunities and a demand of economic growth. This transformation is mostly
a result of structural changes, from an industry based society towards a society based on
service organized in clusters, universities and science parks, with a high educated population
which travels over larger areas than ever in their daily spatial room.4 As an example of this
expansion of our spatial room, one could exam the increase in distances that the average
person travels every day. Today, the average Swede travels over 50 kilometers every day,
compared with 9 kilometers 1950.5 About 10% of these travels were by some kind of public
transportation. Among these, 29% were counted as commuters, in other words 1.2 million
1 (Forsberg, 2005, p. 236)
2 (Campbell & Fainstein, 1996, p. 23)
3 (Svenska Kommunförbundet, Arena för tillväxt, 2003, p. 9)
4 (Banverket, 2007, p. 4)
5 (Wärneryd, Hallin, & Hultman, 2002, p. 73)
8 | P a g e
people in Sweden.6 This increase of our spatial room needs a well-designed and functional
infrastructural network. A well-designed and fast infrastructural network is perhaps the main
factor for economic growth in a region.7 This need of transportations, together with a demand
after economic growth and a well-designed infrastructural network of nodes needs a visions,
regulations and alternatives.
The regulation of regional development processes is both a top–down and a bottom–up
process. The European Union is at a global level the leading figure behind regional
development and it´s regulation.8 This regulation should help the democratization processes,
in a bottom–up approach in the planning of our common spatial room. These processes have
made that there today is a middle layer on the hierarchical democratic stairway, namely
regions.9 The agency that regulates this processes and guidelines at a transnational level is the
department of regional strategic planning department (ESDP). These guidelines most
important statements are development of regional innovation systems and directive of
subsidiaries.10
ESDPs regional program has been implied on most parts of Europe, including
Sweden and the region of Skåne. In Sweden, NUTEK11
and Boverket12
are the two national
agencies that apply the regional guideline programs on a national level, which on their hand
directs the regions. On an international level there have been problems with Sweden’s
regional development, because of its different spatial conditions compared with the rest of
EU. Sweden has spatial conditions that differ, when it comes to infrastructural and
demographic factors, with a population that is spread over large areas and greater distances
between cities, then the average European country. In other words, a national regulation at a
regional level is needed in a country like Sweden in order to a have a positive economic
development in a regional context.
Sweden does today have a huge program of different traffic policy guidelines including both
private and public transports. The main idea of the policy program is that it should help the
population with their daily mobility and at the same time be as climate-smart as possible.13
This is indeed a problematic situation. At the same time should our ability of mobility not
decrease and still should we be capable of keeping up with our national environmental goals.
This is another case of the problematic issue of long term environmental goals and short term
goals of economic growth. But one could at the same time not put a side that cars are a large
part of our welfare, which is claimed to be flexible and non-restricted. This has from an
environmental perspective created a situation where our freedom of mobility and our modern
regional development is claimed for creating urban sprawl and a sprawled population
demands better transportations options.14
On the other hand have the environmental issue
started a discourse change in our freedom of mobility, towards a more environmental friendly
6 (Sandow & Westin, 2007, p. 23)
7 (Näringsdepartementet, 2008, p. 118)
8 (Boverket, 2004, p. 13)
9 (Gren, 2002, pp. 20-21) (Hermelin, 2005, p. 269)
10 (Pinto & Rodrigues, 2010, p. 1734)
11 National administrative agency of business and economic development and regulation.
12 National administrative agency for planning of the built environment and management of land-use planning.
13 (Näringsdepartementet, 2008, p. 10)
14 (Scheiner, 2006, pp. 294-296)
9 | P a g e
development of transportations. As claimed above, a positive economic growth demands a
well-designed infrastructural network, and during the last decade a solution of this complex
issue has been raised, namely regional rail bound traffic. Regional rail bound traffic has not
only been argued to be the solution of the last years discussion of climate changes. Rail
bound traffic have in this discussion been one of the solutions in order to achieve an
environmental friendly transport network without a loss in freedom of mobility. With a
population that is spread over a larger area in a region.15
It is furthermore also claimed to be
the solution of integration of all parts of a region, even those areas that is located in the
periphery and therefore prevent depopulation in rural areas.16
1.2 Railbound traffic Rail bound traffic was introduced for commercial traffic in 1841, and have ever since then
been one of the most important mode of transportation systems. It was actually the most
important mode of transportation until the 1950s. 17
Nevertheless it has during the last
decades played minor role at least on shorter distances; these trips have instead mostly been
done with cars. However, there is today a change in the discussion of transportation as
mentioned before, from a motor driven traffic towards a system based on public rail-bound
traffic. Not only on a national scale of long transports, from country to country, but also on a
regional level, meaning city to city. This development on a regional level is taking place in
most western countries, not at least in Sweden. In Sweden one could today see a trend that is
becoming more and more visible, that new railway as well as old ones opens up again. We
have in other words seen a movement back to the 1950´s in the use of railways. In a historical
perspective, this development of regional rail bound traffic between cities in a region is not at
all a new idea, it could be found in several examples from the last century. For example, in the
1930´s England there was the idea of satellite towns. These cities could basically be described
as different smaller units of villages that were spread over an area, which was supposed to
separate by greenbelts and connected with infrastructure.18
The same development could also
be identified in the Master plan of Stockholm from 1950´s were satellite cities were supposed
to be connected with subway lines (network of cities).19
The introduction of this thesis have so far be given us a glimpse of the complex subject of
regional development and expansion. But in order to summarize one should try to understand
that there is a complex network of links between regional development, expansion and
sustainable development. In this network, infrastructure plays an important role as a major
player for regional expansion, development and sustainable development, when it comes to
movement of population, cargo and labor. It is also important to remember that some of the
ideas of regional development and rail bound infrastructure are not only taking place at
present time, but also that it has historical association. The ideas of regional development
15
(Banverket, 2007,p. 13) 16
(Tillväxtanalys, 2010, p. 43) (Wärneryd, Hallin, & Hultman, 2002, p. 84) 17
(Prideaux, 2009, p. 98) 18
(Ward, 2002, pp. 106-107) 19
(Ward, 2002, p. 203)
10 | P a g e
could all be implied on the region of Skåne. The Region of Skåne is perhaps the oldest
example in Sweden of large scale regional development. 20
1.3 Purpose of the study So far, there have been numerous research projects on regional development when it comes to
innovation system, infrastructure and mobility. Some these are from larger projects in Sweden
that have been a success when it comes to commuting and regional expansion, for example
the Öresund Bridge in the region of Öresund (in southern Sweden and Denmark) and the
projects in Mälardalen around Stockholm.21
However, there have so far been shortages of
studies that link regional expansion and public transportation in a broader sense.22
Moreover,
there has also been a shortage of studies on areas and cities that are located in periphery of a
region and how they will be affected by the positive economic development that is taking
place in populated areas in a region. What is more, is that there still is no actual empirical
evidence concerning if an increased access to public transportation actually benefits
commuters and travellers more than on marginal levels.23
But it has been showed that
improved accessibility to a train station reduces car dependency and increases the use of
public transports.24
Even if these statements proclaim a problematic situation, private cars are
still to a far extent the most important mode of transportation. Although that there have been
large investments and political campaigns in order to increase the use of public transports.25
The purpose of this study is therefore to investigate and find a link between improvements in
accessibility to rail bound traffic and the numbers of commuters and travellers from a
municipality or/and a station city on a regional level in Skåne. I will also investigate if there is
any collaboration between improvements of accessibility to regional rail bound traffic and
population numbers in a municipality or/and a station city both near regional centers and in
the periphery of a region. Furthermore, I also aim to find a link between the main
development factors of economic growth, regional expansion and environmental
sustainability and then link this to development of regional rail bound traffic.
1.4 Delimitations of the study As mentioned earlier, the main idea is to investigate what effect regional trains will have on
region, when it comes to numbers of commuters, travellers and population levels. Therefore I
have been strict to this aspect of regional trains and I have therefore not put in any national
and interregional trains as a factor even if they share the same lines and use the same stations
and could be counted as commuter trains. I have also decided to not include Malmö,
Helsingborg and Lund in this study because of their high numbers of inhabitants.
The first train station that was constructed for regional use in Skåne was opened in the year of
1982. I have therefore chosen this year as the starting year for my study. I have then tried to
20
(Statiska Centralbyrån, p. 24) 21
(Statiska Centralbyrån, p. 65) 22
(Wärmark, 2004, p. 13) 23
( Armstrong & Rodríguez, 2006, p. 22) (Jonsson L. , 2007, p. 1) 24
(Olaru, Smith, & John , 2010, p. 220) 25
(Boverket, 2005, p. 21)
11 | P a g e
analyze patterns from the introduction of the station in each city and municipality, and then
from this tried to understand what will occur during the upcoming years in new station cities
until the year of 2014. Furthermore I have been using statistics from SCB (Swedish census
bureau)26
for my investigation. Some of these data are not available from the year of 1982, in
one case from 1993 when it comes to data of commuters from each municipality. The
numbers of commuter also refers to all commuters, and not only those who are commuting
with trains. But I would argue that this still is a reliable source because of that there is a
correlation between both the opening year of the train station and an increase in the amount of
commuters. When it comes to population levels only every fifth year was available for every
individual city. All of the available data from the region of Skåne is from 1982 until 2010.
This is problematic since it gives a restraining effect on the time perspective of the thesis.
However, I will present a deeper investigation of the used data in methodological chapter.
These above declared statements bring up several questions around concentration of
population, important transports corridors among other questions. Of course, this have been
argued and discussed in policies in Sweden for a long time. But still there are a lot of
questions to find answer for in order to achieve an extent use of commuting and travelling of
public transports. I will not try to find evidence for the whole spectrum of mobility and
sustainability of public transports. But I will try to find some evidence and a method which
could be applied at regions which are in the same dimension as the region of Skåne.
1.5 Disposition So far, there have been discussions about the complex system of infrastructural regional
bound traffic and its connection to the regional development, including its need of regulation
and investment in order to have an economic growth. In the next chapter there will be a
discussion and overview on region of Skåne, it´s general conditions and development
processes. I will then present the found knowledge in the theoretical section. This chapter
includes accessibility, mobility, regional development, regional expansion and infrastructure
and how these are connected in a regional context when it comes to development of rail
bound traffic. I will then present the methodological framework of the study. The study
should be considered as a quantitative study of computer based analysis of statistical material.
This statistical data is presented in the empirical part that is based on own produced maps and
graphs, based on statistical data. The empirical results is then analysed and concluded in the
last section of the thesis.
26
(Statiska centralbyrån, 2011)
12 | P a g e
2. Research questions
- What factors are behind the development of regional rail bound traffic in Skåne
when it comes to aspects of regional development and regional expansion?
- What aspects lie behind a development of positive and regularly use and flow
travellers and commuters relating to regional rail bound traffic in region of
Skåne?
- Are there any spatial patterns between municipalities and cities which have a
regional railway station and those who do not have when it comes to population
levels, both now and in the future?
3. Region of Skåne27
”Skåne experiences at this moment regional growth both on a mental stage as well as a
geographical stage”28
Skåne in southern Sweden is one of four areas in Sweden that have a regional independent
office.29
The purpose of the regional office is to develop and analyze the potentials of the
region, i and to gain a better democratization in the regional spatial planning, when it comes
to infrastructure, housing, nature and climate.30
Skåne have today a total number of 1.2
million inhabitants and four major cities. These cities are Malmö with 270 000 inhabitants,
Helsingborg with 120 000 inhabitants, Lund with 100 000 and Kristianstad with 75 000
inhabitants.31
There are 33 municipalities, which varies in size in Skåne. These municipalities
are divided into labor regions which are connected by a network of transportation corridors
and nodes. Most important nodes among these are; Malmö, Lund, Helsingborg, Hässleholm,
Ystad, Landskrona, Trelleborg, Simrishamn and Osby.
3.1 Processes of regional development As mentioned in the introduction, regional development is closely connected to infrastructural
development and investment, as well as regional expansion, which requires an economic
growth. Regional expansion is therefore based on increased transportation between nodes in a
spatial network of both labor and cargo.
At a national level, Sweden aims to be in the front of the regional expansion and Skåne is one
of the prime regions. In this debate of labor regions, regional expansion and positive
development, public transportation have many times been called to be the answer for the
27
(Map of Skåne is available in appendix 1) 28
(Svenska Kommunförbundet, Arena för tillväxt, 2003, p. 60) 29
(Statiska Centralbyrån, p. 24) 30
(Region Skåne, 2010) 31
(Region Skåne)
13 | P a g e
future.32
Commuting and flow of labor, is as one could exam, two important aspects of
regional development. Commuting and flow of labor is regulated and analyzed with labor
regions. Malmö, Lund and Helsingborg in Skåne are all counted in the top in Sweden, when it
comes to flow of commuters and movements of labor.33
These three cities are also the most
important links and nodes for regional commuting in Skåne. If one set the amount of
commuters down to 2000 daily commuters, there will be a link between all larger cities in
Skåne, if the numbers is set to 1000 daily commuters, then it will be a link between all cities
even smaller ones.34
This have led to that Skåne have created a dependency between larger
labor regions and economic growth, were smaller local labor regions are tied to each other in
larger labor regions. At this moment, region of Skåne has 11 smaller labor regions and three
larger labor regions. These regions ought to work as a complement to the region as a whole.
However, this also shows that there potential and a demand of integration of the labor regions
in the region.35
There are of course both problems and opportunities with the development that actually is
taking place right now in Skåne. First of all, the expansion of our daily spatial room have
made that is not unusual to commute more than 2 hours a day.36
This is socially problematic.
One could ask if it is possible to have social life when you are commuting for more than 2
hours every day. However, commuting also means a solution of a complicated question in
many areas, suddenly there is a solution for areas in the periphery to have a steady population
ground, economic growth and increased working opportunities.37
In contrast there are
problems of different environmental issues, urban sprawl and so on. It is at this stage
important to remember, that these theories including regional processes of development are all
a part of a market based discourse of economic growth and competition between regions.38
There are some theories and development projects that deal with the problem of urban sprawl,
infrastructure and regional expansion, at least in a certain sustainable direction. Example of
this is Transit Oriented Development (TOD). Transit–oriented development has been
discussed during the last decade and it could to some extent also be applied in the case of
Skåne. TOD is focused to prevent urban sprawl, even in cities in the periphery of an urban
area. Main characteristics of a TOD area is high density, and short walking distances to public
transportation hubs or stations. The land use should have a varied pattern of residents,
employment and shopping, which should be designed for walk and cyclist.39
TOD and its
ideas of development in a regional context are connected Christallers theory of hieratical
levels of cities and the theory of polycentric network between nodes in a region, which is
depending on each other with a flow of labor, knowledge and service. 40
32
(Bösch, 2008, p. 1) 33
(Örebro Universitet, 2006, p. 16) 34
(Levin, 2008, p. 5) 35
(Levin, 2008, p. 3) 36
(Svenska Kommunförbundet, Arena för tillväxt, 2003, p. 48) 37
(Boverket, 2005, p. 13) 38
(Rodrigue, 2009, p. 7) 39
(Olaru, Smith, & John , 2010, p. 220) 40
(Meijers, 2006, pp. 245-247)
14 | P a g e
3.2 Regional infrastructural conditions The start of the development of modern regional rail bound traffic in Skåne was in the year of
1982, when the first train station for regional use was opened. Today, there are some major
railways that run through Skåne. Most important of the railways in Skåne are “Södra
Stambanan” which connects Malmö with Stockholm; it is argued as an important link for
both public transportation as well as cargo traffic. The other two important railway corridors
are “Västkustbanan”, which is located from Malmö to Göteborg,41
and “Blekingebanan” that
connects Kristianstad with Karlskrona in Blekinge.42
There are also some smaller regional
tracks and local tracks that only have cargo and/or regional traffic. There are on some of these
lines planned investments, which contains rebuilding or expansion of rails. On the larger
tracks most of the investment are to unburden critical lines that are at the edge of their
capacity, mostly around Malmö, Helsingborg and Lund. However, the infrastructure system
in Skåne has at the moment a high standard if one compares it on a national level. Skåne does
as well have the advantage for public transportation because of the population density. This
means that there are a couple of important nodes for commuting. Most of the commuting
between these nodes has in a historical perspective been done with cars. This is because of a
well-designed accessible network of highways that connects cities both in Skåne and in
Sweden.43
41
(Banverket, 2007, p. 6) 42
(Tellerup & Tellerup, Kristianstad-Karlskrona Blekinge kustbana ) 43
(Banverket, 2007, pp. 4-6)
15 | P a g e
4. Theoretical Framework This section deals with theoretical framework of rail bound traffic in context of regional
development and the involved factors in this umbrella term. Some of the main theories have
already been mentioned and highlighted. In this section I will try to put them in a perspective
on other factors that involves development of regional railway systems and link them together
in order to exam how they are depending on each other. From the previous chapters, one
could distinguish some important factors;
- The important role that a regional infrastructural network has in a spatial system.
- That there is a complex spatial relationship between different development processes.
- That there are reasons why development and expansion could occur at a certain time,
for example; visions, regulations, investments in infrastructure, spatial conditions
etc.44
There are furthermore some variables that are considered to be important for these processes
and it is clear that there is a system of different variables that could ignite a regional
expansion and development. However, there is not any exact theory on how all are linked to
each other.45
The different variables that are involved in the regional processes and in the theoretical
framework of regional development and expansion have been touched upon so far; economic
growth, commuting, accessibility, mobility and sustainable development. Were some having a
correlation, and some have a more unclear connection to regional development and
expansion. All of these will be more investigated in the upcoming chapters. But then again
one could already here distinguish a crucial statement, that development and expansion of
regions demands an economic growth, which do not collaborate with environmental
sustainable goals at the moment. This has done that one today stand in front of a critical cross
road of conflicting factors.46
4.1 Regional development To begin with, as described before, there is no actual theory that encompasses all perspectives
of regional development. There are a number of different theories that deals with this subject
more or less.
When one tries to study development of regional rail bound traffic, there is a need to consider
what a regional development and expansion in fact is. Regional development is the process,
which is taking place in the middle layer on the hierarchal democratic stairway, between local
and national level. This process includes improvements of economic growth, housing,
employment rate, accessibility, and service in the region as a whole.47
Among these hard
values there are also soft values that are linked to regional development such as attractivity,
44
(Rodrigue, 2009, p. 7) 45
(Wärmark, 2004, p. 16) 46
(Banverket, 2007, p. 9) 47
(Hermelin, 2005, p. 267) (Pike, Rodríguez-Pose, & Tomaney, 2006, p. 24) (SIKA, 2001, p. 18)
16 | P a g e
nature and factors of demographic concerns.48
These soft and hard values are all depending on
strong economic structures49
, universities as well as governmental policies, visions and
guidelines.50
Regional development has also come to be a global competition of commercial
values, meaning between countries, and national competition, meaning between regions. This
includes the importance of a strategic value of a specific place, sustainable regional
expansion, innovation systems and clusters which are all connected in a complex network.51
This connection of global competition is about attracting labor and investments to a specific
area /or region. In order to attract those, a region needs to have all of the above stated points
well-established and organized.52
Furthermore, a region needs to be equal on economic,
cultural, social and also political planes. It is also a question of functionality of specific areas,
which has developed through processes involving housing possibilities, infrastructure network
and institutional systems.53
When one discusses regional development and its theory, there are factors that lie behind the
creation of a region. In the creation a region, there are two common explanations, namely;
administrative and functional regions. An administrative region is based on cultural and
political values; many times socio–economic factors along with historical and environmental
events.54
The people inside an administrative region define themselves as a population on
their own, and the borders are many times based on historical or mental borders.55 Functional
regions on their hand are in general based on a node56
, for example a labor pool, or a regional
center.57
The theory around functional regions is closely linked to Christallers Central place
theory. This center of labor and distribution of service is in a need of surrounding area in
order to serve the demand after products, labor and facilities. A functional region is
established when smaller labor regions are linked together and one could distinguish an
expansion of the spatial room in larger regions.58
However, there are some drawbacks in the
theory around the creation of an administrative region. An administrative region tends to get
outdated fast for the reason that it is based on historical and mental borders that was created
when the region was introduced. Therefore, functional regions have come to be the more
logical choose of geographically describing regional processes and development.59
4.1.1 Regional expansion The discussion of regional development and the increase of our spatial room are often referred
to regional expansion and in order to understand what lies behind regional development, one
need to understand the function of regional expansion. Regional expansion gives one the
ability to have a freedom of mobility, were one could choose to live at one place, work in
48
(Stough, 2010, pp. 617-618) 49
(Pike, Rodríguez-Pose, & Tomaney, 2006, p. 14) 50
(Stough, 2010, p. 617) 51
(Örebro Universitet, 2006, p. 9) 52
(Pike, Rodríguez-Pose, & Tomaney, 2006, pp 10-13) 53
(Lönegren, 2001) 54
(Gren, 2002, pP. 12-17) 55
(Boverket, 2005, pp. 21-22) 56
(Statiska Centralbyrån, p. 22) 57
(Stough, 2010, pp. 613-614) 58
(Statiska Centralbyrån, p. 22) 59
(SIKA, 2001, p. 14)
17 | P a g e
another area and at the same time specialize in interests at different locations.60
In other
words, what is seen today is a demand of regional expansion.61
The theory behind why regional expansion is taking place at a certain time and place is
unclear, and no exact empirical data has so far been found. Nevertheless, there are some ideas
of factors which ought to initiates an expansion. To begin with, there are factors behind
urbanization that has been frequent used during the last decades, and therefore we see a
pressure on housing prices and as a result, families and households tends to move further out
from the city to suburbs and smaller cities (an expansion of our spatial room).62
This trend of regional expansion is also a case of an upturn in the ability of mobility, because
of an increased accessibility. One could argue that these aspects are clear and common
knowledge, but it has been discussed how regional expansion actually improves and help a
region to grow more than in square meters. However there is empirical evidence that regional
expansion creates economic growth, decrease unemployment rates, and helps regions to be
less vulnerable and stable to crisis. This expansion will therefore give the possibility to have
an economic growth, better ability to find qualified labor, better access to infrastructure and
freedom of mobility.63
For example, if one labor region has an economical decline another
could have an increase in economic growth and labor. Regional expansion could at this point
consequently stimulate one to still live in the hometown and work in another, with help from a
satisfying infrastructural regional network.64
Therefore, region expansion has come to be the
solution of keeping up positive population levels, economic growth and increase the
attractivity, even in the periphery of a region.65
4.1.2 Central place theory or polycentric network model Even if regional development only has been on the agenda for some decades, different
theories that involve the same ground concepts have been discussed and theorized during the
years. Perhaps the most famous and discussed theory is Christallers “Central place theory”
that were introduced in the 1930s. The Central place theory is based on different levels or
thresholds of service and producing levels in and between cities. A given city has a given
minimum demand and geographical domain, of which people is not willing to pay for.66
This
provides a hierarchal network of cities in which only a few cities (central places) will offer all
service and goods, these different cities are connected with infrastructure.67
If a city and its
surrounding area cannot fulfill the minimum demand of goods and service, then this city must
connect to the nearest central place that fulfills the levels of goods and service.68
This theory could be considered as the ground fundament of regional development, but it is
indeed generalized and simplified explanation of complex system and in the 1960s
60
(Scheiner, 2006, p. 291) (Frändberg, Thulin, & Vilhelmson, 2005, p. 54) 61
(Sandow & Westin, 2007, p. 11) 62
(Sandow & Westin, 2007, p. 25) 63
(Bergman, 2009, p. 7) (Näringsdepartementet, 2008, p. 55) 64
(Sandow & Westin, 2007, p. 11) 65
(Wärmark, 2004, pp. 18-44) 66
(Meijers, 2006, pp. 245-247) 67
(SCB, 2010, p. 19) 68
(Meijers, 2006, pp. 245-247)
18 | P a g e
Christallers theory was redefined. The redefinition of Christallers theory was due to the fact
that cities that interact in a network with each other in a region or nation could not be defined
empirical by Christallers theory, when it comes to linkages of growth and spatial relationships
of development in a region. The theory that was meant to replace Central place theory was
“Polycentric urban region”. This theory was expected to be introduced and implemented in
the western advanced economy. A polycentric urban region explains the regions as an area
that could have several different city centers of the same size and service, which is depending
on each other, both-ways. In this Polycentric model, there are primary centers and also
secondary cities that are depended on larger cities, and if the cities are in the same size, they
could work as a compliment to each other in a network.69
Both of these theories have been
criticized and discussed. Authors like Berry have claimed that none of the theories should be
nor abounded, nor fully used. Instead a progressive view of both should be used, were Central
place models should be applied for industrial economics and Polycentric urban models should
be used and applied at more advanced service dominated economies.70
However, the central
place theory as well as the polycentric model is general and static, both are clearly defined but
no exact demonstration and example of empirical evidence has so far been founded.71
4.1.3 Regional rail bound traffic Following up this discussion of development and different theories that is connected to the
regional development and network between cities, regional rail bound traffic has come to be
the main factor of connecting economic growth with regional expansion in a network of cities.
Before one starts to discuss regional trains, it is needed to be defined. Regional trains could be
defined as; rail bound traffic/commuter rail that operates within in a given area, such as a
metropolitan area or a region. Furthermore, it is many times owned by the public, but with
private contractors.
In the discussion of regional infrastructure, regional rail bound traffic is claimed to be one of
the best alternatives of transportations if it have a high level of service, which provides better
accessibility, air quality and growth in a specific area.72
However, these investments are
expensive and some studies shows that it is not economic endurable to have superior
infrastructural rail bound projects in new areas. Investments should instead be concentrated to
existing infrastructural network and corridors, which has a restraining effect on its flexibility
and accessibility.73
This creates two sides of the coin in the theory of regional rail bound
traffic. On the one hand it should aim for deleting polarization and unequal development in a
region. But at the same time it could instead create an unequal development because of the
fact that some areas gain more investments than other. Because of it is not economic
endurable to have investments in some areas. In other words, corridors, links and hubs could
69
(Johansson, 2006, p. 27) 70
(Berry, Parr, Epstein, Ghosh, & Smith, 1988 ) 71
(Meijers, 2006, pp. 245-247) 72
( Armstrong & Rodríguez, 2006, p. 22) 73
(Wärmark, 2004, p. 20) (Boverket, 2005, p. 22) (Örebro Universitet, 2006, p. 37) (Sivilevicius, Maskeliunaite, & Podvezko, 2009, p. 101)
19 | P a g e
create a core /periphery development in the region.74
According to Wärmark, improvements
of infrastructure, which improves mobility and accessibility, will be one of the most
fundamental facts of a marginalized relocation of people in the near future. Wärmark also
argues that investments of specific regional infrastructure only will have a marginalized effect
on the economic growth and the welfare of the region, than it is expected to have.75
At the
same time, there have been discussions that infrastructural investments and its impact on
regional development differs because of spatial conditions. Regions with a weaker economy
and higher unemployment will have economic growth, if infrastructural investments are
made. But areas with a high income and low unemployment will have low countable
differences if investments are made.76
However, regional infrastructure is argued as one of the
most important fundaments of our society, for economic growth, improvements of travel time
between destinations77
, distribution of population and to transport as large numbers of
passengers as possible between cities.78
At the same time one should try to problematize the connection between theories of regional
expansion and rail bound traffic at this stage. First of all regional expansion, has been argued
to reduce our chances towards a sustainable society, and instead campaign urban sprawl,
which is depending on cars.79
Secondly, areas with scattered population ought to have
regional busses, rail bound traffic is more preferred to have in populated areas at already
existing important transport corridors.80
Thirdly, there are the congestions of rail bound traffic
that is a large problem. This is explained by; that investments in rail bound traffic are
expensive compared with other infrastructural investments and it is also more sensitive of
delays and pressure on tracks. Therefore, congestions are created more frequently at rails than
in other transport constructions. In order to get rid of these congestions, investments are
needed in order to maintain a high mobility and accessibility.81
In order to summarize, regional rail bound traffic is claimed to be one of the solution for an
ongoing regional expansion in a network of cities and nodes. In other words; regional
development implies regional expansion and expansion demands well- designed
infrastructure. Regional trains should furthermore, also be more efficient and flexible when it
comes to accessibility and in the longer replace car traffic on some lines or at least decrease
the use.82
Though this there has been a change in the discourse during the last years, and most
of science and official reports tends to discuss that regional trains is the new possibility for a
continuing regional expansion in the concept of sustainable development.
74
(Rodrigue, 2009, pp. 56 -58) 75
(Wärmark, 2004, p. 55) 76
(Polasek, Schwarzbauer, & Sellner, 2010, p. 83) 77
(Näringsdepartementet, 2008, p. 118) (SCB, 2010, p. 65) 78
(Engström, 2005, p. 424) (Prideaux, 2009, p. 98) 79
(Olaru, Smith, & John , 2010, p. 233) 80
(Fridh, 1996, p. 4) 81
(Pike, Rodríguez-Pose, & Tomaney, 2006, p. 14) 82
(Örebro Universitet, 2006, p. 28)
20 | P a g e
4.1.4 Regional commuting As pointed out in the introduction, regional development is depending on one major factor,
namely labor regions; they forms a region and it is claimed to be the most important factor
behind economic growth as well as regional expansion. The term and definition of labor
regions were introduced in 1991 and the smallest part in a labor region is a municipality.83
Labor regions is created in two different processes; firstly if more people move into a local
labor region or if it expands geographical due to commuting.84
There are some steps in order
to decide and split up regions and divide those into labor regions. Step one is to decide a local
center, this include that a 80% of the working force should work inside the municipality and
not more than 7.5% commute to another specified municipality. If both of these are fulfilled,
the municipality is counted as independent labor region on their own, if not, then is the
municipality in need of being linked to another municipality. When the local centers are
divided, one divides the other municipalities into local centers. This is decided from where
one municipality has most commuters.85
At a national level in Sweden there have been a decline from 187 labor regions in 1970 to 86
in the year 2004, this development among others shows that there have been a regional
expansion and an extent of commuting behaviors. But it should at the same time be mentioned
that this development more frequently have been taking place in urban areas, were smaller
regions have been tied together, with the help of faster options of transports as one factor.86
A
labor region with a large and dense populated population has of course better possibilities for
economic growth than a labor region that is stretched over a far area that is sparsely
populated.87
There is at the moment a discussion if there will be continuing decrease in the
number of labor regions, some analyses claims a decline down to 67 labor regions in the year
of 2015 in Sweden.88
This development of labor regions is of course a case of increased
mobility, increased demand of labor from a larger market and a regional expansion.89
In other
words, one could argue that there is a clear link between the size of local labor regions and the
development of the labor market,90
as well as in the network of cities.
Infrastructural investments over a larger spatial area are unquestionably taking place because
of a demand of travelling over a larger area in order to have economic growth and increased
possibilities of commuting, which is connected to regional expansion, infrastructural
investments and labor regions. Currently, there is a trend of people moving out from a city
core to the periphery, because of subjective emotional personal feelings, economic reasons,
according to housing prices and consumption patterns outside of the city core. In this
movement distance to a train station plays a major role as one of the most important factors
when it comes to choice of moving out from the city core. These persons have many times a
83
(Örebro Universitet, 2006, p. 38) 84
(Bergman, 2009, p. 7) 85
(SCB, 2010, p. 10) 86
(Sandow & Westin, 2007, p. 12) 87
(Örebro Universitet, 2006, p. 22) 88
(Sandow & Westin, 2007, p. 12) 89
(Statiska Centralbyrån, p. 115) 90
(SIKA, 2001, p. 31)
21 | P a g e
background in larger cities, and they tend to use public transportation more frequently than
other. On the other hand, a person who tends to commute with automobile continues to do it,
even if they have satisfying public transportation options.91
This creates a situation, where the
facilities, labor, companies, business and universities are located at different places.92
Therefore one could today distinguish an extent in time from house to work. In other words,
today we live at one place and commute to our work in other part of the region.93
This
development is of course in need of good transportation corridors between different nodes, if
one should be able to commute back into the city for the working career and still be able live
were one is settled.94
Investments of infrastructure are therefore done for the reason of a
demand after more movements of labor and economic growth. The factor of economic growth
in this case is commuters.95
An individual that starts to commute is depending on subjective feelings and priorities, but
some general conclusions could be found. A commuter is many times a person with a high
education, the higher graduation level the more wish and need for commuting..96
Men have a
tendency to commute over larger distances compared with women, because of higher
education. Women furthermore tends to have a higher regularity use of regional public
transports.97
Psychological described there is time limit when one considers not commuting;
this time is set to 45 -50 minutes, or at most one hour door–to–door.98
There are also issues of
commuting as factors of inequality, when one starts to commute over a larger area, one part of
the family in some cases needs to take more responsibility in the household and maybe go
down to part time, most of the times women.99
Commuters also tend to be more stressed.
What is more is that groups which that already are marginalized have a tendency to be even
more separated in the commuting societies.100
4.2 Freedom of mobility and accessibility Accessibility and mobility could be considered to be the overall purpose of regional
development. If regional development is the power line, then one could describe accessibility
and mobility as the electricity that connects the different terms and makes them develop.
Accessibility and mobility needs to be separated and it could be described as; accessibility
refers to opportunities that are connected in time and distances and mobility refers to the
ability to move between locations that one needs to access.101
Furthermore, accessibility is;
“… dominantly the outcome of transportation activities, namely the capacity of
infrastructures to support mobility; it presents the most significant influence of transportation
on location.”102
However, transports have a purpose, and that is to fulfill the demand of
91
(Scheiner, 2006, p. 295) 92
(Svenska Kommunförbundet, Arena för tillväxt, 2003, p. 69) 93
(Statiska Centralbyrån, p. 34) 94
(Boverket, 2005, p 7) (Bösch, 2008, p. 1) 95
(Eliasson, Lindgren, & Westerlund, 2003, p. 828) 96
(SIKA, 2001, p. 35) (Sandow & Westin, 2007, p. 25) 97
(Näringsdepartementet, 2008, p. 65) 98
(Banverket, 2007, p. 9) 99
(Sandow & Westin, 2007, p. 16) 100
(Boverket, 2005, p. 13) 101
(Hanson & Giuliano, 2004, p. 4) 102
(Rodrigue, 2009, p. 63)
22 | P a g e
mobility.103
From this, one could argue that regional development is basically an increase in
mobility and accessibility.104
Freedom of mobility is depending on regional expansion, in the creation of nodes and
infrastructural networks. So far have this expansion and freedom of mobility been depending
on cars, but it has as mentioned been challenged by other modes of transportation. One could
simply understand the problem when one knows that the transport sector in Sweden is
responsible of 30% of the total amount of emissions. Because of these facts and the
environmental friendly trend that we face today, it is without a doubt simple to understand
that Sweden need to have a transportation system which could deal with this issue and
decrease the total amount of emissions Freedom of mobility is important in the development
of regional train traffic, and commuters today have high expectation on their mode of
transportation, meaning that commuters requires; comfort, service, quality, just in time,
safety, attractivity, travel time, schedule and distance as some of the factors that is needed to
be fulfilled.105
These mentioned demands should always be fulfilled at location in the core of
the city, as well as in the suburbs or even in the smallest station villages in the countryside.
Accessibility is considered as argued before as one of the main fundaments for economic
growth and regional development. However, accessibility could not be expected as ignited
factor of growth in all parts of a nation, e.g. an older demographic structure could not expect
high population or economic growth just because of increase in accessibility; it is one factor
among other. 106
Nevertheless, accessibility could actually be an attractive factor that people
perhaps will be reluctant to renounce because of the fact that better accessibility tends to
attract people to stay instead of moving.107
Accessibility and mobility is simply to apply,
through investments. However this often means environmental, spatial issues and problems
with congestions. Congestions are well investigated, but the solution is not fully understood
and solved, as the example here will show. Congestion occurs mostly in two different cases,
firstly when the demand of mobility becomes greater than the capacity and secondly because
of random events like accidents etc. The solution of this is to increase the capacity and
accessibility. But at the same time it has been showed that increasing in capacity increases the
demand and the history repeats itself.108
According to above stated arguments one could argue that accessibility and mobility have
come to be one an important part of attractiveness in a region, even outside of larger regional
centers. There is in other words a demand and a need of accessibility, in order to increase the
mobility.109
The solution of creating attractiveness in a region is complex, but there are some
examples of solutions of this issue. One solution of this is regional train stations or hubs at
attractive locations.110
An attractive city/or village needs good infrastructural connections,
103
(Rodrigue, 2009, p. 2) 104
(Hanson & Giuliano, 2004, p. 4) 105
(Fridh, 1996,p. 20) 106
(Polasek, Schwarzbauer, & Sellner, 2010, pp. 71-73) 107
(Eliasson, Lindgren, & Westerlund, 2003, p. 828) 108
(Rodrigue, 2009, p. 311) 109
(SIKA, 2001, p. 32) 110
(Nelldal & Troche, 2001, p. 91)
23 | P a g e
which could be implied through investments of regional train stations. There are examples of
an increased commercial and residential value nearby regional stations, and a decrease of
value the further away one moves from this location.111
But on the other hand there have been
discussion of that accessibility to a regional train station only have improved the value
slightly. One explanation of this could be that the accessibility only has been improved
marginable in the hierarchal regional network, it could be factors of schedule as well as need
of changing transportation at a another station.112
Other reasons could be that other mode of
transportations is more flexible, in order to reach a regional centers.113
4.3 Sustainable development in a regional context As discussed in the previous chapters, there have been an expanding of our daily spatial room,
longer distances between home and work, regional development, regional expansion, faster
transports etc. This together with other environmental issues made that a solution in came up,
namely sustainable development.114
“The term „sustainable development‟ emerged in the late 1980s when what is now called the
„Brundtland report‟ was published under the title Our Common Future. The Brundtland
report presented a common definition of sustainable development that is still topical:
Humanity has the ability to make development sustainable to ensure that it meets the needs of
the present without compromising the ability of future generations to meet their own
needs.”115
Sustainable development is indeed a vague and undefined theory, but it could still not be put
aside in the discussion in the theory of regional development infrastructure and rail bound
traffic. Sweden has, together with the rest of Europe, worked for a development process
towards sustainable development. However, so far have this thesis shown that it is a complex
problem, and one of the main factors is in a regional context is the use of cars. Cars have
somehow become a symbol of freedom, which ought to free oneself from geographical
restrictions and instead improve our geographical flexibility (freedom of mobility). Massive
communication with cars is a problem and it is mostly because of our increased daily spatial
movements during the decades that have shaped this situation.116
Regional expansion is
depending on a growing flow of traffic between different nodes in region. This process has
done that there are a pressure on different concerns such as; climate change, air quality, noise,
water quality, soil quality, biodiversity etc.117
There are furthermore soft values like
segregation barriers and social concerns in the context of regional expansion and sustainable
development.118
111
( Armstrong & Rodríguez, 2006, p. 38) (Pagliaraa & Papab, 2010, p. 204) 112
(Nelldal & Troche, 2001, p. 47) 113
(Jonsson L. , 2007, p. 28) 114
(Prideaux, 2009, pp. 100-106) 115
(Bösch, 2008, p. 37) 116
(Wärneryd, Hallin, & Hultman, 2002, p. 74) 117
(Rodrigue, 2009, pp. 268-272) 118
(Jonsson D. R., 2008, p. 28)
24 | P a g e
Sustainable development is also claimed to be the solution of the technological problems that
we faces in the development of a new mode of transportation. Sustainable development is
connected and linked to the development of technological solutions for rail bound traffic.
Ideological described, sustainable development argues that technological solution will help
our society to develop in sustainable direction; this should be done without any questioning of
economic or social structures. This development should in the longer run lead to a more
efficient and environmental friendly mode of transportation.119
If one compares above
mentioned statement of sustainable development and regional expansion it is obvious that
people should be encouraged to choose public transports (But then again the problem with
mobility contra sustainable development is well known). One could ask if it is possible from a
regional perspective to have transportations that is based on sustainable development.120
However, public transportation is many times called to be the answer of reaching sustainable
development, because of its ability to reach people which are not able to travel over a further
area, and it’s a vital part of the regional development and expansion. It is also claimed to be a
better environmental choice of travelling and furthermore it is a factor of economic growth.
One could argue that this is a simple solution but one might also ask them a question at this
stage. If for example a railway line is under the limit of being economical supportable and it is
then needed to be closed and replaced with less environmental friendly.121
Could it then be
argued to be sustainable? Even if this statement is problematic and discussed, there are still
some main points for reaching a sustainable transport planning in regional context;
A long term vision of a sustainable transport that provides mobility and access
to all.
The vision should contain a long term trend which considers all aspects of
transport, and their impacts on health, environmental, economic and social
implication.
Define environmental quality objects.
Set sector perspective targets with quality objects with milestones and dates.
Set strategies for achieving environmentally sustainable transport, and
implement those.122
119
(Pike, Rodríguez-Pose, & Tomaney, 2006, p. 115) 120
(Bösch, 2008, pp. 1-2) 121
(Bösch, 2008, p. 43) 122
(Rodrigue, 2009, pp. 276-277)
25 | P a g e
5. Methodology When one aims to understand patterns of infrastructure, regional processes and development
from a human geography method one can use the umbrella term of “transport geography”.
Transport geography is not considered as an own field, instead is called to be a field of
application, to understand economic and social processes.123
Transport geography emerged as
a discipline during the same time period as when one could analyse an increase in our
mobility and it is today claimed to be one of the most important fields when it comes to
understand and explain issues of mobility, regions, production of networks and nodes. The
role of transport geography is to understand the relationship between these factors and link
them together. A better understanding of these issues aims to help both public and private
actors with capacity, transfers, reliability and integration of transport systems.124
5.1 Scientific approach This study aims to find regional patterns from information that are collected from a number of
different sources. The theoretical framework is based on literature, articles and policy
documents from governmental institutions and the regional infrastructural office at region of
Skåne. My aim in research process was to find a broad theoretical background in order to find
a wide-ranging fundament of different factors and theories that could involve and influence
regional development. The conclusion is that there are a wide range of different factors that is
involved in the regional process. However, it is mobility and accessibility that is the most
important theories when it comes to development of rail bound traffic.
The data for my empirical research was based on three sources. Firstly, the data of the amount
of travellers on a daily bases and the opening year of the stations were from regional
infrastructural office in Skåne.125
The second collection of data was from SCB (Swedish
Census Bureau).126
The third source is the database of spatial information that is given and
approved to use from the culture and economic geographical department at Lund University.
5.2 Choice of method The study should be considered a quantity study, because of the reason that the empirical data
is based on large numbers of statistic data. The statistic material is to be considered as an
instrument of describing and showing numbers that should be compared with the theoretical
framework in an attempt to analyse the reality. A quantitative study aims for finding exact
numbers for an answer, instead of “pseudo quantity” numbers such as many, often etc.127
Moreover, a quantity study is based on a macro level (in this case a regional level), and not a
micro level (individual level). The macro level in this study is the collected statistical data,
which ought to be well thought-out study of a process in a given area over time. What a macro
quantity study aims to do, is to find a link between different variables and theories and
investigate if it proves or undermines the theory. A macro quantity study has its background
123
(Rodrigue, 2009, p. 37) 124
(Rodrigue, 2009, pp. 7-8) 125
(Region Skåne, 2011) 126
(SCB, 2011) 127
(Rosengren & Arvidsson, 2002, p. 361)
26 | P a g e
in the sociology were Max Weber and Emilee Durkheim were two of the main actors in this
school. Both of them tried to find connection between movements in the society, population’s
behaviour and different official variables.128
I would argue that this type of macro quantitative
study is well designed for this type of thesis. I am using a data tool and large numbers which
ought to show an objective reality from a macro level perspective.
From above stated arguments and statements, one could argue that this method is a positivistic
stance, because of that is trying to highlighting quantitative methods and objectivity in order
to find patterns. Positivistic science is inspired by the nature science and is often claimed to be
more objective, which proclaims hard quantity facts. The hypothesis should then be open for
external review and retest of one´s hypothesis.129
A positivistic research is more over a
method that is close linked to naturalism, which in turn is a philosophical scientific model,
which means that one is doing a study of social reality with the use of general terms, in order
to find a general pattern for the specific case.130
At this point one also needs to define their science and how one observes and identify it. This
is done by validity and reliability. Validity and reliability is a tool for measuring the quality of
the collected data. Validity measures if one really is investigate what one is supposed to do.
Reliability measures how reliable ones choose of tool for measurement that one uses actually
is.131
The validity of the data should be reflected as quality. The data comes from national
agencies and exact numbers for every question have been used, so the validity of the data is
reliable.
5.3 Collection and visualization of empirical data The empirical data is basically based numbers gathered from two sources as told in the
purpose, SCB (Swedish census bureau) and official numbers of stations and the amount of
travellers from the regional infrastructural office at region of Skåne. The databases were
collected in Excel documents with a number representing each year from the collected data
and each station city or municipality. This was a problem which had to be dealt with high
caution. My purpose was to find data so close to the station city/village as possible, in order to
have data that could represent something that was close to source of the study as possible. But
this was not possible at all levels.
Most of the data from SCB represents only municipalities, so there was a need to draw some
general conclusion for the station cities. But in most cases, there was relationship between the
statistics from the municipality and the station city. I would argue that this is of two reasons.
Firstly, the station is mostly located in the largest city and according to the theories around
catchment area and accessibility almost all station cities has the whole municipality as there
catchment area. Secondly, because of the reason that many municipalities have two or more
stations in there municipality, which increases their catchment area.
128
(Rosengren & Arvidsson, 2002, pp. 327-333) 129
(Guelke, 1985, pp. 130-131) 130
(Bryman, 2004, pp. 250-251) 131
(Rosengren & Arvidsson, 2002, p. 47)
27 | P a g e
When this process was finished I decided to find a tool with high validity and reliability in
order to process this data and to get well–designed databases for my presentation. In this
thesis I have used two different tools for doing this, ArcGIS 10 for design and visualization of
maps, and Microsoft Office Excel 2010 for describing and present the collected empirical
data.
As described before I first collected all data in excel and started to process the data in order to
the purpose of the study. However, Excel is a tool that is used for presenting data. Large
numbers of data could be handled by Excel in order to perform and show trends in data tables,
or as in this case line diagram.132
The second tool GIS (Geographic information system) was
introduced the 1980´s, and have since then been developed into a common tool that is used in
business, government and academia. GIS is a tool that is used for organized and collect
geographical data. Furthermore, one could use it in order to handle, analyze and display
different kind of geographical spatial data.133
As described earlier in the method the spatial data from Skåne was based on data that was
received from culture and economic geographical department at Lund University. The spatial
data here represents different databases of geographical lines, polygons and points. In this
thesis the most important figures were; municipalities, railway lines, roads, cities and station
cities. The station points were not represented in the spatial data so I did an own data
collection in a point layer that represented all stations in Skåne.134
These stations points and
the polygons represented the municipalities were then joined with the data from Excel, in
order to achieve a map of all stations and cities in Skåne. These maps could be seen in the
appendix of all different railroads. The use of GIS in this study is only to present and visualize
maps of the spatial conditions in Skåne. The presented data in the empirical part is strictly
described with Excel and visualized as line diagrams, in order to support and clarify my
empirical findings.
5.4 Critique of method GIS have in this study been used for visualization of the spatial conditions of Skåne and
producing pedagogical maps. But one should still consider it as a subjective tool, even when it
comes to visualization and explaining the nature on a specific map. One should remember
important basic factors in the presentation of the analyses such as: choice of color, texture and
the hue. One should of course also apply this factors when the presentations from excels are
done. Besides this, there are also a need of considering which geometric figures that are used;
consider size, orientation and nature and how they are represented with different lines,
polygons and points.135
Furthermore, on objectivity, one could argue that using large numbers
of quantity data is not at all objective, only in some cases strong objectivity.136
Even if one is
aiming for being objective in there research, there is always a risk of taking a partial part of
one side, more or less. In other words, a research project is always subjective. We should
132
(Microsoft Corperation, 2011) 133
(Environmental Systems Research Institute, 1993, p. 2) 134
(Skåne karta tåg och buss) 135
(Rodrigue, 2009, pp. 158-159) 136
(Harding, 1997, p. 388)

28 | P a g e
instead aim for strong objectivity or minor subjectivity.137
In this discussion there is
furthermore a need to be critical of staring oneself blind of technique tools for visualization of
empirical data. This large belief in in technology that is inspired by nature science, is claimed
for being a “god trick” that have made us techno monsters, where one tries to see everything
from nowhere, maps and other lines are simply only positivism and an illusion.138
I agree with above stated argument, that one should not staring oneself blind at one side of the
coin. There is at all times a need for deconstruction, contestation, and webbed connections.
There is always needs to be critical of the objectivity of a project.139
The god trick is indeed a
problem, not at least in nature science and this method should be used with caution. But on
the other hand, I would argue that different methods of presenting data such as GIS and Excel
could be used in order to simplify and show another perspective on a specific issue. One map
cannot show everything, but it could help you to illustrate, what I would argue actually is
close to objective truth. However, one cannot simplify a complex world into total objectivity
in a map or a graph, but still one could simplify it as much as possible.
137
(Friberg, 2006, p. 278-281) 138
(Haraway, 1987, pp. 580-583) 139
(Haraway, 1987, pp. 584-585)
29 | P a g e
6. Empirical results In this section I will present the results of my study. There are as one could see no figures in
the text, so all results which are not presented with footnotes in the text refer to the appendix
and analyses of those. Appendices could be found after the reference list.
6.1 Spatial Conditions in Skåne I will in this section present the development of regional railways in Skåne from an overall
perspective, I will review the different specific lines that have regional trains, from the most
southern line Ystadbanan, and then in geographical order, from south to north. This
presentation of the spatial conditions could be founded in Appendix 1 at page 50.
Skåne have today a railway system that is concentrated to the populated areas in the south and
western parts, around the larger regional centres, Malmö and Helsingborg. The areas in the
north and eastern are more sparsely populated and the railway system is not as well
developed. The most important railway corridor is Södra Stambanan, which is located from
Stockholm to Malmö with stations in Osby, Hässleholm, Höör, Eslöv, Lund, Malmö and a
number smaller regional stations.140
Another important transport corridor is Västkustbanan
that is located on the west coast from Malmö to Göteborg, with stops in Malmö, Lund,
Landskrona, Helsingborg, Ängelholm and Båstad. There are also at this line some regional
stations in cities and villages.141
There are also a number of smaller regional railways in
Skåne; Ystadbanan, located from Malmö to Simrishamn, Rååbanan, located from Helsingborg
to Eslöv and Skånebanan, located from Helsingborg to Kristianstad. Skåne do also have some
major roads that are significant for both regional and interregional traffic. There are
furthermore some smaller railroads at different lines, these are either resign or only for cargo
traffic.142
6.2 Ystadbanan
Ystadbanan is located in the southern parts of Skåne and is used for regional and cargo traffic.
The line is located from Malmö in the direction towards Simrishamn, through Svedala,
Skurup, Rydsgård, Svarte and Ystad at a first leg. The second leg is from Ystad to
Simrishamn, and there are regional stations in Köpingebro, Tomelilla, Lunnarp, Smedstorp,
Gärsnäs and Simrishamn. The results here are based on the empirical data that is presented in
appendix 2 at pages 51-56.
There were two other stations on this line in villages that were located close to Simrishamn,
but these were closed 2002, which improved the travel time from Simrishamn to Malmö. The
highway of E65 goes from Malmö to Ystad is located next to Ystadbanan. The first regional
railways were introduced in the earlier 1990´s, but it was first when Ystadbanan was
electrified on the whole line in 1996 one could start to discuss in terms of a working regional
railway line.143
140
(Tellerup & Tellerrup, Malmö-Nässjö-Mjölby-Norrköping-Katrineholm Södra Stambanan) 141
(Tellerup & Tellerup, Lund-Helsingborg-Halmstad-Göteborg Västkustbanan) 142
(Skånetrafiken, 2010) 143
(Ystadbanan)
30 | P a g e
The first stage of Ystadbanan is situated from Malmö to Ystad and has since the introduction
there has been a curve going up when it comes to population and travel levels. In this part are
the stations in Persborg and Oxie excluded, because of the reason that they are located inside
the borders of Malmö. Svedala is the first station outside of Malmö and it has ever since the
introduction in 1982 had a positive population curve and travelling behavior. But it is still on
percental lower levels if one compare with Skurup, Rydsgård, Svarte and Ystad. The
population level in Svedala have also gone up since 1982, but no actual improvement or
relationship could be seen until 2002 and from this stage the graph also shows a positive
curve in the number of travellers. The stations in Skurup and Rydsgård in the municipality of
Skurup have also seen improvements, both in the amount of travellers and population levels.
The station in Skurup has since the opening in 1989 had a high number of daily travellers, but
with obvious improvements since the year of 2002. The station is Svarte, Ystad and
Köpingebro have a pattern that is close to Skurup; all of the stations have a high level of daily
travellers and increased population levels ever since 2002.The number of daily travellers has
actually increased tripled at the station of Köpingebro.
The second stage of the line is located from Ystad to Simrishamn and is sometimes called
Österlenbanan. The line has during the years had some improvements but also shutdowns. In
2002 two stations was closed, which improved the travel time for the line. Today is the time
schedule is set to 1 hour on the line in the morning, and 2 hours on day time and then 1 hour
again in the afternoon and in the evening.144
However, the station in Tomelilla shows almost
the exact same pattern as the previous stations, a steady improvement since the introduction
and a real boost in 2002, the same pattern could also be seen in Lunnarp and Smedstorp. The
station in Smedstorp have interesting curve if one compare the number of travellers with the
number of inhabitants, 372 inhabitants in 2005 and 118 daily traveller in the same year.
Simrishamn and Gärsnäs station is located longest away from Malmö, almost 90 minutes of
travelling time.145
The municipality of Simrishamn is the only area, were there has been a
decline in the numbers of inhabitants. The last line diagram shows the number of commuters
and there have been an increase in the numbers of commuters going out and in from all
municipalities, and one could also here analyze a pattern of a boost since the year of 2002.
144
(1 Skanetrafiken) 145
(2 Skånetrafiken)
31 | P a g e
6.3 Södra Stambanan Södra Stambanan is located from Stockholm to Malmö. In the Region of Skåne, it is located
from Osby, through Hässleholm, Höör, Eslöv, Lund, Malmö and a couple of smaller cites that
I will present more in detail shortly. The rail is double-lined and it is also shared by cargo
traffic, interregional traffic and regional trains.146
There is also an important highway corridor
located next to the rail. The results founded here are based on the empirical findings which are
presented in appendix 3 at pages 57-61.
The first section of the line is located between Malmö and Lund. The stations in Lund and
Malmö are excluded. All of the municipalities that are located along the line show a positive
population curve, except Hässleholm, which had a decrease until the year of 2000, but since
2005 presented a positive development again. The stations in the municipality of Burlöv and
Staffanstorp, which are located between Lund and Malmö, have been going steady up ever
since the introduction year 1982. Burlöv and Åkarp which are located closer to Malmö have
not had such a distinct growth as Hjärup, which have been going steady up since 1982. The
graph of Burlöv population level and the train station graph show a correlation until the end of
1990s. The number of travellers in Åkarp follows a high number but it should be noted that it
does not follow the population curve. Hjärups has a pattern between the numbers of travellers
and the population levels between 1990 and 2004 and it increases equally.
The stations in Stångby, Örtofta and Eslöv have all improved in the amount of travellers, even
more if one compares with the stations between Lund and Malmö. Both Stångby and Örtofta
show high numbers of travellers compared with the population level. Örtofta had a population
of 196 in 2005 and approximately 361 daily travellers in the same year. Eslöv had
furthermore, an increase in the number of travellers until the year of 1998, but since then there
is curve going downwards. This is probably because of faster communication to Malmö and
Lund with Öresundståg, which has lower amount of stops.147
But there have on the other hand
been a heavy increase in the number of inhabitants with almost an increase with 5000 people
in 10 years.
The last section on the rail is the stations in Stehag and Höör. Hässleholm is also a part of
section and it will be presented in the presentation of Skånebanan later on. Stehag displays a
positive numbers both in the amount of travellers and in the population levels ever since the
introduction in 1987. Furthermore, it is possible to travel with other public transportation
options in the southern direction; this is one reasons of the high number of travellers. 148
Höör
shows a positive development in population numbers, but when it comes to the numbers of
travellers with regional trains we see the same pattern as in Eslöv, a decline since the year of
2000, probably because of the same reason. The amount of commuters out from the
municipality on this section of the railway system in Skåne shows a positive curve. However,
Eslöv shows a line that goes almost straight up and in 10 years, there are almost 30% more
commuters that travel out from the municipality. The numbers of commuters into the
municipalities have also increased but not significantly.
146
(Tellerup & Tellerrup, Malmö-Nässjö-Mjölby-Norrköping-Katrineholm Södra Stambanan) 147
(3 Skånetrafiken) 148
(3 Skånetrafiken)
32 | P a g e
6.4 Västkustbanan
Västkustbanan is located from Malmö to Ängelholm in Skåne, through a number of cities and
villages, including Åkarp and Hjärup which were discussed in the previous presentation on
Södra Stambanan and they are therefore excluded in this section. Helsingborg is also excluded
because of its size. The line goes from Lund further up to Kävlinge, Döjesbro, Hjälarp,
Landskrona, Glumslöv, Rydebäck, Helsingborg, Ödåkra, Kattarp and Ängelholm. The track is
double on all lines except on the route after Helsingborg where it is single way towards
Ängelholm. Furthermore there is also one important highway that is located almost at the
same line as the rail. The rail between Helsingb6org and Lund was rebuilt in the year of 2000
and a couple of new station was at this point introduced, this is why o there is an increase in
the amount of travellers at this point.149
A fully presentation of the empirical data is available
in appendix 4 at page 62-6.
All of the municipalities that had a station since the year of 1982 have a positive development,
when it comes to population levels. Firstly; Kävlinge have since the introduction been
growing steady, with some smaller dip in the beginning of 2000 both in population numbers
and, due to changes in the departure schedule, but today the numbers is higher than ever.
Döjesbro which were opened as a station in 1984 had a stable curve until the beginning of
2000. There have however since 2000 been growing from a level of around 250 persons every
day to 500 daily travellers. Hjälarp have during its 10 years as a station city been stable with a
level of just under 500 travellers every day. It should be noted in Döjesbro and Kävlinge
which both are located in the same municipality have a population line that follows the
number of travellers.
The next section on Västkustbanan contains three different stations; Landskrona, Glumslöv
and Rydebäck. Landskrona is the largest city on the line, and it is therefore a higher number
of travellers and inhabitants. Since the rebuilding of the rail in the year of 2000 there has been
an increase in the amount of daily travellers. Glumslöv and Rydebäck have also been growing
when it comes to population level. Both stations have high numbers of travellers compared
with the population and it seems to be a continuing trend. The next section on the line is from
Helsingborg to Ängelholm and it holds three stations; Ödåkra, Kattarp and Helsingborg.
Ödåkras population have actually decreased since the building of the station, a reason of this
could not be founded. The levels of travellers have also been unstable, with a steady increase
until the year of 2004 when the graph line was straighten out and a decrease in the amount of
travellers could be found. Kattarp have the same pattern as Ödåkra with a decrease in the
population and an unstable amount of travellers. At last, Ängelholm as a station had some
dips during a couple of years but have however had an up going curve during the last years.
Furthermore, Ängelholm population have been growing in a stable line since the station was
build. When it comes to the amount of commuters out and in from the municipalities a pattern
of growth is seen at all levels except for Kävlinge which had a decrease in the numbers of
commuters into the area since 1993. Moreover, the numbers of commuters have increased
significantly especially after the rebuilding of the line, which appears to be a factor of high
use of the regional trains.
149
(Tellerup & Tellerup, Lund-Helsingborg-Halmstad-Göteborg Västkustbanan)
33 | P a g e
6.5 Rååbanan
Rååbanan is located next to Västkustbanan on the west side of Skåne. The rail is located from
Eslöv in the south to Helsingborg in northeast, through a couple of smaller villages. The
Stations are located in following cities; Teckomatorp, Billeberga, Tågarp, Vallåkra, Gantofta
and Helsingborg. In this section are Helsingborg and Eslöv excluded. Eslöv have already been
presented and Helsingborg is a regional centre and are therefore not of interest. A fully
presentation of founded data is presented in appendix 5 at pages 67 -70.
The track is a single rail and it carries both cargos and regional trains. After the opening of
Västkustbanan in 2001150
, Rååbanan lost its position as the major railway on the west coast.
However it gave the regional trains new opportunities and two new stations.151
All of the
municipalities in this section have been presented with population level in the other sections,
but as a reminder, all stations have since 1982 have a positive population growth, mostly
Eslöv and Landskrona. Svalöv had until the earlier 2000 a negative trend but had since then
had a positive population curve.
The station in Teckomatorp has since 1990 had a positive development of population, 1494
inhabitants in the year of 1990 and 1644 in 2005. The use of the station has varied over time,
but since 2005 a growth in the amount travellers could be seen. Today the station has a time
schedule that is set to one every hour.152
Billeberga have during the years had both a loss in
the population level and a quite low number of travellers which have varied year from year.
But since the early 2000, a trend could be seen with higher number of travellers. Tågarp have
at the moment both a high number of travellers and a positive development of the population,
which could be considered as odd because of that both stations next to Tågarp have a negative
trend. Vallåkra and Gantofta are both located close to Helsingborg but only Gantofta have so
far been having a positive trend of inhabitants. On the other hand, Vallåkra have a high
number of travellers every day but a negative trend in the number of inhabitants. The number
of commuters in and out from the municipalities has been shown in the previous section.
150
(Tellerup & Tellerup, Lund-Helsingborg-Halmstad-Göteborg Västkustbanan) 151
(Tellerup & Tellerup, Eslöv-Teckomatorp-Ramlösa (-Helsingborg) Rååbanan) 152
(4 Skånetrafiken, 2010)
34 | P a g e
6.6 Skånebanan
Skånebanan is a case that of a line that have a history that goes in two development directions.
Firstly, there are some stations that have been opened for a long time and secondly some that
have not been opening for more than 4 years.153
A full presentation of the founded the
empirical data could be founded in appendix 6 at pages 71-76.
One could argue that there is a pattern of two different groups on the line from Helsingborg to
Hässleholm. At first we have the municipalities of Bjuv, Klippan and Åstorp which all have
been having an up going curve during the last 10 years. In the other group there is Perstorp
which has a negative or stagnated curve. On the line from Hässleholm to Kristianstad there
are some interesting cases. First of all, Hässleholm shows a curve that is stagnated which
seems to be strange of the fact that is considered as a node in both a regional and national
perspective. Krisitanstad on the other hand is in up going curve in both the number of
travellers and population levels.
Closest to Helsingborg there are three stations that have been opened for the longest time,
Påarp, Mörarp and Bjuv. All three had during the first years a positive development, but a dip
in the year of 2000. However, after the reopening of the whole line from Helsingborg to
Kristianstad a steady development up going curve could be analysed. The station in Åstorp
was opened in the year of 1999, and the first years there was a small amount of travellers, but
since 2007 the curve has been going up to levels that is almost three double as large as before
1999. Klippan, Perstorp and Tyringe also show high numbers that seems to be continuing to
grow in the next couple of years. Hässleholm and Krististand have also been having high
numbers of travellers since the opening in 2007.
Vinslöv is located between Hässleholm and Kristianstad. Vinslöv have lost travellers the last
two years. Vinslöv had before the new schedule a timetable that was set to every hour, but
since the last years lost some departures.154
There have been small changes in the number of
commuters into the municipalities, but these have not collaborated with the start of the
stations. There has on the other hand been a positive development on the commuters that
travels out from the municipalities, especially those ones that is situated closer to
Helsingborg.
153
(Tellerup & Tellerup, Hässleholm-Åstorp-Ramlösa / Kattarp (-Helsingborg) Skånebanan ) 154
(4 Skånetrafiken)
35 | P a g e
6.7 Commuting patterns into regional centers A full presentation of the founded empirical data in this section could be founded in appendix
7 at page 77.
The regional conditions in Skåne for commuting and travel with regional trains have as one
could realize been over all positive so far. If one analyse the amount of commuters in and out
from the municipalities in Skåne no especially pattern could be seen, but if one analyse the
pattern of commuters going to Helsingborg and Malmö a totally different pattern is taking
place. Since 1993 the amount of commuters has gone almost straight up and most of the
development collaborates with the introduction of the regional railway station that has been
taking place during the same period. The amounts of travellers into Helsingborg have
increased from 8000 to 20 000 in 15 years. Malmö shows the same development with an
increase in the amount of commuters into the city from 42 000 to 60 000 during the same
period.
6.8 Future investments A full presentation of the empirical data for section 6.8 and 6.9 could be founded in appendix
8 at page 78-80.
6.8.1 Cities with new investments 2011 -2014 In the upcoming year investments are made in the northeast parts of Skåne. The project of
“Pågatågen Nordost (Pågatågen northeast)”, is taking place during the years from 2012 until
2014. All of the cities that will have regional stations have since 1990 had a population curve
that has been either stagnated or negative. The project consists of two railway lines, which
will both go in northern direction from Hässleholm. The first line is located from Hässleholm
to Växjö and in Skåne stations will be opening in Ballingslöv, Hästveda, Osby and Killeberg.
The other line will be located from Hässleholm to Bjärnum and Vittsjö and finally Markaryd
in Småland. New stations will also be installed in Sösdala and Tjörnarp south of Hässleholm
on Södra Stambanan. Stations will also be close to Kristianstad and in Bromölla, which will
be the end station.155
Osby have at the moment opportunities of travelling with train on longer
distances with interregional trains. However it is still a long distance to larger cities like
Malmö and Helsingborg. At last, Bromölla which is in the same size as Osby share the same
patterns in the population levels and the answer of this pattern is also almost surely the same;
the factor of distance that is too long to larger important regional centers. Furthermore, most
of the municipalities in Skåne will at least one regional station in after 2014. However, there
are also some municipalities that will not be affected by the investments that are made during
the next years and were currently is no plans on investments.
155
(Pågatågatågen Nordost)
36 | P a g e
6.9 No future investments
6.9.1 Southwest Lomma, Trelleborg and Vellinge are all located close Malmö and do not have any planned
investments. But because of its close distance to Malmö, they still have opportunity of growth
in number of population levels without regional railways. All of these three municipalities are
at the moment integrated with Malmö and there are more flexible options of public transport
options like city busses.
6.9.2 Northeast The northeast parts of Skåne has for a long time had a decline in number of population,
mostly in the municipality of Östra Göinge, which are both in the periphery with a scattered
and rural population. Östra Göinge´s population level has been going steady down, despite of
their good geographical placement within a close distance to Kristianstad. This is probably
because of a lack of good transportation options.
6.9.3 Northwest Båstad and Höganäs are two municipalities which are located in the northwest parts of Skåne,
close to the border of Halland. Both have seen a growth in the population levels, due to the
same reason as the case of the municipalities around Malmö, a short distance to a regional
center. Örkelljunga on the other hand is located in the inland, and it has a linear growth in the
number of inhabitants, furthermore the city would perhaps have loss in population if it was
not for the highway that runs through the municipality, that gives Örkelljunga a good mobility
and close distance in time to especially Helsingborg.
6.9.4 Mid Skåne The municipalities of Hörby and Sjöbo are located in the central parts of Skåne and these do
both have a growth in the number of inhabitants, not as heavy as in the other municipalities
that have regional train stations, as an example, if one compares Hörby and Höör. One could
also match Sjöbo with Ystad.
37 | P a g e
7. Analysis The aims for this thesis were to find and analyse if there are any patterns in the development
of regional railways since 1982 in Skåne when it comes to factors of population, travellers
and commuting.
7.1 Research question 1 - What factors are behind the development of regional rail bound traffic in Skåne
when it comes to aspects of regional development and regional expansion?
I would argue that there is a link between the theoretical framework and the empirical results,
between the regional development and expansion, and the development of rail bound traffic.
However it is also as mentioned in the theoretical framework some unclear link that also will
be discussed in the paragraphs on the following pages.
First of all one of the main factors in the regional development of rail bound traffic in Skåne
is the factor of population and fast infrastructural connections to regional centers (Malmö and
Helsingborg). The railway system in Skåne is developed from and around these populated
areas in the southwest and the northwest parts of the region, and mostly around the important
transports corridors of Västkustbanan, Södra Stambanan and important highways from the
start of 1982. As discussed in the chapter of regional development, I would argue that there is
a complex spatial relationship between different regional processes and regional rail bound
traffic.
In the region of Skåne are these factors of development influenced on different levels. The
regional rail bound network has developed from the more populated area in and around
Malmö and Helsingborg. This is mainly due to a couple of reason. Firstly, these cities had
already before a well-constructed network of nodes and lines between the cities, both when it
comes to railways and highways. This has made the investments cheaper. Furthermore, the
economic growth has mostly been concentered to the populated areas, which have done that
there is a need to have good infrastructural network because of a demand after specialized
labor and an economic growth. When there was investments in new regional railway system
one could see an increase in the amount of travellers over time at most of the stations even
those that is located far from the regional centers, up to the crucial time of 45-50 minutes.
After this, a positive travel pattern fades out and one could see a decrease in the amount of
travellers, probably due to fact that Malmö, Helsingborg and their hinterland is important to
all parts within 50 minutes in Skåne, especially when it comes to commuting.
The regional expansion in Skåne is taking place within the concept of Sustainable
development, on a social, economic and environmental level, and they are all linked to the
development of regional rail bound traffic. Firstly, there is the social concept of
sustainability. Regional traffic in Skåne is aiming for being social sustainable, when it comes
to reaching as many people as possible and increase their ability of mobility. However, this is
problematic, because of the reason that some parts are excluded from regional rail bound
traffic, due to the fact that it not economic sustainable to develop railway systems in these
areas, the population is simply to scattered and the factor of distance to regional centers is too
38 | P a g e
long. Environmental sustainable is perhaps the clearest declaration in the development of
regional rail bound traffic in Skåne when it comes to regional development and expansion.
Regional rail bound traffic is simply a way towards a more environmental sustainable choice
of transportation in the concept of regional development and expansion. However, it is still
problematic due to the same reasons as described above when it comes too factors of
economic growth and that not all inhabitants will be able to travel with regional trains because
of their lack of accessibility in order to have freedom of mobility.
Furthermore in this discussion there are the development of labor regions, which is also
considered to be one of the main factors behind regional development and expansion. The
development of labor regions will probably continue to expand, according to the increased
levels of commuters along the important transport corridors in and between nodes, especially
to Malmö and Helsingborg. However, this expand will only be taking place in some areas in
Skåne and some areas in the more scattered populated areas will not be able to integrated with
the larger labor regions within the region.
This process creates both a social and environmental challenge in the context of regional
expansion and development. The aim is to create a regional expansion that could improve
growth and accessibility to service in all parts of a region. On the other hand, it is also
environmental vulnerable because of that no development of alternative transport options
creates a society that is depending on cars. However, the last years developing of the regional
rail bound system have made it possible to travel with regional trains even in the peripheries
of the region. Several of these stations are outside of the time limit of 50 minutes to regional
centers in the region of Skåne, which is problematic, and therefore will the shift at these
places only be marginal.
7.2 Research question 2 - What aspects lie behind a development of positive and regularly use and flow
travellers and commuters relating to regional rail bound traffic in region of
Skåne?
The empirical results shows that there has been a heavy increase in the use of regional rail
bound traffic. First of all this is due to a couple of factors, which all involves accessibility and
mobility, which seems to be the overall best explanation of a regular use of regional rail
bound traffic. In order to have a steady use, a region needs to have a capacity of
infrastructural networks to support mobility. The development of regional railways in Skåne
shows that accessibility and mobility is important factors behind a positive trend of regular
use regional rail bound traffic, both when it comes to travelling and commuting. It is
furthermore also a question of governmental guidelines which promotes more environmental
friendly alternatives, instead of going by cars. In order to forsake to travel with cars, there is a
need for develop alternative transports that is equal or even more flexible when it comes to
accessibility to important nodes and regional centres. This development could be applied to
the case of Skåne on the important transport corridors that is located from Malmö and
Helsingborg. At these transport corridors there are some years of adaption and then a steady
growth in the use of a new railway station. This is due to both promotion and the subjective
39 | P a g e
feeling to choose to travel with regional railways have transformed, from a transportation
option that one uses on larger distances to an option that is more flexible even on a daily basis
when it comes to travel within in region.
One other important aspect that is crucial for a regular use of regional rail bound traffic is
time and schedule in regional expansion and in accessibility when it comes to mobility. In
order to have an economic growth, larger labour markets, specialized functions of cities and
equal level of development, a region needs to have fast transport option to important nodes
(polycentric region). The empirical results in this investigation shows that region of Skåne is
separated. I claim that the region of Skåne could be separated in three different development
groups of travelling and commuting patterns.
In the first group there are the municipalities and station cities that are located next–to or
nearby the regional centres of Malmö and Helsingborg. These municipalities show a distinct
growth in the amount of travellers from 1982 and in the amount of commuters going out and
in. However, the growth rates do not collaborate with the introduction of the station on more
than a marginal level. This is because of some different factors, first of all the factor of
distance and mobility. If one commute to Malmö or Helsingborg from these municipalities or
cities, there are other transportation options that are more flexible than regional trains, like
city busses, bicycle or cars. These cities and municipalities have for a long time been
developed around these regional centres and they are therefore already fully integrated and
adapted to these cities. In other words, these areas are not affected more than marginal by
introduction of regional station. Therefore are they not an own part of the polycentric model,
they are more or less already in a symbiosis and integrated with the regional centres.
If one travels further out from the regional centres of Malmö and Helsingborg, one finds the
cities and municipalities that are most affected positive by the introduction of a regional
station. This cities and municipalities are within a distance of 20- 50 minutes from one of the
regional centres. These areas show a distinct growth in the amount of commuter and travellers
that are equal involved with the introduction of a station. However, it has taken some years of
adaption time before a clear link in the amount of travellers could be founded. This is due to
reasons and arguments of accessibility and adoption time to a new mode of transportation.
Furthermore, this development have most likely been given people the possibility to still live
in one city and work or study in another city, or the possibility to move outside of the city to a
more attractive location with better subjective possibilities of service and housing. In other
words the increased accessibility has upgraded people possibility of mobility.
Most of the increase in the amount of travellers and commuters has been taking place along
historical important transport corridors along the west and the southern coast, as well as
inland on Stambanan. Furthermore, these increased levels of travellers and commuters is
taking place were one have the possibility to travel one way without any change of
transportation mode, to either a university city or an important labour market such as Malmö
or Helsingborg. There also some other stations that works within the time limit of 50 minutes
maximum. However, these travellers are in a need of changing trains at some of the nodes in
40 | P a g e
the region, for example Krisitanstad or Hässleholm, and therefore the growth of travellers is
not as distinct as in the above stated examples.
Group number three is the cities and municipalities that are located more 50 minutes from the
regional centres. These areas are many times either an end station or an area without a well –
developed infrastructural network of rail bound regional traffic. There are most of the times
not a correlation between the numbers of commuters and travellers and an introduction of a
new regional train station, some of them have a steady amount of travellers and some is stuck
in a downward spiral. There are also two cases of stations that have being closed due to small
amount of travellers, almost certainly caused by the factor of that they are too far away from a
regional city centres, or depending on the factor that is not economic endurable to have a
station there. These examples are from Ystadbanan as well at one location on Skånebanan.
However, some station in this last group have only been open for some years and therefore it
is hard to draw any exact conclusion according to the adaptation time of getting used to travel
with an alternative transportation option.
One could furthermore not put aside the aspect of labour market, labour regions and the
network of different facilities that is behind the use of rail bound traffic when it comes to the
amount of commuters. As described and analysed before, region of Skåne have two important
nodes that could be defined as regional centres, which are Malmö and Helsingborg. One
understands the importance of these two nodes when the amount of commuters in these two
cities during the last 15 years are analysed. Most of the cities and municipalities in Skåne
have a majority of labour going out from the municipality, except of those that are located
nearest Malmö and Helsingborg, which have a high amount of commuters going into the
municipality. The municipalities that are located further out, between 20-50 minutes from
Malmö or Helsingborg has a level of commuters going out from the municipality that is going
upwards and a stable curve of commuters going into the municipalities. The third group have
an up going curve of commuters going out from the municipality, but not more than marginal
if one compares with the first two groups. In almost all cases the amount of commuters
corresponds with improvements and better accessibility to specific regional railway systems
in municipalities.
I would argue that the use of rail bound traffic in Skåne have made it possible to analyse a
development of an up-going curve going into both regional centres and also into cities that is
located close to these important nodes. This is a case of polycentric urban development of a
network of cities that works as a compliment to each other; both between the regional centres
and their hinterland. This is clearly a trend of regional and labour market expansion.
However, this development of rail bound traffic have helped region of Skåne to have an
growth on many levels, those who are within the crucial time of 50 minutes from a regional
centre with satisfying accessibility of regional rail bound traffic. This will give the region a
possibility to have a smoother and more balanced growth, which will work within aspects of
network, nodes, expansion and sustainable development on both a commercial as well as on
an individual level. But it is also shown that some areas are more or less excluded at this
point. The growth is concentrated to the important transport corridors around Västkustbanan,
Södra Stambanan and Ystadbanan, if they are within the time limit of 50 minutes.
41 | P a g e
7.3 Research question 3 - Are there any spatial patterns between municipalities and cities which have a
regional railway station and those who do not have when it comes to population
levels, both now and in the future?
When it comes to population numbers and the spatial patterns between those cities and
municipalities which do have and do not have any station at this moment is fundamental. I
would argue there is a clear pattern that is close to the same previous analysed patterns. The
spatial patterns are developed in three different development groups. First of all there are the
municipalities that are located closest to Helsingborg and Malmö. These municipalities and
cities have ever since 1982 have a positive development of population levels; because of that
they are already fully integrated within the regional centres and are therefore not affected by
any planned new investments or affected by the regional expansion that is taking place in
Skåne at the moment.
The second group is those that are the municipalities and station cities that are located on a
distance of 20 -50 minutes from a regional centre. The empirical results show that they do
have a population curve that corresponds with the introduction of a new train station. This
clarifies that an expansion of the region and growth has been taking place. These areas are
located between Malmö, Lund and Hässleholm, between Malmö and Ystad, around
Krisitanstad and Helsingborg. There are at this moment two new stations that are going to be
located south of Hässleholm in smaller cities and they will probably have a positive numbers
both when it comes to the number of commuters and population, because of the reason their
fast and attractive distance from Malmö. Several of the municipalities in this group around
Helsingborg do also have major roads that are located through the area. This will give the
cities a good connection with a stable level of commuters and growth in the population levels
both now and in the upcoming years, even if they do not have any planned investments at the
moment. This is because of the reason they are already integrated with the regional network,
because of their good accessibility to mobility and therefore are they a part of the regional
expansion. On Ystadbanan there are at the moment not any planned investments, and there
will probably according to the empirical findings be a continuing stable level of population at
least to Ystad. From Ystad to Simrishamn is the development unsure, according to the factor
of time and accessibility to Malmö.
In the third group are those who are located farthest away in the periphery from the regional
centres. In the case of Skåne, these are located north and northeast of Hässleholm on two new
lines in the project of Pågatågen Nordost. These new station cities will perhaps have a more
stable population level. However, some of them are already in a downward spiral of
population, with a stagnated levels and low numbers of commuters. Therefore will the effect
of new investments of station not be more than marginal, probably due to two reasons. Firstly;
the factor of distance that is over the limit of commuting time and secondly because of that
one needs change train in Hässleholm in order to reach the regional centres. In other words,
the investments of accessibility will not support the flexibility of mobility in the third group.
This is why these areas only will have a marginal effect on the expansion of the region.
42 | P a g e
From the previous paragraph, one could find the important factor of time, which is connected
to mobility and accessibility. Mobility and accessibility is the most crucial factors of positive
population levels and expansion in a region. The first two groups are already fully integrated
in a regional network of expansion according to their good infrastructural condition in the
spatial room. Furthermore one could therefore discuss these two groups in a concept of
regional polycentric development. The third group is perhaps the most important group of
having a positive development; many of these municipalities are already in a downward spiral
of negative trends. Many of those that decide to move out cities for better housing
possibilities, demands a high mobility or freedom of mobility and consequently a regional
expansion, because of reason that they still have a working career in the regional centres. The
cities and municipalities that are in group three simply do not have the attractiveness,
accessibility or freedom of mobility that areas closer to regional centres have. I would argue
that the network of cities in Skåne does not reach all parts, and some parts are therefore
excluded from the regional expansion and the goal of stable development in the region as
whole is not reached. This development of mono-centric development from two regional
centres will probably lead to even more increased regional differences, even if there are
investments of new regional railway stations. One of the effects will be continued negative
trends of population levels. It will furthermore lead to a continue use of cars. Because of the
reason that the alternative mode of transportation does not satisfy the individual need of
mobility.
.
43 | P a g e
8. Conclusion During the last 30 years in region of Skåne there has been a development of regional rail
bound traffic that started at the regional centers in and around Malmö and Helsingborg. From
these areas an expansion of the region has been taking place, especially along three important
transport corridors, Ystadbanan, Södra Stambanan and Västkustbanan. This development
have been positive for the region if one discuss in terms of economic growth, labor market,
population levels, accessibility and freedom of mobility. However, this development have not
been as extensive as expected, because of the reason that not all parts of the region is affected
more than on a marginal level. The areas that are within the given maximum time of 50
minutes from either Malmö or Helsingborg single way without a change of mode of
transportation will have a continued positive development, when it comes to the commuters,
travellers and population levels, in the upcoming years. The cities and municipalities that are
located outside of this critical time limit are in a need for another solution than a mono–
centric regional expansion in order to create an equal growth in the region of Skåne. Perhaps a
regional expansion that crosses over to other regions in the north.
All of the areas in the case of Skåne from above stated examples could be separated into three
different groups that are all depending on accessibility and mobility. Group number one is
municipalities that are located closest and already fully integrated with the regional centers.
These areas are only depending on regional railways more at a marginal level. Group number
two is located within the time limit of 50 minutes maximum from a regional center. These
station cities and municipalities have a positive development of population and commuting
levels and are depending on development of regional railway system. The third group is not
affected by the regional expansion; they are simply located to far from regional centers and
outside of important transport corridors.
Finally I conclude that investments of regional rail bound traffic do not have more than a
marginal effect over a large area like Skåne. If the network of regional centers and cities is not
equal distributed over an area, with a well-designed regional infrastructure some will be
marginalized and the economic growth will be tied to specific areas. Therefore one could
argue that regional expansion is not the solution for unpopulated areas, but perhaps, as we
have seen is this thesis, investment of the right kind in the right area, in the right time, could
direct us in a certain direction; an environmental friendly rail bound direction. In other words,
a train station does no help everything everywhere, but some things somewhere.

44 | P a g e
4 Further research This thesis has shown an overall perspective of the regional development of regional rail
bound traffic, when it comes to perspective involving population levels, commuters and
travellers, both historical, at the moment and in the future development. I would argue that
this have been given us information about how the development of rail bound traffic have
developed on a regional level in a top –down approach has been taking place. An interesting
continuing of this research would have been to go down to a more local level in order to have
achieved a deeper understanding for a specific line or railway. My investigation has shown
some general patterns that could be implemented on the case of Skåne and perhaps other
regions in the same size. However, even Skåne could be considered to be quite unequal when
it comes to spatial and demographic condition. There are probably more aspects that need to
be putt in order to have exact theory and solution for every line.
45 | P a g e
Bibliography Armstrong, R. J., & Rodríguez, D. A. (2006). An Evaluation of the Accessibility Benefits of Commuter
Rail in Eastern Massachusetts using Spatial Hedonic Price Functions. Transportation , 21-43.
1 Skanetrafiken. (n.d.). Malmö -Ystad -Simrishamn. Retrieved August 3, 2011, from Skanetrafiken:
http://www.skanetrafiken.se/P4W/Tag/101212_110814/Tag_6_101212_110814.pdf
2 Skånetrafiken. (n.d.). Reseplaneraren. Retrieved May 13, 2011, from Skånetrafiken:
http://www.reseplaneraren.skanetrafiken.se/lineResults.aspx?key=18734114548027103794
100403900010020&id=91069
3 Skånetrafiken. (n.d.). Reseplaneraren. Retrieved May 13, 2011, from Skånetrafiken:
http://www.reseplaneraren.skanetrafiken.se/lineResults.aspx?key=18734114548027103752
700339600230031&id=85131
4 Skånetrafiken. (2010, December 10). Helsingborg -Teckomatorp -Malmö. Retrieved May 13, 2011,
from Skånetrafiken:
http://www.skanetrafiken.se/P4W/Tag/101212_110814/Tag_3_101212_110814.pdf
4 Skånetrafiken. (n.d.). Skånetrafiekn. Retrieved August 7, 2010, from Karlskrona - Kristianstad -
Hässleholm -Höör -Malmö:
http://www.skanetrafiken.se/P4W/Tag/101212_110814/Tag_4B_101212_110814.pdf
Banverket. (2007). Järnvägens bidrag till samhällsutvecklingen – inriktningsunderlag 2010–2019.
Borlänge: Banverket.
Banverket. (2007). Järnvägens roll i transportförsörjningen 2 -Regional persontrafik i Skåne-Blekinge.
Möjliga strategier på längre sikt. Underlag till inriktningsplanering . Borlänge: Banverket.
Bergman, C. (2009). Regionförstoring - en jämförelse mellan Västra Götaland och Skåne. Göteborg,:
Västra Götalands regionen.
Berry, B., Parr, J. B., Epstein, J. B., Ghosh, A., & Smith, R. H. (1988 ). Market centers and retail
location; theory and applications . London: Prentice-Hall International.
Bösch, S. (2008). The Tragedy of Ordinarity Culture Constraints on Sustainable Development based on
public transportation. Karlstad: Karlstad University.
Boverket. (2004). Strategier för regional utveckling –kapplöpning mellan regioner. Karlskrona:
Boverket.
Boverket. (2005). Är regionförstoring hållbar? Karlskrona: Boverket.
Bryman, A. (2004). Samhällsvetenskapliga metoder. Malmö: Liber AB.
Campbell, S., & Fainstein, S. S. (1996). Readings in planning theory. Cambridge: Blackwell.
Eliasson, K., Lindgren, U., & Westerlund, O. (2003). Geographical Labor Mobility: Migration or
Commuting? Regional Studies Vol 37 8, 827 -837.
46 | P a g e
Engström, M. G. (2005). Planering för transporter. In G. Forsberg, Planeringens utmaningar och
tillämpningar (pp. 424-432). Uppsala: Konsultförlaget/Uppsala Publishing House.
Environmental Systems Research Institute. (1993). Understanding GIS: the ARC/INFO
method/Enviromental Systems Research. Harlow: Harlow: Longman scientific & technical.
Forsberg, G. (2005). Planering i nedärvda strukturer och gränslösa nätverk. In G. Forsberg,
Planeringens utmaningar och tillämpningar (pp. 236-254). Uppsala: Konsultförlaget/Uppsala
publishing house.
Frändberg, L., Thulin, E., & Vilhelmson, B. (2005). Rörlighetens omvandling : om resor och virtuell
kommunikation - mönster, drivkrafter, gränser. Lund: Studentlittratur.
Friberg, T. (2006). Towards a gender conscious counter-discourse in comprehensice physical
planning. GeoJournal, pp. Vol 65; No4; pp 275-285.
Fridh, P. (1996). Riktlinjer för val mellan buss och tåg för regional tågtrafik. Lund: University of Lund,
Lund Institute of technology, department of traffic planning and engineering.
Gren, J. (2002). Den perfekta regionen?: en nyregionalism i Europa och samspelet mellan staten,
regionen och den europeiska intergrationen. Lund: Studentlitteratur.
Guelke, L. (1985). On the Role of Evidence in Physical and Human Geography. Geoforum, Vol. 16 No.
2, 131-137.
Hanson, S., & Giuliano, G. (2004). The geography of urban transportation. New York: The Guilford
press cop.
Haraway, D. (1987). Situated Knowledges: The Science Question in Feminism and the Privilege of
Partial. Feminist Studies, Vol. 14, No. 3, 575-599.
Harding, S. (1997). Comment on Hekman's "Truth and Method: Feminist Standpoint Theory
Revisited": Whose Standpoint Needs the Regimes of Truth and Reality? Signs, Vol. 22, No. 2,
382-391.
Hermelin, B. (2005). Regional ekonomisk utveckling. In G. Forsberg, Planeringens utmaningar och
tillämpningar (pp. 266 -284). Uppsala: Konsultförlaget/Uppsala publishing house.
Johansson, M. (2006). Urbanisering, storstäder och tillväxt - En kunskapsöversikt kring sambandet
mellan städer och ekonomisk tillväxt. Östersund: Institutet för tillväxtpolitiska studier.
Jonsson, D. R. (2008). Analysing sustainbility in a land -use and transport system. Jorunal of transport
geography 16, 28-41.
Jonsson, L. (2007). Regionaltågssatsningars effekt på fastighetsvärden - en studie av västkustbanan i
Skåne. Lund: Lund Universitet.
Levin, K. (2008). Arbetspendlingens struktur i Skåne. Malmö: Region Skåne.
47 | P a g e
Lönegren, H. (2001). Var slutar Östergötland som funktionell region? En diskussion om begreppet
region i en föränderlig tid med exempel från Kinda kommun. Linköping: Centrum för
kommunstrategiska studier Linköpings Universitet.
Meijers, E. (2006). From central place to network model: Theory and evidence of a paradigm. The
Netherlands: OTB Research Institute for Housing, Urban and Mobility Studies; Delft, 245-259.
Microsoft Corperation. (2011). Excel 2010 features and benefits. Retrieved May 10, 2011, from
Microsoft Office: http://office.microsoft.com/en-us/excel/excel-2010-features-and-benefits-
HA101806958.aspx
Näringsdepartementet. (2008). Framtidens resor och transporter - infrastruktur för hållbar tillväxt.
Stockholm: Näringsdepartementet.
Nelldal, B.-L., & Troche, G. (2001). Tåg för tillväxt i Östra mellansverige. Stockholm: KTH.
Olaru, D., Smith, B., & John , T. H. (2010). Residential location and transit-oriented development in a
new rail corridor. Transportation Research Part A 45, 219-237.
Örebro Universitet. (2006). Bergslagsproblematik eller mälardalsdynamik? - Pendling och
flyttströmmar i Örebro län. Örebro: Örebro Universitet.
Pågatågatågen Nordost. (n.d.). Pågatågen för en bättre regional utveckling. Retrieved May 11, 2011,
from pågatågen nordost: http://www.pagatagnordost.se/
Pagliaraa, F., & Papab, E. (2010). Urban rail systems investments: an analysis of the impacts on
property values and residents’ location. Journal of Transport Geography 19, 200-211 .
Pike, A., Rodríguez-Pose, A., & Tomaney, J. (2006). Local and regional development. Oxon: Routledge.
Pinto, H., & Rodrigues, P. M. (2010). Knowledge Production in European Regions: The Impact of
Regional Strategies and Regionalization on Innovation. European planning studies 18, 10,
1731 — 1748.
Polasek, W., Schwarzbauer, W., & Sellner, R. (2010). Aggregate and regional economic effects of new
railway infrastructure. Review of Economic Analysis 2, 73–85.
Prideaux, B. (2009). Resort Destinations -evolution mangement and developments. In Transport -A
key element in destination development and operations, mobility, a neglected element of
tourist experience (pp. 79-113). Oxford : Butterworth -Heniemann.
Region Skåne. (2010, Marsch 03). Skånes utveckling. Retrieved April 4, 2010, from Region Skåne:
http://www.skane.se/templates/Page.aspx?id=5861
Region Skåne. (2011, March 09). Infrastruktur. Retrieved July 21, 2011, from Skåne:
www.skane.se/sv/Skanes-utveckling/Infrastruktur
Region Skåne. (n.d.). Om Skåne. Retrieved May 08, 2011, from Region Skåne:
http://www.skane.se/templates/Page.aspx?id=269039
Rodrigue, J.-P. (2009). The Geography of Transport Systems. Abingdon ; New York: Routledge.
48 | P a g e
Rosengren, K., & Arvidsson, P. (2002). Sociologisk metodik. Malmö: Liber AB.
Sandow, E., & Westin, K. (2007). Regionförstoring i glesa områden -kollektivtrafikens möjligheter och
betydelse. Umeå: Vinnova.
SCB. ( 2011, Marsch 11). Om SCB. Retrieved 05 10, 2011, from Statistiska Centralbyrån:
http://www.scb.se/Pages/List____250620.aspx
SCB. (2010). Lokala Arbetsmarknader -egenskaper, utveckling och funktion. Örebro: Statistiska
Centralbyrån.
Scheiner, J. (2006). Housing mobility and travel behaviour: A process -oriented approach to spatial
mobility. Evidence from a new research Weld in Germany. Journal of transport geography 14,
287 -298.
SIKA. (2001). Infrastruktur och regional utveckling. Stockholm: SIKA.
Sivilevicius, H., Maskeliunaite, L., & Podvezko, V. (2009). Research on the quality of passenger
transportation by railway. Transport , 100-112.
Skåne karta tåg och buss. (n.d.). Retrieved July 23, 2011, from Skånetrafiken:
http://www.skanetrafiken.se/upload/Dokumentbank/Tidtabeller/2011from12dec10/skanek
artatagobuss.pdf
Skånetrafiken. (2010, December 10). Linjekarta Skånetrafiken. Retrieved May 13, 2011, from
Skånetrafiken:
http://www.skanetrafiken.se/upload/Dokumentbank/Tidtabeller/2011from12dec10/skanek
artatagobuss.pdf
Statiska centralbyrån. (2011, May 16). Statiska centralbyrån. Retrieved August 10, 2011, from
startsida: http://www.scb.se/
Statiska Centralbyrån. (n.d.). Lokala Arbetsmarknader -egenskaper, utveckling och funktion.
Stough, R. (2010). Leadership and Creativity in Regional Economic Development. European Planning
studies 18, 613 -627.
Svenska Kommunförbundet, Arena för tillväxt. (2003). På spåret -en studie om pendling och
regionförstoring. Stockholm: Svenska kommunförbundet.
Tellerup, F., & Tellerup, M. (n.d.). Eslöv-Teckomatorp-Ramlösa (-Helsingborg) Rååbanan. Retrieved
May 13, 2011, from Järnväg.net -din guide till Sveriges tåg och järnvägar:
http://www.jarnvag.net/index.php/banguide/banor-gotaland/eslov-helsingborg
Tellerup, F., & Tellerrup, M. (n.d.). Malmö-Nässjö-Mjölby-Norrköping-Katrineholm Södra Stambanan.
Retrieved May 2, 2011, from Järnväg.net -din guide till Sveriges tåg och järnvägar:
http://www.jarnvag.net/index.php/banguide/banor-gotaland/malmo-katrineholm
49 | P a g e
Tellerup, F., & Tellerup, M. (n.d.). Hässleholm-Åstorp-Ramlösa / Kattarp (-Helsingborg) Skånebanan .
Retrieved May 13, 2011, from Järnväg.net -din guide till Sveriges tåg och järnvägar:
http://www.jarnvag.net/index.php/banguide/banor-gotaland/hassleholm-helsingborg
Tellerup, F., & Tellerup, M. (n.d.). Kristianstad-Karlskrona Blekinge kustbana . Retrieved April 14,
2010, from Järnväg: http://www.jarnvag.net/index.php/banguide/banor-
gotaland/kristianstad-karlskrona
Tellerup, F., & Tellerup, M. (n.d.). Lund-Helsingborg-Halmstad-Göteborg Västkustbanan. Retrieved
May 02, 2010, from Järnväg.net -din guide till Sveriges tåg och järnvägar:
http://www.jarnvag.net/index.php/banguide/banor-gotaland/lund-goteborg
Tillväxtanalys. (2010). Regional tillväxt 2010 - En rapport om tillstånd och utveckling i och inom
Sveriges FA-regioner. Östersund: Tillväxtanalys.
Ward, S. V. (2002). Planning the twentieth -century city: the advanced capitalist world. Chichester:
Wiley.
Wärmark, A. (2004). Infrastruktur för tillväxt: analys av infrastrukturinvesteringars betydelse för
tillväxt, regional utveckling och regionförstoring. Stockholm: Statens institut för
kommunikationsanalys.
Wärneryd, O., Hallin, P.-O., & Hultman, J. (2002). Hållbar utveckling : om kris och omställning i stad
och samhälle. Lund : Studentlitteratur.
Ystadbanan. (n.d.). Retrieved May 12, 2011, from Järnväg: - How have the development of regional
train in Skåne affected the flow of travellers relating to rail bound traffic?
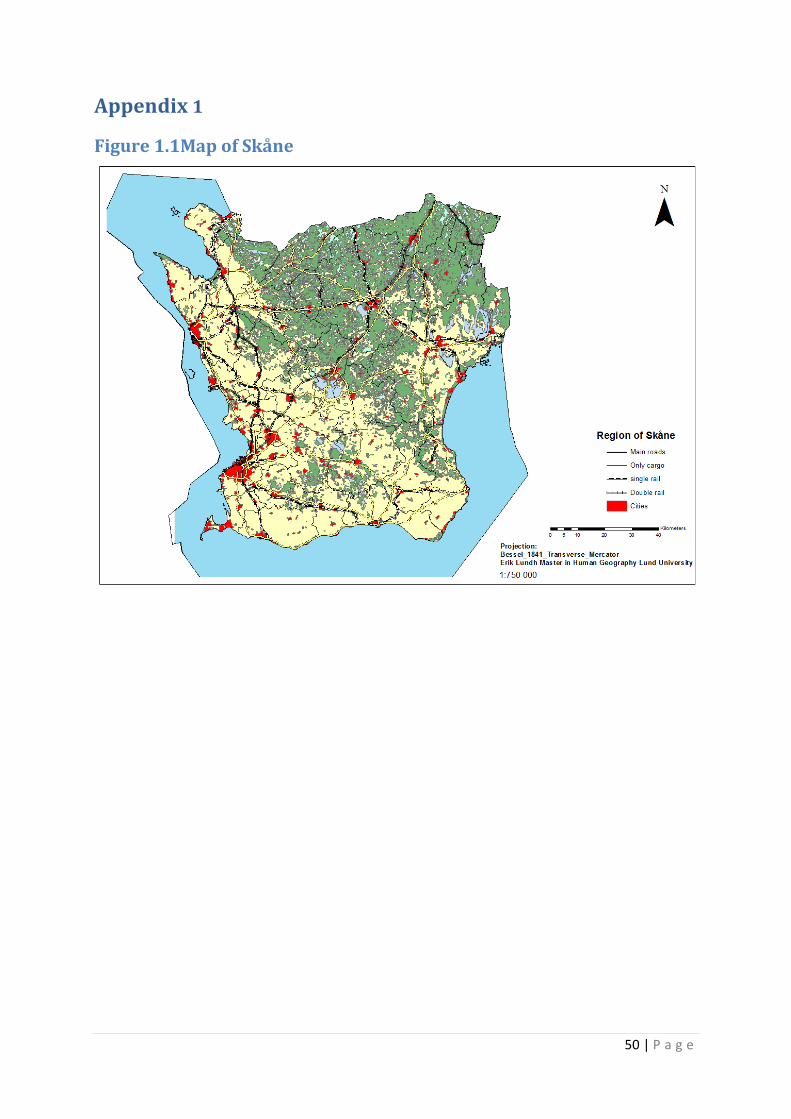
50 | P a g e
Appendix 1
Figure 1.1Map of Skåne
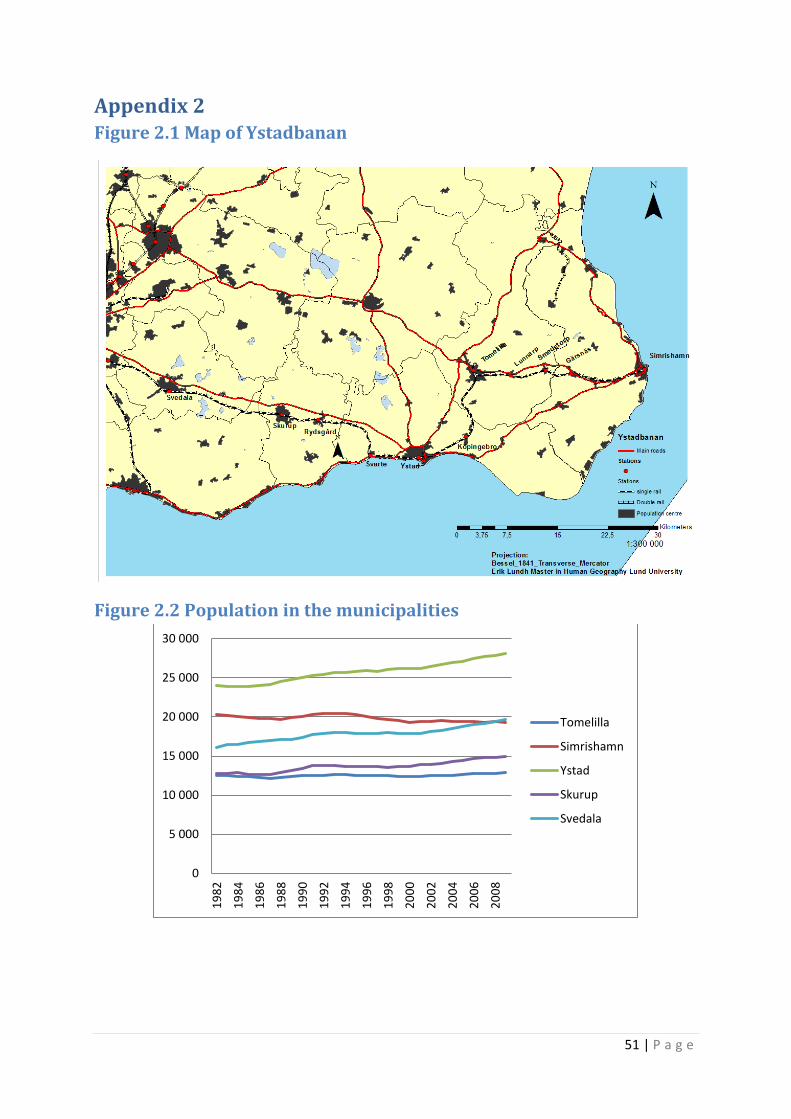
51 | P a g e
Appendix 2 Figure 2.1 Map of Ystadbanan
Figure 2.2 Population in the municipalities
0
5 000
10 000
15 000
20 000
25 000
30 000
19
82
19
84
19
86
19
88
19
90
19
92
19
94
19
96
19
98
20
00
20
02
20
04
20
06
20
08
Tomelilla
Simrishamn
Ystad
Skurup
Svedala
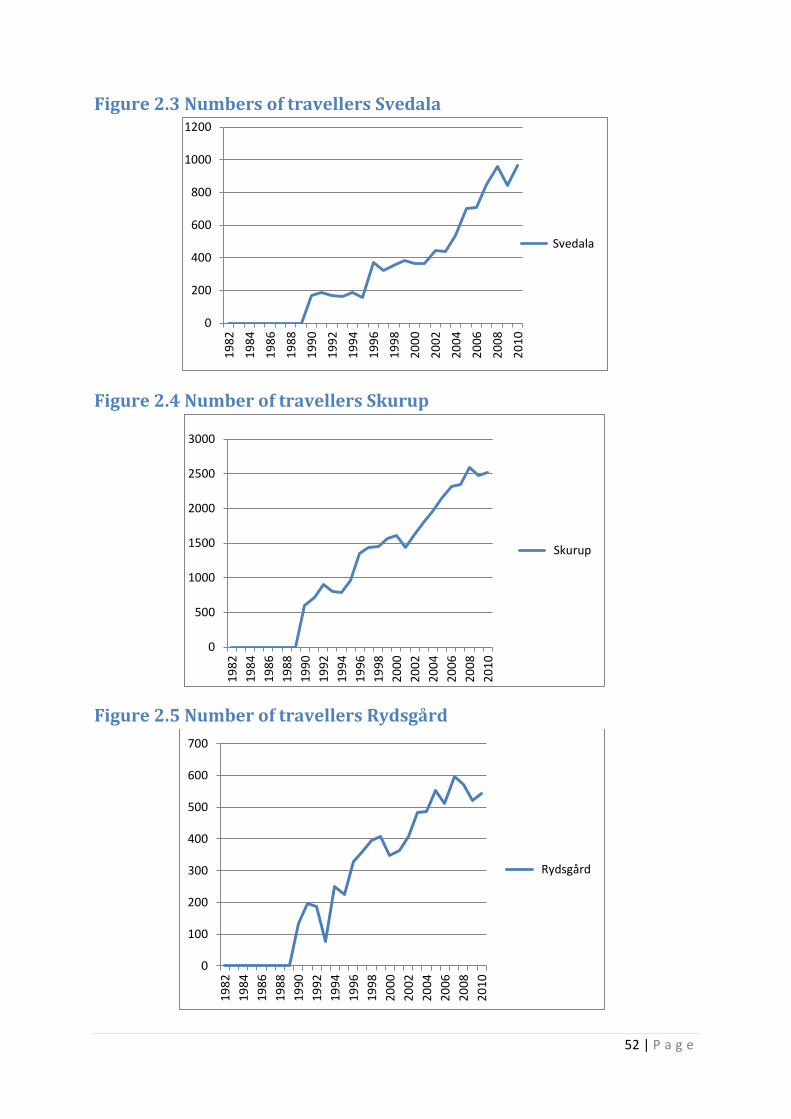
52 | P a g e
Figure 2.3 Numbers of travellers Svedala
Figure 2.4 Number of travellers Skurup
Figure 2.5 Number of travellers Rydsgård
0
200
400
600
800
1000
1200
19
82
19
84
19
86
19
88
19
90
19
92
19
94
19
96
19
98
20
00
20
02
20
04
20
06
20
08
20
10
Svedala
0
500
1000
1500
2000
2500
3000
19
82
19
84
19
86
19
88
19
90
19
92
19
94
19
96
19
98
20
00
20
02
20
04
20
06
20
08
20
10
Skurup
0
100
200
300
400
500
600
700
19
82
19
84
19
86
19
88
19
90
19
92
19
94
19
96
19
98
20
00
20
02
20
04
20
06
20
08
20
10
Rydsgård
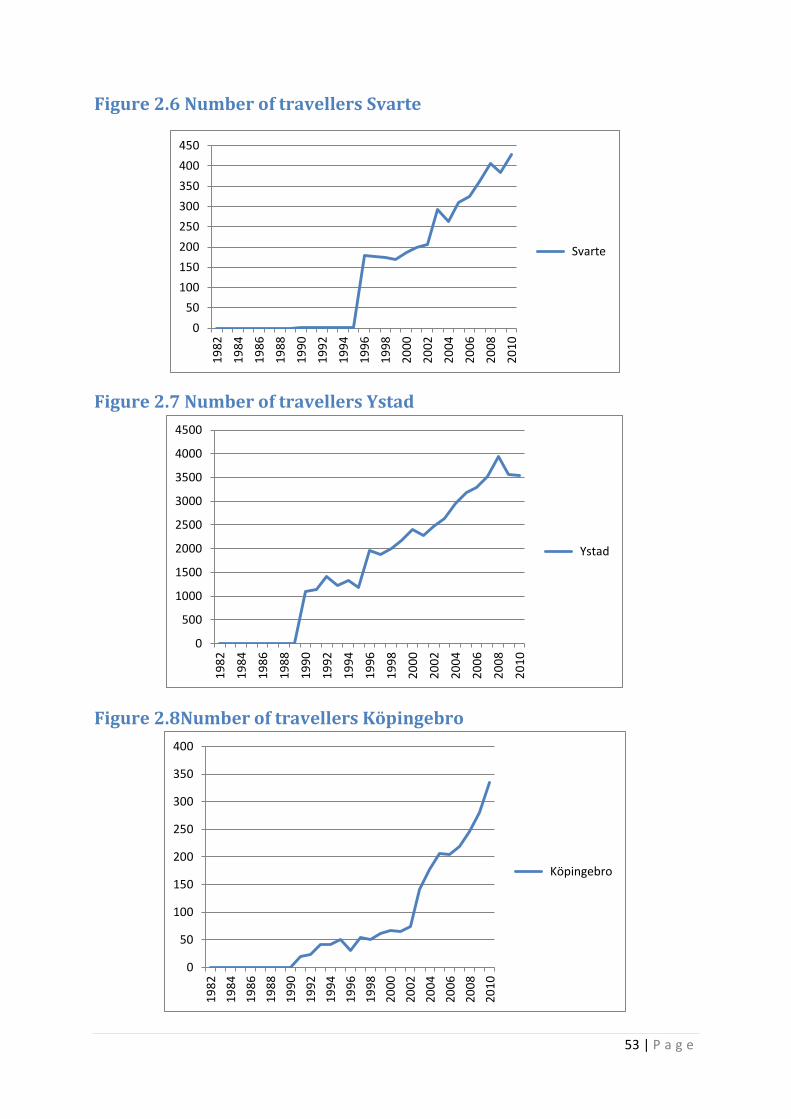
53 | P a g e
Figure 2.6 Number of travellers Svarte
Figure 2.7 Number of travellers Ystad
Figure 2.8Number of travellers Köpingebro
0
50
100
150
200
250
300
350
400
450
19
82
19
84
19
86
19
88
19
90
19
92
19
94
19
96
19
98
20
00
20
02
20
04
20
06
20
08
20
10
Svarte
0
500
1000
1500
2000
2500
3000
3500
4000
4500
19
82
19
84
19
86
19
88
19
90
19
92
19
94
19
96
19
98
20
00
20
02
20
04
20
06
20
08
20
10
Ystad
0
50
100
150
200
250
300
350
400
19
82
19
84
19
86
19
88
19
90
19
92
19
94
19
96
19
98
20
00
20
02
20
04
20
06
20
08
20
10
Köpingebro
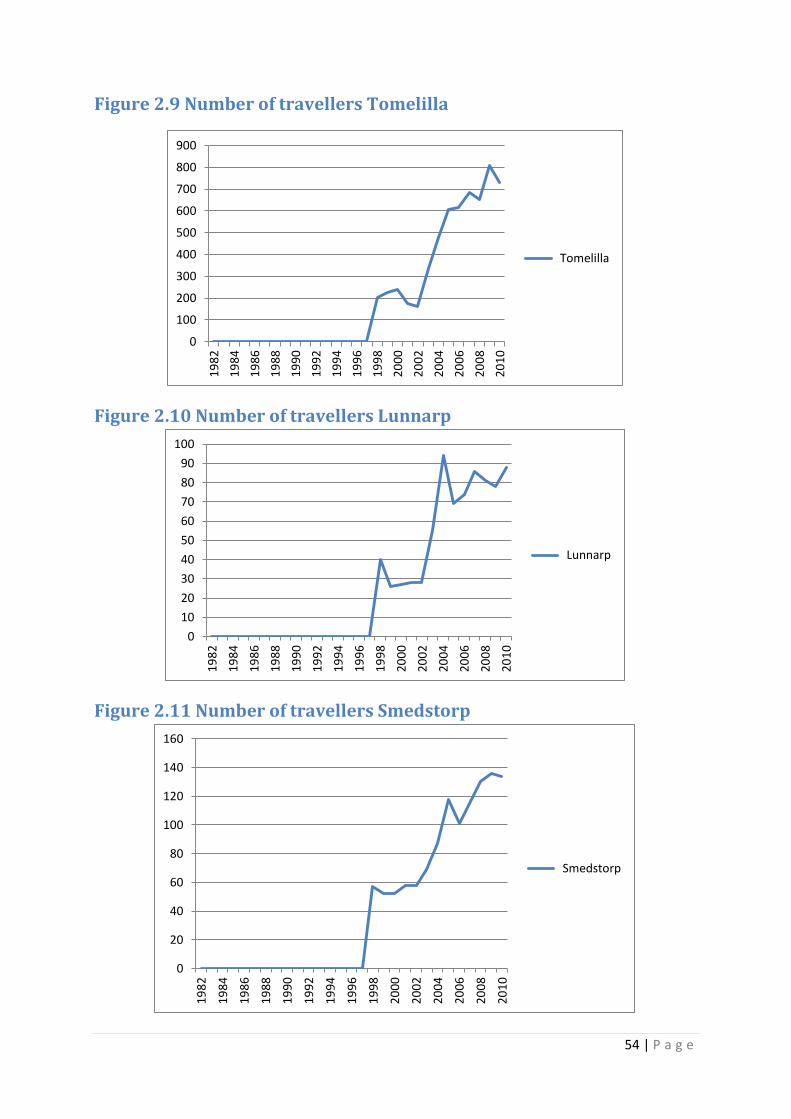
54 | P a g e
Figure 2.9 Number of travellers Tomelilla
Figure 2.10 Number of travellers Lunnarp
Figure 2.11 Number of travellers Smedstorp
0
100
200
300
400
500
600
700
800
900
19
82
19
84
19
86
19
88
19
90
19
92
19
94
19
96
19
98
20
00
20
02
20
04
20
06
20
08
20
10
Tomelilla
0
10
20
30
40
50
60
70
80
90
100
19
82
19
84
19
86
19
88
19
90
19
92
19
94
19
96
19
98
20
00
20
02
20
04
20
06
20
08
20
10
Lunnarp
0
20
40
60
80
100
120
140
160
19
82
19
84
19
86
19
88
19
90
19
92
19
94
19
96
19
98
20
00
20
02
20
04
20
06
20
08
20
10
Smedstorp
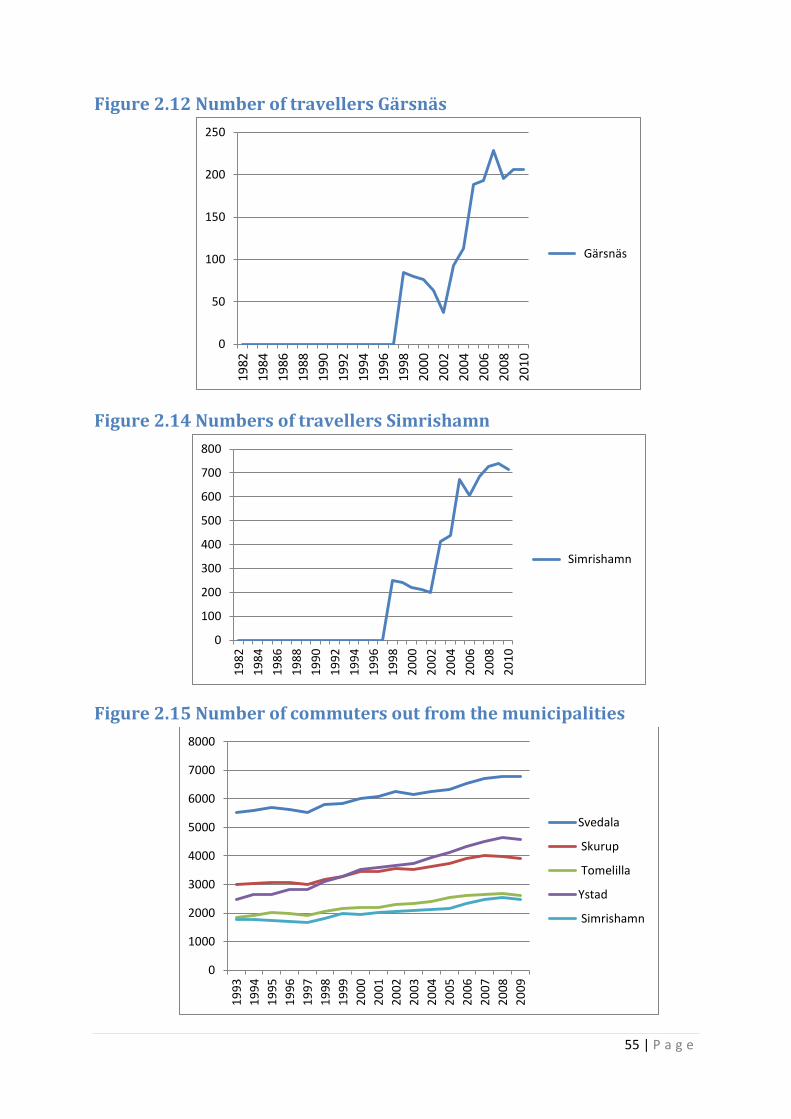
55 | P a g e
Figure 2.12 Number of travellers Gärsnäs
Figure 2.14 Numbers of travellers Simrishamn
Figure 2.15 Number of commuters out from the municipalities
0
50
100
150
200
250
19
82
19
84
19
86
19
88
19
90
19
92
19
94
19
96
19
98
20
00
2002
2004
2006
20
08
20
10
Gärsnäs
0
100
200
300
400
500
600
700
800
19
82
19
84
19
86
19
88
19
90
19
92
19
94
19
96
19
98
20
00
20
02
20
04
20
06
20
08
20
10
Simrishamn
0
1000
2000
3000
4000
5000
6000
7000
8000
19
93
19
94
19
95
19
96
19
97
19
98
19
99
20
00
20
01
20
02
20
03
20
04
20
05
20
06
20
07
20
08
20
09
Svedala
Skurup
Tomelilla
Ystad
Simrishamn
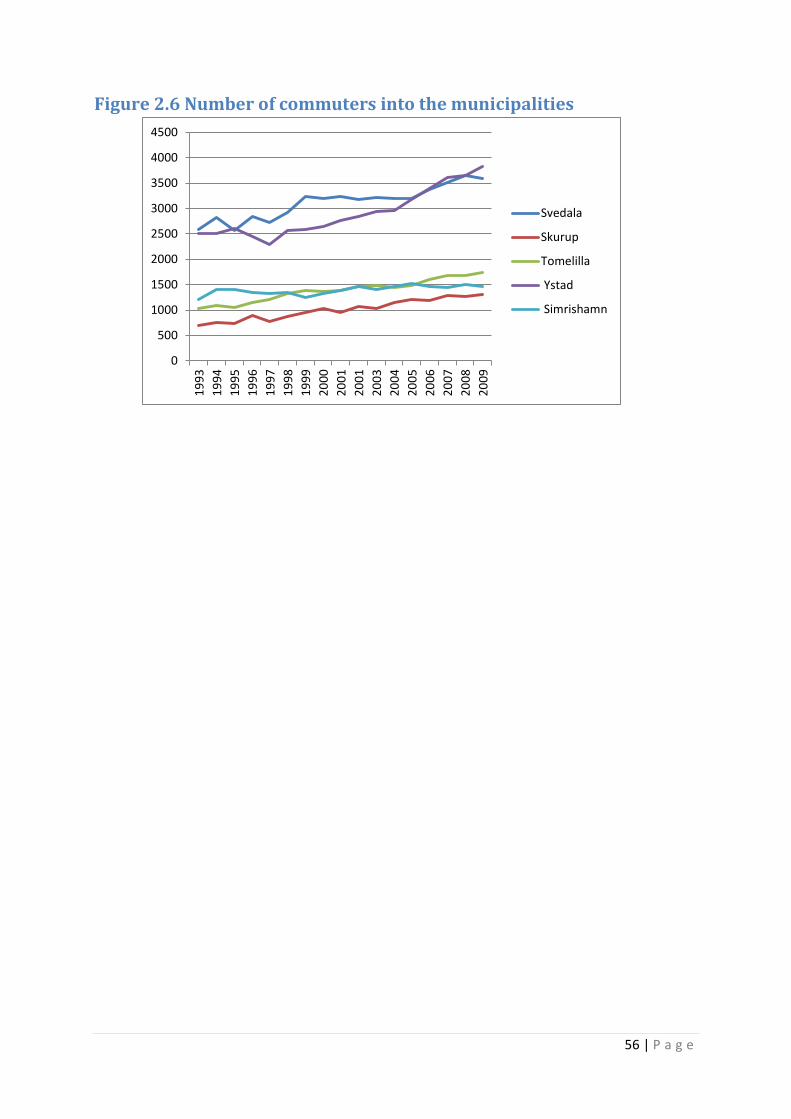
56 | P a g e
Figure 2.6 Number of commuters into the municipalities
0
500
1000
1500
2000
2500
3000
3500
4000
4500
19
93
19
94
19
95
19
96
19
97
19
98
19
99
20
00
20
01
20
01
20
03
20
04
20
05
20
06
20
07
20
08
20
09
Svedala
Skurup
Tomelilla
Ystad
Simrishamn
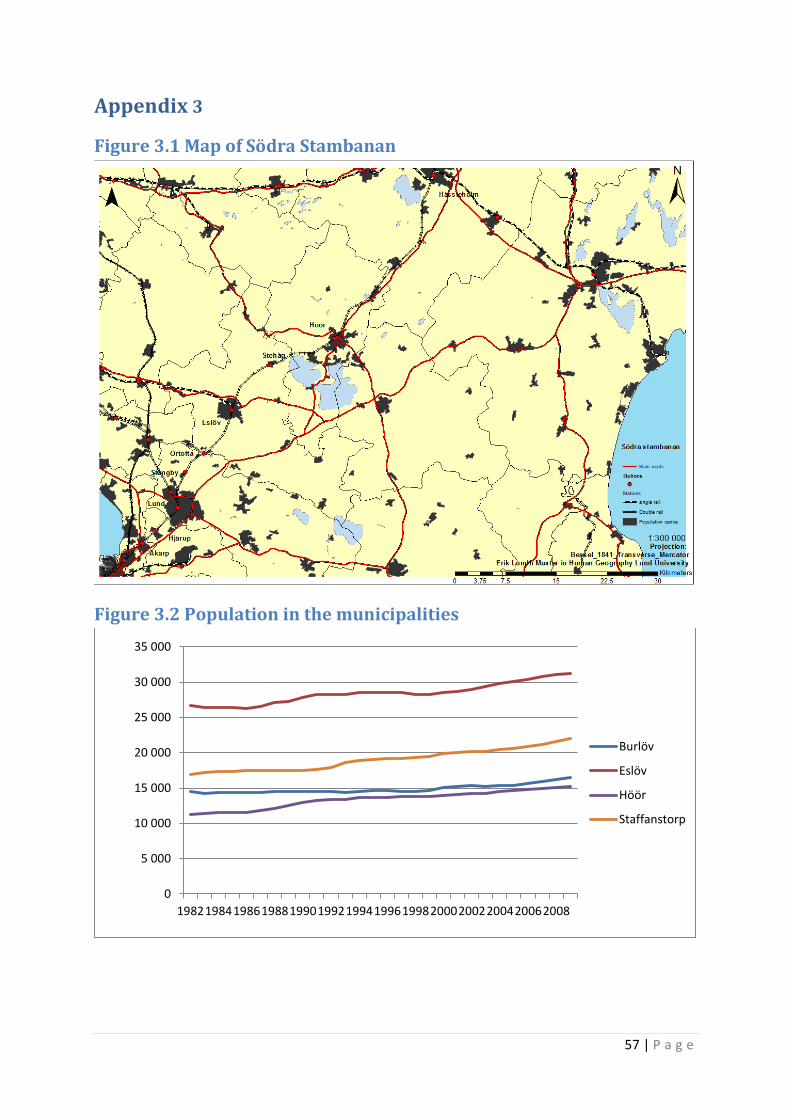
57 | P a g e
Appendix 3
Figure 3.1 Map of Södra Stambanan
Figure 3.2 Population in the municipalities
0
5 000
10 000
15 000
20 000
25 000
30 000
35 000
19821984198619881990199219941996199820002002200420062008
Burlöv
Eslöv
Höör
Staffanstorp
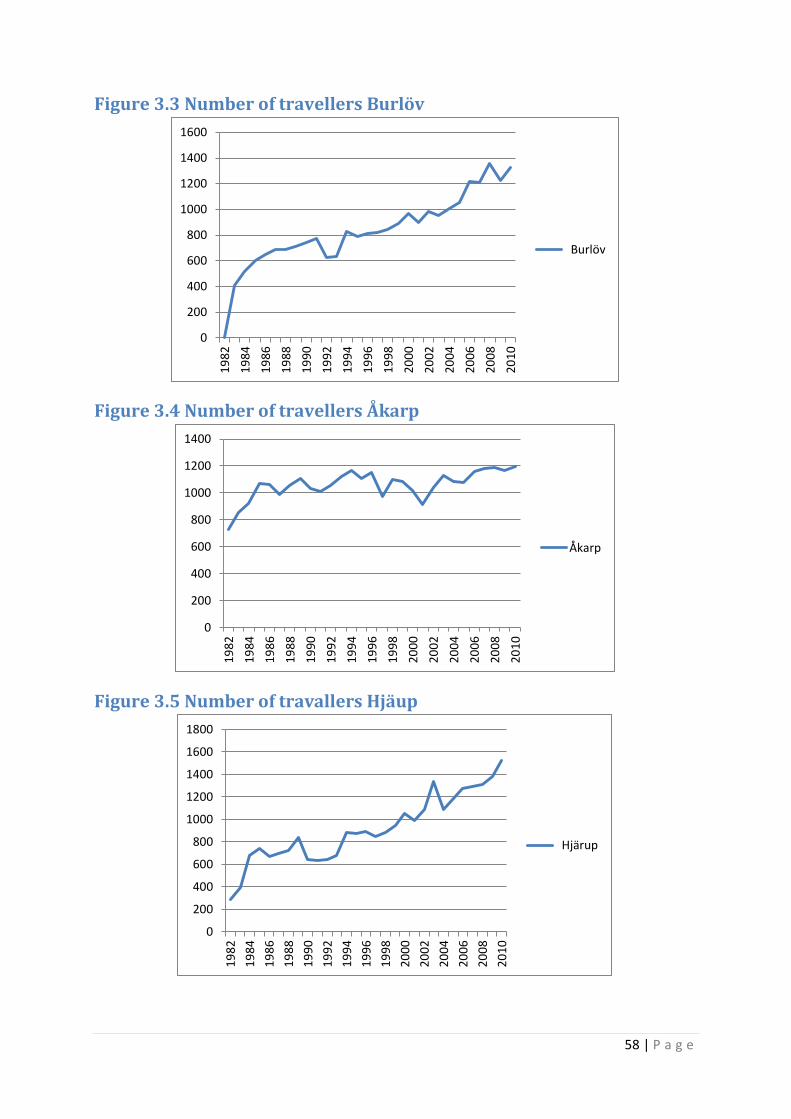
58 | P a g e
Figure 3.3 Number of travellers Burlöv
Figure 3.4 Number of travellers Åkarp
Figure 3.5 Number of travallers Hjäup
0
200
400
600
800
1000
1200
1400
1600
19
82
19
84
19
86
19
88
19
90
19
92
19
94
19
96
19
98
20
00
20
02
20
04
20
06
20
08
20
10
Burlöv
0
200
400
600
800
1000
1200
1400
19
82
19
84
19
86
19
88
19
90
19
92
19
94
19
96
19
98
20
00
20
02
20
04
20
06
20
08
20
10
Åkarp
0
200
400
600
800
1000
1200
1400
1600
1800
19
82
19
84
19
86
19
88
19
90
19
92
19
94
19
96
19
98
20
00
20
02
20
04
20
06
20
08
20
10
Hjärup
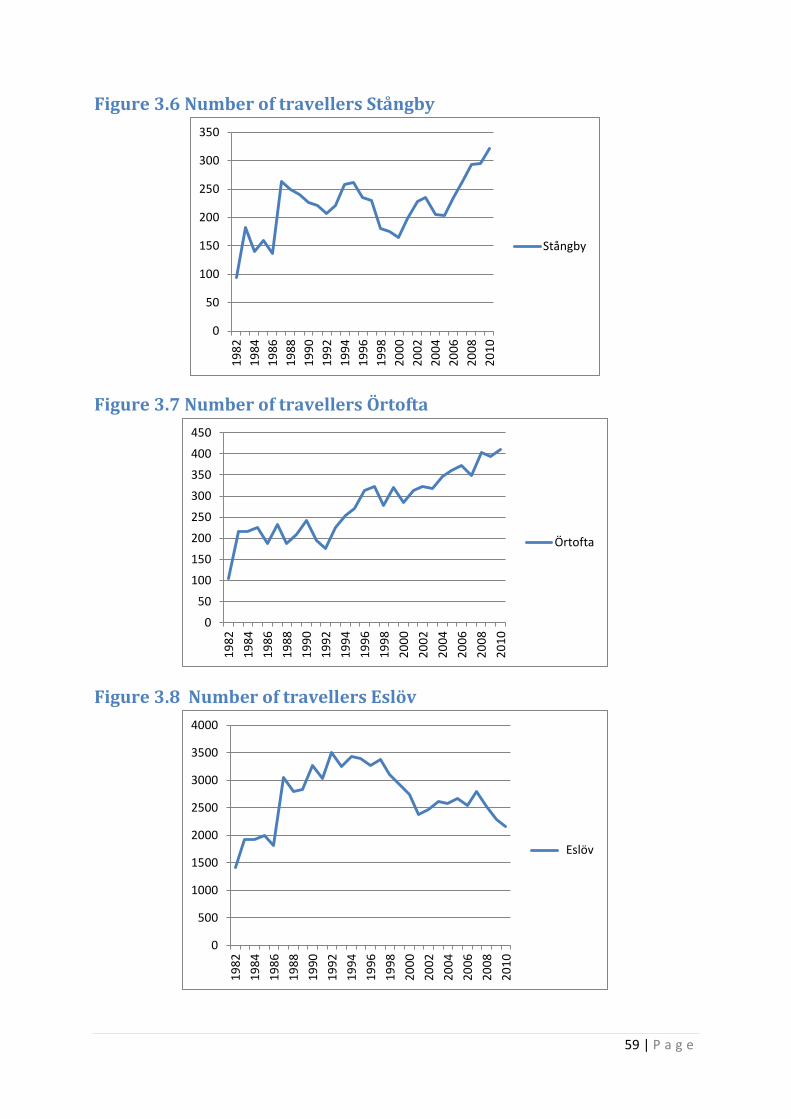
59 | P a g e
Figure 3.6 Number of travellers Stångby
Figure 3.7 Number of travellers Örtofta
Figure 3.8 Number of travellers Eslöv
0
50
100
150
200
250
300
350
19
82
19
84
19
86
19
88
19
90
19
92
19
94
19
96
19
98
20
00
20
02
20
04
20
06
20
08
20
10
Stångby
0
50
100
150
200
250
300
350
400
450
19
82
19
84
19
86
19
88
19
90
19
92
19
94
19
96
19
98
20
00
20
02
20
04
20
06
20
08
20
10
Örtofta
0
500
1000
1500
2000
2500
3000
3500
4000
19
82
19
84
19
86
19
88
19
90
19
92
19
94
19
96
19
98
20
00
20
02
20
04
20
06
20
08
20
10
Eslöv
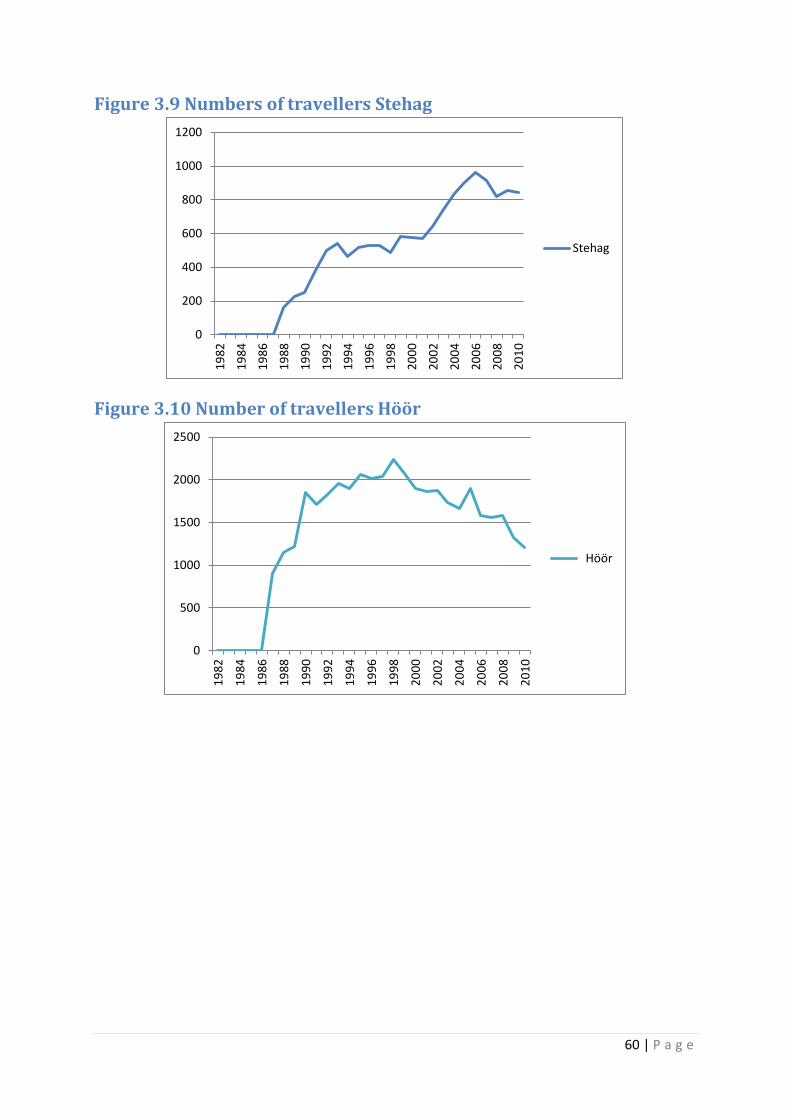
60 | P a g e
Figure 3.9 Numbers of travellers Stehag
Figure 3.10 Number of travellers Höör
0
200
400
600
800
1000
1200
19
82
19
84
19
86
19
88
19
90
19
92
19
94
19
96
19
98
20
00
20
02
20
04
20
06
20
08
20
10
Stehag
0
500
1000
1500
2000
2500
19
82
19
84
19
86
19
88
19
90
19
92
19
94
19
96
19
98
20
00
20
02
20
04
20
06
20
08
20
10
Höör
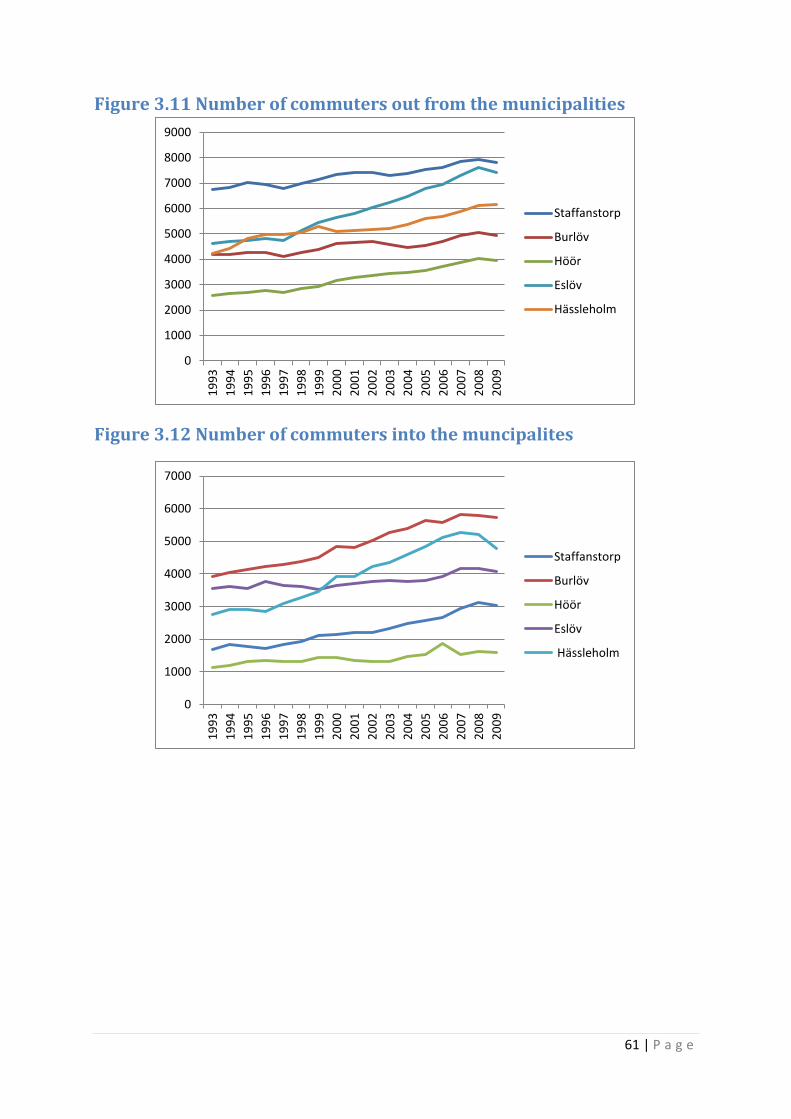
61 | P a g e
Figure 3.11 Number of commuters out from the municipalities
Figure 3.12 Number of commuters into the muncipalites
0
1000
2000
3000
4000
5000
6000
7000
8000
9000
19
93
19
94
19
95
19
96
19
97
19
98
19
99
20
00
20
01
20
02
20
03
20
04
20
05
20
06
20
07
20
08
20
09
Staffanstorp
Burlöv
Höör
Eslöv
Hässleholm
0
1000
2000
3000
4000
5000
6000
7000
19
93
19
94
19
95
19
96
19
97
19
98
19
99
20
00
20
01
20
02
20
03
20
04
20
05
20
06
20
07
20
08
20
09
Staffanstorp
Burlöv
Höör
Eslöv
Hässleholm
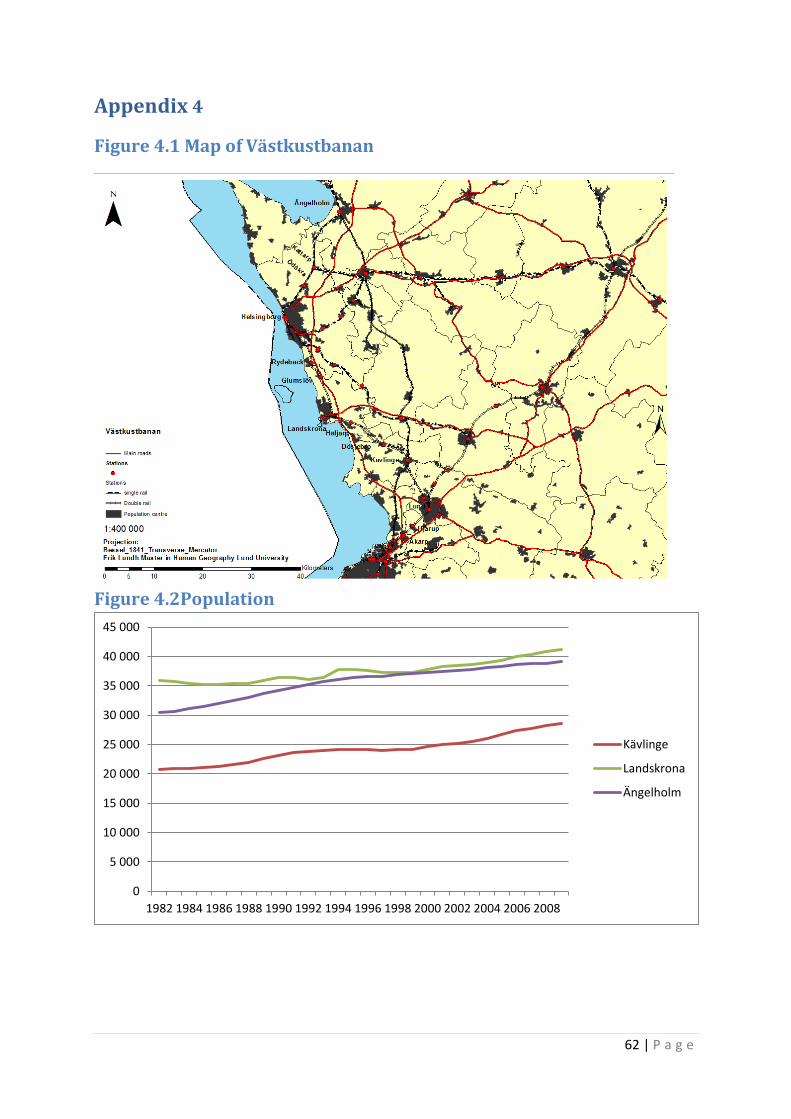
62 | P a g e
Appendix 4
Figure 4.1 Map of Västkustbanan
Figure 4.2Population
0
5 000
10 000
15 000
20 000
25 000
30 000
35 000
40 000
45 000
1982 1984 1986 1988 1990 1992 1994 1996 1998 2000 2002 2004 2006 2008
Kävlinge
Landskrona
Ängelholm
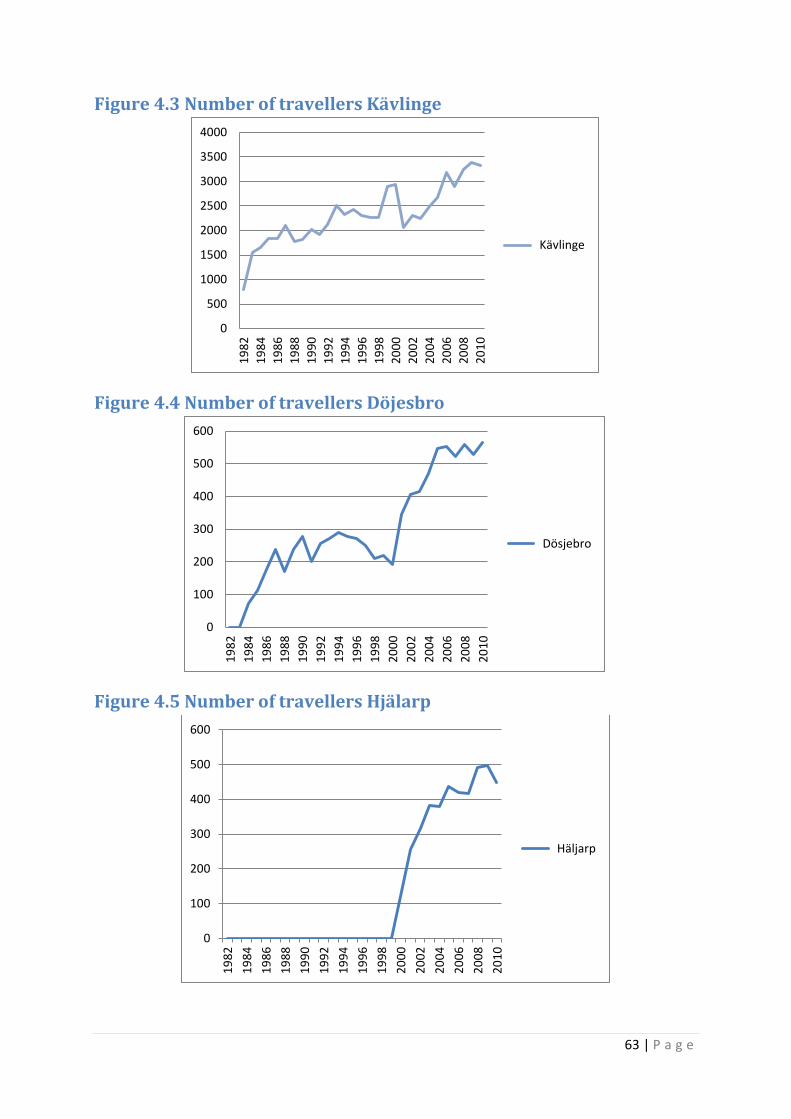
63 | P a g e
Figure 4.3 Number of travellers Kävlinge
Figure 4.4 Number of travellers Döjesbro
Figure 4.5 Number of travellers Hjälarp
0
500
1000
1500
2000
2500
3000
3500
4000
19
82
19
84
19
86
19
88
19
90
19
92
19
94
19
96
19
98
20
00
20
02
20
04
20
06
20
08
20
10
Kävlinge
0
100
200
300
400
500
600
19
82
19
84
19
86
19
88
19
90
19
92
19
94
19
96
19
98
20
00
20
02
20
04
20
06
20
08
20
10
Dösjebro
0
100
200
300
400
500
600
19
82
19
84
19
86
19
88
19
90
19
92
19
94
19
96
19
98
20
00
20
02
20
04
20
06
20
08
20
10
Häljarp
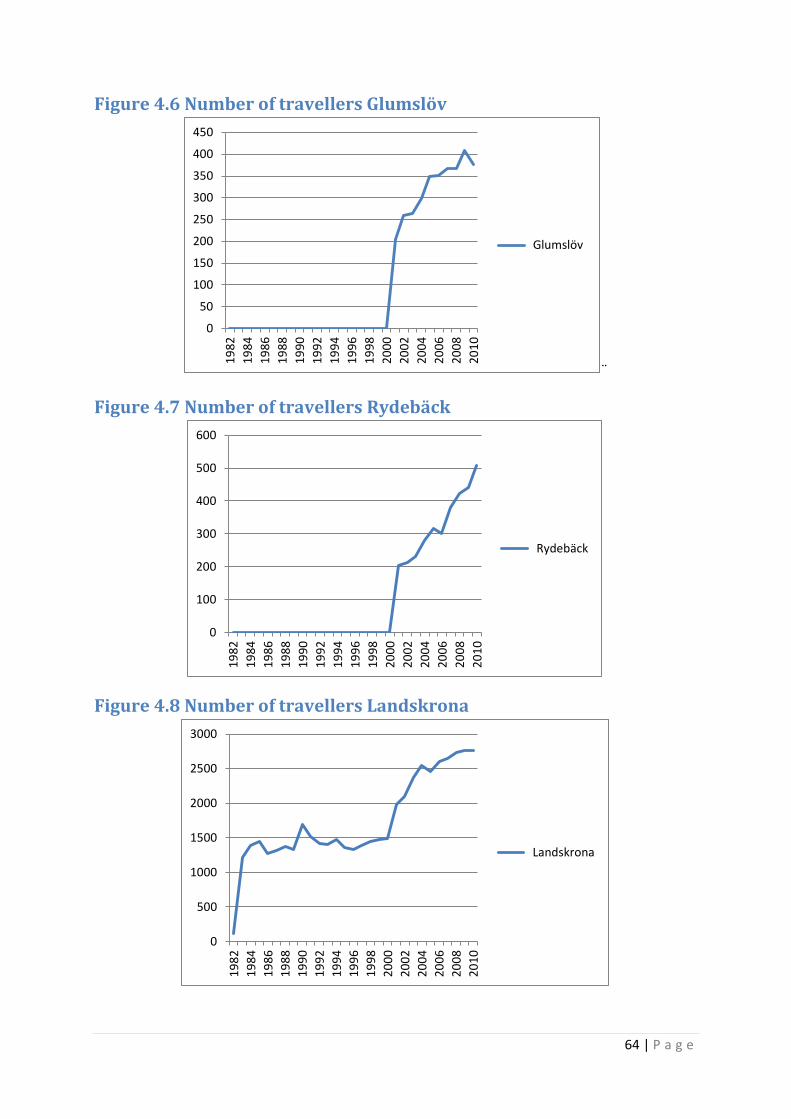
64 | P a g e
Figure 4.6 Number of travellers Glumslöv
¨
Figure 4.7 Number of travellers Rydebäck
Figure 4.8 Number of travellers Landskrona
0
50
100
150
200
250
300
350
400
450
19
82
19
84
19
86
19
88
19
90
19
92
19
94
19
96
19
98
20
00
20
02
20
04
20
06
20
08
20
10
Glumslöv
0
100
200
300
400
500
600
19
82
19
84
19
86
19
88
19
90
19
92
19
94
19
96
19
98
20
00
20
02
20
04
20
06
20
08
20
10
Rydebäck
0
500
1000
1500
2000
2500
3000
19
82
19
84
19
86
19
88
19
90
19
92
19
94
19
96
19
98
20
00
20
02
20
04
20
06
20
08
20
10
Landskrona
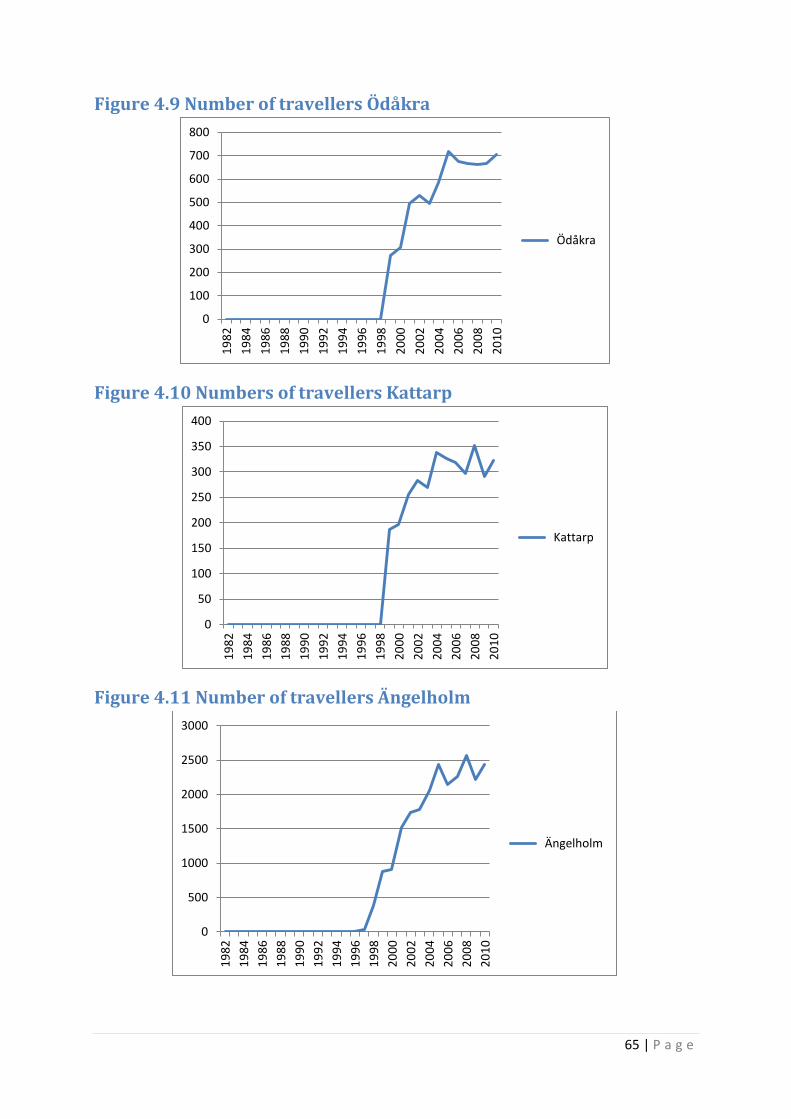
65 | P a g e
Figure 4.9 Number of travellers Ödåkra
Figure 4.10 Numbers of travellers Kattarp
Figure 4.11 Number of travellers Ängelholm
0
100
200
300
400
500
600
700
800
19
82
19
84
19
86
19
88
19
90
19
92
19
94
19
96
19
98
20
00
20
02
20
04
20
06
20
08
20
10
Ödåkra
0
50
100
150
200
250
300
350
400
19
82
19
84
19
86
19
88
19
90
19
92
19
94
19
96
19
98
20
00
20
02
20
04
20
06
20
08
20
10
Kattarp
0
500
1000
1500
2000
2500
3000
19
82
19
84
19
86
19
88
19
90
19
92
19
94
19
96
19
98
20
00
20
02
20
04
20
06
20
08
20
10
Ängelholm
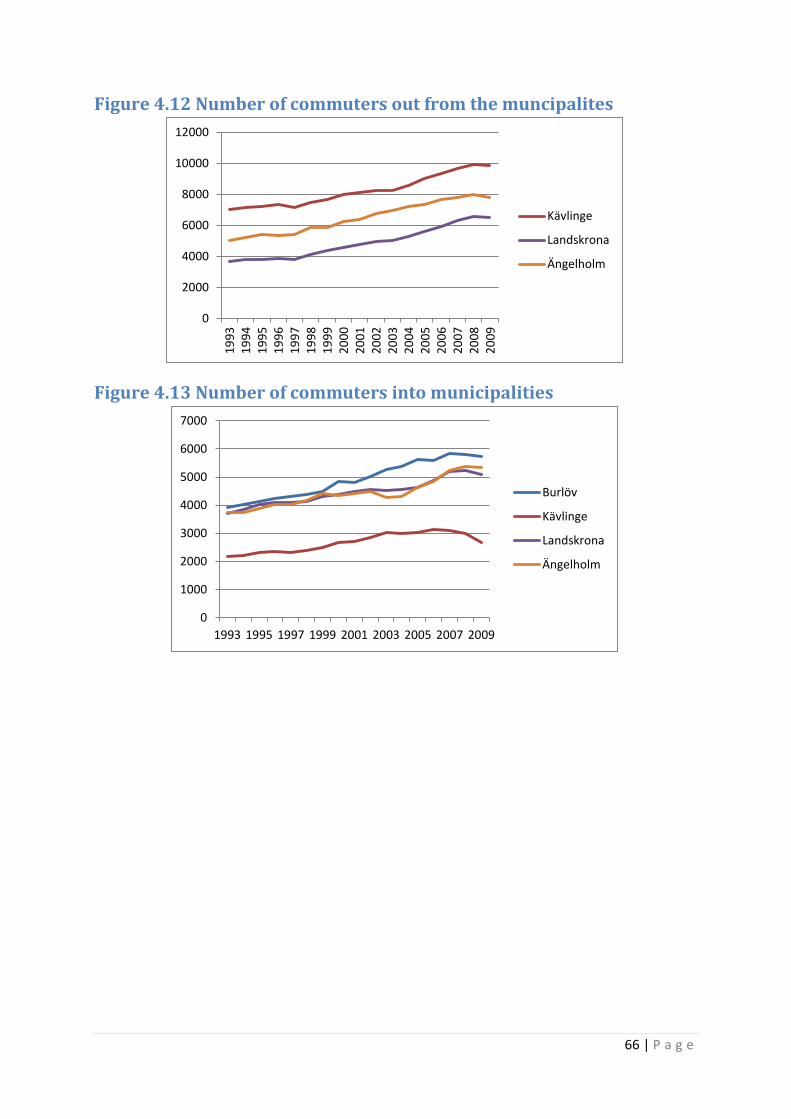
66 | P a g e
Figure 4.12 Number of commuters out from the muncipalites
Figure 4.13 Number of commuters into municipalities
0
2000
4000
6000
8000
10000
12000
19
93
19
94
19
95
19
96
19
97
19
98
19
99
20
00
20
01
20
02
20
03
20
04
20
05
20
06
20
07
20
08
20
09
Kävlinge
Landskrona
Ängelholm
0
1000
2000
3000
4000
5000
6000
7000
1993 1995 1997 1999 2001 2003 2005 2007 2009
Burlöv
Kävlinge
Landskrona
Ängelholm
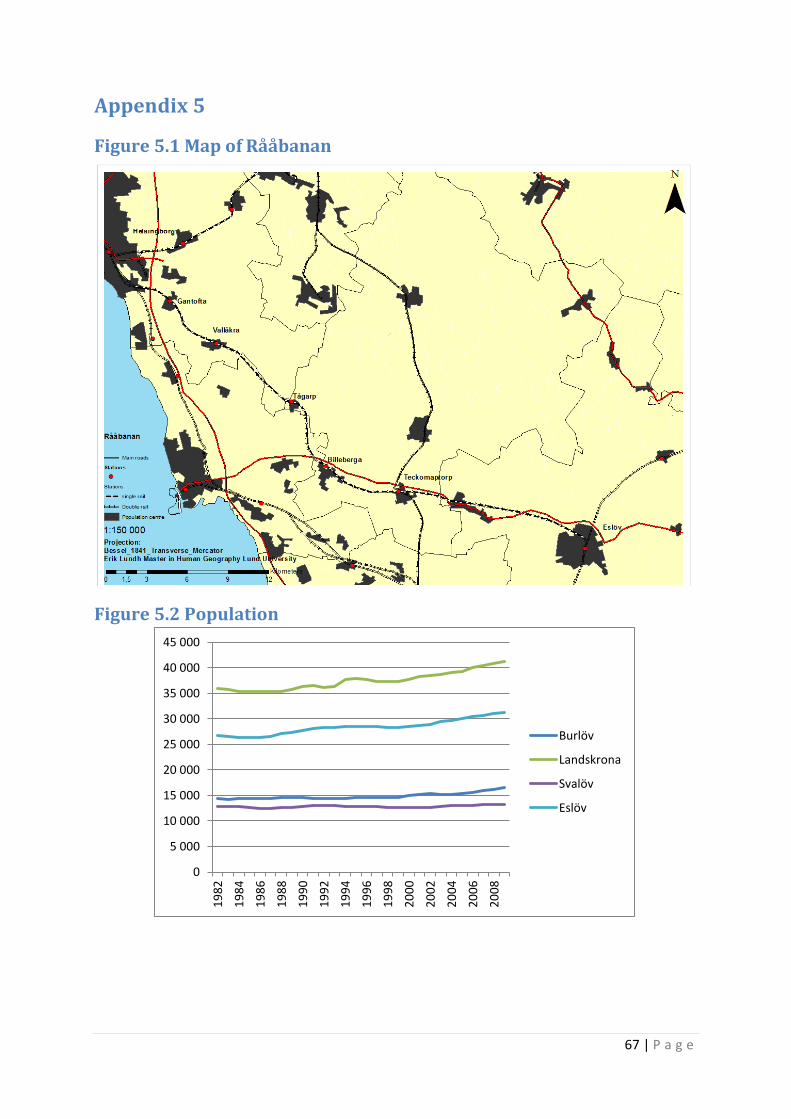
67 | P a g e
Appendix 5
Figure 5.1 Map of Rååbanan
Figure 5.2 Population
0
5 000
10 000
15 000
20 000
25 000
30 000
35 000
40 000
45 000
19
82
19
84
19
86
19
88
19
90
19
92
19
94
19
96
19
98
20
00
20
02
20
04
20
06
20
08
Burlöv
Landskrona
Svalöv
Eslöv
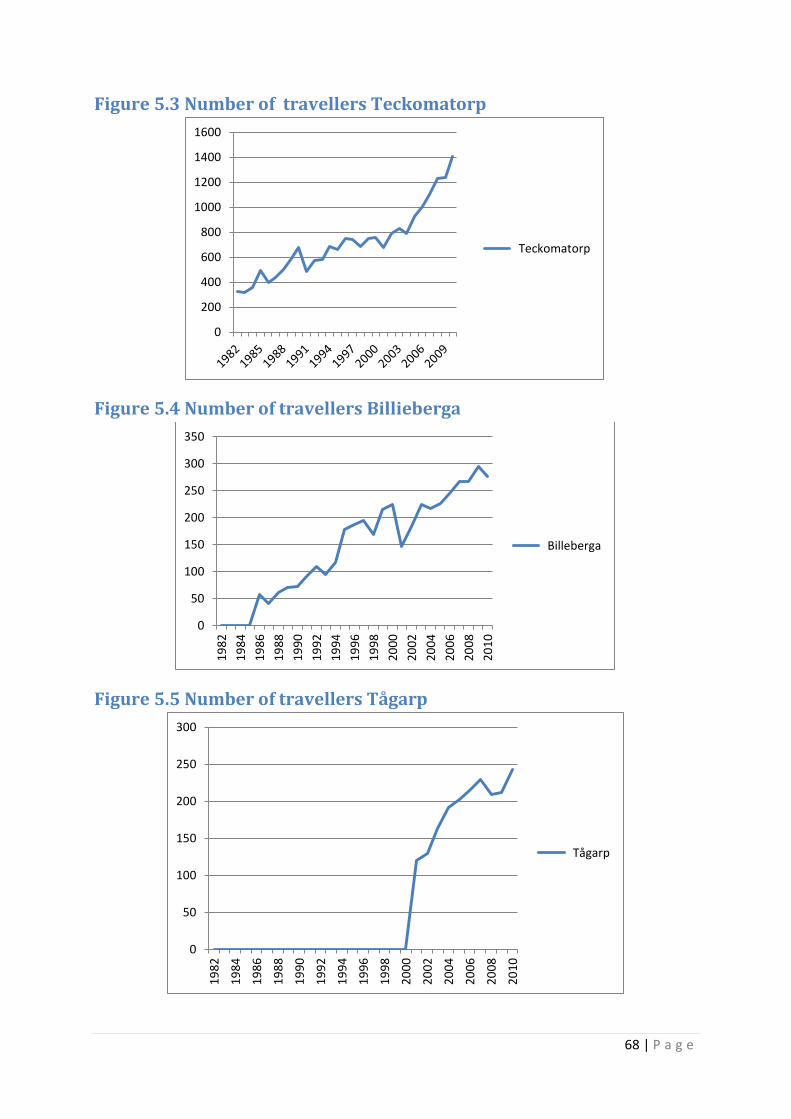
68 | P a g e
Figure 5.3 Number of travellers Teckomatorp
Figure 5.4 Number of travellers Billieberga
Figure 5.5 Number of travellers Tågarp
0
200
400
600
800
1000
1200
1400
1600
Teckomatorp
0
50
100
150
200
250
300
350
19
82
19
84
19
86
19
88
19
90
19
92
19
94
19
96
19
98
20
00
20
02
20
04
20
06
20
08
20
10
Billeberga
0
50
100
150
200
250
300
19
82
19
84
19
86
19
88
19
90
19
92
19
94
19
96
19
98
20
00
20
02
20
04
20
06
20
08
20
10
Tågarp
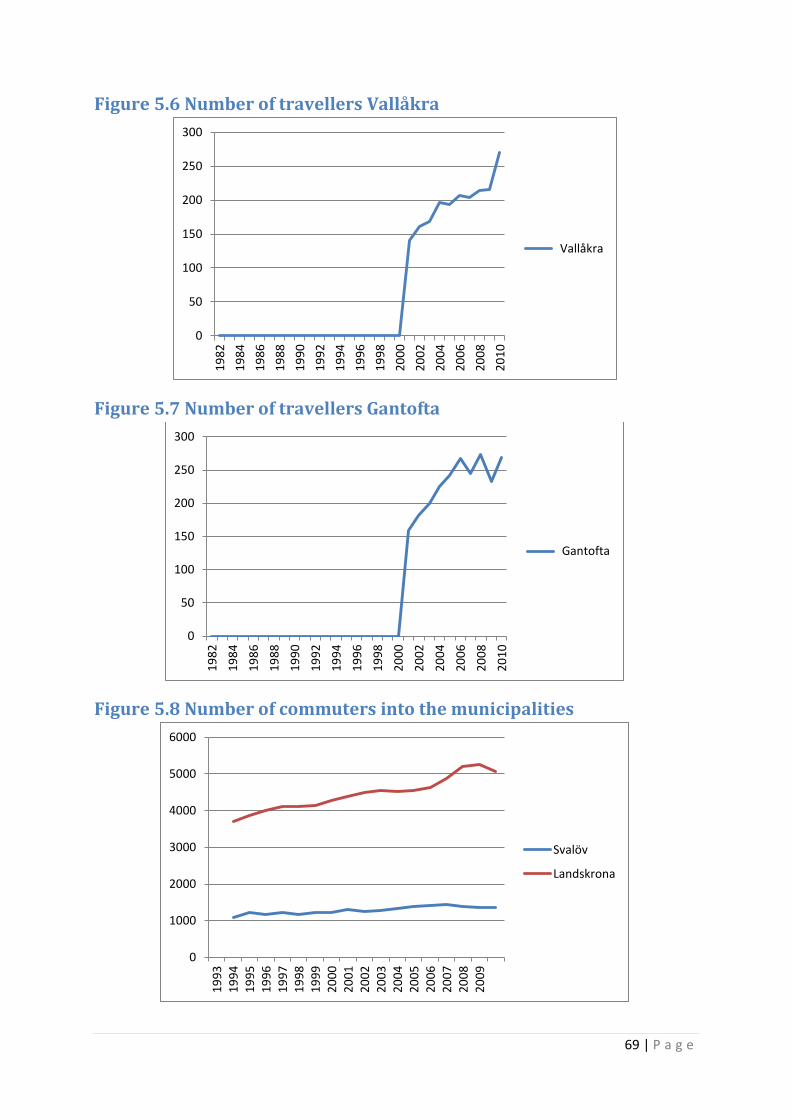
69 | P a g e
Figure 5.6 Number of travellers Vallåkra
Figure 5.7 Number of travellers Gantofta
Figure 5.8 Number of commuters into the municipalities
0
50
100
150
200
250
300
19
82
19
84
19
86
19
88
19
90
19
92
19
94
19
96
19
98
20
00
20
02
20
04
20
06
20
08
20
10
Vallåkra
0
50
100
150
200
250
300
19
82
19
84
19
86
19
88
19
90
19
92
19
94
19
96
19
98
20
00
20
02
20
04
20
06
20
08
20
10
Gantofta
0
1000
2000
3000
4000
5000
6000
19
93
19
94
19
95
19
96
19
97
19
98
19
99
20
00
20
01
20
02
20
03
20
04
20
05
20
06
20
07
20
08
20
09
Svalöv
Landskrona
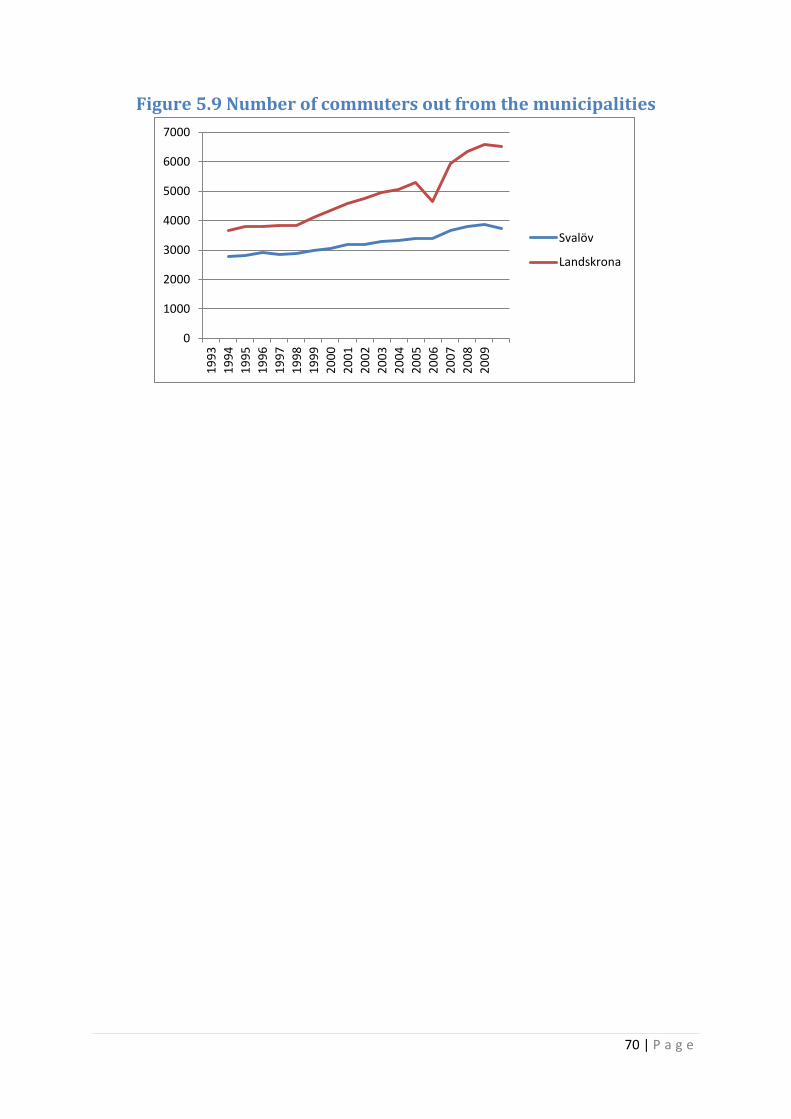
70 | P a g e
Figure 5.9 Number of commuters out from the municipalities
0
1000
2000
3000
4000
5000
6000
7000
19
93
19
94
19
95
19
96
19
97
19
98
19
99
20
00
20
01
20
02
20
03
20
04
20
05
20
06
20
07
20
08
20
09
Svalöv
Landskrona
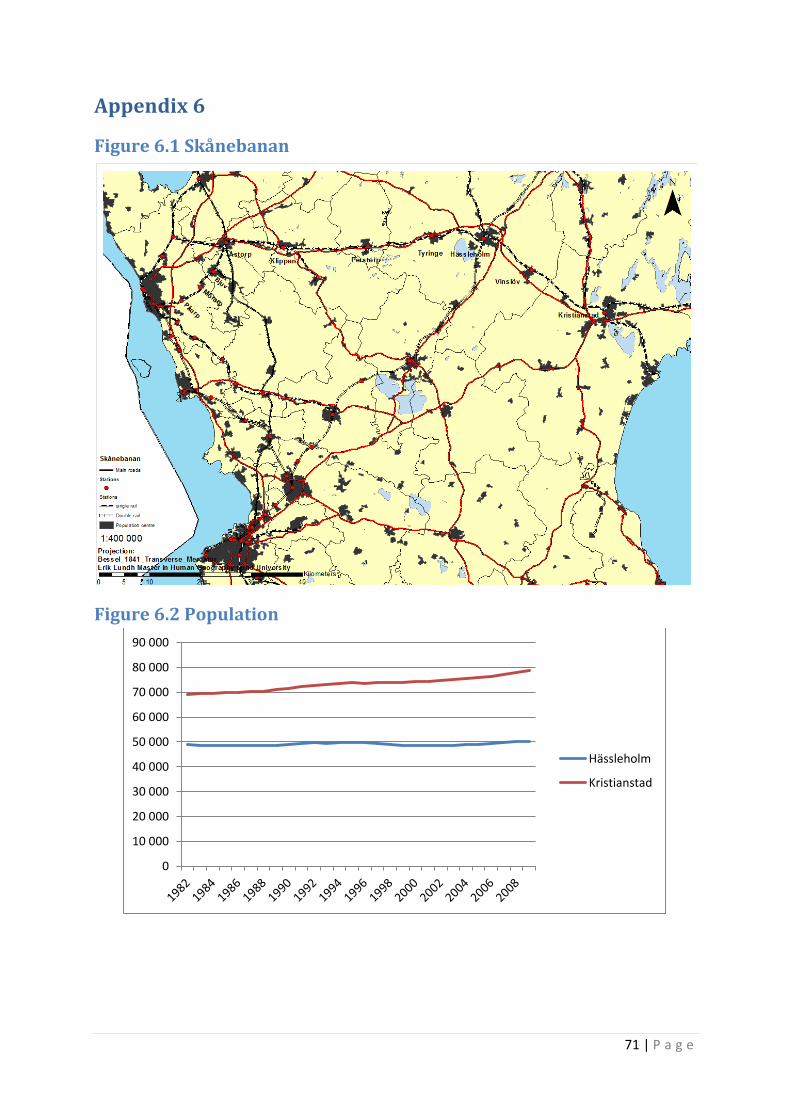
71 | P a g e
Appendix 6
Figure 6.1 Skånebanan
Figure 6.2 Population
0
10 000
20 000
30 000
40 000
50 000
60 000
70 000
80 000
90 000
Hässleholm
Kristianstad
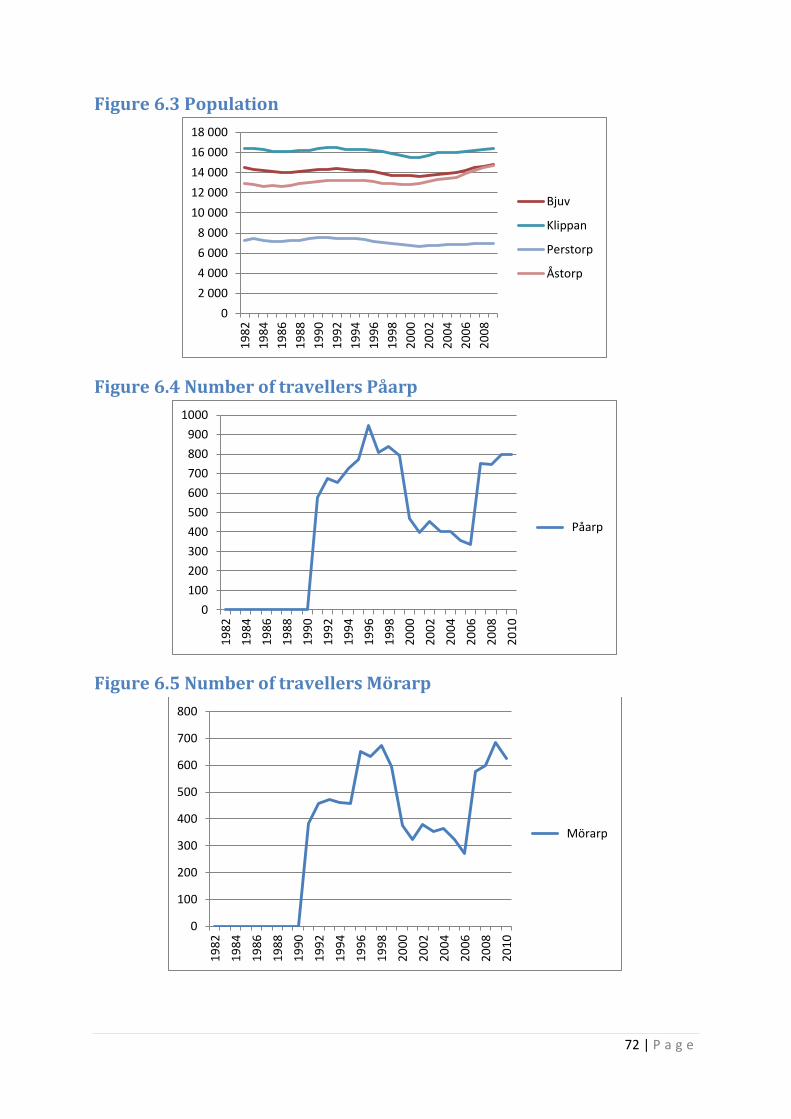
72 | P a g e
Figure 6.3 Population
Figure 6.4 Number of travellers Påarp
Figure 6.5 Number of travellers Mörarp
0
2 000
4 000
6 000
8 000
10 000
12 000
14 000
16 000
18 000
19
82
19
84
19
86
19
88
19
90
19
92
19
94
19
96
19
98
20
00
20
02
20
04
20
06
20
08
Bjuv
Klippan
Perstorp
Åstorp
0
100
200
300
400
500
600
700
800
900
1000
19
82
19
84
19
86
19
88
19
90
19
92
19
94
19
96
19
98
20
00
20
02
20
04
20
06
20
08
20
10
Påarp
0
100
200
300
400
500
600
700
800
19
82
19
84
19
86
19
88
19
90
19
92
19
94
19
96
19
98
20
00
20
02
20
04
20
06
20
08
20
10
Mörarp
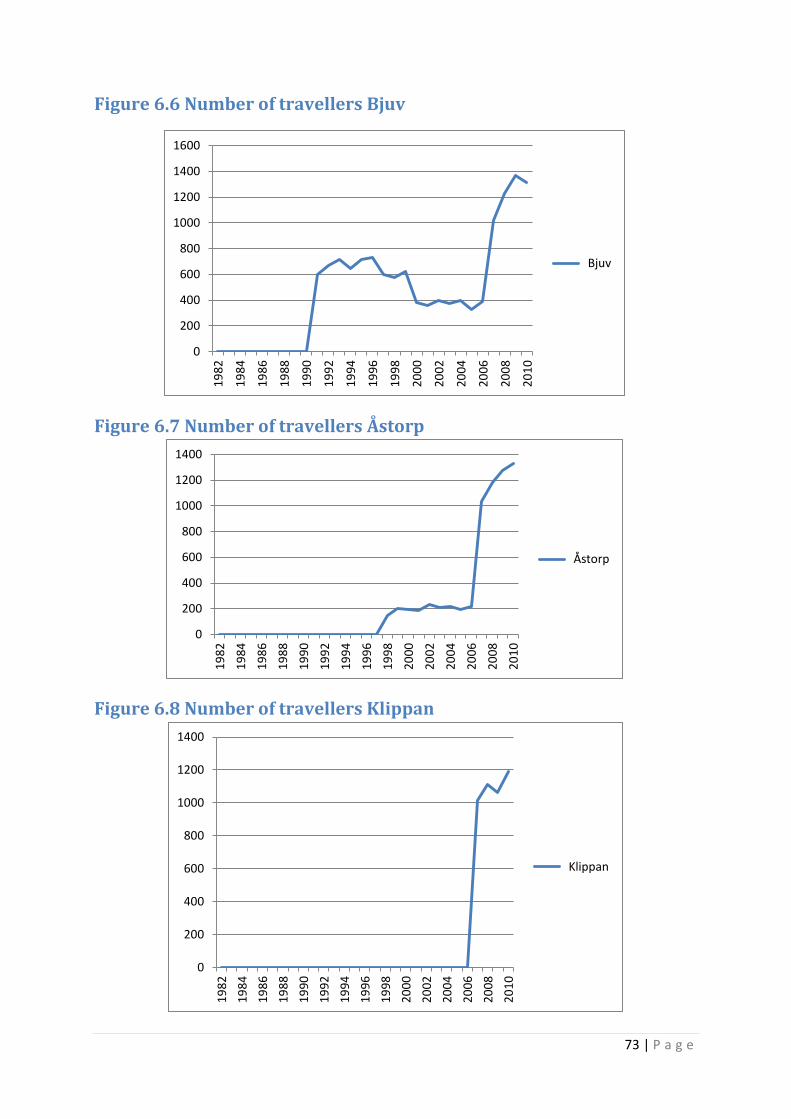
73 | P a g e
Figure 6.6 Number of travellers Bjuv
Figure 6.7 Number of travellers Åstorp
Figure 6.8 Number of travellers Klippan
0
200
400
600
800
1000
1200
1400
1600
19
82
19
84
19
86
19
88
19
90
19
92
19
94
19
96
19
98
20
00
20
02
20
04
20
06
20
08
20
10
Bjuv
0
200
400
600
800
1000
1200
1400
19
82
19
84
19
86
19
88
19
90
19
92
19
94
19
96
19
98
20
00
20
02
20
04
20
06
20
08
20
10
Åstorp
0
200
400
600
800
1000
1200
1400
19
82
19
84
19
86
19
88
19
90
19
92
19
94
19
96
19
98
20
00
20
02
20
04
20
06
20
08
20
10
Klippan
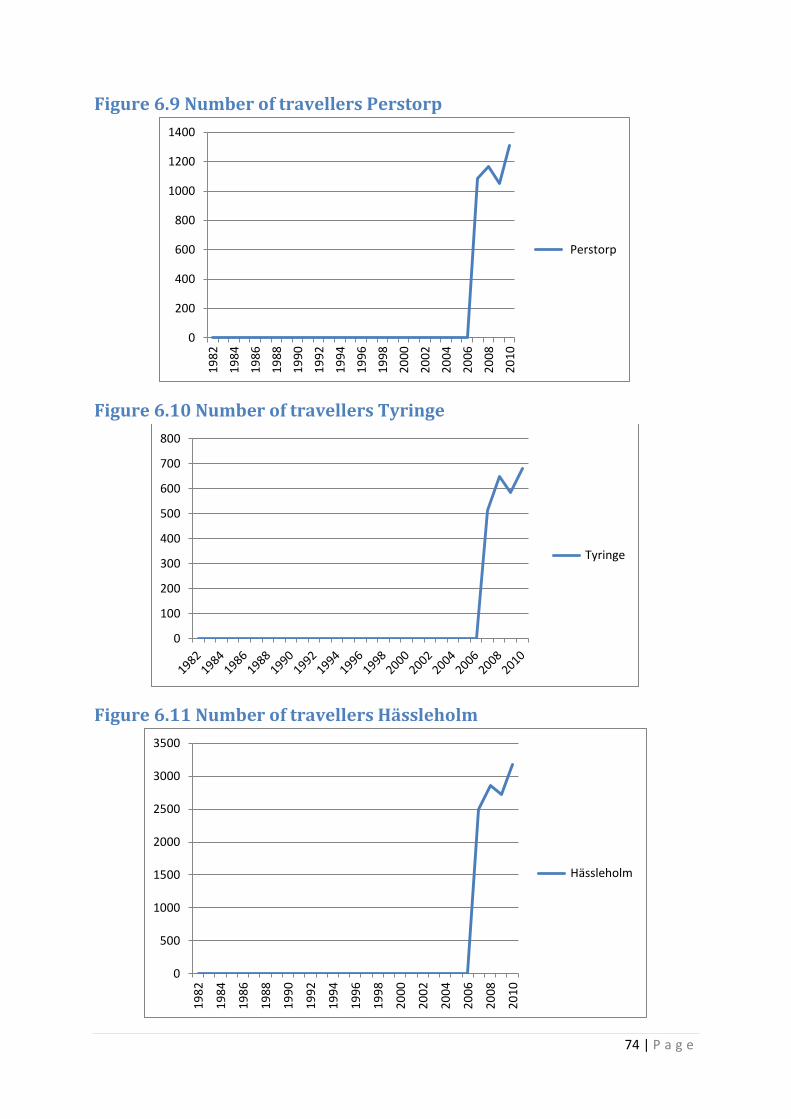
74 | P a g e
Figure 6.9 Number of travellers Perstorp
Figure 6.10 Number of travellers Tyringe
Figure 6.11 Number of travellers Hässleholm
0
200
400
600
800
1000
1200
1400
19
82
19
84
19
86
19
88
19
90
19
92
19
94
19
96
19
98
20
00
20
02
20
04
20
06
20
08
20
10
Perstorp
0
100
200
300
400
500
600
700
800
Tyringe
0
500
1000
1500
2000
2500
3000
3500
19
82
19
84
19
86
19
88
19
90
19
92
19
94
19
96
19
98
20
00
20
02
20
04
20
06
20
08
20
10
Hässleholm
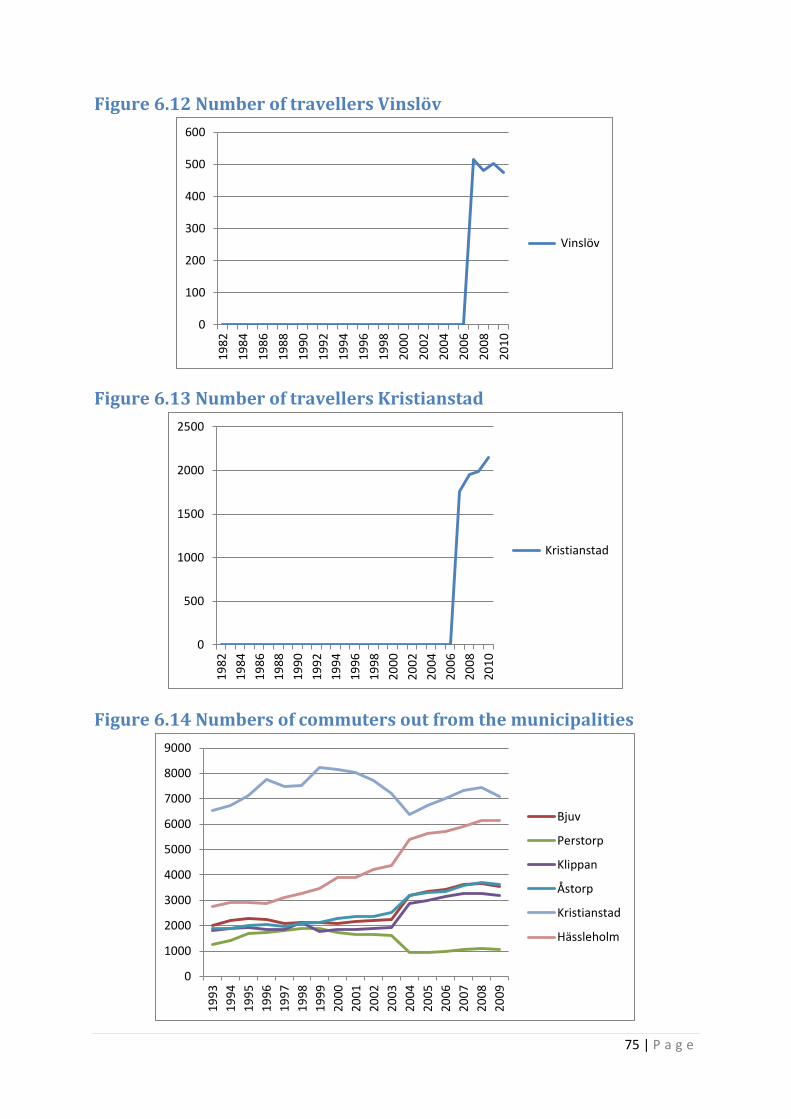
75 | P a g e
Figure 6.12 Number of travellers Vinslöv
Figure 6.13 Number of travellers Kristianstad
Figure 6.14 Numbers of commuters out from the municipalities
0
100
200
300
400
500
600
19
82
19
84
19
86
19
88
19
90
19
92
19
94
19
96
19
98
20
00
20
02
20
04
20
06
20
08
20
10
Vinslöv
0
500
1000
1500
2000
2500
19
82
19
84
19
86
19
88
19
90
19
92
19
94
19
96
19
98
20
00
20
02
20
04
20
06
20
08
20
10
Kristianstad
0
1000
2000
3000
4000
5000
6000
7000
8000
9000
19
93
19
94
19
95
19
96
19
97
19
98
19
99
20
00
20
01
20
02
20
03
20
04
20
05
20
06
20
07
20
08
20
09
Bjuv
Perstorp
Klippan
Åstorp
Kristianstad
Hässleholm
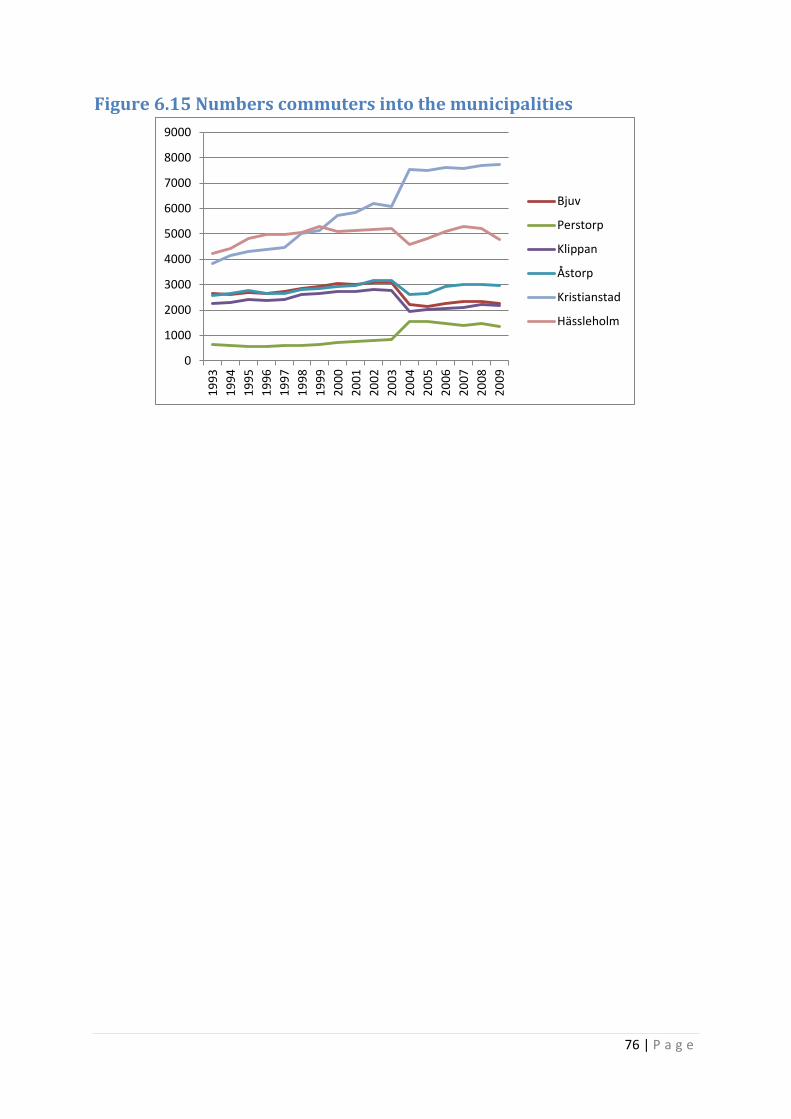
76 | P a g e
Figure 6.15 Numbers commuters into the municipalities
0
1000
2000
3000
4000
5000
6000
7000
8000
9000
19
93
19
94
19
95
19
96
19
97
19
98
19
99
20
00
20
01
20
02
20
03
20
04
20
05
20
06
20
07
20
08
20
09
Bjuv
Perstorp
Klippan
Åstorp
Kristianstad
Hässleholm
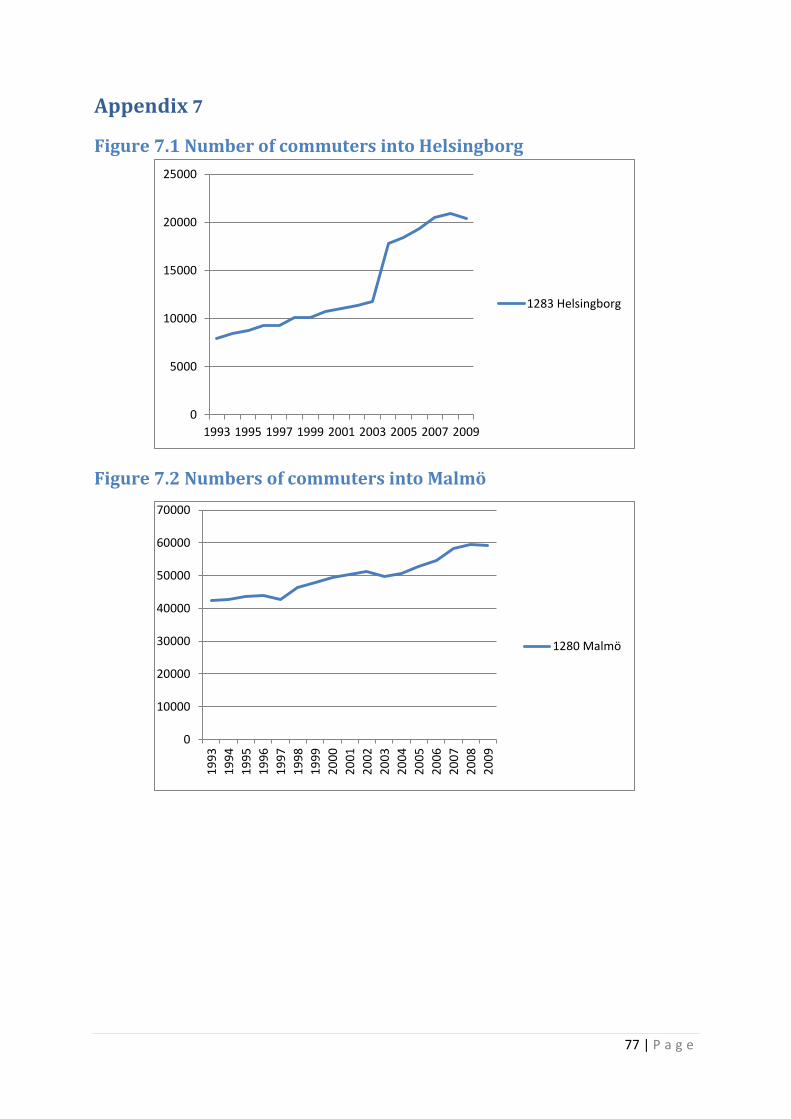
77 | P a g e
Appendix 7
Figure 7.1 Number of commuters into Helsingborg
Figure 7.2 Numbers of commuters into Malmö
0
5000
10000
15000
20000
25000
1993 1995 1997 1999 2001 2003 2005 2007 2009
1283 Helsingborg
0
10000
20000
30000
40000
50000
60000
70000
19
93
19
94
19
95
19
96
19
97
19
98
19
99
20
00
20
01
20
02
20
03
20
04
20
05
20
06
20
07
20
08
20
09
1280 Malmö
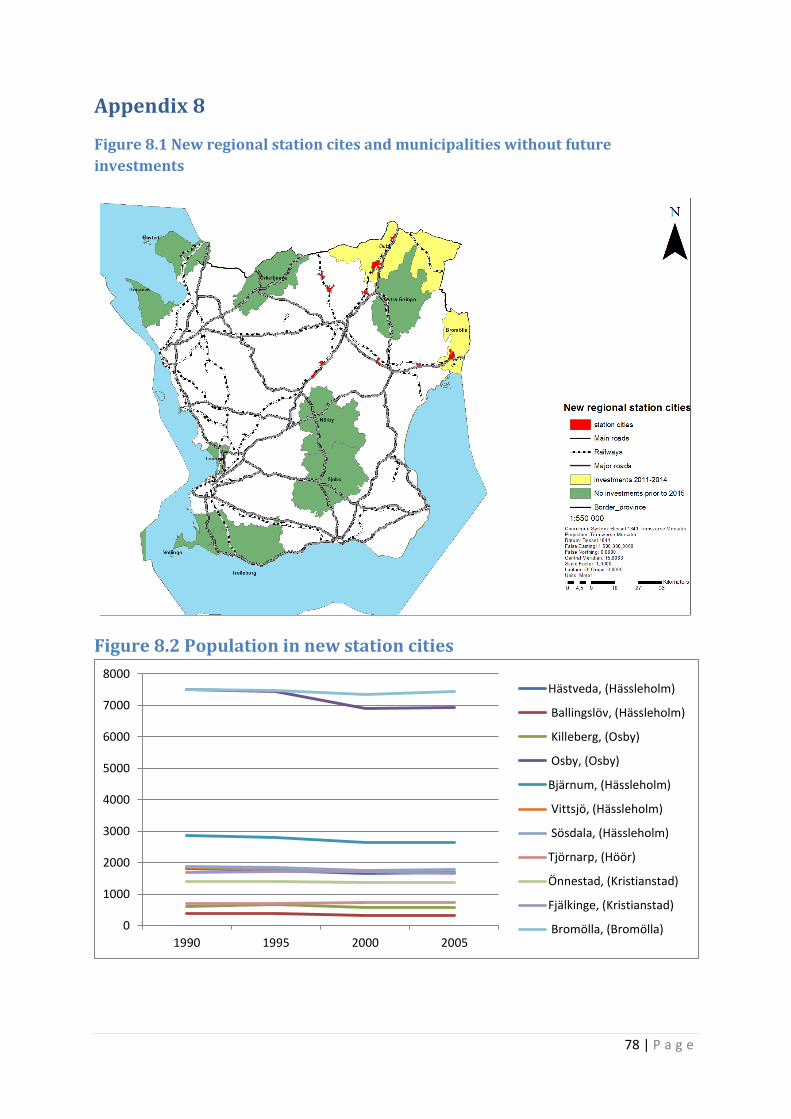
78 | P a g e
Appendix 8
Figure 8.1 New regional station cites and municipalities without future
investments
Figure 8.2 Population in new station cities
0
1000
2000
3000
4000
5000
6000
7000
8000
1990 1995 2000 2005
Hästveda, (Hässleholm)
Ballingslöv, (Hässleholm)
Killeberg, (Osby)
Osby, (Osby)
Bjärnum, (Hässleholm)
Vittsjö, (Hässleholm)
Sösdala, (Hässleholm)
Tjörnarp, (Höör)
Önnestad, (Kristianstad)
Fjälkinge, (Kristianstad)
Bromölla, (Bromölla)
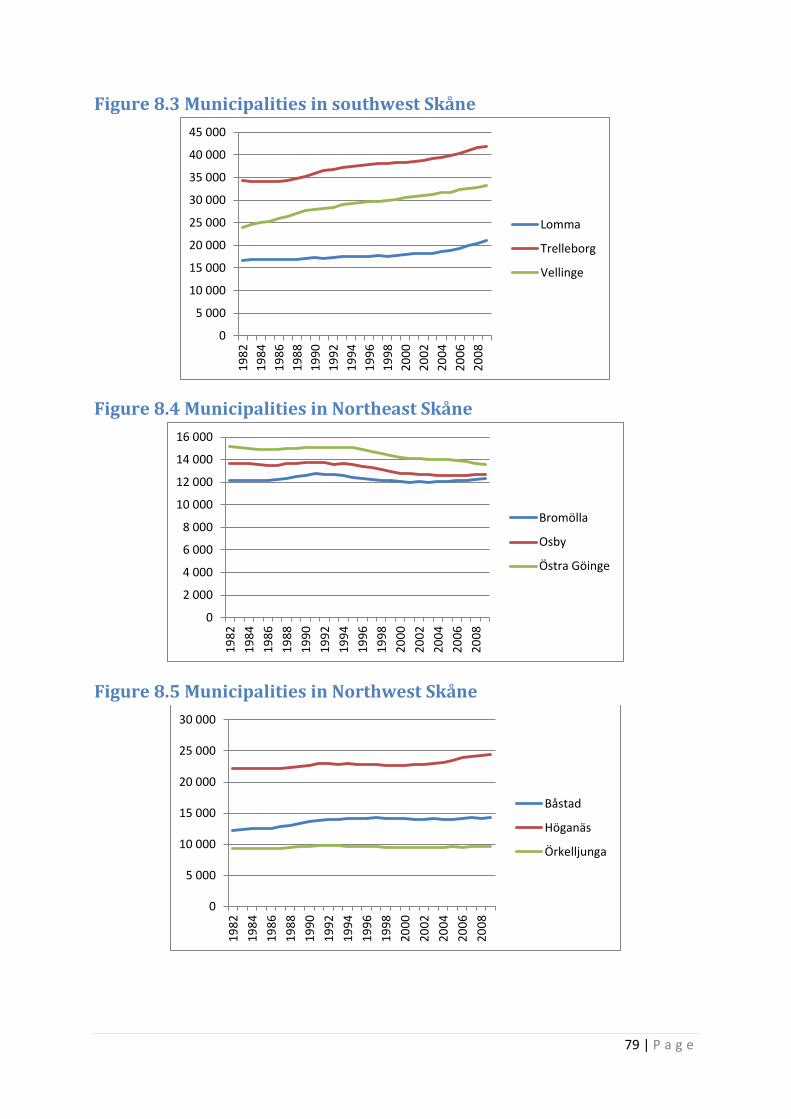
79 | P a g e
Figure 8.3 Municipalities in southwest Skåne
Figure 8.4 Municipalities in Northeast Skåne
Figure 8.5 Municipalities in Northwest Skåne
0
5 000
10 000
15 000
20 000
25 000
30 000
35 000
40 000
45 000
19
82
19
84
19
86
19
88
19
90
19
92
19
94
19
96
19
98
20
00
20
02
20
04
20
06
20
08
Lomma
Trelleborg
Vellinge
0
2 000
4 000
6 000
8 000
10 000
12 000
14 000
16 000
19
82
19
84
19
86
19
88
19
90
19
92
19
94
19
96
19
98
20
00
20
02
20
04
20
06
20
08
Bromölla
Osby
Östra Göinge
0
5 000
10 000
15 000
20 000
25 000
30 000
19
82
19
84
19
86
19
88
19
90
19
92
19
94
19
96
19
98
20
00
20
02
20
04
20
06
20
08
Båstad
Höganäs
Örkelljunga
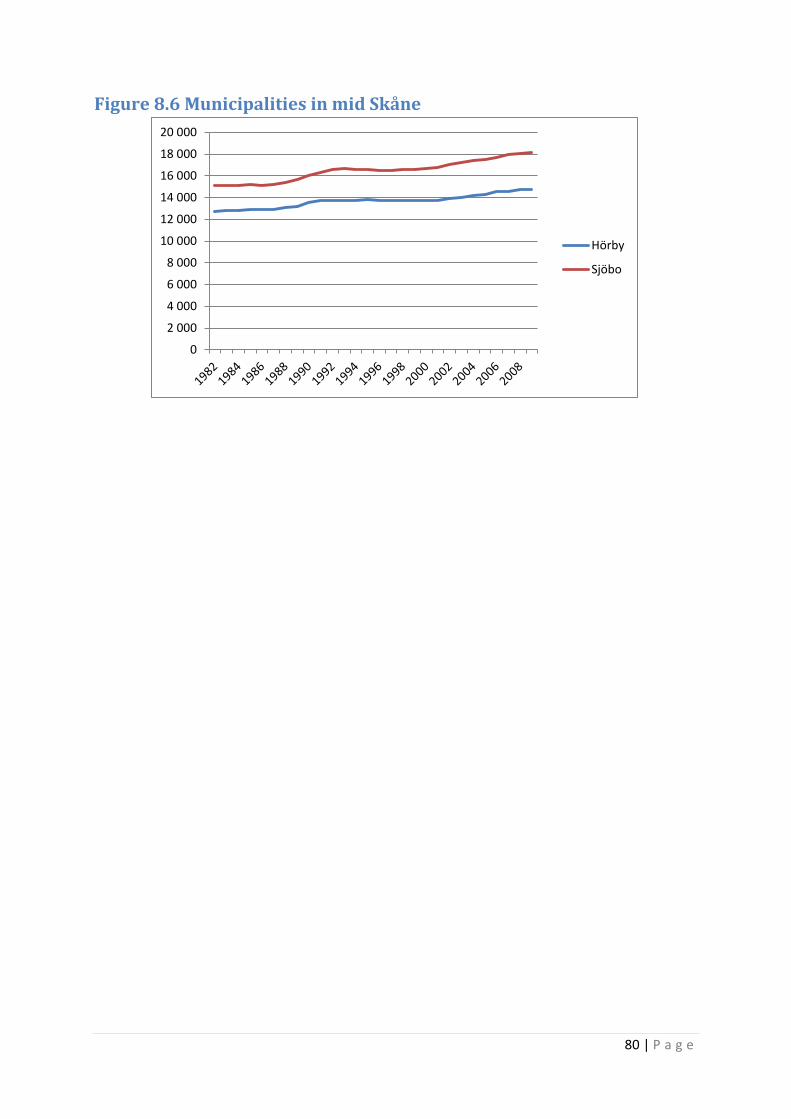
80 | P a g e
Figure 8.6 Municipalities in mid Skåne
0
2 000
4 000
6 000
8 000
10 000
12 000
14 000
16 000
18 000
20 000
Hörby
Sjöbo