mass spectrometry-based relative quantification of proteins in precatalytic and catalytically active...
TRANSCRIPT
Mass spectrometry–based relative quantification of proteinsin precatalytic and catalytically active spliceosomesby metabolic labeling (SILAC), chemical labeling (iTRAQ),and label-free spectral count
CARLA SCHMIDT,1,4,7 MADS GRØNBORG,1,5,7 JOCHEN DECKERT,2,6 SERGEY BESSONOV,2 THOMAS CONRAD,2
REINHARD LÜHRMANN,2 and HENNING URLAUB1,3,8
1Bioanalytical Mass Spectrometry Group, 2Department of Cellular Biochemistry, Max Planck Institute for Biophysical Chemistry,37077 Göttingen, Germany3Bioanalytics, Department of Clinical Chemistry, University Medical Center Göttingen, 37075 Göttingen, Germany
ABSTRACT
The spliceosome undergoes major changes in protein and RNA composition during pre-mRNA splicing. Knowing the proteins—and their respective quantities—at each spliceosomal assembly stage is critical for understanding the molecular mechanisms andregulation of splicing. Here, we applied three independent mass spectrometry (MS)–based approaches for quantification of theseproteins: (1) metabolic labeling by SILAC, (2) chemical labeling by iTRAQ, and (3) label-free spectral count for quantification ofthe protein composition of the human spliceosomal precatalytic B and catalytic C complexes. In total wewere able to quantify 157proteins by at least two of the three approaches. Our quantification shows that only a very small subset of spliceosomal proteins(the U5 and U2 Sm proteins, a subset of U5 snRNP-specific proteins, and the U2 snRNP-specific proteins U2A′ and U2B′′) remainsunaltered upon transition from the B to the C complex. TheMS-based quantification approaches classify the majority of proteins asdynamically associated specifically with the B or the C complex. In terms of experimental procedure and the methodical aspect ofthis work, we show that metabolically labeled spliceosomes are functionally active in terms of their assembly and splicing kineticsand can be utilized for quantitative studies. Moreover, we obtain consistent quantification results from all three methods,including the relatively straightforward and inexpensive label-free spectral count technique.
Keywords: spliceosome; quantitative proteomics; stable isotope labeling with amino acids in cell culture (SILAC); isobaric tags forrelative and absolute quantification (iTRAQ); spectral count
INTRODUCTION
Proteomic analysis provides essential information about thefunction and regulation of protein complexes. Numerousmass spectrometry (MS) techniques have been developedto determine protein composition and their quantities(Aebersold and Mann 2003; Steen and Mann 2004; Ongand Mann 2005; Domon and Aebersold 2006; Yates et al.2009; Bantscheff et al. 2012; Nikolov et al. 2012). To date,the relative quantification technique of stable-isotope label-
ing followed by MS has frequently been used to quantify pro-teins from tissues, from different functional states of a cell,from compartments or from pull-down experiments involv-ing protein(–ligand) complexes. However, they have rarelybeen used to compare directly isolated native protein com-plexes that represent different functional states of a singlemolecular machine. Here, we examine the proteomes of iso-lated human precatalytic B and catalytically active C spliceo-somal complexes by quantitative MS.The spliceosome catalyzes eukaryotic pre-mRNA splicing
to generate maturemRNAs and is a highly dynamic and com-plex macromolecular machine. Spliceosomes consist of oneor more of the five uridine-rich small nuclear ribonucleopro-tein particles (snRNPs; U1,U2, U5, theU4/U6 di-snRNP, andthe U4/U6.U5 tri-snRNP), each of which contains U snRNA
4Present address: Department of Chemistry, Physical and TheoreticalChemistry Laboratory, University of Oxford, OX1 3QZ Oxford, UK
5Present address: Department of Beta Cell Regeneration, HagedornResearch Institute, 2820 Gentofte, Denmark
6Present address: Axolabs GmbH, 95326 Kulmbach, Germany7These authors contributed equally to this work.8Corresponding authorE-mail [email protected] published online ahead of print. Article and publication date are at
http://www.rnajournal.org/cgi/doi/10.1261/rna.041244.113. Freely availableonline through the RNA Open Access option.
© 2014 Schmidt et al. This article, published in RNA, is available under aCreative Commons License (Attribution-NonCommercial 3.0 Unported),as described at http://creativecommons.org/licenses/by-nc/3.0/.
METHOD
406 RNA 20:406–420; Published by Cold Spring Harbor Laboratory Press for the RNA Society
Cold Spring Harbor Laboratory Press on May 9, 2015 - Published by rnajournal.cshlp.orgDownloaded from
(s), a core set of seven Sm or LSm proteins, and numerous UsnRNP-specific proteins. In vitro, several different functionalstates of the spliceosome can be distinguished; these aretermed the E, A, B, Bact, and C complexes (Wahl et al.2009). Transitions between these different states are often ac-companied by dramatic rearrangements in the spliceosomalinteractions. For instance, the precatalytic B complex, whichcontains the U4/U6.U5 tri-snRNP, undergoes structural rear-rangements that destabilize the U1 and U4 snRNPs to formthe activated Bact complex; this then catalyzes the first step ofsplicing to generate the catalytically active C complex, whichin turn catalyzes the second stepof splicing to produce thema-turemRNA (Wahl et al. 2009). Determining the protein com-position of each of the spliceosomal states has been a majorgoal in the past decade. Initial studies using active spliceo-somes assembled in vitro revealed that in addition to theU snRNP-specific proteins, more than 100 proteins are in-volved in the splicing cycle (Jurica et al. 2002; Rappsilberet al. 2002; Zhou et al. 2002; Jurica andMoore 2003).Morede-tailed studies focused on analyzing the protein composition ofthe isolated functional states of the A, B, Bact, andC complexesand the mRNPs in humans (Deckert et al. 2006; Behzadniaet al. 2007; Bessonov et al. 2008, 2010), yeast (B, Bact, and Ccomplexes) (Fabrizio et al. 2009), and Drosophila (B and Ccomplexes) (Herold et al. 2009). MS analyses have revealedthat the human B and C complexes contain approximately130 and 150 proteins, respectively. Of these, 105 proteins arestably associated with both complexes (Bessonov et al.2008). The substantial change in composition from one func-tional spliceosomal state to another has been clearly shownby the determination of the protein compositions of isolatedA, B, Bact, and C complexes, each of which differs remarkablyfrom the others even when isolated under native conditionsthat allow close comparison (Deckert et al. 2006; Behzadniaet al. 2007; Bessonov et al. 2008, 2010; Fabrizio et al. 2009;Herold et al. 2009). Byusing anovel 2Dgel electrophoresis sys-tem to quantify spliceosomal complexes, it has recently beenshown that only 60–70 protein factors aremoderately or high-ly abundant in the various spliceosomal complexes (Agafonovet al. 2011). In these previous studies, the protein componentsof isolated spliceosomes were analyzed in a so-called “semi-quantitative” manner by determining the number of se-quenced peptides by MS (peptide count) or by measuringthe intensity of stained proteins after 2D gel electrophoresisto determine the relative and absolute abundances, respec-tively, of the proteins (Deckert et al. 2006; Behzadnia et al.2007; Merz et al. 2007; Bessonov et al. 2008, 2010; Fabrizioet al. 2009; Agafonov et al. 2011). We applied now here—for the first time—three independent MS-based quantifica-tion methods (SILAC metabolic labeling [Ong et al. 2002],iTRAQ chemical labeling [Ross et al. 2004], and the label-free spectral count [Liu et al. 2004]) in determining the pro-tein quantities in purified spliceosomal B and C complexes.We identified and quantified approximately 200 proteins
in both the B and the C complex preparations; this represents
>95% of the previously published proteomes of the B and Ccomplexes (Deckert et al. 2006; Bessonov et al. 2008).Strikingly, only a few of the proteins identified are “core”components of both complexes, the quantities of which donot change upon transition from B-to-C complex. Thesewere a subset of U5 snRNP proteins, the U2-specific proteinsU2A′ and U2B′′, and the evolutionarily conserved Sm pro-teins of U5 and U2. Most proteins, in contrast, either joinedor left the spliceosome during its transition from the precata-lytic B complex to the catalytically active C complex. Thisstudy expands our previous investigation of the proteomesof spliceosomal B and C complexes and may further be ex-tended to study the assembly kinetics of spliceosomal com-plexes in nuclear extract (NE).
RESULTS
For our quantitativeMS studies, we used the same experimen-tal approach as Bessonov et al. (2008), namely, separation ofthe protein components of glycerol-gradient-purified spli-ceosomal complexes by 1D gel electrophoresis, and thus re-duced the sample complexity to a similar extent (Bessonovet al. 2008). Importantly, as a prerequisite of such an MS-based quantitative analysis, namely, comparing the exactamount of natively purified assemblies, we benefit from themeasurement of the amount of 32P-labeled pre-mRNA thatis bound to the respective complexes. All quantitative MS-based analyses were performed with two biological replicates.We resumed the protein assignment previously introduced byDeckert et al. (2006), Bessonov et al. (2008), and Agafonovet al. (2011) and adjusted the protein classification of B andC complexes according to our quantification results (Table1). In addition, we list some proteins that could not unambig-uously be assigned to either of the two complexes, owing totheir fluctuating quantification results (Supplemental Table1). Finally, we identified and quantified several proteins thatclearly show association with either the B or the C complexby all three approaches and were not classified as B- or C-spe-cific proteins previously byBessonov et al. (2008) orAgafonovet al. (2011); Table 1.
MS analysis of metabolically stable isotope-labeled(SILAC) spliceosomes
Metabolic labeling with stable isotopes (Ong et al. 2002) isconsidered to be the gold standard in protein quantification;as proteins are fully labeled, samples can be pooled at an earlystage of sample preparation and cleavage of proteins withendoproteinase trypsin always leads to coeluting labeled pep-tide pairs that are analyzed in the MS. We prepared spliceo-somes from HeLa NEs labeled with Lys+6, and Arg+10(“heavy” NE) and spliceosomes prepared from NEs contain-ing the nonlabeled amino acids Lys+0 and Arg+0 (“light”NE) (Fig. 1A). We had previously verified that the differentSILACNE preparations did not display significant differences
Relative quantification of spliceosomal complexes
www.rnajournal.org 407
Cold Spring Harbor Laboratory Press on May 9, 2015 - Published by rnajournal.cshlp.orgDownloaded from
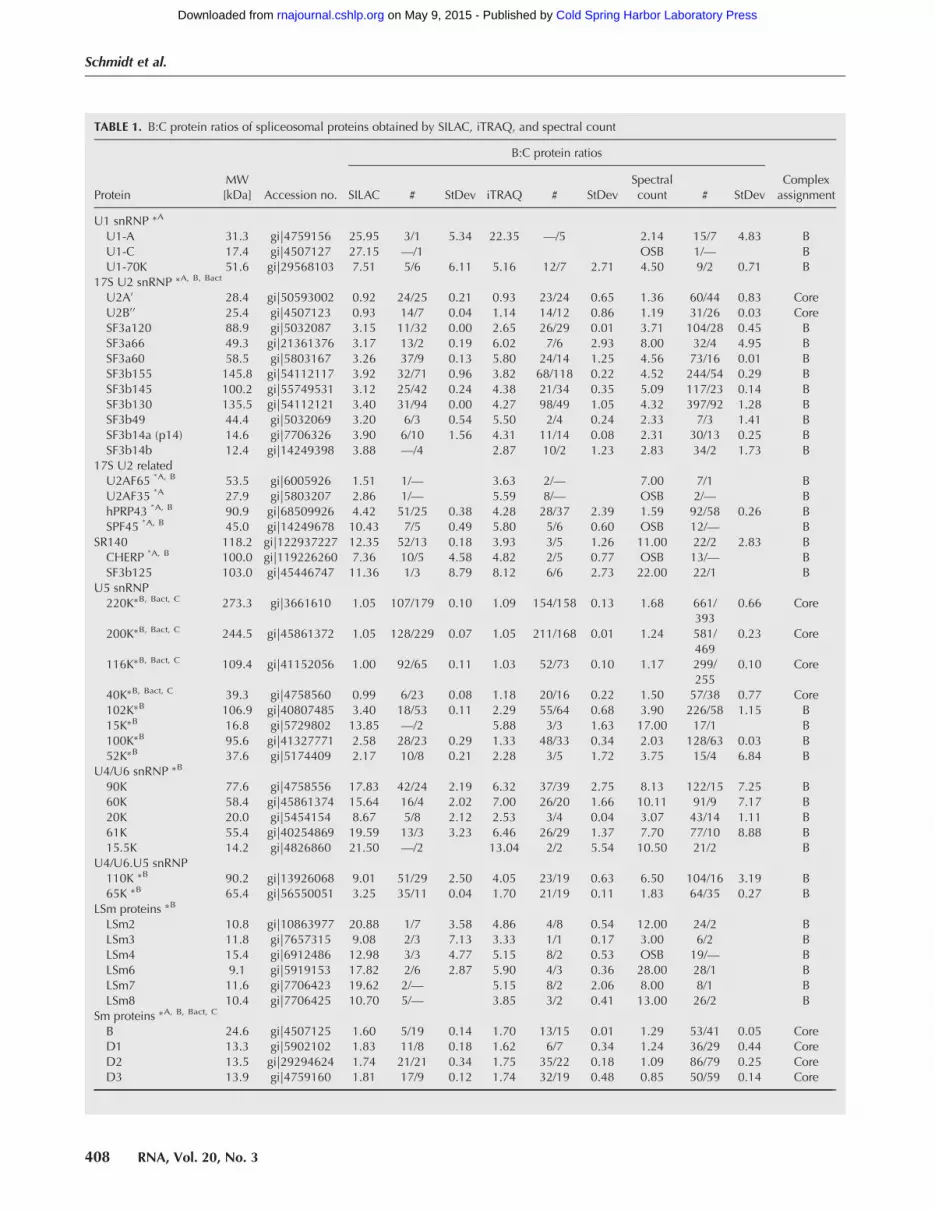
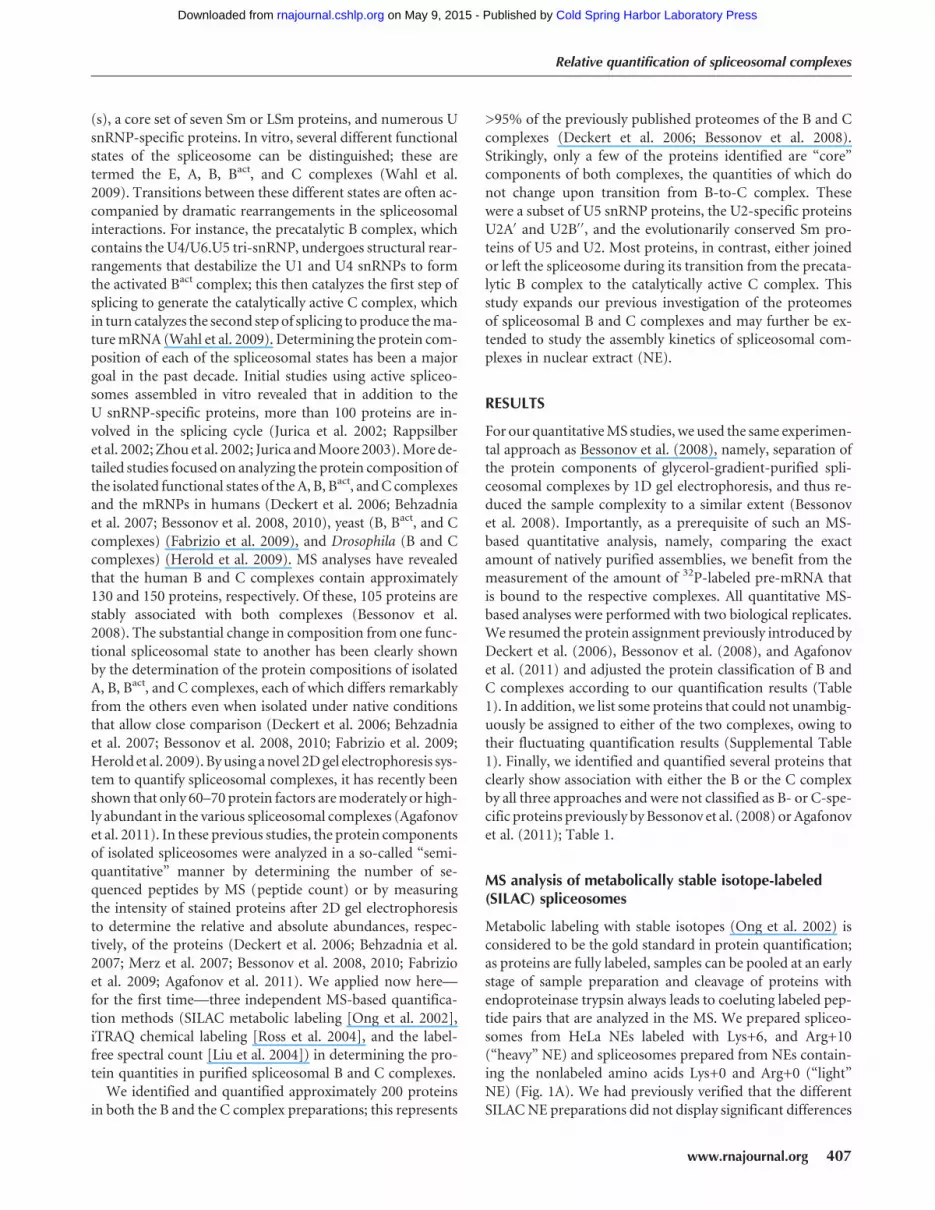
TABLE 1. B:C protein ratios of spliceosomal proteins obtained by SILAC, iTRAQ, and spectral count
ProteinMW[kDa] Accession no.
B:C protein ratios
ComplexassignmentSILAC # StDev iTRAQ # StDev
Spectralcount # StDev
U1 snRNP ∗A
U1-A 31.3 gi|4759156 25.95 3/1 5.34 22.35 —/5 2.14 15/7 4.83 BU1-C 17.4 gi|4507127 27.15 —/1 OSB 1/— BU1-70K 51.6 gi|29568103 7.51 5/6 6.11 5.16 12/7 2.71 4.50 9/2 0.71 B
17S U2 snRNP ∗A, B, Bact
U2A′ 28.4 gi|50593002 0.92 24/25 0.21 0.93 23/24 0.65 1.36 60/44 0.83 CoreU2B′ ′ 25.4 gi|4507123 0.93 14/7 0.04 1.14 14/12 0.86 1.19 31/26 0.03 CoreSF3a120 88.9 gi|5032087 3.15 11/32 0.00 2.65 26/29 0.01 3.71 104/28 0.45 BSF3a66 49.3 gi|21361376 3.17 13/2 0.19 6.02 7/6 2.93 8.00 32/4 4.95 BSF3a60 58.5 gi|5803167 3.26 37/9 0.13 5.80 24/14 1.25 4.56 73/16 0.01 BSF3b155 145.8 gi|54112117 3.92 32/71 0.96 3.82 68/118 0.22 4.52 244/54 0.29 BSF3b145 100.2 gi|55749531 3.12 25/42 0.24 4.38 21/34 0.35 5.09 117/23 0.14 BSF3b130 135.5 gi|54112121 3.40 31/94 0.00 4.27 98/49 1.05 4.32 397/92 1.28 BSF3b49 44.4 gi|5032069 3.20 6/3 0.54 5.50 2/4 0.24 2.33 7/3 1.41 BSF3b14a (p14) 14.6 gi|7706326 3.90 6/10 1.56 4.31 11/14 0.08 2.31 30/13 0.25 BSF3b14b 12.4 gi|14249398 3.88 —/4 2.87 10/2 1.23 2.83 34/2 1.73 B
17S U2 relatedU2AF65
∗A, B 53.5 gi|6005926 1.51 1/— 3.63 2/— 7.00 7/1 BU2AF35
∗A 27.9 gi|5803207 2.86 1/— 5.59 8/— OSB 2/— BhPRP43
∗A, B 90.9 gi|68509926 4.42 51/25 0.38 4.28 28/37 2.39 1.59 92/58 0.26 BSPF45
∗A, B 45.0 gi|14249678 10.43 7/5 0.49 5.80 5/6 0.60 OSB 12/— BSR140 118.2 gi|122937227 12.35 52/13 0.18 3.93 3/5 1.26 11.00 22/2 2.83 BCHERP
∗A, B 100.0 gi|119226260 7.36 10/5 4.58 4.82 2/5 0.77 OSB 13/— BSF3b125 103.0 gi|45446747 11.36 1/3 8.79 8.12 6/6 2.73 22.00 22/1 B
U5 snRNP220K∗B, Bact, C 273.3 gi|3661610 1.05 107/179 0.10 1.09 154/158 0.13 1.68 661/
3930.66 Core
200K∗B, Bact, C 244.5 gi|45861372 1.05 128/229 0.07 1.05 211/168 0.01 1.24 581/469
0.23 Core
116K∗B, Bact, C 109.4 gi|41152056 1.00 92/65 0.11 1.03 52/73 0.10 1.17 299/255
0.10 Core
40K∗B, Bact, C 39.3 gi|4758560 0.99 6/23 0.08 1.18 20/16 0.22 1.50 57/38 0.77 Core102K∗B 106.9 gi|40807485 3.40 18/53 0.11 2.29 55/64 0.68 3.90 226/58 1.15 B15K∗B 16.8 gi|5729802 13.85 —/2 5.88 3/3 1.63 17.00 17/1 B100K∗B 95.6 gi|41327771 2.58 28/23 0.29 1.33 48/33 0.34 2.03 128/63 0.03 B52K∗B 37.6 gi|5174409 2.17 10/8 0.21 2.28 3/5 1.72 3.75 15/4 6.84 B
U4/U6 snRNP ∗B
90K 77.6 gi|4758556 17.83 42/24 2.19 6.32 37/39 2.75 8.13 122/15 7.25 B60K 58.4 gi|45861374 15.64 16/4 2.02 7.00 26/20 1.66 10.11 91/9 7.17 B20K 20.0 gi|5454154 8.67 5/8 2.12 2.53 3/4 0.04 3.07 43/14 1.11 B61K 55.4 gi|40254869 19.59 13/3 3.23 6.46 26/29 1.37 7.70 77/10 8.88 B15.5K 14.2 gi|4826860 21.50 —/2 13.04 2/2 5.54 10.50 21/2 B
U4/U6.U5 snRNP110K ∗B 90.2 gi|13926068 9.01 51/29 2.50 4.05 23/19 0.63 6.50 104/16 3.19 B65K ∗B 65.4 gi|56550051 3.25 35/11 0.04 1.70 21/19 0.11 1.83 64/35 0.27 B
LSm proteins ∗B
LSm2 10.8 gi|10863977 20.88 1/7 3.58 4.86 4/8 0.54 12.00 24/2 BLSm3 11.8 gi|7657315 9.08 2/3 7.13 3.33 1/1 0.17 3.00 6/2 BLSm4 15.4 gi|6912486 12.98 3/3 4.77 5.15 8/2 0.53 OSB 19/— BLSm6 9.1 gi|5919153 17.82 2/6 2.87 5.90 4/3 0.36 28.00 28/1 BLSm7 11.6 gi|7706423 19.62 2/— 5.15 8/2 2.06 8.00 8/1 BLSm8 10.4 gi|7706425 10.70 5/— 3.85 3/2 0.41 13.00 26/2 B
Sm proteins ∗A, B, Bact, C
B 24.6 gi|4507125 1.60 5/19 0.14 1.70 13/15 0.01 1.29 53/41 0.05 CoreD1 13.3 gi|5902102 1.83 11/8 0.18 1.62 6/7 0.34 1.24 36/29 0.44 CoreD2 13.5 gi|29294624 1.74 21/21 0.34 1.75 35/22 0.18 1.09 86/79 0.25 CoreD3 13.9 gi|4759160 1.81 17/9 0.12 1.74 32/19 0.48 0.85 50/59 0.14 Core
(continued )
Schmidt et al.
408 RNA, Vol. 20, No. 3
Cold Spring Harbor Laboratory Press on May 9, 2015 - Published by rnajournal.cshlp.orgDownloaded from
TABLE 1. Continued
ProteinMW[kDa] Accession no.
B:C protein ratios
ComplexassignmentSILAC # StDev iTRAQ # StDev
Spectralcount # StDev
E 10.8 gi|4507129 1.88 8/7 0.21 1.61 11/7 0.59 1.22 39/32 0.91 CoreF 9.7 gi|4507131 1.77 2/7 0.07 2.15 2/6 1.07 1.69 22/13 0.16 CoreG 8.5 gi|4507133 1.86 2/8 0.12 1.36 4/5 0.23 2.13 17/8 1.37 Core
hPRP19/CDC5L complexhPrp19 ∗Bact, C 55.2 gi|7657381 0.36 59/29 0.02 0.60 61/62 0.04 0.59 116/
1970.21 C
CDC5L ∗Bact, C 92.2 gi|11067747 0.42 38/66 0.01 0.21 45/30 0.03 0.44 101/229
0.04 C
SPF27 ∗Bact, C 21.5 gi|5031653 0.34 28/17 0.01 0.54 18/15 0.01 0.67 28/42 0.50 CPRL1 ∗Bact, C 57.2 gi|4505895 0.33 26/11 0.01 0.87 33/6 0.26 0.47 39/83 0.13 CHsp70 ∗Bact, C 70.4 gi|5729877 0.17 21/4 0.03 0.72 15/10 0.67 0.28 10/36 0.18 CAD-002 ∗Bact, C 26.6 gi|7705475 0.27 8/9 0.08 0.18 6/3 0.05 0.44 8/18 0.35 CCTNNBL1 ∗Bact 65.1 gi|18644734 0.67 4/10 0.11 1.86 4/11 0.60 1.50 21/14 0.41
hPRP19/CDC5L relatedhSYF1 ∗Bact, C 100.0 gi|55770906 0.25 86/42 0.04 0.33 62/65 0.08 0.45 84/188 0.15 CCRNKL1 ∗Bact, C 100.6 gi|30795220 0.26 78/44 0.02 0.39 88/82 0.11 0.43 123/
2860.05 C
hIsy1 ∗Bact, C 33.0 gi|20149304 0.20 —/15 0.04 0.40 16/17 0.28 0.18 8/45 0.01 CSKIP ∗Bact, C 51.1 gi|6912676 0.31 85/34 0.03 0.60 58/42 0.03 0.58 85/147 0.24 CRBM22 ∗Bact, C 46.9 gi|8922328 0.29 20/14 0.02 0.49 35/39 0.06 0.36 33/92 0.24 CCyp-E ∗Bact, C 33.4 gi|5174637 0.20 16/10 0.03 0.36 8/5 0.32 0.47 16/34 0.08 CPPIL1 ∗Bact, C 18.2 gi|7706339 0.31 8/21 0.09 0.43 10/8 0.02 0.58 21/36 0.10 CKIAA0560 ∗Bact, C 171.3 gi|38788372 0.25 122/86 0.04 0.24 96/186 0.21 0.25 73/287 0.01 CG10 ∗Bact, C 17.0 gi|32171175 —/— 0.64 14/4 0.35 0.42 21/50 0.12 C
hRES complex proteinsSNIP1 ∗Bact 45.8 gi|21314720 0.73 —/7 1.23 10/2 0.61 1.38 18/13 0.37 CoreMGC12135 70.5 gi|14249338 0.75 10/14 0.01 1.46 10/10 0.73 1.24 36/29 0.28 CoreCGI-79 39.7 gi|4929627 0.62 8/6 0.15 1.06 3/2 0.42 1.14 8/7 0.14 Core
B complex proteinshPRP38 ∗B 37.5 gi|24762236 2.70 —/11 4.50 11/7 0.64 6.83 41/6 BhSnu23 ∗B 28.8 gi|13385046 8.85 2/4 4.77 OSB 10/— BTFIP11 96.8 gi|8393259 1.58 11/8 0.18 3.75 12/22 3.88 1.00 19/19 0.30 BMFAP1 ∗B 51.9 gi|50726968 2.65 10/11 0.74 4.15 38/11 0.87 5.00 70/14 1.24 BRED ∗B 65.6 gi|10835234 5.51 11/11 0.15 5.92 23/20 1.82 10.75 86/8 0.09 BhSmu-1 ∗B 57.5 gi|8922679 6.12 9/8 4.78 4.83 44/4 1.18 7.47 127/17 14.45 BRBM42 50.3 gi|21359951 12.35 2/— —/— 2.00 2/1 BTHRAP3 ∗A 108.6 gi|4827040 10.21 5/11 9.39 1.62 30/4 0.60 3.58 68/19 0.17 BUBL5 8.5 gi|13236510 —/— 13.56 1/2 4.92 OSB 12/— BHsKin17 45.2 gi|13124883 1.33 7/5 0.10 3.04 6/8 0.08 21.00 21/1 BNpw38BP 70.0 gi|7706501 3.53 2/2 0.60 8.04 6/17 1.04 24.00 24/1 BNpw38 30.5 gi|74735456 3.55 —/1 7.68 —/3 OSB 6/— BFUSE3 61.7 gi|100816392 6.08 6/3 0.21 3.48 4/17 0.43 3.00 10/1 BPUF60 54.0 gi|109087698 6.45 7/3 0.32 3.30 1/19 1.36 OSB 9/— BRBM5/LUCA15 56.12 gi|62087206 12.27 7/— 5.86 2/2 1.23 OSB 6/5 BSAFB-like 115.4 gi|62244004 8.21 2/1 3.81 4.10 5/— 12.00 12/1 BSFRS12 59.4 gi|28703790 10.08 —/1 4.60 1/6 2.55 BSPF30 26.7 gi|5032113 10.08 —/5 30.16 1/— OSB 5/— B
Step 2 factorshPRP22 ∗C 139.3 gi|4826690 0.12 49/48 0.03 0.21 55/11 0.11 0.05 13/257 0.01 ChPRP18 ∗C 39.9 gi|4506123 0.10 —/1 0.39 1/4 0.01 OSC —/5 ChPRP17 ∗Bact 65.5 gi|7706657 0.26 28/29 0.04 0.32 32/57 0.19 0.34 31/91 0.12 ChPRP16 140.5 gi|17999539 0.48 —/2 0.43 —/12 0.17 1/6 ChSLU7 ∗C 68.4 gi|27477111 0.32 6/14 0.11 0.15 19/38 0.07 OSC —/81 C
C complex proteinsAbstrakt ∗C 69.8 gi|21071032 0.16 25/24 0.05 0.12 48/90 0.06 0.02 3/164 0.01 CGCIP p29 ∗C 28.7 gi|46371998 0.09 11/18 0.09 0.18 11/7 0.00 0.04 2/45 CDDX35 ∗C 78.9 gi|20544129 0.06 13/15 0.01 0.25 28/22 0.11 0.11 7/64 0.05 C
(continued )
Relative quantification of spliceosomal complexes
www.rnajournal.org 409
Cold Spring Harbor Laboratory Press on May 9, 2015 - Published by rnajournal.cshlp.orgDownloaded from
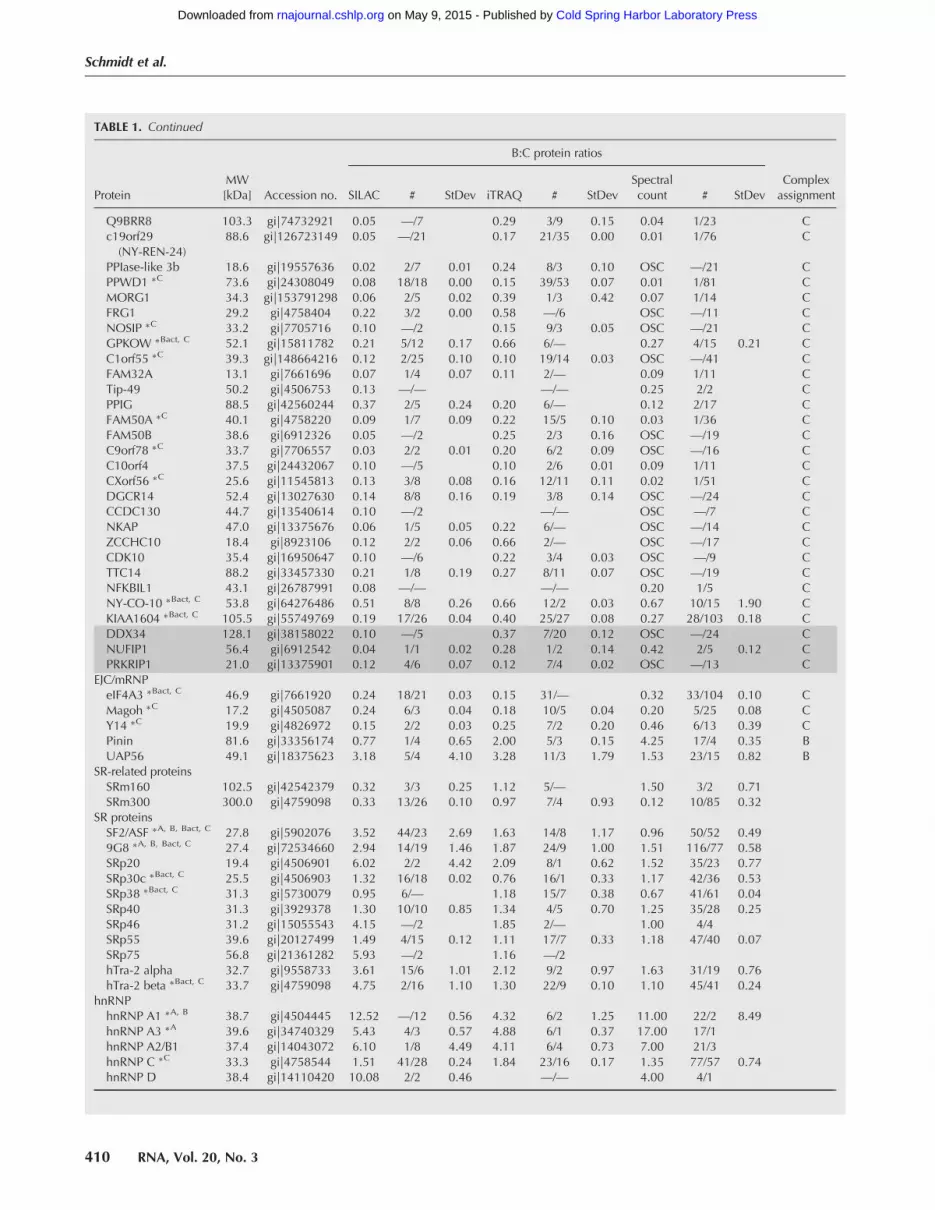
TABLE 1. Continued
ProteinMW[kDa] Accession no.
B:C protein ratios
ComplexassignmentSILAC # StDev iTRAQ # StDev
Spectralcount # StDev
Q9BRR8 103.3 gi|74732921 0.05 —/7 0.29 3/9 0.15 0.04 1/23 Cc19orf29(NY-REN-24)
88.6 gi|126723149 0.05 —/21 0.17 21/35 0.00 0.01 1/76 C
PPIase-like 3b 18.6 gi|19557636 0.02 2/7 0.01 0.24 8/3 0.10 OSC —/21 CPPWD1 ∗C 73.6 gi|24308049 0.08 18/18 0.00 0.15 39/53 0.07 0.01 1/81 CMORG1 34.3 gi|153791298 0.06 2/5 0.02 0.39 1/3 0.42 0.07 1/14 CFRG1 29.2 gi|4758404 0.22 3/2 0.00 0.58 —/6 OSC —/11 CNOSIP ∗C 33.2 gi|7705716 0.10 —/2 0.15 9/3 0.05 OSC —/21 CGPKOW ∗Bact, C 52.1 gi|15811782 0.21 5/12 0.17 0.66 6/— 0.27 4/15 0.21 CC1orf55 ∗C 39.3 gi|148664216 0.12 2/25 0.10 0.10 19/14 0.03 OSC —/41 CFAM32A 13.1 gi|7661696 0.07 1/4 0.07 0.11 2/— 0.09 1/11 CTip-49 50.2 gi|4506753 0.13 —/— —/— 0.25 2/2 CPPIG 88.5 gi|42560244 0.37 2/5 0.24 0.20 6/— 0.12 2/17 CFAM50A ∗C 40.1 gi|4758220 0.09 1/7 0.09 0.22 15/5 0.10 0.03 1/36 CFAM50B 38.6 gi|6912326 0.05 —/2 0.25 2/3 0.16 OSC —/19 CC9orf78 ∗C 33.7 gi|7706557 0.03 2/2 0.01 0.20 6/2 0.09 OSC —/16 CC10orf4 37.5 gi|24432067 0.10 —/5 0.10 2/6 0.01 0.09 1/11 CCXorf56 ∗C 25.6 gi|11545813 0.13 3/8 0.08 0.16 12/11 0.11 0.02 1/51 CDGCR14 52.4 gi|13027630 0.14 8/8 0.16 0.19 3/8 0.14 OSC —/24 CCCDC130 44.7 gi|13540614 0.10 —/2 —/— OSC —/7 CNKAP 47.0 gi|13375676 0.06 1/5 0.05 0.22 6/— OSC —/14 CZCCHC10 18.4 gi|8923106 0.12 2/2 0.06 0.66 2/— OSC —/17 CCDK10 35.4 gi|16950647 0.10 —/6 0.22 3/4 0.03 OSC —/9 CTTC14 88.2 gi|33457330 0.21 1/8 0.19 0.27 8/11 0.07 OSC —/19 CNFKBIL1 43.1 gi|26787991 0.08 —/— —/— 0.20 1/5 CNY-CO-10 ∗Bact, C 53.8 gi|64276486 0.51 8/8 0.26 0.66 12/2 0.03 0.67 10/15 1.90 CKIAA1604 ∗Bact, C 105.5 gi|55749769 0.19 17/26 0.04 0.40 25/27 0.08 0.27 28/103 0.18 CDDX34 128.1 gi|38158022 0.10 —/5 0.37 7/20 0.12 OSC —/24 CNUFIP1 56.4 gi|6912542 0.04 1/1 0.02 0.28 1/2 0.14 0.42 2/5 0.12 CPRKRIP1 21.0 gi|13375901 0.12 4/6 0.07 0.12 7/4 0.02 OSC —/13 C
EJC/mRNPeIF4A3 ∗Bact, C 46.9 gi|7661920 0.24 18/21 0.03 0.15 31/— 0.32 33/104 0.10 CMagoh ∗C 17.2 gi|4505087 0.24 6/3 0.04 0.18 10/5 0.04 0.20 5/25 0.08 CY14 ∗C 19.9 gi|4826972 0.15 2/2 0.03 0.25 7/2 0.20 0.46 6/13 0.39 CPinin 81.6 gi|33356174 0.77 1/4 0.65 2.00 5/3 0.15 4.25 17/4 0.35 BUAP56 49.1 gi|18375623 3.18 5/4 4.10 3.28 11/3 1.79 1.53 23/15 0.82 B
SR-related proteinsSRm160 102.5 gi|42542379 0.32 3/3 0.25 1.12 5/— 1.50 3/2 0.71SRm300 300.0 gi|4759098 0.33 13/26 0.10 0.97 7/4 0.93 0.12 10/85 0.32
SR proteinsSF2/ASF ∗A, B, Bact, C 27.8 gi|5902076 3.52 44/23 2.69 1.63 14/8 1.17 0.96 50/52 0.499G8 ∗A, B, Bact, C 27.4 gi|72534660 2.94 14/19 1.46 1.87 24/9 1.00 1.51 116/77 0.58SRp20 19.4 gi|4506901 6.02 2/2 4.42 2.09 8/1 0.62 1.52 35/23 0.77SRp30c ∗Bact, C 25.5 gi|4506903 1.32 16/18 0.02 0.76 16/1 0.33 1.17 42/36 0.53SRp38 ∗Bact, C 31.3 gi|5730079 0.95 6/— 1.18 15/7 0.38 0.67 41/61 0.04SRp40 31.3 gi|3929378 1.30 10/10 0.85 1.34 4/5 0.70 1.25 35/28 0.25SRp46 31.2 gi|15055543 4.15 —/2 1.85 2/— 1.00 4/4SRp55 39.6 gi|20127499 1.49 4/15 0.12 1.11 17/7 0.33 1.18 47/40 0.07SRp75 56.8 gi|21361282 5.93 —/2 1.16 —/2hTra-2 alpha 32.7 gi|9558733 3.61 15/6 1.01 2.12 9/2 0.97 1.63 31/19 0.76hTra-2 beta ∗Bact, C 33.7 gi|4759098 4.75 2/16 1.10 1.30 22/9 0.10 1.10 45/41 0.24
hnRNPhnRNP A1 ∗A, B 38.7 gi|4504445 12.52 —/12 0.56 4.32 6/2 1.25 11.00 22/2 8.49hnRNP A3 ∗A 39.6 gi|34740329 5.43 4/3 0.57 4.88 6/1 0.37 17.00 17/1hnRNP A2/B1 37.4 gi|14043072 6.10 1/8 4.49 4.11 6/4 0.73 7.00 21/3hnRNP C ∗C 33.3 gi|4758544 1.51 41/28 0.24 1.84 23/16 0.17 1.35 77/57 0.74hnRNP D 38.4 gi|14110420 10.08 2/2 0.46 —/— 4.00 4/1
(continued )
Schmidt et al.
410 RNA, Vol. 20, No. 3
Cold Spring Harbor Laboratory Press on May 9, 2015 - Published by rnajournal.cshlp.orgDownloaded from

in their overall protein abundance, as shown by LC-MS/MSanalyses of peptides obtained from equivalent concentrationsof the “light” or “heavy” NE proteins hydrolyzed in gel(Nikolov et al. 2011).In order to ensure that spliceosomal complexes isolated
from “light” and “heavy” NEs do not exhibit differences intheir activity, we monitored the splicing kinetics (Fig. 2A)and spliceosomal complex formation (Fig. 2B) in “light”and “heavy” SILAC NEs, as well as the RNA compositionsof the purified B and C complexes (Fig. 2C). The analyses re-vealed that catalytically active spliceosomes form in exactlythe same manner from “light” and “heavy” SILAC NEs,with no significant quantitative differences in the overall pro-tein composition or functional pre-mRNA splicing activities(Fig. 2). We then isolated spliceosomal B complexes from“light” SILAC NEs and C complexes from “heavy” SILACNEs (Fig. 1A), as described elsewhere (Bessonov et al. 2008).Proteins from the B and C complex mixtures were then sepa-rated by 1D SDS-PAGE and analyzed. We identified andquantified 266 proteins (see Supplemental Fig. 1); this includ-ed all of the previously published spliceosomal proteins fromthe B and C complexes, with the exception of the G10, UBL5,RACK1, TOE1, RBM7, THOC3, and SC35 proteins (Supple-mental Table 2). Additionally, we identified and quantified 91proteins that in previous studies had not been found to becomponents of the spliceosome and that in most cases repre-sent contaminating proteins commonly detected in large-scale proteomic studies (Supplemental Table 3).
Chemical labeling of spliceosomal proteinswith iTRAQ reagents
We also applied chemical labeling with stable isotopes on pu-rified spliceosomal B and C complexes using iTRAQ reagents(Ross et al. 2004). Chemical labeling is widely accepted as aquantitative MS-based method to analyze proteins derivedfrom different samples. iTRAQ labeling of peptides from pu-rified spliceosomal B and C complexes was performed with amethod most recently established after gel separation of pro-teins as described previously (Schmidt and Urlaub 2009;Schmidt et al. 2013). Extracted peptides from the B complexwere labeled with iTRAQ-115 and from the C complex withiTRAQ-116. Our iTRAQ analysis allowed us to quantifyalmost all previously published spliceosomal proteins fromB and C complex preparations (Bessonov et al. 2008), ex-cept for the proteins U1-C, RACK1, Tip-49, CCDC130,NFKBIL1, THOC3, DBPA, RBM42, and SC35 (Supplemen-tal Table 4). Similarly to the SILAC results, we found a total of265 proteins; among these were 87 proteins that had not beenlisted in the previous analysis by counting peptides; thesemainly represented commonly encountered contaminants(Supplemental Table 5).
Proteome analysis: spectral count
Previous analyses of protein components of spliceosomalcomplexes used the numbers of sequenced peptides in each
TABLE 1. Continued
ProteinMW[kDa] Accession no.
B:C protein ratios
ComplexassignmentSILAC # StDev iTRAQ # StDev
Spectralcount # StDev
hnRNP F 45.7 gi|148470406 3.85 —/2 2.94 —/1 0.75 3/4hnRNP G 47.4 gi|56699409 3.52 19/11 0.32 1.87 32/6 0.49 1.29 49/38 1.51hnRNP H1 49.1 gi|5031753 2.64 3/6 0.01 1.56 4/13 0.40 1.25 5/4hnRNP K 51.0 gi|14165435 12.05 13/— 1/2 0.74 OSB 24/—hnRNP M 77.5 gi|14141152 3.56 8/1 1.04 3.49 8/4 0.04 3.00 39/13 5.36
hnRNP Q 69.6 gi|15809590 2.49 3/— 1.34 —/— 1.89 17/9 0.24hnRNP R 70.9 gi|5031755 1.05 12/4 0.25 0.98 8/1 0.15 1.44 23/16 0.88hnRNP U ∗A 90.6 gi|14141161 11.24 2/2 2.24 3.86 10/— 2.00 8/4 0.71PCBP1 ∗A 37.5 gi|5453854 5.42 11/2 0.14 4.84 5/10 0.26PCBP2 38.1 gi|14141166 4.47 12/2 1.37 3.15 4/16 0.80 2.74 52/19 1.54RALY 32.5 gi|8051631 1.25 —/8 1.64 4/3 1.19 0.56 10/18 0.47
The average B:C protein ratio of two biological replicates after SILAC, iTRAQ, or spectral count quantification is shown. For SILAC and iTRAQquantification, the number of peptide ratios (#) used for quantification is given for both biological replicates (1st replicate/2nd replicate). Forspectral count, the sum of spectra from both biological replicates for B and C complexes is given (sum spectra B/sum spectra C). For all quan-tification methods, the standard deviation between the two biological replicates is provided. Note that if no spectra were acquired in one ofthe complexes, no standard deviation can be calculated for spectral count analysis. The proteins were classified as specific to complex B or tocomplex C, or as part of the spliceosomal core. Proteins that lacked an assignment could not be quantified by the respective approach.Proteins quantified by only one approach are not shown. For proteins identified solely in the B or C complex (OSB, only spectra B complex;OSC, only spectra C complex), no B:C protein ratio could be calculated by spectral count. The proteins are assigned according to the methodof Bessonov et al. (2008) and have been regrouped on the basis of our quantification results. Proteins labeled with an asterisk are inferred tobe major components of the human spliceosome and to be abundant in complexes A, B, C, or Bact according to Agafonov et al. (2011).Proteins highlighted in gray were added to the list of spliceosomal B and C complex proteins according to results from this study. Protein ac-cession numbers were observed from NCBInr database.
Relative quantification of spliceosomal complexes
www.rnajournal.org 411
Cold Spring Harbor Laboratory Press on May 9, 2015 - Published by rnajournal.cshlp.orgDownloaded from
sample to estimate the quantities of the proteins in their re-spective complexes (Deckert et al. 2006; Behzadnia et al.2007; Bessonov et al. 2008, 2010; Fabrizio et al. 2009;Herold et al. 2009; Agafonov et al. 2011). As in these studiesspliceosomal complexes were purified to the highest stan-dards in biochemical terms (i.e., kinetic splicing assays,density gradient centrifugation to obtain homogenous popu-lations), the number of peptides sequenced in the subsequentMS analysis was considered to be a valid approach for the es-timation of amounts of proteins in various complexes.Nonetheless, a certain ambiguity remained in these studies,namely, whether the peptide numbers and the respectivecomparison with numbers obtained from other complexesmeet the requirements of quantitative protein analysis. Aswehave nowobtained quantitative values for the proteins pre-sent in the spliceosomal B and C complex, we set out to com-pare these values with MS data obtained from a previous dataset (Bessonov et al. 2008). Instead of peptide count, we used
the spectral count from the same data set of Bessonov et al.(2008) with the software Scaffold 2 (Supplemental Table 5).The ratios of the spectra or peptides of B-complex proteinsto C-complex proteins are listed in Supplemental Table 6(note that ratios could not be assigned to the proteins thatwere exclusively present in either the B or the C complex;these were labeled as “OSB” [only spectra B complex] or“OSC” [only spectra C complex]). This comparison revealedthat assigning a protein abundance on the basis of peptidecounting gives results consistent with those of spectral count-ing, with differences observed for only a few proteins (such asRACK1 andPinin) (Supplemental Table 6).Moreover, we ob-served, when compared with the values obtained from the la-beling experiments, good agreement in the quantification ofthe various proteins in the different complexes, so that itcan be concluded—with a few exceptions that are discussedbelow—that spectral count (or even peptide count) is an ap-propriate method to quantify proteins in various spliceoso-mal complexes.
Validation of the quantification results
The investigated spliceosomal B and C complexes provide anideal system for validation of the obtained quantitative re-sults. The expected theoretical B:C protein ratio for thecap-binding proteins (which interact with the 5′ cap structureof the pre-mRNA) is 1:1; for the Sm proteins (which are coresubunits for all of the U snRNPs except U6), 2:1 (since the Ccomplex contains the U2 and U5 but lacks the U1 and U4).Indeed, we observe a 1:1 ratio for the CBP20 and CBP80cap-binding proteins in the B:C complexes by all threemethods (SILAC, iTRAQ, and label-free spectral count),with the exception of the spectral count for CPB20, whichgave a ratio of 0.67 (Supplemental Tables 2, 4, 6). For theB:C protein ratios for the Sm proteins, both iTRAQ andSILAC yielded an average protein ratio of 1.75, which is closeto the expected value of 2 (Fig. 3A). However, spectral countgave the expected value only for the SmF and SmG proteinsand showed clearly lower ratios for the other Sm proteins(Fig. 3A). Overall, the quantification of these proteins pro-vided an internal validation of the different quantificationmethods.
A stable “core” of U snRNP-specific proteins
The snRNAs of U2 and the U5 snRNPs remain stably associ-ated with the B and C complexes; however, only a subset ofthe U2- and U5-specific proteins appears in equal amountswithin the two complexes (Fig. 3B,C). SILAC, iTRAQ, andspectral count showed that the U2-A′ and U2-B′′ proteinshad B:C ratios of approximately 1, whereas the U2 snRNP-as-sociated splicing factors SF3a and SF3b were more abundantin the B complex (Table 1; Fig. 3B). Likewise, only four of theeight U5 snRNP proteins were found to be present in a 1:1ratio between the two complexes (220K, 200K, 116K, and
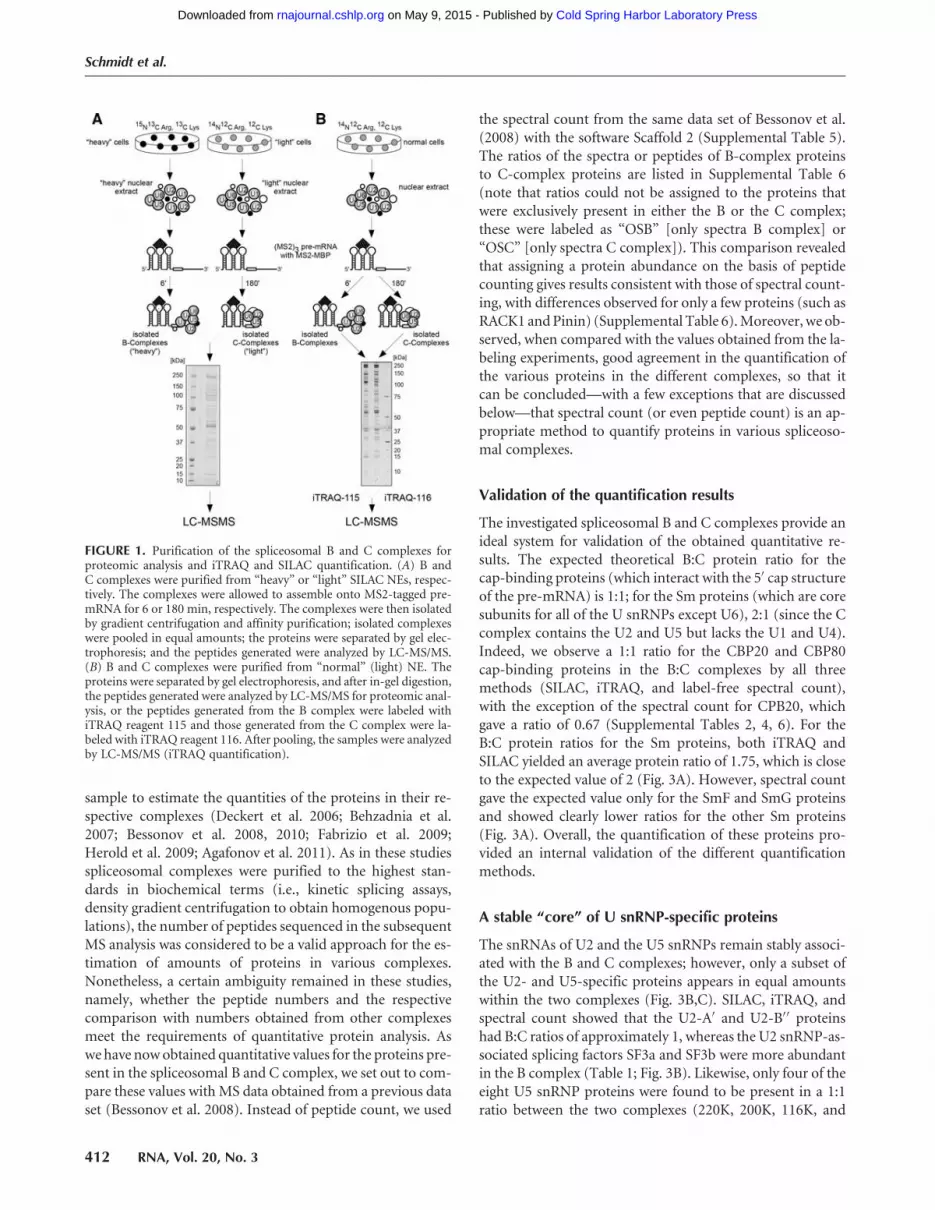
FIGURE 1. Purification of the spliceosomal B and C complexes forproteomic analysis and iTRAQ and SILAC quantification. (A) B andC complexes were purified from “heavy” or “light” SILAC NEs, respec-tively. The complexes were allowed to assemble onto MS2-tagged pre-mRNA for 6 or 180 min, respectively. The complexes were then isolatedby gradient centrifugation and affinity purification; isolated complexeswere pooled in equal amounts; the proteins were separated by gel elec-trophoresis; and the peptides generated were analyzed by LC-MS/MS.(B) B and C complexes were purified from “normal” (light) NE. Theproteins were separated by gel electrophoresis, and after in-gel digestion,the peptides generated were analyzed by LC-MS/MS for proteomic anal-ysis, or the peptides generated from the B complex were labeled withiTRAQ reagent 115 and those generated from the C complex were la-beled with iTRAQ reagent 116. After pooling, the samples were analyzedby LC-MS/MS (iTRAQ quantification).
Schmidt et al.
412 RNA, Vol. 20, No. 3
Cold Spring Harbor Laboratory Press on May 9, 2015 - Published by rnajournal.cshlp.orgDownloaded from

40K) (Fig. 3C); we therefore consider the proteins U2A′,U2B′′, U5-220K, 200K, 116K, and 40K together with theSm proteins of U2 and U5 snRNPs, which are also stably as-sociated with both complexes (see above, Fig. 3A), to be thespliceosomal “core” proteins in the B and C complexes.
Specific proteins of the B and C complexes
Once we had validated our quantification results as describedabove, we next used the quantitative values of the proteinabundances to investigate the correlation of their associationwith the B and C complexes. To do this, we consider proteinsthat show a B:C value above 2.0 for at least two of thethree methods to be specifically associated with the B com-plex and those showing a value below 0.5 for at least two ofthe three methods to be specifically associated with the Ccomplex. We also take the previous ordering and groupingof proteins into account (Bessonov et al. 2008, 2010; Agafo-
nov et al. 2011). Of note, to draw conclu-sion from the absolute number of thevalues, that means, whether, for example,an extremely high or low value (e.g., U1-A, 25.95 [SILAC]; PPIase-like 3b, 0.02[SILAC]) compared with a moderate val-ue (e.g., hPrp19, 0.36 [SILAC]; MFAP,2.65 [SILAC]) reflects the complete pres-ence or absence in B or C complex, re-spectively, cannot be unambiguouslyaddressed.
Proteins predominantly associated withspliceosomal B complexes
During the transition from the B to the Ccomplex, the U1 and U4 snRNPs withtheir associated proteins are destabilizedand dissociate; this is clearly reflectedby the high B:C ratios observed for theseproteins (Table 1; Fig. 4A,B). The U4/U6 snRNP-specific proteins showed veryhigh B:C ratios (average B:C 10.54), as de-termined by all three approaches (Fig.4B), showing that they, together withthe U4 snRNA, also dissociate from thespliceosome during the transition fromthe B to the C complex. All threemethodsrevealed high B:C ratios (>3) for the U6snRNP LSm proteins, showing that, al-though theU6 snRNA remains associatedwith theC complex, the LSmproteins dis-sociate fromU6 during the B-to-C transi-tion (Table 1; Fig. 4C). Contrary to theU2A′ and U2-B′′ proteins (see above),the U2 snRNP-specific SF3a and SF3bsplicing factors were found to be moreabundant in the B complex (Fig. 3B)
and thus, however, do not seem to belong in the category ofU snRNP “core” proteins of the B and C spliceosomes.Likewise, U5 snRNP-specific proteins 15K, 52K, 100K, and102K show high B:C ratios as obtained by all three methodsand thus represent B-specific proteins (Fig. 3C). In addition,all proteins specific to the tri-snRNP (U4/U6.U5) showedhigh B:C ratios (Fig. 4B; Table 1); this is consistent with pre-vious studies that have shown dissociation of some tri-snRNP–specific proteins from the spliceosome during its ac-tivation (Makarov et al. 2002).For several non-snRNP proteins high B:C ratios were ob-
served, showing that they are more abundant in B-complexpreparations. Some examples are RED (average B:C 7.39), h-Smu-1 (average B:C 6.12), and UBL5 (B:C 13.56 [iTRAQ]).By using our quantification methods, we classify these pro-teins as specific for the B complex (hPrp38, hSnu23,TFIP11, MFAP1, RED, hSmu-1, RBM42, TRAP3, UBL5,HsKin17, Npw38, Npw38BP) (Table 1; Fig. 5A). In addition
FIGURE 2. Metabolically labeled NEs retained full catalytic activity, as shown by analyzing the Band C complexes purified from “heavy” or “light” SILAC NEs, respectively. (A) The splicing ki-netics were determined from aliquots of splicing reactions taken from 0–180 min and analyzed bydenaturing gel electrophoresis. Pre-mRNA and splicing products were visualized by autoradiog-raphy. Splicing products first appeared after 10min. (B) The spliceosomal complex formation wasassayed by native agarose gel electrophoresis and visualized by autoradiography. The A and Bcomplexes were first observed after 2 and 4 min, respectively, while the C complex first appearedafter 10–15 min. (C) The RNA compositions of purified B (“light” SILAC NE) and C (“heavy”SILAC NEs) complexes were analyzed by denaturing gel electrophoresis and visualized by silverstaining (lanes 1,3) or autoradiography (lanes 2,4). B complexes contained U1, U2, U4, U5, andU6 snRNA (lane 1) and a large amount of pre-mRNA (lane 2). C complexes contained U2, U5,and U6 snRNA (lane 3) and splicing products and reduced amounts of pre-mRNA (lane 4).
Relative quantification of spliceosomal complexes
www.rnajournal.org 413
Cold Spring Harbor Laboratory Press on May 9, 2015 - Published by rnajournal.cshlp.orgDownloaded from

to these proteins, we thus extend the list of B-specific proteinsby six proteins (FUSE3, PUF60, RBM5/LUCA15, SAFB-like,SFRS12, and SPF30) (Table 1), which were not present inthe protein lists of previous studies (Bessonov et al. 2008;Agafonov et al. 2011).
Proteins predominantly associated with C complexes
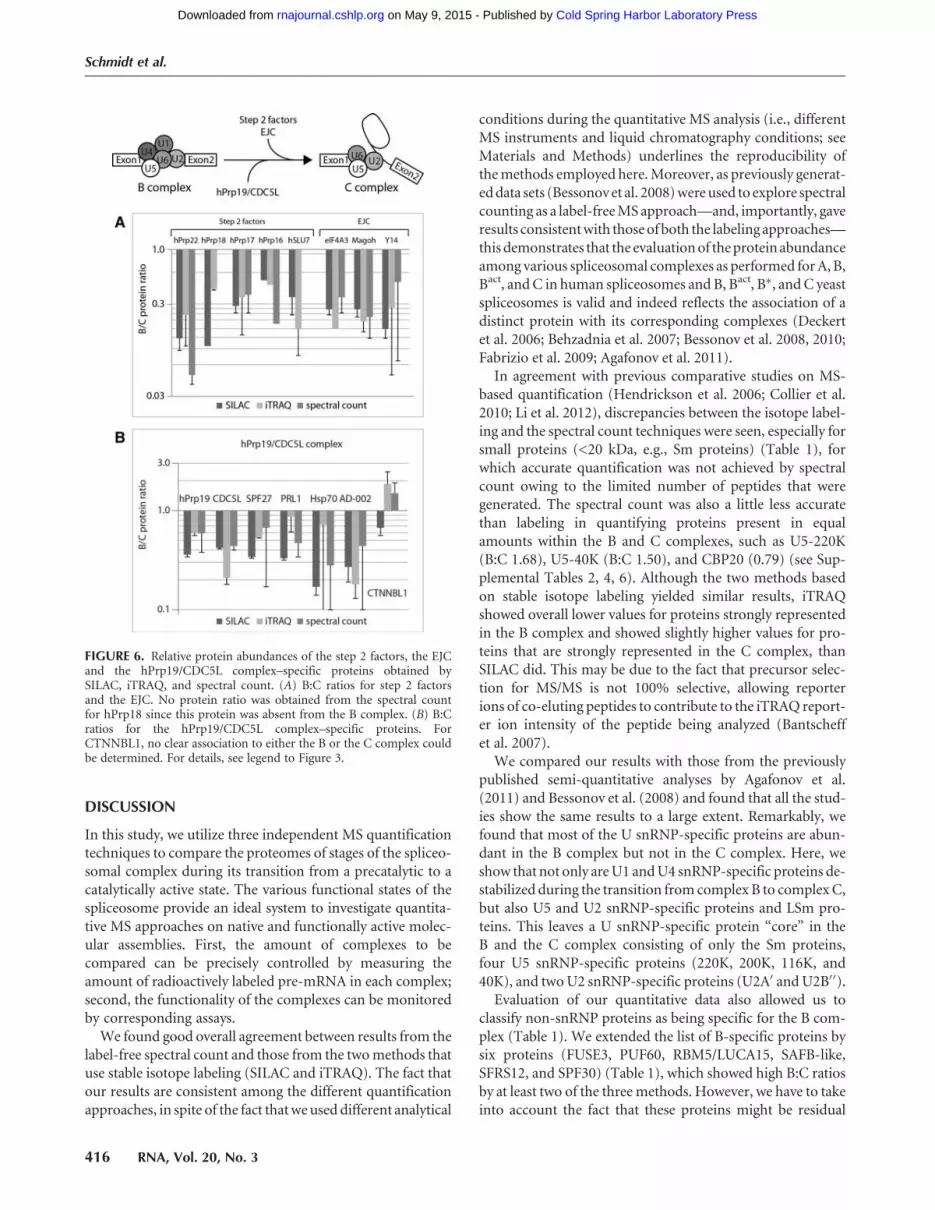
The so-called step 2 splicing factors are required for the sec-ond step of pre-mRNA splicing, which occurs in the C com-plex (for review, see Umen and Guthrie 1995; Smith et al.2008), and accordingly, those proteins should be more abun-dant in this complex. Indeed, all of these proteins (hPrp17,
FIGURE 3. Relative protein abundances of the Sm proteins and the U2and U5 snRNP-specific proteins obtained by spectral count, SILAC, andiTRAQ. The B:C ratios are shown for the Sm proteins (A), the U2snRNP-specific proteins (B), and the U5 snRNP specific proteins (C).Ratios of proteins in B versus C complex are plotted on a logarithmicscale; error bars, SD between the two biological replicates. “1” indicatesthat a protein is present in these complexes in a 1:1 ratio. The differentshading of the bars represents the ratios of proteins in B and C complex-es derived from the values obtained by SILAC, iTRAQ, and spectralcount, respectively (see Table 1; Supplemental Tables). FIGURE 4. Relative protein abundances in the B and C complexes for
the U1, U4/U6, and U4/U6.U5 snRNP-specific proteins and the LSmproteins, as obtained by SILAC, iTRAQ, and spectral count. (A) B:C ra-tios for U1 snRNP-specific proteins. No protein ratios were obtained forU1-C from the spectral count since this protein was completely absentfrom the C complex. (B) B:C ratios for the U4/U6- and U4/U6.U5-spe-cific proteins. (C) B:C ratios for the LSm proteins. No protein ratio wasobtained from the spectral count for LSm4 since this protein was absentfrom the C complex. LSm5 was not identified or quantified. For details,see legend to Figure 3.
Schmidt et al.
414 RNA, Vol. 20, No. 3
Cold Spring Harbor Laboratory Press on May 9, 2015 - Published by rnajournal.cshlp.orgDownloaded from

hPrp18, hPrp22, hPrp16, and hSlu7) had B:C ratios between0.1 and 0.5 in iTRAQ and SILAC and close to 0 by spectralcount, showing that they were clearly associated with the cat-alytically active spliceosomal C complex (Fig. 6A; Table 1).Additional proteins have previously been classified as
“proteins recruited to the C complex” and “potential C com-plex–specific proteins” (Bessonov et al. 2008). All of theseproteins revealed low B:C ratios by all three quantificationmethods (Table 1; Fig. 5B; Supplemental Tables 2, 4, 6).On the basis of these quantification results, we extended
the list of C-specific proteins by three proteins (DDX34,NUFIP1, and PRKRIP1) (Table 1), all of which showedhigh abundance in the C complex, with B:C ratios between0.04 and 0.37. The DDX34 protein, which was not previouslyidentified within any spliceosomal complex, was clearly iden-tified as being more strongly represented in the C complex byboth iTRAQ and SILAC. Spectral-count analysis identifiedthis protein solely in the C complex but not in the B complex.
The hPrp19/CDC5L complex
The hPrp19/CDC5L (NTC in yeast, Chan et al. 2003) complexis essential for pre-mRNA splicing and associates with thespliceosome before the first catalytic step of splicing (Ajuh
et al. 2000). Together with U5 snRNP, itforms the remodeled 35S U5 complex inhumans (Makarov et al. 2002), and recentstudies in yeast found it in the 35S ILSintron-lariat spliceosome (Fourmannet al. 2013). Here, we found that all ofthese proteins (hPrp19, CDC5L, SPF27,PRL1, Hsp70, AD-002)—with the excep-tion of CTNNBL1, which showed an av-erage B:C ratio of 1.34 (Table 1)—wereclearly more abundant in the C complexthan the B complex (Table 1; Fig. 6B).The Npw38 and Npw38BP proteinswere previously found to comigrate atthe top of the gradient during hPrp19/CDC5L complex purification, suggestingthat they were co-isolated and/or not sta-bly associated with the hPrp19/CDC5Lcomplex (Makarova et al. 2004). Thesetwo proteins were found here to be highlyabundant in the B complex comparedwith the C complex (Table 1; Fig. 5A),demonstrating their predominant associ-ation with the B but not with C complex.
The RES complex
The RES (retention and splicing) com-plex consists of SNIP1, MGC12135, andCGI-79. It binds to the spliceosome be-fore the first step of splicing and is re-quired for efficient intron removal and
nuclear pre-mRNA retention (Dziembowski et al. 2004).We found by all three quantification methods that thehRES proteins associate with both the B and C complexes,showing a 1:1 B:C ratio (Table 1). Indeed, this is the onlynon-snRNP protein complex among the quantified non-snRNP splicing factors that remains constantly associatedin the B and C complex.
The exon junction complex
The exon junction complex (EJC) protein complex bindsspliced mRNAs in a sequence-independent manner close tosite of exon–exon ligation. It is a highly dynamic complexwith stably and more weakly associated protein components(Le Hir et al. 2000; Lau et al. 2003; Merz et al. 2007; Singhet al. 2012). We found that the EJC did not show the sameB:C ratios for all its proteins. Only for three proteins(eIF4A3, Magoh, and Y14), we observed low B:C ratios(∼0.25) (Table 1; Fig. 6A), showing that they are much moreabundant in the C complex, while proteins UAP56 andPinin are much more abundant in the B complex (B:C ratiosof ∼2.5) (Table 1). Other proteins previously assigned to theEJC showed fluctuating protein ratios (Supplemental Table1), which did not allow us to classify them unambiguously.
FIGURE 5. Relative protein abundances of the B- and C- specific proteins. (A) B:C ratios for B-specific proteins. (B) B:C ratios for C-specific proteins. For several proteins, no values for spectralcount were obtained as these proteins had spectra only in the B (hSnu23, UBL5, Npw38, SPF30)or the C (PPIL3b, FRG1, NOSIP, C1orf55, FAM50B, C9orf78, DGCR14, CCDC130, NKAP,ZCCHC10, CDK10, TTC14, DDX34, PRKRIP1) complex. For details, see legend to Figure 3.
Relative quantification of spliceosomal complexes
www.rnajournal.org 415
Cold Spring Harbor Laboratory Press on May 9, 2015 - Published by rnajournal.cshlp.orgDownloaded from
DISCUSSION
In this study, we utilize three independent MS quantificationtechniques to compare the proteomes of stages of the spliceo-somal complex during its transition from a precatalytic to acatalytically active state. The various functional states of thespliceosome provide an ideal system to investigate quantita-tive MS approaches on native and functionally active molec-ular assemblies. First, the amount of complexes to becompared can be precisely controlled by measuring theamount of radioactively labeled pre-mRNA in each complex;second, the functionality of the complexes can be monitoredby corresponding assays.
We found good overall agreement between results from thelabel-free spectral count and those from the twomethods thatuse stable isotope labeling (SILAC and iTRAQ). The fact thatour results are consistent among the different quantificationapproaches, in spite of the fact thatweused different analytical
conditions during the quantitative MS analysis (i.e., differentMS instruments and liquid chromatography conditions; seeMaterials and Methods) underlines the reproducibility ofthemethods employed here.Moreover, as previously generat-eddata sets (Bessonovet al. 2008)wereused to explore spectralcounting as a label-freeMS approach—and, importantly, gaveresults consistentwith thoseof both the labeling approaches—this demonstrates that the evaluationof theproteinabundanceamong various spliceosomal complexes as performed forA, B,Bact, and C in human spliceosomes and B, Bact, B∗, and C yeastspliceosomes is valid and indeed reflects the association of adistinct protein with its corresponding complexes (Deckertet al. 2006; Behzadnia et al. 2007; Bessonov et al. 2008, 2010;Fabrizio et al. 2009; Agafonov et al. 2011).In agreement with previous comparative studies on MS-
based quantification (Hendrickson et al. 2006; Collier et al.2010; Li et al. 2012), discrepancies between the isotope label-ing and the spectral count techniques were seen, especially forsmall proteins (<20 kDa, e.g., Sm proteins) (Table 1), forwhich accurate quantification was not achieved by spectralcount owing to the limited number of peptides that weregenerated. The spectral count was also a little less accuratethan labeling in quantifying proteins present in equalamounts within the B and C complexes, such as U5-220K(B:C 1.68), U5-40K (B:C 1.50), and CBP20 (0.79) (see Sup-plemental Tables 2, 4, 6). Although the two methods basedon stable isotope labeling yielded similar results, iTRAQshowed overall lower values for proteins strongly representedin the B complex and showed slightly higher values for pro-teins that are strongly represented in the C complex, thanSILAC did. This may be due to the fact that precursor selec-tion for MS/MS is not 100% selective, allowing reporterions of co-eluting peptides to contribute to the iTRAQ report-er ion intensity of the peptide being analyzed (Bantscheffet al. 2007).We compared our results with those from the previously
published semi-quantitative analyses by Agafonov et al.(2011) and Bessonov et al. (2008) and found that all the stud-ies show the same results to a large extent. Remarkably, wefound that most of the U snRNP-specific proteins are abun-dant in the B complex but not in the C complex. Here, weshow that not only areU1 andU4 snRNP-specific proteins de-stabilized during the transition fromcomplex B to complexC,but also U5 and U2 snRNP-specific proteins and LSm pro-teins. This leaves a U snRNP-specific protein “core” in theB and the C complex consisting of only the Sm proteins,four U5 snRNP-specific proteins (220K, 200K, 116K, and40K), and twoU2 snRNP-specific proteins (U2A′ and U2B′′).Evaluation of our quantitative data also allowed us to
classify non-snRNP proteins as being specific for the B com-plex (Table 1). We extended the list of B-specific proteins bysix proteins (FUSE3, PUF60, RBM5/LUCA15, SAFB-like,SFRS12, and SPF30) (Table 1), which showed high B:C ratiosby at least two of the three methods. However, we have to takeinto account the fact that these proteins might be residual
FIGURE 6. Relative protein abundances of the step 2 factors, the EJCand the hPrp19/CDC5L complex–specific proteins obtained bySILAC, iTRAQ, and spectral count. (A) B:C ratios for step 2 factorsand the EJC. No protein ratio was obtained from the spectral countfor hPrp18 since this protein was absent from the B complex. (B) B:Cratios for the hPrp19/CDC5L complex–specific proteins. ForCTNNBL1, no clear association to either the B or the C complex couldbe determined. For details, see legend to Figure 3.
Schmidt et al.
416 RNA, Vol. 20, No. 3
Cold Spring Harbor Laboratory Press on May 9, 2015 - Published by rnajournal.cshlp.orgDownloaded from

proteins belonging to the A complex, which was not includedin our study. They might associate with the spliceosome at avery early point during pre-mRNA splicing and dissociateduring formation of the catalytically active C complex. Oneexample of this is the protein THRAP3, which is classifiedas B-specific by our results but was found to be specificallyassociated with the A complex by Agafonov et al. (2011).Along the same lines, we cannot make a clear statement re-garding the hnRNP proteins. Although these are more abun-dant in the B complex, we have no clear evidence as towhether they are B-specific or whether they are residual pro-teins from the H/A complex.More precise conclusions can be drawn for C complex pro-
teins. The hPrp19/CDC5L complex (Ajuh et al. 2000;Makarova et al. 2004) was found to be associated with the Bcomplex but was shown to be more abundant in the Ccomplex; we show here that the quantitative values are ap-proximately twice as great in the C as in the B complex, sug-gesting that this complex interacts loosely with the B complexand then becomesmore stably associated with the C complex.Similarly, Agafonov et al. (2011) found the hPrp19/CDC5Lcomplex to be less abundant in the B complex but highlyabundant in the Bact and C complexes. We did not analyzethe intermediate complex Bact in our study, and the slightlyhigher B:C ratio of the hPrp19/CDC5L proteins might reflectthe association of these proteins during the B-to-C transition.In contrast, the second-step factors (hPrp16, hPrp17, hPrp18,hPrp 22, and hSLU7) clearly show high abundance in the Ccomplex with very low B:C ratios (∼0.25), showing their asso-ciation with the activated C complex only. Only three EJCproteins (eIF4A3, Magoh, and Y14) were also found to beclearly associated with the C complex. Accordingly, we defineother proteins showing very low B:C ratios as “C-specific pro-teins” (Table 1). Some of these proteins have already beenfound to be abundant in the C complex by Agafonov et al.(2011); however, we are now able to extend the number ofC-complex proteins (e.g., c19orf29, FAM32A, c10orf4,DDX34, NUFIP1) (Table 1). Importantly, DDX34 has neverbeen described in the context of spliceosomal complexes.This protein is a probable ATP-dependent RNA helicase (gi|38158022), but its function has not yet been described, eitherin yeast or in humans. DDX34 thus represents a potential tar-get for future studies.Alongside the proteins that were clearly classifiable into B
and C complex proteins, we identified some proteins thatcould not clearly be assigned owing to their inconsistent quan-tification values (Supplemental Table 1). For these proteins,different B:C ratios were obtained by the different quan-tification approaches (e.g., WDR70, SKIV2L2, DDX3)(Supplemental Table 1). There are several possible reasonswhy these proteins do not show a clear quantitative associa-tion. First, they may represent transiently bound proteinsthat easily dissociate from the complexes during purificationand are thus present to different extents in the different com-plexpreparations. Examples are thepre-mRNA/mRNA-bind-
ing proteins (Supplemental Table 1), which showed veryinconsistent quantitative trends and at least two of which(YB-1 and ASR2B) were found to be present in all spliceoso-mal complexes (A, B, Bact, andC) detected in each case at a dif-ferent abundance (Agafonov et al. 2011). Second, theymay becomponents of the Bact complex, the intermediate complex inthe B-to-C transition. We did not quantify the proteome ofthis complex, and the B:C ratios of proteins abundant in theBact complex fluctuate between different preparations andquantification approaches. Indeed, some of these proteinswere found by Agafonov et al. (2011) to be specific for theBact complex, and a recent study inwhich thehumanBact com-plexwas analyzed confirms this assumption, as several of theseproteins were shown to be abundant in the Bact complex only(Bessonov et al. 2010); examples are hPrp2, PPIL2, RNF113A,MGC20398, and MGC23918 (Supplemental Table 1).
CONCLUSIONS
We applied three independent MS-based quantification tech-niques to compare the proteomes of the precatalytic and thecatalytically active spliceosomes (i.e., B and C complexes).Overall, we confirm, but also extend, results from previousstudies that addressed the relative abundances of proteinsin the respective complexes by semi-quantitative approaches.We have found that the label-free spectral count techniqueprovided a suitable method for quantifying highly purifiedsamples (such as the spliceosome or other RNPs). However,it has its limits when quantifying proteins of low molecularweight or small fold changes. This is the first report ofSILAC used to label and subsequently purify a molecular ma-chine that was functionally as active as its nonlabeled coun-terpart (as shown here for the spliceosome in terms ofsplicing efficiency and kinetics). Thus, it may be applicableto monitoring the assembly kinetics of the spliceosome inshort time-frames in order to address the dynamic incorpo-ration and release of proteins in its various functional statesor to gain insight into the changes of protein modificationduring the splicing cycle. Overall, iTRAQ (or a similar ap-proach using isotope-labeled reagents) is easier to apply tothe quantitative investigation of spliceosomal proteins, inparticular as a relatively large amount of NE is required forthe assembly of spliceosomes. Thus, a reliable quantificationtechnique based on chemical labeling with stable isotopeswould be of benefit for in-depth quantitative analyses ofspliceosomes from sources with low quantities.
MATERIALS AND METHODS
Preparation of metabolically labeled “light” and“heavy” NEs
Dulbecco’s modified Eagle medium (DMEM; PAA Laboratories)lacking L-arginine and L-lysine was supplemented with 10% (v/v)dialyzed fetal bovine serum (PAA Laboratories), 1 × penicillin/
Relative quantification of spliceosomal complexes
www.rnajournal.org 417
Cold Spring Harbor Laboratory Press on May 9, 2015 - Published by rnajournal.cshlp.orgDownloaded from
streptomycin, and 50 mg/L of normal (“light”) or stable-isotope-la-beled (“heavy”) L-arginine and L-lysine. HeLa S3 cells were grownin custom-made DMEM containing either “light” or “heavy” L-ar-ginine and L-lysine. Cells were grown for at least six passages at 100mL (∼0.5 ×10⁸ to 1.0 × 10⁸ cells/mL) in 200 mL spinner flasks. Thecells were then expanded to higher volumes and transferred to a 2.5L fermenter. The cells were grown under standard conditions (50mg/L L-arginine and L-lysine) with continuous perfusion of medi-um (0.5–1.0 v/24 h). A total of 1.5 L (5 × 10⁶ cells/mL) of cells washarvested, and NEs were prepared according to the method ofDignam et al. (1983) from “light”- or “heavy”-labeled cells. L-argi-nine and L-lysine, and stable isotope-labeled L-arginine (13C6
15N4;Arg+10) and L-lysine (13C6; Lys+6), were purchased from Sigma-Aldrich.
Generation of aptamer-tagged pre-mRNAand in vitro splicing
MS2-tagged PM5 pre-mRNA was generated as previously described(Deckert et al. 2006; Bessonov et al. 2008). In vitro splicing was per-formed in either “light” or “heavy” HeLa NE, using 32P-labeled,m7G(5′)ppp(5′)G-capped, and MS2-tagged PM5 pre-mRNA.RNA was separated on a 8.0 M urea–10% (v/v) polyacrylamidegel. Spliceosomal complex assembly was analyzed by native gel elec-trophoresis on a 2% (m/v) agarose gel.
Affinity selection of spliceosomal B and C complexes
Spliceosomal B and C complexes for proteomic analysis and SILACand iTRAQ quantification were isolated as previously described(Bessonov et al. 2008). Briefly, 32P-labeled, m7G(5′)ppp(5′)G-capped, and MS2-tagged PM5 pre-mRNA was incubated withMS2-MBP fusion protein. Spliceosomal complexes were allowedto assemble from “light” or “heavy” NEs for 6 min (B complex)or 180 min (C complex). For SILAC quantification, B complexeswere assembled from “heavy” NEs, and C complexes were assem-bled from “light” NEs. Assembled complexes were separated on10%–30% (v/v) glycerol gradients, and 40–45S gradient fractionswere subjected to affinity selection on amylose beads.
Sample preparation and MS for SILAC quantification
Three pmoles of affinity-purified B and C complexes was mixed inequal amounts according to the 32P-labeled pre-mRNA. Proteinswere separated by gel electrophoresis on a 4%–12% Bis-Tris precastgel (NuPAGE, Invitrogen) and stained with colloidal Coomassieblue. The entire gel lane was cut into 25 pieces, and proteins weredigested in-gel as described previously (Shevchenko et al. 1996).Samples were redissolved in 10% (v/v) acetonitrile/0.15% (v/v) for-mic acid (FA) and analyzed on a CAP-LC system coupled to a Q-ToF Ultima mass spectrometer (Waters) or on an Agilent HP1100 series system coupled to a LTQ-Orbitrap XL (Thermo FisherScientific).
Sample preparation and MS for iTRAQ or spectralcount quantification
Four pmoles each of affinity-purified B and C complexes were sep-arated by 8%/14% (v/v) SDS-PAGE, respectively, and stained with
Coomassie blue. Entire gel lanes were cut into 60–70 slices.Proteins were digested in-gel as described previously (Shevchenkoet al. 1996) except that 50 mM triethylammonium bicarbonate buff-er (TEAB, Sigma-Aldrich) instead of ammonium bicarbonate bufferwas used for the iTRAQ preparation. For iTRAQ labeling, the ex-tracted peptides were dissolved in 20 μL 100 mM TEAB buffer.Internal standards were prepared by mixing 5 μL TEAB bufferwith 5 μL aliquots of samples generated from gel slices cut at thesame height from both gel lanes. iTRAQ reagents were reconstitutedat room temperature in 70 μL ethanol per vial. iTRAQ reagent (5 μL)was added to each sample, and samples were incubated at roomtemperature for 1 h with gentle mixing. Internal standards were la-beled with iTRAQ-114, and samples from the B and C complexeswere labeled with iTRAQ-115 and iTRAQ-116, respectively. The re-maining iTRAQ reagent was quenched by adding 5 μL of 50 mMglycine and incubating at room temperature for 30 min with gentlemixing. Samples to be compared, such as those containing the pep-tides generated from B and C complexes, were pooled with their rel-evant internal standards and then dried in a vacuum centrifuge(Schmidt and Urlaub 2009). For the MS analysis, iTRAQ or spectralcount samples were dissolved in 10% (v/v) acetonitrile with 0.15%(v/v) FA and subsequently analyzed on a Waters Q-TOF Ultimacoupled to a Waters CAP-LC system.
LC-coupled ESI MS–MS/MS on a Q-ToF massspectrometer
To analyze samples over the CAP-LC system coupled to the Q-ToFUltima mass spectrometer (Waters), peptides were separated onlineby reversed-phase chromatography using 0.1% (v/v) FA as mobilephase A and 80% (v/v) acetonitrile/0.15% (v/v) FA as mobile phaseB. The peptides were loaded onto a trap column (μ-PrecolumnCartridge, Acclaim PepMap100 C18, 300 μm i.d. × 5 mm, LCPackings) and separated at a flow rate of 200 nL/min on an analyticalcolumn packed in-house (C18, Reprosil, Maisch) with a gradient of7%–40% mobile phase B over 50 min. Eluted peptides were ana-lyzed directly in the Q-ToF mass spectrometer in a data-dependentmanner. MS scans were acquired for 1 sec followed by three MS/MSspectra for 3 sec, each with an ion-mass window set to 2.5 Da. TheMS-to-MS/MS switch was set to 15 counts/sec, and the MS/MS-to-MS was set to an intensity below a threshold of 2 counts/sec. Chargestate recognition was used to estimate the collision energy for the se-lected precursors. Scan time and interscan time were set to 0.9 secand 0.1 sec, respectively. Peak lists were generated from raw databy usingMassLynx v4.0 software with the following settings: smoothwindow 4.00, number of smooth 2, smooth mode Savitzky-Golay,percentage of peak height to calculate centroid spectra at 80%with no baseline subtraction.
LC-coupled ESI MS–MS/MS on a LTQ-Orbitrapmass spectrometer
Samples were analyzed on an HP 1100 series system (Agilent) cou-pled to a hybrid Linear Ion Trap–Orbitrap mass spectrometer(LTQ-Orbitrap XL, Thermo Fisher Scientific). Peptides were sepa-rated by online reversed-phase nanoflow chromatography, using0.1% (v/v) FA as the mobile phase A and 95% (v/v) acetonitrile/0.1% (v/v) FA as the mobile phase B. Peptides were loaded onto atrap column packed in-house (1.5 cm, 360 μm o.d., 150 μm i.d.,
Schmidt et al.
418 RNA, Vol. 20, No. 3
Cold Spring Harbor Laboratory Press on May 9, 2015 - Published by rnajournal.cshlp.orgDownloaded from
ReproSil-Pur C18-AQ, 5 μm, Dr. Maisch) and separated at a flowrate of 300 nL/min on an analytical C18 capillary column (30 cm,360 μm o.d., 75 μm i.d., ReproSil-Pur C18-AQ, 5 μm) with a gradi-ent of 0%–38% mobile phase B over 35 min. Eluted peptides wereanalyzed directly in the mass spectrometer (LTQ-Orbitrap XL;Thermo Fisher Scientific). The LTQ-Orbitrap was operated in adata-dependent mode. Survey full-scan MS spectra were acquiredin the LTQ-Orbitrap (m/z 350–1400) with a resolution of 30 000at m/z 400, and an automatic gain control target of 5 × 10⁵. Thefive most intense ions were selected for CID (collision-induced dis-sociation) MS/MS fragmentation and detection in the linear iontrap, with previously selected ions dynamically excluded for 60sec. Singly charged ions and ions with unrecognized charge stateswere also excluded. Internal calibration of the Orbitrap was per-formed using the lock mass option (lock mass: m/z 445.120025)(Olsen et al. 2005). Mascot generic format (mgf) files were generat-ed from raw data using Mascot Daemon v2.2.2 (Matrix Science).
Data analysis and quantification
Peak lists generated were searched against NCBI nonredundant da-tabase (October 8, 2007; 5539442 sequences), by using Mascotv.2.2.04 as search engine. The mass accuracy filter used was 0.2Da for the parent and fragment ions for the Q-ToF mass spectrom-eter. For the Orbitrap mass spectrometer, this was 5 ppm for precur-sor and 0.5 Da for product ions. Peptides with no or at most twomissed cleavage sites were defined as tryptic peptides. Carbamido-methylation of cysteines and oxidation of methionine residueswere allowed as variable modifications. For SILAC and iTRAQquantification,“heavy”arginine(Arg+10)and“heavy” lysine(Lys+6)and iTRAQ modifications, respectively, were allowed as fixedmodifications.
SILAC quantification
SILAC quantification was carried out by using unique peptides withthe MSQuant software v1.2. Data normalization was performed onproteins known to be present in a 1:1 ratio (e.g., the 5′ pre-mRNAcap-binding proteins CBP20 and CBP80, the U5-220K and U5-200K proteins).
iTRAQ quantification
Non-normalized peptide ratios for iTRAQ quantification were ob-tained from Mascot v2.2.04 for unique peptides with a minimumpeptide score of 20. Proteins were quantified from the main bandsby calculating the mean ratio after manual removal of outliers.Data normalization was performed on proteins known to be presentin a 1:1 ratio, as above. Protein ratios obtained were further validatedby three independent procedures: (1) calculating the labeling effi-ciency for each protein in each band; (2) using the same amountsof nonmodified trypsin (Roche), resulting in a 1:1 ratio for autopro-teolytic trypsin peptides; and (3) analyzing peak intensities of thereporter ions for the internal standards (iTRAQ-114) of low-scor-ing peptides. As the internal standard was prepared by poolingaliquots from iTRAQ-115– and iTRAQ-116–labeled samples thefollowing equation represents the intensity ratios: intensity[iTRAQ-114] =⅓ intensity[iTRAQ-115] +⅓ intensity[iTRAQ-116] whereby [iTRAQ−114] = (5 µL/(20 µL− 5 µL)) [iTRAQ
−115] + (5 µL/(20 µL− 5 µL)) [iTRAQ-116] (see also Schmidtand Urlaub 2009).
Spectral count
Unweighted spectral count for proteins identified in B and C com-plexes was obtained by using the software Scaffold 2. B:C protein ra-tios were calculated manually from the obtained number of spectrafor each protein.
SUPPLEMENTAL MATERIAL
Supplemental material is available for this article.
ACKNOWLEDGMENTS
We thank P. Kemkes, H. Kohansal, M. Raabe, and U. Plessmann forexcellent technical assistance; I. Lemm for help with SILAC cell cul-ture; and V.A. Raker for help in manuscript preparation. M.G. wassupported by the Danish Agency for Science, Technology andInnovation (DASTI). This work was supported by grants from theDeutsche Forschungsgemeinschaft (SFB860) to R.L. and H.U.
Received July 11, 2013; accepted December 10, 2013.
REFERENCES
Aebersold R, Mann M. 2003. Mass spectrometry-based proteomics.Nature 422: 198–207.
Agafonov DE, Deckert J, Wolf E, Odenwalder P, Bessonov S, Will CL,Urlaub H, Luhrmann R. 2011. Semiquantitative proteomic analysisof the human spliceosome via a novel two-dimensional gel electro-phoresis method. Mol Cell Biol 31: 2667–2682.
Ajuh P, Kuster B, Panov K, Zomerdijk JC, Mann M, Lamond AI. 2000.Functional analysis of the human CDC5L complex and identifica-tion of its components by mass spectrometry. EMBO J 19:6569–6581.
Bantscheff M, Schirle M, Sweetman G, Rick J, Kuster B. 2007.Quantitative mass spectrometry in proteomics: A critical review.Anal Bioanal Chem 389: 1017–1031.
Bantscheff M, Lemeer S, SavitskiMM, Kuster B. 2012. Quantitativemassspectrometry in proteomics: Critical review update from 2007 to thepresent. Anal Bioanal Chem 404: 939–965.
Behzadnia N, Golas MM, Hartmuth K, Sander B, Kastner B, Deckert J,Dube P, Will CL, Urlaub H, Stark H, et al. 2007. Composition andthree-dimensional EM structure of double affinity-purified, humanprespliceosomal A complexes. EMBO J 26: 1737–1748.
Bessonov S, Anokhina M, Will CL, Urlaub H, Luhrmann R. 2008.Isolation of an active step I spliceosome and composition of itsRNP core. Nature 452: 846–850.
Bessonov S, Anokhina M, Krasauskas A, Golas MM, Sander B, Will CL,Urlaub H, Stark H, Luhrmann R. 2010. Characterization of purifiedhuman Bact spliceosomal complexes reveals compositional and mor-phological changes during spliceosome activation and first step ca-talysis. RNA 16: 2384–2403.
Chan SP, Kao DI, Tsai WY, Cheng SC. 2003. The Prp19p-associatedcomplex in spliceosome activation. Science 302: 279–282.
Collier TS, Sarkar P, Franck WL, Rao BM, Dean RA, Muddiman DC.2010. Direct comparison of stable isotope labeling by amino acidsin cell culture and spectral counting for quantitative proteomics.Anal Chem 82: 8696–8702.
Deckert J, Hartmuth K, Boehringer D, Behzadnia N,Will CL, Kastner B,Stark H, Urlaub H, Luhrmann R. 2006. Protein compositionand electron microscopy structure of affinity-purified human
Relative quantification of spliceosomal complexes
www.rnajournal.org 419
Cold Spring Harbor Laboratory Press on May 9, 2015 - Published by rnajournal.cshlp.orgDownloaded from

spliceosomal B complexes isolated under physiological conditions.Mol Cell Biol 26: 5528–5543.
Dignam JD, Lebovitz RM, Roeder RG. 1983. Accurate transcription ini-tiation by RNA polymerase II in a soluble extract from isolatedmammalian nuclei. Nucleic Acids Res 11: 1475–1489.
Domon B, Aebersold R. 2006. Mass spectrometry and protein analysis.Science 312: 212–217.
Dziembowski A, Ventura AP, Rutz B, Caspary F, Faux C, Halgand F,Laprevote O, Seraphin B. 2004. Proteomic analysis identifies a newcomplex required for nuclear pre-mRNA retention and splicing.EMBO J 23: 4847–4856.
Fabrizio P, Dannenberg J, Dube P, Kastner B, Stark H, Urlaub H,Luhrmann R. 2009. The evolutionarily conserved core design ofthe catalytic activation step of the yeast spliceosome. Mol Cell 36:593–608.
Fourmann JB, Schmitzova J, Christian H, Urlaub H, Ficner R, Boon KL,Fabrizio P, Luhrmann R. 2013. Dissection of the factor require-ments for spliceosome disassembly and the elucidation of its disso-ciation products using a purified splicing system. Genes Dev 27:413–428.
Hendrickson EL, Xia Q, Wang T, Leigh JA, Hackett M. 2006.Comparison of spectral counting and metabolic stable isotope label-ing for use with quantitative microbial proteomics. Analyst 131:1335–1341.
Herold N, Will CL, Wolf E, Kastner B, Urlaub H, Luhrmann R. 2009.Conservation of the protein composition and electron microscopystructure of Drosophila melanogaster and human spliceosomal com-plexes. Mol Cell Biol 29: 281–301.
Jurica MS Moore MJ. 2003. Pre-mRNA splicing: Awash in a sea of pro-teins. Mol Cell 12: 5–14.
Jurica MS, Licklider LJ, Gygi SR, Grigorieff N, Moore MJ. 2002.Purification and characterization of native spliceosomes suitablefor three-dimensional structural analysis. RNA 8: 426–439.
Lau CK, Diem MD, Dreyfuss G, Van Duyne G. 2003. Structure of theY14-Magoh core of the exon junction complex. Curr Biol 13:933–941.
Le Hir H, Izaurralde E, Maquat LE, Moore MJ. 2000. The spliceosomedeposits multiple proteins 20–24 nucleotides upstream of mRNAexon–exon junctions. EMBO J 19: 6860–6869.
Li Z, Adams RM, Chourey K, Hurst GB, Hettich RL, Pan C. 2012.Systematic comparison of label-free, metabolic labeling, and isobaricchemical labeling for quantitative proteomics on LTQ OrbitrapVelos. J Proteome Res 11: 1582–1590.
Liu H, Sadygov RG, Yates JR III. 2004. A model for random samplingand estimation of relative protein abundance in shotgun proteomics.Anal Chem 76: 4193–4201.
Makarov EM, Makarova OV, Urlaub H, Gentzel M, Will CL, Wilm M,Luhrmann R. 2002. Small nuclear ribonucleoprotein remodelingduring catalytic activation of the spliceosome. Science 298:2205–2208.
Makarova OV, Makarov EM, Urlaub H, Will CL, Gentzel M, Wilm M,Luhrmann R. 2004. A subset of human 35S U5 proteins, including
Prp19, function prior to catalytic step 1 of splicing. EMBO J 23:2381–2391.
Merz C, Urlaub H, Will CL, Luhrmann R. 2007. Protein composition ofhuman mRNPs spliced in vitro and differential requirements formRNP protein recruitment. RNA 13: 116–128.
Nikolov M, Stutzer A, Mosch K, Krasauskas A, Soeroes S, Stark H,Urlaub H, Fischle W. 2011. Chromatin affinity purification andquantitative mass spectrometry defining the interactome of histonemodification patterns. Mol Cell Proteomics 10: M110.005371.
Nikolov M, Schmidt C, Urlaub H. 2012. Quantitative mass spectrome-try-based proteomics: An overview. Methods Mol Biol 893: 85–100.
Olsen JV, de Godoy LM, Li G, Macek B, Mortensen P, Pesch R,Makarov A, Lange O, Horning S, Mann M. 2005. Parts per millionmass accuracy on an Orbitrap mass spectrometer via lock mass in-jection into a C-trap. Mol Cell Proteomics 4: 2010–2021.
Ong SE, Mann M. 2005. Mass spectrometry-based proteomics turnsquantitative. Nat Chem Biol 1: 252–262.
Ong SE, Blagoev B, Kratchmarova I, Kristensen DB, Steen H, Pandey A,MannM. 2002. Stable isotope labeling by amino acids in cell culture,SILAC, as a simple and accurate approach to expression proteomics.Mol Cell Proteomics 1: 376–386.
Rappsilber J, Ryder U, Lamond AI, Mann M. 2002. Large-scale proteo-mic analysis of the human spliceosome. Genome Res 12: 1231–1245.
Ross PL, Huang YN, Marchese JN, Williamson B, Parker K, Hattan S,Khainovski N, Pillai S, Dey S, Daniels S, et al. 2004. Multiplexed pro-tein quantitation in Saccharomyces cerevisiae using amine-reactiveisobaric tagging reagents. Mol Cell Proteomics 3: 1154–1169.
Schmidt C, Urlaub H. 2009. iTRAQ-labeling of in-gel digested proteinsfor relative quantification. Methods Mol Biol 564: 207–226.
Schmidt C, Hesse D, Raabe M, Urlaub H, Jahn O. 2013. An automatedin-gel digestion/iTRAQ-labeling workflow for robust quantificationof gel-separated proteins. Proteomics 13: 1417–1422.
Shevchenko A, Wilm M, Vorm O, Mann M. 1996. Mass spectrometricsequencing of proteins silver-stained polyacrylamide gels. AnalChem 68: 850–858.
Singh G, Kucukural A, Cenik C, Leszyk JD, Shaffer SA, Weng Z,Moore M. 2012. The cellular EJC interactome reveals higher-ordermRNP structure and an EJC-SR protein nexus. Cell 151: 750–764.
Smith DJ, Query CC, Konarska MM. 2008. “Nought may endure butmutability”: Spliceosome dynamics and the regulation of splicing.Mol Cell 30: 657–666.
Steen H, MannM. 2004. The ABC’s (and XYZ’s) of peptide sequencing.Nat Rev Mol Cell Biol 5: 699–711.
Umen JG, Guthrie C. 1995. The second catalytic step of pre-mRNAsplicing. RNA 1: 869–885.
Wahl MC, Will CL, Luhrmann R. 2009. The spliceosome: Design prin-ciples of a dynamic RNP machine. Cell 136: 701–718.
Yates JR, Ruse CI, Nakorchevsky A. 2009. Proteomics by mass spec-trometry: Approaches, advances, and applications. Annu RevBiomed Eng 11: 49–79.
Zhou Z, Licklider LJ, Gygi SP, Reed R. 2002. Comprehensive proteomicanalysis of the human spliceosome. Nature 419: 182–185.
Schmidt et al.
420 RNA, Vol. 20, No. 3
Cold Spring Harbor Laboratory Press on May 9, 2015 - Published by rnajournal.cshlp.orgDownloaded from

10.1261/rna.041244.113Access the most recent version at doi: 2014 20: 406-420 originally published online January 21, 2014RNA
Carla Schmidt, Mads Grønborg, Jochen Deckert, et al. countlabeling (SILAC), chemical labeling (iTRAQ), and label-free spectralprecatalytic and catalytically active spliceosomes by metabolic
based relative quantification of proteins in−Mass spectrometry
Material
Supplemental
http://rnajournal.cshlp.org/content/suppl/2014/01/09/rna.041244.113.DC1.html
References
http://rnajournal.cshlp.org/content/20/3/406.full.html#ref-list-1
This article cites 43 articles, 20 of which can be accessed free at:
Open Access
Open Access option.RNAFreely available online through the
License
Commons Creative
.http://creativecommons.org/licenses/by-nc/3.0/(Attribution-NonCommercial 3.0 Unported), as described at
, is available under a Creative Commons LicenseRNAThis article, published in
ServiceEmail Alerting
click here.right corner of the article or
Receive free email alerts when new articles cite this article - sign up in the box at the top
http://rnajournal.cshlp.org/subscriptions go to: RNATo subscribe to
© 2014 Schmidt et al.; Published by Cold Spring Harbor Laboratory Press for the RNA Society
Cold Spring Harbor Laboratory Press on May 9, 2015 - Published by rnajournal.cshlp.orgDownloaded from