mas deficiency in fvb/n mice produces marked changes in lipid and glycemic metabolism
TRANSCRIPT
MAS DEFICIENCY IN FVB/N MICE PRODUCES MARKED CHANGES IN LIPID AND GLYCEMIC METABOLISM
SÉRGIO HENRIQUE S. SANTOS1(MSc), LUCIANA RODRIGUES FERNANDES3(MSc), ÉRICA GUILHEN MARIO4(MSc), ADALIENE VERSIANI M. FERREIRA4(PhD), LAURA
CRISTINA J. PÔRTO3(MSc), JAQUELINE ISAURA ALVAREZ-LEITE3(PhD), LEIDA MARIA BOTION4(PhD), MICHAEL BADER2(PhD), NATALIA ALENINA2(PhD), ROBSON
AUGUSTO S. SANTOS1(MD, PhD).
1 Laboratory of Hypertension, Department of Physiology and Biophysics, Biological Sciences Institute (ICB), Federal University of Minas Gerais (UFMG),
Belo Horizonte (BH), Minas Gerais (MG), Brazil; 2 Max-Delbrück-Center for Molecular Medicine (MDC), Berlin-Buch, Germany;
3 Laboratory of Nutritional Biochemistry, Department of Biochemistry, ICB, UFMG, BH, MG, Brazil;
4 Laboratory of Cellular Metabolism, Department of Physiology and Biophysics, ICB, UFMG, BH, MG, Brazil.
Running title: Receptor Mas deletion induces metabolic syndrome
Corresponding author: Robson A. S. Santos
Laborátorio de Hipertensão, Departamento de Fisiologia e Biofisica Universidade Federal de Minas Gerais
Av Antonio Carlos 6627-ICB 31270-901, Belo Horizonte, MG, Brazil
Received for publication 17 July 2007 and accepted in revised form 13 November 2007.
Diabetes Publish Ahead of Print, published online November 19, 2007
Copyright American Diabetes Association, Inc., 2007
Receptor Mas deletion induces metabolic syndrome
ABSTRACT Objective: Metabolic syndrome is characterized by the variable coexistence of obesity, hyperinsulinemia, insulin resistance, dyslipidemia, and hypertension. It is well known that angiotensin II is importantly involved in metabolic syndrome. However, the role of the vasodilator angiotensin-(1-7)/Mas axis is not known. The aim of this study was to evaluate the effect of genetic deletion of G protein-coupled receptor, Mas, in the lipidic and glycemic metabolism in FVB/N mice. Research Design and Methods: Plasma lipids, insulin and cytokines concentrations were measured in FVB/N Mas-deficient and wild type mice. A glucose-tolerance test was performed by intraperitoneally injecting D-glucose into overnight fasted mice. Insulin sensitivity test was performed by intraperitoneal injection of insulin. Uptake of 2-deoxy-[3H]glucose by adipocytes was used to determine the rate of glucose transport; adipose tissue GLUT4 was quantified by Western blot. Gene expression of TGF-β, AT1R and angiotensinogen were measured by real time PCR. Results: Despite of normal body weight, Mas-knockout mice presented dyslipidemia, increased levels of insulin and leptin, and ~50% increase in abdominal fat mass. In addition, Mas-gene deleted mice presented glucose intolerance and reduced insulin sensitivity as well as a decrease in insulin-stimulated glucose uptake by adipocytes and decreased GLUT4 in adipose tissue. Mas-/- presented increased muscle triglycerides while liver triglycerides level was normal. Expression of TGF-β and angiotensinogen genes was higher in Mas-knockout animals in comparison to controls. Conclusions: These results show that Mas-deficiency in FVB/N mice leads to dramatic changes in glucose and lipid metabolisms, inducing a metabolic syndrome-like state. KEYWORDS. Receptor Mas, metabolic syndrome, renin-angiotensin-system, Glucose metabolism, dyslipidemia.
2
Receptor Mas deletion induces metabolic syndrome
etabolic syndrome (MS) is characterized by the variable coexistence of excess of body
fat, hyperinsulinemia (insulin resistance and glucose intolerance), dyslipidemia (high triglycerides and total cholesterol plasma levels), and hypertension (1, 2). The clinical alterations also include a proinflammatory and prothrombotic status as well as microalbuminuria. The MS pathogenesis is multifactorial and is related to central obesity, a sedentary lifestyle, an unbalanced diet and genetic predisposition. Insulin resistance is described as the central feature of MS (3), however, the molecular mechanisms underlying insulin resistance in MS are complex and not fully understood (4 ).
The renin-angiotensin system (RAS) is an important link between MS and cardiovascular diseases. All of the main RAS components are present in adipose tissue (4). RAS consists primarily of an enzymatic cascade in which angiotensinogen (AGT) is converted to angiotensin I (Ang I) and subsequently to Ang II by the actions of renin and angiotensin converting enzyme (ACE), respectively (5). Angiotensin-(1-7) [Ang-(1-7)] is primarily formed from Ang II and Ang I by the angiotensin-converting enzyme 2 (ACE2) (6,7,8). Ang II is a potent proinflammatory, pro-oxidant and prothrombotic agent, which interferes in several steps of intracellular insulin signaling (9). Increased levels of Ang II have been observed in both, obesity and diabetes patients (10). RAS components, especially AGT, found in adipose tissue are closely related to the Ang II effects on insulin resistance (10, 11). Furthermore, AGT secretion, as well as Ang II formation in adipocytes are increased in MS patients promoting adipocyte growth, which could explain the positive
correlation between high blood pressure and increased adipose-tissue mass in these patients (9). Additionally, the AGT gene promoter is regulated by a glucose-responsive element and therefore hyperglycemia could lead to increased tissue Ang II (10).
It has been demonstrated that Ang-(1-7) opposes many of the Ang II actions (6). Ang-(1-7), acting through the G protein-coupled receptor Mas, releases nitric oxide (NO), through a PI3K/Akt- dependent pathway, causing vasodilation, inhibition of cell growth and counter regulation of AT1R-mediated Ang II vasoconstrictor and proliferative effects (12,13). However, the role of Ang-(1-7)-Mas axis in the glycemic and lipid profile is not known. Previous studies using Mas-deficient mice were limited by the heterogeneous genetic background of the animals. We therefore backcrossed Mas-deficient mice for 7 generations onto the FVB/N background, a preferable background for transgenic analyses (14). We then studied the effect of Mas-deficiency on the glycemic and lipid profile.
RESEARCH DESIGN AND METHODS Animals. To obtain Mas-knockout animals on a pure genetic background, Mas+/- mice (mixed genetic background, 129xC57Bl/6) (15) were bred to the FVB/N mouse line (Charles River, Sulzfeld, Germany) for 7 generations at the Max-Delbrück-Center for Molecular Medicine. The selection for the Mas-knockout allele was done by PCR with primers MAS12: 5’-GCC GTT GCC CTC CTG GCG CCT GGG-3’ and NeoPVU: 5’-GGC AGC GCG GCT ATC GTG G-3’. Primers MAS10: 5’-GTA CAG CTT CGA AGA ATG GGA GGC CC-3’ and MAS14: 5’-CCT AAC TGA GCC ACC CTC ACC-3’
M
3
Receptor Mas deletion induces metabolic syndrome
were used for the detection of wild type allele. Thereafter, F7 heterozygous males were bred with F7 heterozygous females to generate the line FVB/N Mas-KO.
Mice were maintained at the transgenic animal facilities of the laboratory of Hypertension (Federal University of Minas Gerais, Belo Horizonte, Brazil) and were treated according to the international guidelines for animal care. Nine to ten week-old male FVB/N wild type (WT) and FVB/N Mas-knockout (Mas-KO) mice, were used for the experiments. The experimental protocol was approved by the ethics committee in animal experimentation of Federal University of Minas Gerais (Protocol # 006/05). The animals were maintained under controlled light and temperature conditions, and had free access to water and chow diet. Measurements of body weight, food intake and tissue collection. Nine week-old male Mas-KO and wild-type mice were individually housed and weighed on the first experimental day. Food intake was measured daily during 7 days in order to obtain food efficiency (food intake / body weight).
Mice were sacrificed after anesthesia with ketamine (130mg/kg) and xylazine (0,3mg/kg) and samples of blood, epididymal and retroperitoneal white adipose tissue were collected, weighted and immediately frozen in liquid nitrogen and stored at -80oC for posterior analysis. Determination of Plasma Parameters. Serum was obtained after centrifugation (3500 rpm for 5 minutes at 4oC). Total serum cholesterol and triglycerides were assayed using enzymatic kits (Doles, GO, Brazil). ELISA kits were used to measure serum adiponectin (AdipoGen, Seoul, Korea) and leptin (Linco, Missouri USA) levels. Serum insulin was measured by
chemiluminescence using kit IRI Bayer (Kyowa; Japan) and ADVIA-Centaur equipment. Determination of Tissue Triglycerides. Hepatic and muscle total lipids were extracted by the method of Folch et al. (16) gravimetrically quantified and assayed for triacylglycerols using enzymatic kits (Doles, GO, Brazil). Histology. Epididymal fat tissue was excised and fixed in Bouin solution and embedded in paraffin. Sections of the tissue were stained with hematoxylin and eosin (HE). Images of nine 8µm-sections from each animal were captured and adipocyte diameters from at least 540 cells were measured from each animal using NIH Image Software using a 20 X objective. (USA). Glucose tolerance and insulin sensitivity tests. For glucose-tolerance test, D-glucose (2 mg/g of body weight) was intraperitoneally injected into overnight fasted mice. Glucose levels from tail blood samples were monitored at 0,15, 30, 60 and 120 min after injection using an Accu-Check glucometer (Roche Diagnostics Corp., Indianapolis, Indiana, USA). Insulin sensitivity test was performed on overnight fed mice, after intraperitoneal injection of insulin (0.75 U/kg body weight - Sigma, St Louis, MO, USA). Tail-blood samples were taken at time 0, 15, 30 and 60 min after injection for measurement of blood glucose levels. Glucose Uptake. Adipocyte isolation. Adipocytes from wild type and Mas-KO mice were isolated from epididymal fat pads according to Rodbell, 1964 (17). Digestion was carried out at 37°C with constant shaking for 45 min. Cells were filtered through nylon mesh and washed three times with buffer containing (mM): 137 NaCl, 5 KCl, 4.2 NaHCO3, 1.3 CaCl2, 0.5 MgCl2, 0.5 MgSO4, 0.5 KH2PO4, 20 HEPES (pH 7,4), plus 1 % BSA.
4
Receptor Mas deletion induces metabolic syndrome
Glucose transport assay. After isolation, adipocytes were incubated for 45 min at 37°C in the presence or absence of insulin (25ng/mL). The uptake of 2-deoxy-[3H]glucose (2-DOG) was used to determine the rate of glucose transport as previously described (18). Briefly, glucose uptake was initiated by the addition of 2-DOG (0,2 µCi/tube) for 3 min. Thereafter, cells were separated by centrifugation through silicone oil and cell associated radioactivity was determined by scintillation counting. Nonspecific association of 2-deoxy-[3H]glucose was determined by performing parallel incubations in the presence of 15 mM phloretin, and this value was subtracted from glucose transport activity in each condition. Western blot analysis. Samples of epididymal adipose tissue (~300 mg) were extracted and 30 µg of protein were resolved on SDS-PAGE gels (10%) and then transferred onto nitrocellulose membranes. The glucose transporter, GLUT4, was probed with a polyclonal rabbit anti-Glut4 antibody (1:5,000) and a goat anti-rabbit IgG antibody conjugated with peroxidase (1:5,000) was used as a secondary antibody. The blots were visualized using a chemiluminescence western blotting detection reagent (ECL; Amercham Pharmacia Biotech®) and revealed on a photograph film. Reverse transcription and Real Time PCR. Total RNA from adipose tissue was prepared using TRIzol reagent (Invitrogen Corp., San Diego, California, USA), treated with DNAse and reverse transcribed with MML-V (Invitrogen Corp.). The endogenous HPRT-Hypoxanthine Guanine Phosphoribosyltransferase (internal control), TNF-∝, TGF-β, AGT, AT1 and Mas cDNA were amplified using specific primers (Table 1) and SYBR Green
reagent (Apllied Biosystem) in an ABI Prism 7000 platform (Apllied Biosystem, EUA). Statistical analysis. Data are expressed as the mean ± SEM. The statistical significance of differences in mean values between transgenic and wild-type mice was assessed by unpaired Student t-test; two-way ANOVA (glucose tolerance and insulin sensibility tests) and one-way ANOVA (glucose uptake test). RESULTS
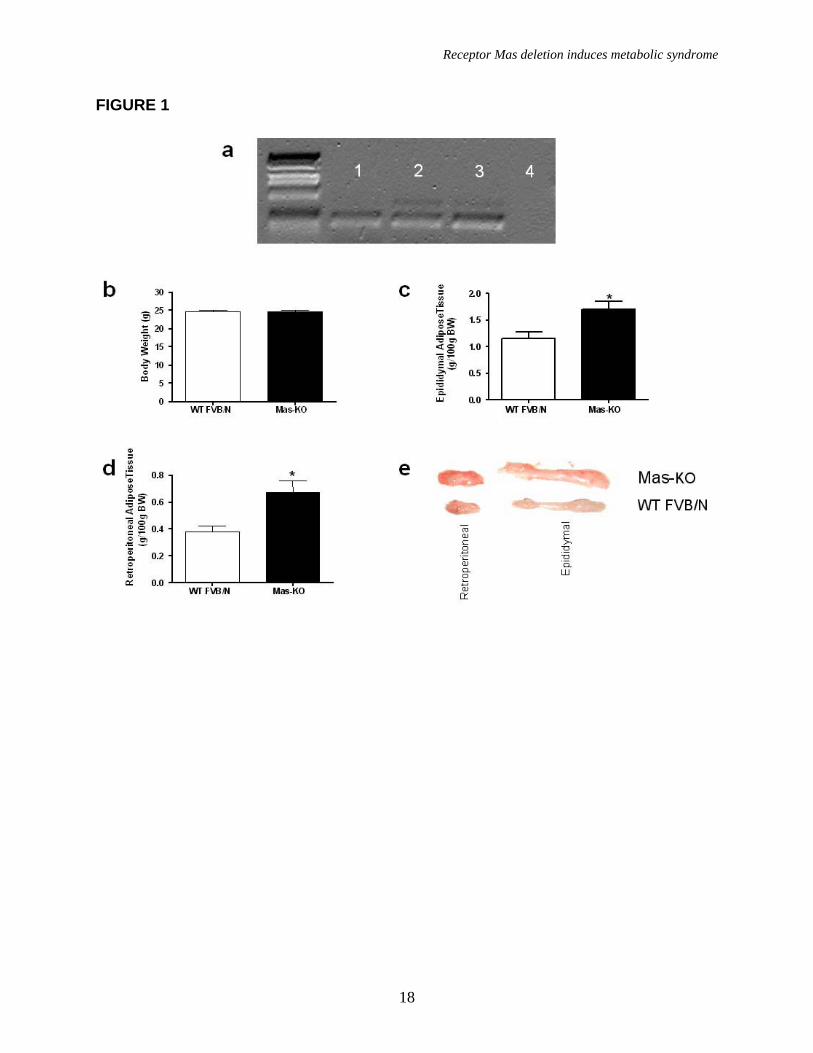
First we analyzed Mas-expression in adipose tissue of FVB/N mice and Sprague Dawley (SD) rats. RT-PCR revealed that Mas gene is expressed in this tissue in both species (Figure 1a), whereas the corresponding transcript was absent in Mas-KO adipose tissue, confirming the genetic deletion of Mas in this model (Figure 1a).
To examine the functional consequences of Mas-deletion we studied the relation between body and fat weight in Mas-knockout mice. As observed in figure 1b, WT and Mas-KO mice did not display differences in body weight (24.8± 0.2 in Mas-KO vs 24.7 ± 0.4 g in WT) or food intake (Table 2). However, analysis of the epididymal (1.70 ± 0.15 in Mas-KO vs 1.15 ± 0.13 % of BW in WT, Figure 1e) and retroperitoneal (0.68 ± 0.09 in Mas-KO vs 0.38 ± 0.05 % of BW in WT, Figure 1e) adipose tissue showed that Mas-KO have a substantial increase in fat mass in relation to WT FVB/N (Figure 1c and 1d).
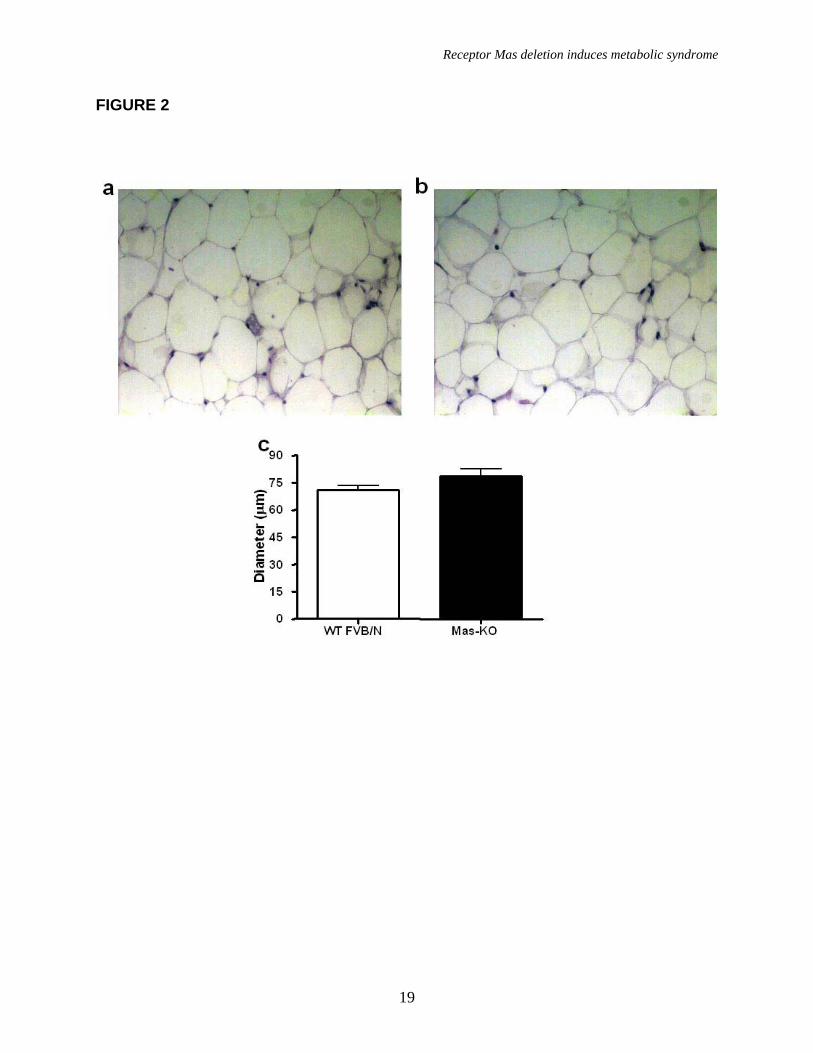
Histological analyses showed a similar diameter of the adipocytes in Mas-KO and WT FVB/N (74.1 ± 4.0 in Mas-KO vs 72.2 ± 4.1 µm in WT), indicating that the increase in adipose tissue mass was not due to hypertrophy in adipocytes (Figure 2).
5
Receptor Mas deletion induces metabolic syndrome
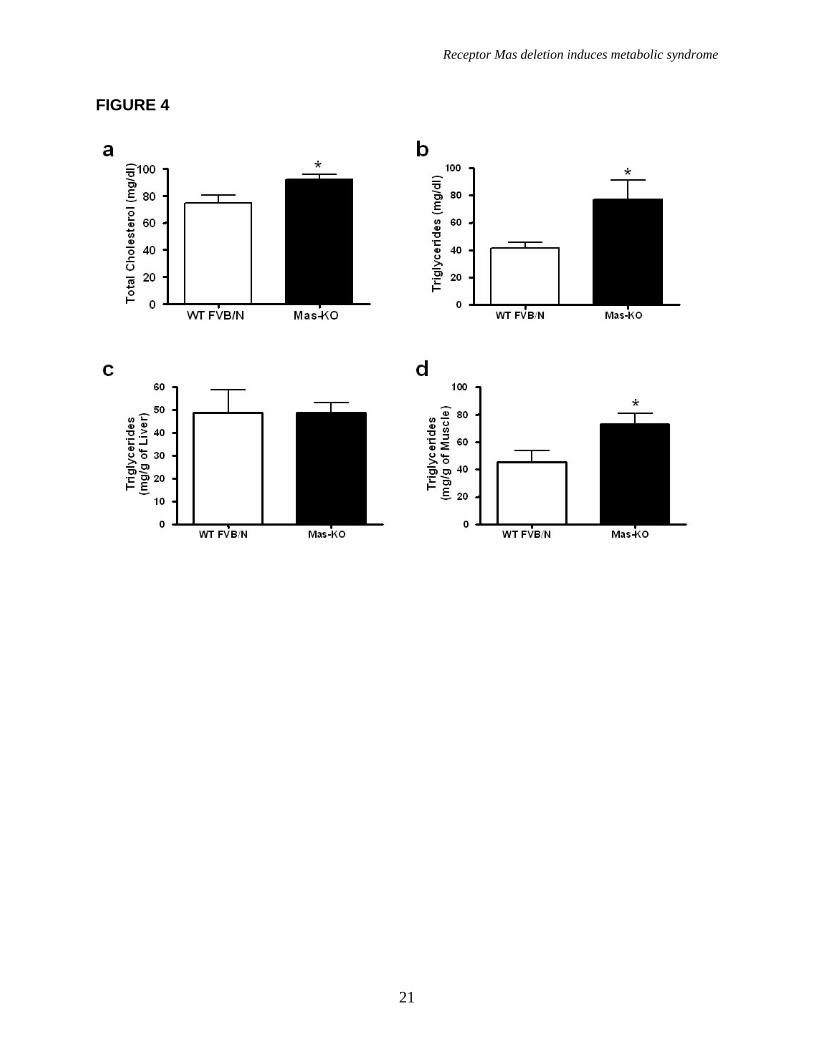
Mas-KO mice presented a significant increase in total cholesterol (92.15 ± 3.66 in Mas-KO vs 74.65 ± 5.68 mg/dl in WT) and triglycerides (76.77 ± 14.45 in Mas-KO vs 41.45 ± 4.08 mg/dl in WT) serum levels, indicating a dyslipidemic state (Figure 4a and 4b). Leptin levels were also increased in the serum of Mas-KO mice (Table 2), however, the correlation of leptin levels with fat mass (by Pearson Test) showed a similar leptin adipocyte secretion in both groups of mice. On the other hand, adiponectin levels were not altered in the serum of Mas-KO mice (Table 2), while the correlation of adiponectin levels with fat mass (by Pearson Test) showed a decrease of adipose tissue adiponectin secretion in Mas-KO mice.
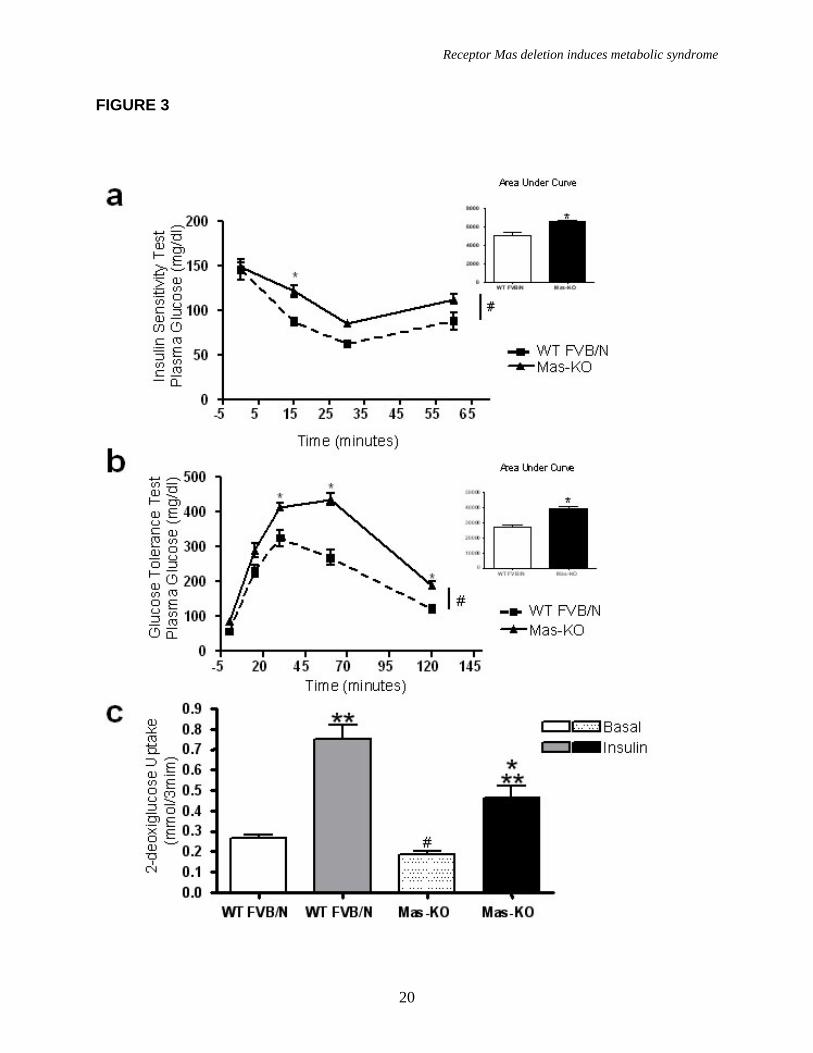
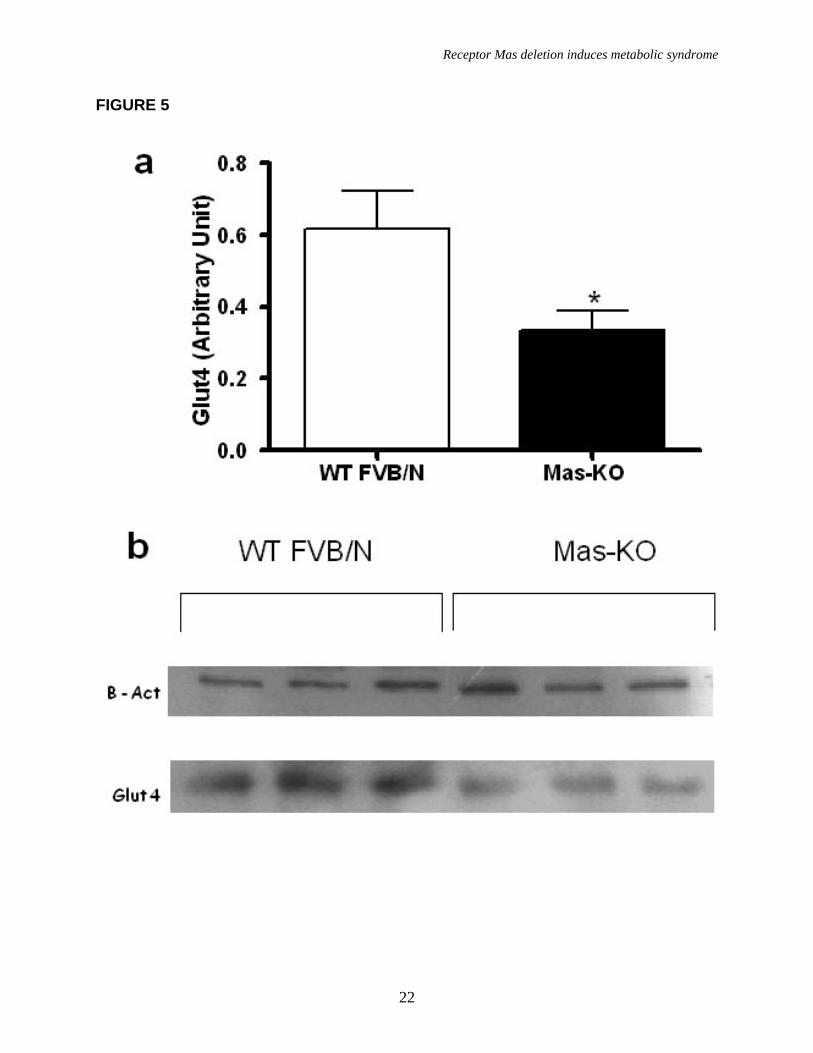
A low glucose tolerance and decreased insulin sensitivity was observed in Mas-KO mice when compared to WT FVB/N (Figure 3a, b). This state was accompanied by an important increase in muscle triglyceride level (45.14 ± 8.71 in Mas-KO vs 72.77 ± 7.84 mg/g of muscle in WT) in Mas-KO mice (Figure 4d) without alteration in liver triglyceride level (Figure 4c). Additionally, fasting plasma glucose levels and insulin levels were elevated in Mas-KO mice (Table 2). Moreover, as shown in figure 5, the GLUT4 protein levels in adipose tissue were decreased in Mas-KO mice (0.336± 0.054 in Mas-KO vs 0.616 ± 0.105 AU in WT).
The 2-deoxy-[3H ]glucose (2DOG-6) is transported, phosphorylated but not oxidized by the adipocyte. Consequently, it accumulates as 2DOG-6- phosphate in the cell. Accumulated radioactivity in adipocytes was used to evaluate the capacity of glucose uptake into this cell type (Figure 3c). Statistical analysis of glucose uptake in WT FVB/N and Mas-KO mice in basal state, utilizing a one-
way ANOVA test (Figure 3c), showed that there was no statistically significant difference. However, when tested with an independent two-sample t-test, there was a significant difference between the groups in the basal state (p<0.02) with decreased glucose uptake in Mas-KO mice group. All other permutations of comparisons between WT and Mas-KO mice were statistically significant using ANOVA analyzes (p<0.05). In addition, the difference of mean glucose uptake between basal and insulin stimulated state was 42% lower in Mas-KO (0.28±0.06 nmol/3min) than in WT FVB/N (0.49±0.06 nmol/3 min).
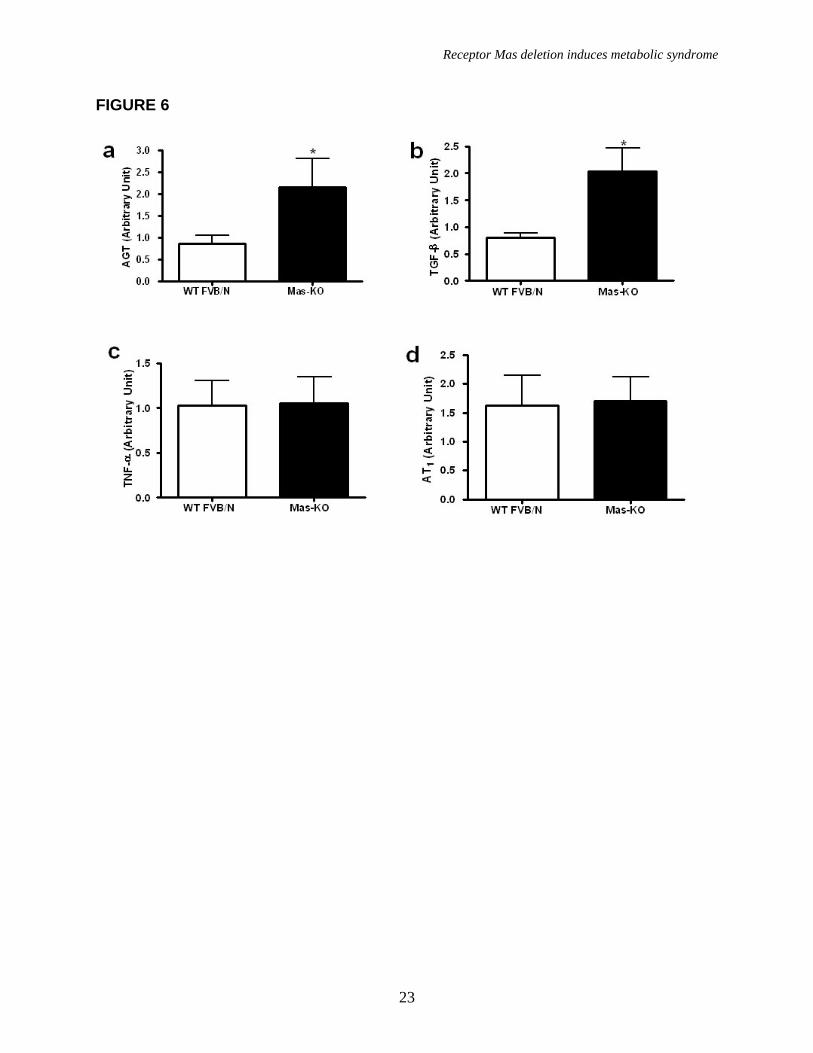
As shown in figure 6, real-time PCR analysis revealed a marked increase in AGT and TGF-β expression in Mas-KO epididymal adipose tissue while TNF-α and AT1R were not altered. DISCUSSION
This study has documented for the first time that deletion of receptor Mas in pure FVB/N background produced a murine model of metabolic syndrome-like state. These animals showed an increased adipose tissue mass associated with high serum cholesterol and triglycerides levels, enhanced fasting glycemia, hyperinsulinemia, and glucose intolerance, decreased insulin sensitivity and glucose uptake by adipocytes, elevated serum leptin levels and reduced triglycerides in skeletal muscle. Additionally, increased AGT and TGF-β mRNA expression as well as decreased GLUT4 receptor expression were observed in epididymal adipose tissue.
Despite of an unchanged food intake and body weight, the knockout animals exhibited a considerable increase in abdominal fat mass (epididymal and retroperitoneal adipose tissue). Alterations were not observed in TNF-α
6
Receptor Mas deletion induces metabolic syndrome
expression or in the apparent number of macrophages in Mas-KO fat tissue histology, suggesting the absence of inflammation in adipose tissue. Signs of adipocyte hypertrophy were not observed in histological studies, suggesting that the increase in fat mass occurred by increased proliferation of adipocytes (hyperplasia). This observation was corroborated by the increase in TGF-β expression, an important cytokine involved in tissue proliferation (19). On the other hand, the absence of alterations in food intake indicates that the changes in fat mass were a not consequence of metabolic changes induced by increased appetite. Although we have shown that Mas is expressed in fat, the changes in this tissue are not necessarily the result of a direct effect of Mas-deficiency in adipocytes. It may also be secondary to hormonal changes induced by the lack of Mas in endocrine glands, including testis, where Mas is highly expressed.
Adipose tissue is a complex and important endocrine organ and plays an essential role in lipid and glucose metabolism (15). Many RAS components are found in the adipose tissue (20). The increased expression of AGT is an important characteristic of pre-adipocyte differentiation, especially because Ang II has a fundamental role in this process. It was previously demonstrated that AGT expression is elevated in obesity (20, 21). Zucker rats show an increased expression and secretion of AGT in adipocytes (22). Our results are in agreement with these data showing an elevated expression of AGT in adipose tissue of Mas-KO mice.
It has been shown that glucose and insulin have opposite effects on AGT expression in the liver and adipose tissue of SD rats. While glucose augments AGT level, insulin promotes a decrease in its
expression. These effects were found in the insulin resistance state of obese rats (23). Our results indicate that Mas-KO mice exhibit an insulin-resistance state as evidenced by the decrease in insulin-sensitivity and glucose tolerance, hyperinsulinemia and more importantly, by a decrease in insulin-induced glucose uptake in adipose tissue. In keeping with these findings a decreased amount of GLUT4 protein was observed in the adipose tissue of Mas-KO mice. It is well established in the literature that high triglyceride muscle levels are closely related to metabolic syndrome which is a known mechanism of muscular insulin resistance (24). Our results are in keeping with these findings, showing an important increase in muscular triglycerides. Therefore, the deficiency of insulin action followed by high glucose plasma levels could be involved in the augmentation of AGT expression in Mas-KO mice.
It has also been shown that AGT expression is up-regulated by fatty acids (25). Our data demonstrated that triglyceride plasma levels are increased in Mas-KO suggesting that this could be an additional underlying mechanism involved in the increased AGT expression in Mas-KO adipose tissue. The increase in local AGT may lead to an increase in Ang II tissue levels and overactivity of the Ang II/AT1 axis, despite of normal AT1 receptor expression. Future studies with measurement of Ang II levels, which is lacking in this study, will be helpful to confirm this possibility. The high AGT expression in adipocytes associated with increased fat mass could explain, at least in part, the higher blood pressure levels in FVB/N Mas-KO mice (118±1 vs 108±2 mmHg in WT, p<0.001) (26). Moreover, the loss of counterregulatory actions (vasodilatation) of the Ang-(1-7)/Mas axis,
7
Receptor Mas deletion induces metabolic syndrome
which are abolished in this model, could also contribute to the moderate hypertensive state of these animals (26).
Obesity can induce insulin resistance and consequently lead to increased plasma glucose and insulin production and release, which are characteristics of type 2 diabetes (27). Moreover, it is clear now, that circulating leptin levels correlate with body fat mass (9, 28). Accordingly, in Mas-KO mice the increase in adipose mass is closely related to an increase in leptin levels. The reduction in adiponectin secretion in Mas-KO mice can be related to the lower insulin sensibility observed in these animals. This adipocytokine is an important agent in tissue sensitization facilitating the action of insulin (29).
The role of Ang II in obesity is still controversial since it can stimulate synthesis or lysis of fat tissue depending on the experimental conditions (30, 31, 32, 33). It has been shown, in rats and humans, that Angiotensin Converting Enzyme inhibitors (ACEi) can decrease body weight (34, 35, 36). Furthermore, many studies have shown that Ang-(1-7) can counterregulate Ang II actions and participate in the ACEi effects (37,38). Our data showing an increased fat mass in Mas-KO mice suggest that the Ang-(1-7)/Mas is crucial in the control of fat accumulation and lipolysis. Measurements of Ang II levels and blockade of AT1 receptors in this model, in future studies, will be helpful to ascertain whether the metabolic changes observed are, at least partially, due to increased Ang II.
Ang II decreases phosphorylation of insulin-stimulated tyrosine, increasing IRS-1 receptor serine phosphorylation (39). As a consequence, insulin intracellular signaling as well as its activity are decreased (40). These alterations are also correlated with an
increase in AGT and Ang II levels during insulin resistance. Taken together, these studies suggest that Ang II decreases insulin metabolic effects. Considering the opposite role of Ang-(1-7) in the RAS, the lack of Ang-(1-7)/Mas axis activity, apart of its direct effect, could be also involved in both insulin resistance and glucose intolerance mechanisms due to an exacerbation of Ang II-mediated effects in Mas-KO mice. Concerning the direct metabolic effects of Ang-(1-7)/Mas axis, the PI3K/Akt pathway which is activated by Ang-(1-7), at least in endothelial cells (13) and in the heart (41) might be implicated.
One question that arise from our study is whether the phenotypic changes observed in FVB/N Mas-deficient mice are also observed in other genetic backgrounds. Ongoing experiments in our laboratory suggest that the sensitivity to genetic deletion of Mas is higher in FVB/N mice than in C57Bl/6 mice. This is particularly true for blood pressure, which is increased in FVB/N and normal in C57Bl/6 Mas-KO mice (26). In ongoing studies concerning metabolism, we have not observed changes in blood glucose, plasma triglycerides and total plasma cholesterol in young C57Bl/6 mice while a significant increase in mice while a significant increase in triglycerides was observed in older animals (RAS Santos and SHS Santos, unpublished observations). These differences, which may be related to the fact that C57Bl/6 present only one renin gene as compared to two genes of other mice strains, including FVB/N, are in keeping with other observations (42). It has been reported that genetic background strongly influences the severity of diabetes and insulin resistance in ob/ob mice (43). C57Bl/6 mice had much milder hyperglycemia and less whole–body and
8
Receptor Mas deletion induces metabolic syndrome
muscle insulin resistance than FVB/N mice despite of having a similar degree of obesity and hyperinsulinemia. Likewise, in the lipoatrophic model A-Zip/F-1 mice, the C57Bl/6 background produced milder hyperglycemia and dislipidemia than the FVB/N background, while liver insulin resistance and liver fatty acid deposition showed the opposite trend (44). Whether a repartitioning of triglycerides from the muscle and other tissues to the liver is contributing to the apparent differences between C57Bl/6 and FVB/N Mas-KO remain to be established.
In summary, the results obtained in this study show that genetic deletion of Mas in FVB/N mice produced a devastating effect on lipid and glucose metabolism, leading ultimately to a metabolic syndrome-like state (45). The primary mechanisms involved in this effect appear to include an increase in
leptin, AGT and TGF-β expression. The development of a murine model for a metabolic syndrome-like state, linked to the deficiency of the vasodilator/antiproliferative arm of the RAS will contribute to the elucidation of interactions between the Ang-(1-7)/Mas and the Ang II/AT1 axis in hypertension and lipid and glucose homeostasis dysregulation.
ACKNOWLEDGEMENTS
Sérgio Henrique Sousa Santos was a recipient of a CNPq master-fellowship at the Post-Graduation in Biological Science: Physiology and Pharmacology, ICB, UFMG. We also would like to thank, CNPq, PRONEX, CAPES and FAPEMIG for financial support. The authors would like to thank Ilma M. da Silva for the valuable technical assistance.
9
Receptor Mas deletion induces metabolic syndrome
REFERENCES 1- Grundy SM, Brewer HB Jr, Cleeman JI, Smith SC Jr, Lenfant C, National Heart, Lung, and Blood Institute. American Heart Association Definition of metabolic syndrome: report of the National Heart, Lung, and Blood Institute/ American Heart Association Conference on Scientific Issues Related to Definition. Circulation; 109:433–438, 2004. 2- Expert Panel on Detection, Evaluation and Treatment of High Blood Cholesterol in Adults. Executive summary of the Third Report of the National Cholesterol Education Program (NCEP) Expert Panel on Detection, Evaluation, and Treatment of High Blood Cholesterol in Adults (Adult Treatment Panel III). JAMA; 285:2486–2496, 2001. 3- Park YW, Zhu S, Palaniappan L, Heshka S, Carnethon MR, Heymsfield SB. The metabolic syndrome: prevalence and associated risk factor findings in the US population from the Third National Health and Nutrition Examination Survey, 1988–1994. Arch Intern Med.; 163:427–436, 2003. 4- Strazzullo P and Galletti F. Impact of the renin-angiotensin system on lipid and carbohydrate metabolism. Curr Opin Nephrol Hypertens.; 13(3):325-332, 2004. 5- Engeli S, Schling P, Gorzelniak K, Boschmann M, Janke J, Ailhaud G, Teboul M, Massiera F, Sharma AM. The adipose –tissue renin-agiotensin-aldosterone system: role in the metabolic syndrome? The Inter. Jour. Bioch.Cell Biol.; 35: 807-825, 2003. 6- Santos RAS, Ferreira AJ, Pinheiro SV, Sampaio WO, Touyz R, Campagnole-Santos MJ. Angiotensin-(1-7) and its receptor as a targets for new cardiovascular drugs. Expert Opin. Investig. Drugs.; 14(8): 1019-1031, 2005. 7- Donoghue M, Hsieh F, Baronas E, Godbout K, Gosselin M, Stagliano N, Donovan M, Woolf B, Robison K, Jeyaseelan R, Breitbart RE, Acton S. A Novel angiotensin-converting enzyme related carboxypeptidase (ACE 2) converts angiotensin I to angiotensin (1-9). Circ. Res.; 87: 1-9, 2000. 8- Crackower MA, Sarao R, Oudit GY, Yagil C, Kozieradzki I, Scanga SE, Oliveira-dos-Santos AJ, da Costa J, Zhang L, Pei Y, Scholey J, Ferrario CM, Manoukian AS, Chappell MC, Backx PH, Yagil Y, Penninger JM. Angiotensin converting enzyme 2 is an essential regulator of heart function. Nature; 417: 822-828, 2002. 9- Prasad A and Quyyumi A. Renin-angiotensin system and angiotensin receptor blockers in the metabolic syndrome. Circulation; 110: 1507-1512, 2004. 10- Giacchetti G, Sechi LA, Rilli S, Carey RM. The renin-angiotensin-aldosterone system, glucose metabolism and diabetes. Tre. Endocri. Metab.; 16: 120-126, 2005. 11- Boustany CM, Bharadwaj K, Daugherty A, Brown DR, Randall DC, Cassis LA. Activation of the systemic and adipose renin-angiotensin system in rats with diet-induced obesity and hypertension. Am. J. Phys Reg.; 287: R943-R949, 2004. 12- Santos RAS, Simoes e Silva AC, Maric C, Silva DM, Machado RP, de Buhr I, Heringer-Walther S, Pinheiro SV, Lopes MT, Bader M, Mendes EP, Lemos VS, Campagnole-Santos MJ, Schultheiss HP, Speth R, Walther T. Angiotensin-(1-7) is an endogenous ligand for the G protein-coupled receptor Mas. Proc Natl Acad Sci U S A.; 100(14): 8258-8263, 2003.
10
Receptor Mas deletion induces metabolic syndrome
13- Sampaio WO, Santos RAS, Faria-Silva R, Mata Machado LT, Schiffrin EL, Touyz RM. Angiotensin-(1-7) through receptor Mas mediates endothelial nitric oxide synthase activation via Akt-dependent pathways. Hypertension; 49(1):185-92, 2007. 14- Taketo M, Schroeder AC, Mobraaten LE, Gunning KB, Hanten G, Fox RR, Roderick TH, Stewart CL, Lilly F, Hansen CT. FVB/N: an inbred mouse strain preferable for transgenic analyses. Proc. Natl. Acad. Sci. U S A; 88(6):2065-2069, 1991. 15- Walther T, Balschun D, Voigt JP, Fink H, Zuschratter W, Birchmeier C, Ganten D and Bader M. Sustained long-term potentiation and anxiety in mice lacking the Mas protooncogene. J Biol Chem.; 273:11867-11873, 1998. 16- Folch J, Lees GH, Sloane-Stanley GH. A simple method for the isolation and purification of total lipids from animal tissues. J. Biol. Chem.; 226:497–509, 1957. 17- Rodbell M. Metabolism of isolated fat cells. I. Effects of hormones on glucose metabolism and lipolysis. J. Biol. Chem.; 239: 375-380, 1964. 18- Green A. Adenosine receptor down-regulation and insulin resistance followinf prolonged incubation of adipocytes with an A1 adenosine receptor agonist. J. Biol. Chem.; 262:15702-15707, 1987. 19- Uhal BD, Kim JK, Li X, Molina-Molina M. Angiotensin-TGF-beta1 crosstalk in human idiopathic pulmonary fibrosis: autocrine mechanisms in myofibroblasts and macrophages Curr. Pharm.; 13(12):1247-1256, 2007. 20- Giacchetti G, Faloia E, Mariniello B, Sardu C, Gatti C, Camilloni MA, Guerrieri M, Mantero F. Overexpression of the renin–angiotensin system in human visceral adipose tissue in normal and overweight subjects. Am. J. Hypertens.; 15:381–388, 2002. 21- Rankinen T, Gagnon J, Perusse L, Rice T, Leon AS, Skinner JS, Wilmore JH, Rao DC, Bouchard C. Body fat, resting and exercise blood pressure and the angiotensinogen M235T polymorphism: the heritage family study. Obes. Res.; 7:423–430, 1999. 22- Hainault I, Nebout G, Turban S, Ardouin B, Ferré P, Quignard-Boulangé A. Adipose tissue-specific increase in angiotensinogen expression and secretion in the obese (fa/fa) Zucker rat. Am. J. Physiol. Endocrinol. Metab.; 282:E59–E66, 2002. 23- Gabriely I, Yang XM, Cases JA, Ma XH, Rossetti L, Barzilai N. Hyperglycemia modulates angiotensinogen gene expression. Am. J. Physiol.; 281:R795–R802, 2001. 24- Pan DA, Lillioja S, Kriketos AD, Milner MR, Baur LA, Bogardus C, Jenkins AB, Storlien LH. Skeletal muscle triglyceride levels are inversely related to insulin action. Diabetes; 46(6): 983-988, 1997. 25- Brun RP, Tontonoz P, Forman BM, Ellis R, Chen J, Evans RM, Spiegelman BM. Differential activation of adipogenesis by multiple PPAR isoforms. Genes Dev.; 10:974–984, 1996. 26- Moura MM, Santos RAS, Bader M, Alenina N, Haibara AS. Angiotensin-(1–7) Receptor Mas Modulates Cardiovascular Reflex Reponses. Hypertension; 48(4): LB26, 2006 (Abstract). 27- Rader DJ. Effect of insulin resistance, dyslipidemia, and intra-abdominal adiposity on the development of cardiovascular disease and diabetes mellitus. Am. J. Med.; 120(3 Suppl 1):S12-S18, 2007.
11
Receptor Mas deletion induces metabolic syndrome
28- Frederich RC, Hamann A, Anderson S, Lollmann B, Lowell BB, Flier JS. Leptin levels reflect body lipid content in mice: evidence for diet-induced resistance to leptin action. Nat. Med.; 1(12):1311-1314, 1995. 29- Weyer C, Funahashi T, Tanaka S, Hotta K, Matsuzawa Y, Pratley RE, Tataranni PA. Hypoadiponectinemia in obesity and type 2 diabetes: close association with insulin resistance and hyperinsulinemia. J. Clin. Endocrinol. Metab.; 86:1930–1935, 2001. 30- Katsuya T, Horiuchi M, Chen Y, Koike G, Pratt RE, Dzau VJ, Reaven GM. Relations between deletion polymorphism of the angiotensin-converting enzyme gene and insulin resistance, glucose intolerance, hyperinsulinemia, and dyslipidemia. Arterioscler. Thromb. Vasc. Biol.; 15:779–782, 1995. 31- Ueda S, Elliott HL, Morton JJ, Connell JM. Enhanced pressor response to angiotensin I in normotensive men with the deletion genotype (DD) for angiotensin-converting enzyme. Hypertension;25:1266–1269, 1995. 32- Nagi DK, Foy CA, Mohamed-Ali V, Yudkin JS, Grant PJ, Knowler WC. Angiotensin-l-converting enzyme (ACE) gene polymorphism, plasma ACE levels, and their association with the metabolic syndrome and electrocardiographic coronary artery disease in Pima Indians. Metabolism; 47:622–626, 1998. 33- Jones BH, Standridge MK, Moustaid N. Angiotensin II increases lipogenesis in 3T3-Ll and human adipose cells. Endocrinology; 138:1512–1519, 1997. 34- (UK) Enalapril in Hypertension Study Group. Enalapril in essential hypertension: a comparative study with propranolol. Br. J. Clin. Pharmacol.; 18:51–56, 1984. 35- McGrath BP, Matthews PG, Louis W, Howes L, Whitworth JA, Kincaid-Smith PS, Fraser I, Scheinkestel C, MacDonald G, Rallings M. Double-blind study of dilevalol and captopril, both in combination with hydrochlorothiazide, in patients with moderate to severe hypertension. J. Cardiovasc. Pharmacol.; 16:831– 838, 1990. 36- Campbell DJ, Duncan AM, Kladis A, Harrap SB. Converting enzyme inhibition and its withdrawal in spontaneously hypertensive rats. J. Cardiovasc. Pharmacol.; 26:426–436, 1995. 37- Ferreira AJ, Santos RAS. Cardiovascular actions of angiotensin-(1-7). Braz. J. Med. Biol. Res.; 38(4):499-507, 2005. 38- Janke J, Engeli S, Gorzelniak K, Luft FC, Sharma AM. Mature adipocytes inhibit in vitro differentiation of human preadipocytes via angiotensin type 1 receptors. Diabetes; 51:1699–1707, 2002. 39- Velloso LA, Folli F, Sun XJ, White MF, Saad MJ, Kahn CR.Cross-talk between the insulin and angiotensin signaling systems. Proc. Natl. Acad. Sci. U S A; 93:12490– 12495, 1996. 40- Folli F, Saad MJ, Velloso L, Hansen H, Carandente O, Feener EP, Kahn CR. Crosstalk between insulin and angiotensin II signaling systems. Exp. Clin. Encrocrinol. Diabetes; 107:133–139, 1999. 41- Giani JF, Gironacci MM, Muñoz MC, Peña C, Turyn D, Dominici FP Angiotensin-(1 7) stimulates the phosphorylation of JAK2, IRS-1 and Akt in rat heart in vivo: role of the AT1 and Mas receptors. Am J Physiol. Heart Circ. Physiol.; 293(2):H1154-1163, 2007.
12
Receptor Mas deletion induces metabolic syndrome
42- Hansen PB, Yang T, Huang Y, Mizel D, Briggs J, Schnermann J. Plasma renin in mice with one or two renin genes. Acta. Physiol. Scand.; 181(4):431-437, 2004. 43- Haluzik M, Colombo C, Gavrilova O, Chua S, Wolf N, Chen M, Stannard B, Dietz KR, Le Roith D, Reitman ML. Genetic background (C57BL/6J versus FVB/N) strongly influences the severity of diabetes and insulin resistance in ob/ob mice. Endocrinologe; 145(7):3258-3264., 2004 44- Colombo C, Haluzik M, Cutson JJ, Dietz KR, Marcus-Samuels B, Vinson C,Gavrilova O, Reitman ML. Opposite effects of background genotype on muscle and liver insulin sensitivity of lipoatrophic mice. Role of triglycerideclearance. J. Biol. Chem.; 278:3992–3999, 2003. 45- Rodríguez A, Catalán V, Gómez-Ambrosi J, Frühbeck G. Visceral and subcutaneous adiposity: are both potential therapeutic targets for tackling the metabolic syndrome? Curr. Pharm. Des.; 13(21):2169-2175, 2007.
13
Receptor Mas deletion induces metabolic syndrome
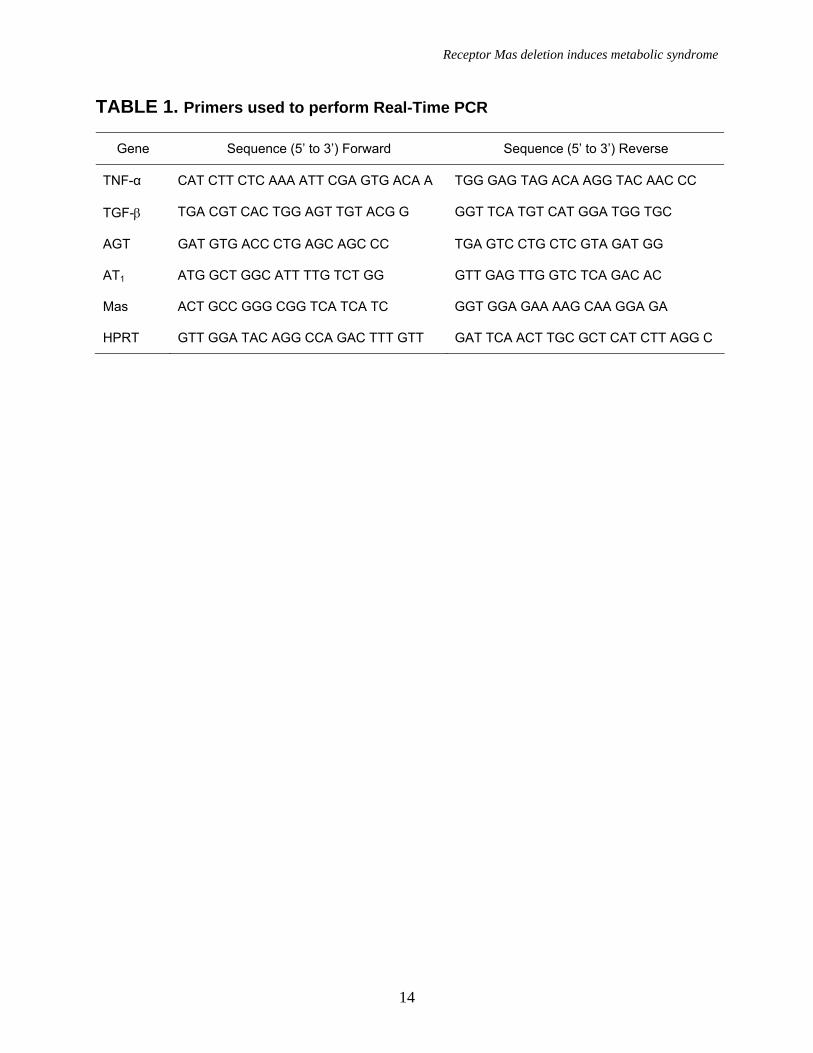
TABLE 1. Primers used to perform Real-Time PCR
Gene Sequence (5’ to 3’) Forward Sequence (5’ to 3’) Reverse
TNF-α CAT CTT CTC AAA ATT CGA GTG ACA A TGG GAG TAG ACA AGG TAC AAC CC
TGF-β TGA CGT CAC TGG AGT TGT ACG G GGT TCA TGT CAT GGA TGG TGC
AGT GAT GTG ACC CTG AGC AGC CC TGA GTC CTG CTC GTA GAT GG
AT1 ATG GCT GGC ATT TTG TCT GG GTT GAG TTG GTC TCA GAC AC
Mas ACT GCC GGG CGG TCA TCA TC GGT GGA GAA AAG CAA GGA GA
HPRT GTT GGA TAC AGG CCA GAC TTT GTT GAT TCA ACT TGC GCT CAT CTT AGG C
14
Receptor Mas deletion induces metabolic syndrome
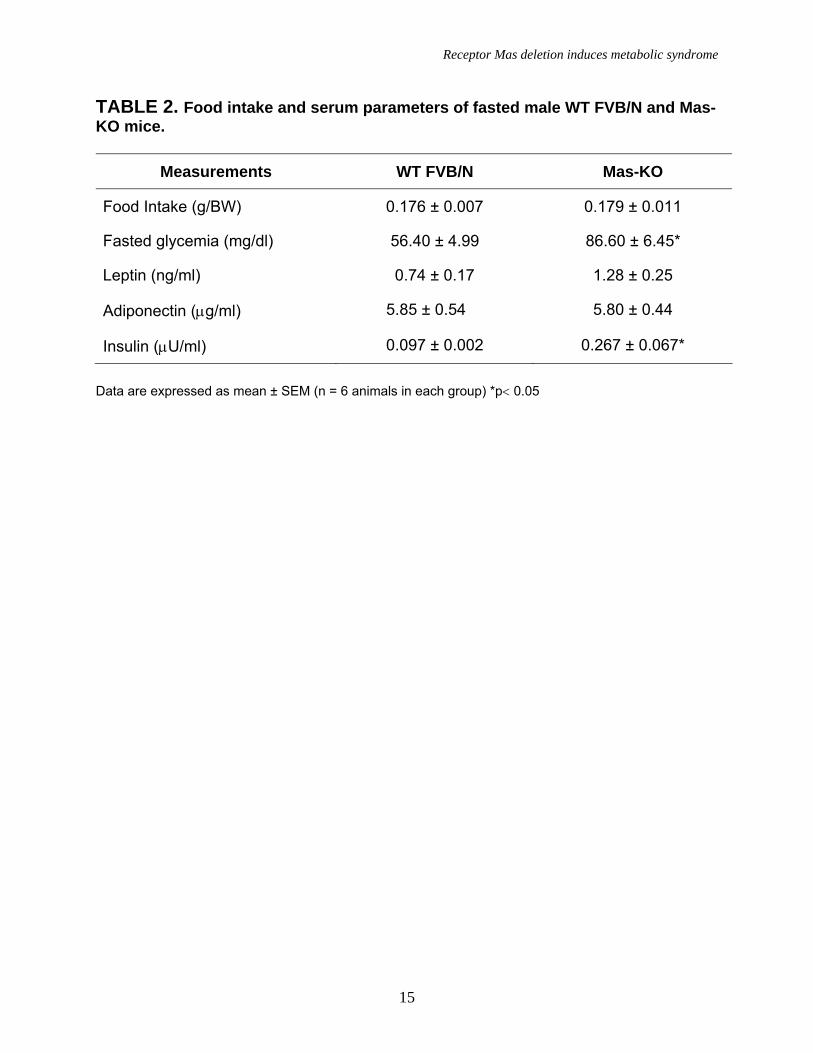
TABLE 2. Food intake and serum parameters of fasted male WT FVB/N and Mas-KO mice.
Measurements WT FVB/N Mas-KO
Food Intake (g/BW) 0.176 ± 0.007 0.179 ± 0.011
Fasted glycemia (mg/dl) 56.40 ± 4.99 86.60 ± 6.45*
Leptin (ng/ml) 0.74 ± 0.17 1.28 ± 0.25
Adiponectin (µg/ml) 5.85 ± 0.54 5.80 ± 0.44
Insulin (µU/ml) 0.097 ± 0.002 0.267 ± 0.067*
Data are expressed as mean ± SEM (n = 6 animals in each group) *p< 0.05
15
Receptor Mas deletion induces metabolic syndrome
FIGURE LEGENDS Figure 1. Mas expression, body weight, and adipose tissue weight. (a) Agarose gel image of Mas mRNA quantification by real-time PCR: 1-mouse epididymal adipose tissue; 2-rat epididymal adipose tissue; 3-mouse testis (positive control); 4- Mas-KO mouse epididymal adipose tissue. (b) Body weight (g) of 10 weeks-old Mas-KO (n = 19) and WT FVB/N (n = 15) male mice. There was no significant difference between the groups. (c) Epididymal adipose tissue weight from Mas-KO (n = 5) and WT FVB/N (n = 5). In Mas-KO mice the tissue weight was significantly increased (p < 0.05) in comparison to WT FVB/N mice. (d) Retroperitoneal adipose tissue weight from Mas-KO (n = 5) and WT FVB/N (n = 5). In Mas-KO mice the tissue weight was significantly increased (p < 0.05) in comparison to WT FVB/N mice. (e) Retroperitoneal and epididymal adipose tissue of Mas-KO and WT FVB/N mice. Figure 2. Hematoxylin-eosin-stained slices of epididymal adipose tissue from Mas-KO (n = 3) and WT FVB/N (n = 3). The diameter of 20 adipocytes of each field was measured; 3 fields from each section; 3 sections in each slide and 3 slides from each animal. (a) Illustrative picture of Mas-KO adipocytes (b) Illustrative picture of WT FVB/N adipocytes (c) Adipocytes diameter. There was no significant difference between the groups Figure 3. Glycemic profile. (a) Insulin-sensitivity test after intraperitoneal injection of insulin (0.75 U/kg body weight) was performed on normal diet mice. Blood samples were collected from the tail at indicated time points and analyzed for glucose concentration. Results are expressed as mean ± SEM from six animals in each group. (b) Glucose-tolerance test. Overnight-fasted mice were given an intraperitoneal injection of glucose (2 mg/g body weight). Data are presented as mean of plasma glucose levels (mg/dl) ± SEM from six mice in each group. Statistically significant differences between the groups are indicated as (*p < 0.05) and (#p < 0.01). (c) Effects of insulin on glucose uptake. Adipocytes taken from WT FVB/N or Mas-KO mice were incubated in a media, in the presence or absence of 25 ng/ml of insulin. Rates of glucose transport were determined by measuring the 2-DOG uptake during a 3-min interval. The data represent means ± SEM (n=4-5). *p<0.05 in Mas-KOin vs. WTin; ** p<0.05 in Insulin vs. Basal (ANOVA); #p<0.02 in Mas-KOb versus WTb (T-Test). b = basal, in = insulin. Figure 4. Lipid profile of Mas-KO (n = 6) and WT FVB/N (n = 6). (a) Serum levels of total cholesterol. (b) Serum levels of triglycerides. (c) Hepatic triglycerides levels. (d) Muscular triglycerides levels. Data are presented as mean ± SEM. Statistically significant differences between the groups are indicated as * p < 0.05 Figure 5. GLUT4 Western blotting analyses of epididymal adipose tissue in Mas-KO (n = 4) and WT FVB/N (n = 3). (a) Western blot for GLUT4 protein Mas-KO and WT FVB/N mice. (b) Illustrative picture of western blotting gel from Mas-KO and WT FVB/N mice. After incubation with primary and secondary antibody for Glut4 detection, the membrane was stripped and incubated with primary and secondary antibody used to detect β–Actin. Data are presented as mean ± SEM. Statistically significant differences between the groups are indicated as * P < 0.05 Figure 6. Adipose tissue mRNA expression performed by Real Time PCR in Mas-KO (n = 6) and WT FVB/N (n = 6) mice. (a) Expression of angiotensinogen (AGT) (b)
16

Receptor Mas deletion induces metabolic syndrome
Expression of TGF-β (c) Expression of TNF-α (d) Expression of Angiotensin II receptor, AT1. *p < 0.05 in comparison to the WT FVB/N group.
17
Receptor Mas deletion induces metabolic syndrome
FIGURE 1
18
Receptor Mas deletion induces metabolic syndrome
FIGURE 2
19
Receptor Mas deletion induces metabolic syndrome
FIGURE 3
20
Receptor Mas deletion induces metabolic syndrome
FIGURE 4
21
Receptor Mas deletion induces metabolic syndrome
FIGURE 5
22
Receptor Mas deletion induces metabolic syndrome
FIGURE 6
23