martines, elena (2006) surfaces with periodic nano-features
TRANSCRIPT

Glasgow Theses Service http://theses.gla.ac.uk/
Martines, Elena (2006) Surfaces with periodic nano-features: physical properties and biocompatibility. PhD thesis http://theses.gla.ac.uk/3900/ Copyright and moral rights for this thesis are retained by the author A copy can be downloaded for personal non-commercial research or study, without prior permission or charge This thesis cannot be reproduced or quoted extensively from without first obtaining permission in writing from the Author The content must not be changed in any way or sold commercially in any format or medium without the formal permission of the Author When referring to this work, full bibliographic details including the author, title, awarding institution and date of the thesis must be given
Surfaces with periodic nano-features.
Physical properties and biocompatibility
Elena Martines
For the degree of PhD at the University of Glasgow, UK
May, 2006
Centre for Cell Engineering
Division of Infection and Immunity
Institute of Biomedical and Life Sciences
University of Glasgow, G12 BOO
United Kingdom

Acknowledgements
I would like to thank all my supervisors, in chronological order. First of all, Prof. Adam Curtis for
giving me the opportunity of completing this work, for being a constant source of advice and
support, and for being an extraordinary example throughout these years. Prof. Chris Wilkinson, for
intermittent but valuable guidance, Prof. Hywel Morgan, for fundamental discussion and for help
during the most difficult times of this project, and finally Dr. Nikolaj Gadegaard.
Three people in particular need my most special thanks: Dr. Mathis Riehle, for his constant and
indispensable guidance and encouragement, Dr. Kris Seunarine, for fabricating all the
nanostructures necessary for this work, and Dr. Lucia Csaderova: when I did not have a desk, Lucia
let me sit next to her fridge for a year. When I did not have cells, she did. When I did not have
food, she fed me. And when she could not help, we had a great laugh. I don't think that I would
have gone all this way without her.
Thanks to Andrew Hart and Gregor Aitchison for cells, photography and the good laugh. Thanks to
Dr. Matt Dalby and Dr. Catherine Berry for advice on the biology, and Dr. Jesus De La Fuente for
practical advice (and salsa?!). Thanks to Ann Macintosh, Margaret Mullin, the IBLS Mechanical
Workshop, Mary Robertson, Davie McCloy, and the early Keiran McGhee.
Thanks to Jean-Christophe, Clair, Jordi and Craig for being my beloved foster-family all this time,
and putting up with me during the last year, and (Craig) making me all those cups of tea! I will
miss you all a lot.
Finally, I would like to thank my parents, for watching patiently while I try to find my own way,
far, far away from home.
2

I hereby declare that the research reported in this thesis is my own work, except otherwise stated,
and that it has not been submittedfor any other degree.
Elena Martines
3
Table ofcontents
Table of contents
Abstract 8
1 Introduction 8
2 Super-hydrophobicity and super-hydrophilicity of regular
nanopatterns 17
2.1 Introduction 18
2.2 Materials and methods 23
2.2.1 Fabrication of silicon nanopatterns 23
2.2.2 Surface modification of silicon nanopatterns 24
2.2.3 Replication of silicon nanopatterns into PCl: Thumb-Embossing 24
2.2.4 Sample characterization 24
2.3 Theoretical Models 26
2.3.1 Hydrophobic surfaces 26
2.3.2 Hydrophilic surfaces 27
2.4 Results 28
2.4.1 Sample characteristics 28
2.4.2 Contact angles 32
2.5 Discussion 34
2.5.1 FTA measurements 34
2.5.2 Hydrophilic silicon nanopatterns 35
2.5.3 Hydrophobic silicon nanopatterns 36
2.5.4 PCl replicas 41
2.6 Conclusion 42
4
Table ofcontents
3 The Dlva force between a micro-sphere and regular sub-
micrometric patterns: a Surface Element Integration study 44
3.1 Introduction 45
3.2 Theoretical background 47
3.2.1 The van der Waals force .48
3.2.2 The electric double-layer force 49
3.2.3 Surface potential and ~-potential 52
3.2.3 The DLVO theory 52
3.2.5 The Derjaguin approximation 53
3.2.6 Other non-DLVO forces 54
3.3 Surface Element Integration (SEI) 54
3.4 Modelling 56
3.5 Results 59
3.5.1 Flat control: SEI and DA 60
3.5.2 Nano-pits and nano-pillars: SEI 60
3.5.3 Small asperities 20d20h. SEI and Suresh's modeL 66
3.6 Discussion 68
3.7 Conclusion 70
4 Cell reaction to nano-pillars 71
4.1 Introduction 72
Part 1. Cells on regular nano-pillars
4.2
4.2.1
4.2.2
4.2.3
4.2.4
4.3
4.4
Materials and Methods. I 76
Fabrication of the nanopatterns 76
Cell culture 77
Cell staining and Imaging 78
Data analysis 80
Initial results: why pillars and not pits 82
Results. I 85
5
Table ofcontents
4.4.1 Samples 85
4.4.2 Cell counts, morphology and surface coverage 88
4.4.3 ActinNinculin staining 96
4.4.4 Protein coating 99
4.4.5 Further work on hTERT 103
4.5 Discussion. I 109
4.5.1 Fabrication 109
4.5.2 Cell culture 109
Part II. Cells on irregular nano-pillars
4.6 Materials and Methods. II. 115
4.6.1 Fabrication and preparation of the replicas 115
4.6.2 Cell culture 115
4.7 Results. II 116
4.7.1 Fabrication 116
4.7.2 Cell culture: hTERT 119
4.7.3 Cell culture: B.End3 122
4.7.4 Cell culture: BHK21 123
4.7.5B.End3
Cell culture: comparison between regular and irregular nanopatterns. HTERT and125
4.8 Discussion II. Regular or irregular nanopatterns? 127
4.9 Conclusion 128
5 Cell flow on nano-pits 129
5.1 Introduction 130
5.2 Materials and Methods 130
5.2.1 Fabrication of the nanopatterns 130
5.2.2 Fabrication of the flow chamber 132
5.2.3 Flow apparatus 134
5.2.4 Cell culture 136
5.3 Results 137
6
Table ofcontents
5.3.1 Nanopatterned replicas 137
5.3.2 Flow chamber and flow apparatus 137
5.3.3 Cell adhesion 138
5.4 Discussion 138
5.4.1 Flow apparatus 138
5.4.2 Initial cell adhesion 139
5.5 Conclusion 141
5.6 Appendix: fluid dynamics 141
5.6.1 Reynolds number 142
5.6.2 Entrance length 143
5.6.3 Wall shear rate 143
5.6.4 Wall shear rate of blood in vessels 144
6 Final discussion 145
7 Conclusion 150
8 Appendix. Solutions 151
9 Bibliography 153
10 Publications 166
7
Abstract
Abstract
The behaviour of animal cells in vitro is affected by both the chemistry and the shape of the surface
("topography") to which they adhere. Culturing animal cells on nanopatterns of different shape,
dimensions and chemistry considerably modifies cell attachment, spreading, proliferation,
migration and gene expression. However, despite this ever-increasing amount of information, very
little is known about how nanotopography alters the surface phenomena that underlie cell
attachment and behaviour.
This work was primarily aimed at elucidating the influence of nanopatterning on some physical
properties of the substrate. The contact angle of water on nanopatterned silicon was measured, and
the predicted DLVO (Derjaguin-Landau-Verweey-Overbeek) interaction between a nanopatterned
silica plate and a microsphere was calculated. After the physical measurements, the silicon
nanopatterns were replicated into a biocompatible polymer, and further experimental investigations
of the response of biological cells to nano-pillared samples were carried out. Finally, in the last
chapter a flow system was designed, in order to determine the influence of a nano-pitted interface
on the initial adhesion of cells subjected to hydrodynamic forces.
Surface texture has a great influence on both the wetting and the interfacial properties of the
substrate. In this thesis, I show that the contact angles on nano-topographies are linked to the
geometry and chemistry of the pattern by defined analytical rules. Contact angle measurements
also proved that air-trapping can happen at a nanopatterned biomaterial surface. On the other hand,
a SEI (Surface Element Integration) study predicts that the adhesion of a microsphere onto a plate
should be strongly favoured by nanopatterned regular protrusions, and that the shape of the
protrusions is a determining factor in this process.
My results on cell behaviour confirm previous observations that some particular nano-patterns can
inhibit the proliferation of fibroblasts in vitro. It is also shown how cell-specific this response can
be, and possible explanations for this behaviour, including air-trapping at the interface, are
discussed.
1 Introduction
Many cells adhere to the extracellular matrix (ECM) throughout most of their lifetime. This close
contact with the matrix exerts an extraordinary control on the behaviour of cells, determining
whether they move or stay put, proliferate or remain quiescent, and even live or die. The
interactions of the cells with the extracellular matrix and with each other play a major role in
embryogenesis (Danen, 2003) and the maintenance of tissue integrity (Gumbiner, 1996).
8
2. Contact angles on nano-patterns
Impairment of these interactions (i.e. the ability of cell to attach) are found in numerous
pathological conditions, including tumor invasion and metastasis (Rovenski, 1998).
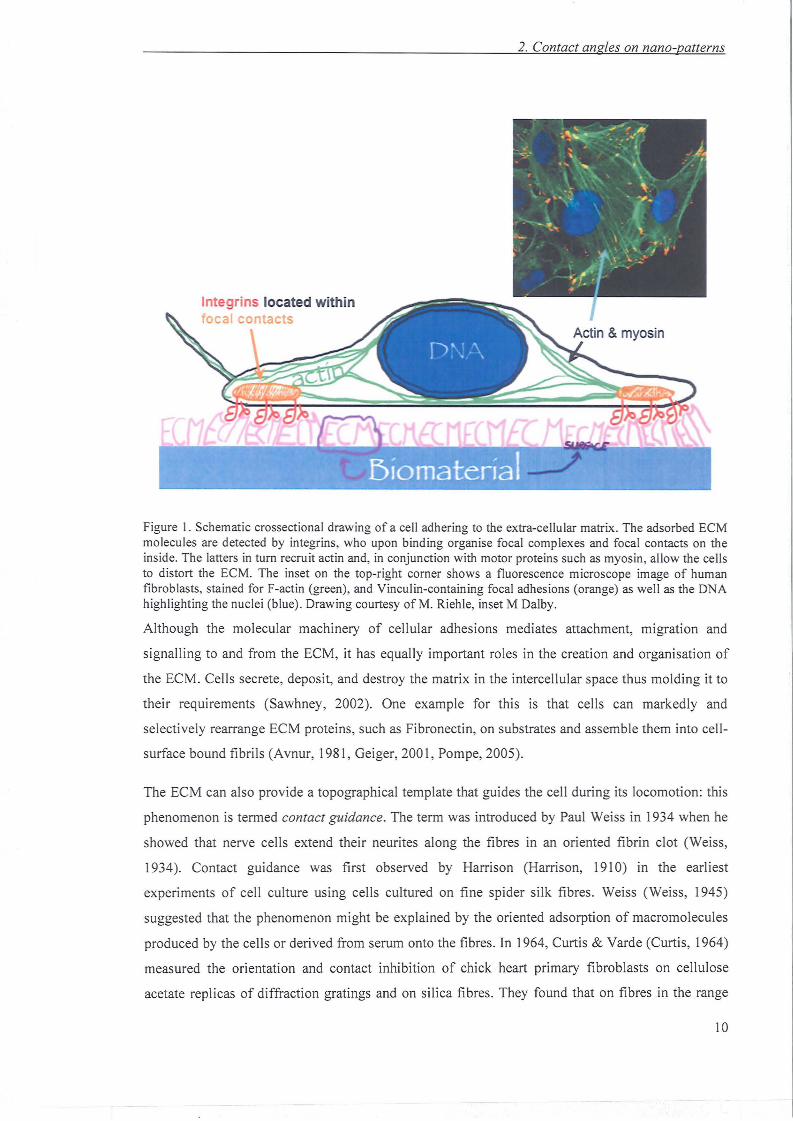
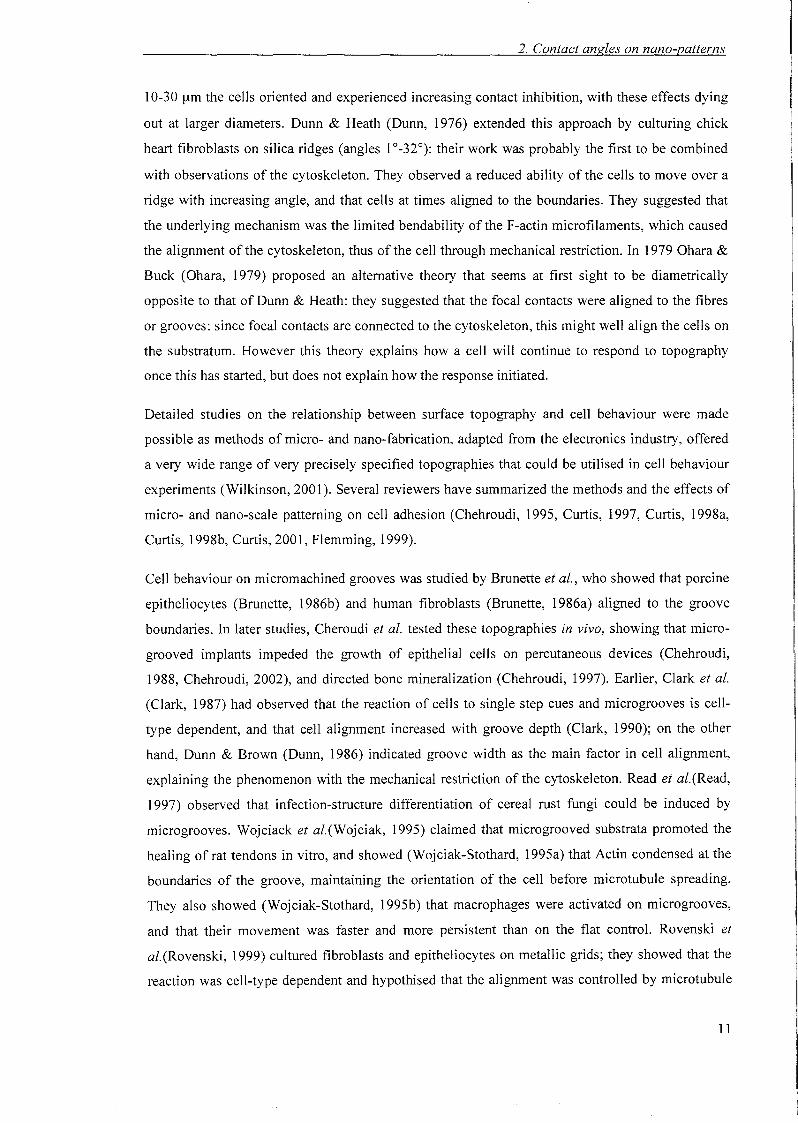
Figure 1 illustrates how cells adhere to their surrounding environment. The effects of the
extracellular matrix are thought to be primarily mediated by Integrins, a family of cell adhesion
molecules that are specific transmembrane receptors, which attach the cells to the matrix and
mediate mechanical and chemical signals from it (DeMali, 2003, Giancotti, 2003, Gillespie, 2001,
Hynes, 2002, Zamir, 2001). Integrins mediate trans-membrane connections between ECM proteins
such as Collagen, Laminin, and Elastin on the outside and the cell cytoskeleton on the inside. The
cytoskeleton is a system of protein filaments crisscrossing the cytoplasm and forming, together
with the many proteins that attach to them, a system of "ropes" and "motors" that gives the cell
mechanical strength, controls its shape, and drives and guides its movements; the network of Actin
filaments shown green in Figure 1 is one of the many cytoskeletal components. Katz et al.(Katz,
2000) established that the physical state of the extracellular matrix (and not only its molecular
composition) can regulate Integrin-mediated cytoskeletal assembly and tyrosine phosphorylation to
generate two distinct types of cell-matrix adhesions: fibrillar adhesions, which are enriched in
Tensin, and "classical" focal contacts (as observed by Izzard et al.(Izzard, 1976)) which contain
high levels ofPaxillin and Vinculin. They propose that the rigidity of the extracellular matrix is one
of the mechanisms that control the molecular organisation of adhesion sites, a hypothesis that was
later extended to include the control of cell locomotion (Pelham, 1997, Lo, 2000, Kaverina, 2002).
Also, Vinculin-containing focal complexes (Geiger, 2001) are a further category of cell-matrix
adhesions: these are small, dot-like adhesions that are present mainly at the cell edge, and that can
be associated with cell migration or serve as precursors offocal adhesions.
When cells are cultured in vitro, they do not usually form adhesions directly with the substrate, but
rather with the proteins that are adsorbed onto the material. Upon the first contact of growth
medium with a biomaterial, proteins adsorb on its surface, forming a distribution or arranging in
clusters to which cells adhere (Castner, 2002). It is becoming clearer that the clustering of
Integrins, rather than their average distribution, is the main factor determining the ability of cells to
attachment and migration (Arnold, 2004, Maheshwari, 2000). Finally, another significant factor in
cell growth is the influence of external mechanical forces due to e.g. flowing extracellular fluids
(Tsuruta, 2003, Bongrand, 1994, Bongrand, 1995).
9
2. Contact angles on nano-patterns
Figure I. Schematic crossectional drawing of a cell adhering to the extra-cellular matrix. The adsorbed ECMmolecules are detected by integrins, who upon binding organise focal complexes and focal contacts on theinside. The latters in tum recruit actin and, in conjunction with motor proteins such as myosin, allow the cellsto distort the ECM . The inset on the top-right corner shows a fluorescence microscope image of humanfibroblasts, stained for F-actin (green), and Vinculin-containing focal adhesions (orange) as well as the DNAhighlighting the nuclei (blue). Drawing courtesy of M. Riehle, inset M Dalby.
Although the molecular machinery of cellular adh esions mediates attachment, migration and
signalling to and from the ECM , it has equally important roles in the creation and organi sation of
the ECM. Cells secrete , depo sit, and destroy the matrix in the intercellular space thu s molding it to
their requirements (Sawhney, 200 2). One example for thi s is that cells can markedly and
select ively rearrange ECM proteins, such as Fibronectin, on substrates and assemble them into cell
surface bound fibril s (Avnur, 1981, Geiger, 200 I, Pompe, 2005).
The ECM can also provide a topographical template that guides the cell during its locomotion: this
phenomenon is term ed contact guidance. The term was introduced by Paul Weis s in 1934 when he
showed that nerv e cells extend their neurites along the fibr es in an oriented fibrin clot (Weiss,
1934). Contact guidance was first observed by Harri son (Harrison, 1910) in the earliest
experiments of cell culture using cells cultured on fin e spider silk fibres . Weiss (W eiss, 1945)
sugges ted that th e phenomenon might be explained by the orient ed adsorption of macromolecules
produced by the cells or derived from serum onto the fibres. In 1964, Curtis & Yarde (Curtis, 1964)
measured the orientation and contact inhibition of chick heart primary fibrob lasts on cellulose
acetate replicas of diffraction gratings and on silica fibres. They found that on fibr es in the range
10
2. Contact angles on nano-patterns
10-30 um the cells oriented and experienced increasing contact inhibition, with these effects dying
out at larger diameters. Dunn & Heath (Dunn, 1976) extended this approach by culturing chick
heart fibroblasts on silica ridges (angles 10_32 0) : their work was probably the first to be combined
with observations of the cytoskeleton. They observed a reduced ability of the cells to move over a
ridge with increasing angle, and that cells at times aligned to the boundaries. They suggested that
the underlying mechanism was the limited bendability of the F-actin microfilaments, which caused
the alignment of the cytoskeleton, thus of the cell through mechanical restriction. In 1979 Ohara &
Buck (Ohara, 1979) proposed an alternative theory that seems at first sight to be diametrically
opposite to that of Dunn & Heath: they suggested that the focal contacts were aligned to the fibres
or grooves: since focal contacts are connected to the cytoskeleton, this might well align the cells on
the substratum. However this theory explains how a cell will continue to respond to topography
once this has started, but does not explain how the response initiated.
Detailed studies on the relationship between surface topography and cell behaviour were made
possible as methods of micro- and nano-fabrication, adapted from the electronics industry, offered
a very wide range of very precisely specified topographies that could be utilised in cell behaviour
experiments (Wilkinson, 2001). Several reviewers have summarized the methods and the effects of
micro- and nano-scale patterning on cell adhesion (Chehroudi, 1995, Curtis, 1997, Curtis, 1998a,
Curtis, 1998b, Curtis, 2001, Flemming, 1999).
Cel1 behaviour on micromachined grooves was studied by Brunette et a!., who showed that porcine
epitheliocytes (Brunette, 1986b) and human fibroblasts (Brunette, 1986a) aligned to the groove
boundaries. In later studies, Cheroudi et a!. tested these topographies in vivo, showing that micro
grooved implants impeded the growth of epithelial cells on percutaneous devices (Chehroudi,
1988, Chehroudi, 2002), and directed bone mineralization (Chehroudi, 1997). Earlier, Clark et al.
(Clark, 1987) had observed that the reaction of cells to single step cues and microgrooves is cell
type dependent, and that cell alignment increased with groove depth (Clark, 1990); on the other
hand, Dunn & Brown (Dunn, 1986) indicated groove width as the main factor in cell alignment,
explaining the phenomenon with the mechanical restriction of the cytoskeleton. Read et al.(Read,
1997) observed that infection-structure differentiation of cereal rust fungi could be induced by
microgrooves. Wojciack et al.(Wojciak, 1995) claimed that microgrooved substrata promoted the
healing of rat tendons in vitro, and showed (Wojciak-Stothard, 1995a) that Actin condensed at the
boundaries of the groove, maintaining the orientation of the cell before microtubule spreading.
They also showed (Wojciak-Stothard, 1995b) that macrophages were activated on microgrooves,
and that their movement was faster and more persistent than on the flat control. Rovenski et
al.(Rovenski, 1999) cultured fibroblasts and epitheliocytes on metallic grids; they showed that the
reaction was cell-type dependent and hypothised that the alignment was controlled by microtubule
11
2. Contact angles on nano-patterns
organisation. Li et al.(Li, 2001) studied the migration of endothelial cells in microgrooves, showing
that the cells aligned and migrated faster in the direction of the groove, with focal adhesions
oriented in the direction of migration. Turner et al.(Turner, 2000) cultured astroglial cells on
micropillars (width 0.5-2 urn, height 1 urn, pitch 1-5 urn). They showed that the cells were more
confluent on the pillars (70% more cells than on the flat control), although they did not create
adhesions with the bottom of the surface.
With the rapid improvement of fabrication techniques, surface textures at the nano-scale could be
fabricated, and the influence ofnanotopographies on cell behaviour was studied. The fabrication of
nano-patterned substrates can be achieved with high precision techniques like photolithography and
electron beam lithography (EBL). EBL yields a lateral resolution as high as 5-10 nm, but
unfortunately, although very precise, it is also expensive and time consuming, especially if large
areas need to be patterned. To overcome these inconvenients, it is possible to replicate the substrate
topography by embossing a master mold into polymers (Casey, 1997), which also allows the
combination of the topography with different surface chemistries.
In 1991, Clark et al.(Clark, 1991) proved that BHK,1 MDCK2 and chick embryo neural cells
aligned on nanometrically wide and deep quartz grooves, and that their degree of alignment and
elongation was cell type-dependent. Wojciack-Stothard et al.(Wojciak-Stothard, 1996) cultured
macrophages on micrometrically-wide grooves and ridges of depth between 30 and 282 nm (in
fused silica), and concluded that cells on the nanometrically deep grooves were activated as they
showed higher phagocytic activity. More recently, Stavridi et al.(Stavridi, 2003) showed that poy
s-caprolactone nano-grooves (width 450 nm, depth 190 nm) attracted more platelets and induced
faster platelet coagulation in a parallel-plate flow chamber. When nano-pillars started to be
fabricated (Casey, 1997), Curtis et al.(Curtis, 2001) could observe that the number of animal cells
on regular silicon nano pillars decreased with time; however, when the nano-pillars were randomly
arranged this effect was less pronounced. Gallagher et al.(Gallagher, 2002) cultured rat epitenon
fibroblasts' on nano-pits made of poly-s-caprolactone, and observed that the cells on the nano-pits
had smaller focal adhesions and smaller spreading area; by coating the substrates with Poly-L
Lysine, they could conclude that surface chemistry did not override the effects ofnanotopography.
1.!2.aby hamster kidney cells: fibroblastic cells.
2 Madin-Darby £anine kidney: polarised kidney epithelial cells with microvilli.
3 a fibroblastic cell line extracted from the Epitenon sheath that surrounds the flexor tendon of
Sprague-Dawley rats.
12
2. Contact angles on nano-patterns
Dalby et al.(Dalby, 2004) cultured human fibroblasts on nano-columns (height 160 nm, diameter
100 nm, average pitch 230 nm), showing that after 3 h the Actin cytoskeleton was less organised on
the nanopattern, and that the focal adhesions were smaller and very faint compared to the flat
control. The effects of nano-piIIars and nano-pits on cell adhesion are discussed in more detail in
Chapter 4. For now suffice it to say that a variety of cell reactions to nanotopographies have been
reported, from alignment to increased migration speed, from apoptosis to enhanced spreading,
engulfing of the asperities, modified gene expression, elongation, inhibited proliferation; and these
in tum depended on the cell type and on the shape, dimensions, regularity and chemistry of the
surface textures (Flemming, 1999).
The responses of cells to nanotopographies have raised several questions concerning the nature of
these interactions, since the size of the surface features is at least two orders of magnitude smaller
than the cells. Mechanical restriction is not a possibility at this scale. MJ. Dalby(Dalby, 2005) has
suggested that topographically-induced mechanotransduction might be a reason for decreased cell
growth. Another potential explanation could be a change in protein adsorption and activity due to
the surface patterns (Denis, 2002, Riedel, 2001). The dependence of cell adhesion, spreading,
proliferation and differentiation on the surface energy and, in tum, on the protein
adsorption/conformation on a substrate is a very complex subject, even without considering any
additional topographical factors. Studies on protein-resistant surfaces (Ostuni, 2001) indicate that
the water shell on the surface plays an important role (Herrwerth, 2003), which can be expressed in
terms of hydrophobicity-hydrophilicity at the macroscopic scale (Vogler, 1998). However, an
unequivocal relation between cell behaviour, surface energy and protein adsorption has not been
established yet (Lim, 2004, Ostuni, 2001, Vogler, 1998, Garcia, 1999, McClary, 2000, Spijker,
2002, Ruardy, 1997).
The nanopatterns might also influence cell attachment by simply reducing the surface area
available for focal adhesion formation. This in tum, could be due to the inability of the cells to
form adhesion sites with the bottom surface between asperities (with heights of order 100 nm).
Alternatively, it could be due to the presence of nano-bubbles (nano-cavities) of air trapped in
between asperities, which would shield the adsorption of proteins on the substrate from the growth
medium, and on which the cells cannot form adhesions. One way of investigating the occurrence of
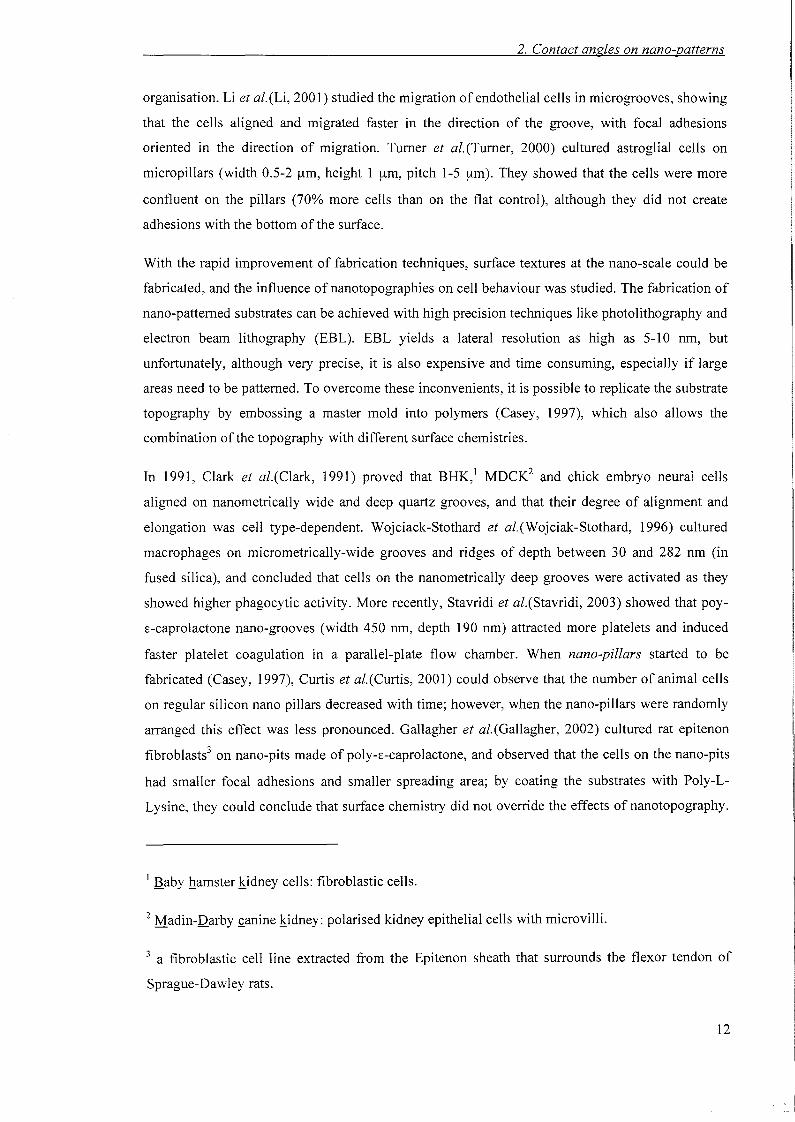
air-trapping on a substrate is to determine its wettability by contact angle measurements (Figure 2).
The wettability of a substrate depends primarily on the surface energy of the material, i.e. on its
chemical composition. The relation between the surface energies of the three phases and the
equilibrium static contact angle Oy is formulated by the Young-Dupre (Young, 1805) equation (eq
1):
13
COSey = Ysv - YSL
YLV
2. Contact angles on nana-patterns
(1)
Figure 2. Dynamic contact angle measurements.
where YfJ is the surface tension ofthe interface Il, and the letters S, V, L designate the solid, vapour
and liquid phase respectively. If YSV<YSL the surface will be hydrophobic, i.e. cos8>nl2. If YSV>YSL
the surface will be hydrophilic, i.e. cos8<n/2. However, other criteria for defining hydrophobicity
and hydrophilicity have been suggested (Vogler, 1998).
Eq 1 assumes that the surface is ideal, i.e.
chemically and topographically
homogeneous, and yields the ideal
equilibrium (or Young) contact angle ()y of a
static drop (Figure 2a). However, during the
wetting of chemically and/or
topographically heterogeneous surfaces not
a single, but a range of metastable static
contact angles can form at the edge of the
interface. These can be observed during
dynamic contact angle measurements (Figure 2b), where the advancing angle ()adv is the maximum
static angle and the receding angle ()rec is the minimum static angle. The contact angle hysteresis L1()
is the difference between these two boundaries (L1 ()= ()adv-()rec). If the energy barrier between
metastable states can be overcome, for instance by vibrating the surface (Meiron, 2004), the ideal
contact angle can be measured. Surface roughness is observed to affect the contact angle, but
differently according to the wettability region. On rough hydrophilic surfaces, the Wenzel model
predicts the contact angles to be smaller than the corresponding Young angle (Quere, 2002);
however, recent evidence (Abdelsalam, 2005) shows that on substrates with 8y=70°, air-trapping in
the roughness can increase the contact angle. On hydrophobic surfaces, as the roughness increases,
first the hysteresis increases significantly; then both advancing and receding angles suddenly
increase while the hysteresis nearly vanishes. These two regimes are called, respectively, Wenzel
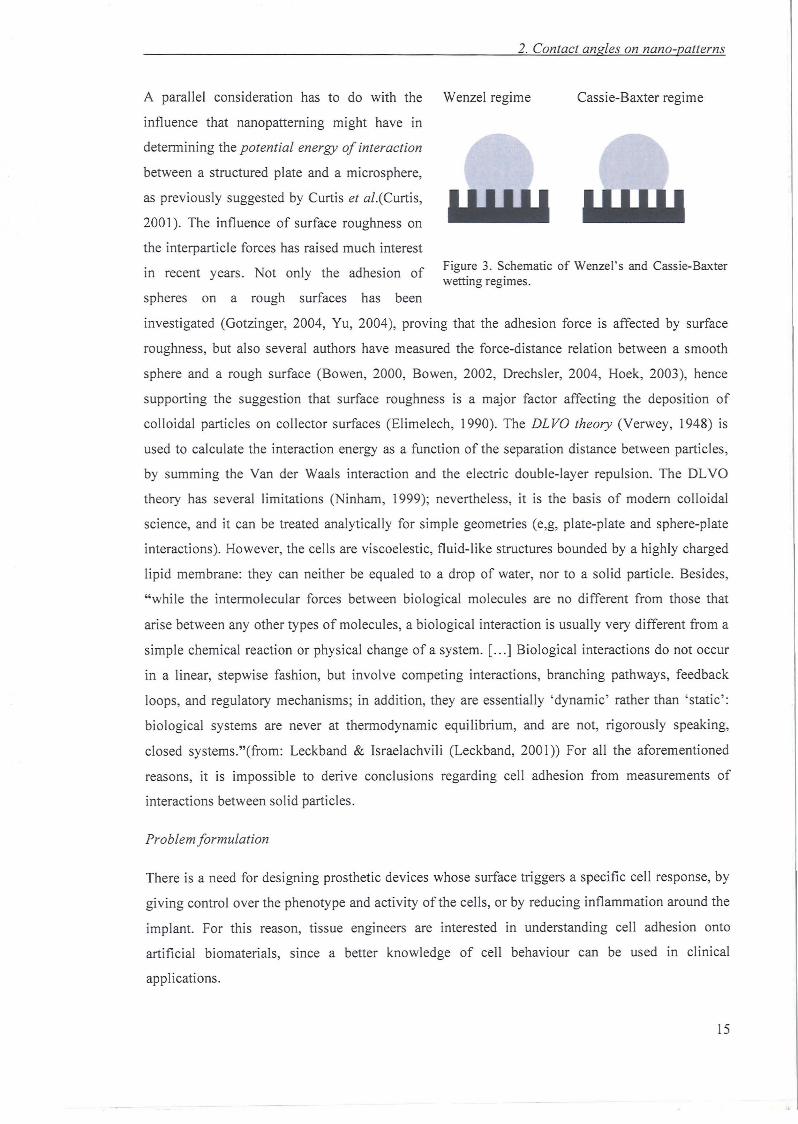
and Cassie-Baxter regime (Figure 3), and will be discussed in more detail in Chapter 4. The
Cassie-Baxter regime corresponds to the onset of air-trapping amongst the surface asperities.
14
2. Contact angles on nano -patterns
Cassie-Baxter regime
Figure 3. Schematic of Wenzel' s and Cassie-Baxterwetting regimes.
A parall el consideration has to do with the Wenzel regime
influence that nanopatteming might have in
determining the potential energy of interact ion
between a structured plate and a microsphere,
as previously suggested by Curtis et al.(Curtis,
2001). The influence of surface roughn ess on
the interparticle forces has raised much interest
in recent years. Not only the adhesion of
spheres on a rough surfaces has been
investigated (Gotzinger, 2004, Yu, 2004), proving that the adhesion force is affected by surface
roughn ess, but also several authors have measured the force-distan ce relation between a smooth
sphere and a rough surface (Bowen, 2000, Bowen, 2002, Drechsler, 2004, Hoek, 2003), hence
supporting the suggestion that surface roughn ess is a major factor affecting the deposition of
colloidal particles on collector surfaces (Elimel ech, 1990). The DI Va theory (Verwey, 1948) is
used to calculate the interaction energy as a function of the separation distance between particles,
by summing the Van der Waals interaction and the electric double-layer repulsion. The DLVO
theory has several limitations (Ninham, 1999); nevertheless, it is the basis of modem colloidal
science, and it can be treated analytically for simple geometries (e,g, plate-plate and sphere-plate
interactions). However, the cells are viscoelestic, fluid-like structures bounded by a highly charged
lipid membran e: they can neither be equaled to a drop of water, nor to a solid particle. Besides,
"while the intermole cular forces between biological molecules are no different from those that
arise between any other types of molecules, a biological interaction is usually very different from a
simple chemical reaction or physical change of a system. [... ] Biological interactions do not occur
in a linear, stepwise fashion, but involve competing interactions, branching pathway s, feedback
loops, and regulatory mechanisms; in addition, they are essentially 'dynamic' rather than ' static' :
biological systems are never at thermodyn amic equilibrium, and are not, rigorously speaking,
closed systems." (from: Leckband & Israelachvili (Leckband, 2001» For all the aforementioned
reasons, it is impossible to derive conclusions regarding cell adhesion from measurements of
interactions between solid particles.
Problem formulation
There is a need for designing prosthetic devices whose surface triggers a specific cell response, by
giving control over the phenotyp e and activity of the cells, or by reducing inflammation around the
implant. For this reason, tissue engineers are interested in understanding cell adhesion onto
artificial biomaterials, since a better knowledge of cell behaviour can be used in clinical
applications.
15
2. Contact angles on nano-patterns
However, despite the increasing amount of literature on the effect of nanopattemed surfaces on cell
behaviour in vitro, there is no unequivocal understanding of the influence of nano-textures on
animal cells. There are many reasons for this, including the difficulty of accurately controlling the
feature dimensions at this scale, the fact that biological experiments are subject to a high degree of
variability and the interdisciplinarity required to succeed in "biological surface science". The use of
nanofabrication technology for medical purposes is waiting for unifying concepts that could finally
lead to the predictability and application of nanotopography-induced cell behaviour, in order to
improve prosthetic implants or other medical devices that involve prolonged contact with living
cells. The way to such knowledge needs to go through physical chemistry and colloid and surface
science. Therefore, on one hand investigating the effect of nanotopography on cells needs to
become more systematic and rigorous, especially since the modem fabrication techniques allow
increasingly good control over surface features. On the other hand, there is a clear need to
understand how the nanotopography affects other surface properties, like the occurrence of air
trapping, the deposition of colloidal particles or the adsorption of proteins. The present study has to
be understood in this dual context: first and foremost, this work was aimed at elucidating the
influence of nanopatteming on some physical properties of the substrate, such as the contact angle
of water on silicon (Chapter 4), and the predicted DLVO interaction between a plate and a
microsphere (Chapter 3). Subsequently, the nanopattems were replicated in a biomaterial, and
further experimental investigation of the response of biological cells to nanotopographies (Chapter
4 and Chapter 5) were carried out, following the work initiated by J. Gallagher and Dalby et
al.(Dalby, 2004, Gallagher, 2002). By gaining a better understanding of some physical phenomena
at the nano-scale, a first step is done towards a causal formulation of the effects of nanopattems on
the behaviour of biological cells.
16
2 Super-hydrophobicity and super-hydrophilicity
of regular nanopatterns
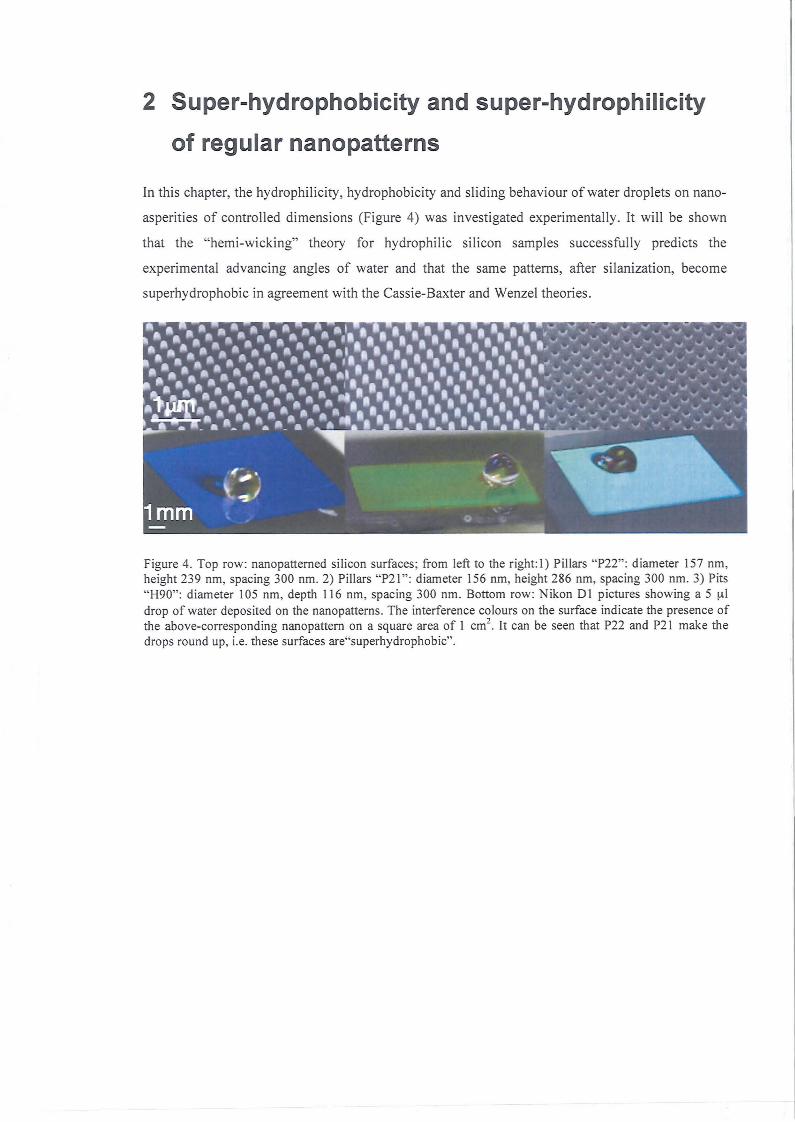
In this chapter, the hydrop hilicity, hydrop hobicity and sliding behaviour of water droplets on nano
asperi ties of controlled dimensions (Figure 4) was investigated experimentally. It will be shown
that the "hemi-wicking" theory for hydroph ilic silicon samples successfully predicts the
experimental advancing angles of water and that the same patterns , after silanization, become
superhy drophobic in agreement with the Cassie-Baxter and Wenzel theories .
Figure 4. Top row: nanopatterned silicon surfaces ; from left to the right:I) Pillars "P22" : diameter 157 nrn,height 239 nm, spacing 300 nm. 2) Pillars "P21": diameter 156 nm, height 286 nm, spacing 300 nm. 3) Pits"H90": diameter 105 nm, depth 116 nm, spac ing 300 nm. Bottom row: Nikon Dl pictures showing as f-lldrop of water deposited on the nanopatterns. The interference colours on the surface indicate the presence ofthe above-corresponding nanopattern on a square area of 1 crrr' . It can be seen that P22 and P21 make thedrops round up, i.e. these surfaces are"superhydrophobic".
2. Contact angles on nano-patterns
2.1 Introduction
The wettability of solid surfaces is a subject that has raised great interest in the past decades. The
surface energy of a sample will determine if a drop of a given liquid, when deposited on it, will
assume a bead-like shape (indicating that the liquid is being repelled by the surface), or if it will
spread and wet the substrate. Roughening the surface enhances its repellent or wetting properties
(Bico, 2002), resulting in "superhydrophobic" or "superhydrophilic" textures (this nomenclature
applies if the liquid considered is water, as is the case in this work). These structures raise great
interest for potential applications, e.g. in the development of self-cleaning surfaces, or in
wettability-driven microtluidics (Blossey, 2003, Grunze, 1999).
Many authors have contributed to the fabrication and understanding of superhydrophobic surfaces
(Bico, 1999, Furstner, 2005, Lafuma, 2003, Lau, 2003, Marmur, 2004, Miwa, 2000, Nakae, 1998,
Onda, 1996, Oner, 2000, Patankar, 2003, Patankar, 2004b, Quere, 2003, Shibuichi, 1996,
Yoshimitsu, 2002). Oner&McCarthy(Oner, 2000) describe a superhydrophobic surface as one
where the advancing angle ()adv is very high (generally>150°), and the receding angle ()rec is such
that the drop exhibits low hysteresis jj()(jj8=()adv-()reJ, as illustrated in Figure 2.
Water drops form beads and can roll off superhydrophobic surfaces, cleaning them in the process,
by picking up surface contaminants. This phenomenon has been termed the "Lotus effect" (Figure
5), since it is very pronounced on the leaves of the Lotus plant (Nelumbo nucifera) (Barthloot,
1997, Furstner, 2005, Neinhuis, 1997). These leaves exhibit a double-structured roughness, where
sub-micrometric wax crystals cover a larger micrometric structure; even though multi-scale
roughness has been proven to enhance water repellency (Herminghaus, 2000, Otten, 2004,
Shirtcliffe, 2004, Shirtcliffe, 2005). it has been suggested that the small scale roughness plays an
important role (Patankar, 2004a).
18
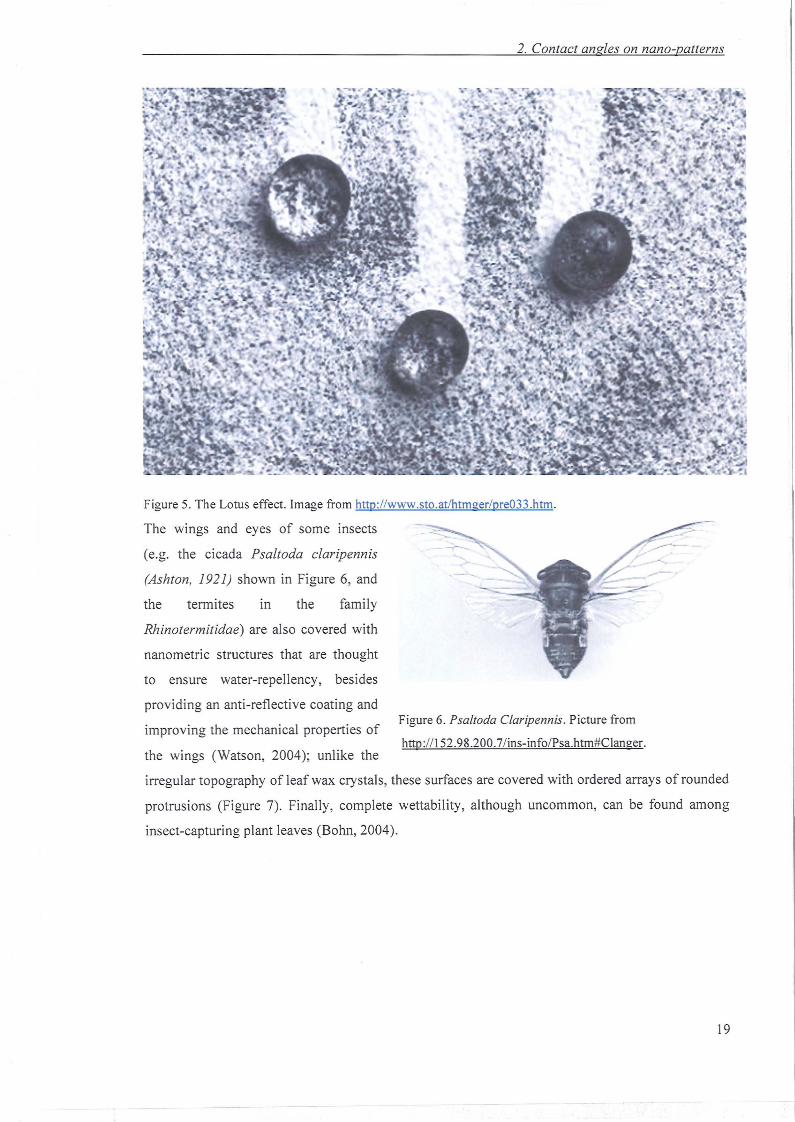
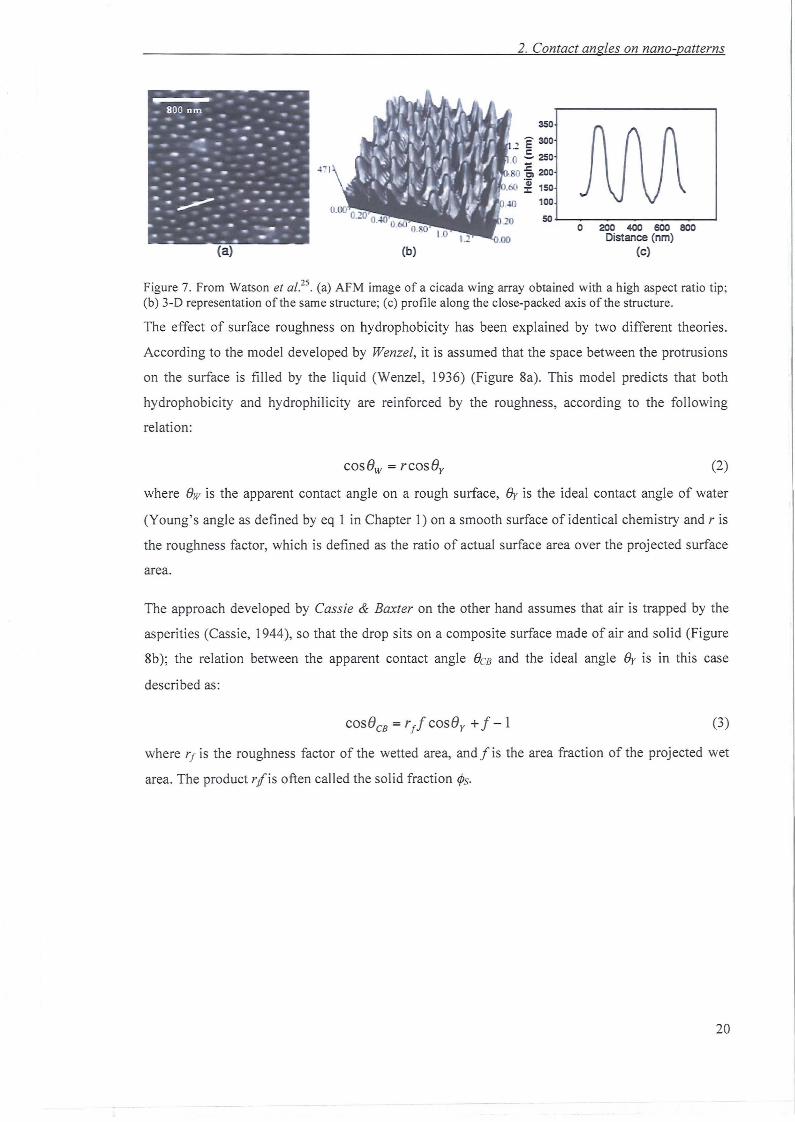
Figure 6. Psa ltoda Claripennis . Picture from
http://152 .98.200.7/ins-info/Psa.htm#Clanger.
2. Contact angles on nano-patterns
Figure 5. The Lotus effect. Image from http ://www.sto .atlhtmger/pre033 .htm.
The wings and eyes of some insects
(e.g. the cicada Psaltoda claripennis
(Ashton, 1921) shown in Figure 6, and
the termites in the family
Rhinotermitidae) are also covered with
nanometric structures that are thought
to ensure water-repell ency, besides
providing an anti -refl ective coating and
improving the mechanical prop erties of
the wings (Watson, 2004); unlike the
irregu lar topography of leaf wax crystal s, these surfaces are covered with ordered array s of rounded
protrusions (Figure 7). Fina lly, compl ete wettability, although uncommon, can be found among
insect-capturing plant leaves (Bohn, 2004).
19
2. Contact angles on nano-patterns
(a)
o 200 400 600 800Distance (om)
(e)
350
, E 300- I:o - 250
80 ~ 200
.(:(, ~ 150
10050 "--~- - _'
(b)
471
-. --· - -- .. ..
___ e ...
• ' 800 nm, . • _.- . . .· . .. - .. ~· . . ..~. -4 - • - _• .
~ . . . .· . ' .. .. ..- : ~ .._. _- .-. . - - - - _ . : ~ .~ ..· . -- . . ... ..~ ... '. .. . .· .. "",- " .. ,- ,. .... . . . - .. .. .. .. . . . .-._......._ r.-
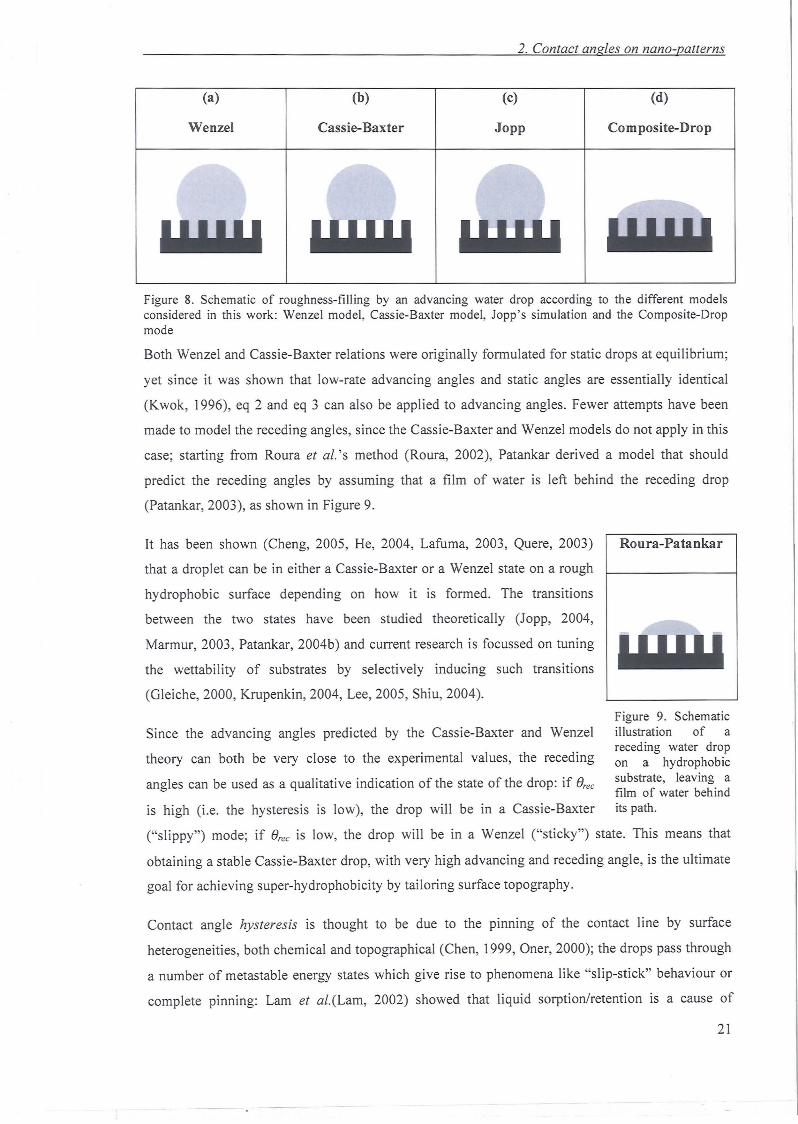
Figure 7. From Watson et al.25. (a) AFM image of a cicada wing array obtained with a high aspect ratio tip;
(b) 3-D representation of the same structure; (c) profile along the close-packed axis of the structure.
The effect of surface roughness on hydrophobicity has been explained by two different theories.
According to the model developed by Wenzel, it is assumed that the space between the protrusions
on the surface is filled by the liquid (Wenzel, 1936) (Figure 8a). This model predicts that both
hydrophobicity and hydrophilicity are reinforced by the roughness, accord ing to the following
relation :
cos8w = rcos8y (2)
where Bw is the apparent contact ang le on a rough surface, By is the ideal contact angle of water
(Young' s ang le as defined by eq 1 in Chapter 1) on a smooth surface of identical chemistry and r is
the roughness factor, which is defined as the ratio of actual surface area over the proj ected surface
area .
The approach developed by Cassie & Baxter on the other hand assumes that air is trapped by the
asperities (Cassie, 1944), so that the drop sits on a composite surface made of air and solid (Figure
8b); the relation between the apparent contact angle BeE and the ideal angle By is in this case
described as :
(3)
where rJ is the roughness factor of the wetted area, and f is the area fraction of the projected wet
area . The product rli s often called the solid fraction ¢s.
20
(a) (b) (c)
2. Contact angles on nano-patterns
(d)
Wenzel Cassie-Baxter Jopp Composite-Drop
Figure 8. Schematic of roughness-filling by an advancing water drop according to the different modelsconsidered in this work: Wenzel model, Cassie-Baxter model, Jopp' s simulation and the Composite-Dropmode
Both Wenzel and Cassie-Baxter relations were orig inally formulated for static drops at equilibrium;
yet since it was shown that low-rate advancing angles and static angles are essentially identi cal
(Kwok, 1996), eq 2 and eq 3 can also be appli ed to advancing angles. Fewer attempts have been
made to model the receding angles, since the Cassie-Baxter and Wenzel models do not apply in thi s
case; starting from Roura et al. ' s method (Roura, 2002), Patankar derived a model that should
predict the receding angles by assuming that a film of water is left behind the receding drop
(Patankar, 2003), as shown in Figure 9.
It has been shown (Cheng, 2005, He, 2004, Lafuma, 2003, Quere, 2003)
that a drop let can be in either a Cassie-Baxter or a Wenzel state on a rough
hydrophobic surface depending on how it is formed. The transitions
between the two states have been studied theoretically (Jopp, 2004,
Marmur, 2003, Patankar, 2004b) and current research is focussed on tuning
the wettabi lity of substrates by selectively inducing such transitions
(Gleiche, 2000, Krupenk in, 2004, Lee, 2005, Shiu, 2004).
Roura-Patankar
Figure 9. SchematicSince the advancing angles predicted by the Cassie-Baxter and Wenzel illustration of a
receding water droptheory can both be very close to the experimental values, the receding on a hydrophobic
angles can be used as a qualitative indication of the state of the drop : if (Jrec substrate, leaving afilm of water behind
is high (i.e. the hyst eresis is low), the drop will be in a Cassi e-Baxter its path.
("slippy") mode; if (Jrec is low, the drop will be in a Wenzel ("sticky ") state. This means that
obtaining a stable Cassie -Baxter drop, with very high advancing and receding angle, is the ultimate
goal for achieving super-hydrophobicity by tai loring surface topography .
Contact angle hysteresis is thought to be due to the pinning of the contact line by surface
heterogen eiti es, both chemical and topographical (Chen, 1999, Oner, 2000); the drop s pass through
a numb er of metastable energy states which give rise to phenomena like "slip -stick" behaviour or
compl ete pinning: Lam et al.(Lam, 2002) showed that liquid sorption/retention is a cause of
21
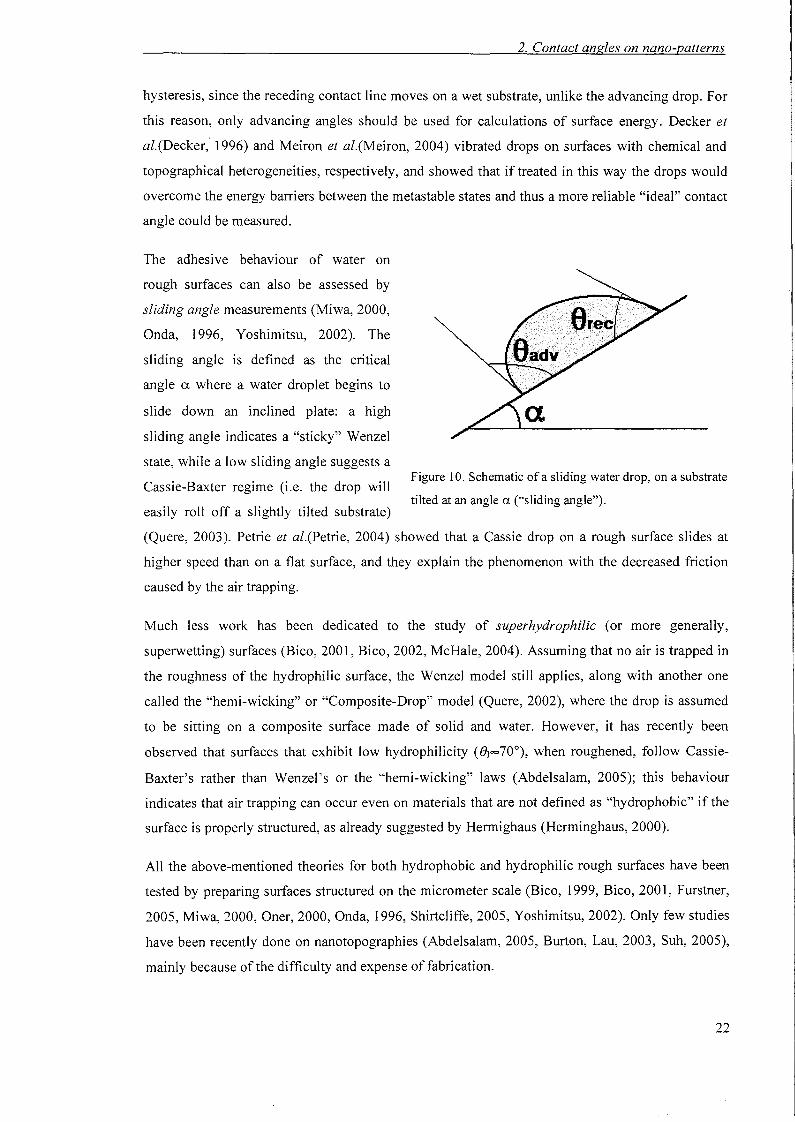
Figure 10. Schematic of a sliding water drop, on a substrate
tilted at an angle a ("sliding angle").
2. Contact angles on nan a-patterns
hysteresis, since the receding contact line moves on a wet substrate, unlike the advancing drop. For
this reason, only advancing angles should be used for calculations of surface energy. Decker et
al.(Decker,' 1996) and Meiron et al.(Meiron, 2004) vibrated drops on surfaces with chemical and
topographical heterogeneities, respectively, and showed that if treated in this way the drops would
overcome the energy barriers between the metastable states and thus a more reliable "ideal" contact
angle could be measured.
The adhesive behaviour of water on
rough surfaces can also be assessed by
sliding angle measurements (Miwa, 2000,
Onda, 1996, Yoshimitsu, 2002). The
sliding angle is defined as the critical
angle a where a water droplet begins to
slide down an inclined plate: a high
sliding angle indicates a "sticky" Wenzel
state, while a low sliding angle suggests a
Cassie-Baxter regime (i.e. the drop will
easily roll off a slightly tilted substrate)
(Quere, 2003). Petrie et al.(Petrie, 2004) showed that a Cassie drop on a rough surface slides at
higher speed than on a flat surface, and they explain the phenomenon with the decreased friction
caused by the air trapping.
Much less work has been dedicated to the study of superhydrophilic (or more generally,
superwetting) surfaces (Bico, 2001, Bico, 2002, McHale, 2004). Assuming that no air is trapped in
the roughness of the hydrophilic surface, the Wenzel model still applies, along with another one
called the "hemi-wicking" or "Composite-Drop" model (Quere, 2002), where the drop is assumed
to be sitting on a composite surface made of solid and water. However, it has recently been
observed that surfaces that exhibit low hydrophilicity (f}y=70°), when roughened, follow Cassie
Baxter's rather than Wenzel's or the "hemi-wicking" laws (Abdelsalam, 2005); this behaviour
indicates that air trapping can occur even on materials that are not defined as "hydrophobic" if the
surface is properly structured, as already suggested by Hermighaus (Herminghaus, 2000).
All the above-mentioned theories for both hydrophobic and hydrophilic rough surfaces have been
tested by preparing surfaces structured on the micrometer scale (Bico, 1999, Bico, 2001, Furstner,
2005, Miwa, 2000, Oner, 2000, Onda, 1996, Shirtcliffe, 2005, Yoshimitsu, 2002). Only few studies
have been recently done on nanotopographies (Abdelsalam, 2005, Burton, Lau, 2003, Suh, 2005),
mainly because of the difficulty and expense of fabrication.
22
2. Contact angles on nano-patterns
In this study, ordered arrays of nano-pits and nano-pillars have been fabricated in silicon, and their
dynamic wettability before and after chemical hydrophobisation was investigated. Afterwards the
hydrophobic silicon masters were embossed into poly-s-caprolactone sheets, and contact angles
were measured on these replicas.
My model structures resemble the natural sub-micrometric features that ensure the water
repellency of biological surfaces like the Lotus leaf and some insect wings. Because of the accurate
geometrical characterization of our nanopatterns, the validity of the analytical models currently
available for predicting the wettability of rough surfaces can be verified, for both the hydrophilic
and the hydrophobic case.
2.2 Materials and methods
2.2.1 Fabrication of silicon nanopatterns
Nanopatterns with increasing solid fraction (two samples with nano-pits and four with nano
pillars) were fabricated in silicon wafers (4 in., (100), p-doped, 525±50 urn thick) across an area of
1 em x 1 ern. All the masters were fabricated by Dr K. Seunarine.
2.2.1.1 Nano-pillars
A 2 nm titanium layer was evaporated on the silicon (Plassys evaporator), and the samples
immediately spin-coated with a 60%NEB31A3-40%EC solvent (Sumitomo Chemical Co Ltd) at
3krpm for 60 seconds (150 nm thick coating). After a pre-exposure bake at 90°C for 2 mins, the
wafers were exposed in the e-beam writer (Leica Microsystems EBPG 5) with the desired pattern.
After a post-exposure bake at 85°C for 2 mins, the samples were developed in Microposit MF CD
26 for 20 s and rinsed with reverse osmosis (RO) water; the titanium was etched (I part HF:26
parts RO water) for approximately 2-3 s, and the samples rinsed in RO water. The silicon was then
dry-etched using STS-ICP (Surface Technology Systems-Inductively Coupled Plasma) with C4F8
and SF6 (unswitched gasses) at an etch rate of 100 nm/min, and finally Piranha-cleaned for 5 mins.
2.2.1.2 Nano-pits
The silicon wafers were spin-coated with 40%ZEP520A at 5 krpm (100 nm thick coating) and
baked at 180°C for 1 hour. The samples were then exposed in the e-beam writer, developed in 0
xylene for 60 s and dry etched as for the pillars. Finally, the surfaces were Piranha-cleaned for 5
mins.
23
2. Contact angles on nano-patterns
2.2.2 Surface modification of silicon nanopatterns
Prior to the measurements of contact angles on the hydrophilic nanopatterns, all the samples were
cleaned with an O2 plasma for 15 min (BP80 RIE, flow rate 20 seem, pressure 30mT, RF power
lOOW); the contact angles on these surfaces were measured within 24 hours.
Subsequently, the same patterns were hydrophobised with octadecyltricholorosilane (OTS) by
modifying the procedure of Rosloznik et al. (Rozlosnik, 2003): all samples were sonicated for lOs
in 1:1 water-ethanol and lOs in IPA, then rinsed in chloroform and blow-dried in N2• After a 15
min O2 cleaning (BP80 RIE, flow rate 20 seem, pressure 30mT, RF power lOOW), they were
sonicated for lOs in chloroform and lOs in IPA, rinsed in 1:1 water-ethanol, rinsed in RO water
and blow dried. The clean samples were then placed in a ceramic slide holder, which was gently
tilted on the side at 90°, so that the patterns were facing down. This technique ensured that if any
OTS clusters formed in the solution, they had less chances of being deposited on the patterned
surfaces. The tilted holder was placed in a glass beaker filled with a 0.001 % solution of OTS
(Sigma) in heptane (Sigma). After 3.5 hours the holder was sonicated three times for 1 min in
copious amounts of heptane, then rinsed in IPA, 1:1 water:ethanol, RO water and finally blow
dried.
2.2.3 Replication of silicon nanopatterns into peL: Thumb-Embossing
Poly-s-Caprolactone (PCL) pellets were purchased from Sigma. Sheets of polymer (of
thickness-Of mm) were prepared by placing pellets spaced on a square grid (at a distance of 1 em
from each other) between two glass plates; then the plates were clamped using 4 bulldog clamps,
and the assembly was kept for more than 3 hours at 70°C in an oven. At this temperature the PCL
melted and formed a sheet. On cooling down, the polymer was easily separated from the glass and
the sheet was cut into squares (0.7 em X 0.7 em).
The silicon masters were placed on a hot plate at 85°C, and a square of PCL was placed on top of
the patterned area. When the polymer had melted, a glass slide was pressed on it for a few seconds,
in order to force the PCL into the nanopattern. The sandwich (masterIPCL/slide) was immediately
transferred into RO water for cooling. On cooling, the polymer came off both surfaces. The
polymers were blow-dried with N2•
2.2.4 Sample characterization.
2.2.4.1 Scanning Electron Microscopy.
The silicon surfaces were imaged with a Hitachi S4700, prior to and following hydrophobisation.
After contact angle measurements, they were cleaved and their SEM profiles were used to measure
the dimensions of the asperities with ImageJ (Rasband, 1997-2005). The PCL replicas were imaged
after being sputter-coated with 20 nm of gold-palladium in a sputter coater (Emscope, Ashford,
24
2. Contact angles on nano-patterns
UK). To measure the depth of the PCL pits, the replicas were plunged in liquid nitrogen, together
with two glass slides (glued to make a thick base) and a scalpel blade. The frozen samples were
placed on the cold glass base, and the scalpel was hammered on the sample from the back side.
This resulted in a cleavage of the patterned surface. After sputter-coating and imaging, it was
possible to use the SEM profile to measure the dimensions of the embossed nano-pits, and the
diameter of the embossed nano-pillars,
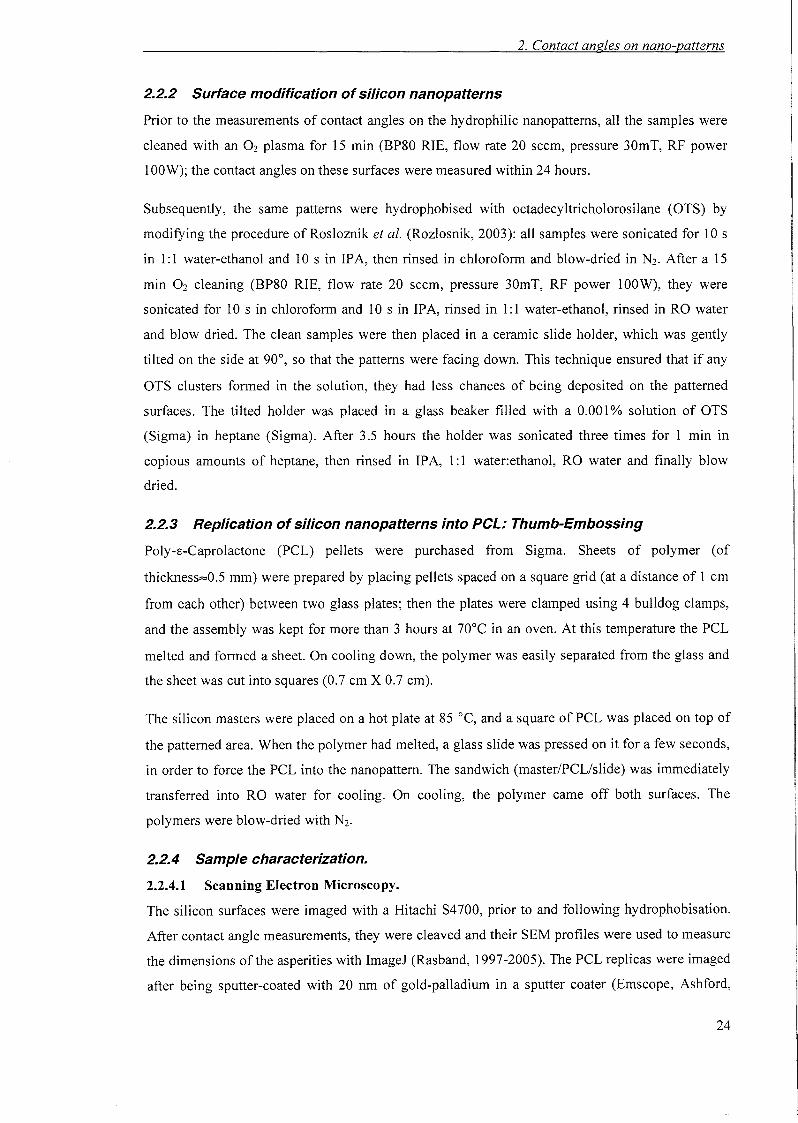
2.2.4.2 Dynamic Contact Angle Measurements.
Images of the advancing and receding
contact angles of filtered Milli-Q water
were captured at a rate of 2 images/s with a
long-distance objective connected to a
CCO camera (Sanyo), and analysed with
the FTA200 software (First Ten
Angstroms, v2.0). The FTA setup consists
of a vertical syringe that is controlled by a
stepper-motor through the FTA software.
The drops are imaged with a long-distance
objective connected to a CCO camera
(Figure 11). The back illumination is also
computer-controlled. The software
recognizes the drop profile and calculates
the contact angle from the left and right
side of the drop. In practice, achieving a
fully automated and correct analysis was
often difficult: in this case, it was possible
to define the drop profile manually, and use
the software to calculate the angle.Figure 11. FTA apparatus.
Water drops were deposited and taken up through a 30-gauge flat-tipped needle mounted on a
Hamilton syringe, at a rate of 0.25 ul/s; the maximum volume of the drops was 5 !AI on
hydrophobic substrates, and 4 !AI on hydrophilic ones. The values reported are averages of at least 5
measurements made on different areas of the sample. All measurements were performed at room
temperature on a vibration-free platform.
25
2. Contact angles on nano -patterns
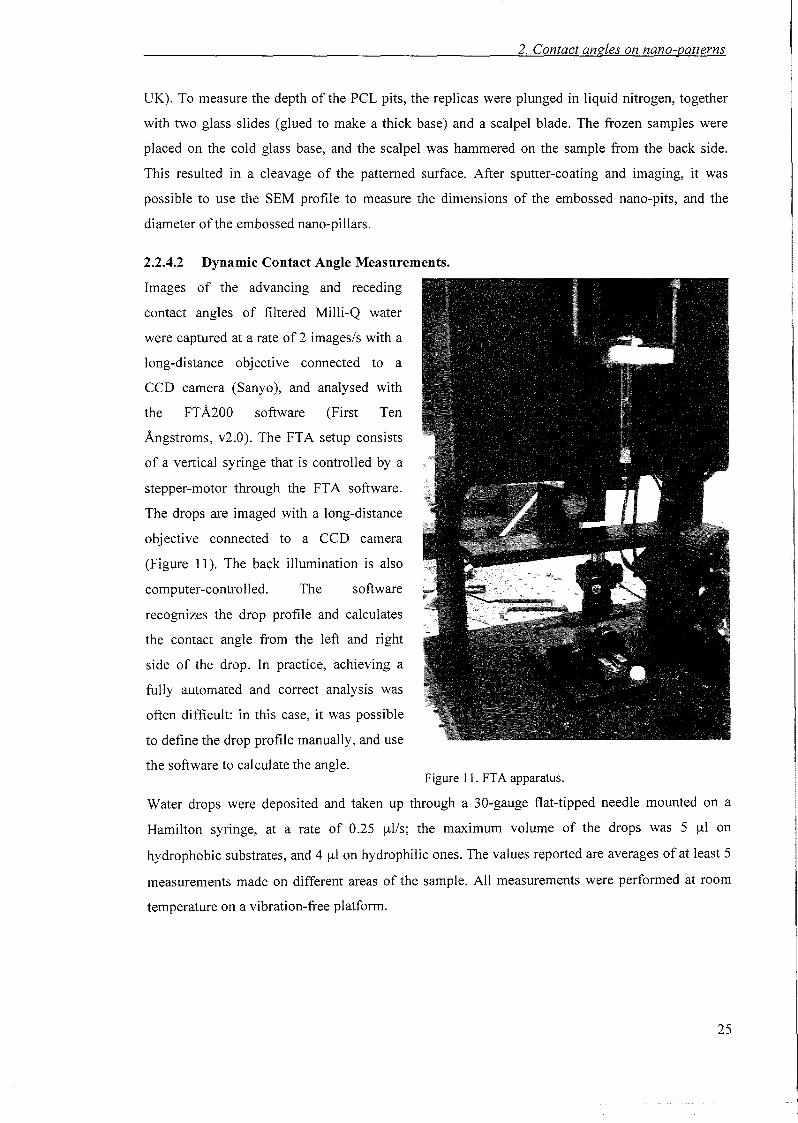
2.2.4.3 Sliding Angle Measurements.
For sliding angle measurements on the
hydrophobic samples, water drops of
weight ranging from 5 to 40 mg were
gently deposited on a horizontal plate fixed
on a goniometer (Figure 12), by means of a
calibrated micropipette. The goniometer
was rotated slowly until the drops started to
slide. The sliding angle was determin ed on
at least 4 different location s/sample. Figure 12. Sliding angle setup. The image shows
pinned drops at 90° on a pitted sample.
2.3 Theoretical Models
2.3. 1 Hydrophobic surfaces
In order to be able to test which model would best explain the experimental findings, the measured
angles were compared with the advancing and receding angles predicted by several models (i.e .
Cassie-Baxter, Wenzel, Composite-drop and lopp' s models for advancing angles, and Roura
Patankar' s model for receding angles on hydrophobic surfaces). To do so, the equati ons of each
model (eq 2 and 3) were re-formulated in order to obtain the theoretical apparent contact angle eas
a function ofthe geometric parameters ofthe surface. As a result, the formulas differ for cylindrical
and hemispherical-top asperities. Note that the term "asperities" here is generally used to refer to
both pillars and pits.
For vertical structures with a flat top, assuming that the water does not invad e the roughness, the
roughness factor of the wet area is I (rr I ) and the solid fraction is equa l to the proje cted wet area
fraction (¢.<Ff, defined in 2.1). In this work, ¢s always refers to the solid fraction of cylindrical
pillars ¢s=:nxi2/412, where d is the base diameter of the cylinders, and I is their centre-to-centre pitch.
The Cassie-Baxter and Wenzel formulas were appli ed to different geometries.
I) The Cassie-Baxter relation was calculated for two cases :
- Cylindrical asperities: cos8CB_c = - 1+ ¢s(cos8y + 1) (4)
- Hemispherical-top pillar s (Bico , 1999): cOS8CB_h = - 1+ ¢B (costi, + 1)2 (5)
where ¢B is the ratio of the area of the pillar bases over the total area. In this case, ¢B=¢S since the
walls of the pillars are vertical.
2) Wenzel' s relation was calculated for two cases :
26
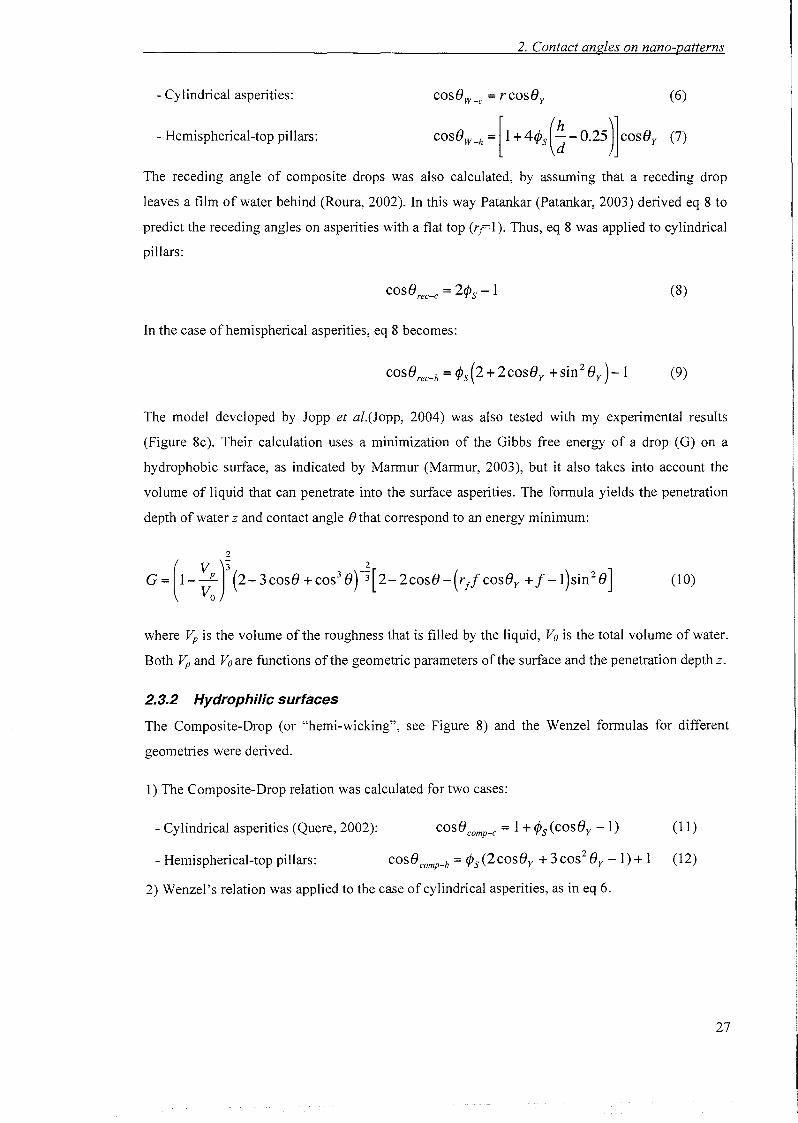
- Cylindrical asperities:
- Hemispherical-top pillars:
2. Contact angles on nano-patterns
cos8w_c = r coeii; (6)
cosOW _h =[I + 4¢s(~-0.25)]coso, (7)
The receding angle of composite drops was also calculated, by assuming that a receding drop
leaves a film of water behind (Roura, 2002). In this way Patankar (Patankar, 2003) derived eq 8 to
predict the receding angles on asperities with a flat top (rr1). Thus, eq 8 was applied to cylindrical
pillars:
cos8rec_c = 2¢s -1
In the case of hemispherical asperities, eq 8 becomes:
(8)
The model developed by Jopp et al.(Jopp, 2004) was also tested with my experimental results
(Figure 8c). Their calculation uses a minimization of the Gibbs free energy of a drop (G) on a
hydrophobic surface, as indicated by Marmur (Marmur, 2003), but it also takes into account the
volume of liquid that can penetrate into the surface asperities. The formula yields the penetration
depth of water z and contact angle 8 that correspond to an energy minimum:
(10)
where Vp is the volume of the roughness that is filled by the liquid, Va is the total volume of water.
Both Vp and Va are functions of the geometric parameters of the surface and the penetration depth z.
2.3.2 Hydrophilic surfaces
The Composite-Drop (or "hemi-wicking", see Figure 8) and the Wenzel formulas for different
geometries were derived.
1) The Composite-Drop relation was calculated for two cases:
- Cylindrical asperities (Quere, 2002): cos8comp-c = 1+ ¢s (cos8y - 1) (11)
- Hemispherical-top pillars: cos8comp_h = ¢s(2cos8y +3cos28y -1)+ 1 (12)
2) Wenzel's relation was applied to the case of cylindrical asperities, as in eq 6.
27
2. Contact angles on nano-patterns
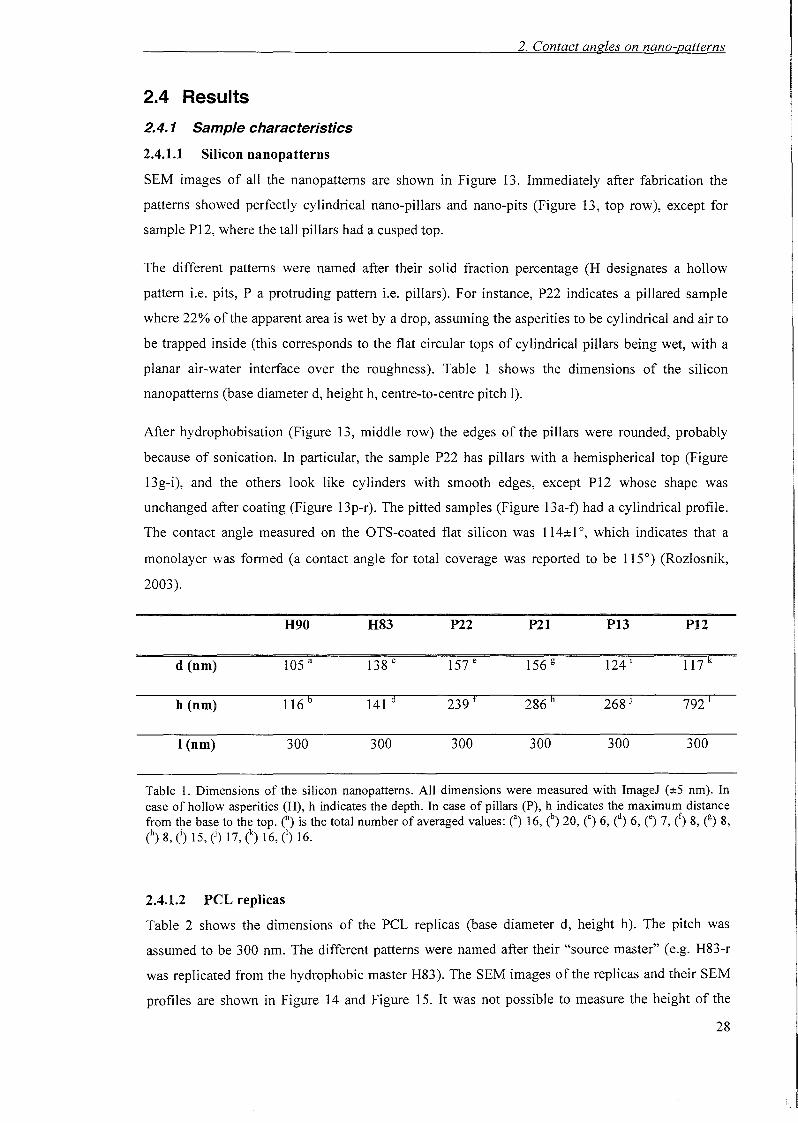
2.4 Results
2.4.1 Sample characteristics
2.4.1.1 Silicon nanopatterns
SEM images of all the nanopatterns are shown in Figure 13. Immediately after fabrication the
patterns showed perfectly cylindrical nano-pillars and nano-pits (Figure 13, top row), except for
sample P12, where the tall pillars had a cusped top.
The different patterns were named after their solid fraction percentage (H designates a hollow
pattern i.e. pits, P a protruding pattern i.e. pillars). For instance, P22 indicates a pillared sample
where 22% of the apparent area is wet by a drop, assuming the asperities to be cylindrical and air to
be trapped inside (this corresponds to the flat circular tops of cylindrical pillars being wet, with a
planar air-water interface over the roughness). Table 1 shows the dimensions of the silicon
nanopatterns (base diameter d, height h, centre-to-centre pitch I).
After hydrophobisation (Figure 13, middle row) the edges of the pillars were rounded, probably
because of sonication. In particular, the sample P22 has pillars with a hemispherical top (Figure
13g-i), and the others look like cylinders with smooth edges, except P12 whose shape was
unchanged after coating (Figure 13p-r). The pitted samples (Figure 13a-f) had a cylindrical profile.
The contact angle measured on the OTS-coated flat silicon was 114±1°, which indicates that a
monolayer was formed (a contact angle for total coverage was reported to be 115°) (Rozlosnik,
2003).
H90 H83 P22 P21 P13 P12
d (nm) 105 a 138 c 157 e 156 g 124 I 117 k
h (nm) 116 b 141 d 239 t 286 h 268 J 792 I
I (nm) 300 300 300 300 300 300
Table 1. Dimensions of the silicon nanopattems. All dimensions were measured with ImageJ (±5 nm). Incase of hollow asperities (H), h indicates the depth. In case of pillars (P), h indicates the maximum distancefrom the base to the top. n is the total number of averaged values: (") 16, (b) 20, n 6, f) 6, () 7, (f) 8, (g) 8,(h) 8, o15, (j) 17, (k) 16, (I) 16.
2.4.1.2 ret. replicas
Table 2 shows the dimensions of the peL replicas (base diameter d, height h). The pitch was
assumed to be 300 nm. The different patterns were named after their "source master" (e.g. H83-r
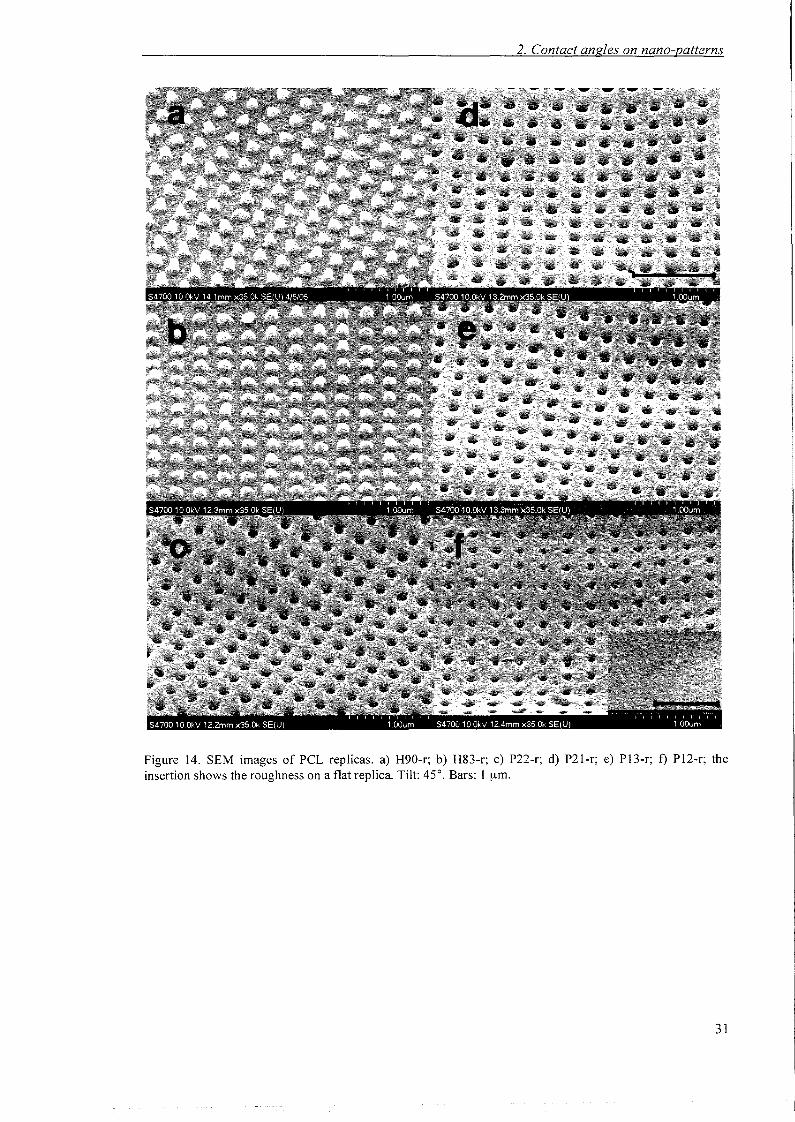
was replicated from the hydrophobic master H83). The SEM images of the replicas and their SEM
profiles are shown in Figure 14 and Figure 15. It was not possible to measure the height of the
28

2. Contact angles on nano-patterns
replicated pillars (H90-r and H83-r) from their profiles, because the nano-pillars at the edge
collapsed during the cutting.
d (nm)
h (nm)
H90-r
NA
H83-r
196± 11 b
NA
P22-r
130±9 C
214±23 d
P21-r
147:t8 e
275±I8 t
P13-r
1I8±9 g
242±43 h
P12-r
88±II 1
Table 2. Dimensions of the peL replicas. All dimensions were measured with Image] from SEM images. Incase of hollow asperities (H), h indicates the depth. In case of pillars (P), h indicates the maximum distancefrom the base to the top. CO) is the total number of averaged values: (") 62, (b) 38, (C) 97, (d) 50, () 125, (f) 46,(g) 132, (h) 14, (i) 92, (j) 20.
29
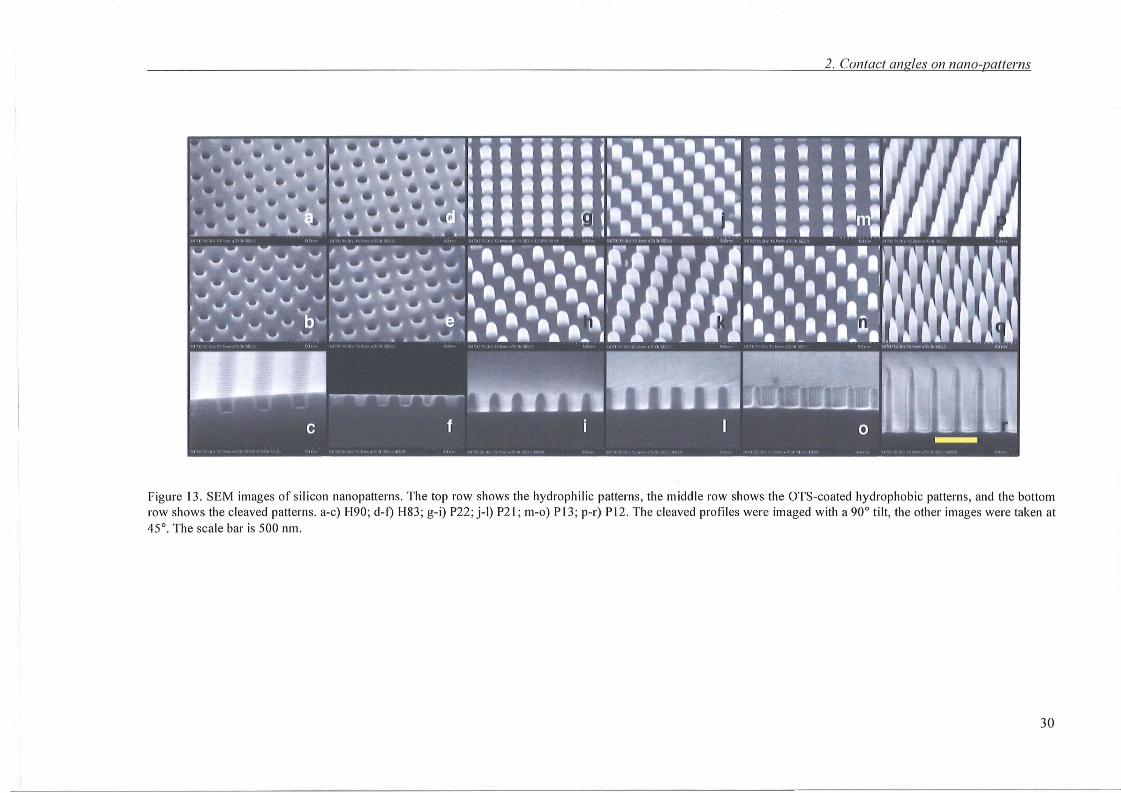
2. Contact angles on nano-patterns
Figure 13. SEM images of silico n nanopatterns. Th e top row shows the hydrophilic pattern s, the middl e row shows the OT S-coated hydrophobi c pattern s, and the bottomrow show s the cleaved patterns. a-c) 1-190; dot) 1-183; g- i) P22 ; j-t) P21 ; moo) P13; p-r) P 12. The cleaved profil es were imaged with a 90 ° tilt , the other images were taken at45° . The sc a le bar is 500 nm .
30

· ~..'
PAGE
NUMBERING
\,
AS ORIGINAL
'r ,
"
--:--... ;
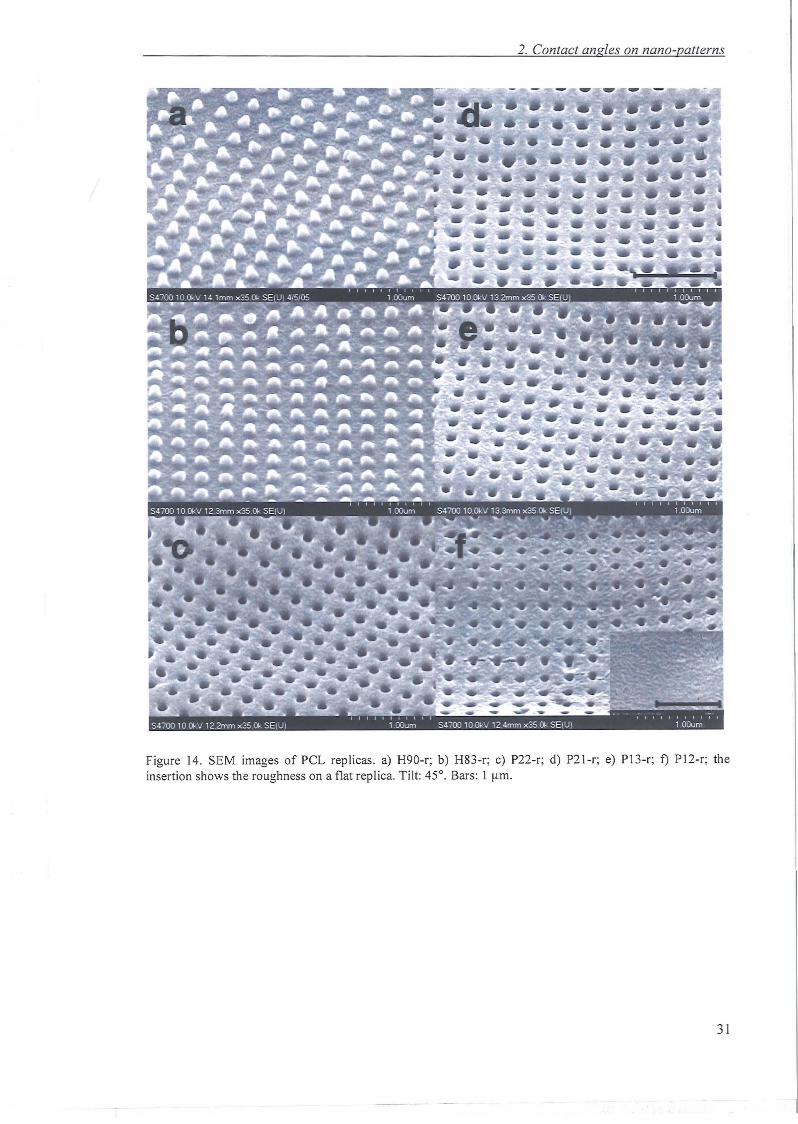
2. Contact angles on nano -patterns
Figure 14. SEM images of peL replicas. a) H90-r; b) H83-r; c) P22-r; d) P21-r; e) P13-r; f) P I2-r; theinsertion shows the roughness on a flat replica. T ilt: 45°. Bars: I urn.
3 1
2. Contact angles on nano-patterns
II
b
c
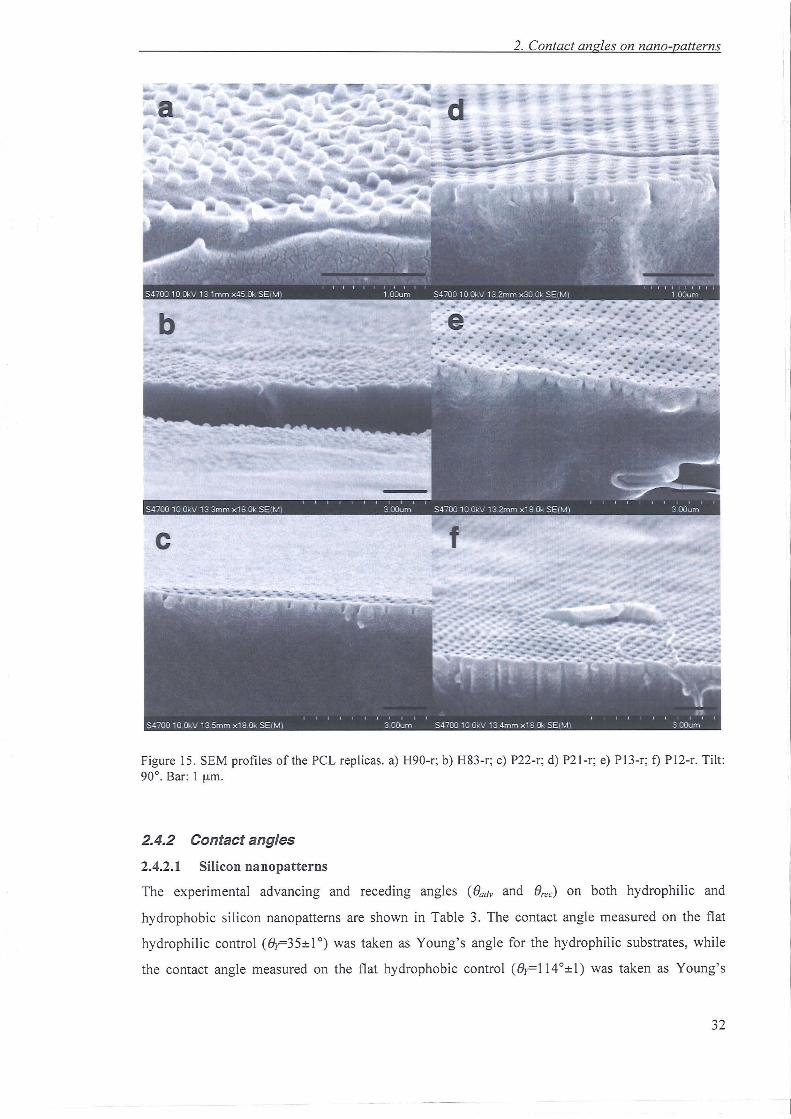
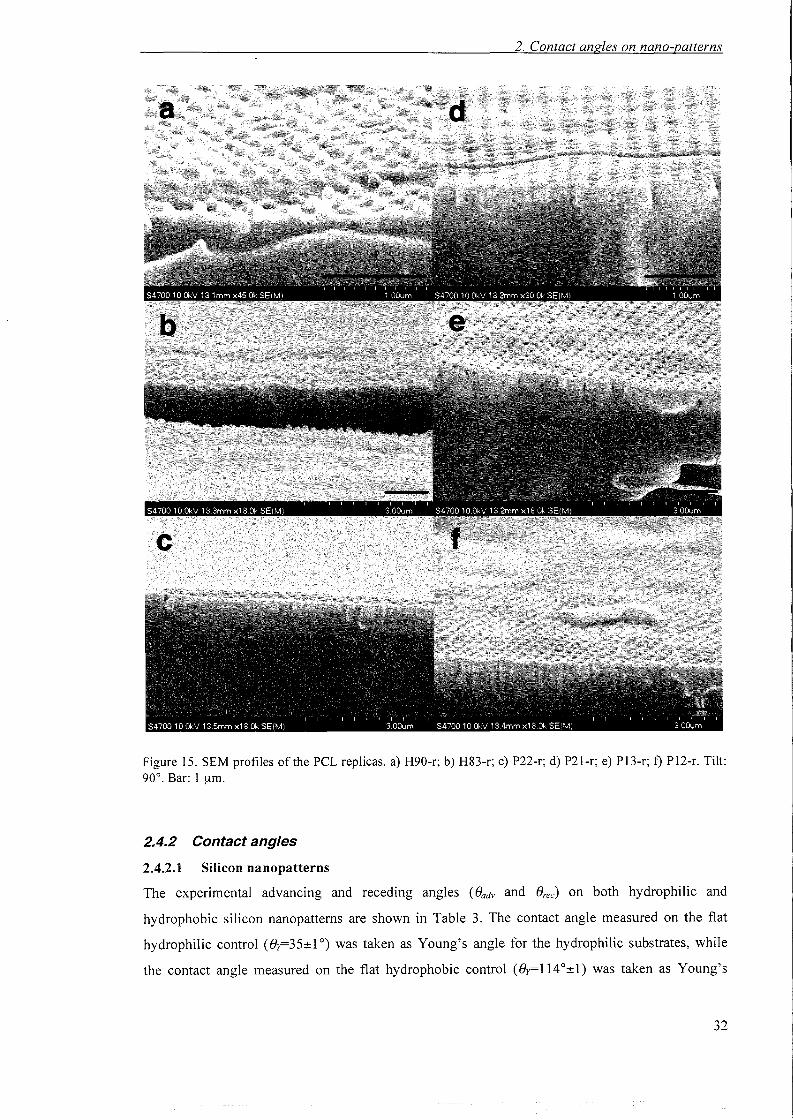
Figure 15. SEM profiles of the re i. replicas. a) H90-r; b) H83-r; c) P22-r; d) P21-r; e) P13-r; t) PI 2-r. Tilt:90°. Bar: I urn.
2.4.2 Contact angles
2.4.2. 1 Silicon nanopatterns
The experimental advancing and receding angles (()adv and ()rec) on both hydrophil ic and
hydrophobic silicon nanopattem s are shown in Table 3. The contact angle measured on the flat
hydrophili c control (()y=35± 10) was taken as Young 's angle for the hydrophilic substrates, while
the contact angle measured on the flat hydrophobic contro l (()y=114°±1) was taken as Young's
32
2. Contact angles on nanD-patterns
Figure 14. SEM images of rei. replicas. a) H90-r; b) H83-r; c) P22-r; d) P21-r; e) P13-r; f) PI2-r; theinsertion shows the roughness on a flat replica. Tilt: 45°. Bars: 1 urn.
31
2. Contact angles on nano-patterns
Figure 15. SEM profiles of the ret. replicas. a) H90-r; b) H83-r; c) P22-r; d) P21-r; e) P13-r; f) PI2-r. Tilt:90°. Bar: I urn,
2.4.2 Contact angles
2.4.2.1 Silicon nanopatterns
The experimental advancing and receding angles (f)adv and f)rec) on both hydrophilic and
hydrophobic silicon nanopattems are shown in Table 3. The contact angle measured on the flat
hydrophilic control (f)y=35±1 0) was taken as Young's angle for the hydrophilic substrates, while
the contact angle measured on the flat hydrophobic control (f)y=114°±1) was taken as Young's
32
2. Contact angles on nano-patterns
angle for the hydrophobic substrates. The receding drops on the hydrophilic substrates were pinned
(erec=OO), as predicted by Quere (Quere, 2002).
Flat H90 H83 P22 P21 P13 P12Hydro Sadv(O) 114:!:1 a 125±2 c 129±3 e 155±2 g 159±2 h 161±2 J 164±2 '
PhobicSrec(O) 100±3 b 92±2 d 89±2 f 0 140±2 i 150±2 k 163±2 m
Model W-c W-c W CB-h CB-h CB-hHydro Sadv(O) 35±3 n 36±3° 35±3 p 12±3 q 19±3 r 11±3 s 0
Srece) 0 0 0 0 0 0 0Philic Model Comp-c Comp-c Comp-c Comp-c Comp-c Comp-h
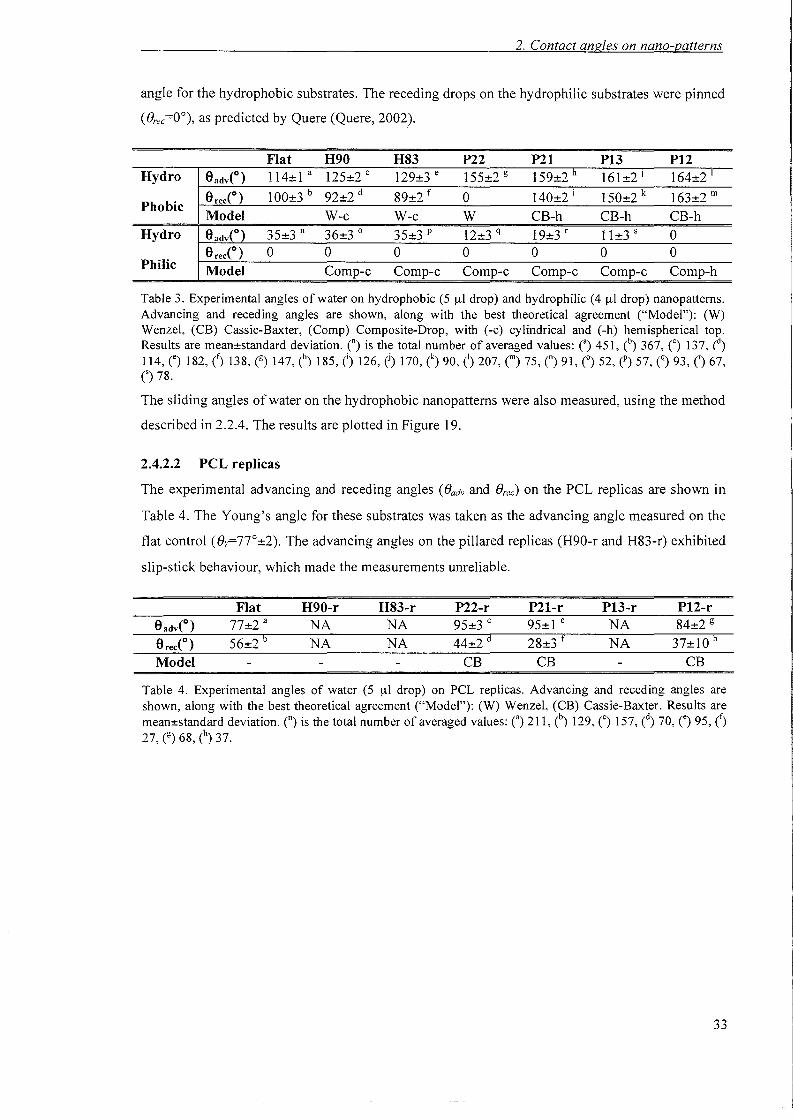
Table 3. Experimental angles of water on hydrophobic (5 ul drop) and hydrophilic (4 [tl drop) nanopatterns.Advancing and receding angles are shown, along with the best theoretical agreement ("Model"): (W)Wenzel, (CB) Cassie-Baxter, (Comp) Composite-Drop, with (-c) cylindrical and (-h) hemispherical top.Results are meanestandard deviation. en> is the total number of averaged values: (a) 451, (b) 367, n 137, (d)114, (e) 182, (f) 138, (g) 147, (h) 185, o 126, (j) 170, (k) 90, (') 207, (m) 75, en> 91, CO) 52, (P) 57, (q) 93, () 67,C) 78.
The sliding angles of water on the hydrophobic nanopattems were also measured, using the method
described in 2.2.4. The results are plotted in Figure 19.
2.4.2.2 rei, replicas
The experimental advancing and receding angles (eadv and erec) on the PCL replicas are shown in
Table 4. The Young's angle for these substrates was taken as the advancing angle measured on the
flat control (er=7r±2). The advancing angles on the pillared replicas (H90-r and H83-r) exhibited
slip-stick behaviour, which made the measurements unreliable.
Model
Flat77±2 a
56±2 b
H90-rNANA
H83-r P22-r P21-r P13-r P12-rNA 95±3 c 95±1 e NA 84±2 g
NA 44±2 d 28±3 f NA 37±10 h
CB CB CB
Table 4. Experimental angles of water (5 ul drop) on PCL replicas. Advancing and receding angles areshown, along with the best theoretical agreement ("Model"): (W) Wenzel, (CB) Cassie-Baxter. Results aremeanestandard deviation. en> is the total number of averaged values: (a) 211, (b) 129, (') 157, (d) 70, n 95, (f)27, e) 68, (h) 37.
33
2. Contact angles on nano-patterns
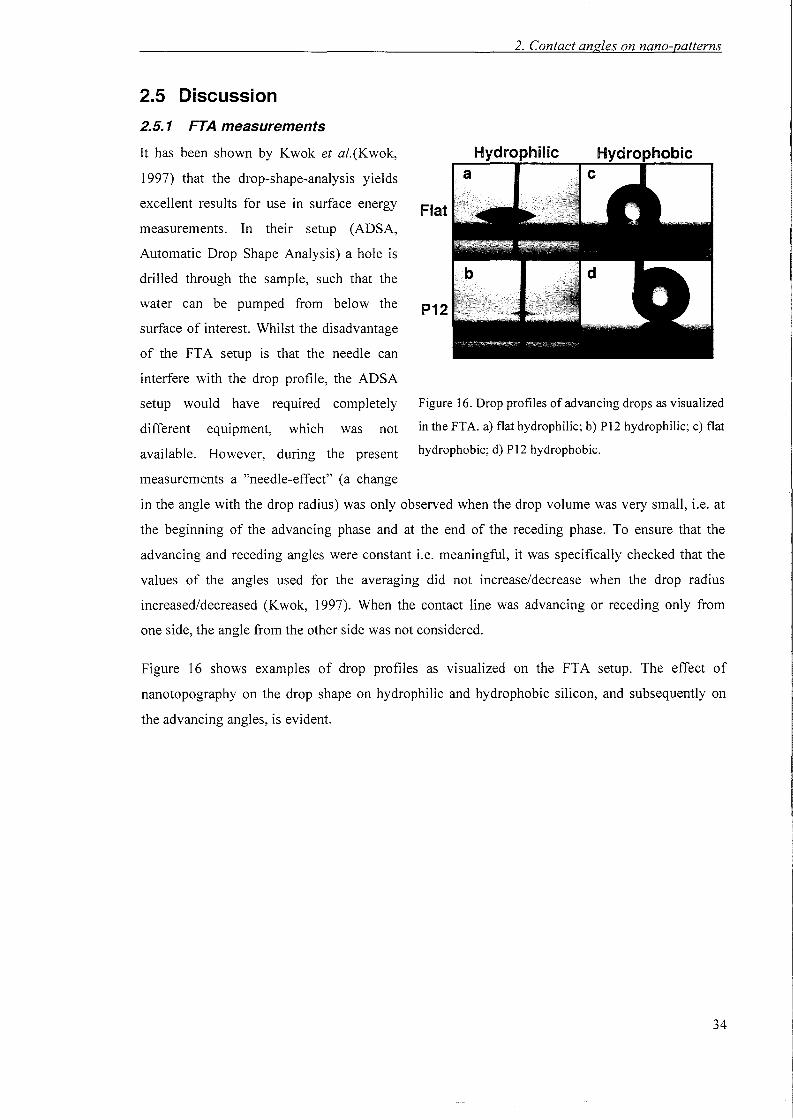
Figure 16. Drop profiles of advancing drops as visualized
in the FTA. a) flat hydrophilic; b) P12 hydrophilic; c) flat
hydrophobic; d) P12 hydrophobic.
Hydrophilica
P12
Flat
2.5 Discussion
2.5.1 FTA measurements
It has been shown by Kwok et al.(Kwok,
1997) that the drop-shape-analysis yields
excellent results for use in surface energy
measurements. In their setup (ADSA,
Automatic Drop Shape Analysis) a hole is
drilled through the sample, such that the
water can be pumped from below the
surface of interest. Whilst the disadvantage
of the FTA setup is that the needle can
interfere with the drop profile, the ADSA
setup would have required completely
different equipment, which was not
available. However, during the present
measurements a "needle-effect" (a change
in the angle with the drop radius) was only observed when the drop volume was very small, i.e. at
the beginning of the advancing phase and at the end of the receding phase. To ensure that the
advancing and receding angles were constant i.e. meaningful, it was specifically checked that the
values of the angles used for the averaging did not increase/decrease when the drop radius
increased/decreased (Kwok, 1997). When the contact line was advancing or receding only from
one side, the angle from the other side was not considered.
Figure 16 shows examples of drop profiles as visualized on the FTA setup. The effect of
nanotopography on the drop shape on hydrophilic and hydrophobic silicon, and subsequently on
the advancing angles, is evident.
34
2. Contact angles on nano-patterns
2.5.2 Hydrophilic silicon nanopatterns
4.5
----
43.532 2.5lid
1.5
···········~·······w······················
..,,··•·•••........<,
0.5
2r;======;~ITT-.-,------,------,-----r-\"""T----'- Comp-e-P•.•.• Comp-h-P
1.8 •••• Cornp-c-H---- W-c-HSO
--- w-e-H831.6 - W-c-P22
--- W-c-P21W-c-P13
-... W-c-P12
0.8
-1.4~
<no(J 1.2
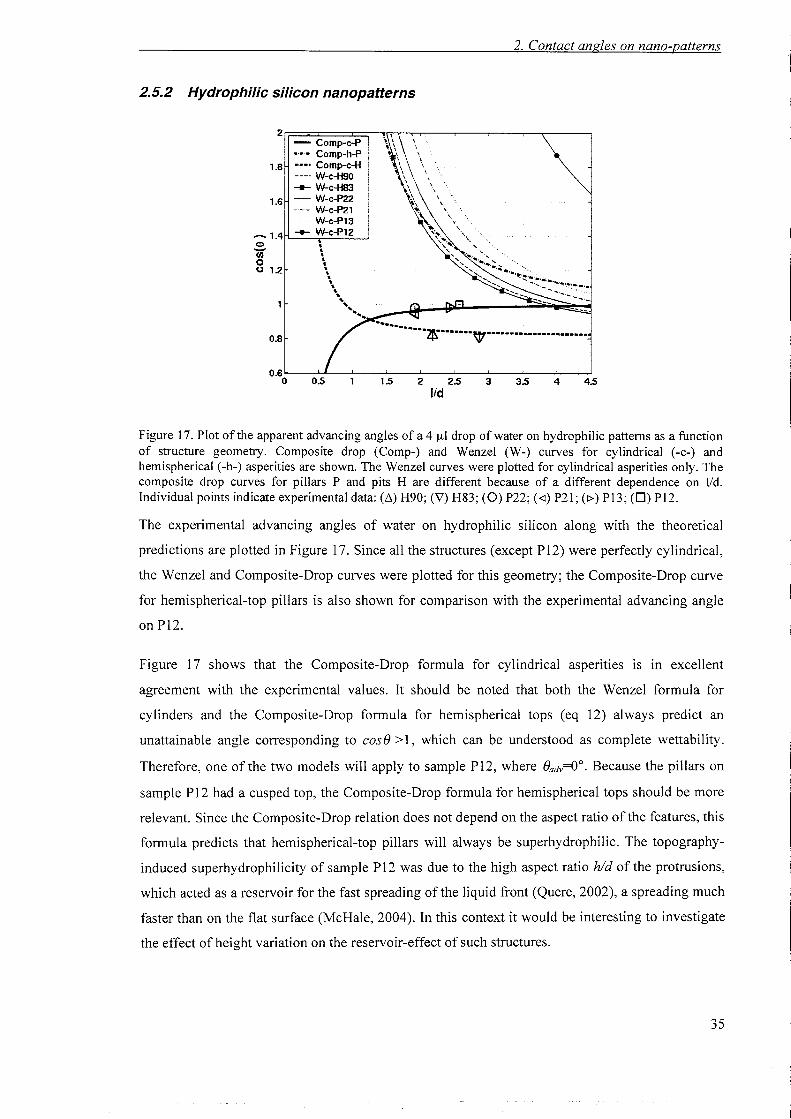
Figure 17. Plot of the apparent advancing angles of a 4111 drop of water on hydrophilic patterns as a functionof structure geometry. Composite drop (Comp-) and Wenzel (W-) curves for cylindrical (-c-) andhemispherical (-h-) asperities are shown. The Wenzel curves were plotted for cylindrical asperities only. Thecomposite drop curves for pillars P and pits H are different because of a different dependence on lid.Individual points indicate experimental data: (L1) H90; (\7) H83; (0) P22; (-<l) P21; (I» P13; (D) P12.
The experimental advancing angles of water on hydrophilic silicon along with the theoretical
predictions are plotted in Figure 17. Since all the structures (except P12) were perfectly cylindrical,
the Wenzel and Composite-Drop curves were plotted for this geometry; the Composite-Drop curve
for hemispherical-top pillars is also shown for comparison with the experimental advancing angle
on P12.
Figure 17 shows that the Composite-Drop formula for cylindrical asperities is in excellent
agreement with the experimental values. It should be noted that both the Wenzel formula for
cylinders and the Composite-Drop formula for hemispherical tops (eq 12) always predict an
unattainable angle corresponding to cost) >1, which can be understood as complete wettability.
Therefore, one of the two models will apply to sample P12, where ()adv=O°. Because the pillars on
sample P12 had a cusped top, the Composite-Drop formula for hemispherical tops should be more
relevant. Since the Composite-Drop relation does not depend on the aspect ratio of the features, this
formula predicts that hemispherical-top pillars will always be superhydrophilic. The topography
induced superhydrophilicity of sample P12 was due to the high aspect ratio hid of the protrusions,
which acted as a reservoir for the fast spreading of the liquid front (Quere, 2002), a spreading much
faster than on the flat surface (McHale, 2004). In this context it would be interesting to investigate
the effect of height variation on the reservoir-effect of such structures.
35
2. Contact angles on nano-patterns
2.5.3 Hydrophobic silicon nanopatterns
43.531.S 2 2.5lid
.LI.Ll--_ -..- _ _....,....
.','-
0.5
-12
-1
- CB-h-P•••• CB-e-H
-<J2 --_. w-e-H90..... w-e-HB3- W-h-P22
-<J.4 -- - w-h-P21w-h-P13
..... W-h-P12
43.531.5 2 2.5lid
••..•.•..._ .•**.'
0.5
0r;==:t;==:=".----,---...,.---,---.---,---
-12
-1
- CB-c-P•••• CB-c-H
-<J2 ---- w-e-HSO____ Woc-HaS
- W-e-P22-<J.4 - - - W-e-P21
Woc-P13--+- W-c-P12
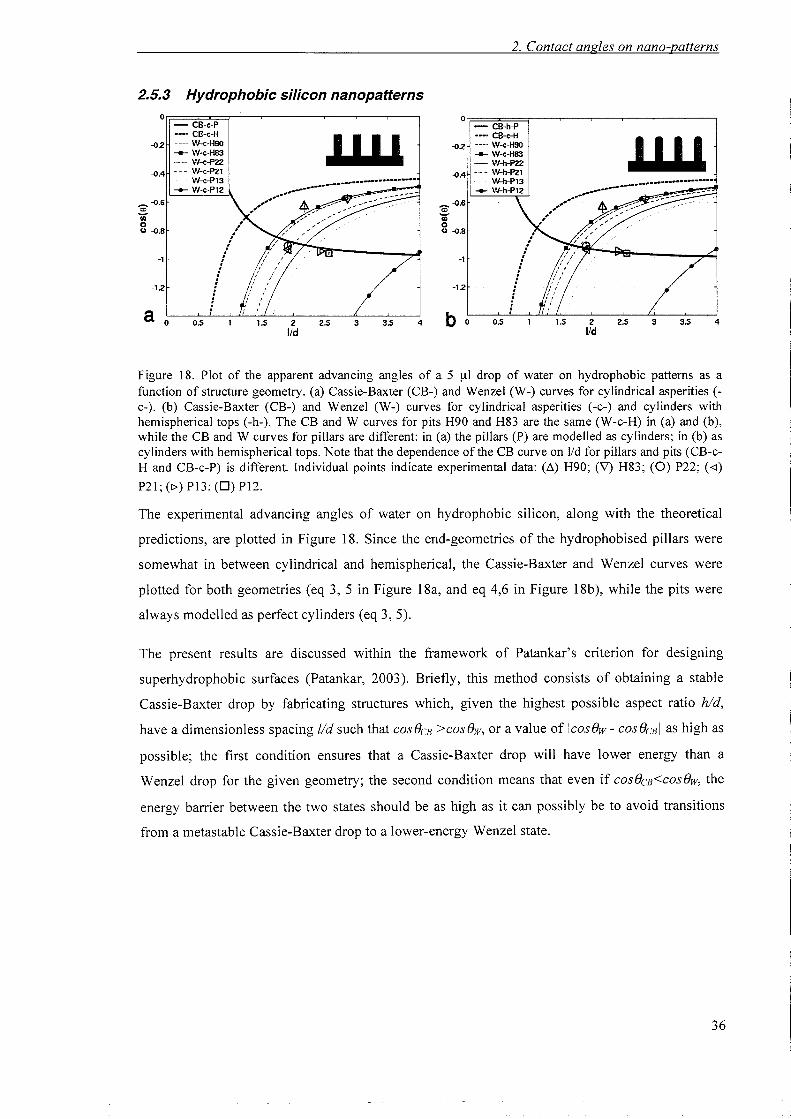
Figure 18. Plot of the apparent advancing angles of a 5 111 drop of water on hydrophobic patterns as afunction of structure geometry. (a) Cassie-Baxter (CB-) and Wenzel (W-) curves for cylindrical asperities (c-), (b) Cassie-Baxter (CB-) and Wenzel (W-) curves for cylindrical asperities (-c-) and cylinders withhemispherical tops (-h-). The CB and W curves for pits H90 and H83 are the same (W-c-H) in (a) and (b),while the CB and W curves for pillars are different: in (a) the pillars (P) are modelled as cylinders; in (b) ascylinders with hemispherical tops. Note that the dependence of the CB curve on I/d for pillars and pits (CB-cH and CB-c-P) is different. Individual points indicate experimental data: (~) H90; (V) H83; (0) P22; (<l)
P21; (I» P13; (D) P12.
The experimental advancing angles of water on hydrophobic silicon, along with the theoretical
predictions, are plotted in Figure 18. Since the end-geometries of the hydrophobised pillars were
somewhat in between cylindrical and hemispherical, the Cassie-Baxter and Wenzel curves were
plotted for both geometries (eq 3, 5 in Figure 18a, and eq 4,6 in Figure 18b), while the pits were
always modelled as perfect cylinders (eq 3,5).
The present results are discussed within the framework of Patankar's criterion for designing
superhydrophobic surfaces (Patankar, 2003). Briefly, this method consists of obtaining a stable
Cassie-Baxter drop by fabricating structures which, given the highest possible aspect ratio hid,
have a dimensionless spacing lid such that cos8CB »cosii», or a value of Icos8w - cos 8CBI as high as
possible; the first condition ensures that a Cassie-Baxter drop will have lower energy than a
Wenzel drop for the given geometry; the second condition means that even if cos8CB<cos8w, the
energy barrier between the two states should be as high as it can possibly be to avoid transitions
from a metastable Cassie-Baxter drop to a lower-energy Wenzel state.
36
2. Contact angles on nano-patterns
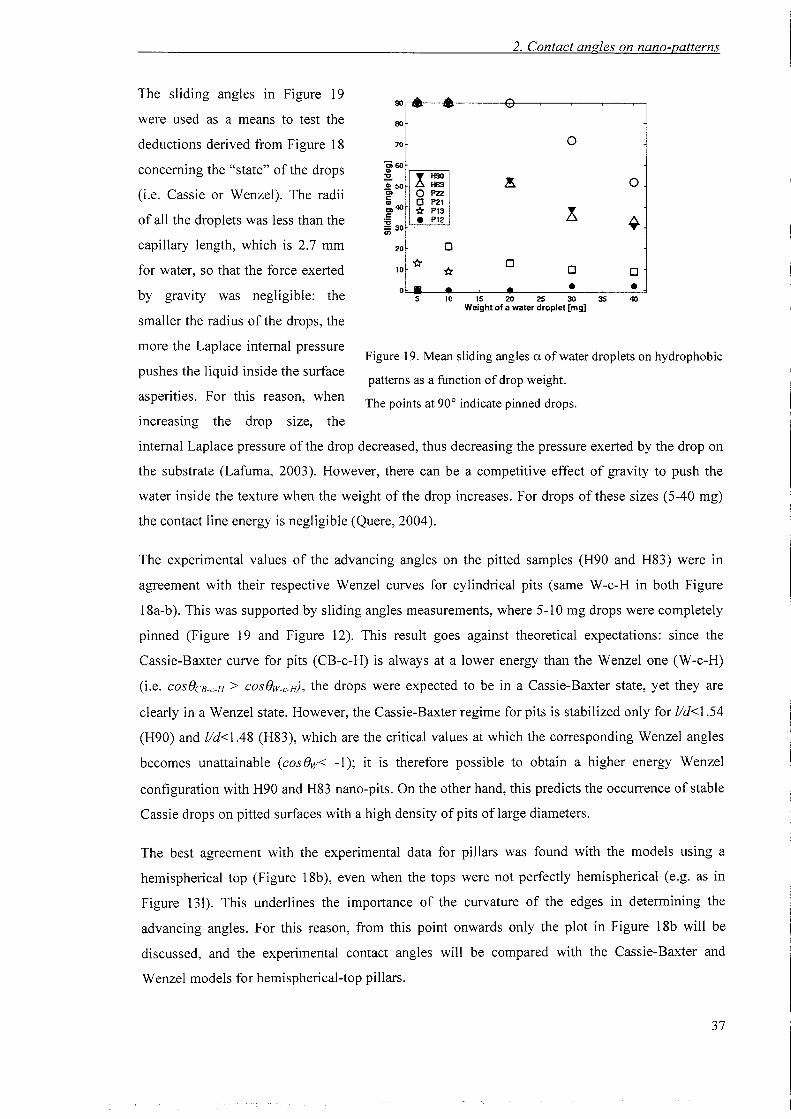
Figure 19. Mean sliding angles a of water droplets on hydrophobic
4010 15 20 2S 30 3SWeight of a water droplet [mg]
5
..... ..... -- - "-'
0
X:: .!. 0OP22o P21* P13 !• P12
~
0
* 0 0* 01m ... ... • •o
10
70
20
90
80
co 60..~
"SO...c:~4Oc:
~ 30U)
patterns as a function of drop weight.
The points at 90° indicate pinned drops.
The sliding angles in Figure 19
were used as a means to test the
deductions derived from Figure 18
concerning the "state" of the drops
(i.e. Cassie or Wenzel). The radii
of all the droplets was less than the
capillary length, which is 2.7 mm
for water, so that the force exerted
by gravity was negligible: the
smaller the radius of the drops, the
more the Laplace internal pressure
pushes the liquid inside the surface
asperities. For this reason, when
increasing the drop size, the
internal Laplace pressure ofthe drop decreased, thus decreasing the pressure exerted by the drop on
the substrate (Lafuma, 2003). However, there can be a competitive effect of gravity to push the
water inside the texture when the weight of the drop increases. For drops of these sizes (5-40 mg)
the contact line energy is negligible (Quere, 2004).
The experimental values of the advancing angles on the pitted samples (H90 and H83) were in
agreement with their respective Wenzel curves for cylindrical pits (same W-c-H in both Figure
18a-b). This was supported by sliding angles measurements, where 5-10 mg drops were completely
pinned (Figure 19 and Figure 12). This result goes against theoretical expectations: since the
Cassie-Baxter curve for pits (CB-c-H) is always at a lower energy than the Wenzel one (W-c-H)
(i.e. COS()CB-c-H > cOS()W-c-H), the drops were expected to be in a Cassie-Baxter state, yet they are
clearly in a Wenzel state. However, the Cassie-Baxter regime for pits is stabilized only for l/d<I.54
(H90) and l/d<I.48 (H83), which are the critical values at which the corresponding Wenzel angles
becomes unattainable (cos()w< -1); it is therefore possible to obtain a higher energy Wenzel
configuration with H90 and H83 nano-pits. On the other hand, this predicts the occurrence of stable
Cassie drops on pitted surfaces with a high density of pits of large diameters.
The best agreement with the experimental data for pillars was found with the models using a
hemispherical top (Figure 18b), even when the tops were not perfectly hemispherical (e.g. as in
Figure 131). This underlines the importance of the curvature of the edges in determining the
advancing angles. For this reason, from this point onwards only the plot in Figure 18b will be
discussed, and the experimental contact angles will be compared with the Cassie-Baxter and
Wenzel models for hemispherical-top pillars.
37
2. Contact angles on nano-patterns
Samples P22 and P21 had practically the same ¢s, but different roughness r. Their experimental
advancing angles were close to the intersection between the Cassie-Baxter curve for pillars and
their Wenzel curves. In this case the receding angles should allow to distinguish if the drops were
in either a Wenzel or in a Cassie-Baxter state. On receding, the water droplets were pinned on P22
(8rec=00), since the receding angle never attained a steady state. The sliding angle measurements
showed that drops of up to 20 mg were pinned on this substrate (upper 90° values in Figure 19).
This result suggests that P22 is in a Wenzel state; this could be explained by the fact that P22 is the
shallowest of the four protruding patterns, and it has truly hemispherical edges: both factors make
the Cassie-Baxter regime more unlikely to happen, since sharp edges and a high aspect ratio are
important conditions to ensure air trapping (Bico, 1999). However, a receding angle of 0° was
unexpected; between the possible reasons a differential hydrophobisation of the bottom surface
compared to the top of the asperities cannot be excluded, because it could have affected the
receding angles on the Wenzel samples; still, only P22 showed this behaviour. Oner&McCarthy
(Oner, 2000) showed that the receding angles depended on the three-phase contact line structure,
while the advancing angles were unaffected by it. Therefore, the unusual pinning on sample P22
might be due to the curvature of the hemispherical tops (see Figure 13i) since the contact line could
be pinned by greater solid-liquid contact, and indeed a hemispherical top will have more solid
liquid contact than a flat top with the same height (1I.<I>s =4% for P22).
Unlike P22, sample P21 had a high receding angle, showing that it was in a Cassie state. Its
closeness to the "critical point" (i.e. the intersection between the Cassie-Baxter and Wenzel curves)
would imply that a transition to the Wenzel state would need very little energy; this hypothesis was
confirmed by tilting angle measurements, which showed a sudden jump from 0° to 21° when the
drop weight was increased from 5 mg to 10 mg. The increased weight forced the water inside the
texture, and the 10 mg drop transitioned to the Wenzel state.
For sample P13 a Wenzel state would have had a lower energy, but the energy barrier to overcome
is bigger than in P21. In this case, an increase in drop weight from 5 to 10 mg caused a decrease in
sliding angle, confirming the Cassie-Baxter state of the 5 ul droplet.
Sample P12 had the best water-repellent configuration, since not only the Cassie-Baxter state was
at lower energy than the Wenzel state and the energy barrier between the two was very high, but
the Wenzel angle corresponding to this geometry was unattainable (cos 8w<-I). Tilting angles on
P12 were 0±2° throughout the whole range of drop weights, making it impossible to deposit a drop
smaller than 30 ul. This finding is coherent with Patankar's prediction that a forest of nano-pillars
would be the most effective water-repellent structure (Patankar, 2004a). confirming that for a given
spacing I, increasing the aspect ratio hid will stabilize the Cassie-Baxter regime, as discussed by
Patankar (Patankar, 2004a) and illustrated by Yoshimitsu et al.(Yoshimitsu, 2002) Sample P12 also
38
2. Contact angles on nano-patterns
acted as superwettable when its surface was hydrophilic: this similarity not only shows that
roughness with the highest possible aspect ratio hid will enhance dramatically the wetting
properties of a surface, whether hydrophilic or hydrophobic; it also entails the ambivalence of
topography-enhanced wetting/dewetting, as already highlighted by McHale et al.(McHale, 2004).
Having verified the validity of the Cassie-Baxter model for our submicrometric structures,
Patankar's (Patankar, 2004a) suggestion that the epicuticular wax crystalloids on the Lotus leaf
(200 nm-I urn) playa significant role in repelling water droplets was investigated. This hypothesis
was tested by applying the Cassie-Baxter formula for hemispherical tops to our superhydrophobic
surfaces (P21, P13 and PI2), assuming an ideal contact angle of cuticular wax 8y=100° (Holloway,
1969): the Cassie-Baxter formula predicts apparent contact angles of 150°, 155° and 15r,
respectively. This result is only indicative, since the morphology of the wax crystalloids is very
different from our model structures: however, it shows clearly that nanotopography alone is able to
increase the contact angle of water from 100° to over 150°, making the surface superhydrophobic
without the need of an underlying microstructure. Thus, Patankar's hypothesis was confirmed by
showing that roughness at this scale might stabilize or even be the primary cause of the
hydrophobicity of dual-scale topographies. Since our model topographies resemble the naturally
occurring ordered arrays of nanometric structures shown by Watson et al.(Watson, 2004) on the
wings ofthe cicada and the termite, it would be very interesting to compare the present results with
experimental contact angles of such insect wings. Unfortunately, this data is not available at
present.
The model of Jopp et al.(Jopp, 2004) for advancing hydrophobic angles (eq 10) was also tested.
The results are shown in Table 5. As it can be seen, most of the predicted regimes are not in
agreement with the experimental measurements. Figure 20 shows a plot of the Gibbs energy of the
drop on sample H83, as a function ofthe penetration depth of water and the contact angle.
39
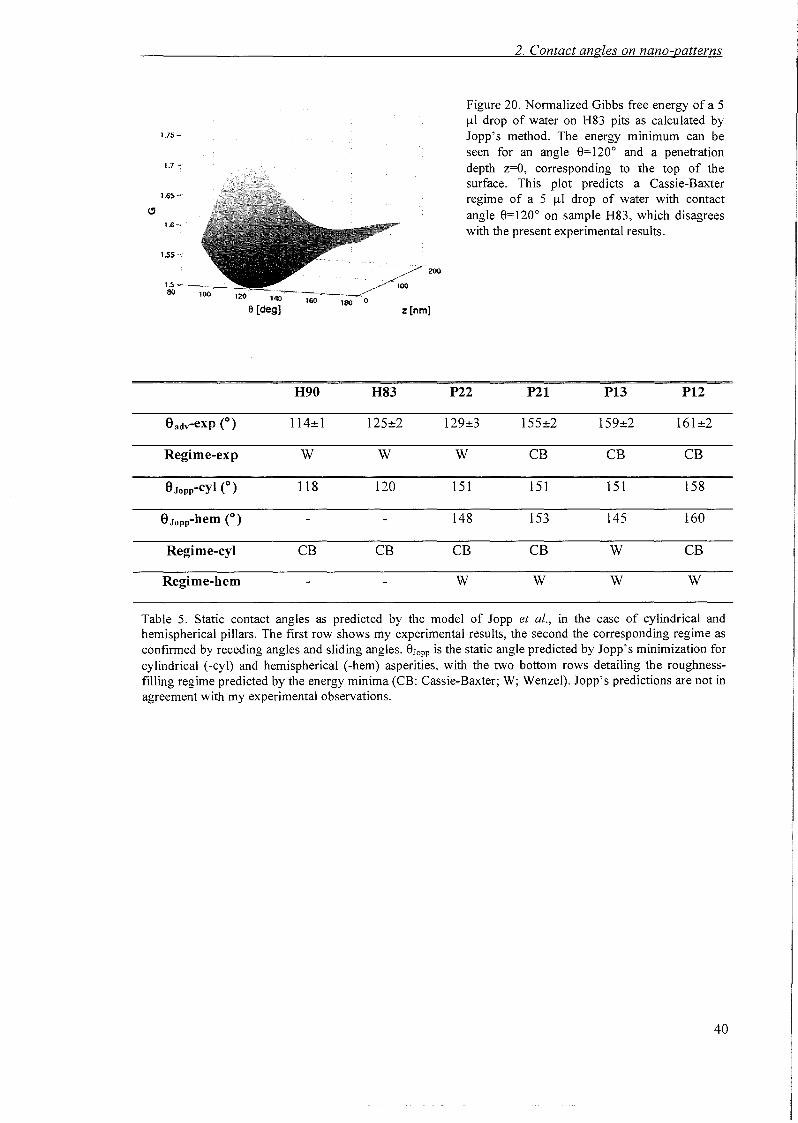
1.7
2. Contact angles on nano-patterns
Figure 20. Normalized Gibbs free energy of a 5ul drop of water on H83 pits as calculated byJopps method. The energy minimum can beseen for an angle 8=120° and a penetrationdepth z=O, corresponding to the top of thesurface. This plot predicts a Cassie-Baxterregime of a 5 ul drop of water with contactangle 8=120° on sample H83, which disagreeswith the present experimental results.
H90 H83
Regime-exp
Regime-cyl
Regime-hem
114±1
w
118
CB
125±2
w
120
CB
P22 P21 P13 P12
129±3 155±2 159±2 161±2
W CB CB CB
151 151 151 158
148 153 145 160
CB CB W CB
W W W W
Table 5. Static contact angles as predicted by the model of lopp et al., in the case of cylindrical andhemispherical pillars. The first row shows my experimental results, the second the corresponding regime asconfirmed by receding angles and sliding angles. 8Jopp is the static angle predicted by Jopps minimization forcylindrical (-cyl) and hemispherical (-hem) asperities, with the two bottom rows detailing the roughnessfilling regime predicted by the energy minima (CB: Cassie-Baxter; W; Wenzel). Jopp's predictions are not inagreement with my experimental observations.
40
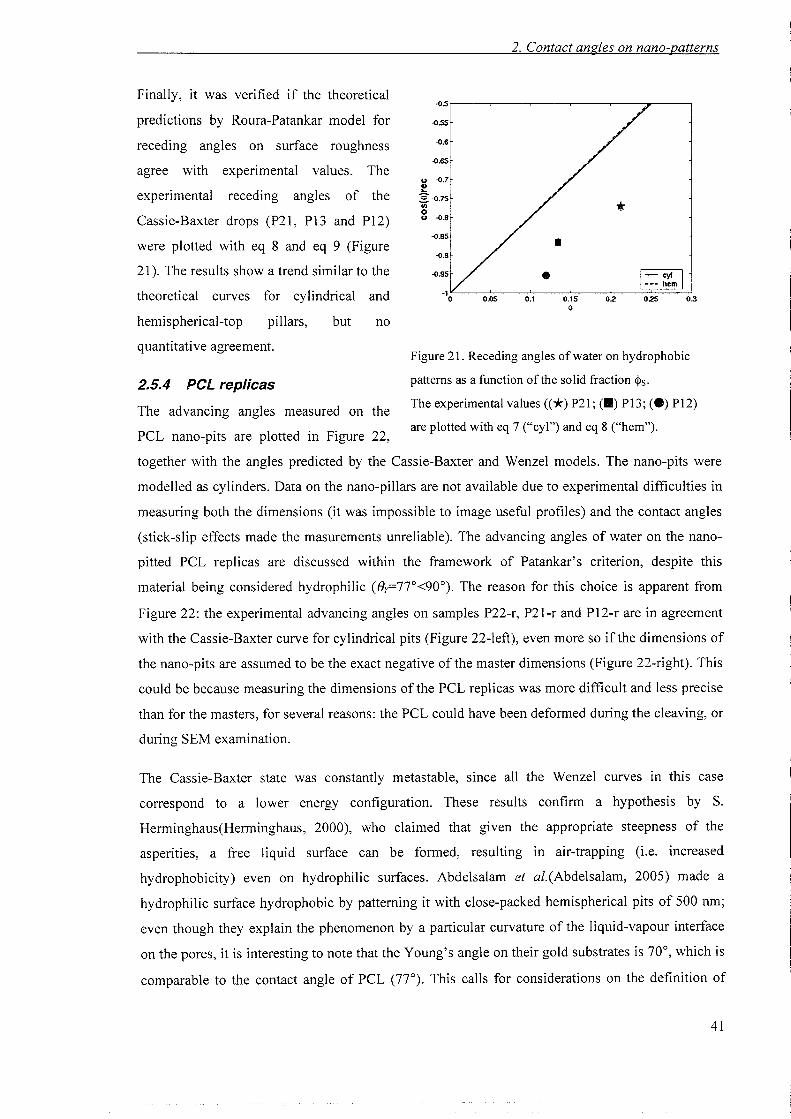
2. Contact angles on nano-patterns
0.3025020.15o
••
0.10.05
-().5r--~----'------'---'-----:J"----
Figure 21. Receding angles of water on hydrophobic
patterns as a function of the solid fraction <Ps.
The experimental values «*) P21; (.) P13; (e) P12)
are plotted with eq 7 ("cyl") and eq 8 ("hem").
2.5.4 ecc replicas
The advancing angles measured on the
PCL nano-pits are plotted in Figure 22,
together with the angles predicted by the Cassie-Baxter and Wenzel models. The nano-pits were
modelled as cylinders. Data on the nano-pillars are not available due to experimental difficulties in
measuring both the dimensions (it was impossible to image useful profiles) and the contact angles
(stick-slip effects made the masurements unreliable). The advancing angles of water on the nano
pitted PCL replicas are discussed within the framework of Patankar's criterion, despite this
material being considered hydrophilic (8y=77°<900). The reason for this choice is apparent from
Figure 22: the experimental advancing angles on samples P22-r, P2I-r and PI2-r are in agreement
with the Cassie-Baxter curve for cylindrical pits (Figure 22-left), even more so if the dimensions of
the nano-pits are assumed to be the exact negative of the master dimensions (Figure 22-right). This
could be because measuring the dimensions of the PCL replicas was more difficult and less precise
than for the masters, for several reasons: the PCL could have been deformed during the cleaving, or
during SEM examination.
Finally, it was verified if the theoretical
predictions by Roura-Patankar model for
receding angles on surface roughness
agree with experimental values. The
experimental receding angles of the
Cassie-Baxter drops (P2I, PI3 and PI2)
were plotted with eq 8 and eq 9 (Figure
21). The results show a trend similar to the
theoretical curves for cylindrical and
hemispherical-top pillars, but no
quantitative agreement.
The Cassie-Baxter state was constantly metastable, SInce all the Wenzel curves in this case
correspond to a lower energy configuration. These results confirm a hypothesis by S.
Herminghaus(Herminghaus, 2000), who claimed that given the appropriate steepness of the
asperities, a free liquid surface can be formed, resulting in air-trapping (i.e. increased
hydrophobicity) even on hydrophilic surfaces. Abdelsalam et al.(Abdelsalam, 2005) made a
hydrophilic surface hydrophobic by patterning it with close-packed hemispherical pits of 500 nm;
even though they explain the phenomenon by a particular curvature of the liquid-vapour interface
on the pores, it is interesting to note that the Young's angle on their gold substrates is 70°, which is
comparable to the contact angle of PCL (7r). This calls for considerations on the definition of
41
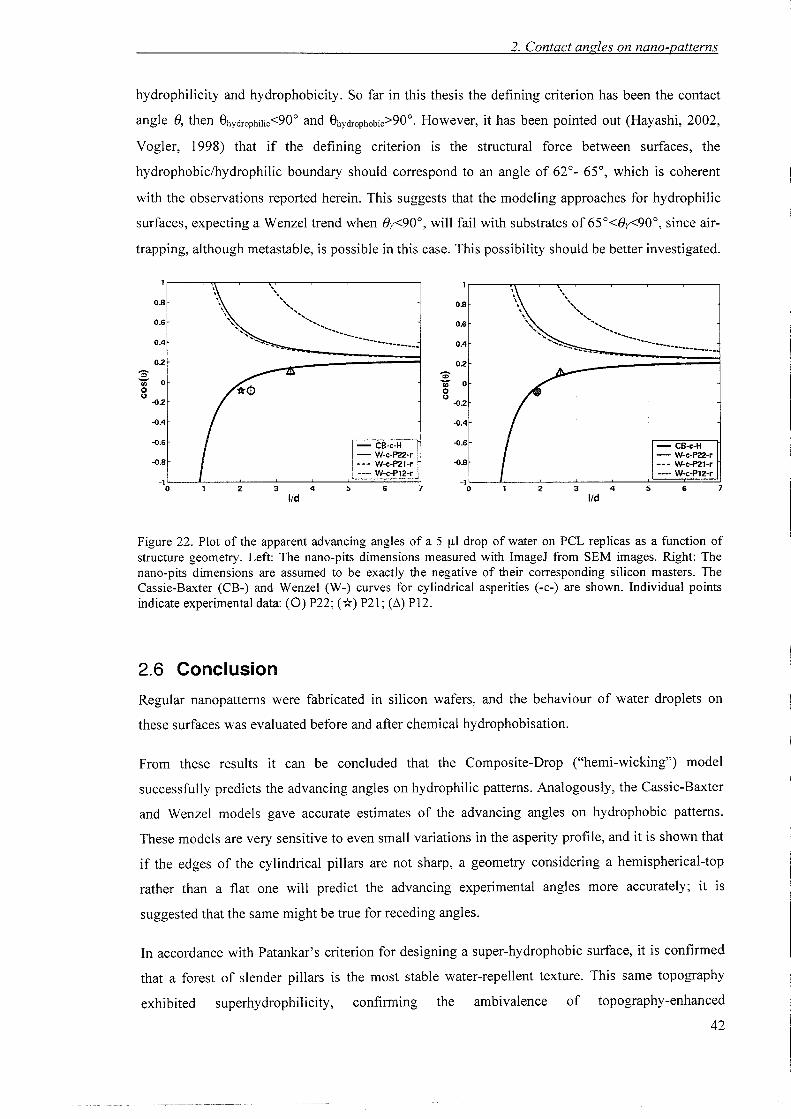
2. Contact angles on nano-patterns
hydrophilicity and hydrophobicity. So far in this thesis the defining criterion has been the contact
angle (), then 8hydrophilic<90° and 8hydrophobic>90°. However, it has been pointed out (Hayashi, 2002,
Vogler, 1998) that if the defining criterion is the structural force between surfaces, the
hydrophobiclhydrophilic boundary should correspond to an angle of 62°- 65°, which is coherent
with the observations reported herein. This suggests that the modeling approaches for hydrophilic
surfaces, expecting a Wenzel trend when ()y<90°, will fail with substrates of 65°<()y<90°, since air
trapping, although metastable, is possible in this case. This possibility should be better investigated.
O.B
0.6
0.4
0.8
0.6
0.4
,,".........
<.
"',.,..•...._-_...._-----------02
0;-li) 0ou
-<l2
-<l.4
-o.e
-o.a- CB-e-H- W-c-P22-r-_.- W-c-P21-r---. W-e-P12-r
020;-li) 0ou
-<l2
-<l.4
-o.e
-<l.8
- CB-c-H- W-c-P22-r_._.- W-e-P21-r--_. W-c-P12-r
2 3lId
4 5 6 7 2lId
4 5 6 7
Figure 22. Plot of the apparent advancing angles of a 5 ftl drop of water on PCL replicas as a function ofstructure geometry. Left: The nano-pits dimensions measured with Image] from SEM images. Right: Thenano-pits dimensions are assumed to be exactly the negative of their corresponding silicon masters. TheCassie-Baxter (CB-) and Wenzel (W-) curves for cylindrical asperities (-c-) are shown. Individual pointsindicate experimental data: (0) P22; (*) P21; (D.) P12.
2.6 Conclusion
Regular nanopatterns were fabricated in silicon wafers, and the behaviour of water droplets on
these surfaces was evaluated before and after chemical hydrophobisation.
From these results it can be concluded that the Composite-Drop ("hemi-wicking") model
successfully predicts the advancing angles on hydrophilic patterns. Analogously, the Cassie-Baxter
and Wenzel models gave accurate estimates of the advancing angles on hydrophobic patterns.
These models are very sensitive to even small variations in the asperity profile, and it is shown that
if the edges of the cylindrical pillars are not sharp, a geometry considering a hemispherical-top
rather than a flat one will predict the advancing experimental angles more accurately; it is
suggested that the same might be true for receding angles.
In accordance with Patankar's criterion for designing a super-hydrophobic surface, it is confirmed
that a forest of slender pillars is the most stable water-repellent texture. This same topography
exhibited superhydrophilicity, confirming the ambivalence of topography-enhanced
42
2. Contact angles on nano-patterns
wetting/dewetting. It is also suggested that nano-pits can support stable Cassie drops only if the
diameter is large compared to the spacing.
Having verified the design criterion, the hypothetical angle of the epicuticular wax crystalloids of
the Lotus leaf was calculated. The results support the suggestion (Patankar, 2004a) that the sub
micrometric structures of the Lotus leaf playa main role in its water-repellent behaviour.
The PCL nano-pits exhibited a Cassie-Baxter behaviour, despite the contact angle on PCL being
()y=77°<90°. These results, besides proving that air-trapping can occur on such "hydrophilic"
surfaces, are in agreement with previous work (Abdelsalam, 2005, Herminghaus, 2000) and
strongly support the consideration that the hydrophobic/hydrophilic boundary contact angle is not
90°, but rather between 62° and 90° (Hayashi, 2002, Vogler, 1998).
43
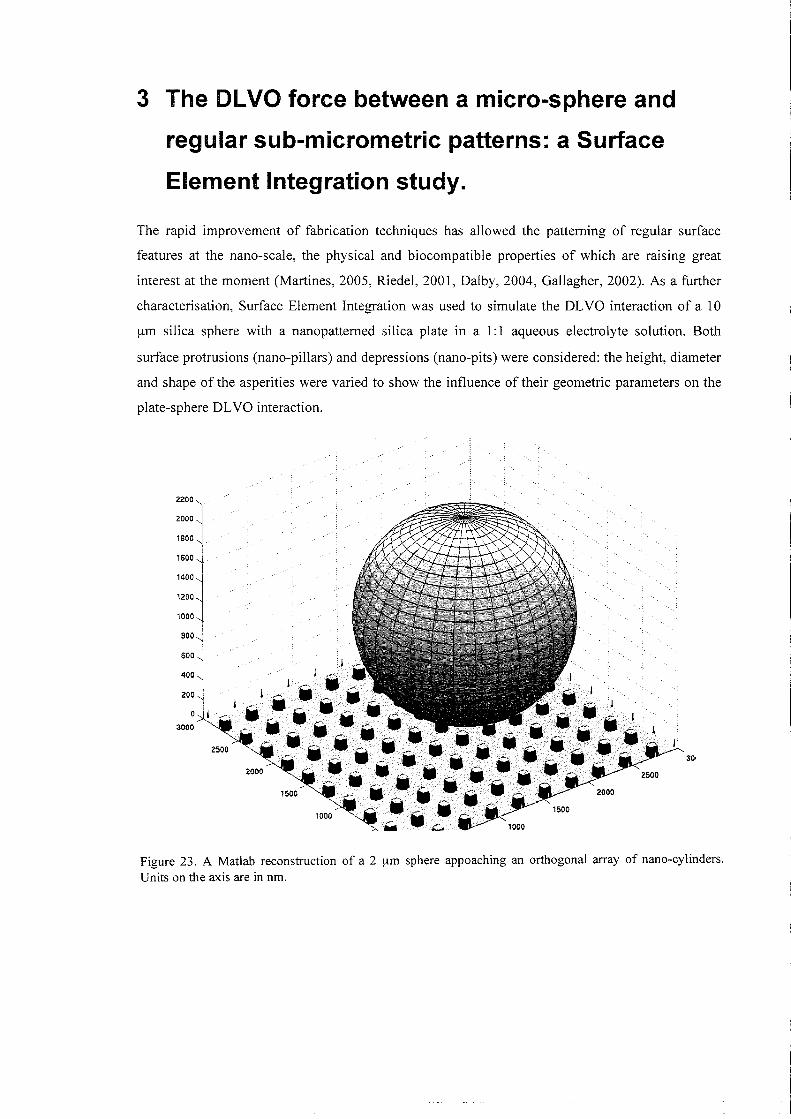
3 The DLVO force between a micro-sphere and
regular sub-micrometric patterns: a Surface
Element Integration study.
The rapid improvement of fabrication techniques has allowed the patterning of regular surface
features at the nano-scale, the physical and biocompatible properties of which are raising great
interest at the moment (Martines, 2005, Riedel, 2001, Dalby, 2004, Gallagher, 2002). As a further
characterisation, Surface Element Integration was used to simulate the DLVO interaction of a 10
urn silica sphere with a nanopatterned silica plate in a 1:1 aqueous electrolyte solution. Both
surface protrusions (nano-pillars) and depressions (nano-pits) were considered: the height, diameter
and shape of the asperities were varied to show the influence of their geometric parameters on the
plate-sphere DLVO interaction.
2200
2000,
1800
1600
1400
1200
1000
800
600
400
200
0 I ".-,
3000
Figure 23. A Matlab reconstruction of a 2 urn sphere appoaching an orthogonal array of nano-cylinders,Units on the axis are in nm.
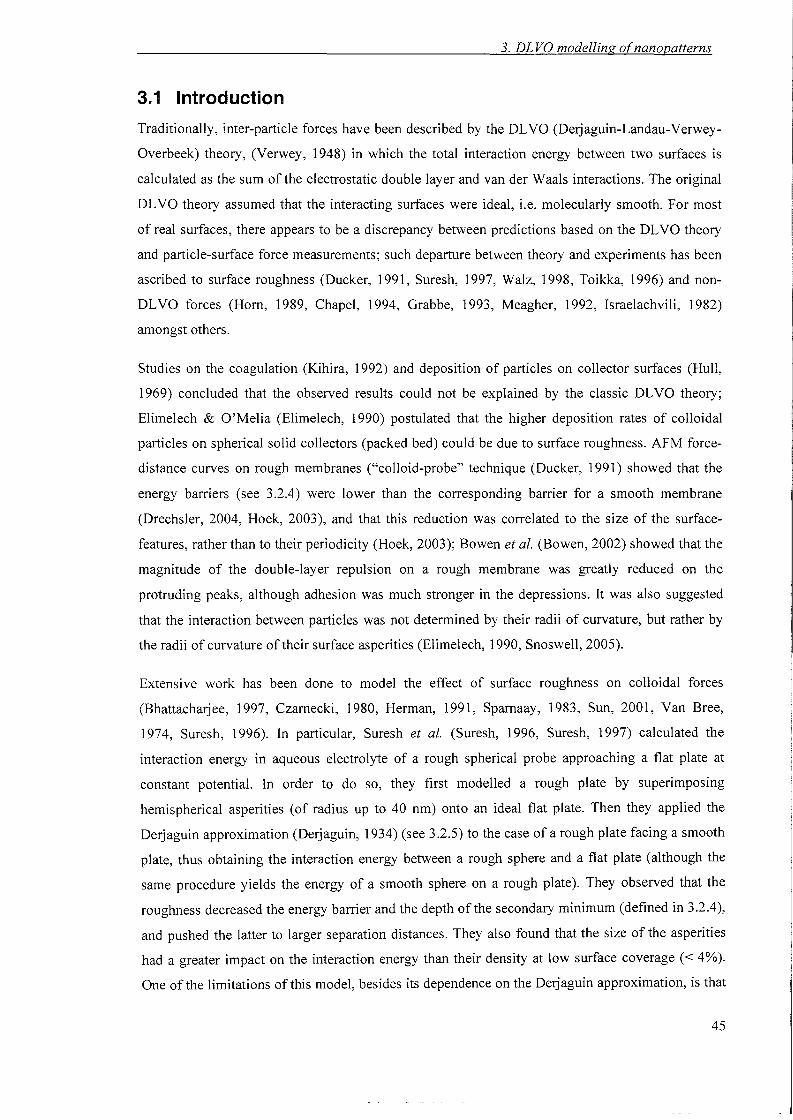
3. DLVa modelling ofnanopatterns
3.1 Introduction
Traditionally, inter-particle forces have been described by the DLVO (Derjaguin-Landau-Verwey
Overbeek) theory, (Verwey, 1948) in which the total interaction energy between two surfaces is
calculated as the sum of the electrostatic double layer and van der Waals interactions. The original
DLVO theory assumed that the interacting surfaces were ideal, i.e. molecularly smooth. For most
of real surfaces, there appears to be a discrepancy between predictions based on the DLVO theory
and particle-surface force measurements; such departure between theory and experiments has been
ascribed to surface roughness (Ducker, 1991, Suresh, 1997, Wa1z, 1998, Toikka, 1996) and non
DLVO forces (Hom, 1989, Chapel, 1994, Grabbe, 1993, Meagher, 1992, Israelachvili, 1982)
amongst others.
Studies on the coagulation (Kihira, 1992) and deposition of particles on collector surfaces (Hull,
1969) concluded that the observed results could not be explained by the classic DLVO theory;
Elimelech & O'Melia (Elimelech, 1990) postulated that the higher deposition rates of colloidal
particles on spherical solid collectors (packed bed) could be due to surface roughness. AFM force
distance curves on rough membranes ("colloid-probe" technique (Ducker, 1991) showed that the
energy barriers (see 3.2.4) were lower than the corresponding barrier for a smooth membrane
(Drechsler, 2004, Hoek, 2003), and that this reduction was correlated to the size of the surface
features, rather than to their periodicity (Hoek, 2003); Bowen et al. (Bowen, 2002) showed that the
magnitude of the double-layer repulsion on a rough membrane was greatly reduced on the
protruding peaks, although adhesion was much stronger in the depressions. It was also suggested
that the interaction between particles was not determined by their radii of curvature, but rather by
the radii of curvature of their surface asperities (Elimelech, 1990, Snoswell, 2005).
Extensive work has been done to model the effect of surface roughness on colloidal forces
(Bhattacharjee, 1997, Czarnecki, 1980, Herman, 1991, Sparnaay, 1983, Sun, 2001, Van Bree,
1974, Suresh, 1996). In particular, Suresh et al. (Suresh, 1996, Suresh, 1997) calculated the
interaction energy in aqueous electrolyte of a rough spherical probe approaching a flat plate at
constant potential. In order to do so, they first modelled a rough plate by superimposing
hemispherical asperities (of radius up to 40 nm) onto an ideal flat plate. Then they applied the
Derjaguin approximation (Derjaguin, 1934) (see 3.2.5) to the case of a rough plate facing a smooth
plate, thus obtaining the interaction energy between a rough sphere and a flat plate (although the
same procedure yields the energy of a smooth sphere on a rough plate). They observed that the
roughness decreased the energy barrier and the depth of the secondary minimum (defined in 3.2.4),
and pushed the latter to larger separation distances. They also found that the size of the asperities
had a greater impact on the interaction energy than their density at low surface coverage « 4%).
One of the limitations of this model, besides its dependence on the Derjaguin approximation, is that
45
3. DLVO modelling ofnanopatterns
the reliability of the prediction decreases inversely with asperity SIze. Thus, for hemispherical
protrusions of order 30 nm the surface covered by asperities must be less than 10%, and
calculations involving protrusions of order 100 nm would be nonsensical. Besides, the model
cannot be applied to the case of concave asperities (i.e. surface depressions).
A common problem of many models is their dependence on the Derjaguin approximation
(Derjaguin, 1934) to calculate the energy between a spherical probe and a plate, because this
approximation is not valid at small separation distances or for highly curved surfaces, and it cannot
be applied to concave topographies. Models like the Surface Element Integration (SEI)
(Bhattacharjee, 1997) or the model of Sun et al.(Sun, 2001) on the other hand allow to approximate
the interaction between interfaces with an arbitrary surface topology. The SEI in particular, consists
of a straightforward analytical method to calculate interaction energies between two surfaces at
constant potential; SEI was proven to be in closer agreement than the Derjaguin approximation
with exact finite-element solutions of the sphere-plate interaction (Bhattacharjee, 1997), and with
experimental measurements (Todd, 2004).
In this work, the SEI technique was applied to simulate the DLva interaction energy between a 10
urn silica sphere and regular silica nanotopographies of varying shape and dimensions, in a 1:I
aqueous electrolyte solution. The height, diameter and shape of the asperities were varied to show
the influence of these geometric parameters on the potential energy of interaction. By using this
simplified model system, the influence of nano-fabricated surface features on the DLVO
interaction energy was simulated as it could be measured by the "colloid-probe" technique. Unlike
in earlier work (Herman, 1991, Suresh, 1996), concave (or hollow) surface topography was
successfully modelled ("nano-pits"). My simulation confirms previous predictions (Suresh, 1996)
that protruding surface topography/roughness ("nano-pillars") should lower the energy barrier and
the depth of the secondary minima, although no dramatic shift in the position of the wells was
observed. The changes in energy barrier and secondary well induced by the nano-pits were less
striking than the ones induced by the nano-pillars. The lower energy barriers would yield much
larger particle deposition rates than predicted by the DLva theory for particles on smooth surfaces,
in qualitative agreement with experimental observations (Elimelech, 1990).
46
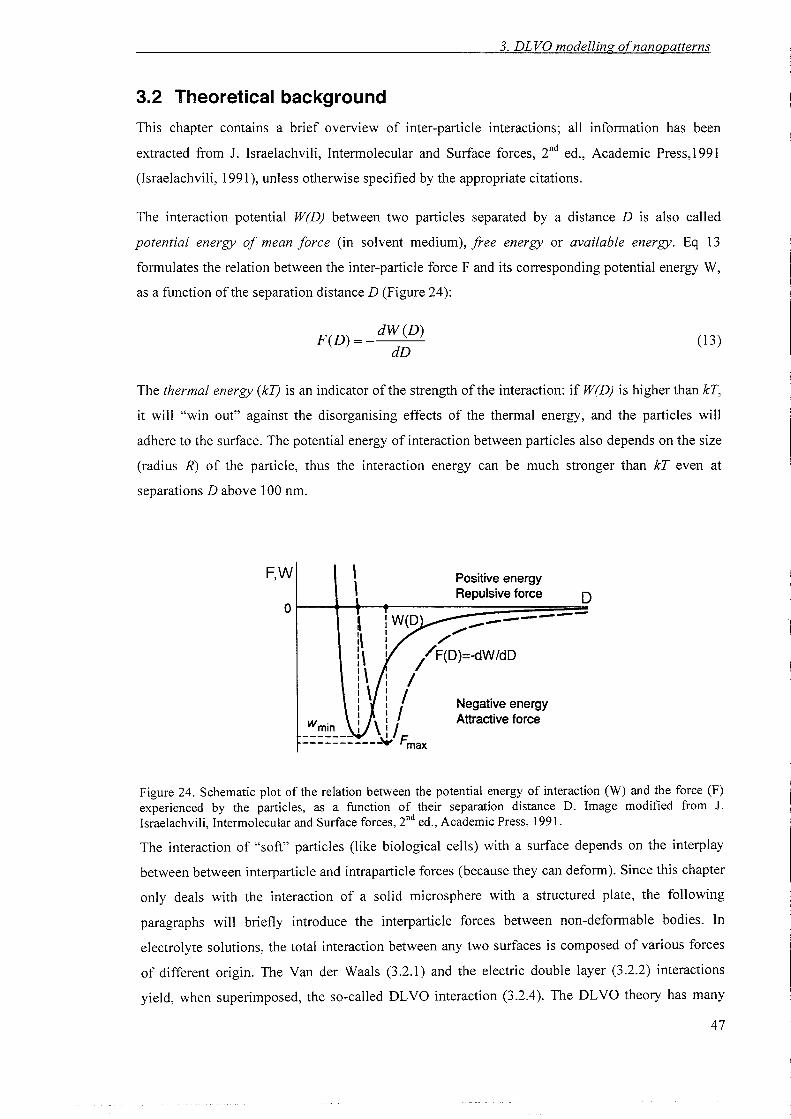
3. DLvo modelling ofnanopatterns
3.2 Theoretical background
This chapter contains a brief overview of inter-particle interactions; all information has been
extracted from J. Israelachvili, Intermolecular and Surface forces, 2nd ed., Academic Press,1991
(Israelachvili, 1991), unless otherwise specified by the appropriate citations.
The interaction potential W(D) between two particles separated by a distance D is also called
potential energy of mean force (in solvent medium), free energy or available energy. Eq 13
formulates the relation between the inter-particle force F and its corresponding potential energy W,
as a function ofthe separation distance D (Figure 24):
F(D) =dW(D)
dD(13)
The thermal energy (kT) is an indicator ofthe strength of the interaction: if W(D) is higher than kT,
it will "win out" against the disorganising effects of the thermal energy, and the particles will
adhere to the surface. The potential energy of interaction between particles also depends on the size
(radius R) of the particle, thus the interaction energy can be much stronger than kT even at
separations D above 100 nm.
D
Negative energyAttractive force
Positive energyRepulsive force
\\
l -----------~
:\ //:\ //F(D)=-dW/dD
l \ /!\ /I I II I
_~~~n : \! IF.-----------'*' max
F,W
Figure 24. Schematic plot of the relation between the potential energy of interaction (W) and the force (F)experienced by the particles, as a function of their separation distance D. Image modified from J.Israelachvili, Intermolecular and Surface forces, 2nd ed., Academic Press, 1991.
The interaction of "soft" particles (like biological cells) with a surface depends on the interplay
between between interparticle and intraparticle forces (because they can deform). Since this chapter
only deals with the interaction of a solid microsphere with a structured plate, the following
paragraphs will briefly introduce the interparticle forces between non-deformable bodies. In
electrolyte solutions, the total interaction between any two surfaces is composed of various forces
of different origin. The Van der Waals (3.2.1) and the electric double layer (3.2.2) interactions
yield, when superimposed, the so-called DLVO interaction (3.2.4). The DLVO theory has many
47
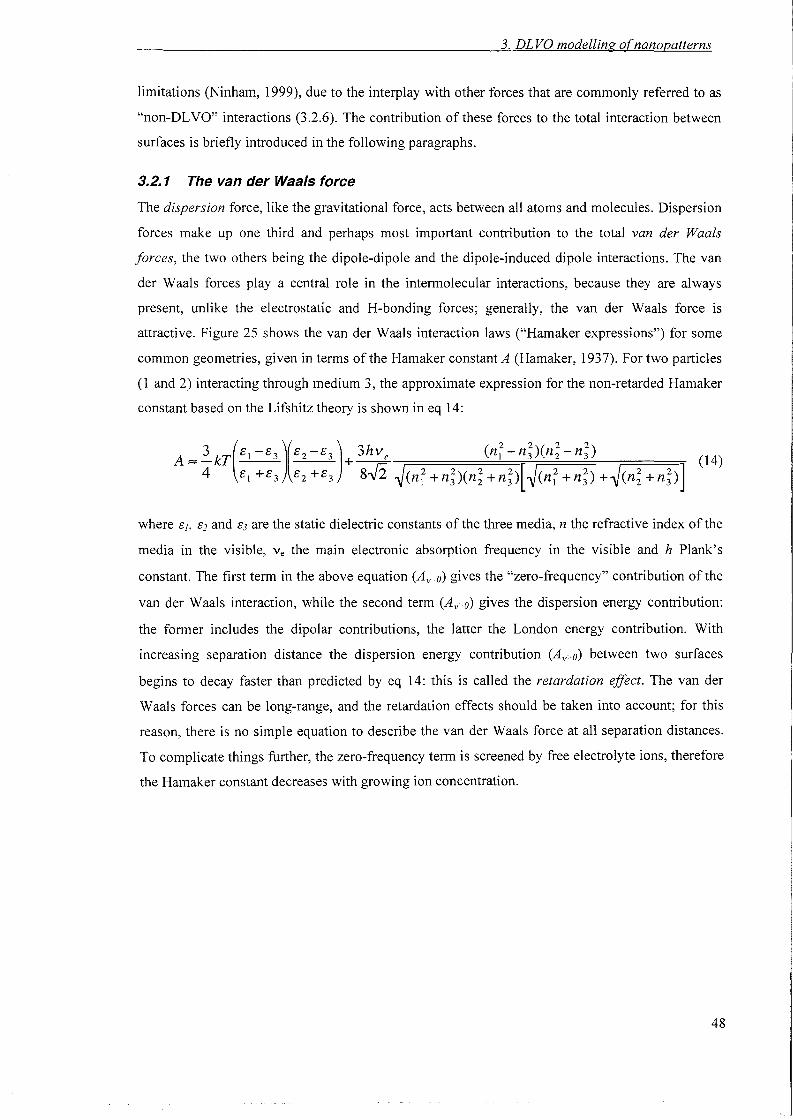
3. DLVa modelling o(nanopatterns
limitations (Ninham, 1999), due to the interplay with other forces that are commonly referred to as
"non-Dl.VO" interactions (3.2.6). The contribution of these forces to the total interaction between
surfaces is briefly introduced in the following paragraphs.
3.2.1 The van der Waals force
The dispersion force, like the gravitational force, acts between all atoms and molecules. Dispersion
forces make up one third and perhaps most important contribution to the total van der Waals
forces, the two others being the dipole-dipole and the dipole-induced dipole interactions. The van
der Waals forces playa central role in the intermolecular interactions, because they are always
present, unlike the electrostatic and H-bonding forces; generally, the van der Waals force is
attractive. Figure 25 shows the van der Waals interaction laws ("Hamaker expressions") for some
common geometries, given in terms of the Hamaker constant A (Hamaker, 1937). For two particles
(1 and 2) interacting through medium 3, the approximate expression for the non-retarded Hamaker
constant based on the Lifshitz theory is shown in eq 14:
where Sf, S2 and S3 are the static dielectric constants of the three media, n the refractive index of the
media in the visible, v, the main electronic absorption frequency in the visible and h Plank's
constant. The first term in the above equation (Ava) gives the "zero-frequency" contribution of the
van der Waals interaction, while the second term (A v ·o) gives the dispersion energy contribution:
the former includes the dipolar contributions, the latter the London energy contribution. With
increasing separation distance the dispersion energy contribution (Av>o) between two surfaces
begins to decay faster than predicted by eq 14: this is called the retardation effect. The van der
Waals forces can be long-range, and the retardation effects should be taken into account; for this
reason, there is no simple equation to describe the van der Waals force at all separation distances.
To complicate things further, the zero-frequency term is screened by free electrolyte ions, therefore
the Hamaker constant decreases with growing ion concentration.
48
Two atoms
1 2... r ••
Atom-surface
w= o1tCp/6D 3
Twoparallel chain molecules
Twocrossed cylinders
3. DLVa modelling ofnanopatterns
Two spheres
Sphere-surface
W=-ARl6D
Twocylinders
Twosurfaces
::cW =-A/121tD2 per unit area
Figure 25. Non-retarded van der Waals interaction free energies between bodies of different geometriescalculated on the basis of Hamaker summation method. The interaction energy (W) can be expressed as theHamaker constant (A) times a geometric term describing the interacting surfaces. Image from J. Israelachvili,Intermolecular and Surface forces, 2nd ed., Academic Press, 1991.
3.2.2 The electric double-layer force
The electric double layer force between charged surfaces decays roughly exponentially and is
repulsive if the charge on the interacting surfaces has the same sign. Its strength is governed by the
electrical potential of the surfaces, its range by the ionic strength of the electrolyte solution.
A surface in a liquid can be charged by ionization or dissociation of surface groups (e.g.
COOH-COO-+H+), and/or by adsorption (binding) of ions from the solution onto a previously
uncharged surface. The surface charge is balanced by an atmosphere of counterions, some
transiently bound to the surface (within the Stern layer, see below), some diffuse in rapid thermal
motion close to the surface (diffuse electric double layer). The widely accepted model for the
49
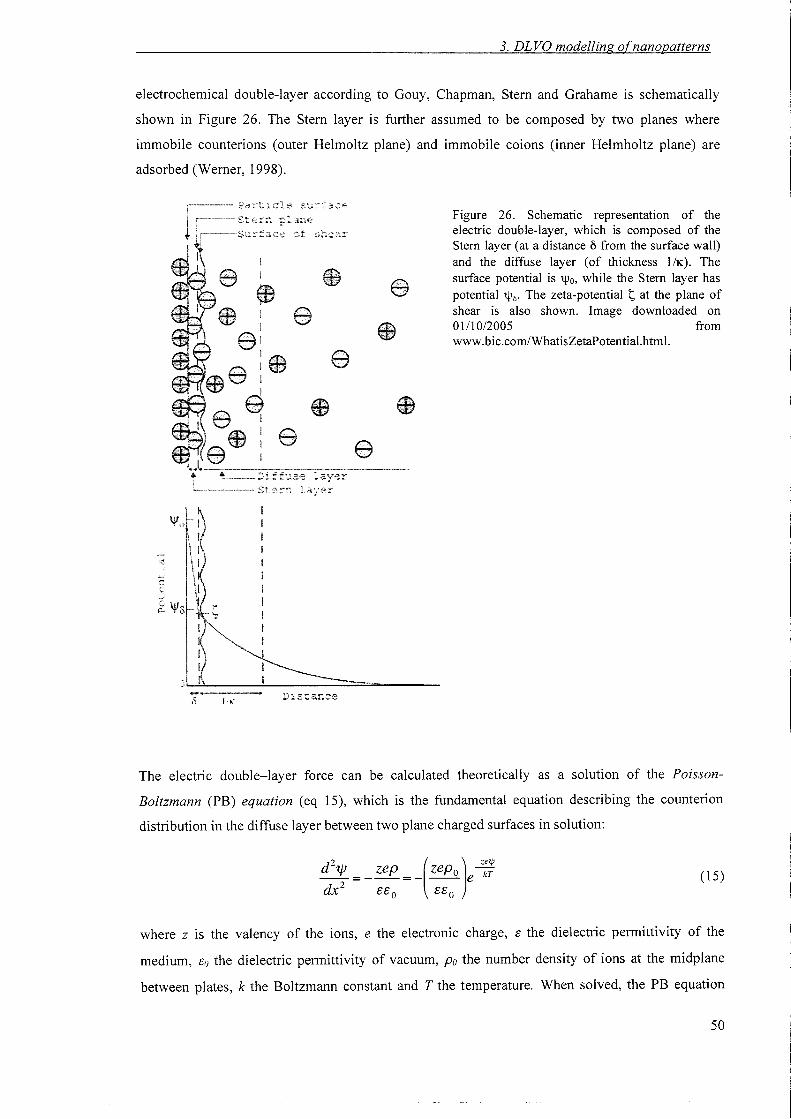
3. DLVa modelling ofnanopatterns
electrochemical double-layer according to Gouy, Chapman, Stem and Grahame is schematically
shown in Figure 26. The Stem layer is further assumed to be composed by two planes where
immobile counterions (outer Helmoltz plane) and immobile coions (inner Helmholtz plane) are
adsorbed (Werner, 1998).
Figure 26. Schematic representation of theelectric double-layer, which is composed of theStem layer (at a distance [) from the surface wall)and the diffuse layer (of thickness 11K). Thesurface potential is <VO, while the Stem layer haspotential <Vb. The zeta-potential ~ at the plane ofshear is also shown. Image downloaded on01110/2005 fromwww.bic.com/WhatisZetaPotential.html.
DlSta::ce
The electric double-layer force can be calculated theoretically as a solution of the Poisson
Boltzmann (PB) equation (eq 15), which is the fundamental equation describing the counterion
distribution in the diffuse layer between two plane charged surfaces in solution:
(15)
where z is the valency of the ions, e the electronic charge, e the dielectric permittivity of the
medium, &0 the dielectric permittivity of vacuum, po the number density of ions at the midplane
between plates, k the Boltzmann constant and T the temperature. When solved, the PB equation
50
3. DLvo modelling ofnanopatterns
gives the potential 'ljJ, the electric field E=o'ljJlox and the counterion density p at any point x in the
gap. To solve the PB equation, certain boundary conditions have to be assumed, e.g. constant
potential or constant charge distribution of the surfaces. The relation between the surface charge a
and the surface potential 'ljJo is given by the Grahame equation for the case of a mixed NaCl +CaCIz
electrolyte:
In most cases neither the surface charge nor the surface potential remains constant as the solution
conditions change: if specific ions from the solution bind to the ionizable sites of the surface
(potential determining ions), both 'ljJo and a will vary as the salt concentration and/or pH are
changed. For low surface potentials ('ljJo <25 mW), the Grahame equation reduces to:
(17)
where 11K is the Debye length, i.e. the "thickness" of the diffuse electric double-layer given by eq
18:
(18)
Typical values of the Debye length in a 1:1 electrolyte are: K-1",,10 nm at 1 mM and K-1 ",,1 nm at
100 mM. The magnitude of the Debye length depends solely on the properties of the liquid, and not
on the surface properties as is the case for the surface charge and potential.
The contact value theorem (eq 19) defines the pressure (force) P between two surfaces at
separation distance 0, as a function of the ionic concentration at the surface Ps:
P(D)=kT[ps(D)- ps(oo)) (19)
By using the Poisson-Boltzmann equation to calculate the ionic distribution between two surfaces,
and incorporating it in the contact value theorem, it is possible to obtain the double-layer potential
energy (WEod per unit area between two planar surfaces:
W (D) = 64kTpx tanh 2 (ze1.fJo)e-1dJ
WL K 4kT(20)
where px is the concentration of ions in the bulk and D the separation distanceof the two plates. It
can be noted that the double layer interaction between surfaces decays exponentially with distance,
with a characteristic decay length (the Debye length 117>:). The above equation is known as the weak
51
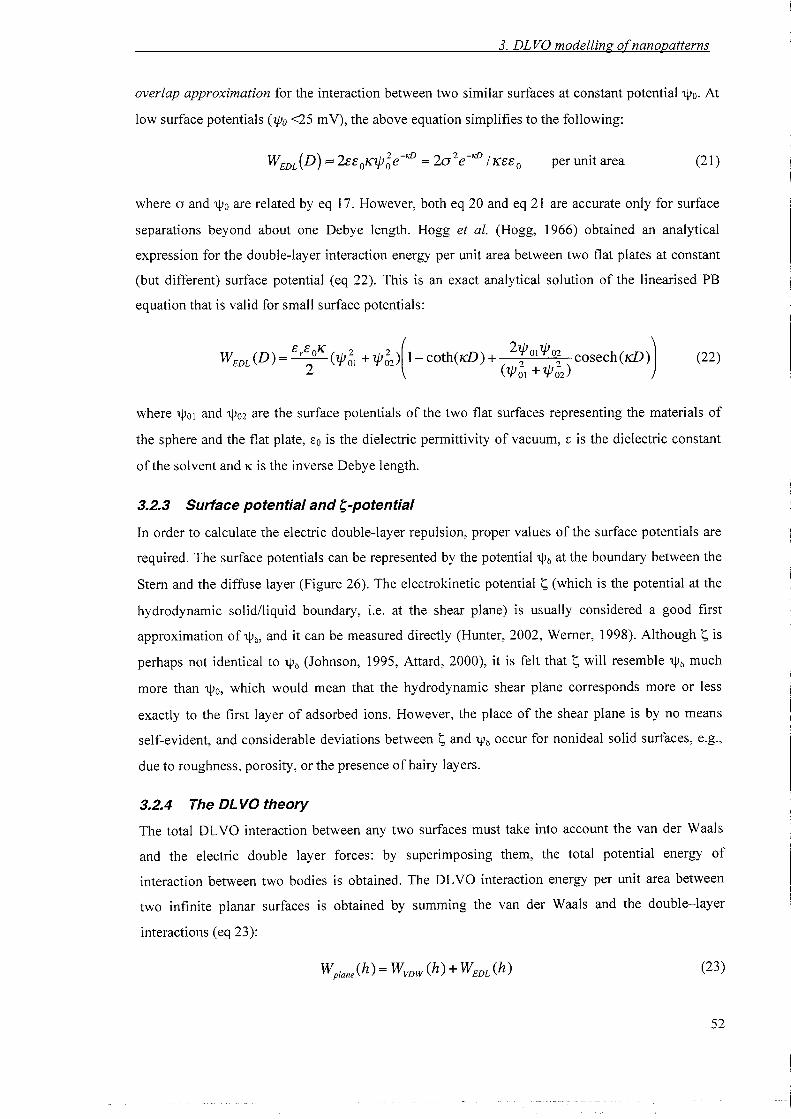
3. DLVa modelling ofnanopatterns
overlap approximation for the interaction between two similar surfaces at constant potential 'ljJo. At
low surface potentials ('l/Jo <25 mV), the above equation simplifies to the following:
per unit area (21)
where (J and 'ljJo are related by eq 17. However, both eq 20 and eq 21 are accurate only for surface
separations beyond about one Debye length. Hogg et al. (Hogg, 1966) obtained an analytical
expression for the double-layer interaction energy per unit area between two flat plates at constant
(but different) surface potential (eq 22). This is an exact analytical solution of the linearised PB
equation that is valid for small surface potentials:
W (D)= crcOK (./,2 +.1,2 )(l-coth(KD)+ 21./J0! 1./J 02 COSeCh(KD)) (22)EDL 2 't'0! 't'02 (1./J;\ +'l.jJ;2)
where 'ljJOl and 'ljJ02 are the surface potentials of the two flat surfaces representing the materials of
the sphere and the flat plate, £0 is the dielectric permittivity of vacuum, £ is the dielectric constant
of the solvent and K is the inverse Debye length.
3.2.3 Surface potential and ~-potential
In order to calculate the electric double-layer repulsion, proper values of the surface potentials are
required. The surface potentials can be represented by the potential 'ljJo at the boundary between the
Stem and the diffuse layer (Figure 26). The electrokinetic potential ~ (which is the potential at the
hydrodynamic solid/liquid boundary, i.e. at the shear plane) is usually considered a good first
approximation of'ljJo, and it can be measured directly (Hunter, 2002, Werner, 1998). Although ~ is
perhaps not identical to 'ljJo (Johnson, 1995, Attard, 2000), it is felt that ~ will resemble 'ljJo much
more than 'ljJo, which would mean that the hydrodynamic shear plane corresponds more or less
exactly to the first layer of adsorbed ions. However, the place of the shear plane is by no means
self-evident, and considerable deviations between ~ and 'ljJo occur for nonideal solid surfaces, e.g.,
due to roughness, porosity, or the presence of hairy layers.
3.2.4 The DL VO theory
The total DLVO interaction between any two surfaces must take into account the van der Waals
and the electric double layer forces: by superimposing them, the total potential energy of
interaction between two bodies is obtained. The DL VO interaction energy per unit area between
two infinite planar surfaces is obtained by summing the van der Waals and the double-layer
interactions (eq 23):
(23)
52
3. DL va modelling o(nanopaUerns
As a first approximation, the van der Waals potential is considered insensitive to electrolyte
concentrations and pH, so it is assumed to be fixed. When D~O, the van der Waals energy
dominates because it is a power-law, whereas the double layer interaction energy remains finite or
rises more slowly. Depending on the electrolyte concentration, the surface charge density or
potential, different cases can occur under the combined action of the two forces. In the case of
highly charged surfaces in electrolyte solution there is a strong long-range repulsion that peaks at
some distance (1-4 nm), usually at the energy barrier, followed by a significant secondary
minimum or well as shown in Figure 27. The potential energy minimum at adhesive contact is
known as the primary minimum for a colloidal system, and if the energy barrier is too high to be
overcome, the particles sit in the weak secondary minimum or they remain totally dispersed.
The main factor bringing two surfaces into
adhesive contact is the decreasing of the
surface charge or potential (by screening or
binding) by increasing the salt
concentration. However, if the surface has
a high potential, even after adding
electrolyte to the solution, the surfaces can
still adhere in a secondary minimum.
3.2.5 The Derjaguin approximation
It is convenient to relate the interaction
__ Energy barrier
Distance [nm]
Figure 27. Schematic ofa DLVO curve.force F(D) between two curved surfaces to
the interaction free energy W(D) between two planar surfaces. The Derjaguin approximation
(Derjaguin, 1934) (DA, eq 24) gives the van der Waals force between two spheres of radii R, and
R2 in terms of the energy per unit area of two flat surfaces at the same distance D, assuming
Rj»D and R2»D:
If R2»Rj, we obtain the limiting case ofa sphere near a planar surface:
F(D)sphere = 2JCRW(D)Planes
(24)
(25)
This relation is valid for any type of force law, assuming that the radius of curvature of the two
bodies ifmuch bigger than their separation distance (R»D). Subsequently, it is possible to obtain
the free energy of interaction between a sphere and a plate by applying eq 13:
53
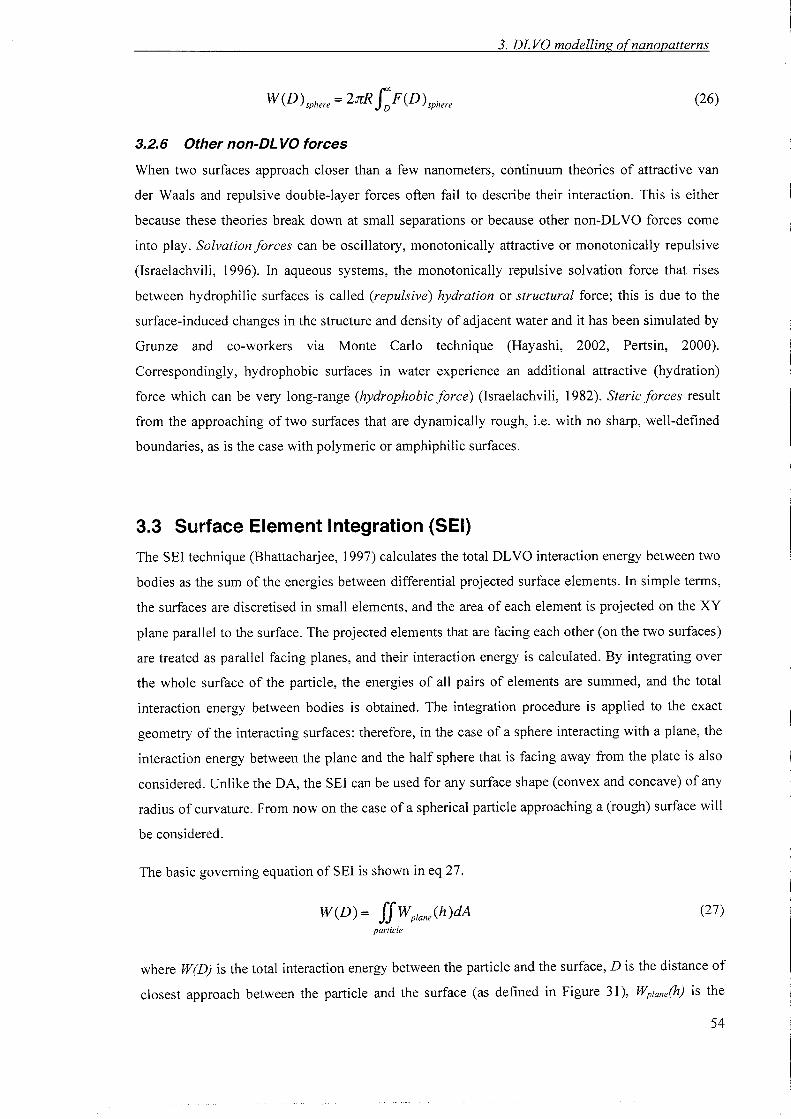
W(D)sphere = 2nR J;F(D),Phere
3.2.6 Other non-DL VO forces
3. DL va modelling ofnanopatterns
(26)
When two surfaces approach closer than a few nanometers, continuum theories of attractive van
der Waals and repulsive double-layer forces often fail to describe their interaction. This is either
because these theories break down at small separations or because other non-Dl.VO forces come
into play. Solvation forces can be oscillatory, monotonically attractive or monotonically repulsive
(Israelachvili, 1996). In aqueous systems, the monotonically repulsive solvation force that rises
between hydrophilic surfaces is called (repulsive) hydration or structural force; this is due to the
surface-induced changes in the structure and density of adjacent water and it has been simulated by
Grunze and co-workers via Monte Carlo technique (Hayashi, 2002, Pertsin, 2000).
Correspondingly, hydrophobic surfaces in water experience an additional attractive (hydration)
force which can be very long-range (hydrophobic force) (Israelachvili, 1982). Steric forces result
from the approaching of two surfaces that are dynamically rough, i.e. with no sharp, well-defined
boundaries, as is the case with polymeric or amphiphilic surfaces.
3.3 Surface Element Integration (SEI)
The SEI technique (Bhattacharjee, 1997) calculates the total DLVO interaction energy between two
bodies as the sum of the energies between differential projected surface elements. In simple terms,
the surfaces are discretised in small elements, and the area of each element is projected on the XY
plane parallel to the surface. The projected elements that are facing each other (on the two surfaces)
are treated as parallel facing planes, and their interaction energy is calculated. By integrating over
the whole surface of the particle, the energies of all pairs of elements are summed, and the total
interaction energy between bodies is obtained. The integration procedure is applied to the exact
geometry of the interacting surfaces: therefore, in the case of a sphere interacting with a plane, the
interaction energy between the plane and the half sphere that is facing away from the plate is also
considered. Unlike the DA, the SEI can be used for any surface shape (convex and concave) of any
radius of curvature. From now on the case of a spherical particle approaching a (rough) surface will
be considered.
The basic governing equation ofSEI is shown in eq 27.
WeD) = ffWplane(h)dAparticle
(27)
where W(D) is the total interaction energy between the particle and the surface, D is the distance of
closest approach between the particle and the surface (as defined in Figure 3 I), Wplane(h) is the
54
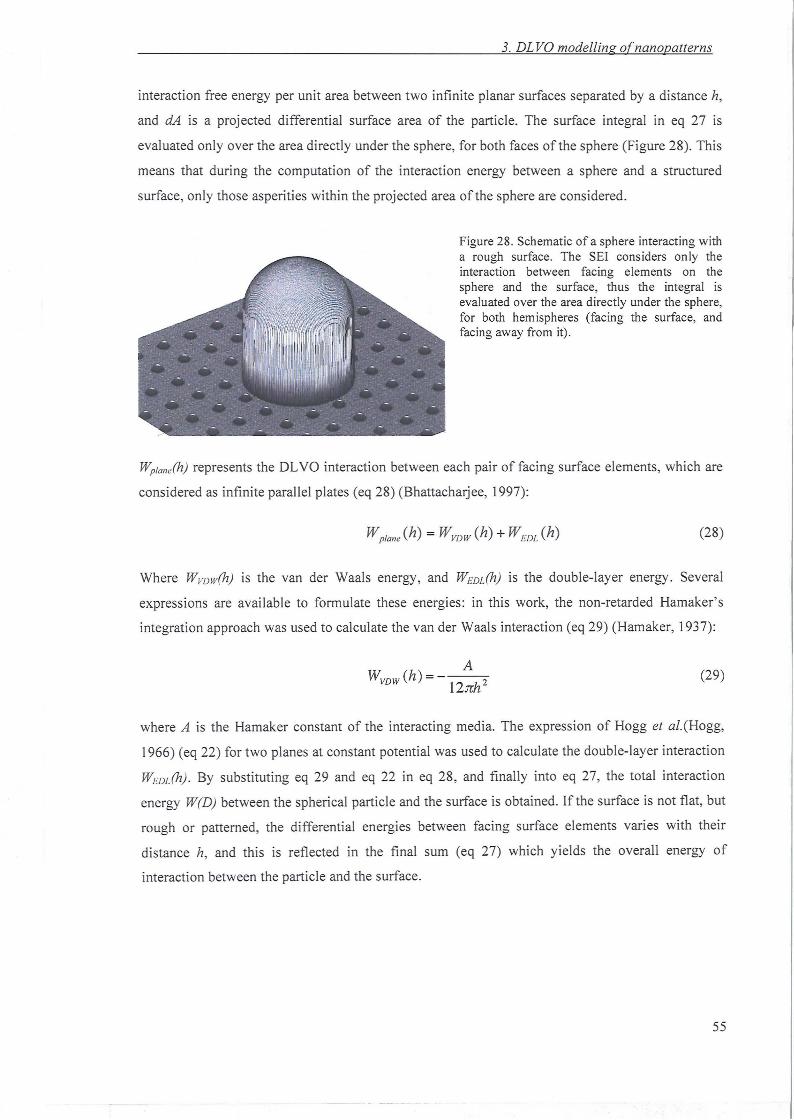
3. DLVa modelling ofnanopatterns
interaction free energy per unit area between two infinite planar surfaces separated by a distance h,
and dA is a projected differentia l surface area of the particle. The surface integral in eq 27 is
evaluated only over the area directly under the sphere, for both faces of the sphere (Figure 28). This
means that dur ing the computation of the interaction energy between a sphere and a structured
surface, only those asperities within the projected area of the sphere are considered.
Figure 28. Schematic of a sphere interacting witha rough surface. The SEI considers only theinteraction between facing elements on thesphere and the surface, thus the integral isevaluated over the area directly under the sphere,for both hemispheres (facing the surface, andfacing away from it).
Wp/one(h) represents the DLVO interaction between each pair of facing surface elements, which are
considered as infinite parallel plates (eq 28) (Bhattacharj ee, 1997):
W p/one(h) = W VDW (h) + WE/X (h) (28)
Where WVDw(h) is the van der Waals energy , and WEDL (h) is the double-layer energy. Several
expre ssions are available to formu late these energies: in this work, the non-retarded Hamake r's
integration approach was used to calculate the van der Waals interaction (eq 29) (Hamaker, 1937):
WVDW(h) =A
12nh 2(29)
where A is the Hamaker constant of the interacting media. The expression of Hogg et al.(Hogg,
1966) (eq 22) for two planes at constant potential was used to calculate the double-layer interaction
W/:DL (h) . By substituting eq 29 and eq 22 in eq 28, and finally into eq 27, the total interaction
energy W(D) betwe en the spherical part icle and the surface is obtain ed. If the surface is not flat , but
rough or patterned, the differential energies between facing surface elements vari es with their
distance h, and this is reflected in the final sum (eq 27) which yie lds the overall energy of
interaction between the particl e and the surface.
55
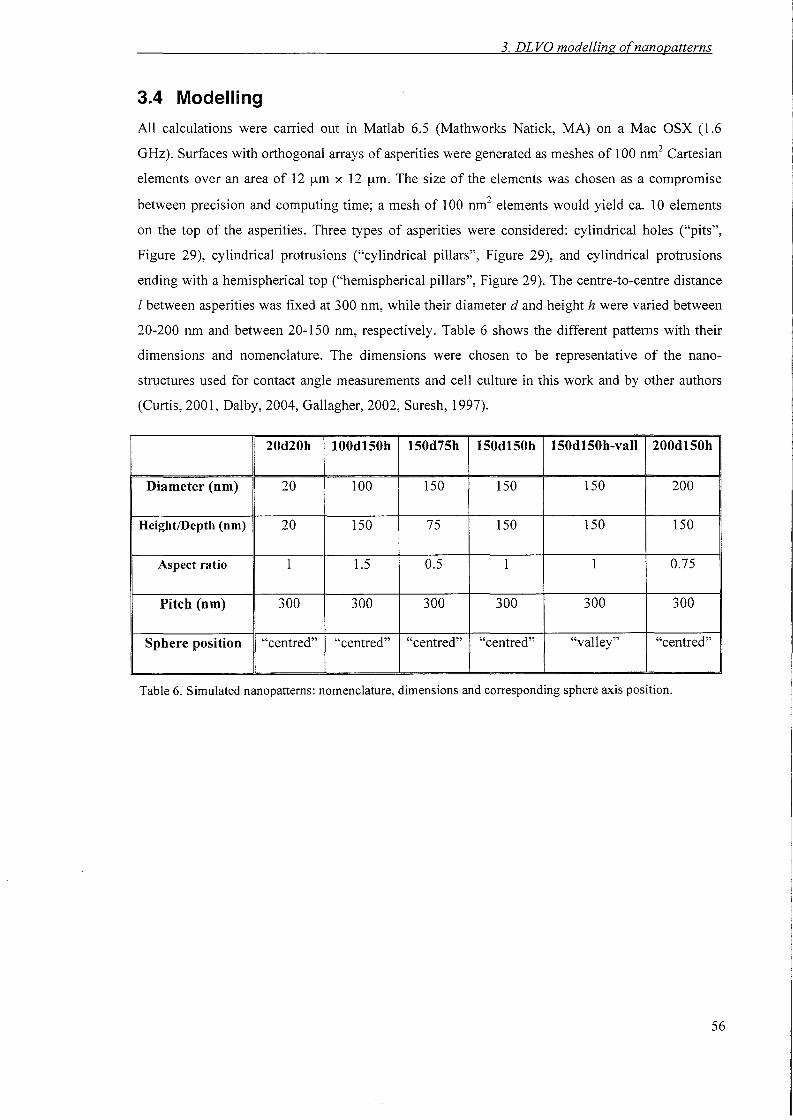
3. DLvo modelling ofnanopatterns
3.4 Modell ing
All calculations were carried out in Matlab 6.5 (Mathworks Natick, MA) on a Mac OSX (1.6
GHz). Surfaces with orthogonal arrays of asperities were generated as meshes of 100 nrrr' Cartesian
elements over an area of 12 urn x 12 urn. The size of the elements was chosen as a compromise
between precision and computing time; a mesh of 100 nrrr' elements would yield ca. 10 elements
on the top of the asperities. Three types of asperities were considered: cylindrical holes ("pits",
Figure 29), cylindrical protrusions ("cylindrical pillars", Figure 29), and cylindrical protrusions
ending with a hemispherical top ("hemispherical pillars", Figure 29). The centre-to-centre distance
I between asperities was fixed at 300 nm, while their diameter d and height h were varied between
20-200 nm and between 20-150 nm, respectively. Table 6 shows the different patterns with their
dimensions and nomenclature. The dimensions were chosen to be representative of the nano
structures used for contact angle measurements and cell culture in this work and by other authors
(Curtis, 2001, Dalby, 2004, Gallagher, 2002, Suresh, 1997).
20d20h lOOd150h 150d75h 150d150h 150d150h-vall 200d150h
Diameter (nm) 20 100 150 150 150 200
Height/Depth (om) 20 150 75 150 150 150
Aspect ratio 1 1.5 0.5 1 1 0.75
Pitch (nm) 300 300 300 300 300 300
Sphere position "centred" "centred" "centred" "centred" "valley" "centred"
Table 6. Simulated nanopattems: nomenclature, dimensions and corresponding sphere axis position.
56
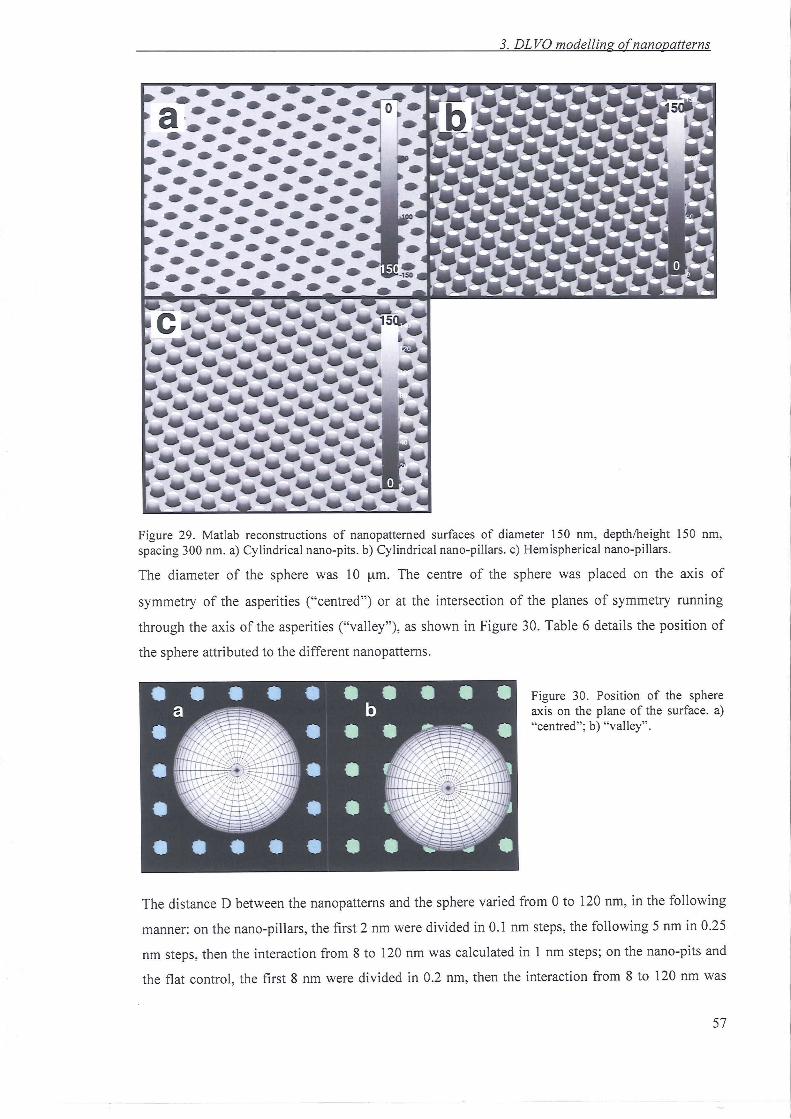
3. DLVa modelling o[nanopatlerns
<rz-z-r-»:-a ,· •••••• ••••••••• -r:»:- •••-z-rz-z-z-r:-z-rz-z-z-r:• •• • •• • • •• • ••• • • •• • •-z-rz-z-z-r:-z-rz-z-z-r:• •• • •• • • ••• •-z-rz-z-z-r:- I.~......... -. .~.-• • • • •
Figure 29. Matlab reconstructions of nanopatterned surfaces of diameter 150 nm, depth/height 150 nm,spacing 300 nm. a) Cylindrica l nano-pits. b) Cylindrical nano-pillars. c) Hemispherical nano-pillars.
The diameter of the sphere was 10 urn. The centre of the sphere was placed on the axis of
symmetry of the asperities ("centred") or at the intersection of the planes of symmetry runnin g
through the axis of the asperities ("valley"), as shown in Figure 30. Table 6 details the position of
the sphere attributed to the different nanopattems.
Figure 30. Position of the sphereaxis on the plane of the surface. a)"centred"; b) "valley" .
The distance 0 between the nanopattems and the sphere varied from 0 to 120 nm, in the following
manner: on the nano-pillars, the first 2 nm were divided in 0.1 nm steps, the following 5 nm in 0.25
nm steps, then the interaction from 8 to 120 nm was calculated in 1 nm steps; on the nano-pits and
the flat control, the first 8 nm were divided in 0.2 nm, then the interaction from 8 to 120 nm was
57
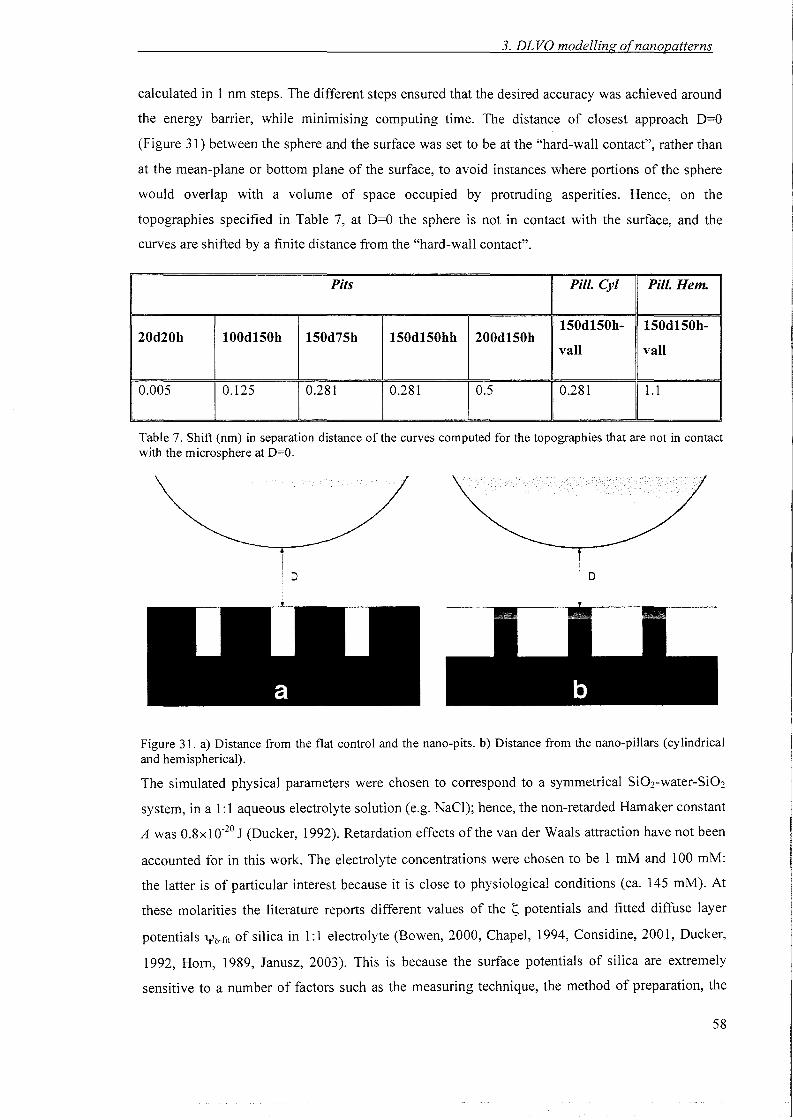
3. DLvo modelling ofnanopatterns
calculated in 1 nm steps. The different steps ensured that the desired accuracy was achieved around
the energy barrier, while minimising computing time. The distance of closest approach D=O
(Figure 31) between the sphere and the surface was set to be at the "hard-wall contact", rather than
at the mean-plane or bottom plane of the surface, to avoid instances where portions of the sphere
would overlap with a volume of space occupied by protruding asperities. Hence, on the
topographies specified in Table 7, at D=O the sphere is not in contact with the surface, and the
curves are shifted by a finite distance from the "hard-wall contact".
Pits Pill. Cyl Pill. Hem.
150d150h- 150d150h-20d20h 100d150h 150d75h 150d150hh 200d150h
vall vall
0.005 0.125 0.281 0.281 I 0.5 0.281 1.1
Table 7. Shift (nm) in separation distance of the curves computed for the topographies that are not in contactwith the microsphere at 0=0.
D D
Figure 31. a) Distance from the flat control and the nano-pits. b) Distance from the nano-pillars (cylindricaland hemispherical).
The simulated physical parameters were chosen to correspond to a symmetrical Si02-water-Si02
system, in a 1:1 aqueous electrolyte solution (e.g. NaCl); hence, the non-retarded Hamaker constant
A was 0.8x10⁻²⁰ J (Ducker, 1992). Retardation effects of the van der Waals attraction have not been
accounted for in this work. The electrolyte concentrations were chosen to be I mM and 100 mM:
the latter is of particular interest because it is close to physiological conditions (ca. 145 mM). At
these molarities the literature reports different values of the S potentials and fitted diffuse layer
potentials 1.lJo-fit of silica in I: 1 electrolyte (Bowen, 2000, Chapel, 1994, Considine, 2001, Ducker,
1992, Hom, 1989, Janusz, 2003). This is because the surface potentials of silica are extremely
sensitive to a number of factors such as the measuring technique, the method of preparation, the
58
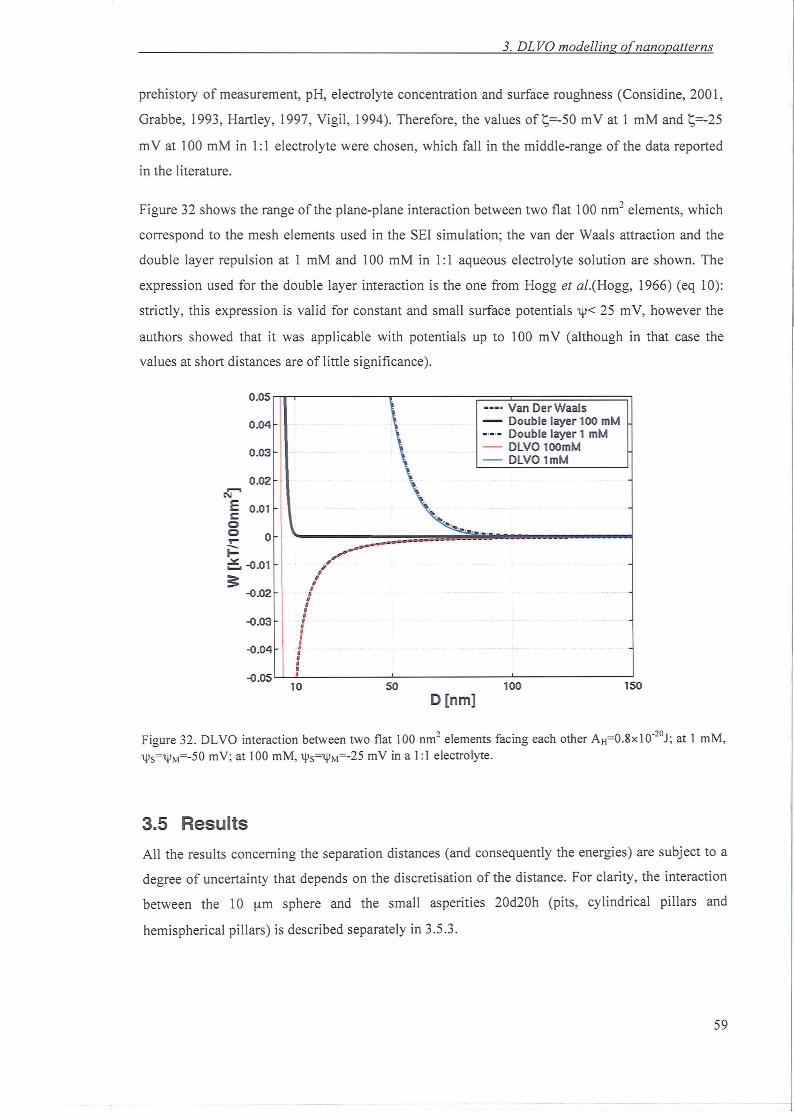
3. DL Va modelling ofnanopatterns
prehis tory of measurement, pH, electrolyte concentration and surface roughness (Considine, 200 1,
Grabbe, 1993, Hartley, 1997, Vigil, 1994). Therefore, the values of ~=-50 mV at 1 mM and ~=-25
mV at 100 mM in I :I electrolyte were chosen, which fall in the middle-range of the data reported
in the literature.
Figure 32 shows the range of the plane-plane interaction between two flat 100 nrrr' elements, which
correspond to the mesh elements used in the SEI simulation; the van der Waals attraction and the
doub le layer repulsion at I mM and 100 mM in 1:1 aqueous electro lyte solution are shown. The
expression used for the doubl e layer interaction is the one from Hogg et al.(Hogg, 1966) (eq 10):
strictly, this expre ssion is valid for constant and small surface potentials '4'< 25 mV, however the
authors showed that it was applicab le with potentials up to 100 mV (although in that case the
values at short distances are of little significance).
0.05 riT--r-- - - - -.--- - - - -;== = = = = = = = ::::;.,
o
0 .04
0.03
0.02a:~ 0.01oo...~::'-0.01
:5:-0 .02
-0.03
-0.04
I,,JII
iI••
•••• Van Der Waals- Double layer 100 mM•.•.• Double layer 1 mM- DLV0 100mM- DLV0 1mM
1501005010-0 .05 L.L.--'-- -'- ---''-- ......l
o [nm]
Figure 32 . DLYO interaction between two flat 100 nm2 elements fac ing each other A H=0 .8x I0·20J; at 1 mM,
'\jJs='\jJM=-50 mY; at 100 mM , '\jJs=1jJM=-2 5 mY in a 1:1 electrolyte.
3.5 Results
All the results concerning the separation distances (and consequently the energ ies) are subject to a
degree of uncertainty that depends on the discretisation of the distance. For clarity, the interaction
between the 10 urn sphere and the small asperities 20d20h (pits, cylindrical pillars and
hemispherical pillars ) is described separately in 3.5.3.
59
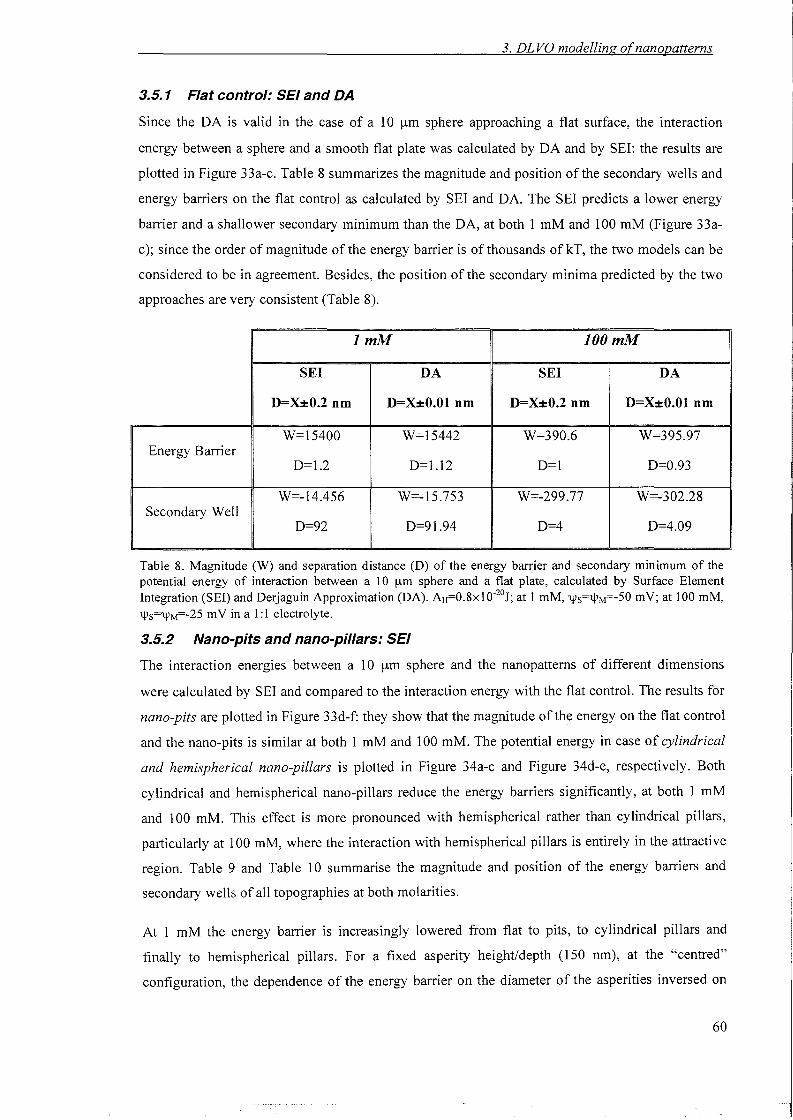
3. tnvo modelling o(nanopatterns
3.5.1 Flat control: SEI and DA
Since the OA is valid in the case of a 10 urn sphere approaching a flat surface, the interaction
energy between a sphere and a smooth flat plate was calculated by OA and by SEI: the results are
plotted in Figure 33a-c. Table 8 summarizes the magnitude and position ofthe secondary wells and
energy barriers on the flat control as calculated by SEI and OA. The SEI predicts a lower energy
barrier and a shallower secondary minimum than the OA, at both 1 mM and 100 mM (Figure 33a
c); since the order of magnitude of the energy barrier is of thousands ofkT, the two models can be
considered to be in agreement. Besides, the position of the secondary minima predicted by the two
approaches are very consistent (Table 8).
ImM lOOmM
SEI DA SEI DA
D=X±O.2 nm D=X±O.Ol nm D=X±O.2 nm D=X±O.Ol nm
W=15400 W=15442 W=390.6 W=395.97Energy Barrier
0=1.2 0=1.12 0=1 0=0.93
W=-14.456 W=-15.753 W=-299.77 W=-302.28Secondary Well
0=92 0=91.94 0=4 0=4.09
Table 8. Magnitude (W) and separation distance (D) of the energy barrier and secondary minimum of thepotential energy of interaction between a 10 IJ-m sphere and a flat plate, calculated by Surface ElementIntegration (SEI) and Derjaguin Approximation (DA). AH=0.8xl0-
2oJ; at 1 mM, 1.\Js=1.\JM=-50 mY; at 100 mM,1.\Js=1.\JM=-25 mV in a 1:1 electrolyte.
3.5.2 Neno-pits and nano-pillars: SEI
The interaction energies between a 10 urn sphere and the nanopattems of different dimensions
were calculated by SEI and compared to the interaction energy with the flat control. The results for
nano-pits are plotted in Figure 33d-f: they show that the magnitude of the energy on the flat control
and the nano-pits is similar at both 1 mM and 100 mM. The potential energy in case of cylindrical
and hemispherical nano-pillars is plotted in Figure 34a-c and Figure 34d-e, respectively. Both
cylindrical and hemispherical nano-pillars reduce the energy barriers significantly, at both 1 mM
and 100 mM. This effect is more pronounced with hemispherical rather than cylindrical pillars,
particularly at 100 mM, where the interaction with hemispherical pillars is entirely in the attractive
region. Table 9 and Table 10 summarise the magnitude and position of the energy barriers and
secondary wells of all topographies at both molarities.
At 1 mM the energy barrier is increasingly lowered from flat to pits, to cylindrical pillars and
finally to hemispherical pillars. For a fixed asperity height/depth (150 nm), at the "centred"
configuration, the dependence of the energy barrier on the diameter of the asperities inversed on
60
3. DLVO modelling ofnanopatterns
pits and pillars: on pits the energy barrier decreases inversely with the diameter, while on both
cylindrical and hemispherical pillars the lowest energy barrier is found with the smallest diameter.
All three topographies made the secondary wells shallower than on the flat control; this effect is
more pronounced on pillars than on pits. Again, the trend is opposite on pits and pillars, since on
pits the largest diameter has the shallowest well, while on the pillars this relation is inversed.
At 100 mM, the energy barrier is increasingly lowered from pits to flat, to cylindrical pillars and
finally to hemispherical pillars: unlike at I mM, now the energy barriers on the pits are higher than
on the flat; for a fixed height (150 nm), at the "centred" configuration, the dependence of the
energy barrier on the diameter of the asperities is the same for pits and cylindrical pillars, showing
an increase in energy barrier with an increase in diameter. However, the dependence of the
secondary wells on the diameter is opposite on pits and pillars, like at 1 mM: on pits, the largest
diameter yields the shallowest minimum, while on pillars the same topography has the deepest
well. On hemispherical pillars the curves are now entirely in the attractive region.
The position of the secondary wells on the nano-pits at both molarities is within 1 nm from the
value on the flat control, and mainly shifted to closer distances (for the topographies specified in
Table 7, due to the definition of 0=0 the fixed shift has to be added to the position of the secondary
well). Similarly, the secondary minima of both cylindrical and hemispherical pillars (Figure 34b
and e, respectively) are generally shifted to closer distances (more so on the hemispherical than on
the cylindrical pillars), but with differences of up to 10 nm (20d20h). On hemispherical pillars
20d20h and 150d150h-vall, the wells disappear and the curves tend to the primary minimum. The
difference between "valley" and "centred" sphere on 150d150h is significant only on pillars at 100
mM: on the "valley" between cylindrical pillars the interaction is mainly attractive and the energy
barrier is much shallower than on the centred configuration; on the "valley" between hemispherical
pillars the energy barrier disappears, and the curve tends to the primary minimum. Decreasing the
height/depth of the asperities from 150 nm to 75 nm makes the energy more attractive at both
molarities; this is more visible at the secondary minima, but is true for the energy barriers too.
61
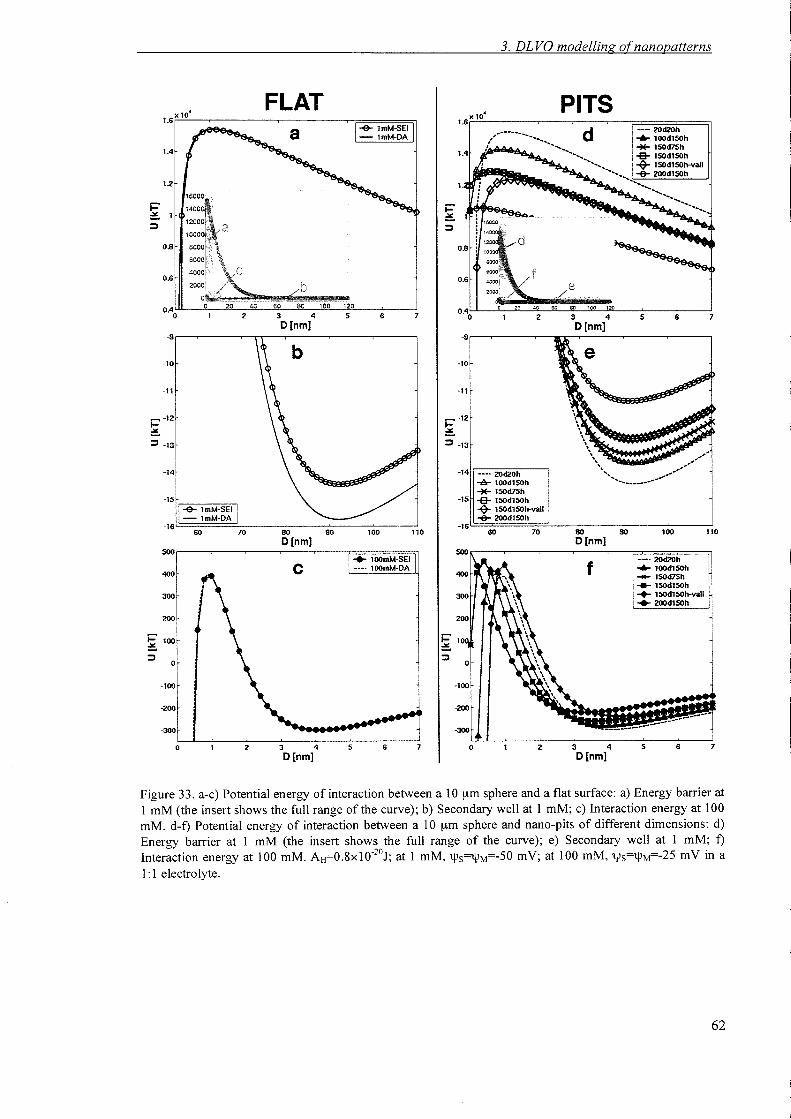
3. DLVa modelling ofnanopatterns
7653 4o [nm]
2
PITSd ····20 d20 h
t'.....·_-.......................... ..... l00dtSOh• <, -M- ISOd7Sh• ------__ -e- lSOdlSOh
---__... ~ lSOdlSOh-val1<, ~ 2OOdlSOh
----------------
76
~ ImM-SEI-lmM-DA
53 4o [nm]
FLAT
2
0.4 '0 ec so ",.2 3 " 5 6 7 0 2 3 " 5 6 7o [nm] o [nm]
-s
-10
-11
.~-12 ·l- ··~ ···:::::l -13 ·
\""-14 ····20d20h ' ..................._..................,;......-6- iooarson
-M- lSOd7Sh-15 -e- lSOdlSOh~ lSOdlSOh-vail~ 2OOdlSOh
-1670 60 90 100 110 60 70 60 90 100 110
o [nm] o [nm]
"'IOOmM-SEI ····20d20h_••. l00mM-DA ....... lOOdlSOh
....... lSOdl5h
.... lSOdlSOh
... lSOdlSOh-vall
... 200dlSOh
1=1~:::::l
1.4
12
Figure 33. a-c) Potential energy of interaction between a 10 urn sphere and a flat surface: a) Energy barrier at1 mM (the insert shows the full range of the curve); b) Secondary well at 1 mM; c) Interaction energy at 100mM. d-f) Potential energy of interaction between a 10 urn sphere and nano-pits of different dimensions: d)Energy barrier at 1 mM (the insert shows the full range of the curve); e) Secondary well at 1 mM; f)Interaction energy at 100 mM. AH=0.8xl0·
20J; at 1 mM, 'l\Js='l\JM=-50 mY; at 100 mM, 'l\Js='l\JM=-25 mV in a1:1 electrolyte.
62
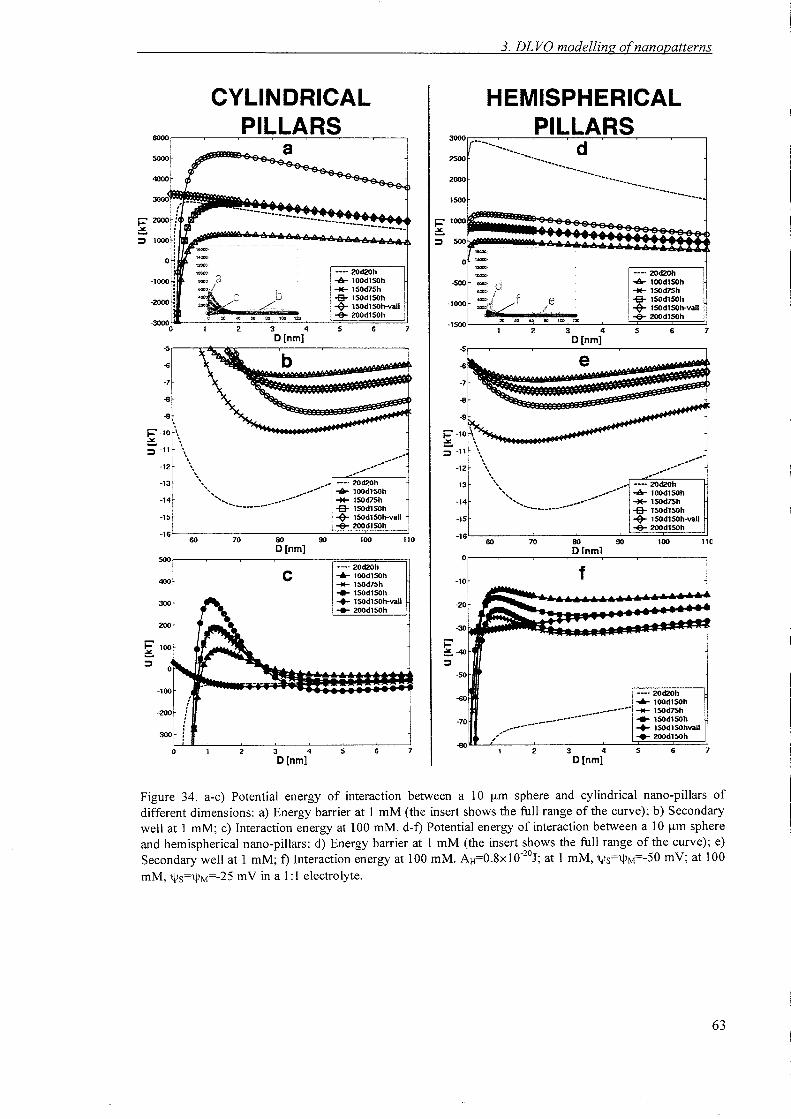
3. DL va modelling ofnanopatterns
765
-·-·lOd20h..... lOOdlSOh"*" lSOd7Sh-e- lSOdlSOh+ lSOdlSOh-val1-e- 2OOdlSOh
e
3 4o [nm]
eI
2
---·lOd20h.... loodlSOh
................... lSOd7Sh
.>-.................. :: :~~:~::v.1I
,'. .... 2OOdlSOh
2 3 4 5 6 7o [nm]
,,,, " ....•...........
", 2Od20h
"""" • .-_----------..- l00dlSOh••..__..__....- "*" lSOd7Sh-e- lSOdlSOh+ lSOdlSOh-val1-e- 2OOdlSOh
-70
-15
-14
-13
60 70 80 90 100 11eDrnml
0
-10 f
-500
1500
2000
HEMISPHERICAL3OOOr:;;;:::---r----,.=--"':PI:..::::;L:.=LA::....::,::....RS.=:...,...-~----,esoo ~--~._-~----~ ••_----._~._.
-1000
i= -10~
;- -11
-12
i=lOOO~SEE3~=.~ 500
'1";-o "'"
'''''"'"
6
6
....•...........
5
5
--··lOd20h..... 100dlSOh"*" lSOd75h-e- lSOdlSOh+ lSOdlSOh-vail-e- lO0dl SOh
3 4o[nm]
3 4o [nm]
2
.........•_ _ _._ __.._._._._-_._-
70 80 90 100 110o [nm]
•••. lOd20h
C .... iooetson...... lSOd7Sh.... lSOdlSOh-+- lSOdlSOh-vall.... 2OOdlSOh
CYLINDRICALPILLARS
~_~~_,a
-5r-~""'I:"1!11<-"1l<'.-----r------r---,....---
-14
5000
-7
"i=' -10 \
=- \
~ :11
1231
\\\,"»»' •••• lOd20h
-, •••••• ..... lOOdlSOh•......._._ -. "*" lSOd7Sh
-e- lSOdlSOh+ lSOdlSOh-vall-e- 2OOd150h
-15
-1660
500
400
300
200
i= 100=.~
-100
,-200
-300
0
:' ---..
i= 2000 f~ .- .::J 1°oo i
0;
-1000 i-2000 :
Figure 34. a-c) Potential energy of interaction between a 10 urn sphere and cylindrical nano-pillars ofdifferent dimensions: a) Energy barrier at 1 mM (the insert shows the full range of the curve); b) Secondarywell at 1 mM; c) Interaction energy at 100 mM. d-f) Potential energy of interaction between a l G um sphereand hemispherical nano-pillars: d) Energy barrier at 1 mM (the insert shows the full range of the curve); e)Secondary well at 1 mM; t) Interaction energy at 100 mM. AH=0.8xl0-
20J; at I mM, \lJs=\lJM=-50 mY; at 100mM, \lJs=\lJM=-25 mY in a 1:1 electrolyte.
63
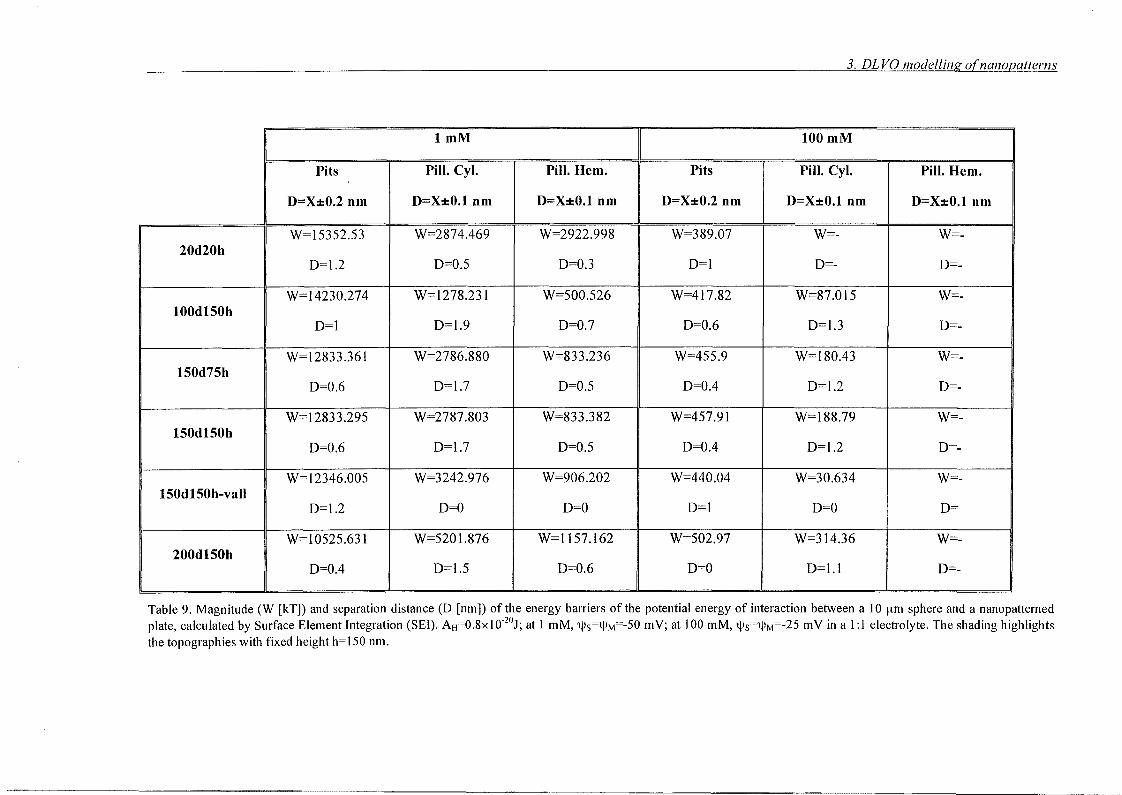
3. DLVa modelling ofnanopatterns
ImM 100mM
Pits Pill. Cyl. Pill. Hem. Pits Pill. Cyl. Pill. Hem.
D=X±O.2 om D=X±O.lom D=X±O.lom D=X±O.2 om D=X±O.lom D=X±O.lllm
W=15352.53 W=2874.469 W=2922.998 W=389.07 W=- W=-20d20h
0=1.2 0=0.5 0=0.3 0=1 0=- 0=-
W=14230.274 W=1278.231 W=500.526 W=417.82 W=87.015 W=-100d150h
0=1 0=1.9 0=0.7 0=0.6 0=1.3 0=-
W=12833.361 W=2786.880 W=833.236 W=455.9 W=180.43 W=-150d75h
0=0.6 0=1.7 0=0.5 0=0.4 0=1.2 0---
W=12833.295 W=2787.803 W=833.382 W=457.91 W=188.79 W=-150d150h
0=0.6 0=1.7 0=0.5 0=0.4 0=1.2 0---
W=12346.005 W=3242.976 W=906.202 W=440.04 W=30.634 W=-150d150h-vall
0=1.2 0=0 0=0 0=1 0=0 0=
W=10525.631 W=5201.876 W=1157.l62 W=502.97 W=314.36 W=-200d150h
0=0.4 0=1.5 0=0.6 D=O D=1.1 D=-
Table 9. Magnitude (W [kT]) and separation distance (D [nm]) of the energy barriers of the potential energy of interaction between a 10 urn sphere and a nanopatternedplate, calculated by Surface Element Integration (SEI). AH=0.8x I0·20J; at I mM, tjJs=tjJM=-50 mV; at 100 mM, tjJs=tjJM=-25 mV in a I: I electrolyte. The shading highlightsthe topographies with fixed height h=150 nm.

3. DLVa modelling ofnanopatterns
ImM 100mM
Pits Pill. Cyi. Pill. Hem. Pits Pill. Cyi. Pill. Hem.
D=X±lnm D=X±lnm D=X±lnm D=X±O.2 nm D=X±O.25 nm D=X±O.25 nm
W=-14.449 W=-14.422 W=-14.443 W=-299.24 W=-68.229 W=-20d20h
0=92 0=73 0=72 0=4 0=2.5 0=-
W=-13.677 W=-6.6135 W=-6.6743 W=-282.51 W=-31.797 W=-18.l87100d150h
0=92 0=82 0=81 0=3.8 0=5.25 0=3.5
W=-13.335 W=-9.9511 W=-10.007 W=-262.64 W=-66.351 W=-32.724150d75h
0=91 0=83 0=81 0=3.6 0=5 0=3.25
W=-12.782 W=-7.4289 W=-7.381 W=-260.76 W=-58.595 W=-24.705150d150h
0=92 0=87 0=81 0=3.6 0=5 0=3.5
W=-12.782 W=-7.429 W=-7.3811 W=-239.18 W=-82.486 W=-150d150h-vall
0=92 0=87 0=81 0=4.2 0=2.25 0=-
W=-11.382 W=-8.7917 W=-8.2672 W=-221.73 W=-102.46 W=-31.763200d150h
0=91 0=90 0=81 0=3.4 0=4.75 0=3.25
Table 10. Magnitude (W [kT)) and separation distance (0 [nm)) of the secondary minima of the potential energy of interaction between a 10 urn sphere and ananopatterned plate, calculated by Surface Element Integration (SEl). AH=0.8xI0·
20J; at I mM, 1fJs=1fJM=-50 mY; at 100 mM, 1fJs=1fJM=-25 mY in a 1:1 electrolyte. Theshading highlights the topographies with fixed height h=150 nm.
65
3. DLVa modelling ofnanopatterns
3.5.3 Small asperities 20d20h. SEJ and Suresh's model.
Of all the nano-pits, 20d20h yielded the smallest difference in energy barrier and secondary
minimum with the flat control at both molarities. On the other hand, at 1 mM both cylindrical and
hemispherical pillars 20d20h reduced the energy barrier significantly compared to the flat control,
and with similar magnitude (see Table 9), while yielding small effects on the secondary minimum
compared to the other asperities. At 100 mM, the 20d20h nano-pillars had a dramatic effect on the
potential energy, which became always attractive.
Asperities of this shape and dimensions have been treated previously by Suresh et al.(Suresh,
1996) as a model of surface roughness: although in their simulation the roughness is on the sphere
rather than on the plate, their formulas can also be applied to the case of a smooth sphere on a
rough plate. Therefore, the non-retarded interaction energy of 20d20h hemispherical pillars was
calculated and used for a comparison between SEI and Suresh's method at both 1 mM (Figure 35),
and at 100 mM (Figure 36). For the case of 20d20h hemispheres, Suresh's model predicts a higher
energy barrier and a deeper secondary minimum than the SEI. This is mainly because Suresh's
model is based on the DA which, as already seen in Figure 33b, predicts deeper secondary minima
than SEI. By taking this into account, the results yielded by SEI and Suresh's model can be
considered to be in good agreement.
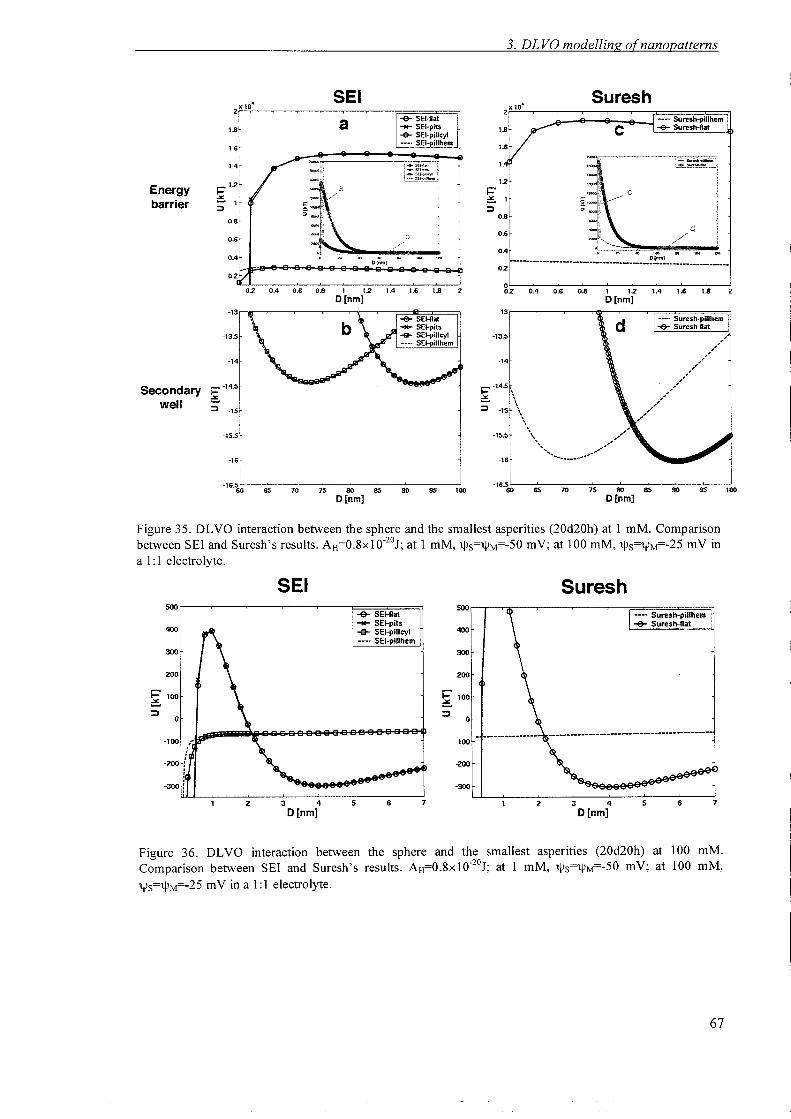
3. DLVa modelling o[nanopatterns
lXl0·SEI
ZX10·Suresh
a -e- SEI-Rat -_. Suresh-pUlhem
1.8__ SEI-pits
1.8 C -e- Suresh-ftat-e- SEI-piilcyl
1.6--_. SEI-piilhem
1.6
1.411'0001 :::~::. '~
1._SH!>ilkyl n
l='12~c~-i1 12
Energy l='barrier :!:. 1 :!:. 1
::::l ::::l0.8
b 0.6
/ 0.4
o("mj ._---_.._._._.._-_......._--_.._.._-_...._--_.._~;::~----------- ----02
02 0.4 0.6 0.8 1 12 1.4 1.6 1.8 2002 0.4 0.6 0.8 1 12 1.4 1.6 1.8
o [nm] o [nm]-13 -13
-13.5 -13.5 ,,,
,",-14 -14 ,,
,,,,
-'Secondary _-14.5 _-14.5 ,-'
l- I- -,'well :!:. :!:. ,
::::l -15 ::::l -15 -,', -,',
-15.5 -15.5 \" ,,
...~........_------16 -16
-16.5 -16.560 6S 70 75 80 as 90 as 100 60 6S 70 75 80 as 90 as 100
o [nm] o [nm]
Figure 35. DLVO interaction between the sphere and the smallest asperities (20d20h) at 1 mM. Comparisonbetween SEI and Suresh's results. AH=0.8xlO-
2oJ; at 1 mM, 1.jJs=1.jJM=-50 mY; at 100 mM, 1.jJs=1.jJM=-25 mV ina1:1 electrolyte.
Suresh
..-_ -_ - _--_ ..--_..--_ ----
76s
--- Suresh-pillhem-e- Suresh-llat
3 4D[nm]
2
SEI500 soo-e- SEI-Rat
400__ SEI-pits-e- SEI-pillcyl 400--_. SEI-pillhem
300 300
200 200
1='100 1='100=. =.:;:) :;:)
0 0
-100 -100
-200
-300
2 3 4 5 6 7D[nm]
Figure 36. DLVO interaction between the sphere and the smallest asperities (20d20h) at 100 mM.Comparison between SEI and Suresh's results. AH=0.8x10-
20J; at 1 mM, 1.jJs=1.jJM=-50 mY; at 100 mM,
1.jJs=1.jJM=-25 mV in a 1:1 electrolyte.
67
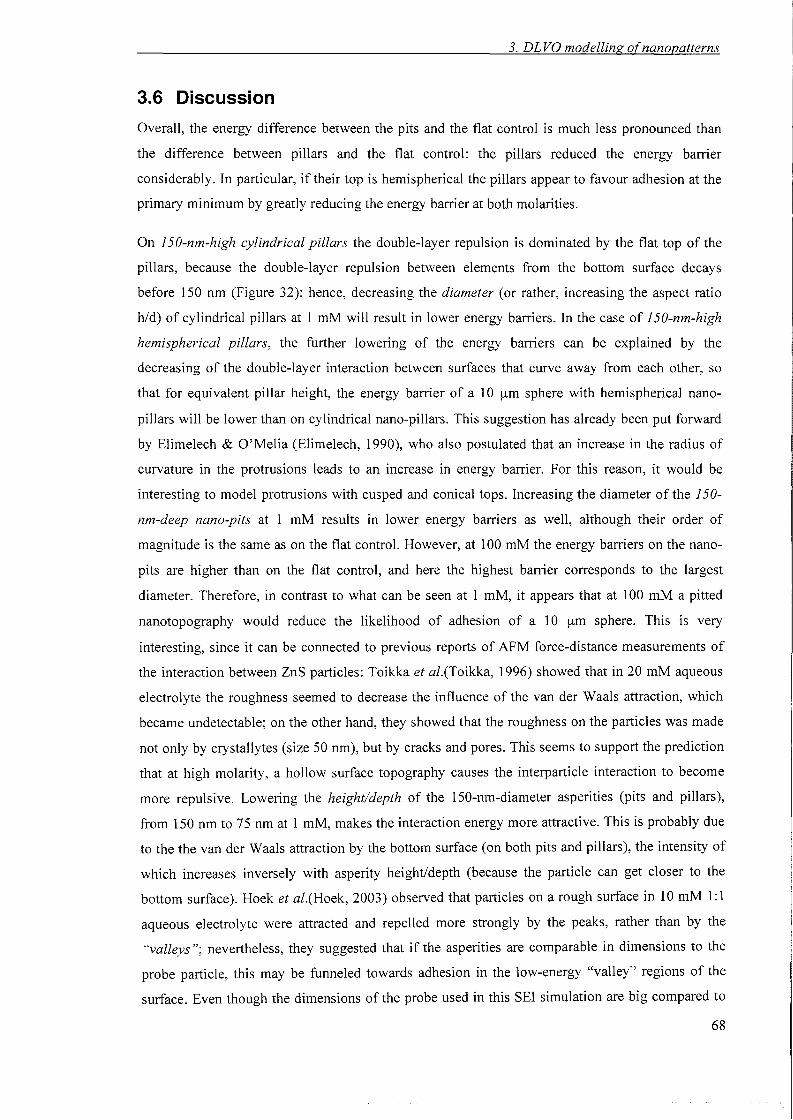
3. DLVa modelling ofnanopatterns
3.6 Discussion
Overall, the energy difference between the pits and the flat control is much less pronounced than
the difference between pillars and the flat control: the pillars reduced the energy barrier
considerably. In particular, if their top is hemispherical the pillars appear to favour adhesion at the
primary minimum by greatly reducing the energy barrier at both molarities.
On 150-nm-high cylindrical pillars the double-layer repulsion is dominated by the flat top of the
pillars, because the double-layer repulsion between elements from the bottom surface decays
before 150 nm (Figure 32): hence, decreasing the diameter (or rather, increasing the aspect ratio
hid) of cylindrical pillars at 1 mM will result in lower energy barriers. In the case of l Stl-nm-high
hemispherical pillars, the further lowering of the energy barriers can be explained by the
decreasing of the double-layer interaction between surfaces that curve away from each other, so
that for equivalent pillar height, the energy barrier of a 10 urn sphere with hemispherical nano
pillars will be lower than on cylindrical nano-pillars. This suggestion has already been put forward
by Elimelech & O'Melia (Elimelech, 1990), who also postulated that an increase in the radius of
curvature in the protrusions leads to an increase in energy barrier. For this reason, it would be
interesting to model protrusions with cusped and conical tops. Increasing the diameter of the 150
nm-deep nano-pits at 1 mM results in lower energy barriers as well, although their order of
magnitude is the same as on the flat control. However, at 100 mM the energy barriers on the nano
pits are higher than on the flat control, and here the highest barrier corresponds to the largest
diameter. Therefore, in contrast to what can be seen at 1 mM, it appears that at 100 mM a pitted
nanotopography would reduce the likelihood of adhesion of a 10 urn sphere. This is very
interesting, since it can be connected to previous reports of AFM force-distance measurements of
the interaction between ZnS particles: Toikka et al.(Toikka, 1996) showed that in 20 mM aqueous
electrolyte the roughness seemed to decrease the influence of the van der Waals attraction, which
became undetectable; on the other hand, they showed that the roughness on the particles was made
not only by crystallytes (size 50 nm), but by cracks and pores. This seems to support the prediction
that at high molarity, a hollow surface topography causes the interparticle interaction to become
more repulsive. Lowering the height/depth of the 150-nm-diameter asperities (pits and pillars),
from 150 nm to 75 nm at 1 mM, makes the interaction energy more attractive. This is probably due
to the the van der Waals attraction by the bottom surface (on both pits and pillars), the intensity of
which increases inversely with asperity height/depth (because the particle can get closer to the
bottom surface). Hoek et al.(Hoek, 2003) observed that particles on a rough surface in 10 mM 1:1
aqueous electrolyte were attracted and repelled more strongly by the peaks, rather than by the
"valleys"; nevertheless, they suggested that if the asperities are comparable in dimensions to the
probe particle, this may be funneled towards adhesion in the low-energy "valley" regions of the
surface. Even though the dimensions of the probe used in this SEI simulation are big compared to
68
3. DLVa modelling o(nanopatterns
the topography, my calculations predict that at 100 mM, a 10 urn sphere approaching the "valley"
between hemispherical pillars 150d150h would be attracted towards adhesion at the primary
minimum. The same would happen on the smaller roughness 20d20h. From these results, no
conclusion can be drawn regarding the influence of the sphere position on the strength of adhesion
with a nanopatterned surface; however, particle adhesion on a rough surface is expected to be
stronger on the "valleys" between asperities (Bowen, 2000, Gotzinger, 2004).
At 100 mM, the 20d20h nano-pits yield little energy difference with the flat control. Inversely, the
20d20h nano-pillars make most of the surface inaccessible to the sphere at distances where the
repulsion becomes steep, so that the attraction dominates, yielding a purely attractive energy that
would drive the sphere towards adhesion at the primary minimum. The tops of the pillars provide a
very small repulsion, even smaller when their radius of curvature decreases. The influence of
hemispherical protrusions of these dimensions on the interaction energy between a rough sphere
and a plate has been modelled by Suresh et al. (Suresh, 1996) As shown in Figure 35-Figure 36,
my results are consistent with Suresh's previous simulations, where they found that hemispherical
protrusions decrease the energy barriers and the depth of the secondary minima. However, their
statement that the secondary minima are pushed to further distances cannot be generalised: when
Suresh's model was applied to my simulated conditions, and when the origin of the curves was
chosen according to Figure 31, the results from the two methods are coherent and no significant
minima shift is visible. Suresh's predicted energy barriers are higher than calculated by SEI,
however the latter should be more accurate at short distances because it is neither based on the DA,
nor on the weak overlap approximation for the double-layer potential (eq 8), unlike Suresh's
calculations which for those reasons are valid at large separation distances only.
In conclusion, it appears that for these submicrometric patterns, the variation of asperity diameter is
the most influential parameter upon the energy of interaction with a microsphere. However, the
scale of the topography is also an important factor, as demonstrated by the potential energy of the
smallest asperities 20d20h with the sphere. Another determining parameter is the shape of the
topography, since the calculations demonstrate that the radius of curvature of the tops of the pillars
have a dramatic effect on the height of the energy barriers. Although retardation effects and non
DLVO forces have not been taken into account in this work, these results provide some
undestanding in the effect of nanopatterning of a silica plate on its interfacial energy of interaction
with a microsphere. Since the dimensions of the patterns are of uttmost importance, this work
should be followed up by a methodical investigation of the influence of shape and aspect ratio of
protruding asperities on the interaction energy with spheres of different diameters, for different
dimensions and scales of the topography starting from orders of 10 nm into the micron range. This
should include the study of the effect of ionic strength on the energy barrier between a pitted
surface and colloids of different sizes, for it could be of interest in the field of fouling prevention.
69
3. DLVa modelling ofnanopatterns
3.7 Conclusion
So far most attempts at modelling the DLVO interaction between rough surfaces has considered
protruding asperities, mainly because the different models were based on the Derjaguin
approximation. The SEI allows the modelling of hollow topography, and to my knowledge this is
the first consistent attempt to model the potential energy of interaction between a sphere and a
surface with depressions (pits) of different dimensions.
The present SEI simulations are coherent with previous calculations and experimental observations
that protruding roughness (nano-pillars) decreases the energy barrier and the depth of the secondary
minima of the interaction energy: it follows that a nano-pillared surface will greatly enhance the
adhesion of particles onto it, even more so when the tops of the pillars are hemispherical rather
than flat. The changes induced by the nano-pits were much less significant: generally, while the
secondary minima are only slightly affected by changes between pitted and pillared topography,
the energy barrier is strikingly decreased when the asperities are protruding rather than hollow.
Interestingly though, the nano-pits at 100 mM were predicted to increase the energy barrier against
adhesive contact, which can be related to previous experimental observations (Toikka, 1996), and
could have useful implications in the context of fouling prevention.
The geometrical characteristics of the pattern are important: with the dimensions used in my
simulation, the height variation yielded a small difference in energy, whereas the changes in
diameter were a determining factor. The position of the sphere axis had a strong importance on
nano-pillars at 100 mM: a sphere approaching a pillared surface on the "valleys" between
protrusions would be attracted towards the primary minimum.
Future work should clearly involve the verification of this model by AFM colloid-probe
measurements on nano-structured silicon plates.
70
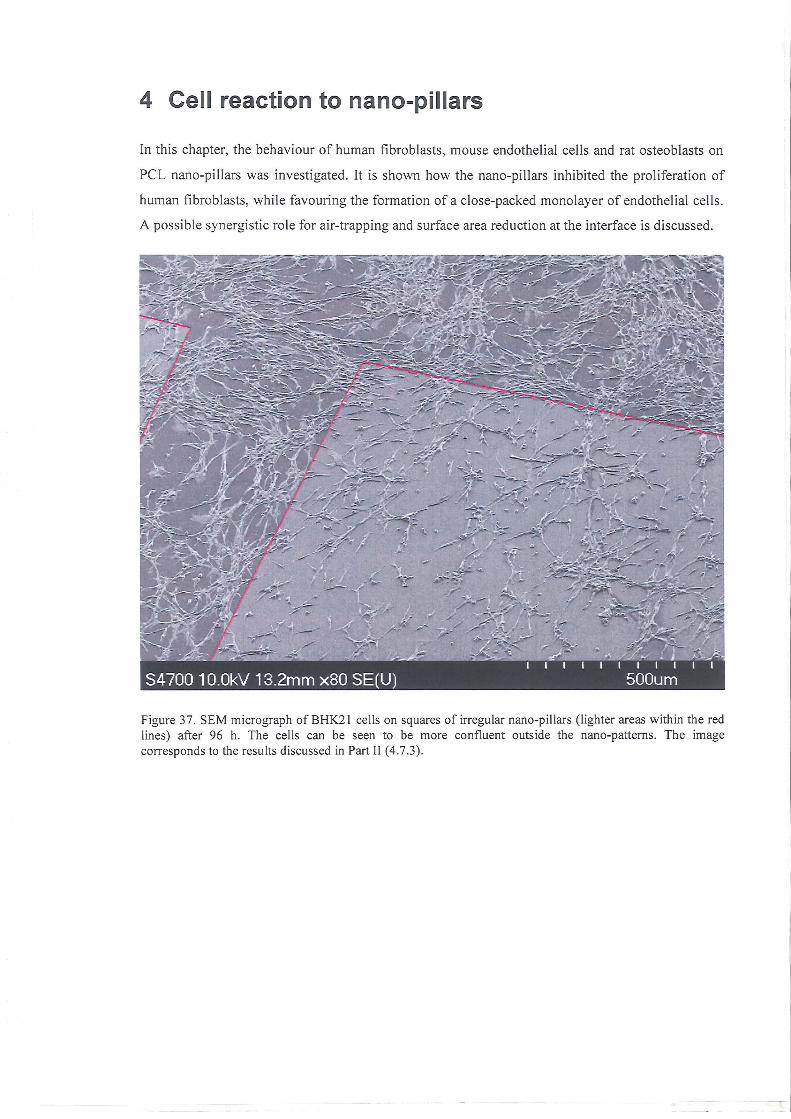
4 Cell reaction to nano-pillars
In this chapter, the behaviour of human fibroblasts, mouse endothelial cells and rat osteoblasts on
peL nano-pillars was investigated. It is shown how the nano-pillars inhibited the proliferation of
human fibrobla sts, while favouring the formation of a close-packed monolayer of endothelial cells.
A possible synergistic role for air-trapping and surface area reduction at the interface is discussed.
Figure 37. SEM micrograph of BHK21 cells on squares of irregular nano-pillars (lighter areas within the redlines) after 96 h. The cells can be seen to be more confluent outside the nano-patt erns. The imagecorresponds to the results discussed in Part 11 (4.7.3).
4. Cell reaction to nanopillars
4.1 Introduction
Cell adhesion on nanopatterned surfaces has raised great interest in recent years. Nano-structures
(i.e. surface topographies with features of dimensions 0.001-1 urn) are much smaller than cells
normally measuring 5-40 urn. Understanding why and how the behaviour of cells is modified by
such patterns has great potential for both clinical applications and fundamental biology. Nature
seems to make extensive use of nano-structured surfaces to achieve specific functions, such as
reduction of bio-fouling (Baum, 2001), structural colour (Gu, 2003), water-repellency (Barthloot,
1997), mechanical stability (Watson, 2004), and tissue scaffolding (Goodman, 1996). Goodman et
al. (Goodman, 1996) replicated the sub-endothelial matrix of the arteries of some mammalian
species; they showed that the matrix has a complex topography at the micro- and nano- scale, and
that endothelial cells cultured on these patterns not only spread faster, but at confluence also more
closely resembled the cells as they appear in vivo (less spread, more rounded and thicker).
It is known that surface roughness has a marked effect on cell culture. Recently, two studies by
Wieland et al. (Wieland, 2002, Wieland, 2005) investigated the influence of various surface
treatments on the roughness of titanium (Ti) dental and orthopedic implants, showing that at
constant surface chemistry, human fibroblasts and rat osteobIasts had increasingly thicker cell
bodies on surfaces with increasing roughness (rms 0.08-7.64 urn). Since the cells in the same study
were also proven to have constant volume, it can be inferred that their spreading area decreased
with increasing roughness. Also, in the same paper the osteoblasts were seen to form more focal
adhesions on the smoothest surface, a finding also supported by Meredith et al. (Meredith, 2005).
Turner et al. (Turner, 1997) cultured astrocytes on RIE-fabricated nano-columnar structures
("silicon grass", diameter ca. 57 nm, height ca. 230 nm, surface density 137 urn"), and wet-etched
surfaces (depression width 100-250 nm, average peak-to-valley distance 115 nm, surface density
27 urn") on neighbouring micrometric stripes. They showed that immortalized cells grew better on
the wet-etched stripes, while the primary astrocytes preferred the silicon grass.
Curtis et al. (Curtis, 2001) studied the reaction of rat epitenon fibroblasts" on a square lattice of
EBL-fabricated silicon nano-pillars (diameter 50 nm, spacing 300 nm); the number of cells on the
nanopattern was significantly smaller than on the control. Gallagher et al. (Gallagher, 2002)
embossed silicon nano-pillars in poly-s-caprolactone, thus obtaining nano-pits (diameter 216 nm,
height 100 nm, pitch 300 nm). By coating the substrates with Poly-L-Lysine and culturing rat
epitenon fibroblasts on coated and uncoated samples, they concluded that surface chemistry did not
4 a fibroblastic cell line extracted from the Epitenon sheath that surrounds the flexor tendon of Sprague
Dawley rats.
72
4. Cell reaction to nanopillars
override the effect of topography: the cells on the nanopattern always had smaller focal adhesions
and smaller spreading area. Later in his thesis (Gallagher, 2003), Gallagher reported that the
epitenon cells on PCL, polyurethane and poly-carbonate nano-pits selectively migrated outside the
nanopatterned area, and did not proliferate on it. He also observed faster cell locomotion and the
formation of cell clusters on the nano-pits, and claimed that these phenomena were neither
polymer-dependent nor cell-dependent, having observed it with mouse macrophages, MDCK,
HGTFN endothelial cells and rat epitenon cells. Dalby et al.(Dalby, 2002a, Dalby, 2002b) and
Riehle et al.(Riehle, 2003) studied the effect of 13-nm-high polymer-demixed nanoislands on,
respectively, human endothelial cells, human fibroblasts and rat calvaria bone cells. It was shown
that the nano-islands increased both endothelial and fibroblast spreading; furthermore, since in
fibroblasts cell spreading is a conditio sine qua non for proliferation (Meredith, 1993), the up
regulation of the genes required for cell proliferation confirmed the morphological observations.
No significant change in the behaviour of bone cells was detected; this was because the surface
chemistry of the nano-islands did not support bone cell growth. Dalby et al.(Dalby, 2004) also
cultured human fibroblasts on nano-columns (diameter 100 nm, height 160 nm, spacing =230 nm),
showing that after 3 h the number of cells on the flat control and on the nanopattern was not
significantly different, even though the cells were significantly more spread on the former. They
also observed that for cells on the nano-columns, the Actin cytoskeleton was less organised, and
the focal adhesions were smaller and very faint compared to the ones on the flat control.
Furthermore, TEM imaging revealed that the cell membrane did not form adhesive contacts with
the bottom surface between nano-columns. This last observation has recently been revisited by
Curtis et al,(Curtis, 2005) who showed that the cell membrane could bend between nano-pillars.
However their study did not prove the formation of cell adhesions with the bottom surface.
The observed reactions of cells to nanotopography, especially pits and pillars, has raised several
questions concerning the nature of these interactions, since the sizes of the surface features are at
least 2 orders of magnitude smaller than the cells. Mechanical restriction is not a possibility at this
scale (while it is at the micro-scale); current hypotheses include a change in protein adsorption or
conformation due to the surface patterns, or simply a reduction in the surface area available for
focal contact formation, assuming that, as Dalby observed (Dalby, 2004), the cells do not adhere to
the bottom surface. Very few studies have been concerned with the investigation of protein
adsorption and conformation on nano-structured surfaces. Webster et al. (Webster, 2000) showed
that nanophase ceramics adsorbed significantly greater quantities of vitronectin, which in tum
enhanced osteoblast adhesion. On the same substrates fibroblast adhesion decreased and
endothelial adhesion was similar to the flat control. However, the authors did not seek information
regarding the conformation and bio-activity of the proteins. Riedel et al. (Riedel, 2001) fabricated
germanium nanopyramids (60x60 nm2x15 nm) and adsorbed y-globulin (160 kD) on these
73
4. Cell reaction to nanopillars
substrates; they observed that while more protein was adsorbed on a higher density of nano
pyramids, protein activity decreased, along with the viability of cultured monocytes U937; yet, the
study did not yield information regarding the conformation of the protein. Denis et al. (Denis,
2002) observed that the amount of collagen on a nanotextured substrate and on the flat control was
the same, but that the supramolecular organisation was inhibited. However, the size of collagen
fibrils (up to 600 nm) was much bigger than the nanotopography (75 nm), thus the underlying
dotlike protrusions could have been concealed by the protein.
The role of focal contacts in cell adhesion and signalling has already been outlined in the main
introduction. This raises questions with regard to the minimum surface area required by the cells to
form adhesion sites. Massia et al. (Massia, 1991) cultured human fibroblasts on RGD-coated
substrates (covalently attached) and concluded that a minimum peptide-to-peptide spacing of 440
nm and of 140 nm is necessary for cell spreading and for focal contact formation, respectively.
However, Maheshwari et al. (Maheshwari, 2000) proved that nano-scale clustering of the ligands
significantly reduced the average ligand density required to support cell migration. In fact, non
clustered Integrin ligands support cell attachment but not full spreading. They suggested that there
exists a minimum size and number of Integrin clusters required in order to achieve significant
values of cell adhesion and migration. In a more recent study, Arnold et at. (Arnold, 2004) have
been able to control the position of single RGD peptides by arranging them in hexagonal close
packed templates tunable between 28-120 nm. By varying their spacing, they saw that a peptide
separation >73 nm limited cell adhesion and spreading, and they attributed the phenomenon to
restricted ligand clustering. In conclusion, the formation of adequate focal adhesions to support cell
spreading is linked to the size and ligand density of the adhesion sites. Thus, assuming that the
cells adhere only to the top of some nanotopographies (Dalby, 2004), the nanopatteming of
biomaterials could reduce the area available for adhesion formation, resulting in decreased cell
attachment, spreading and inhibited proliferation.
Finally, recent evidence shows that nanopattemed materials with contact angle in the range 650_90 0
can trap air in their surface asperities (see 2.5.4, and Abdelsalam et al, (Abdelsalam, 2005)). The
presence of air-bubbles on the surface could hinder the adsorption of proteins on the surface (Wu,
2005), and/or influence the molecular mechanisms that underlie cell adhesion.
This work was aimed at elucidating by which mechanisms different types of mammalian cells
(human fibroblasts, mouse endothelial cells, rat osteoblasts and baby hamster kidney cells) react to
nanopattems. In Part I of this study, cell reaction to regular nano-pillars (diameter 170 nm, height
131 nm) was investigated. By molding PCL against a nanopitted hydrophobic master, a large
number of samples could be replicated. After analysing cell coverage, morphology and focal
contact formation of the three cell types on the nanopattemed PCL replicas, the samples were gold-
74

4. Cell reaction to nanopillars
coated and the study proceeded with comparing the influence of the two equally patterned
materials on fibroblasts. The influence of protein-coating on the surface coverage of fibroblasts and
endothelial cells is also shown. The second part of the study (Part II) shows a set of limited but
interesting results obtained by culturing cells on irregular nano-pillars, which were fabricated by
replicating peL on a hydrophilic pitted master.
75
4. Part 1. Cells on regular nanopillars
Part I. Cells on regular nano-pillars
4.2 Materials and Methods. I.
4.2.1 Fabrication of the nanopatterns
4.2.1.1 Fabrication and replication
In Chapter 1, it was explained how after measuring tthe contact angle on the nanopatterned silicon
masters, these dies were replicated in poly-s-caprolactone (PCL) by "thumb-embossing" (2.2.3).
These same PCL replicas are used in this chapter for cell adhesion experiments. Briefly,
nanopatterns of different morphology and dimensions (nano-pits and nano-pillars) were fabricated
in silicon wafers, and made hydrophobic by octadecyltrichlorosilane (OTS) coating. PCL sheets
were embossed onto them by melting the polymer on the master at 85°C, and then manually
pressing a glass-slide on it. The nomenclature of the nanopatterns in this chapter will be the same
defined in Chapter 1 (page 28). All the silicon masters were fabricated by Dr K. Seunarine.
However in this study, only the pillared PCL H90-r replicas were used for the cell culture: the
reason for this choice is clear from Figure 40 and is discussed in 4.3. Therefore, throughout this
chapter I will refer to this pattern only, unless otherwise specified.
For time-lapse video microscopy only, the nano-pillars H90-r were replicated in poly-carbonate
(PC), because the samples needed to be transparent for filming. The embossing procedure is the
same as for PCL, except that the melting temperature is 140°C, hence the glass slide was pressed
with a pair of forceps; the polymer was air-cooled after embossing.
The diameter of the H90-r pillars were measured with ImageJ (Rasband, 1997-2005) from SEM
images. Their height was measured by Atomic Force Microscopy in tapping mode (Nanoscope III,
Digital Instruments).
4.2.1.2 Sterilisation
After embossing, the PCL samples were sterilised by immersing them in 70% ethanol (BDH). Then
they were rinsed in copious amounts of RO water and finally stored in RO water at 4°C for up to 7
days. Alternatively, both sides of the samples were sterilised by exposing them to the collimated
light of a mercury vapour arc lamp (l00 W) for 5 min at a distance of 30 ern. Prior to cell seeding,
the samples were rinsed in HEPES Saline.
4.2.1.3 Protein coating and gold coating
Fibronectin coating. The sterilised samples were incubated overnight in 10 ug/ml of a Fibronectin
solution (0.1% from human plasma, Sigma, 440-500 KDa) in PBS at 4°C, then washed twice with
PBS, and rinsed with HEPES saline prior to cell seeding.
76
4. Part I Cells on regular nanopillars
Poly-L-Lysine (PLL) coating. The sterilised samples were incubated for 1 h in 100 fAg/ml solution
in water (0.01%, Sigma, 150-300 KDa) at room temperature, then washed twice with sterile RO
water, and rinsed with HEPES saline prior to seeding. For visualisation of the coating by
fluorescence microscopy, FITC-labelled Poly-L-Lysine (Sigma, 30-70 KDa) was used.
Gold-palladium (AuPd) coating. The samples were sputter-coated with 10 nm of gold-palladium in
a sputter coater (Emscope, Ashford, UK). Immediately after coating the samples were immersed
and kept in RO water, to avoid contact with atmospheric contaminants. Thus their hydrophilicity
was preserved.
4.2.2 Cell culture
Three different types of cells were cultured on the nanopattem: 1) Infinity™ telomerase
immortalized primary human fibroblasts (hTERT-BJl,Clonetech Laboratories Inc, USA), 2)
Mouse SV129 brain endothelioma (b.End3, ECACq and 3) Rat calvaria bone cells from primary
culture. Details of media and solutions can be found in Chapter 8.
4.2.2.1 Passage of hTERT and B.End3
The cells were expanded in 25 cnr' tissue culture flasks (Coming Incorporated, USA) at 37°C with
a 5% CO2 atmosphere until confluence, with medium changes every three days. Before reaching
confluence, the flasks were washed twice with HEPES Saline (to rinse away the medium), then
twice with versene (to break the cell-cell junctions). The flasks were then incubated in 5 ml of
0.01% (v/w) trypsin (Gibco) in versene until the cells appeared rounded, in order to detach them
from the flasks. Once the cells detached, 5 ml of DMEM complete growth medium were added to
neutralize trypsin activity. The suspension was transferred into a centrifuge tube (Sterilin, UK) and
centrifuged for 5 min at 1500 rpm. The resultant pellet was resuspended in 1 ml of culture medium
with a hypodermic needle (1.2X40, BD Microlance 3, Ireland) for cell counting (Improved
Neubauer haemocytometer, BS.748, Hawksley). The cell suspension was then diluted and split into
three 25 crrr' tissue culture flasks for further expansion or used for experimental purposes.
4.2.2.2 Primary culture of bone cells
Rat calvaria bone cells were isolated by Anne Macintosh from the bony calvariae of 4 neonatal rats
(1-5 days p.n.) by serial digestion (agitated for 20 min at 3rq with collagenase type I (1 mg/ml)
in DMEM/Hams FlO mixture (1:1). After sedimentation the cells were seeded into flasks and fed
every 3rd day with DMEM (10% calf serum) supplemented with 0.003 mg/ml ascorbic acid. After
reaching confluence, the cells were isolated by trypsinisation and seeded at the desired density onto
the substrates.
77
4. Part 1. Cells on regular nanopillars
4.2.2.3 Cell seeding
4.2.2.3.1 hTERTand B.End3
For seeding on the PCL samples, the cells were resuspended in DMEM at a density of 1-1.5xl04
cells/ml, and 4 ml of suspension were placed on each sample, yielding a total of 4-6xl04 cells per
sample. For each time point or assay, 2 samples were seeded in a 6-well plate.
4.2.2.3.2 Bone cells
For seeding on the PCL samples, the cells were resuspended in DMEM at a density of 1-1.5xl04
cells/ml, and 4 ml of suspension were added into each well, yielding a total of 4-6x10⁴ cells per
well. For each time point or assay, 2 samples were seeded in a 6-well plate.
4.2.2.4 Fixation
To fix the cells, the samples were rinsed with PBS at 37°C, incubated for 15 nun in 4%
formaldehyde/PBS (with 2% Sucrose) at 37°C, and stored in PBS at 4°C.
4.2.3 Cell staining and Imaging
The cells could be visualized by ordinary phase-contrast microscopy, but it was desirable to stain
the whole cell body for cell morphology analysis. The cell cytoskeleton is transparent in standard
light and electron microscope preparations, and is therefore "invisible". By immunofluorescence
staining it was possible to attach fluorescently-Iabeled antibodies to specific molecules, thus
revealing the desired cell component. The cell surface could be seen by Scanning Electron
Microscopy.
4.2.3.1 Cell body staining
In order to visualize the whole cells for cell counts, cell area and surface coverage analysis, the
fixed cells were stained with Coomassie Blue solution for 15 min, then rinsed in PBS until the
excess die was washed away; the cells were then counted under a Zeiss Axiovert 25 at X5
magnification. A camera (Scion Corporation) transmitted the images to a Pc. Images of the
microscope field were captured with Visicapture 1.1 (Scion Corporation). Images of the whole
replicas after Coomassie staining were acquired with a Nikon Dl camera (objective AF Nikkor,
35-70 mm).
4.2.3.2 Time-lapse video microscopy
HTERT cells were cultured on PLL-coated poly-carbonate replicas (5xl04 cells in 4 ml DMEM),
and filmed with a time-lapse video recorder (Panasonic) by capturing 1 frame/min for 96 h under a
Zeiss Axiovert 25 in phase contrast. The movies were digitized with a MacOsX.
78
4. Part I Cells on regular nanopillars
4.2.3.3 Immunofluorescence: Actin/Vinculin Staining
The cells were stained simultaneously for F-Actin using fluorescent Phalloidin and for Vinculin
using antibodies. After fixation, the cell membrane was permeabilised by washing with PBS and a
permeabilising buffer for 5 min at 4°C; permeabilisation was blocked by adding 1% BSAlPBS for
5 min at 3rC. After removing the BSA, 200 !!l of primary anti- VinculinlPhallodin solution (see
Note below) were added on each sample, and incubated for 1 hat 3re. The cells were washed in
0.5% Tween 20/PBS a few times, then the secondary antibody (Alexa -588 donkey anti-mouse,
stock 1:100 in BLK, Molecular Probes) was added. The samples were washed in 0.5% Tween 20 a
few times, then mounted on a glass slide in a mounting medium that contained DAPI, a fluorescent
nuclear stain. After a few minutes for the nuclear stain to work, the cells could be viewed by
fluorescence microscopy (Zeiss Axiovert 200M at X40 magnification).
[Note: Preparation of the anti- VinculinlPhalloidin solution. First, the anti- Vinculin solution is
prepared (1: 150 in 1% BSAlPBS, Hvin 1 monoclonal anti-human raised in mouse (IgG 1), Sigma).
Then, 10 !!l oregon-green Phalloidin solution (1:50 , Molecular Probes, Oregon) is added to 1 ml of
anti- Vinculin solution].
4.2.3.4 Immunofluorescence: Actin/Fibronectin Staining
The cells were stained simultaneously for F-Actin using fluorescent Phalloidin and for Fibronectin
using antibodies. After fixation, the cell membrane was permeabilised by washing with PBS and a
permeabilising buffer (see 4.2.3.1) for 5 min at 4°C; permeabilisation wass ended and unspecific
binding sites blocked by adding 1% BSAlPBS for 5 min at 37°e. After removing the BSA, 200 ul
of primary anti-Fibronectin/Phallodin solution (see Note below) were added on each sample, and
incubated for 1 h at 37°e. The cells were washed in 0.5% Tween 20/PBS a few times, then the
secondary antibody (1:50 biotinilated anti-rabbit, Sigma) was added and the sample again
incubated for I hat 3rc. The samples were washed in 0.5% Tween 20 a few times, then incubated
in fluorescein-conjugated Streptavidin (1:50) for 30 min at 4°C. Finally, the samples were washed
in 0.5% Tween 20 a few times, and mounted on a glass slide as described above. Samples were
viewed by fluorescence microscopy (Zeiss Axiovert 200M) at X40 magnification.
[Note: Preparation of the anti-Fibronectin/Phalloidin solution. First, the anti-Fibronectin solution
is prepared (1: 100 in 1% BSAlPBS, rabbit anti-human Fibronectin polyclonal, Chemicon
International). Then, 10 !!l oregon-green Phalloidin (1:50 , Molecular Probes, Oregon) is added to
1 ml of anti-Fibronectin solution].
4.2.3.5 Proliferation assay
BrdU (5-bromo-2-oxyuridine, CalBiochem) is a Thymidine analogue taken up by cells when they
enter the S-phase, which is the phase of the cell cycle where DNA is replicated before mitosis,
79
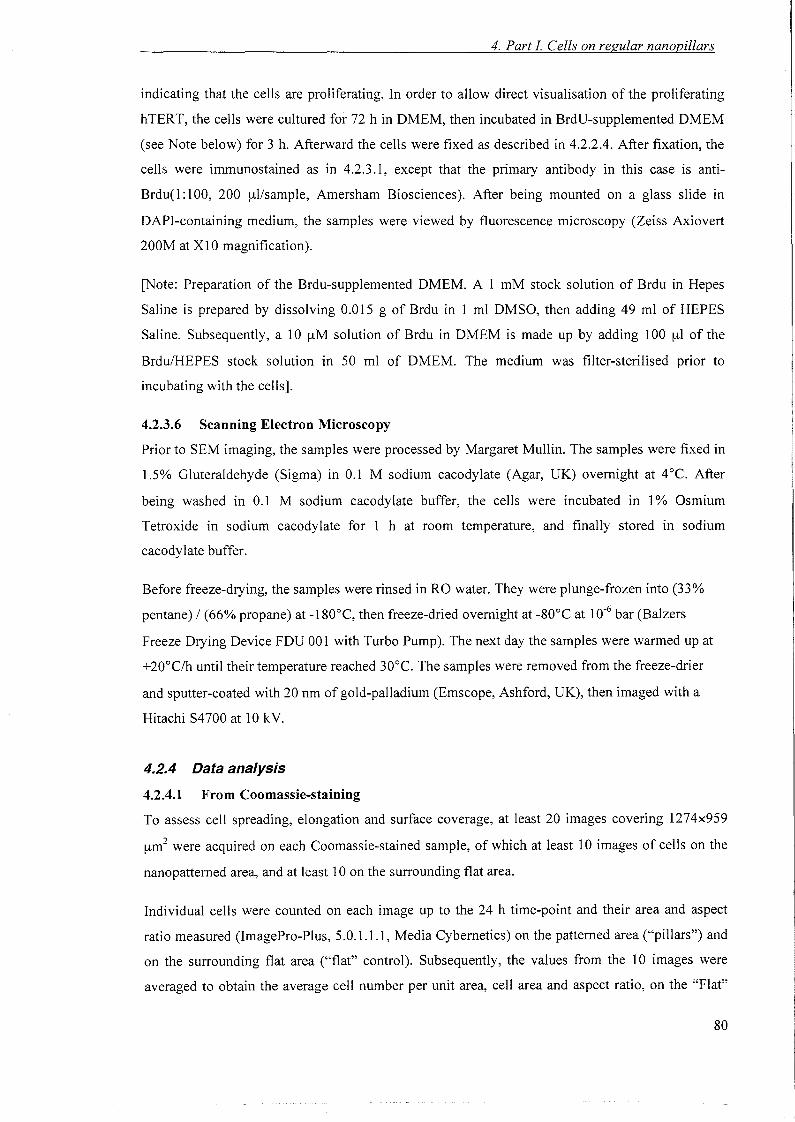
4. Part J Cells on regular nanopillars
indicating that the cells are proliferating. In order to allow direct visualisation of the proliferating
hTERT, the cells were cultured for 72 h in DMEM, then incubated in BrdU-supplemented DMEM
(see Note below) for 3 h. Afterward the cells were fixed as described in 4.2.2.4. After fixation, the
cells were immunostained as in 4.2.3.1, except that the primary antibody in this case is anti
Brdu(l :100, 200 ul/sample, Amersham Biosciences). After being mounted on a glass slide in
DAPI-containing medium, the samples were viewed by fluorescence microscopy (Zeiss Axiovert
200M at Xl 0 magnification).
[Note: Preparation of the Brdu-supplemented DMEM. A 1 mM stock solution of Brdu in Hepes
Saline is prepared by dissolving 0.015 g of Brdu in 1 ml DMSO, then adding 49 ml of HEPES
Saline. Subsequently, a 10 uM solution of Brdu in DMEM is made up by adding 100 ul of the
Brdu/HEPES stock solution in 50 ml of DMEM. The medium was filter-sterilised prior to
incubating with the cells].
4.2.3.6 Scanning Electron Microscopy
Prior to SEM imaging, the samples were processed by Margaret Mullin. The samples were fixed in
1.5% Gluteraldehyde (Sigma) in 0.1 M sodium cacodylate (Agar, UK) overnight at 4°C. After
being washed in 0.1 M sodium cacodylate buffer, the cells were incubated in 1% Osmium
Tetroxide in sodium cacodylate for 1 h at room temperature, and finally stored in sodium
cacodylate buffer.
Before freeze-drying, the samples were rinsed in RO water. They were plunge-frozen into (33%
pentane) I (66% propane) at -180°C, then freeze-dried overnight at -80°C at 10-6 bar (Balzers
Freeze Drying Device FDU 001 with Turbo Pump). The next day the samples were warmed up at
+20°C/h until their temperature reached 30°C. The samples were removed from the freeze-drier
and sputter-coated with 20 nm of gold-palladium (Emscope, Ashford, UK), then imaged with a
Hitachi S4700 at 10 kY.
4.2.4 Data analysis
4.2.4.1 From Coomassie-staining
To assess cell spreading, elongation and surface coverage, at least 20 images covering 1274x959
[.lm2 were acquired on each Coomassie-stained sample, of which at least 10 images of cells on the
nanopatterned area, and at least lOon the surrounding flat area.
Individual cells were counted on each image up to the 24 h time-point and their area and aspect
ratio measured (ImagePro-Plus, 5.0.1.1.1, Media Cybernetics) on the patterned area ("pillars") and
on the surrounding flat area ("flat" control). Subsequently, the values from the 10 images were
averaged to obtain the average cell number per unit area, cell area and aspect ratio, on the "Flat"
80
4. Part I Cells on regular nanopillars
control and on the "Pillars" of each sample. In order to measure the surface coverage, Coomassie
images were thresholded in Image] (Rasband, 1997-2005) and the average surface coverage was
calculated as the average ratio of thresholded pixels over the total number of pixels per image, and
averaged over all images (from "Pillars" and from "Flat"). The aspect ratio was calculated by
ImagePro-Plus as the ratio of major and minor axis of the cell.
Since each time point was tested in duplicate, it was necessary to verify the significance of
averaging values from equivalent groups of the two samples (e.g. average cell area on "pillars" I
and average cell area on "pillars" 2). Since all the values were positively skewed, they were
normalized by a 10glO. Then, unpaired t-Test (two-tailed assuming unequal variance) was used to
compare equivalent groups of values and non-equivalent groups of values (e.g. number of cells on
"flat" 1 and number of cells on "pillars" 1) from the two samples at the same time-point. Results of
p<0.05 were considered significant. The test confirmed that the difference between equivalent
groups (e.g. flatl-flat2) was not significant, while it was significant between non-equivalent groups
(e.g. flatl-pillarsl, flatl-pillars2); hence, the equivalent values from the two samples could be
averaged.
The cells started forming contacts after the 24 h time-point. This is known to alter individual cell
behaviour (Curtis, 1962). For this reason, it was not meaningful to analyse individual cell areas and
morphology after this point. Thus, only the surface coverage was measured for the 48 h to 96 h
time-points.
4.2.4.2 From Vinculin staining
For each surface the number of Vinculin-containing cell-substrate adhesions (but not their area)
was counted using immunofluorescent images of at least 20 cells. The number of adhesions in each
cell was divided by the cell area in order to obtain the densities of adhesions; these values were
averaged to yield the average number of adhesions per cell-unit-area on each surface. It should be
noted that the counts included focal complexes, focal adhesions/contacts and fibrillar adhesions,
since they all contain Vinculin.
4.2.4.3 From the proliferation assay
In order to analyse cell proliferation, at least 20 pictures per surface were captured of the
BrdU/DAPI-stained samples. Subsequently, the total number of nuclei (DAPI stain) and the
number of BrdU-stained nuclei (proliferating cells) on each image were counted (ImagePro-Plus,
5.0.1.1.1, Media Cybernetics). The total percentage of proliferating cells was obtained by summing
over the values of all the pictures.
81
4. Part 1. Cells on regular nanopillars
4.3 Initial results: why pillars and not pits
Figure 40 shows the SEM profiles of the
nanofabricated masters (top row) and the
SEM images of the corresponding PCL
nanopatterns (middle row). In order to test
which nanopattern had an evident effect on
cell adhesion, PCL replicas were embossed
from all the silicon masters. The replicas
consisted of a 1 crrr' nanopatterned square
in the middle of the sample, surrounded by
a flat area. The diameters of the nano-pits
and nano-pillars is shown in Table 2, page
29. After sterilisation, hTERT cells were
seeded on these patterns (1.5xl04
cells/sample) for 96 h, then they were fixed
and Coomassie-stained.
Figure 38. SEM image of the PCl. nano-pits used byGallager et al:(Galiagher, 2003) this nanopattem wasshown to inhibit cell attachment. The diameter of the pits(216:t:10 nm) was measured by ImageJ(Rasband, 19972005) from this picture. Bar: 2 urn,
It is obvious from Figure 40 that both nano-pillared replicas (H83-r and H90-r) had the similar
effect of strongly reducing cell coverage at confluence, while the cell culture on the nano-pitted
patterns (P21-r, P13-r and P12-r) resembled the one on the flat sample. Only on P21-r a very light
reduction in cell coverage could be seen. This seems at first in contradiction with previous results
(Gallagher, 2002, Casey, 1997), which showed that cell adhesion was significantly reduced by
nano-pits. However on analysing by SEM a PCL sample embossed with the pattern used by
Gallagher (Gallagher, 2003) it became evident that this difference could be due to the much larger
diameter of the pits he used (216±10 nm, Figure 38). This point will be discussed further in 4.5. It
should also be noted that the experiment was repeated with both ethanol- and UV-sterilised
replicas, with the same results.
Because H90-r and H83-r elicited the most obvious and therefore immediately interesting cell
reaction, the results of cell counts, morphology, area and surface coverage of hTERT on sample
H83-r (Figure 39) and sample H90-r (Figure 47) were gathered. Figure 39 shows these results for
sample H83-r. Initially (l h) there were significantly more cells on the pillared area than on the
surrounding flat area. This is due to the seeding process, which often results in an increased
number of cells in the middle of a large sample, due to user-induced and vibration-induced
whirling of the medium in the Petri dish. The number of cells did not differ significantly from flat
to pillared areas over 12 h, but from 6 h the area ofthe cells on the nano-pillars started to decrease,
and this contributed to decreasing the surface coverage on the nano-pillars at 12 h. The cells on the
82
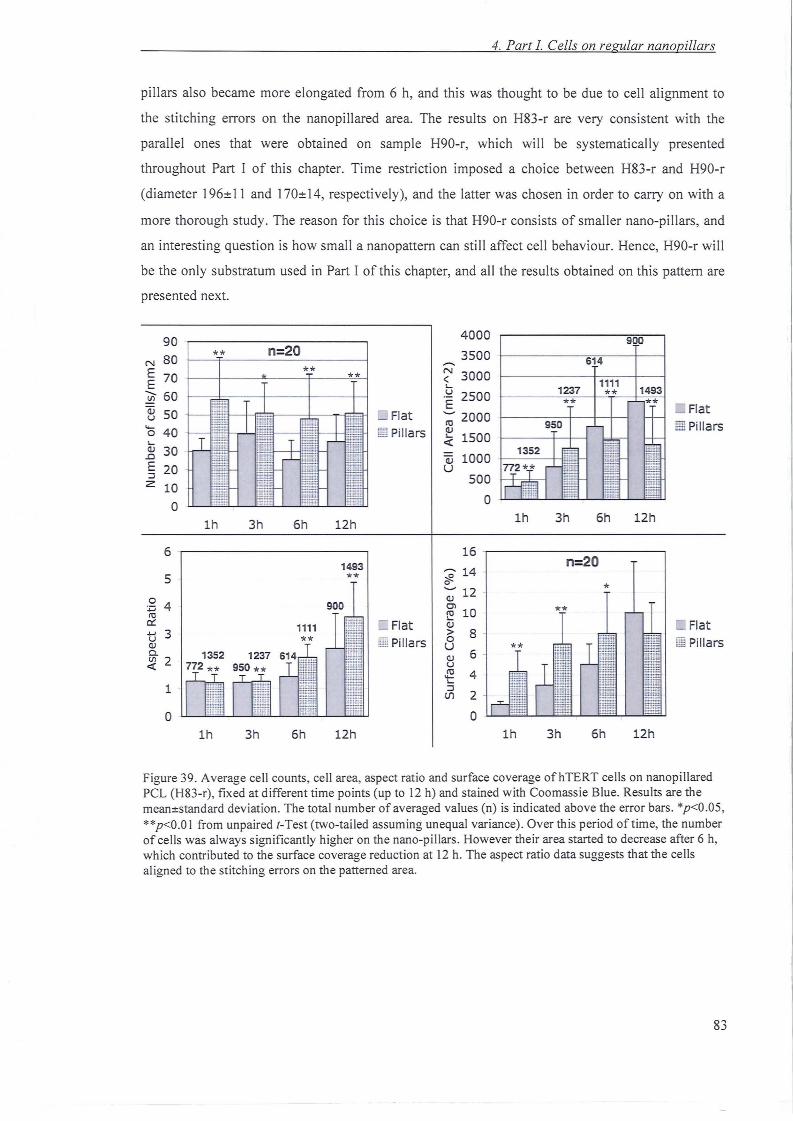
4. Part I. Cells on regular nanopillars
pillars also became more elongated from 6 h, and this was thought to be due to cell alignment to
the stitching errors on the nanopillared area. The results on H83-r are very consistent with the
parallel ones that were obtained on sample H90-r, which will be systematically presented
throughout Part 1 of this chapter. Time restriction imposed a choice between H83-r and H90-r
(diameter 196::: 11 and 170:::14, respectively), and the latter was chosen in order to carry on with a
more thorough study. The reason for this choice is that H90-r consists of smaller nano-pil lars, and
an interesting question is how small a nanopattern can still affect cell behaviour. Hence, H90-r will
be the only substratum used in Part 1 of this chapter, and all the results obtained on this pattern are
presented next.
FlatEf Pillars
**1493
12h
12h
900
1111**
6h
6h
614
**1237
n=20
*
**
3h
3h
lh
**
lh
8
6
4
2
o
16 -,.--- - - - - - - - - - --,
;e 14 .o-; 12~ 10 .'-QJ>oUQJU
~~
U1
4000
3500.......~ 3000'-
~ 2500-; 2000
~ 1500
Qj 1000u
500
o
Flatiili! Pillars
Flat
~ Pillars
** n=20
** **T T
;;;~~i; T 1 1f-------_..~~f~ I ~:~ g~1~ I ~~'"
l i ii T I~ ~~~i~~ ~:
~~
I~M:j~
""a:iii I ~~ -":i~
~TI g~ ~~~:._-_.-...
lh 3h 6h 12h
61493
5 **0 4:c;ttlex: 1111.u 3u **QJ0.l/l 2<t
1
0 E~~
lh 3h 6h 12h
90N 80E 70E~ 60~ 50a 40'-
~ 30E 20~
z 10
o
Figure 39. Average cell counts, cell area, aspect ratio and surface coverage ofhTERT cells on nanopillaredPCL (H83-r), fixed at different time points (up to 12 h) and stained with Coomassie Blue. Results are themeanestandard deviation . The total number of averaged values (n) is indicated above the error bars. *p<O.05,**p<O.O 1 from unpaired t-Test (two-tailed assuming unequal variance). Over this period of time, the numberof cells was always significantly higher on the nano-pillars. However their area started to decrease after 6 h,which contributed to the surface coverage reduction at 12 h. The aspect ratio data suggests that the cellsaligned to the stitching errors on the patterned area.
83
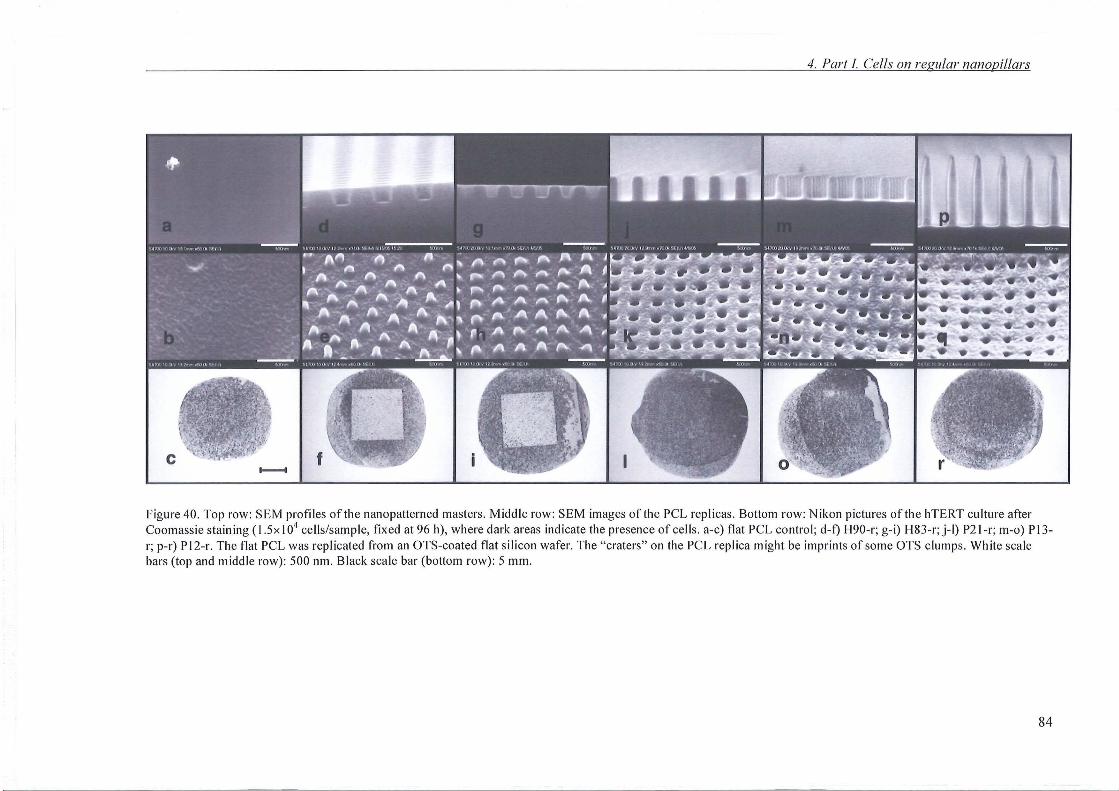
4. Part J. Cells on regular nanopillars
Figure 40 . Top row: SEM profiles of the nanopatterned masters. Middl e row: SEM images of the PCL replicas. Bottom row: Nikon pictures of the hTERT culture afterCoomassie staining (1 .5x 104 cells/sample, fixed at 96 h), where dark areas indicate the presence of cells . a-c) flat PCL control; d-f) H90-r ; g-i) H83-r; j-I) P21-r ; m-o) P131'; p-r) PI2-r. The flat PCL was replicated from an OTS -coated flat silicon wafer. The "craters" on the PCL replica might be imprints of some OTS clumps. Whit e scalebars (top and middle row): 500 nm. Black scale bar (bottom row): 5 mm .
84
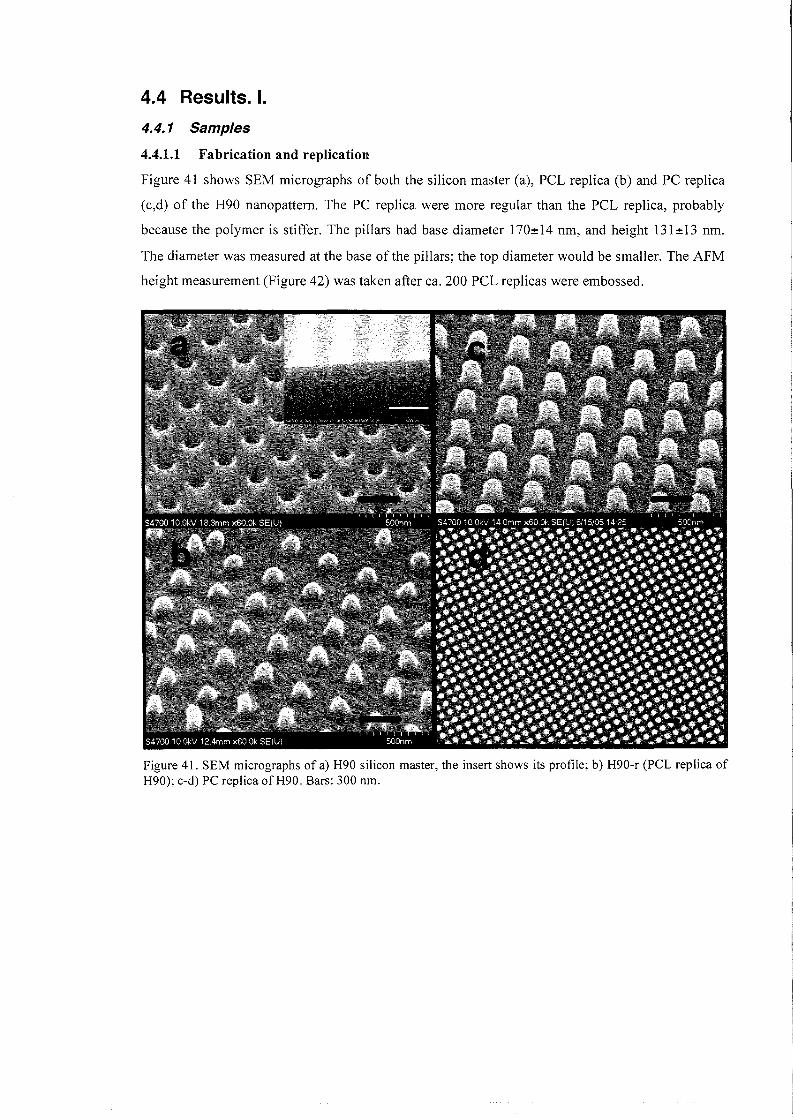
4.4 Results. I.
4.4.1 Samples
4.4.1.1 Fabrication and replication
Figure 41 shows SEM micrographs of both the silicon master (a), PCL replica (b) and PC replica
(c,d) of the H90 nanopattem. The PC replica were more regular than the PCL replica, probably
because the polymer is stiffer. The pillars had base diameter 170±14 nm, and height 131±13 nm.
The diameter was measured at the base of the pillars; the top diameter would be smaller. The AFM
height measurement (Figure 42) was taken after ca. 200 PCL replicas were embossed.
Figure 41. SEM micrographs of a) H90 silicon master, the insert shows its profile; b) H90-r (PCL replica ofH90); c-d) PC replica ofH90. Bars: 300 nm.
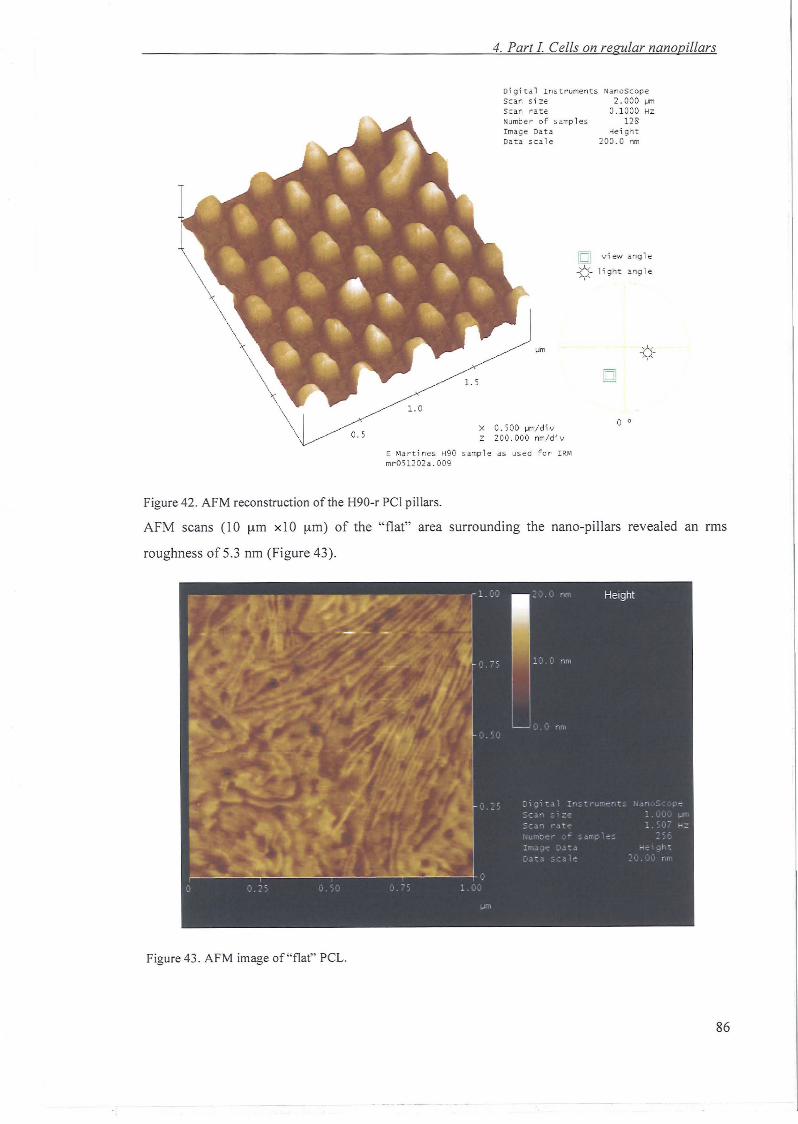
4. Part 1. Cells on regular nano pillars
~m
~ v i e w an gl e
i:~- l i gh t ang l e
Digi t a l I ns t rument sScan s i zeScan rateNumb e r of sampl esImage Dat aDat a sca le
1. 5
x O. 500 ~m/di v
Z 200 . 000 nm/di v
E Ma rt i ne s ~90 s ampl e as us e d f o r IRMmr 051202a.009
NanoScope2 . 000 ~m
0. 1000 H;:128
Height200 . 0 nm
a 0
Figure 42. AFM reconstru ction of the H90-r PCl pillars.
AFM scans (10 urn x l 0 urn) of the "flat" area surrounding the nano-pill ars revealed an rms
roughness of 5.3 nm (Figure 43).
Figure 43. AFM image of"flat" PCL.
86
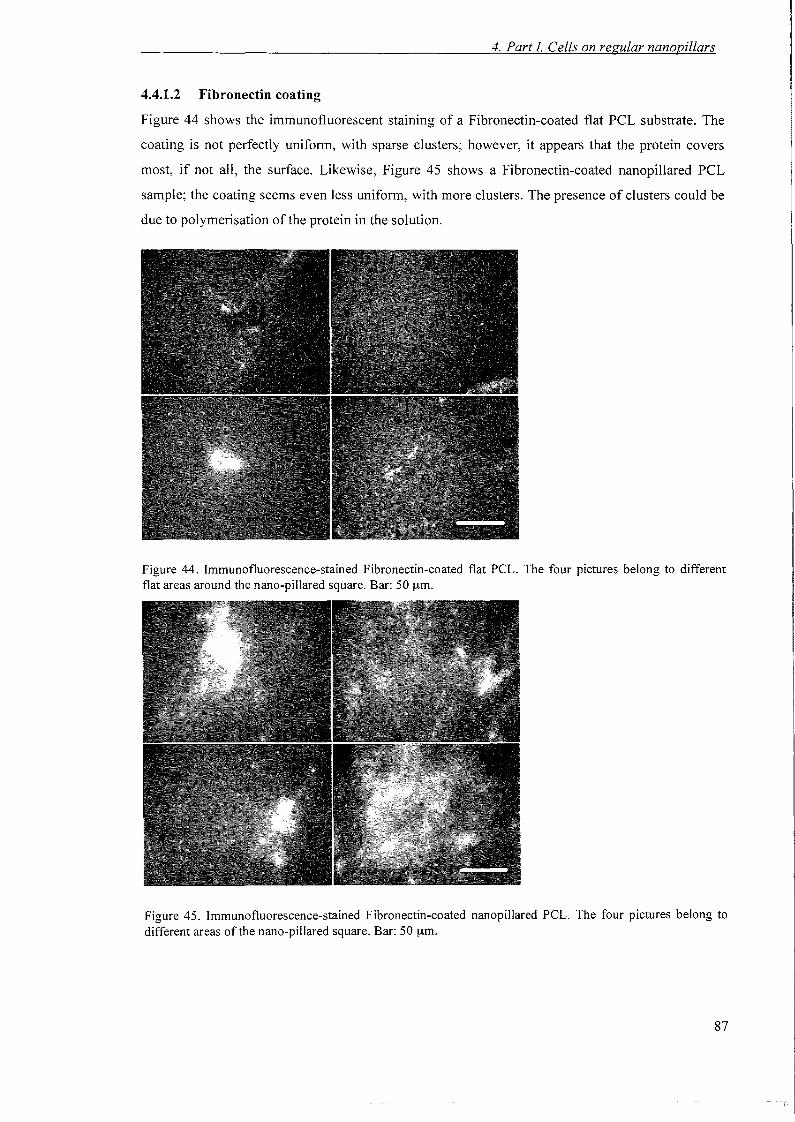
4. Part J Cells on regular nanopillars
4.4.1.2 Fibronectin coating
Figure 44 shows the immunofluorescent staining of a Fibronectin-coated flat PCL substrate. The
coating is not perfectly uniform, with sparse clusters; however, it appears that the protein covers
most, if not all, the surface. Likewise, Figure 45 shows a Fibronectin-coated nanopillared PCL
sample; the coating seems even less uniform, with more clusters. The presence of clusters could be
due to polymerisation ofthe protein in the solution.
Figure 44. Immunofluorescence-stained Fibronectin-coated flat PCL. The four pictures belong to differentflat areas around the nano-pillared square. Bar: 50 urn,
Figure 45. Immunofluorescence-stained Fibronectin-coated nanopillared PCL. The four pictures belong todifferent areas of the nano-pillared square. Bar: 50 urn.
87
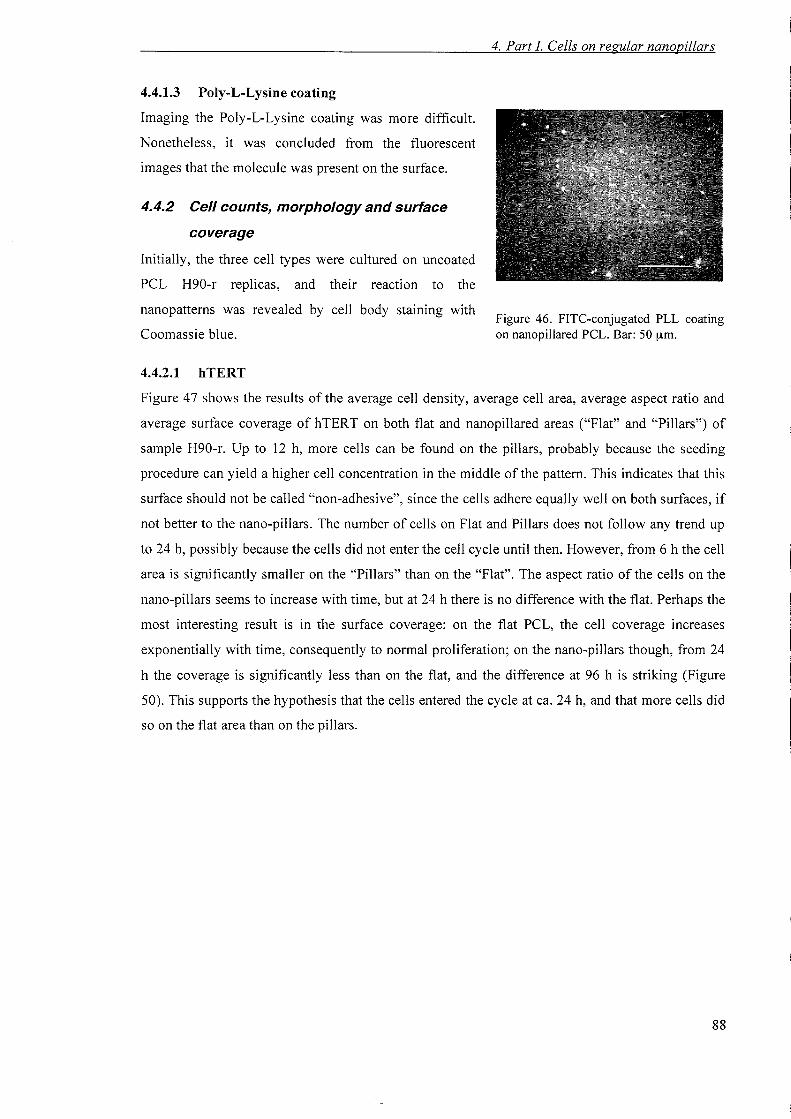
4. Part I Cells on regular nanopillars
4.4.1.3 Poly-L-Lysine coating
Imaging the Poly-L-Lysine coating was more difficult.
Nonetheless, it was concluded from the fluorescent
images that the molecule was present on the surface.
4.4.2 Cell counts, morphology and surface
coverage
Initially, the three cell types were cultured on uncoated
PCL H90-r replicas, and their reaction to the
nanopatterns was revealed by cell body staining with
Coomassie blue.
4.4.2.1 hTERT
Figure 46. FITC-conjugated PLL coatingon nanopillared PCL. Bar: 50 urn.
Figure 47 shows the results of the average cell density, average cell area, average aspect ratio and
average surface coverage of hTERT on both flat and nanopillared areas ("Flat" and "Pillars") of
sample H90-r. Up to 12 h, more cells can be found on the pillars, probably because the seeding
procedure can yield a higher cell concentration in the middle of the pattern. This indicates that this
surface should not be called "non-adhesive", since the cells adhere equally well on both surfaces, if
not better to the nano-pillars. The number of cells on Flat and Pillars does not follow any trend up
to 24 h, possibly because the cells did not enter the cell cycle until then. However, from 6 h the cell
area is significantly smaller on the "Pillars" than on the "Flat". The aspect ratio of the cells on the
nano-pillars seems to increase with time, but at 24 h there is no difference with the flat. Perhaps the
most interesting result is in the surface coverage: on the flat PCL, the cell coverage increases
exponentially with time, consequently to normal proliferation; on the nano-pillars though, from 24
h the coverage is significantly less than on the flat, and the difference at 96 h is striking (Figure
50). This supports the hypothesis that the cells entered the cycle at ca. 24 h, and that more cells did
so on the flat area than on the pillars.
88
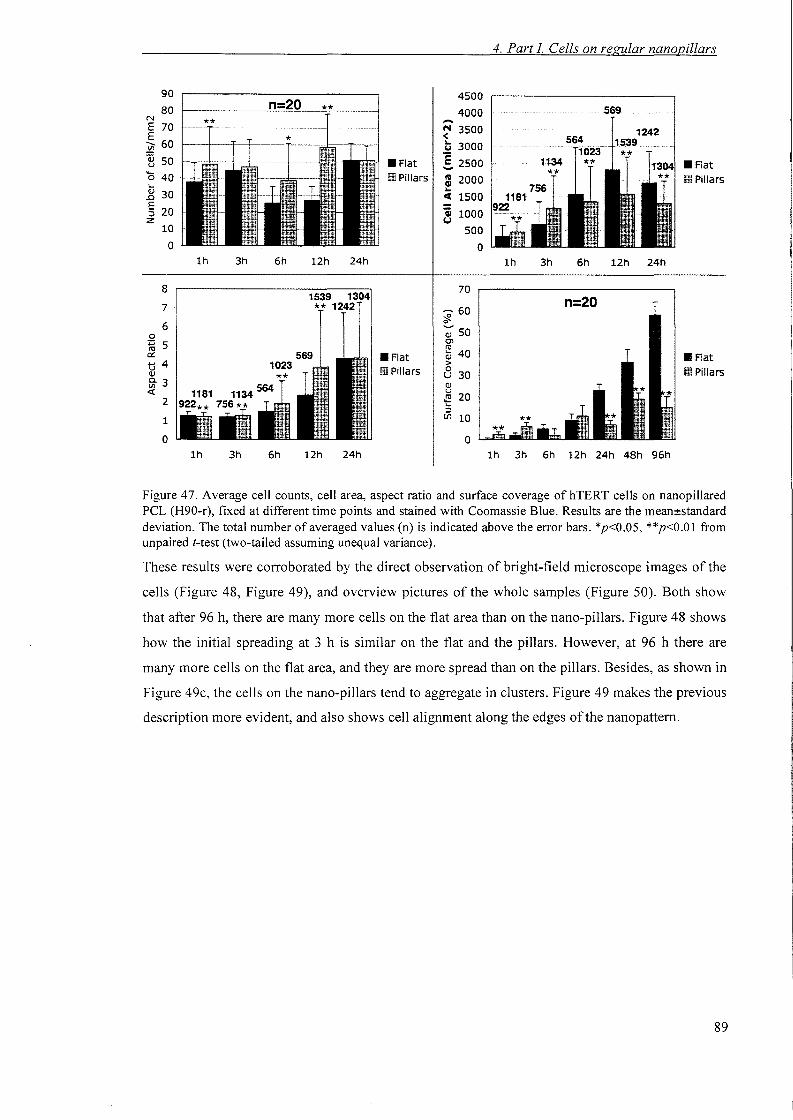
4. Part I Cells on regular nanopillars
90 450080 4000 569
N ......E 70 ~ 3500 1242E 564 1539:iQ 60 b 3000 1023 **~ 50 • Flat ~ 2500 1134 ** • Flat'0 40 iml Pillars **~ 2000 I!!lll Pillars'-<l) 30
....0 « 1500E 20 Qi:::; 1000z <J
10 5000 0
lh 3h 6h 12h 24h lh 3h 6h 12h 24h
8 701539 1304 n=207 ** 1242 ~ 60
-:§<
60
0 :; 50~ 5 C\
~ • Flat ~ 40 • Flatt 4 >(l) I!!lllPillars 8 30 I!!lll Pillars5}3 (l)~ u
2 ~ 20:::;
1 (/l 10
0 0lh 3h 6h 12h 24h lh 3h 6h 12h 24h 48h 96h
Figure 47. Average cell counts, cell area, aspect ratio and surface coverage of hTERT cells on nanopillaredPCL (H90-r), fixed at different time points and stained with Coomassie Blue. Results are the meanestandarddeviation. The total number of averaged values (n) is indicated above the error bars. *p<O.05, **p<O.OI fromunpaired z-test (two-tailed assuming unequal variance).
These results were corroborated by the direct observation of bright-field microscope images of the
cells (Figure 48, Figure 49), and overview pictures of the whole samples (Figure 50). Both show
that after 96 h, there are many more cells on the flat area than on the nano-pillars. Figure 48 shows
how the initial spreading at 3 h is similar on the flat and the pillars. However, at 96 h there are
many more cells on the flat area, and they are more spread than on the pillars. Besides, as shown in
Figure 49c, the cells on the nano-pillars tend to aggregate in clusters. Figure 49 makes the previous
description more evident, and also shows cell alignment along the edges of the nanopattem.
89
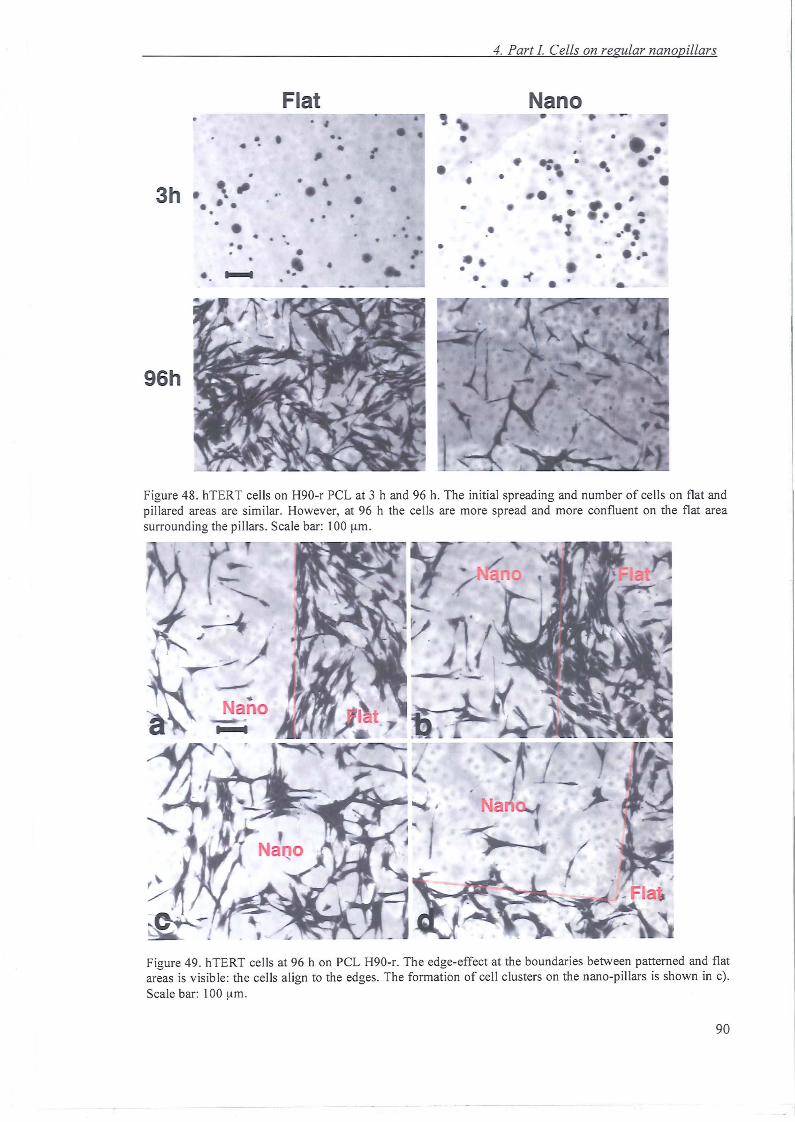
96h
Figure 48. hTERT cells on H90-r PCL at 3 h and 96 h. The initial spreading and number of cells on flat andpillared areas are similar. However, at 96 h the cells are more spread and more confluent on the flat areasurrounding the pillars. Scale bar: 100 urn,
Figure 49. hTERT cells at 96 h on PCL H90-r. The edge-effect at the boundaries between patterned and flatareas is visible: the cells align to the edges. The format ion of cell clusters on the nano-p illars is shown in c).Scale bar: 100 urn.
90
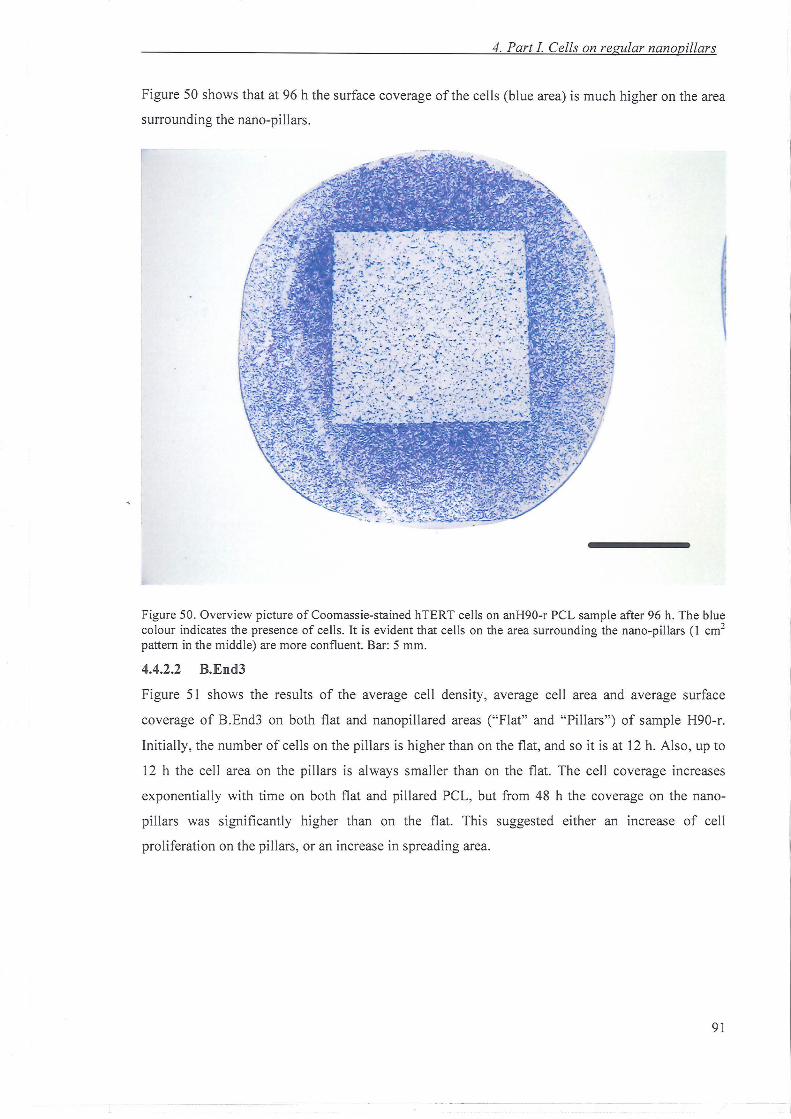
4. Part 1. Cells on regular nanopillars
Figure 50 shows that at 96 h the surface coverage of the cells (blu e area) is much higher on the area
surrounding the nano-pillars.
Figure 50. Overvi ew picture of Coomassie-stained hTERT cells on anH90 -r PCL sample after 96 h. The bluecolour indicates the presence of cells. It is evident that cells on the area surrounding the nano-pillars (1 em"pattern in the middle) are more confluent. Bar: 5 mm.
4.4.2.2 B.End3
Figure 51 shows the resu lts of the average cell density, average cell area and average surface
coverage of B.End3 on both flat and nanopi llared areas ("Flat" and "P illars") of sample H90-r.
Initially, the number of cells on the pill ars is higher than on the flat, and so it is at 12 h. Also, up to
12 h the cell area on the pillars is always smaller than on the flat. The cell coverage increases
exponentially with time on both flat and pillared peL, but from 48 h the coverage on the nano
pillars was significantly higher than on the flat . This suggested either an increase of cell
pro liferation on the pillars, or an increase in spreading area.
91
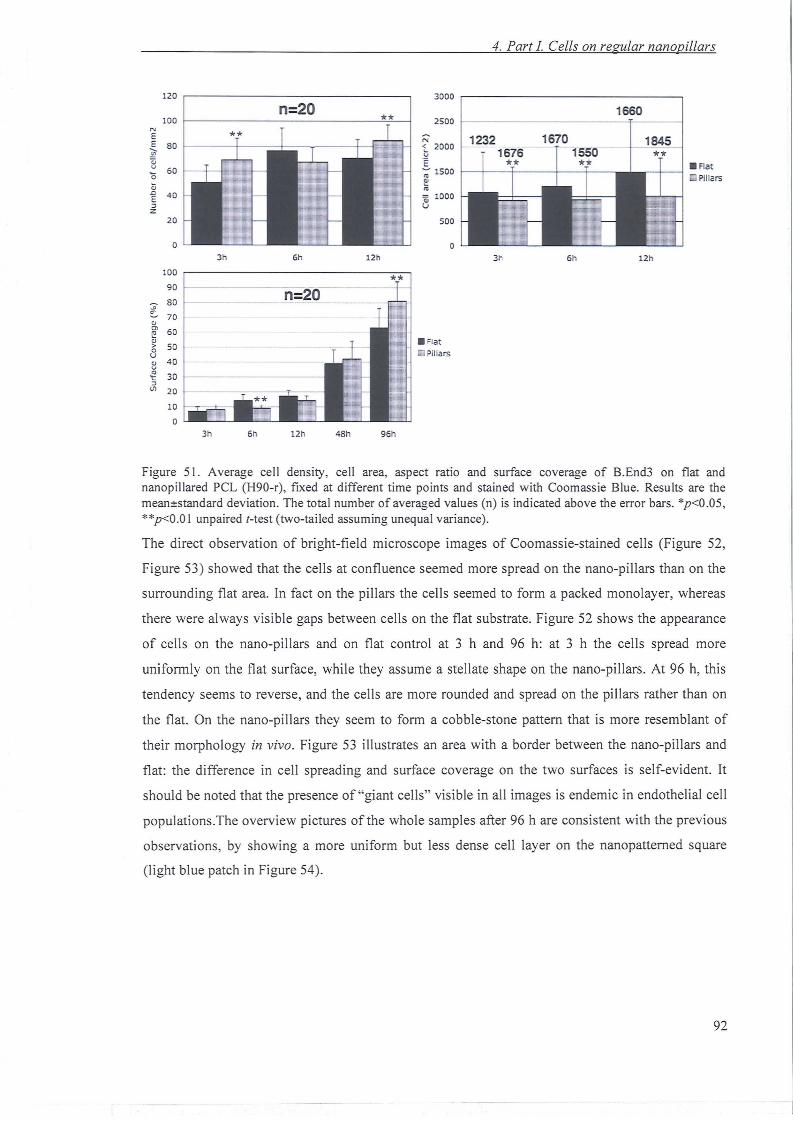
4. Part I Cells on regular nanopillars
3000 ,...---------- ---------,
2500 I-- - - - - - - - - --f----j
1845
12h
1660
6h310
1232 16701676- - - 1550** **
o
500
N
1. 20 00uE-;; 1500 I-~-+--+-_+_-
!!:'"'01 10 00lJ
120
n=20100
N
E
~8 0
c;u
60'0c;.0
E:lZ
20
0
3 h 6h 12h
10 0
9 0 n=2-0'# 80 -------
70oC> 6 0ec> 500u1; 4 0.,
30't::l~ 20
10
0
3h 6h 12h 48h 96h
Figure 51. Average cell density, cell area, aspect ratio and surface coverage of B.End3 on flat andnanopi llared PCL (H90-r), fixed at different time points and stained with Coomass ie Blue. Results are themeanestandard deviation. The tota l number of averaged values (n) is indicated above the error bars. *p<O.05,**p<O.OI unpaired r-test (two-tailed assum ing unequa l variance).
The direct observation of bright-field microscope images of Coornassie-stained cells (Figure 52,
Figure 53) showed that the cells at confluence seemed more spread on the nano-pi llars than on the
surrounding flat area. In fact on the pillars the cells seemed to form a packed monolayer , whereas
there were always visible gaps between cells on the flat substrate. Figure 52 shows the appearance
of cells on the nano-pi llars and on flat control at 3 hand 96 h: at 3 h the cells spread more
uniformly on the flat surface, while they assume a stellate shape on the nano-pi llars, At 96 h, this
tendency seems to reverse , and the cells are more rounded and spread on the pillars rather than on
the flat. On the nano-pi llars they seem to form a cobb le-stone pattern that is more resemb lant of
their morpho logy in vivo. Figure 53 illustrates an area with a border between the nano-pi llars and
flat: the difference in cell spreading and surface coverage on the two surfaces is self-evident. It
shou ld be noted that the presence of "giant cells" visible in all images is endemic in endothelial cell
populations.The overview pictures of the whole samples after 96 h are consistent with the prev ious
observations, by showing a more uniform but less dense cell layer on the nanopatterned square
(light blue patch in Figure 54).
92
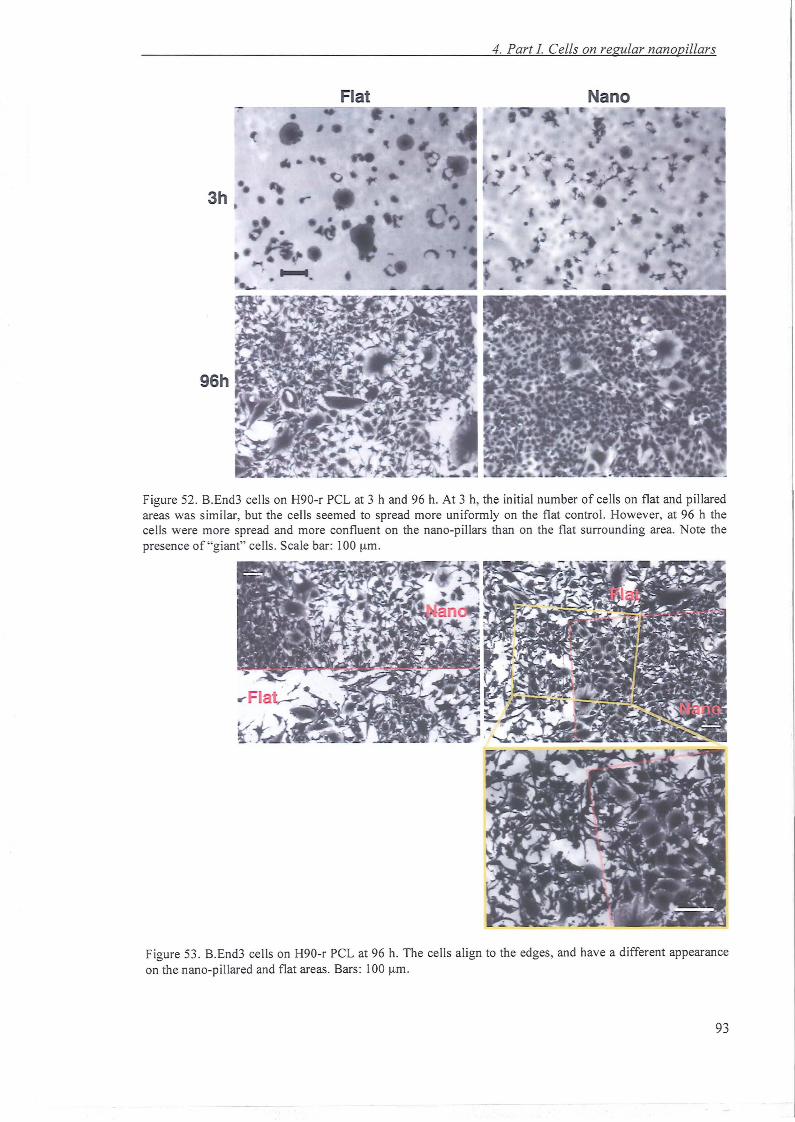
3h •
•Flat
4. Part 1. Cells on regular nanopillars
Nano
Figure 52. B.End3 cells on H90-r PCL at 3 hand 96 h. At 3 h, the initial number of cells on flat and pillaredareas was similar, but the cells seemed to spread more uniformly on the flat control. However, at 96 h thecells were more spread and more confluent on the nano-pillars than on the flat surrounding area. Note thepresence of "giant" cells . Scale bar: 100 urn.
Figure 53. B.End3 cells on H90-r PCL at 96 h. The cells align to the edges, and have a different appearanceon the nano-pillared and flat areas. Bars: 100 urn.
93
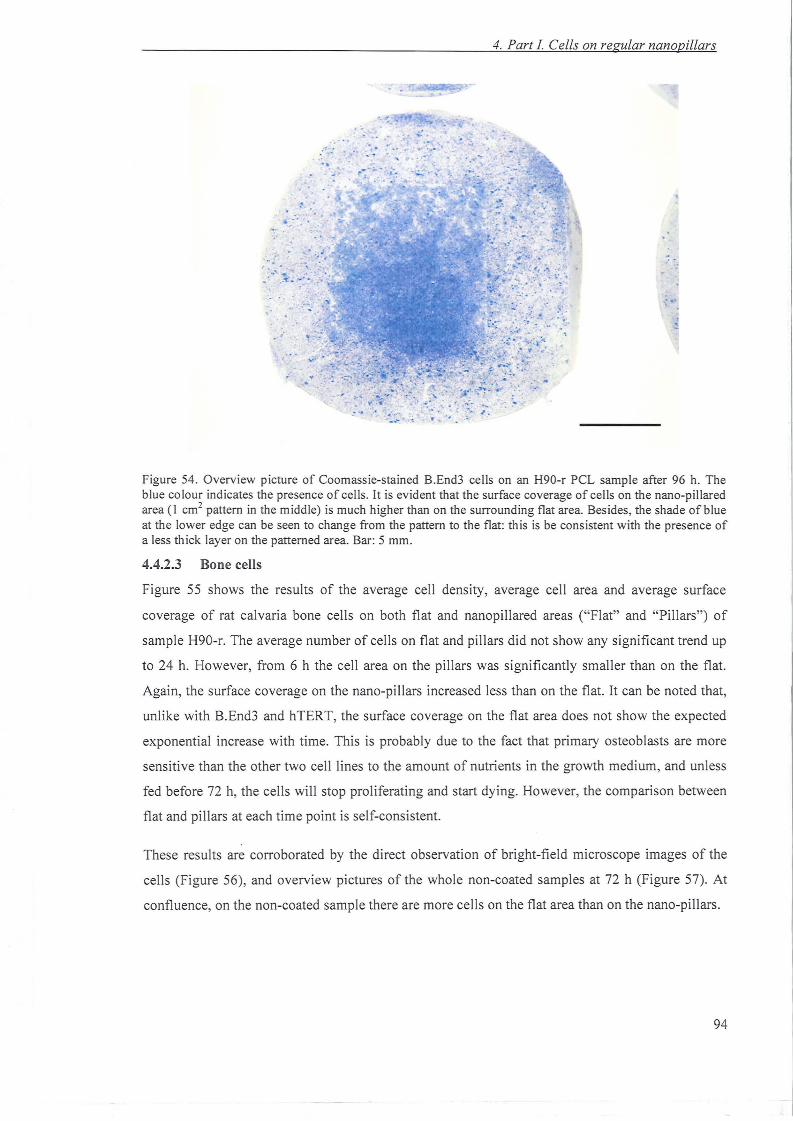
4. Part 1. Cells on regular nanopillars
.'
' 0 '
: ~ -,~ ... . . ' . _ ... :
• = .
' .. ..... ~.
. .- " , f
- ~ " .;. .. _ 0 °. " • • • •
• z
- . ... . .: ". r>
. ,; .._ T ": ..
. ".. . ., ~
-: .... -.
:
Figure 54. Overview picture of Coornassie -stained B.End3 cells on an H90-r PCL sample after 96 h. Theblue colour indicates the presence of cells . It is evident that the surface coverage of cells on the nano-pillaredarea (I cm' pattern in the middle) is much higher than on the surrounding flat area. Besides, the shade of blueat the lower edge can be seen to change from the pattern to the flat: this is be consistent with the presence ofa less thick layer on the patterned area. Bar: 5 mm.
4.4.2.3 Bone cells
Figure 55 shows the results of the average cell density, average cell area and average surface
coverage of rat calvaria bone cells on both flat and nanopillared areas ("Flat" and "Pillars") of
sample H90-r. The average number of cells on flat and pillars did not show any significant trend up
to 24 h. However, from 6 h the cell area on the pillars was significantly smaller than on the flat.
Again, the surface coverage on the nano-pillars increased less than on the flat. It can be noted that,
unlike with B.End3 and hTERT, the surface coverage on the flat area does not show the expected
exponential increase with time. This is probably due to the fact that primary osteoblasts are more
sensitive than the other two cell lines to the amount of nutrients in the growth medium, and unless
fed before 72 h, the cells will stop proliferating and start dying. However, the comparison between
flat and pillars at each time point is self-consistent.
These results are corroborated by the direct observation of bright-field microscope images of the
cells (Figure 56), and overview pictures of the whole non-coated samples at 72 h (Figure 57), At
confluence, on the non -coated sample there are more cells on the flat area than on the nano-pillars.
94
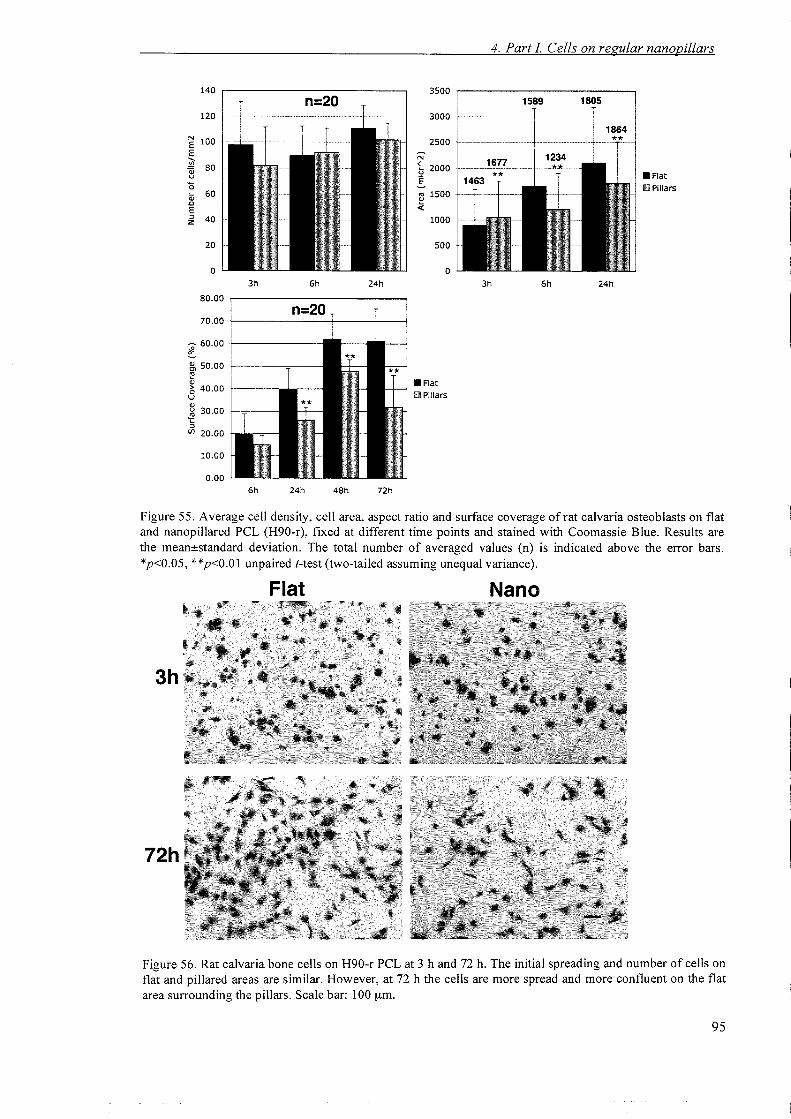
4. Part 1. Cells on regular nanopillars
• Flat
iIIIIPlllars
1864**
6h 24h
1589 1805
• Flat
iIIII Pillars
72h48h
3500
3000
2500
Nb 2000g~ 1500~
1000
500
06h 24h 3h
24h
140
120
N 100E.§..!!l 800;u
'0.... 60Q).0E~ 40z
20
03h
80.00
70.00
~ 60.00~15. 50.00~Q)
1) 40.00uQ)
:5 30.00't:~
(f) 20.00
10.00
0.006h
Figure 55. Average cell density, cell area, aspect ratio and surface coverage of rat calvaria osteoblasts on flatand nanopillared PCL (H90-r), fixed at different time points and stained with Coomassie Blue. Results arethe meanestandard deviation. The total number of averaged values (n) is indicated above the error bars.*p<0.05, **p<O.OI unpaired t-test (two-tailed assuming unequal variance).
Flat Nano
3h
72h
Figure 56. Rat calvaria bone cells on H90-r PCL at 3 hand 72 h. The initial spreading and number of cells onflat and pillared areas are similar. However, at 72 h the cells are more spread and more confluent on the flatarea surrounding the pillars. Scale bar: 100 urn.
95
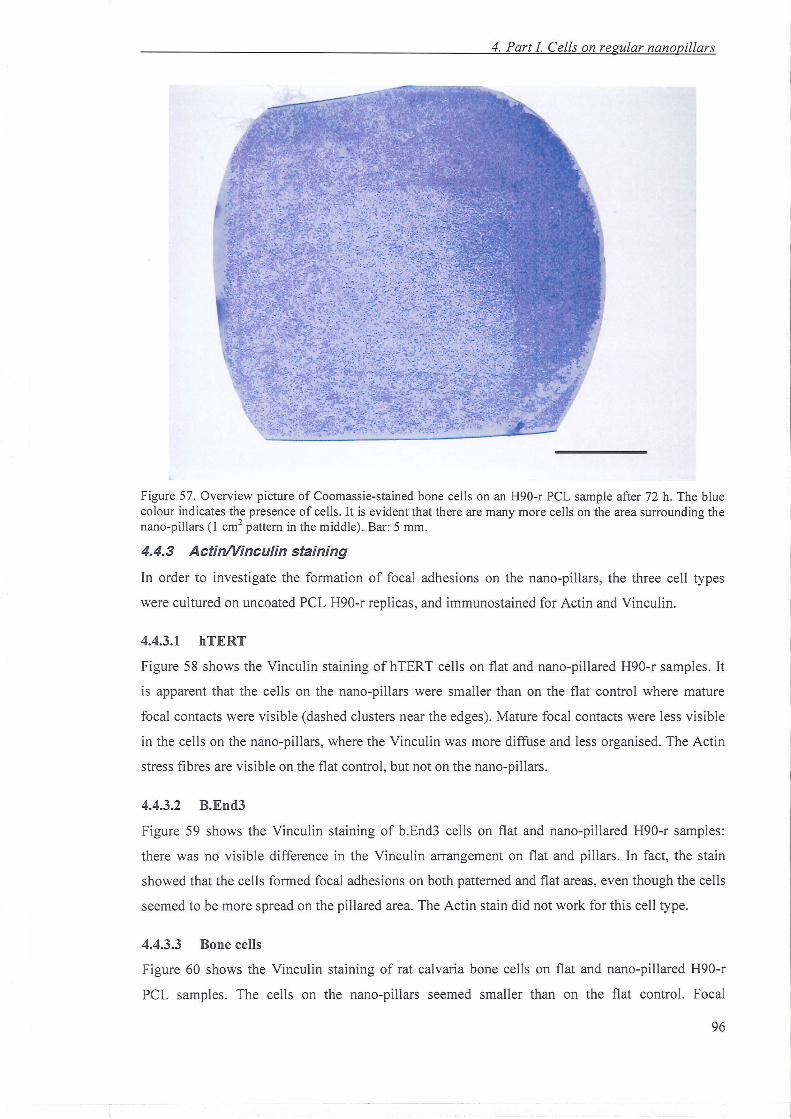
4. Part 1. Cells on regular nanopillars
Figure 57. Overview picture of Coomass ie-sta ined bone cells on an H90-r PCL sample after 72 h. The bluecolour indicates the presence of cells. It is evident that there are many more cells on the area surrounding thenano-pillars (1 crrr' patte rn in the middle). Bar: 5 mm.
4.4.3 ActinNinculin staining
In ord er to investigate the formation of focal adhesions on the nano-pill ars, the three cell types
were cultured on uncoated PCL H90-r repli cas, and immunostained for Actin and Vinculin.
4.4.3.1 hTERT
Figure 58 shows the Vincul in sta ining of hTE RT cells on flat and nano-pi llared H90-r samples. It
is apparent that the cells on the nano-pill ars were smaller than on the flat control where mature
focal contacts were visible (dashed clusters near the edges). Matur e focal contacts were less visibl e
in the cells on the nano-pillars, where the Vinculin was more diffuse and less organised . The Actin
stress fibres are visible on the flat control, but not on th e nan o-pill ars.
4.4.3.2 B.End3
Figure 59 shows the Vincul in staini ng of b.End3 cells on flat and nano-pilla red H90-r samples:
there was no visible difference in the Vinculin arrange ment on flat and pill ars. In fact, the stain
showed that the cells formed focal adhes ions on both patterned and flat areas , eve n though the cells
seemed to be more spread on the pillared area . The Actin stain did not work for this cell typ e.
4.4.3.3 Bone cells
Figure 60 shows the Vinculin staining of rat calvaria bone cells on flat and nano-pillared H90-r
PCL samples. The cells on the nano-pill ars seemed smaller than on the flat control. Focal
96
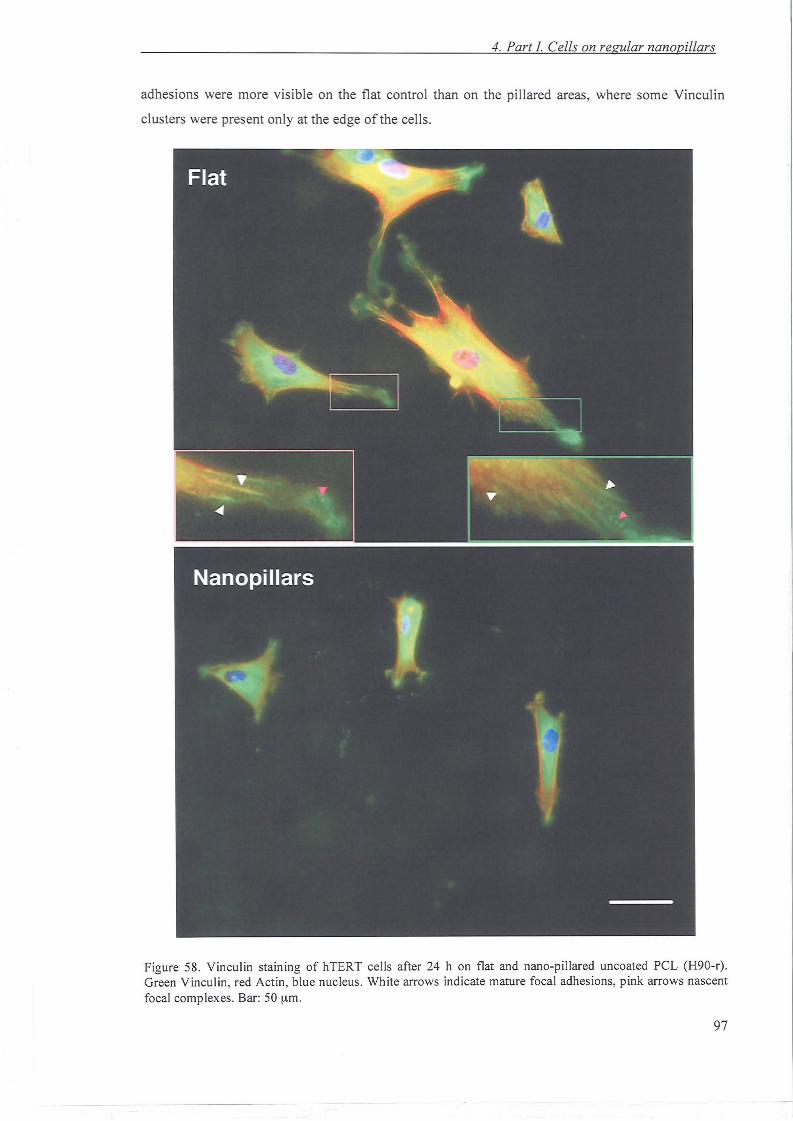
4. Part 1. Cells on regular nanopillars
adhesions were more visible on the flat contro l than on the pillared areas, where some Vinculin
clusters were present only at the edge of the cells.
Figure 58. Vinculin staining of hTERT cells after 24 h on flat and nano-pillared uncoated peL (H90-r) .Green Vinculin, red Actin, blue nucleus. White arrows indicate mature foca l adhesions, pink arrow s nascentfoca l complexes. Bar: 50 urn.
97
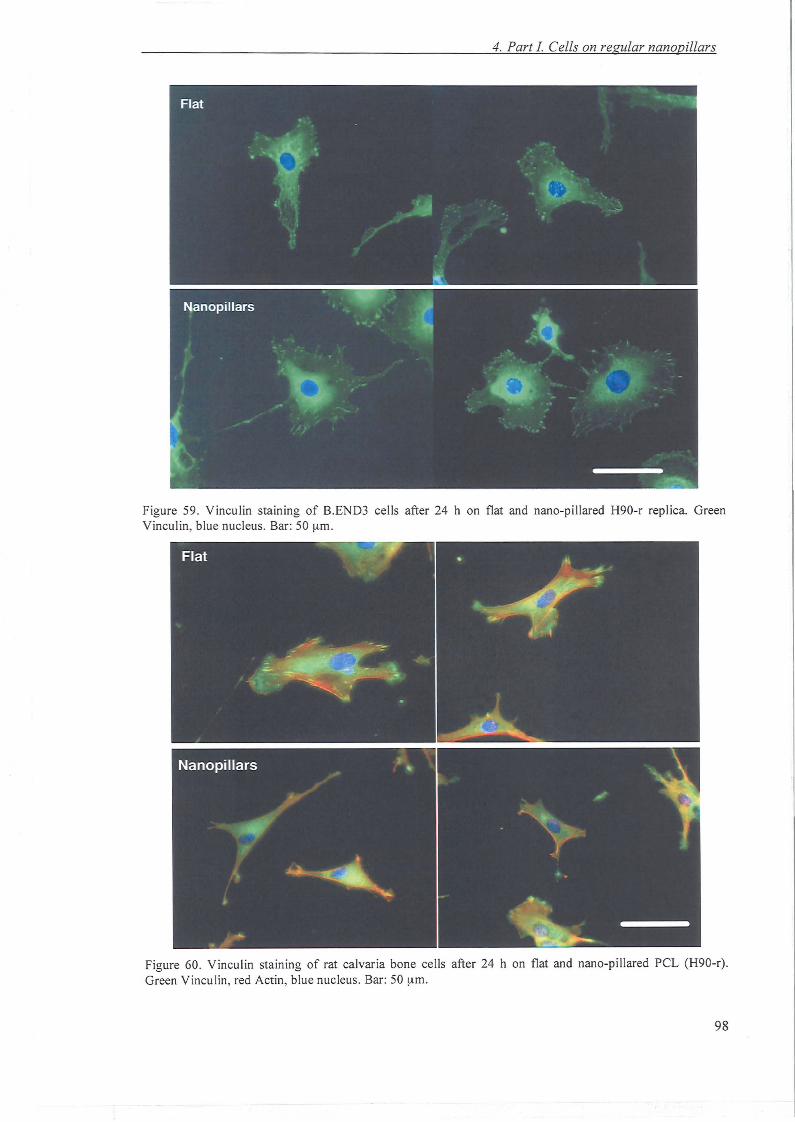
4. Part 1. Cells on regular nanopillars
Figure 59. Vinculin staining of REND3 cells after 24 h on flat and nano-pillared H90-r replica. GreenVinculin, blue nucleus . Bar: 50 urn.
Figure 60 . Vinculin staining of rat calvaria bone cells after 24 h on flat and nano-pillared peL (H90-r) .Green Vincu lin, red Actin , blue nucleus . Bar: 50 urn.
98
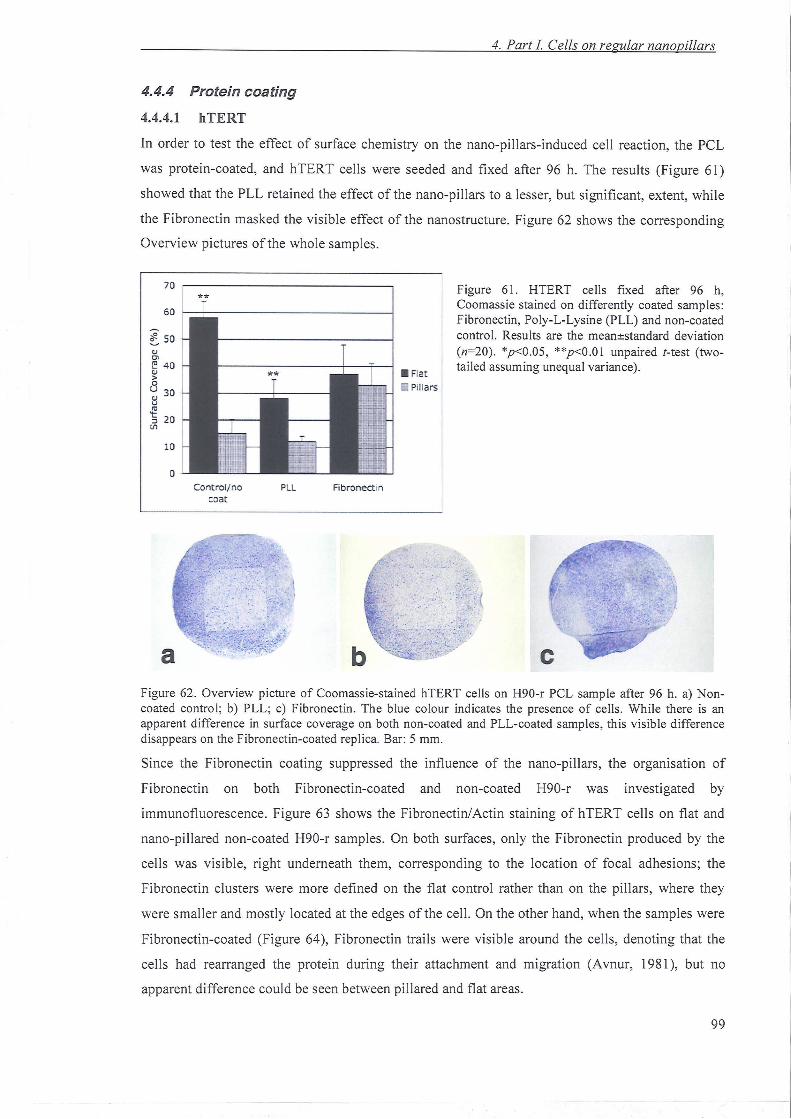
4. Part I Cells on regular nanopillars
4.4.4 Protein coating
4.4.4.1 hTERT
In order to test the effect of surface chemistry on the nano-pillars-induced cell reaction, the PCl.
was protein-coated, and hTERT cells were seeded and fixed after 96 h. The results (Figure 61)
showed that the PLL retained the effect of the nano-pillars to a lesser, but significant, extent, while
the Fibronectin masked the visible effect of the nanostructure. Figure 62 shows the corresponding
Overview pictures of the whole samples.
70
**60
lsoCJCl
e 40CJ>0
~ 30uIII
'§ 20til
10
0Control/ no PLL Fibronect in
coat
Figure 61. HTERT cells fixed after 96 h,Coomassie stained on differently coated samples:Fibron ectin, Poly-L-Lysin e (PLL) and non-coatedcontrol. Results are the meane standard deviation(n=20). *p<O .05, **p<O.OI unpair ed t-test (twotailed assuming unequal variance).
c
--."-; ~< . " ~ '. .:~ .o:--: .~
Figure 62. Overvi ew picture of Coomassie-stained hTERT cells on H90-r PCL sample after 96 h. a) Noncoated contro l; b) PLL; c) Fibron ectin . The blue colour indicates the presence of cells. While there is anapparent difference in surface coverage on both non-coated and PLL-coated samples, this visible differencedisapp ears on the Fibrone ctin-coated replica. Bar: 5 mm.
Since the Fibronectin coating suppressed the influence of the nano-pillars, the organisation of
Fibronectin on both Fibronectin-coated and non-coated H90-r was investigated by
immunofluorescence. Figure 63 shows the Fibronectin/Actin staining of hTERT cells on flat and
nano-pillared non-coated H90-r samples. On both surfaces, only the Fibronectin produced by the
cells was visib le, right underneath them, corresponding to the location of focal adhesions ; the
Fibronectin clusters were more defined on the flat contro l rather than on the pillars, where they
were smaller and mostly located at the edges of the cell. On the other hand, when the samples were
Fibronectin-coated (Figure 64), Fibronectin trails were visible around the cells, denoting that the
cells had rearranged the protein during their attachment and migration (Avnur, 1981), but no
apparent difference could be seen between pillared and flat areas.
99
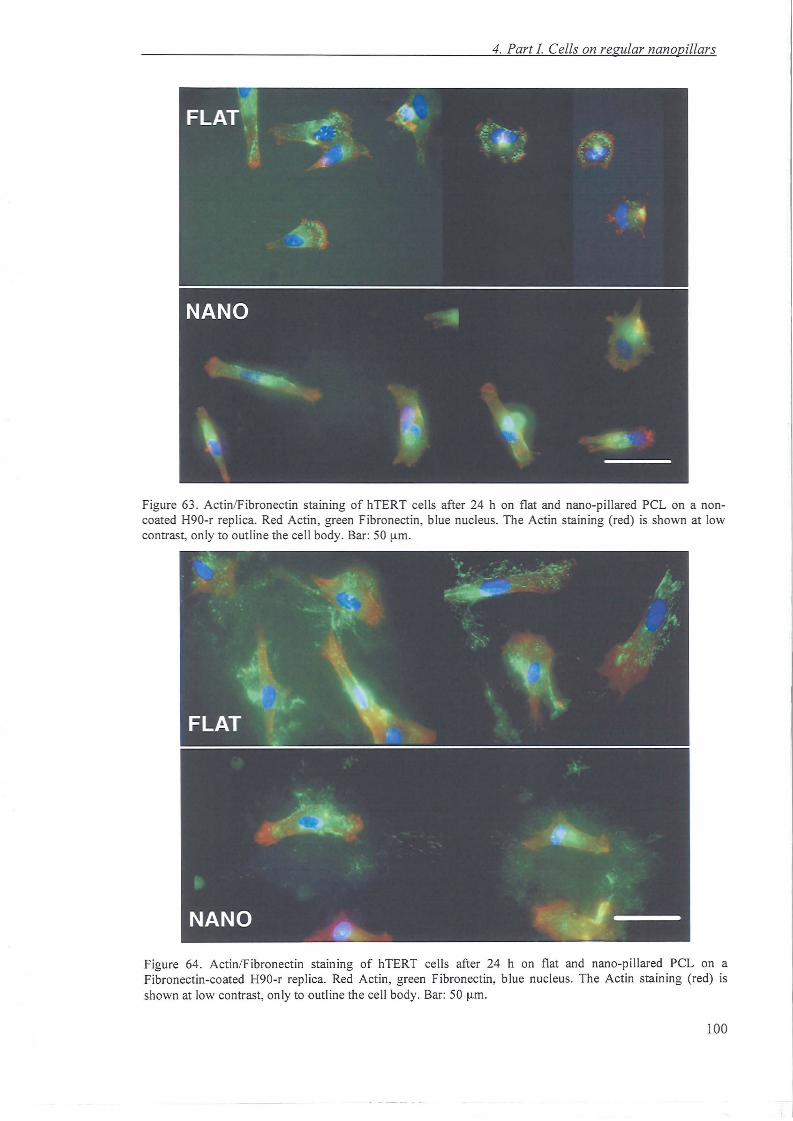
4. Part 1. Cells on regular nanopillars
Figure 63. Actin /Fibronectin staining of hTERT cells after 24 h on flat and nano-pi llared PCL on a noncoated H90-r replica. Red Actin , green Fibronectin, blue nucleus. The Actin sta ining (red) is shown at lowcontrast, only to outline the cell body. Bar: 50 urn.
Figure 64. Actin/Fibronectin stammg of hTERT cells after 24 h on flat and nano-pillared PCL on aFibronectin-coated H90-r replica. Red Actin, green Fibronectin, blue nucleus. The Actin sta ining (red) isshown at low contrast, only to outline the cell body. Bar: 50 urn.
100
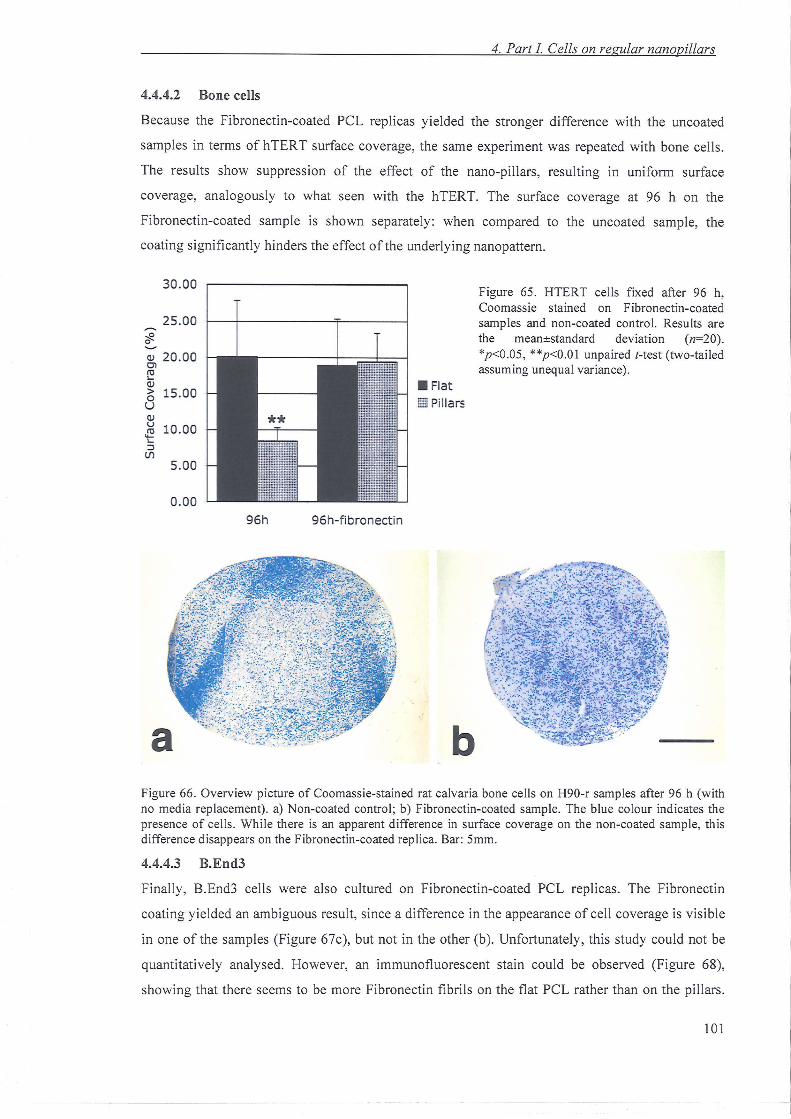
4. Part 1. Cells on regular nanopillars
4.4.4.2 Bone cells
Because the Fibronectin-coated PCL replicas yielded the stronger difference with the uncoated
samples in term s of hTERT surface coverage, the same experiment was repeated with bone cells.
The resu lts show suppress ion of the effect of the nano-pillars, resulting in uniform surface
coverage, ana logously to what see n with the hTERT. The surface coverage at 96 h on the
Fibronectin -coated sample is shown separately: when compared to the uncoated sample, the
coating significantly hinders the effect of the underlying nanopattem.
30.00
25.00
Q) 20 .000'1~Q)
E; 15 .00uQ)u~ 10.00'::JUl
5.00
0.00
• Flatlliill Pillars
Figure 65. HTERT cells fixed after 96 h,Coomassie stained on Fibronectin-coatedsamples and non-coated control. Resu lts arethe meane standard deviation (n=20) .*p<O.05, **p<O.Ol unpaired t-test (two -tai ledassum ing unequa l varian ce).
a
96h 96 h- f ibronect in
bFigure 66 . Overview picture of Coomassie-stained rat calvaria bone cells on H90-r samples after 96 h (withno media rep lacement) . a) Non-coated control; b) Fibron ectin-coated samp le. The blue colour indicates thepresence of cells. Whi le there is an appar ent difference in surface coverage on the non-coated sample, th isdifferenc e disapp ears on the Fibronectin-coated rep lica. Bar: 5mm.
4.4.4.3 B.End3
Finally, REnd3 cells were also cultured on Fibronectin-coated PCL replicas. The Fibronectin
coating yield ed an amb iguous result, since a difference in the appearan ce of cell coverage is visible
in one of the samples (Figure 67c), but not in the other (b). Unfortunately, thi s study could not be
quantitatively analysed. However, an immunofluorescent stain could be observed (Figure 68),
showing that there seems to be more Fibronectin fibril s on the flat PCL rath er than on the pillars.
101
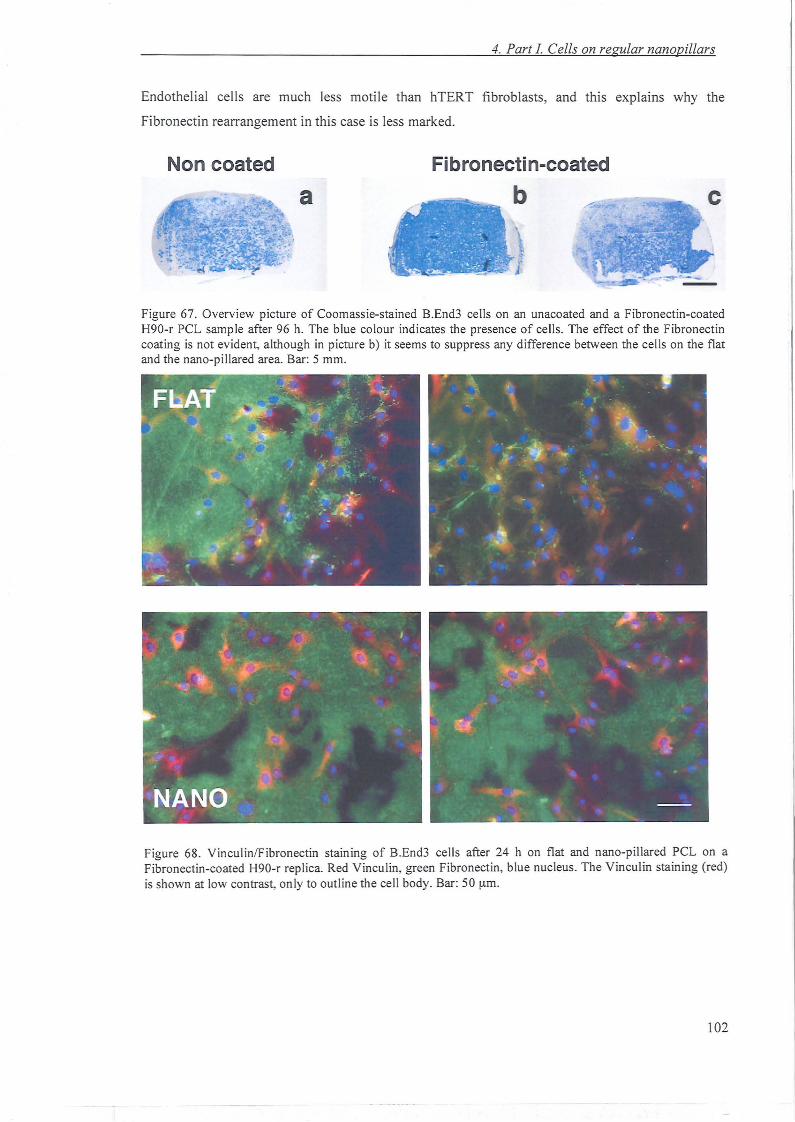
4. Part I. Cells on regular nanopillars
Endothelial cells are much less motile than hTERT fibroblasts, and this explains why the
Fibronectin rearrangement in this case is less marked.
Non coated Fibronectin-coated
a
Figure 67. Overvi ew picture of Coomassie-stained B.End3 cells on an unacoated and a Fibronectin-coatedH90-r PCL sample after 96 h. The blue colour indicates the presence of cells. The effect of the Fibronectincoating is not evident, although in picture b) it seems to suppress any difference between the cells on the flatand the nano-pillared area. Bar: 5 mm.
Figure 68. Vincu linlFibronectin staining of B.End3 cells after 24 h on flat and nano-pillared PCL on aFibronectin -coated H90-r replica. Red Vinculin, green Fibronectin, blue nucleus. The Vinculin staining (red)is shown at low contrast, only to outline the cell body . Bar: 50 urn.
102
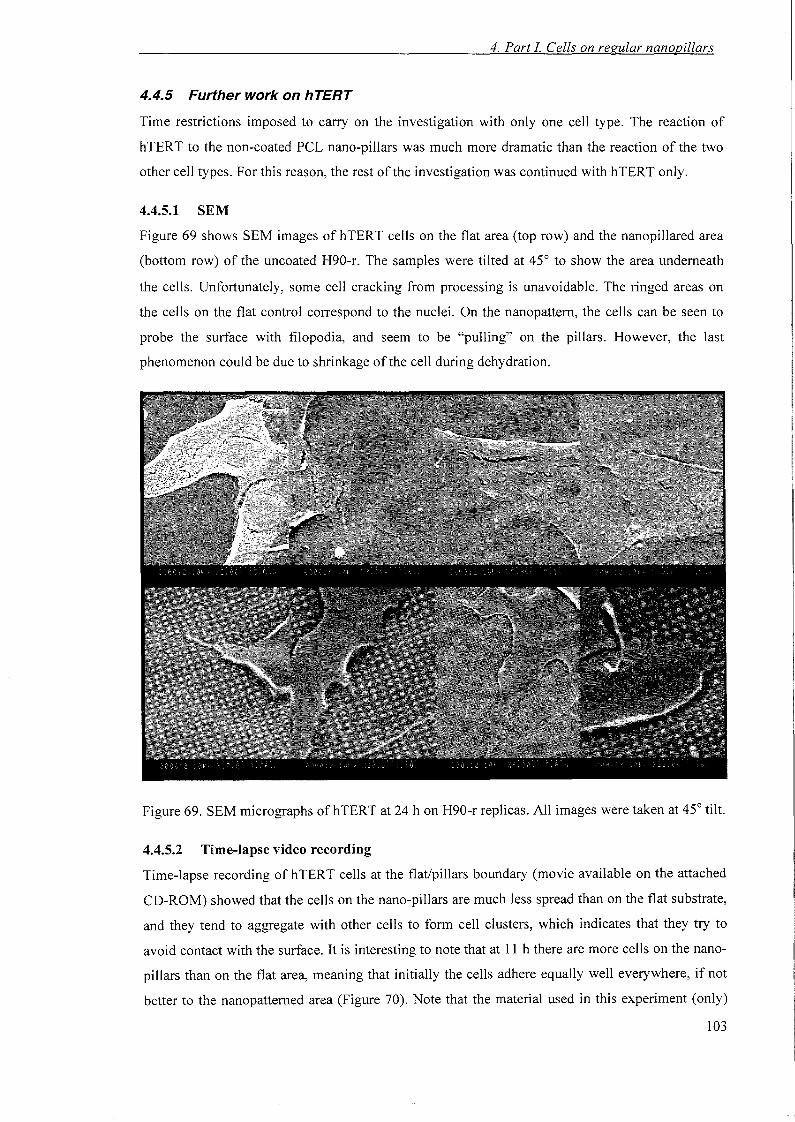
4. Part I Cells on regular nanopillars
4.4.5 Further work on hTERT
Time restrictions imposed to carry on the investigation with only one cell type. The reaction of
hTERT to the non-coated PCL nano-pillars was much more dramatic than the reaction of the two
other cell types. For this reason, the rest of the investigation was continued with hTERT only.
4.4.5.1 SEM
Figure 69 shows SEM images of hTERT cells on the flat area (top row) and the nanopillared area
(bottom row) of the uncoated H90-r. The samples were tilted at 45° to show the area underneath
the cells. Unfortunately, some cell cracking from processing is unavoidable. The ringed areas on
the cells on the flat control correspond to the nuclei. On the nanopattern, the cells can be seen to
probe the surface with filopodia, and seem to be "pulling" on the pillars. However, the last
phenomenon could be due to shrinkage of the cell during dehydration.
Figure 69. SEM micrographs ofhTERT at 24 h on H90-r replicas. All images were taken at 45° tilt.
4.4.5.2 Time-lapse video recording
Time-lapse recording of hTERT cells at the flat/pillars boundary (movie available on the attached
CD-ROM) showed that the cells on the nano-pillars are much less spread than on the flat substrate,
and they tend to aggregate with other cells to form cell clusters, which indicates that they try to
avoid contact with the surface. It is interesting to note that at 11 h there are more cells on the nano
pillars than on the flat area, meaning that initially the cells adhere equally well everywhere, if not
better to the nanopatterned area (Figure 70). Note that the material used in this experiment (only)
103
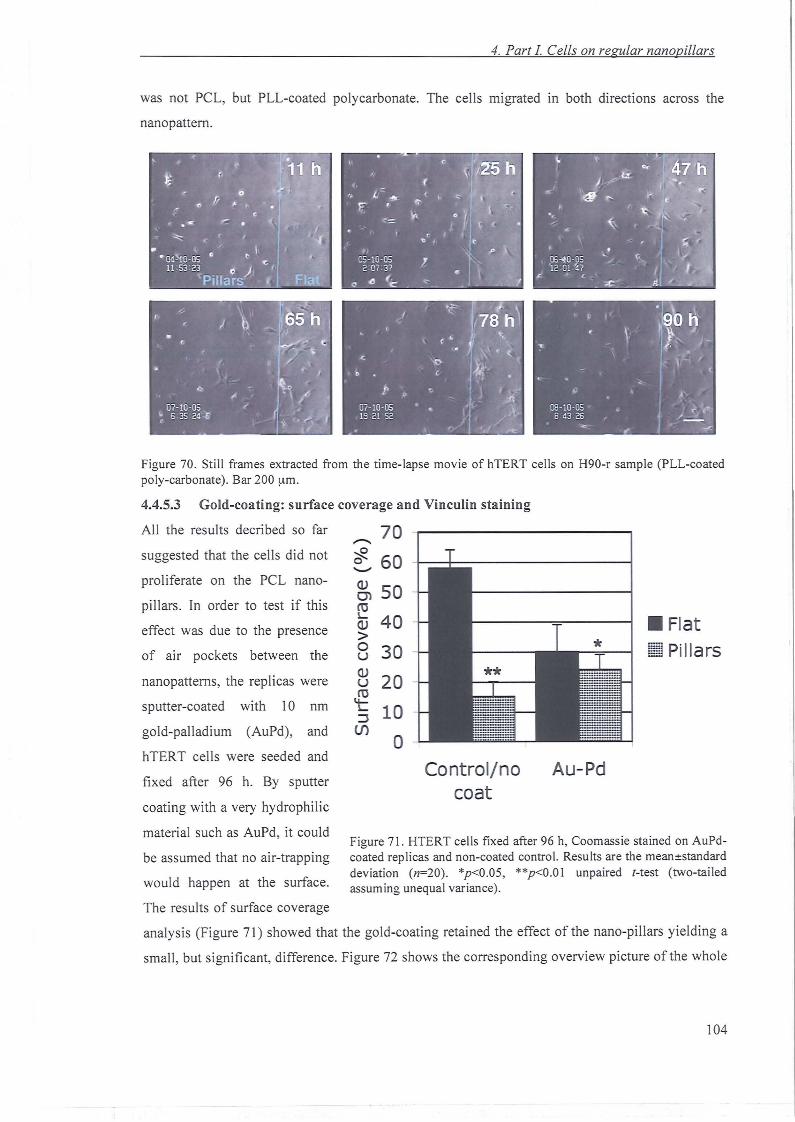
4. Part I. Cells on regular nanopillars
was not PCL, but PLL-coated polycarbonate. The cells migrated in both directions across the
nanopattem .
Figure 70. Still frames extracted from the time-lap se movie of hTERT cells on H90-r sample (PLL-coatedpoly-carbonate). Bar 200 urn.
4.4.5.3 Gold-coatin g: surface coverage and Vinculin staining
Figure 71. HTERT cells fixed after 96 h, Coom assie stained on AuPdcoated replicas and non-coated control. Results are the meane standarddeviation (n=20 ). *p<0 .05, **p<O.OI unpaired r-test (two-tai ledassuming unequal variance).
• Flat~~ Pillars
Au- PdContro l/nocoat
70 -r--- - - - - - - ----,
60
50
40
30
20
10
o
OJCJ)
~OJ>ouOJu
~~
f.I)
All the results decribed so far
suggested that the cells did not
proliferate on the PCL nano
pillars . In order to test if this
effect was due to the presence
of air pockets between the
nanopattems, the replicas were
sputter-coated with 10 nm
gold-palladium (AuPd), and
hTERT cells were seeded and
fixed after 96 h. By sputter
coating with a very hydrophilic
materia l such as AuPd, it could
be assumed that no air-trapping
would happen at the surface.
The result s of surface coverage
analysis (Figure 71) showed that the gold-coating retained the effect of the nano-pillars yielding a
small, but significant, difference. Figure 72 shows the corresponding overview picture ofthe whole
104
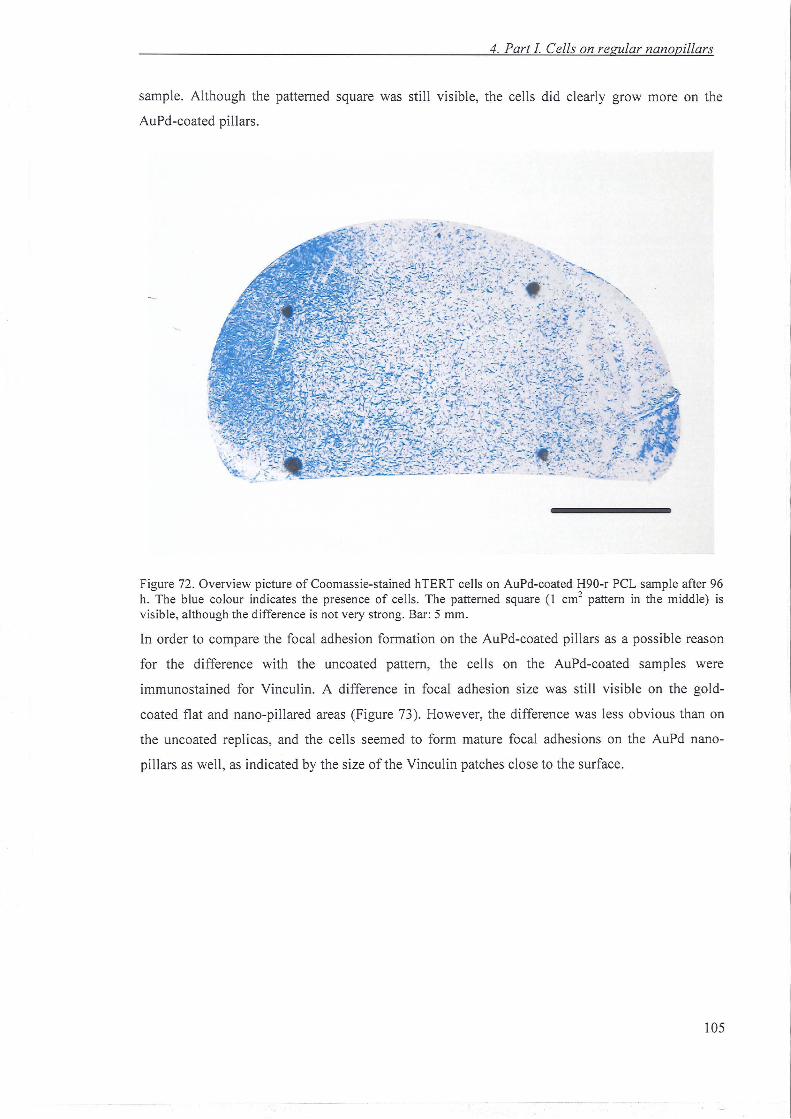
4, Part 1. Cells on regular nanopillars
sample. Although the patterned square was still visible, the cells did clearly grow more on the
AuPd-coated pillars.
.. _......-:.t~:· '-
......: . "
'-,
Figure 72. Overview picture of Coomassie-stained hTERT cells on AuPd-coated H90-r PCL sample after 96h. The blue colour indicates the presence of cells. The patterned square (1 cm' pattern in the middle) isvisib le, although the difference is not very strong. Bar: 5 mm.
In order to compare the foca l adhesion formation on the AuPd -coated pillars as a possible reason
for the difference with the uncoated pattern, the cells on the AuPd-coated samples were
immunostained for Vinculin. A difference in foca l adhesion size was still visibl e on the gold
coated flat and nano -pillared areas (Figure 73). However, the difference was less obvious than on
the uncoated replicas, and the cells seemed to form mature focal adhesions on the AuPd nano
pillars as well, as indicated by the size ofthe Vinculin patches close to the surface .
105
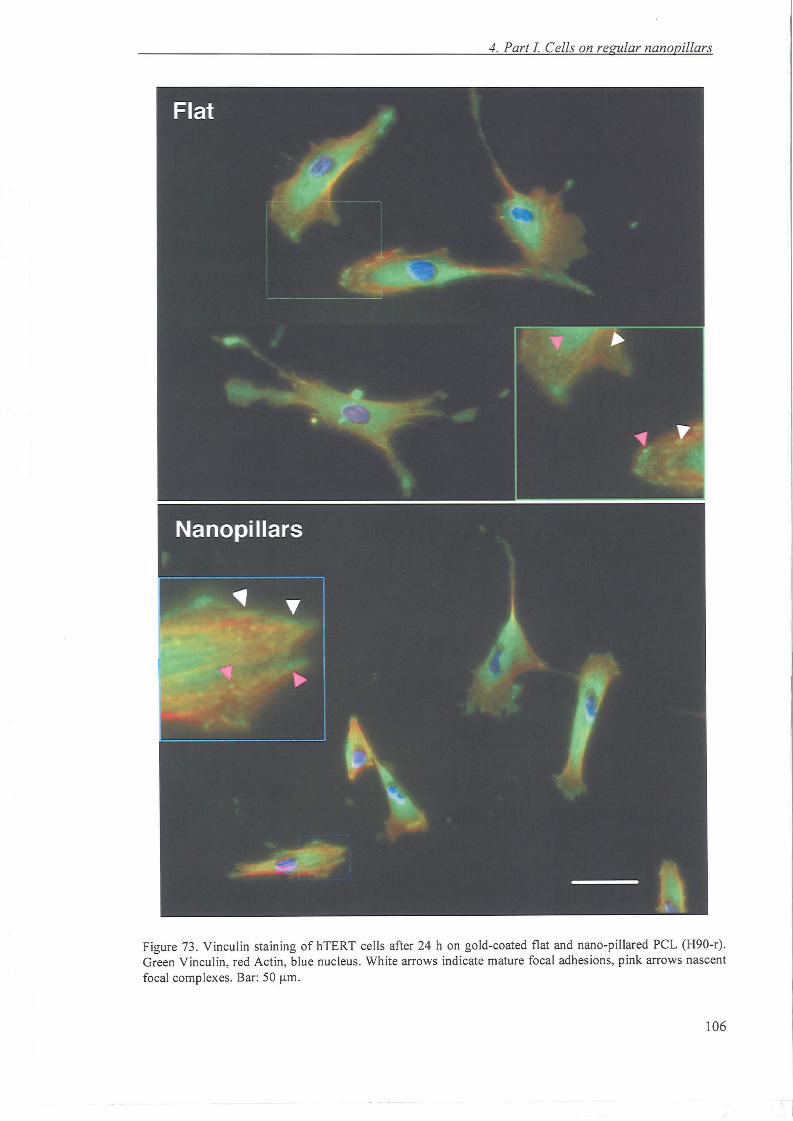
4. Part 1. Cells on regular nanopillars
Figure 73. Vinculin staining of hTERT cells after 24 h on gold-coated flat and nano-pillared peL (H90-r).Green Vinculin, red Actin, blue nucleus. White arrows indicate mature focal adhesions, pink arrows nascentfocal complexes . Bar: 50 urn ,
106
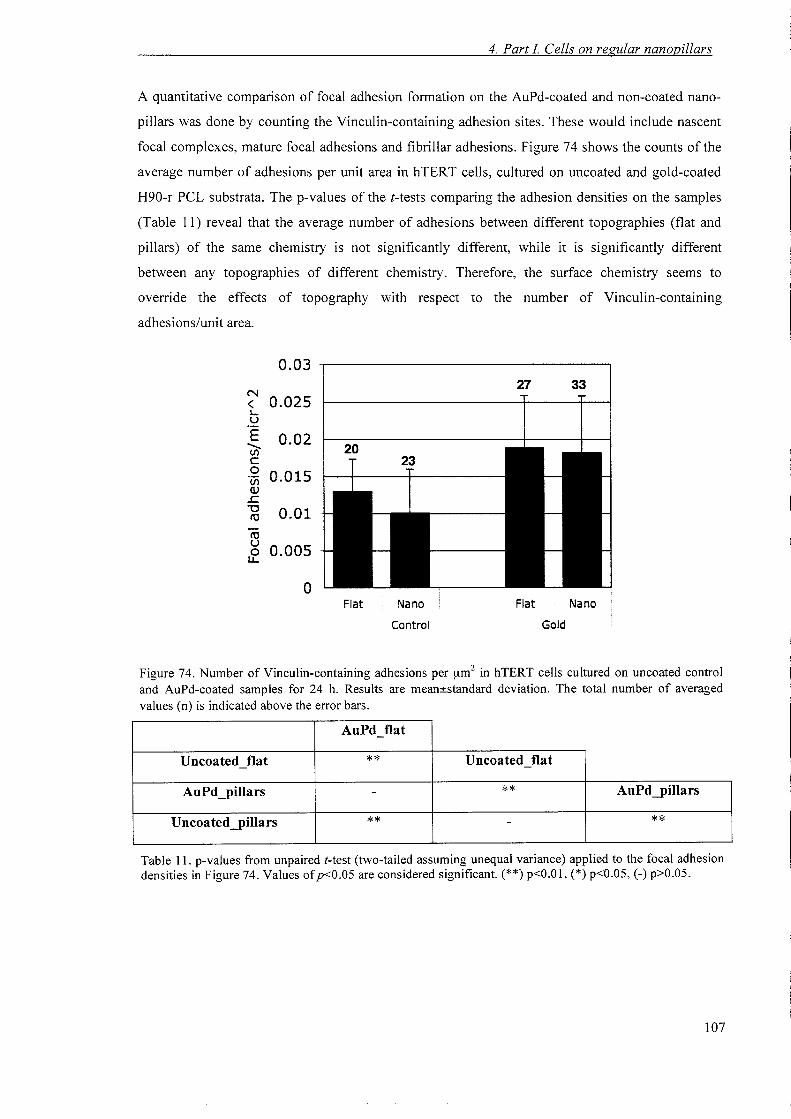
4. Part I Cells on regular nanopillars
A quantitative comparison of focal adhesion formation on the AuPd-coated and non-coated nano
pillars was done by counting the Vinculin-containing adhesion sites. These would include nascent
focal complexes, mature focal adhesions and fibrillar adhesions. Figure 74 shows the counts of the
average number of adhesions per unit area in hTERT cells, cultured on uncoated and gold-coated
H90-r peL substrata. The p-values of the t-tests comparing the adhesion densities on the samples
(Table 11) reveal that the average number of adhesions between different topographies (flat and
pillars) of the same chemistry is not significantly different, while it is significantly different
between any topographies of different chemistry. Therefore, the surface chemistry seems to
override the effects of topography with respect to the number of Vinculin-containing
adhesions/unit area.
0.03
N0.025<
~
uE 0.02'Ul 20c0 0.015"iii(])
.r:::."'0 0.01llJ
llJu
0.0050LL.
0Flat Nano
Control
27 33
T'I II II I
Flat Nano
Gold
Figure 74. Number of Vinculin-containing adhesions per f.lm2 in hTERT cells cultured on uncoated controland AuPd-coated samples for 24 h. Results are meanestandard deviation. The total number of averagedvalues (n) is indicated above the error bars.
AuPd flat
Uncoated flat ** Uncoated flat
AuPd_pillars - ** AuPd_pillars
Uncoated_pillars ** - **
Table 11. p-values from unpaired t-test (two-tailed assuming unequal variance) applied to the focal adhesiondensities in Figure 74. Values of p<O.05 are considered significant. (**) p<O.OI, (*) p<O.05, (-) p>O.05.
107
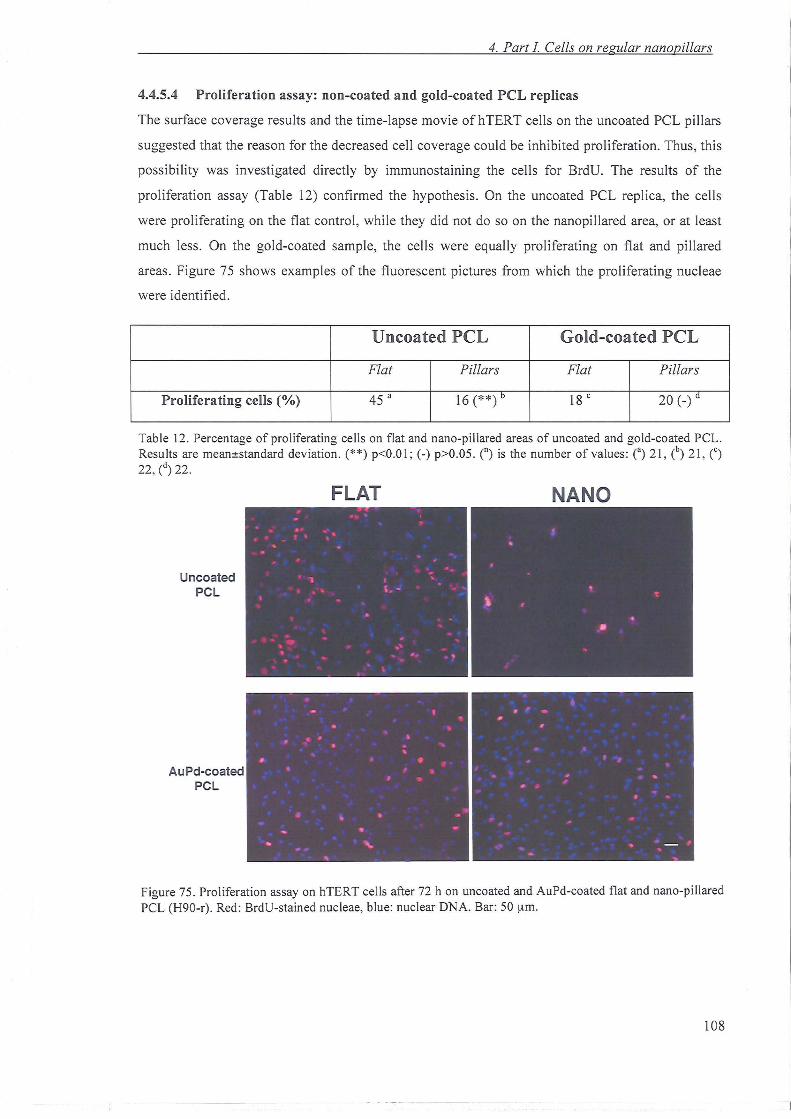
4. Part 1. Cells on regular nano pillars
4.4.5.4 Proliferation assay: non-coated and gold-coated peL replicas
The surface coverage results and the tim e-lap se movi e ofhTERT cells on the uncoated PCL pillars
suggested that the reason for the decreased cell coverage could be inhibited proliferation. Thu s, th is
possibility was investigated directly by immunostaining the cells for BrdU. The results of the
proliferation assay (Tabl e 12) confirmed the hypothesis. On the uncoated PCL replica, the cells
were pro liferating on the flat control, whil e they did not do so on the nanopillared area, or at least
much less. On the gold-coated sample, the cells were equally pro liferating on flat and pi llared
areas. Figure 75 shows examples of the fluorescent pictures from which the proliferating nucleae
were identified .
Uncoated PCL Gold-coate d PCL
Flat Pillars Flat Pillars
Proliferating cells (%) 45 a 16 (**) b 18 c 20 (_) d
Tabl e 12. Percentage of proliferating cells on flat and nano-pillared areas of uncoated and gold-coated PCL.Results are meanestandard deviation. (**) p<O.O I ; (-) p>0.05. (") is the numb er of va lues: (a) 2 1, (b) 21, n22 , (d) 22 .
FLAT NAND
UncoatedPCl
AuPd-coatedPCl
Figure 75. Proliferation assay on hTERT cells after 72 h on uncoated and AuPd- coated flat and nano-pillaredPCL (H90-r). Red: BrdU-stained nucleae, blue: nuclear DNA. Bar: 50 urn.
108
4. Part I Cells on regular nanopillars
4.5 Discussion. I.
4.5.1 Fabrication
By imaging the sample height after ca. 200 replicas, it was verified that the replication was reliable.
The dimensions of pillars on the replicas (d=170 nm, h=131 nm) seem very big compared to the
dimensions of the master (d=105 nm, h=116 nm). The discrepancy is explainable for the diameter:
in the case of the master die, the diameter was SEM-measured at the bottom of the pits to be 105
nm, while in the replicated pillars the diameter was measured at the base (170 nm): however, the
base diameter of the pillars is actually replicated from the top-opening of the master nano-pits,
which is ca. 200 nm. The discrepancy in height is more surprising, since the replicated pillars were
higher than the depth of the master pits; this could be due to a plastic elongation of the pillars
during demolding. Finally, two notes on the nomenclature used throughout this chapter: first of all,
the control surface is called "Flat", but actually it has a roughness (rms=5.3 nm) that is very visible
in Figure 40b and in Figure 43. Therefore, the term "flat" here is to be inteded as relative to the
more substantial roughness of the nanopattern. Secondly, even the term "regular" nano-pillars used
to describe the protrusions of sample H90-r is to be intended as relative, by comparison with the
more disordered protrusions that will be discussed in Part II of this chapter. However, regularity is
found in the centre-to-centre distance of the pillars.
4.5.2 Cell culture
4.5.2.1 Non-coated peL replicas
When cultured on the nano-pillars, time-lapse recording of the hTERT fibroblasts showed that the
cells on the pattern are smaller and very motile. This phenomenon had already been observed with
epitenon fibroblasts by J. Gallagher (Gallagher, 2003), who measured a higher cell motility on
nano-pits, and the formation of cell clusters. Gallagher claimed to have observed selective
migration of cells towards the planar surface; however, this was not apparent from my data. So
why were there significantly less cells on the nano-pillars at 96 h? Unless the cells selectively
migrated outside the pattern, the only other explanation that could justify their dramatically
reduced number at 96 h, is the lack of cell proliferation on the nano-pillars. Thus, both the high
motility of the cells on the pattern and the inhibited proliferation ensured that at 96 h the surface
coverage on the nanopattern was significantly lower than on the surrounding flat area. The
reduction of proliferation on the uncoated peL H90-r nano-pillars was definetely confirmed by
BrdU staining of the cells. However, the cells did initially adhere to the surface after they
sedimented from the suspension: for this reason, with respect to fibroblasts these surfaces should
be called "proliferation-inhibiting" rather than "non-adhesive".
A possible reason for reduced fibroblast proliferation can be found in their spreading area, which in
tum is linked to the formation of focal adhesions. Mature focal adhesions are a necessary
109
4. Part I Cells on regular nanopillars
requirement for the cells to proliferate (Meredith, 1993). Small focal complexes are thought to be
precursors of focal adhesions; if they are not allowed to "mature", the cells cannot spread fully,
hence they will be able to migrate but not to proliferate. Differences in spreading area ofhTERT on
randomly-arranged nano-columns had already been noticed by Dalby et al. (Dalby, 2004), who
also noticed a non-significant difference in initial cell number (which confirms the initial adhesion
of cells everywhere) and a significant difference in spreading area. Consistently with the latter
measurements, both Dalby et al. (Dalby, 2004) and J. Gallagher (Gallagher, 2003) reported that
fibroblastic cells were able to form mature focal contacts on the flat area, while on the nanopattern
they only formed small focal complexes.
Cell area analysis on these uncoated H90-r PCL samples confirmed that hTERT cells spread less
on the nanopillared surface than on the flat area. The average number of Vinculin-containing
adhesions per unit area was not significantly different between flat and pillars, however the main
determining factor in cell spreading is the adhesion size and types, rather than their density.
Assuming that the cells do not form adhesions with the lower surface between the nano-pillars, it
could be that the tops of the nano-pillars do not provide adequate adhesion sites for the cells to
form mature focal adhesions, hence to spread and proliferate. The top area of the pillars could be
too small, and their spacing too large, especially since they are not perfectly cylindrical. It has been
shown (Arnold, 2004, Maheshwari, 2000) that the clustering of RGD peptides on surfaces can
determine cell adhesion and motility. In particular, a separation >73 nm between Integrin
molecules resulted in limited cell attachment and spreading (Arnold, 2004), and it was suggested
that there exists a minimum threshold cluster size for cells to adhere (Maheshwari, 2000).
Therefore, further investigation is required to determine which type of adhesion is prevailing, and
if on the nano-pillars the cells form a smaller number of mature adhesions. This can be achieved by
analysing the area or length distribution of the Vinculin-containing adhesions, in order to
differentiate between focal complexes and focal contacts, while the fibrillar adhesions would be
revealed by immunostaining for Tensin.
The hypothesis that the cells adhere only to the top surface of the nanopattern seems likely, since
this has been previously observed by TEM imaging ofhTERT on nano-columns (Dalby, 2004). At
focal adhesions, the distance between the cell membrane and the substrate is 10-15 nm (Izzard,
1976), thus unless the ECM can bridge the gap between asperities (which probably happens when
the pattern is coated with Fibronectin, hence the shielding of any visible cell response to the pillars
in that case), on asperities of dimensions of 100s nm focal contacts can only be formed on top of
the pillars, or between nano-pits.
Therefore, the ultimate reason why the cells might not form mature focal contacts could be a
reduction of available surface area. This hypothesis could reconcile the discrepancies with the
110
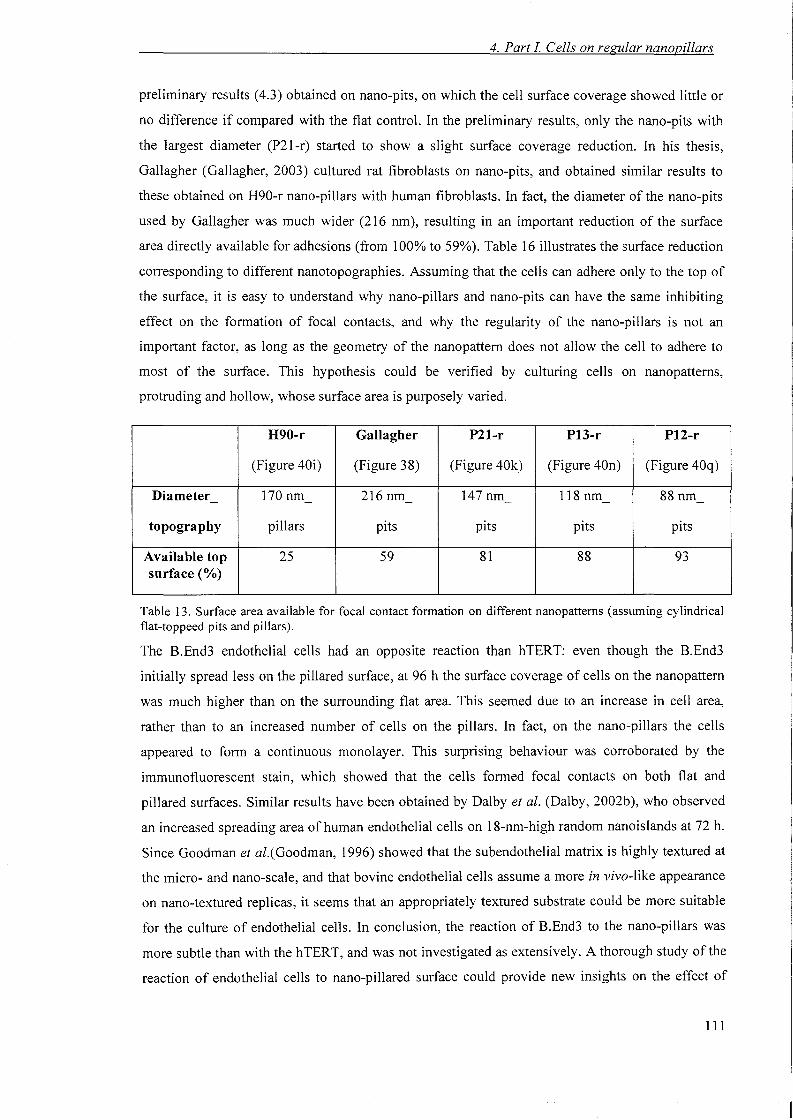
4. Part 1. Cells on regular nanopillars
preliminary results (4.3) obtained on nano-pits, on which the cell surface coverage showed little or
no difference if compared with the flat control. In the preliminary results, only the nano-pits with
the largest diameter (P21-r) started to show a slight surface coverage reduction. In his thesis,
Gallagher (Gallagher, 2003) cultured rat fibroblasts on nano-pits, and obtained similar results to
these obtained on H90-r nano-pillars with human fibroblasts. In fact, the diameter of the nano-pits
used by Gallagher was much wider (216 nm), resulting in an important reduction of the surface
area directly available for adhesions (from 100% to 59%). Table 16 illustrates the surface reduction
corresponding to different nanotopographies. Assuming that the cells can adhere only to the top of
the surface, it is easy to understand why nano-pillars and nano-pits can have the same inhibiting
effect on the formation of focal contacts, and why the regularity of the nano-pillars is not an
important factor, as long as the geometry of the nanopattem does not allow the cell to adhere to
most of the surface. This hypothesis could be verified by culturing cells on nanopattems,
protruding and hollow, whose surface area is purposely varied.
H90-r Gallagher P21-r P13-r P12-r
(Figure 40i) (Figure 38) (Figure 40k) (Figure 40n) (Figure 40q)
Diameter 170 nm- 216 nm 147nm- 118 nm- 88 nm-
topography pillars pits pits pits pits
Available top 25 59 81 88 93surface (%)
Table 13. Surface area available for focal contact formation on different nanopattems (assuming cylindricalflat-toppeed pits and pillars).
The REnd3 endothelial cells had an opposite reaction than hTERT: even though the REnd3
initially spread less on the pillared surface, at 96 h the surface coverage of cells on the nanopattem
was much higher than on the surrounding flat area. This seemed due to an increase in cell area,
rather than to an increased number of cells on the pillars. In fact, on the nano-pillars the cells
appeared to form a continuous monolayer. This surprising behaviour was corroborated by the
immunofluorescent stain, which showed that the cells formed focal contacts on both flat and
pillared surfaces. Similar results have been obtained by Dalby et al. (Dalby, 2002b), who observed
an increased spreading area of human endothelial cells on 18-nm-high random nanoislands at 72 h.
Since Goodman et al.(Goodman, 1996) showed that the subendothelial matrix is highly textured at
the micro- and nano-scale, and that bovine endothelial cells assume a more in vivo-like appearance
on nano-textured replicas, it seems that an appropriately textured substrate could be more suitable
for the culture of endothelial cells. In conclusion, the reaction of REnd3 to the nano-pillars was
more subtle than with the hTERT, and was not investigated as extensively. A thorough study of the
reaction of endothelial cells to nano-pillared surface could provide new insights on the effect of
III
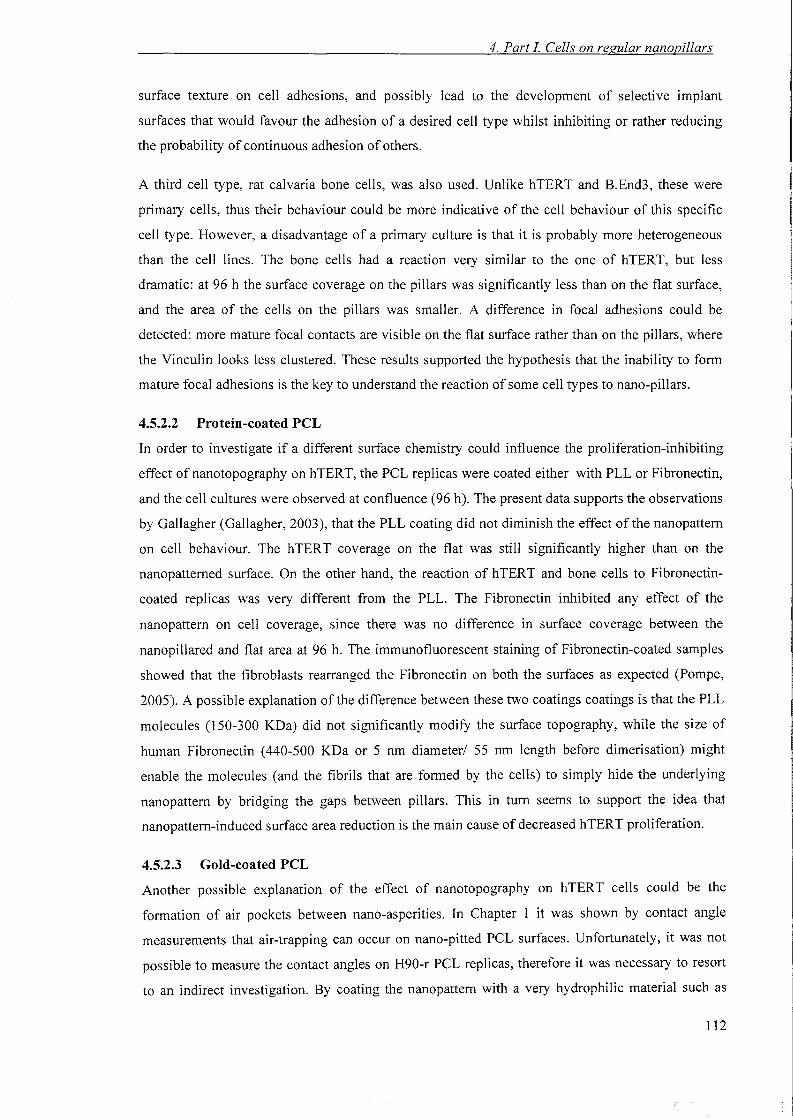
4. Part I Cells on regular nanopillars
surface texture on cell adhesions, and possibly lead to the development of selective implant
surfaces that would favour the adhesion of a desired cell type whilst inhibiting or rather reducing
the probability of continuous adhesion of others.
A third cell type, rat calvaria bone cells, was also used. Unlike hTERT and REnd3, these were
primary cells, thus their behaviour could be more indicative of the cell behaviour of this specific
cell type. However, a disadvantage of a primary culture is that it is probably more heterogeneous
than the cell lines. The bone cells had a reaction very similar to the one of hTERT, but less
dramatic: at 96 h the surface coverage on the pillars was significantly less than on the flat surface,
and the area of the cells on the pillars was smaller. A difference in focal adhesions could be
detected: more mature focal contacts are visible on the flat surface rather than on the pillars, where
the Vinculin looks less clustered. These results supported the hypothesis that the inability to form
mature focal adhesions is the key to understand the reaction of some cell types to nano-pillars.
4.5.2.2 Protein-coated PCL
In order to investigate if a different surface chemistry could influence the proliferation-inhibiting
effect ofnanotopography on hTERT, the PCL replicas were coated either with PLL or Fibronectin,
and the cell cultures were observed at confluence (96 h). The present data supports the observations
by Gallagher (Gallagher, 2003), that the PLL coating did not diminish the effect of the nanopattem
on cell behaviour. The hTERT coverage on the flat was still significantly higher than on the
nanopattemed surface. On the other hand, the reaction of hTERT and bone cells to Fibronectin
coated replicas was very different from the PLL. The Fibronectin inhibited any effect of the
nanopattem on cell coverage, since there was no difference in surface coverage between the
nanopillared and flat area at 96 h. The immunofluorescent staining of Fibronectin-coated samples
showed that the fibroblasts rearranged the Fibronectin on both the surfaces as expected (Pompe,
2005). A possible explanation ofthe difference between these two coatings coatings is that the PLL
molecules (I50-300 KDa) did not significantly modify the surface topography, while the size of
human Fibronectin (440-500 KDa or 5 nm diameter/55 nm length before dimerisation) might
enable the molecules (and the fibrils that are formed by the cells) to simply hide the underlying
nanopattem by bridging the gaps between pillars. This in tum seems to support the idea that
nanopattem-induced surface area reduction is the main cause of decreased hTERT proliferation.
4.5.2.3 Gold-coated PCL
Another possible explanation of the effect of nanotopography on hTERT cells could be the
formation of air pockets between nano-asperities. In Chapter 1 it was shown by contact angle
measurements that air-trapping can occur on nano-pitted PCL surfaces. Unfortunately, it was not
possible to measure the contact angles on H90-r PCL replicas, therefore it was necessary to resort
to an indirect investigation. By coating the nanopattem with a very hydrophilic material such as
112
4. Part I Cells on regular nanopillars
gold (8",30°- 40°) (Churaev, 1995), it can be assumed that no air trapping could possibly occur;
simple visual inspection of the substrates indicated a completely wettable surface (even though the
actual contact angles were not measured).
Table 14 and Table 15 summarize the differences that were found between the hTERT cells on
uncoated and gold-coated PCL at 96 h. Overall, the gold coating has the effect of hampering the
differences induced by the nanotopography. When the PCL nano-pillars were gold-coated, their
proliferation-inhibiting effect vanished, although the surface coverage difference was still
significant. On the other hand, the density of focal adhesions was irrespective of the topography,
while it was significantly different on the two chemistries (p-values in Table 11). However, while
the cells are generally expected to attach more efficiently on hydrophilic surfaces such as gold
(Vogler, 1998), the present results show that after 5 days the cells were more confluent on the
hydrophobic PCL. This could be due to a different ECM secretion of the cells on the two different
chemistries, following initial attachment.
These results do not disprove the suggestion that the proliferation of hTERT could be inhibited by
the presence of air pockets between nano-pillars. This would justify the strong surface coverage
reduction on uncoated PCL, and it would imply that on gold nano-pillars the cells can proliferate
because there is no air. If this was the case, the fact that the surface coverage is still significantly
different on gold-coated flat and nanopillared surface could be explained with an accelerated speed
of migration on the pattern. This could be due to a modified adhesiveness of the substrate (Palacek,
1997) as a result of surface area reduction, and would result in an increased probability of finding
the cells outside the nanopatterned area. Finally, it should be noted that the initial results of cell
coverage were the same on ethanol-sterilised and UV-sterilised PCL replicas, and that both
procedures would counteract the occurrence of air-trapping. In summary, this interpretation
advocates a synergistic effect due to air-trapping and surface area reduction.
113
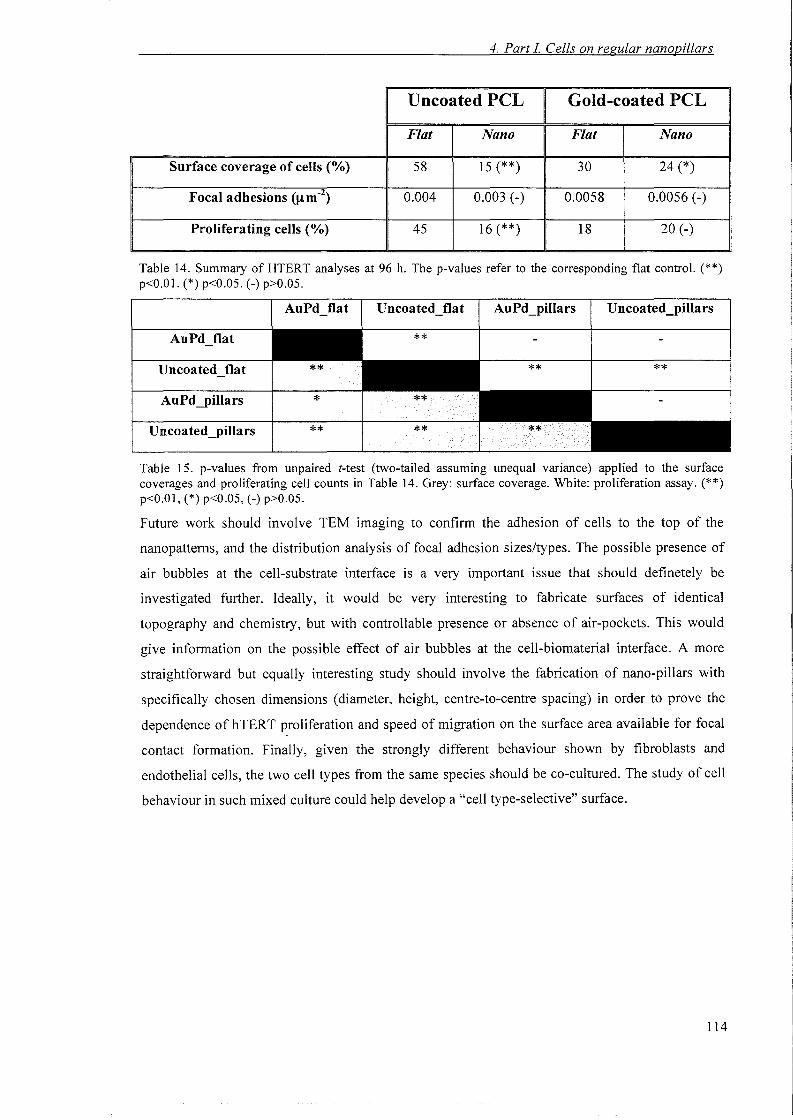
4. Part I Cells on regular nanopillars
Uncoated PCL Gold-coated PCL
Flat Nan 0 Flat Nano
Surface coverage of cells (%) 58 15 (**) 30 24 (*)
Focal adhesions (um") 0.004 0.003 (-) 0.0058 0.0056 (-)
Proliferating cells (%) 45 16 (**) 18 20 (-)
Table 14. Summary of HTERT analyses at 96 h. The p-values refer to the corresponding flat control. (**)p<O.Ol. (*) p<O.05. (-) p>O.05.
****
**
**
***
AuPd flat Uncoated flat Au Pd_pillars Uncoated_pillars
AuPd flat
AuPd_pillars
Table 15. p-values from unpaired t-test (two-tailed assuming unequal variance) applied to the surfacecoverages and proliferating cell counts in Table 14. Grey: surface coverage. White: proliferation assay. (**)p<O.OI, (*) p<O.05, (-) p>O.05.
Future work should involve TEM imaging to confirm the adhesion of cells to the top of the
nanopattems, and the distribution analysis of focal adhesion sizes/types. The possible presence of
air bubbles at the cell-substrate interface is a very important issue that should definetely be
investigated further. Ideally, it would be very interesting to fabricate surfaces of identical
topography and chemistry, but with controllable presence or absence of air-pockets. This would
give information on the possible effect of air bubbles at the cell-biomaterial interface. A more
straightforward but equally interesting study should involve the fabrication of nano-pillars with
specifically chosen dimensions (diameter, height, centre-to-centre spacing) in order to prove the
dependence of hTERT proliferation and speed of migration on the surface area available for focal
contact formation. Finally, given the strongly different behaviour shown by fibroblasts and
endothelial cells, the two cell types from the same species should be co-cultured. The study of cell
behaviour in such mixed culture could help develop a "cell type-selective" surface.
114
4. Part II. Cells on irregular nanopillars
Part II. Cells on arrays of irregular nano-pillars:
preliminary comparison with regular pillars.
This section contains a set of preliminary results of cell culture on arrays of irregular nano-pillars
of varying dimensions. It is shown that a systematic investigation ofthe effect of pillar size on cell
behaviour is a necessity for the future.
4.6 Materials and Methods. II.
4.6.1 Fabrication and preparation of the replicas
Arrays of nano-pits of decreasing diameters (5X5 arrays of 2 mrrr' patterned squares) were
fabricated in silicon wafers by the same procedure described in 2.2.1, page 23. All the masters were
fabricated by Dr K. Seunarine. The diameters of the master nano-pits were measured with ImageJ
(Rasband, 1997-2005) from SEM images. The silicon masters were not hydrophobised. Poly-£
caprolactone (PCL) sheets were embossed on these substrata by melting the polymer on the pattern
at 85°C and then pressing a glass-slide on it ("thumb-embossing", see 4.2.1.1). After embossing
and prior to cell seeding, the PCL replicas were sterilised by immersing them in 70% ethanol
(BOH). Then they were rinsed in copious amounts of RO water and finally stored in Hepes Saline
at 4°C. The dimensions of the replicated nano-pillars were not measured.
4.6.2 Cell culture
hTERT and REnd3 cells were cultured as detailed in 4.2.2. Another type of fibroblastic cells was
also used: Baby Syrian Hamster Kidney cells (BHK 21 CL 13 (IZS), ECACC); these cells were
passaged as described in 4.2.2. The growth medium was OMEM for hTERT and B.End3, and ECT
for BHK21.
4.6.2.1 Cell seeding, fixation and staining
For seeding on the PCL replicas, the cells were resuspended in growth medium at a density of 1
1.5x10⁴ cells/ml, and 4 ml of suspension were placed on each sample, yielding a total of 4-6x10⁴
cells per sample. The cells were fixed at 3 h, 24 hand 72 h. Each time point was repeated 3 times.
To fix the cells, the samples were rinsed with PBS at 3rC, incubated for 15 min in 4%
formaldehyde/PBS at 3rC, and stored in PBS. The cells were then stained with Coomassie Blue
for 15 min, and finally rinsed in PBS.
4.6.2.2 Imaging
Images of the whole replicas after Coomassie staining were acquired with a Nikon 01 camera
(objective AF Nikkor, 35-70 mm). The cells were also observed under a Zeiss Axiovert 25 at X5
115
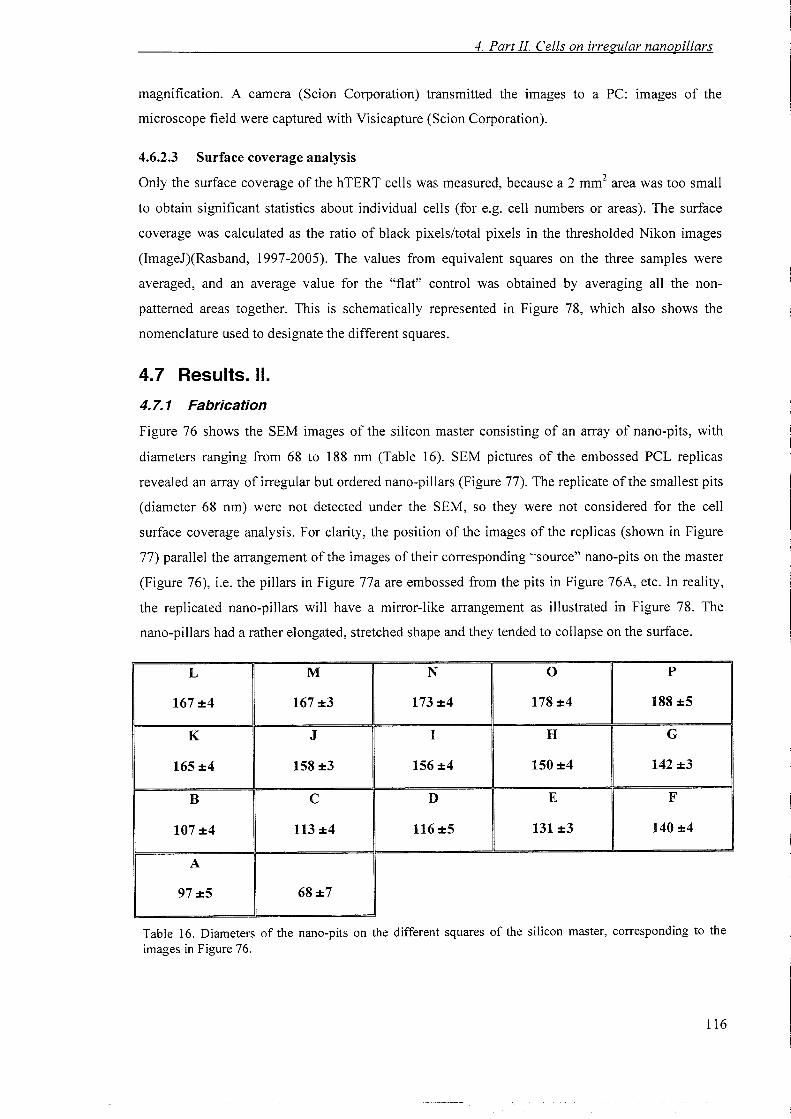
4. Part II. Cells on irregular nanopillars
magnification. A camera (Scion Corporation) transmitted the images to a PC: images of the
microscope field were captured with Visicapture (Scion Corporation).
4.6.2.3 Surface coverage analysis?
Only the surface coverage of the hTERT cells was measured, because a 2 mm: area was too small
to obtain significant statistics about individual cells (for e.g. cell numbers or areas). The surface
coverage was calculated as the ratio of black pixels/total pixels in the thresholded Nikon images
(lmageJ)(Rasband, 1997-2005). The values from equivalent squares on the three samples were
averaged, and an average value for the "flat" control was obtained by averaging all the non
patterned areas together. This is schematically represented in Figure 78, which also shows the
nomenclature used to designate the different squares.
4.7 Results. II.
4.7.1 Fabrication
Figure 76 shows the SEM images of the silicon master consisting of an array of nano-pits, with
diameters ranging from 68 to 188 nm (Table 16). SEM pictures of the embossed PCL replicas
revealed an array of irregular but ordered nano-pillars (Figure 77). The replicate of the smallest pits
(diameter 68 nm) were not detected under the SEM, so they were not considered for the cell
surface coverage analysis. For clarity, the position of the images of the replicas (shown in Figure
77) parallel the arrangement of the images of their corresponding "source" nano-pits on the master
(Figure 76), i.e. the pillars in Figure 77a are embossed from the pits in Figure 76A, etc. In reality,
the replicated nano-pillars will have a mirror-like arrangement as illustrated in Figure 78. The
nano-pillars had a rather elongated, stretched shape and they tended to collapse on the surface.
L M N 0 P
167±4 167 ±3 173 ±4 178±4 188±5
K J I H G
165 ±4 158±3 156±4 150±4 142 ±3
B C D E F
107 ±4 113 ±4 116±5 131 ±3 140±4
A
97 ±5 68±7
Table 16. Diameters of the nano-pits on the different squares of the silicon master, corresponding to theimages in Figure 76.
116
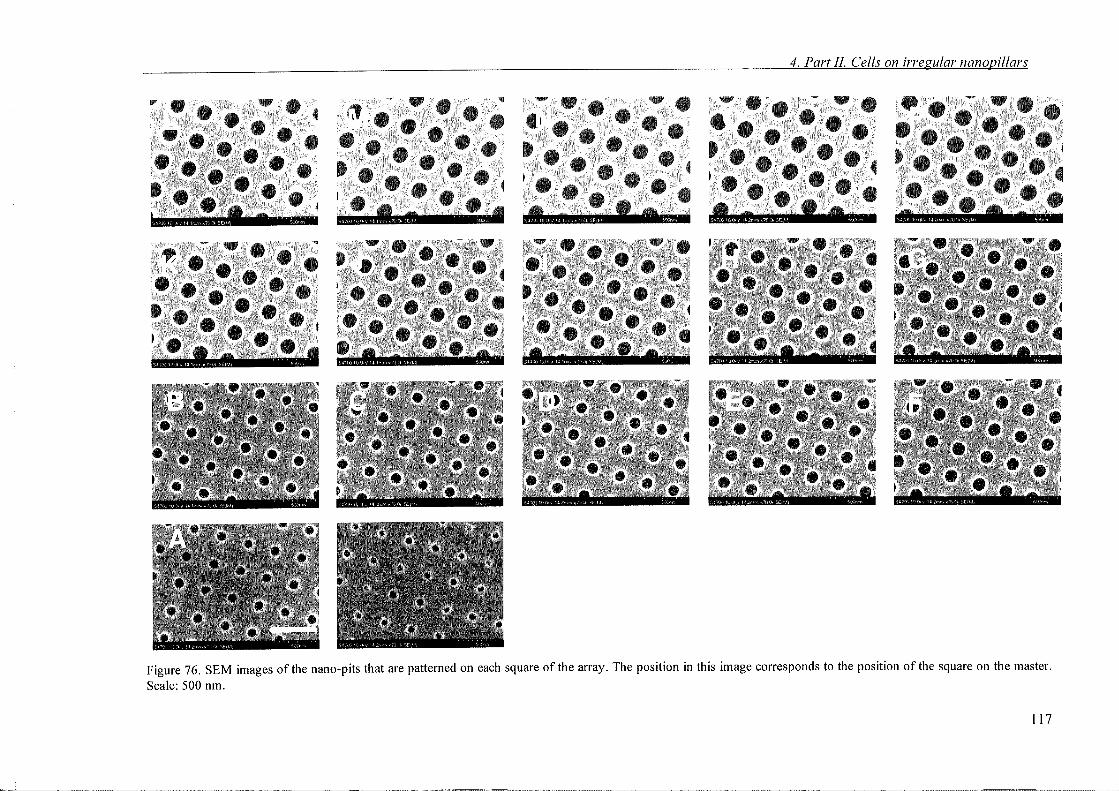
4. Part II. Cells on irregular nanooillars
Figure 76. SEM images of the nano-pits that are patterned on each square of the array. The position in this image corresponds to the position of the square on the master.
Scale: 500 nm.
117
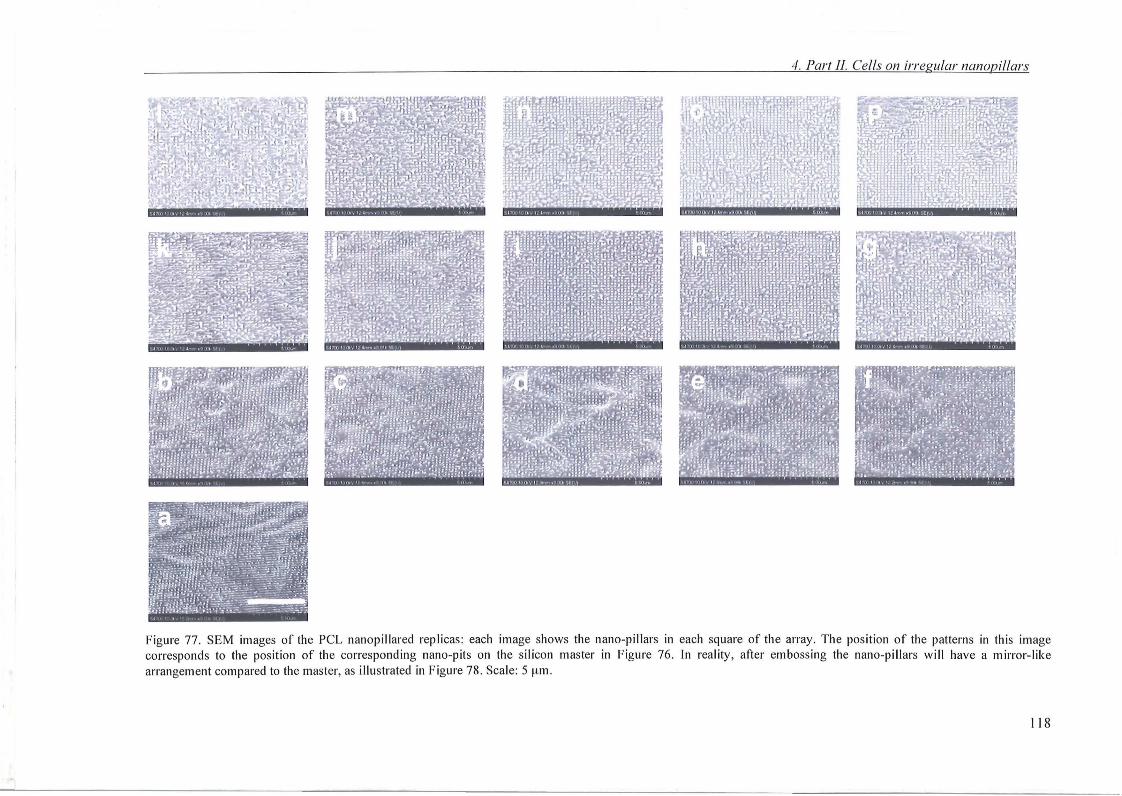
4. Par' ll. Cells on uiszutar nanopillars
.. 41\1\1 'H . ', I} .". ·. to ~·.
i11~1~j~;~:;~:[fr[ijlr!:J~@W!'J • -;"' ~l.'1 ....~.. . r . "~ .. ~ .. . :::.,...
~ . ...... ' ~' 'f' ~ ::-i" ·.-J1~1:: ' ''''' r.·.; . ~ .~~ . ~~ , t
1~~1~~1~~~~ 4~.1 b U . , . ~ 0 • • ' "to., ' fU ...
Figure 77. SEM images of the PCl, nanopillared replicas: each image shows the nano-pillars in each square of the array. The position of the patterns in this imagecorresponds to the position of the corresponding nano-pits on the silicon master in Figure 76. In reality, after embossing the nann-pillars will have a mirror-likearrangement compared to the master, as illustrated in Figure 78. Scale: 5 ~1I11.
11 8
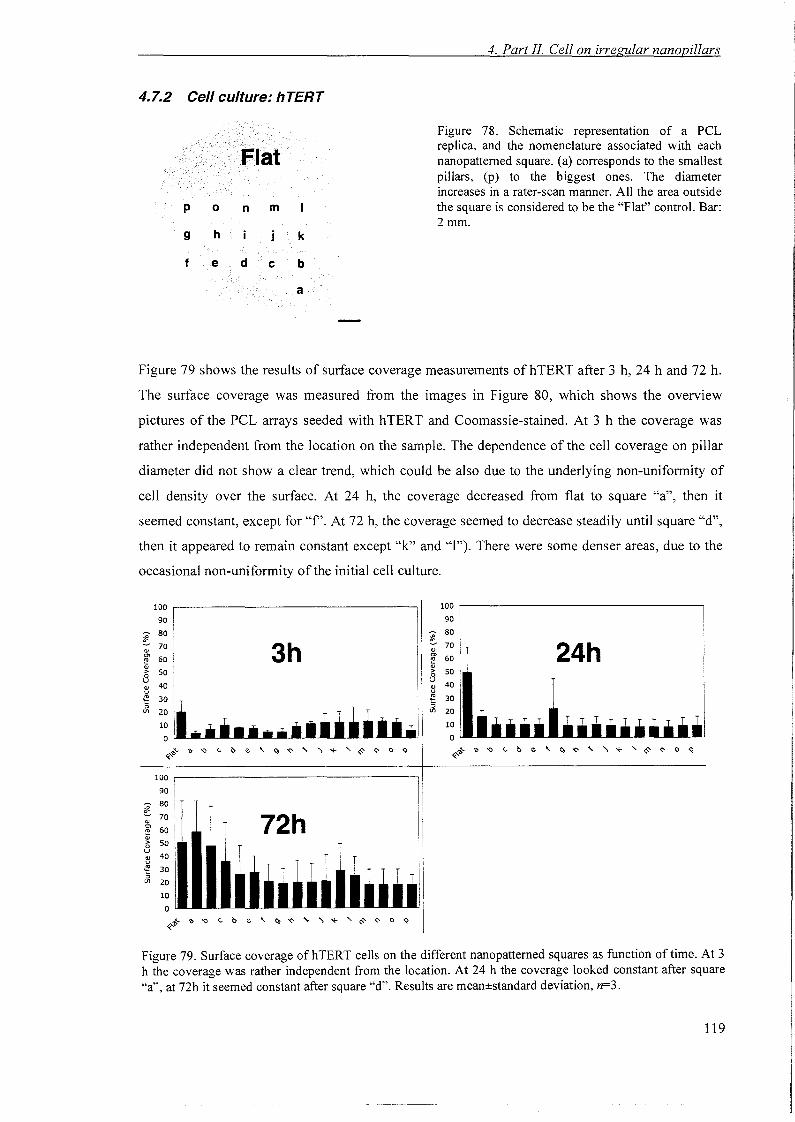
4. Part II. Cell on irregular nanopillars
4.7.2 Cell culture: hTERT
p
9
o
h
n m
k
Figure 78. Schematic representation of a peLreplica, and the nomenclature associated with eachnanopatterned square. (a) corresponds to the smallestpillars, (p) to the biggest ones. The diameterincreases in a rater-scan manner. All the area outsidethe square is considered to be the "Flat" control. Bar:2mm.
f e d c b
a
Figure 79 shows the results of surface coverage measurements of hTERT after 3 h, 24 hand 72 h.
The surface coverage was measured from the images in Figure 80, which shows the overview
pictures of the PCL arrays seeded with hTERT and Coomassie-stained. At 3 h the coverage was
rather independent from the location on the sample. The dependence of the cell coverage on pillar
diameter did not show a clear trend, which could be also due to the underlying non-uniformity of
cell density over the surface. At 24 h, the coverage decreased from flat to square "a", then it
seemed constant, except for "f". At 72 h, the coverage seemed to decrease steadily until square "d",
then it appeared to remain constant except "k" and "1"). There were some denser areas, due to the
occasional non-uniformity of the initial cell culture.
24h
100
90
l 80
"70
'" 60~
"> so0u
40"u~ 30:::>
'" 20
10
0
v.'~
100 I
t :~ I"
70 3h'":~ I
e">0u~
40
~30 I:::>
'" 20
10
0
<t..'~'0 '0 c C '" "- 0, '<' "- " 'l- .... ~ <- 0 <i
100 I90
80 't
70 I 72h"'" 60 Ie"> so I0u
" 40 ,u
~ 30:::>
'" 20
10
0
v.'~'0 '0 c C '" "- 0, '<' "-
" 'l-.... ~ c 0 <i
Figure 79. Surface coverage ofhTERT cells on the different nanopatterned squares as function of time. At 3h the coverage was rather independent from the location. At 24 h the coverage looked constant after square"a", at 72h it seemed constant after square "d", Results are meanestandard deviation, n=3.
119
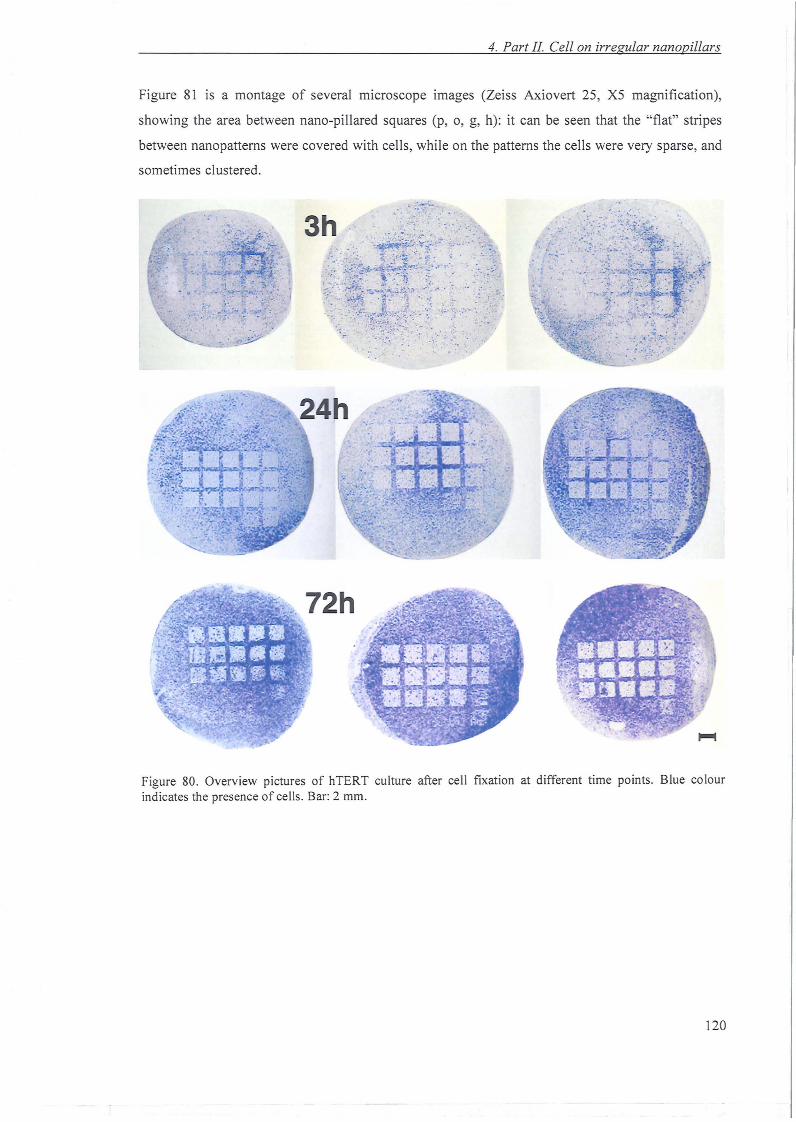
4. Part II. Cell on irregular nanopillars
Figure 81 is a montage of several microscope images (Zeiss Axiovert 25, X5 magnification),
showing the area between nano-pillared squares (p, 0, g, h): it can be seen that the "flat" stripes
between nanopatterns were covered with cells, while on the patterns the cells were very sparse, and
sometimes clustered.
Figure 80. Overview pictures of hTERT culture after cell fixation at different time points. Blue colourindicates the presence of celIs. Bar: 2 mm.
120
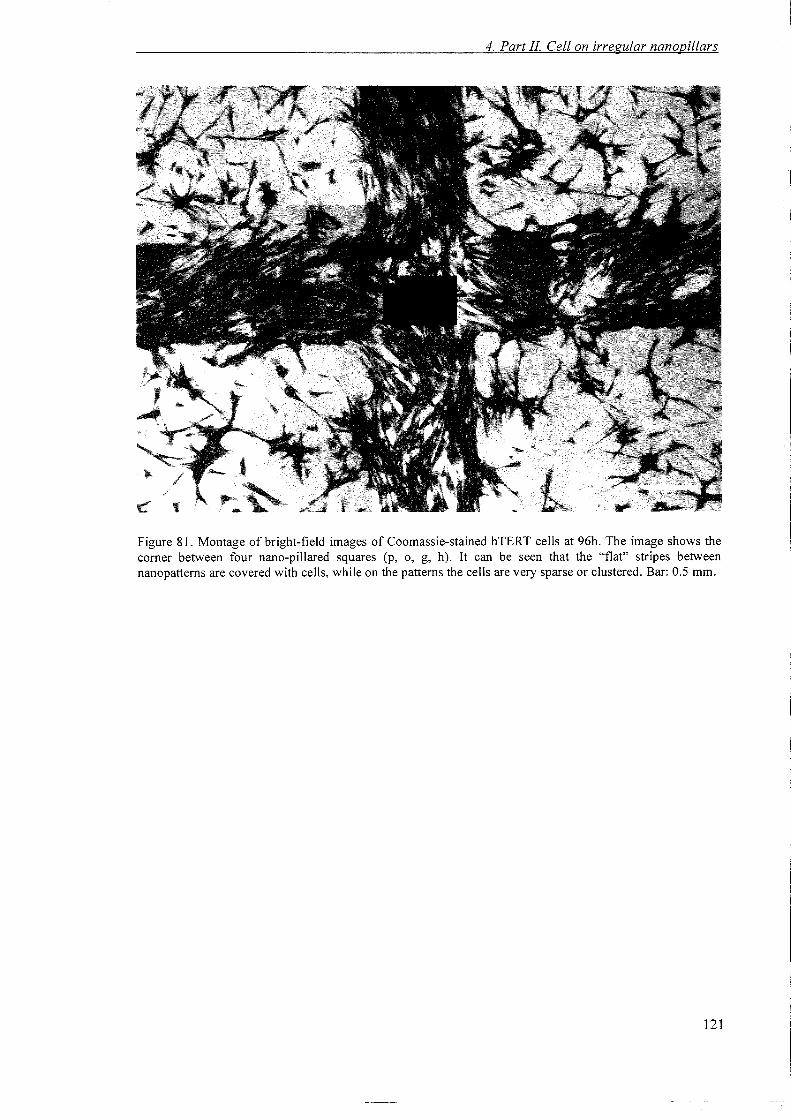
4. Part II Cell on irregular nanopillars
Figure 81. Montage of bright-field images of Coomassie-stained hTERT cells at 96h. The image shows thecorner between four nano-pillared squares (p, 0, g, h). It can be seen that the "flat" stripes betweennanopatterns are covered with cells, while on the patterns the cells are very sparse or clustered. Bar: 0.5 mm.
121
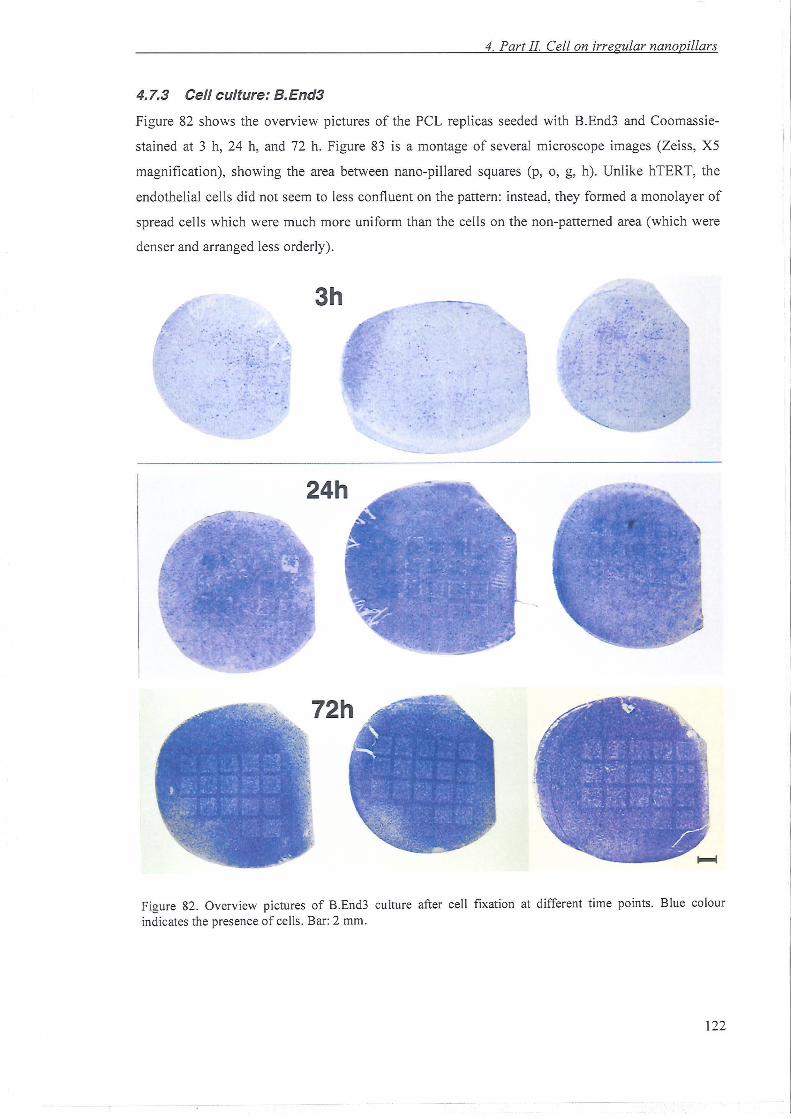
24h
4. Part II. Cell on irregular nanopillars
4.7.3 Cell culture: B.End3
Figure 82 show s the overview pictures of the PCL replicas seeded with B.End3 and Coomassie
stained at 3 h, 24 h, and 72 h. Figure 83 is a montage of several microscope images (Zeiss, X5
magn ification), showing the area between nano-pillared squares (p, 0, g, h). Unlik e hTERT, the
endothelial cells did not seem to less confluent on the pattern: instead, they formed a monolayer of
spread cells which were much more uniform than the cells on the non-patterned area (whi ch were
denser and arranged less orderly) .
3h: ~ ..
Figure 82. Overvi ew pictures of B.End3 culture after cell fixation at different time points. Blue colourindicates the presence of cells. Bar: 2 mm.
122
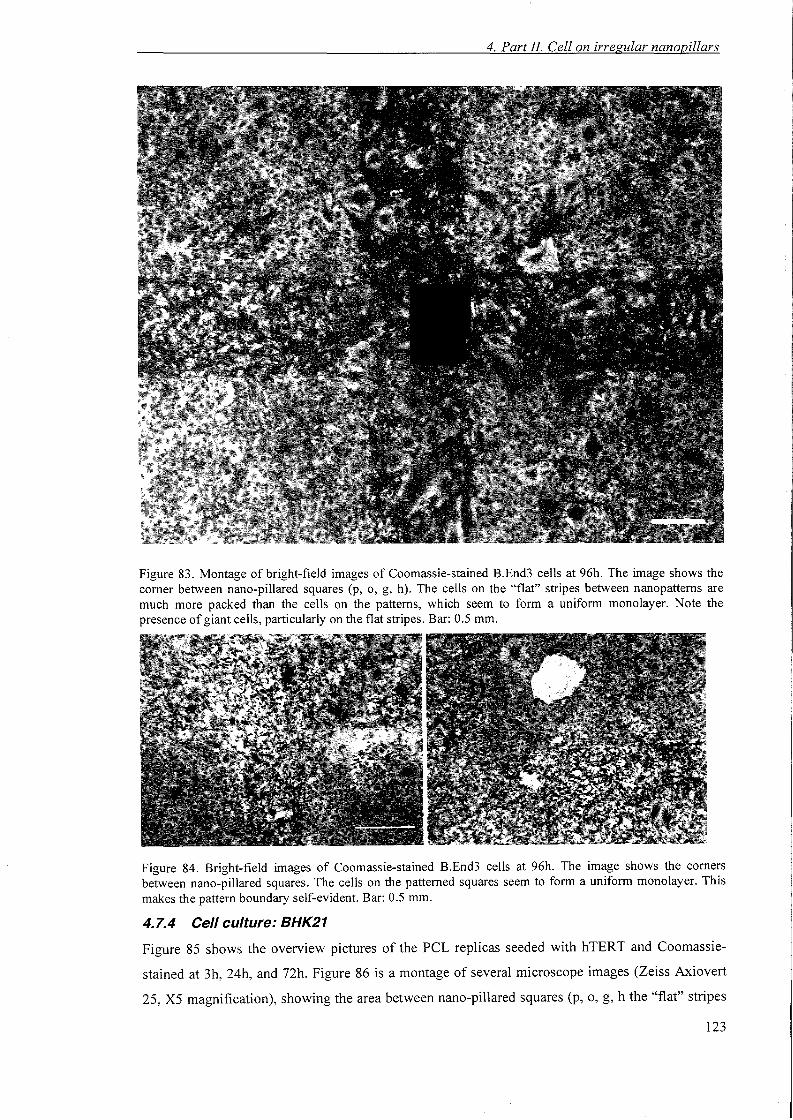
4. Part 11. Cell on irregular nanopillars
Figure 83. Montage of bright-field images of Coomassie-stained REnd3 cells at 96h. The image shows thecorner between nano-pillared squares (p, 0, g, h). The cells on the "flat" stripes between nanopatterns aremuch more packed than the cells on the patterns, which seem to form a uniform monolayer. Note thepresence of giant cells, particularly on the flat stripes. Bar: 0.5 mm.
Figure 84. Bright-field images of Coomassie-stained REnd3 cells at 96h. The image shows the cornersbetween nano-pillared squares. The cells on the patterned squares seem to form a uniform monolayer. Thismakes the pattern boundary self-evident. Bar: 0.5 mm.
4.7.4 Cell culture: BHK21
Figure 85 shows the overview pictures of the PCL replicas seeded with hTERT and Coomassie
stained at 3h, 24h, and 72h. Figure 86 is a montage of several microscope images (Zeiss Axiovert
25, X5 magnification), showing the area between nano-pillared squares (p, 0, g, h the "flat" stripes
123
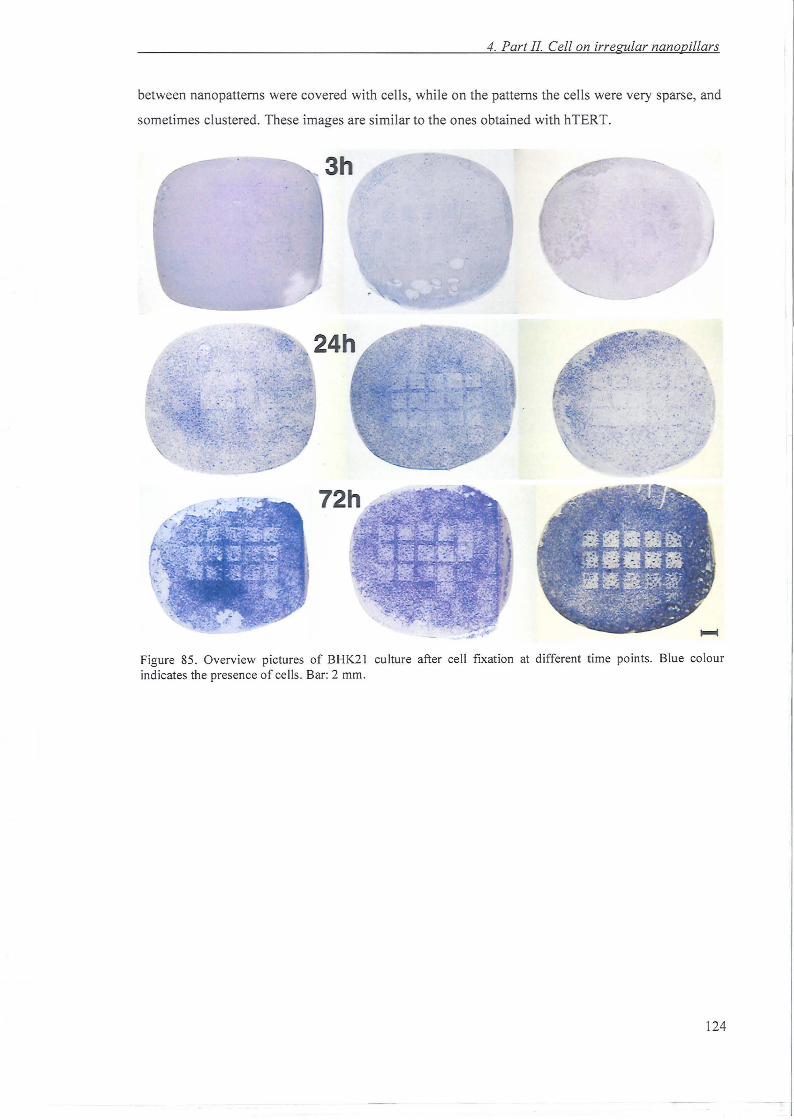
4. Part II. Cell on irregular nanopillars
between nanopatterns were covered with cells, while on the patterns the cells were very sparse, and
sometimes cluste red. These images are similar to the ones obta ined with hTERT.
0- ." -
3h
Figure 85. Overview pictures of BHK2 l culture after cell fixation at different time points. Blue colourindicates the presence of cells. Bar: 2 mm.
124
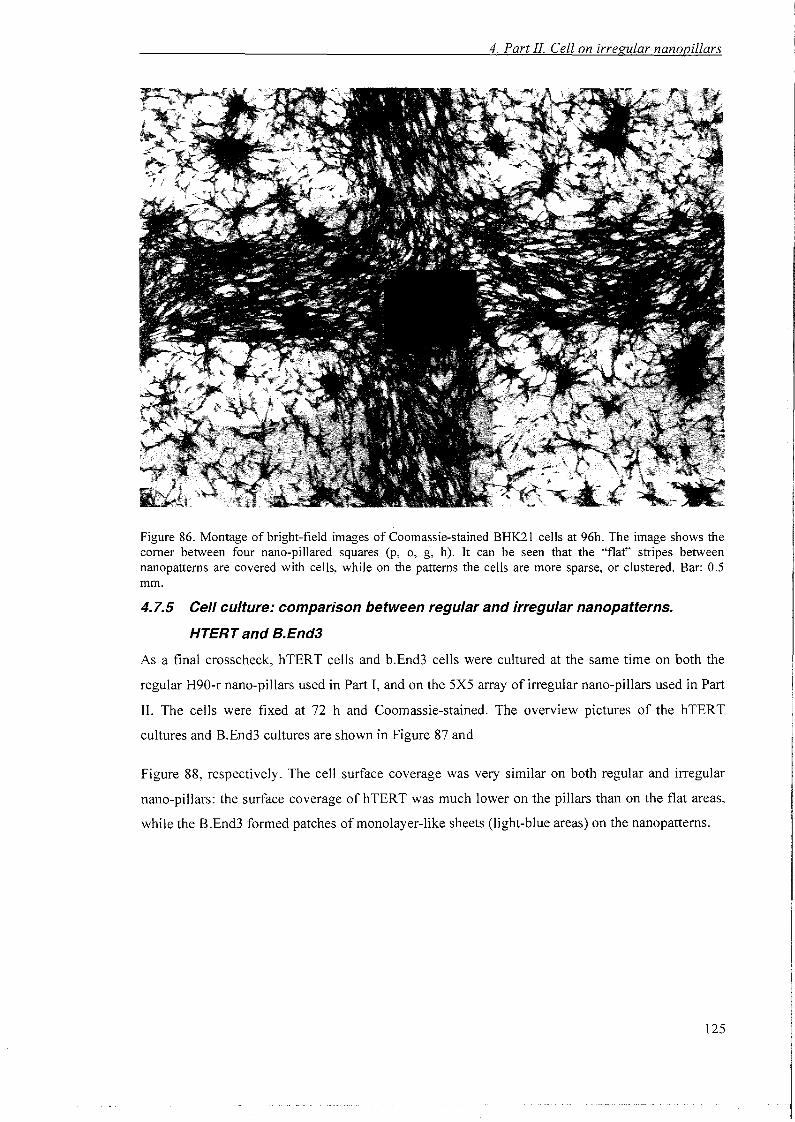
4. Part II Cell on irregular nanopillars
Figure 86. Montage of bright-field images of Coomassie-stained BHK21 cells at 96h. The image shows thecorner between four nano-pillared squares (p, 0, g, h). It can be seen that the "flat" stripes betweennanopatterns are covered with cells, while on the patterns the cells are more sparse, or clustered. Bar: 0.5mm.
4.7.5 Cell culture: comparison between regular and irregular nanopatterns.
HTERT and B.End3
As a final crosscheck, hTERT cells and b.End3 cells were cultured at the same time on both the
regular H90-r nano-pillars used in Part I, and on the 5X5 array of irregular nano-pillars used in Part
II. The cells were fixed at 72 hand Coomassie-stained. The overview pictures of the hTERT
cultures and B.End3 cultures are shown in Figure 87 and
Figure 88, respectively. The cell surface coverage was very similar on both regular and irregular
nano-pillars: the surface coverage ofhTERT was much lower on the pillars than on the flat areas,
while the B.End3 formed patches of monolayer-like sheets (light-blue areas) on the nanopattems.
125
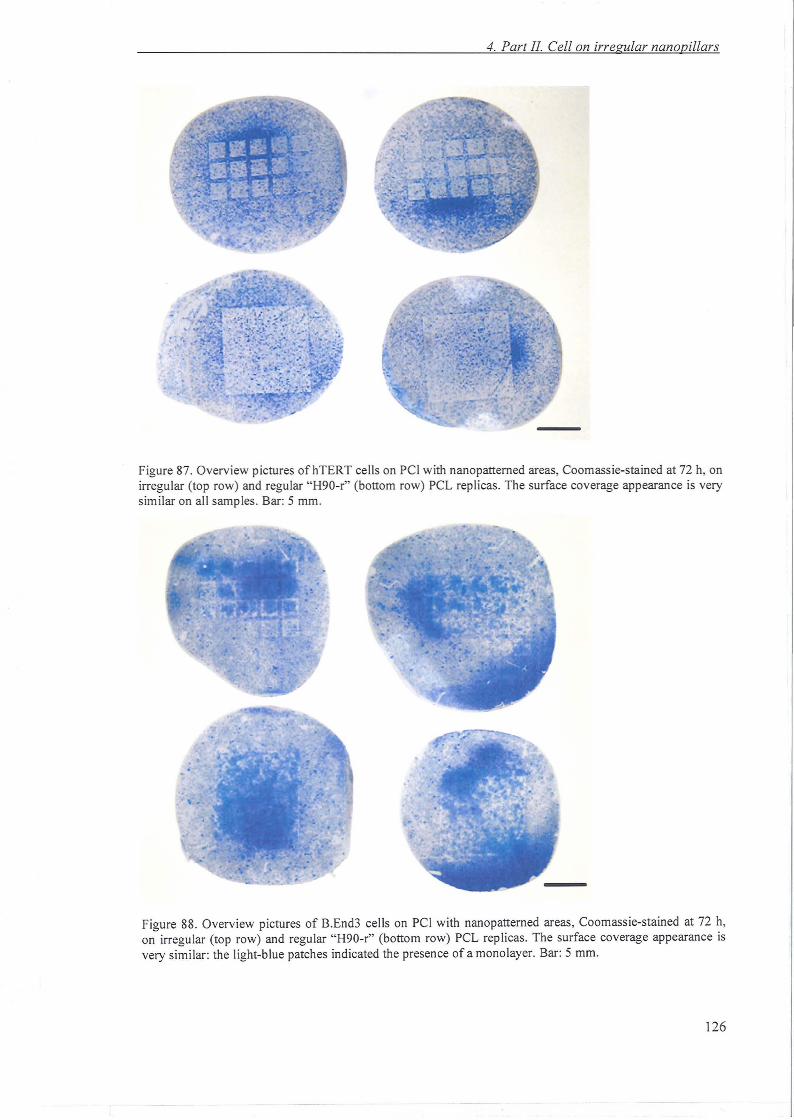
4. Part II. Cell on irregular nanopillars
. '.
Figure 87. Overview pictures ofhTERT cells on PCI with nanopattemed areas, Coomassie -stained at 72 h, onirregular (top row) and regular "H90-r" (bottom row) PCL replicas. The surface coverage appearance is verysimilar on all samples . Bar: 5 mm.
Figure 88. Overview pictures of B.End3 cells on PCI with nanopattemed areas, Coornassie-stained at 72 h,on irregular (top row) and regular "H90-r" (bottom row) PCL replicas. The surface coverage appearance isvery similar: the light-blue patches indicated the presence of a monolayer. Bar: 5 mm.
126
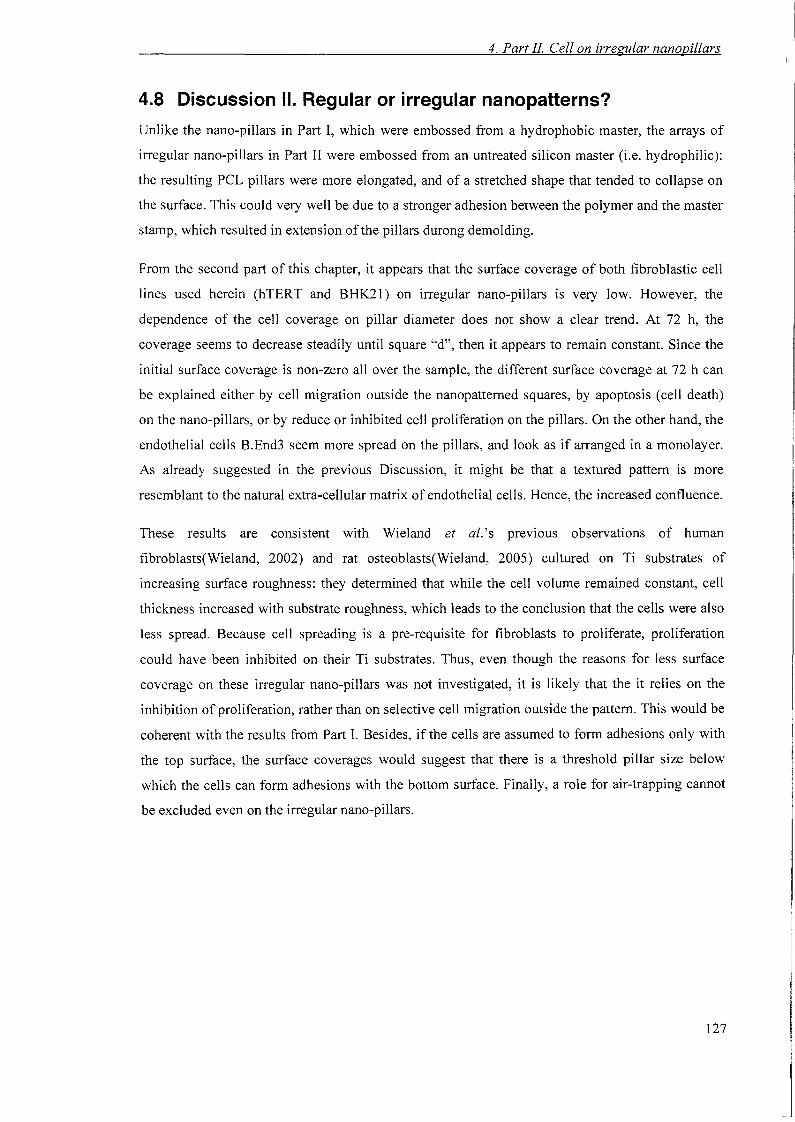
4. Part 11. Cell on irregular nanopillars
4.8 Discussion II. Regular or irregular nanopatterns?
Unlike the nano-pillars in Part I, which were embossed from a hydrophobic master, the arrays of
irregular nano-pillars in Part II were embossed from an untreated silicon master (i.e. hydrophilic):
the resulting peL pillars were more elongated, and of a stretched shape that tended to collapse on
the surface. This could very well be due to a stronger adhesion between the polymer and the master
stamp, which resulted in extension of the pillars durong demolding.
From the second part of this chapter, it appears that the surface coverage of both fibroblastic cell
lines used herein (hTERT and BHK21) on irregular nano-pillars is very low. However, the
dependence of the cell coverage on pillar diameter does not show a clear trend. At 72 h, the
coverage seems to decrease steadily until square "d", then it appears to remain constant. Since the
initial surface coverage is non-zero all over the sample, the different surface coverage at 72 h can
be explained either by cell migration outside the nanopatterned squares, by apoptosis (cell death)
on the nano-pillars, or by reduce or inhibited cell proliferation on the pillars. On the other hand, the
endothelial cells REnd3 seem more spread on the pillars, and look as if arranged in a monolayer.
As already suggested in the previous Discussion, it might be that a textured pattern is more
resemblant to the natural extra-cellular matrix of endothelial cells. Hence, the increased confluence.
These results are consistent with Wieland et al.'s previous observations of human
fibroblasts(Wieland, 2002) and rat osteoblasts(Wieland, 2005) cultured on Ti substrates of
increasing surface roughness: they determined that while the cell volume remained constant, cell
thickness increased with substrate roughness, which leads to the conclusion that the cells were also
less spread. Because cell spreading is a pre-requisite for fibroblasts to proliferate, proliferation
could have been inhibited on their Ti substrates. Thus, even though the reasons for less surface
coverage on these irregular nano-pillars was not investigated, it is likely that the it relies on the
inhibition of proliferation, rather than on selective cell migration outside the pattern. This would be
coherent with the results from Part I. Besides, if the cells are assumed to form adhesions only with
the top surface, the surface coverages would suggest that there is a threshold pillar size below
which the cells can form adhesions with the bottom surface. Finally, a role for air-trapping cannot
be excluded even on the irregular nano-pillars.
127
4. Cell reaction to nanopillars
4.9 Conclusion
The results of cell culture on regular and irregular nano-pillars were very consistent, indicating that
nano-pillars of order of 100 nm can inhibit the proliferation of fibroblastic cells, while favouring
the spreading and the formation od a confluent monolayer of endothelial cells. It can be concluded
that the cells are not as sensitive to the regularity of the asperities, as to their average size and
centre-to-centre distance. The results of hTERT coverage on irregular nano-pillars confirm that a
systematic variation of asperity size and spacing is a necessary future step to follow up this
investigation.
All the results are consistent with the hypothesis that the availability of surface sites for ligand
clustering is at the origin of fibroblast behaviour. Therefore, it is postulated that the main reason
behind the lack of proliferation ofhTERT cells on PCL nano-pillars is the inability of fibroblasts to
form mature focal adhesions. It seems reasonable to assume that the cells will adhere to the top of
the asperities. Therefore, in the light of previous studies on nano-pits (Gallagher, 2003) and nano
pillars (Dalby, 2004), it is suggested herein that the main mechanism responsible for the
suppression of focal adhesion formation is the reduction in surface area due to the nanopatterns.
However, there might also be a role for air-trapping between nano-pillars or inside nano-pits. When
the PCL nano-pillars were gold-coated, the proliferation-inhibiting effect of the nano-pillars
disappeared.
Endothelial cells were not only able to form focal adhesions, but also formed a confluent and
cobble-stone-looking monolayer on the nano-pillars. Differential cell responses were also observed
by Turner et al. (Turner, 1997) and Clark et al. (Clark, 1991), as discussed in 4.1. This cell-type
dependent, differential effect on cell adhesion makes these nano-pillars most interesting for the
possible development of "cell-selective" surfaces.
128
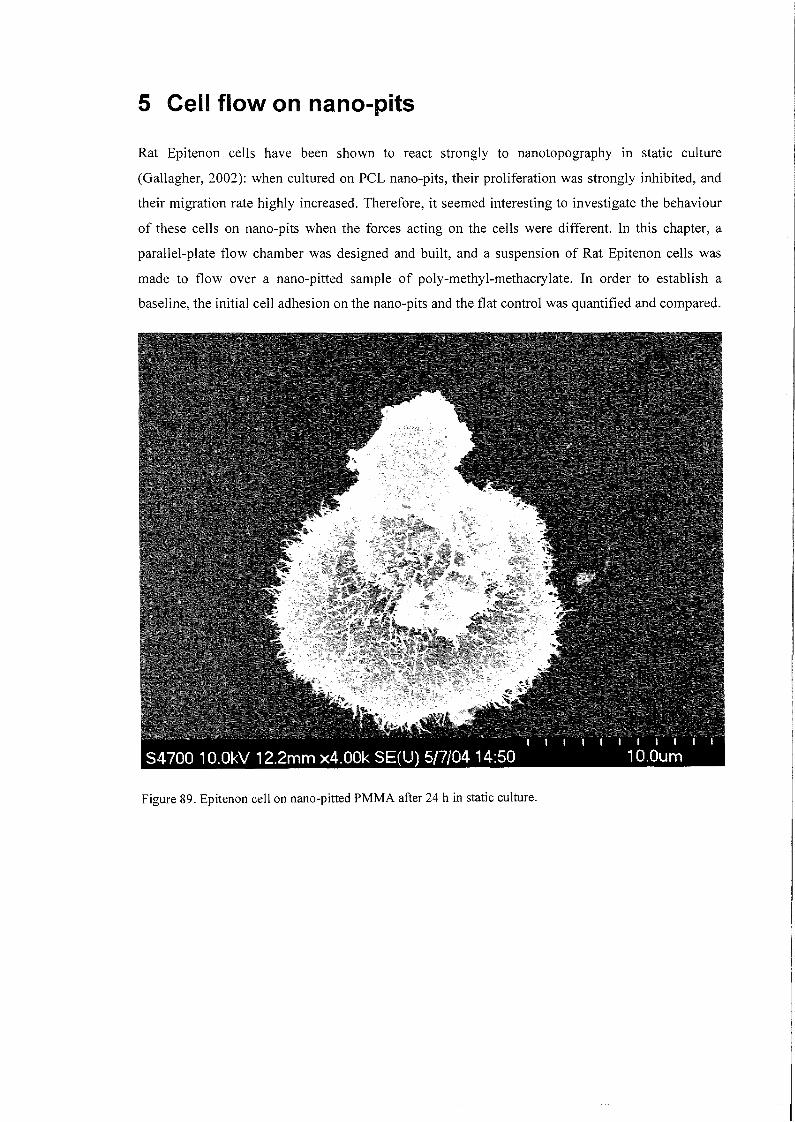
5 Cell flow on nano-pits
Rat Epitenon cells have been shown to react strongly to nanotopography in static culture
(Gallagher, 2002): when cultured on peL nano-pits, their proliferation was strongly inhibited, and
their migration rate highly increased. Therefore, it seemed interesting to investigate the behaviour
of these cells on nano-pits when the forces acting on the cells were different. In this chapter, a
parallel-plate flow chamber was designed and built, and a suspension of Rat Epitenon cells was
made to flow over a nano-pitted sample of poly-methyl-methacrylate. In order to establish a
baseline, the initial cell adhesion on the nano-pits and the flat control was quantified and compared.
Figure 89. Epitenon cell on nano-pitted PMMA after 24 h in static culture.
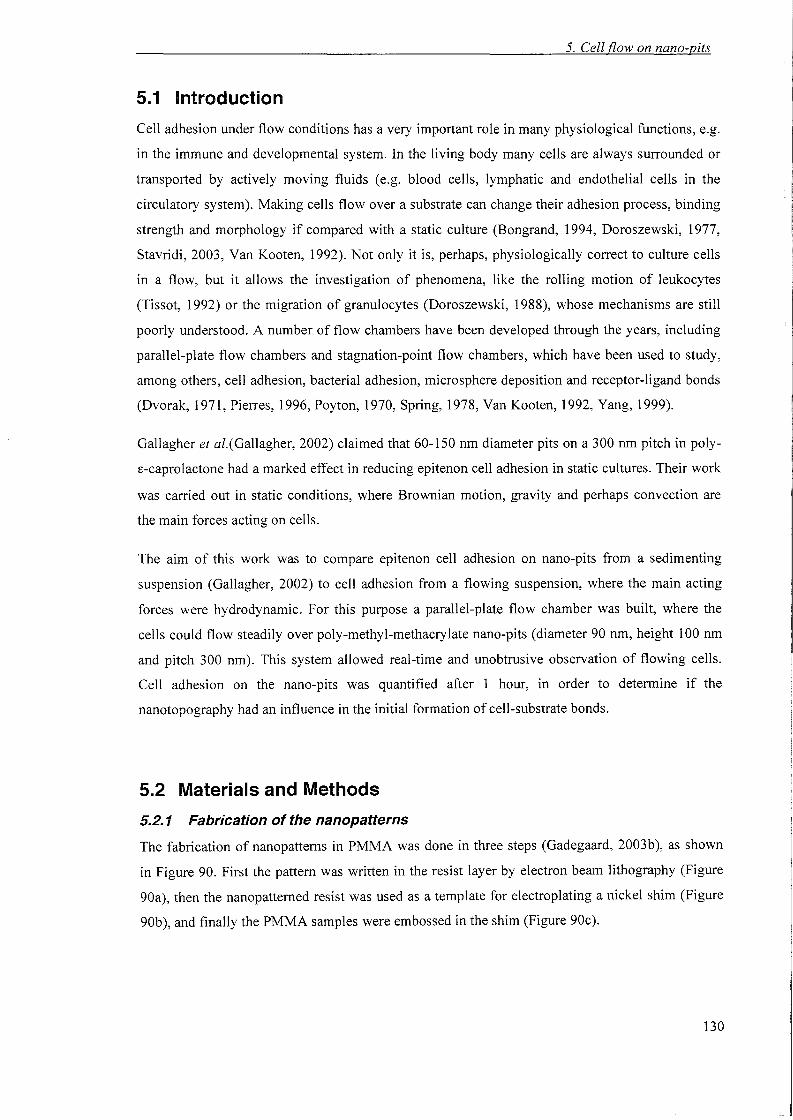
5. Cell flow on nana-pits
5.1 Introduction
Cell adhesion under flow conditions has a very important role in many physiological functions, e.g.
in the immune and developmental system. In the living body many cells are always surrounded or
transported by actively moving fluids (e.g. blood cells, lymphatic and endothelial cells in the
circulatory system). Making cells flow over a substrate can change their adhesion process, binding
strength and morphology if compared with a static culture (Bongrand, 1994, Doroszewski, 1977,
Stavridi, 2003, Van Kooten, 1992). Not only it is, perhaps, physiologically correct to culture cells
in a flow, but it allows the investigation of phenomena, like the rolling motion of leukocytes
(Tissot, 1992) or the migration of granulocytes (Doroszewski, 1988), whose mechanisms are still
poorly understood. A number of flow chambers have been developed through the years, including
parallel-plate flow chambers and stagnation-point flow chambers, which have been used to study,
among others, cell adhesion, bacterial adhesion, microsphere deposition and receptor-ligand bonds
(Dvorak, 1971, Pierres, 1996, Poyton, 1970, Spring, 1978, Van Kooten, 1992, Yang, 1999).
Gallagher et al.(Gallagher, 2002) claimed that 60-150 nm diameter pits on a 300 nm pitch in poly
s-caprolactone had a marked effect in reducing epitenon cell adhesion in static cultures. Their work
was carried out in static conditions, where Brownian motion, gravity and perhaps convection are
the main forces acting on cells.
The aim of this work was to compare epitenon cell adhesion on nano-pits from a sedimenting
suspension (Gallagher, 2002) to cell adhesion from a flowing suspension, where the main acting
forces were hydrodynamic. For this purpose a parallel-plate flow chamber was built, where the
cells could flow steadily over poly-methyl-methacrylate nano-pits (diameter 90 nm, height 100 nm
and pitch 300 nm). This system allowed real-time and unobtrusive observation of flowing cells.
Cell adhesion on the nano-pits was quantified after 1 hour, in order to determine if the
nanotopography had an influence in the initial formation of cell-substrate bonds.
5.2 Materials and Methods
5.2.1 Fabrication of the nanopatterns
The fabrication of nanopattems in PMMA was done in three steps (Gadegaard, 2003b), as shown
in Figure 90. First the pattern was written in the resist layer by electron beam lithography (Figure
90a), then the nanopatterned resist was used as a template for electroplating a nickel shim (Figure
90b), and finally the PMMA samples were embossed in the shim (Figure 90c).
130
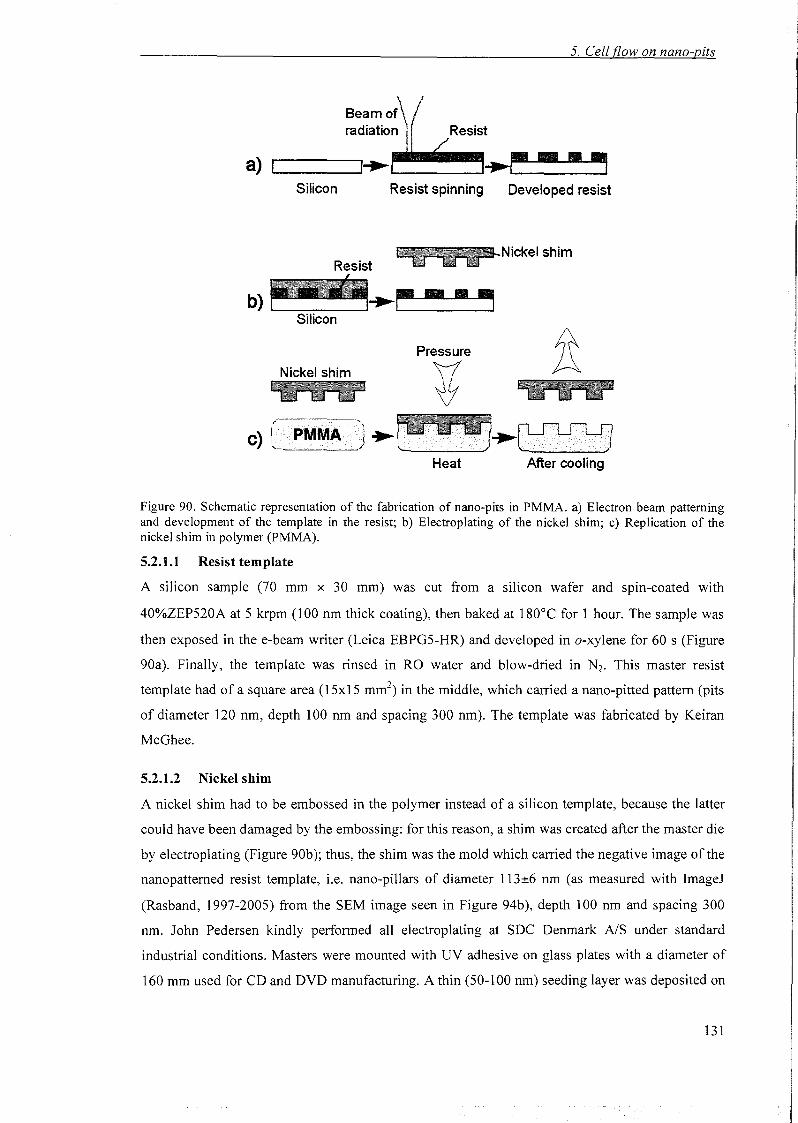
5. Cell flow on nano-pits
Beam ofradiation Resist
a) I.... ...~. -.,Silicon Resist spinning Developed resist
Nickel shim
.-Resist
b)~....r-__.,Silicon
Nickel shim..... Pressure
rJ/-----
) \ PMMA 1.-C '-... ,"-- J
Heat After cooling
Figure 90. Schematic representation of the fabrication of nano-pits in PMMA. a) Electron beam patterningand development of the template in the resist; b) Electroplating of the nickel shim; c) Replication of thenickel shim in polymer (PMMA).
5.2.1.1 Resist template
A silicon sample (70 mm x 30 mm) was cut from a silicon wafer and spin-coated with
40%ZEP520A at 5 krpm (l00 nm thick coating), then baked at 180°C for 1 hour. The sample was
then exposed in the e-beam writer (Leica EBPG5-HR) and developed in a-xylene for 60 s (Figure
90a). Finally, the template was rinsed in RO water and blow-dried in N2• This master resist
template had of a square area (l5x15 mm") in the middle, which carried a nano-pitted pattern (pits
of diameter 120 nm, depth 100 nm and spacing 300 nm). The template was fabricated by Keiran
McGhee.
5.2.1.2 Nickel shim
A nickel shim had to be embossed in the polymer instead of a silicon template, because the latter
could have been damaged by the embossing: for this reason, a shim was created after the master die
by electroplating (Figure 90b); thus, the shim was the mold which carried the negative image of the
nanopatterned resist template, i.e. nano-pillars of diameter l13±6 nm (as measured with ImageJ
(Rasband, 1997-2005) from the SEM image seen in Figure 94b), depth 100 nm and spacing 300
nm. John Pedersen kindly performed all electroplating at SDC Denmark A/S under standard
industrial conditions. Masters were mounted with UV adhesive on glass plates with a diameter of
160 mm used for CD and DVD manufacturing. A thin (50-100 nm) seeding layer was deposited on
131
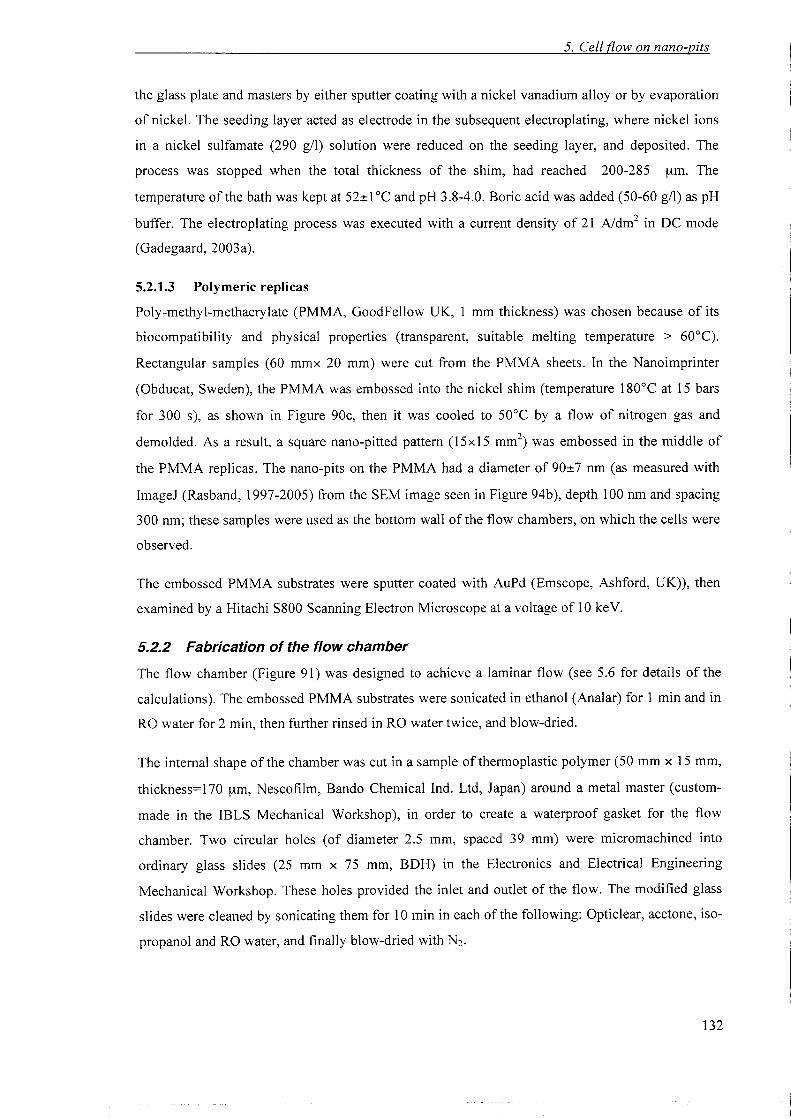
5. Cell flow on nano-pits
the glass plate and masters by either sputter coating with a nickel vanadium alloy or by evaporation
of nickel. The seeding layer acted as electrode in the subsequent electroplating, where nickel ions
in a nickel sulfamate (290 gil) solution were reduced on the seeding layer, and deposited. The
process was stopped when the total thickness of the shim, had reached 200-285 urn. The
temperature of the bath was kept at 52±1 °C and pH 3.8-4.0. Boric acid was added (50-60 gil) as pH
buffer. The electroplating process was executed with a current density of 21 Azdrrr' in DC mode
(Gadegaard, 2003a).
5.2.1.3 Polymeric replicas
Poly-methyl-methacrylate (PMMA, GoodFellow UK, 1 mm thickness) was chosen because of its
biocompatibility and physical properties (transparent, suitable melting temperature > 60°C).
Rectangular samples (60 mmx 20 mm) were cut from the PMMA sheets. In the Nanoimprinter
(Obducat, Sweden), the PMMA was embossed into the nickel shim (temperature 180°C at 15 bars
for 300 s), as shown in Figure 90c, then it was cooled to 50°C by a flow of nitrogen gas and
demolded. As a result, a square nano-pitted pattern (15x15 mm") was embossed in the middle of
the PMMA replicas. The nano-pits on the PMMA had a diameter of 90±7 nm (as measured with
ImageJ (Rasband, 1997-2005) from the SEM image seen in Figure 94b), depth 100 nm and spacing
300 nm; these samples were used as the bottom wall of the flow chambers, on which the cells were
observed.
The embossed PMMA substrates were sputter coated with AuPd (Emscope, Ashford, UK)), then
examined by a Hitachi S800 Scanning Electron Microscope at a voltage oflO keY.
5.2.2 Fabrication of the flow chamber
The flow chamber (Figure 91) was designed to achieve a laminar flow (see 5.6 for details of the
calculations). The embossed PMMA substrates were sonicated in ethanol (Analar) for 1 min and in
RO water for 2 min, then further rinsed in RO water twice, and blow-dried.
The internal shape ofthe chamber was cut in a sample ofthermoplastic polymer (50 mm x 15 mm,
thickness=170 urn, Nescofilm, Bando Chemical Ind. Ltd, Japan) around a metal master (custom
made in the IBLS Mechanical Workshop), in order to create a waterproof gasket for the flow
chamber. Two circular holes (of diameter 2.5 mm, spaced 39 mm) were micromachined into
ordinary glass slides (25 mm x 75 mm, BDH) in the Electronics and Electrical Engineering
Mechanical Workshop. These holes provided the inlet and outlet of the flow. The modified glass
slides were cleaned by sonicating them for 10 min in each of the following: Opticlear, acetone, iso
propanol and RO water, and finally blow-dried with N2.
132
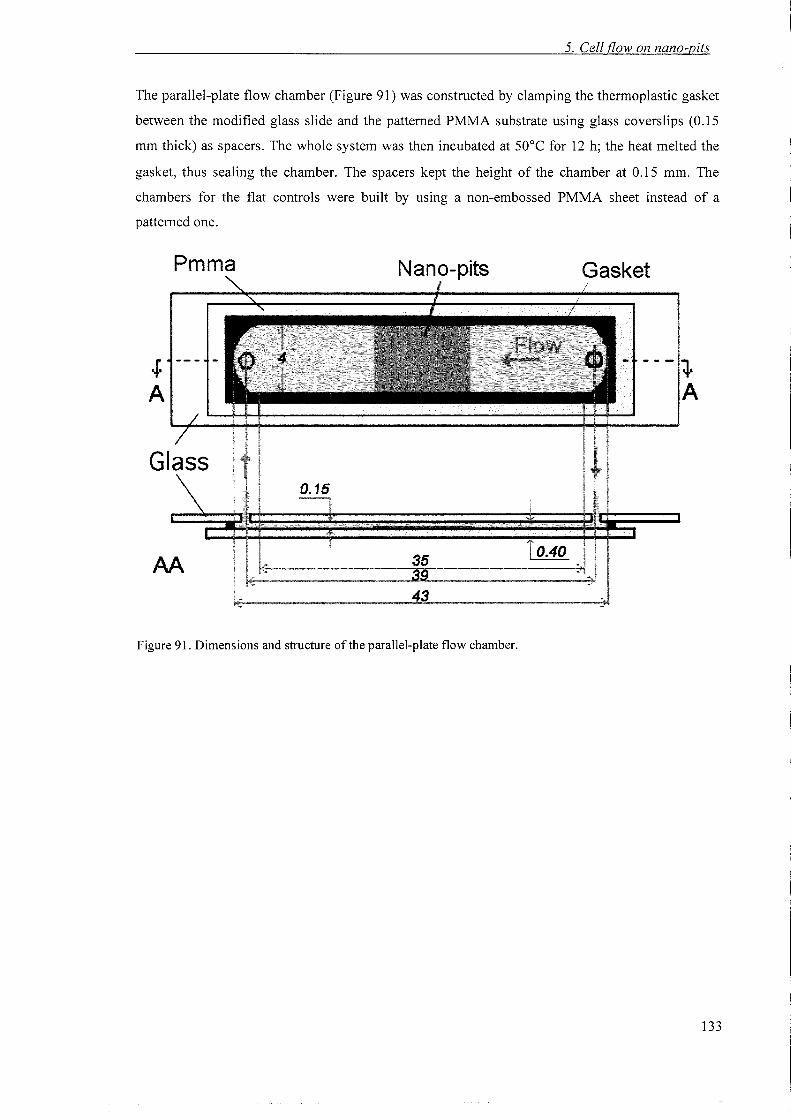
5. Cell flow on nano-pits
The parallel-plate flow chamber (Figure 91) was constructed by clamping the thermoplastic gasket
between the modified glass slide and the patterned PMMA substrate using glass coverslips (0.15
mm thick) as spacers. The whole system was then incubated at 50°C for 12 h; the heat melted the
gasket, thus sealing the chamber. The spacers kept the height of the chamber at 0.15 mm. The
chambers for the flat controls were built by using a non-embossed PMMA sheet instead of a
patterned one.
Pmma
Glass
AA
0.15--,
Nano-pits Gasket
---:J.A
Figure 91. Dimensions and structure of the parallel-plate flow chamber.
133
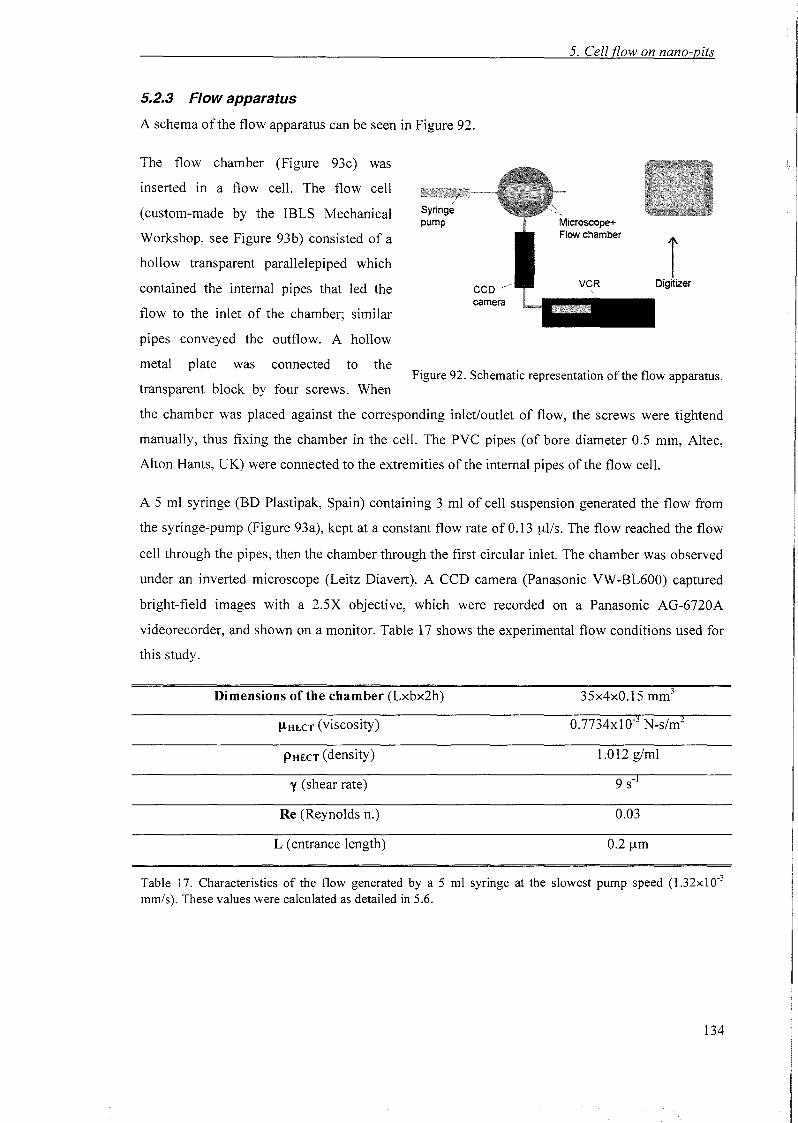
5. Cell flow on nano-pits
5.2.3 Flow apparatus
A schema of the flow apparatus can be seen in Figure 92.
Figure 92. Schematic representation of the flow apparatus.
1DigitizerVCR
CCDcamera
Syringepump
The flow chamber (Figure 93c) was
inserted in a flow cell. The flow cell
(custom-made by the IBLS Mechanical
Workshop, see Figure 93b) consisted of a
hollow transparent parallelepiped which
contained the internal pipes that led the
flow to the inlet of the chamber; similar
pipes conveyed the outflow. A hollow
metal plate was connected to the
transparent block by four screws. When
the chamber was placed against the corresponding inlet/outlet of flow, the screws were tightend
manually, thus fixing the chamber in the cell. The PVC pipes (of bore diameter 0.5 mm, Altec,
Alton Hants, UK) were connected to the extremities of the internal pipes ofthe flow cell.
A 5 ml syringe (BD Plastipak, Spain) containing 3 ml of cell suspension generated the flow from
the syringe-pump (Figure 93a), kept at a constant flow rate of 0.13 ul/s, The flow reached the flow
cell through the pipes, then the chamber through the first circular inlet. The chamber was observed
under an inverted microscope (Leitz Diavert). A CCD camera (Panasonic VW-BL600) captured
bright-field images with a 2.5X objective, which were recorded on a Panasonic AG-6720A
videorecorder, and shown on a monitor. Table 17 shows the experimental flow conditions used for
this study.
Dimensions of the chamber (Lxbx2h) 35x4xO.15 mm'
!J.HECT (viscosity) 0.7734xl0·3 N-s/m1
PHECT (density) 1.012 glml
y (shear rate)
Re (Reynolds n.) 0.03
L (entrance length) 0.2!-lm
Table 17. Characteristics of the flow generated by a 5 ml syringe at the slowest pump speed (1.32x10·3
mm/s). These values were calculated as detailed in 5.6.
134
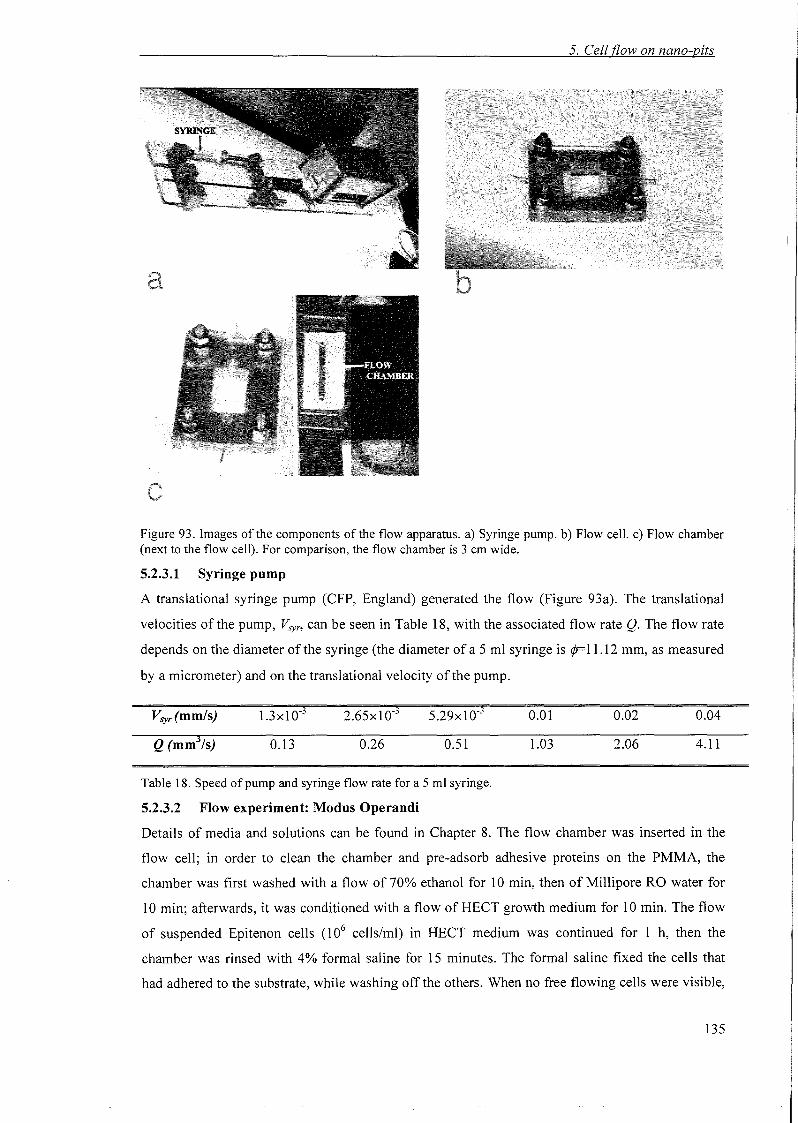
5. Cell flow on nano-pits
Figure 93. Images of the components of the flow apparatus. a) Syringe pump. b) Flow cell. c) Flow chamber(next to the flow cell). For comparison, the flow chamber is 3 em wide.
5.2.3.1 Syringe pump
A translational syringe pump (CFP, England) generated the flow (Figure 93a). The translational
velocities of the pump, V,yr, can be seen in Table 18, with the associated flow rate Q. The flow rate
depends on the diameter ofthe syringe (the diameter ofa 5 ml syringe is q'F11.12 mm, as measured
by a micrometer) and on the translational velocity ofthe pump.
Vsyr(mm/s)
Q (mm3/s) 0.13
2.65x I 0-3
0.26
5.29xlO-3
0.51
0.01
1.03
0.02
2.06
0.04
4.11
Table 18. Speed of pump and syringe flow rate for a 5 ml syringe.
5.2.3.2 Flow experiment: Modus Operandi
Details of media and solutions can be found in Chapter 8. The flow chamber was inserted in the
flow cell; in order to clean the chamber and pre-adsorb adhesive proteins on the PMMA, the
chamber was first washed with a flow of 70% ethanol for 10 min, then of Millipore RO water for
10 min; afterwards, it was conditioned with a flow of HECT growth medium for 10 min. The flow
of suspended Epitenon cells (l06 cells/ml) in HECT medium was continued for I h, then the
chamber was rinsed with 4% formal saline for 15 minutes. The formal saline fixed the cells that
had adhered to the substrate, while washing off the others. When no free flowing cells were visible,
135
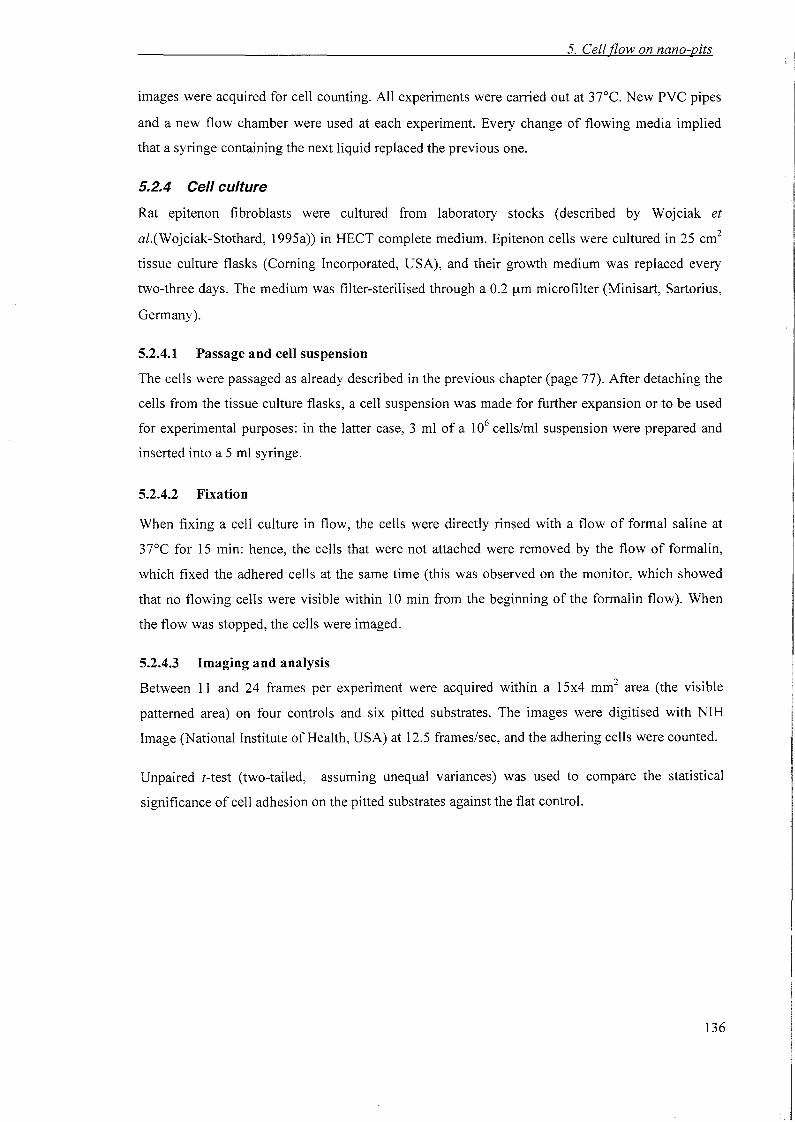
5. Cell flow on nano-pits
images were acquired for cell counting. All experiments were carried out at 37°C. New PVC pipes
and a new flow chamber were used at each experiment. Every change of flowing media implied
that a syringe containing the next liquid replaced the previous one.
5.2.4 Cell culture
Rat epitenon fibroblasts were cultured from laboratory stocks (described by Wojciak et
al.(Wojciak-Stothard, 1995a)) in HECT complete medium. Epitenon cells were cultured in 25 crrr'
tissue culture flasks (Coming Incorporated, USA), and their growth medium was replaced every
two-three days. The medium was filter-sterilised through a 0.2 urn microfilter (Minisart, Sartorius,
Germany).
5.2.4.1 Passage and cell suspension
The cells were passaged as already described in the previous chapter (page 77). After detaching the
cells from the tissue culture flasks, a cell suspension was made for further expansion or to be used
for experimental purposes: in the latter case, 3 ml of a 106 cells/ml suspension were prepared and
inserted into a 5 ml syringe.
5.2.4.2 Fixation
When fixing a cell culture in flow, the cells were directly rinsed with a flow of formal saline at
37°C for 15 min: hence, the cells that were not attached were removed by the flow of formalin,
which fixed the adhered cells at the same time (this was observed on the monitor, which showed
that no flowing cells were visible within 10 min from the beginning of the formalin flow). When
the flow was stopped, the cells were imaged.
5.2.4.3 Imaging and analysis
Between 11 and 24 frames per experiment were acquired within a 15x4 mrrr' area (the visible
patterned area) on four controls and six pitted substrates. The images were digitised with NIH
Image (National Institute of Health, USA) at 12.5 frames/sec, and the adhering cells were counted.
Unpaired z-test (two-tailed, assuming unequal variances) was used to compare the statistical
significance of cell adhesion on the pitted substrates against the flat control.
136
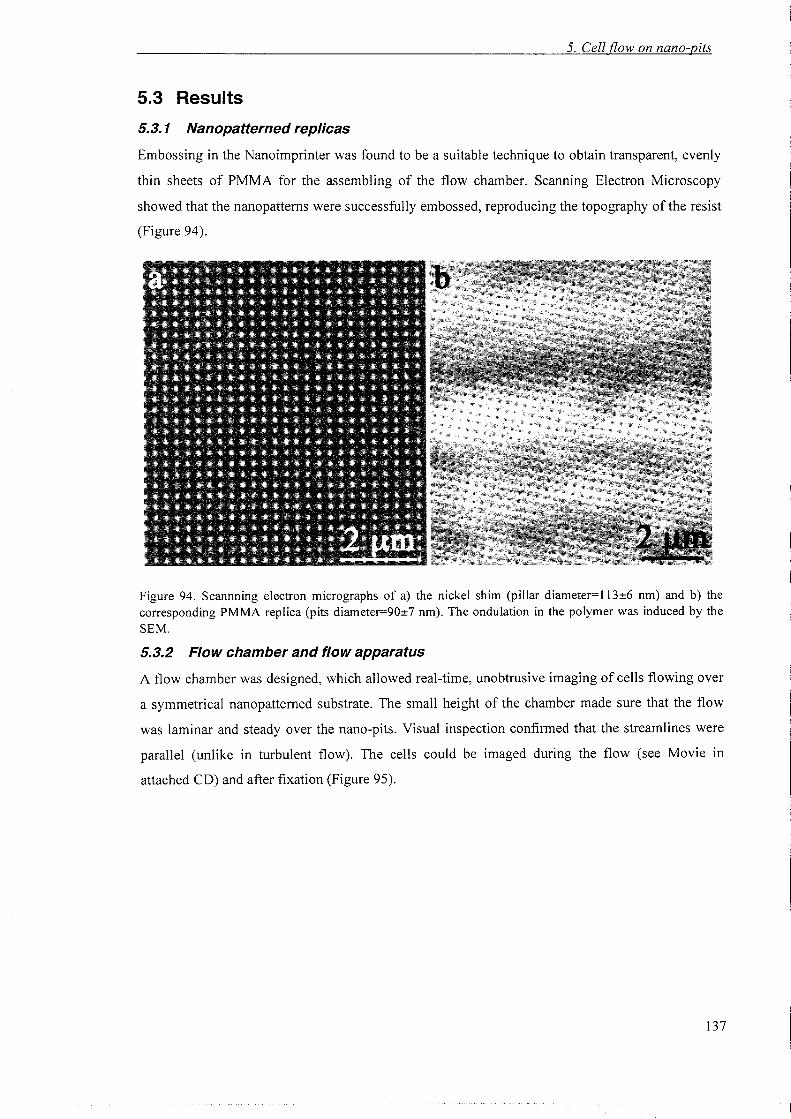
5. Cell flow on nano-pits
5.3 Results
5.3.1 Nanopatterned replicas
Embossing in the Nanoimprinter was found to be a suitable technique to obtain transparent, evenly
thin sheets of PMMA for the assembling of the flow chamber. Scanning Electron Microscopy
showed that the nanopattems were successfully embossed, reproducing the topography of the resist
(Figure 94).
Figure 94. Scannning electron micrographs of a) the nickel shim (pillar diameter=113±6 nm) and b) thecorresponding PMMA replica (pits diameter=90±7 nm). The ondulation in the polymer was induced by theSEM.
5.3.2 Flow chamber and flow apparatus
A flow chamber was designed, which allowed real-time, unobtrusive imaging of cells flowing over
a symmetrical nanopattemed substrate. The small height of the chamber made sure that the flow
was laminar and steady over the nano-pits. Visual inspection confirmed that the streamlines were
parallel (unlike in turbulent flow). The cells could be imaged during the flow (see Movie in
attached CD) and after fixation (Figure 95).
137
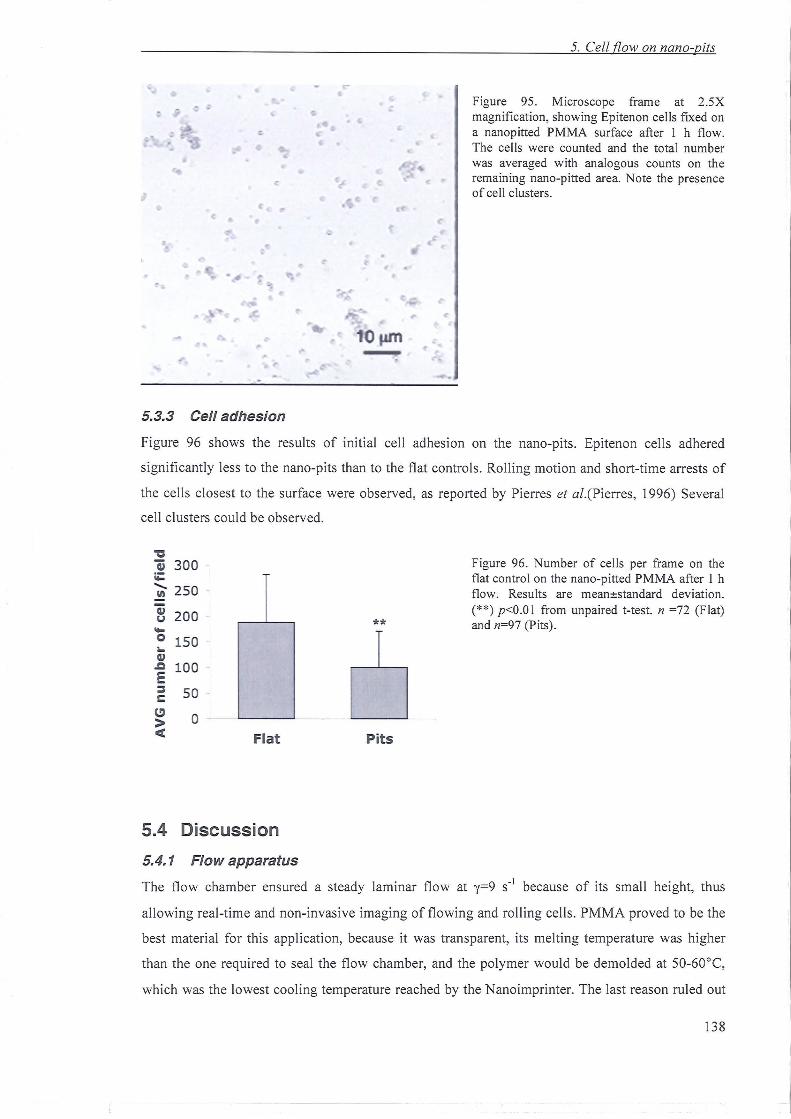
5. Cell flow on nan a-pits
Figure 95. Microscope frame at 2.5Xmagnifi cation, showing Epitenon cells fixed ona nanopitted PMMA surface after I h flow .The cells were counted and the total numberwas averaged with ana logous counts on theremaining nano-pitted area. Note the presenceof cell clusters.
-5.3.3 Cell adhesion
Figure 96 shows the results of initial cell adhesion on the nano-pits. Epitenon cells adhered
significantly less to the nano-pits than to the flat controls. Rolling motion and short-time arrests of
the cells closest to the surface were observed, as reported by Pierres et al.(Pierres, 1996) Several
cell clusters could be observed.
**
I
og
cu 300~....... 250III
cu 200u~
0 1501-cu.c 100 -E~ 50 -c
CJ 0>« Flat Pits
Figure 96. Numb er of cells per fram e on theflat control on the nano-pitt ed PMMA after I hflow . Results are meane standard deviation.(**) p<O .O I from unpaired t-test. n =72 (Flat)and n=97 (Pit s).
5.4 Discussion
5.4.1 Flow apparatus
The flow chamber ensured a steady laminar flow at y=9 S- I because of its small height, thus
allowing real-time and non-invasive imaging of flowing and rolling cells. PMMA proved to be the
best material for this application, because it was transparent, its melting temperature was higher
than the one required to seal the flow chamber, and the polymer would be demolded at 50-60°C,
which was the lowest cooling temperature reached by the Nanoimprinter. The last reason ruled out
138
5. Cell flow on nano-pits
the use of PCL, SInce thumb-embossing would not have provided transparent sheets of even
thickness.
The syringe pump did not give rise to reservoir effects (unlike peristaltic pumps), which meant
that the velocity of flow was constant at all times. However, even though the flow could have been
kept for up to 14 h at a flow rate of 28 s-\ the cells sedimented inside the syringe, which meant that
after approximately 1 h, only growth medium was flowing into the chamber.
Running the experiment proved to be a difficult task. The chamber was very fragile, and changing
the syringes with the different media was an extremely delicate operation, since the syringes had to
be disconnected from the pipes. This could cause the infiltration of air bubbles, which would and
did compromise several experiments.
The next step in improving this set up would involve the fabrication of a flow cell and chamber
where only the nanopatterned polymer is replaced at each experiment, instead of the whole
chamber. Also, a pumping system based on valves, rather than on syringe replacement, could be
designed: this would allow the changing of liquid media without disconnecting the pipes, ensuring
sterility at all times.
5.4.2 Initial cell adhesion
The wall shear rate of this flow chamber (Ywan=9 S-l) is much lower than in any physiological
condition (see 5.6.4): hence the velocity profile is much less parabolic, meaning that the flowing
cells undergo less torque than in vivo, which should make their adhesion more likely. Instead,
Figure 96 shows that the PMMA nano-pits significantly reduced initial cell adhesion. This could be
due to a reduction in surface area available for the first cell-substrate contact: since the nano-pits
reduced the surface area by 20%, the formation of initial bonds would occur less frequently.
Alternatively, the nanopits might increase the slippage of the medium at the surface (Cottin
Bizonne c., 2003). In this case, reduced surface friction would make cell adhesion less probable.
Cell clusters formed on both patterned and flat surfaces (Figure 95), suggesting that cells adhere
more easily to other cells rather than to the substrate, or simply that an adhered cell constitutes an
obstacle for a flowing one, thus starting the nucleation of clusters. in the latter case, it is possible
that a region of micro-turbulence is created behind an adhered cell, and that this in tum favours cell
adhesion. Alternatively, the clusters might form in the suspension, or in the regions of turbulence in
the flow path.
As Gallagher et al.(Gallagher, 2002) proved that some nano-pitted surfaces prevent or reduce static
Epitenon cell adhesion in vitro, the purpose of the present study was to investigate cell adhesion on
the same nano-pits, but under dynamic conditions, which is a more physiological-resembling
139
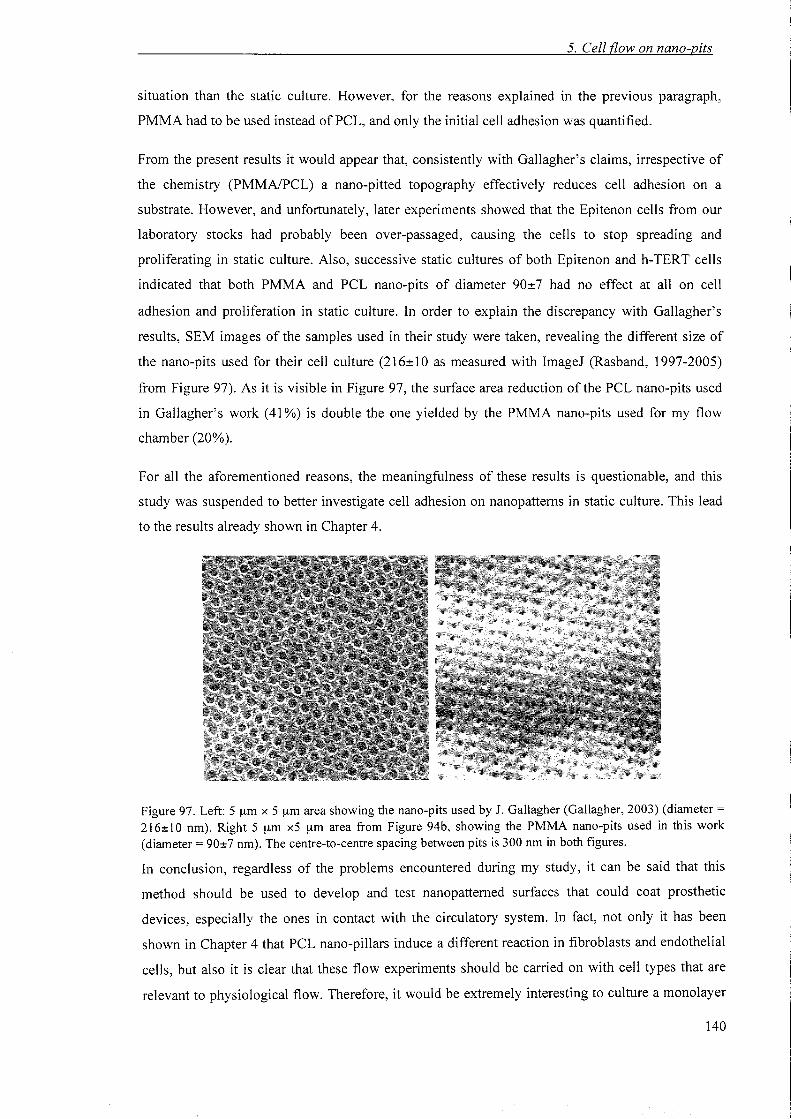
5. Cell flow on nano-pits
situation than the static culture. However, for the reasons explained in the previous paragraph,
PMMA had to be used instead of PCL, and only the initial cell adhesion was quantified.
From the present results it would appear that, consistently with Gallagher's claims, irrespective of
the chemistry (PMMAlPCL) a nano-pitted topography effectively reduces cell adhesion on a
substrate. However, and unfortunately, later experiments showed that the Epitenon cells from our
laboratory stocks had probably been over-passaged, causing the cells to stop spreading and
proliferating in static culture. Also, successive static cultures of both Epitenon and h-TERT cells
indicated that both PMMA and PCL nano-pits of diameter 90±7 had no effect at all on cell
adhesion and proliferation in static culture. In order to explain the discrepancy with Gallagher's
results, SEM images of the samples used in their study were taken, revealing the different size of
the nano-pits used for their cell culture (216±10 as measured with ImageJ (Rasband, 1997-2005)
from Figure 97). As it is visible in Figure 97, the surface area reduction of the PCL nano-pits used
in Gallagher's work (41%) is double the one yielded by the PMMA nano-pits used for my flow
chamber (20%).
For all the aforementioned reasons, the meaningfulness of these results is questionable, and this
study was suspended to better investigate cell adhesion on nanopattems in static culture. This lead
to the results already shown in Chapter 4.
Figure 97. Left: 5 urn x 5 urn area showing the nano-pits used by J. Gallagher (Gallagher, 2003) (diameter =216± 10 nm). Right 5 urn x5 urn area from Figure 94b, showing the PMMA nano-pits used in this work(diameter = 90±7 nm). The centre-to-centre spacing between pits is 300 nm in both figures.
In conclusion, regardless of the problems encountered during my study, it can be said that this
method should be used to develop and test nanopattemed surfaces that could coat prosthetic
devices, especially the ones in contact with the circulatory system. In fact, not only it has been
shown in Chapter 4 that PCL nano-pillars induce a different reaction in fibroblasts and endothelial
cells, but also it is clear that these flow experiments should be carried on with cell types that are
relevant to physiological flow. Therefore, it would be extremely interesting to culture a monolayer
140
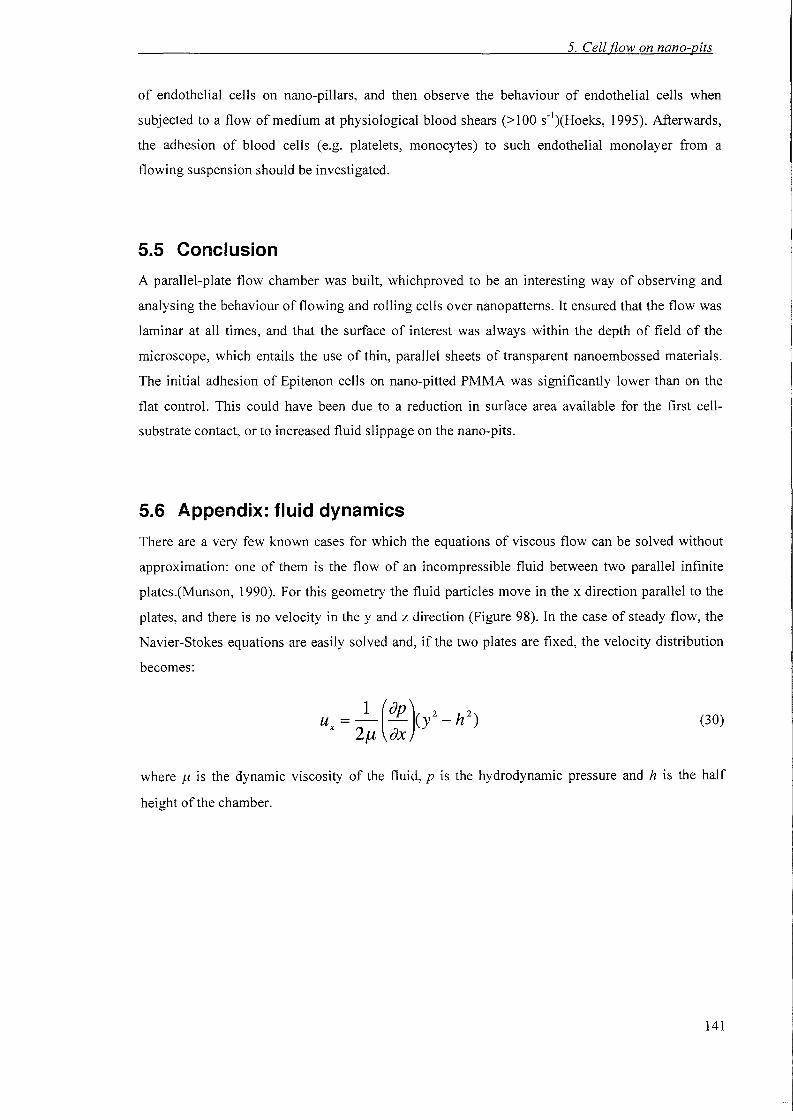
5. Cell flow on nano-pits
of endothelial cells on nano-pillars, and then observe the behaviour of endothelial cells when
subjected to a flow of medium at physiological blood shears (>100 s·I)(Hoeks, 1995). Afterwards,
the adhesion of blood cells (e.g. platelets, monocytes) to such endothelial monolayer from a
flowing suspension should be investigated.
5.5 Conclusion
A parallel-plate flow chamber was built, whichproved to be an interesting way of observing and
analysing the behaviour of flowing and rolling cells over nanopattems. It ensured that the flow was
laminar at all times, and that the surface of interest was always within the depth of field of the
microscope, which entails the use of thin, parallel sheets of transparent nanoembossed materials.
The initial adhesion of Epitenon cells on nano-pitted PMMA was significantly lower than on the
flat control. This could have been due to a reduction in surface area available for the first cell
substrate contact, or to increased fluid slippage on the nano-pits.
5.6 Appendix: fluid dynamics
There are a very few known cases for which the equations of viscous flow can be solved without
approximation: one of them is the flow of an incompressible fluid between two parallel infinite
plates.(Munson, 1990). For this geometry the fluid particles move in the x direction parallel to the
plates, and there is no velocity in the y and z direction (Figure 98). In the case of steady flow, the
Navier-Stokes equations are easily solved and, if the two plates are fixed, the velocity distribution
becomes:
1 (ap ) 2 2Ux=- - (y -h )
2f.l dx(30)
where f-l is the dynamic viscosity of the fluid, p is the hydrodynamic pressure and h is the half
height ofthe chamber.
141
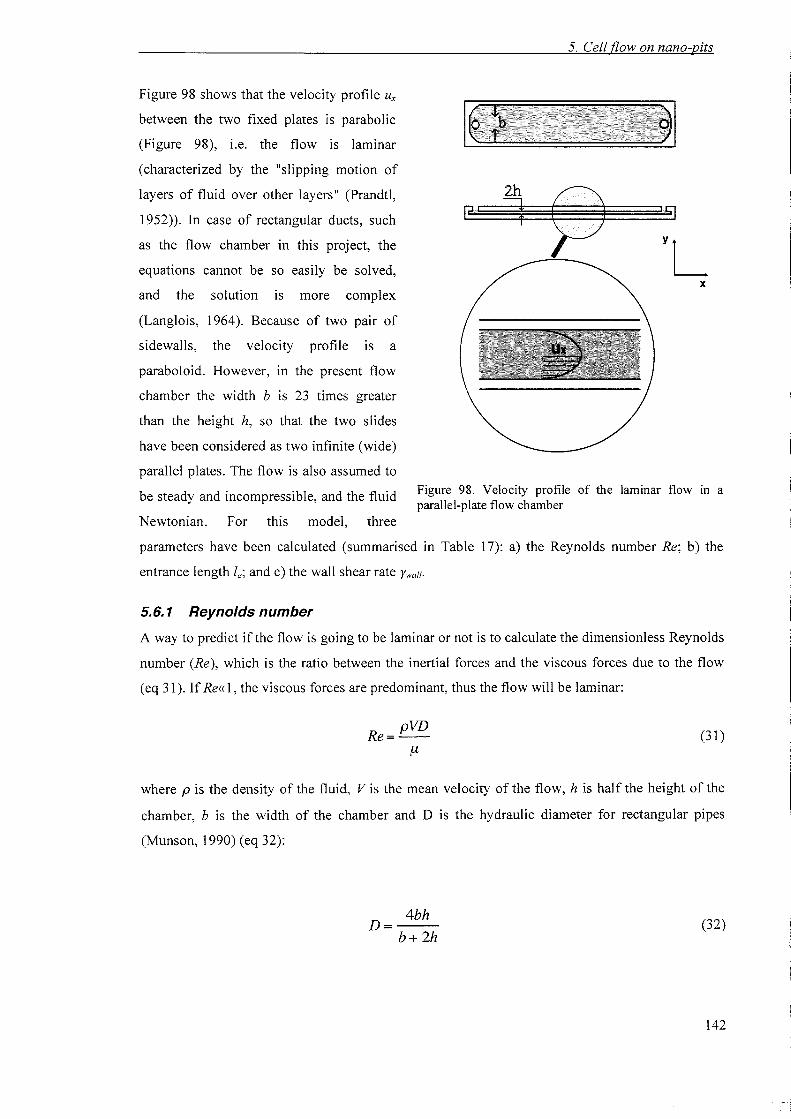
5. Cell flow on nano-pits
Figure 98. Velocity profile of the laminar flow in aparallel-plate flow chamber
x
'512h;;pi
Figure 98 shows that the velocity profile u,
between the two fixed plates is parabolic
(Figure 98), i.e. the flow is laminar
(characterized by the "slipping motion of
layers of fluid over other layers" (Prandtl,
1952». In case of rectangular ducts, such
as the flow chamber in this project, the
equations cannot be so easily be solved,
and the solution IS more complex
(Langlois, 1964). Because of two pair of
sidewalls, the velocity profile is a
paraboloid. However, in the present flow
chamber the width b is 23 times greater
than the height h, so that the two slides
have been considered as two infinite (wide)
parallel plates. The flow is also assumed to
be steady and incompressible, and the fluid
Newtonian. For this model, three
parameters have been calculated (summarised in Table 17): a) the Reynolds number Re; b) the
entrance length L: and c) the wall shear rate Ywall.
5.6.1 Reynolds number
A way to predict if the flow is going to be laminar or not is to calculate the dimensionless Reynolds
number (Re), which is the ratio between the inertial forces and the viscous forces due to the flow
(eq 31). If Re« I, the viscous forces are predominant, thus the flow will be laminar:
Re= pVD!1
(31)
where p is the density of the fluid, V is the mean velocity of the flow, h is half the height of the
chamber, b is the width of the chamber and 0 is the hydraulic diameter for rectangular pipes
(Munson, 1990) (eq 32):
4bhD=-
b+ 2h(32)
142
5. Cell flow on nano-pits
The dynamic viscosity J1 of the suspension can be calculated acoording to Happel and Brenner
(Happel, 1965), and in the case of our dilute system it can be approximated to the viscosity of the
HECT medium, which has been measured with a 27942 ASTM-IP Ostwald viscometer. At 3rC,
PHEC7=1.012 glml and J1HEC7=0.7734xl0·3 N-s/m2• Calculations of the Reynolds number for this
flow chamber showed that the viscous effects are predominant (Re=0.02), which is not surprising
due to the small height of the chamber.
5.6.2 Entrance length
When the flow is entering the chamber, it needs a certain length before it becomes fully developed,
i.e. before the velocity profile becomes parabolic. This is the so-called entrance length l-. Different
correlations have been accepted to calculate the entrance length (Munson, 1990, Prandtl, 1952); for
this chamber, the expression from Munson et al.(Munson, 1990) has been used, where D is the
hydraulic diameter:
I = 0.065 ReDe
(33)
The turbulent effects due to the geometry have not been considered which means that the entrance
length is longer than calculated. The flow pattern represents a sharp-edged "source and sink"
configuration (Prandtl, 1952), which will give rise to turbulence near the inlet and outlet. However,
the distance between the inlet and the centre of the chamber is 19.5 mm, which is 104 times bigger
than the calculated entrance length (Ie =0.6 urn): it seems therefore reasonable to assume that the
flow in the middle is fully developed.
5.6.3 Wall shear rate
The most commonly cited haemodynamic factor implicated in cell adhesion defects, disease
initiation and ligand-receptor bond dissociation is the wall shear stress Twall, while the wall shear
rate Ywall (=Twalll!-L) seems to affect bond formation (Chen, 2001). The shear rate Yquantifies the
speed of deformation of a flowing fluid, and it is inversely proportional to the viscosity J1. The wall
shear rate is calculated from the velocity distribution in a Newtonian fluid flowing between two
wide, parallel plates (Munson, 1990):
3QYwall = 2bh 2
where b is the width of the chamber, h is the half height and Q is flow rate (eq 35):
Q = n ¢:vr V4 syr
where ¢.Iyr is the diameter ofthe syringe and V,yr is the translational velocity of the syringe.
(34)
(35)
143
5. Cell flow on nanD-pits
In this flow chamber, at Q=O.13 mmvs, Ywalf= 9 s'.
5.6.4 Wall shear rate of blood in vessels
For a comparison with blood flow, the radial velocity V= of a steady, laminar flow in a circular tube
(Poiseuille's flow, eq 36) was considered:
(36)
where z is the position along the axis of the tube, r is the radial distance from the axis and R is the
radius of the tube. The associated shear rate is formulated in eq 37:
av 1 apy=--=1--2r
ar 4.u az
The mean velocity V is related to the radial velocity V= by eq 38:
By replacing eq 38 into eq 36 and 37, the wall shear rate in a tube Ywalf was finally obtained:
(37)
(38)
2Vry=
R2=> (39)
Values of the mean velocity of blood and the radius of the vessels were found in Tortora &
Grabowski (Tortora, 2000), and substituted in eq 39 to calculate the wall shear rates. In the aorta,
V;:::;40 cmls and the cross-sectional area, JtR2;:::; 3-5cm2
. It follows Raorta ;:::; 0.98-1.26 em, thus Ywall.aorta
;:::; 82-63 s'. In the capillaries, V ;:::; 0.1 cmls, and the total cross-sectional area is 4500-6000 ern",
The average diameter of the capillaries is Rcapill 8!tm
(http://www.nanomedicine.comINMI/8.2.1.2.htm). thus Ywall-capill;:::; 250 S·I.
144
6. Discussion
6 Final discussion
Despite the increasing amount of literature on the effects of nano-topographies on cell behaviour
(Casey, 1997, Clark, 1991, Curtis, 1964, Curtis, 1998a, Dalby, 2002b, Dalby, 2004, Flemming,
1999, Gallagher, 2002, Goodman, 1996, Stavridi, 2003, Turner, 1997, Wieland, 2005, Wilkinson,
2001, Wojciak-Stothard, 1996), the origin of the vast and disparate set of reported phenomena is
still unknown also because the wide range of materials and shapes used in previous experimental
reports makes it difficult to classify the different.
One possible explanation for some of the observed phenomena, such as reduced spreading and low
proliferation, is that nano-scale patterning could cause or enhance the formation of air pockets on
the surface. This would shield protein adsorption on the substrate (Wu, 2005), and would generally
reduce the area available for cells to form focal contacts. The cells might attach to the proteins
absorbed at the air-medium interface (Lu, 1999), but a vapour cavity would not provide the
mechanical resistance required for focal adhesion development (Pelham, 1997).
In 1994, Parker et al.(Parker, 1994) proposed that the long-ranged hydrophobic attraction (10-100
nm) is due to preexisting bubbles that bridge the two approaching surfaces. There is increasing
evidence of the formation of nano-bubbles (or more precisely, nano-cavities) on hydrophobic
surfaces (Ishida N., 2000, Tyrrell, 2001). In particular, Attard and co-workers (Tyrrell, 2001)
imaged a close-packed network of "nano-bubbles" of height 20-30 nm and radii of curvature of the
order of 100 nm, literally covering a hydrophobic surface. However, the presence of such a
network is controversial (Mao, 2004). The occurrence of nano-bubbles on hydrophobic surfaces
has been suspected to influence colloidal stability (Snoswell, 2003) and cavitation probability
(Bunkin, 1997), and it was suggested that it is increased by submicrometric roughness (Ryan,
1998). The existence and stability of nanobubbles is hard to reconcile with conventional
thermodynamics. Such small cavities should rapidly dissolve because of their high internal
pressure; from the Laplace equation [Pin/-Pex/=2ylr, where Pint is the pressure from the concave side
of the bubble, Pext the pressure from its convex side, y is the surface tension and r the radius of the
bubble], the internal pressure of a 50-nm-radius air bubble in water would be 30 atm, and 140 atm
in a 10-nm-radius bubble, with Y(25oC)=72.75 mN/m. Nevertheless, Tyrrel et al.(Tyrrell, 2001)
noticed by AFM imaging that the bubbles were not spherical, but rather flattened on the surface,
which suggested a lower internal pressure. Besides, the bubbles seemed stable for 10-20 min. They
explained the phenomenon by air supersaturation of the water, possibly due to e.g. heating by the
AFM laser or entrainment of bubbles during solution exchange.
In Chapter 1, the contact angles of water on nano-topographies of well-defined dimensions and
surface chemistry were measured, and the results confirmed that not only air-trapping can occur
145
6. Discussion
between hydrophobic (8y=113°) nano-asperities, but also that air pockets were formed in PCL
(8y=77°) nano-pits, which is a common biomaterial used for cell culture. It was shown that the
low-rate advancing angles of water will depend on the geometric parameters of the nano
topography, which in tum determines the occurrence of air-trapping. In both the hydrophobic and
the hydrophilic case, the contact angles on nanotopographies were proven to be predictable by
analytical models, that so far had only been proven reliable to model the wetting of micro
topographies. These results are revealing, not only in view of potential applications (Blossey, 2003,
Grunze, 1999), and as a long-overdue answer to the question of air-trapping by surface roughness,
but also because they could serve to provide an explanation to the phenomenon ofnanotopography
induced cell behaviour.
The presence of air pockets inside the PCL nano-pits was shown indirectly as the Cassie-Baxter
model provided the best fit to the measured advancing angles of water at room temperature.
However, the cells in Chapter 4 were cultured in growth medium on nano-pillars at 37°C. Even
assuming that the PCL nano-pillars can trap air in water, not only will the temperature and
viscosity of the growth medium affect the contact angle, but also the medium contains 10% serum
and trace amounts of non-ionic surfactants (Tween-20, Triton X 100), both of which will favour
the spreading of the liquid inside the nano-topography. Also, it has been shown in Chapter 1 how
external pressure can force the water inside the surface textures, and how on certain nano
topographies (P21) very little energy was needed to effect the transition. When pouring a cell
suspension on the substrate, the velocity and the height at which the suspension is pipetted out are
not controlled, and this can add variability to the results, by inducing transitions from air-trapping
to asperity-filling. Therefore, while air-trapping is an interesting hypothesis that needs further
investigation, caution must be heeded when extending interpretations from low-rate advancing
angles of water to cell behaviour on similar surfaces.
Due to the slip-stick behaviour of water droplets during contact angle measurements and mainly
because of shortage of time, it was not possible to establish directly if the very same nano-pillars
used for cell culture induced air-trapping in water. However, coating the nano-pillars with gold
palladium, which is highly hydrophilic, masked the "proliferation-inhibiting" effect that the PCL
nano-pillars had on human fibroblasts. This could be due to several factors, one of them being the
unlikely occurrence of air-trapping on a hydrophilic surface. In that case, the different surface
coverage on gold flat and nano-pillared areas could be explained by the increased motility of
fibroblasts due to reduced surface area available for focal contact formation. The occurrence of air
trapping could also be an explanation for the decreased initial adhesion of rat epitenon fibroblasts
in flow. The latter in particular could be linked to the decreased surface friction that is expected on
146
6. Discussion
air-trapping roughness (Cottin-Bizonne C., 2003). By increasing the interfacial slippage, the
PMMA nano-pits might make initial cell adhesion in flow more unlikely.
If, on the other hand, we assume that there is no air-trapping at the surface, the question that raises
is how focal adhesions can form on and between protrusions. Previous TEM evidence (Dalby,
2004) suggests that the cells adhere only to the top of the pillars. However, in a recent article Curtis
et al. (Curtis, 2005) showed that the cell membrane can bend between nano-pillars. Even though
the TEM image shown in their paper does not provide information about the formation of
adhesions, it is clear that this question needs further investigation. Therefore, a possible hypothesis
is that the observed reduced number of mature focal contacts should be due primarily to the
reduced surface area available for focal contact formation, irrespective of the presence of air
bubbles between asperities. This could help explain the observation that cells generally grow on
nano-pits, unless their diameter is very large (Gallagher, 2002). Moreover, another reason for
decreased surface coverage of human fibroblasts on the nanopillars could be a higher migration
rate on the pattern (Gallagher, 2003). This effect should be mediated by the formation of nascent
focal complexes, which would provide sufficient attachment to ensure migration, but would not
mature into focal adhesions, which are necessary for fibroblast spreading and proliferation.
Nevertheless, an increased migration alone does not explain why the difference between pillars and
flat is much more evident on the uncoated PCL replicas, and barely visible on the gold-coated
replicas. Assuming no air-trapping, it could be argued that the difference in cell coverage in the
overview picture (Figure 72) of the gold-coated replicas is actually visible only at the edges of the
pattern. This would be consistent with increased migration rates and subsequent higher probability
of finding the cells outside the patterned area, given that the cells were proven to proliferate on the
gold-coated pillars. However, the difference in coverage between nano-pillars and flat on the
uncoated replicas was too striking and too uniform to be attributable to increased migration rates
only. Besides, the cells on the pillars were shown not to proliferate. Therefore, in the end, a likely
interpretation advocates for a synergistic effect of the uncoated PCL pillars in increasing the
migration rates of the fibroblasts and inhibiting their proliferation rate probably by air-trapping,
since this could efficiently ensure a reduction in available surface area. On the gold-coated pillars,
the formation of mature focal contacts seemed possible, and the proliferation was not inhibited,
therefore it might be that without air pockets the cells can form attachments even between pillars.
The possible presence of air-bubbles at the surface would also affect the interfacial force
experienced by a sedimenting cell or an approahing particle. This possibility has not been
considered in Chapter 3, where the DLVO interaction between a microsphere and a nano-patterned
plate was simulated. The question ofthe effect of nano-patterning on the interfacial forces between
regular nano-pits and 2 urn carboxylated spheres was raised by Curtis et al.(Curtis, 2001)
147
6. Discussion
Therefore, it seemed recommendable to investigate theoretically the DLVO interaction between a
microsphere and a nano-patterned silica plate. Surface Energy Integration showed that the energy
barriers towards particle adhesion predicted by the DLVO theory should be dramatically decreased
by nano-pillars, in agreement with previous suggestions and observations. This model relies on
several simplifying assumptions and does not include short-range forces. Nevertheless, this
characterisation is interesting, since the influence of surface roughness on colloidal forces is still
the object of research, and this model could prove very useful for future AFM colloid-probe
measurements of sphere-nanopattern interactions. A particular advantage of the SEI technique is
that hollow depressions can be modelled just as reliably as the surface protrusions, which have
been the only topography considered by most modelling attempts so far. Besides, surfaces of
arbitrary topology can be used, as long as mathematically representable. Thus, it is hoped that these
calculations will be validated by experimental evidence. If this will be the case, it would be
interesting to model the interaction between nanotopographies and spheres with dimensions,
refractive index and surface charge similar to a rounded cell. Afterwards, similar nanotopographies
could be fabricated, and their effect on cell sedimentation and initial adhesion monitored. Hence,
the understanding of intermolecular forces between a sphere and a nanopattern might help to shed
some light on the forces experienced by the cells when sedimenting on a nanotopography.
Future work
Having established the reliability of the Cassie-Baxter and Wenzel equations at the nano-scale, it
would be very interesting to investigate the behaviour of water droplets at the
hydrophobic/hydrophilic boundary, and to define this boundary in terms of the occurrence of air
trapping in the asperities. For that purpose, not only it will be necessary to fabricate polymeric
patterns of defined and regular geometries (cylinders, hemispherical-top cylinders, spheres), but the
accurate determination of their dimensions will be a pre-requisite for the reliable interpretation of
dynamic contact angle measurements.
The verification of the SEI model presented in Chapter 3 should be done by AFM force-distance
measurements.
In order to comprehend the effect of PCL nanopillars on fibroblast proliferation, two principal
questions are left open: the first concerns the existence of nano-bubbles between PCL nanopillars,
the second the likelihood offocal contact formation between nanopillars of order of 100 nm.
The question regarding the occurrence of air-trapping at nano-patterned biocompatible surfaces,
and its effect on cell culture in vitro should definitely be investigated further. To do so, regular
nano-pillared polymeric surfaces should be fabricated and their topography accurately
characterised. Secondly, the contact angle of growth medium at 37°C should be measured on these
148
6. Discussion
substrata, in order to investigate the presence of air pockets. It would also be interesting to repeat
the measurements with degased medium. Once determined if a surface traps air or not, and
especially in the second case, TEM investigations and immunofluorescence would be needed to
elucidate the question of cell attachment to the bottom area between protrusions. During the cell
culture, it should be made sure that the cell suspension is poured on the substrates in a manner
resemblant of the contact angle measurement, i.e. at similar velocity and height, to ensure
comparability with the contact angle measurement.
In order to determine if surface area reduction is the main cause for reduced fibroblast
proliferation, the experiment described above should be repeated for nano-pitted and nano-pillared
surfaces of different spacings and aspect ratios. In this context, the determination of the adhesion
type distribution should define if the cells can form as many mature focal adhesions on the pillars
as on the flat. This would also be linked to the migration of cells. Since it is suggested here that a
reason for decreased surface coverage could be the increased speed of migration on the nano
patterns, a quantitative analysis of fibroblast locomotion should be done. Subsequently, the
percentage of nascent focal complexes and mature adhesions on the nanopillars should be
determined and compared to the control.
The increased spreading of mouse endothelial cells on the same nano-pillars that inhibited human
fibroblast proliferation was extremely interesting. This work should be followed by a more
extensive investigation of this type of cell culture. If the present observations that nano-pillared
surfaces can favour the formation of a monolayer of endothelial cells was to be unambiguously
established, this finding could have exciting implications for the field of tissue engineered vascular
implants (Niklason, 1999, Richter, 2005). Such work should be followed by the culture of
endothelial cells in a flow system that incorporates a nano-pillared surface. Another interesting
experiment should involve the co-culture of human fibroblasts and endothelial cells on nano
pillars, since this could lead to the development of cell-selective surfaces.
149
7. Conclusion
7 Conclusion
The wetting of hydrophobic and hydrophilic nanotopographies is predictable by analytical laws,
which relate the low-rate advancing angles to the geometric parameters of the nanopatterns and to
the advancing angle on a flat surface of the same chemistry.
Air-trapping occurs between hydrophobic nano-topographies of appropriate geometric parameters.
However, air-trapping can "unexpectedly" occur on hydrophilic (contact angle <90°) nano
structured surfaces as well. This suggests that the hydrophobic/hydrophilic boundary is before 90°.
Surface Element Integration simulations predict that the energy barrier toward particle deposition
(l0 urn SiO2 sphere approaching a SiO2 nano-patterned plate, in I and 100 mM of 1:1 aqueous
electrolyte) should be dramatically decreased by the presence of surface asperities, and that the
energy barrier decreases with the radius of curvature of the asperities, in agreement with previous
suggestions.
The proliferation of human fibroblasts on PCL replicas is drastically reduced when the cells are
cultured on nano-pillars. This phenomenon disappears when the pillars are gold-coated. Possible
explanations include air-trapping between uncoated PCL nano-pillars and a (possibly related)
reduction of surface area available for the formation of mature focal adhesions; the latter, in tum,
would increase the speed of migration and inhibit the proliferation of the fibroblasts.
While human fibroblasts did not proliferate, on the PCL nano-pillars mouse endothelial cells
formed a cobble-stone pattern suggestive of a close-packed monolayer, which is more resemblant
of their morphology in vivo. This differential effect of nano-pillars on cell behaviour evokes the
possibility of creating cell-selective surfaces.
150
8. Appendix
8 Appendix. Solutions
This section contains the recipes ofthe different solutions, in alphabetical order.
Antibiotics mix. 144 mM Glutamine (Gibco), 11.9 u.M Amphoterin (Gibco), 1950 U/ml Penicillin!
Streptomycin (Gibco), 7 ml 7.5% Bicarbonate (Gibco).
1% BSA/PBS. 1 g BSA (bovine serum albumin, Gibco) into 100 ml PBS. Store frozen.
Coomassie Blue Stain. 225 ml methanol, (BDH) 50 ml glacial acetic acid (BDH), filled to 500 ml
RO water. Add 1.25 g Coomassie Brilliant Blue (BDH,UK).
DMEM. 71% Dulbecco's Modified Eagle's medium (Sigma, UK), 17% Medium 199 (Sigma), 9%
foetal calf serum (Life Technologies, UK), 1.6% 200 mM L-glutamine (Life Technologies) and
0.9% 100 mM sodium pyruvate (Life Technologies).
Eagles water. 134 ml of MilliporeTM Reverse Osmosis (MilliQ RO) purified water, autoclaved
and stored at 4°C.
ECT. 180 ml Eagles water, 16 ml BHK21XI0 (Biowest), 20 ml Calf serum (Gibco), 5 ml
Antibiotics mix, 20 ml Tryptose phosphate broth (Sigma), 1 ml 7.5 % Sodium Bicarbonate
(Gibco).
Formal Saline (made to 1 1 RO water). 8 g NaCl, 0.2 g KCl, 1.15 g Na2HP04, 0.2 g KH2P04,
100 ml 40% formaldehyde (Sigma), pH adjusted to 7.2, add 2 g sucrose.
HamsFIO. 500 ml HamsFI0 (Biowest), 15 ml foetal calf serum (Gibco), 12.5 ml anibiotics mix,
2.5 ml 7.5% Sodium Bicarbonate (Gibco), 5 ml ITS (Insulin, Transferrin, Selenite solution, Gibco).
HECT. 180 ml HEPES water, 16 ml BHK21XI0 (Biowest), 20 ml Calf serum (Gibco), 5 ml
Antibiotics mix, 20 ml Tryptose phosphate broth (Sigma), 1 ml 7.5 % Sodium Bicarbonate
(Gibco).
Hepes Saline buffer. 8 NaCl, 0.4 KCl, 1 D-glucose(Fisher), 2.38 HEPES ((N-2 hydroxyethyl
piperazine-N' 2 ethane sulphonic acid, BDH), 0.1 Phenol-Red Sodium salt (Sigma), 1 1 RO water,
pH adjusted to 7.5.
HEPES water. 1 litre RO water supplemented with 5.25 g HEPES, pH-adjusted (with NaOH) to
pH7.5 and stored at 4°C.
Permeabilising buffer. 10.3 g sucrose, 0.292 g NaCl, 0.06 g MgCI2-6H20, 0.476 g Hepes in 100
ml PBS. Adjust pH to 7.2, then add 0.5 ml Triton X.
8. Appendix
Phosphate buffered saline (PBS) X10 (made to 1 1 RO water). 11.5 gil Na2HP04 (BDH), 2 g
KH2P04 (BDH), 80 gil NaCl (BDH), 2 gil KCl (BDH). adjust to Ph7.4
0.5% Tween/PBS. 0.5 ml Tween 20 into 100 ml PBS.
Versene buffer. 8 g NaCl, 0.4 g KCl, 1 g D-glucose, 2.38 g HEPES, 0.1 g Phenol-Red, 0.2 g
EDTA (Di Sodium salt, Sigma), 1 litre RO water, pH adjusted to 7.5.
152
9. Bibliographv
9 Bibliography
ABDELSALAM, M. E., BARTLETT, P.N., KELF, T., BAUMBERG, J. (2005) Wetting ofregularly structured gold surfaces. Langmuir, 21, 1753-1757.
ARNOLD, M., CAVALCANTI-ADAM E.A., GLASS R., BLUMMEL J., ECK W.,KANTLEHNER M., KESSLER J., SPATZ J.P. (2004) Activation of integrin function bynanopattemed adhesive interfaces. ChemPhysChem, 5, 383-388.
ASHTON, J. (1921) A revision of the Australian Cicadiae. Part 1. Proc. Roy. Soc. Viet., 33,87107.
ATTARD, P., ANTELMI, D., LARSON, 1. (2000) Comparison of the zeta potential with thediffuse layer potential from charge titration. Langmuir, 16, 1542-1552.
AVNUR, Z., GEIGER, B. (1981) The removal of extracellular Fibronectin from areas of cellsubstrate contact. Cell, 25,121-132.
BARTHLOOT, W., NEINHUIS, C. (1997) Purity of the sacred lotus, or escape fromcontamination in biological surfaces. Planta, 202, 1-8.
BAUM, c., MEYER, W., STELZER, R., FLEISHER, L.G., SIEBERS, D. (2001) Averagenanorough skin surface of the pilot whale (Globicephala melas, Delphinidae): considerations on theself-cleaning abilities based on nanoroughness. Marine Biology Online.
BHATTACHARJEE, S., ELIMELECH, M. (1997) Surface Element Integration: A NovelTechnique for Evaluation of DLVO Interaction between a Particle and a Flat Plate. J. Coil. Int.Sci., 193, 273-285.
B1CO,J., MARZOLIN, c., QUERE D. (1999) Pearl drops. Europhys. Lett., 47, 220-226.
BICO, J., THIELE, U., QUERE, D. (2002) Wetting of textured surfaces. Coil. Surf. A, 206, 41-46.
BlCO, J., TORDEUX C., QUERE D. (2001) Rough wetting. Europhys. Lett., 55,214-220.
BLOSSEY, R. (2003) Self-cleaning surfaces-virtual realities. Nature Materials, 2, 301-306.
BOHN, H. F., FEDERLE, W. (2004) Insect aquaplaning: Nephentes pitcher plants capture preywith their peristome, a fully wettable water-lubricated anisotropic surface. PNAS, 101, 1413814143.
BONGRAND, P. (1995) Adhesion of cells. IN LIPOWSKY, R., SACKMANN, E. (Ed.) Handbookof biological physics. Elsevier Science B.V.
BONGRAND, P., CLAESSON PM, CURTIS ASG (EDS) (1994) Studying cell adhesion, BerlinHeidelberg, Springer-Verlag.
BOWEN, W. R., DONEVA, T.A. (2000) Atomic force microscopy studies of membranes: effect ofsurface roughness on double-layer interactions and particle adhesion. J. Coil. Int. Sci., 229, 544549.
BOWEN, W. R., DONEVA, T.A., STOTON, J.A. (2002) The use of atomic force microscopy toquantify membrane surface electrical properties. Colloids and Surfaces A; Physicochemical andEngineering Aspects, 201, 73-83.
BRUNETTE, D. M. (1986a) Fibroblasts on micromachined substrata orient hierarchically togrooves of different dimensions. Exp. Cell Res., 164, 11-26.
9. Bibliography
BRUNETTE, D. M. (1986b) Spreading and orientation of epithelial cells on grooved substrata.Exp. Cell Res., 167,203-217.
BUNKIN, N. F., KISELEVA, O.A., LOBEYEV, A.V., MOVCHAN, T.G., NINHAM, B.W.,VINOGRADOVA, OJ. (1997) Effect of salts and dissolved gas on optical cavitation nearhydrophobic and hydrophilic surfaces. Langmuir, 13, 3024-3028.
BURTON, Z., BHUSHAN, B. (2005) Nano Letters, 5, 1607-1613.
CASEY, B. G., MONAGHAN, W., WILKINSON, C.D.W. (1997) Embossing nanoscale featuresand environments. Microelec. Eng., 35, 393-396.
CASSIE, A. B. D., BAXTER, S. (1944) Wettability of porous surfaces. Trans. Farad. Soc., 40, 546.
CASTNER, D. G., RATNER, B.D. (2002) Biomedical surface science: Foundations to frontiers.Surf Sci, 500, 28-60.
CHAPEL, J. P. (1994) Electrolyte species dependent hydration forces between silica surfaces.Langmuir.
CHEHROUDI, B., BRUNETTE, D.M. (1995) Effects of surface topography on cell behaviour. INDONALD, D., WISE L, ALTOBELLI DE, YASZENSKI MJ, GRESSER JD, SCHWARTZ ER(Ed.) Encyclopedic handbook of biomaterials and bioengineering. Part S: Materials. New York,Marcel Dekker.
CHEHROUDI, B., BRUNETTE, D.M. (2002) Subcutaneous microfabricated surfaces inhibitepithelial recession and promote long-term surfvival of percutaneous implants. Biomaterials, 23,229-237.
CHEHROUDI, B., GOULD, T.R., BRUNETTE D.M. (1988) Effects of a grooved epoxysubstratum on epithelial cell behaviour in vitro and in vivo. J. Biomed. Mat. Res., 22, 459-473.
CHEHROUDI, B., MCDONNELL, D., BRUNETTE, D.M. (1997) The effects of micromachinedsurfaces on the formation of bonelike tissue on subcutaneous implants as assessed by radiographyand computer image processing. J. Biomed. Mat. Res., 34, 279-290.
CHEN, S., SPRINGER T.A. (2001) Selectin receptor-ligand bonds: Formation limited by shearrate and dissociation governed by the Bell model. PNAS, 98.
CHEN, W., FADEEV, A.Y., HSIEH, M.C., ONER, D., YOUNGBLOOD, J., MCCARTHY, T.J.(1999) Ultrahydrophobic and ultralyophobic surfaces: some comments and examples. Langmuir,15,3395-3399.
CHENG, Y., RODAK, D.E. (2005) Is the lotus leaf superhydrophobic? Appl. Phys. Lett., 86,144101.
CHURAEV, N. V. (1995) Contact angles and surface forces. Adv. ColI. Interf. Sc., 58, 87-118.
CLARK, P., CONNOLLY P, CURTIS ASG, DOW JAT, WILKINSON COW (1991) Cellguidance by ultrafine topography in vitro. J. Cell Sci., 99, 73-77.
CLARK, P., CONNOLLY, P., CURTIS, ASG., DOW, JAT., WILKINSON, COW. (1987)Topographical conrol of cell behaviour I: Simple step cues. Development, 99, 439-448.
CLARK, P., CONNOLLY, P., CURTIS, ASG., DOW, JAT., WILKINSON, COW. (1990)Topographical control of cell behaviour II: Multiple grooved substrata. Development, 108, 635644.
154
9. Bibliography
CONSIDINE, R., DRUMMOND CJ (2001) Surface roughness and surface force measurement: acomparison of electrostatic potentials derived from atomic force microscopy and electrophoreticmobility measurements. Langmuir, 17, 777-7783.
COTTIN-BIZONNE c., B. J. L., BOCQUET L., CHARLAIX E. (2003) Low-friction flows ofliquid at nanopattemed interfaces. Nature Materials, 2, 237-240.
CURTIS, AS. G. (1962) Cell contact and adhesion. BioI. Rev., 37, 82-129.
CURTIS, A S. G., CASEY B., GALLAGHER J.O., PASQUI, D., WOOD., M.A, WILKINSON,C.D.W. (2001) Substratum nanotopography and the adhesion of biological cells. Are symmetry orregularity ofnanotopography important? Biophys Chern, 94,275-283.
CURTIS, A. S. G., DALBY, MJ., GADEGAARD, N. (2005) Nanoimprinting onto cells. J. R. Soc.Interface, online.
CURTIS, A. S. G., YARDE, M. (1964) Control of cell behaviour: topological factors. J. Nat.Cancer Inst., 33, 15-26.
CURTIS, A S. G., WILKINSON, C.D.W. (1997) Topographical control of cells. Biomaterials, 18,1573-1583.
CURTIS, A. S. G., WILKINSON, C.D. W. (1998a) Reactions of cells to topography. J. Biomater.Sci. Polymer Edn., 9, 1313-1329.
CURTIS, A S. G., WILKINSON, C.D.W. (1998b) Topographical control of cell migration. INSOLL, D., WESSELS 0 (Ed.) Motion Analysis of Living Cells. New York, Wiley-Liss.
CZARNECKI, J., DABROS, T. (1980) Attenuation of the van der Waals attraction energy in theparticle/semi-infinite medium system due to the roughness of the particle surface. J. Coli. Int. Sci.,78,25-30.
DALBY, M., YARWOOD SJ, RIEHLE MO, JOHNSTONE HJH, AFFROSSMAN S, CURTISASG (2002a) Increasing fibroblast response to materials using nanotopography: morphological andgenetic measurements of cell response to 13-nm-high polymer demixed islands. Exp Cell Res, 276,1-9.
DALBY, M. J. (2005) Topographically induced direct cell mechanotransduction. Med. Eng. Phys.,27,730-742.
DALBY, M. J., RIEHLE, M.O., AFFROSSMAN, S., CURTIS, A.S.G. (2002b) In vitro reaction ofendothelial cells to polymer demixed nanotopography. Biomaterials, 23, 2945-2954.
DALBY, M. J., RIEHLE, M.O., SUTHERLAND, D.S., AGHELI, H., CURTIS, AS.G. (2004)Fibroblast response to a controlled nanoenvironment produced by colloidal lithography. J BiomedMater Res, 69, 314-322.
DANEN, E. H. J., SONNENBERG, A (2003) Integrins in regulation of tissue development andfunction. J. Pathol., 201, 632-641.
DECKER, E. L., GAROFF, S. (1996) Using vibrational noise to probe energy barriers producingcontact angle hysteresis. Langmuir, 12,21 00-211 O.
DEMALI, K. A., WENNERBERG K., BURRIDGE, K. (2003) Integrin signaling to the actincytoskeleton. Curro Op. Cell. BioI., 15, 572-582.
155
9. Bibliography
DENIS, F. A, HANARP, P., SUTHERLAND, D.S., GOLD, J., MUSTIN, C, ROUXHET, P.G.,DUFRENE, Y.F. (2002) Protein adsorption on model surfaces with controlled nanotopography andchemistry. Lamgmuir, 18, 819-828.
DERJAGUIN, B. V. (1934) Kolloid Z., 69,155-164.
DOROSZEWSKI, J., KIWALA A (1988) Adhesion and locomotion of granulocytes under flowconditions. J. Cell Sci., 90, 335-340.
DOROSZEWSKI, J., SKIERSKI, J., PRZADKA, L. (1977) Interaction of neoplastic cells withglass surface under flow conditions. Exp. Cell. Res., 104,335-343.
DRECHSLER, A., PETONG, N., ZHANG, J., KWOK, D.Y., GRUNDKE,K. (2004) Forcemeasurements between Teflon AF and colloidal silica particles in electrolyte solutions. Coll. Surf.A, 250, 357-366.
DUCKER, W. A., SENDEN, T,J., PASHLEY, R.M. (1991) Direct measurement of colloidal forcesusing an atomic force microscope. Nature, 353, 239-241.
DUCKER, W. A., SENDEN, T,J., PASHLEY, R.M. (1992) Measurement of forces in liquids usinga force microscope. Langmuir, 8, 1831-1836.
DUNN, G. A, BROWN, AF. (1986) Alignment of fibroblasts on grooved surfaces described by asimple geometric transformation. J. Cell Sci., 83,313-340.
DUNN, G. A., HEATH, J.P. (1976) A new hypothesis of contact guidance in tissue cells. Exp. CellRes., 101, 1-14.
DVORAK, 1., STOTLER W (1971) A controlled-environment culture system for high resolutionlight microscopy. Exp Cell Res, 68, 144-148.
ELIMELECH, M., O'MELIA, CR. (1990) Effect of particle size on collision efficiency in thedeposition of Brownian particles with electrostatic energy barriers. Langmuir, 6, 1153-1163.
FLEMMING, R. G., MURPHY, C.J., ABRAMS, G.A, GOODMAN, S.L., NEALEY, P.F. (1999)Effects of synthetic micro- and nano-structured surfaces on cell behaviour. Biomaterials, 20, 573588.
FURSTNER, R., BARTHLOTT, W., NEINHUIS, C, WALZEL, P. (2005) Wetting and selfcleaning properties of artificial superhydrophobic surfaces. Langmuir, 21, 956-961.
GADEGAARD, N., MOSLER, S., LARSEN, N.B. (2003a) Biomimetic polymer nanostructures byinjection molding. Macromol. Mater. Eng., 288, 76-83.
GADEGAARD, N., THOMS S., MACINTYRE D.S., MCGHEE K., GALLAGHER J.O., CASEYB., WILKINSON C.D.W. (2003b) Arrays of nano-dots for cellular engineering. Microelec. Eng.,67-68, 162-168.
GALLAGHER, J. O. (2003) Interactions of cells with nanotopography. PhD Thesis. Infection andImmunity, IBLS. University of Glasgow.
GALLAGHER, J. 0., MCGHEE, K.F., WILKINSON, CD.W., RIEHLE, M.O. (2002) Interactionof animal cells with ordered nanotopography. IEEE Transactions on Nanobioscience, 1,24-28.
GARCIA, A. J., VEGA, M.D., BOETTIGER, D. (1999) Modulation of cell proliferation anddifferentiation through substrate-dependent changes in fibronectin conformation. Mol. Biol. Cell,10, 785-798.
156
9. Bibliography
GEIGER, B., BERSHADSKY, A, PANKOV, R., YAMADA, K.M. (2001) Transmembraneextracellular matrix-cytoskeleton crosstalk. Nature, 2, 793-804.
GIANCOTTI, F. G., TARONE, G. (2003) Positional control of cell fate through jointintegrin/receptor protein kinase signaling. Annu. Rev. Cell Dev. Bio., 19, 173-206.
GILLESPIE, P. G., WALKER, R.G. (2001) Molecular basis of mechanosensory transduction.Nature, 413, 194-202.
GLEICHE, M., CHI, L.F., FUCHS, H. (2000) Nanoscopic channel lattices with controlledanisotropic wetting. Nature, 403, 173-175.
GOODMAN, S. L., SIMS, P.A, ALBRECHT, R.M. (1996) Three-dimensional extracellular matrixtextured biomaterials. Biomaterials, 17,2087-2095.
GOTZINGER, M., PEUKERT, W. (2004) Particle adhesion force distributions on rough surfaces.Langmuir, 20, 5298-5303.
GRABBE, A., HORN, R.G. (1993) Double-layer and hydration forces measured between silicasheets subjected to various surface treatments. J. ColI. Int. Sci., 157,375-383.
GRUNZE, M. (1999) Driven Liquids. Science, 283, 41-45.
GU, Z., UETSUKA, H., TAKAHASHI, K., NAKAJIMA, R., ONISHI, H., UJISHIMA, A, SATO,O. (2003) Structural color and the Lotus effect. Angew. Chern. Int. Ed., 42,894-897.
GUMBINER, B. M. (1996) Cell adhesion: the molecular basis of tissue architecture andmorphogenesis. Cell, 84, 345-357.
HAMAKER, H. C. (1937) The London-Van Der Waals attraction between spherical particles.Physica, 10, 1058-1072.
HAPPEL, J., BRENNER H (1965) Low Reynolds Number Hydrodynamics, New York, PrenticeHall, Inc.
HARRISON, R. G. (1910) On the stereotropism of embryonic cells. J Exp Zool, 10.
HARTLEY, P. G., LARSON, I., SCALES, PJ. (1997) Electrokinetic and direct forcemeasurements between silica and mica surfaces in dilute electrolyte solutions. Langmuir, 13,22072214.
HAYASHI, T., PERTSIN, AJ., GRUNZE, M (2002) Grand canonical Monte Carlo simulation ofhydration forces between nonorienting and orienting structureless walls. J. Chern. Phys., 117,6271-6280.
HE, 8., LEE, J., PATANKAR, N.A (2004) Contact angle hysteresis on rough hydrophobicsurfaces. ColI. Surf. A, 248, 101-104.
HERMAN, M. C., PAPADOPOULOS, K.D. (1991) A method for modeling the interactions ofparallel flat plate systems with surface features. J. ColI. Int. ScL, 142,331-342.
HERMINGHAUS, S. (2000) Roughness-induced non-wetting. Europhys. Lett., 52, 165.
HERRWERTH, S., ECK, W., REINHARDT, S., GRUNZE, M. (2003) Factors that determine theprotein resistance of oligoether self-assembled monolayers- internal hydrophilicity, terminalhydrophilicity, and lateral packing density. J. Am. Chern. Soc., 125,9359-9366.
HOEK, E. M. V., BHATTACHARJEE, S., ELIMELECH, M. (2003) Effect of membrane surfaceroughness on colloid-membrane DLVO interactions. Langmuir, 19,4836-4847.
157
9. Bibliography
HOEKS, A. P. G., SAMIJO, S.K., BRANDS, PJ., RENEMAN, R.S. (1995) Noninvasivedetermination of shear-rate distribution across the arterial lumen. Hypertension, 26, 26-33.
HOGG, R., HEALY, T.W., FUERSTENAU, D.W. (1966) Mutual coagulation of colloidaldispersions. Trans. Faraday Soc., 62, 1638-1651.
HOLLOWAY, P. J. (1969) The effects of superficial wax on leafwettability. Ann. Appl. Biol., 63,145-153.
HORN, R. G., SMITH, D.T., HALLER, W. (1989) Surface forces and viscosity of water measuredbetween silica sheets. Chern. Phys. Lett., 162,404-408.
HULL, M., KITCHNER, J.A. (1969) Interaction of spherical colloidal particles with planarsurfaces. Trans. Faraday Soc., 65.
HUNTER, R. (2002) The significance of stagnant layer conduction in electrokinetics. Adv. Coll.Int. Sc., 100-102, 153-167.
HYNES, R. O. (2002) Integrins: bidirectional, allosteric signaling machines. Cell, 110,673-687.
ISHIDA N., 1., T., MIYAHARA, M., HIGASHITANI, K. (2000) Nano bubbles on a hydrophobicsurface in water observed by tapping-mode atomic force microscopy. Langmuir, 16,6377-6380.
ISRAELACHVILI, J., PASHLEY, R. (1982) The hydrophobic interaction is long range, decayingexponentially with distance. Nature, 300, 341-342.
ISRAELACHVILI, J., WENNERSTROM, H. (1996) Role of hydration and water structure inbiological and colloidal interactions. Nature, 379, 219-225.
ISRAELACHVILI, J. N. (1991) Intermolecular and surface forces. 2nd ed., Academic Press.
IZZARD, C. S., LOCHNER, L.R. (1976) Cell-to-substrate contacts in living fibroblasts: aninterference reflexion study with an evaluation of the technique. J. Cell Sci., 21, 129-159.
JANUSZ, W., PATKOWSKI, J., CHIBOWSKI, S. (2003) Competitive adsorption of Ca2+ andZn(II) ions at monodispersed Si02/electrolyte solution interface. J. Coll. Int. Sci., 266, 259-268.
JOHNSON, S. B., DRUMMOND, CJ.,SCALES, PJ., NISHIMURA, S. (1995) Comparison oftechniques for measuring the electrical double-layer properties of surfaces in aqueous solution:hexadecyltrimethylammonium bromide self-assembly structures as a model system. Langmuir, 11,2367-2375.
JOPP, J., GRULL, H., YERUSHALMI-ROZEN, R. (2004) Wetting behaviour of water droplets onhydrophobic microtextures of comparable size. Langmuir, 20,10015-10019.
KATZ, B., ZAMIR, E., BERSHADSKY, Z.K., YAMADA, K.M., GEIGER, B. (2000) Physicalstate of the extracellular matrix regulates the structure and molecular composition of cell-matrixadhesions. Mol. BioI. Cell, 11, 1047-1060.
KAVERINA, 1., KRYLYSHKINA, 0., SMALL, J.V. (2002) Regulation of substrate adhesiondynamics during cell motility. IntJ Bioche Cell Biol, 34, 746-761.
KIHIRA, H., RYDE, N., MATIJEVIC, E. (1992) Kinetics ofheterocoagulation. Part 2. The effectof the discreteness of surface charge. 1. Chern. Soc. Faraday Trans., 88,2379-2386.
KRUPENKIN, T. N., TAYLOR, J.A., SCHNEIDER, T.M., YANG, S. (2004) From rolling ball tocomplete wetting: the dynamic tuning of liquids on nanostructured surfaces. Langmuir, 20, 38243827.
158
9. Bibliography
KWOK, D. Y., GIETZELT, T., GRUNDKE, K., JACOBASCH, H., NEUMANN, AW. (1997)Contact angle measurements and contact angle interpretation. 1. Contact angle measurements byaxisymmetric drop shape analysis and a goniometer sessile drop technique. Langmuir, 13, 28802894.
KWOK, D. Y, LIN, R., NEUMANN, A.W. (1996) Low-rate dynamic and static contact angles andthe determination of solid surface tensions. Colloids and surfaces A, 116,63-77.
LAFUMA, A., QUERE, D. (2003) Superhydrophobic states. Nature Mat., 2, 457-460.
LAM, C. N. c., WU, R., LI, D., HAIR, M.L., NEUMANN, AW. (2002) Study of the advancingand receding angles: liquid sorption as a cause of contact angle hysteresis. Adv. ColI. Int. Sc., 96,169-191.
LANGLOIS, W. (1964) Slow Viscous Flow, New York, Macmillan.
LAU, K. K. S., BICO, J., TEO, K.B.K., CHHOWALLA, M., AMARATUNGA, G.AJ., MILNE,W.I., MCKINLEY, G.H., GLEASON, K.K. (2003) Superhydrophobic carbon nanotube forest.NanoLetters, 3,1701-1705.
LECKBAND, D., ISRAELACHVILI, J. (2001) Intermolecular forces in biology. Q. Rev. Biophys.,34, 105-267.
LEE, J., PATANKAR, N.A (2005) A roughness-based wettability switching membrane device forhydrophobic surfaces. J. Micromech. Microeng., 15,591-600.
LI, S., BHATIA, S., HU, Y., SHIU, Y., LI, Y., USAMI, S., CHIEN, S. (2001) Effects ofmorphological patterning on endothelial cell migration. Biorheology, 38,101-108.
LIM, J. Y, LUI, X., VOGLER, E.A., DONAHUE, H.J. (2004) Systematic varation in osteoblastadhesion and phenotype with substratum surface characteristics. J. Biomed. Mater. Res., 68A, 504512.
LO, C. H., WANG, H.B., DAMBO, M., WANG, Y.L. (2000) Cell movement is guided by therigidity of the substrate. Biophys. J., 79, 144-152.
LU, J. R., SU, TJ., THOMAS, R.K. (1999) Structural conformation of bovine serum albuminlayers at the air-water interface studied by neutron reflection. J. ColI. Int. Sc., 213, 426-437.
MAHESHWARI, G., BROWN, G., LAUFFENBURGER, D.A., WELLS, A., GRIFFITH, G.G.(2000) Cell adhesion and motility depend on nanoscale RGD clustering. J. Cell Sci., 113, 16771686.
MAO, M., ZHANG, J., YOON, R., DUCKER, W.A (2004) Is there a thin film of air at theinterface between water and smooth hydrophobic solids? Langmuir, 20, 1843-1849.
MARMUR, A. (2003) Wetting on hydrophobic rough surfaces: to be heterogeneous or not to be?Langmuir, 19,8343-8348.
MARMUR, A. (2004) The Lotus Effect: superhydrophobicity and metastability. Langmuir, 20,3517-3519.
MARTINES, E., SEUNARINE, K., MORGAN, H., GADEGAARD, N., WILKINSON,CCD.W.,RIEHLE, M. (2005) Super-hydrophobicity and super-hydrophilicity of regularnanopatterns. Nano Letters, 5, 2097-2103.
159
9. Bibliography
MASSIA, S. P., HUBBELL, J.A. (1991) An RGD spacing of 440 nm is sufficient for integrinavb3-mediated fibroblast spreading and 140 nm for focal contacts and stress fiber formation. J. CellBio., 114, 1089-1100.
MCCLARY, K. B., UGAROVA, T., GRAINGER, D.W. (2000) Modulating fibroblast adhesion,spreadingm and proliferation using self-assembled monolayer films of alkylthiolates on gold. J.Biomed. Mater. Res., 50, 428-439.
MCHALE, G., SHIRTCLIFFE, N.J., AQIL, S., PERRY, C.C., NEWTON, M.1. (2004) Topographydriven spreading. Phys. Rev. Lett., 93, 036102-1.
MEAGHER, L. (1992) Direct measurement of forces between silica surfaces in aqueous CaCI2solutions using an atomic force microscope. J. Coil. Int. Sci., 152, 293-295.
MEIRON, T. S., MARMUR, A., SAGUY, I.S. (2004) Contact angle measurement on roughsurfaces. J. Coil. Int. Sci., 274, 637-644.
MEREDITH, D.O., ESCHBACH, L., WOOD, M.A., RIEHLE, M.O., CURTIS, A.S.G.,RICHARDS, R.G. (2005) Human fibroblasts reactions to standard and electropolished titanium andTi-6AI-7Nb, and electropolished stainless steel. J Biomed Mat Res, 75A, 541-555.
MEREDITH, J. E., FAZELI, B., SHWARZ, M.A. (1993) The extracellular matrix as a cell survivalfactor. Mol Bioi Cell, 4, 953-961.
MIWA, M., NAKAJIMA, A., FUJISHIMA, A., HASHIMOTO, K., WATANABE, T. (2000)Effects of the surface roughness on sliding angles of water droplets on superhydrophobic surfaces.Langmuir, 16,5754-5760.
MUNSON, B., YOUNG DF, OKIISHI TH (1990) Fundamentals of Fluid Mechanics, New York,John Wiley & Sons, Inc.
NAKAE, H., INUI,R., HIRATA, Y., SAITO, H. (1998) Effects of surface roughness onwettability. Acta Mater., 46, 2313-2318.
NEINHUIS, c., BARTHLOTT, W. (1997) Characterization and distribution of water-repellent,self-cleaning plant surfaces. Annals of Botany, 79, 667-677.
NIKLASON, L. E., GAO, J., ABBOTT, W.M., HIRSHI, K.K., HOUSER, S., MARINI, R.,LANGER, R. (1999) Functional arteries grown In vitro. Science, 284, 489-493.
NINHAM, B. W. (1999) On progress in forces since the DLVO theory. Adv. Coil. Int. Sc., 83, 117.
OHARA, P. T., BUCK, R.C. (1979) Contact guidance in vitro. Exp. Cell Res., 121,235-249.
ONDA, T., SHIBUICHI, S., SATOH, N., TSUJII, K. (1996) Super-water-repellent fractal surfaces.Langmuir, 12,2125-2127.
ONER, D., MCCARTHY, TJ. (2000) Ultrahydrophobic Surfaces. Effects of topography lenghtscales on wettability. Langmuir, 7777-7782.
OSTUNI, E., CHAPMAN, R.G., LIANG, M.N., MELULENI, G., PIER, G., INGBER, D.E.,WHITESIDES, G.M. (2001) Self-assembled monolayers that resist the adsorption of proteins andthe adhesion of bacterial and mammalian cells. Langmuir, 17,6336-6343.
OTTEN, A., HERMINGHAUS, S. (2004) How plants keep dry; a physicist's point of view.Langmuir, 20, 2405-2408.
160
9. Bibliography
PALACEK, S. P., LOFTUS, J.C., GINSBERG, M.H., LAUFFENBERGER, D.A., HORWITZ,A.F. (1997) Integrin-ligand binding properties govern cell migration speed through cell-substratumadhesiveness. Nature, 385, 537-540.
PARKER, J. L., CLAESSON, P.M., ATTARD, P. (1994) J. Phys. Chern., 98, 8468.
PATANKAR, N. A. (2003) On the modeling of hydrophobic contact angles on rough surfaces.Langmuir, 19, 1249-1253.
PATANKAR, N. A. (2004a) Mimicking the Lotus effect: influence of double roughness structuresand slender pillars. Langmuir, 20, 8209-8213.
PATANKAR, N. A. (2004b) Transition between Superhydrophobic states on rough surfaces.Langmuir, 20, 7097-7102.
PELHAM, R. J. J., WANG, Y. (1997) Cell locomotion and focal adhesions are regulated bysubstrate flexibility. PNAS, 94, 13661-13665.
PERTSIN, A. J., GRUNZE, M. (2000) Computer simulation of water near the surface ofoligo(ethylene glycol)-terminated alkanethiol self-assembled monolayers. Langmuir, 16, 88298841.
PETRIE, R. J., BAILEY, T., GORMAN, C.R, GENZER, J. (2004) Fast directed motion of "fakir"droplets. Langmuir, 20, 9893-9896.
PIERRES, A., BENOLIEL AM, BONGRAND P (1996) Measuring bonds between surfaceassociated molecules. J Immun Meth, 196, 105-120.
POMPE, T., RENNER, L., WERNER, C. (2005) Nanoscale features of fibronectin fibrillogenesisdepend on protein-substrate interaction and cytoskeleton structure. Biophys J, 88, 527-534.
POYTON, R., BRANTON D (1970) A multipurpose microperfusion chamber. Exp Cell Res, 60,109-114.
PRANDTL, L. (1952) Essentials of Fluid Dynamics, London, Blackie and Son Ltd.
QUERE, D. (2002) Rough ideas on wetting. Physica A, 313, 32-46.
QUERE, D. (2004) Model droplets. Nature Materials, 3, 79-80.
QUERE, D., LAFUMA, A., BICO, J. (2003) Slippy and sticky microtextured solids. Nanotech., 14,1109-1112.
RASBAND, W. S. (1997-2005) Image J. Betheda, Maryland, USA, U.S. National Institutes ofHealth.
READ, N. D., KELLOCH, LJ., COLLINS, TJ., GUNDLACH, A.M. (1997) Role of topographysensing for infection-structure differentiation in cereal rust fungi. Planta, 202, 163-170.
RICHTER, G. M., STAMPFL, U., STAMPFL, S., REHNITZ, c., HOLLER, S., SCHNABEL, P.,GRUNZE, M. (2005) A new polymer concept for coating of vascular stents using PTFEP(poly(bis(trifluoroethoxy)phosphazene) to reduce thrombogenicity and late in-stent stenosis.Investigative Radiology, 40,210-218.
RIEDEL, M., MULLER, R, WINTERMANTEL, E. (2001) Protein adsorption and monocyteactivation on germanium nanopyramids. Biomaterials, 22, 2307-2316.
RIEHLE, M. O. (2003) Cell behaviour of rat calvaria bone cells on surfaces with randomnanometric features. Mat. Sci. Eng. C, 23, 337-340.
161
9. Bibliography
ROURA, P., FORT, J. (2002) Comments on "Effects of the surface roughness on sliding angles ofwater droplets on superhydrophobic surfaces". Langmuir, 18,566-569.
ROVENSKI, Y. A. (1998) Cellular and molecular mechanisms of tumor invasion. Biochemistry(Moscow), 63,1029-1043.
ROVENSKI, Y. A., DOMNINA, L.V., IVANOVA, O.Y., VASILIEV, J.M. (1999) Locomotorybehaviour of epitheliocytes and fibroblasts on metallic grids. J. Cell Sci., 112, 1273-1282.
ROZLOSNIK, N., GERSTENBERG, M.C., LARSEN, N.B. (2003) Effect of Solvents andConcentration on the Formation of a Self-Assembled Monolayer of Octadecylsiloxane on Silicon(001). Langmuir, 19, 1182.
RUARDY, T. G., MOORLAG, H.E., SCHAKENRAAD, J.M., VAN DER MEl, H.C.,BUSSCHER, H.J. (1997) Growth of fibroblasts and endothelial cells on wettability gradientsurfaces. J. ColI. Int. Sci., 188,209-217.
RYAN, W. L., HEMMINGSEN, E.A. (1998) Bubble formation at porous hydrophobic surfaces. J.ColI. Int. Sc.i, 197, 101-107.
SA WHNEY, R. K., HOWARD, J. (2002) Slow local movements of collagen fibers by fibroblastsdrive the rapid global self-organization of collagen gels. J. Cell Bio., 157, 1083-1091.
SHIBUICHI, S., ONDA, T., SATOH, N., TSUJI I, K. (1996) Super water-repellent surfacesresulting from fractal structures. J. Phys. Chern., 100, 19512-19517.
SHIRTCLIFFE, N. J., MCHALE, G., NEWTON, M.I., CHABROL, G., PERRY, c.c. (2004)Dual-scale roughness produces unusually water-repellent surfaces. Adv. Mater., 16, 1929-1932.
SHIRTCLIFFE, N. J., MCHALE, G., NEWTON, M.I., PERRY, C.C. (2005) Wetting and wettingtransitions on copper-based super-hydrophobic surfaces. Langmuir, 21,937-943.
SHIU, J., KUO, C., MOU, C. (2004) Fabrication of tunable superhydrophobic surfaces bynanosphere lithography. Chern. Mater., 16,561-564.
SNOSWELL, D. R. E., DUAN, J., FORNASIERO, D., RALSTON, J. (2003) Colloid stability andthe influence of dissolved gas. J. Phys. Chern B, 107,2986-2994.
SNOSWELL, D. R. E., DUAN, J., FORNASIERO, D., RALSTON, J. (2005) Colloid stability ofsynthetic titania and the influence of surface roughness. J. ColI. Int. Sci., 286, 526-535.
SPARNAAY, M. J. (1983) Four notes on van der Waals forces. J. ColI. Int. Sci., 91,307-319.
SPIJKER, H. T., BOS, R., BISSCHER, H.J., VAN KOOTEN T.G., VAN OEVEREN, W. (2002)Platelet adhesion and activation on a shielded gradient prepared on polystyrene. Biomaterials, 23,757-766.
SPRING, K., HOPE A (1978) Size and shape of the lateral intercellular spaces in a livingepithelium. Science, 200, 54-57.
STAVRIDI, M., KATSIKOGIANNI, M., MISSIRLIS, Y.F. (2003) The influence of surfacepatterning and/or sterilization on the heamocompatibility of polycaprolactones. Mat. Sci. Eng. C,23,359-365.
SUH, K. Y., JON, S. (2005) Control over wettability of polyethylene glycol surfaces usingcapillary lithography. Langmuir, 21, 6836-6841.
162
9. Bibliography
SUN, N., WALZ, J.Y. (2001) A model for calculating electrostatic interactions between colloidalparticles of arbitrary surface topology. J. ColI. Int. Sci., 234, 90-105.
SURESH, L., WALZ J.Y. (1996) Effect of surface roughness on the interaction energy between acolloidal sphere and a flat plate. J. ColI. Int. Sci., 183, 199-213.
SURESH, L., WALZ, JY. (1997) Direct measurement of the effect of surface roughness on thecolloidal forces between a particle and flat plate. J. ColI. Int. Sci., 196, 177-190.
TISSOT, 0., PIERRES A, FOA C, DELAAGE M, BONGRAND P (1992) Motion of cellssedimenting on a solid surface in a laminar shear flow. Biophys J, 61, 204-215.
TODD, B. A, EPPELL, S.1. (2004) Probing the limits of the Derjaguin approximation withscanning force microscopy. Langmuir, 20, 4892-4897.
TOIKKA, G., HAYES, R.A., RALSTON, J. (1996) Surface forces between spherical ZnS particlesin aqueous electrolyte. Langmuir, 12,3783-3788.
TORTORA, G., GRABOWSKI SR (2000) Principles of Anatomy and Physiology, JohnWiley &Sons, Inc.
TSURUTA, D., JONES, J.C.R. (2003) The vimentin cytoskeleton regulates focal contact size andadhesion of endothelial cells subjected to shear stress. J. Cell Sci., 116,4977-4984.
TURNER, A M. P., DOWELL, N.,TURNER, S.W.P., KAM, L.,ISAACSON,M., TURNER,J.N.,CRAIGHEAD, H.G.,SHAIN, W. (2000) Attachment of astroglial cells to microfabricatedpillar arrays of different geometries. J Biomed Mater Res, 51, 430-441.
TURNER, S., KAM, L., ISAACSON, M., CRAIGHEAD, H.G., SHAIN, W., TURNER, J. (1997)Cell attachment on silicon nanostructures. J. Vac. Sci. Tech. B, 15,2848-2854.
TYRRELL, J. W. G., ATTARD, P. (2001) Images of nanobubbles on hydrophobic surfaces andtheir interaction. Phys. Rev. Lett., 87, 176104-1.
VAN BREE, J. L. M. J., POULIS,J.A, VERHAAR, B.1., SCHRAM, K. (1974) The influence ofsurface irregularities upon the Van der Waals forces between macroscopic bodies. Physica, 78,187-190.
VAN KOOTEN, T., SCHAKENRAAD JM, VAN DER MEl HC, BUSSCHER HJ (1992)Development and use of a parallel-plate flow chamber for studying cellular adhesion to solidsurfaces. J. Biomed. Mat. Res., 26, 725-738.
VERWEY, E. 1. W., OVERBEEK, J.TH.G. (1948) Theory of the stability of lyophobic colloids,Dover.
VIGIL, G., XU, Z., STEINBERG, S., ISRAELACHVILI, J. (1994) Interactions of Silica Surfaces.J. ColI. Int. Sci., 165,367-385.
VOGLER, E. A (1998) Structure and reactivity of water at biomaterial surfaces. Adv. Coll, Interf.Sc., 74,69-117.
WALZ, J. Y. (1998) The effect of surface heterogeneities on colloidal forces. Adv. ColI. Int. Sc.,74,119-168.
WATSON, G. S., WATSON, J.A (2004) Natural nano-structures on insects-possible functions ofordered arrays characterized by atomic force microscopy. Appl. Surf. Sci., 235, 139-144.
163
9. Bibliography
WEBSTER, T. J., ERGUN, C., DOREMUS, R.H., SIEGEL, R.W., BIZIOS, R. (2000) Specificproteins mediate enhanced osteoblast adhesion on nanophase ceramics. J. Biomed. Mat. Res., 51,475-483.
WEISS, P. (1934) In vitro experiments on the factors determining the course of the outgrowingnerve fiber. J. Exp. Zool., 68, 393-418.
WEISS, P. (1945) Experiments on cell and axon orientation in vitro: the role of colloidal exudatesin tissue organization. J. Exp. Zool., 100,353-86.
WENZEL, R. N. (1936) Resistance of solid surfaces to wetting by water. Ind. Eng. Chern., 28, 988994.
WERNER, C., KORBER, H., ZIMMERMANN, R., DUHKIN, S., JACOBASCH, H. (1998)Extended electrokinetic characterization of flat solid surfaces. J. ColI. Int. Sci., 208, 329-346.
WIELAND, M., CHEHROUDI, B., TEXTOR, M., BRUNETTE, D.M. (2002) Use of Ti-coatedreplicas to investigate the effects on fibroblast shape of surfaces with varying roughness andconstant chemical composition. J Biomed Mater Res, 60, 434-444.
WIELAND, M., TEXTOR, M., CHEHROUDI, B., BRUNETTE, D.M. (2005) Synergisticinteraction of topographic features in the production of bone-like nodules on Ti surfaces by ratosteobleats. Biomaterials, 26, 1119-1130.
WILKINSON, C., RIEHLE M, WOOD, MA GALLAGHER JO, CURTIS ASG (2002) The use ofmaterials patterned on a nano- and micro-metric scale in cellular engineering. Mat Sci Eng, 19,263-263.
WOJCIAK, B., CROSSAN J., CURTIS A.S.G., WILKINSON C.D.W. (1995) Grooved substratafacilitate In vitro healing of completely divided flexor tendons. J Mat Sc: Materials in Medecine, 6,266-271.
WOJCIAK-STOTHARD, B., CURTIS A.S.G., MONAGHAN, W., MACDONALD,K., WILKINSON, C.D. W. (1996) Guidance and activation of murine macrophages by nanometricscale topography. Exp. Cell Res., 223, 426-435.
WOJCIAK-STOTHARD, B., CURTIS, A.S.G., MONAGHAN, W., MCGRATH, M., SOMMER,I., WILKINSON, C.D.W. (1995a) Role of the cytoskeleton in the reaction of fibroblasts to multiplegrooved substrata. Cell Motility and the Cytoskeleton, 31,147-158.
WOJCIAK-STOTHARD, B., MADEJA, Z., KOROHODA, W., CURTIS, A.S.G., WILKINSON,C.D. W. (1995b) Activation of macrophage-like cells by multiple grooved substrata. Topographicalcontrol of cell behaviour. Cell BioI Int, 19, 485-489.
WU, Z., ZHANG, X., ZHANG, X., LI, G., SUN, J., ZHANG, Y., LI, M., HU, J. (2005)Nanobubbles influence on BSA adsorption on mica surface. Surf. Interf. Anal., 37, 797-801.
YANG, J., BOS R, POORTINGA A, WIT PJ, BELDER GF, BUSSCHER HJ (1999) Comparisonof particle deposition in a parallel plate flow chamber and a stagnation point flow chamber.Langmuir, 15,4671-4677.
YOSHIMITSU, Z., NAKAJIMA, A., WATANABE, T., HASHIMOTO, K. (2002) Effects ofsurface structure on the hydrophobicity and sliding behaviour of water droplets. Langmuir, 18,5818-5822.
YOUNG, T. (1805) Phil. Trans. R. Soc. London, 95, 65.
164

9. Bibliographv
YU, N., POLYCARPOU, A.A. (2004) Adhesive contact based on the Lennard-Jones potential: acorrection to the value of the equilibrium distance as used in the potential. J. ColI. Int. Sci., 278,428-435.
ZAMIR, E., GEIGER, B. (2001) Molecular compexity and dynamics of cell-matrix adhesions. J.Cell Sci., 114,3583-3590.
165

Publications
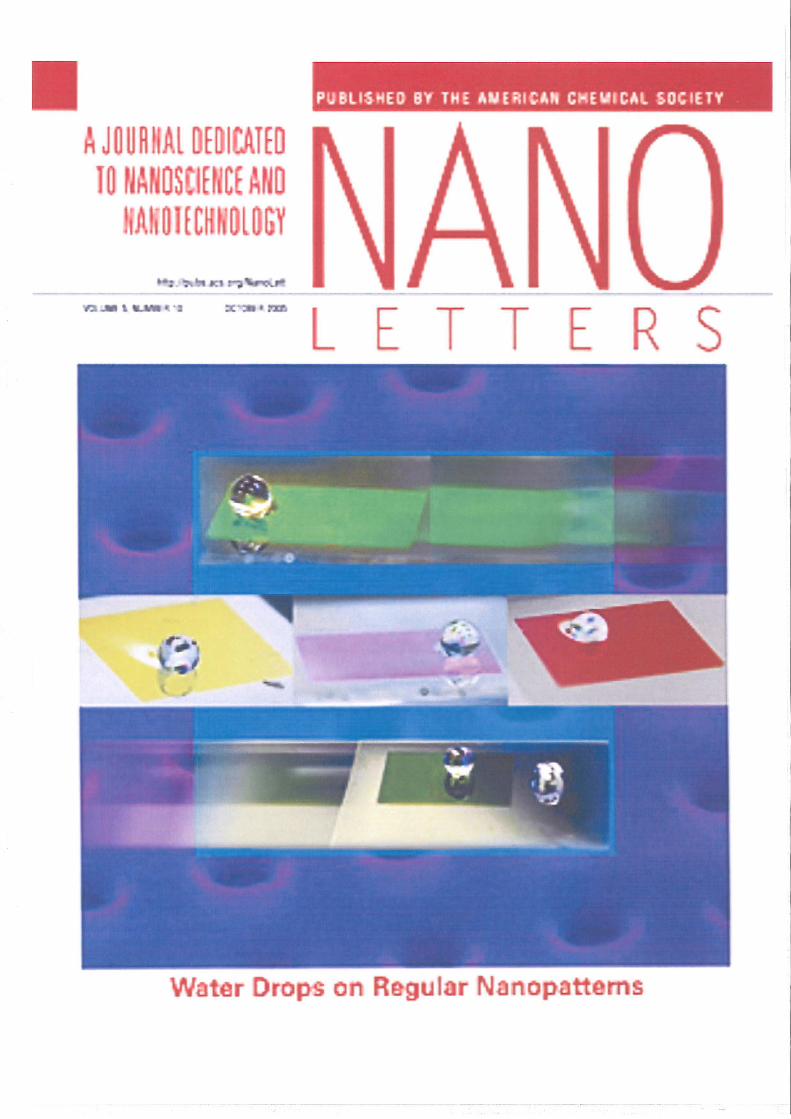
J U
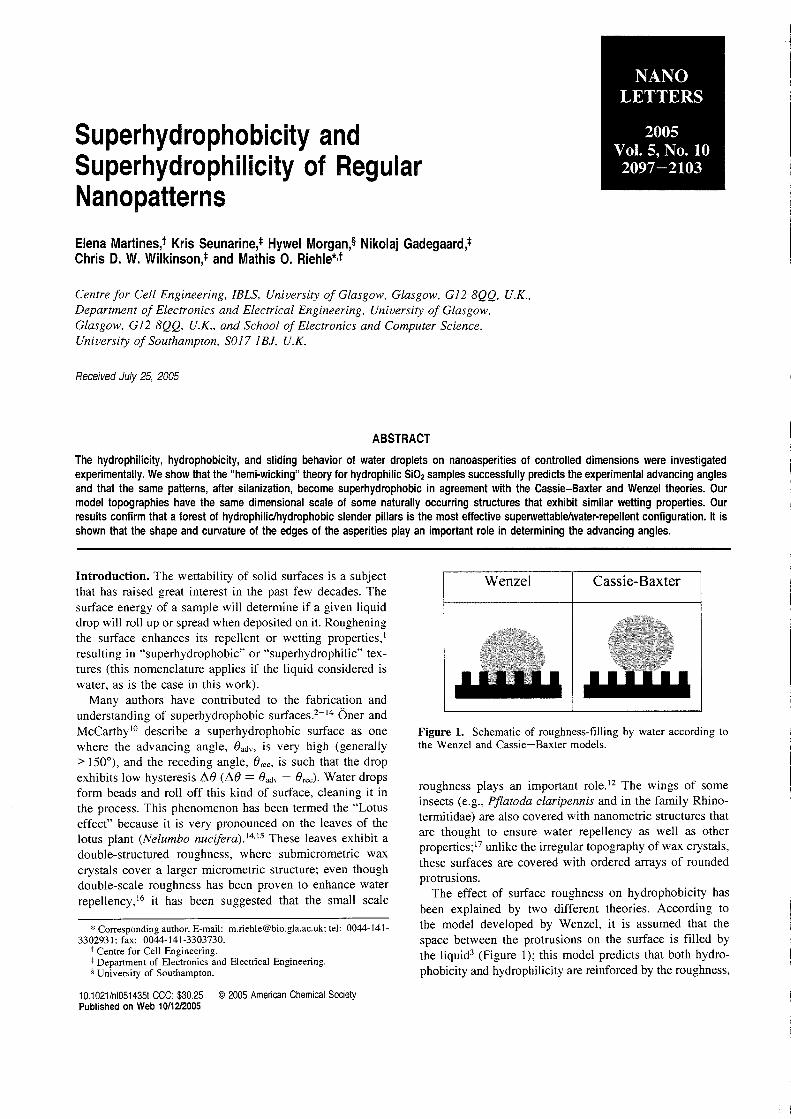
Superhydrophobicity andSuperhydrophilicity of RegularNanopatterns
Elena Martines,t Kris Seunarine,* Hywel Morgan,§ Nikolaj Gadegaard,*Chris D. W. Wilkinson,* and Mathis O. Riehle*,t
Centre for Cell Engineering, IBLS. University of Glasgow. Glasgow, Gl2 8QQ, UK,Department of Electronics and Electrical Engineering. University of Glasgow.Glasgow, Gl2 8QQ. U'K; and School of Electronics and Computer Science,University of Southampton, SOl7 IBl, UK
Received July 25, 2005
ABSTRACT
NANOLETTERS
2005Vol. 5, No. 102097-2103
The hydrophilicity, hydrophobicity, and sliding behavior of water droplets on nanoasperities of controlled dimensions were investigatedexperimentally. We showthatthe "hemi-wicking" theory for hydrophilic Si02 samples successfully predicts theexperimental advancing anglesand that the same patterns, after silanization, become superhydrophobic in agreement with the Cassie-Baxter and Wenzel theories. Ourmodel topographies have the same dimensional scale of some naturally occurring structures that exhibit similar wetting properties. Ourresults confirm that a forest of hydrophiliclhydrophobic slender pillars is the mosteffective superwettablelwater-repellent configuration. It isshown that the shape and curvature of the edges of the asperities playan important role in determining the advancing angles.
Figure 1. Schematic of roughness-filling by water according tothe Wenzel and Cassie-Baxter models.
roughness plays an important role.'? The wings of someinsects (e.g., Pflatoda claripennis and in the family Rhinoterrnitidae) are also covered with nanometric structures thatare thought to ensure water repellency as well as otherproperties;'? unlike the irregular topography of wax crystals,these surfaces are covered with ordered arrays of roundedprotrusions.
The effect of surface roughness on hydrophobicity hasbeen explained by two different theories. According tothe model developed by Wenzel, it is assumed that thespace between the protrusions on the surface is filled bythe liquid? (Figure 1); this model predicts that both hydrophobicity and hydrophilicity are reinforced by the roughness,
Introduction. The wettability of solid surfaces is a subjectthat has raised great interest in the past few decades. Thesurface energy of a sample will determine if a given liquiddrop will roll up or spread when deposited on it. Rougheningthe surface enhances its repellent or wetting properties, 1
resulting in "superhydrophobic" or "superhydrophilic" textures (this nomenclature applies if the liquid considered iswater, as is the case in this work).
Many authors have contributed to the fabrication andunderstanding of superhydrophobic surfaces.v '? Oner andMct.arthy'? describe a superhydrophobic surface as onewhere the advancing angle, eadv, is very high (generally> 150°), and the receding angle, erec, is such that the dropexhibits low hysteresis !i.e (!i.e = ead\ - erec) . Water dropsform beads and roll off this kind of surface, cleaning it inthe process. This phenomenon has been termed the "Lotuseffect" because it is very pronounced on the leaves of thelotus plant (Nelumbo nucijera).14.1S These leaves exhibit adouble-structured roughness, where submicrometric waxcrystals cover a larger micrometric structure; even thoughdouble-scale roughness has been proven to enhance waterrepellency," it has been suggested that the small scale
* Corresponding author. E-mail: [email protected]: tel: 0044-141-3302931: fax: 0044-141-3303730.
t Centre for Cell Engineering.t Department of Electronics and Electrical Engineering.• University of Southampton.
10.1021/nI051435t CCC: $30.25 © 2005 American Chemical SocietyPublished on Web 10/1212005
Wenzel Cassie-Baxter
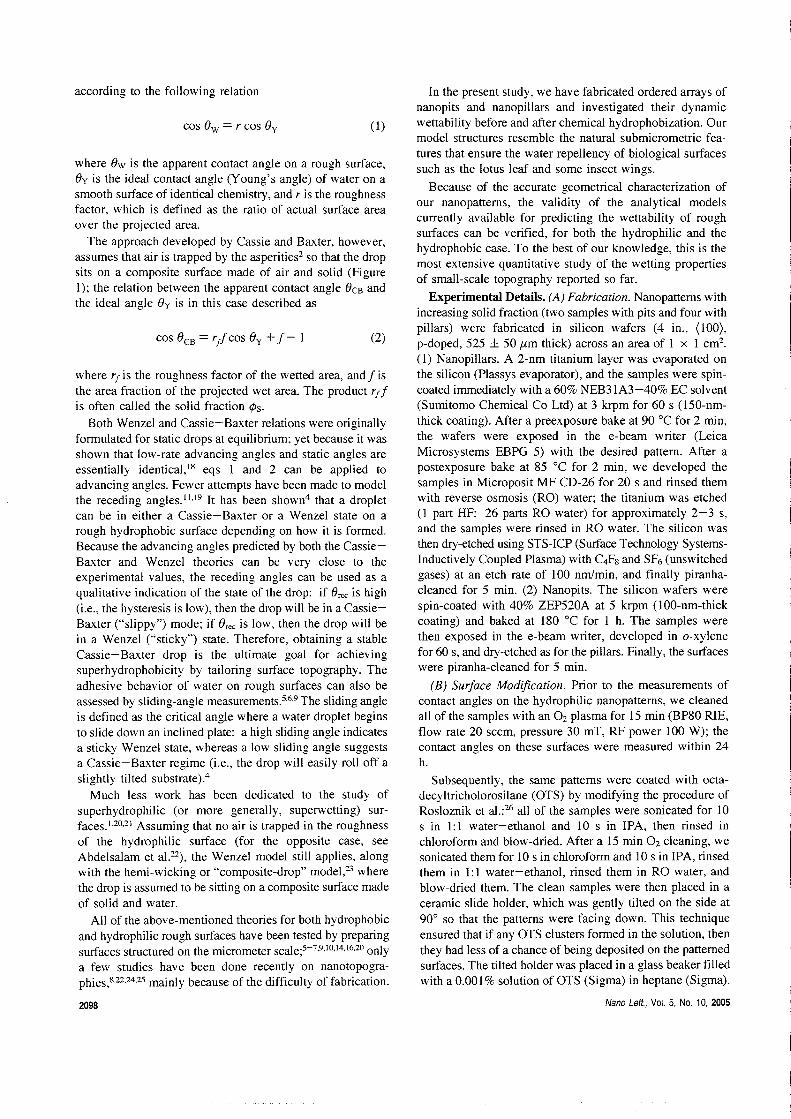
where ew is the apparent contact angle on a rough surface,ey is the ideal contact angle (Young's angle) of water on asmooth surface of identical chemistry, and r is the roughnessfactor, which is defined as the ratio of actual surface areaover the projected area.
The approach developed by Cassie and Baxter, however,assumes that air is trapped by the asperities- so that the dropsits on a composite surface made of air and solid (FigureI); the relation between the apparent contact angle eCB andthe ideal angle ey is in this case described as
where rf is the roughness factor of the wetted area, and I isthe area fraction of the projected wet area. The product rrIis often called the solid fraction <Ps.
Both Wenzel and Cassie-Baxter relations were originallyformulated for static drops at equilibrium; yet because it wasshown that low-rate advancing angles and static angles areessentially identical," eqs 1 and 2 can be applied toadvancing angles. Fewer attempts have been made to modelthe receding angles.J':" It has been shown" that a dropletcan be in either a Cassie-Baxter or a Wenzel state on arough hydrophobic surface depending on how it is formed.Because the advancing angles predicted by both the CassieBaxter and Wenzel theories can be very close to theexperimental values, the receding angles can be used as aqualitative indication of the state of the drop: if eree is high(i.e., the hysteresis is low), then the drop will be in a CassieBaxter ("slippy") mode; if eree is low, then the drop will bein a Wenzel ("sticky") state. Therefore, obtaining a stableCassie-Baxter drop is the ultimate goal for achievingsuperhydrophobicity by tailoring surface topography. Theadhesive behavior of water on rough surfaces can also beassessed by sliding-angle rneasurements.v-? The sliding angleis defined as the critical angle where a water droplet beginsto slide down an inclined plate: a high sliding angle indicatesa sticky Wenzel state, whereas a low sliding angle suggestsa Cassie-Baxter regime (i.e. the drop will easily roll off aslightly tilted substrate)."
Much less work has been dedicated to the study ofsuperhydrophilic (or more generally, superwetting) surfaces. 1,20,21 Assuming that no air is trapped in the roughnessof the hydrophilic surface (for the opposite case, seeAbdelsalam et aI.22), the Wenzel model still applies, alongwith the hemi-wicking or "composite-drop" model.P wherethe drop is assumed to be sitting on a composite surface madeof solid and water.
All of the above-mentioned theories for both hydrophobicand hydrophilic rough surfaces have been tested by preparingsurfaces structured on the micrometer scale;5-7,9,1O,14,16,20 onlya few studies have been done recently on nanotopographies,8,22,24,25 mainly because of the difficulty of fabrication.
2098
according to the following relation
cos ew = r cos ey
cos eCB = rflcos ey +1- I
(l)
(2)
In the present study, we have fabricated ordered arrays ofnanopits and nanopillars and investigated their dynamicwettability before and after chemical hydrophobization. Ourmodel structures resemble the natural submicrometric features that ensure the water repellency of biological surfacessuch as the lotus leaf and some insect wings.
Because of the accurate geometrical characterization ofour nanopatterns, the validity of the analytical modelscurrently available for predicting the wettability of roughsurfaces can be verified, for both the hydrophilic and thehydrophobic case, To the best of our knowledge, this is themost extensive quantitative study of the wetting propertiesof small-scale topography reported so far.
Experimental Details. (A) Fabrication. Nanopatterns withincreasing solid fraction (two samples with pits and four withpillars) were fabricated in silicon wafers (4 in., (100),p-doped, 525 ± 50 ust: thick) across an area of 1 x 1 cm-,(l) Nanopillars. A 2-nm titanium layer was evaporated onthe silicon (Plassys evaporator), and the samples were spincoated immediately with a 60% NEB31A3-40% EC solvent(Sumitomo Chemical Co Ltd) at 3 krpm for 60 s (l50-nmthick coating). After a preexposure bake at 90°C for 2 min,the wafers were exposed in the e-beam writer (LeicaMicrosystems EBPG 5) with the desired pattern. After apostexposure bake at 85°C for 2 min, we developed thesamples in Microposit MF CD-26 for 20 s and rinsed themwith reverse osmosis (RO) water; the titanium was etched(l part HF: 26 parts RO water) for approximately 2-3 s,and the samples were rinsed in RO water. The silicon wasthen dry-etched using STS-ICP (Surface Technology SystemsInductively Coupled Plasma) with C~8 and SF6(unswitchedgases) at an etch rate of 100 nm/min, and finally piranhacleaned for 5 min. (2) Nanopits. The silicon wafers werespin-coated with 40% ZEP520A at 5 krpm (lOO-nm-thickcoating) and baked at 180°C for 1 h. The samples werethen exposed in the e-beam writer, developed in o-xylenefor 60 s, and dry-etched as for the pillars. Finally, the surfaceswere piranha-cleaned for 5 min.
(B) Surface Modification. Prior to the measurements ofcontact angles on the hydrophilic nanopatterns, we cleanedall of the samples with an O2 plasma for 15 min (BP80 RIE,flow rate 20 seem, pressure 30 mT, RF power 100 W); thecontact angles on these surfaces were measured within 24h.
Subsequently, the same patterns were coated with octadecyltricholorosilane (OTS) by modifying the procedure ofRosloznik et a1.:26 all of the samples were sonicated for 10s in 1:1 water-ethanol and 10 s in IPA, then rinsed inchloroform and blow-dried. After a 15 min O2 cleaning, wesonicated them for 10 s in chloroform and 10 s in IPA, rinsedthem in 1:1 water-ethanol, rinsed them in RO water, andblow-dried them. The clean samples were then placed in aceramic slide holder, which was gently tilted on the side at90° so that the patterns were facing down. This techniqueensured that if any OTS clusters formed in the solution, thenthey had less of a chance of being deposited on the patternedsurfaces. The tilted holder was placed in a glass beaker filledwith a 0.001 % solution of OTS (Sigma) in heptane (Sigma).
Nano Lett., Vol. 5, No. 10, 2005
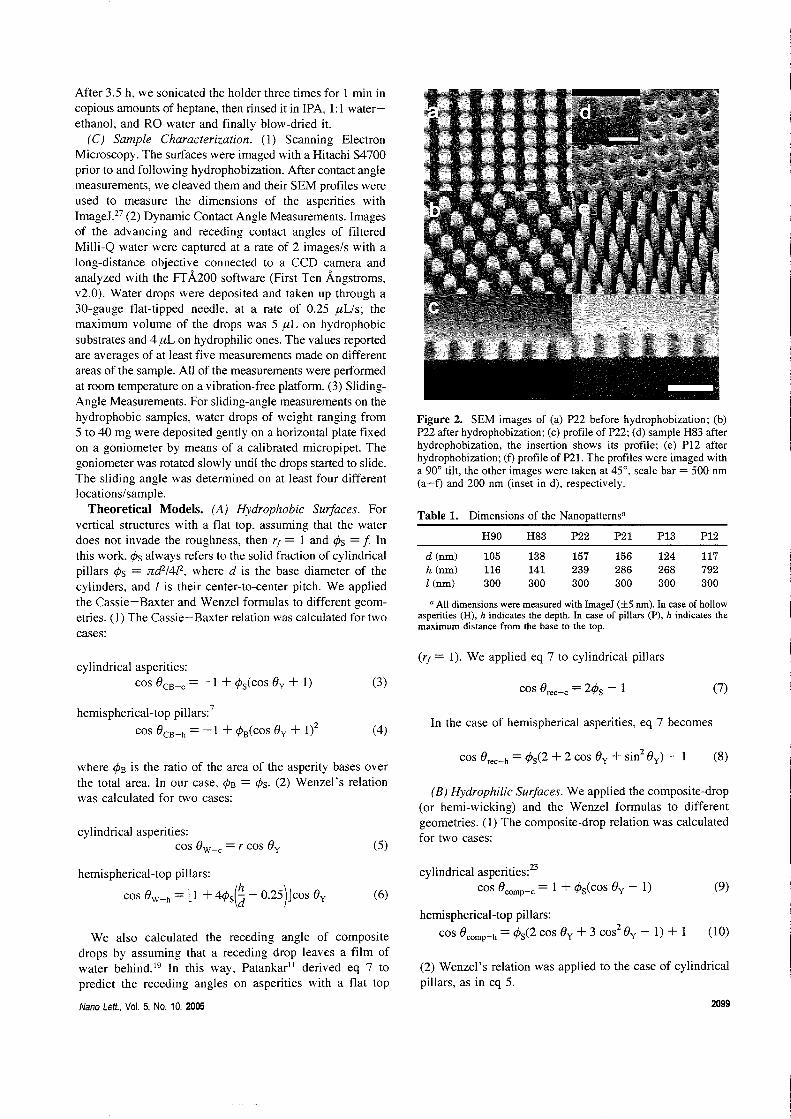
a All dimensions were measured with ImageJ (±5 nm). In case of hollowasperities (H), h indicates the depth. In case of pillars (P), h indicates themaximum distance from the base to the top.
Figure 2. SEM images of (a) P22 before hydrophobization; (b)P22after hydrophobization; (c) profile of P22;(d) sample H83 afterhydropbobization, the insertion shows its profile; (e) PI2 afterhydrophobization; (f) profile of P21. The profiles were imaged witha 90° tilt, the other images were taken at 45°, scale bar = 500 nm(a-f) and 200 nm (inset in d), respectively.
Table 1. Dimensions of the Nanopatterns"
117792300
P12
124268300
P13
156286300
P21
157239300
P22
138141300
H83
105116300
H90
d(nm)
h(nm)
[(nm)
After 3.5 h, we sonicated the holder three times for I min incopious amounts of heptane, then rinsed it in IPA, I: I waterethanol, and RO water and finally blow-dried it.
(C) Sample Characterization. (1) Scanning ElectronMicroscopy. The surfaces were imaged with a Hitachi S4700prior to and following hydrophobization. After contact anglemeasurements, we cleaved them and their SEM profiles wereused to measure the dimensions of the asperities withImagel.'? (2) Dynamic Contact Angle Measurements. Imagesof the advancing and receding contact angles of filteredMilli-Q water were captured at a rate of 2 images/s with along-distance objective connected to a CCD camera andanalyzed with the FfA200 software (First Ten Angstroms,v2.0). Water drops were deposited and taken up through a30-gauge flat-tipped needle, at a rate of 0.25 IlUS; themaximum volume of the drops was 5 ilL on hydrophobicsubstrates and 4 ilL on hydrophilic ones. The values reportedare averages of at least five measurements made on differentareas of the sample. All of the measurements were performedat room temperature on a vibration-free platform. (3) SlidingAngle Measurements. For sliding-angle measurements on thehydrophobic samples, water drops of weight ranging from5 to 40 mg were deposited gently on a horizontal plate fixedon a goniometer by means of a calibrated micropipet. Thegoniometer was rotated slowly until the drops started to slide.The sliding angle was determined on at least four differentlocations/sample.
Theoretical Models. (A) Hydrophobic Surfaces. Forvertical structures with a flat top, assuming that the waterdoes not invade the roughness, then rJ = I and cPs = f Inthis work, cPs always refers to the solid fraction of cylindricalpillars cPs = :nd2/4f2, where d is the base diameter of thecylinders, and I is their center-to-center pitch. We appliedthe Cassie-Baxter and Wenzel formulas to different geometries. (I) The Cassie-Baxter relation was calculated for twocases:
cylindrical asperities:cos 8CB-c = -I + cPs(cos 8y + 1) (3)
(rJ = 1). We applied eq 7 to cylindrical pillars
cos 8rec-c = 2cPs - I (7)
hemispherical-top pillars:7
cos 8CB-h = -I + cPB(COS 8y + 1)2 (4) In the case of hemispherical asperities, eq 7 becomes
where cPB is the ratio of the area of the asperity bases overthe total area. In our case, cPB = cPs. (2) Wenzel's relationwas calculated for two cases:
cylindrical asperities:cos 8w- c = r cos 8y (5)
cos 8rec-h= cPs(2 + 2 cos 8y + sin2 8y ) - I (8)
(B) Hydrophilic Surfaces. We applied the composite-drop(or hemi-wicking) and the Wenzel formulas to differentgeometries. (1) The composite-drop relation was calculatedfor two cases:
We also calculated the receding angle of compositedrops by assuming that a receding drop leaves a film ofwater behind.'? In this way, Patankar!' derived eq 7 topredict the receding angles on asperities with a flat top
Nano Lett., Vol. 5, No. 10,2005
(9)hemispherical-top pillars:
cos 8W - h = II + 4¢s(~ - 0.25)Jcos 8y (6)
cylindrical asperities.Fcos 8comp-c = I + cPs(cos 8y - I)
hemispherical-top pillars:
cos 8comp-h = cPs(2 cos 8y + 3 cos2 8y - I) + I (10)
(2) Wenzel's relation was applied to the case of cylindricalpillars, as in eq 5.
2099

Table 2. Experimental Angles of Water on Hydrophobic (5 ,ilL Drop) and Hydrophilic (4,uL Drop) Nanopatterns"
flat H90 H83 P22 P21 P13 P12
Oadv(deg) 114±1 125 ±2 129 ± 3 155 ± 2 159 ± 2 161 ± 2 164 ± 2hydrophobic Orec(deg) 100 ± 3 92 ±2 89 ±2 0 140 ± 2 150 ± 2 163 ± 2
model W-c W-c W-h CB-h CB-h CB-h
Oadv(deg) 35 ±3 36 ±3 35 ± 3 12 ± 3 19 ± 3 11 ± 3 0hydrophilic Orec(deg) 0 0 0 0 0 0 0
model comp-c comp-c comp-c comp-c comp-c comp-h
a Advancing and receding angles are shown, along with the best theoretical agreement (model): (W) Wenzel, (CB) Cassie-Baxter and (comp) compositedrop, with (-c) cylindrical and (-h) hemispherical top.
Figure 3. Plot of the apparentadvancingangles of a 4-,uL drop ofwater on hydrophilic patterns as a function of structuregeometry.composite drop (comp-) and Wenzel (W-) curves for cylindrical(-c-) and hemispherical (-h-) asperities are shown. The Wenzelcurves were plottedfor cylindrical asperitiesonly. The compositedrop curves for pillars, P, and pits, H, are different because of adifferent dependence on lid. Individual pointsindicate experimentaldata: (.6.) H90; ('\7) H83; (0) P22; (left-facing triangle) P21; (rightfacing triangle) P13; (D) P12.
In this context, it would be interesting to investigate the effectof height variation on the reservoir-effect of such structures.
(C) Hydrophobic Patterns: Experiments and Predictions.The experimental advancing and receding angles (e adv anderec) on hydrophobic silicon are shown in Table 2. Young'sangle for these substrates was taken as the advancing anglemeasured on the flat control (8y = 114° ± I). Theexperimental advancing angles along with the theoreticalpredictions are plotted in Figure 4.
Because the end-geometries of the hydrophobized pillarswere somewhat between cylindrical and hemispherical, theCassie-Baxter and Wenzel curves were plotted for bothgeometries (eqs 3 and 5 in Figure 4a, and eqs 4 and 6 inFigure 4b), whereas the pits were always modeled as perfectcylinders (eqs 3 and 5). The sliding angles in Figure 5 wereused as a means to test the predictions derived from Figure4 concerning the "state" of the drops (i.e., Cassie-Baxteror Wenzel).
In the following paragraphs, we discuss our results withinthe framework of Patankar's criterion for designing superhydrophobic surfaces." Briefly, this method consists ofobtaining a stable Cassie-Baxter drop by fabricating structures, which, given the highest possible aspect ratio, hid, havea dimensionless spacing, lid, such that cos eCB > cos ew, or
Nano Lett., Vol. 5, No. 10, 2005
0.8
I.:> 2 2;) 3 3;) 4 4;)
lid
'-'-'L!>-"-'~'-"""""'-'"
- CO"'l'-C-P••• Comp-h-P
1.8 ••- Comp-e-H---- W·e·lloo-- W-c-H83
1.6 - W-c-P22-- W-c-P21
W-c-PI3..... W-e-P12-1.4
<0
l<>1.2
Results and Discussion. (A) Sample Characteristics. SEMimages of the patterns immediately after fabrication showedperfectly cylindrical nanopillars and nanopits, except forsample P12, where the tall pillars had a cusped top. Theedges of the pillars were rounded after hydrophobizationbecause of sonication. This is summarized in Figure 2a-b.In particular, sample P22 has pillars with a hemisphericaltop (Figure 2c), and the others look like cylinders withsmooth edges (Figure 2f), except PI2 whose shape wasunchanged after coating (Figure 2e). The pitted samples(Figure 2d) had a cylindrical profile. The different patternswere named after their solid fraction percentage (H designatesa hollow pattern, i.e., pits, P a protruding pattern, i.e., pillars;P22 indicates a pillared sample where 22% of the apparentarea is wet by the drop, assuming a cylindrical top). TableI shows the dimensions of the patterns (base diameter d,height h, center-to-center pitch I). The contact angle measuredon the OTS-coated flat silicon was 114 ± 1°, which indicatesthat a monolayer was formed (a contact angle for totalcoverage was reported to be 115°).26
(B) Hydrophilic Patterns: Experiments and Predictions.The experimental advancing and receding angles (e adv anderee) on hydrophilic silicon are shown in Table 2. Theexperimental advancing angles along with the theoreticalpredictions are plotted in Figure 3. Because all of thestructures (except P12) were perfectly cylindrical, the Wenzeland composite-drop curves were plotted for this geometry;the composite-drop curve for hemispherical-top pillars is alsoshown for comparison with the experimental advancing angleon P12. Young's angle for these substrates was taken as theangle measured on the flat control (e y = 35 ± 1°). Thereceding drops on these substrates were pinned (erec = 0°),as predicted by Quere.P
Figure 3 shows that the composite-drop formula forcylindrical asperities is in excellent agreement with theexperimental values, except for sample PI2 where eadv =0°. It should be noted that both the Wenzel formula forcylinders and the composite-drop formula for hemisphericaltops (eq 10) always predict an apparent angle of 0°, whichis theoretically unattainable because cos e > 1. Therefore,the topography-induced superhydrophilicity of sample PI2was due to the high aspect ratio, hid, of the protrusions,which acted as a reservoir for the fast spreading of the liquidfront,23 a spreading much faster than that on the flat surface."Because the composite-drop relation does not depend on theaspect ratio of the features, this formula predicts thathemispherical-top pillars will always be superhydrophilic,
2100
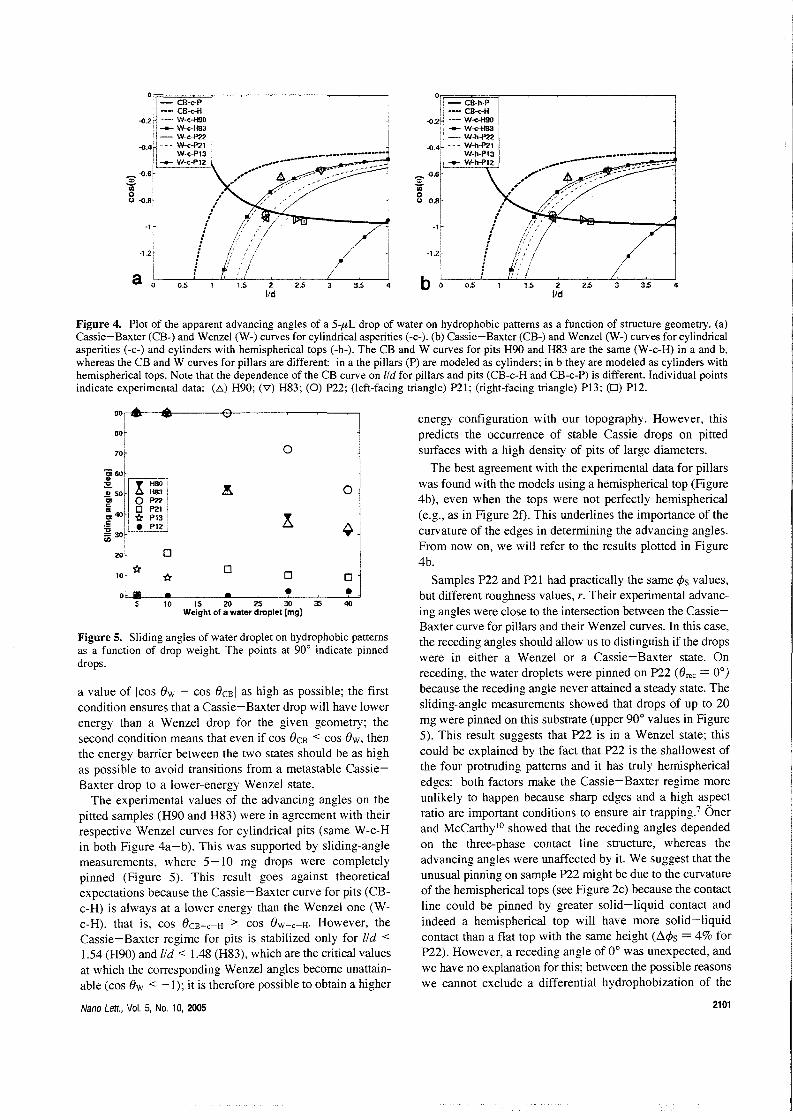
43.531.5 2 2.5lid
/,..........---_...._.~.~:~.~:~"",
-12
-1
Or;==C~B==_h-P====r-~-~------~--,
~•••• CB-c-li
~2 . ---- W-c-H90...... W-c·H83- W-h-P22
~.4 - - - W-h-P21W-h-P13
...... W-h-P12
b 0 0.5
~~.6
'"orou ~.B
J.----_ _...•:,:::j
__/-_.........4-~.. -- .: --.-----.,...,/ -: !
// .: iI' ' 1I' " '
////" .' I/i ij //t' ',I
1.5 2 2.5 3 3.5 4lid
o- CB-c-P
I '- CB-c-li~2~. :--- W-c-H90i W··c+183
i - W-c:-P22~_41 - - - W-c-P21
w-e-P13I -- W-c-P12
~·(I.6"
.:. I
g~B~
-If
Figu.re 4. Plot of the apparent advancing angles of a 5-,uL drop of water on hydrophobic patterns as a function of structure geometry. (a)Cassie-rBaxter (CB-) and Wenzel (W-) curves for cylindrical asperities (-c-). (b) Cassie-Baxter (CB-) and Wenzel (W-) curves for cylindricalasperities (-c-) and cylinders with hemispherical tops (-h-). The CB and W curves for pits H90 and H83 are the same (W-c-H) in a and b,whe~eas th.eCB and W curves for pillars are different: in a the pillars (P) are modeled as cylinders; in b they are modeled as cylinders with~e~l1sphencal.tops. Note that the dependence of the CB curve on lid for pillars and pits (CB-c-H and CB-c-P) is different. Individual pointsindicate experimental data: (.0.) H90; (\7) H83; (0) P22; (left-facing triangle) P21; (right-facing triangle) P13; (D) P12.
Figure 5. Sliding angles of water droplet on hydrophobic patternsas a function of drop weight. The points at 90° indicate pinneddrops.
a value of [cos ew - cos ecBI as high as possible; the firstcondition ensures that a Cassie-Baxter drop will have lowerenergy than a Wenzel drop for the given geometry; thesecond condition means that even if cos eCB < cos ew, thenthe energy barrier between the two states should be as highas possible to avoid transitions from a metastable CassieBaxter drop to a lower-energy Wenzel state.
The experimental values of the advancing angles on thepitted samples (H90 and H83) were in agreement with theirrespective Wenzel curves for cylindrical pits (same W-c-Hin both Figure 4a-b). This was supported by sliding-anglemeasurements, where 5-10 mg drops were completelypinned (Figure 5). This result goes against theoreticalexpectations because the Cassie-Baxter curve for pits (CBc-H) is always at a lower energy than the Wenzel one (Wc-H), that is, cos eCB- c - H > cos eW- c- H• However, theCassie-Baxter regime for pits is stabilized only for lid <1.54 (H90) and lid < 1.48 (H83), which are the critical valuesat which the corresponding Wenzel angles become unattainable (cos ew < -1); it is therefore possible to obtain a higher
Nano Lett., Vol. 5, No. 10, 2005
• •
energy configuration with our topography. However, thispredicts the occurrence of stable Cassie drops on pittedsurfaces with a high density of pits of large diameters.
The best agreement with the experimental data for pillarswas found with the models using a hemispherical top (Figure4b), even when the tops were not perfectly hemispherical(e.g., as in Figure 2f). This underlines the importance of thecurvature of the edges in determining the advancing angles.From now on, we will refer to the results plotted in Figure4b.
Samples P22 and P2l had practically the same </Js values,but different roughness values, r. Their experimental advancing angles were close to the intersection between the CassieBaxter curve for pillars and their Wenzel curves. In this case,the receding angles should allow us to distinguish if the dropswere in either a Wenzel or a Cassie-Baxter state. Onreceding, the water droplets were pinned on P22 (e rcc = 0°)because the receding angle never attained a steady state. Thesliding-angle measurements showed that drops of up to 20mg were pinned on this substrate (upper 90° values in Figure5). This result suggests that P22 is in a Wenzel state; thiscould be explained by the fact that P22 is the shallowest ofthe four protruding patterns and it has truly hemisphericaledges: both factors make the Cassie-Baxter regime moreunlikely to happen because sharp edges and a high aspectratio are important conditions to ensure air trapping." Onerand Mcf'arthy'? showed that the receding angles dependedon the three-phase contact line structure, whereas theadvancing angles were unaffected by it. We suggest that theunusual pinning on sample P22 might be due to the curvatureof the hemispherical tops (see Figure 2c) because the contactline could be pinned by greater solid-liquid contact andindeed a hemispherical top will have more solid-liquidcontact than a flat top with the same height (I:i</Js = 4% forP22). However, a receding angle of 0° was unexpected, andwe have no explanation for this; between the possible reasonswe cannot exclude a differential hydrophobization of the
2101
40
10 1
35
o
o
o
o
15 20 25 30Weight of a water droplet [mg]
•10
o,
2O~1'((
lOrob.

-(l.5,--c------,----r---,.----:r----,
Figure 6. Receding angles of water on hydrophobic patterns as afunction of the solid fraction, rPs. The experimental values CC*)P21; C-) P13; Ce) P12) are plotted with eq 7 (cyl) and eq 8 Chern).
bottom surface compared to the top of the asperities, whichwould have affected the receding angles on the Wenzelsamples; still, only P22 showed this behavior.
Unlike P22, sample P21 had a high receding angle,showing that it was in a Cassie state. Its closeness to thecritical point would imply that a transition to the Wenzelstate would need very little energy; this hypothesis wasconfirmed by the tilting angle measurements, which showeda sudden jump from 0 to 21° when the drop weight wasincreased from 5 to 10 mg. The increased weight forced thewater inside the texture, and the lO-mg drop transitioned tothe Wenzel state.
For sample P13, a Wenzel state would have a lowerenergy, but the energy barrier to overcome is bigger thanthat in P21. In this case, an increase in drop weight from 5to 10 mg caused a decrease in sliding angle, confirming theCassie- Baxter state of the 5-,uL droplet.
Sample P12 had the best water-repellent configuration notonly because the Cassie-Baxter state was at lower energythan the Wenzel state and the energy barrier between thetwo was very high but also because the Wenzel anglecorresponding to this geometry is unattainable (cos 8w <
-1). Tilting angles on P12 were 0 ± 20 throughout the wholerange of drop weights, making it impossible to deposit a dropsmaller than 30,uL. This finding is coherent with Patankar'sprediction that a forest of nanopillars would be the mosteffective water-repellent structure.F confirming that for agiven spacing, l, increasing the aspect ratio, hid, will stabilizethe Cassie- Baxter regime, as was also illustrated byYoshimitsu et aJ.5 Sample P12 was superwettable when itssurface was hydrophilic: this similarity not only shows thatroughness with the highest possible aspect ratio, hid, willdramatically enhance the wettability of a surface, whetherhydrophilic or hydrophobic, but it also entails the ambivalence of topography-enhanced wettingldewetting, as highlighted already by McHale et al.2 1
Having verified the validity of the Cassie-Baxtermodel for our submicrometric structures, we investigatedPatankar's'? suggestion that the epicuticular wax crystalloidson the Lotus leaf (200 nrn-r I zzm) playa significant role in
2102 Nano Lett., Vol. 5, No. 10, 2005
Acknowledgment. Many thanks to Adam S. G. Curtis,F. Madani, V. Koutsos, L. Csaderova, N. Blondiaux, M.Robertson, and S. Borzi. The partial support by the ECfunded project NaPa (contract no. NMP4-CT-2003-500120)is gratefully acknowledged. The content of this work is thesole responsibility of the authors.
References
(I) Bico, J.; Thiele. U.; Quere, D. Colloids Surf. A 2002. 206. 41-46.(2) Cassie. A. B. D.; Baxter, S. Trans. Faraday Soc. 1944. 40. 546.(3) Wenzel. R. N. Ind. Eng. Chem. 1936. 28. 988-994.(4) Quere, D.; Lafuma, A.; Bico, J. Nanotechnology 2003. 14. 1109
1112.(5) Yoshimitsu, Z.; Nakajima. A.; Watanabe. T.; Hashimoto. K. Langmuir
2002. 18. 5818-5822.
repelling water droplets. We tested this hypothesis byapplying the Cassie-Baxter formula for hemispherical topsto our superhydrophobic surfaces (P21, P13, and PI2),assuming an ideal contact angle of cuticular wax 8y = 100°:28 the Cassie-Baxter formula predicts apparent contactangles of 150, 155, and 157°, respectively. This result is onlyindicative because the morphology of the wax crystalloidsis very different from those of our model structures.However, we can confirm Patankar's hypothesis that roughness at this scale might stabilize or even be the primary causeof the hydrophobicity of dual-scale topographies. It wouldbe even more interesting for us to compare our results withexperimental contact angles of insect wings because ourmodels closely resemble the ordered arrays of nanometricstructures shown by Watson et al.'? Unfortunately, this datais not available at present.
Finally, we verified that the current theoretical predictionsfor receding angles agree with our experimental values. Theexperimental receding angles of our Cassie-Baxter drops(P21, P13, and P12) were plotted with eqs 7 and 8 (Figure6). Our values show a trend similar to the theoretical curvesfor cylindrical and hemispherical-ended pillars, but morework will have to be done in order to obtain betterquantitative predictions.
Conclusions. Regular nanopatterns were fabricated insilicon wafers, and the behavior of water droplets on thesesurfaces was evaluated before and after chemical hydrophobization. From our results, we conclude that the compositedrop (hemi-wicking) model successfully predicts the advancing angles on hydrophilic patterns. Analogously, the CassieBaxter and Wenzel models gave accurate estimates of theadvancing angles on hydrophobic patterns. These models arevery sensitive to even small variations in the asperity profile,and we show that if the edges of the cylindrical pillars arenot sharp, a geometry considering a hemispherical-top ratherthan a flat one will predict the advancing experimental anglesmore accurately; we suggest that the same might be true forreceding angles. In accordance with Patankar's criterion fordesigning a superhydrophobic surface, we confirmed that aforest of slender pillars is the most stable water-repellenttexture; this same topography exhibited superhydrophilicity,confirming the ambivalence of topography-enhanced wettingldewetting. Finally, our findings support the suggestion thatthe epicuticular wax crystalloids of the lotus leaf playa mainrole in its water-repellent behavior.
0.3025
I cyl I---- hem
...
020.15o
•e
0.10.05
-(l.55,
i.().6i
-o.ss]
g -o.z}
~ -0.751~ iU -o.s}
(6) Shibuichi, S.; Onda, T.; Satoh, N.; Tsujii, K. J. Phys. Chem. 1996,100,19512-19517.
(7) Bico, J.; Marzolin, c. Quere, D. Europhys. Lett. 1999, 47, 220226.
(8) Lau, K. K. S.; Bico, J.; Teo, K. B. K.; Chhowalla, M.; Amaratunga,G. A. 1.; Milne, W. I.; McKinley, G. H.; Gleason, K. K. Nano Lett.2003,3, 1701-1705.
(9) Miwa, M.; Nakajima, A.; Fujishima, A.; Hashimoto, K.; Watanabe,T. Langmuir 2000, 16,5754-5760.
(10) Oner, D.; McCarthy, T. J. Langmuir 2000, 7777-7782.(II) Patankar, N. A. Langmuir 2003, 19, 1249-1253.(12) Patankar, N. A. Langmuir 2004,20,8209-8213.(13) Marmur, A. Langmuir 2004,20,3517-3519.(14) Furstner, R.; Barthlott, W.; Neinhuis, c.;Walzel, P. Langmuir 2005,
21,956-961.(15) Barthloot, W.; Neinhuis, C. Planta 1997, 202, 1-8.(16) Shirtcliffe, N. J.; McHale, G.; Newton, M. 1.; Perry, C. C. Langmuir
2005,21,937-943.(17) Watson, G. S.; Watson, J. A. App/. Surf Sci. 2004, 235, 139-144.
Nano Lett., Vol. 5, No. 10, 2005
(18) Kwok, D. Y.; Lin, R.; Neumann, A. W. Colloids Surf, A 1996, 116,63-77.
(19) Roura, P.; Fort, J. Langmuir 2002, 18,566-569.(20) Bico,1.; Tordeux, c.; Quere, D. Europhys. Lett. 2001, 55, 214
220.(21) McHale, G.; Shirtcliffe, N. J.; Aqil, S.; Perry, C. c. Newton, M. 1.
Phys. Rev. Lett. 2004, 93, 036102- L(22) Abdelsalam, M, E; Bartlett, P. N.; Kelf, T.; Baumberg, J, Langmuir
2005,21,1753-1757.(23) Quere, D. Physica A 2002, 313, 32-46.(24) Burton, Z.; Bhushan, B. Nano Lett. 2005, 5,1607-1613.(25) Suh, K. Y.; Jon, S. Langmuir 2005,21,6836-6841.(26) Rozlosnik, N.; Gerstenberg, M, c., Larsen, N. B. Langmuir 2003,
19, 1182.(27) Rasband, W. S. U.S. National Institutes of Health: Betheda, MD,
1997-2005.(28) Holloway, P. J. Ann. App/. BiD/. 1969, 63, 145-153.
NL051435T
2103
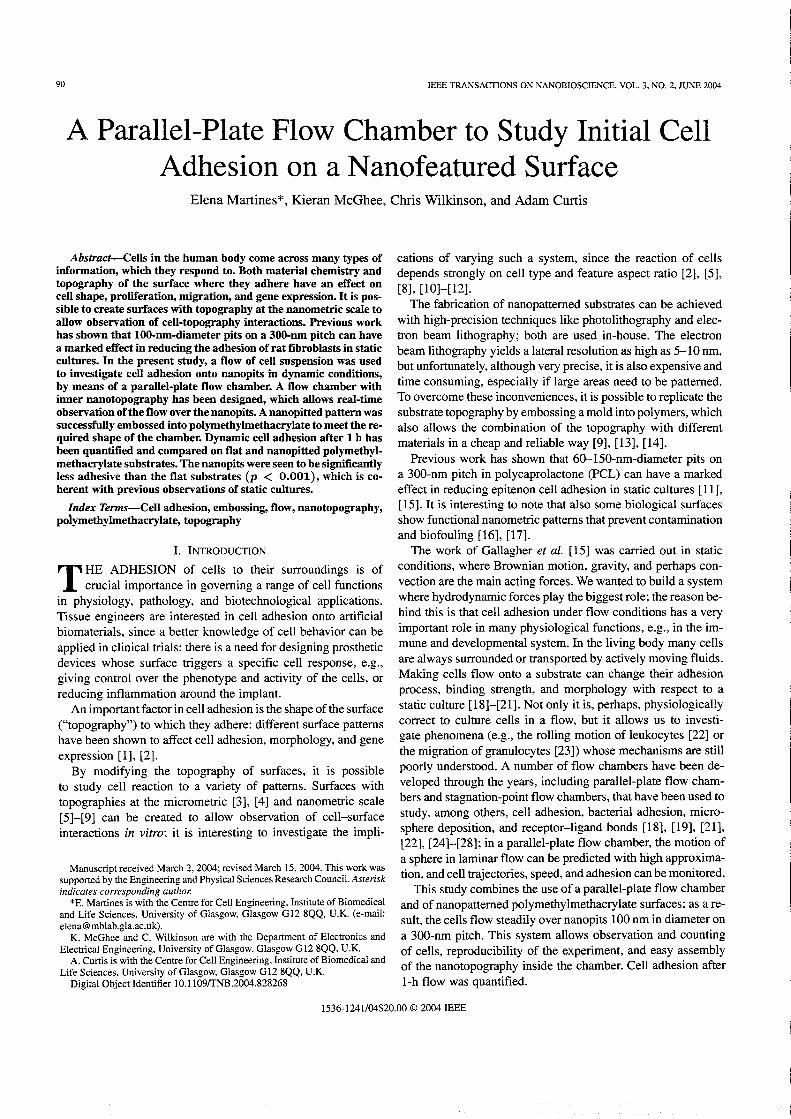
90 IEEE TRANSACTIONS ON NANOBIOSCIENCE. VOL. 3. NO.2. JUNE 2004
A Parallel-Plate Flow Chamber to Study Initial CellAdhesion on a Nanofeatured Surface
Elena Martines*, Kieran McGhee, Chris Wilkinson, and Adam Curtis
Abstract-Cells in the human body come across many types ofinformation, which they respond to. Both material chemistry andtopography of the surface where they adhere have an effect oncell shape, proliferation, migration, and gene expression. It is possible to create surfaces with topography at the nanometric scale toallow observation of cell-topography interactions. Previous workhas shown that lOO-nm-diameter pits on a 300-nm pitch can havea marked effect in reducing the adhesion of rat fibroblasts in staticcultures. In the present study, a flow of cell suspension was usedto investigate cell adhesion onto nanopits in dynamic conditions,by means of a parallel-plate flow chamber. A flow chamber withinner nanotopography has been designed, which allows real-timeobservation of the flow over the nanopits. A nanopitted pattern wassuccessfully embossed into polymethylmethacrylate to meet the required shape of the chamber. Dynamic cell adhesion after 1 h hasbeen quantified and compared on flat and nanopitted polymethylmethacrylate substrates. The nanopits were seen to be significantlyless adhesive than the flat substrates (p < 0.001), which is coherent with previous observations of static cultures.
Index Terms-Cell adhesion, embossing, flow, nanotopography,polymethylmethacrylate, topography
I. INTRODUCTION
T HE ADHESION of cells to their surroundings is ofcrucial importance in governing a range of cell functions
in physiology, pathology, and biotechnological applications.Tissue engineers are interested in cell adhesion onto artificialbiomaterials, since a better knowledge of cell behavior can beapplied in clinical trials: there is a need for designing prostheticdevices whose surface triggers a specific cell response, e.g.,giving control over the phenotype and activity of the cells, orreducing inflammation around the implant.
An important factor in cell adhesion is the shape of the surface("topography") to which they adhere: different surface patternshave been shown to affect cell adhesion, morphology, and geneexpression [I], [2].
By modifying the topography of surfaces, it is possibleto study cell reaction to a variety of patterns. Surfaces withtopographies at the micrometric [3], [4] and nanometric scale[5]-[9] can be created to allow observation of cell-surfaceinteractions in vitro; it is interesting to investigate the impli-
Manuscript received March 2, 2004; revised March 15, 2004. This work wassupported by the Engineering and Physical Sciences Research Council. Asteriskindicates corresponding author.
*E. Martines is with the Centre for Cell Engineering, Institute of Biomedicaland Life Sciences, University of Glasgow, Glasgow GI2 8QQ, U.K. (e-mail:[email protected]).
K. McGhee and C. Wilkinson are with the Department of Electronics andElectrical Engineering, University of Glasgow, Glasgow G 12 8QQ, U.K.
A. Curtis is with the Centre for Cell Engineering, Institute of Biomedical andLife Sciences, University of Glasgow, Glasgow GI2 8QQ, U.K.
Digital Object Identifier 10.1109rrNB.2004.828268
cations of varying such a system, since the reaction of cellsdepends strongly on cell type and feature aspect ratio [2], [5],[8], [10]-[12].
The fabrication of nanopatterned substrates can be achievedwith high-precision techniques like photolithography and electron beam lithography; both are used in-house. The electronbeam lithography yields a lateral resolution as high as 5-10 nm,but unfortunately, although very precise, it is also expensive andtime consuming, especially if large areas need to be patterned.To overcome these inconveniences, it is possible to replicate thesubstrate topography by embossing a mold into polymers, whichalso allows the combination of the topography with differentmaterials in a cheap and reliable way [9], [13], [14].
Previous work has shown that 6D-150-nm-diameter pits ona 300-nm pitch in polycaprolactone (PCL) can have a markedeffect in reducing epitenon cell adhesion in static cultures [11],[15]. It is interesting to note that also some biological surfacesshow functional nanometric patterns that prevent contaminationand biofouling [16], [17].
The work of Gallagher et al. [15] was carried out in staticconditions, where Brownian motion, gravity, and perhaps convection are the main acting forces. We wanted to build a systemwhere hydrodynamic forces play the biggest role; the reason behind this is that cell adhesion under flow conditions has a veryimportant role in many physiological functions, e.g., in the immune and developmental system. In the living body many cellsare always surrounded or transported by actively moving fluids.Making cells flow onto a substrate can change their adhesionprocess, binding strength, and morphology with respect to astatic culture [18]-[21]. Not only it is, perhaps, physiologicallycorrect to culture cells in a flow, but it allows us to investigate phenomena (e.g., the rolling motion of leukocytes [22] orthe migration of granulocytes [23]) whose mechanisms are stillpoorly understood. A number of flow chambers have been developed through the years, including parallel-plate flow chambers and stagnation-point flow chambers, that have been used tostudy, among others, cell adhesion, bacterial adhesion, microsphere deposition, and receptor-ligand bonds [18], [19], [21],[22], [24]-[28]; in a parallel-plate flow chamber, the motion ofa sphere in laminar flow can be predicted with high approximation, and cell trajectories, speed, and adhesion can be monitored.
This study combines the use of a parallel-plate flow chamberand of nanopatterned polymethylmethacrylate surfaces: as a result, the cells flow steadily over nanopits 100 nm in diameter ona 300-nm pitch. This system allows observation and countingof cells, reproducibility of the experiment, and easy assemblyof the nanotopography inside the chamber. Cell adhesion afterl-h flow was quantified.
1536-1241/04$20.00 © 2004 IEEE
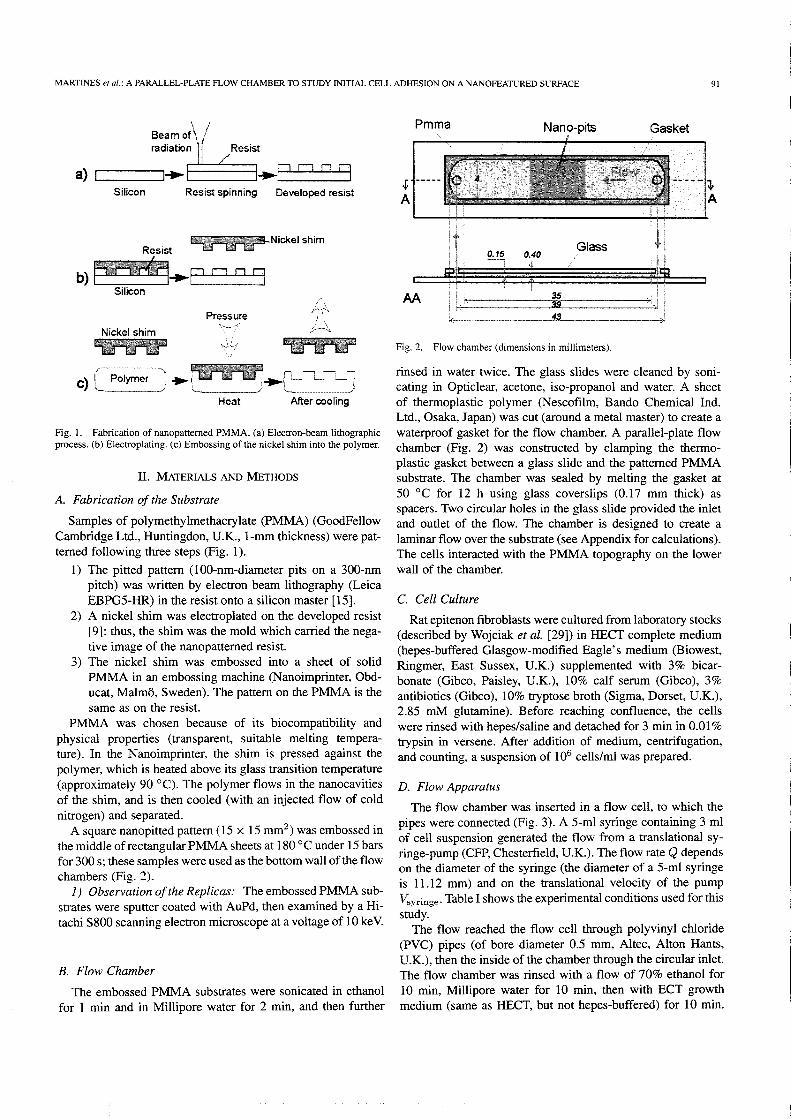
MARTINES et al.: A PARALLEL-PLATE FLOW CHAMBER TO STUDY INITIAL CELL ADHESION ON A NANOFEATURED SURFACE 91
Resist ~Nickel shim
b)~...PCJ09Silicon
\ 'Beamof\ !radiatio~ 'jf / Resist
a) ::=====~I""~""P CJ 0 9Silicon Resist spinning Developed resist
GasketNano-pits
AA
Pmma
+-----A
Fig. 2. Flow chamber (dimensions in millimeters).
Nickel shim
Pressure
c) C~~~e~J ~~""C~-L-UJHeat After cooling
Fig. I. Fabrication of nanopatterned PMMA. (a) Electron-beam lithographicprocess. (b) Electroplating. (c) Embossing of the nickel shim into the polymer.
II. MATERIALS AND METHODS
A. Fabrication of the Substrate
Samples of polymethylmethacrylate (PMMA) (GoodFellowCambridge Ltd., Huntingdon, U.K., l-rnm thickness) were patterned following three steps (Fig. 1).
I) The pitted pattern (IOO-nm-diameter pits on a 300-nmpitch) was written by electron beam lithography (LeicaEBPG5-HR) in the resist onto a silicon master [15].
2) A nickel shim was electroplated on the developed resist[9]; thus, the shim was the mold which carried the negative image of the nanopatterned resist.
3) The nickel shim was embossed into a sheet of solidPMMA in an embossing machine (Nanoimprinter, Obducat, Malmo, Sweden). The pattern on the PMMA is thesame as on the resist.
PMMA was chosen because of its biocompatibility andphysical properties (transparent, suitable melting temperature). In the Nanoimprinter, the shim is pressed against thepolymer, which is heated above its glass transition temperature(approximately 90°C). The polymer flows in the nanocavitiesof the shim, and is then cooled (with an injected flow of coldnitrogen) and separated.
A square nanopitted pattern (IS x IS mrrr') was embossed inthe middle ofrectangularPMMA sheets at 180°C under 15barsfor 300 s; these samples were used as the bottom wall of the flowchambers (Fig. 2).
1) Observation ofthe Replicas: The embossed PMMA substrates were sputter coated with AuPd, then examined by a Hitachi S800 scanning electron microscope at a voltage of 10 keV.
B. Flow Chamber
The embossed PMMA substrates were sonicated in ethanolfor 1 min and in Millipore water for 2 min, and then further
rinsed in water twice. The glass slides were cleaned by sonicating in Opticlear, acetone, iso-propanol and water. A sheetof thermoplastic polymer (Nescofilm, Bando Chemical Ind.Ltd., Osaka, Japan) was cut (around a metal master) to create awaterproof gasket for the flow chamber. A parallel-plate flowchamber (Fig. 2) was constructed by clamping the thermoplastic gasket between a glass slide and the patterned PMMAsubstrate. The chamber was sealed by melting the gasket at50 °C for 12 h using glass coverslips (0.17 mm thick) asspacers. Two circular holes in the glass slide provided the inletand outlet of the flow. The chamber is designed to create alaminar flow over the substrate (see Appendix for calculations).The cells interacted with the PMMA topography on the lowerwall of the chamber.
C. Cell Culture
Rat epitenon fibroblasts were cultured from laboratory stocks(described by Wojciak et al. [29]) in HECT complete medium(hepes-buffered Glasgow-modified Eagle's medium (Biowest,Ringmer, East Sussex, U.K.) supplemented with 3% bicarbonate (Gibco, Paisley, U.K.), 10% calf serum (Gibco), 3%antibiotics (Gibco), 10% tryptose broth (Sigma, Dorset, U.K.),2.85 mM glutamine). Before reaching confluence, the cellswere rinsed with hepes/saline and detached for 3 min in 0.01%trypsin in versene. After addition of medium, centrifugation,and counting, a suspension of 106 cells/ml was prepared.
D. Flow Apparatus
The flow chamber was inserted in a flow cell, to which thepipes were connected (Fig. 3). A 5-ml syringe containing 3 mlof cell suspension generated the flow from a translational syringe-pump (CFP,Chesterfield, U.K.). The flow rate Qdependson the diameter of the syringe (the diameter of a 5-ml syringeis 11.12 mm) and on the translational velocity of the pumpV';;yringe' Table I shows the experimental conditions used for thisstudy.
The flow reached the flow cell through polyvinyl chloride(PVC) pipes (of bore diameter 0.5 mm, Altec, Alton Hants,U.K.), then the inside of the chamber through the circular inlet.The flow chamber was rinsed with a flow of 70% ethanol for10 min, Millipore water for 10 min, then with ECT growthmedium (same as HECT, but not hepes-buffered) for 10 min.
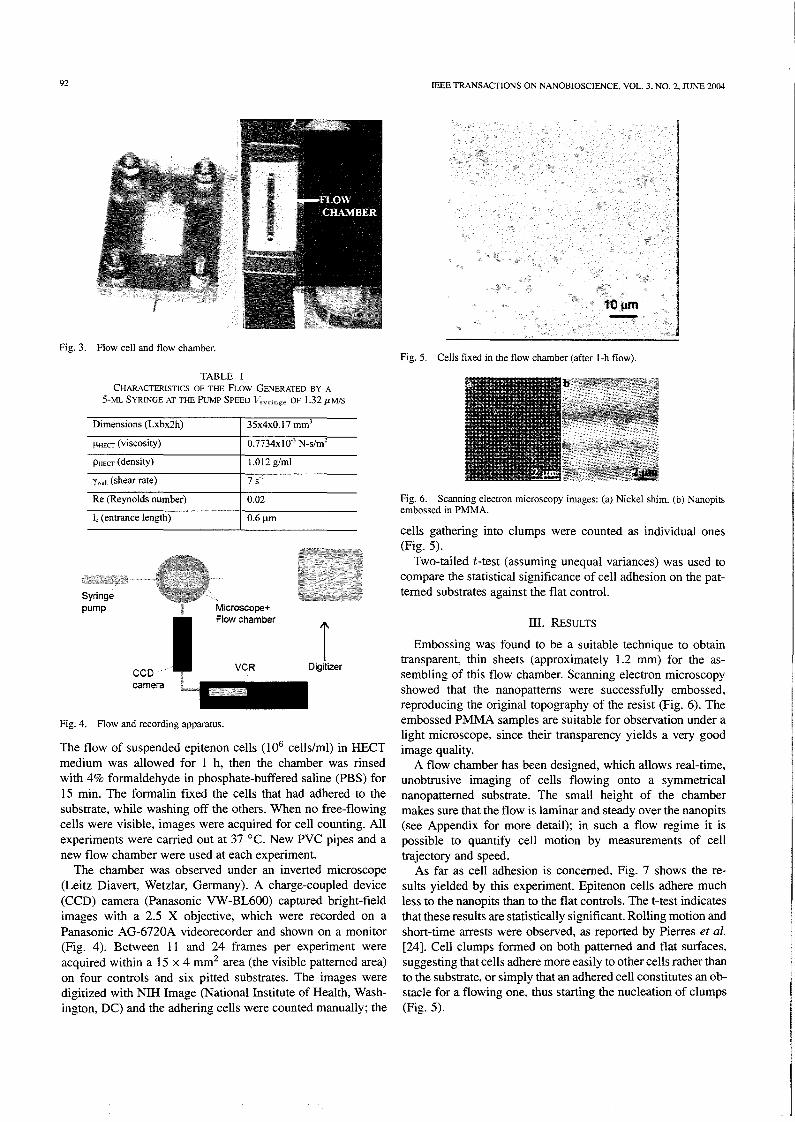
92
Fig. 3. Flow cell and flow chamber.
IEEE TRANSACTIONS ON NANOBIOSCIENCE. VOL. 3. NO.2. JUNE 2004
Fig. 5. Cells fixed in the flow chamber (after I-h flow).
TABLE ICHARACTERISTICS OF THE FLOW GENERATED BY A
5-ML SYRINGE ATTHE PuMP SPEED V~Y'inge OF 1.32 pM/S
The flow of suspended epitenon cells (l06 cells/ml) in HECTmedium was allowed for I h, then the chamber was rinsedwith 4% formaldehyde in phosphate-buffered saline (PBS) for15 min. The formalin fixed the cells that had adhered to thesubstrate, while washing off the others. When no free-flowingcells were visible, images were acquired for cell counting. Allexperiments were carried out at 37°C. New PVC pipes and anew flow chamber were used at each experiment.
The chamber was observed under an inverted microscope(Leitz Diavert, Wetzlar, Germany). A charge-coupled device(CCD) camera (Panasonic VW-BL600) captured bright-fieldimages with a 2.5 X objective, which were recorded on aPanasonic AG-6720A videorecorder and shown on a monitor(Fig. 4). Between 11 and 24 frames per experiment wereacquired within a 15 x 4 mrrr' area (the visible patterned area)on four controls and six pitted substrates. The images weredigitized with NIH Image (National Institute of Health, Washington, DC) and the adhering cells were counted manually; the
Dimensions (Lxbx2h)
ftHECT (viscosity)
PHECT (density)
)' w,1I (shear rate)
Re (Reynolds number)
I, (entrance length)
Syringepump
CCD
Fig. 4. Flow and recording apparatus.
35x4xO.17 mrrr'
0.7734xlO-3 Nss/rrr'
1.012 g/ml
0.02
rDigitizer
Fig. 6. Scanning electron microscopy images: (a) Nickel shim. (b) Nanopitsembossed in PMMA.
cells gathering into clumps were counted as individual ones(Fig. 5).
Two-tailed t-test (assuming unequal variances) was used tocompare the statistical significance of cell adhesion on the patterned substrates against the flat control.
III. RESULTS
Embossing was found to be a suitable technique to obtaintransparent, thin sheets (approximately 1.2 rom) for the assembling of this flow chamber. Scanning electron microscopyshowed that the nanopatterns were successfully embossed,reproducing the original topography of the resist (Fig. 6). Theembossed PMMA samples are suitable for observation under alight microscope, since their transparency yields a very goodimage quality.
A flow chamber has been designed, which allows real-time,unobtrusive imaging of cells flowing onto a symmetricalnanopatterned substrate. The small height of the chambermakes sure that the flow is laminar and steady over the nanopits(see Appendix for more detail); in such a flow regime it ispossible to quantify cell motion by measurements of celltrajectory and speed.
As far as cell adhesion is concerned, Fig. 7 shows the results yielded by this experiment. Epitenon cells adhere muchless to the nanopits than to the flat controls. The t-test indicatesthat these results are statistically significant. Rolling motion andshort-time arrests were observed, as reported by Pierres et al.[24]. Cell clumps formed on both patterned and flat surfaces,suggesting that cells adhere more easily to other cells rather thanto the substrate, or simply that an adhered cell constitutes an obstacle for a flowing one, thus starting the nucleation of clumps(Fig. 5).
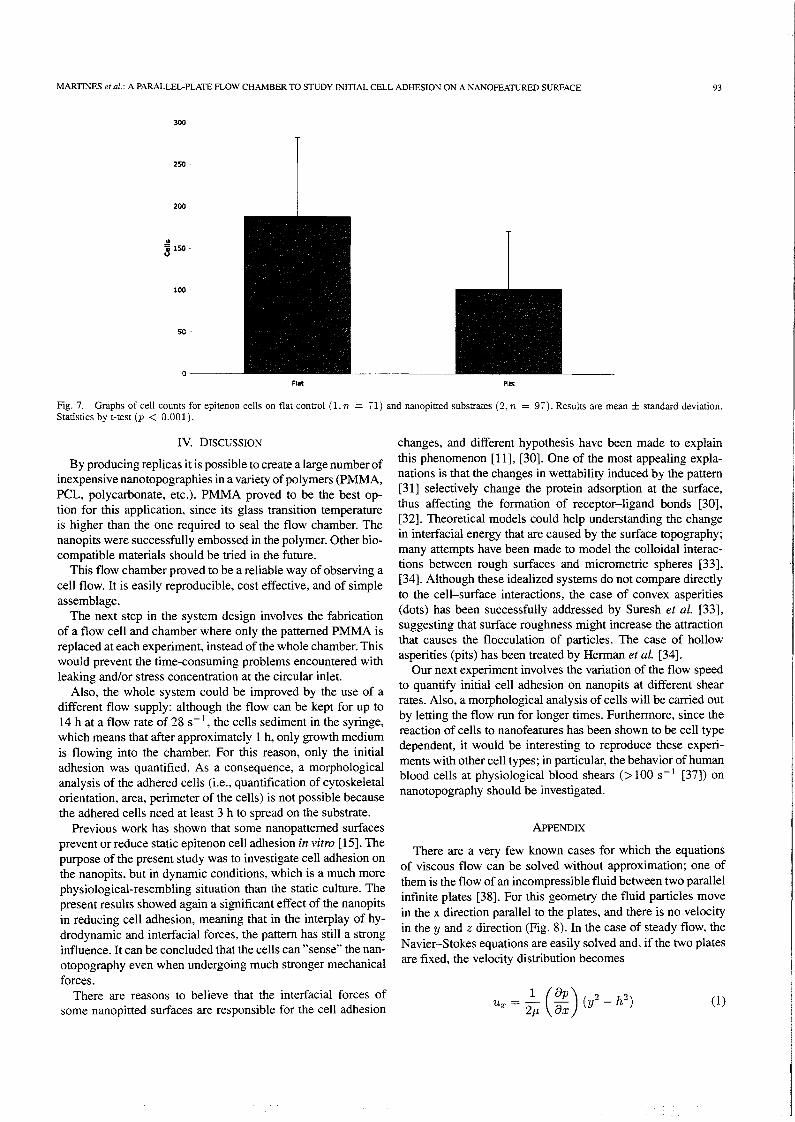
MARTINES et al.: A PARALLEL-PLATE FLOW CHAMBER TO STUDY INITIAL CELL ADHESION ON A NANOFEATURED SURFACE
300
250
200
93
..'i 150 u
100 -
50
0----Flit Pits
SFig'. 7.. Graphs of cell counts for epitenon cells on flat control (1. n = (1) and nanopitted substrates (.) n = 97) Results are me ± tand d d . .
tanstics by t-test (1' < 0.001). ~, . an s ar evianon.
IV. DISCUSSION
By producing replicas it is possible to create a large number ofinexpensive nanotopographies in a variety of polymers (PMMA,~CL, polycarbonate, etc.). PMMA proved to be the best op~lOn. for this application, since its glass transition temperatureIS higher than the one required to seal the flow chamber. Thenanopits were successfully embossed in the polymer. Other biocompatible materials should be tried in the future.
This flow chamber proved to be a reliable way of observing acell flow. It is easily reproducible, cost effective, and of simpleassemblage.
The next step in the system design involves the fabricationof a flow cell and chamber where only the patterned PMMA isreplaced at each experiment, instead of the whole chamber. Thiswould prevent the time-consuming problems encountered withleaking and/or stress concentration at the circular inlet.
Also, the whole system could be improved by the use of adifferent flow supply: although the flow can be kept for up to14 h at a flow rate of 28 S-I, the cells sediment in the syringe,which means that after approximately 1 h, only growth mediumis flowing into the chamber. For this reason, only the initialadhesion was quantified. As a consequence, a morphologicalanalysis of the adhered cells (i.e., quantification of cytoskeletalorientation, area, perimeter of the cells) is not possible becausethe adhered cells need at least 3 h to spread on the substrate.
Previous work has shown that some nanopatterned surfacesprevent or reduce static epitenon cell adhesion in vitro [15]. Thepurpose of the present study was to investigate cell adhesion onthe nanopits, but in dynamic conditions, which is a much morephysiological-resembling situation than the static culture. Thepresent results showed again a significant effect of the nanopitsin reducing cell adhesion, meaning that in the interplay of hydrodynamic and interfacial forces, the pattern has still a stronginfluence. It can be concluded that the cells can "sense" the nanotopography even when undergoing much stronger mechanicalforces.
There are reasons to believe that the interfacial forces ofsome nanopitted surfaces are responsible for the cell adhesion
c~anges, and different hypothesis have been made to explainthl~ phe~omenon [11], [30]. One of the most appealing explanations IS ~at the changes in wettability induced by the pattern[31] selectively change the protein adsorption at the surface,thus affecting the formation of receptor-ligand bonds [30],[32]. Theoretical models could help understanding the changein interfacial energy that are caused by the surface topography;many attempts have been made to model the colloidal interactions between rough surfaces and micrometric spheres [33],[34]. Although these idealized systems do not compare directlyto the cell-surface interactions, the case of convex asperities(dots) has been successfully addressed by Suresh et at. [33],suggesting that surface roughness might increase the attractionthat causes the flocculation of particles. The case of hollowasperities (pits) has been treated by Herman et at. [34].
Our next experiment involves the variation of the flow speedto quantify initial cell adhesion on nanopits at different shearrates. Also, a morphological analysis of cells will be carried outby letting the flow run for longer times. Furthermore, since thereaction of cells to nanofeatures has been shown to be cell typedependent, it would be interesting to reproduce these experiments with other cell types; in particular, the behavior of humanblood cells at physiological blood shears (> 100 S-1 [37]) onnanotopography should be investigated.
ApPENDIX
There are a very few known cases for which the equationsof viscous flow can be solved without approximation; one ofthem is the flow of an incompressible fluid between two parallelinfinite plates [38]. For this geometry the fluid particles movein the x direction parallel to the plates, and there is no velocityin the y and z direction (Fig. 8). In the case of steady flow, theNavier-Stokes equations are easily solved and, ifthe two platesare fixed, the velocity distribution becomes
(1)
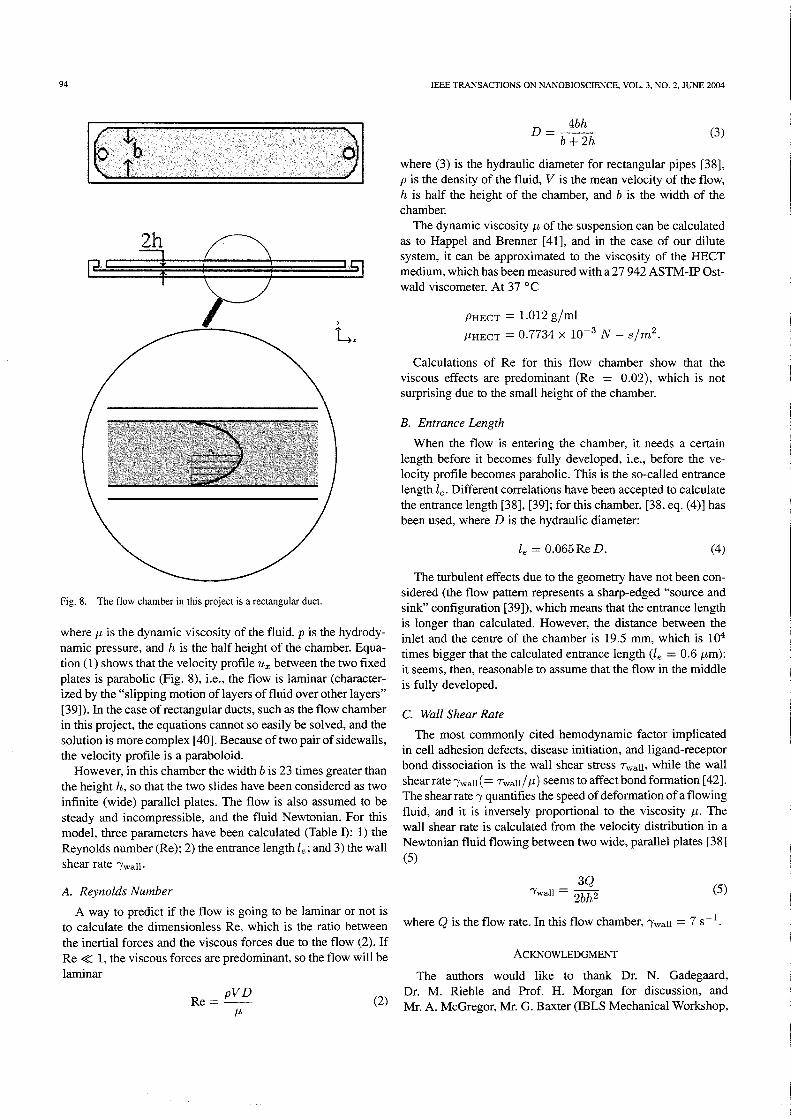
94 IEEE TRANSACTIONS ON NANOBIOSCIENCE. VOL. 3. NO.2. JUNE 2004
PHECT = 1.012 glmlf.LHECT = 0.7734 X 10⁻³ N - 81m2.
where (3) is the hydraulic diameter for rectangular pipes [38],P is the density of the fluid, V is the mean velocity of the flow,h is half the height of the chamber, and b is the width of thechamber.
The dynamic viscosity f.L of the suspension can be calculatedas to Happel and Brenner [41], and in the case of our dilutesystem, it can be approximated to the viscosity of the HECTmedium, which has been measured with a 27942 ASTM-IP Ostwald viscometer. At 37°C
,4.
D=~b +2h
(3)
Calculations of Re for this flow chamber show that theviscous effects are predominant (Re = 0.02), which is notsurprising due to the small height of the chamber.
B. Entrance Length
When the flow is entering the chamber, it needs a certainlength before it becomes fully developed, i.e., before the velocity profile becomes parabolic. This is the so-called entrancelength Ie. Different correlations have been accepted to calculatethe entrance length [38], [39]; for this chamber, [38, eq. (4)] hasbeen used, where D is the hydraulic diameter:
The turbulent effects due to the geometry have not been considered (the flow pattern represents a sharp-edged "source andsink" configuration [39]), which means that the entrance lengthis longer than calculated. However, the distance between theinlet and the centre of the chamber is 19.5 rnm, which is ]04
times bigger that the calculated entrance length (le = 0.6 f.Lm):it seems, then, reasonable to assume that the flow in the middleis fully developed.
(4)l; = 0.065ReD.
C. Wall Shear Rate
The most commonly cited hemodynamic factor implicatedin cell adhesion defects, disease initiation, and ligand-receptorbond dissociation is the wall shear stress Twall> while the wallshear rate l'wall(= T wallI f.L) seems to affect bond formation [42].The shear rate I' quantifies the speed ofdeformation of a flowingfluid, and it is inversely proportional to the viscosity u, Thewall shear rate is calculated from the velocity distribution in aNewtonian fluid flowing between two wide, parallel plates [38](5)
where f.L is the dynamic viscosity of the fluid, p is the hydrodynamic pressure, and h is the half height of the chamber. Equation (I) shows that the velocity profile 7Lx between the two fixedplates is parabolic (Fig. 8), i.e., the flow is laminar (characterized by the "slipping motion of layers of fluid over other layers"[39]). In the case of rectangular ducts, such as the flow chamberin this project, the equations cannot so easily be solved, and thesolution is more complex [40]. Because of two pair of sidewalls,the velocity profile is a paraboloid.
However, in this chamber the width b is 23 times greater thanthe height h, so that the two slides have been considered as twoinfinite (wide) parallel plates. The flow is also assumed to besteady and incompressible, and the fluid Newtonian. For thismodel, three parameters have been calculated (Table I): I) theReynolds number (Re); 2) the entrance length Ie; and 3) the wallshear rate l'wall.
Fig. 8. The flow chamber in this project is a rectangular duct.
A. Reynolds Number
A way to predict if the flow is going to be laminar or not isto calculate the dimensionless Re, which is the ratio betweenthe inertial forces and the viscous forces due to the flow (2). IfRe ~ 1, the viscous forces are predominant, so the flow will belaminar
(5)
Re = pVDIL
(2)
3Ql'wall = 2bh2
where Q is the flow rate. In this flow chamber, l'wall = 7 S-1.
ACKNOWLEDGMENT
The authors would like to thank Dr. N. Gadegaard,Dr. M. Riehle and Prof. H. Morgan for discussion, andMr. A. McGregor, Mr. G. Baxter (IBLS Mechanical Workshop,
M".RTINES et al.: A PARALLEL-PLATE R..OW CHAMBER TO STUDY INITIAL CELL ADHESION ON A NANOFEATURED SURFACE 95
Glasgow, U.K.), and Mr. K. Piechowiak (Electronics Mechanical Workshop, Glasgow, U.K.) for technical assistance.
REFERENCES
[1] A. Curtis and C. D. W. Wilkinson, "Topographical control of cells," Biomaterials, vol. 18, pp. 1573-1583, 1997.
[2] M. Dalby, S. J. Yarwood, M. O. Riehle, H. J. H. Johnstone, S.Affrossman. and A. S. G. Curtis, "Increasing fibroblast response tomaterials using nanotopography: Morphological and genetic measurements of cell response to l3-nm-high polymer demixed islands:' Exp.Cell Res., vol. 276, pp. 1-9,2002.
[3] B. Chehroudi and D. M. Brunette, "Effects of surface topography oncell behavior:' in Encyclopedic Handbook ofBiomaterials and Bioengineering. Part S: Materials, D. Donald, L. Wise, D. E. Altobelli. M. J.Yaszenski, J. D. Gresser, and E. R. Schwartz, Eds. New York: MarcelDekker, 1995.
[4] D. L. Rovenski YA, O. Y. Ivanova, and J. M. Vasiliev, "Locomotorybehavior of epitheliocytes and fibroblasts on metallic grids," J. Cell Sci.,vol. 112, pp. 1273-1282, 1999.
[5] P. Clark, P. Connolly, A. S. G. Curtis, J. A. T. Dow. and C. D. W.Wilkinson, "Cell guidance by ultrafine topography in vitro." J. CellSci., vol. 99, pp. 73-77,1991.
[6] C. Wilkinson, M. Riehle, M. A. Wood. J. O. Gallagher, and A. S. G.Curtis. "The use of materials patterned on a nano- and micro-metric scalein cellular engineering," Mater. Sci. Eng., 200 I.
[7] M. Dalby, M. O. Riehle, S. Affrossman, and A. S. G. Curtis. "In vitroreaction of endothelial cells to polymer demixed nanotopography," Biomaterials, vol. 23, pp. 2945-2954, 2002.
[8] C. Wilkinson, A. S. G. Curtis, and J. Crossan, "Nanofabrication in cellular engineering," J. Vac. Sci. Tech. B, vol. 16, pp. 3132-3136, 1998.
[9] N. Gadegaard, S. Thoms, D. S. Macintyre, K. Mcghee, J. O. Gallagher,B. Casey, and C. D. W. Wilkinson, "Arrays of nano-dots for cellularengineering," Microelectron. Eng., vol. 67-68. pp. 162-168,2003.
[10] A. Curtis and C. D. W. Wilkinson, "Topographical control of cell migration." in Motion Analysis ofLiving Cells. Techniques in Modern Biomedical Microscopy, D. Soll and D. Wessels, Eds. New York: Wiley-Liss,1998, pp. 141-156.
[I I] A. Curtis, B. Casey. J. O. Gallagher. D. Pasqui, M. A. Wood, and C. D.W. Wilkinson, "Substratum nanotopography and the adhesion of biological cells. Are symmetry or regularity of nanotopography important","Biophys. Chem .• vol. 94. pp. 275-283, 2001.
[12] M. Riehle. "Cell behavior of rat calvaria bone cells on surfaces withrandom nanometric features," Mater. Sci. Eng. C, vol. 23, pp. 337-340,2003.
[13] Y.Xia, J. A. Rogers. K. E. Paul. and G. M. Whitesides, "Unconventionalmethods for fabricating and patterning nanostructures," Chem. Rev., vol.99. pp. 1823-1848, 1999.
[14] L. Heyderman, H. Schift, C. David, J. Gobrecht, and T. Shweizer, "Flowbehavior of thin polymer films used for hot embossing lithography," Microelectron. Eng., vol. 54. pp. 229-245, 2000.
[15] J. O. Gallagher, K. F. McGhee, C. D. W. Wilkinson. and M. O. Riehle,"Interaction of animal cells with ordered nanotopography," IEEE Trans.Nanobiosci., vol. I, pp. 24-28, Mar. 2002.
[16] W. Barthloot and C. Neinhuis, "Purity of the sacred lotus. or escape fromcontamination in biological surfaces," Planta. vol. 202, pp. 1-8. 1997.
[17] C. Baurn, W. Meyer. R. Stelzer. L. G. Fleisher, and D. Siebers. "Average nanorough skin surface of the pilot whale (globicephala rnelas.delphinidae): Considerations on the self-cleaning abilities based onnanoroughness," Marine Bioi. Online, 2001.
[18] P. Bongrand, P. M. Claesson, and A. S. G. Curtis. Studying Cell Adhesion. Heidelberg, Germany: Springer-Verlag, 1994.
[19] J. Doroszewski, J. Skierski, and L. Przadka, "Interaction of neoplasticcells with glass surface under flow conditions," Exp. Cell Res., vol. 104,pp. 335-343, 1977.
[20] T. Van Kooten. J. M. Schakenraad, H. C. Van der Mei, and H. J. Busscher,"Development and use of a parallel-plate flow chamber for studying cellular adhesion to solid surfaces." J. Biomed. Mater. Res.• vol. 26, pp.725-738, 1992.
[2 I] M. Stavridi, M. Katsikogianni, and Y. F.Missirlis, "The influence ofsurface patterning and/or sterilization on the heamocompatibility of polycaprolactones," Mater. Sci. Eng. C. vol. 23. pp. 359-365, 2003.
[22] O. Tissot, A. Pierres, C. Foa, M. Delaage, and P. Bongrand, "Motion ofcells sedimenting on a solid surface in a laminar shear flow," Biophys.J.. vol. 61, pp. 204-215,1992.
[23] J. Doroszewski and A. Kiwala, "Adhesion and locomotion of granulocytes under flow conditions," J. Cell Sci., vol. 90. pp. 335-340. 1988.
[24] A. Pierres, A. M. Benoliel, and P. Bongrand, "Measuring bonds between surface-associated molecules." J. Immunoi. Methods. vol. 196,pp. 105-120, 1996.
[25] R. Poyton and D. Branton, "A multipurpose microperfusion chamber,"Exp. Cell Res., vol. 60, pp. 109-I14. 1970.
[26] J. Dvorak and W. Stotler. "A controlled-environment culture system forhigh resolution light microscopy." Exp. Cell Res., vol. 68, pp. 144-148,1971.
[27] K. Spring and A. Hope. "Size and shape of the lateral intercellular spacesin a living epithelium." Science. vol. 200. pp. 54-57. 1978.
[28] J. Yang. R. Bos, A. Poortinga, P. J. Wit. G. F. Belder, and H. J. Busscher,"Comparison of particle deposition in a parallel plate flow chamber anda stagnation point flow chamber," Langmuir. vol. 15. pp. 4671-4677.1999.
[29] B. Wojciak, J. Crossan, A. S. G. Curtis, and C. D. W. Wilkinson,"Grooved substrata facilitate In vitro healing of completely dividedflexor tendons." J. Mater. Sci.: Mater. Med., vol. 6, pp. 266-271. 1995.
[30] T. Webster. C. Ergun, R. H. Doremus, R. W. Siegel. and R. Bizios, "Specific proteins mediate enhanced osteoblast adhesion on nanophase ceramics." J. Biomed. Mater. Res., vol. 51. pp. 475-483, 2000.
[31] J. Bico, C. Tordeux, and D. Quere, "Rough wetting." Europhys. Lett.,vol. 55. pp. 214-220, 2001.
[32] T. Ruardy, H. E. Moorlag, J. M. Schakenraad, H. C. Van der Mei. and H.J. Busscher, "Growth of fibroblasts and endothelial cells on wettabilitygradient surfaces," J. Colloid Interface Sci., vol. 188, pp. 209-217,1997.
[33] L. Suresh and J. Y.Walz, "Effect of surface roughness on the interactionenergy between a colloidal sphere and a flat plate." J. Colloid InterfaceSci.• vol. 183, pp. 199-213. 1996.
[34] M. Herman and K. D. Papadopoulos. "A method for modeling the interactions of parallel flat plate systems with surface features," J. ColloidInterface Sci.• vol. 142, pp. 331-342,1991.
[35] W. Bowen and A. O. Sharif. "Hydrodynamic and colloidal interactionseffects on the rejection of a particle larger than a pore in microfiltrationand ultrafiltration membranes," Chem. Eng. Sci.• vol. 53. pp. 879-890,1998.
[36] E. Kokkoli and C. F.Zokoski, "Surface pattern recognition by a colloidalparticle," Langmuir, vol. 17. pp. 369-376. 2001.
[37] A. Hoeks. S. K. Samijo, P. J. Brands. and R. S. Reneman, "Noninvasivedetermination of shear-rate distribution across the arterial lumen," Hypertension, vol. 26. pp. 26-33. 1995.
[38] B. Munson, D. F. Young, and T. H. Okiishi, Fundamentals ofFluid Mechanics, 3rd ed. New York: Wiley, 1990.
[39] L. Prandtl, Essentials of Fluid Dynamics. London. U.K.: Blackie,1952.
[40] W. Langlois, Slow Viscous Flow. New York: Macmillan. 1964.[41] J. Happel and H. Brenner, Low Reynolds Number Hydrody
namics. New York: Prentice-Hall, 1965.[42] S. Chen and T. A. Springer. "Selectin receptor-ligand bonds: Formation
limited by shear rate and dissociation governed by the Bell model." Proc.Nat. Acad. Sci.• vol. 98. no. 3, pp. 950-955, Jan. 30. 2001.
Elena Martines received the M.Eng. degree from the Institut National desSciences Appliquees (INSA), Lyon, France, in 2001. She is currently workingtoward the Ph.D. degree in the Centre for Cell Engineering, University ofGlasgow. Galsgow, U.K.
Her research interests include the use of nanotopographic surfaces to studycell adhesion, microfluidic systems, and surface forces modeling.
Kieran McGhee. photograph and biography not available at the time ofpublication.
Chris Wilkinson. photograph and biography not available at the time ofpublication.
Adam Curtis, photograph and biography not available at the time ofpublication.

THESISCONTAINS
CD/DVD