marriott international, inc
TRANSCRIPT
Table of Contents
UNITED STATESSECURITIES AND EXCHANGE COMMISSION
Washington, D.C. 20549
FORM 10-K
x ANNUAL REPORT PURSUANT TO SECTION 13 OR 15(d) OF THE SECURITIES EXCHANGE ACT OF 1934
For the Fiscal Year Ended December 31, 2010
or
¨ TRANSITION REPORT PURSUANT TO SECTION 13 OR 15(d) OF THE SECURITIES AND EXCHANGE ACTOF 1934
For the transition period from to
Commission File No. 1-13881
MARRIOTT INTERNATIONAL, INC.(Exact name of registrant as specified in its charter)
Delaware 52-2055918(State or other jurisdiction of
incorporation or organization) (IRS Employer
Identification No.)
10400 Fernwood Road, Bethesda, Maryland 20817(Address of Principal Executive Offices) (Zip Code)
Registrant’s Telephone Number, Including Area Code (301) 380-3000
Securities registered pursuant to Section 12(b) of the Act:
Title of Each Class Name of Each Exchange on Which Registered
Class A Common Stock, $0.01 par value(367,937,640 shares outstanding as of January 28, 2011)
New York Stock ExchangeChicago Stock Exchange
Securities registered pursuant to Section 12(g) of the Act: NONE
Indicate by check mark if the registrant is a well-known seasoned issuer, as defined in rule 405 of the Securities Act. Yes x No ¨
Indicate by check mark if the registrant is not required to file reports pursuant to Section 13 or Section 15(d) of the Act. Yes ̈ No x
Indicate by check mark whether the registrant: (1) has filed all reports required to be filed by Section 13 or 15(d) of the Securities Exchange Act of 1934during the preceding 12 months (or for such shorter period that the registrant was required to file such reports), and (2) has been subject to such filingrequirements for the past 90 days. Yes x No ¨
Indicate by check mark whether the registrant has submitted electronically and posted on its corporate website, if any, every Interactive Data File required tobe submitted and posted pursuant to Rule 405 of Regulation S-T during the preceding 12 months (or for such shorter period that the registrant was required tosubmit and post such files). Yes x No ¨
Indicate by check mark if disclosure of delinquent filers pursuant to Item 405 of Regulation S-K is not contained herein, and will not be contained, to the bestof the registrant’s knowledge, in definitive proxy or information statements incorporated by reference in Part III of this Form 10-K or any amendment to thisForm 10-K. ¨
Indicate by check mark whether the registrant is a large accelerated filer, an accelerated filer, a non-accelerated filer, or a small reporting company. Seedefinitions of “large accelerated filer,” “accelerated filer” and “smaller reporting company” in Rule 12b-2 of the Exchange Act.
Large accelerated filer x Accelerated filer ¨ Non-accelerated filer ¨ Smaller reporting company ¨
(Do not check if a smaller reportingcompany)
Indicate by check mark whether the registrant is a shell company (as defined in Rule 12b-2 of the Exchange Act). Yes ̈ No x
The aggregate market value of shares of common stock held by non-affiliates at June 18, 2010, was $9,920,558,833
DOCUMENTS INCORPORATED BY REFERENCE
Portions of the Proxy Statement prepared for the 2011 Annual Meeting of Shareholders are incorporated by reference intoPart III of this report.

Table of Contents
MARRIOTT INTERNATIONAL, INC.FORM 10-K TABLE OF CONTENTS
FISCAL YEAR ENDED DECEMBER 31, 2010 Page No. Part I.
Item 1. Business 3 Item 1A. Risk Factors 16 Item 1B. Unresolved Staff Comments 22 Item 2. Properties 22 Item 3. Legal Proceedings 22 Item 4. Removed and Reserved 22
Part II.
Item 5. Market for Registrant’s Common Equity, Related Stockholder Matters and Issuer Purchases of Equity Securities 23 Item 6. Selected Financial Data 24 Item 7. Management’s Discussion and Analysis of Financial Condition and Results of Operations 25 Item 7A. Quantitative and Qualitative Disclosures About Market Risk 60 Item 8. Financial Statements and Supplementary Data 61 Item 9. Changes in and Disagreements with Accountants on Accounting and Financial Disclosure 108 Item 9A. Controls and Procedures 108 Item 9B. Other Information 109
Part III.
Item 10. Directors, Executive Officers and Corporate Governance 110 Item 11. Executive Compensation 110 Item 12. Security Ownership of Certain Beneficial Owners and Management and Related Stockholder Matters 110 Item 13. Certain Relationships and Related Transactions, and Director Independence 110 Item 14. Principal Accounting Fees and Services 110
Part IV.
Item 15. Exhibits, Financial Statement Schedules 115 Signatures 118
2
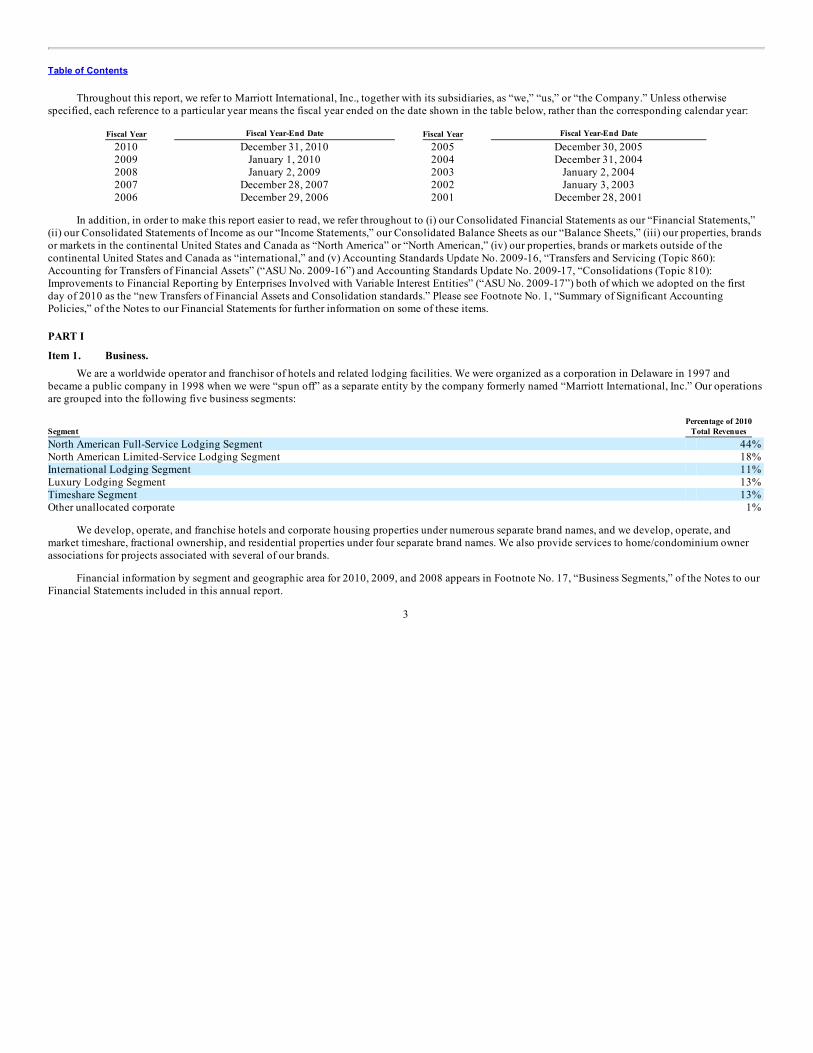
Table of Contents
Throughout this report, we refer to Marriott International, Inc., together with its subsidiaries, as “we,” “us,” or “the Company.” Unless otherwisespecified, each reference to a particular year means the fiscal year ended on the date shown in the table below, rather than the corresponding calendar year:
Fiscal Year Fiscal Year-End Date Fiscal Year Fiscal Year-End Date
2010 December 31, 2010 2005 December 30, 20052009 January 1, 2010 2004 December 31, 20042008 January 2, 2009 2003 January 2, 20042007 December 28, 2007 2002 January 3, 20032006 December 29, 2006 2001 December 28, 2001
In addition, in order to make this report easier to read, we refer throughout to (i) our Consolidated Financial Statements as our “Financial Statements,”(ii) our Consolidated Statements of Income as our “Income Statements,” our Consolidated Balance Sheets as our “Balance Sheets,” (iii) our properties, brandsor markets in the continental United States and Canada as “North America” or “North American,” (iv) our properties, brands or markets outside of thecontinental United States and Canada as “international,” and (v) Accounting Standards Update No. 2009-16, “Transfers and Servicing (Topic 860):Accounting for Transfers of Financial Assets” (“ASU No. 2009-16”) and Accounting Standards Update No. 2009-17, “Consolidations (Topic 810):Improvements to Financial Reporting by Enterprises Involved with Variable Interest Entities” (“ASU No. 2009-17”) both of which we adopted on the firstday of 2010 as the “new Transfers of Financial Assets and Consolidation standards.” Please see Footnote No. 1, “Summary of Significant AccountingPolicies,” of the Notes to our Financial Statements for further information on some of these items.
PART I
Item 1. Business.We are a worldwide operator and franchisor of hotels and related lodging facilities. We were organized as a corporation in Delaware in 1997 and
became a public company in 1998 when we were “spun off” as a separate entity by the company formerly named “Marriott International, Inc.” Our operationsare grouped into the following five business segments:
Segment Percentage of 2010
Total Revenues North American Full-Service Lodging Segment 44% North American Limited-Service Lodging Segment 18% International Lodging Segment 11% Luxury Lodging Segment 13% Timeshare Segment 13% Other unallocated corporate 1%
We develop, operate, and franchise hotels and corporate housing properties under numerous separate brand names, and we develop, operate, andmarket timeshare, fractional ownership, and residential properties under four separate brand names. We also provide services to home/condominium ownerassociations for projects associated with several of our brands.
Financial information by segment and geographic area for 2010, 2009, and 2008 appears in Footnote No. 17, “Business Segments,” of the Notes to ourFinancial Statements included in this annual report.
3
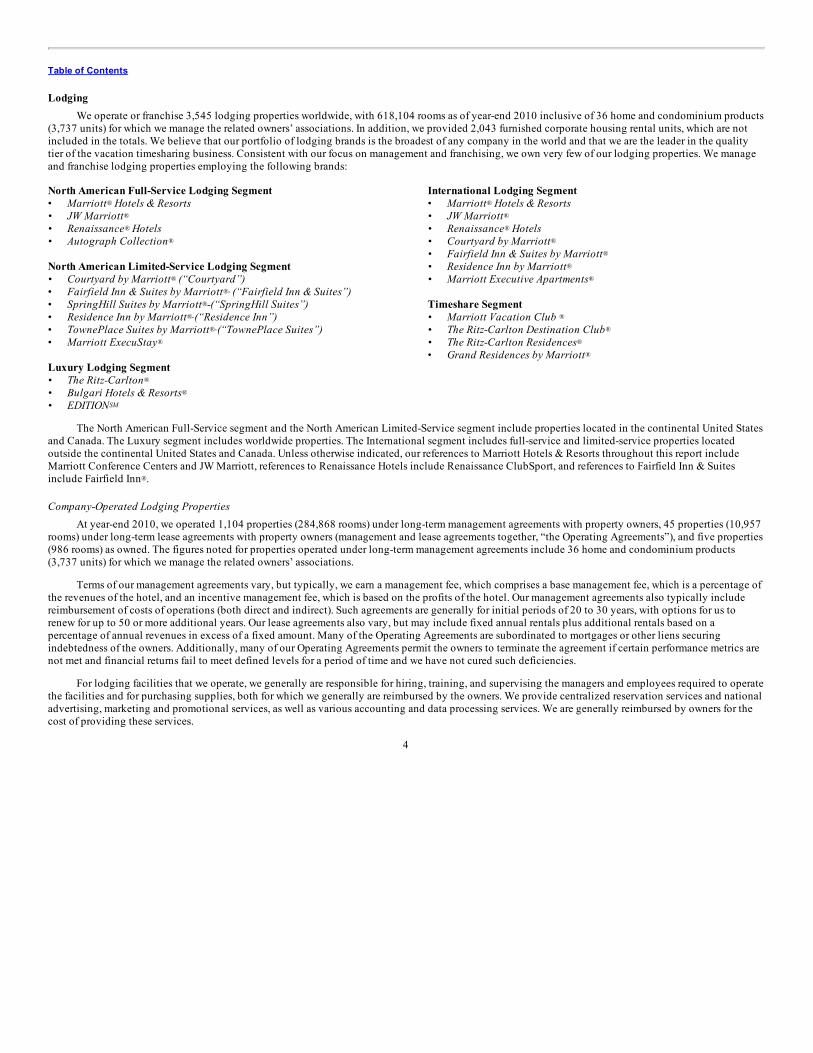
Table of Contents
LodgingWe operate or franchise 3,545 lodging properties worldwide, with 618,104 rooms as of year-end 2010 inclusive of 36 home and condominium products
(3,737 units) for which we manage the related owners’ associations. In addition, we provided 2,043 furnished corporate housing rental units, which are notincluded in the totals. We believe that our portfolio of lodging brands is the broadest of any company in the world and that we are the leader in the qualitytier of the vacation timesharing business. Consistent with our focus on management and franchising, we own very few of our lodging properties. We manageand franchise lodging properties employing the following brands: North American Full-Service Lodging Segment International Lodging Segment• Marriott Hotels & Resorts • Marriott Hotels & Resorts• JW Marriott • JW Marriott• Renaissance Hotels • Renaissance Hotels• Autograph Collection • Courtyard by Marriott
• Fairfield Inn & Suites by MarriottNorth American Limited-Service Lodging Segment • Residence Inn by Marriott• Courtyard by Marriott (“Courtyard”) • Marriott Executive Apartments• Fairfield Inn & Suites by Marriott (“Fairfield Inn & Suites”) • SpringHill Suites by Marriott -(“SpringHill Suites”) Timeshare Segment• Residence Inn by Marriott (“Residence Inn”) • Marriott Vacation Club • TownePlace Suites by Marriott (“TownePlace Suites”) • The Ritz-Carlton Destination Club• Marriott ExecuStay • The Ritz-Carlton Residences
• Grand Residences by MarriottLuxury Lodging Segment • The Ritz-Carlton • Bulgari Hotels & Resorts • EDITION
The North American Full-Service segment and the North American Limited-Service segment include properties located in the continental United Statesand Canada. The Luxury segment includes worldwide properties. The International segment includes full-service and limited-service properties locatedoutside the continental United States and Canada. Unless otherwise indicated, our references to Marriott Hotels & Resorts throughout this report includeMarriott Conference Centers and JW Marriott, references to Renaissance Hotels include Renaissance ClubSport, and references to Fairfield Inn & Suitesinclude Fairfield Inn .
Company-Operated Lodging PropertiesAt year-end 2010, we operated 1,104 properties (284,868 rooms) under long-term management agreements with property owners, 45 properties (10,957
rooms) under long-term lease agreements with property owners (management and lease agreements together, “the Operating Agreements”), and five properties(986 rooms) as owned. The figures noted for properties operated under long-term management agreements include 36 home and condominium products(3,737 units) for which we manage the related owners’ associations.
Terms of our management agreements vary, but typically, we earn a management fee, which comprises a base management fee, which is a percentage ofthe revenues of the hotel, and an incentive management fee, which is based on the profits of the hotel. Our management agreements also typically includereimbursement of costs of operations (both direct and indirect). Such agreements are generally for initial periods of 20 to 30 years, with options for us torenew for up to 50 or more additional years. Our lease agreements also vary, but may include fixed annual rentals plus additional rentals based on apercentage of annual revenues in excess of a fixed amount. Many of the Operating Agreements are subordinated to mortgages or other liens securingindebtedness of the owners. Additionally, many of our Operating Agreements permit the owners to terminate the agreement if certain performance metrics arenot met and financial returns fail to meet defined levels for a period of time and we have not cured such deficiencies.
For lodging facilities that we operate, we generally are responsible for hiring, training, and supervising the managers and employees required to operatethe facilities and for purchasing supplies, both for which we generally are reimbursed by the owners. We provide centralized reservation services and nationaladvertising, marketing and promotional services, as well as various accounting and data processing services. We are generally reimbursed by owners for thecost of providing these services.
4
® ®
® ®
® ®
® ®
®
®
® ®
®-
®
®- ®
®- ®
® ®
®
®
®
SM
®
Table of Contents
Franchised Lodging PropertiesWe have franchising programs that permit the use of many of our lodging brand names and systems by other hotel owners and operators. Under these
programs, we generally receive an initial application fee and continuing royalty fees, which typically range from four percent to six percent of room revenuesfor all brands, plus two percent to three percent of food and beverage revenues for certain full-service hotels. In addition, franchisees contribute to ournational marketing and advertising programs and pay fees for use of our centralized reservation systems.
At year-end 2010, we had 2,391 franchised properties (321,293 rooms).
Timeshare and ResidentialWe develop, operate, market, and sell timeshare interval, fractional ownership, and residential properties under four brand names and generate revenues
from three primary sources: (1) selling fee simple and other forms of timeshare intervals and personal residences; (2) financing consumer purchases; and(3) operating the resorts. During 2010 we broadened our timeshare interval product offering to include the sale of the points-based Marriott Vacation ClubDestinations program in North America and the Caribbean. The Marriott Vacation Club Destinations program offers greater flexibility, furtherpersonalization, and more experience opportunities for Owners. See the “Marriott Vacation Club Destinations Timeshare Program” caption later in this Form10-K for additional information. Many resorts are located adjacent to company-operated hotels, such as Marriott Hotels & Resorts and The Ritz-Carlton, andowners have access to certain hotel facilities during their vacation. Owners can trade their annual interval for intervals at other Marriott timesharing resorts orfor intervals at certain timesharing resorts not otherwise sponsored by Marriott through a third-party exchange company. Owners can also trade their unusedinterval for points in our frequent guest programs, enabling them to stay at over 3,500 company-operated or franchised properties worldwide.
We also sell residential real estate in conjunction with luxury hotel development (Ritz-Carlton-Residential) and Timeshare segment projects (Ritz-Carlton Residences and Grand Residences by Marriott-Residential) and receive branding fees for sales of such branded residential real estate by others.Residences developed in conjunction with hotels are typically constructed and sold by hotel owners with limited amounts, if any, of our capital at risk. Wetypically open our Timeshare segment residential projects over time with limited inventory available at any one time. While the worldwide residential marketis very large, the luxurious nature of our residential properties, the quality and exclusivity associated with our brands, and the hospitality services that weprovide, all serve to make our residential properties distinctive.
SeasonalityIn general, business at company-operated and franchised properties is relatively stable and includes only moderate seasonal fluctuations. Business at
some resort properties may be seasonal depending on location.
Relationship with Major CustomerWe operate a number of properties under long-term management agreements that are owned or leased by Host Hotels & Resorts, Inc. (“Host”). In
addition, Host is a partner in several partnerships that own properties operated by us under long-term management agreements. See Footnote No. 23,“Relationship with Major Customer,” of the Notes to our Financial Statements included in this annual report for more information.
Intellectual PropertyWe operate in a highly competitive industry and our brand names, trademarks, service marks, trade names, and logos are very important to the sales and
marketing of our properties and services. We believe that our brand names and other intellectual property have come to represent the highest standards ofquality, caring, service, and value to our customers and the traveling public. Accordingly, we register and protect our intellectual property where we deemappropriate and otherwise protect against its unauthorized use.
Summary of Properties by BrandAt year-end 2010, we operated or franchised the following properties by brand (excluding 2,043 corporate housing rental units):
5
TM
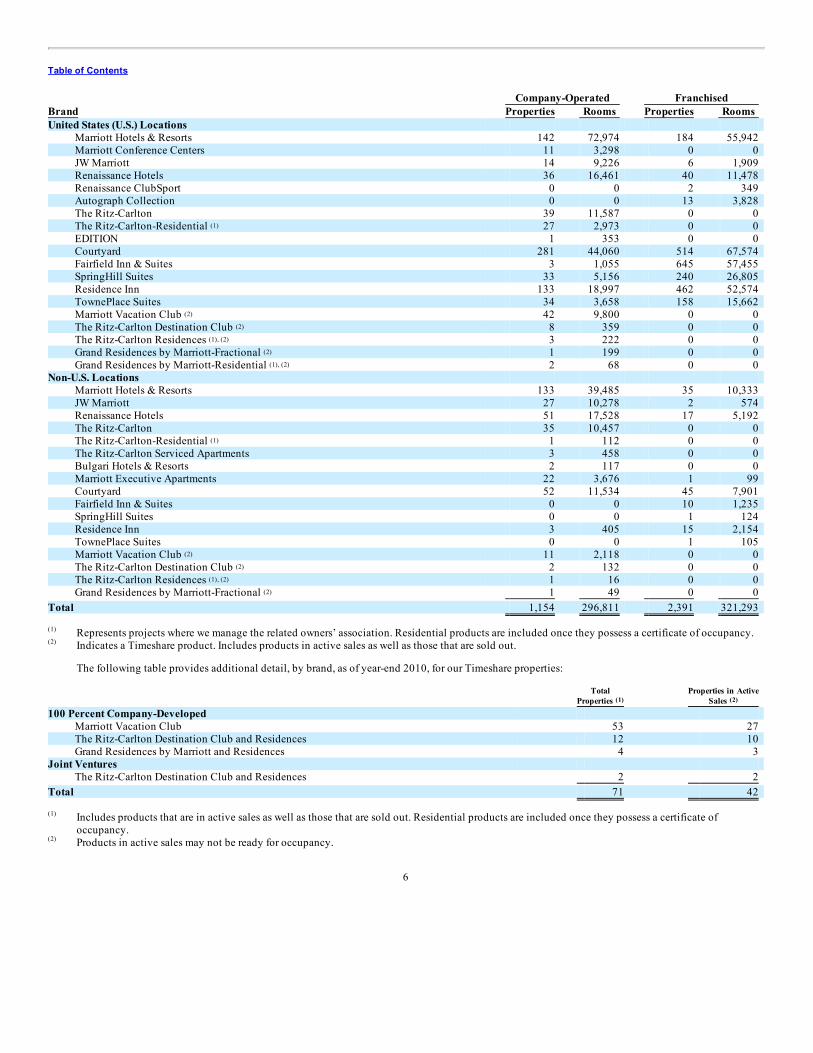
Table of Contents
Company-Operated Franchised Brand Properties Rooms Properties Rooms United States (U.S.) Locations
Marriott Hotels & Resorts 142 72,974 184 55,942 Marriott Conference Centers 11 3,298 0 0 JW Marriott 14 9,226 6 1,909 Renaissance Hotels 36 16,461 40 11,478 Renaissance ClubSport 0 0 2 349 Autograph Collection 0 0 13 3,828 The Ritz-Carlton 39 11,587 0 0 The Ritz-Carlton-Residential 27 2,973 0 0 EDITION 1 353 0 0 Courtyard 281 44,060 514 67,574 Fairfield Inn & Suites 3 1,055 645 57,455 SpringHill Suites 33 5,156 240 26,805 Residence Inn 133 18,997 462 52,574 TownePlace Suites 34 3,658 158 15,662 Marriott Vacation Club 42 9,800 0 0 The Ritz-Carlton Destination Club 8 359 0 0 The Ritz-Carlton Residences 3 222 0 0 Grand Residences by Marriott-Fractional 1 199 0 0 Grand Residences by Marriott-Residential 2 68 0 0
Non-U.S. Locations Marriott Hotels & Resorts 133 39,485 35 10,333 JW Marriott 27 10,278 2 574 Renaissance Hotels 51 17,528 17 5,192 The Ritz-Carlton 35 10,457 0 0 The Ritz-Carlton-Residential 1 112 0 0 The Ritz-Carlton Serviced Apartments 3 458 0 0 Bulgari Hotels & Resorts 2 117 0 0 Marriott Executive Apartments 22 3,676 1 99 Courtyard 52 11,534 45 7,901 Fairfield Inn & Suites 0 0 10 1,235 SpringHill Suites 0 0 1 124 Residence Inn 3 405 15 2,154 TownePlace Suites 0 0 1 105 Marriott Vacation Club 11 2,118 0 0 The Ritz-Carlton Destination Club 2 132 0 0 The Ritz-Carlton Residences 1 16 0 0 Grand Residences by Marriott-Fractional 1 49 0 0
Total 1,154 296,811 2,391 321,293
Represents projects where we manage the related owners’ association. Residential products are included once they possess a certificate of occupancy.Indicates a Timeshare product. Includes products in active sales as well as those that are sold out.
The following table provides additional detail, by brand, as of year-end 2010, for our Timeshare properties:
Total
Properties Properties in Active
Sales 100 Percent Company-Developed
Marriott Vacation Club 53 27 The Ritz-Carlton Destination Club and Residences 12 10 Grand Residences by Marriott and Residences 4 3
Joint Ventures The Ritz-Carlton Destination Club and Residences 2 2
Total 71 42
Includes products that are in active sales as well as those that are sold out. Residential products are included once they possess a certificate ofoccupancy.Products in active sales may not be ready for occupancy.
6
(1)
(2)
(2)
(1), (2)
(2)
(1), (2)
(1)
(2)
(2)
(1), (2)
(2)
(1)
(2)
(1) (2)
(1)
(2)
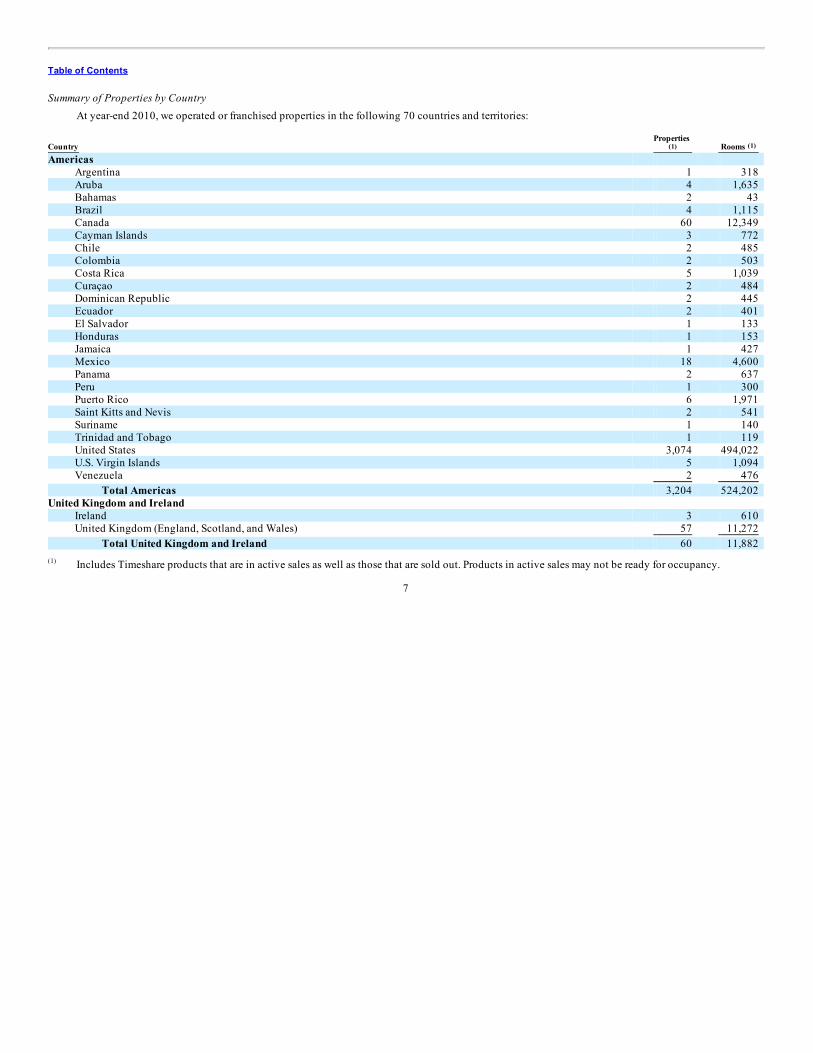
Table of Contents
Summary of Properties by CountryAt year-end 2010, we operated or franchised properties in the following 70 countries and territories:
Country Properties
Rooms Americas
Argentina 1 318 Aruba 4 1,635 Bahamas 2 43 Brazil 4 1,115 Canada 60 12,349 Cayman Islands 3 772 Chile 2 485 Colombia 2 503 Costa Rica 5 1,039 Curaçao 2 484 Dominican Republic 2 445 Ecuador 2 401 El Salvador 1 133 Honduras 1 153 Jamaica 1 427 Mexico 18 4,600 Panama 2 637 Peru 1 300 Puerto Rico 6 1,971 Saint Kitts and Nevis 2 541 Suriname 1 140 Trinidad and Tobago 1 119 United States 3,074 494,022 U.S. Virgin Islands 5 1,094 Venezuela 2 476
Total Americas 3,204 524,202 United Kingdom and Ireland
Ireland 3 610 United Kingdom (England, Scotland, and Wales) 57 11,272
Total United Kingdom and Ireland 60 11,882
Includes Timeshare products that are in active sales as well as those that are sold out. Products in active sales may not be ready for occupancy.
7
(1) (1)
(1)
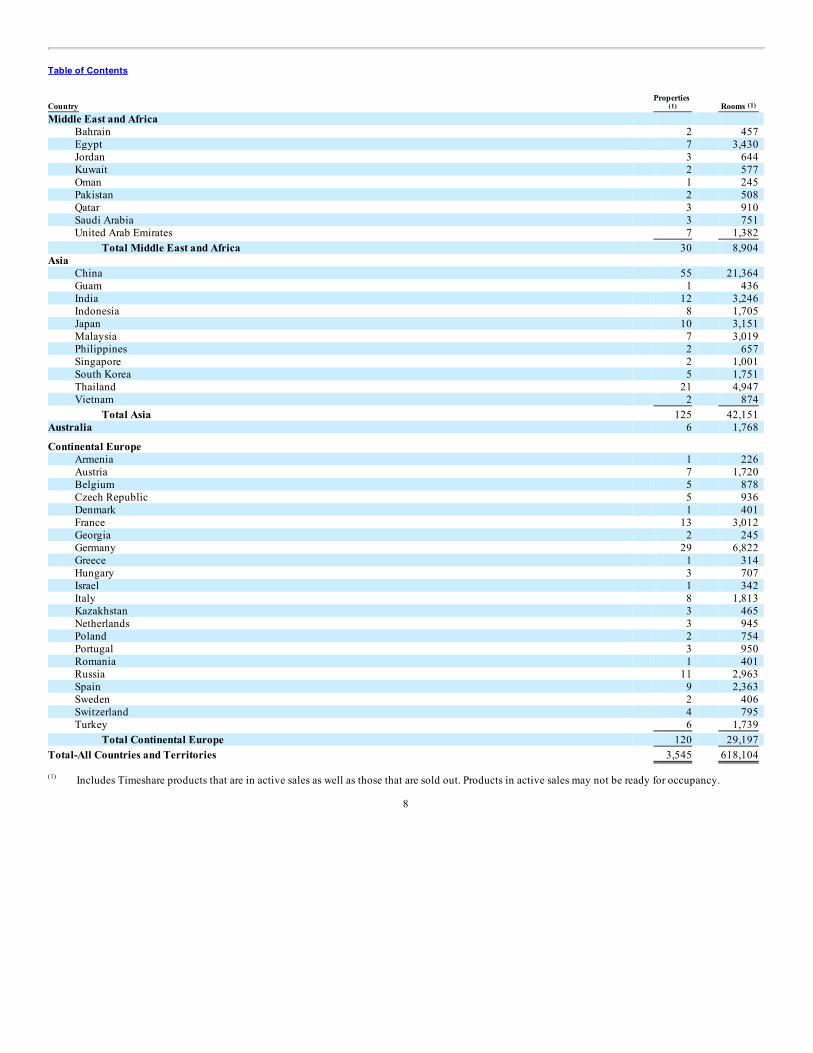
Table of Contents
Country Properties
Rooms Middle East and Africa
Bahrain 2 457 Egypt 7 3,430 Jordan 3 644 Kuwait 2 577 Oman 1 245 Pakistan 2 508 Qatar 3 910 Saudi Arabia 3 751 United Arab Emirates 7 1,382
Total Middle East and Africa 30 8,904 Asia
China 55 21,364 Guam 1 436 India 12 3,246 Indonesia 8 1,705 Japan 10 3,151 Malaysia 7 3,019 Philippines 2 657 Singapore 2 1,001 South Korea 5 1,751 Thailand 21 4,947 Vietnam 2 874
Total Asia 125 42,151 Australia 6 1,768
Continental Europe Armenia 1 226 Austria 7 1,720 Belgium 5 878 Czech Republic 5 936 Denmark 1 401 France 13 3,012 Georgia 2 245 Germany 29 6,822 Greece 1 314 Hungary 3 707 Israel 1 342 Italy 8 1,813 Kazakhstan 3 465 Netherlands 3 945 Poland 2 754 Portugal 3 950 Romania 1 401 Russia 11 2,963 Spain 9 2,363 Sweden 2 406 Switzerland 4 795 Turkey 6 1,739
Total Continental Europe 120 29,197 Total-All Countries and Territories 3,545 618,104
Includes Timeshare products that are in active sales as well as those that are sold out. Products in active sales may not be ready for occupancy.
8
(1) (1)
(1)
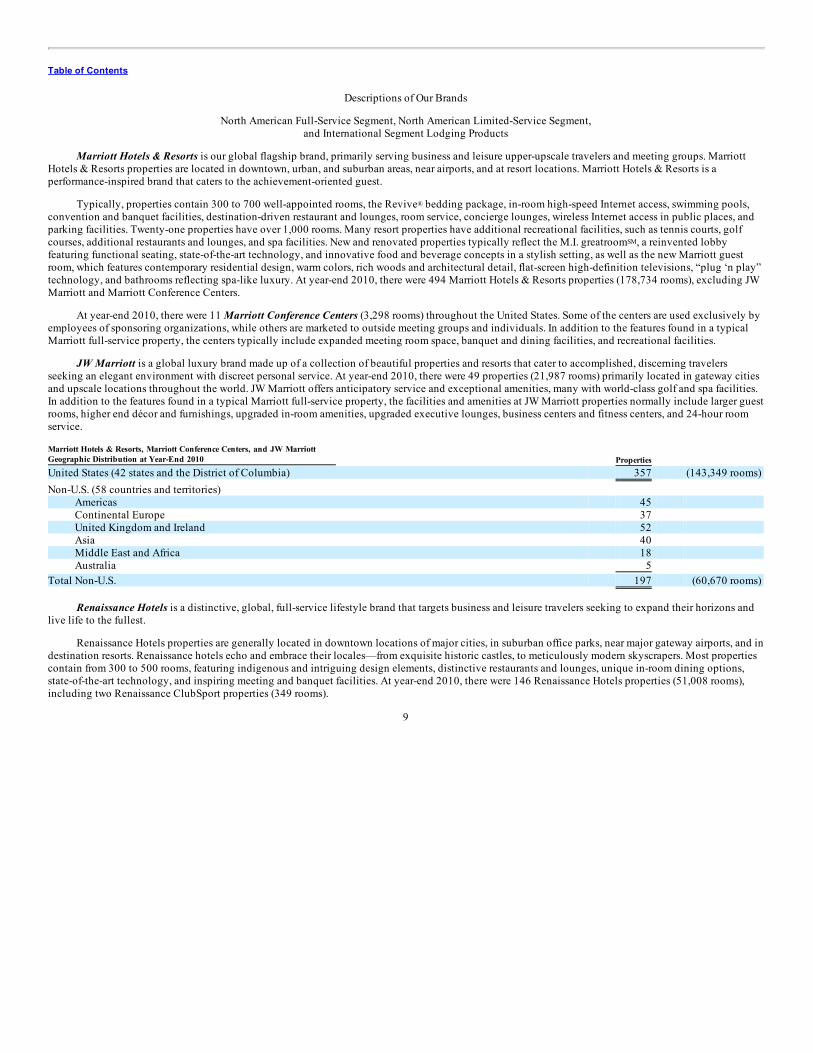
Table of Contents
Descriptions of Our Brands
North American Full-Service Segment, North American Limited-Service Segment,and International Segment Lodging Products
Marriott Hotels & Resorts is our global flagship brand, primarily serving business and leisure upper-upscale travelers and meeting groups. MarriottHotels & Resorts properties are located in downtown, urban, and suburban areas, near airports, and at resort locations. Marriott Hotels & Resorts is aperformance-inspired brand that caters to the achievement-oriented guest.
Typically, properties contain 300 to 700 well-appointed rooms, the Revive bedding package, in-room high-speed Internet access, swimming pools,convention and banquet facilities, destination-driven restaurant and lounges, room service, concierge lounges, wireless Internet access in public places, andparking facilities. Twenty-one properties have over 1,000 rooms. Many resort properties have additional recreational facilities, such as tennis courts, golfcourses, additional restaurants and lounges, and spa facilities. New and renovated properties typically reflect the M.I. greatroom , a reinvented lobbyfeaturing functional seating, state-of-the-art technology, and innovative food and beverage concepts in a stylish setting, as well as the new Marriott guestroom, which features contemporary residential design, warm colors, rich woods and architectural detail, flat-screen high-definition televisions, “plug ‘n play”technology, and bathrooms reflecting spa-like luxury. At year-end 2010, there were 494 Marriott Hotels & Resorts properties (178,734 rooms), excluding JWMarriott and Marriott Conference Centers.
At year-end 2010, there were 11 Marriott Conference Centers (3,298 rooms) throughout the United States. Some of the centers are used exclusively byemployees of sponsoring organizations, while others are marketed to outside meeting groups and individuals. In addition to the features found in a typicalMarriott full-service property, the centers typically include expanded meeting room space, banquet and dining facilities, and recreational facilities.
JW Marriott is a global luxury brand made up of a collection of beautiful properties and resorts that cater to accomplished, discerning travelersseeking an elegant environment with discreet personal service. At year-end 2010, there were 49 properties (21,987 rooms) primarily located in gateway citiesand upscale locations throughout the world. JW Marriott offers anticipatory service and exceptional amenities, many with world-class golf and spa facilities.In addition to the features found in a typical Marriott full-service property, the facilities and amenities at JW Marriott properties normally include larger guestrooms, higher end décor and furnishings, upgraded in-room amenities, upgraded executive lounges, business centers and fitness centers, and 24-hour roomservice. Marriott Hotels & Resorts, Marriott Conference Centers, and JW MarriottGeographic Distribution at Year-End 2010 Properties United States (42 states and the District of Columbia) 357 (143,349 rooms) Non-U.S. (58 countries and territories)
Americas 45 Continental Europe 37 United Kingdom and Ireland 52 Asia 40 Middle East and Africa 18 Australia 5
Total Non-U.S. 197 (60,670 rooms)
Renaissance Hotels is a distinctive, global, full-service lifestyle brand that targets business and leisure travelers seeking to expand their horizons andlive life to the fullest.
Renaissance Hotels properties are generally located in downtown locations of major cities, in suburban office parks, near major gateway airports, and indestination resorts. Renaissance hotels echo and embrace their locales—from exquisite historic castles, to meticulously modern skyscrapers. Most propertiescontain from 300 to 500 rooms, featuring indigenous and intriguing design elements, distinctive restaurants and lounges, unique in-room dining options,state-of-the-art technology, and inspiring meeting and banquet facilities. At year-end 2010, there were 146 Renaissance Hotels properties (51,008 rooms),including two Renaissance ClubSport properties (349 rooms).
9
®
SM
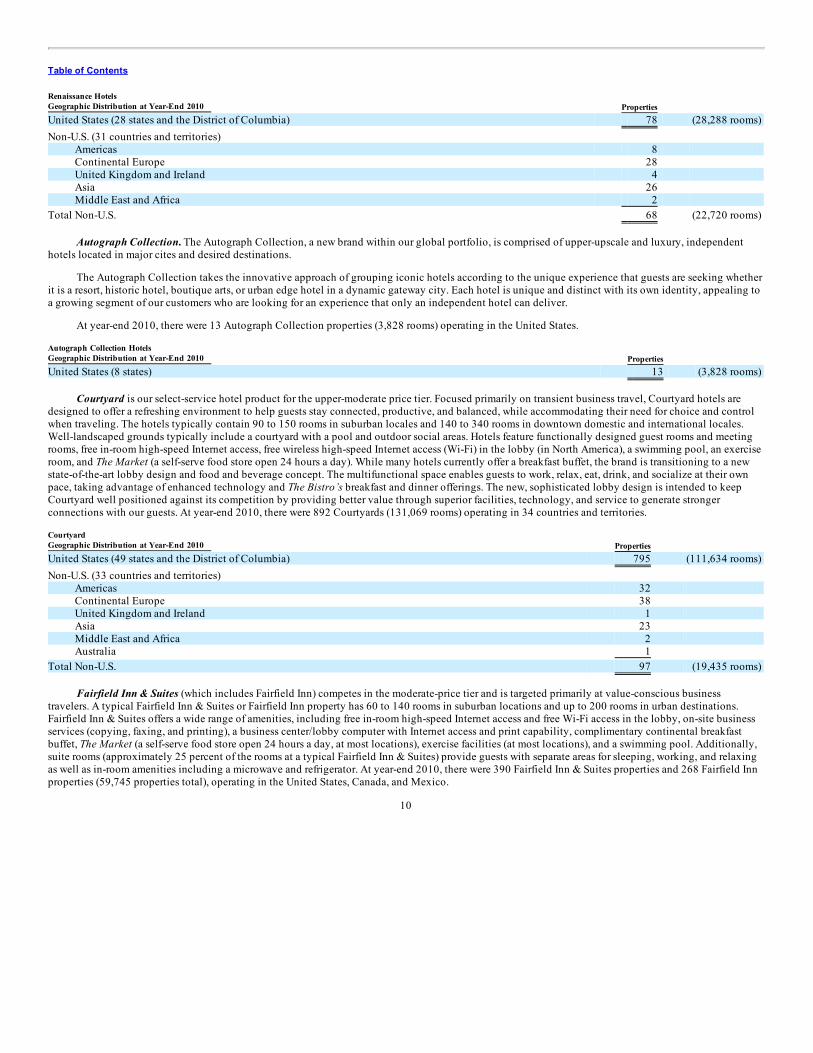
Table of Contents
Renaissance HotelsGeographic Distribution at Year-End 2010 Properties United States (28 states and the District of Columbia) 78 (28,288 rooms) Non-U.S. (31 countries and territories)
Americas 8 Continental Europe 28 United Kingdom and Ireland 4 Asia 26 Middle East and Africa 2
Total Non-U.S. 68 (22,720 rooms)
Autograph Collection. The Autograph Collection, a new brand within our global portfolio, is comprised of upper-upscale and luxury, independenthotels located in major cites and desired destinations.
The Autograph Collection takes the innovative approach of grouping iconic hotels according to the unique experience that guests are seeking whetherit is a resort, historic hotel, boutique arts, or urban edge hotel in a dynamic gateway city. Each hotel is unique and distinct with its own identity, appealing toa growing segment of our customers who are looking for an experience that only an independent hotel can deliver.
At year-end 2010, there were 13 Autograph Collection properties (3,828 rooms) operating in the United States. Autograph Collection HotelsGeographic Distribution at Year-End 2010 Properties United States (8 states) 13 (3,828 rooms)
Courtyard is our select-service hotel product for the upper-moderate price tier. Focused primarily on transient business travel, Courtyard hotels aredesigned to offer a refreshing environment to help guests stay connected, productive, and balanced, while accommodating their need for choice and controlwhen traveling. The hotels typically contain 90 to 150 rooms in suburban locales and 140 to 340 rooms in downtown domestic and international locales.Well-landscaped grounds typically include a courtyard with a pool and outdoor social areas. Hotels feature functionally designed guest rooms and meetingrooms, free in-room high-speed Internet access, free wireless high-speed Internet access (Wi-Fi) in the lobby (in North America), a swimming pool, an exerciseroom, and The Market (a self-serve food store open 24 hours a day). While many hotels currently offer a breakfast buffet, the brand is transitioning to a newstate-of-the-art lobby design and food and beverage concept. The multifunctional space enables guests to work, relax, eat, drink, and socialize at their ownpace, taking advantage of enhanced technology and The Bistro’s breakfast and dinner offerings. The new, sophisticated lobby design is intended to keepCourtyard well positioned against its competition by providing better value through superior facilities, technology, and service to generate strongerconnections with our guests. At year-end 2010, there were 892 Courtyards (131,069 rooms) operating in 34 countries and territories. CourtyardGeographic Distribution at Year-End 2010 Properties United States (49 states and the District of Columbia) 795 (111,634 rooms) Non-U.S. (33 countries and territories)
Americas 32 Continental Europe 38 United Kingdom and Ireland 1 Asia 23 Middle East and Africa 2 Australia 1
Total Non-U.S. 97 (19,435 rooms)
Fairfield Inn & Suites (which includes Fairfield Inn) competes in the moderate-price tier and is targeted primarily at value-conscious businesstravelers. A typical Fairfield Inn & Suites or Fairfield Inn property has 60 to 140 rooms in suburban locations and up to 200 rooms in urban destinations.Fairfield Inn & Suites offers a wide range of amenities, including free in-room high-speed Internet access and free Wi-Fi access in the lobby, on-site businessservices (copying, faxing, and printing), a business center/lobby computer with Internet access and print capability, complimentary continental breakfastbuffet, The Market (a self-serve food store open 24 hours a day, at most locations), exercise facilities (at most locations), and a swimming pool. Additionally,suite rooms (approximately 25 percent of the rooms at a typical Fairfield Inn & Suites) provide guests with separate areas for sleeping, working, and relaxingas well as in-room amenities including a microwave and refrigerator. At year-end 2010, there were 390 Fairfield Inn & Suites properties and 268 Fairfield Innproperties (59,745 properties total), operating in the United States, Canada, and Mexico.
10
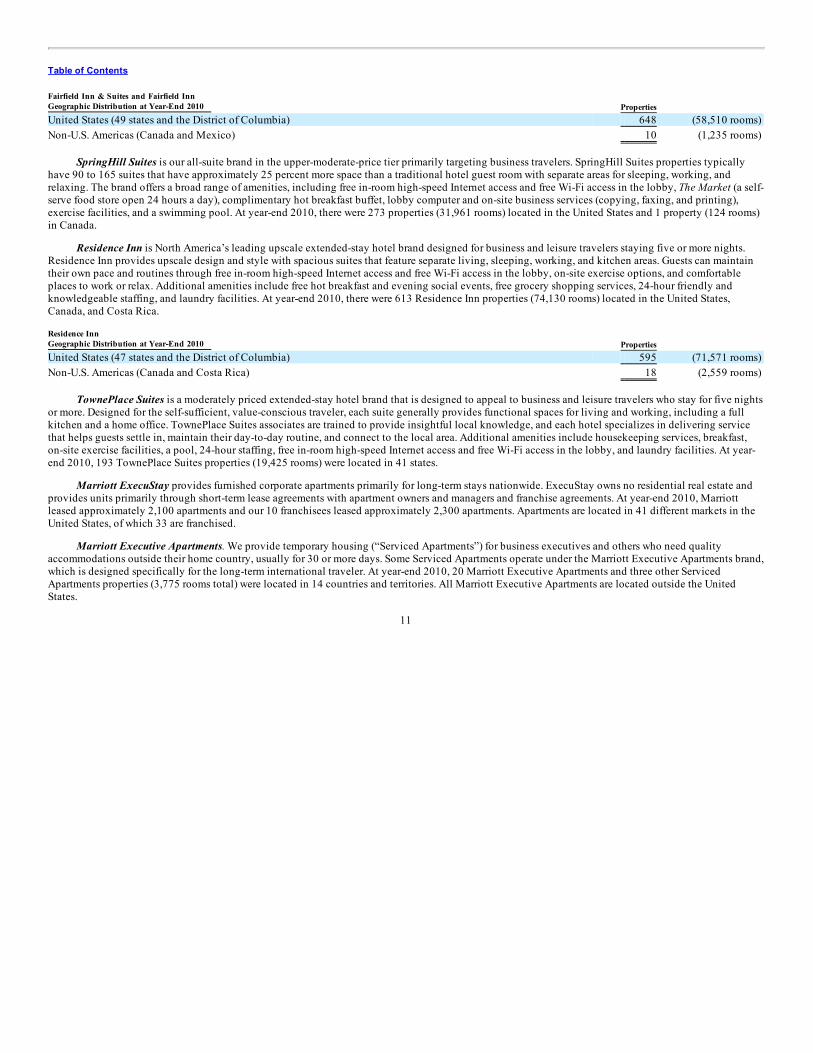
Table of Contents
Fairfield Inn & Suites and Fairfield InnGeographic Distribution at Year-End 2010 Properties United States (49 states and the District of Columbia) 648 (58,510 rooms) Non-U.S. Americas (Canada and Mexico) 10 (1,235 rooms)
SpringHill Suites is our all-suite brand in the upper-moderate-price tier primarily targeting business travelers. SpringHill Suites properties typicallyhave 90 to 165 suites that have approximately 25 percent more space than a traditional hotel guest room with separate areas for sleeping, working, andrelaxing. The brand offers a broad range of amenities, including free in-room high-speed Internet access and free Wi-Fi access in the lobby, The Market (a self-serve food store open 24 hours a day), complimentary hot breakfast buffet, lobby computer and on-site business services (copying, faxing, and printing),exercise facilities, and a swimming pool. At year-end 2010, there were 273 properties (31,961 rooms) located in the United States and 1 property (124 rooms)in Canada.
Residence Inn is North America’s leading upscale extended-stay hotel brand designed for business and leisure travelers staying five or more nights.Residence Inn provides upscale design and style with spacious suites that feature separate living, sleeping, working, and kitchen areas. Guests can maintaintheir own pace and routines through free in-room high-speed Internet access and free Wi-Fi access in the lobby, on-site exercise options, and comfortableplaces to work or relax. Additional amenities include free hot breakfast and evening social events, free grocery shopping services, 24-hour friendly andknowledgeable staffing, and laundry facilities. At year-end 2010, there were 613 Residence Inn properties (74,130 rooms) located in the United States,Canada, and Costa Rica. Residence InnGeographic Distribution at Year-End 2010 Properties United States (47 states and the District of Columbia) 595 (71,571 rooms) Non-U.S. Americas (Canada and Costa Rica) 18 (2,559 rooms)
TownePlace Suites is a moderately priced extended-stay hotel brand that is designed to appeal to business and leisure travelers who stay for five nightsor more. Designed for the self-sufficient, value-conscious traveler, each suite generally provides functional spaces for living and working, including a fullkitchen and a home office. TownePlace Suites associates are trained to provide insightful local knowledge, and each hotel specializes in delivering servicethat helps guests settle in, maintain their day-to-day routine, and connect to the local area. Additional amenities include housekeeping services, breakfast,on-site exercise facilities, a pool, 24-hour staffing, free in-room high-speed Internet access and free Wi-Fi access in the lobby, and laundry facilities. At year-end 2010, 193 TownePlace Suites properties (19,425 rooms) were located in 41 states.
Marriott ExecuStay provides furnished corporate apartments primarily for long-term stays nationwide. ExecuStay owns no residential real estate andprovides units primarily through short-term lease agreements with apartment owners and managers and franchise agreements. At year-end 2010, Marriottleased approximately 2,100 apartments and our 10 franchisees leased approximately 2,300 apartments. Apartments are located in 41 different markets in theUnited States, of which 33 are franchised.
Marriott Executive Apartments. We provide temporary housing (“Serviced Apartments”) for business executives and others who need qualityaccommodations outside their home country, usually for 30 or more days. Some Serviced Apartments operate under the Marriott Executive Apartments brand,which is designed specifically for the long-term international traveler. At year-end 2010, 20 Marriott Executive Apartments and three other ServicedApartments properties (3,775 rooms total) were located in 14 countries and territories. All Marriott Executive Apartments are located outside the UnitedStates.
11
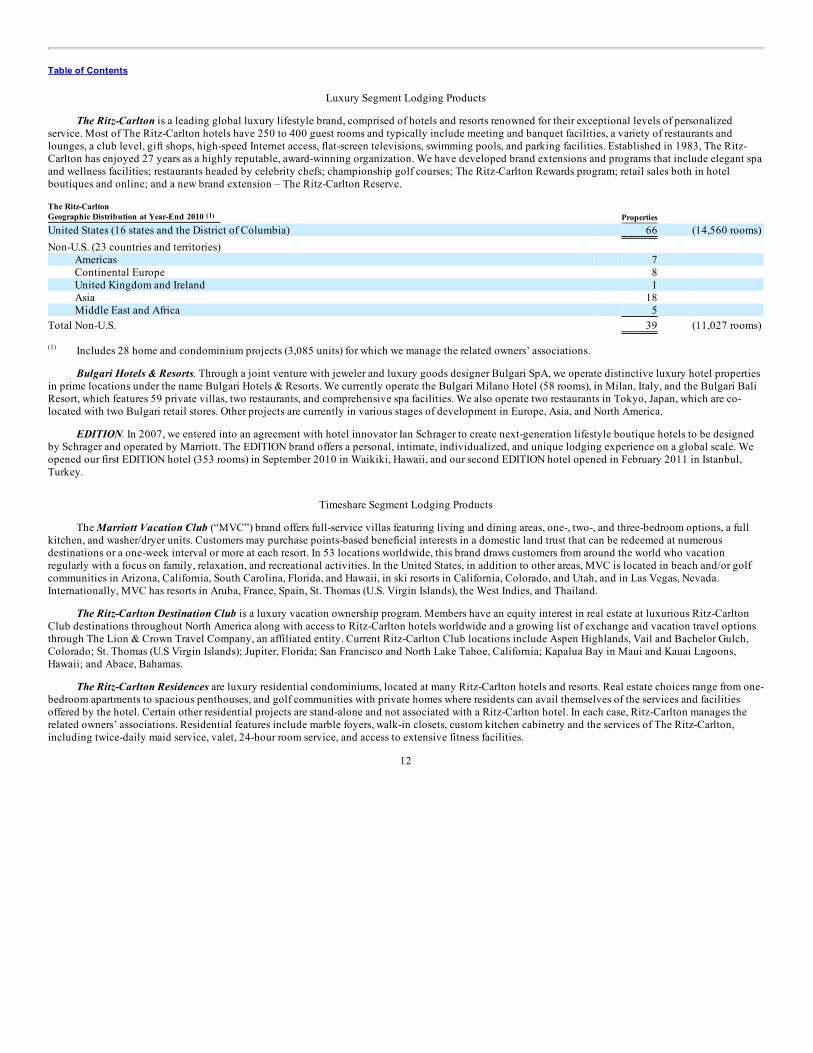
Table of Contents
Luxury Segment Lodging Products
The Ritz-Carlton is a leading global luxury lifestyle brand, comprised of hotels and resorts renowned for their exceptional levels of personalizedservice. Most of The Ritz-Carlton hotels have 250 to 400 guest rooms and typically include meeting and banquet facilities, a variety of restaurants andlounges, a club level, gift shops, high-speed Internet access, flat-screen televisions, swimming pools, and parking facilities. Established in 1983, The Ritz-Carlton has enjoyed 27 years as a highly reputable, award-winning organization. We have developed brand extensions and programs that include elegant spaand wellness facilities; restaurants headed by celebrity chefs; championship golf courses; The Ritz-Carlton Rewards program; retail sales both in hotelboutiques and online; and a new brand extension – The Ritz-Carlton Reserve. The Ritz-CarltonGeographic Distribution at Year-End 2010 Properties United States (16 states and the District of Columbia) 66 (14,560 rooms) Non-U.S. (23 countries and territories)
Americas 7 Continental Europe 8 United Kingdom and Ireland 1 Asia 18 Middle East and Africa 5
Total Non-U.S. 39 (11,027 rooms)
Includes 28 home and condominium projects (3,085 units) for which we manage the related owners’ associations.
Bulgari Hotels & Resorts. Through a joint venture with jeweler and luxury goods designer Bulgari SpA, we operate distinctive luxury hotel propertiesin prime locations under the name Bulgari Hotels & Resorts. We currently operate the Bulgari Milano Hotel (58 rooms), in Milan, Italy, and the Bulgari BaliResort, which features 59 private villas, two restaurants, and comprehensive spa facilities. We also operate two restaurants in Tokyo, Japan, which are co-located with two Bulgari retail stores. Other projects are currently in various stages of development in Europe, Asia, and North America.
EDITION. In 2007, we entered into an agreement with hotel innovator Ian Schrager to create next-generation lifestyle boutique hotels to be designedby Schrager and operated by Marriott. The EDITION brand offers a personal, intimate, individualized, and unique lodging experience on a global scale. Weopened our first EDITION hotel (353 rooms) in September 2010 in Waikiki, Hawaii, and our second EDITION hotel opened in February 2011 in Istanbul,Turkey.
Timeshare Segment Lodging Products
The Marriott Vacation Club (“MVC”) brand offers full-service villas featuring living and dining areas, one-, two-, and three-bedroom options, a fullkitchen, and washer/dryer units. Customers may purchase points-based beneficial interests in a domestic land trust that can be redeemed at numerousdestinations or a one-week interval or more at each resort. In 53 locations worldwide, this brand draws customers from around the world who vacationregularly with a focus on family, relaxation, and recreational activities. In the United States, in addition to other areas, MVC is located in beach and/or golfcommunities in Arizona, California, South Carolina, Florida, and Hawaii, in ski resorts in California, Colorado, and Utah, and in Las Vegas, Nevada.Internationally, MVC has resorts in Aruba, France, Spain, St. Thomas (U.S. Virgin Islands), the West Indies, and Thailand.
The Ritz-Carlton Destination Club is a luxury vacation ownership program. Members have an equity interest in real estate at luxurious Ritz-CarltonClub destinations throughout North America along with access to Ritz-Carlton hotels worldwide and a growing list of exchange and vacation travel optionsthrough The Lion & Crown Travel Company, an affiliated entity. Current Ritz-Carlton Club locations include Aspen Highlands, Vail and Bachelor Gulch,Colorado; St. Thomas (U.S Virgin Islands); Jupiter, Florida; San Francisco and North Lake Tahoe, California; Kapalua Bay in Maui and Kauai Lagoons,Hawaii; and Abace, Bahamas.
The Ritz-Carlton Residences are luxury residential condominiums, located at many Ritz-Carlton hotels and resorts. Real estate choices range from one-bedroom apartments to spacious penthouses, and golf communities with private homes where residents can avail themselves of the services and facilitiesoffered by the hotel. Certain other residential projects are stand-alone and not associated with a Ritz-Carlton hotel. In each case, Ritz-Carlton manages therelated owners’ associations. Residential features include marble foyers, walk-in closets, custom kitchen cabinetry and the services of The Ritz-Carlton,including twice-daily maid service, valet, 24-hour room service, and access to extensive fitness facilities.
12
(1)
(1)
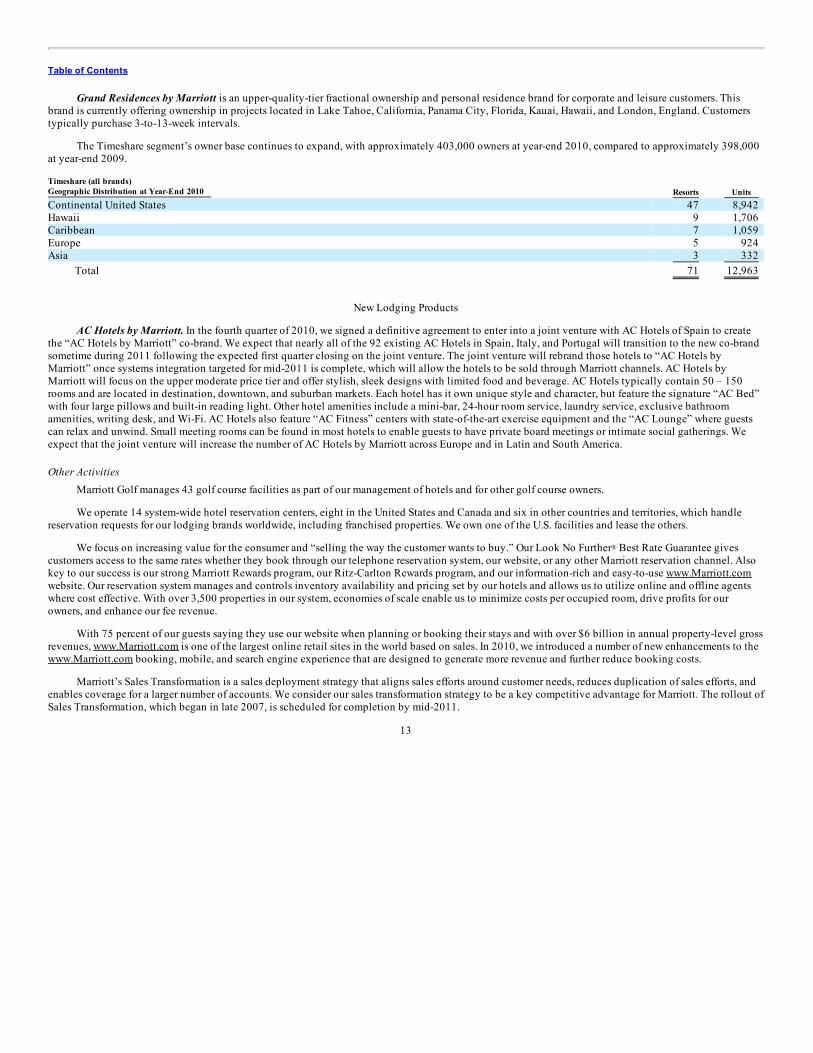
Table of Contents
Grand Residences by Marriott is an upper-quality-tier fractional ownership and personal residence brand for corporate and leisure customers. Thisbrand is currently offering ownership in projects located in Lake Tahoe, California, Panama City, Florida, Kauai, Hawaii, and London, England. Customerstypically purchase 3-to-13-week intervals.
The Timeshare segment’s owner base continues to expand, with approximately 403,000 owners at year-end 2010, compared to approximately 398,000at year-end 2009. Timeshare (all brands)Geographic Distribution at Year-End 2010 Resorts Units Continental United States 47 8,942 Hawaii 9 1,706 Caribbean 7 1,059 Europe 5 924 Asia 3 332
Total 71 12,963
New Lodging Products
AC Hotels by Marriott. In the fourth quarter of 2010, we signed a definitive agreement to enter into a joint venture with AC Hotels of Spain to createthe “AC Hotels by Marriott” co-brand. We expect that nearly all of the 92 existing AC Hotels in Spain, Italy, and Portugal will transition to the new co-brandsometime during 2011 following the expected first quarter closing on the joint venture. The joint venture will rebrand those hotels to “AC Hotels byMarriott” once systems integration targeted for mid-2011 is complete, which will allow the hotels to be sold through Marriott channels. AC Hotels byMarriott will focus on the upper moderate price tier and offer stylish, sleek designs with limited food and beverage. AC Hotels typically contain 50 – 150rooms and are located in destination, downtown, and suburban markets. Each hotel has it own unique style and character, but feature the signature “AC Bed”with four large pillows and built-in reading light. Other hotel amenities include a mini-bar, 24-hour room service, laundry service, exclusive bathroomamenities, writing desk, and Wi-Fi. AC Hotels also feature “AC Fitness” centers with state-of-the-art exercise equipment and the “AC Lounge” where guestscan relax and unwind. Small meeting rooms can be found in most hotels to enable guests to have private board meetings or intimate social gatherings. Weexpect that the joint venture will increase the number of AC Hotels by Marriott across Europe and in Latin and South America.
Other ActivitiesMarriott Golf manages 43 golf course facilities as part of our management of hotels and for other golf course owners.
We operate 14 system-wide hotel reservation centers, eight in the United States and Canada and six in other countries and territories, which handlereservation requests for our lodging brands worldwide, including franchised properties. We own one of the U.S. facilities and lease the others.
We focus on increasing value for the consumer and “selling the way the customer wants to buy.” Our Look No Further Best Rate Guarantee givescustomers access to the same rates whether they book through our telephone reservation system, our website, or any other Marriott reservation channel. Alsokey to our success is our strong Marriott Rewards program, our Ritz-Carlton Rewards program, and our information-rich and easy-to-use www.Marriott.comwebsite. Our reservation system manages and controls inventory availability and pricing set by our hotels and allows us to utilize online and offline agentswhere cost effective. With over 3,500 properties in our system, economies of scale enable us to minimize costs per occupied room, drive profits for ourowners, and enhance our fee revenue.
With 75 percent of our guests saying they use our website when planning or booking their stays and with over $6 billion in annual property-level grossrevenues, www.Marriott.com is one of the largest online retail sites in the world based on sales. In 2010, we introduced a number of new enhancements to thewww.Marriott.com booking, mobile, and search engine experience that are designed to generate more revenue and further reduce booking costs.
Marriott’s Sales Transformation is a sales deployment strategy that aligns sales efforts around customer needs, reduces duplication of sales efforts, andenables coverage for a larger number of accounts. We consider our sales transformation strategy to be a key competitive advantage for Marriott. The rollout ofSales Transformation, which began in late 2007, is scheduled for completion by mid-2011.
13
®
Table of Contents
Building on more than 20 years of energy conservation experience, we are committed to protecting the environment. Our “Spirit to Preserve ”environmental strategy calls for: greening our $10 billion supply chain; further reducing fuel and water consumption; expanding our portfolio of greenhotels and buildings; educating and inspiring employees and guests to support the environment; and investing in innovative, large-scale conservationprojects worldwide.
We are the first in the hospitality industry to launch a green hotel prototype that has been pre-approved by U.S. Green Building Council (“USGBC”) aspart of its Leadership in Energy and Environment Design (“LEED”) Volume program, meaning that any hotel that follows these plans will earn basic LEEDcertification, or possibly higher, upon final USGBC approval. The U.S. Travel Association confirms that travelers place the importance of supportingenvironmentally responsible travel service suppliers as a necessity, even in an economic downturn.
Our Architecture and Construction (“A&C”) division provides design, development, construction, refurbishment, and procurement services to ownersand franchisees of lodging properties on a voluntary basis outside the scope of and separate from our management or franchise contracts. Similar to third-party contractors, A&C provides these services for owners and franchisees of Marriott-branded properties on a fee basis.
CompetitionWe encounter strong competition both as a lodging operator and as a franchisor. We believe that by operating a number of hotels among our brands, we
stay in direct touch with customers and react to changes in the marketplace more quickly than chains that rely exclusively on franchising. There areapproximately 870 lodging management companies in the United States, including several that operate more than 100 properties. These operators areprimarily private management firms, but also include several large national chains that own and operate their own hotels and also franchise their brands. Ourmanagement contracts are typically long-term in nature, but most allow the hotel owner to replace the management firm if certain financial or performancecriteria are not met.
During the recent recession we experienced significant reductions in demand for hotel rooms and timeshare products, particularly in 2009, and we tooksteps to reduce operating costs and improve efficiency. Due to the competitive nature of our industry, we focused these efforts on areas that had limited or noimpact on the guest experience. While demand trends globally improved in 2010, additional cost reductions could become necessary to preserve operatingmargins if demand trends reverse, but we would expect to implement any such efforts in a manner designed to maintain customer loyalty, owner preference,and associate satisfaction, to help maintain or increase our market share.
Affiliation with a national or regional brand is prevalent in the U.S. lodging industry. In 2010, approximately 69 percent of U.S. hotel rooms werebrand-affiliated. Most of the branded properties are franchises, under which the operator pays the franchisor a fee for use of its hotel name and reservationsystem. The franchising business is concentrated, with the six largest franchisors operating multiple brands accounting for a significant proportion of all U.S.rooms.
Outside the United States, branding is much less prevalent and most markets are served primarily by independent operators, although branding is morecommon for new hotel development. We believe that chain affiliation will increase in overseas markets as local economies grow, trade barriers are reduced,international travel accelerates and hotel owners seek the economies of centralized reservation systems and marketing programs.
Based on lodging industry data, we have approximately a ten percent share of the U.S. hotel market (based on number of rooms) and we estimate lessthan a one percent share of the lodging market outside the United States. We believe that our hotel brands are attractive to hotel owners seeking amanagement company or franchise affiliation because our hotels typically generate higher occupancies and Revenue per Available Room (“RevPAR”) thanour direct competitors in most market areas. We attribute this performance premium to our success in achieving and maintaining strong customer preference.We believe that the location and quality of our lodging facilities, our marketing programs, our reservation systems and our emphasis on guest service andguest and associate satisfaction are contributing factors across all of our brands.
Properties that we operate or franchise are regularly upgraded to maintain their competitiveness. Most of our management agreements provide for theallocation of funds, generally a fixed percentage of revenue, for periodic renovation of buildings and replacement of furnishings. These ongoingrefurbishment programs, along with periodic brand initiatives, are generally adequate to preserve or enhance the competitive position and earning power ofthe hotels and timeshare properties. Competitor hotels converting to one of Marriott’s brands typically complete renovations as needed in conjunction withthe conversion.
14
®
Table of Contents
The vacation ownership industry is comprised of a number of highly competitive companies including several branded hotel companies. Sinceentering the timeshare industry in 1984, we have become a recognized leader in vacation ownership worldwide. Competition in the timeshare interval,fractional, and residential business is based primarily on the quality and location of timeshare resorts, trust in the brand, the pricing of product offerings, andthe availability of program benefits, such as exchange programs. We believe that our focus on offering distinct vacation experiences, combined with ourfinancial strength, diverse market presence, strong brands, and well-maintained properties, will enable us to remain competitive. Approximately 74 percent ofour timeshare ownership resort sales came from additional purchases by or referrals from existing owners in 2010, as compared to 65 percent in 2009. Theincrease in 2010 reflected our customer service, marketing, and sales efforts which initially focused on the existing owner base after the launch of MarriottVacation Club Destinations timeshare program in June.
Marriott Rewards and The Ritz-Carlton Rewards are our frequent guest programs with over 34 million members and 12 participating brands. Therewards programs yield repeat guest business by rewarding frequent stays with points toward free hotel stays and other rewards, or airline miles with any of 30participating airline programs. We believe that our rewards programs generate substantial repeat business that might otherwise go to competing hotels. In2010, approximately 50 percent of our room nights were purchased by rewards program members. In addition, the ability of timeshare owners to convertunused intervals into rewards points enhances the competitive position of our timeshare brands. We continue to enhance our rewards program offerings andspecifically and strategically market to this large and growing customer base. Our loyal rewards member base provides a low cost and high impact vehicle forour revenue generation efforts.
Discontinued OperationsSynthetic Fuel
Prior to 2008, we operated four coal-based synthetic fuel production facilities (the “Facilities”). Because tax credits under Section 45K of the U.S.Internal Revenue Code (“IRC”) were not available for coal-based synthetic fuel produced or sold after calendar year-end 2007, we shut down the Facilitiesand permanently ceased production of synthetic fuel in late 2007. Accordingly, we now report this business segment as a discontinued operation. SeeFootnote No. 3, “Discontinued Operations – Synthetic Fuel,” of the Notes to our Financial Statements for additional information.
Employee RelationsAt year-end 2010, we had approximately 129,000 employees, approximately 7,700 of whom were represented by labor unions. We believe relations
with our employees are positive.
Environmental ComplianceThe properties we operate or develop are subject to national, state and local laws and regulations that govern the discharge of materials into the
environment or otherwise relate to protecting the environment. Those environmental provisions include requirements that address health and safety; the use,management and disposal of hazardous substances and wastes; and emission or discharge of wastes or other materials. We believe that our operation ofproperties and our development of properties comply, in all material respects, with environmental laws and regulations. Our compliance with such provisionsalso has not had a material impact on our capital expenditures, earnings or competitive position, nor do we anticipate that such compliance will have amaterial impact in the future.
Internet Address and Company SEC FilingsOur Internet address is www.Marriott.com. On the investor relations portion of our website, www.Marriott.com/investor, we provide a link to our
electronic SEC filings, including our annual report on Form 10-K, our quarterly reports on Form 10-Q, our current reports on Form 8-K and any amendmentsto these reports. All such filings are available free of charge and are available as soon as reasonably practicable after filing. The information found on ourwebsite is not part of this or any other report we file with or furnish to the U.S. Securities and Exchange Commission (the “SEC”).
15
Table of Contents
Item 1A. Risk Factors.Forward-Looking Statements
We make forward-looking statements in Management’s Discussion and Analysis of Financial Condition and Results of Operations and elsewhere inthis report based on the beliefs and assumptions of our management and on information currently available to us. Forward-looking statements includeinformation about our possible or assumed future results of operations, which follow under the headings “Business and Overview,” “Liquidity and CapitalResources,” and other statements throughout this report preceded by, followed by or that include the words “believes,” “expects,” “anticipates,” “intends,”“plans,” “estimates” or similar expressions.
Forward-looking statements are subject to a number of risks and uncertainties that could cause actual results to differ materially from those expressed inthese forward-looking statements, including the risks and uncertainties described below and other factors we describe from time to time in our periodic filingswith the SEC. We therefore caution you not to rely unduly on any forward-looking statements. The forward-looking statements in this report speak only as ofthe date of this report, and we undertake no obligation to update or revise any forward-looking statement, whether as a result of new information, futuredevelopments or otherwise.
Risks and UncertaintiesWe are subject to various risks that could have a negative effect on the Company and its financial condition. You should understand that these risks
could cause results to differ materially from those expressed in forward-looking statements contained in this report and in other Company communications.Because there is no way to determine in advance whether, or to what extent, any present uncertainty will ultimately impact our business, you should giveequal weight to each of the following:
Lodging and Timeshare Industry RisksOur industries are highly competitive, which may impact our ability to compete successfully with other hotel and timeshare properties for customers.
We generally operate in markets that contain numerous competitors. Each of our hotel and timeshare brands competes with major hotel chains in national andinternational venues and with independent companies in regional markets. Our ability to remain competitive and to attract and retain business and leisuretravelers depends on our success in distinguishing the quality, value, and efficiency of our lodging products and services from those offered by others. If weare unable to compete successfully in these areas, this could limit our operating margins, diminish our market share, and reduce our earnings.
We are subject to the range of operating risks common to the hotel, timeshare, and corporate apartment industries. The profitability of the hotels,vacation timeshare resorts, and corporate apartments that we operate or franchise may be adversely affected by a number of factors, including:
(1) the availability of and demand for hotel rooms, timeshare interval, fractional ownership, and residential products, and apartments;
(2) pricing strategies of our competitors;
(3) international, national, and regional economic and geopolitical conditions;
(4) the impact of war, actual or threatened terrorist activity and heightened travel security measures instituted in response to war, terrorist activity orthreats, and civil unrest;
(5) the desirability of particular locations and changes in travel patterns;
(6) travelers’ fears of exposure to contagious diseases, such as H1N1 Flu, Avian Flu and Severe Acute Respiratory Syndrome (“SARS”);
(7) the occurrence of natural or man-made disasters, such as earthquakes, tsunamis, hurricanes, and oil spills;
(8) events that may be beyond our control that could affect the reputation of one or more of our properties or more generally impact the reputation ofour brands;
(9) taxes and government regulations that influence or determine wages, prices, interest rates, construction procedures, and costs;
(10) the costs and administrative burdens associated with compliance with applicable laws and regulations, including, among others, those associatedwith franchising, timeshare, lending, privacy, marketing and sales,
16
Table of Contents
licensing, labor, employment, immigration, the environment, and the U.S. Department of the Treasury’s Office of Foreign Asset Control and theForeign Corrupt Practices Act;
(11) the availability and cost of capital to allow us and potential hotel owners and joint venture partners to fund investments;
(12) regional and national development of competing properties;
(13) increases in wages and other labor costs, energy, healthcare, insurance, transportation and fuel, and other expenses central to the conduct of our
business or the cost of travel for our customers, including recent increases in energy costs and any resulting increase in travel costs or decrease inairline capacity;
(14) organized labor activities, which could cause the diversion of business from hotels involved in labor negotiations, loss of group business, and/orincreased labor costs;
(15) currency exchange fluctuations; and
(16) trademark or intellectual property infringement.
Any one or more of these factors could limit or reduce the demand or the prices our hotels are able to obtain for hotel rooms, timeshare units, residentialunits, and corporate apartments or could increase our costs and therefore reduce the profit of our lodging businesses. Reduced demand for hotels could alsogive rise to losses under loans, guarantees, and noncontrolling equity investments that we have made in connection with hotels that we manage. Even wheresuch factors do not reduce demand, property-level profit margins may suffer if we are unable to fully recover increased operating costs from our guests.Similarly, our fee revenue could be impacted by weak property-level revenue or profitability.
Our hotel management and franchise agreements may also be subject to premature termination in certain circumstances, such as the bankruptcy of ahotel owner or franchisee, or a failure under some agreements to meet specified financial or performance criteria that are subject to the risks described in thissection, which the Company fails or elects not to cure. A significant loss of agreements due to premature terminations could hurt our financial performance orour ability to grow our business.
General economic uncertainty and weak demand in the lodging and timeshare industries could continue to impact our financial results and growth.Weak economic conditions in the United States, Europe and much of the rest of the world and the uncertainty over the duration of these conditions couldcontinue to have a negative impact on the lodging and timeshare industries. As a result of current economic conditions, we continue to experience weakeneddemand for our hotel rooms and timeshare products. Recent improvements in demand trends globally may not continue, and our future financial results andgrowth could be further harmed or constrained if the recovery was to stall or conditions were to worsen.
Proposed Spin-off RiskThe proposed spin-off of our Timeshare division may not occur as or when planned or at all, or could result in issues we do not yet anticipate.
Unanticipated developments could delay, prevent the completion of, or otherwise adversely affect the proposed spin-off of our Timeshare division, includingany problems or delays in obtaining financing for the new timeshare company, regulatory approvals, third-party consents, a favorable letter ruling from theInternal Revenue Service, or disruptions either in general market conditions or in the lodging or timeshare business. The transaction is also subject to finalapproval by our board of directors. Completion of the proposed spin-off may require significant time, effort, and expense, and may divert management’sattention from other aspects of our business operations, which could adversely affect those operations. Any delays in completion of the proposed spin-offmay increase the amount of time, effort, and expense that we devote to the transaction. Moreover, we may not be able to complete the spin-off on the termscurrently anticipated as a result of financing issues or accommodations we may have to make to obtain the consent of regulators or other third parties.
In addition, if we complete the proposed spin-off, the actual results may differ materially from the results we anticipate. Specifically, the proposedtransaction could adversely affect our relationships with our customers or employees (including those of the Timeshare division) or disrupt our operations.The separated businesses could also face unanticipated problems in operating independently, and thus may not achieve the anticipated benefits of theseparation.
Operational RisksOur lodging operations are subject to global, regional and national conditions. Because we conduct our business on a global platform, our activities
are susceptible to changes in the performance of both global and regional
17
Table of Contents
economies. In recent years, our business has been hurt by decreases in travel resulting from weak economic conditions and the heightened travel securitymeasures that have resulted from the threat of further terrorism. Our future economic performance could be similarly affected by the economic environment ineach of the regions in which we operate, the resulting unknown pace of business travel, and the occurrence of any future incidents in those regions.
The growing significance of our operations outside of the United States also makes us increasingly susceptible to the risks of doing businessinternationally, which could lower our revenues, increase our costs, reduce our profits or disrupt our business. We currently operate or franchise hotels andresorts in 70 countries, and our operations outside the United States represented approximately 16 percent of our revenues in 2010. We expect that theinternational share of our total revenues will increase in future years. As a result, we are increasingly exposed to a number of challenges and risks associatedwith doing business outside the United States, including the following, any of which could reduce our revenues or profits, increase our costs, or disrupt ourbusiness: (1) compliance with complex and changing laws, regulations and policies of governments that may impact our operations, including foreignownership restrictions, import and export controls, and trade restrictions; (2) compliance with U.S. laws that affect the activities of U.S. companies abroad;(3) limitations on our ability to repatriate non-U.S. earnings in a tax effective manner; (4) the difficulties involved in managing an organization doingbusiness in many different countries; (5) uncertainties as to the enforceability of contract and intellectual property rights under local laws; and (6) rapidchanges in government policy, political or civil unrest, acts of terrorism or the threat of international boycotts or U.S. anti-boycott legislation.
Our new programs and new branded products may not be successful. We cannot assure that our recently launched EDITION and Autograph Collectionbrands and Marriott Vacation Club Destination points-based timeshare program, the expected launch of AC Hotels by Marriott, or any new programs orproducts we may launch in the future will be accepted by hotel owners, potential franchisees, or the traveling public or other customers. We also cannot becertain that we will recover the costs we incurred in developing the brands or any new programs or products, or that the brands or any new programs orproducts will be successful. In addition, some of our new brands involve or may involve cooperation and/or consultation with one or more third parties,including some shared control over product design and development, sales and marketing, and brand standards. Disagreements with these third parties couldslow the development of these new brands and/or impair our ability to take actions we believe to be advisable for the success and profitability of such brands.
Risks relating to natural or man-made disasters, contagious disease, terrorist activity, and war could reduce the demand for lodging, which mayadversely affect our revenues. So called “Acts of God,” such as hurricanes, earthquakes, and other natural disasters, man-made disasters such as the recent oilspill in the Gulf of Mexico, and the spread of contagious diseases, such as H1N1 Flu, Avian Flu, and SARS, in locations where we own, manage or franchisesignificant properties, and areas of the world from which we draw a large number of customers could cause a decline in the level of business and leisure traveland reduce the demand for lodging. Actual or threatened war, terrorist activity, political unrest, civil strife, and other geopolitical uncertainty could have asimilar effect. Any one or more of these events may reduce the overall demand for hotel rooms, timeshare units, and corporate apartments or limit the pricesthat we are able to obtain for them, both of which could adversely affect our profits.
Disagreements with the owners of the hotels that we manage or franchise may result in litigation or may delay implementation of product or serviceinitiatives. Consistent with our focus on management and franchising, we own very few of our lodging properties. The nature of our responsibilities under ourmanagement agreements to manage each hotel and enforce the standards required for our brands under both management and franchise agreements may besubject to interpretation and will from time to time give rise to disagreements, which may include disagreements over the need for or payment for newproduct or service initiatives. Such disagreements may be more likely while hotel returns are weaker as a result of the 2008 – 2009 economic slow down. Weseek to resolve any disagreements in order to develop and maintain positive relations with current and potential hotel owners and joint venture partners butare not always able to do so. Failure to resolve such disagreements has resulted in litigation, and could do so in the future. If any such litigation results in asignificant adverse judgment, settlement or court order, we could suffer significant losses, our profits could be reduced, or our future ability to operate ourbusiness could be constrained.
Damage to, or other potential losses involving, properties that we own, manage or franchise may not be covered by insurance. We havecomprehensive property and liability insurance policies with coverage features and insured limits that we believe are customary. Market forces beyond ourcontrol may nonetheless limit the scope of the insurance coverage we can obtain or our ability to obtain coverage at reasonable rates. Certain types of losses,generally of a catastrophic nature, such as earthquakes, hurricanes and floods, or terrorist acts, may be uninsurable or too expensive to justify obtaininginsurance. As a result, we may not be successful in obtaining insurance without increases in cost or decreases in coverage levels. In addition, in the event of asubstantial loss, the insurance coverage we carry may not be sufficient to pay the full market value or replacement cost of our lost investment or
18
Table of Contents
that of hotel owners or in some cases could result in certain losses being totally uninsured. As a result, we could lose some or all of the capital we haveinvested in a property, as well as the anticipated future revenue from the property, and we could remain obligated for guarantees, debt, or other financialobligations related to the property.
Development and Financing RisksWhile we are predominantly a manager and franchisor of hotel properties, we depend on capital to buy, develop, and improve hotels and to develop
timeshare properties, and we or our hotel owners may be unable to access capital when necessary. In order to fund new hotel investments, as well asrefurbish and improve existing hotels, both the Company and current and potential hotel owners must periodically spend money. The availability of fundsfor new investments and improvement of existing hotels by our current and potential hotel owners depends in large measure on capital markets and liquidityfactors, over which we can exert little control. Instability in the financial markets following the 2008 worldwide financial crisis and the contraction ofavailable liquidity and leverage continue to constrain the capital markets for hotel and real estate investments. In addition, owners of existing hotels that wefranchise or manage may have difficulty meeting required debt service payments or refinancing loans at maturity. While lenders have shown a willingness towork with borrowers to extend relief in the short- to medium- term, some current and prospective hotel owners are still finding new hotel financing oncommercially viable terms to be challenging.
Our growth strategy depends upon third-party owners/operators, and future arrangements with these third parties may be less favorable. Our presentgrowth strategy for development of additional lodging facilities entails entering into and maintaining various arrangements with property owners. The termsof our management agreements, franchise agreements, and leases for each of our lodging facilities are influenced by contract terms offered by our competitors,among other things. We cannot assure you that any of our current arrangements will continue or that we will be able to enter into future collaborations, renewagreements, or enter into new agreements in the future on terms that are as favorable to us as those that exist today.
Our ability to grow our management and franchise systems is subject to the range of risks associated with real estate investments. Our ability tosustain continued growth through management or franchise agreements for new hotels and the conversion of existing facilities to managed or franchisedMarriott brands is affected, and may potentially be limited, by a variety of factors influencing real estate development generally. These include siteavailability, financing, planning, zoning and other local approvals, and other limitations that may be imposed by market and submarket factors, such asprojected room occupancy, changes in growth in demand compared to projected supply, territorial restrictions in our management and franchise agreements,costs of construction, and anticipated room rate structure.
Our development activities expose us to project cost, completion, and resale risks. We develop new hotel, timeshare interval, fractional ownership, andresidential properties, both directly and through partnerships, joint ventures, and other business structures with third parties. As demonstrated by the 2009impairment charges associated with our Timeshare business, our ongoing involvement in the development of properties presents a number of risks, includingthat: (1) continued weakness in the capital markets may limit our ability, or that of third parties with whom we do business, to raise capital for completion ofprojects that have commenced or for development of future properties; (2) properties that we develop could become less attractive due to further decreases indemand for residential, fractional or interval ownership, increases in mortgage rates and/or decreases in mortgage availability, market absorption oroversupply, with the result that we may not be able to sell such properties for a profit or at the prices or selling pace we anticipate, potentially requiringadditional changes in our pricing strategy that could result in further charges; (3) construction delays, cost overruns, lender financial defaults, or so called“Acts of God” such as earthquakes, hurricanes, floods or fires may increase overall project costs or result in project cancellations; and (4) we may be unable torecover development costs we incur for these projects that are not pursued to completion.
Development activities that involve our co-investment with third parties may result in disputes that could increase project costs, impair projectoperations, or increase project completion risks. Partnerships, joint ventures, and other business structures involving our co-investment with third partiesgenerally include some form of shared control over the operations of the business and create additional risks, including the possibility that other investors insuch ventures could become bankrupt or otherwise lack the financial resources to meet their obligations, or could have or develop business interests, policiesor objectives that are inconsistent with ours. Although we actively seek to minimize such risks before investing in partnerships, joint ventures or similarstructures, actions by another investor may present additional risks of project delay, increased project costs, or operational difficulties following projectcompletion. Such disputes may also be more likely in the current difficult business environment.
19
Table of Contents
Other Risks Associated with Timeshare and Residential PropertiesDisruption in the credit markets could impair our ability to securitize the loans that our Timeshare business generates. Our Timeshare business
provides financing to purchasers of our timeshare and fractional properties, and we periodically securitize interests in those loans in the capital markets.Disruption in the credit markets in the second half of 2008 and much of 2009 impaired the timing and volume of the timeshare loans that we securitized, aswell as the financial terms of such securitizations. Improved market conditions in 2010 allowed us to successfully complete a securitization in the fourthquarter of 2010 on substantially more favorable terms. Nonetheless, any future deterioration in the financial markets could preclude, delay or increase thecost to us of future note securitizations, which could in turn cause us to reduce spending in order to maintain our leverage and return targets.
Risks associated with development and sale of residential properties that are associated with our lodging and timeshare properties or brands mayreduce our profits. In certain hotel and timeshare projects we participate, through noncontrolling interests and/or licensing fees, in the development and saleof residential properties associated with our brands, including luxury residences and condominiums under our Ritz-Carlton and Marriott brands. Suchprojects pose additional risks beyond those generally associated with our lodging and timeshare businesses, which may reduce our profits or compromise ourbrand equity, including the following:
• The continued weakness in residential real estate, vacation home prices, and demand generally will continue to reduce our profits and could
result in losses on residential sales, increase our carrying costs due to a slower pace of sales than we anticipated, and could make it more difficultto convince future hotel development partners of the value added by our brands;
• Increases in interest rates, reductions in mortgage availability, or increases in the costs of residential ownership could prevent potentialcustomers from buying residential products or reduce the prices they are willing to pay; and
• Residential construction may be subject to warranty and liability claims, and the costs of resolving such claims may be significant.
Purchaser defaults on the loans our Timeshare business generates could reduce our Timeshare revenues and profits. We are also subject to the risk ofdefault on the financing we provide to purchasers of our timeshare and fractional properties. Purchaser defaults could force us to foreclose on the loan andreclaim ownership of the financed property, both for loans that we have not securitized and in our role as servicer for the loans we have securitized. If wecannot resell foreclosed properties in a timely manner or at a price sufficient to repay the loans and our costs, we could incur losses or impairment charges onloans we have yet to securitize or loss of future income from our residual interest in loans that we have securitized.
Technology, Information Protection, and Privacy RisksA failure to keep pace with developments in technology could impair our operations or competitive position. The lodging and timeshare industries
continue to demand the use of sophisticated technology and systems, including those used for our reservation, revenue management and propertymanagement systems, our Marriott Rewards and The Ritz-Carlton Rewards programs, and technologies we make available to our guests. These technologiesand systems must be refined, updated, and/or replaced with more advanced systems on a regular basis. If we are unable to do so as quickly as our competitorsor within budgeted costs and time frames, our business could suffer. We also may not achieve the benefits that we anticipate from any new technology orsystem, and a failure to do so could result in higher than anticipated costs or could impair our operating results.
An increase in the use of third-party Internet services to book online hotel reservations could adversely impact our business. Some of our hotel roomsare booked through Internet travel intermediaries such as Expedia.com , Travelocity.com , and Orbitz.com , as well as lesser-known online travel serviceproviders. These intermediaries initially focused on leisure travel, but now also provide offerings for corporate travel and group meetings. AlthoughMarriott’s Look No Further Best Rate Guarantee has greatly reduced the ability of intermediaries to undercut the published rates at our hotels, intermediariescontinue to use a variety of aggressive online marketing methods to attract customers, including the purchase, by certain companies, of trademarked onlinekeywords such as “Marriott” from Internet search engines such as Google , Bing and Yahoo to steer customers toward their websites (a practice currentlybeing challenged by various trademark owners in federal court). Although Marriott has successfully limited these practices through contracts with key onlineintermediaries, the number of intermediaries and related companies that drive traffic to intermediaries’ websites is too large to permit us to eliminate this riskentirely. Our business and profitability could be harmed if online intermediaries succeed in significantly shifting loyalties from our lodging brands to theirtravel services, diverting bookings away from www.Marriott.com, or through their fees increasing the overall cost of Internet bookings for our hotels.
20
® ® ®
®
® ® ®
Table of Contents
Failure to maintain the integrity of internal or customer data could result in faulty business decisions, operational inefficiencies, damage ofreputation and/or subject us to costs, fines, or lawsuits. Our businesses require collection and retention of large volumes of internal and customer data,including credit card numbers and other personally identifiable information of our customers in various information systems and those of our serviceproviders. We also maintain personally identifiable information about our employees. The integrity and protection of that customer, employee, and companydata is critical to us. If that data is inaccurate or incomplete, we could make faulty decisions. Our customers and employees also have a high expectation thatwe and our service providers will adequately protect their personal information. The regulatory environment surrounding information, security and privacy isalso increasingly demanding, in both the United States and other jurisdictions in which we operate. Our systems may be unable to satisfy changing regulatoryrequirements and employee and customer expectations, or may require significant additional investments or time in order to do so. Our information systemsand records, including those we maintain with our service providers, may be subject to security breaches, system failures, viruses, operator error or inadvertentreleases of data. A significant theft, loss, or fraudulent use of customer, employee, or company data maintained by us or by a service provider could adverselyimpact our reputation and could result in remedial and other expenses, fines, or litigation. A breach in the security of our information systems or those of ourservice providers could lead to an interruption in the operation of our systems, resulting in operational inefficiencies and a loss of profits.
Changes in privacy law could adversely affect our ability to market our products effectively. We rely on a variety of direct marketing techniques,including telemarketing, email marketing, and postal mailings. Any further restrictions in laws such as the Telemarketing Sales Rule, CANSPAM Act, andvarious U.S. state laws, or new federal laws, regarding marketing and solicitation or international data protection laws that govern these activities couldadversely affect the continuing effectiveness of telemarketing, email, and postal mailing techniques and could force further changes in our marketingstrategy. If this occurs, we may not be able to develop adequate alternative marketing strategies, which could impact the amount and timing of our sales oftimeshare units and other products. We also obtain access to potential customers from travel service providers or other companies with whom we havesubstantial relationships and market to some individuals on these lists directly or by including our marketing message in the other company’s marketingmaterials. If access to these lists was prohibited or otherwise restricted, our ability to develop new customers and introduce them to our products could beimpaired.
Other RisksChanges in tax and other laws and regulations could reduce our profits or increase our costs. Our businesses are subject to regulation under a wide
variety of laws, regulations and policies in jurisdictions around the world. In response to the recent economic crisis and the recent recession, we anticipatethat many of the jurisdictions in which we do business will review tax and other revenue raising laws, regulations and policies, and any resulting changescould impose new restrictions, costs or prohibitions on our current practices and reduce our profits. In particular, governments may revise tax laws,regulations or official interpretations in ways that could have a significant impact on us, including modifications that could reduce the profits that we caneffectively realize from our non-U.S. operations, or that could require costly changes to those operations, or the way in which they are structured. Forexample, most U.S. company effective tax rates reflect the fact that income earned and reinvested outside the United States is generally taxed at local rates,which are often much lower than U.S. tax rates. If changes in tax laws, regulations or interpretations were to significantly increase the tax rates on non-U.S.income, our effective tax rate could increase, our profits could be reduced, and if such increases were a result of our status as a U.S. company, could place us ata disadvantage to our non-U.S. competitors if those competitors remain subject to lower local tax rates.
If we cannot attract and retain talented associates, our business could suffer. We compete with other companies both within and outside of ourindustry for talented personnel. If we are not able to recruit, train, develop, and retain sufficient numbers of talented associates, we could experience increasedassociate turnover, decreased guest satisfaction, low morale, inefficiency, or internal control failures. Insufficient numbers of talented associates could alsolimit our ability to grow and expand our businesses.
Delaware law and our governing corporate documents contain, and our Board of Directors could implement, anti-takeover provisions that coulddeter takeover attempts. Under the Delaware business combination statute, a stockholder holding 15 percent or more of our outstanding voting stock couldnot acquire us without Board of Director consent for at least three years after the date the stockholder first held 15 percent or more of the voting stock. Ourgoverning corporate documents also, among other things, require supermajority votes in connection with mergers and similar transactions. In addition, ourBoard of Directors could, without stockholder approval, implement other anti-takeover defenses, such as a stockholder’s rights plan to replace thestockholder’s rights plan that expired in March 2008.
21
Table of Contents
Item 1B. Unresolved Staff Comments.None.
Item 2. Properties.
Company-operated properties are described in Part I, Item 1. “Business,” earlier in this report. We believe our properties are in generally good physicalcondition with the need for only routine repairs and maintenance and periodic capital improvements. Most of our regional offices and reservation centers,both domestically and internationally, are located in leased facilities. We also lease space in a number of buildings with combined space of approximately1.3 million square feet in Maryland and Florida where our corporate, Ritz-Carlton, and Marriott Vacation Club International headquarters are located. Item 3. Legal Proceedings.
From time to time, we are subject to certain legal proceedings and claims in the ordinary course of business, including adjustments proposed duringgovernmental examinations of the various tax returns we file. While management presently believes that the ultimate outcome of these proceedings,individually and in the aggregate, will not materially harm our financial position, cash flows, or overall trends in results of operations, legal proceedings aresubject to inherent uncertainties, and unfavorable rulings could occur that could have individually or in aggregate, a material adverse effect on our business,financial condition, or operating results. Item 4. Removed and Reserved.Executive Officers of the Registrant
See Part III, Item 10 of this report for information about our executive officers.
22
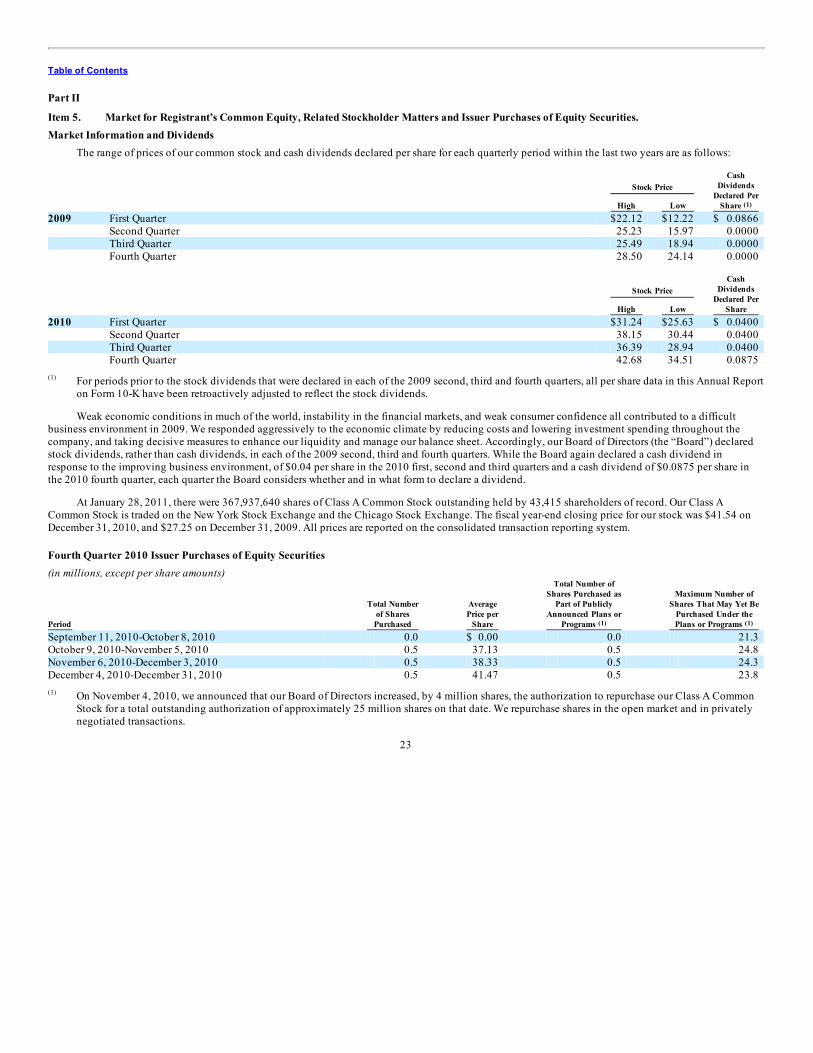
Table of Contents
Part II
Item 5. Market for Registrant’s Common Equity, Related Stockholder Matters and Issuer Purchases of Equity Securities.Market Information and Dividends
The range of prices of our common stock and cash dividends declared per share for each quarterly period within the last two years are as follows:
Stock Price Cash
DividendsDeclared Per
Share High Low 2009 First Quarter $22.12 $12.22 $ 0.0866
Second Quarter 25.23 15.97 0.0000 Third Quarter 25.49 18.94 0.0000 Fourth Quarter 28.50 24.14 0.0000
Stock Price Cash
DividendsDeclared Per
Share High Low 2010 First Quarter $31.24 $25.63 $ 0.0400
Second Quarter 38.15 30.44 0.0400 Third Quarter 36.39 28.94 0.0400 Fourth Quarter 42.68 34.51 0.0875
For periods prior to the stock dividends that were declared in each of the 2009 second, third and fourth quarters, all per share data in this Annual Reporton Form 10-K have been retroactively adjusted to reflect the stock dividends.
Weak economic conditions in much of the world, instability in the financial markets, and weak consumer confidence all contributed to a difficultbusiness environment in 2009. We responded aggressively to the economic climate by reducing costs and lowering investment spending throughout thecompany, and taking decisive measures to enhance our liquidity and manage our balance sheet. Accordingly, our Board of Directors (the “Board”) declaredstock dividends, rather than cash dividends, in each of the 2009 second, third and fourth quarters. While the Board again declared a cash dividend inresponse to the improving business environment, of $0.04 per share in the 2010 first, second and third quarters and a cash dividend of $0.0875 per share inthe 2010 fourth quarter, each quarter the Board considers whether and in what form to declare a dividend.
At January 28, 2011, there were 367,937,640 shares of Class A Common Stock outstanding held by 43,415 shareholders of record. Our Class ACommon Stock is traded on the New York Stock Exchange and the Chicago Stock Exchange. The fiscal year-end closing price for our stock was $41.54 onDecember 31, 2010, and $27.25 on December 31, 2009. All prices are reported on the consolidated transaction reporting system.
Fourth Quarter 2010 Issuer Purchases of Equity Securities(in millions, except per share amounts)
Period
Total Numberof Shares
Purchased
AveragePrice per
Share
Total Number ofShares Purchased as
Part of PubliclyAnnounced Plans or
Programs
Maximum Number ofShares That May Yet Be
Purchased Under thePlans or Programs
September 11, 2010-October 8, 2010 0.0 $ 0.00 0.0 21.3 October 9, 2010-November 5, 2010 0.5 37.13 0.5 24.8 November 6, 2010-December 3, 2010 0.5 38.33 0.5 24.3 December 4, 2010-December 31, 2010 0.5 41.47 0.5 23.8
On November 4, 2010, we announced that our Board of Directors increased, by 4 million shares, the authorization to repurchase our Class A CommonStock for a total outstanding authorization of approximately 25 million shares on that date. We repurchase shares in the open market and in privatelynegotiated transactions.
23
(1)
(1)
(1) (1)
(1)
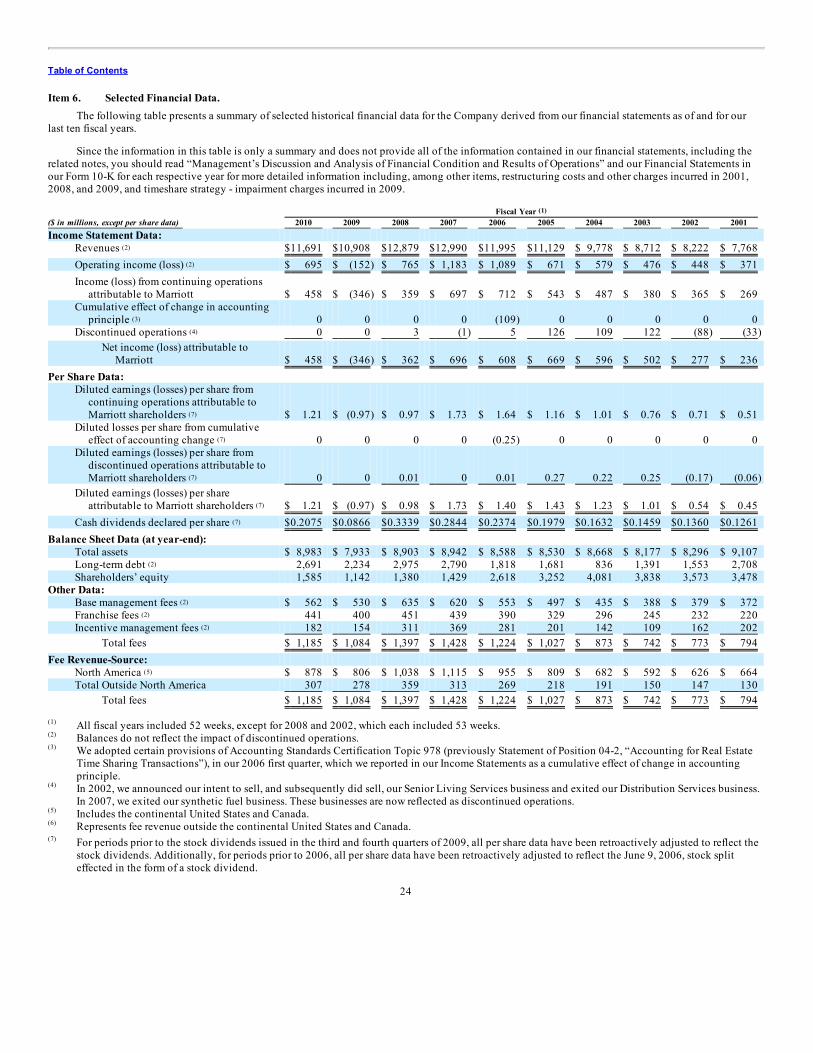
Table of Contents
Item 6. Selected Financial Data.The following table presents a summary of selected historical financial data for the Company derived from our financial statements as of and for our
last ten fiscal years.
Since the information in this table is only a summary and does not provide all of the information contained in our financial statements, including therelated notes, you should read “Management’s Discussion and Analysis of Financial Condition and Results of Operations” and our Financial Statements inour Form 10-K for each respective year for more detailed information including, among other items, restructuring costs and other charges incurred in 2001,2008, and 2009, and timeshare strategy - impairment charges incurred in 2009. Fiscal Year ($ in millions, except per share data) 2010 2009 2008 2007 2006 2005 2004 2003 2002 2001 Income Statement Data:
Revenues $11,691 $10,908 $12,879 $12,990 $11,995 $11,129 $ 9,778 $ 8,712 $ 8,222 $ 7,768 Operating income (loss) $ 695 $ (152) $ 765 $ 1,183 $ 1,089 $ 671 $ 579 $ 476 $ 448 $ 371 Income (loss) from continuing operations
attributable to Marriott $ 458 $ (346) $ 359 $ 697 $ 712 $ 543 $ 487 $ 380 $ 365 $ 269 Cumulative effect of change in accounting
principle 0 0 0 0 (109) 0 0 0 0 0 Discontinued operations 0 0 3 (1) 5 126 109 122 (88) (33)
Net income (loss) attributable toMarriott $ 458 $ (346) $ 362 $ 696 $ 608 $ 669 $ 596 $ 502 $ 277 $ 236
Per Share Data: Diluted earnings (losses) per share from
continuing operations attributable toMarriott shareholders $ 1.21 $ (0.97) $ 0.97 $ 1.73 $ 1.64 $ 1.16 $ 1.01 $ 0.76 $ 0.71 $ 0.51
Diluted losses per share from cumulativeeffect of accounting change 0 0 0 0 (0.25) 0 0 0 0 0
Diluted earnings (losses) per share fromdiscontinued operations attributable toMarriott shareholders 0 0 0.01 0 0.01 0.27 0.22 0.25 (0.17) (0.06)
Diluted earnings (losses) per shareattributable to Marriott shareholders $ 1.21 $ (0.97) $ 0.98 $ 1.73 $ 1.40 $ 1.43 $ 1.23 $ 1.01 $ 0.54 $ 0.45
Cash dividends declared per share $0.2075 $0.0866 $0.3339 $0.2844 $0.2374 $0.1979 $0.1632 $0.1459 $0.1360 $0.1261 Balance Sheet Data (at year-end):
Total assets $ 8,983 $ 7,933 $ 8,903 $ 8,942 $ 8,588 $ 8,530 $ 8,668 $ 8,177 $ 8,296 $ 9,107 Long-term debt 2,691 2,234 2,975 2,790 1,818 1,681 836 1,391 1,553 2,708 Shareholders’ equity 1,585 1,142 1,380 1,429 2,618 3,252 4,081 3,838 3,573 3,478
Other Data: Base management fees $ 562 $ 530 $ 635 $ 620 $ 553 $ 497 $ 435 $ 388 $ 379 $ 372 Franchise fees 441 400 451 439 390 329 296 245 232 220 Incentive management fees 182 154 311 369 281 201 142 109 162 202
Total fees $ 1,185 $ 1,084 $ 1,397 $ 1,428 $ 1,224 $ 1,027 $ 873 $ 742 $ 773 $ 794 Fee Revenue-Source:
North America $ 878 $ 806 $ 1,038 $ 1,115 $ 955 $ 809 $ 682 $ 592 $ 626 $ 664 Total Outside North America 307 278 359 313 269 218 191 150 147 130
Total fees $ 1,185 $ 1,084 $ 1,397 $ 1,428 $ 1,224 $ 1,027 $ 873 $ 742 $ 773 $ 794
All fiscal years included 52 weeks, except for 2008 and 2002, which each included 53 weeks.Balances do not reflect the impact of discontinued operations.We adopted certain provisions of Accounting Standards Certification Topic 978 (previously Statement of Position 04-2, “Accounting for Real EstateTime Sharing Transactions”), in our 2006 first quarter, which we reported in our Income Statements as a cumulative effect of change in accountingprinciple.In 2002, we announced our intent to sell, and subsequently did sell, our Senior Living Services business and exited our Distribution Services business.In 2007, we exited our synthetic fuel business. These businesses are now reflected as discontinued operations.Includes the continental United States and Canada.Represents fee revenue outside the continental United States and Canada.For periods prior to the stock dividends issued in the third and fourth quarters of 2009, all per share data have been retroactively adjusted to reflect thestock dividends. Additionally, for periods prior to 2006, all per share data have been retroactively adjusted to reflect the June 9, 2006, stock spliteffected in the form of a stock dividend.
24
(1)
(2)
(2)
(3)
(4)
(7)
(7)
(7)
(7)
(7)
(2)
(2)
(2)
(2)
(5)
(1)
(2)
(3)
(4)
(5)
(6)
(7)
Table of Contents
Item 7. Management’s Discussion and Analysis of Financial Condition and Results of Operations.BUSINESS AND OVERVIEW
We are a worldwide operator and franchisor of 3,545 properties (618,104 rooms) and related facilities. The figures in the preceding sentence are as ofyear-end 2010 and include 34 home and condominium products (3,391 units) for which we manage the related owners’ associations. In addition, we provided2,043 furnished corporate housing rental units, which are not included in the totals.
Our operations are grouped into five business segments: North American Full-Service Lodging, North American Limited-Service Lodging,International Lodging, Luxury Lodging, and Timeshare. We operate, develop, and franchise under numerous separate brand names in 70 countries andterritories.
We earn base, incentive, and franchise fees based upon the terms of our management and franchise agreements. We earn revenues from the limitednumber of hotels we own or lease. We also generate revenues from the following sources associated with our Timeshare segment: (1) selling timeshareinterval, fractional ownership, and residential properties; (2) operating the resorts and residential properties; (3) financing customer purchases of timesharingintervals; and (4) rentals. Finally, we earn fees in association with affinity card endorsements and the sale of branded residential real estate.
During 2010 we broadened our timeshare interval product offering to include the sale of the points-based Marriott Vacation Club Destinationstimeshare program in North America and the Caribbean. The Marriott Vacation Club Destinations timeshare program offers greater flexibility, furtherpersonalization and more experience opportunities for participating timeshare owners. See the “Marriott Vacation Club Destinations Timeshare Program”caption later in this Form 10-K for additional information.
We sell residential real estate either in conjunction with luxury hotel development or on a stand-alone basis under The Ritz-Carlton brand (The Ritz-Carlton Residences) and in conjunction with Timeshare segment projects (The Ritz-Carlton Destination Club and Grand Residences by Marriott-Residential). Our Timeshare segment residential projects are typically opened over time. Other residences are typically constructed and sold by third-partydevelopers with limited amounts, if any, of our capital at risk. While the worldwide residential market is very large, the luxurious nature of our residentialproperties, the quality and exclusivity associated with our brands, and the hospitality services that we provide, all serve to make our residential propertiesdistinctive.
LodgingBusiness conditions for our lodging business improved in 2010. While the recent recession significantly impacted lodging demand and hotel pricing,
occupancies began to improve late in 2009 and that improvement continued throughout 2010. Room rates began to stabilize and improve in some markets inthe 2010 second quarter, and that improvement continued, strengthened and expanded to other markets throughout the rest of 2010. In 2010, worldwideaverage daily rates on a constant dollar basis stayed the same as 2009 for company-operated properties. Worldwide RevPAR for company-operated propertiesincreased 6.3 percent on a constant dollar basis for 2010, as compared to 2009, and occupancy increased 4.1 percentage points to 68.7 percent.
While worldwide RevPAR for 2010 remained well below 2008 levels, we continued to see strengthening in properties in Asia, Europe, the Caribbean,Latin America, and in our luxury properties around the world. Our hotels in Asia are particularly benefitting from strong economic growth in that region.Additionally, hotels in North America experienced stronger demand from corporate transient and association group customers in 2010 as compared to 2009,and that demand continued to strengthen progressively during the 2010 period. However, property-level banquet and catering spending continues to be weakprimarily reflecting tight budgets and fewer group functions; although we did experience some improvement late in 2010. During the 2010 first quarter,group meeting cancellations declined to typical levels, and expected revenue from group meetings continued to improve throughout 2010. While ourbooking windows for both group business and transient business remain very short, our pace of bookings for group business for future periods continued toimprove throughout 2010.
We monitor market conditions continuously and carefully price our rooms daily to meet individual hotel demand levels. We modify the mix of ourbusiness to increase revenue as demand changes. Demand for higher rated rooms improved in 2010, which allowed us to reduce discounting and specialoffers for transient business. This mix improvement benefited average daily rates at many hotels.
Negotiated corporate business (“special corporate business”) represented 14 percent of our full-service hotel room nights for 2010 in North America.By late 2010, demand trends had further strengthened, and we had negotiated rates with more
25
Table of Contents
than two-thirds of our 2011 special corporate rate clients. Those rates were meaningfully higher than those we negotiated in 2009 and early 2010. Wetypically negotiate and fix room rates associated with special corporate business in advance of the year to which they apply, which limits our ability to raisethese rates quickly. We expect to complete negotiations with our remaining special corporate business clients in the 2011 first quarter. In negotiating pricingfor this segment of business, we do not focus strictly on volume, but instead carefully evaluate the relationship with our customers, including for example,stay patterns (day of week and season), locations of stays, non-room spend, and aggregate spend.
Group business pricing is also inflexible in the near term, as some group business may be booked several years in advance of guest arrival. However, asa result of the recent recession, shorter group booking windows became more common for 2010 than they were in prior years. Accordingly, withstrengthening demand, group business booked in 2010 showed stronger price improvement than business booked in 2009, and “in-the-year-for-the-year”bookings also increased in 2010.
Properties in our system are maintaining very tight cost controls, as we continue to focus on enhancing property-level house profit margins. Whereappropriate for market conditions, we have maintained many of our 2009 property-level cost saving initiatives such as adjusting menus and restaurant hours,modifying room amenities, cross-training personnel, utilizing personnel at multiple properties where feasible, and not filling some vacant positions. We alsoreduced above-property costs, which are allocated to hotels, by scaling back systems, processing, and support areas. In addition, we have not filled certainabove-property vacant positions, and have required where legally permitted and elsewhere encouraged employees to use their vacation time accrued during2010.
Our lodging business model involves managing and franchising hotels, rather than owning them. At year-end 2010, we operated 45 percent of the hotelrooms in our system under management agreements, our franchisees operated 53 percent under franchise agreements, and we owned or leased 2 percent. Ouremphasis on long-term management contracts and franchising tends to provide more stable earnings in periods of economic softness, while the addition ofnew hotels to our system generates growth. This strategy has allowed substantial growth while reducing financial leverage and risk in a cyclical industry. Inaddition, we increase our financial flexibility by reducing our capital investments and adopting a strategy of recycling the investments that we make.
We consider RevPAR, which we calculate by dividing room sales for comparable properties by room nights available to guests for the period, to be ameaningful indicator of our performance because it measures the period-over-period change in room revenues for comparable properties. RevPAR may not becomparable to similarly titled measures, such as revenues. References to RevPAR throughout this report are in constant dollars, unless otherwise noted.
Company-operated house profit margin is the ratio of property-level gross operating profit (also known as house profit) to total property-level revenue.We consider house profit margin to be a meaningful indicator of our performance because this ratio measures our overall ability as the operator to produceproperty-level profits by generating sales and controlling the operating expenses over which we have the most direct control. House profit includes room,food and beverage, and other revenue and the related expenses including payroll and benefits expenses, as well as repairs and maintenance, utility, generaland administrative, and sales and marketing expenses. House profit does not include the impact of management fees, furniture, fixtures and equipmentreplacement reserves, insurance, taxes, or other fixed expenses.
For our North American comparable properties, systemwide RevPAR (which includes data from our franchised, managed, owned, and leased properties)increased by 4.9 percent in 2010, compared to 2009, reflecting improved occupancy levels in most markets, partially offset by a modest decline in averagedaily rates. For our properties outside North America, systemwide RevPAR for 2010 increased 9.2 percent versus 2009, reflecting improved occupancy levels,partially offset by a modest decline in average daily rates.
TimeshareWe launched the points-based Marriott Vacation Club Destinations timeshare program (“MVCD Program”) in North America and the Caribbean in
June 2010, and we are initially focusing our marketing efforts on existing customers. As a result, in 2010, contract sales to existing owners increased 31percent while sales to new customers declined. We expect accelerated sales to new customers in 2011. See the “Marriott Vacation Club DestinationsTimeshare Program” caption later in this Form 10-K for additional information.
Contract sales for our timeshare, fractional, and residential products increased modestly in 2010, compared to 2009, largely due to a decline in contractsales cancellation allowances. We adjust our contract sales for cancellation allowances that we record in anticipation that a portion of contract revenuepreviously recorded for certain residential and fractional projects would not be realized due to pre-closing contract cancellations. At the same time, contractsales were constrained by difficult comparisons driven by sales promotions begun in 2009. By the end of 2010, timeshare pricing improved because we hadlargely discontinued or reduced the purchase incentives and targeted marketing efforts instituted in 2009.
26
Table of Contents
Rental revenues increased in 2010 with stronger leisure demand for our Marriott Vacation Club product and greater available rental inventory. Demandfor fractional and residential units remains weak. Sales and marketing costs as a percentage of contract sales continue to improve. As with Lodging, ourTimeshare properties continue to maintain very tight cost controls, and we have not filled certain vacant positions, and have required where legally permittedand elsewhere encouraged employees to use their vacation time accrued during 2010.
Since the sale of timeshare and fractional intervals and condominiums follows the percentage-of-completion accounting method, current demand maynot always be reflected in our Timeshare segment results until later accounting periods.
On January 2, 2010, the first day of our 2010 fiscal year, we adopted the new Transfers of Financial Assets and Consolidation standards. As a result ofadopting these standards in the 2010 first quarter, we consolidated 13 existing qualifying special purpose entities associated with past securitizationtransactions, and we recorded a one-time non-cash after-tax reduction to shareholders’ equity of $146 million ($238 million pretax) in the 2010 first quarter,representing the cumulative effect of a change in accounting principle.
See Footnote No. 1, “Summary of Significant Accounting Policies,” of the Notes to our Financial Statements for more detailed information on ouradoption of these new accounting topics, including the impact to our Balance Sheet and Statement of Income.
CONSOLIDATED RESULTSThe following discussion presents an analysis of results of our operations for 2010, 2009, and 2008.
Continuing OperationsRevenues2010 Compared to 2009
Revenues increased by $783 million (7 percent) to $11,691 million in 2010 from $10,908 million in 2009, as a result of higher: cost reimbursementsrevenue ($557 million); Timeshare sales and services revenue ($98 million); base management and franchise fees ($73 million); incentive management fees($28 million (comprised of a $12 million increase for North America and a $16 million increase outside of North America)); and owned, leased, corporatehousing, and other revenue ($27 million).
The increase in Timeshare sales and services revenue to $1,221 million in 2010, from $1,123 million in 2009, primarily reflected higher financingrevenue due to higher interest income and to a lesser extent higher services revenue reflecting increased rental occupancy levels and rates. These favorableimpacts were partially offset by lower development revenue reflecting lower sales volumes primarily associated with tough comparisons driven by salespromotions begun in 2009, a $20 million increase in reserves (we now reserve for 100 percent of notes that are in default in addition to the reserve we recordon notes not in default), and lower sales to new customers in our initial launch of the MVCD Program. See “BUSINESS SEGMENTS: Timeshare” later in thisreport for additional information on our Timeshare segment.
The increases in base management fees, to $562 million in 2010 from $530 million in 2009, and in franchise fees, to $441 million in 2010 from $400million in 2009, primarily reflected stronger RevPAR and the impact of unit growth across the system. The increase in incentive management fees, to $182million in 2010 from $154 million in 2009, primarily reflected higher property-level revenue and continued tight property-level cost controls that improved2010 margins compared to 2009 and, to a lesser extent, new unit growth.
The increase in owned, leased, corporate housing, and other revenue, to $1,046 million in 2010, from $1,019 million in 2009, largely reflected $14million of higher hotel agreement termination fees associated with six properties that exited our system, $8 million of higher branding fees, $6 million ofhigher revenue for owned and leased properties, and $5 million of higher other revenue. Partially offsetting these favorable variances was a one-time $6million transaction cancellation fee received in 2009. The increase in owned and leased revenue primarily reflected increased RevPAR and occupancy levels.Combined branding fees associated with affinity card endorsements and the sale of branded residential real estate totaled $78 million and $70 million in2010 and 2009, respectively.
Cost reimbursements revenue represents reimbursements of costs incurred on behalf of managed and franchised properties and relates, predominantly,to payroll costs at managed properties where we are the employer. As we record cost reimbursements based upon costs incurred with no added markup, thisrevenue and related expense has no impact on either our operating income or net income attributable to us. The increase in cost reimbursements revenue, to$8,239 million in 2010 from $7,682 million in 2009, reflected the impact of growth across the system, partially offset by lower property-level
27
Table of Contents
costs in response to cost controls. Net of hotels exiting the system, we added 4,287 managed rooms and 17,024 franchised rooms to our system in 2010.
2009 Compared to 2008Revenues decreased by $1,971 million (15 percent) to $10,908 million in 2009 from $12,879 million in 2008, as a result of lower: cost reimbursements
revenue ($1,152 million); Timeshare sales and services revenue ($300 million); owned, leased, corporate housing, and other revenue ($206 million);incentive management fees ($157 million (comprised of $108 million for North America and $49 million outside of North America)); base management fees($105 million (comprised of $79 million for North America and $26 million outside of North America)); and franchise fees ($51 million).
The decrease in cost reimbursements revenue, to $7,682 million in 2009 from $8,834 million in 2008, reflected lower property-level costs, in responseto lower occupancy and cost controls, partially offset by the impact of growth across the system. We added 35 managed properties (8,574 rooms) and 200franchised properties (25,136 rooms) to our system in 2009, net of properties exiting the system.
The decrease in Timeshare sales and services revenue of $300 million (21 percent), to $1,123 million in 2009, from $1,423 million in 2008, primarilyreflected lower demand for timeshare intervals and to a lesser extent, residential products and the Asia Pacific points program, as well as lower revenue fromprojects with limited available inventory in 2009, and lower reacquired and resales revenue and services revenue. The decrease was partially offset by higherrevenue from projects that became reportable subsequent to 2008 and higher financing revenue. See “BUSINESS SEGMENTS: Timeshare,” later in this reportfor additional information on our Timeshare segment.
The decrease in owned, leased, corporate housing, and other revenue, to $1,019 million in 2009, from $1,225 million in 2008, largely reflected $183million of lower revenue for owned and leased properties, $19 million of lower revenue associated with our corporate housing business, $14 million of lowerhotel agreement termination fees, and $5 million of lower branding fees associated with the sale of residential real estate, partially offset by $11 million ofincreased branding fees associated with our affinity credit card and a $3 million favorable impact related to a property that was being renovated during 2008,and as a result was not operating at full capacity. Combined branding fees associated with affinity card endorsements and the sale of branded residential realestate totaled $70 million and $64 million in 2009 and 2008, respectively. The decrease in owned and leased revenue primarily reflected RevPAR declinesassociated with weak lodging demand.
The decrease in incentive management fees, to $154 million in 2009 from $311 million in 2008, reflected lower property-level revenue, associatedwith weak demand, lower RevPAR, and the associated lower property-level operating income and margins in 2009 compared to 2008. Most incentivemanagement fees are earned only after each hotel earns a minimum return for the hotel’s owner. With particularly weak demand and low property-leveloperating income in 2009, most managed hotels did not have sufficient operating income to allow us to earn an incentive fee. In 2009, only 25 percent ofmanaged hotels paid incentive fees to us, as compared to 56 percent in 2008. The decreases in base management fees, to $530 million in 2009 from $635million in 2008, and franchise fees, to $400 million in 2009 from $451 million in 2008, both reflected RevPAR declines driven by weaker demand, partiallyoffset by the favorable impact of unit growth across the system.
Timeshare Strategy-Impairment ChargesIn 2009 we recorded pretax charges totaling $752 million in our Income Statement ($502 million after-tax), including $614 million of pretax charges
that impacted operating income under the “Timeshare strategy-impairment charges” caption, and $138 million of pretax charges that impacted non-operatingincome under the “Timeshare strategy-impairment charges (non-operating)” caption. The $752 million of pretax impairment charges were non-cash, otherthan $27 million of charges associated with ongoing mezzanine loan fundings and $21 million of charges for purchase commitments.
See Footnote No. 18, “Timeshare Strategy-Impairment Charges,” of the Notes to our Financial Statements for additional information, including a tableshowing the composition of the charges.
Restructuring Costs and Other ChargesAs a result of the restructuring actions we began in the fourth quarter of 2008, we incurred $55 million in restructuring costs in the fourth quarter of
2008. As part of these actions we initiated further cost savings measures in 2009 associated with our Timeshare segment, hotel development, above-propertylevel management, and corporate overhead. These further measures resulted in additional restructuring costs of $51 million in 2009. For additionalinformation on the 2008 and 2009 restructuring costs, including the types of restructuring costs incurred in total and by segment, please see Footnote No. 21,“Restructuring Costs and Other Charges,” of the Notes to the Financial Statements in our 2009 Form 10-K. For the cumulative restructuring costs incurredsince inception and a roll forward of the restructuring liability through year-end
28
Table of Contents
2010, please see Footnote No. 19, “Restructuring Costs and Other Charges,” of the Notes to our Financial Statements in this Form 10-K.
As a result of our restructuring efforts, we realized the following annual cost savings in 2010, which were primarily reflected in our Income Statementunder the expense captions noted: (i) $113 million ($73 million after-tax) for our Timeshare segment, under “Timeshare-direct” and “General, administrative,and other”; (ii) $12 million ($8 million after-tax) for hotel development across several of our Lodging segments, primarily under “General, administrative,and other”; and (iii) $10 million ($8 million after-tax) for reducing above property-level lodging management personnel under “General, administrative, andother.”
Operating Income (Loss)2010 Compared to 2009
Operating income increased by $847 million to operating income of $695 million in 2010 from an operating loss of $152 million in 2009. Theincrease in operating income reflected a favorable variance of $614 million related to Timeshare strategy-impairment charges recorded in 2009, $116 millionof higher Timeshare sales and services revenue net of direct expenses, a $73 million increase in base management and franchise fees, a $51 million decreasein restructuring costs, $28 million of higher incentive management fees, and $23 million of higher owned, leased, corporate housing, and other revenue net ofdirect expenses, partially offset by a $58 million increase in general, administrative, and other expenses. We note the reasons for the increase of $73 millionin base management and franchise fees as well as the increase of $28 million in incentive management fees as compared to 2009 in the preceding “Revenues”section.
Timeshare sales and services revenue net of direct expenses in 2010 totaled $199 million. The increase of $116 million as compared to 2009, primarilyreflected $78 million of higher financing revenue, net of expenses, which largely reflected increased interest income associated with the impact ofconsolidating previously unconsolidated securitized notes under the new Transfers of Financial Assets and Consolidation standards, $33 million of higherdevelopment revenue net of product costs and marketing and selling costs, and $8 million of higher other revenue, net of expenses partially offset by $3million of lower services revenue net of expenses. Higher development revenue net of product costs and marketing and selling costs primarily reflected bothlower product costs due to lower sales volumes and lower marketing and selling costs in 2010, as well as favorable variances from both a $10 million chargerelated to an issue with a state tax authority and a net $3 million impact from contract cancellation allowances in 2009, partially offset by lower developmentrevenue for the reasons stated in the preceding “Revenues” section. See “BUSINESS SEGMENTS: Timeshare,” later in this report for additional informationon our Timeshare segment.
The $23 million (34 percent) increase in owned, leased, corporate housing, and other revenue net of direct expenses was primarily attributable to $12million of higher hotel agreement termination fees net of property closing costs, $8 million of higher branding fees, a $4 million reversal of a liability relatedto a hotel that closed in 2010, and net stronger results at some owned and leased properties due to higher RevPAR and property-level margins, partially offsetby additional rent expense associated with one property and an unfavorable variance from a one-time $6 million transaction cancellation fee received in2009.
General, administrative, and other expenses increased by $58 million (8 percent) to $780 million in 2010 from $722 million in 2009. The increaseprimarily reflected the following 2010 charges: an $84 million long-lived asset impairment associated with a capitalized revenue management software asset(which we did not allocate to any of our segments); a $13 million long-lived asset impairment (allocated to our Timeshare segment); and a $14 million long-lived asset impairment (allocated to our North American Limited-Service segment). See Footnote No. 8, “Property and Equipment,” of the Notes to ourFinancial Statements for additional information regarding these three impairment charges. In addition, we recorded a $4 million contract acquisition costimpairment charge (allocated to our North American Full-Service segment) in 2010. See the North American Full-Service segment discussion for additionalinformation regarding this impairment charge. Also contributing to the year-over-year increase was $35 million of higher incentive compensation costs, $14million of increased other expenses primarily associated with initiatives to enhance our brands globally, $7 million of increased currency exchange losses,and $2 million of increased legal expenses. These unfavorable variances were partially offset by an $8 million reversal in 2010 of guarantee accruals,primarily related to a completion guarantee for which we satisfied the related requirements, and a $4 million reversal of excess accruals for net asset tax basedon the receipt of final assessments from a taxing authority located outside the United States. In addition, the comparison reflects the following 2009 expensesthat we did not incur in 2010: $49 million of impairment charges related to two security deposits that we deemed unrecoverable in 2009 due, in part, to ourdecision not to fund certain cash flow shortfalls, partially offset by an $11 million reversal of the 2008 accrual for the funding of those cash flow shortfalls; a$7 million write-off of Timeshare segment capitalized software costs; and $4 million of bad debt expense on an accounts receivable balance. The year-over-year comparison also reflected a $15 million favorable variance in deferred compensation expenses (with changes to our deferred compensation plan, general,administrative, and other expenses for 2010 had no deferred
29
Table of Contents
compensation impact, compared with $15 million of mark-to-market valuation expenses in 2009). The increase in general, administrative, and other expenseswas also partially offset by the elimination of the loan loss provision in 2010, compared with a $43 million provision in 2009, which reflected $29 millionassociated with one Luxury segment project and $14 million associated with a North American Limited-Service segment portfolio.
The $58 million increase in total general, administrative, and other expenses was comprised of: a $77 million increase that we did not allocate to anyof our segments; a $5 million increase impacting our Timeshare segment; an $8 million decrease impacting our North American Limited-Service segment; an$8 million decrease impacting our Luxury segment; a $7 million decrease impacting our North American Full-Service segment; and a $1 million decreaseimpacting our International segment.
2009 Compared to 2008Operating income decreased by $917 million (120 percent) to an operating loss of $152 million in 2009 from operating income of $765 million in
2008. The decrease in operating income reflected Timeshare strategy-impairment charges in 2009 of $614 million, $157 million of lower incentivemanagement fees, a $156 million decrease in combined base management and franchise fees, $69 million of lower owned, leased, corporate housing, andother revenue net of direct expenses, $6 million of lower Timeshare sales and services revenue net of direct expenses, partially offset by an $81 milliondecrease in general, administrative, and other expenses and a decrease in restructuring costs of $4 million. In the preceding “Revenues” section, we note thereasons for the decrease of $157 million in incentive management fees as well as the decrease of $156 million in combined base management and franchisefees as compared to 2008.
Timeshare sales and services revenue net of direct expenses in 2009 totaled $83 million. The decline of $6 million (7 percent) from $89 million in2008 primarily reflected $50 million of lower development revenue net of product costs and marketing and selling costs and $17 million of lower servicesrevenue net of expenses, mostly offset by $43 million of higher financing revenue net of financing expenses, $15 million of higher other revenue, net ofexpenses, and $3 million of higher reacquired and resales revenue, net of expenses. Lower development revenue net of product, marketing and selling costsprimarily reflected lower revenue for timeshare intervals and to a lesser extent, lower revenue net of costs for our Asia Pacific points program, and a $10million charge related to an issue with a state tax authority, partially offset by favorable reportability for several projects that reached revenue recognitionreportability thresholds after 2008 and favorable variances from both a $22 million 2008 pretax impairment charge related to a joint venture that we fullyconsolidate ($10 million net of noncontrolling interest benefit) and a $9 million 2008 inventory write-down related to the termination of certain phases oftimeshare development in Europe. Higher financing revenue net of financing expenses reflected higher note securitization gains, increased residual interestaccretion, a decrease in the adjustment to the fair market value of residual interests, and a decrease in the cost of financing, partially offset by lower interestincome. Lower services revenue net of expenses reflected weak demand for rentals and increased maintenance cost for unsold inventory. See “BUSINESSSEGMENTS: Timeshare” later in this section for additional information regarding our Timeshare segment.
The $69 million (50 percent) decrease in owned, leased, corporate housing, and other revenue net of direct expenses was primarily attributable to adecline of $65 million in revenue, net of expenses primarily associated with weaker demand at owned and leased properties, as well as our corporate housingbusiness, $14 million of lower hotel agreement termination fees, and $5 million of lower branding fees associated with sale of residential real estate, partiallyoffset by $11 million of increased branding fees associated with our affinity credit card and a $3 million favorable impact related to a property that was beingrenovated during 2008, and as a result was not operating at full capacity.
General, administrative, and other expenses decreased by $81 million (10 percent) to $722 million in 2009 from $803 million in 2008. The decreaseprimarily reflected $186 million of lower expenses, largely due to cost savings generated from the restructuring efforts initiated in 2008 and lower incentivecompensation as well as a $12 million favorable variance due to development cancellations in 2008. Additionally, in 2009 we reached final settlementregarding the Delta Airlines lease investment and recorded a $3 million recovery of the investment previously reserved in the “General, administrative, andother” expense caption on our Income Statement. For additional information regarding the Delta Airlines lease investment, see the “Investment in LeveragedLease” caption in “Management’s Discussion and Analysis of Financial Condition and Results of Operations” in our 2008 Form 10-K. These benefits werepartially offset by the following items: $49 million of impairment charges for two security deposits that we deemed unrecoverable in 2009 due, in part, to ourdecision not to fund certain cash flow shortfalls, partially offset by a $15 million accrual in 2008 for the expected funding of those cash flow shortfalls and an$11 million reversal in 2009 of the remaining balance of that 2008 accrual due to the decision to no longer fund those cash flow shortfalls; 2009 provisionsfor loan losses of $43 million for two loans partially offset by a $22 million favorable variance from a 2008 provision on a fully impaired loan; an $8 millionimpairment charge related to the write-off of contract acquisition costs for one property; a $7 million write-off of Timeshare segment capitalized softwarecosts; $12 million of expenses primarily related to write-offs of other assets that we deemed non-recoverable, performance cure accruals, and guaranteeaccruals associated with 12 hotels; and $4 million of bad debt expense on an accounts receivable balance. Additionally, 2009 included a $15 millionunfavorable impact
30
Table of Contents
associated with deferred compensation expenses, compared to a $28 million favorable impact in 2008, both of which reflected mark-to-market valuations. Ofthe $81 million decrease in total general, administrative, and other expenses, a $1 million increase was attributable to our Lodging segments, a $31 milliondecrease was attributable to our Timeshare segment, and a $51 million decrease was unallocated.
Gains (Losses) and Other Income (Expense)The table below shows our gains (losses) and other income for 2010, 2009, and 2008:
($ in millions) 2010 2009 2008 Gain on debt extinguishment $ 0 $ 21 $ 28 Gains on sales of real estate and other 34 10 14 Gain/(loss) on sale of joint venture and other investments 1 3 (1) Income/(loss) from cost method joint ventures 0 2 (3) Impairment of equity securities 0 (5) 0
$ 35 $ 31 $ 38
2010 Compared to 2009We did not extinguish any debt in 2010. In 2009, we repurchased $122 million principal amount of our Senior Notes in the open market, across
multiple series. The $21 million gain on debt extinguishment in 2009 represents the difference between the $98 million purchase price and the $119 millionnet carrying amount of Senior Notes we repurchased during the period. The $5 million impairment of equity securities in 2009 reflected an other-than-temporary impairment of marketable securities in accordance with the guidance for accounting for certain investments in debt and equity securities. Foradditional information on the impairment, see Footnote No. 5, “Fair Value Measurements,” of the Notes to the Financial Statements in our 2009 Form 10-K.
2009 Compared to 2008See the previous paragraph for information on our debt extinguishment and impairment of equity securities in 2009. We did not extinguish any debt in
2008.
Interest Expense2010 Compared to 2009
Interest expense increased by $62 million (53 percent) to $180 million in 2010 compared to $118 million in 2009. This increase was driven by: (1) theconsolidation of $1,121 million of debt in the 2010 first quarter associated with previously securitized notes, which resulted in a $55 million increase ininterest expense in 2010 related to that debt; (2) a $14 million unfavorable variance from 2009 as a result of lower capitalized interest in 2010 associatedwith construction projects; and (3) $12 million of higher interest expense in 2010 associated with our executive deferred compensation plan. These increaseswere partially offset by: (1) $12 million of lower interest expense associated with our repurchase of $122 million of principal amount of our Senior Notes in2009, the maturity of our Series C Senior Notes in the 2009 fourth quarter and other net debt reductions; and (2) a $7 million decrease in interest expenseassociated with our $2.4 billion multicurrency revolving credit facility (our “Credit Facility”), which primarily reflected lower average borrowings.
2009 Compared to 2008Interest expense decreased by $45 million (28 percent) to $118 million in 2009 compared to $163 million in 2008. Interest expense associated with
commercial paper and our Credit Facility decreased by $25 million reflecting the repayment of our commercial paper in 2008 and increased borrowingsunder the Credit Facility with a lower interest rate. We also benefited from a $26 million decrease in interest costs associated with various programs that weoperate on behalf of owners (including our Marriott Rewards, gift certificates, and self-insurance programs) as a result of lower interest rates, and therepurchase of some of our Senior Notes across multiple series in the 2008 fourth quarter and 2009 first quarter (see “Liquidity and Capital Resources” in our2009 Form 10-K for additional information), which resulted in a $12 million reduction to interest expense, and finally, other interest expense decreases of $5million. These decreases in interest expense were partially offset by a $23 million unfavorable variance to 2008 as a result of lower capitalized interest in2009 associated with construction projects.
Interest Income and Income Tax2010 Compared to 2009
Interest income decreased by $6 million (24 percent) to $19 million in 2010, from $25 million in 2009, primarily reflecting a $4 million decreaseassociated with a loan that we determined was impaired in 2009. Because we recognize
31
Table of Contents
interest on impaired loans on a cash basis, we did not recognize any interest on this loan after its impairment. The decline in interest income also reflected a$2 million decrease due to a reduction in principal due associated with one loan.
Our income tax expense increased by $158 million (243 percent) to a provision of $93 million in 2010 from a benefit of $65 million in 2009. Theincrease was primarily due to pretax income in 2010 (as compared to a pretax loss in 2009) and $14 million of higher tax expense associated with changes toour deferred compensation plan (there were no 2010 plan changes impacting deferred compensation expenses, compared with changes which had a $14million favorable impact in 2009). The increase was partially offset by a lower tax rate in 2010, as 2009 reflected $52 million of income tax expenseprimarily related to the treatment of funds received from certain non-U.S. subsidiaries. In the 2010 fourth quarter, we settled issues with the Internal RevenueService (“IRS”) on our treatment of funds received from certain non-U.S. subsidiaries. In conjunction with that settlement, we recorded an $85 million benefitto our income tax provision in 2010. Our 2010 income tax expense also reflected a $12 million benefit we recorded primarily associated with revisions toprior years’ estimated foreign tax expense.
2009 Compared to 2008Interest income decreased by $14 million (36 percent) to $25 million in 2009, from $39 million in 2008, primarily reflecting $8 million of interest
income we recorded in 2008 for three loans that subsequently became impaired. Because we recognize interest on impaired loans on a cash basis, we did notrecognize any interest on these impaired loans in 2009. The decline in interest income also reflected $5 million of lower interest income due to a decline ininterest rates on our cash balances, $2 million of previously reserved interest income collected in 2008, and $2 million of lower interest income in 2009reflecting a reduction in principal due associated with one loan, partially offset by $4 million of additional interest income from new loans funded at year-end 2008 and in 2009.
Our tax provision decreased by $415 million (119 percent) to a benefit of $65 million in 2009 from a provision of $350 million in 2008, reflecting apretax loss in 2009 and $43 million of lower tax expense associated with our deferred compensation plan. The decrease was partially offset by an increase tothe effective tax rate in 2009 due to a change in our mix of worldwide income resulting from substantial reductions of non-U.S. income in jurisdictions withlow tax rates. The 2009 tax rate also reflected $52 million of income tax expense, primarily related to the treatment of funds received from certain non-U.S.subsidiaries, an issue that was the subject of ongoing discussions at that time between us and the IRS. The charges recorded in 2009 primarily related to ourthen current exposure related to this issue. In addition to tax expense on pretax earnings, tax expense for 2008 also reflected: (1) $29 million of income taxexpense primarily related to an unfavorable U.S. Court of Federal Claims decision involving a refund claim associated with a 1994 tax planning transaction;(2) $19 million of income tax expense due primarily to prior years’ tax adjustments, including a settlement with the IRS that resulted in a lower than expectedrefund of taxes associated with a 1995 leasing transaction; and (3) $24 million of income tax expense related to the tax treatment of funds received fromcertain non-U.S. subsidiaries.
Equity in (Losses) Earnings2010 Compared to 2009
Equity in losses of $18 million in 2010 decreased by $48 million from equity in losses of $66 million in 2009 and primarily reflected favorablevariances from a $30 million impairment charge associated with a Luxury segment joint venture investment that we determined was fully impaired and a $3million impairment charge for a joint venture that we did not allocate to one of our segments, both incurred in 2009. In the 2010 fourth quarter we alsorecorded an $11 million reversal of a funding liability (recorded in 2009) due to progress in that quarter on certain construction-related legal claims and otherfactors. See Footnote No. 18, “Timeshare Strategy-Impairment Charges,” of the Notes to our Financial Statements for additional information regarding thisreversal. Increased earnings of $5 million for our International segment joint ventures and $3 million of lower cancellation reserves at our Timeshare segmentjoint venture also contributed to the decrease in equity in losses. A 2010 impairment charge of $5 million associated with our North American Limited-Service segment joint venture partially offset the favorable impacts.
2009 Compared to 2008Equity in losses of $66 million in 2009 increased by $81 million from equity in earnings of $15 million in 2008 and primarily reflected a $30 million
impairment charge in 2009 associated with a Luxury segment joint venture investment that we determined to be fully impaired. The decrease in joint ventureequity earnings also reflected an unfavorable comparison to $15 million of equity earnings in 2008 from a joint venture that sold portfolio assets and hadsignificant associated gains, and $5 million of earnings in 2008 from another joint venture primarily reflecting insurance proceeds received by that jointventure. Further contributing to the decline were $24 million of decreased earnings in 2009 for a Timeshare segment joint venture residential and fractionalproject, $7 million of equity losses associated with a North American Limited-Service segment joint venture, a $3 million impairment and $2 million of otherequity losses associated with an International segment joint venture, and $9 million of equity losses at certain other joint ventures, all of which werenegatively affected by the weak demand environment. The unfavorable impacts also included a $3 million impairment
32
Table of Contents
charge for a joint venture that is not allocated to one of our segments and for which we do not expect to recover our investment. These decreases werepartially offset by an unfavorable $11 million impact in 2008 associated with tax law changes in a country in which two international joint ventures operateand a 2008 impairment charge of $9 million associated with one Luxury segment joint venture under development. See Footnote No. 21, “RestructuringCosts and Other Charges,” of the Notes to the Financial Statements in our 2009 Form 10-K for more information on some of these joint venture impairments.
Net Losses Attributable to Noncontrolling Interests2010 Compared to 2009
Net losses attributable to noncontrolling interests decreased by $7 million in 2010 to zero, compared to $7 million in 2009. The benefit for net lossesattributable to noncontrolling interests in 2009 of $7 million are net of tax and reflected our partners’ share of losses totaling $11 million associated withjoint ventures we consolidate, net of our partners’ share of tax benefits of $4 million associated with the losses.
2009 Compared to 2008Net losses attributable to noncontrolling interests decreased by $8 million in 2009 to $7 million compared to $15 million in 2008.
Income (Loss) from Continuing Operations2010 Compared to 2009
Income from continuing operations of $458 million in 2010 increased by $811 million (230 percent) from a loss of $353 million in 2009, income fromcontinuing operations attributable to Marriott of $458 million in 2010 increased by $804 million (232 percent) from a loss of $346 million in 2009, anddiluted income per share from continuing operations attributable to Marriott of $1.21 per share increased by $2.18 (225 percent) from losses of $0.97 pershare in 2009. As discussed in more detail in the preceding sections beginning with “Operating Income (Loss),” the $458 million increase in income fromcontinuing operations compared to the prior year was due to a favorable variance related to Timeshare strategy-impairment charges in 2009 ($752 million),higher Timeshare sales and services revenue net of direct expenses ($116 million), lower restructuring costs ($51 million), higher base management andfranchise fees ($73 million), lower equity in losses ($48 million), higher incentive management fees ($28 million), higher owned, leased, corporate housing,and other revenue net of direct expenses ($23 million), and higher gains and other income ($4 million). These favorable variances were partially offset byhigher income taxes ($158 million), higher general, administrative, and other expenses ($58 million), higher interest expense ($62 million), and lowerinterest income ($6 million).
2009 Compared to 2008Compared to the prior year, loss from continuing operations increased by $697 million (203 percent) to a 2009 loss of $353 million from 2008 income
of $344 million, loss from continuing operations attributable to Marriott increased by $705 million (196 percent) to a 2009 loss of $346 million from 2008income of $359 million, and diluted losses per share from continuing operations attributable to Marriott increased by $1.94 (200 percent) to $0.97 per sharefrom earnings of $0.97 per share. As discussed in more detail in the preceding sections beginning with “Operating Income (Loss),” the $697 million increasein loss from continuing operations compared to the prior year was due to 2009 Timeshare strategy-impairment charges ($752 million), lower incentivemanagement fees ($157 million), lower base management and franchise fees ($156 million), lower equity in earnings ($81 million), lower owned, leased,corporate housing, and other revenue net of direct expenses ($69 million), lower interest income ($14 million), lower gains and other income ($7 million),and lower Timeshare sales and services revenue net of direct expenses ($6 million). Lower income taxes ($415 million), lower general, administrative, andother expenses ($81 million), lower interest expense ($45 million), and lower restructuring costs ($4 million) partially offset the unfavorable variances.
Earnings Before Interest Expense, Taxes, Depreciation and Amortization (“EBITDA”) and Adjusted EBITDAEBITDA, a financial measure which is not prescribed or authorized by United States generally accepted accounting principles (“GAAP”), reflects
earnings excluding the impact of interest expense, provision for income taxes, depreciation and amortization. We consider EBITDA to be an indicator ofoperating performance because we use it to measure our ability to service debt, fund capital expenditures, and expand our business. We also use EBITDA, asdo analysts, lenders, investors and others, to evaluate companies because it excludes certain items that can vary widely across different industries or amongcompanies within the same industry. For example, interest expense can be dependent on a company’s capital structure, debt levels and credit ratings.Accordingly, the impact of interest expense on earnings can vary significantly among companies. The tax positions of companies can also vary because oftheir differing abilities to take advantage of tax benefits and because of the tax policies of the jurisdictions in which they operate. As a result, effective taxrates and provision for income taxes can vary considerably among companies. EBITDA also excludes depreciation and
33
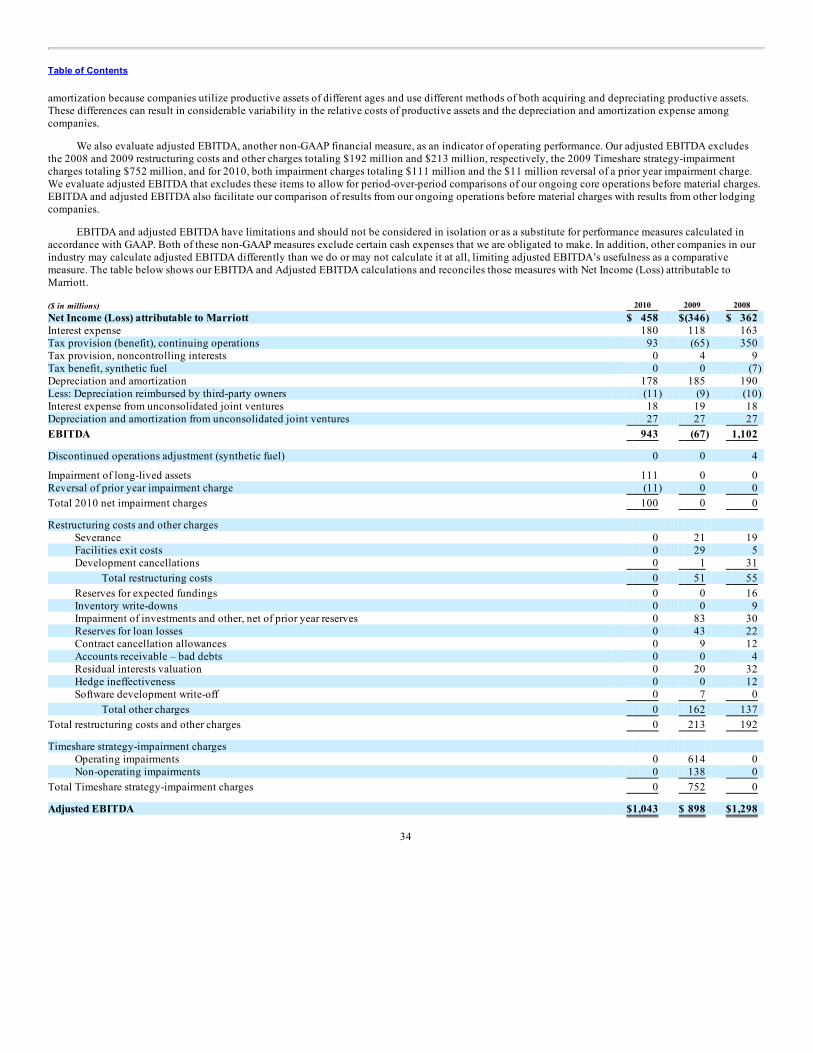
Table of Contents
amortization because companies utilize productive assets of different ages and use different methods of both acquiring and depreciating productive assets.These differences can result in considerable variability in the relative costs of productive assets and the depreciation and amortization expense amongcompanies.
We also evaluate adjusted EBITDA, another non-GAAP financial measure, as an indicator of operating performance. Our adjusted EBITDA excludesthe 2008 and 2009 restructuring costs and other charges totaling $192 million and $213 million, respectively, the 2009 Timeshare strategy-impairmentcharges totaling $752 million, and for 2010, both impairment charges totaling $111 million and the $11 million reversal of a prior year impairment charge.We evaluate adjusted EBITDA that excludes these items to allow for period-over-period comparisons of our ongoing core operations before material charges.EBITDA and adjusted EBITDA also facilitate our comparison of results from our ongoing operations before material charges with results from other lodgingcompanies.
EBITDA and adjusted EBITDA have limitations and should not be considered in isolation or as a substitute for performance measures calculated inaccordance with GAAP. Both of these non-GAAP measures exclude certain cash expenses that we are obligated to make. In addition, other companies in ourindustry may calculate adjusted EBITDA differently than we do or may not calculate it at all, limiting adjusted EBITDA’s usefulness as a comparativemeasure. The table below shows our EBITDA and Adjusted EBITDA calculations and reconciles those measures with Net Income (Loss) attributable toMarriott. ($ in millions) 2010 2009 2008 Net Income (Loss) attributable to Marriott $ 458 $(346) $ 362 Interest expense 180 118 163 Tax provision (benefit), continuing operations 93 (65) 350 Tax provision, noncontrolling interests 0 4 9 Tax benefit, synthetic fuel 0 0 (7) Depreciation and amortization 178 185 190 Less: Depreciation reimbursed by third-party owners (11) (9) (10) Interest expense from unconsolidated joint ventures 18 19 18 Depreciation and amortization from unconsolidated joint ventures 27 27 27 EBITDA 943 (67) 1,102
Discontinued operations adjustment (synthetic fuel) 0 0 4
Impairment of long-lived assets 111 0 0 Reversal of prior year impairment charge (11) 0 0 Total 2010 net impairment charges 100 0 0
Restructuring costs and other charges Severance 0 21 19 Facilities exit costs 0 29 5 Development cancellations 0 1 31
Total restructuring costs 0 51 55 Reserves for expected fundings 0 0 16 Inventory write-downs 0 0 9 Impairment of investments and other, net of prior year reserves 0 83 30 Reserves for loan losses 0 43 22 Contract cancellation allowances 0 9 12 Accounts receivable – bad debts 0 0 4 Residual interests valuation 0 20 32 Hedge ineffectiveness 0 0 12 Software development write-off 0 7 0
Total other charges 0 162 137 Total restructuring costs and other charges 0 213 192
Timeshare strategy-impairment charges Operating impairments 0 614 0 Non-operating impairments 0 138 0
Total Timeshare strategy-impairment charges 0 752 0
Adjusted EBITDA $1,043 $ 898 $1,298
34
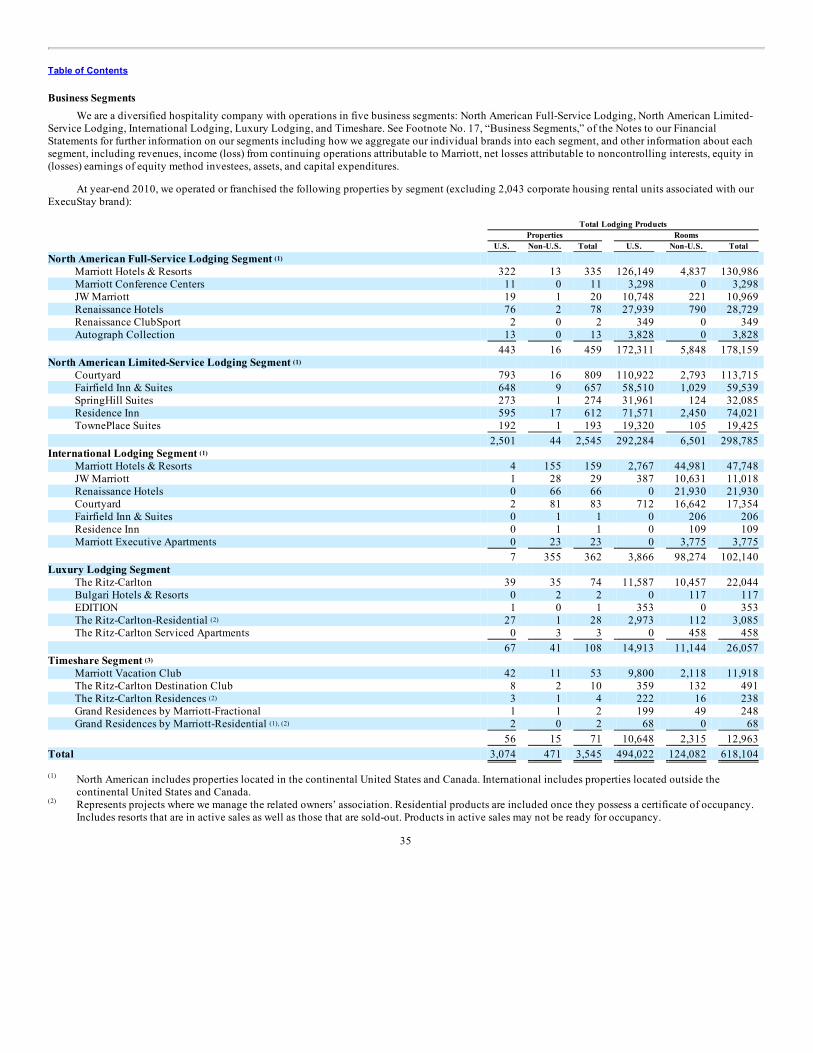
Table of Contents
Business SegmentsWe are a diversified hospitality company with operations in five business segments: North American Full-Service Lodging, North American Limited-
Service Lodging, International Lodging, Luxury Lodging, and Timeshare. See Footnote No. 17, “Business Segments,” of the Notes to our FinancialStatements for further information on our segments including how we aggregate our individual brands into each segment, and other information about eachsegment, including revenues, income (loss) from continuing operations attributable to Marriott, net losses attributable to noncontrolling interests, equity in(losses) earnings of equity method investees, assets, and capital expenditures.
At year-end 2010, we operated or franchised the following properties by segment (excluding 2,043 corporate housing rental units associated with ourExecuStay brand): Total Lodging Products Properties Rooms U.S. Non-U.S. Total U.S. Non-U.S. Total North American Full-Service Lodging Segment
Marriott Hotels & Resorts 322 13 335 126,149 4,837 130,986 Marriott Conference Centers 11 0 11 3,298 0 3,298 JW Marriott 19 1 20 10,748 221 10,969 Renaissance Hotels 76 2 78 27,939 790 28,729 Renaissance ClubSport 2 0 2 349 0 349 Autograph Collection 13 0 13 3,828 0 3,828
443 16 459 172,311 5,848 178,159 North American Limited-Service Lodging Segment
Courtyard 793 16 809 110,922 2,793 113,715 Fairfield Inn & Suites 648 9 657 58,510 1,029 59,539 SpringHill Suites 273 1 274 31,961 124 32,085 Residence Inn 595 17 612 71,571 2,450 74,021 TownePlace Suites 192 1 193 19,320 105 19,425
2,501 44 2,545 292,284 6,501 298,785 International Lodging Segment
Marriott Hotels & Resorts 4 155 159 2,767 44,981 47,748 JW Marriott 1 28 29 387 10,631 11,018 Renaissance Hotels 0 66 66 0 21,930 21,930 Courtyard 2 81 83 712 16,642 17,354 Fairfield Inn & Suites 0 1 1 0 206 206 Residence Inn 0 1 1 0 109 109 Marriott Executive Apartments 0 23 23 0 3,775 3,775
7 355 362 3,866 98,274 102,140 Luxury Lodging Segment
The Ritz-Carlton 39 35 74 11,587 10,457 22,044 Bulgari Hotels & Resorts 0 2 2 0 117 117 EDITION 1 0 1 353 0 353 The Ritz-Carlton-Residential 27 1 28 2,973 112 3,085 The Ritz-Carlton Serviced Apartments 0 3 3 0 458 458
67 41 108 14,913 11,144 26,057 Timeshare Segment
Marriott Vacation Club 42 11 53 9,800 2,118 11,918 The Ritz-Carlton Destination Club 8 2 10 359 132 491 The Ritz-Carlton Residences 3 1 4 222 16 238 Grand Residences by Marriott-Fractional 1 1 2 199 49 248 Grand Residences by Marriott-Residential 2 0 2 68 0 68
56 15 71 10,648 2,315 12,963 Total 3,074 471 3,545 494,022 124,082 618,104
North American includes properties located in the continental United States and Canada. International includes properties located outside thecontinental United States and Canada.Represents projects where we manage the related owners’ association. Residential products are included once they possess a certificate of occupancy.Includes resorts that are in active sales as well as those that are sold-out. Products in active sales may not be ready for occupancy.
35
(1)
(1)
(1)
(2)
(3)
(2)
(1), (2)
(1)
(2)
Table of Contents
Lodging (reflects all five of our Lodging segments)2010 Compared to 2009
We added 154 properties (28,114 rooms) and 31 properties (6,072 rooms) exited the system in 2010. These figures do not include residential orExecuStay units. We also added three residential properties (442 units) and one residential property (25 units) exited the system in 2010.
Total segment financial results increased by $979 million to $983 million in 2010 from $4 million in 2009, and total segment revenues increased by$780 million to $11,611 million in 2010, a 7 percent increase from revenues of $10,831 million in 2009.
The year-over-year increase in revenues included a $557 million increase in cost reimbursements revenue, which does not impact operating income ornet income attributable to Marriott. The results, compared to 2009, reflected a favorable variance from $685 million of 2009 Timeshare strategy-impairmentcharges, $614 million of which were reported in the “Timeshare strategy-impairment charges” caption and $71 million of which were reported in the“Timeshare strategy-impairment charges (non-operating)” caption of our Income Statements, an increase of $116 million in Timeshare sales and servicesrevenue net of direct expenses, $19 million of decreased general, administrative, and other expenses, a $73 million increase in base management andfranchise fees to $1,003 million in 2010 from $930 million in 2009, a $48 million decrease in restructuring costs, $35 million of lower joint venture equitylosses, $28 million of higher incentive management fees to $182 million in 2010 from $154 million in 2009, an increase of $21 million in owned, leased,corporate housing, and other revenue net of direct expenses, and a $21 million increase in gains and other income. These favorable variances were partiallyoffset by $55 million of increased interest expense and an $11 million decrease in net losses attributable to noncontrolling interest benefit. For more detailedinformation regarding the variances see the preceding sections beginning with “Operating Income (Loss).”
In 2010, 27 percent of our managed properties paid incentive management fees to us versus 25 percent in 2009. In addition, in 2010, 65 percent of ourincentive fees were derived from properties outside of the continental United States versus 67 percent in 2009.
See “Statistics” below for detailed information on Systemwide RevPAR and Company-operated RevPAR by segment, region and brand.
Compared to 2009, worldwide comparable company-operated house profit margins in 2010 increased by 50 basis points and worldwide comparablecompany-operated house profit per available room (“HP-PAR”) increased by 6.4 percent on a constant U.S. dollar basis, reflecting the impact of tight costcontrols in 2010 at properties in our system and increased demand, partially offset by decreased average daily rates. North American company-operated houseprofit margins were nearly unchanged as compared to 2009 while HP-PAR at those same properties increased by 3.8 percent reflecting increased demand andtight cost controls at properties, partially offset by decreased average daily rates and lower cancellation and attrition fees. International company-operatedhouse profit margins increased by 120 basis points and HP-PAR at those properties increased by 10.6 percent reflecting increased demand and continuedtight property-level cost controls.
2009 Compared to 2008We added 254 properties (37,714 rooms) and 17 properties (3,476 rooms) exited the system in 2009. These figures do not include residential or
ExecuStay units. We also added five residential properties (568 units) in 2009.
Total segment financial results decreased by $1,162 million (100 percent) to $4 million in 2009 from $1,166 million in 2008, and total segmentrevenues decreased by $1,986 million to $10,831 million in 2009, a 15 percent decrease from total segment revenues of $12,817 million in 2008. Asdiscussed in more detail earlier in this report, demand was weaker in 2009 than 2008.
The decrease in revenues included a $1,152 million decrease in cost reimbursements revenue, which does not impact operating income or net incomeattributable to Marriott. The results, compared to 2008, reflected $685 million of Timeshare impairment charges ($614 million of which were reported in the“Timeshare strategy-impairment charges” caption and $71 million of which we reported in the “Timeshare strategy-impairment charges (non-operating)”caption of our Income Statements. See the “Timeshare strategy-impairment charges” section for more information on the impairments), $157 million of lowerincentive management fees, a $156 million decrease in combined 2009 base management and franchise fees, $85 million of owned, leased, corporatehousing, and other revenue net of direct expenses, $63 million of lower equity joint venture results, $18 million of higher restructuring costs, a $13 milliondecrease in net losses attributable to a noncontrolling interests benefit, a decrease of $9 million in gains and other income, and a decrease
36
Table of Contents
of $6 million in Timeshare sales and services revenue net of direct expenses, partially offset by $30 million of decreased general, administrative, and otherexpenses. These decreases included $80 million in other charges (see Footnote No. 21, “Restructuring Costs and Other Charges,” of the Notes to the FinancialStatements in our 2009 Form 10-K), with $57 million recorded in general, administrative, and other expenses and $23 million recorded in Timeshare salesand services revenue net of direct expenses.
The $156 million decrease in combined base management and franchise fees reflected lower demand and significantly lower RevPAR in 2009.Incentive management fees decreased by $157 million and reflected lower property-level operating revenues and margins associated with weak demand,somewhat offset by property-level cost controls. With lower property-level operating income, many managed properties did not earn sufficient income toachieve owner priority returns and, as a result, we earned no incentive fees from those properties. In 2009, 67 percent of our incentive fees were derived fromhotels outside North America versus 49 percent in 2008.
Compared to 2008, worldwide comparable company-operated house profit margins in 2009 decreased by 380 basis points and worldwide comparablecompany-operated HP-PAR decreased by 25.7 percent on a constant U.S. dollar basis, reflecting the impact of very tight cost control plans in 2009 atproperties in our system, more than offset by the impact of year-over-year RevPAR decreases. International company-operated house profit margins declinedby 270 basis points, and HP-PAR at our International managed properties decreased by 22.0 percent reflecting significant cost control plans at properties,more than offset by the impact of decreased demand. North American company-operated house profit margins declined by 440 basis points, and HP-PAR atour North American managed properties decreased by 27.7 percent also reflecting significant cost control plans at properties, more than offset by the impactof decreased demand. HP-PAR at our North American Limited-Service managed properties decreased by 28.7 percent, reflecting cost control plans atproperties, more than offset by the impact of decreased demand.
Lodging DevelopmentWe opened 154 properties, totaling 28,114 rooms, across our brands in 2010 and 31 properties (6,072 rooms) left the system, not including residential
products or ExecuStay. We also added three residential properties (442 units) and one residential property (25 units) left the system. Highlights of the yearincluded:
• Converting 23 properties (3,660 rooms), or 13 percent of our gross room additions for the year, to one of our brands including 11 propertiesjoining our Autograph Collection brand. Twenty-two of the properties converted were located in the United States;
• Opening approximately 28 percent of all the new rooms outside the United States;
• Adding 102 properties (12,030 rooms) to our North American Limited-Service brands;
• Opening three new Marriott Vacation Club properties, one in Singer Island, Florida, one in Orlando, Florida, and one in Kauai, Hawaii. We alsoopened one Ritz-Carlton Destination Club property in Vail, Colorado; and
• Opening our first EDITION hotel in Waikiki, Hawaii (353 rooms).
We currently have nearly 105,000 hotel rooms under construction, awaiting conversion, or approved for development in our hotel developmentpipeline and we expect to add approximately 35,000 hotel rooms (gross) to our system in 2011.
We believe that we have access to sufficient financial resources to finance our growth, as well as to support our ongoing operations and meet debtservice and other cash requirements. Nonetheless, our ability to develop and update our brands and the ability of hotel developers to build or acquire newMarriott-branded properties, both of which are important parts of our growth plan, depend in part on capital access, availability and cost for other hoteldevelopers and third-party owners. These growth plans are subject to numerous risks and uncertainties, many of which are outside of our control. See the“Forward-Looking Statements” and “Risks and Uncertainties” captions earlier in this report and the “Liquidity and Capital Resources” caption later in thisreport.
StatisticsThe following tables show occupancy, average daily rate, and RevPAR for comparable properties, for each of the brands in our North American Full-
Service and North American Limited-Service segments, for our International segment by region, and the principal brand in our Luxury segment, The Ritz-Carlton. We have not presented statistics for company-operated Fairfield Inn & Suites properties in these tables because the brand is predominantlyfranchised and we operate very few properties, so such information would not be meaningful (identified as “nm” in the tables that follow).
37

Table of Contents
Systemwide statistics include data from our franchised properties, in addition to our owned, leased, and managed properties.
The occupancy, average daily rate, and RevPAR statistics used throughout this report for 2010 include the 52 weeks from January 2, 2010, throughDecember 31, 2010, for 2009 include the 52 weeks from January 3, 2009, through January 1, 2010, and for 2008 include the 53 weeks from December 29,2007, through January 2, 2009 (except in each case, for The Ritz-Carlton brand properties and properties located outside of the continental United States andCanada, which for them includes the period from January 1 through December 31 for each year).
38
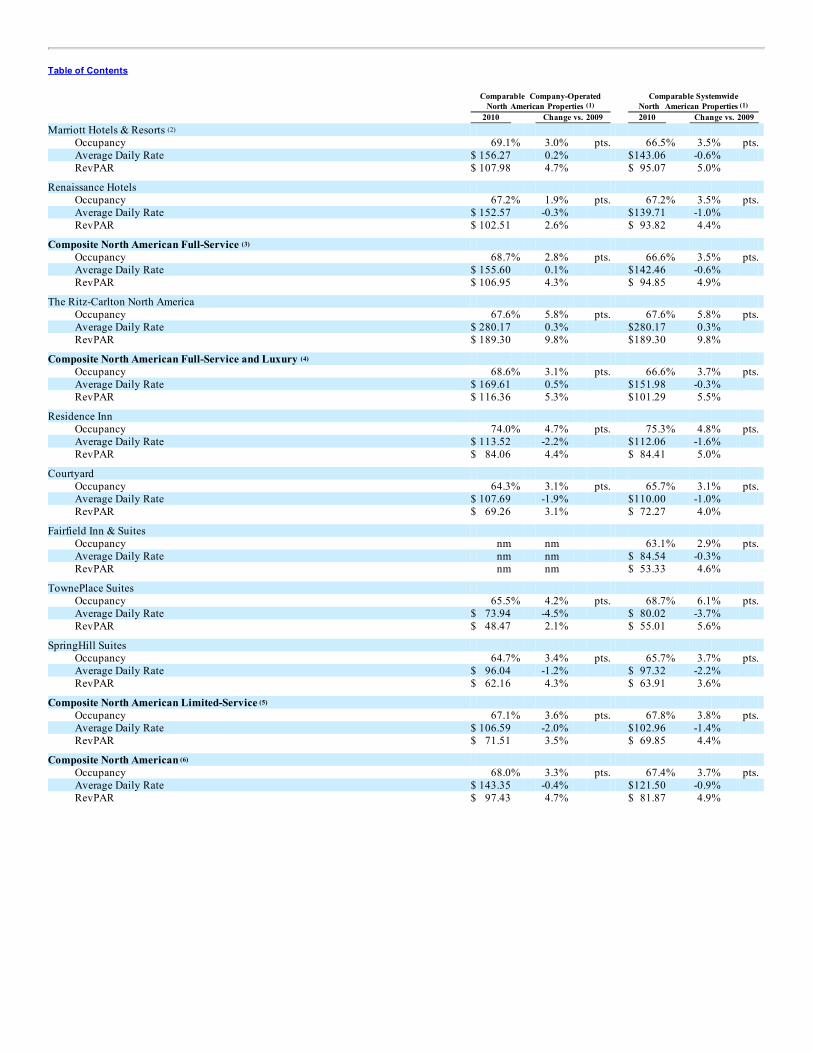
Table of Contents
Comparable Company-Operated
North American Properties Comparable Systemwide
North American Properties 2010 Change vs. 2009 2010 Change vs. 2009 Marriott Hotels & Resorts
Occupancy 69.1% 3.0% pts. 66.5% 3.5% pts. Average Daily Rate $ 156.27 0.2% $143.06 -0.6% RevPAR $ 107.98 4.7% $ 95.07 5.0%
Renaissance Hotels Occupancy 67.2% 1.9% pts. 67.2% 3.5% pts. Average Daily Rate $ 152.57 -0.3% $139.71 -1.0% RevPAR $ 102.51 2.6% $ 93.82 4.4%
Composite North American Full-Service Occupancy 68.7% 2.8% pts. 66.6% 3.5% pts. Average Daily Rate $ 155.60 0.1% $142.46 -0.6% RevPAR $ 106.95 4.3% $ 94.85 4.9%
The Ritz-Carlton North America Occupancy 67.6% 5.8% pts. 67.6% 5.8% pts. Average Daily Rate $ 280.17 0.3% $280.17 0.3% RevPAR $ 189.30 9.8% $189.30 9.8%
Composite North American Full-Service and Luxury Occupancy 68.6% 3.1% pts. 66.6% 3.7% pts. Average Daily Rate $ 169.61 0.5% $151.98 -0.3% RevPAR $ 116.36 5.3% $101.29 5.5%
Residence Inn Occupancy 74.0% 4.7% pts. 75.3% 4.8% pts. Average Daily Rate $ 113.52 -2.2% $112.06 -1.6% RevPAR $ 84.06 4.4% $ 84.41 5.0%
Courtyard Occupancy 64.3% 3.1% pts. 65.7% 3.1% pts. Average Daily Rate $ 107.69 -1.9% $110.00 -1.0% RevPAR $ 69.26 3.1% $ 72.27 4.0%
Fairfield Inn & Suites Occupancy nm nm 63.1% 2.9% pts. Average Daily Rate nm nm $ 84.54 -0.3% RevPAR nm nm $ 53.33 4.6%
TownePlace Suites Occupancy 65.5% 4.2% pts. 68.7% 6.1% pts. Average Daily Rate $ 73.94 -4.5% $ 80.02 -3.7% RevPAR $ 48.47 2.1% $ 55.01 5.6%
SpringHill Suites Occupancy 64.7% 3.4% pts. 65.7% 3.7% pts. Average Daily Rate $ 96.04 -1.2% $ 97.32 -2.2% RevPAR $ 62.16 4.3% $ 63.91 3.6%
Composite North American Limited-Service Occupancy 67.1% 3.6% pts. 67.8% 3.8% pts. Average Daily Rate $ 106.59 -2.0% $102.96 -1.4% RevPAR $ 71.51 3.5% $ 69.85 4.4%
Composite North American Occupancy 68.0% 3.3% pts. 67.4% 3.7% pts. Average Daily Rate $ 143.35 -0.4% $121.50 -0.9% RevPAR $ 97.43 4.7% $ 81.87 4.9%
(1) (1)
(2)
(3)
(4)
(5)
(6)

Statistics are for the 52 weeks ended December 31, 2010, and January 1, 2010, except for The Ritz-Carlton for which the statistics are for the 12 monthsended December 31, 2010, and December 31, 2009. North American statistics represent properties located in the continental United States.Marriott Hotels & Resorts includes JW Marriott properties.Composite North American Full-Service statistics include Marriott Hotels & Resorts and Renaissance Hotels properties.Composite North American Full-Service and Luxury includes Marriott Hotels & Resorts, Renaissance Hotels, and The Ritz-Carlton properties.Composite North American Limited-Service statistics include Residence Inn, Courtyard, Fairfield Inn & Suites, TownePlace Suites, and SpringHillSuites properties.Composite North American statistics include Marriott Hotels & Resorts, Renaissance Hotels, Residence Inn, Courtyard, Fairfield Inn & Suites,TownePlace Suites, SpringHill Suites, and The Ritz-Carlton properties.
39
(1)
(2)
(3)
(4)
(5)
(6)
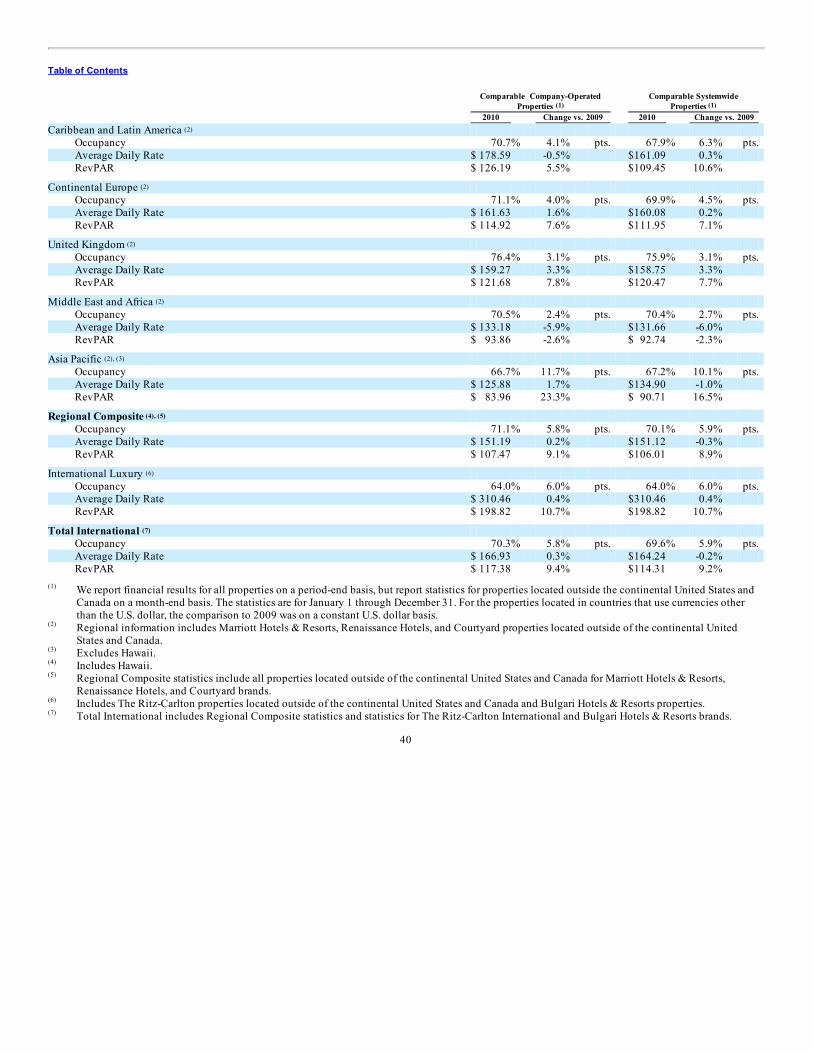
Table of Contents
Comparable Company-Operated
Properties Comparable Systemwide
Properties 2010 Change vs. 2009 2010 Change vs. 2009 Caribbean and Latin America
Occupancy 70.7% 4.1% pts. 67.9% 6.3% pts. Average Daily Rate $ 178.59 -0.5% $161.09 0.3% RevPAR $ 126.19 5.5% $109.45 10.6%
Continental Europe Occupancy 71.1% 4.0% pts. 69.9% 4.5% pts. Average Daily Rate $ 161.63 1.6% $160.08 0.2% RevPAR $ 114.92 7.6% $111.95 7.1%
United Kingdom Occupancy 76.4% 3.1% pts. 75.9% 3.1% pts. Average Daily Rate $ 159.27 3.3% $158.75 3.3% RevPAR $ 121.68 7.8% $120.47 7.7%
Middle East and Africa Occupancy 70.5% 2.4% pts. 70.4% 2.7% pts. Average Daily Rate $ 133.18 -5.9% $131.66 -6.0% RevPAR $ 93.86 -2.6% $ 92.74 -2.3%
Asia Pacific Occupancy 66.7% 11.7% pts. 67.2% 10.1% pts. Average Daily Rate $ 125.88 1.7% $134.90 -1.0% RevPAR $ 83.96 23.3% $ 90.71 16.5%
Regional Composite Occupancy 71.1% 5.8% pts. 70.1% 5.9% pts. Average Daily Rate $ 151.19 0.2% $151.12 -0.3% RevPAR $ 107.47 9.1% $106.01 8.9%
International Luxury Occupancy 64.0% 6.0% pts. 64.0% 6.0% pts. Average Daily Rate $ 310.46 0.4% $310.46 0.4% RevPAR $ 198.82 10.7% $198.82 10.7%
Total International Occupancy 70.3% 5.8% pts. 69.6% 5.9% pts. Average Daily Rate $ 166.93 0.3% $164.24 -0.2% RevPAR $ 117.38 9.4% $114.31 9.2%
We report financial results for all properties on a period-end basis, but report statistics for properties located outside the continental United States andCanada on a month-end basis. The statistics are for January 1 through December 31. For the properties located in countries that use currencies otherthan the U.S. dollar, the comparison to 2009 was on a constant U.S. dollar basis.Regional information includes Marriott Hotels & Resorts, Renaissance Hotels, and Courtyard properties located outside of the continental UnitedStates and Canada.Excludes Hawaii.Includes Hawaii.Regional Composite statistics include all properties located outside of the continental United States and Canada for Marriott Hotels & Resorts,Renaissance Hotels, and Courtyard brands.Includes The Ritz-Carlton properties located outside of the continental United States and Canada and Bulgari Hotels & Resorts properties.Total International includes Regional Composite statistics and statistics for The Ritz-Carlton International and Bulgari Hotels & Resorts brands.
40
(1) (1)
(2)
(2)
(2)
(2)
(2), (3)
(4), (5)
(6)
(7)
(1)
(2)
(3)
(4)
(5)
(6)
(7)
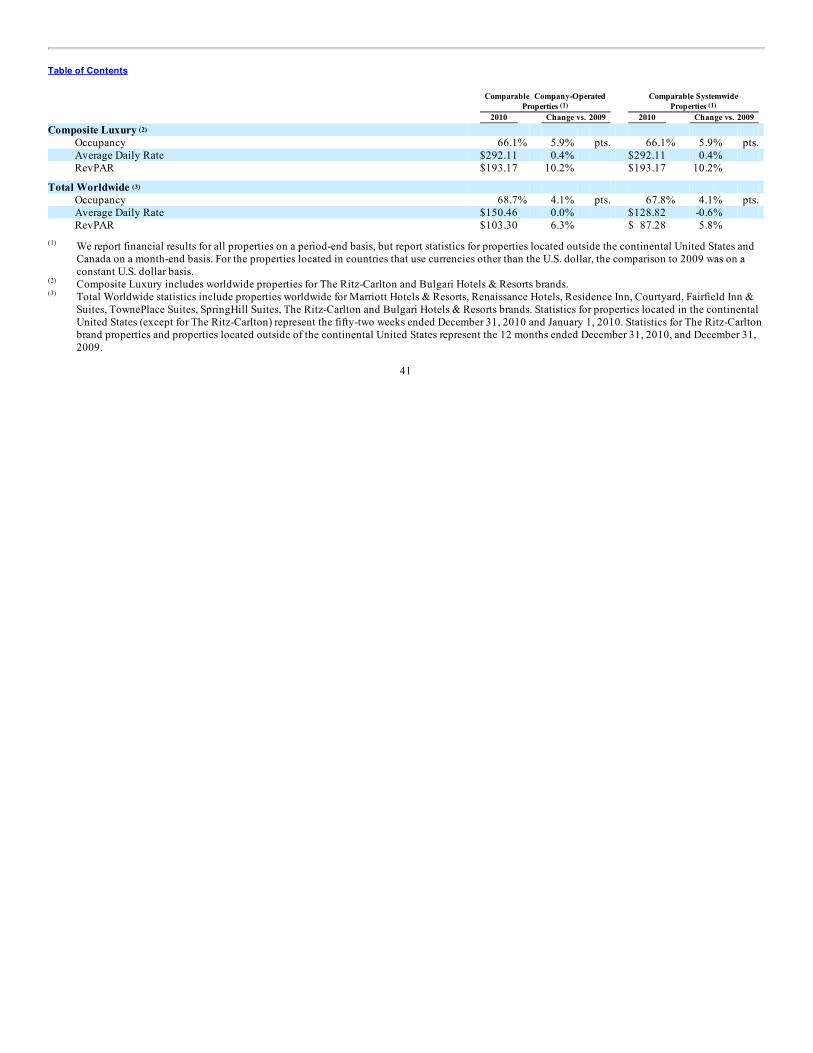
Table of Contents
Comparable Company-Operated
Properties Comparable Systemwide
Properties 2010 Change vs. 2009 2010 Change vs. 2009 Composite Luxury
Occupancy 66.1% 5.9% pts. 66.1% 5.9% pts. Average Daily Rate $292.11 0.4% $292.11 0.4% RevPAR $193.17 10.2% $193.17 10.2%
Total Worldwide Occupancy 68.7% 4.1% pts. 67.8% 4.1% pts. Average Daily Rate $150.46 0.0% $128.82 -0.6% RevPAR $103.30 6.3% $ 87.28 5.8%
We report financial results for all properties on a period-end basis, but report statistics for properties located outside the continental United States andCanada on a month-end basis. For the properties located in countries that use currencies other than the U.S. dollar, the comparison to 2009 was on aconstant U.S. dollar basis.Composite Luxury includes worldwide properties for The Ritz-Carlton and Bulgari Hotels & Resorts brands.Total Worldwide statistics include properties worldwide for Marriott Hotels & Resorts, Renaissance Hotels, Residence Inn, Courtyard, Fairfield Inn &Suites, TownePlace Suites, SpringHill Suites, The Ritz-Carlton and Bulgari Hotels & Resorts brands. Statistics for properties located in the continentalUnited States (except for The Ritz-Carlton) represent the fifty-two weeks ended December 31, 2010 and January 1, 2010. Statistics for The Ritz-Carltonbrand properties and properties located outside of the continental United States represent the 12 months ended December 31, 2010, and December 31,2009.
41
(1) (1)
(2)
(3)
(1)
(2)
(3)

Table of Contents
Comparable Company-Operated
North American Properties Comparable Systemwide
North American Properties 2009 Change vs. 2008 2009 Change vs. 2008 Marriott Hotels & Resorts
Occupancy 66.3% -4.3% pts. 63.4% -4.6% pts. Average Daily Rate $ 157.81 -11.8% $145.16 -11.6% RevPAR $ 104.60 -17.2% $ 92.09 -17.5%
Renaissance Hotels Occupancy 65.3% -4.2% pts. 63.8% -4.3% pts. Average Daily Rate $ 153.71 -10.7% $140.75 -10.9% RevPAR $ 100.42 -16.1% $ 89.75 -16.5%
Composite North American Full-Service Occupancy 66.1% -4.3% pts. 63.5% -4.5% pts. Average Daily Rate $ 157.10 -11.6% $144.42 -11.5% RevPAR $ 103.87 -17.0% $ 91.70 -17.3%
The Ritz-Carlton North America Occupancy 61.5% -6.5% pts. 61.5% -6.5% pts. Average Daily Rate $ 280.76 -14.9% $280.76 -14.9% RevPAR $ 172.61 -23.1% $172.61 -23.1%
Composite North American Full-Service and Luxury Occupancy 65.7% -4.5% pts. 63.4% -4.6% pts. Average Daily Rate $ 167.93 -12.2% $151.75 -11.9% RevPAR $ 110.30 -17.8% $ 96.18 -17.9%
Residence Inn Occupancy 69.5% -5.3% pts. 70.7% -4.5% pts. Average Daily Rate $ 114.27 -10.0% $113.86 -9.2% RevPAR $ 79.38 -16.4% $ 80.48 -14.6%
Courtyard Occupancy 61.2% -5.8% pts. 62.8% -5.1% pts. Average Daily Rate $ 109.78 -14.2% $111.20 -11.7% RevPAR $ 67.15 -21.7% $ 69.87 -18.3%
Fairfield Inn & Suites Occupancy nm nm 60.8% -5.4% pts. Average Daily Rate nm nm $ 84.62 -8.1% RevPAR nm nm $ 51.41 -15.6%
TownePlace Suites Occupancy 61.3% -7.4% pts. 62.8% -5.9% pts. Average Daily Rate $ 77.40 -11.5% $ 81.60 -9.2% RevPAR $ 47.45 -21.1% $ 51.24 -16.9%
SpringHill Suites Occupancy 61.3% -6.9% pts. 62.7% -5.2% pts. Average Daily Rate $ 97.32 -11.0% $ 98.97 -9.2% RevPAR $ 59.63 -20.0% $ 62.01 -16.1%
Composite North American Limited-Service Occupancy 63.5% -5.8% pts. 64.5% -5.1% pts. Average Daily Rate $ 108.33 -12.7% $104.55 -10.0% RevPAR $ 68.83 -20.0% $ 67.40 -16.6%
Composite North American Occupancy 64.8% -5.1% pts. 64.0% -4.9% pts. Average Daily Rate $ 142.86 -12.2% $122.71 -10.9% RevPAR $ 92.52 -18.5% $ 78.59 -17.2%
(1) (1)
(2)
(3)
(4)
(5)
(6)

Statistics are for the fifty-two weeks and the fifty-three weeks ended January 1, 2010, and January 2, 2009, respectively, except for The Ritz-Carlton forwhich the statistics are for the 12 months ended December 31, 2009, and December 31, 2008. North American statistics represent properties located inthe continental United States.Marriott Hotels & Resorts includes JW Marriott properties.Composite North American Full-Service statistics include Marriott Hotels & Resorts and Renaissance Hotels properties.Composite North American Full-Service and Luxury includes Marriott Hotels & Resorts, Renaissance Hotels, and The Ritz-Carlton properties.Composite North American Limited-Service statistics include Residence Inn, Courtyard, Fairfield Inn & Suites, TownePlace Suites, and SpringHillSuites properties.Composite North American statistics include Marriott Hotels & Resorts, Renaissance Hotels, Residence Inn, Courtyard, Fairfield Inn & Suites,TownePlace Suites, SpringHill Suites, and The Ritz-Carlton properties.
42
(1)
(2)
(3)
(4)
(5)
(6)
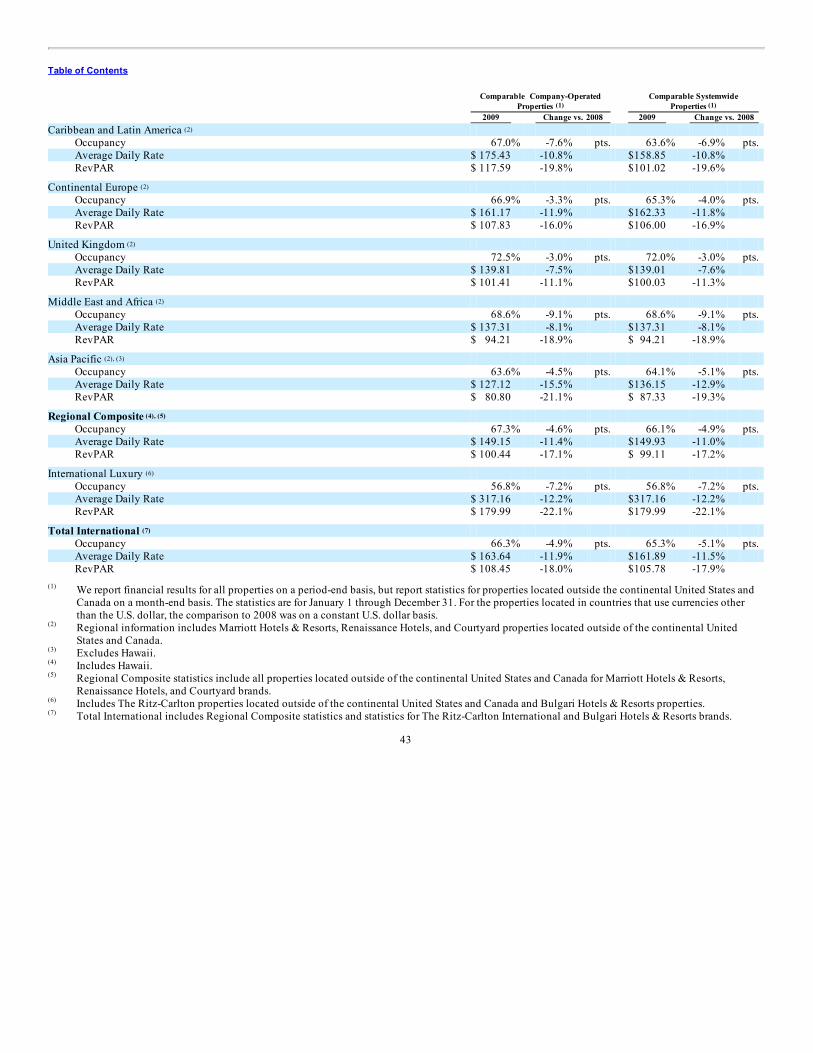
Table of Contents
Comparable Company-Operated
Properties Comparable Systemwide
Properties 2009 Change vs. 2008 2009 Change vs. 2008 Caribbean and Latin America
Occupancy 67.0% -7.6% pts. 63.6% -6.9% pts. Average Daily Rate $ 175.43 -10.8% $158.85 -10.8% RevPAR $ 117.59 -19.8% $101.02 -19.6%
Continental Europe Occupancy 66.9% -3.3% pts. 65.3% -4.0% pts. Average Daily Rate $ 161.17 -11.9% $162.33 -11.8% RevPAR $ 107.83 -16.0% $106.00 -16.9%
United Kingdom Occupancy 72.5% -3.0% pts. 72.0% -3.0% pts. Average Daily Rate $ 139.81 -7.5% $139.01 -7.6% RevPAR $ 101.41 -11.1% $100.03 -11.3%
Middle East and Africa Occupancy 68.6% -9.1% pts. 68.6% -9.1% pts. Average Daily Rate $ 137.31 -8.1% $137.31 -8.1% RevPAR $ 94.21 -18.9% $ 94.21 -18.9%
Asia Pacific Occupancy 63.6% -4.5% pts. 64.1% -5.1% pts. Average Daily Rate $ 127.12 -15.5% $136.15 -12.9% RevPAR $ 80.80 -21.1% $ 87.33 -19.3%
Regional Composite Occupancy 67.3% -4.6% pts. 66.1% -4.9% pts. Average Daily Rate $ 149.15 -11.4% $149.93 -11.0% RevPAR $ 100.44 -17.1% $ 99.11 -17.2%
International Luxury Occupancy 56.8% -7.2% pts. 56.8% -7.2% pts. Average Daily Rate $ 317.16 -12.2% $317.16 -12.2% RevPAR $ 179.99 -22.1% $179.99 -22.1%
Total International Occupancy 66.3% -4.9% pts. 65.3% -5.1% pts. Average Daily Rate $ 163.64 -11.9% $161.89 -11.5% RevPAR $ 108.45 -18.0% $105.78 -17.9%
We report financial results for all properties on a period-end basis, but report statistics for properties located outside the continental United States andCanada on a month-end basis. The statistics are for January 1 through December 31. For the properties located in countries that use currencies otherthan the U.S. dollar, the comparison to 2008 was on a constant U.S. dollar basis.Regional information includes Marriott Hotels & Resorts, Renaissance Hotels, and Courtyard properties located outside of the continental UnitedStates and Canada.Excludes Hawaii.Includes Hawaii.Regional Composite statistics include all properties located outside of the continental United States and Canada for Marriott Hotels & Resorts,Renaissance Hotels, and Courtyard brands.Includes The Ritz-Carlton properties located outside of the continental United States and Canada and Bulgari Hotels & Resorts properties.Total International includes Regional Composite statistics and statistics for The Ritz-Carlton International and Bulgari Hotels & Resorts brands.
43
(1) (1)
(2)
(2)
(2)
(2)
(2), (3)
(4), (5)
(6)
(7)
(1)
(2)
(3)
(4)
(5)
(6)
(7)
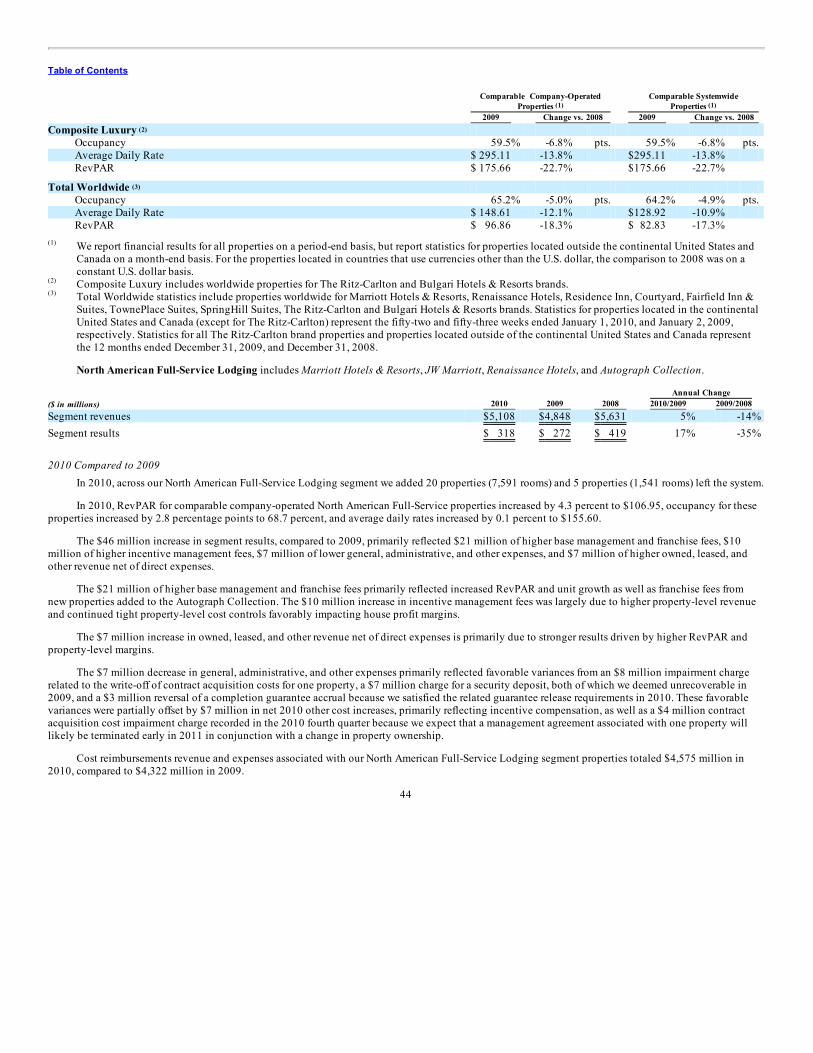
Table of Contents
Comparable Company-Operated
Properties Comparable Systemwide
Properties 2009 Change vs. 2008 2009 Change vs. 2008 Composite Luxury
Occupancy 59.5% -6.8% pts. 59.5% -6.8% pts. Average Daily Rate $ 295.11 -13.8% $295.11 -13.8% RevPAR $ 175.66 -22.7% $175.66 -22.7%
Total Worldwide Occupancy 65.2% -5.0% pts. 64.2% -4.9% pts. Average Daily Rate $ 148.61 -12.1% $128.92 -10.9% RevPAR $ 96.86 -18.3% $ 82.83 -17.3%
We report financial results for all properties on a period-end basis, but report statistics for properties located outside the continental United States andCanada on a month-end basis. For the properties located in countries that use currencies other than the U.S. dollar, the comparison to 2008 was on aconstant U.S. dollar basis.Composite Luxury includes worldwide properties for The Ritz-Carlton and Bulgari Hotels & Resorts brands.Total Worldwide statistics include properties worldwide for Marriott Hotels & Resorts, Renaissance Hotels, Residence Inn, Courtyard, Fairfield Inn &Suites, TownePlace Suites, SpringHill Suites, The Ritz-Carlton and Bulgari Hotels & Resorts brands. Statistics for properties located in the continentalUnited States and Canada (except for The Ritz-Carlton) represent the fifty-two and fifty-three weeks ended January 1, 2010, and January 2, 2009,respectively. Statistics for all The Ritz-Carlton brand properties and properties located outside of the continental United States and Canada representthe 12 months ended December 31, 2009, and December 31, 2008.
North American Full-Service Lodging includes Marriott Hotels & Resorts, JW Marriott, Renaissance Hotels, and Autograph Collection. Annual Change ($ in millions) 2010 2009 2008 2010/2009 2009/2008 Segment revenues $5,108 $4,848 $5,631 5% -14% Segment results $ 318 $ 272 $ 419 17% -35%
2010 Compared to 2009In 2010, across our North American Full-Service Lodging segment we added 20 properties (7,591 rooms) and 5 properties (1,541 rooms) left the system.
In 2010, RevPAR for comparable company-operated North American Full-Service properties increased by 4.3 percent to $106.95, occupancy for theseproperties increased by 2.8 percentage points to 68.7 percent, and average daily rates increased by 0.1 percent to $155.60.
The $46 million increase in segment results, compared to 2009, primarily reflected $21 million of higher base management and franchise fees, $10million of higher incentive management fees, $7 million of lower general, administrative, and other expenses, and $7 million of higher owned, leased, andother revenue net of direct expenses.
The $21 million of higher base management and franchise fees primarily reflected increased RevPAR and unit growth as well as franchise fees fromnew properties added to the Autograph Collection. The $10 million increase in incentive management fees was largely due to higher property-level revenueand continued tight property-level cost controls favorably impacting house profit margins.
The $7 million increase in owned, leased, and other revenue net of direct expenses is primarily due to stronger results driven by higher RevPAR andproperty-level margins.
The $7 million decrease in general, administrative, and other expenses primarily reflected favorable variances from an $8 million impairment chargerelated to the write-off of contract acquisition costs for one property, a $7 million charge for a security deposit, both of which we deemed unrecoverable in2009, and a $3 million reversal of a completion guarantee accrual because we satisfied the related guarantee release requirements in 2010. These favorablevariances were partially offset by $7 million in net 2010 other cost increases, primarily reflecting incentive compensation, as well as a $4 million contractacquisition cost impairment charge recorded in the 2010 fourth quarter because we expect that a management agreement associated with one property willlikely be terminated early in 2011 in conjunction with a change in property ownership.
Cost reimbursements revenue and expenses associated with our North American Full-Service Lodging segment properties totaled $4,575 million in2010, compared to $4,322 million in 2009.
44
(1) (1)
(2)
(3)
(1)
(2)
(3)
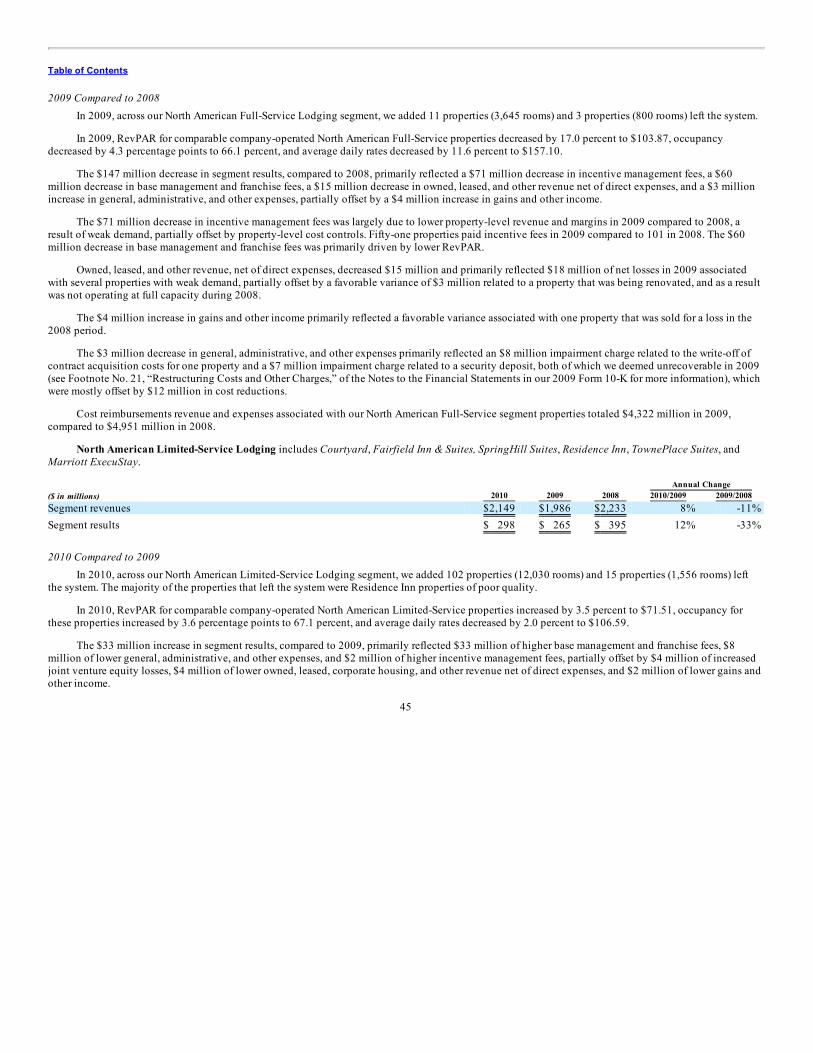
Table of Contents
2009 Compared to 2008In 2009, across our North American Full-Service Lodging segment, we added 11 properties (3,645 rooms) and 3 properties (800 rooms) left the system.
In 2009, RevPAR for comparable company-operated North American Full-Service properties decreased by 17.0 percent to $103.87, occupancydecreased by 4.3 percentage points to 66.1 percent, and average daily rates decreased by 11.6 percent to $157.10.
The $147 million decrease in segment results, compared to 2008, primarily reflected a $71 million decrease in incentive management fees, a $60million decrease in base management and franchise fees, a $15 million decrease in owned, leased, and other revenue net of direct expenses, and a $3 millionincrease in general, administrative, and other expenses, partially offset by a $4 million increase in gains and other income.
The $71 million decrease in incentive management fees was largely due to lower property-level revenue and margins in 2009 compared to 2008, aresult of weak demand, partially offset by property-level cost controls. Fifty-one properties paid incentive fees in 2009 compared to 101 in 2008. The $60million decrease in base management and franchise fees was primarily driven by lower RevPAR.
Owned, leased, and other revenue, net of direct expenses, decreased $15 million and primarily reflected $18 million of net losses in 2009 associatedwith several properties with weak demand, partially offset by a favorable variance of $3 million related to a property that was being renovated, and as a resultwas not operating at full capacity during 2008.
The $4 million increase in gains and other income primarily reflected a favorable variance associated with one property that was sold for a loss in the2008 period.
The $3 million decrease in general, administrative, and other expenses primarily reflected an $8 million impairment charge related to the write-off ofcontract acquisition costs for one property and a $7 million impairment charge related to a security deposit, both of which we deemed unrecoverable in 2009(see Footnote No. 21, “Restructuring Costs and Other Charges,” of the Notes to the Financial Statements in our 2009 Form 10-K for more information), whichwere mostly offset by $12 million in cost reductions.
Cost reimbursements revenue and expenses associated with our North American Full-Service segment properties totaled $4,322 million in 2009,compared to $4,951 million in 2008.
North American Limited-Service Lodging includes Courtyard, Fairfield Inn & Suites, SpringHill Suites, Residence Inn, TownePlace Suites, andMarriott ExecuStay. Annual Change ($ in millions) 2010 2009 2008 2010/2009 2009/2008 Segment revenues $2,149 $1,986 $2,233 8% -11% Segment results $ 298 $ 265 $ 395 12% -33%
2010 Compared to 2009In 2010, across our North American Limited-Service Lodging segment, we added 102 properties (12,030 rooms) and 15 properties (1,556 rooms) left
the system. The majority of the properties that left the system were Residence Inn properties of poor quality.
In 2010, RevPAR for comparable company-operated North American Limited-Service properties increased by 3.5 percent to $71.51, occupancy forthese properties increased by 3.6 percentage points to 67.1 percent, and average daily rates decreased by 2.0 percent to $106.59.
The $33 million increase in segment results, compared to 2009, primarily reflected $33 million of higher base management and franchise fees, $8million of lower general, administrative, and other expenses, and $2 million of higher incentive management fees, partially offset by $4 million of increasedjoint venture equity losses, $4 million of lower owned, leased, corporate housing, and other revenue net of direct expenses, and $2 million of lower gains andother income.
45
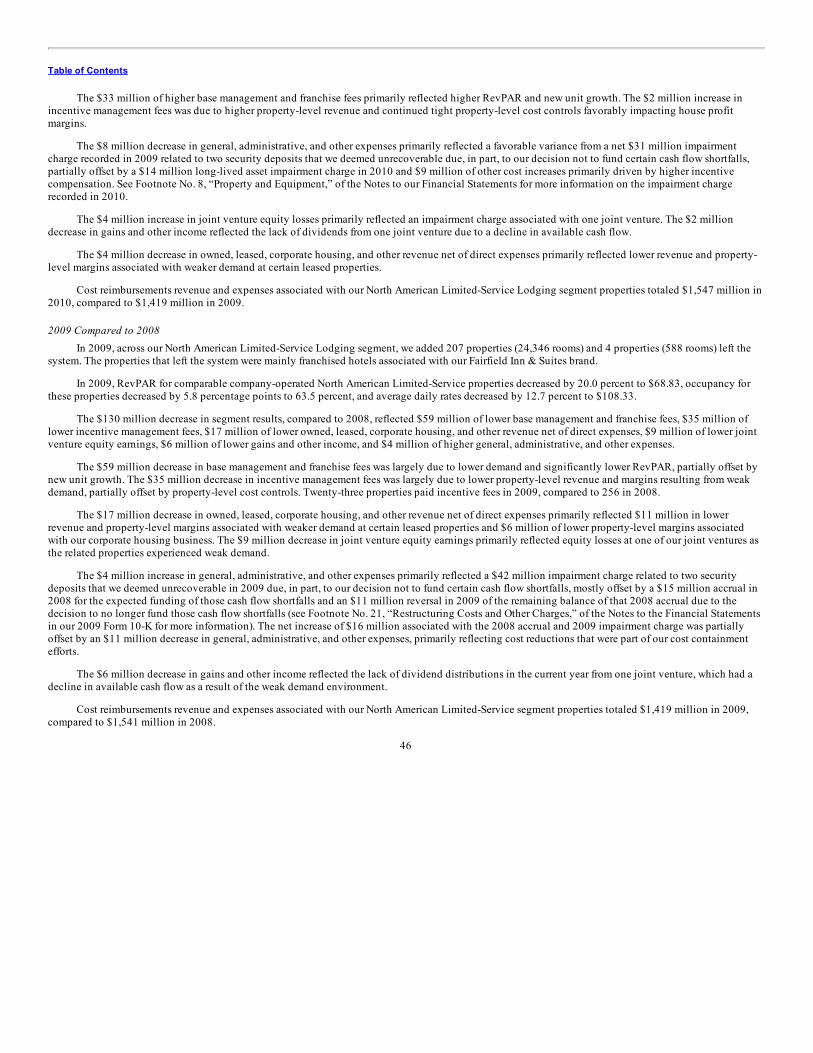
Table of Contents
The $33 million of higher base management and franchise fees primarily reflected higher RevPAR and new unit growth. The $2 million increase inincentive management fees was due to higher property-level revenue and continued tight property-level cost controls favorably impacting house profitmargins.
The $8 million decrease in general, administrative, and other expenses primarily reflected a favorable variance from a net $31 million impairmentcharge recorded in 2009 related to two security deposits that we deemed unrecoverable due, in part, to our decision not to fund certain cash flow shortfalls,partially offset by a $14 million long-lived asset impairment charge in 2010 and $9 million of other cost increases primarily driven by higher incentivecompensation. See Footnote No. 8, “Property and Equipment,” of the Notes to our Financial Statements for more information on the impairment chargerecorded in 2010.
The $4 million increase in joint venture equity losses primarily reflected an impairment charge associated with one joint venture. The $2 milliondecrease in gains and other income reflected the lack of dividends from one joint venture due to a decline in available cash flow.
The $4 million decrease in owned, leased, corporate housing, and other revenue net of direct expenses primarily reflected lower revenue and property-level margins associated with weaker demand at certain leased properties.
Cost reimbursements revenue and expenses associated with our North American Limited-Service Lodging segment properties totaled $1,547 million in2010, compared to $1,419 million in 2009.
2009 Compared to 2008In 2009, across our North American Limited-Service Lodging segment, we added 207 properties (24,346 rooms) and 4 properties (588 rooms) left the
system. The properties that left the system were mainly franchised hotels associated with our Fairfield Inn & Suites brand.
In 2009, RevPAR for comparable company-operated North American Limited-Service properties decreased by 20.0 percent to $68.83, occupancy forthese properties decreased by 5.8 percentage points to 63.5 percent, and average daily rates decreased by 12.7 percent to $108.33.
The $130 million decrease in segment results, compared to 2008, reflected $59 million of lower base management and franchise fees, $35 million oflower incentive management fees, $17 million of lower owned, leased, corporate housing, and other revenue net of direct expenses, $9 million of lower jointventure equity earnings, $6 million of lower gains and other income, and $4 million of higher general, administrative, and other expenses.
The $59 million decrease in base management and franchise fees was largely due to lower demand and significantly lower RevPAR, partially offset bynew unit growth. The $35 million decrease in incentive management fees was largely due to lower property-level revenue and margins resulting from weakdemand, partially offset by property-level cost controls. Twenty-three properties paid incentive fees in 2009, compared to 256 in 2008.
The $17 million decrease in owned, leased, corporate housing, and other revenue net of direct expenses primarily reflected $11 million in lowerrevenue and property-level margins associated with weaker demand at certain leased properties and $6 million of lower property-level margins associatedwith our corporate housing business. The $9 million decrease in joint venture equity earnings primarily reflected equity losses at one of our joint ventures asthe related properties experienced weak demand.
The $4 million increase in general, administrative, and other expenses primarily reflected a $42 million impairment charge related to two securitydeposits that we deemed unrecoverable in 2009 due, in part, to our decision not to fund certain cash flow shortfalls, mostly offset by a $15 million accrual in2008 for the expected funding of those cash flow shortfalls and an $11 million reversal in 2009 of the remaining balance of that 2008 accrual due to thedecision to no longer fund those cash flow shortfalls (see Footnote No. 21, “Restructuring Costs and Other Charges,” of the Notes to the Financial Statementsin our 2009 Form 10-K for more information). The net increase of $16 million associated with the 2008 accrual and 2009 impairment charge was partiallyoffset by an $11 million decrease in general, administrative, and other expenses, primarily reflecting cost reductions that were part of our cost containmentefforts.
The $6 million decrease in gains and other income reflected the lack of dividend distributions in the current year from one joint venture, which had adecline in available cash flow as a result of the weak demand environment.
Cost reimbursements revenue and expenses associated with our North American Limited-Service segment properties totaled $1,419 million in 2009,compared to $1,541 million in 2008.
46
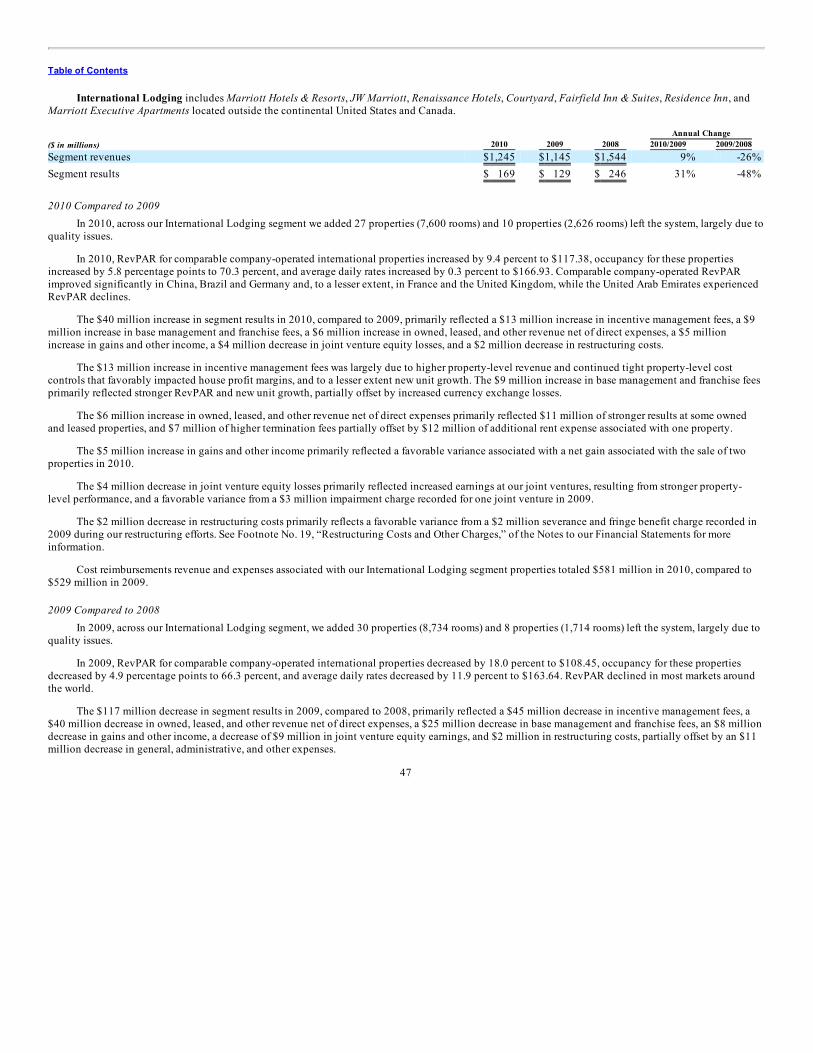
Table of Contents
International Lodging includes Marriott Hotels & Resorts, JW Marriott, Renaissance Hotels, Courtyard, Fairfield Inn & Suites, Residence Inn, andMarriott Executive Apartments located outside the continental United States and Canada. Annual Change ($ in millions) 2010 2009 2008 2010/2009 2009/2008 Segment revenues $1,245 $1,145 $1,544 9% -26% Segment results $ 169 $ 129 $ 246 31% -48%
2010 Compared to 2009In 2010, across our International Lodging segment we added 27 properties (7,600 rooms) and 10 properties (2,626 rooms) left the system, largely due to
quality issues.
In 2010, RevPAR for comparable company-operated international properties increased by 9.4 percent to $117.38, occupancy for these propertiesincreased by 5.8 percentage points to 70.3 percent, and average daily rates increased by 0.3 percent to $166.93. Comparable company-operated RevPARimproved significantly in China, Brazil and Germany and, to a lesser extent, in France and the United Kingdom, while the United Arab Emirates experiencedRevPAR declines.
The $40 million increase in segment results in 2010, compared to 2009, primarily reflected a $13 million increase in incentive management fees, a $9million increase in base management and franchise fees, a $6 million increase in owned, leased, and other revenue net of direct expenses, a $5 millionincrease in gains and other income, a $4 million decrease in joint venture equity losses, and a $2 million decrease in restructuring costs.
The $13 million increase in incentive management fees was largely due to higher property-level revenue and continued tight property-level costcontrols that favorably impacted house profit margins, and to a lesser extent new unit growth. The $9 million increase in base management and franchise feesprimarily reflected stronger RevPAR and new unit growth, partially offset by increased currency exchange losses.
The $6 million increase in owned, leased, and other revenue net of direct expenses primarily reflected $11 million of stronger results at some ownedand leased properties, and $7 million of higher termination fees partially offset by $12 million of additional rent expense associated with one property.
The $5 million increase in gains and other income primarily reflected a favorable variance associated with a net gain associated with the sale of twoproperties in 2010.
The $4 million decrease in joint venture equity losses primarily reflected increased earnings at our joint ventures, resulting from stronger property-level performance, and a favorable variance from a $3 million impairment charge recorded for one joint venture in 2009.
The $2 million decrease in restructuring costs primarily reflects a favorable variance from a $2 million severance and fringe benefit charge recorded in2009 during our restructuring efforts. See Footnote No. 19, “Restructuring Costs and Other Charges,” of the Notes to our Financial Statements for moreinformation.
Cost reimbursements revenue and expenses associated with our International Lodging segment properties totaled $581 million in 2010, compared to$529 million in 2009.
2009 Compared to 2008In 2009, across our International Lodging segment, we added 30 properties (8,734 rooms) and 8 properties (1,714 rooms) left the system, largely due to
quality issues.
In 2009, RevPAR for comparable company-operated international properties decreased by 18.0 percent to $108.45, occupancy for these propertiesdecreased by 4.9 percentage points to 66.3 percent, and average daily rates decreased by 11.9 percent to $163.64. RevPAR declined in most markets aroundthe world.
The $117 million decrease in segment results in 2009, compared to 2008, primarily reflected a $45 million decrease in incentive management fees, a$40 million decrease in owned, leased, and other revenue net of direct expenses, a $25 million decrease in base management and franchise fees, an $8 milliondecrease in gains and other income, a decrease of $9 million in joint venture equity earnings, and $2 million in restructuring costs, partially offset by an $11million decrease in general, administrative, and other expenses.
47
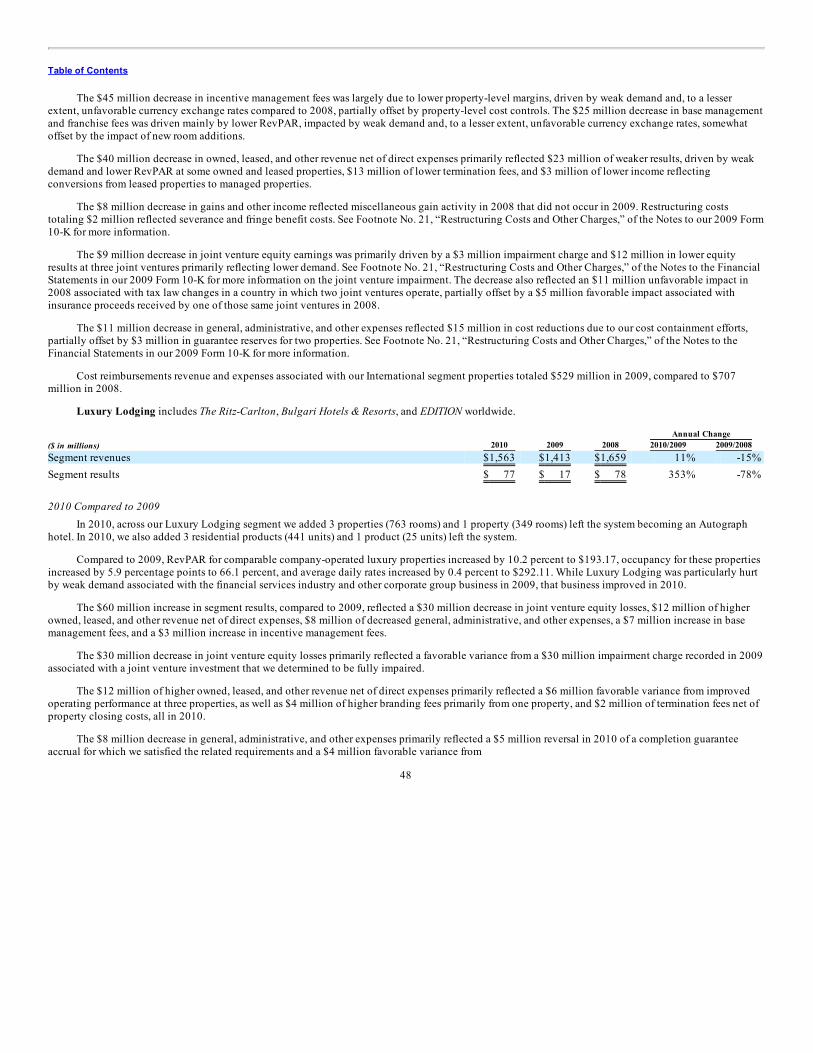
Table of Contents
The $45 million decrease in incentive management fees was largely due to lower property-level margins, driven by weak demand and, to a lesserextent, unfavorable currency exchange rates compared to 2008, partially offset by property-level cost controls. The $25 million decrease in base managementand franchise fees was driven mainly by lower RevPAR, impacted by weak demand and, to a lesser extent, unfavorable currency exchange rates, somewhatoffset by the impact of new room additions.
The $40 million decrease in owned, leased, and other revenue net of direct expenses primarily reflected $23 million of weaker results, driven by weakdemand and lower RevPAR at some owned and leased properties, $13 million of lower termination fees, and $3 million of lower income reflectingconversions from leased properties to managed properties.
The $8 million decrease in gains and other income reflected miscellaneous gain activity in 2008 that did not occur in 2009. Restructuring coststotaling $2 million reflected severance and fringe benefit costs. See Footnote No. 21, “Restructuring Costs and Other Charges,” of the Notes to our 2009 Form10-K for more information.
The $9 million decrease in joint venture equity earnings was primarily driven by a $3 million impairment charge and $12 million in lower equityresults at three joint ventures primarily reflecting lower demand. See Footnote No. 21, “Restructuring Costs and Other Charges,” of the Notes to the FinancialStatements in our 2009 Form 10-K for more information on the joint venture impairment. The decrease also reflected an $11 million unfavorable impact in2008 associated with tax law changes in a country in which two joint ventures operate, partially offset by a $5 million favorable impact associated withinsurance proceeds received by one of those same joint ventures in 2008.
The $11 million decrease in general, administrative, and other expenses reflected $15 million in cost reductions due to our cost containment efforts,partially offset by $3 million in guarantee reserves for two properties. See Footnote No. 21, “Restructuring Costs and Other Charges,” of the Notes to theFinancial Statements in our 2009 Form 10-K for more information.
Cost reimbursements revenue and expenses associated with our International segment properties totaled $529 million in 2009, compared to $707million in 2008.
Luxury Lodging includes The Ritz-Carlton, Bulgari Hotels & Resorts, and EDITION worldwide. Annual Change ($ in millions) 2010 2009 2008 2010/2009 2009/2008 Segment revenues $1,563 $1,413 $1,659 11% -15% Segment results $ 77 $ 17 $ 78 353% -78%
2010 Compared to 2009In 2010, across our Luxury Lodging segment we added 3 properties (763 rooms) and 1 property (349 rooms) left the system becoming an Autograph
hotel. In 2010, we also added 3 residential products (441 units) and 1 product (25 units) left the system.
Compared to 2009, RevPAR for comparable company-operated luxury properties increased by 10.2 percent to $193.17, occupancy for these propertiesincreased by 5.9 percentage points to 66.1 percent, and average daily rates increased by 0.4 percent to $292.11. While Luxury Lodging was particularly hurtby weak demand associated with the financial services industry and other corporate group business in 2009, that business improved in 2010.
The $60 million increase in segment results, compared to 2009, reflected a $30 million decrease in joint venture equity losses, $12 million of higherowned, leased, and other revenue net of direct expenses, $8 million of decreased general, administrative, and other expenses, a $7 million increase in basemanagement fees, and a $3 million increase in incentive management fees.
The $30 million decrease in joint venture equity losses primarily reflected a favorable variance from a $30 million impairment charge recorded in 2009associated with a joint venture investment that we determined to be fully impaired.
The $12 million of higher owned, leased, and other revenue net of direct expenses primarily reflected a $6 million favorable variance from improvedoperating performance at three properties, as well as $4 million of higher branding fees primarily from one property, and $2 million of termination fees net ofproperty closing costs, all in 2010.
The $8 million decrease in general, administrative, and other expenses primarily reflected a $5 million reversal in 2010 of a completion guaranteeaccrual for which we satisfied the related requirements and a $4 million favorable variance from
48
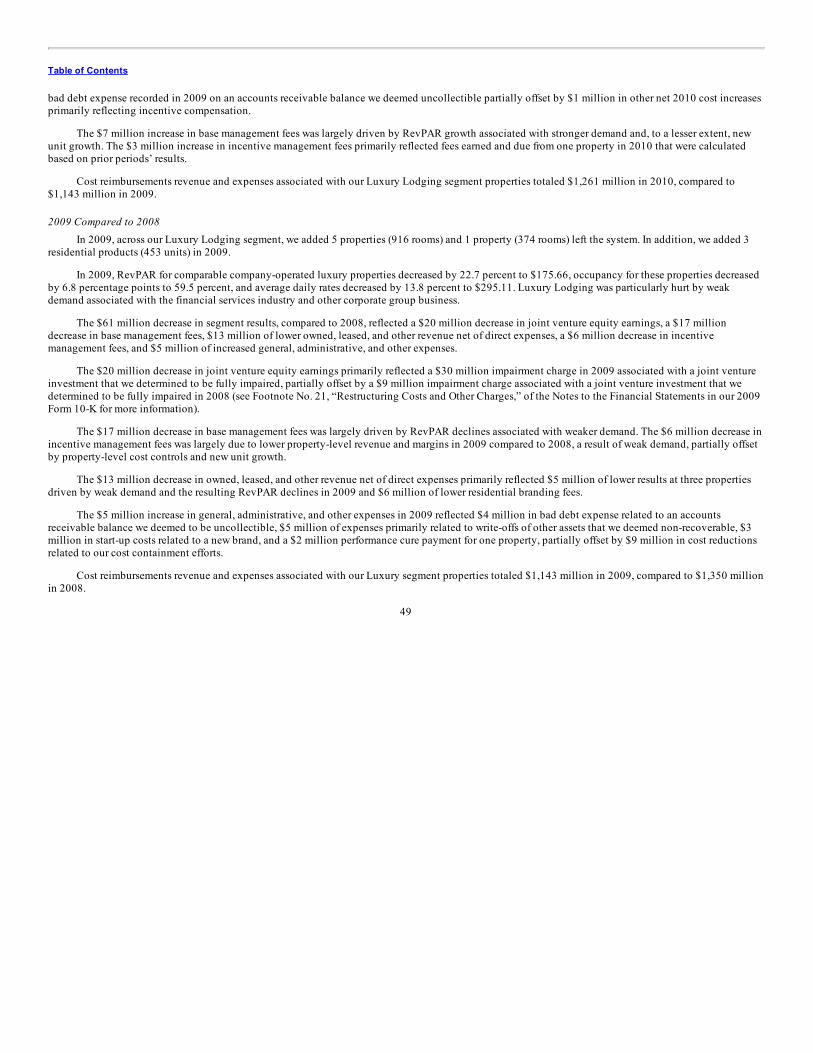
Table of Contents
bad debt expense recorded in 2009 on an accounts receivable balance we deemed uncollectible partially offset by $1 million in other net 2010 cost increasesprimarily reflecting incentive compensation.
The $7 million increase in base management fees was largely driven by RevPAR growth associated with stronger demand and, to a lesser extent, newunit growth. The $3 million increase in incentive management fees primarily reflected fees earned and due from one property in 2010 that were calculatedbased on prior periods’ results.
Cost reimbursements revenue and expenses associated with our Luxury Lodging segment properties totaled $1,261 million in 2010, compared to$1,143 million in 2009.
2009 Compared to 2008In 2009, across our Luxury Lodging segment, we added 5 properties (916 rooms) and 1 property (374 rooms) left the system. In addition, we added 3
residential products (453 units) in 2009.
In 2009, RevPAR for comparable company-operated luxury properties decreased by 22.7 percent to $175.66, occupancy for these properties decreasedby 6.8 percentage points to 59.5 percent, and average daily rates decreased by 13.8 percent to $295.11. Luxury Lodging was particularly hurt by weakdemand associated with the financial services industry and other corporate group business.
The $61 million decrease in segment results, compared to 2008, reflected a $20 million decrease in joint venture equity earnings, a $17 milliondecrease in base management fees, $13 million of lower owned, leased, and other revenue net of direct expenses, a $6 million decrease in incentivemanagement fees, and $5 million of increased general, administrative, and other expenses.
The $20 million decrease in joint venture equity earnings primarily reflected a $30 million impairment charge in 2009 associated with a joint ventureinvestment that we determined to be fully impaired, partially offset by a $9 million impairment charge associated with a joint venture investment that wedetermined to be fully impaired in 2008 (see Footnote No. 21, “Restructuring Costs and Other Charges,” of the Notes to the Financial Statements in our 2009Form 10-K for more information).
The $17 million decrease in base management fees was largely driven by RevPAR declines associated with weaker demand. The $6 million decrease inincentive management fees was largely due to lower property-level revenue and margins in 2009 compared to 2008, a result of weak demand, partially offsetby property-level cost controls and new unit growth.
The $13 million decrease in owned, leased, and other revenue net of direct expenses primarily reflected $5 million of lower results at three propertiesdriven by weak demand and the resulting RevPAR declines in 2009 and $6 million of lower residential branding fees.
The $5 million increase in general, administrative, and other expenses in 2009 reflected $4 million in bad debt expense related to an accountsreceivable balance we deemed to be uncollectible, $5 million of expenses primarily related to write-offs of other assets that we deemed non-recoverable, $3million in start-up costs related to a new brand, and a $2 million performance cure payment for one property, partially offset by $9 million in cost reductionsrelated to our cost containment efforts.
Cost reimbursements revenue and expenses associated with our Luxury segment properties totaled $1,143 million in 2009, compared to $1,350 millionin 2008.
49
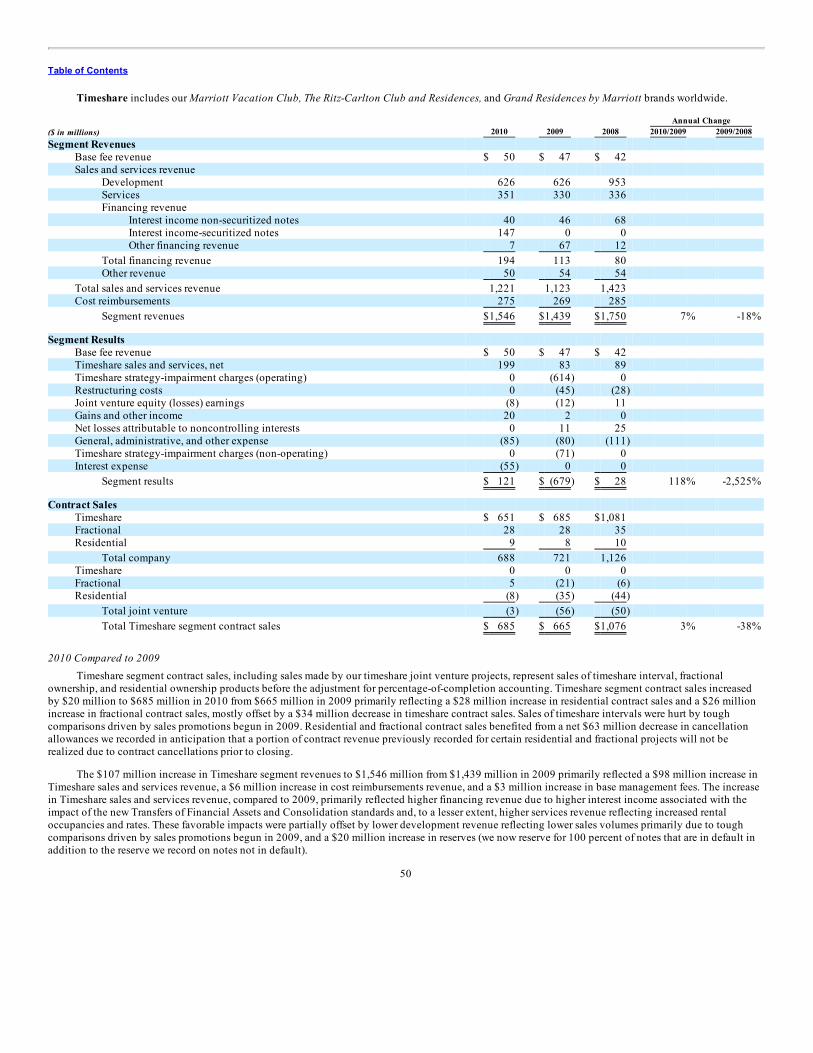
Table of Contents
Timeshare includes our Marriott Vacation Club, The Ritz-Carlton Club and Residences, and Grand Residences by Marriott brands worldwide. Annual Change ($ in millions) 2010 2009 2008 2010/2009 2009/2008 Segment Revenues
Base fee revenue $ 50 $ 47 $ 42 Sales and services revenue
Development 626 626 953 Services 351 330 336 Financing revenue
Interest income non-securitized notes 40 46 68 Interest income-securitized notes 147 0 0 Other financing revenue 7 67 12
Total financing revenue 194 113 80 Other revenue 50 54 54
Total sales and services revenue 1,221 1,123 1,423 Cost reimbursements 275 269 285
Segment revenues $1,546 $1,439 $1,750 7% -18%
Segment Results Base fee revenue $ 50 $ 47 $ 42 Timeshare sales and services, net 199 83 89 Timeshare strategy-impairment charges (operating) 0 (614) 0 Restructuring costs 0 (45) (28) Joint venture equity (losses) earnings (8) (12) 11 Gains and other income 20 2 0 Net losses attributable to noncontrolling interests 0 11 25 General, administrative, and other expense (85) (80) (111) Timeshare strategy-impairment charges (non-operating) 0 (71) 0 Interest expense (55) 0 0
Segment results $ 121 $ (679) $ 28 118% -2,525%
Contract Sales Timeshare $ 651 $ 685 $1,081 Fractional 28 28 35 Residential 9 8 10
Total company 688 721 1,126 Timeshare 0 0 0 Fractional 5 (21) (6) Residential (8) (35) (44)
Total joint venture (3) (56) (50)
Total Timeshare segment contract sales $ 685 $ 665 $1,076 3% -38%
2010 Compared to 2009Timeshare segment contract sales, including sales made by our timeshare joint venture projects, represent sales of timeshare interval, fractional
ownership, and residential ownership products before the adjustment for percentage-of-completion accounting. Timeshare segment contract sales increasedby $20 million to $685 million in 2010 from $665 million in 2009 primarily reflecting a $28 million increase in residential contract sales and a $26 millionincrease in fractional contract sales, mostly offset by a $34 million decrease in timeshare contract sales. Sales of timeshare intervals were hurt by toughcomparisons driven by sales promotions begun in 2009. Residential and fractional contract sales benefited from a net $63 million decrease in cancellationallowances we recorded in anticipation that a portion of contract revenue previously recorded for certain residential and fractional projects will not berealized due to contract cancellations prior to closing.
The $107 million increase in Timeshare segment revenues to $1,546 million from $1,439 million in 2009 primarily reflected a $98 million increase inTimeshare sales and services revenue, a $6 million increase in cost reimbursements revenue, and a $3 million increase in base management fees. The increasein Timeshare sales and services revenue, compared to 2009, primarily reflected higher financing revenue due to higher interest income associated with theimpact of the new Transfers of Financial Assets and Consolidation standards and, to a lesser extent, higher services revenue reflecting increased rentaloccupancies and rates. These favorable impacts were partially offset by lower development revenue reflecting lower sales volumes primarily due to toughcomparisons driven by sales promotions begun in 2009, and a $20 million increase in reserves (we now reserve for 100 percent of notes that are in default inaddition to the reserve we record on notes not in default).
50
Table of Contents
Segment income of $121 million in 2010 increased by $800 million from $679 million of segment losses in 2009, and primarily reflected a favorablevariance from the $685 million of impairments recorded in 2009, $116 million of higher 2010 Timeshare sales and services revenue net of direct expenses,$45 million of lower restructuring costs compared with 2009, $18 million increase in gains and other income, $3 million increase in base management fees,and $4 million of lower joint venture equity losses partially offset by a $55 million increase in interest expense, an $11 million decrease in net lossesattributable to noncontrolling interest, and $5 million of higher general, administrative, and other expenses.
The $116 million increase in Timeshare sales and services revenue net of direct expenses primarily reflected $78 million of higher financing revenue,net of expenses, $33 million of higher development revenue net of product costs and marketing and selling costs, and $8 million of higher other revenue netof expense, partially offset by $3 million of lower services revenue net of expenses. Higher development revenue net of product costs and marketing andselling costs primarily reflected both lower costs due to lower sales volumes and lower marketing and selling costs in 2010, as well as favorable variancesfrom both a $10 million charge related to an issue with a state tax authority and a net $3 million impact from contract cancellation allowances in 2009,partially offset by lower development revenue for the reasons stated previously. The $20 million unfavorable impact to development revenue related to thereserve for uncollectible accounts was partially offset by a favorable impact in product costs, resulting in a net $12 million increase in reserves.
The $78 million increase in financing revenue, net of expense, primarily reflected: (1) a net $141 million increase in interest income, reflecting a $147million increase from the notes receivable we now consolidate associated with past securitization transactions as part of our adoption of the new Transfers ofFinancial Assets and Consolidation standards, partially offset by a $6 million decrease in interest income related to non-securitized notes receivablereflecting a lower outstanding balance; and (2) a favorable variance from a $20 million charge in 2009 related to the reduction in the valuation of residualinterests. These favorable variances were partially offset by $42 million of decreased residual interest accretion reflecting the elimination of residual interestsas part of our 2010 adoption of the new Transfers of Financial Assets and Consolidation standards, $37 million of gain on notes sold in 2009, and $3 millionof other net expenses.
The $8 million increase in other revenue net of expense primarily reflected a $15 million favorable adjustment to the Marriott Rewards liabilityresulting from lower than anticipated cost of redemptions, as well as $6 million of higher other miscellaneous revenue, partially offset by $13 million of netcosts in excess of enrollment revenue related to the new points-based program. The $11 million increase in services revenue net of expenses primarilyreflected higher rental revenue associated with increased transient demand.
The $55 million in interest expense was a result of the consolidation of debt obligations due to our adoption of the new Transfers of Financial Assetsand Consolidation standards.
Gains and other income increased by $18 million, primarily due to the sale of one property in the 2010 fourth quarter.
The $5 million increase in general, administrative, and other expenses primarily reflected a $13 million impairment charge in 2010 associated with theanticipated disposition of a golf course and related assets. Partially offsetting this unfavorable variance was a $7 million write-off of capitalized softwaredevelopment costs in 2009 related to a project for which we decided not to pursue further development. For additional information regarding the impairmentcharge recorded in 2010, see Footnote No. 8, “Property and Equipment,” of the Notes to our Financial Statements.
Joint venture equity losses decreased by $4 million and primarily reflected higher cancellation allowances recorded at a joint venture in 2009.
The $11 million decrease to zero in net losses attributable to a noncontrolling interest was associated with our acquisition of that noncontrollinginterest. See Footnote No. 20, “Variable Interest Entities,” of the Notes to our Financial Statements for additional information.
2009 Compared to 2008Timeshare segment contract sales decreased by $411 million (38 percent), compared to 2008, to $665 million from $1,076 million. The decrease in
Timeshare segment contract sales in 2009, compared to 2008, reflected a $396 million decrease in timeshare contract sales and a $22 million decrease infractional contract sales, partially offset by $7 million of lower residential net cancellation allowances on contract sales. Sales of fractional and timeshareintervals decreased significantly as a result of weak demand, but were partially offset by a decrease in cancellation allowances of $32 million, as comparedwith prior year, recorded in anticipation that a portion of contract revenue previously recorded for certain residential and fractional projects will not berealized due to contract cancellations prior to closing (see Footnote No. 21, “Restructuring Costs and Other Charges,” of the Notes to the FinancialStatements in our 2009 Form 10-K for additional information).
51

Table of Contents
The $311 million decrease in Timeshare segment revenues to $1,439 million from $1,750 million primarily reflected a $300 million decrease inTimeshare sales and services revenue and a $16 million decrease in cost reimbursements revenue, partially offset by a $5 million increase in basemanagement fees. The decrease in Timeshare sales and services revenue, compared to 2008, primarily reflected lower demand for timeshare intervals and to alesser extent, residential products and the Asia Pacific points program, as well as lower revenue from projects with limited available inventory in 2009, andlower reacquired and resales revenue and services revenue. Partially offsetting the decrease was higher revenue from projects that became reportablesubsequent to 2008 and higher financing revenue. Timeshare segment revenues in 2009 and 2008 included note securitization gains of $37 million and $16million, respectively.
Segment losses of $679 million in 2009 increased by $707 million from $28 million of segment income in 2008, and reflected $685 million ofimpairments (See Footnote No. 20, “Timeshare Strategy-Impairment Charges,” of the Notes to the Financial Statements in our 2009 Form 10-K for moreinformation on the impairments), $17 million of higher restructuring costs, $23 million in lower joint venture equity earnings, a $14 million decrease in netlosses attributable to noncontrolling interests, and $6 million of lower Timeshare sales and services revenue net of direct expenses, partially offset by $31million of lower general, administrative, and other expenses and $5 million of higher base management fees.
The $6 million decrease in Timeshare sales and services revenue net of direct expenses primarily reflected $50 million of lower development revenuenet of product costs and marketing and selling costs and $17 million of lower services revenue net of expenses, mostly offset by $43 million of higherfinancing revenue net of financing expenses, $15 million of higher other revenue, net of expenses, and $3 million of higher reacquired and resales revenue,net of expenses. Lower development revenue net of product, marketing and selling costs primarily reflected lower revenue for timeshare intervals and to alesser extent, lower revenue net of costs for our Asia Pacific points program, and a $10 million charge related to an issue with a state tax authority, partiallyoffset by favorable reportability for several projects that reached revenue recognition reportability thresholds after 2008 and favorable variances from both a$22 million 2008 pretax impairment charge related to a joint venture that we fully consolidate ($10 million net of noncontrolling interest benefit) and a $9million 2008 inventory write-down related to the termination of certain phases of timeshare development in Europe.
The $43 million increase in financing revenue, net of financing costs, primarily reflected: (1) a $21 million increase in note securitization gains, from$16 million in 2008, which included a $12 million charge related to hedge ineffectiveness, to $37 million in 2009, due to only one note securitization in2008 as compared with two note securitizations in 2009; (2) $22 million of increased residual interest accretion reflecting incremental accretion from thesecond quarter 2008, first quarter 2009, and fourth quarter 2009 note securitizations; (3) a $12 million decrease in the charge that reduced the valuation ofresidual interests to $20 million in 2009 from $32 million in 2008; and (4) a $13 million decrease in the cost of financing due to cost containment efforts.These favorable impacts were partially offset by $22 million of lower interest income because of lower notes receivable balances in 2009 due to thecompletion of the 2009 second and fourth quarter note securitizations; and $5 million of lower settlement revenue, net of expenses, due to lower settlementvolume. The $20 million recorded charge for the reduced value of residual interests in 2009 consisted of a $19 million unfavorable impact for eightpreviously securitized pools that reached performance triggers as a result of increased defaults in 2009, partially offset by a $4 million benefit for the releaseof seven of the eight performance triggers later in 2009 due to improved loan performance, and a $5 million net unfavorable impact from changes in theassumptions for discount, default and prepayment rates that we used in our estimate of fair market value (see Footnote No. 21, “Restructuring Costs and OtherCharges,” of the Notes to the Financial Statements in our 2009 Form 10-K for more information).
The $17 million decrease in services revenue net of expenses was driven by lower rental revenue due to the weak demand and increased maintenancecost for unsold inventory. The $15 million increase in other revenue, net of expenses, was primarily a result of higher marketing and sales revenue.
The $17 million increase in restructuring costs reflected a $24 million increase in facilities exit costs and $1 million increase in severance costs,partially offset by an $8 million decrease in development cancellations (see the “Restructuring Costs and Other Charges” section of our 2009 Form 10-K foradditional information).
The $31 million decrease in general, administrative, and other expenses reflected $33 million in cost savings primarily generated from the restructuringefforts initiated in 2008, which resulted in the elimination of certain positions and other cost reductions and a $4 million favorable variance due todevelopment cancellations in 2008, partially offset by a $7 million 2009 write-off of capitalized software development costs related to a project for which wehave decided not to pursue further development. See Footnote No. 21, “Restructuring Costs and Other Charges,” of the Notes to the Financial Statements inour 2009 Form 10-K for additional information on the write-off of capitalized software costs.
Joint venture equity earnings decreased by $23 million and primarily reflected decreased earnings from a joint venture, attributable to weak 2009demand for a residential and fractional project.
52
Table of Contents
The $14 million decrease in net losses attributable to noncontrolling interests primarily related to a $12 million noncontrolling interest benefitrecorded in 2008 related to an impairment of a joint venture we consolidate.
MARRIOTT VACATION CLUB DESTINATIONS TIMESHARE PROGRAMDuring our 2010 third quarter, we launched the points-based Marriott Vacation Club Destinations timeshare program (the “MVCD Program”) in North
America and the Caribbean. Under the MVCD Program, we sell beneficial interests in a domestic land trust. Based on the number of beneficial interestspurchased, MVCD members receive an annual allocation of Vacation Club Points to redeem for travel at numerous destinations. Although the existing rightsand privileges of owners of weeks-based intervals are unchanged, those owners now also have the option of enrolling in the Marriott Vacation ClubDestinations Exchange Program, which affords them the opportunity to trade their weeks-based intervals for Vacation Club Points usage each year, as well asto purchase additional product in increments of less than one week. Since the MVCD Program is a significant change from our prior approach to the timesharebusiness, we have focused our marketing efforts on existing owners, to encourage participation and purchase of additional product. Early results haveexceeded our expectations.
We believe the MVCD Program will appeal to a broader demographic than our prior weeks-based program by providing our owners with more flexibleusage options, including the use of points for tailored vacation experiences, and by allowing us to sell our resort system at all locations, including thosewhere few or no weeks were still available. We expect that the MVCD Program will result in fewer resorts under construction at any given time and allow usto better leverage successful sales centers at completed resorts. With less invested in inventory, the MVCD Program also should allow us to improve returnson investment.
Revenue recognition for the MVCD Program follows our Timeshare Points-Based Use System revenue recognition policy (see Footnote No. 1,“Summary of Significant Accounting Policies,” of the Notes to our Financial Statements). The timing of revenue recognition for this program approximatescontract sales because we expect to sell fully completed inventory for the foreseeable future. With more efficient inventory management, we expect to havelower unsold maintenance fee expense, which should enhance profitability over time. In addition to capitalized costs for internally developed software andlicensing fees of $14 million, we incurred costs for the MVCD Program in 2010 of approximately $20 million (which included $12 million of start-up costs).Costs in excess of enrollment revenue for the new points-based program totaled $13 million and is reflected in our Income Statement in Timeshare sales andservice, net of direct expenses.
Given the amount of inventory we have, we do not expect to develop new timeshare resorts in the near term.
PROPOSED SPIN-OFF OF TIMESHARE OPERATIONS AND DEVELOPMENT BUSINESSOn February 14, 2011, we announced a plan to split the company’s businesses into two separate, publicly traded companies. Under the plan, we expect
to spin off our timeshare operations and development business as a new independent company through a special tax-free dividend to our shareholders in late2011. Please see Footnote No. 24, “Subsequent Event,” of the Notes to our Financial Statements for additional information.
DISCONTINUED OPERATIONSSynthetic Fuel
Prior to 2008 we operated four coal-based synthetic fuel production facilities (the “Facilities”). Because tax credits under IRC Section 45K were notavailable for coal-based synthetic fuels produced or sold after calendar year 2007, and because we estimated that high oil prices during 2007 would result inthe phase-out of a significant portion of the tax credits available for synthetic fuel produced and sold in 2007, we shut down the Facilities in our 2007 fourthquarter and permanently ceased production of synthetic fuel. Accordingly, we now report this business as a discontinued operation. See Footnote No. 3,“Discontinued Operations - Synthetic Fuel,” of the Notes to our Financial Statements for additional information regarding our former Synthetic Fuel segment.
SHARE-BASED COMPENSATIONUnder our 2002 Comprehensive Stock and Cash Incentive Plan, we award: (1) stock options to purchase our Class A Common Stock (“Stock Option
Program”); (2) stock appreciation rights (“SARs”) for our Class A Common Stock (“Stock Appreciation Program”); (3) restricted stock units (“RSUs”) of ourClass A Common Stock; and (4) deferred stock units. We grant awards at exercise prices or strike prices that are equal to the market price of our Class ACommon Stock on the date of grant.
53
Table of Contents
During 2010, we granted 3.8 million RSUs and 1.1 million Employee SARs. See Footnote No. 4, “Share-Based Compensation,” of the Notes to ourFinancial Statements for additional information.
NEW ACCOUNTING STANDARDSSee Footnote No. 1, “Summary of Significant Accounting Policies,” of the Notes to our Financial Statements for information related to our adoption of
new accounting standards in 2010 and for information on our anticipated adoption of recently issued accounting standards.
LIQUIDITY AND CAPITAL RESOURCESCash Requirements and Our Credit Facilities
Our Credit Facility, which expires on May 14, 2012, and associated letters of credit, provide for $2.4 billion of aggregate effective borrowings.Borrowings under the Credit Facility bear interest at the London Interbank Offered Rate (LIBOR) plus a fixed spread based on the credit ratings for our publicdebt. We also pay quarterly fees on the Credit Facility at a rate based on our public debt rating. For additional information on our Credit Facility, includingparticipating financial institutions, see Exhibit 10, “Amended and Restated Credit Agreement,” to our Current Report on Form 8-K filed with the SEC onMay 16, 2007. Although our Credit Facility does not expire until 2012, we expect that we may extend or replace it during 2011.
The Credit Facility contains certain covenants, including a single financial covenant that limits our maximum leverage (consisting of Adjusted TotalDebt to Consolidated EBITDA, each as defined in the Credit Facility) to not more than 4 to 1. Our outstanding public debt does not contain a correspondingfinancial covenant or a requirement that we maintain certain financial ratios. We currently satisfy the covenants in our Credit Facility and public debtinstruments, including the leverage covenant under the Credit Facility, and do not expect the covenants to restrict our ability to meet our anticipatedborrowing and guarantee levels or increase those levels should we need to do so in the future.
We believe the Credit Facility, together with cash we expect to generate from operations and our ability to raise capital, remains adequate to meet ourshort-term and long-term liquidity requirements, finance our long-term growth plans, meet debt service, and fulfill other cash requirements.
At year-end 2010, our available borrowing capacity amounted to $2.831 billion and reflected borrowing capacity of $2.326 billion under our CreditFacility and our cash balance of $505 million. We calculate that borrowing capacity by taking $2.404 billion of effective aggregate bank commitments underour Credit Facility and subtracting $78 million of outstanding letters of credit under our Credit Facility. During 2010, we repaid our outstanding CreditFacility borrowings and had no outstanding balance at year-end. As noted in the previous paragraphs, we anticipate that this available capacity will beadequate to fund our liquidity needs. Since we continue to have ample flexibility under the Credit Facility’s covenants, we also expect that undrawn bankcommitments under the Credit Facility will remain available to us even if business conditions were to deteriorate markedly.
Cash from OperationsCash from operations, depreciation expense, and amortization expense for the last three fiscal years are as follows:
($ in millions) 2010 2009 2008 Cash from operations $1,151 $868 $641 Depreciation expense 138 151 155 Amortization expense 40 34 35
Our ratio of current assets to current liabilities was roughly 1.4 to 1.0 at year-end 2010 and 1.2 to 1.0 at year-end 2009. We minimize working capitalthrough cash management, strict credit-granting policies, and aggressive collection efforts. We also have significant borrowing capacity under our CreditFacility should we need additional working capital.
54
Table of Contents
Our ratios of earnings to fixed charges for the last five fiscal years, the calculations of which are detailed in Exhibit 12 to our 2010 Annual Report onForm 10-K, are as follows:
Fiscal Years2010 2009 2008 2007 20062.9x * 3.1x 4.3x 5.3x * In 2009, earnings were inadequate to cover fixed charges by approximately $364 million.
Timeshare Cash Flows. In conjunction with our adoption of the new Transfers of Financial Assets and Consolidation standards in the 2010 firstquarter, as discussed in more detail in Footnote No. 1, “Summary of Significant Accounting Policies,” of the Notes to our Financial Statements we no longeraccount for note receivable securitizations as sales, but rather as secured borrowings as defined in the new standards, and accordingly did not recognize gainsor losses on the 2010 notes receivable securitization nor do we expect to recognize gains or losses on future note receivable securitizations. As part of ouradoption of the new standards, we classify the following 2010 activities as “Financing Activities” in our Consolidated Statement of Cash Flows:(1) payments on the newly recorded debt obligations as repayments of long-term debt ($231 million); (2) note repurchases (classified in “Timeshare activity,net” under “Operating Activities” for 2009 and 2008) as repayments of long-term debt ($93 million); and (3) proceeds on any note securitizations as issuanceof long-term debt ($215 million) (classified in “Timeshare activity, net” under “Operating Activities” for 2009 and 2008). Also, we no longer have any cashflow activity related to residual interests or servicing assets. We will continue to classify any collections on held notes receivable, as well as the notesreceivable we reestablished in the 2010 first quarter associated with past securitization transactions, as “Timeshare activity, net” in “Operating Activities.”
In response to lower demand for our Timeshare products, we have correspondingly reduced our projected investment in new Timeshare development.While our Timeshare segment historically generates positive operating cash flow, year-to-year cash flow varies based on the timing of both cash outlays forthe acquisition and development of new resorts and cash received from purchaser financing. We include timeshare reportable sales we finance in cash fromoperations when we collect cash payments. The following table shows the net operating activity from our Timeshare segment (which does not include theportion of income from continuing operations from our Timeshare segment). In 2010, 2009, and 2008, new Timeshare segment mortgages were $256 million,$302 million, and $747 million, respectively, and collections totaled $347 million (which included collections on securitized notes of $230 million), $155million, and $222 million, respectively. ($ in millions) 2010 2009 2008 Timeshare segment development less than (in excess of) cost of sales $ 15 $ (4) $(299) Timeshare segment collections (net of new mortgages) 91 (147) (525) Note repurchases 0 (81) (56) Financially reportable sales less than closed sales 58 29 126 Note securitization gains 0 (37) (16) Note securitization proceeds 0 349 237 Collection on retained interests in securitized notes and servicing fees 0 82 102 Other cash inflows (outflows) 52 (45) 33
Net cash inflows (outflows) from Timeshare segment activity $216 $ 146 $(398)
See Footnote No. 13, “Long-term Debt,” of the Notes to our Financial Statements for additional information on the failure of some Timesharesecuritized notes receivable pools to perform within established parameters and the resulting redirection of cash flows. In 2010, seven securitized notesreceivable pools reached performance triggers in different months throughout the year as a result of increased defaults. As of year-end 2010, of the sevenpools out of compliance during 2010, loan performance had improved sufficiently in six pools to cure the performance triggers, leaving one pool out ofcompliance. Approximately $6 million of cash flows in 2010 and $17 million of cash flows in 2009 were redirected as a result of reaching the performancetriggers for those years. None of our pools experienced performance triggers in 2008, so no cash flow was redirected during that year.
On November 12, 2010, we securitized a pool of approximately $229 million in timeshare mortgage loans to a newly formed special purpose entity(the “2010-1 Trust”). Simultaneous with the securitization, investors purchased approximately $218 million in Timeshare Loan Backed Notes from the 2010-1 Trust in a private placement in two classes. Class A Notes totaling approximately $195 million with an interest rate of 3.54 percent and Class B Notestotaling approximately $23 million with an interest rate of 4.52 percent. As consideration for our securitization of the timeshare mortgage loans, we receivedcash proceeds of approximately $215 million, net of costs, and a subordinated residual interest in the 2010-1 Trust, through which we expect to realize theremaining value of the mortgage loans over time. Under the new Transfers of Financial Assets and Consolidation standards, we accounted for this transactionas a secured borrowing in 2010 and we did not record a gain or loss.
55
Table of Contents
On October 20, 2010, we exercised our option for the Term 2002 transaction to repurchase all outstanding collateral, payoff and redeem all outstandingbonds, and terminate the associated trust, which resulted in cash outflows from the Company of approximately $25 million.
On March 9, 2009, we completed a private placement of approximately $205 million of floating-rate Timeshare Loan Backed Notes with a bank-administered commercial paper conduit. We contributed approximately $284 million of notes receivable originated by our Timeshare segment in connectionwith the securitization of timeshare interval and fractional ownership products to a newly formed special purpose entity (the “2009-1 Trust”). On the sameday, the 2009-1 Trust issued approximately $205 million of the 2009-1 Trust’s notes. In connection with the private placement of notes receivable, wereceived proceeds of approximately $181 million, net of costs, and retained $94 million of residual interests in the special purpose entity, which included$81 million of notes we effectively owned after the transfer and $13 million related to the servicing assets and interest only strip. We measured all residualinterests at fair market value on the date of the transfer. We recorded the notes that we effectively owned after the transfer as notes receivable. In connectionwith this March 2009 note securitization, we recorded a $1 million loss, which we included in the “Timeshare sales and services” line item in our IncomeStatement.
On October 21, 2009, we securitized a pool of approximately $380 million in timeshare mortgage loans to a newly formed special purpose entity (the“2009-2 Trust”). Simultaneous with the securitization, investors purchased $317 million of 4.809 percent Timeshare Loan Backed Notes from the 2009-2Trust in a private placement. As part of this transaction, we paid off the notes that the 2009-1 Trust issued in March 2009 and reacquired approximately $233million of timeshare mortgage loans that were released from the 2009-1 Trust. We included approximately $218 million of these reacquired loans in theOctober 21, 2009 securitization. As consideration for our securitization of the timeshare mortgage loans, we received cash proceeds of approximately $168million and a subordinated residual interest in the 2009-2 Trust, through which we expect to realize the remaining value of the mortgage loans over time.These cash proceeds are net of approximately $145 million paid to the commercial paper conduit to unwind the first quarter transaction. In connection withthis October 2009 note securitization, we recorded a $38 million gain, which we included in the “Timeshare sales and services” line item in our IncomeStatement.
On June 10, 2008, we securitized to a newly formed special purpose entity (the “2008-1 Trust”) $300 million of notes receivable originated by ourTimeshare segment in connection with the sale of timeshare interval and fractional products. On the same day, the 2008-1 Trust issued $246 million of the2008-1 Trust’s notes. In connection with the securitization of notes receivable, we received net proceeds of $237 million. We retained residual interests witha fair value on the day of sale of $93 million. We recorded note securitization gains totaling $16 million in 2008, which was net of a $12 million chargerelated to hedge ineffectiveness which we included in the “Timeshare sales and services” line item in our Income Statement.
We had residual interests of $214 million at year-end 2009, which we recorded in the accompanying Balance Sheet as other long-term receivables of$144 million and other current assets of $70 million. Our servicing assets and residual interests, which we measured at year-end 2009 using Level 3 inputs inthe fair value measurement hierarchy (which we described in our 2009 Form 10-K in Footnote No. 5, “Fair Value Measurements”), accounted for 91 percent ofthe total fair value of our financial assets at year-end 2009 that were required to be measured at fair value using the then applicable fair value measurementguidance. We treated the residual interests, including servicing assets, as trading securities under the provisions for accounting for certain investments in debtand equity securities, and accordingly, we recorded realized and unrealized gains or losses related to these assets in the “Timeshare sales and services”revenue caption in our Income Statements. During 2009 and 2008, we recorded trading gains of $18 million and losses of $9 million, respectively. SeeFootnote No. 1, “Summary of Significant Accounting Policies,” of the Notes to our Financial Statements for additional information on residual interestseliminated as part of the adoption of the new Transfers of Financial Assets and Consolidation standards in the first quarter of 2010.
For additional information on our timeshare note securitizations, including a discussion of the cash flows on securitized notes, see Footnote No. 12,“Asset Securitizations,” of the Notes to our Financial Statements. See also Footnote No. 1, “Summary of Significant Accounting Policies,” and FootnoteNo. 20, “Variable Interest Entities,” of the Notes to our Financial Statements for the impact of adoption of the new Transfers of Financial Assets andConsolidation standards.
We estimate that, for the 20-year period from 2011 through 2030, the cash flow associated with completing all phases of our existing portfolio ofowned timeshare properties will be approximately $2.8 billion. This estimate is based on our current development plans, which remain subject to change.
56
Table of Contents
Investing Activities Cash FlowsCapital Expenditures and Other Investments. We made capital expenditures of $307 million in 2010, $147 million in 2009, and $357 million in
2008 that included expenditures related to the development and construction of new hotels and acquisitions of hotel properties, as well as improvements toexisting properties and systems initiatives. Timeshare segment development expenditures, which we include in “Cash from Operations,” as noted in thatsection, are not reflected in these numbers. Capital expenditures increased primarily due to our purchase of two hotel properties in 2010. Over time, we havesold lodging properties under development subject to long-term management agreements. The ability of third-party purchasers to raise the necessary debt andequity capital depends in part on the perceived risks inherent in the lodging industry and other constraints inherent in the capital markets as a whole. Wemonitor the status of the capital markets and regularly evaluate the potential impact on our business operations of changes in capital market conditions. Weexpect to continue to make selective and opportunistic investments in connection with adding units to our lodging business. These investments includeloans and noncontrolling equity investments.
Fluctuations in the values of hotel real estate generally have little impact on the overall results of our Lodging and Timeshare segments because: (1) weown less than one percent of the total number of hotels that we operate or franchise; (2) management and franchise fees are generally based upon hotelrevenues and profits rather than current hotel property values; and (3) our management agreements generally do not terminate upon hotel sale or foreclosure.
Dispositions. Property and asset sales generated cash proceeds of $114 million in 2010, $2 million in 2009, and $38 million in 2008.
Loan Activity. From time to time we make loans to owners of hotels that we operate or franchise. Collections and sales for such loans, net of advancesduring 2010 and 2009, amounted to net loan advances of $6 million in 2010 and net loan advances of $45 million in 2009. At year-end 2010, we had nosenior loans and $191 million in mezzanine and other loans (including a current portion of $7 million) outstanding, compared with $1 million in senior loans(including a current portion of $1 million) and $195 million in mezzanine and other loans (including a current portion of $95 million) outstanding at year-end 2009. In 2010, our notes receivable balance associated with senior, mezzanine, and other loans decreased by $4 million and primarily reflected thefunding and collection of several loans offset by the reserves against loans. See the “Senior, Mezzanine, and Other Loans” caption in Footnote No. 1,“Summary of Significant Accounting Policies,” of the Notes to our Financial Statements for additional information.
Equity and Cost Method Investments. Cash outflows of $29 million in 2010, $28 million in 2009, and $25 million in 2008 associated with equity andcost method investments primarily reflects our investments in a number of joint ventures.
Cash from Financing ActivitiesDebt. Debt increased by $531 million in 2010, to $2,829 million at year-end 2010 from $2,298 million at year-end 2009, and reflected consolidation
(in conjunction with our adoption of the new Transfers of Financial Assets and Consolidation standards) of debt with a balance at year-end 2010 of $1,016million, partially offset by decreased borrowings under our Credit Facility of $425 million and other net debt decreases of $60 million. Debt decreased by$797 million in 2009, to $2,298 million at year-end 2009 from $3,095 million at year-end 2008, and reflected a $544 million decrease in borrowings underour Credit Facility, the repayment, upon maturity, of $79 million (including interest) of Series C Senior Notes in 2009, the repurchase of $119 million inbook value ($122 million in principal amount) of Senior Notes across multiple series, and other debt decreases of $57 million.
Our financial objectives include diversifying our financing sources, optimizing the mix and maturity of our long-term debt and reducing our workingcapital. At year-end 2010, our long-term debt had an average interest rate of 5.6 percent and an average maturity of approximately 8.9 years. The ratio offixed-rate long-term debt to total long-term debt was 0.99 to 1.0 at year-end 2010.
See the “Cash Requirements and Our Credit Facilities,” caption within this “Liquidity and Capital Resources” section for additional information onour Credit Facility.
During 2010, we repaid all outstanding borrowings under our Credit Facility, which had a balance outstanding at year-end 2009 of $425 million.
In 2009, we repurchased $122 million principal amount of our Senior Notes in the open market, across multiple series. We recorded a gain of $21million for the debt extinguishment representing the difference between the acquired debt’s purchase price of $98 million and its carrying amount of $119million. In 2008, we repurchased $109 million of our Senior Notes in the open market, across multiple series. We recorded a gain of $28 million for the debtextinguishment
57
Table of Contents
representing the difference between the acquired debt’s purchase price of $77 million and its carrying amount of $105 million of the debt.
Share Repurchases. We purchased 1.5 million shares of our Class A Common Stock in 2010 at an average price of $39.02 per share, did not purchaseany shares in 2009, and purchased 11.9 million shares in 2008 at an average price of $31.18 per share. On November 4, 2010, our Board of Directorsauthorized the purchase of 4 million additional shares, bringing the total outstanding purchase authorization on that date to approximately 25 million shares.We purchase shares in the open market and in privately negotiated transactions. As of year-end 2010, 23.8 million shares remained available for repurchaseunder authorizations from our Board of Directors.
Dividends. Our Board of Directors declared a cash dividend of $0.04 per share on April 9, May 7, and August 5, 2010, respectively, and a cashdividend of $0.0875 per share on November 4, 2010.
Contractual Obligations and Off Balance Sheet ArrangementsThe following table summarizes our contractual obligations as of year-end 2010:
Contractual Obligations Payments Due by Period
($ in millions) Total Less Than
1 Year 1-3 Years 3-5 Years After
5 Years Debt $3,424 $ 282 $ 1,256 $ 744 $1,142 Capital lease obligations 9 1 2 2 4 Operating leases where we are the primary obligor:
Recourse 1,174 128 243 206 597 Non-recourse 337 15 31 26 265
Operating leases where we are secondarily liable 58 18 27 12 1 Purchase obligations 11 8 2 1 0 Other long-term liabilities 108 0 21 6 81
Total contractual obligations $5,121 $ 452 $ 1,582 $ 997 $2,090
Includes principal as well as interest payments.
The preceding table does not reflect unrecognized tax benefits as of year-end 2010 of $39 million. As a large taxpayer, we are under continual audit bythe IRS and other taxing authorities. Although we do not anticipate that those audits will have a significant impact on our unrecognized tax benefit balanceduring the next 52 weeks, it remains possible that our liability for unrecognized tax benefits could change over that time period. See Footnote No. 2, “IncomeTaxes,” of the Notes to our Financial Statements for additional information.
The following table summarizes our guarantee commitments as of year-end 2010:
Guarantee Commitments Amount of Guarantee Commitments Expiration By Period
($ in millions) Total Amounts
Committed Less Than
1 Year 1-3 Years 3-5 Years After
5 Years Total guarantees where we are the primary obligor $ 199 $ 33 $ 59 $ 50 $ 57 Total guarantees where we are secondarily liable 185 43 87 29 26
Total guarantee commitments $ 384 $ 76 $ 146 $ 79 $ 83
In addition to the guarantees noted in the preceding table, we have provided two project completion guarantees in favor of lenders:
• A guarantee with an estimated aggregate total cost of $592 million, and a $16 million carrying value for our associated liability as of year-end2010, as further discussed in Footnote No. 20, “Variable Interest Entities,” of the Notes to our Financial Statements; and
• A guarantee with an estimated aggregate total cost of Canadian $491 million ($491 million), and a $3 million carrying value for our associated
liability as of year-end 2010. During 2010, our joint venture partners executed documents indemnifying us for any payments that may berequired in connection with this guarantee.
58
(1)
(1)
(1)
Table of Contents
For additional information on these project completion guarantees, including our pro rata ownership percentages in the associated entities, as well asadditional information on our guarantees, including their nature and the circumstances under which they were entered into, see the “Guarantees” captionwithin Footnote No. 16, “Contingencies,” of the Notes to our Financial Statements.
In addition to the guarantees described in the preceding paragraphs, in conjunction with financing obtained for specific projects or properties ownedby joint ventures in which we are a party, we may provide industry standard indemnifications to the lender for loss, liability or damage occurring as a result ofour actions or the actions of the other joint venture owner.
We also had the following other commitments, including loan and investment commitments, outstanding at year-end 2010:
Loan and Investment Commitments Amount of Loan and Investment Commitments Expected Funding By Period
($ in millions) Total Amounts
Committed Less Than
1 Year 1-3 Years 3-5 Years After
5 Years Total loan commitments $ 1 $ 0 $ 1 $ 0 $ 0 Total investment commitments 129 95 3 31 0
Total other commitments $ 130 $ 95 $ 4 $ 31 $ 0
For further information on our loan and investment commitments, including the nature of the commitments and their expirations, see the“Commitments and Letters of Credit” caption within Footnote No. 16, “Contingencies,” of the Notes to our Financial Statements.
At year-end 2010, we also had $81 million of letters of credit outstanding ($78 million under our Credit Facility and $3 million outside the CreditFacility), the majority of which related to our self-insurance programs. Surety bonds issued as of year-end 2010 totaled $219 million, the majority of whichwere requested by federal, state or local governments related to our lodging operations, including our Timeshare segment and self-insurance programs.
In the normal course of the hotel management business, we enter into purchase commitments to manage the daily operating needs of hotels we managefor owners. Since we are reimbursed from the cash flows of the hotels, these obligations have minimal impact on our net income and cash flow.
RELATED PARTY TRANSACTIONSEquity Method Investments
We have equity method investments in entities that own properties for which we provide management and/or franchise services and receive fees. Insome cases we provide loans, preferred equity or guarantees to these entities. Our ownership interests in these equity method investments generally variesfrom 10 to 49 percent. For other information regarding these equity method investments, including the impact to our financial statements of transactions withthese related parties, see Footnote No. 22, “Related Party Transactions,” of the Notes to our Financial Statements.
CRITICAL ACCOUNTING ESTIMATESThe preparation of financial statements in accordance with GAAP requires management to make estimates and assumptions that affect reported
amounts and related disclosures. Management considers an accounting estimate to be critical if: (1) it requires assumptions to be made that were uncertain atthe time the estimate was made; and (2) changes in the estimate, or different estimates that could have been selected, could have a material effect on ourconsolidated results of operations or financial condition.
While we believe that our estimates, assumptions, and judgments are reasonable, they are based on information presently available. Actual results maydiffer significantly. Additionally, changes in our assumptions, estimates or assessments as a result of unforeseen events or otherwise could have a materialimpact on our financial position or results of operations.
Management has discussed the development and selection of its critical accounting estimates with the Audit Committee of the Board of Directors, andthe Audit Committee has reviewed the disclosure presented below relating to them.
Please see Footnote No. 1, “Summary of Significant Accounting Policies,” of the Notes to our Financial Statements for further information on ourcritical accounting policies, including our policies on:
59
Table of Contents
Marriott Rewards and The Ritz-Carlton Rewards, our frequent guest rewards programs, including how members earn points, how we determine the fair valueof our redemption obligation, and how we recognize revenue related to these programs;
Valuation of Goodwill, including how we evaluate the fair value of goodwill and when we record an impairment loss on goodwill;
Valuation of Intangibles and Long-Lived Assets, including how we evaluate the fair value of intangibles and long-lived assets and when we recordimpairment losses on intangibles and long-lived assets;
Valuation of Investments in Ventures, including information on how we evaluate the fair value of investments in ventures and when we record impairmentlosses on investments in ventures;
Legal Contingencies, including information on how we account for legal contingencies;Income Taxes, including information on how we determine our current year amounts payable or refundable, as well as our estimate of deferred tax assets andliabilities;
Loan Loss Reserves for Senior, Mezzanine, and Other Loans and for Loans to Timeshare Owners, including information on how we measure impairment oneach of these types of loans.
OTHER MATTERSInflation
Inflation has been moderate in recent years and has not had a significant impact on our businesses. Item 7A. Quantitative and Qualitative Disclosures About Market Risk.
We are exposed to market risk from changes in interest rates, currency exchange rates, and debt prices. We manage our exposure to these risks bymonitoring available financing alternatives, through development and application of credit granting policies and by entering into derivative arrangements.We do not foresee any significant changes in either our exposure to fluctuations in interest rates or currency rates or how such exposure is managed in thefuture.
We are exposed to interest rate risk on our floating-rate notes receivable and the fair value of our fixed-rate notes receivable. Changes in interest ratesalso impact the fair value of our fixed-rate long-term debt.
We are also subject to risk from changes in debt prices from our investments in debt securities. We account for our investments as available-for-salesecurities under the guidance for accounting for certain investments in debt and equity securities. At year-end 2010, our investments had a fair value of $18million.
We use derivative instruments, including cash flow hedges, net investment in non-U.S. operations hedges, and other derivative instruments, as part ofour overall strategy to manage our exposure to market risks associated with fluctuations in interest rates and currency exchange rates. As a matter of policy,we only enter into transactions that we believe will be highly effective at offsetting the underlying risk, and we do not use derivatives for trading orspeculative purposes. At year-end 2010, our Balance Sheet included a $1 million liability for currency exchange derivatives and a $1 million liability forinterest rate swaps not designated as hedging instruments. Please see Footnote No. 1, “Summary of Significant Accounting Policies,” of the Notes to ourFinancial Statements for additional information associated with derivative instruments.
60
Table of Contents
The following table sets forth the scheduled maturities and the total fair value as of year-end 2010 for our financial instruments that are impacted bymarket risks: Maturities by Period
($ in millions) 2011 2012 2013 2014 2015 There-after
TotalCarryingAmount
TotalFair
Value Assets-Maturities represent expected principal receipts, fair values represent assets.
Timeshare segment notes receivable-non-securitized $ 55 $ 28 $ 24 $ 20 $ 19 $ 79 $ 225 $ 231 Average interest rate 11.78%
Timeshare segment notes receivable-securitized $ 118 $ 123 $ 130 $ 131 $ 126 $ 400 $ 1,028 $ 1,219 Average interest rate 13.07%
Fixed-rate notes receivable $ 3 $ 21 $ 2 $ 4 $ 75 $ 8 $ 113 $ 90 Average interest rate 6.92%
Floating-rate notes receivable $ 4 $ 0 $ 8 $ 1 $ 0 $ 65 $ 78 $ 47 Average interest rate 3.42%
Liabilities-Maturities represent expected principal payments, fair values represent liabilities.
Fixed-rate debt $ (7) $(354) $(404) $ (6) $(311) $(702) $(1,784) $(1,916) Average interest rate 5.56%
Non-recourse debt associated with securitized timeshare segment notes receivable $(126) $(131) $(138) $(139) $(134) $(348) $(1,016) $(1,047) Average interest rate 4.96% Item 8. Financial Statements and Supplementary Data.
The following financial information is included on the pages indicated: Page Management’s Report on Internal Control Over Financial Reporting 62
Report of Independent Registered Public Accounting Firm 63
Report of Independent Registered Public Accounting Firm 64
Consolidated Statements of Income 65
Consolidated Balance Sheets 66
Consolidated Statements of Cash Flows 67
Consolidated Statements of Comprehensive Income 68
Consolidated Statements of Shareholders’ Equity 69
Notes to Consolidated Financial Statements 70
61
Table of Contents
MANAGEMENT’S REPORT ONINTERNAL CONTROL OVER FINANCIAL REPORTING
Management of Marriott International, Inc. (the “Company”) is responsible for establishing and maintaining adequate internal control over financialreporting and for the assessment of the effectiveness of internal control over financial reporting. The Company’s internal control over financial reporting isdesigned to provide reasonable assurance regarding the reliability of financial reporting and the preparation of the consolidated financial statements inaccordance with U.S. generally accepted accounting principles.
The Company’s internal control over financial reporting includes those policies and procedures that: (1) pertain to the maintenance of records that, inreasonable detail, accurately and fairly reflect the Company’s transactions and dispositions of the Company’s assets; (2) provide reasonable assurance thattransactions are recorded as necessary to permit preparation of the consolidated financial statements in accordance with U.S. generally accepted accountingprinciples, and that receipts and expenditures of the Company are being made only in accordance with authorizations of the Company’s management anddirectors; and (3) provide reasonable assurance regarding prevention or timely detection of unauthorized acquisition, use or disposition of the Company’sassets that could have a material effect on the consolidated financial statements.
Because of its inherent limitations, internal control over financial reporting may not prevent or detect misstatements. Also, projections of anyevaluation of effectiveness to future periods are subject to the risk that controls may become inadequate because of changes in conditions, or that the degreeof compliance with the policies or procedures may deteriorate.
In connection with the preparation of the Company’s annual consolidated financial statements, management has undertaken an assessment of theeffectiveness of the Company’s internal control over financial reporting as of December 31, 2010, based on criteria established in Internal Control-IntegratedFramework issued by the Committee of Sponsoring Organizations of the Treadway Commission (the “COSO criteria”).
Based on this assessment, management has concluded that, applying the COSO criteria, as of December 31, 2010, the Company’s internal control overfinancial reporting was effective to provide reasonable assurance of the reliability of financial reporting and the preparation of financial statements forexternal purposes in accordance with U.S. generally accepted accounting principles.
Ernst & Young LLP, the independent registered public accounting firm that audited the Company’s consolidated financial statements included in thisreport, has issued an attestation report on the effectiveness of the Company’s internal control over financial reporting, a copy of which appears on the nextpage of this annual report.
62
Table of Contents
REPORT OF INDEPENDENT REGISTERED PUBLIC ACCOUNTING FIRM
The Board of Directors and Shareholders of Marriott International, Inc.:We have audited Marriott International, Inc.’s internal control over financial reporting as of December 31, 2010, based on criteria established in
Internal Control-Integrated Framework issued by the Committee of Sponsoring Organizations of the Treadway Commission (the COSO criteria). MarriottInternational, Inc.’s management is responsible for maintaining effective internal control over financial reporting and for its assessment of the effectiveness ofinternal control over financial reporting included in the accompanying Management’s Report on Internal Control Over Financial Reporting. Ourresponsibility is to express an opinion on the company’s internal control over financial reporting based on our audit.
We conducted our audit in accordance with the standards of the Public Company Accounting Oversight Board (United States). Those standards requirethat we plan and perform the audit to obtain reasonable assurance about whether effective internal control over financial reporting was maintained in allmaterial respects. Our audit included obtaining an understanding of internal control over financial reporting, assessing the risk that a material weaknessexists, testing and evaluating the design and operating effectiveness of internal control based on the assessed risk, and performing such other procedures aswe considered necessary in the circumstances. We believe that our audit provides a reasonable basis for our opinion.
A company’s internal control over financial reporting is a process designed to provide reasonable assurance regarding the reliability of financialreporting and the preparation of financial statements for external purposes in accordance with generally accepted accounting principles. A company’sinternal control over financial reporting includes those policies and procedures that (1) pertain to the maintenance of records that, in reasonable detail,accurately and fairly reflect the transactions and dispositions of the assets of the company; (2) provide reasonable assurance that transactions are recorded asnecessary to permit preparation of financial statements in accordance with generally accepted accounting principles, and that receipts and expenditures of thecompany are being made only in accordance with authorizations of management and directors of the company; and (3) provide reasonable assuranceregarding prevention or timely detection of unauthorized acquisition, use or disposition of the company’s assets that could have a material effect on thefinancial statements.
Because of its inherent limitations, internal control over financial reporting may not prevent or detect misstatements. Also, projections of anyevaluation of effectiveness to future periods are subject to the risk that controls may become inadequate because of changes in conditions, or that the degreeof compliance with the policies or procedures may deteriorate.
In our opinion, Marriott International, Inc. maintained, in all material respects, effective internal control over financial reporting as of December 31,2010, based on the COSO criteria.
We also have audited, in accordance with the standards of the Public Company Accounting Oversight Board (United States), the consolidated balancesheets of Marriott International, Inc. as of December 31, 2010 and January 1, 2010, and the related consolidated statements of income, comprehensiveincome, shareholders’ equity, and cash flows, for each of the three fiscal years in the period ended December 31, 2010, of Marriott International, Inc. and ourreport dated February 18, 2011 expressed an unqualified opinion thereon.
/s/ Ernst & Young LLP
McLean, VirginiaFebruary 18, 2011
63
Table of Contents
REPORT OF INDEPENDENT REGISTERED PUBLIC ACCOUNTING FIRM
The Board of Directors and Shareholders of Marriott International, Inc.:We have audited the accompanying consolidated balance sheets of Marriott International, Inc. as of December 31, 2010 and January 1, 2010, and the
related consolidated statements of income, comprehensive income, shareholders’ equity, and cash flows, for each of the three fiscal years in the period endedDecember 31, 2010. These financial statements are the responsibility of the Company’s management. Our responsibility is to express an opinion on thesefinancial statements based on our audits.
We conducted our audits in accordance with the standards of the Public Company Accounting Oversight Board (United States). Those standardsrequire that we plan and perform the audit to obtain reasonable assurance about whether the financial statements are free of material misstatement. An auditincludes examining, on a test basis, evidence supporting the amounts and disclosures in the financial statements. An audit also includes assessing theaccounting principles used and significant estimates made by management, as well as evaluating the overall financial statement presentation. We believe thatour audits provide a reasonable basis for our opinion.
In our opinion, the financial statements referred to above present fairly, in all material respects, the consolidated financial position of MarriottInternational, Inc. as of December 31, 2010 and January 1, 2010, and the consolidated results of its operations and its cash flows for each of the three fiscalyears in the period ended December 31, 2010, in conformity with U.S. generally accepted accounting principles.
As discussed in Note 1 to the consolidated financial statements, the Company changed its method of accounting for its qualified special purposeentities associated with past securitization transactions as a result of the adoption of Accounting Standards Update No. 2009-16, “Transfers and Servicing(Topic 860): Accounting for Transfers of Financial Assets” and Accounting Standards Update No. 2009-17, “Consolidations (Topic 810): Improvements toFinancial Reporting by Enterprises Involved with Variable Interest Entities,” effective January 2, 2010.
We also have audited, in accordance with the standards of the Public Company Accounting Oversight Board (United States), Marriott International,Inc.’s internal control over financial reporting as of December 31, 2010, based on criteria established in Internal Control-Integrated Framework issued by theCommittee of Sponsoring Organizations of the Treadway Commission and our report dated February 18, 2011, expressed an unqualified opinion thereon.
/s/ Ernst & Young LLP
McLean, VirginiaFebruary 18, 2011
64
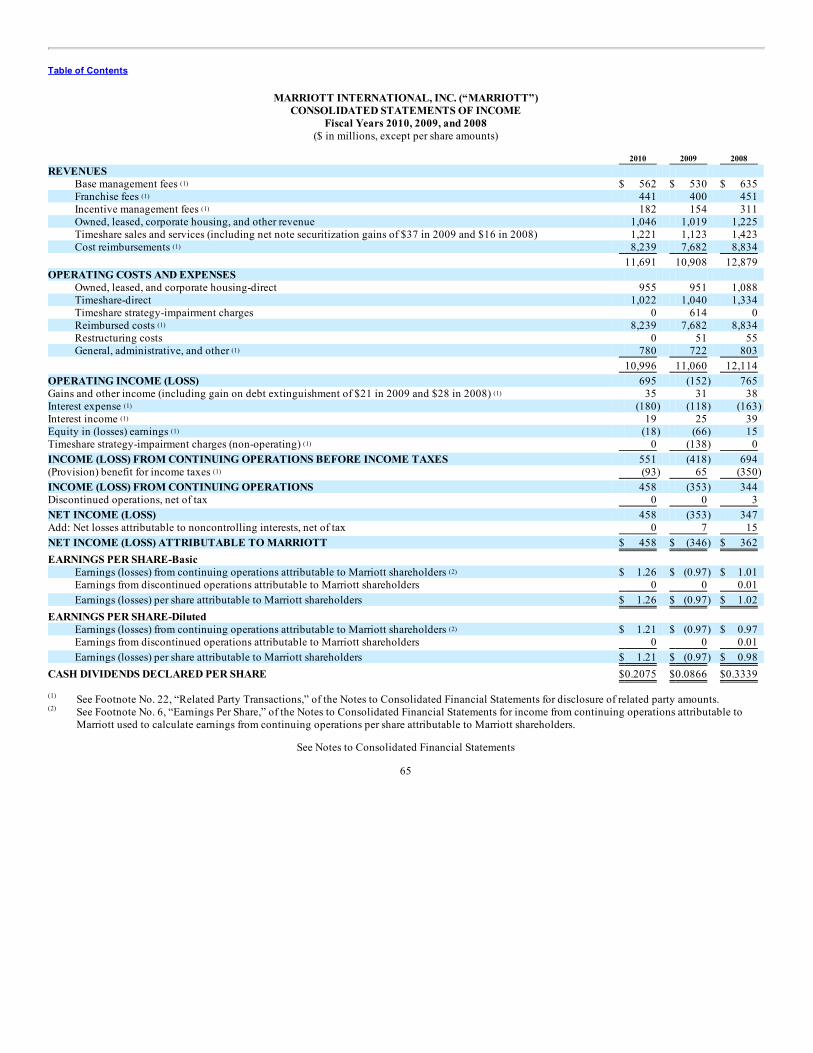
Table of Contents
MARRIOTT INTERNATIONAL, INC. (“MARRIOTT”)CONSOLIDATED STATEMENTS OF INCOME
Fiscal Years 2010, 2009, and 2008($ in millions, except per share amounts)
2010 2009 2008 REVENUES
Base management fees $ 562 $ 530 $ 635 Franchise fees 441 400 451 Incentive management fees 182 154 311 Owned, leased, corporate housing, and other revenue 1,046 1,019 1,225 Timeshare sales and services (including net note securitization gains of $37 in 2009 and $16 in 2008) 1,221 1,123 1,423 Cost reimbursements 8,239 7,682 8,834
11,691 10,908 12,879 OPERATING COSTS AND EXPENSES
Owned, leased, and corporate housing-direct 955 951 1,088 Timeshare-direct 1,022 1,040 1,334 Timeshare strategy-impairment charges 0 614 0 Reimbursed costs 8,239 7,682 8,834 Restructuring costs 0 51 55 General, administrative, and other 780 722 803
10,996 11,060 12,114 OPERATING INCOME (LOSS) 695 (152) 765 Gains and other income (including gain on debt extinguishment of $21 in 2009 and $28 in 2008) 35 31 38 Interest expense (180) (118) (163) Interest income 19 25 39 Equity in (losses) earnings (18) (66) 15 Timeshare strategy-impairment charges (non-operating) 0 (138) 0 INCOME (LOSS) FROM CONTINUING OPERATIONS BEFORE INCOME TAXES 551 (418) 694 (Provision) benefit for income taxes (93) 65 (350) INCOME (LOSS) FROM CONTINUING OPERATIONS 458 (353) 344 Discontinued operations, net of tax 0 0 3 NET INCOME (LOSS) 458 (353) 347 Add: Net losses attributable to noncontrolling interests, net of tax 0 7 15 NET INCOME (LOSS) ATTRIBUTABLE TO MARRIOTT $ 458 $ (346) $ 362 EARNINGS PER SHARE-Basic
Earnings (losses) from continuing operations attributable to Marriott shareholders $ 1.26 $ (0.97) $ 1.01 Earnings from discontinued operations attributable to Marriott shareholders 0 0 0.01 Earnings (losses) per share attributable to Marriott shareholders $ 1.26 $ (0.97) $ 1.02
EARNINGS PER SHARE-Diluted Earnings (losses) from continuing operations attributable to Marriott shareholders $ 1.21 $ (0.97) $ 0.97 Earnings from discontinued operations attributable to Marriott shareholders 0 0 0.01 Earnings (losses) per share attributable to Marriott shareholders $ 1.21 $ (0.97) $ 0.98
CASH DIVIDENDS DECLARED PER SHARE $0.2075 $0.0866 $0.3339
See Footnote No. 22, “Related Party Transactions,” of the Notes to Consolidated Financial Statements for disclosure of related party amounts.See Footnote No. 6, “Earnings Per Share,” of the Notes to Consolidated Financial Statements for income from continuing operations attributable toMarriott used to calculate earnings from continuing operations per share attributable to Marriott shareholders.
See Notes to Consolidated Financial Statements
65
(1)
(1)
(1)
(1)
(1)
(1)
(1)
(1)
(1)
(1)
(1)
(1)
(2)
(2)
(1)
(2)
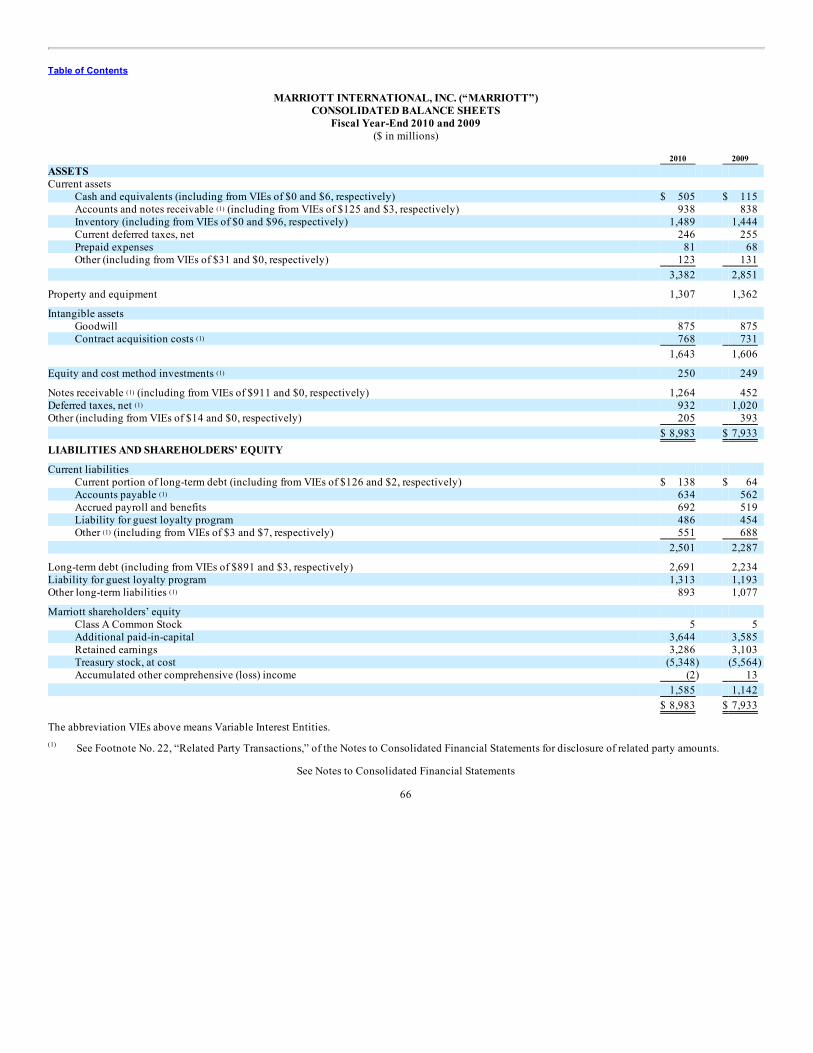
Table of Contents
MARRIOTT INTERNATIONAL, INC. (“MARRIOTT”)CONSOLIDATED BALANCE SHEETS
Fiscal Year-End 2010 and 2009($ in millions)
2010 2009 ASSETS Current assets
Cash and equivalents (including from VIEs of $0 and $6, respectively) $ 505 $ 115 Accounts and notes receivable (including from VIEs of $125 and $3, respectively) 938 838 Inventory (including from VIEs of $0 and $96, respectively) 1,489 1,444 Current deferred taxes, net 246 255 Prepaid expenses 81 68 Other (including from VIEs of $31 and $0, respectively) 123 131
3,382 2,851
Property and equipment 1,307 1,362
Intangible assets Goodwill 875 875 Contract acquisition costs 768 731
1,643 1,606
Equity and cost method investments 250 249
Notes receivable (including from VIEs of $911 and $0, respectively) 1,264 452 Deferred taxes, net 932 1,020 Other (including from VIEs of $14 and $0, respectively) 205 393
$ 8,983 $ 7,933 LIABILITIES AND SHAREHOLDERS’ EQUITY
Current liabilities Current portion of long-term debt (including from VIEs of $126 and $2, respectively) $ 138 $ 64 Accounts payable 634 562 Accrued payroll and benefits 692 519 Liability for guest loyalty program 486 454 Other (including from VIEs of $3 and $7, respectively) 551 688
2,501 2,287
Long-term debt (including from VIEs of $891 and $3, respectively) 2,691 2,234 Liability for guest loyalty program 1,313 1,193 Other long-term liabilities 893 1,077
Marriott shareholders’ equity Class A Common Stock 5 5 Additional paid-in-capital 3,644 3,585 Retained earnings 3,286 3,103 Treasury stock, at cost (5,348) (5,564) Accumulated other comprehensive (loss) income (2) 13
1,585 1,142 $ 8,983 $ 7,933
The abbreviation VIEs above means Variable Interest Entities.
See Footnote No. 22, “Related Party Transactions,” of the Notes to Consolidated Financial Statements for disclosure of related party amounts.
See Notes to Consolidated Financial Statements
66
(1)
(1)
(1)
(1)
(1)
(1)
(1)
(1)
(1)
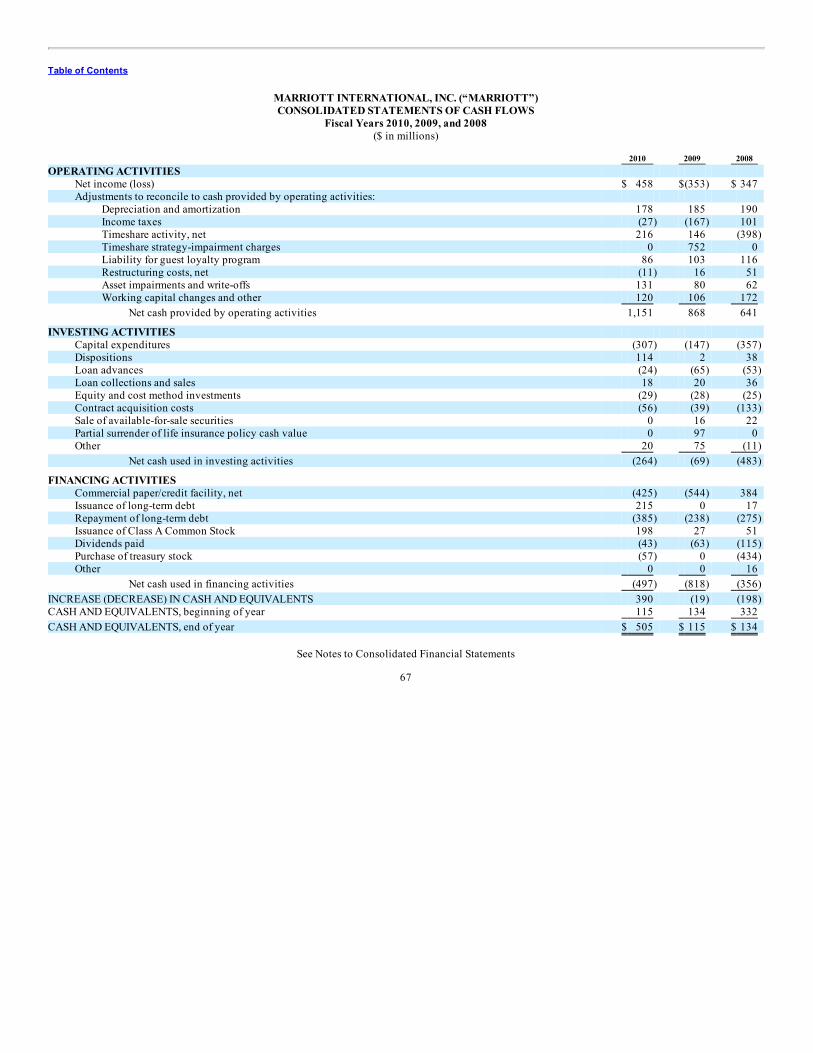
Table of Contents
MARRIOTT INTERNATIONAL, INC. (“MARRIOTT”)CONSOLIDATED STATEMENTS OF CASH FLOWS
Fiscal Years 2010, 2009, and 2008($ in millions)
2010 2009 2008 OPERATING ACTIVITIES
Net income (loss) $ 458 $(353) $ 347 Adjustments to reconcile to cash provided by operating activities:
Depreciation and amortization 178 185 190 Income taxes (27) (167) 101 Timeshare activity, net 216 146 (398) Timeshare strategy-impairment charges 0 752 0 Liability for guest loyalty program 86 103 116 Restructuring costs, net (11) 16 51 Asset impairments and write-offs 131 80 62 Working capital changes and other 120 106 172
Net cash provided by operating activities 1,151 868 641
INVESTING ACTIVITIES Capital expenditures (307) (147) (357) Dispositions 114 2 38 Loan advances (24) (65) (53) Loan collections and sales 18 20 36 Equity and cost method investments (29) (28) (25) Contract acquisition costs (56) (39) (133) Sale of available-for-sale securities 0 16 22 Partial surrender of life insurance policy cash value 0 97 0 Other 20 75 (11)
Net cash used in investing activities (264) (69) (483)
FINANCING ACTIVITIES Commercial paper/credit facility, net (425) (544) 384 Issuance of long-term debt 215 0 17 Repayment of long-term debt (385) (238) (275) Issuance of Class A Common Stock 198 27 51 Dividends paid (43) (63) (115) Purchase of treasury stock (57) 0 (434) Other 0 0 16
Net cash used in financing activities (497) (818) (356) INCREASE (DECREASE) IN CASH AND EQUIVALENTS 390 (19) (198) CASH AND EQUIVALENTS, beginning of year 115 134 332 CASH AND EQUIVALENTS, end of year $ 505 $ 115 $ 134
See Notes to Consolidated Financial Statements
67
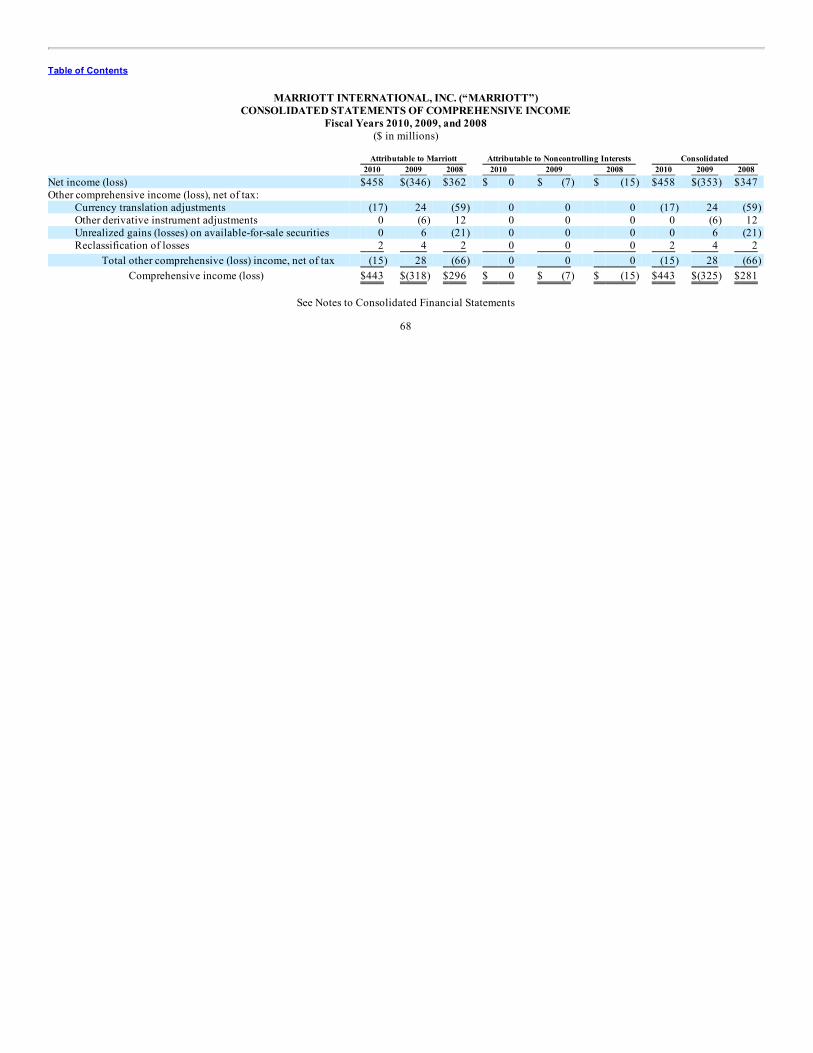
Table of Contents
MARRIOTT INTERNATIONAL, INC. (“MARRIOTT”)CONSOLIDATED STATEMENTS OF COMPREHENSIVE INCOME
Fiscal Years 2010, 2009, and 2008($ in millions)
Attributable to Marriott Attributable to Noncontrolling Interests Consolidated 2010 2009 2008 2010 2009 2008 2010 2009 2008 Net income (loss) $458 $(346) $362 $ 0 $ (7) $ (15) $458 $(353) $347 Other comprehensive income (loss), net of tax:
Currency translation adjustments (17) 24 (59) 0 0 0 (17) 24 (59) Other derivative instrument adjustments 0 (6) 12 0 0 0 0 (6) 12 Unrealized gains (losses) on available-for-sale securities 0 6 (21) 0 0 0 0 6 (21) Reclassification of losses 2 4 2 0 0 0 2 4 2
Total other comprehensive (loss) income, net of tax (15) 28 (66) 0 0 0 (15) 28 (66) Comprehensive income (loss) $443 $(318) $296 $ 0 $ (7) $ (15) $443 $(325) $281
See Notes to Consolidated Financial Statements
68
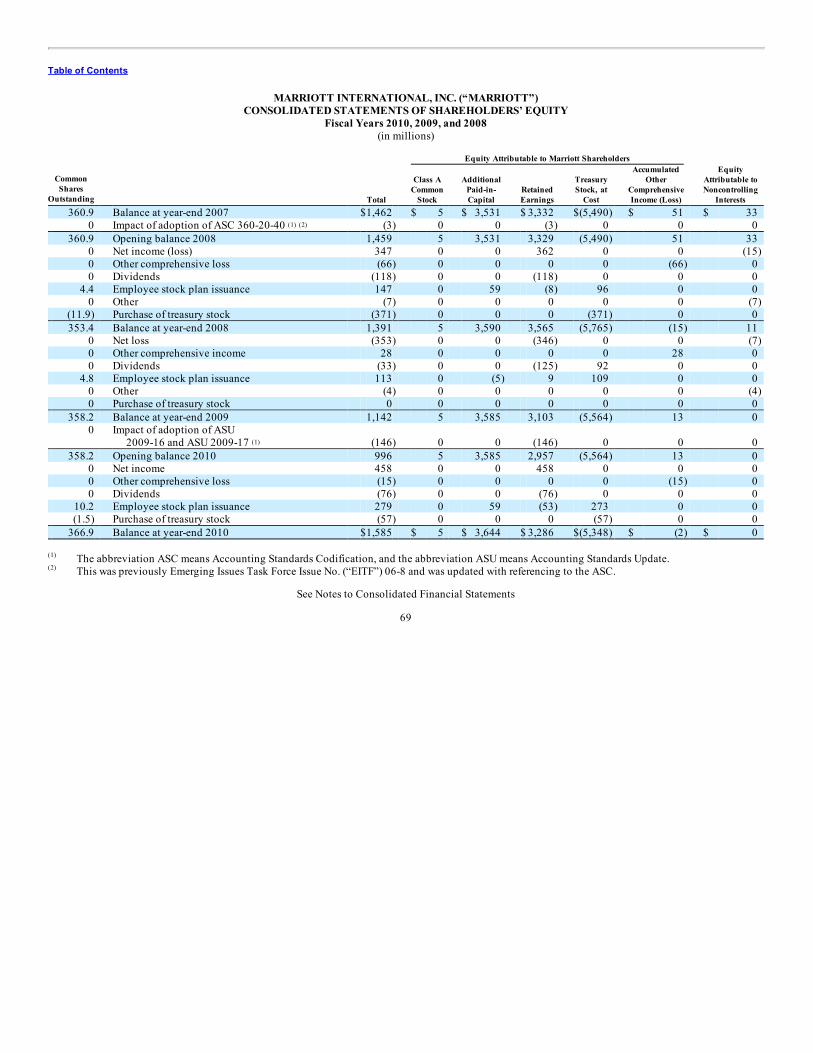
Table of Contents
MARRIOTT INTERNATIONAL, INC. (“MARRIOTT”)CONSOLIDATED STATEMENTS OF SHAREHOLDERS’ EQUITY
Fiscal Years 2010, 2009, and 2008(in millions)
Equity Attributable to Marriott Shareholders
CommonShares
Outstanding Total
Class ACommon
Stock
AdditionalPaid-in-Capital
RetainedEarnings
TreasuryStock, at
Cost
AccumulatedOther
ComprehensiveIncome (Loss)
EquityAttributable toNoncontrolling
Interests 360.9 Balance at year-end 2007 $1,462 $ 5 $ 3,531 $ 3,332 $(5,490) $ 51 $ 33 0 Impact of adoption of ASC 360-20-40 (3) 0 0 (3) 0 0 0 360.9 Opening balance 2008 1,459 5 3,531 3,329 (5,490) 51 33 0 Net income (loss) 347 0 0 362 0 0 (15) 0 Other comprehensive loss (66) 0 0 0 0 (66) 0 0 Dividends (118) 0 0 (118) 0 0 0 4.4 Employee stock plan issuance 147 0 59 (8) 96 0 0 0 Other (7) 0 0 0 0 0 (7) (11.9) Purchase of treasury stock (371) 0 0 0 (371) 0 0 353.4 Balance at year-end 2008 1,391 5 3,590 3,565 (5,765) (15) 11 0 Net loss (353) 0 0 (346) 0 0 (7) 0 Other comprehensive income 28 0 0 0 0 28 0 0 Dividends (33) 0 0 (125) 92 0 0 4.8 Employee stock plan issuance 113 0 (5) 9 109 0 0 0 Other (4) 0 0 0 0 0 (4) 0 Purchase of treasury stock 0 0 0 0 0 0 0 358.2 Balance at year-end 2009 1,142 5 3,585 3,103 (5,564) 13 0 0
Impact of adoption of ASU
2009-16 and ASU 2009-17 (146) 0 0 (146) 0 0 0 358.2 Opening balance 2010 996 5 3,585 2,957 (5,564) 13 0 0 Net income 458 0 0 458 0 0 0 0 Other comprehensive loss (15) 0 0 0 0 (15) 0 0 Dividends (76) 0 0 (76) 0 0 0 10.2 Employee stock plan issuance 279 0 59 (53) 273 0 0 (1.5) Purchase of treasury stock (57) 0 0 0 (57) 0 0 366.9 Balance at year-end 2010 $1,585 $ 5 $ 3,644 $ 3,286 $(5,348) $ (2) $ 0
The abbreviation ASC means Accounting Standards Codification, and the abbreviation ASU means Accounting Standards Update.This was previously Emerging Issues Task Force Issue No. (“EITF”) 06-8 and was updated with referencing to the ASC.
See Notes to Consolidated Financial Statements
69
(1) (2)
(1)
(1)
(2)
Table of Contents
MARRIOTT INTERNATIONAL, INC.NOTES TO CONSOLIDATED FINANCIAL STATEMENTS
1. SUMMARY OF SIGNIFICANT ACCOUNTING POLICIESBasis of Presentation
The consolidated financial statements present the results of operations, financial position, and cash flows of Marriott International, Inc. (“Marriott,”and together with its subsidiaries “we,” “us,” or the “Company”). In order to make this report easier to read, we refer throughout to (i) our ConsolidatedFinancial Statements as our “Financial Statements,” (ii) our Consolidated Statements of Income as our “Income Statements,” our Consolidated BalanceSheets as our “Balance Sheets,” (iii) our properties, brands or markets in the continental United States and Canada as “North America” or “North American,”(iv) our properties, brands or markets outside of the continental United States and Canada as “international,” and (v) Accounting Standards Update No. 2009-16, “Transfers and Servicing (Topic 860): Accounting for Transfers of Financial Assets” (“ASU No. 2009-16”) and Accounting Standards Update No. 2009-17, “Consolidations (Topic 810): Improvements to Financial Reporting by Enterprises Involved with Variable Interest Entities” (“ASU No. 2009-17”) both ofwhich we adopted on the first day of 2010 as the “new Transfers of Financial Assets and Consolidation standards.”
In accordance with the guidance for noncontrolling interests in consolidated financial statements, references in this report to our earnings per share, netincome, and shareholders’ equity attributable to Marriott do not include noncontrolling interests (previously known as minority interests), which we reportseparately.
The preparation of financial statements in conformity with U.S. generally accepted accounting principles (“GAAP”) requires management to makeestimates and assumptions that affect the reported amounts of assets and liabilities as of the date of the financial statements, the reported amounts of revenuesand expenses during the reporting periods, and the disclosures of contingent liabilities. Accordingly, ultimate results could differ from those estimates.
Because we permanently shut down our synthetic fuel business in 2007, we segregated the balances and activities of our synthetic fuel reportablesegment and report them as discontinued operations for all periods presented.
In our opinion, the accompanying consolidated financial statements reflect all normal and recurring adjustments necessary to present fairly ourfinancial position at fiscal year-end 2010 and fiscal year-end 2009 and the results of our operations and cash flows for fiscal years 2010, 2009, and 2008. Wehave eliminated all material intercompany transactions and balances between entities consolidated in these financial statements. We have also reclassifiedcertain prior year amounts to conform to our 2010 presentation.
Adoption of New Accounting Standards Resulting in Consolidation of Special Purpose EntitiesOn January 2, 2010, the first day of the 2010 fiscal year, we adopted the new Transfers of Financial Assets and Consolidation standards (which were
originally known as Financial Accounting Standards Nos. 166 and 167).
We use certain special purpose entities to securitize Timeshare segment notes receivables, which prior to our adoption of these new standards wetreated as off-balance sheet entities. We retain the servicing rights and varying subordinated interests in the securitized notes. Pursuant to GAAP in effectprior to the 2010 fiscal year, we did not consolidate these special purpose entities in our financial statements because the securitization transactions qualifiedas sales of financial assets.
As a result of adopting the new Transfers of Financial Assets and Consolidation standards on the first day of 2010, we consolidated 13 existingqualifying special purpose entities associated with past securitization transactions. We recorded a one-time non-cash pretax reduction to shareholders’ equityof $238 million in 2010, representing the cumulative effect of a change in accounting principle. Including the related $92 million decrease in deferred taxliabilities, the after-tax reduction to shareholders’ equity totaled $146 million. The one-time non-cash after-tax reduction to shareholders’ equity wasapproximately $41 million greater than we had estimated for this charge, as disclosed in our 2009 Form 10-K, primarily due to increased notes receivablereserves recorded for the newly consolidated notes receivable. This increase in reserves was due to a change in estimate of uncollectible accounts based onhistorical experience. We now reserve for 100 percent of notes that are in default in addition to the reserve we record on the remaining notes.
We recorded the cumulative effect of the adoption of these standards to our financial statements in 2010. This consisted primarily of reestablishing thenotes receivable (net of reserves) that we had transferred to special purpose entities as a result of the securitization transactions, eliminating residual intereststhat we initially recorded in connection with those transactions (and subsequently revalued on a periodic basis), the impact of recording debt obligationsassociated with
70
Table of Contents
third-party interests held in the special purpose entities, and related adjustments to inventory balances accounted for using the relative sales value method.We adjusted the inventory balance to include anticipated future revenue from the resale of inventory that we expect to acquire when we foreclose ondefaulted notes.
Adopting these topics had the following impacts on our Balance Sheet at January 2, 2010: (1) assets increased by $970 million, primarily representingthe consolidation of notes receivable (and corresponding reserves) partially offset by the elimination of our retained interests; (2) liabilities increased by$1,116 million, primarily representing the consolidation of debt obligations associated with third party interests; and (3) shareholders’ equity decreased byapproximately $146 million. Adopting these topics also impacted our 2010 Income Statement by increasing interest income (reflected in Timeshare sales andservices revenue) from securitized notes and increasing interest expense from consolidation of debt obligations, partially offset by the absence of accretionincome on residual interests that were eliminated. We do not expect to recognize gains or losses from future securitizations of our timeshare notes as a resultof the adoption of these topics. Our adoption of these topics on January 2, 2010 did not have a significant impact on our Consolidated Statement of CashFlow because the resulting increase in assets and liabilities was primarily non-cash.
Please also see the parenthetical disclosures on our Balance Sheets that show the amounts of consolidated assets and liabilities associated with variableinterest entities (including those associated with our Timeshare segment securitizations) that we consolidated. Also see the “New Accounting Standards”caption later in this footnote for additional information regarding ASU Nos. 2009-16 and 2009-17.
Fiscal YearOur fiscal year ends on the Friday nearest to December 31. The fiscal years in the following table encompass a 52-week period, except for 2002 and
2008, which both encompass a 53-week period. Unless otherwise specified, each reference to a particular year in this Form 10-K means the fiscal year endedon the date shown in the following table, rather than the corresponding calendar year:
Fiscal Year Fiscal Year-End Date Fiscal Year Fiscal Year-End Date2010 December 31, 2010 2005 December 30, 20052009 January 1, 2010 2004 December 31, 20042008 January 2, 2009 2003 January 2, 20042007 December 28, 2007 2002 January 3, 20032006 December 29, 2006 2001 December 28, 2001
Revenue RecognitionOur revenues include: (1) base management and incentive management fees; (2) franchise fees; (3) revenues from lodging properties owned or leased
by us; (4) timeshare sales and services, which also includes resort rental revenue, interest income associated with our “Loans to timeshare owners,” Timesharesegment note securitization gains, and revenue from our points-based use system; and (5) cost reimbursements. Management fees comprise a base fee, whichis a percentage of the revenues of hotels, and an incentive fee, which is generally based on hotel profitability. Franchise fees comprise initial application feesand continuing royalties generated from our franchise programs, which permit the hotel owners and operators to use certain of our brand names. Costreimbursements include direct and indirect costs that are reimbursed to us by lodging properties that we manage or franchise.
Base Management and Incentive Management Fees: We recognize base management fees as revenue when earned in accordance with the contract. Ininterim periods and at year-end, we recognize incentive management fees that would be due as if the contract were to terminate at that date, exclusive of anytermination fees payable or receivable by us.
Franchise Fee Revenue: We recognize franchise fees as revenue in each accounting period as fees are earned from the franchisee.
Owned and Leased Units: We recognize room sales and revenues from other guest services for our owned and leased units when rooms are occupiedand services have been rendered.
Timeshare and Fractional Intervals and Condominiums: We recognize sales when: (1) we have received a minimum of ten percent of the purchaseprice; (2) the purchaser’s period to cancel for a refund has expired; (3) we deem the receivables to be collectible; and (4) we have attained certain minimumsales and construction levels. We defer all revenue using the deposit method for sales that do not meet all four of these criteria. For sales that do not qualifyfor full revenue recognition as the project has progressed beyond the preliminary stages but has not yet reached completion, all revenue and profit aredeferred and recognized in earnings using the percentage of completion method. Timeshare segment deferred revenue at year-end 2010 and 2009 was $56million and $63 million, respectively.
71
Table of Contents
Timeshare Points-Based Use System Revenue: As sales under this points-based use system are considered to be the sale of real estate, we recognizethese sales when the criteria noted in the “Timeshare and Fractional Intervals and Condominiums” caption are met.
Timeshare Residential (Stand-Alone Structures): We recognize sales under the full accrual method of accounting when we receive our proceeds andtransfer title at settlement.
Cost Reimbursements: We recognize cost reimbursements from managed, franchised, and timeshare properties when we incur the related reimbursablecosts.
Other Revenue: Includes third-party licensing fees, branding fees for third party residential sales and credit card licensing, land rental income, and otherrevenue.
Ground LeasesWe are both the lessor and lessee of land under long-term operating leases, which include scheduled increases in minimum rents. We recognize these
scheduled rent increases on a straight-line basis over the initial lease term.
Real Estate SalesWe reduce gains on sales of real estate by the maximum exposure to loss if we have continuing involvement with the property and do not transfer
substantially all of the risks and rewards of ownership. In sales transactions where we retain a management contract, the terms and conditions of themanagement contract are generally comparable to the terms and conditions of the management contracts obtained directly with third-party owners incompetitive bid processes.
Profit Sharing PlanWe contribute to a profit sharing plan for the benefit of employees meeting certain eligibility requirements and electing participation in the plan.
Contributions are determined based on a specified percentage of salary deferrals by participating employees. We recognized compensation costs from profitsharing of $86 million in 2010, $94 million in 2009, and $111 million in 2008.
Self-Insurance ProgramsWe are self-insured for certain levels of property, liability, workers’ compensation and employee medical coverage. We accrue estimated costs of these
self-insurance programs at the present value of projected settlements for known and incurred but not reported claims. We use a discount rate of 2.0 percent todetermine the present value of the projected settlements, which we consider to be reasonable given our history of settled claims, including payment patternsand the fixed nature of the individual settlements.
We are subject to a variety of assessments related to our insurance activities, including those by state guaranty funds and workers’ compensationsecond-injury funds. Our liabilities recorded for assessments are reflected within the amounts shown in our Balance Sheets on the other current liabilities line,are not discounted, and totaled $5 million at year-end 2010 and $4 million at year-end 2009. The $5 million liability for assessments as of year-end 2010 isexpected to be paid by the end of 2011.
Our Rewards ProgramsMarriott Rewards and The Ritz-Carlton Rewards are our frequent guest loyalty programs. Program members earn points based on their monetary
spending at our lodging operations, purchases of timeshare interval, fractional ownership, and residential products and, to a lesser degree, throughparticipation in affiliated partners’ programs, such as those offered by car rental and credit card companies. Points, which we track on members’ behalf, can beredeemed for stays at most of our lodging operations, airline tickets, airline frequent flyer program miles, rental cars, and a variety of other awards; however,points cannot be redeemed for cash. We provide Marriott Rewards and The Ritz-Carlton Rewards as marketing programs to participating properties, with theobjective of operating the programs on a break-even basis to us. As members earn points at properties and other program partners, we sell the points foramounts that we expect will, in the aggregate, equal the costs of point redemptions and program operating costs over time.
We defer revenue received from managed, franchised, and Marriott-owned/leased hotels and program partners equal to the fair value of our futureredemption obligation. We determine the fair value of the future redemption obligation based on statistical formulas that project timing of future pointredemption based on historical levels, including an estimate of the “breakage” for points that will never be redeemed, and an estimate of the points that willeventually be redeemed. These judgment factors determine the required liability for outstanding points. Our rewards programs’ liability totaled $1,799million and $1,647 million at year-end 2010 and 2009, respectively. A ten percent reduction in the estimate of “breakage” would have resulted in anestimated $90 million increase in the liability at year-end 2010.
72
Table of Contents
Our management and franchise agreements require that we be reimbursed currently for the costs of operating the program, including marketing,promotion, communication with, and performing member services for rewards program members. Due to the requirement that properties reimburse us forprogram operating costs as incurred, we recognize the related cost reimbursements revenues from properties in connection with our rewards programs at thetime such costs are incurred and expensed. We recognize the component of revenue from program partners that corresponds to program maintenance servicesover the expected life of the points awarded. Upon the redemption of points, we recognize as revenue the amounts previously deferred and recognize thecorresponding expense relating to the costs of the awards redeemed.
GuaranteesWe record a liability for the fair value of a guarantee on the date a guarantee is issued or modified. The offsetting entry depends on the circumstances in
which the guarantee was issued. Funding under the guarantee reduces the recorded liability. When no funding is forecasted, the liability is amortized intoincome on a straight-line basis over the remaining term of the guarantee. On a quarterly basis, we evaluate all material estimated liabilities based on theoperating results and the terms of the guarantee. If we conclude that it is probable that we will be required to fund a greater amount than previously estimated,we will record a loss unless the advance would be recoverable in the form of a loan.
Rebates and AllowancesWe participate in various vendor rebate and allowance arrangements as a manager of hotel properties. There are three types of programs that are
common in the hotel industry that are sometimes referred to as “rebates” or “allowances,” including unrestricted rebates, marketing (restricted) rebates andsponsorships. The primary business purpose of these arrangements is to secure favorable pricing for our hotel owners for various products and services orenhance resources for promotional campaigns co-sponsored by certain vendors. More specifically, unrestricted rebates are funds returned to the buyer,generally based upon volumes or quantities of goods purchased. Marketing (restricted) allowances are funds allocated by vendor agreements for certainmarketing or other joint promotional initiatives. Sponsorships are funds paid by vendors, generally used by the vendor to gain exposure at meetings andevents, which are accounted for as a reduction of the cost of the event.
We account for rebates and allowances as adjustments of the prices of the vendors’ products and services. We show vendor costs and the reimbursementof those costs as reimbursed costs and cost reimbursements revenue, respectively; therefore, rebates are reflected as a reduction of these line items.
Cash and EquivalentsWe consider all highly liquid investments with an initial maturity of three months or less at date of purchase to be cash equivalents.
Restricted CashRestricted cash in our Balance Sheets at year-end 2010 and year-end 2009 is recorded as $55 million and $54 million, respectively, in the “Other
current assets” line and $30 million and $22 million, respectively, in the “Other long-term assets” line. Restricted cash primarily consists of cash held in areserve account related to Timeshare segment notes receivable securitizations; cash held internationally that we have not repatriated due to statutory, tax andcurrency risks; and deposits received, primarily associated with timeshare interval, fractional ownership, and residential sales that are held in escrow until theassociated contract has closed.
Assets Held for SaleWe consider properties (other than Timeshare segment interval, fractional ownership, and residential products, which we classify as inventory) to be
assets held for sale when all of the following criteria are met:
• management commits to a plan to sell a property;
• it is unlikely that the disposal plan will be significantly modified or discontinued;
• the property is available for immediate sale in its present condition;
• actions required to complete the sale of the property have been initiated;
• sale of the property is probable and we expect the completed sale will occur within one year; and
• the property is actively being marketed for sale at a price that is reasonable given its current market value.
73
Table of Contents
Upon designation as an asset held for sale, we record the carrying value of each property at the lower of its carrying value or its estimated fair value,less estimated costs to sell, and we cease depreciation.
At year-end 2010 and 2009, we had no assets held for sale or liabilities related to assets held for sale.
Loan Loss ReservesSenior, Mezzanine, and Other LoansWe make loans to owners of hotels that we operate or franchise, typically to facilitate the development of a hotel and sometimes to facilitate brand
programs or initiatives. We expect the owners to repay the loans in accordance with the loan agreements, or earlier as the hotels mature and capital marketspermit. We use metrics such as loan-to-value ratios, debt service coverage, collateral, etc., to assess the credit quality of the loan receivable upon entering intothe loan agreement and on an ongoing basis as applicable.
On a regular basis, we individually assess all of these loans for impairment. Internally generated cash flow projections are used to determine if the loansare expected to be repaid according to the terms of the loan agreements. If it is probable that a loan will not be repaid in accordance with the loan agreement,we consider the loan impaired and begin recognizing interest income on a cash basis. To measure impairment, we calculate the present value of expectedfuture cash flows discounted at the loan’s original effective interest rate or the estimated fair value of the collateral. If the present value or the estimatedcollateral is less than the carrying value of the loan receivable, we establish a specific impairment reserve for the difference.
If it is likely that a loan will not be collected based on financial or other business indicators, including our historical experience, it is our policy tocharge off these loans in the quarter when it is deemed uncollectible.
Loans to Timeshare OwnersWe record an estimate of expected uncollectibility on all notes receivable from timeshare purchasers as a reduction of revenue at the time we recognize
profit on a timeshare sale. We fully reserve all defaulted notes in addition to recording a reserve on the estimated uncollectible portion of the remainingnotes. For those notes not in default, we assess collectibility based on pools of receivables because we hold large numbers of homogeneous timeshare notesreceivable. We estimate uncollectibles for the pool based on historical activity for similar timeshare notes receivable.
Although we consider loans to timeshare owners past due if we do not receive payment within 30 days of the due date, we suspend accrual of interestonly on those that are over 90 days past due. We consider loans over 150 days past due to be in default. We apply payments we receive for loans on non-accrual status first to interest, then principal, and any remainder to fees. We resume accruing interest when loans are less than 90 days past due. We do notaccept payments for notes during the foreclosure process unless the amount is sufficient to pay all principal, interest, fees and penalties owed and fullyreinstate the note. We write uncollectible notes off against the reserve once we receive title through the foreclosure or deed-in-lieu process. At year-end 2010,we estimated an average remaining default rate of 9.25 percent for both non-securitized and securitized timeshare notes receivable. An increase of 0.5 percentin the estimated default rate would have resulted in an increase in our allowance for credit losses of $6 million.
For additional information on our notes receivable, including information on the related reserves, see Footnote No. 11, “Notes Receivable.”
Valuation of GoodwillWe evaluate the fair value of goodwill to assess potential impairments at the end of each fiscal year, or during the year if an event or other circumstance
indicates that we may not be able to recover the carrying amount of the asset. In the first step of the review process, we compare the estimated fair value of thereporting unit with its carrying value. If the estimated fair value of the reporting unit exceeds its carrying amount, no further analysis is needed.
If the estimated fair value of the reporting unit is less than its carrying amount, we proceed to the second step of the review process to calculate theimplied fair value of the reporting unit goodwill in order to determine whether any impairment is required. We calculate the implied fair value of thereporting unit goodwill by allocating the estimated fair value of the reporting unit to all of the assets and liabilities of the reporting unit as if the reportingunit had been acquired in a business combination. If the carrying value of the reporting unit’s goodwill exceeds the implied fair value of the goodwill, werecognize an impairment loss for that excess amount. In allocating the estimated fair value of the reporting unit to all of the assets and liabilities of thereporting unit, we use industry and market data, as well as knowledge of the industry and our past experiences.
74
Table of Contents
We base our calculation of the estimated fair value of a reporting unit on the income approach. For the income approach, we use internally developeddiscounted cash flow models that include, among others, the following assumptions: projections of revenues and expenses and related cash flows based onassumed long-term growth rates and demand trends; expected future investments to grow new units; and estimated discount rates. We base these assumptionson our historical data and experience, third-party appraisals, industry projections, micro and macro general economic condition projections, and ourexpectations.
We have not recorded a goodwill impairment charge in the last three fiscal years, and at year-end 2010, the estimated fair value of each of our reportingunits’ exceeded its’ respective carrying amount by more than 100 percent based on our models and assumptions.
For additional information related to goodwill, including the amounts of goodwill by segment, see Footnote No. 17, “Business Segments.”
InvestmentsWe consolidate entities that we control. We account for investments in joint ventures using the equity method of accounting when we exercise
significant influence over the venture. If we do not exercise significant influence, we account for the investment using the cost method of accounting. Weaccount for investments in limited partnerships and limited liability companies using the equity method of accounting when we own more than a minimalinvestment. Our ownership interest in these equity method investments varies generally from 10 percent to 49 percent.
The fair value of our available-for-sale securities totaled $18 million and $18 million at year-end 2010 and year-end 2009, respectively. The amount ofnet losses reclassified out of accumulated other comprehensive income as a result of the sale of available-for-sale securities totaled zero and ($4) million for2010 and 2009, respectively. We determined the cost basis of the securities sold using specific identification.
Costs Incurred to Sell Real Estate ProjectsWe charge the majority of sales and marketing costs we incur to sell timeshares to expense when incurred. Deferred selling and marketing costs were $6
million at year-end 2010 and $5 million at year-end 2009 and are included in the accompanying Balance Sheets in the “Other” caption within the “Currentassets” section. If a contract is canceled, we charge unrecoverable direct selling and marketing costs to expense and record deposits forfeited as income.
Valuation of Intangibles and Long-Lived AssetsWe test intangibles and long-lived asset groups for recoverability when changes in circumstances indicate the carrying value may not be recoverable,
for example, when there are material adverse changes in projected revenues or expenses, significant underperformance relative to historical or projectedoperating results, and significant negative industry or economic trends. We also perform a test for recoverability when management has committed to a planto sell or otherwise dispose of an asset group and the plan is expected to be completed within a year. We evaluate recoverability of an asset group bycomparing its carrying value to the future net undiscounted cash flows that we expect will be generated by the asset group. If the comparison indicates thatthe carrying value of an asset group is not recoverable, we recognize an impairment loss for the excess of carrying value over the estimated fair value. Whenan impairment loss is recognized for assets to be held and used, we depreciate the adjusted carrying amount of those assets over their remaining useful life.
We base our calculations of the estimated fair value of an intangible asset or asset group on the income approach or the market approach. Theassumptions and methodology we utilize for the income approach are the same as those described in the “Valuation of Goodwill” caption. For the marketapproach, we use internal analyses based primarily on market comparables and assumptions about market capitalization rates, growth rates, and inflation.
For information on impairment losses that we recorded in 2009 and 2008 associated with intangibles and long-lived assets, see Footnote No. 20,“Timeshare Strategy-Impairment Charges” and Footnote No. 21, “Restructuring Costs and Other Charges” of the Notes to the Financial Statements in our2009 Form 10-K. For information on impairment losses that we recorded in 2010 associated with long-lived assets, see Footnote No. 8, “Property andEquipment.”
Valuation of Investments in VenturesWe sometimes hold a minority equity interest in ventures established to develop timeshare interval, fractional ownership and residential properties or
to develop or acquire and own hotel properties. These ventures are generally limited liability companies or limited partnerships, and our equity interest inthese ventures generally ranges from 10 percent to 49 percent.
75
Table of Contents
We evaluate an investment in a venture for impairment when circumstances indicate that the carrying value may not be recoverable, for exampledue to loan defaults, significant under performance relative to historical or projected operating performance and significant negative industry oreconomic trends.
We impair investments accounted for using the equity and cost methods of accounting when we determine that there has been an “other thantemporary” decline in the estimated fair value as compared to the carrying value, of the venture. Additionally, a commitment to a plan to sell some orall of the assets in a venture could cause a recoverability evaluation for the individual long-lived assets in the venture and possibly the venture itself.
We calculate the estimated fair value of an investment in a venture using either a market approach or an income approach. The assumptions andmethodology we utilize for the income approach are the same as those described in the “Valuation of Goodwill” caption. For the market approach, weuse internal analyses based primarily on market comparables and assumptions about market capitalization rates, growth rates, and inflation.
For information regarding impairment losses that we recorded in 2009 and 2008 associated with investments in ventures, see Footnote No. 20,“Timeshare Strategy-Impairment Charges” and Footnote No. 21, “Restructuring Costs and Other Charges” in the Notes to the Financial Statements inour 2009 Form 10-K.
Timeshare Segment Residual InterestsWe periodically securitize notes receivable originated by our Timeshare segment. We continue to service the notes after securitization, and we
retain servicing assets and other interests in the notes. Historically, we accounted for these residual interests, including the servicing assets, as tradingsecurities under the then-applicable standards for accounting for certain investments in debt and equity securities. At the dates of sale and at the end ofeach reporting period, we estimated the fair value of our residual interests using a Level 3 discounted cash flow model.
For additional information, including the elimination of our residual interests upon adoption of the new Transfers of Financial Assets andConsolidation standards, see the “Adoption of New Accounting Standards Resulting in Consolidation of Special Purpose Entities” caption of thisfootnote, Footnote No. 5, “Fair Value of Financial Instruments,” and Footnote No. 12, “Asset Securitizations.”
Fair Value MeasurementsWe have various financial instruments we must measure at fair value on a recurring basis, including certain marketable securities and derivatives.
See Footnote No. 5, “Fair Value of Financial Instruments,” for further information. We also apply the provisions of fair value measurement to variousnon-recurring measurements for our financial and non-financial assets and liabilities.
Fair value is defined as the price that would be received to sell an asset or paid to transfer a liability in an orderly transaction between marketparticipants at the measurement date (an exit price). We measure our assets and liabilities using inputs from the following three levels of the fair valuehierarchy:
Level 1 inputs are unadjusted quoted prices in active markets for identical assets or liabilities that we have the ability to access at themeasurement date.Level 2 inputs include quoted prices for similar assets and liabilities in active markets, quoted prices for identical or similar assets orliabilities in markets that are not active, inputs other than quoted prices that are observable for the asset or liability (i.e., interest rates,yield curves, etc.), and inputs that are derived principally from or corroborated by observable market data by correlation or other means(market corroborated inputs).Level 3 includes unobservable inputs that reflect our assumptions about what factors market participants would use in pricing the assetor liability. We develop these inputs based on the best information available, including our own data.
Derivative InstrumentsThe designation of a derivative instrument as a hedge and its ability to meet the hedge accounting criteria determine how we reflect the change
in fair value of the derivative instrument in our Financial Statements. A derivative qualifies for hedge accounting if, at inception, we expect thederivative to be highly effective in offsetting the underlying hedged cash flows or fair value and we fulfill the hedge documentation standards at thetime we enter into the derivative contract. We designate a hedge as a cash flow hedge, fair value hedge, or a net investment in non-U.S. operationshedge based on the exposure we are hedging. The asset or liability value of the derivative will change in tandem with its fair value. For the effectiveportion of qualifying hedges, we record changes in fair value in other comprehensive income (“OCI”). We release the derivative’s gain or loss from OCIto match the timing of the underlying hedged items’ effect on earnings.
76
Table of Contents
We review the effectiveness of our hedging instruments on a quarterly basis, recognize current period hedge ineffectiveness immediately inearnings, and discontinue hedge accounting for any hedge that we no longer consider to be highly effective. We recognize changes in fair value forderivatives not designated as hedges or those not qualifying for hedge accounting in current period earnings. Upon termination of cash flow hedges,we release gains and losses from OCI based on the timing of the underlying cash flows or revenue recognized, unless the termination results from thefailure of the intended transaction to occur in the expected timeframe. Such untimely transactions require us to immediately recognize in earnings,gains and losses that we previously recorded in OCI.
Changes in interest rates, currency exchange rates, and equity securities expose us to market risk. We manage our exposure to these risks bymonitoring available financing alternatives, as well as through development and application of credit granting policies. We also use derivativeinstruments, including cash flow hedges, net investment in non-U.S. operations hedges, fair value hedges, and other derivative instruments, as part ofour overall strategy to manage our exposure to market risks. As a matter of policy, we only enter into transactions that we believe will be highlyeffective at offsetting the underlying risk, and we do not use derivatives for trading or speculative purposes. See Footnote No. 5, “Fair Value ofFinancial Instruments,” for additional information.
Non-U.S. OperationsThe U.S. dollar is the functional currency of our consolidated and unconsolidated entities operating in the United States. The functional
currency for our consolidated and unconsolidated entities operating outside of the United States is generally the currency of the primary economicenvironment in which the entity primarily generates and expends cash. For consolidated entities whose functional currency is not the U.S. dollar, wetranslate their financial statements into U.S. dollars, and we do the same, as needed, for unconsolidated entities whose functional currency is not theU.S. dollar. We translate assets and liabilities at the exchange rate in effect as of the financial statement date, and translate income statement accountsusing the weighted average exchange rate for the period. We include translation adjustments from currency exchange and the effect of exchange ratechanges on intercompany transactions of a long-term investment nature as a separate component of shareholders’ equity. We report gains and lossesfrom currency exchange rate changes related to intercompany receivables and payables that are not of a long-term investment nature, as well as gainsand losses from non-U.S. currency transactions, currently in operating costs and expenses, and those amounted to a loss of $7 million in 2010, a loss ofless than $1 million in 2009, and a $6 million loss in 2008. Gains and other income for 2010 included $2 million attributable to currency translationadjustment losses, net of gains, from the sale or complete or substantially complete liquidation of investments. There were no similar gains or losses in2008 and 2009.
Legal ContingenciesWe are subject to various legal proceedings and claims, the outcomes of which are subject to significant uncertainty. We record an accrual for
legal contingencies when we determine that it is probable that a liability has been incurred and the amount of the loss can be reasonably estimated. Inmaking such determinations we evaluate, among other things, the degree of probability of an unfavorable outcome and, when it is probable that aliability has been incurred, our ability to make a reasonable estimate of the loss. We review these accruals each reporting period and make revisionsbased on changes in facts and circumstances.
Income TaxesWe record the amounts of taxes payable or refundable for the current year, as well as deferred tax liabilities and assets for the future tax
consequences of events that we have recognized in our financial statements or tax returns. We use judgment in assessing future profitability and thelikely future tax consequences of events that we have recognized in our financial statements or tax returns. We base our estimates of deferred tax assetsand liabilities on current tax laws, rates and interpretations, and, in certain cases, business plans and other expectations about future outcomes. Wedevelop our estimates of future profitability and based on our historical data and experience, industry projections, micro and macro general economiccondition projections, and our expectations.
Changes in existing tax laws and rates, their related interpretations, as well as the uncertainty generated by the current economic environmentmay affect the amounts of deferred tax liabilities or the valuations of deferred tax assets over time. Our accounting for deferred tax consequencesrepresents management’s best estimate of future events that can be appropriately reflected in the accounting estimates.
For tax positions we have taken or expect to take in a tax return, we apply a more likely than not threshold, under which we must conclude a taxposition is more likely than not to be sustained, assuming that the position will be examined by the appropriate taxing authority that has fullknowledge of all relevant information, in order to continue to recognize the benefit. In determining our provision for income taxes, we use judgment,reflecting our estimates and assumptions, in applying the more likely than not threshold.
77
Table of Contents
For information about income taxes and deferred tax assets and liabilities, see Footnote No. 2, “Income Taxes.”
New Accounting StandardsNew Transfers of Financial Assets and Consolidation StandardsOn the first day of 2010, we adopted ASU No. 2009-16, which amended Topic 860, “Transfers and Servicing,” by: (1) eliminating the concept of
a qualifying special-purpose entity (“QSPE”); (2) clarifying and amending the criteria for a transfer to be accounted for as a sale; (3) amending andclarifying the unit of account eligible for sale accounting; and (4) requiring that a transferor initially measure at fair value and recognize all assetsobtained (for example beneficial interests) and liabilities incurred as a result of a transfer of an entire financial asset or group of financial assetsaccounted for as a sale. In addition, this topic requires us to evaluate entities for consolidation that had been treated as QSPEs under previousaccounting guidance. The topic also mandates that we supplement our disclosures about, among other things, our continuing involvement withtransfers of financial assets previously accounted for as sales, the inherent risks in our retained financial assets, and the nature and financial effect ofrestrictions on the assets that we continue to report in our Balance Sheet.
We also adopted ASU No. 2009-17 on the first day of 2010, which changed the consolidation guidance applicable to variable interest entities(“VIEs”). This topic also amended the guidance on determination of whether an enterprise is the primary beneficiary of a VIE, and is, therefore, requiredto consolidate an entity, by requiring a qualitative, rather than the prior quantitative, analysis of the VIE. The new qualitative analysis includes, amongother things, consideration of who has the power to direct those activities that most significantly impact the entity’s economic performance and whohas the obligation to absorb losses or the right to receive benefits of the VIE that could potentially be significant to the VIE. This topic also mandatesthat an enterprise continually reassess whether it is the primary beneficiary of a VIE, in contrast to the prior standard that required the primarybeneficiary only be reassessed when specific events occurred. This topic now also expressly applies to QSPEs, which were previously exempt, andrequires additional disclosures about an enterprise’s involvement with a VIE.
Accounting Standards Update No. 2009-13 “Revenue Recognition (Topic 605): Multiple-Deliverable Revenue Arrangements” (“ASU No. 2009-13”)We adopted ASU No. 2009-13 in the 2010 third quarter as required by the guidance and applied it retrospectively to the first day of 2010. ASU
No. 2009-13 addresses the accounting for multiple-deliverable arrangements (complex contracts or related contracts that require the separate deliveryof multiple goods and/or services) by expanding the circumstances in which vendors may account for deliverables separately rather than as a combinedunit. This update clarifies the guidance on how to separate such deliverables and how to measure and allocate consideration for these arrangements toone or more units of accounting. The previous guidance required a vendor to use vendor-specific objective evidence or third-party evidence of sellingprice to separate deliverables in multiple-deliverable arrangements. In addition to retaining this guidance, in situations where vendor-specificobjective evidence or third-party evidence is not available, ASU No. 2009-13 requires a vendor to allocate arrangement consideration to eachdeliverable in multiple-deliverable arrangements based on each deliverable’s relative selling price. Our adoption did not have a material impact on ourfinancial statements, and we do not expect it will have a material effect on our financial statements in future periods.
Accounting Standards Update No. 2010-06 “Fair Value Measurements and Disclosures (Topic 820): Improving Disclosures about Fair ValueMeasurements” (“ASU No. 2010-06”)We adopted certain provisions of ASU No. 2010-06 in the 2010 first quarter. Those provisions amended Subtopic 820-10, “Fair Value
Measurements and Disclosures – Overall,” by requiring additional disclosures for transfers in and out of Level 1 and Level 2 fair value measurements,as well as requiring fair value measurement disclosures for each “class” of assets and liabilities, a subset of the captions in our Balance Sheets. Ouradoption did not have a material impact on our financial statements or disclosures, as we had no transfers between Level 1 and Level 2 fair valuemeasurements and no material classes of assets and liabilities that required additional disclosure. See “Future Adoption of Accounting Standards” forthe provisions of this topic that apply to future periods.
Accounting Standards Update No. 2010-09 “Subsequent Events (Topic 855): Amendments to Certain Recognition and DisclosureRequirements” (“ASU No. 2010-09”)We adopted ASU No. 2010-09 in the 2010 first quarter. ASU No. 2010-09 amended Subtopic 855-10, “Subsequent Events – Overall,” by
removing the requirement for a United States Securities and Exchange Commission (“SEC”) registrant to disclose a date, in both issued and revisedfinancial statements, through which that filer had evaluated subsequent events. Accordingly, we removed the related disclosure from the “Basis ofPresentation” caption of Footnote
78
Table of Contents
No. 1, “Summary of Significant Accounting Policies.” Our adoption did not have a material impact on our financial statements.
Accounting Standards Update No. 2010-20 “Receivables (Topic 310): Disclosures about the Credit Quality of Financing Receivables and theAllowance for Credit Losses” (“ASU No. 2010-20”)We adopted ASU No. 2010-20 in the 2010 fourth quarter. ASU No. 2010-20 amends existing guidance by requiring more robust and
disaggregated disclosures by an entity about the credit quality of its financing receivables and its allowance for credit losses. These disclosures providefinancial statement users with additional information about the nature of credit risks inherent in our financing receivables, how we analyze and assesscredit risk in determining our allowance for credit losses, and the reasons for any changes we may make in our allowance for credit losses. Our adoptionof this update primarily resulted in increased notes receivable disclosures (see Footnote No. 11, “Notes Receivable”), but did not have any other impacton our financial statements.
Future Adoption of Accounting StandardsASU No. 2010-06 – Provisions Effective in the 2011 First QuarterCertain provisions of ASU No. 2010-06 are effective for fiscal years beginning after December 15, 2010, which for us will be our 2011 first
quarter. Those provisions, which amended Subtopic 820-10, will require us to present as separate line items all purchases, sales, issuances, andsettlements of financial instruments valued using significant unobservable inputs (Level 3) in the reconciliation of fair value measurements, in contrastto the current aggregate presentation as a single line item. Although this may change the appearance of our fair value reconciliations, we do not believethe adoption will have a material impact on our financial statements or disclosures.
2. INCOME TAXES
Our (provision for)/benefit from income taxes consists of:
($ in millions) 2010 2009 2008 Current -U.S. Federal $ 117 $(169) $(275)
-U.S. State (7) (12) (40) -Non-U.S. (51) (61) (85)
59 (242) (400)
Deferred -U.S. Federal (150) 234 7 -U.S. State (14) 28 8 -Non-U.S. 12 45 35
(152) 307 50 $ (93) $ 65 $(350)
Our current tax provision does not reflect the benefits (costs) attributable to us for the exercise or vesting of employee share-based awards of $51million in 2010, $(8) million in 2009, and $21 million in 2008. The preceding table includes tax credits of $2 million in 2010, $2 million in 2009, and$9 million in 2008. The taxes applicable to other comprehensive income are not material.
We have made no provision for U.S. income taxes or additional non-U.S. taxes on the cumulative unremitted earnings of non-U.S. subsidiaries($861 million as of year-end 2010) because we consider these earnings to be permanently invested. These earnings could become subject to additionaltaxes if remitted as dividends, loaned to us or a U.S. affiliate or if we sold our interests in the affiliates. We cannot practically estimate the amount ofadditional taxes that might be payable on the unremitted earnings.
We conduct business in countries that grant “holidays” from income taxes for 5- to 30- year periods. These holidays expire through 2034.Without these tax “holidays,” we would have incurred the following aggregate income taxes and related earnings per share impacts: $7 million ($0.02per diluted share) in 2010; $4 million ($0.01 per diluted share) in 2009; and $11 million ($0.03 per diluted share) in 2008.
We file income tax returns, including returns for our subsidiaries, in various jurisdictions around the world. We filed an Internal Revenue Service(“IRS”) refund claim relating to 2000 and 2001 for certain software development costs. The IRS disallowed the claims, and in July 2009, we protestedthe disallowance. This issue is pending in the IRS Appeals Division.
In the 2010 fourth quarter, we reached a settlement with the IRS Appeals Division resolving all issues that arose in the audit of tax years 2005through 2008. This settlement resulted in an $85 million decrease in our tax expense for 2010 due
79
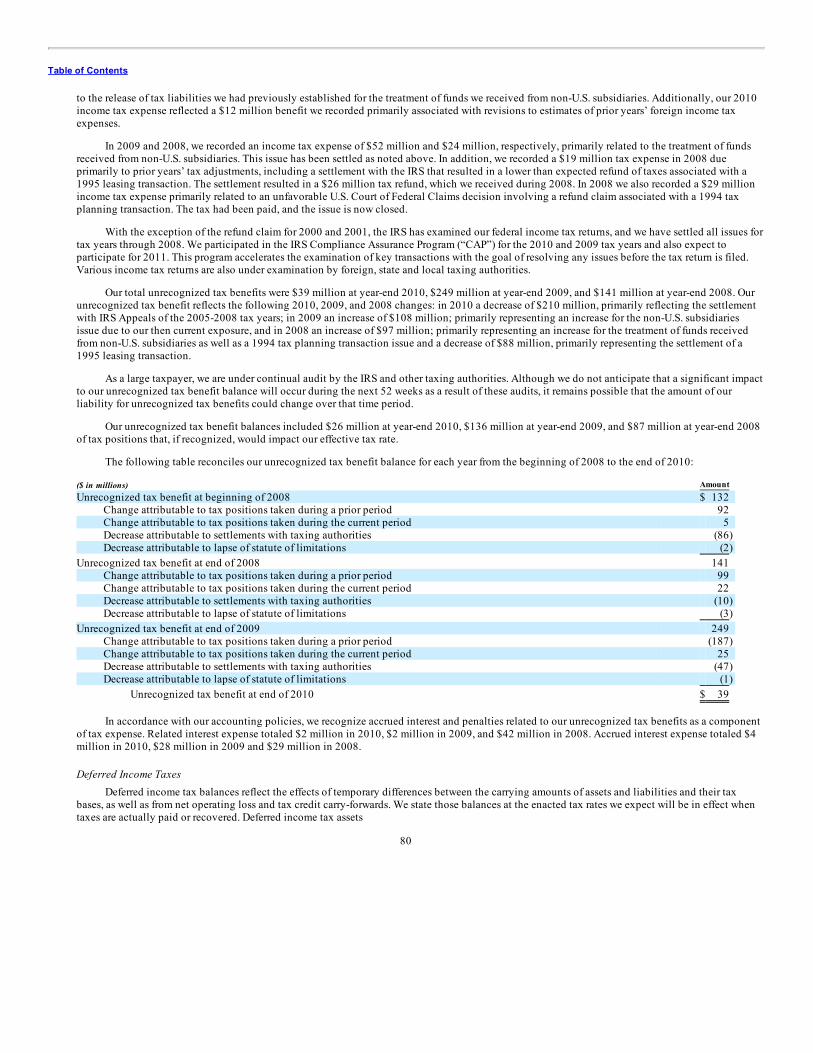
Table of Contents
to the release of tax liabilities we had previously established for the treatment of funds we received from non-U.S. subsidiaries. Additionally, our 2010income tax expense reflected a $12 million benefit we recorded primarily associated with revisions to estimates of prior years’ foreign income taxexpenses.
In 2009 and 2008, we recorded an income tax expense of $52 million and $24 million, respectively, primarily related to the treatment of fundsreceived from non-U.S. subsidiaries. This issue has been settled as noted above. In addition, we recorded a $19 million tax expense in 2008 dueprimarily to prior years’ tax adjustments, including a settlement with the IRS that resulted in a lower than expected refund of taxes associated with a1995 leasing transaction. The settlement resulted in a $26 million tax refund, which we received during 2008. In 2008 we also recorded a $29 millionincome tax expense primarily related to an unfavorable U.S. Court of Federal Claims decision involving a refund claim associated with a 1994 taxplanning transaction. The tax had been paid, and the issue is now closed.
With the exception of the refund claim for 2000 and 2001, the IRS has examined our federal income tax returns, and we have settled all issues fortax years through 2008. We participated in the IRS Compliance Assurance Program (“CAP”) for the 2010 and 2009 tax years and also expect toparticipate for 2011. This program accelerates the examination of key transactions with the goal of resolving any issues before the tax return is filed.Various income tax returns are also under examination by foreign, state and local taxing authorities.
Our total unrecognized tax benefits were $39 million at year-end 2010, $249 million at year-end 2009, and $141 million at year-end 2008. Ourunrecognized tax benefit reflects the following 2010, 2009, and 2008 changes: in 2010 a decrease of $210 million, primarily reflecting the settlementwith IRS Appeals of the 2005-2008 tax years; in 2009 an increase of $108 million; primarily representing an increase for the non-U.S. subsidiariesissue due to our then current exposure, and in 2008 an increase of $97 million; primarily representing an increase for the treatment of funds receivedfrom non-U.S. subsidiaries as well as a 1994 tax planning transaction issue and a decrease of $88 million, primarily representing the settlement of a1995 leasing transaction.
As a large taxpayer, we are under continual audit by the IRS and other taxing authorities. Although we do not anticipate that a significant impactto our unrecognized tax benefit balance will occur during the next 52 weeks as a result of these audits, it remains possible that the amount of ourliability for unrecognized tax benefits could change over that time period.
Our unrecognized tax benefit balances included $26 million at year-end 2010, $136 million at year-end 2009, and $87 million at year-end 2008of tax positions that, if recognized, would impact our effective tax rate.
The following table reconciles our unrecognized tax benefit balance for each year from the beginning of 2008 to the end of 2010:
($ in millions) Amount Unrecognized tax benefit at beginning of 2008 $ 132
Change attributable to tax positions taken during a prior period 92 Change attributable to tax positions taken during the current period 5 Decrease attributable to settlements with taxing authorities (86) Decrease attributable to lapse of statute of limitations (2)
Unrecognized tax benefit at end of 2008 141 Change attributable to tax positions taken during a prior period 99 Change attributable to tax positions taken during the current period 22 Decrease attributable to settlements with taxing authorities (10) Decrease attributable to lapse of statute of limitations (3)
Unrecognized tax benefit at end of 2009 249 Change attributable to tax positions taken during a prior period (187) Change attributable to tax positions taken during the current period 25 Decrease attributable to settlements with taxing authorities (47) Decrease attributable to lapse of statute of limitations (1)
Unrecognized tax benefit at end of 2010 $ 39
In accordance with our accounting policies, we recognize accrued interest and penalties related to our unrecognized tax benefits as a componentof tax expense. Related interest expense totaled $2 million in 2010, $2 million in 2009, and $42 million in 2008. Accrued interest expense totaled $4million in 2010, $28 million in 2009 and $29 million in 2008.
Deferred Income TaxesDeferred income tax balances reflect the effects of temporary differences between the carrying amounts of assets and liabilities and their tax
bases, as well as from net operating loss and tax credit carry-forwards. We state those balances at the enacted tax rates we expect will be in effect whentaxes are actually paid or recovered. Deferred income tax assets
80
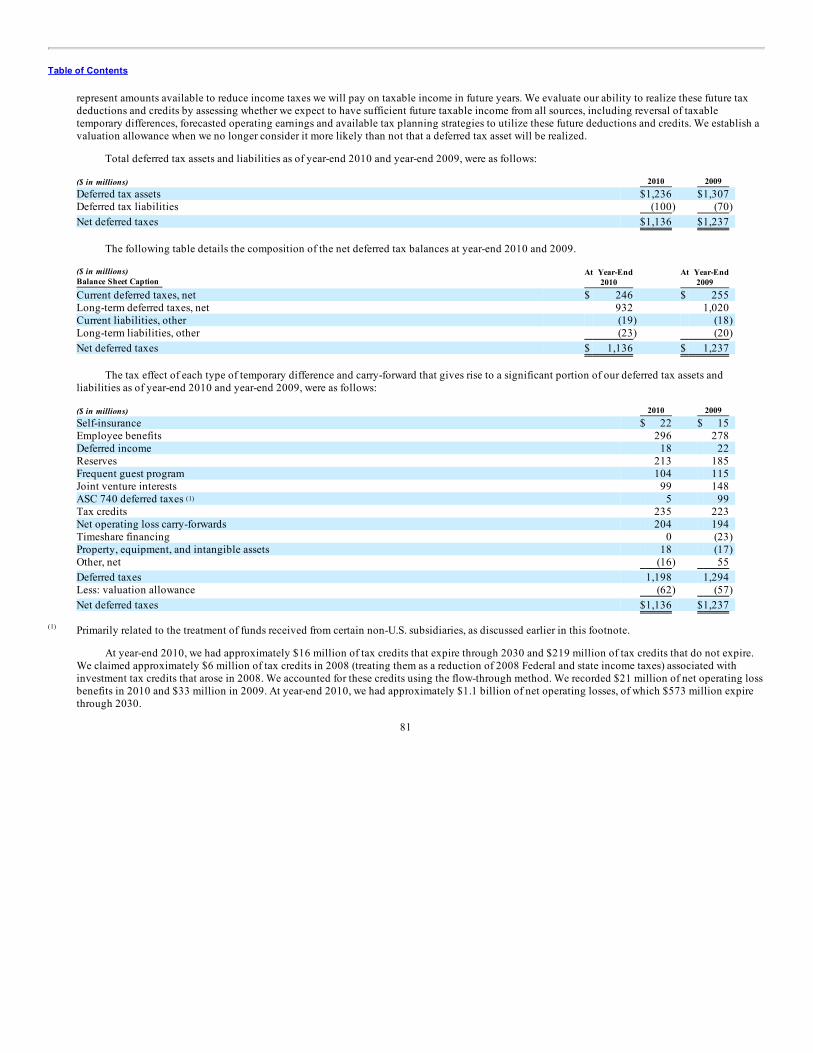
Table of Contents
represent amounts available to reduce income taxes we will pay on taxable income in future years. We evaluate our ability to realize these future taxdeductions and credits by assessing whether we expect to have sufficient future taxable income from all sources, including reversal of taxabletemporary differences, forecasted operating earnings and available tax planning strategies to utilize these future deductions and credits. We establish avaluation allowance when we no longer consider it more likely than not that a deferred tax asset will be realized.
Total deferred tax assets and liabilities as of year-end 2010 and year-end 2009, were as follows:
($ in millions) 2010 2009 Deferred tax assets $1,236 $1,307 Deferred tax liabilities (100) (70) Net deferred taxes $1,136 $1,237
The following table details the composition of the net deferred tax balances at year-end 2010 and 2009.
($ in millions)Balance Sheet Caption
At Year-End2010
At Year-End2009
Current deferred taxes, net $ 246 $ 255 Long-term deferred taxes, net 932 1,020 Current liabilities, other (19) (18) Long-term liabilities, other (23) (20) Net deferred taxes $ 1,136 $ 1,237
The tax effect of each type of temporary difference and carry-forward that gives rise to a significant portion of our deferred tax assets andliabilities as of year-end 2010 and year-end 2009, were as follows:
($ in millions) 2010 2009 Self-insurance $ 22 $ 15 Employee benefits 296 278 Deferred income 18 22 Reserves 213 185 Frequent guest program 104 115 Joint venture interests 99 148 ASC 740 deferred taxes 5 99 Tax credits 235 223 Net operating loss carry-forwards 204 194 Timeshare financing 0 (23) Property, equipment, and intangible assets 18 (17) Other, net (16) 55 Deferred taxes 1,198 1,294 Less: valuation allowance (62) (57) Net deferred taxes $1,136 $1,237
Primarily related to the treatment of funds received from certain non-U.S. subsidiaries, as discussed earlier in this footnote.
At year-end 2010, we had approximately $16 million of tax credits that expire through 2030 and $219 million of tax credits that do not expire.We claimed approximately $6 million of tax credits in 2008 (treating them as a reduction of 2008 Federal and state income taxes) associated withinvestment tax credits that arose in 2008. We accounted for these credits using the flow-through method. We recorded $21 million of net operating lossbenefits in 2010 and $33 million in 2009. At year-end 2010, we had approximately $1.1 billion of net operating losses, of which $573 million expirethrough 2030.
81
(1)
(1)
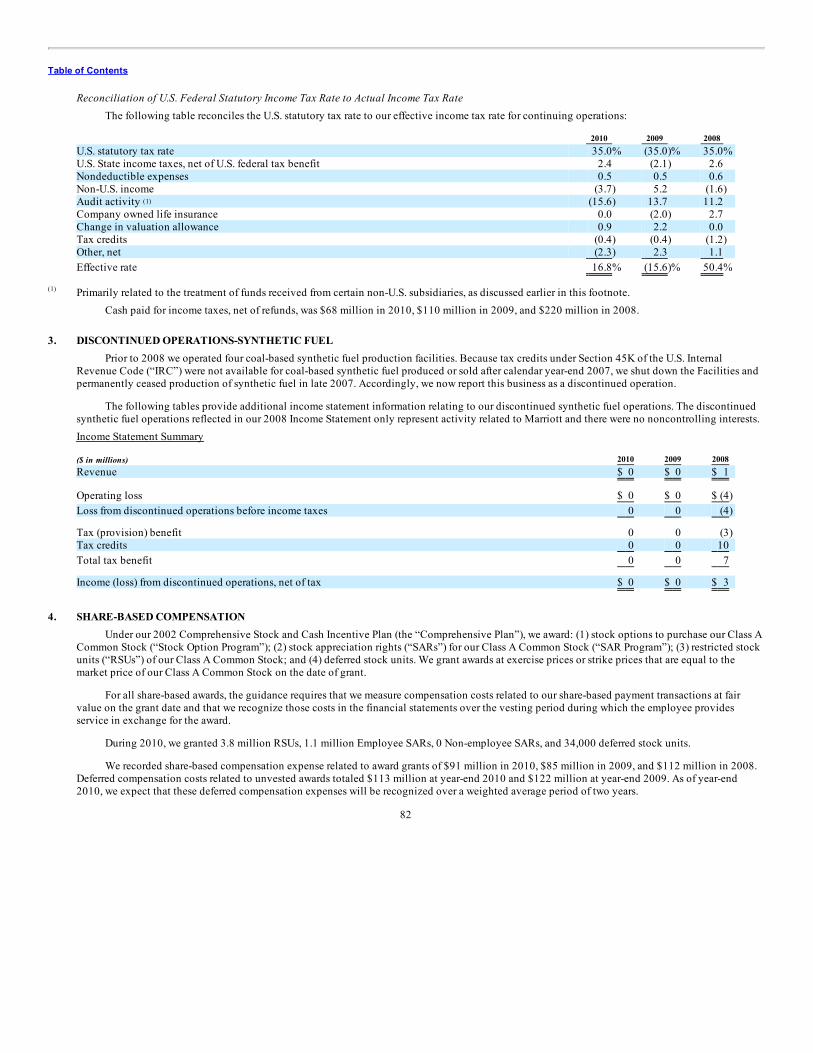
Table of Contents
Reconciliation of U.S. Federal Statutory Income Tax Rate to Actual Income Tax RateThe following table reconciles the U.S. statutory tax rate to our effective income tax rate for continuing operations:
2010 2009 2008 U.S. statutory tax rate 35.0% (35.0)% 35.0% U.S. State income taxes, net of U.S. federal tax benefit 2.4 (2.1) 2.6 Nondeductible expenses 0.5 0.5 0.6 Non-U.S. income (3.7) 5.2 (1.6) Audit activity (15.6) 13.7 11.2 Company owned life insurance 0.0 (2.0) 2.7 Change in valuation allowance 0.9 2.2 0.0 Tax credits (0.4) (0.4) (1.2) Other, net (2.3) 2.3 1.1 Effective rate 16.8% (15.6)% 50.4%
Primarily related to the treatment of funds received from certain non-U.S. subsidiaries, as discussed earlier in this footnote.
Cash paid for income taxes, net of refunds, was $68 million in 2010, $110 million in 2009, and $220 million in 2008. 3. DISCONTINUED OPERATIONS-SYNTHETIC FUEL
Prior to 2008 we operated four coal-based synthetic fuel production facilities. Because tax credits under Section 45K of the U.S. InternalRevenue Code (“IRC”) were not available for coal-based synthetic fuel produced or sold after calendar year-end 2007, we shut down the Facilities andpermanently ceased production of synthetic fuel in late 2007. Accordingly, we now report this business as a discontinued operation.
The following tables provide additional income statement information relating to our discontinued synthetic fuel operations. The discontinuedsynthetic fuel operations reflected in our 2008 Income Statement only represent activity related to Marriott and there were no noncontrolling interests.Income Statement Summary
($ in millions) 2010 2009 2008 Revenue $ 0 $ 0 $ 1
Operating loss $ 0 $ 0 $ (4) Loss from discontinued operations before income taxes 0 0 (4)
Tax (provision) benefit 0 0 (3) Tax credits 0 0 10 Total tax benefit 0 0 7
Income (loss) from discontinued operations, net of tax $ 0 $ 0 $ 3
4. SHARE-BASED COMPENSATION
Under our 2002 Comprehensive Stock and Cash Incentive Plan (the “Comprehensive Plan”), we award: (1) stock options to purchase our Class ACommon Stock (“Stock Option Program”); (2) stock appreciation rights (“SARs”) for our Class A Common Stock (“SAR Program”); (3) restricted stockunits (“RSUs”) of our Class A Common Stock; and (4) deferred stock units. We grant awards at exercise prices or strike prices that are equal to themarket price of our Class A Common Stock on the date of grant.
For all share-based awards, the guidance requires that we measure compensation costs related to our share-based payment transactions at fairvalue on the grant date and that we recognize those costs in the financial statements over the vesting period during which the employee providesservice in exchange for the award.
During 2010, we granted 3.8 million RSUs, 1.1 million Employee SARs, 0 Non-employee SARs, and 34,000 deferred stock units.
We recorded share-based compensation expense related to award grants of $91 million in 2010, $85 million in 2009, and $112 million in 2008.Deferred compensation costs related to unvested awards totaled $113 million at year-end 2010 and $122 million at year-end 2009. As of year-end2010, we expect that these deferred compensation expenses will be recognized over a weighted average period of two years.
82
(1)
(1)
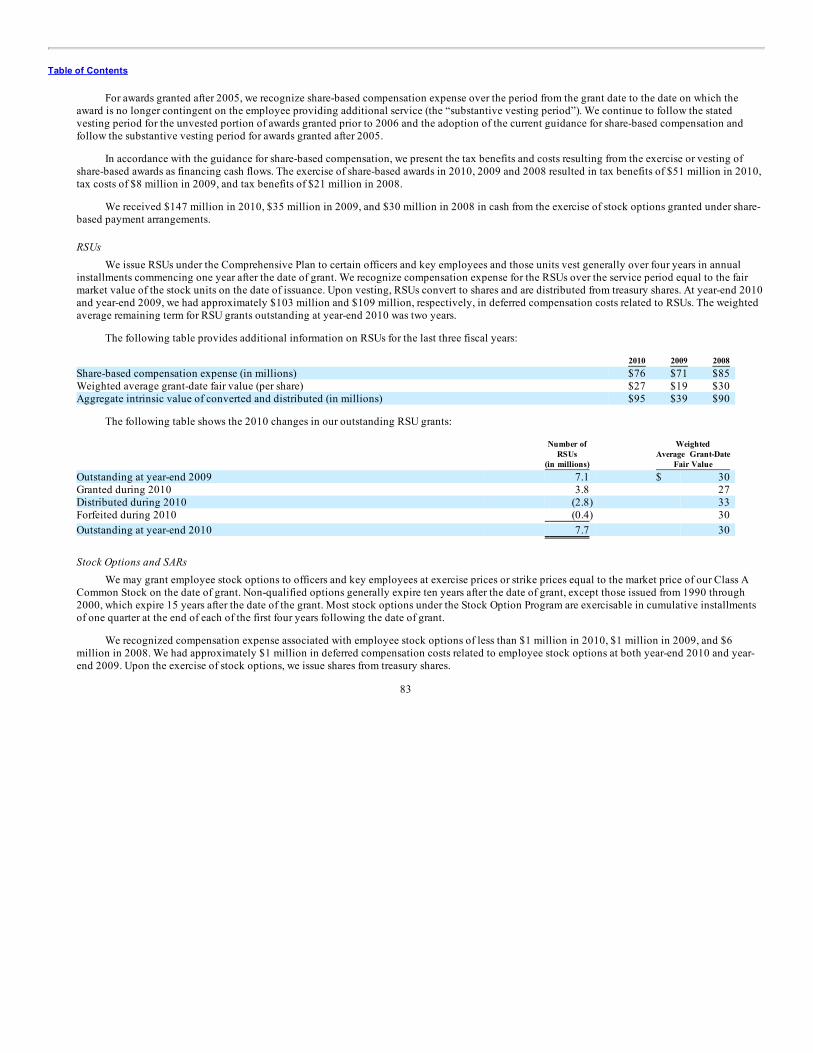
Table of Contents
For awards granted after 2005, we recognize share-based compensation expense over the period from the grant date to the date on which theaward is no longer contingent on the employee providing additional service (the “substantive vesting period”). We continue to follow the statedvesting period for the unvested portion of awards granted prior to 2006 and the adoption of the current guidance for share-based compensation andfollow the substantive vesting period for awards granted after 2005.
In accordance with the guidance for share-based compensation, we present the tax benefits and costs resulting from the exercise or vesting ofshare-based awards as financing cash flows. The exercise of share-based awards in 2010, 2009 and 2008 resulted in tax benefits of $51 million in 2010,tax costs of $8 million in 2009, and tax benefits of $21 million in 2008.
We received $147 million in 2010, $35 million in 2009, and $30 million in 2008 in cash from the exercise of stock options granted under share-based payment arrangements.
RSUsWe issue RSUs under the Comprehensive Plan to certain officers and key employees and those units vest generally over four years in annual
installments commencing one year after the date of grant. We recognize compensation expense for the RSUs over the service period equal to the fairmarket value of the stock units on the date of issuance. Upon vesting, RSUs convert to shares and are distributed from treasury shares. At year-end 2010and year-end 2009, we had approximately $103 million and $109 million, respectively, in deferred compensation costs related to RSUs. The weightedaverage remaining term for RSU grants outstanding at year-end 2010 was two years.
The following table provides additional information on RSUs for the last three fiscal years:
2010 2009 2008 Share-based compensation expense (in millions) $76 $71 $85 Weighted average grant-date fair value (per share) $27 $19 $30 Aggregate intrinsic value of converted and distributed (in millions) $95 $39 $90
The following table shows the 2010 changes in our outstanding RSU grants:
Number ofRSUs
(in millions)
WeightedAverage Grant-Date
Fair Value Outstanding at year-end 2009 7.1 $ 30 Granted during 2010 3.8 27 Distributed during 2010 (2.8) 33 Forfeited during 2010 (0.4) 30 Outstanding at year-end 2010 7.7 30
Stock Options and SARsWe may grant employee stock options to officers and key employees at exercise prices or strike prices equal to the market price of our Class A
Common Stock on the date of grant. Non-qualified options generally expire ten years after the date of grant, except those issued from 1990 through2000, which expire 15 years after the date of the grant. Most stock options under the Stock Option Program are exercisable in cumulative installmentsof one quarter at the end of each of the first four years following the date of grant.
We recognized compensation expense associated with employee stock options of less than $1 million in 2010, $1 million in 2009, and $6million in 2008. We had approximately $1 million in deferred compensation costs related to employee stock options at both year-end 2010 and year-end 2009. Upon the exercise of stock options, we issue shares from treasury shares.
83
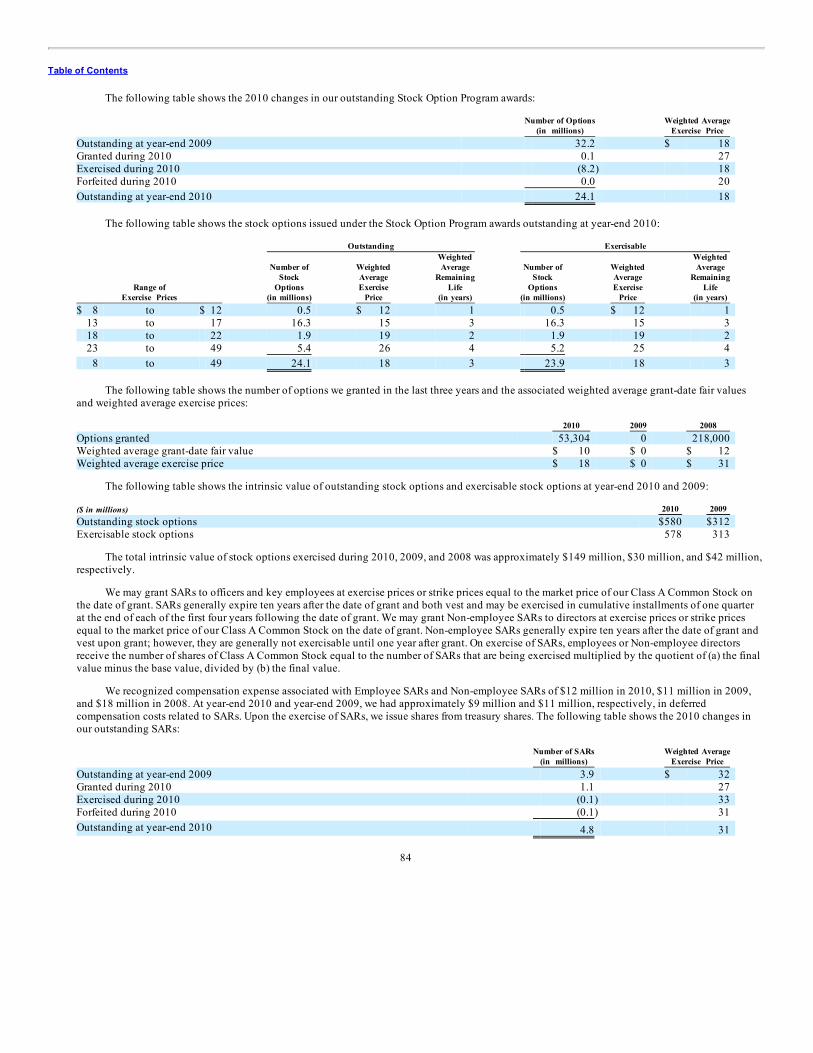
Table of Contents
The following table shows the 2010 changes in our outstanding Stock Option Program awards:
Number of Options
(in millions) Weighted Average
Exercise Price Outstanding at year-end 2009 32.2 $ 18 Granted during 2010 0.1 27 Exercised during 2010 (8.2) 18 Forfeited during 2010 0.0 20 Outstanding at year-end 2010 24.1 18
The following table shows the stock options issued under the Stock Option Program awards outstanding at year-end 2010:
Outstanding Exercisable
Range ofExercise Prices
Number ofStock
Options(in millions)
WeightedAverageExercise
Price
WeightedAverage
RemainingLife
(in years)
Number ofStock
Options(in millions)
WeightedAverageExercise
Price
WeightedAverage
RemainingLife
(in years) $ 8 to $ 12 0.5 $ 12 1 0.5 $ 12 1 13 to 17 16.3 15 3 16.3 15 3 18 to 22 1.9 19 2 1.9 19 2 23 to 49 5.4 26 4 5.2 25 4 8 to 49 24.1 18 3 23.9 18 3
The following table shows the number of options we granted in the last three years and the associated weighted average grant-date fair valuesand weighted average exercise prices:
2010 2009 2008 Options granted 53,304 0 218,000 Weighted average grant-date fair value $ 10 $ 0 $ 12 Weighted average exercise price $ 18 $ 0 $ 31
The following table shows the intrinsic value of outstanding stock options and exercisable stock options at year-end 2010 and 2009:
($ in millions) 2010 2009 Outstanding stock options $580 $312 Exercisable stock options 578 313
The total intrinsic value of stock options exercised during 2010, 2009, and 2008 was approximately $149 million, $30 million, and $42 million,respectively.
We may grant SARs to officers and key employees at exercise prices or strike prices equal to the market price of our Class A Common Stock onthe date of grant. SARs generally expire ten years after the date of grant and both vest and may be exercised in cumulative installments of one quarterat the end of each of the first four years following the date of grant. We may grant Non-employee SARs to directors at exercise prices or strike pricesequal to the market price of our Class A Common Stock on the date of grant. Non-employee SARs generally expire ten years after the date of grant andvest upon grant; however, they are generally not exercisable until one year after grant. On exercise of SARs, employees or Non-employee directorsreceive the number of shares of Class A Common Stock equal to the number of SARs that are being exercised multiplied by the quotient of (a) the finalvalue minus the base value, divided by (b) the final value.
We recognized compensation expense associated with Employee SARs and Non-employee SARs of $12 million in 2010, $11 million in 2009,and $18 million in 2008. At year-end 2010 and year-end 2009, we had approximately $9 million and $11 million, respectively, in deferredcompensation costs related to SARs. Upon the exercise of SARs, we issue shares from treasury shares. The following table shows the 2010 changes inour outstanding SARs:
Number of SARs
(in millions) Weighted Average
Exercise Price Outstanding at year-end 2009 3.9 $ 32 Granted during 2010 1.1 27 Exercised during 2010 (0.1) 33 Forfeited during 2010 (0.1) 31 Outstanding at year-end 2010 4.8 31
84
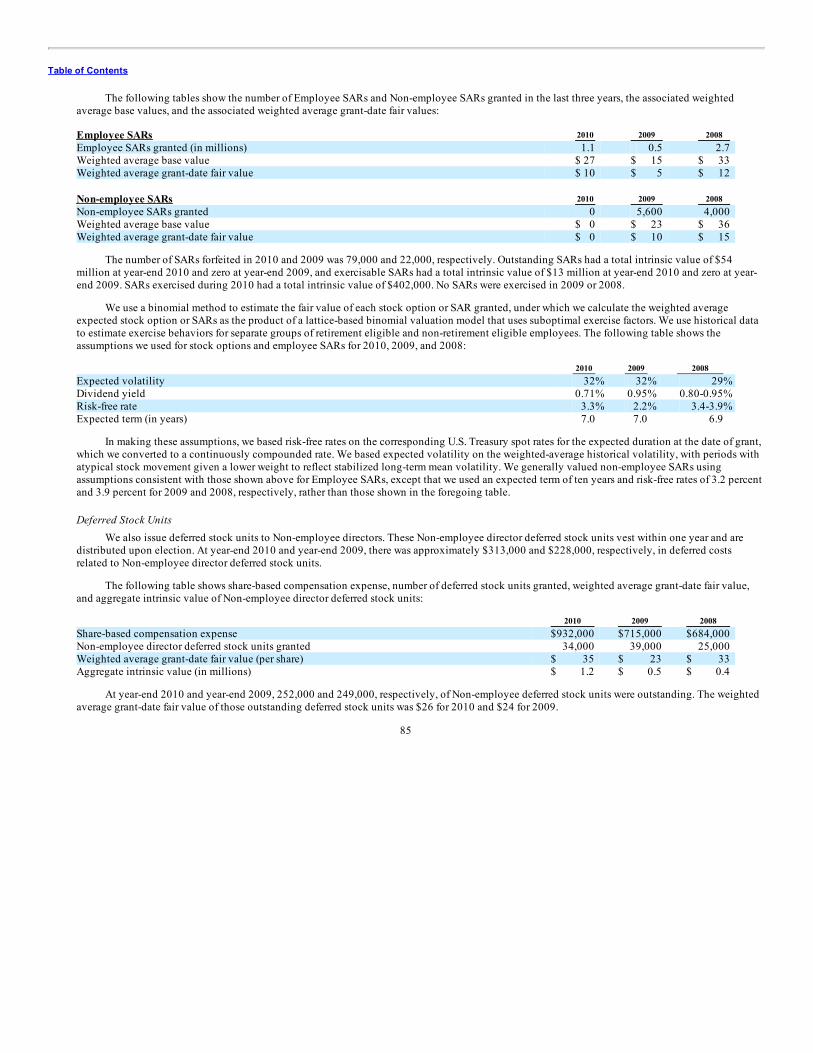
Table of Contents
The following tables show the number of Employee SARs and Non-employee SARs granted in the last three years, the associated weightedaverage base values, and the associated weighted average grant-date fair values:
Employee SARs 2010 2009 2008 Employee SARs granted (in millions) 1.1 0.5 2.7 Weighted average base value $ 27 $ 15 $ 33 Weighted average grant-date fair value $ 10 $ 5 $ 12
Non-employee SARs 2010 2009 2008 Non-employee SARs granted 0 5,600 4,000 Weighted average base value $ 0 $ 23 $ 36 Weighted average grant-date fair value $ 0 $ 10 $ 15
The number of SARs forfeited in 2010 and 2009 was 79,000 and 22,000, respectively. Outstanding SARs had a total intrinsic value of $54million at year-end 2010 and zero at year-end 2009, and exercisable SARs had a total intrinsic value of $13 million at year-end 2010 and zero at year-end 2009. SARs exercised during 2010 had a total intrinsic value of $402,000. No SARs were exercised in 2009 or 2008.
We use a binomial method to estimate the fair value of each stock option or SAR granted, under which we calculate the weighted averageexpected stock option or SARs as the product of a lattice-based binomial valuation model that uses suboptimal exercise factors. We use historical datato estimate exercise behaviors for separate groups of retirement eligible and non-retirement eligible employees. The following table shows theassumptions we used for stock options and employee SARs for 2010, 2009, and 2008:
2010 2009 2008 Expected volatility 32% 32% 29% Dividend yield 0.71% 0.95% 0.80-0.95% Risk-free rate 3.3% 2.2% 3.4-3.9% Expected term (in years) 7.0 7.0 6.9
In making these assumptions, we based risk-free rates on the corresponding U.S. Treasury spot rates for the expected duration at the date of grant,which we converted to a continuously compounded rate. We based expected volatility on the weighted-average historical volatility, with periods withatypical stock movement given a lower weight to reflect stabilized long-term mean volatility. We generally valued non-employee SARs usingassumptions consistent with those shown above for Employee SARs, except that we used an expected term of ten years and risk-free rates of 3.2 percentand 3.9 percent for 2009 and 2008, respectively, rather than those shown in the foregoing table.
Deferred Stock UnitsWe also issue deferred stock units to Non-employee directors. These Non-employee director deferred stock units vest within one year and are
distributed upon election. At year-end 2010 and year-end 2009, there was approximately $313,000 and $228,000, respectively, in deferred costsrelated to Non-employee director deferred stock units.
The following table shows share-based compensation expense, number of deferred stock units granted, weighted average grant-date fair value,and aggregate intrinsic value of Non-employee director deferred stock units:
2010 2009 2008 Share-based compensation expense $932,000 $715,000 $684,000 Non-employee director deferred stock units granted 34,000 39,000 25,000 Weighted average grant-date fair value (per share) $ 35 $ 23 $ 33 Aggregate intrinsic value (in millions) $ 1.2 $ 0.5 $ 0.4
At year-end 2010 and year-end 2009, 252,000 and 249,000, respectively, of Non-employee deferred stock units were outstanding. The weightedaverage grant-date fair value of those outstanding deferred stock units was $26 for 2010 and $24 for 2009.
85
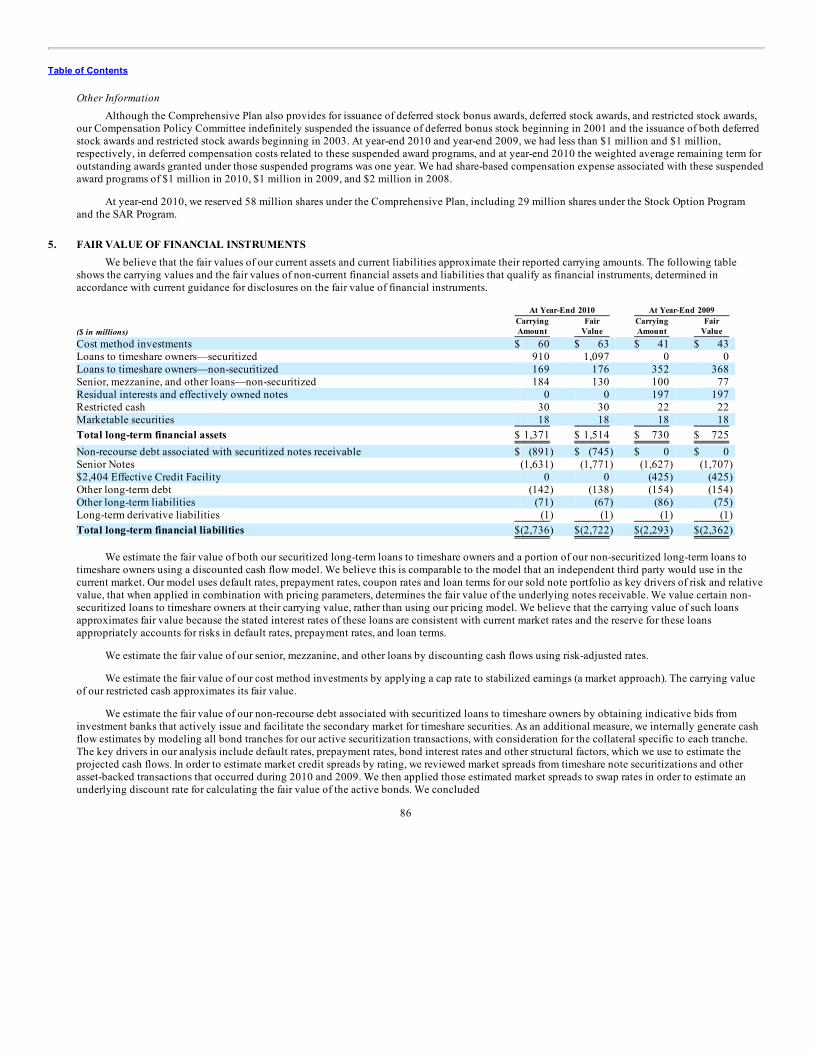
Table of Contents
Other InformationAlthough the Comprehensive Plan also provides for issuance of deferred stock bonus awards, deferred stock awards, and restricted stock awards,
our Compensation Policy Committee indefinitely suspended the issuance of deferred bonus stock beginning in 2001 and the issuance of both deferredstock awards and restricted stock awards beginning in 2003. At year-end 2010 and year-end 2009, we had less than $1 million and $1 million,respectively, in deferred compensation costs related to these suspended award programs, and at year-end 2010 the weighted average remaining term foroutstanding awards granted under those suspended programs was one year. We had share-based compensation expense associated with these suspendedaward programs of $1 million in 2010, $1 million in 2009, and $2 million in 2008.
At year-end 2010, we reserved 58 million shares under the Comprehensive Plan, including 29 million shares under the Stock Option Programand the SAR Program.
5. FAIR VALUE OF FINANCIAL INSTRUMENTS
We believe that the fair values of our current assets and current liabilities approximate their reported carrying amounts. The following tableshows the carrying values and the fair values of non-current financial assets and liabilities that qualify as financial instruments, determined inaccordance with current guidance for disclosures on the fair value of financial instruments.
At Year-End 2010 At Year-End 2009
($ in millions) CarryingAmount
FairValue
CarryingAmount
FairValue
Cost method investments $ 60 $ 63 $ 41 $ 43 Loans to timeshare owners—securitized 910 1,097 0 0 Loans to timeshare owners—non-securitized 169 176 352 368 Senior, mezzanine, and other loans—non-securitized 184 130 100 77 Residual interests and effectively owned notes 0 0 197 197 Restricted cash 30 30 22 22 Marketable securities 18 18 18 18 Total long-term financial assets $ 1,371 $ 1,514 $ 730 $ 725 Non-recourse debt associated with securitized notes receivable $ (891) $ (745) $ 0 $ 0 Senior Notes (1,631) (1,771) (1,627) (1,707) $2,404 Effective Credit Facility 0 0 (425) (425) Other long-term debt (142) (138) (154) (154) Other long-term liabilities (71) (67) (86) (75) Long-term derivative liabilities (1) (1) (1) (1) Total long-term financial liabilities $(2,736) $(2,722) $(2,293) $(2,362)
We estimate the fair value of both our securitized long-term loans to timeshare owners and a portion of our non-securitized long-term loans totimeshare owners using a discounted cash flow model. We believe this is comparable to the model that an independent third party would use in thecurrent market. Our model uses default rates, prepayment rates, coupon rates and loan terms for our sold note portfolio as key drivers of risk and relativevalue, that when applied in combination with pricing parameters, determines the fair value of the underlying notes receivable. We value certain non-securitized loans to timeshare owners at their carrying value, rather than using our pricing model. We believe that the carrying value of such loansapproximates fair value because the stated interest rates of these loans are consistent with current market rates and the reserve for these loansappropriately accounts for risks in default rates, prepayment rates, and loan terms.
We estimate the fair value of our senior, mezzanine, and other loans by discounting cash flows using risk-adjusted rates.
We estimate the fair value of our cost method investments by applying a cap rate to stabilized earnings (a market approach). The carrying valueof our restricted cash approximates its fair value.
We estimate the fair value of our non-recourse debt associated with securitized loans to timeshare owners by obtaining indicative bids frominvestment banks that actively issue and facilitate the secondary market for timeshare securities. As an additional measure, we internally generate cashflow estimates by modeling all bond tranches for our active securitization transactions, with consideration for the collateral specific to each tranche.The key drivers in our analysis include default rates, prepayment rates, bond interest rates and other structural factors, which we use to estimate theprojected cash flows. In order to estimate market credit spreads by rating, we reviewed market spreads from timeshare note securitizations and otherasset-backed transactions that occurred during 2010 and 2009. We then applied those estimated market spreads to swap rates in order to estimate anunderlying discount rate for calculating the fair value of the active bonds. We concluded
86
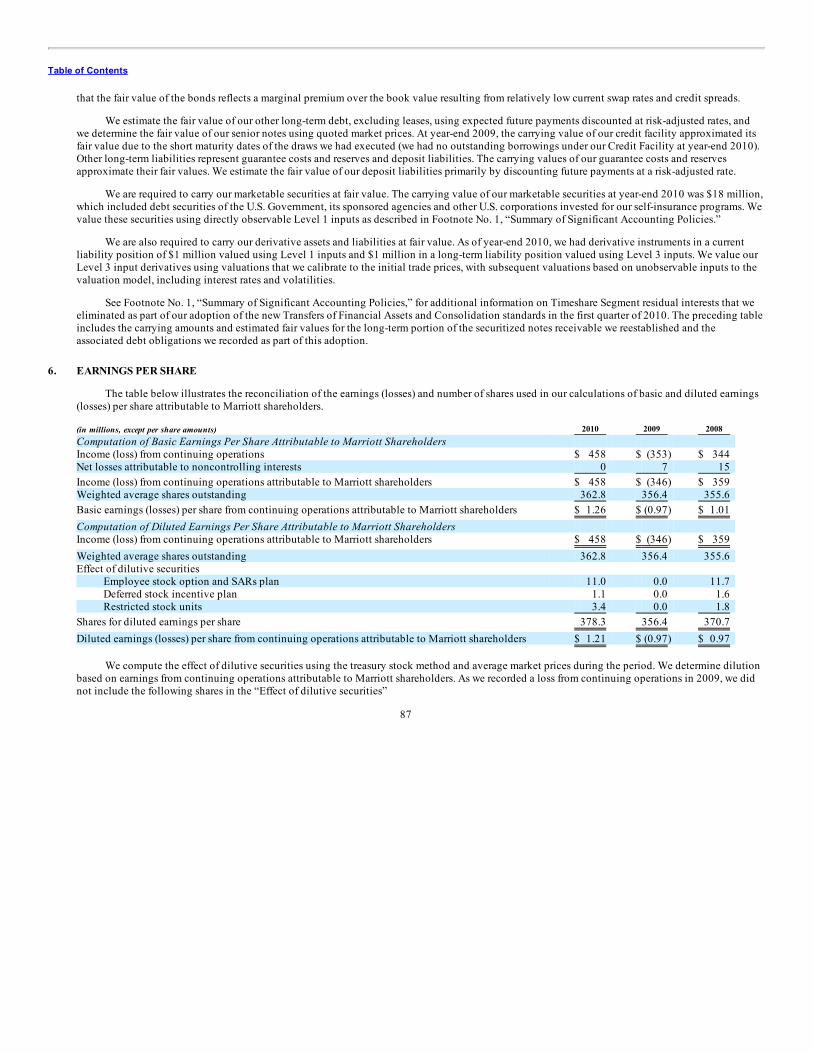
Table of Contents
that the fair value of the bonds reflects a marginal premium over the book value resulting from relatively low current swap rates and credit spreads.
We estimate the fair value of our other long-term debt, excluding leases, using expected future payments discounted at risk-adjusted rates, andwe determine the fair value of our senior notes using quoted market prices. At year-end 2009, the carrying value of our credit facility approximated itsfair value due to the short maturity dates of the draws we had executed (we had no outstanding borrowings under our Credit Facility at year-end 2010).Other long-term liabilities represent guarantee costs and reserves and deposit liabilities. The carrying values of our guarantee costs and reservesapproximate their fair values. We estimate the fair value of our deposit liabilities primarily by discounting future payments at a risk-adjusted rate.
We are required to carry our marketable securities at fair value. The carrying value of our marketable securities at year-end 2010 was $18 million,which included debt securities of the U.S. Government, its sponsored agencies and other U.S. corporations invested for our self-insurance programs. Wevalue these securities using directly observable Level 1 inputs as described in Footnote No. 1, “Summary of Significant Accounting Policies.”
We are also required to carry our derivative assets and liabilities at fair value. As of year-end 2010, we had derivative instruments in a currentliability position of $1 million valued using Level 1 inputs and $1 million in a long-term liability position valued using Level 3 inputs. We value ourLevel 3 input derivatives using valuations that we calibrate to the initial trade prices, with subsequent valuations based on unobservable inputs to thevaluation model, including interest rates and volatilities.
See Footnote No. 1, “Summary of Significant Accounting Policies,” for additional information on Timeshare Segment residual interests that weeliminated as part of our adoption of the new Transfers of Financial Assets and Consolidation standards in the first quarter of 2010. The preceding tableincludes the carrying amounts and estimated fair values for the long-term portion of the securitized notes receivable we reestablished and theassociated debt obligations we recorded as part of this adoption.
6. EARNINGS PER SHARE
The table below illustrates the reconciliation of the earnings (losses) and number of shares used in our calculations of basic and diluted earnings(losses) per share attributable to Marriott shareholders.
(in millions, except per share amounts) 2010 2009 2008 Computation of Basic Earnings Per Share Attributable to Marriott Shareholders Income (loss) from continuing operations $ 458 $ (353) $ 344 Net losses attributable to noncontrolling interests 0 7 15 Income (loss) from continuing operations attributable to Marriott shareholders $ 458 $ (346) $ 359 Weighted average shares outstanding 362.8 356.4 355.6 Basic earnings (losses) per share from continuing operations attributable to Marriott shareholders $ 1.26 $ (0.97) $ 1.01 Computation of Diluted Earnings Per Share Attributable to Marriott Shareholders Income (loss) from continuing operations attributable to Marriott shareholders $ 458 $ (346) $ 359 Weighted average shares outstanding 362.8 356.4 355.6 Effect of dilutive securities
Employee stock option and SARs plan 11.0 0.0 11.7 Deferred stock incentive plan 1.1 0.0 1.6 Restricted stock units 3.4 0.0 1.8
Shares for diluted earnings per share 378.3 356.4 370.7 Diluted earnings (losses) per share from continuing operations attributable to Marriott shareholders $ 1.21 $ (0.97) $ 0.97
We compute the effect of dilutive securities using the treasury stock method and average market prices during the period. We determine dilutionbased on earnings from continuing operations attributable to Marriott shareholders. As we recorded a loss from continuing operations in 2009, we didnot include the following shares in the “Effect of dilutive securities”
87
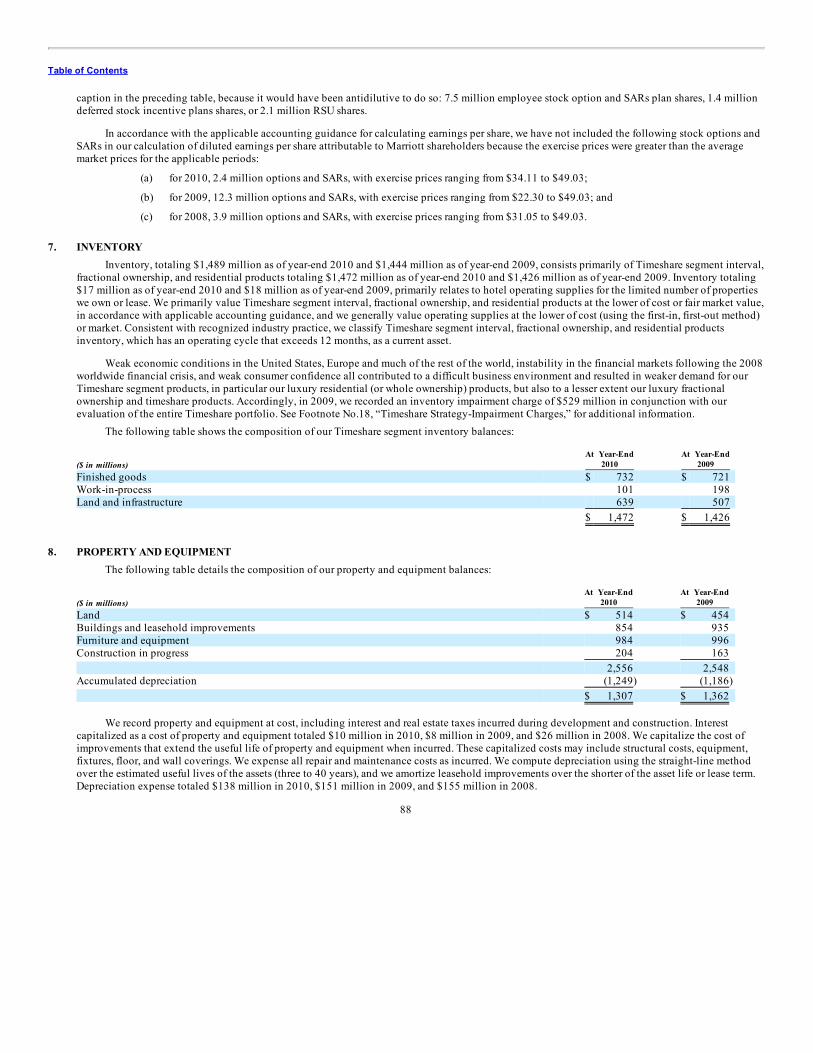
Table of Contents
caption in the preceding table, because it would have been antidilutive to do so: 7.5 million employee stock option and SARs plan shares, 1.4 milliondeferred stock incentive plans shares, or 2.1 million RSU shares.
In accordance with the applicable accounting guidance for calculating earnings per share, we have not included the following stock options andSARs in our calculation of diluted earnings per share attributable to Marriott shareholders because the exercise prices were greater than the averagemarket prices for the applicable periods:
(a) for 2010, 2.4 million options and SARs, with exercise prices ranging from $34.11 to $49.03;
(b) for 2009, 12.3 million options and SARs, with exercise prices ranging from $22.30 to $49.03; and
(c) for 2008, 3.9 million options and SARs, with exercise prices ranging from $31.05 to $49.03. 7. INVENTORY
Inventory, totaling $1,489 million as of year-end 2010 and $1,444 million as of year-end 2009, consists primarily of Timeshare segment interval,fractional ownership, and residential products totaling $1,472 million as of year-end 2010 and $1,426 million as of year-end 2009. Inventory totaling$17 million as of year-end 2010 and $18 million as of year-end 2009, primarily relates to hotel operating supplies for the limited number of propertieswe own or lease. We primarily value Timeshare segment interval, fractional ownership, and residential products at the lower of cost or fair market value,in accordance with applicable accounting guidance, and we generally value operating supplies at the lower of cost (using the first-in, first-out method)or market. Consistent with recognized industry practice, we classify Timeshare segment interval, fractional ownership, and residential productsinventory, which has an operating cycle that exceeds 12 months, as a current asset.
Weak economic conditions in the United States, Europe and much of the rest of the world, instability in the financial markets following the 2008worldwide financial crisis, and weak consumer confidence all contributed to a difficult business environment and resulted in weaker demand for ourTimeshare segment products, in particular our luxury residential (or whole ownership) products, but also to a lesser extent our luxury fractionalownership and timeshare products. Accordingly, in 2009, we recorded an inventory impairment charge of $529 million in conjunction with ourevaluation of the entire Timeshare portfolio. See Footnote No.18, “Timeshare Strategy-Impairment Charges,” for additional information.
The following table shows the composition of our Timeshare segment inventory balances:
($ in millions) At Year-End
2010 At Year-End
2009 Finished goods $ 732 $ 721 Work-in-process 101 198 Land and infrastructure 639 507
$ 1,472 $ 1,426
8. PROPERTY AND EQUIPMENT
The following table details the composition of our property and equipment balances:
($ in millions) At Year-End
2010 At Year-End
2009 Land $ 514 $ 454 Buildings and leasehold improvements 854 935 Furniture and equipment 984 996 Construction in progress 204 163
2,556 2,548 Accumulated depreciation (1,249) (1,186)
$ 1,307 $ 1,362
We record property and equipment at cost, including interest and real estate taxes incurred during development and construction. Interestcapitalized as a cost of property and equipment totaled $10 million in 2010, $8 million in 2009, and $26 million in 2008. We capitalize the cost ofimprovements that extend the useful life of property and equipment when incurred. These capitalized costs may include structural costs, equipment,fixtures, floor, and wall coverings. We expense all repair and maintenance costs as incurred. We compute depreciation using the straight-line methodover the estimated useful lives of the assets (three to 40 years), and we amortize leasehold improvements over the shorter of the asset life or lease term.Depreciation expense totaled $138 million in 2010, $151 million in 2009, and $155 million in 2008.
88
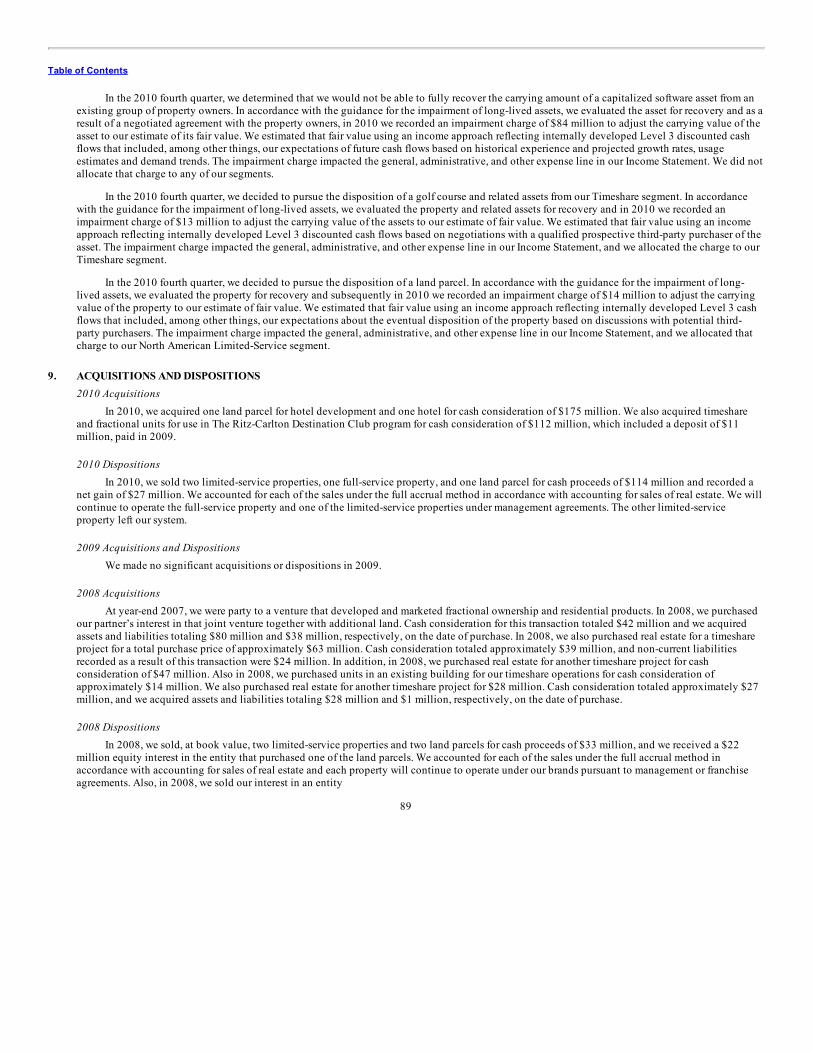
Table of Contents
In the 2010 fourth quarter, we determined that we would not be able to fully recover the carrying amount of a capitalized software asset from anexisting group of property owners. In accordance with the guidance for the impairment of long-lived assets, we evaluated the asset for recovery and as aresult of a negotiated agreement with the property owners, in 2010 we recorded an impairment charge of $84 million to adjust the carrying value of theasset to our estimate of its fair value. We estimated that fair value using an income approach reflecting internally developed Level 3 discounted cashflows that included, among other things, our expectations of future cash flows based on historical experience and projected growth rates, usageestimates and demand trends. The impairment charge impacted the general, administrative, and other expense line in our Income Statement. We did notallocate that charge to any of our segments.
In the 2010 fourth quarter, we decided to pursue the disposition of a golf course and related assets from our Timeshare segment. In accordancewith the guidance for the impairment of long-lived assets, we evaluated the property and related assets for recovery and in 2010 we recorded animpairment charge of $13 million to adjust the carrying value of the assets to our estimate of fair value. We estimated that fair value using an incomeapproach reflecting internally developed Level 3 discounted cash flows based on negotiations with a qualified prospective third-party purchaser of theasset. The impairment charge impacted the general, administrative, and other expense line in our Income Statement, and we allocated the charge to ourTimeshare segment.
In the 2010 fourth quarter, we decided to pursue the disposition of a land parcel. In accordance with the guidance for the impairment of long-lived assets, we evaluated the property for recovery and subsequently in 2010 we recorded an impairment charge of $14 million to adjust the carryingvalue of the property to our estimate of fair value. We estimated that fair value using an income approach reflecting internally developed Level 3 cashflows that included, among other things, our expectations about the eventual disposition of the property based on discussions with potential third-party purchasers. The impairment charge impacted the general, administrative, and other expense line in our Income Statement, and we allocated thatcharge to our North American Limited-Service segment.
9. ACQUISITIONS AND DISPOSITIONS
2010 AcquisitionsIn 2010, we acquired one land parcel for hotel development and one hotel for cash consideration of $175 million. We also acquired timeshare
and fractional units for use in The Ritz-Carlton Destination Club program for cash consideration of $112 million, which included a deposit of $11million, paid in 2009.
2010 DispositionsIn 2010, we sold two limited-service properties, one full-service property, and one land parcel for cash proceeds of $114 million and recorded a
net gain of $27 million. We accounted for each of the sales under the full accrual method in accordance with accounting for sales of real estate. We willcontinue to operate the full-service property and one of the limited-service properties under management agreements. The other limited-serviceproperty left our system.
2009 Acquisitions and DispositionsWe made no significant acquisitions or dispositions in 2009.
2008 AcquisitionsAt year-end 2007, we were party to a venture that developed and marketed fractional ownership and residential products. In 2008, we purchased
our partner’s interest in that joint venture together with additional land. Cash consideration for this transaction totaled $42 million and we acquiredassets and liabilities totaling $80 million and $38 million, respectively, on the date of purchase. In 2008, we also purchased real estate for a timeshareproject for a total purchase price of approximately $63 million. Cash consideration totaled approximately $39 million, and non-current liabilitiesrecorded as a result of this transaction were $24 million. In addition, in 2008, we purchased real estate for another timeshare project for cashconsideration of $47 million. Also in 2008, we purchased units in an existing building for our timeshare operations for cash consideration ofapproximately $14 million. We also purchased real estate for another timeshare project for $28 million. Cash consideration totaled approximately $27million, and we acquired assets and liabilities totaling $28 million and $1 million, respectively, on the date of purchase.
2008 DispositionsIn 2008, we sold, at book value, two limited-service properties and two land parcels for cash proceeds of $33 million, and we received a $22
million equity interest in the entity that purchased one of the land parcels. We accounted for each of the sales under the full accrual method inaccordance with accounting for sales of real estate and each property will continue to operate under our brands pursuant to management or franchiseagreements. Also, in 2008, we sold our interest in an entity
89
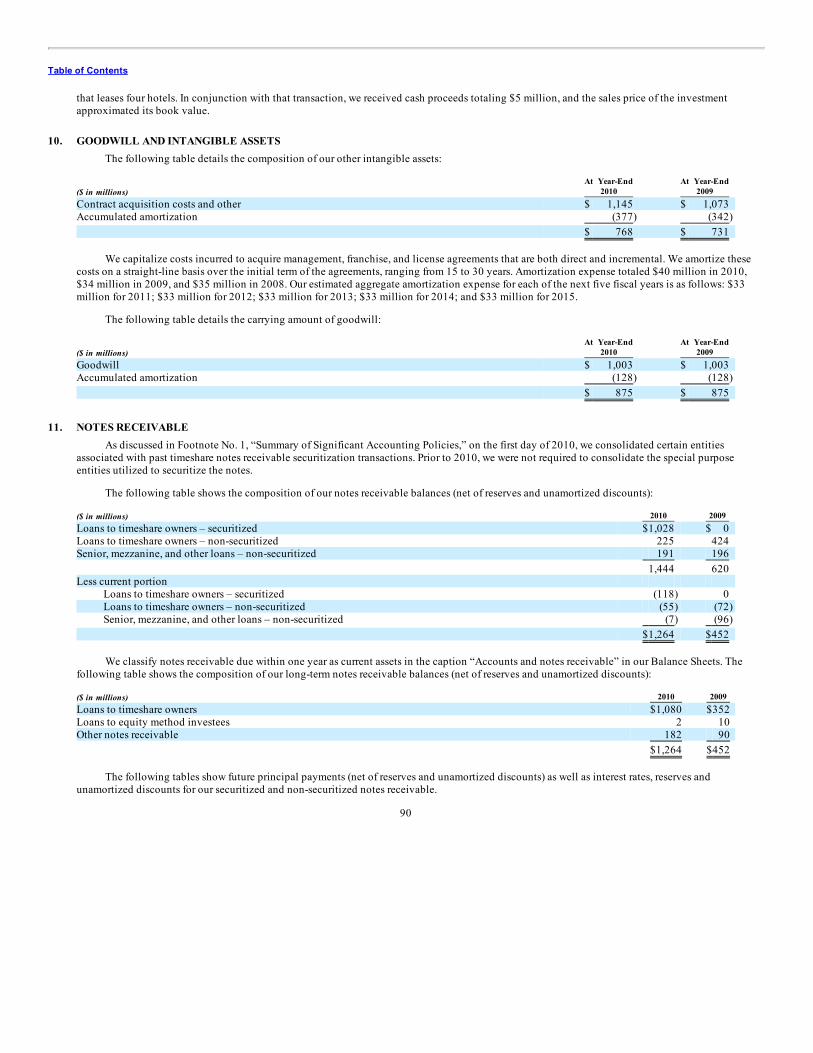
Table of Contents
that leases four hotels. In conjunction with that transaction, we received cash proceeds totaling $5 million, and the sales price of the investmentapproximated its book value.
10. GOODWILL AND INTANGIBLE ASSETS
The following table details the composition of our other intangible assets:
($ in millions) At Year-End
2010 At Year-End
2009 Contract acquisition costs and other $ 1,145 $ 1,073 Accumulated amortization (377) (342)
$ 768 $ 731
We capitalize costs incurred to acquire management, franchise, and license agreements that are both direct and incremental. We amortize thesecosts on a straight-line basis over the initial term of the agreements, ranging from 15 to 30 years. Amortization expense totaled $40 million in 2010,$34 million in 2009, and $35 million in 2008. Our estimated aggregate amortization expense for each of the next five fiscal years is as follows: $33million for 2011; $33 million for 2012; $33 million for 2013; $33 million for 2014; and $33 million for 2015.
The following table details the carrying amount of goodwill:
($ in millions) At Year-End
2010 At Year-End
2009 Goodwill $ 1,003 $ 1,003 Accumulated amortization (128) (128)
$ 875 $ 875
11. NOTES RECEIVABLE
As discussed in Footnote No. 1, “Summary of Significant Accounting Policies,” on the first day of 2010, we consolidated certain entitiesassociated with past timeshare notes receivable securitization transactions. Prior to 2010, we were not required to consolidate the special purposeentities utilized to securitize the notes.
The following table shows the composition of our notes receivable balances (net of reserves and unamortized discounts):
($ in millions) 2010 2009 Loans to timeshare owners – securitized $1,028 $ 0 Loans to timeshare owners – non-securitized 225 424 Senior, mezzanine, and other loans – non-securitized 191 196
1,444 620 Less current portion
Loans to timeshare owners – securitized (118) 0 Loans to timeshare owners – non-securitized (55) (72) Senior, mezzanine, and other loans – non-securitized (7) (96)
$1,264 $452
We classify notes receivable due within one year as current assets in the caption “Accounts and notes receivable” in our Balance Sheets. Thefollowing table shows the composition of our long-term notes receivable balances (net of reserves and unamortized discounts):
($ in millions) 2010 2009 Loans to timeshare owners $1,080 $352 Loans to equity method investees 2 10 Other notes receivable 182 90
$1,264 $452
The following tables show future principal payments (net of reserves and unamortized discounts) as well as interest rates, reserves andunamortized discounts for our securitized and non-securitized notes receivable.
90
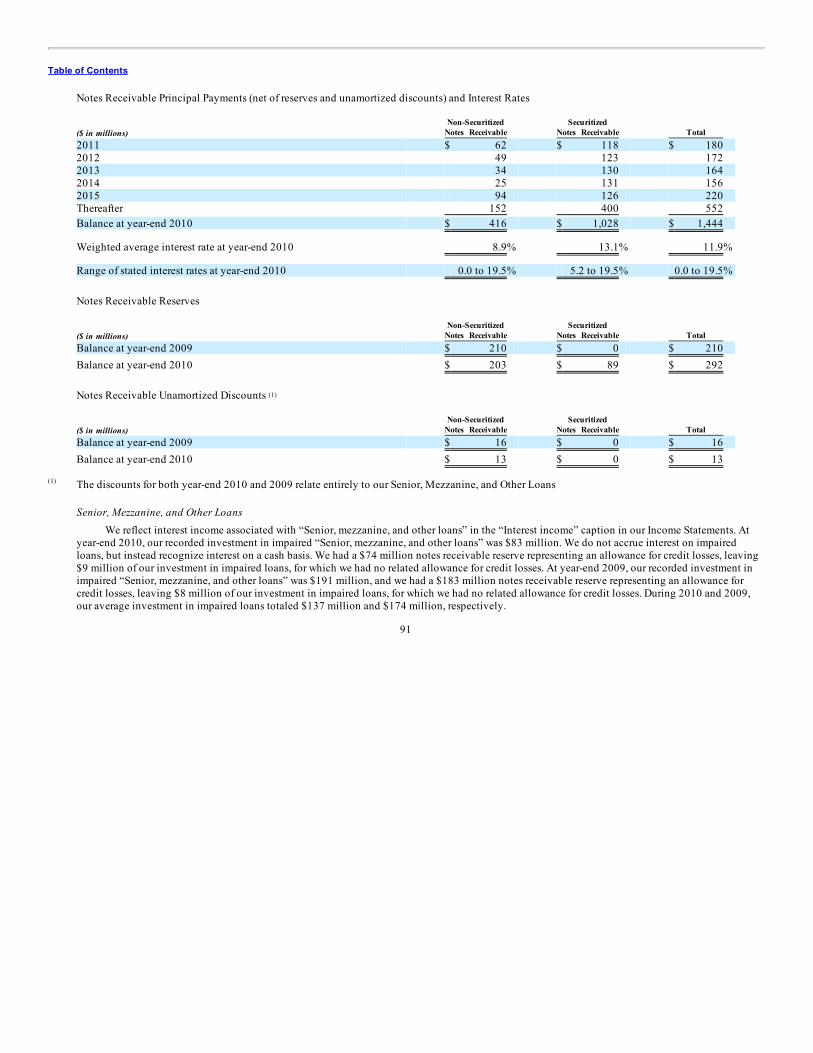
Table of Contents
Notes Receivable Principal Payments (net of reserves and unamortized discounts) and Interest Rates
($ in millions) Non-Securitized
Notes Receivable Securitized
Notes Receivable Total 2011 $ 62 $ 118 $ 180 2012 49 123 172 2013 34 130 164 2014 25 131 156 2015 94 126 220 Thereafter 152 400 552 Balance at year-end 2010 $ 416 $ 1,028 $ 1,444
Weighted average interest rate at year-end 2010 8.9% 13.1% 11.9%
Range of stated interest rates at year-end 2010 0.0 to 19.5% 5.2 to 19.5% 0.0 to 19.5%
Notes Receivable Reserves
($ in millions) Non-Securitized
Notes Receivable Securitized
Notes Receivable Total Balance at year-end 2009 $ 210 $ 0 $ 210 Balance at year-end 2010 $ 203 $ 89 $ 292
Notes Receivable Unamortized Discounts
($ in millions) Non-Securitized
Notes Receivable Securitized
Notes Receivable Total Balance at year-end 2009 $ 16 $ 0 $ 16 Balance at year-end 2010 $ 13 $ 0 $ 13
The discounts for both year-end 2010 and 2009 relate entirely to our Senior, Mezzanine, and Other Loans
Senior, Mezzanine, and Other LoansWe reflect interest income associated with “Senior, mezzanine, and other loans” in the “Interest income” caption in our Income Statements. At
year-end 2010, our recorded investment in impaired “Senior, mezzanine, and other loans” was $83 million. We do not accrue interest on impairedloans, but instead recognize interest on a cash basis. We had a $74 million notes receivable reserve representing an allowance for credit losses, leaving$9 million of our investment in impaired loans, for which we had no related allowance for credit losses. At year-end 2009, our recorded investment inimpaired “Senior, mezzanine, and other loans” was $191 million, and we had a $183 million notes receivable reserve representing an allowance forcredit losses, leaving $8 million of our investment in impaired loans, for which we had no related allowance for credit losses. During 2010 and 2009,our average investment in impaired loans totaled $137 million and $174 million, respectively.
91
(1)
(1)
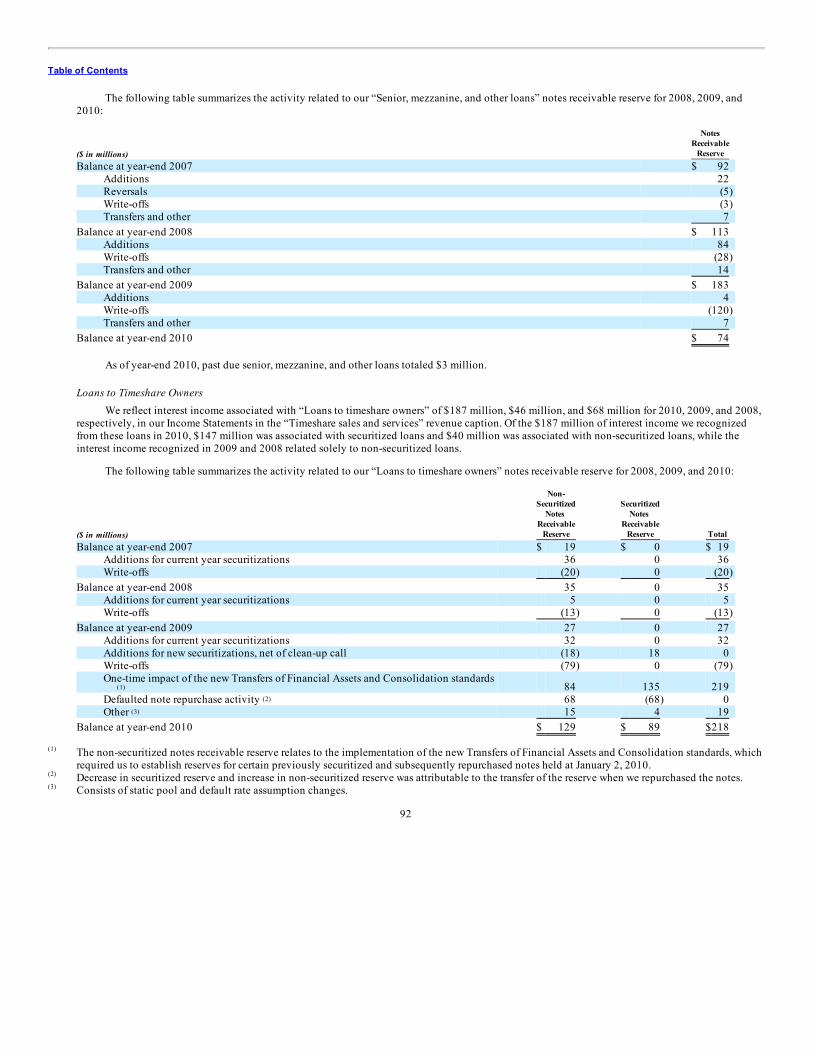
Table of Contents
The following table summarizes the activity related to our “Senior, mezzanine, and other loans” notes receivable reserve for 2008, 2009, and2010:
($ in millions)
NotesReceivable
Reserve Balance at year-end 2007 $ 92
Additions 22 Reversals (5) Write-offs (3) Transfers and other 7
Balance at year-end 2008 $ 113 Additions 84 Write-offs (28) Transfers and other 14
Balance at year-end 2009 $ 183 Additions 4 Write-offs (120) Transfers and other 7
Balance at year-end 2010 $ 74
As of year-end 2010, past due senior, mezzanine, and other loans totaled $3 million.
Loans to Timeshare OwnersWe reflect interest income associated with “Loans to timeshare owners” of $187 million, $46 million, and $68 million for 2010, 2009, and 2008,
respectively, in our Income Statements in the “Timeshare sales and services” revenue caption. Of the $187 million of interest income we recognizedfrom these loans in 2010, $147 million was associated with securitized loans and $40 million was associated with non-securitized loans, while theinterest income recognized in 2009 and 2008 related solely to non-securitized loans.
The following table summarizes the activity related to our “Loans to timeshare owners” notes receivable reserve for 2008, 2009, and 2010:
($ in millions)
Non-Securitized
Notes Receivable
Reserve
SecuritizedNotes
ReceivableReserve Total
Balance at year-end 2007 $ 19 $ 0 $ 19 Additions for current year securitizations 36 0 36 Write-offs (20) 0 (20)
Balance at year-end 2008 35 0 35 Additions for current year securitizations 5 0 5 Write-offs (13) 0 (13)
Balance at year-end 2009 27 0 27 Additions for current year securitizations 32 0 32 Additions for new securitizations, net of clean-up call (18) 18 0 Write-offs (79) 0 (79) One-time impact of the new Transfers of Financial Assets and Consolidation standards
84 135 219 Defaulted note repurchase activity 68 (68) 0 Other 15 4 19
Balance at year-end 2010 $ 129 $ 89 $218
The non-securitized notes receivable reserve relates to the implementation of the new Transfers of Financial Assets and Consolidation standards, whichrequired us to establish reserves for certain previously securitized and subsequently repurchased notes held at January 2, 2010.Decrease in securitized reserve and increase in non-securitized reserve was attributable to the transfer of the reserve when we repurchased the notes.Consists of static pool and default rate assumption changes.
92
(1)
(2)
(3)
(1)
(2)
(3)
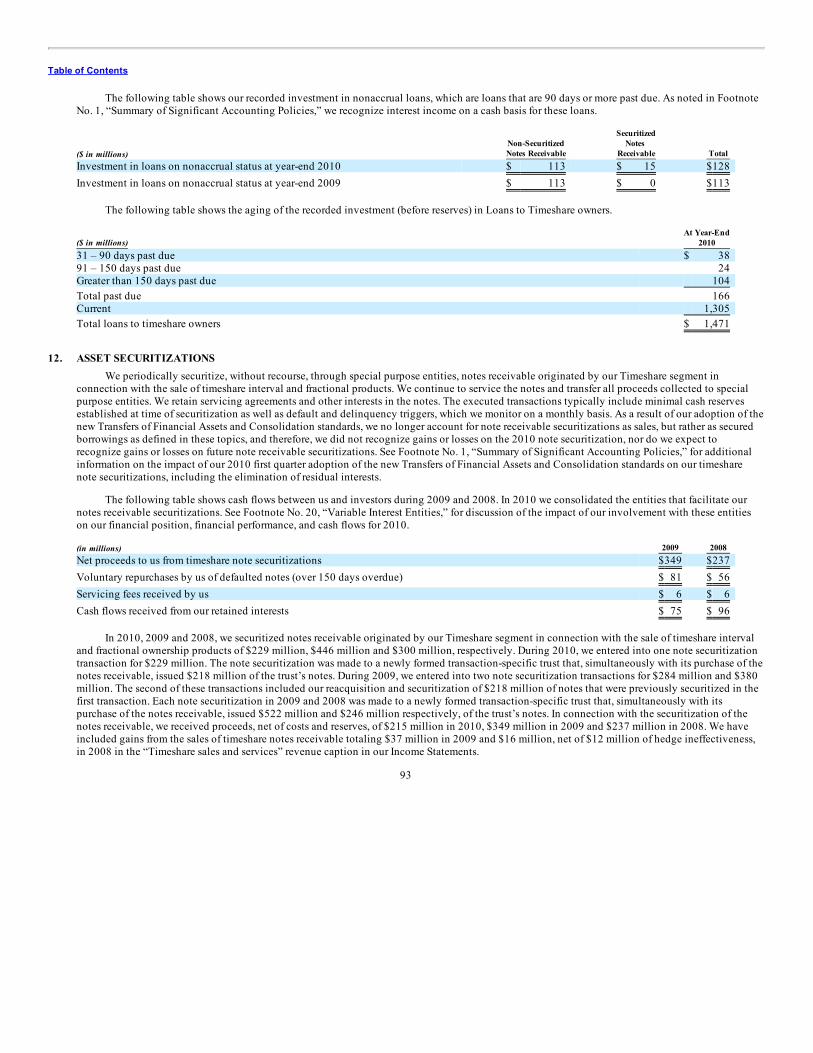
Table of Contents
The following table shows our recorded investment in nonaccrual loans, which are loans that are 90 days or more past due. As noted in FootnoteNo. 1, “Summary of Significant Accounting Policies,” we recognize interest income on a cash basis for these loans.
($ in millions) Non-SecuritizedNotes Receivable
SecuritizedNotes
Receivable Total Investment in loans on nonaccrual status at year-end 2010 $ 113 $ 15 $128 Investment in loans on nonaccrual status at year-end 2009 $ 113 $ 0 $113
The following table shows the aging of the recorded investment (before reserves) in Loans to Timeshare owners.
($ in millions) At Year-End
2010 31 – 90 days past due $ 38 91 – 150 days past due 24 Greater than 150 days past due 104 Total past due 166 Current 1,305 Total loans to timeshare owners $ 1,471
12. ASSET SECURITIZATIONS
We periodically securitize, without recourse, through special purpose entities, notes receivable originated by our Timeshare segment inconnection with the sale of timeshare interval and fractional products. We continue to service the notes and transfer all proceeds collected to specialpurpose entities. We retain servicing agreements and other interests in the notes. The executed transactions typically include minimal cash reservesestablished at time of securitization as well as default and delinquency triggers, which we monitor on a monthly basis. As a result of our adoption of thenew Transfers of Financial Assets and Consolidation standards, we no longer account for note receivable securitizations as sales, but rather as securedborrowings as defined in these topics, and therefore, we did not recognize gains or losses on the 2010 note securitization, nor do we expect torecognize gains or losses on future note receivable securitizations. See Footnote No. 1, “Summary of Significant Accounting Policies,” for additionalinformation on the impact of our 2010 first quarter adoption of the new Transfers of Financial Assets and Consolidation standards on our timesharenote securitizations, including the elimination of residual interests.
The following table shows cash flows between us and investors during 2009 and 2008. In 2010 we consolidated the entities that facilitate ournotes receivable securitizations. See Footnote No. 20, “Variable Interest Entities,” for discussion of the impact of our involvement with these entitieson our financial position, financial performance, and cash flows for 2010.
(in millions) 2009 2008 Net proceeds to us from timeshare note securitizations $349 $237 Voluntary repurchases by us of defaulted notes (over 150 days overdue) $ 81 $ 56 Servicing fees received by us $ 6 $ 6 Cash flows received from our retained interests $ 75 $ 96
In 2010, 2009 and 2008, we securitized notes receivable originated by our Timeshare segment in connection with the sale of timeshare intervaland fractional ownership products of $229 million, $446 million and $300 million, respectively. During 2010, we entered into one note securitizationtransaction for $229 million. The note securitization was made to a newly formed transaction-specific trust that, simultaneously with its purchase of thenotes receivable, issued $218 million of the trust’s notes. During 2009, we entered into two note securitization transactions for $284 million and $380million. The second of these transactions included our reacquisition and securitization of $218 million of notes that were previously securitized in thefirst transaction. Each note securitization in 2009 and 2008 was made to a newly formed transaction-specific trust that, simultaneously with itspurchase of the notes receivable, issued $522 million and $246 million respectively, of the trust’s notes. In connection with the securitization of thenotes receivable, we received proceeds, net of costs and reserves, of $215 million in 2010, $349 million in 2009 and $237 million in 2008. We haveincluded gains from the sales of timeshare notes receivable totaling $37 million in 2009 and $16 million, net of $12 million of hedge ineffectiveness,in 2008 in the “Timeshare sales and services” revenue caption in our Income Statements.
93
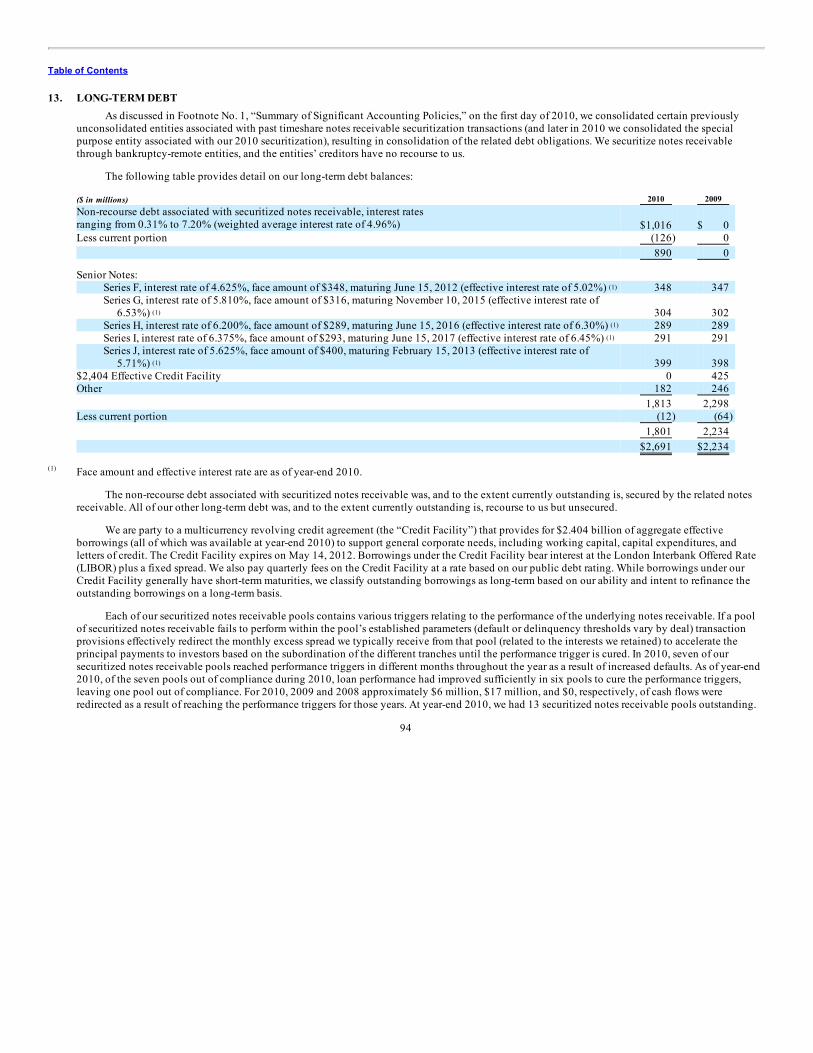
Table of Contents
13. LONG-TERM DEBTAs discussed in Footnote No. 1, “Summary of Significant Accounting Policies,” on the first day of 2010, we consolidated certain previously
unconsolidated entities associated with past timeshare notes receivable securitization transactions (and later in 2010 we consolidated the specialpurpose entity associated with our 2010 securitization), resulting in consolidation of the related debt obligations. We securitize notes receivablethrough bankruptcy-remote entities, and the entities’ creditors have no recourse to us.
The following table provides detail on our long-term debt balances:
($ in millions) 2010 2009 Non-recourse debt associated with securitized notes receivable, interest ratesranging from 0.31% to 7.20% (weighted average interest rate of 4.96%) $1,016 $ 0 Less current portion (126) 0
890 0
Senior Notes: Series F, interest rate of 4.625%, face amount of $348, maturing June 15, 2012 (effective interest rate of 5.02%) 348 347 Series G, interest rate of 5.810%, face amount of $316, maturing November 10, 2015 (effective interest rate of
6.53%) 304 302 Series H, interest rate of 6.200%, face amount of $289, maturing June 15, 2016 (effective interest rate of 6.30%) 289 289 Series I, interest rate of 6.375%, face amount of $293, maturing June 15, 2017 (effective interest rate of 6.45%) 291 291 Series J, interest rate of 5.625%, face amount of $400, maturing February 15, 2013 (effective interest rate of
5.71%) 399 398 $2,404 Effective Credit Facility 0 425 Other 182 246
1,813 2,298 Less current portion (12) (64)
1,801 2,234 $2,691 $2,234
Face amount and effective interest rate are as of year-end 2010.
The non-recourse debt associated with securitized notes receivable was, and to the extent currently outstanding is, secured by the related notesreceivable. All of our other long-term debt was, and to the extent currently outstanding is, recourse to us but unsecured.
We are party to a multicurrency revolving credit agreement (the “Credit Facility”) that provides for $2.404 billion of aggregate effectiveborrowings (all of which was available at year-end 2010) to support general corporate needs, including working capital, capital expenditures, andletters of credit. The Credit Facility expires on May 14, 2012. Borrowings under the Credit Facility bear interest at the London Interbank Offered Rate(LIBOR) plus a fixed spread. We also pay quarterly fees on the Credit Facility at a rate based on our public debt rating. While borrowings under ourCredit Facility generally have short-term maturities, we classify outstanding borrowings as long-term based on our ability and intent to refinance theoutstanding borrowings on a long-term basis.
Each of our securitized notes receivable pools contains various triggers relating to the performance of the underlying notes receivable. If a poolof securitized notes receivable fails to perform within the pool’s established parameters (default or delinquency thresholds vary by deal) transactionprovisions effectively redirect the monthly excess spread we typically receive from that pool (related to the interests we retained) to accelerate theprincipal payments to investors based on the subordination of the different tranches until the performance trigger is cured. In 2010, seven of oursecuritized notes receivable pools reached performance triggers in different months throughout the year as a result of increased defaults. As of year-end2010, of the seven pools out of compliance during 2010, loan performance had improved sufficiently in six pools to cure the performance triggers,leaving one pool out of compliance. For 2010, 2009 and 2008 approximately $6 million, $17 million, and $0, respectively, of cash flows wereredirected as a result of reaching the performance triggers for those years. At year-end 2010, we had 13 securitized notes receivable pools outstanding.
94
(1)
(1)
(1)
(1)
(1)
(1)
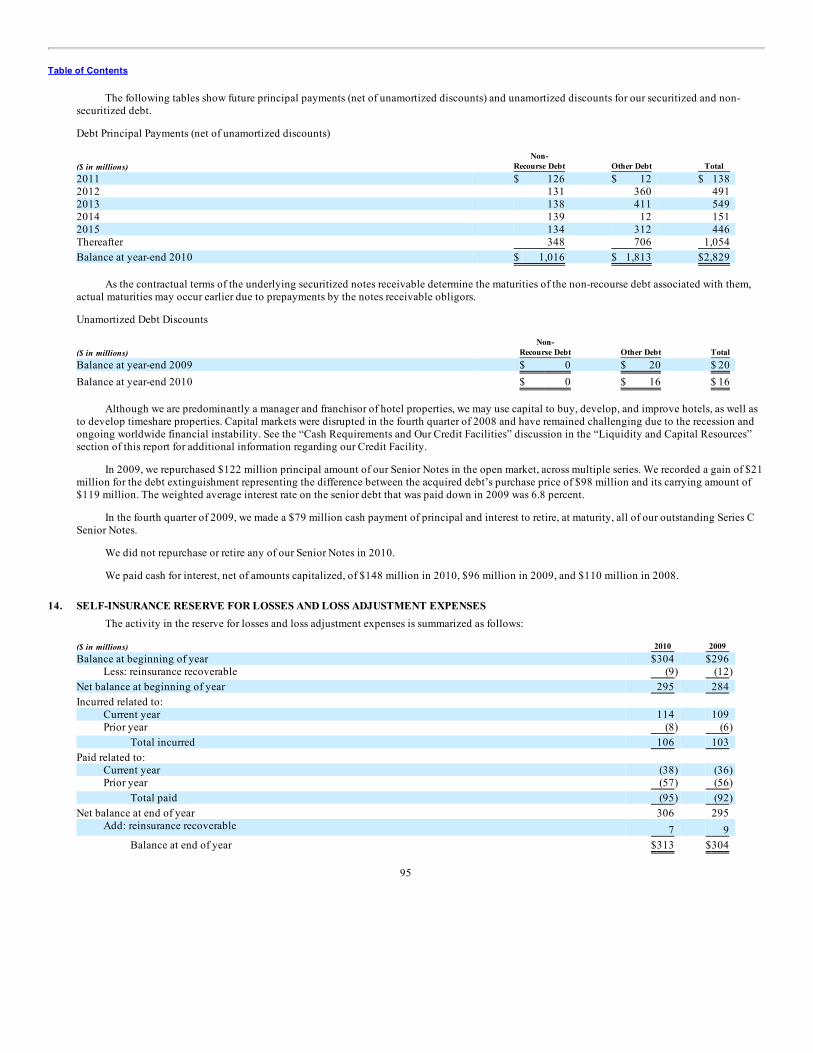
Table of Contents
The following tables show future principal payments (net of unamortized discounts) and unamortized discounts for our securitized and non-securitized debt.
Debt Principal Payments (net of unamortized discounts)
($ in millions) Non-
Recourse Debt Other Debt Total 2011 $ 126 $ 12 $ 138 2012 131 360 491 2013 138 411 549 2014 139 12 151 2015 134 312 446 Thereafter 348 706 1,054 Balance at year-end 2010 $ 1,016 $ 1,813 $2,829
As the contractual terms of the underlying securitized notes receivable determine the maturities of the non-recourse debt associated with them,actual maturities may occur earlier due to prepayments by the notes receivable obligors.
Unamortized Debt Discounts
($ in millions) Non-
Recourse Debt Other Debt Total Balance at year-end 2009 $ 0 $ 20 $ 20 Balance at year-end 2010 $ 0 $ 16 $ 16
Although we are predominantly a manager and franchisor of hotel properties, we may use capital to buy, develop, and improve hotels, as well asto develop timeshare properties. Capital markets were disrupted in the fourth quarter of 2008 and have remained challenging due to the recession andongoing worldwide financial instability. See the “Cash Requirements and Our Credit Facilities” discussion in the “Liquidity and Capital Resources”section of this report for additional information regarding our Credit Facility.
In 2009, we repurchased $122 million principal amount of our Senior Notes in the open market, across multiple series. We recorded a gain of $21million for the debt extinguishment representing the difference between the acquired debt’s purchase price of $98 million and its carrying amount of$119 million. The weighted average interest rate on the senior debt that was paid down in 2009 was 6.8 percent.
In the fourth quarter of 2009, we made a $79 million cash payment of principal and interest to retire, at maturity, all of our outstanding Series CSenior Notes.
We did not repurchase or retire any of our Senior Notes in 2010.
We paid cash for interest, net of amounts capitalized, of $148 million in 2010, $96 million in 2009, and $110 million in 2008. 14. SELF-INSURANCE RESERVE FOR LOSSES AND LOSS ADJUSTMENT EXPENSES
The activity in the reserve for losses and loss adjustment expenses is summarized as follows:
($ in millions) 2010 2009 Balance at beginning of year $304 $296
Less: reinsurance recoverable (9) (12) Net balance at beginning of year 295 284 Incurred related to:
Current year 114 109 Prior year (8) (6)
Total incurred 106 103 Paid related to:
Current year (38) (36) Prior year (57) (56)
Total paid (95) (92) Net balance at end of year 306 295
Add: reinsurance recoverable 7 9 Balance at end of year $313 $304
95
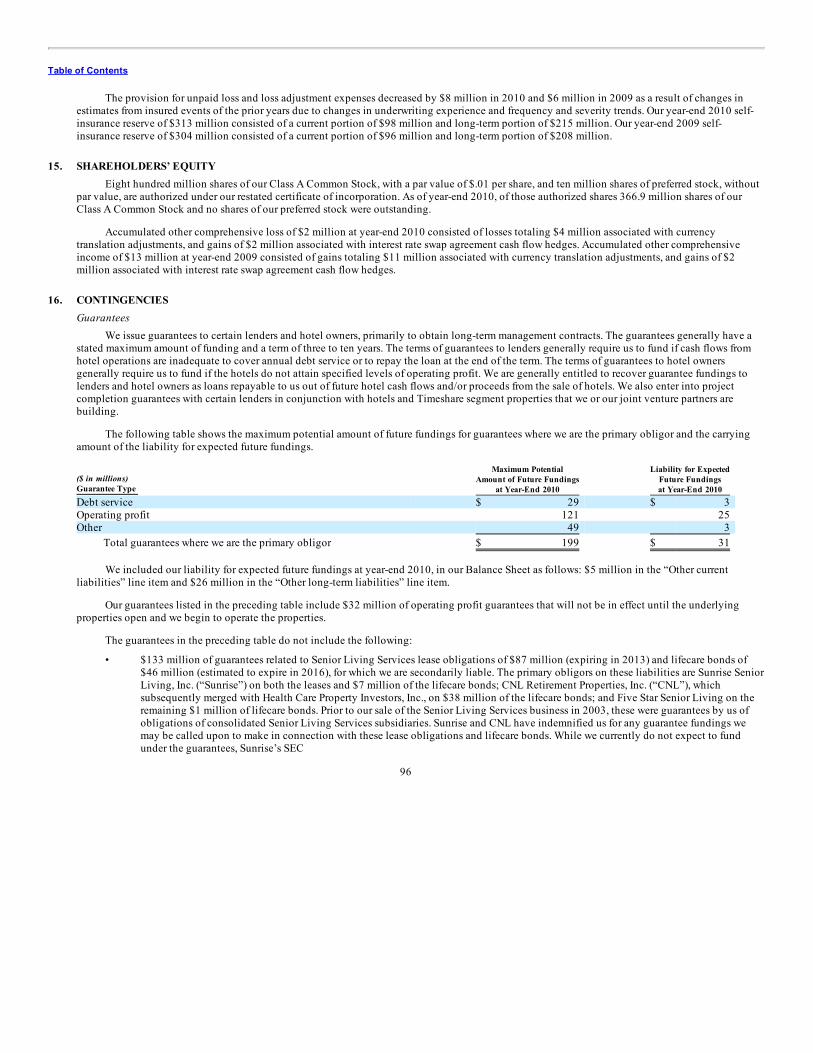
Table of Contents
The provision for unpaid loss and loss adjustment expenses decreased by $8 million in 2010 and $6 million in 2009 as a result of changes inestimates from insured events of the prior years due to changes in underwriting experience and frequency and severity trends. Our year-end 2010 self-insurance reserve of $313 million consisted of a current portion of $98 million and long-term portion of $215 million. Our year-end 2009 self-insurance reserve of $304 million consisted of a current portion of $96 million and long-term portion of $208 million.
15. SHAREHOLDERS’ EQUITY
Eight hundred million shares of our Class A Common Stock, with a par value of $.01 per share, and ten million shares of preferred stock, withoutpar value, are authorized under our restated certificate of incorporation. As of year-end 2010, of those authorized shares 366.9 million shares of ourClass A Common Stock and no shares of our preferred stock were outstanding.
Accumulated other comprehensive loss of $2 million at year-end 2010 consisted of losses totaling $4 million associated with currencytranslation adjustments, and gains of $2 million associated with interest rate swap agreement cash flow hedges. Accumulated other comprehensiveincome of $13 million at year-end 2009 consisted of gains totaling $11 million associated with currency translation adjustments, and gains of $2million associated with interest rate swap agreement cash flow hedges.
16. CONTINGENCIES
GuaranteesWe issue guarantees to certain lenders and hotel owners, primarily to obtain long-term management contracts. The guarantees generally have a
stated maximum amount of funding and a term of three to ten years. The terms of guarantees to lenders generally require us to fund if cash flows fromhotel operations are inadequate to cover annual debt service or to repay the loan at the end of the term. The terms of guarantees to hotel ownersgenerally require us to fund if the hotels do not attain specified levels of operating profit. We are generally entitled to recover guarantee fundings tolenders and hotel owners as loans repayable to us out of future hotel cash flows and/or proceeds from the sale of hotels. We also enter into projectcompletion guarantees with certain lenders in conjunction with hotels and Timeshare segment properties that we or our joint venture partners arebuilding.
The following table shows the maximum potential amount of future fundings for guarantees where we are the primary obligor and the carryingamount of the liability for expected future fundings.
($ in millions)Guarantee Type
Maximum PotentialAmount of Future Fundings
at Year-End 2010
Liability for ExpectedFuture Fundingsat Year-End 2010
Debt service $ 29 $ 3 Operating profit 121 25 Other 49 3
Total guarantees where we are the primary obligor $ 199 $ 31
We included our liability for expected future fundings at year-end 2010, in our Balance Sheet as follows: $5 million in the “Other currentliabilities” line item and $26 million in the “Other long-term liabilities” line item.
Our guarantees listed in the preceding table include $32 million of operating profit guarantees that will not be in effect until the underlyingproperties open and we begin to operate the properties.
The guarantees in the preceding table do not include the following:
• $133 million of guarantees related to Senior Living Services lease obligations of $87 million (expiring in 2013) and lifecare bonds of$46 million (estimated to expire in 2016), for which we are secondarily liable. The primary obligors on these liabilities are Sunrise SeniorLiving, Inc. (“Sunrise”) on both the leases and $7 million of the lifecare bonds; CNL Retirement Properties, Inc. (“CNL”), whichsubsequently merged with Health Care Property Investors, Inc., on $38 million of the lifecare bonds; and Five Star Senior Living on theremaining $1 million of lifecare bonds. Prior to our sale of the Senior Living Services business in 2003, these were guarantees by us ofobligations of consolidated Senior Living Services subsidiaries. Sunrise and CNL have indemnified us for any guarantee fundings wemay be called upon to make in connection with these lease obligations and lifecare bonds. While we currently do not expect to fundunder the guarantees, Sunrise’s SEC
96
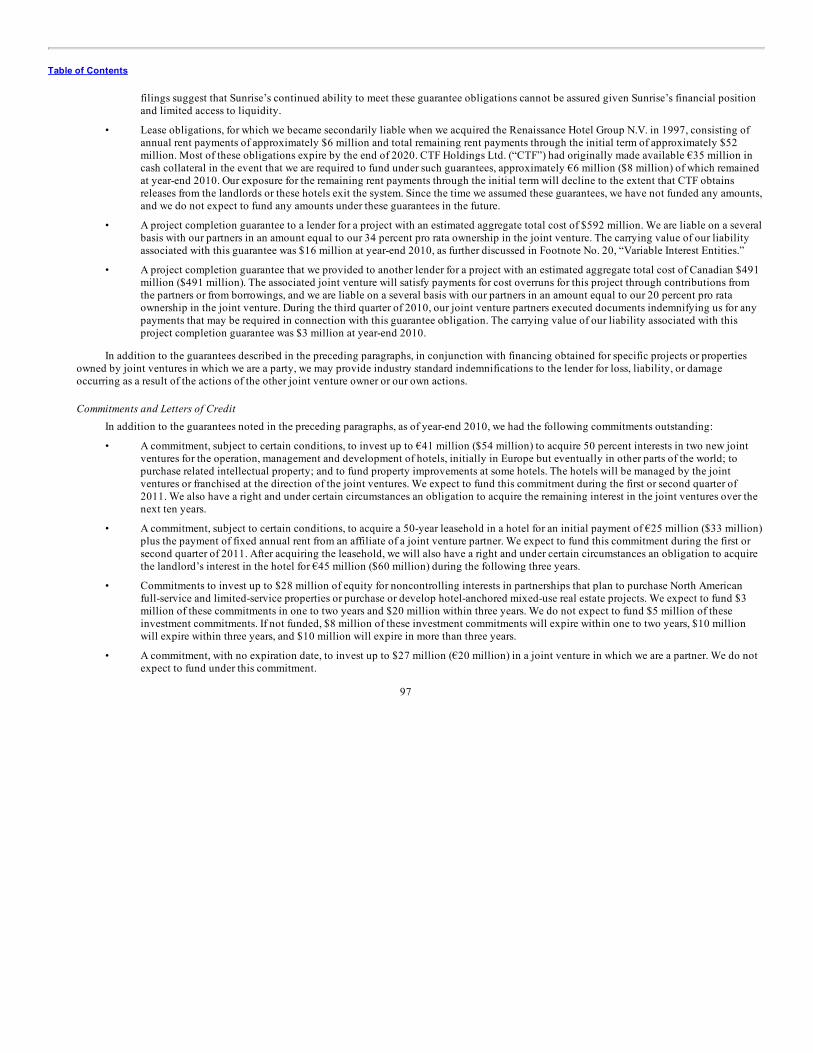
Table of Contents
filings suggest that Sunrise’s continued ability to meet these guarantee obligations cannot be assured given Sunrise’s financial positionand limited access to liquidity.
• Lease obligations, for which we became secondarily liable when we acquired the Renaissance Hotel Group N.V. in 1997, consisting ofannual rent payments of approximately $6 million and total remaining rent payments through the initial term of approximately $52million. Most of these obligations expire by the end of 2020. CTF Holdings Ltd. (“CTF”) had originally made available €35 million incash collateral in the event that we are required to fund under such guarantees, approximately €6 million ($8 million) of which remainedat year-end 2010. Our exposure for the remaining rent payments through the initial term will decline to the extent that CTF obtainsreleases from the landlords or these hotels exit the system. Since the time we assumed these guarantees, we have not funded any amounts,and we do not expect to fund any amounts under these guarantees in the future.
• A project completion guarantee to a lender for a project with an estimated aggregate total cost of $592 million. We are liable on a several
basis with our partners in an amount equal to our 34 percent pro rata ownership in the joint venture. The carrying value of our liabilityassociated with this guarantee was $16 million at year-end 2010, as further discussed in Footnote No. 20, “Variable Interest Entities.”
• A project completion guarantee that we provided to another lender for a project with an estimated aggregate total cost of Canadian $491million ($491 million). The associated joint venture will satisfy payments for cost overruns for this project through contributions fromthe partners or from borrowings, and we are liable on a several basis with our partners in an amount equal to our 20 percent pro rataownership in the joint venture. During the third quarter of 2010, our joint venture partners executed documents indemnifying us for anypayments that may be required in connection with this guarantee obligation. The carrying value of our liability associated with thisproject completion guarantee was $3 million at year-end 2010.
In addition to the guarantees described in the preceding paragraphs, in conjunction with financing obtained for specific projects or propertiesowned by joint ventures in which we are a party, we may provide industry standard indemnifications to the lender for loss, liability, or damageoccurring as a result of the actions of the other joint venture owner or our own actions.
Commitments and Letters of CreditIn addition to the guarantees noted in the preceding paragraphs, as of year-end 2010, we had the following commitments outstanding:
• A commitment, subject to certain conditions, to invest up to €41 million ($54 million) to acquire 50 percent interests in two new jointventures for the operation, management and development of hotels, initially in Europe but eventually in other parts of the world; topurchase related intellectual property; and to fund property improvements at some hotels. The hotels will be managed by the jointventures or franchised at the direction of the joint ventures. We expect to fund this commitment during the first or second quarter of2011. We also have a right and under certain circumstances an obligation to acquire the remaining interest in the joint ventures over thenext ten years.
• A commitment, subject to certain conditions, to acquire a 50-year leasehold in a hotel for an initial payment of €25 million ($33 million)plus the payment of fixed annual rent from an affiliate of a joint venture partner. We expect to fund this commitment during the first orsecond quarter of 2011. After acquiring the leasehold, we will also have a right and under certain circumstances an obligation to acquirethe landlord’s interest in the hotel for €45 million ($60 million) during the following three years.
• Commitments to invest up to $28 million of equity for noncontrolling interests in partnerships that plan to purchase North Americanfull-service and limited-service properties or purchase or develop hotel-anchored mixed-use real estate projects. We expect to fund $3million of these commitments in one to two years and $20 million within three years. We do not expect to fund $5 million of theseinvestment commitments. If not funded, $8 million of these investment commitments will expire within one to two years, $10 millionwill expire within three years, and $10 million will expire in more than three years.
• A commitment, with no expiration date, to invest up to $27 million (€20 million) in a joint venture in which we are a partner. We do notexpect to fund under this commitment.
97
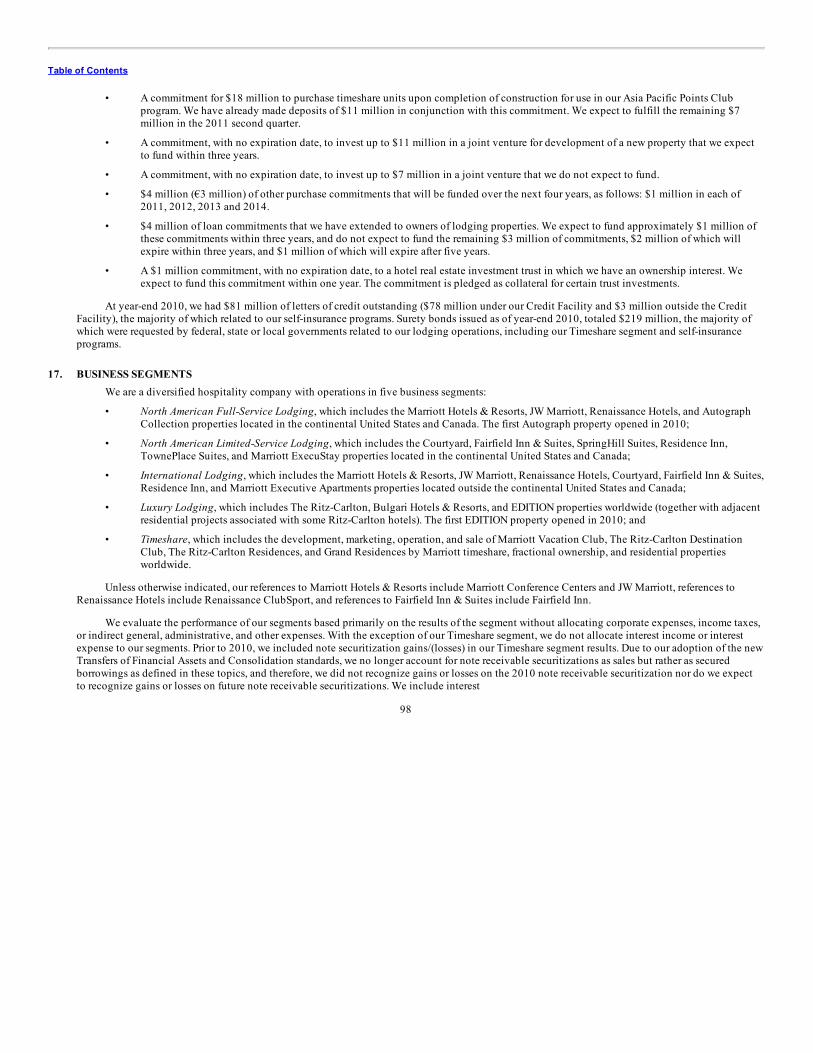
Table of Contents
• A commitment for $18 million to purchase timeshare units upon completion of construction for use in our Asia Pacific Points Club
program. We have already made deposits of $11 million in conjunction with this commitment. We expect to fulfill the remaining $7million in the 2011 second quarter.
• A commitment, with no expiration date, to invest up to $11 million in a joint venture for development of a new property that we expectto fund within three years.
• A commitment, with no expiration date, to invest up to $7 million in a joint venture that we do not expect to fund.
• $4 million (€3 million) of other purchase commitments that will be funded over the next four years, as follows: $1 million in each of2011, 2012, 2013 and 2014.
• $4 million of loan commitments that we have extended to owners of lodging properties. We expect to fund approximately $1 million of
these commitments within three years, and do not expect to fund the remaining $3 million of commitments, $2 million of which willexpire within three years, and $1 million of which will expire after five years.
• A $1 million commitment, with no expiration date, to a hotel real estate investment trust in which we have an ownership interest. Weexpect to fund this commitment within one year. The commitment is pledged as collateral for certain trust investments.
At year-end 2010, we had $81 million of letters of credit outstanding ($78 million under our Credit Facility and $3 million outside the CreditFacility), the majority of which related to our self-insurance programs. Surety bonds issued as of year-end 2010, totaled $219 million, the majority ofwhich were requested by federal, state or local governments related to our lodging operations, including our Timeshare segment and self-insuranceprograms.
17. BUSINESS SEGMENTS
We are a diversified hospitality company with operations in five business segments:
• North American Full-Service Lodging, which includes the Marriott Hotels & Resorts, JW Marriott, Renaissance Hotels, and AutographCollection properties located in the continental United States and Canada. The first Autograph property opened in 2010;
• North American Limited-Service Lodging, which includes the Courtyard, Fairfield Inn & Suites, SpringHill Suites, Residence Inn,TownePlace Suites, and Marriott ExecuStay properties located in the continental United States and Canada;
• International Lodging, which includes the Marriott Hotels & Resorts, JW Marriott, Renaissance Hotels, Courtyard, Fairfield Inn & Suites,Residence Inn, and Marriott Executive Apartments properties located outside the continental United States and Canada;
• Luxury Lodging, which includes The Ritz-Carlton, Bulgari Hotels & Resorts, and EDITION properties worldwide (together with adjacentresidential projects associated with some Ritz-Carlton hotels). The first EDITION property opened in 2010; and
• Timeshare, which includes the development, marketing, operation, and sale of Marriott Vacation Club, The Ritz-Carlton Destination
Club, The Ritz-Carlton Residences, and Grand Residences by Marriott timeshare, fractional ownership, and residential propertiesworldwide.
Unless otherwise indicated, our references to Marriott Hotels & Resorts include Marriott Conference Centers and JW Marriott, references toRenaissance Hotels include Renaissance ClubSport, and references to Fairfield Inn & Suites include Fairfield Inn.
We evaluate the performance of our segments based primarily on the results of the segment without allocating corporate expenses, income taxes,or indirect general, administrative, and other expenses. With the exception of our Timeshare segment, we do not allocate interest income or interestexpense to our segments. Prior to 2010, we included note securitization gains/(losses) in our Timeshare segment results. Due to our adoption of the newTransfers of Financial Assets and Consolidation standards, we no longer account for note receivable securitizations as sales but rather as securedborrowings as defined in these topics, and therefore, we did not recognize gains or losses on the 2010 note receivable securitization nor do we expectto recognize gains or losses on future note receivable securitizations. We include interest
98
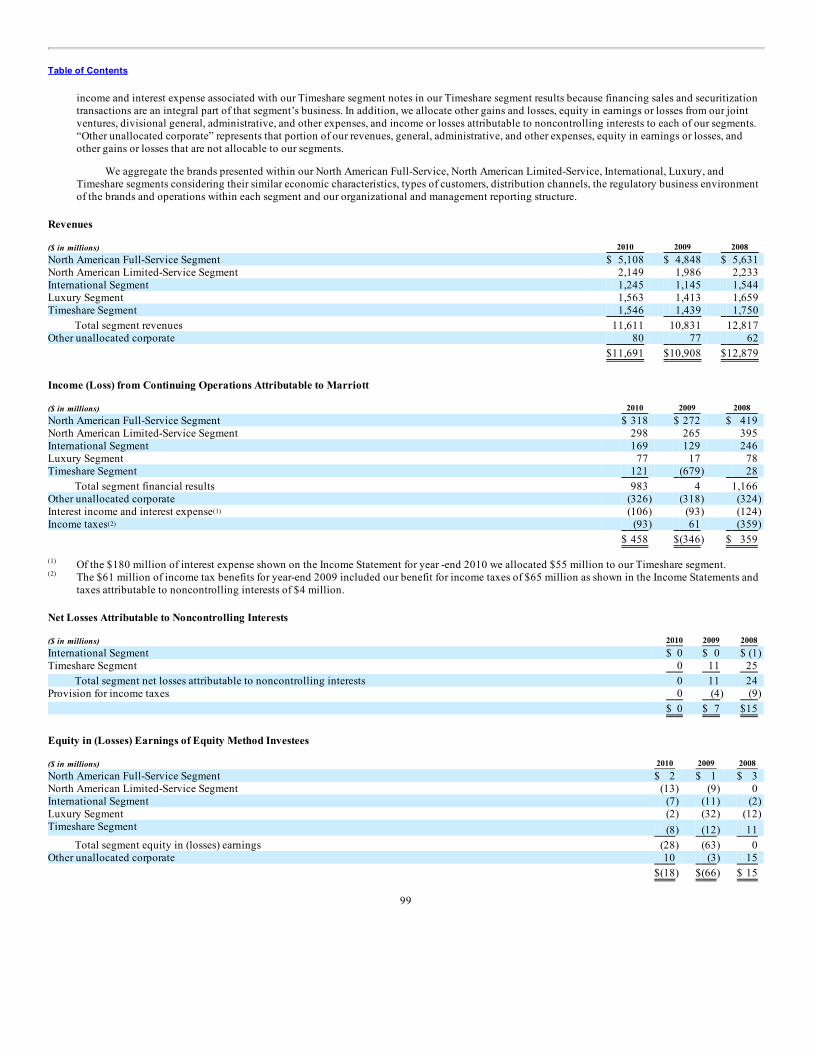
Table of Contents
income and interest expense associated with our Timeshare segment notes in our Timeshare segment results because financing sales and securitizationtransactions are an integral part of that segment’s business. In addition, we allocate other gains and losses, equity in earnings or losses from our jointventures, divisional general, administrative, and other expenses, and income or losses attributable to noncontrolling interests to each of our segments.“Other unallocated corporate” represents that portion of our revenues, general, administrative, and other expenses, equity in earnings or losses, andother gains or losses that are not allocable to our segments.
We aggregate the brands presented within our North American Full-Service, North American Limited-Service, International, Luxury, andTimeshare segments considering their similar economic characteristics, types of customers, distribution channels, the regulatory business environmentof the brands and operations within each segment and our organizational and management reporting structure.
Revenues ($ in millions) 2010 2009 2008 North American Full-Service Segment $ 5,108 $ 4,848 $ 5,631 North American Limited-Service Segment 2,149 1,986 2,233 International Segment 1,245 1,145 1,544 Luxury Segment 1,563 1,413 1,659 Timeshare Segment 1,546 1,439 1,750
Total segment revenues 11,611 10,831 12,817 Other unallocated corporate 80 77 62
$11,691 $10,908 $12,879
Income (Loss) from Continuing Operations Attributable to Marriott ($ in millions) 2010 2009 2008 North American Full-Service Segment $ 318 $ 272 $ 419 North American Limited-Service Segment 298 265 395 International Segment 169 129 246 Luxury Segment 77 17 78 Timeshare Segment 121 (679) 28
Total segment financial results 983 4 1,166 Other unallocated corporate (326) (318) (324) Interest income and interest expense (106) (93) (124) Income taxes (93) 61 (359)
$ 458 $(346) $ 359
Of the $180 million of interest expense shown on the Income Statement for year -end 2010 we allocated $55 million to our Timeshare segment.The $61 million of income tax benefits for year-end 2009 included our benefit for income taxes of $65 million as shown in the Income Statements andtaxes attributable to noncontrolling interests of $4 million.
Net Losses Attributable to Noncontrolling Interests ($ in millions) 2010 2009 2008 International Segment $ 0 $ 0 $ (1) Timeshare Segment 0 11 25
Total segment net losses attributable to noncontrolling interests 0 11 24 Provision for income taxes 0 (4) (9)
$ 0 $ 7 $15
Equity in (Losses) Earnings of Equity Method Investees ($ in millions) 2010 2009 2008 North American Full-Service Segment $ 2 $ 1 $ 3 North American Limited-Service Segment (13) (9) 0 International Segment (7) (11) (2) Luxury Segment (2) (32) (12) Timeshare Segment (8) (12) 11
Total segment equity in (losses) earnings (28) (63) 0 Other unallocated corporate 10 (3) 15
$(18) $(66) $ 15
99
(1)
(2)
(1)
(2)
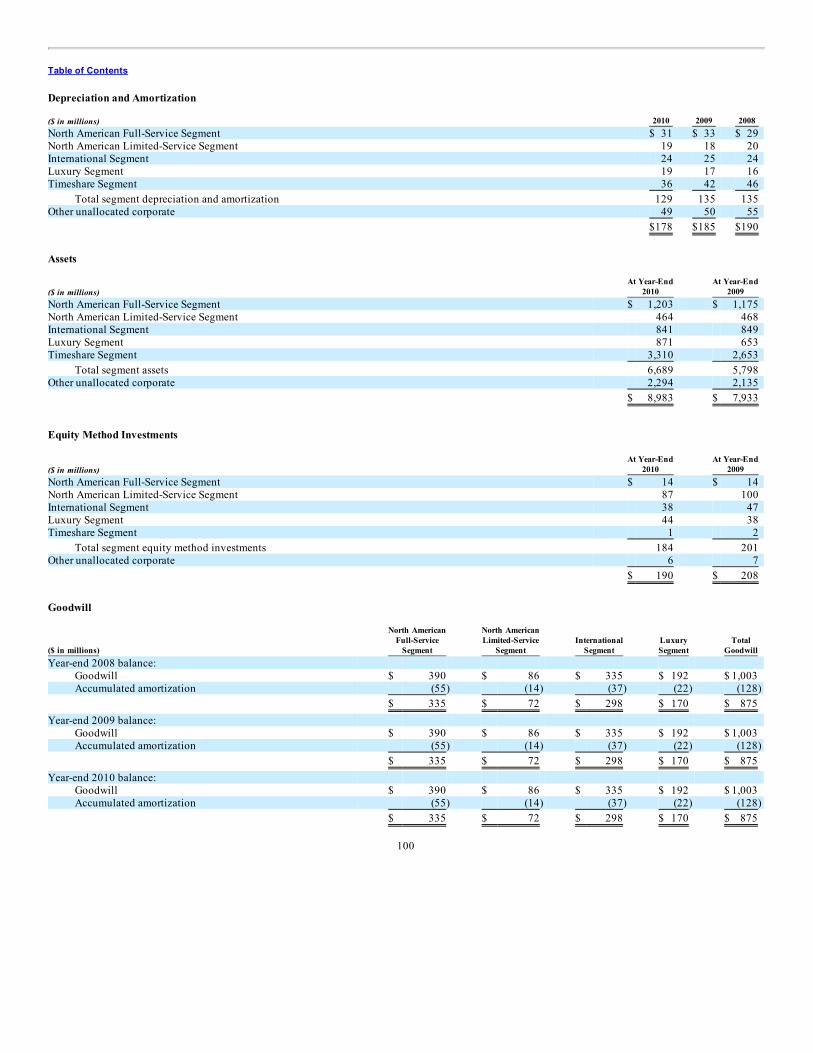
Table of Contents
Depreciation and Amortization ($ in millions) 2010 2009 2008 North American Full-Service Segment $ 31 $ 33 $ 29 North American Limited-Service Segment 19 18 20 International Segment 24 25 24 Luxury Segment 19 17 16 Timeshare Segment 36 42 46
Total segment depreciation and amortization 129 135 135 Other unallocated corporate 49 50 55
$178 $185 $190
Assets
($ in millions) At Year-End
2010 At Year-End
2009 North American Full-Service Segment $ 1,203 $ 1,175 North American Limited-Service Segment 464 468 International Segment 841 849 Luxury Segment 871 653 Timeshare Segment 3,310 2,653
Total segment assets 6,689 5,798 Other unallocated corporate 2,294 2,135
$ 8,983 $ 7,933
Equity Method Investments
($ in millions) At Year-End
2010 At Year-End
2009 North American Full-Service Segment $ 14 $ 14 North American Limited-Service Segment 87 100 International Segment 38 47 Luxury Segment 44 38 Timeshare Segment 1 2
Total segment equity method investments 184 201 Other unallocated corporate 6 7
$ 190 $ 208
Goodwill
($ in millions)
North AmericanFull-Service
Segment
North AmericanLimited-Service
Segment International
Segment LuxurySegment
TotalGoodwill
Year-end 2008 balance: Goodwill $ 390 $ 86 $ 335 $ 192 $ 1,003 Accumulated amortization (55) (14) (37) (22) (128)
$ 335 $ 72 $ 298 $ 170 $ 875 Year-end 2009 balance:
Goodwill $ 390 $ 86 $ 335 $ 192 $ 1,003 Accumulated amortization (55) (14) (37) (22) (128)
$ 335 $ 72 $ 298 $ 170 $ 875 Year-end 2010 balance:
Goodwill $ 390 $ 86 $ 335 $ 192 $ 1,003 Accumulated amortization (55) (14) (37) (22) (128)
$ 335 $ 72 $ 298 $ 170 $ 875
100
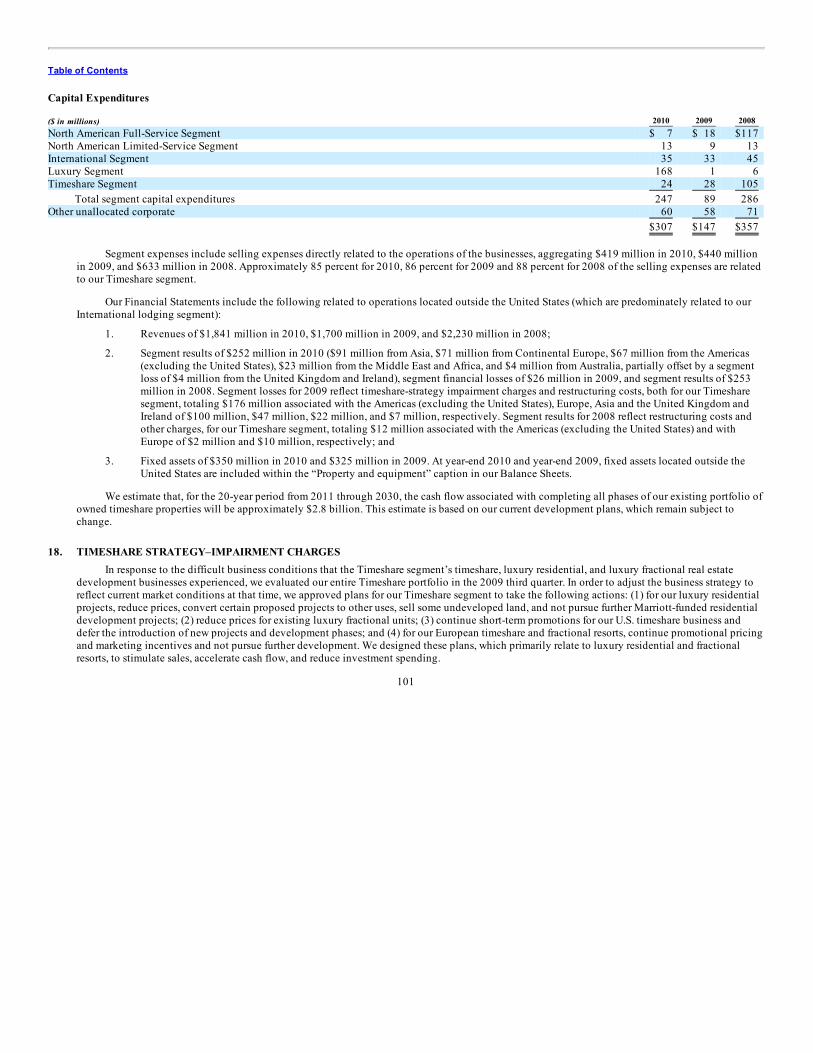
Table of Contents
Capital Expenditures ($ in millions) 2010 2009 2008 North American Full-Service Segment $ 7 $ 18 $117 North American Limited-Service Segment 13 9 13 International Segment 35 33 45 Luxury Segment 168 1 6 Timeshare Segment 24 28 105
Total segment capital expenditures 247 89 286 Other unallocated corporate 60 58 71
$307 $147 $357
Segment expenses include selling expenses directly related to the operations of the businesses, aggregating $419 million in 2010, $440 millionin 2009, and $633 million in 2008. Approximately 85 percent for 2010, 86 percent for 2009 and 88 percent for 2008 of the selling expenses are relatedto our Timeshare segment.
Our Financial Statements include the following related to operations located outside the United States (which are predominately related to ourInternational lodging segment):
1. Revenues of $1,841 million in 2010, $1,700 million in 2009, and $2,230 million in 2008;
2. Segment results of $252 million in 2010 ($91 million from Asia, $71 million from Continental Europe, $67 million from the Americas(excluding the United States), $23 million from the Middle East and Africa, and $4 million from Australia, partially offset by a segmentloss of $4 million from the United Kingdom and Ireland), segment financial losses of $26 million in 2009, and segment results of $253million in 2008. Segment losses for 2009 reflect timeshare-strategy impairment charges and restructuring costs, both for our Timesharesegment, totaling $176 million associated with the Americas (excluding the United States), Europe, Asia and the United Kingdom andIreland of $100 million, $47 million, $22 million, and $7 million, respectively. Segment results for 2008 reflect restructuring costs andother charges, for our Timeshare segment, totaling $12 million associated with the Americas (excluding the United States) and withEurope of $2 million and $10 million, respectively; and
3. Fixed assets of $350 million in 2010 and $325 million in 2009. At year-end 2010 and year-end 2009, fixed assets located outside theUnited States are included within the “Property and equipment” caption in our Balance Sheets.
We estimate that, for the 20-year period from 2011 through 2030, the cash flow associated with completing all phases of our existing portfolio ofowned timeshare properties will be approximately $2.8 billion. This estimate is based on our current development plans, which remain subject tochange.
18. TIMESHARE STRATEGY–IMPAIRMENT CHARGES
In response to the difficult business conditions that the Timeshare segment’s timeshare, luxury residential, and luxury fractional real estatedevelopment businesses experienced, we evaluated our entire Timeshare portfolio in the 2009 third quarter. In order to adjust the business strategy toreflect current market conditions at that time, we approved plans for our Timeshare segment to take the following actions: (1) for our luxury residentialprojects, reduce prices, convert certain proposed projects to other uses, sell some undeveloped land, and not pursue further Marriott-funded residentialdevelopment projects; (2) reduce prices for existing luxury fractional units; (3) continue short-term promotions for our U.S. timeshare business anddefer the introduction of new projects and development phases; and (4) for our European timeshare and fractional resorts, continue promotional pricingand marketing incentives and not pursue further development. We designed these plans, which primarily relate to luxury residential and fractionalresorts, to stimulate sales, accelerate cash flow, and reduce investment spending.
101
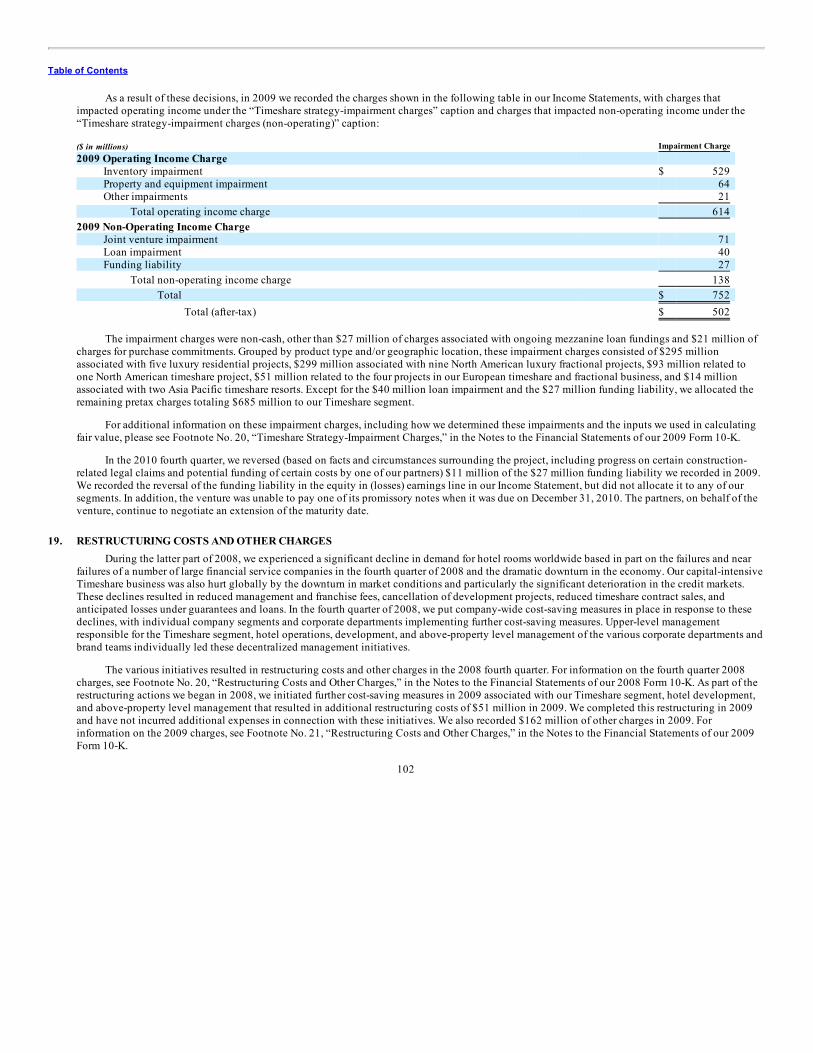
Table of Contents
As a result of these decisions, in 2009 we recorded the charges shown in the following table in our Income Statements, with charges thatimpacted operating income under the “Timeshare strategy-impairment charges” caption and charges that impacted non-operating income under the“Timeshare strategy-impairment charges (non-operating)” caption:
($ in millions) Impairment Charge 2009 Operating Income Charge
Inventory impairment $ 529 Property and equipment impairment 64 Other impairments 21
Total operating income charge 614 2009 Non-Operating Income Charge
Joint venture impairment 71 Loan impairment 40 Funding liability 27
Total non-operating income charge 138 Total $ 752
Total (after-tax) $ 502
The impairment charges were non-cash, other than $27 million of charges associated with ongoing mezzanine loan fundings and $21 million ofcharges for purchase commitments. Grouped by product type and/or geographic location, these impairment charges consisted of $295 millionassociated with five luxury residential projects, $299 million associated with nine North American luxury fractional projects, $93 million related toone North American timeshare project, $51 million related to the four projects in our European timeshare and fractional business, and $14 millionassociated with two Asia Pacific timeshare resorts. Except for the $40 million loan impairment and the $27 million funding liability, we allocated theremaining pretax charges totaling $685 million to our Timeshare segment.
For additional information on these impairment charges, including how we determined these impairments and the inputs we used in calculatingfair value, please see Footnote No. 20, “Timeshare Strategy-Impairment Charges,” in the Notes to the Financial Statements of our 2009 Form 10-K.
In the 2010 fourth quarter, we reversed (based on facts and circumstances surrounding the project, including progress on certain construction-related legal claims and potential funding of certain costs by one of our partners) $11 million of the $27 million funding liability we recorded in 2009.We recorded the reversal of the funding liability in the equity in (losses) earnings line in our Income Statement, but did not allocate it to any of oursegments. In addition, the venture was unable to pay one of its promissory notes when it was due on December 31, 2010. The partners, on behalf of theventure, continue to negotiate an extension of the maturity date.
19. RESTRUCTURING COSTS AND OTHER CHARGES
During the latter part of 2008, we experienced a significant decline in demand for hotel rooms worldwide based in part on the failures and nearfailures of a number of large financial service companies in the fourth quarter of 2008 and the dramatic downturn in the economy. Our capital-intensiveTimeshare business was also hurt globally by the downturn in market conditions and particularly the significant deterioration in the credit markets.These declines resulted in reduced management and franchise fees, cancellation of development projects, reduced timeshare contract sales, andanticipated losses under guarantees and loans. In the fourth quarter of 2008, we put company-wide cost-saving measures in place in response to thesedeclines, with individual company segments and corporate departments implementing further cost-saving measures. Upper-level managementresponsible for the Timeshare segment, hotel operations, development, and above-property level management of the various corporate departments andbrand teams individually led these decentralized management initiatives.
The various initiatives resulted in restructuring costs and other charges in the 2008 fourth quarter. For information on the fourth quarter 2008charges, see Footnote No. 20, “Restructuring Costs and Other Charges,” in the Notes to the Financial Statements of our 2008 Form 10-K. As part of therestructuring actions we began in 2008, we initiated further cost-saving measures in 2009 associated with our Timeshare segment, hotel development,and above-property level management that resulted in additional restructuring costs of $51 million in 2009. We completed this restructuring in 2009and have not incurred additional expenses in connection with these initiatives. We also recorded $162 million of other charges in 2009. Forinformation on the 2009 charges, see Footnote No. 21, “Restructuring Costs and Other Charges,” in the Notes to the Financial Statements of our 2009Form 10-K.
102
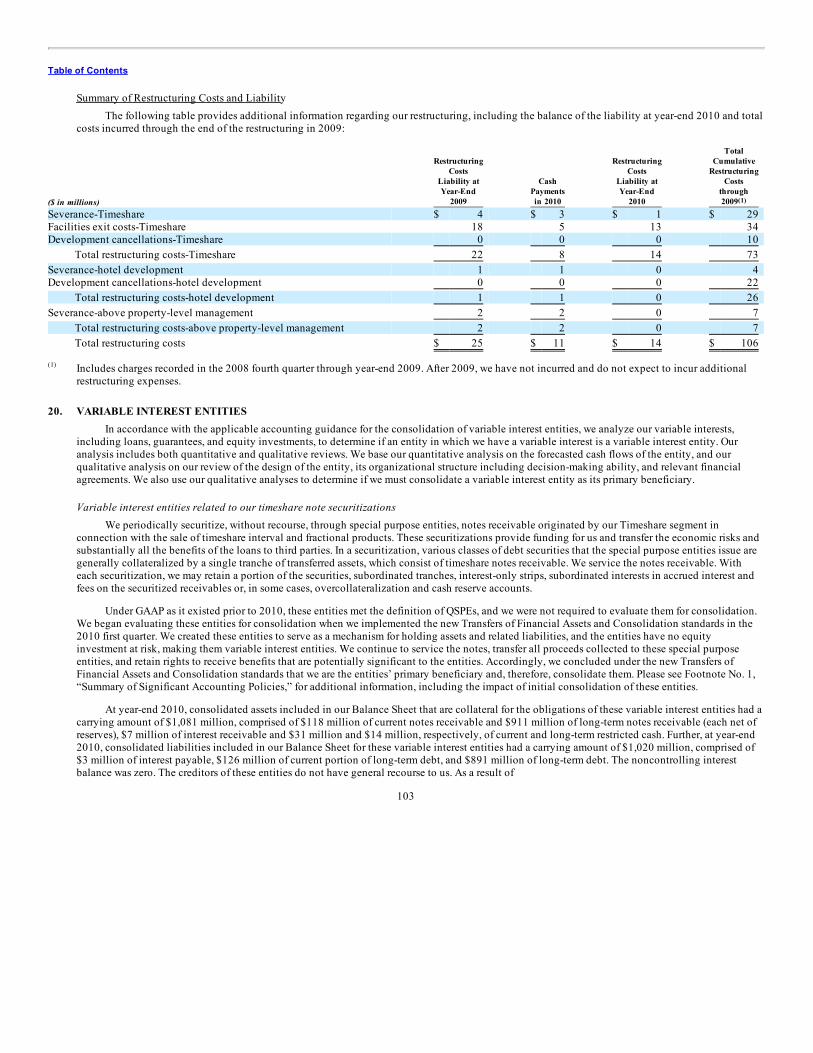
Table of Contents
Summary of Restructuring Costs and LiabilityThe following table provides additional information regarding our restructuring, including the balance of the liability at year-end 2010 and total
costs incurred through the end of the restructuring in 2009:
($ in millions)
RestructuringCosts
Liability atYear-End
2009
CashPaymentsin 2010
RestructuringCosts
Liability atYear-End
2010
TotalCumulative
RestructuringCosts
through2009
Severance-Timeshare $ 4 $ 3 $ 1 $ 29 Facilities exit costs-Timeshare 18 5 13 34 Development cancellations-Timeshare 0 0 0 10
Total restructuring costs-Timeshare 22 8 14 73 Severance-hotel development 1 1 0 4 Development cancellations-hotel development 0 0 0 22
Total restructuring costs-hotel development 1 1 0 26 Severance-above property-level management 2 2 0 7
Total restructuring costs-above property-level management 2 2 0 7 Total restructuring costs $ 25 $ 11 $ 14 $ 106
Includes charges recorded in the 2008 fourth quarter through year-end 2009. After 2009, we have not incurred and do not expect to incur additionalrestructuring expenses.
20. VARIABLE INTEREST ENTITIES
In accordance with the applicable accounting guidance for the consolidation of variable interest entities, we analyze our variable interests,including loans, guarantees, and equity investments, to determine if an entity in which we have a variable interest is a variable interest entity. Ouranalysis includes both quantitative and qualitative reviews. We base our quantitative analysis on the forecasted cash flows of the entity, and ourqualitative analysis on our review of the design of the entity, its organizational structure including decision-making ability, and relevant financialagreements. We also use our qualitative analyses to determine if we must consolidate a variable interest entity as its primary beneficiary.
Variable interest entities related to our timeshare note securitizationsWe periodically securitize, without recourse, through special purpose entities, notes receivable originated by our Timeshare segment in
connection with the sale of timeshare interval and fractional products. These securitizations provide funding for us and transfer the economic risks andsubstantially all the benefits of the loans to third parties. In a securitization, various classes of debt securities that the special purpose entities issue aregenerally collateralized by a single tranche of transferred assets, which consist of timeshare notes receivable. We service the notes receivable. Witheach securitization, we may retain a portion of the securities, subordinated tranches, interest-only strips, subordinated interests in accrued interest andfees on the securitized receivables or, in some cases, overcollateralization and cash reserve accounts.
Under GAAP as it existed prior to 2010, these entities met the definition of QSPEs, and we were not required to evaluate them for consolidation.We began evaluating these entities for consolidation when we implemented the new Transfers of Financial Assets and Consolidation standards in the2010 first quarter. We created these entities to serve as a mechanism for holding assets and related liabilities, and the entities have no equityinvestment at risk, making them variable interest entities. We continue to service the notes, transfer all proceeds collected to these special purposeentities, and retain rights to receive benefits that are potentially significant to the entities. Accordingly, we concluded under the new Transfers ofFinancial Assets and Consolidation standards that we are the entities’ primary beneficiary and, therefore, consolidate them. Please see Footnote No. 1,“Summary of Significant Accounting Policies,” for additional information, including the impact of initial consolidation of these entities.
At year-end 2010, consolidated assets included in our Balance Sheet that are collateral for the obligations of these variable interest entities had acarrying amount of $1,081 million, comprised of $118 million of current notes receivable and $911 million of long-term notes receivable (each net ofreserves), $7 million of interest receivable and $31 million and $14 million, respectively, of current and long-term restricted cash. Further, at year-end2010, consolidated liabilities included in our Balance Sheet for these variable interest entities had a carrying amount of $1,020 million, comprised of$3 million of interest payable, $126 million of current portion of long-term debt, and $891 million of long-term debt. The noncontrolling interestbalance was zero. The creditors of these entities do not have general recourse to us. As a result of
103
(1)
(1)
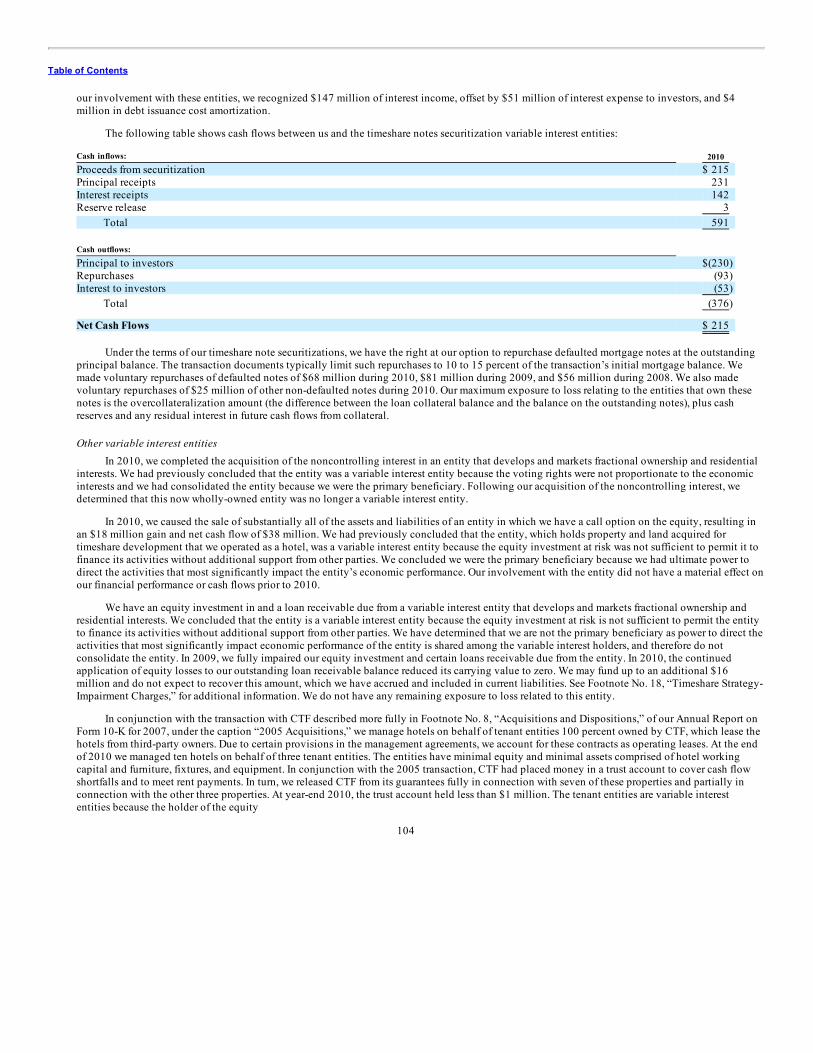
Table of Contents
our involvement with these entities, we recognized $147 million of interest income, offset by $51 million of interest expense to investors, and $4million in debt issuance cost amortization.
The following table shows cash flows between us and the timeshare notes securitization variable interest entities:
Cash inflows: 2010 Proceeds from securitization $ 215 Principal receipts 231 Interest receipts 142 Reserve release 3
Total 591
Cash outflows: Principal to investors $(230) Repurchases (93) Interest to investors (53)
Total (376)
Net Cash Flows $ 215
Under the terms of our timeshare note securitizations, we have the right at our option to repurchase defaulted mortgage notes at the outstandingprincipal balance. The transaction documents typically limit such repurchases to 10 to 15 percent of the transaction’s initial mortgage balance. Wemade voluntary repurchases of defaulted notes of $68 million during 2010, $81 million during 2009, and $56 million during 2008. We also madevoluntary repurchases of $25 million of other non-defaulted notes during 2010. Our maximum exposure to loss relating to the entities that own thesenotes is the overcollateralization amount (the difference between the loan collateral balance and the balance on the outstanding notes), plus cashreserves and any residual interest in future cash flows from collateral.
Other variable interest entitiesIn 2010, we completed the acquisition of the noncontrolling interest in an entity that develops and markets fractional ownership and residential
interests. We had previously concluded that the entity was a variable interest entity because the voting rights were not proportionate to the economicinterests and we had consolidated the entity because we were the primary beneficiary. Following our acquisition of the noncontrolling interest, wedetermined that this now wholly-owned entity was no longer a variable interest entity.
In 2010, we caused the sale of substantially all of the assets and liabilities of an entity in which we have a call option on the equity, resulting inan $18 million gain and net cash flow of $38 million. We had previously concluded that the entity, which holds property and land acquired fortimeshare development that we operated as a hotel, was a variable interest entity because the equity investment at risk was not sufficient to permit it tofinance its activities without additional support from other parties. We concluded we were the primary beneficiary because we had ultimate power todirect the activities that most significantly impact the entity’s economic performance. Our involvement with the entity did not have a material effect onour financial performance or cash flows prior to 2010.
We have an equity investment in and a loan receivable due from a variable interest entity that develops and markets fractional ownership andresidential interests. We concluded that the entity is a variable interest entity because the equity investment at risk is not sufficient to permit the entityto finance its activities without additional support from other parties. We have determined that we are not the primary beneficiary as power to direct theactivities that most significantly impact economic performance of the entity is shared among the variable interest holders, and therefore do notconsolidate the entity. In 2009, we fully impaired our equity investment and certain loans receivable due from the entity. In 2010, the continuedapplication of equity losses to our outstanding loan receivable balance reduced its carrying value to zero. We may fund up to an additional $16million and do not expect to recover this amount, which we have accrued and included in current liabilities. See Footnote No. 18, “Timeshare Strategy-Impairment Charges,” for additional information. We do not have any remaining exposure to loss related to this entity.
In conjunction with the transaction with CTF described more fully in Footnote No. 8, “Acquisitions and Dispositions,” of our Annual Report onForm 10-K for 2007, under the caption “2005 Acquisitions,” we manage hotels on behalf of tenant entities 100 percent owned by CTF, which lease thehotels from third-party owners. Due to certain provisions in the management agreements, we account for these contracts as operating leases. At the endof 2010 we managed ten hotels on behalf of three tenant entities. The entities have minimal equity and minimal assets comprised of hotel workingcapital and furniture, fixtures, and equipment. In conjunction with the 2005 transaction, CTF had placed money in a trust account to cover cash flowshortfalls and to meet rent payments. In turn, we released CTF from its guarantees fully in connection with seven of these properties and partially inconnection with the other three properties. At year-end 2010, the trust account held less than $1 million. The tenant entities are variable interestentities because the holder of the equity
104
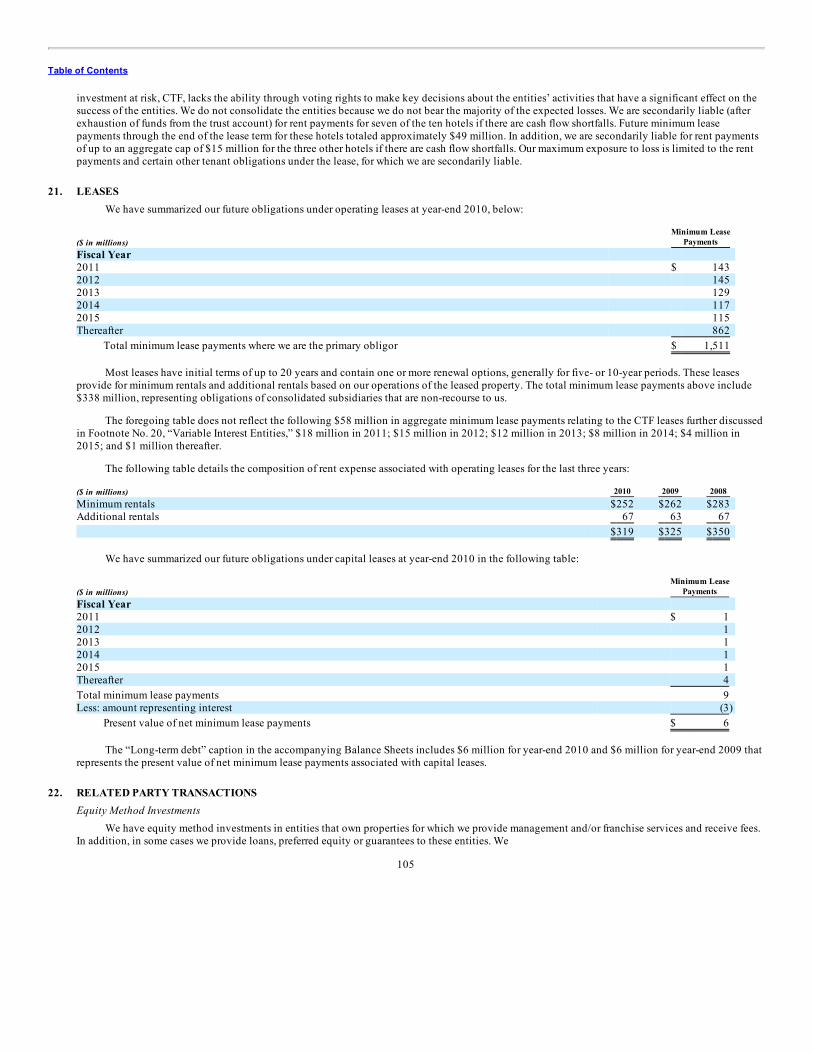
Table of Contents
investment at risk, CTF, lacks the ability through voting rights to make key decisions about the entities’ activities that have a significant effect on thesuccess of the entities. We do not consolidate the entities because we do not bear the majority of the expected losses. We are secondarily liable (afterexhaustion of funds from the trust account) for rent payments for seven of the ten hotels if there are cash flow shortfalls. Future minimum leasepayments through the end of the lease term for these hotels totaled approximately $49 million. In addition, we are secondarily liable for rent paymentsof up to an aggregate cap of $15 million for the three other hotels if there are cash flow shortfalls. Our maximum exposure to loss is limited to the rentpayments and certain other tenant obligations under the lease, for which we are secondarily liable.
21. LEASES
We have summarized our future obligations under operating leases at year-end 2010, below:
($ in millions) Minimum Lease
Payments Fiscal Year 2011 $ 143 2012 145 2013 129 2014 117 2015 115 Thereafter 862
Total minimum lease payments where we are the primary obligor $ 1,511
Most leases have initial terms of up to 20 years and contain one or more renewal options, generally for five- or 10-year periods. These leasesprovide for minimum rentals and additional rentals based on our operations of the leased property. The total minimum lease payments above include$338 million, representing obligations of consolidated subsidiaries that are non-recourse to us.
The foregoing table does not reflect the following $58 million in aggregate minimum lease payments relating to the CTF leases further discussedin Footnote No. 20, “Variable Interest Entities,” $18 million in 2011; $15 million in 2012; $12 million in 2013; $8 million in 2014; $4 million in2015; and $1 million thereafter.
The following table details the composition of rent expense associated with operating leases for the last three years:
($ in millions) 2010 2009 2008 Minimum rentals $252 $262 $283 Additional rentals 67 63 67
$319 $325 $350
We have summarized our future obligations under capital leases at year-end 2010 in the following table:
($ in millions) Minimum Lease
Payments Fiscal Year 2011 $ 1 2012 1 2013 1 2014 1 2015 1 Thereafter 4 Total minimum lease payments 9 Less: amount representing interest (3)
Present value of net minimum lease payments $ 6
The “Long-term debt” caption in the accompanying Balance Sheets includes $6 million for year-end 2010 and $6 million for year-end 2009 thatrepresents the present value of net minimum lease payments associated with capital leases.
22. RELATED PARTY TRANSACTIONS
Equity Method InvestmentsWe have equity method investments in entities that own properties for which we provide management and/or franchise services and receive fees.
In addition, in some cases we provide loans, preferred equity or guarantees to these entities. We
105
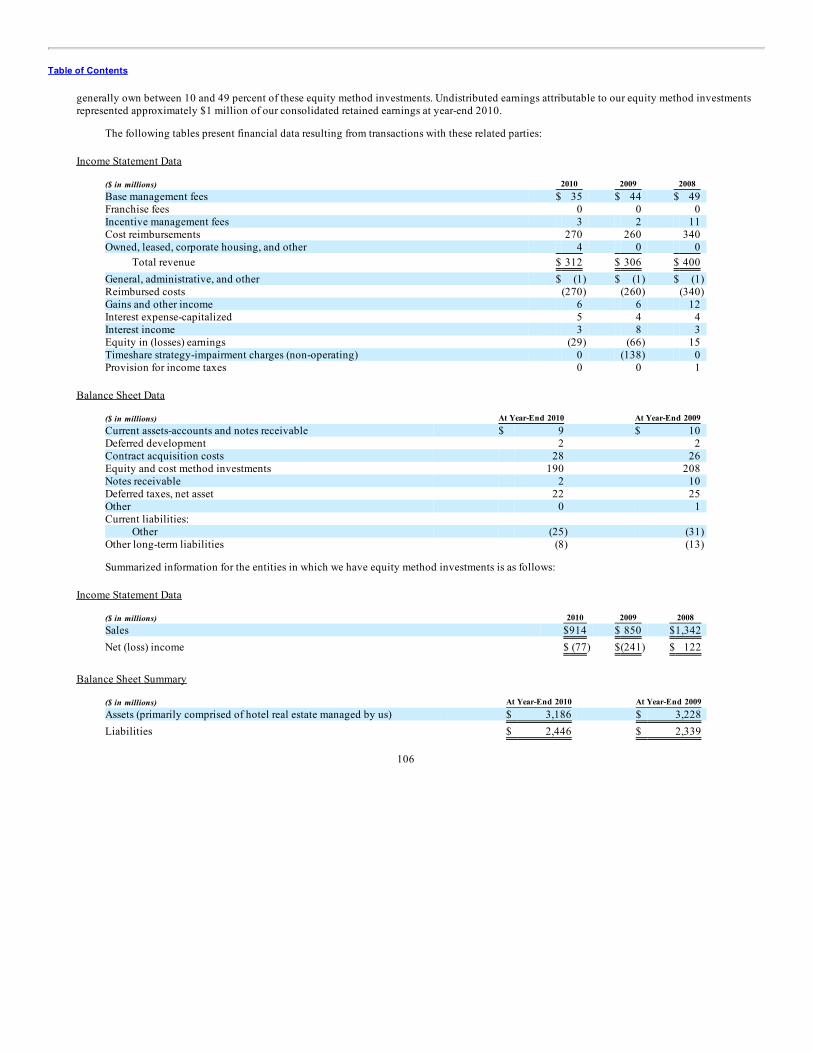
Table of Contents
generally own between 10 and 49 percent of these equity method investments. Undistributed earnings attributable to our equity method investmentsrepresented approximately $1 million of our consolidated retained earnings at year-end 2010.
The following tables present financial data resulting from transactions with these related parties:
Income Statement Data
($ in millions) 2010 2009 2008 Base management fees $ 35 $ 44 $ 49 Franchise fees 0 0 0 Incentive management fees 3 2 11 Cost reimbursements 270 260 340 Owned, leased, corporate housing, and other 4 0 0
Total revenue $ 312 $ 306 $ 400 General, administrative, and other $ (1) $ (1) $ (1) Reimbursed costs (270) (260) (340) Gains and other income 6 6 12 Interest expense-capitalized 5 4 4 Interest income 3 8 3 Equity in (losses) earnings (29) (66) 15 Timeshare strategy-impairment charges (non-operating) 0 (138) 0 Provision for income taxes 0 0 1
Balance Sheet Data
($ in millions) At Year-End 2010 At Year-End 2009 Current assets-accounts and notes receivable $ 9 $ 10 Deferred development 2 2 Contract acquisition costs 28 26 Equity and cost method investments 190 208 Notes receivable 2 10 Deferred taxes, net asset 22 25 Other 0 1 Current liabilities:
Other (25) (31) Other long-term liabilities (8) (13)
Summarized information for the entities in which we have equity method investments is as follows:
Income Statement Data
($ in millions) 2010 2009 2008 Sales $914 $ 850 $1,342 Net (loss) income $ (77) $(241) $ 122
Balance Sheet Summary
($ in millions) At Year-End 2010 At Year-End 2009 Assets (primarily comprised of hotel real estate managed by us) $ 3,186 $ 3,228 Liabilities $ 2,446 $ 2,339
106
Table of Contents
23. RELATIONSHIP WITH MAJOR CUSTOMERAt year-end 2010 and 2009, Host Hotels & Resorts, Inc., formerly known as Host Marriott Corporation, and its affiliates (“Host”) owned or leased
146 lodging properties that we operated under long-term agreements. We recognized the following revenues (which are included in our NorthAmerican Full-Service, North American Limited-Service, Luxury, and International segments) from lodging properties owned or leased over the lastthree years: $2,036 million in 2010, $2,096 million in 2009, and $2,539 in 2008.
Host is also a partner in certain unconsolidated partnerships that own lodging properties that we operate under long-term agreements. As of year-end 2010 and 2009, Host was affiliated with five such properties. We recognized the following revenues (which are included in our North AmericanFull-Service, Luxury, and International segments for 2010, 2009 and 2008, as well as our North American Limited-Service segment for 2008) fromlodging properties associated with Host partnerships over the last three years: $112 million in 2010, $104 million in 2009, and $411 million in 2008.
24. SUBSEQUENT EVENT
On February 14, 2011, we announced a plan to split the company’s businesses into two separate, publicly traded companies. Under the plan, weexpect to spin off our timeshare operations and development business as a new independent company through a special tax-free dividend to ourshareholders in late 2011. The new company will focus on the timeshare business as the exclusive developer and operator of timeshare, fractional, andrelated products under the Marriott brand and the exclusive developer of fractional and related products under the Ritz-Carlton brand. After the split,we will concentrate on the lodging management and franchise business. We will receive franchise fees from the new timeshare company’s use of theMarriott timeshare and Ritz-Carlton fractional brands.
As two separate public companies, Marriott and the new timeshare company will have separate boards of directors. William J. Shaw, who recentlyannounced his retirement as vice chairman of Marriott and also resigned from its board, will become chairman of the board of the new timesharecompany and Deborah Marriott Harrison, senior vice president of government affairs for Marriott, will serve as a board member of the new timesharecompany. J.W. Marriott, Jr. will remain chairman of the board and chief executive officer of Marriott. Stephen P. Weisz, president of Marriott’stimeshare business since 1997 and a 39-year Marriott veteran, will become chief executive officer of the new company. We expect that the commonstock of the new timeshare company will be listed on the New York Stock Exchange. We do not expect that the new timeshare company will pay aquarterly cash dividend or be investment grade in the near term.
We expect that the new timeshare company will file a Form 10 registration statement with the SEC in the second quarter 2011. At that time, wewill disclose additional details about the proposed transaction, including respective pro forma balance sheets and pro forma income statements of thetwo companies. The transaction is subject to the receipt of normal and customary regulatory approvals and third-party consents, the execution of inter-company agreements, receipt of a favorable ruling from the Internal Revenue Service, arrangement of adequate financing facilities, final approval byour board of directors, and other related matters. The transaction will not require shareholder approval and will have no impact on Marriott’scontractual obligations to the existing securitizations. Subject to the completion of this ongoing work, and the receipt of regulatory approvals, thespin-off should be completed before year end 2011.
107
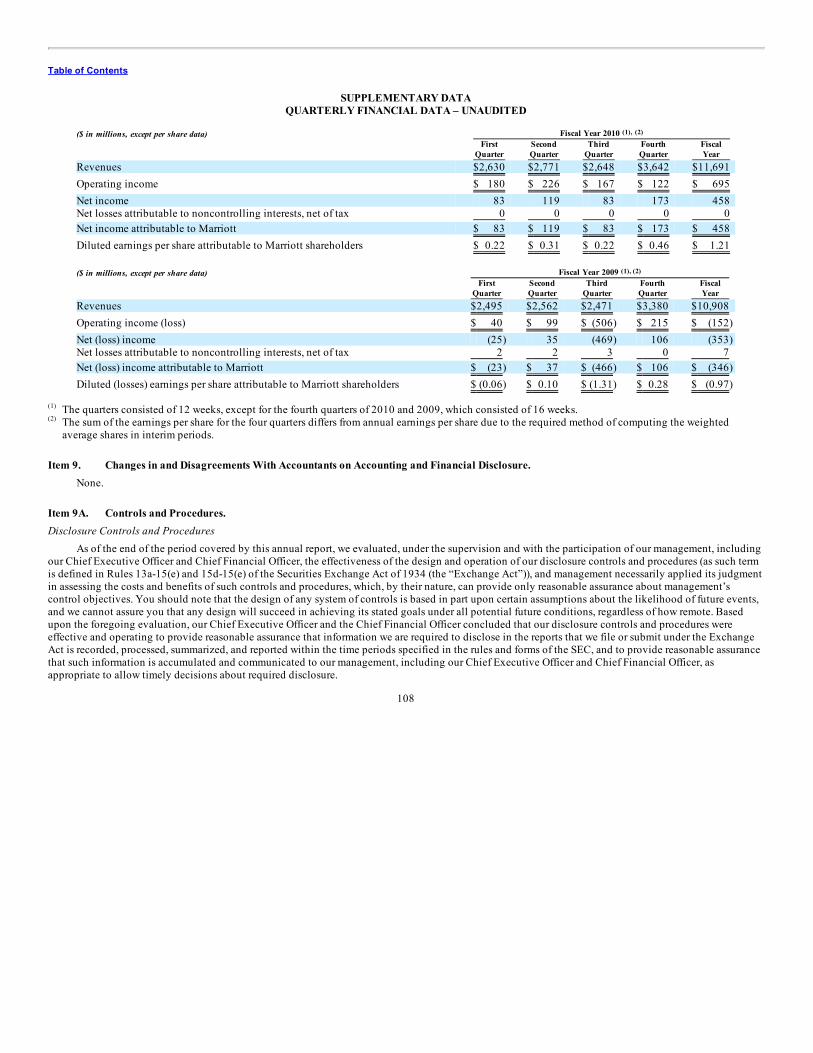
Table of Contents
SUPPLEMENTARY DATAQUARTERLY FINANCIAL DATA – UNAUDITED
($ in millions, except per share data) Fiscal Year 2010
First
Quarter SecondQuarter
ThirdQuarter
FourthQuarter
FiscalYear
Revenues $2,630 $2,771 $2,648 $3,642 $11,691 Operating income $ 180 $ 226 $ 167 $ 122 $ 695 Net income 83 119 83 173 458 Net losses attributable to noncontrolling interests, net of tax 0 0 0 0 0 Net income attributable to Marriott $ 83 $ 119 $ 83 $ 173 $ 458 Diluted earnings per share attributable to Marriott shareholders $ 0.22 $ 0.31 $ 0.22 $ 0.46 $ 1.21
($ in millions, except per share data) Fiscal Year 2009
First
Quarter SecondQuarter
ThirdQuarter
FourthQuarter
FiscalYear
Revenues $2,495 $2,562 $2,471 $3,380 $10,908 Operating income (loss) $ 40 $ 99 $ (506) $ 215 $ (152) Net (loss) income (25) 35 (469) 106 (353) Net losses attributable to noncontrolling interests, net of tax 2 2 3 0 7 Net (loss) income attributable to Marriott $ (23) $ 37 $ (466) $ 106 $ (346) Diluted (losses) earnings per share attributable to Marriott shareholders $ (0.06) $ 0.10 $ (1.31) $ 0.28 $ (0.97)
The quarters consisted of 12 weeks, except for the fourth quarters of 2010 and 2009, which consisted of 16 weeks.The sum of the earnings per share for the four quarters differs from annual earnings per share due to the required method of computing the weightedaverage shares in interim periods.
Item 9. Changes in and Disagreements With Accountants on Accounting and Financial Disclosure.
None. Item 9A. Controls and Procedures.Disclosure Controls and Procedures
As of the end of the period covered by this annual report, we evaluated, under the supervision and with the participation of our management, includingour Chief Executive Officer and Chief Financial Officer, the effectiveness of the design and operation of our disclosure controls and procedures (as such termis defined in Rules 13a-15(e) and 15d-15(e) of the Securities Exchange Act of 1934 (the “Exchange Act”)), and management necessarily applied its judgmentin assessing the costs and benefits of such controls and procedures, which, by their nature, can provide only reasonable assurance about management’scontrol objectives. You should note that the design of any system of controls is based in part upon certain assumptions about the likelihood of future events,and we cannot assure you that any design will succeed in achieving its stated goals under all potential future conditions, regardless of how remote. Basedupon the foregoing evaluation, our Chief Executive Officer and the Chief Financial Officer concluded that our disclosure controls and procedures wereeffective and operating to provide reasonable assurance that information we are required to disclose in the reports that we file or submit under the ExchangeAct is recorded, processed, summarized, and reported within the time periods specified in the rules and forms of the SEC, and to provide reasonable assurancethat such information is accumulated and communicated to our management, including our Chief Executive Officer and Chief Financial Officer, asappropriate to allow timely decisions about required disclosure.
108
(1), (2)
(1), (2)
(1)
(2)

Table of Contents
Internal Control Over Financial ReportingThere were no changes in internal control over financial reporting that occurred during the fourth quarter that have materially affected, or are
reasonably likely to materially affect, our internal control over financial reporting. Item 9B. Other Information.
None.
109
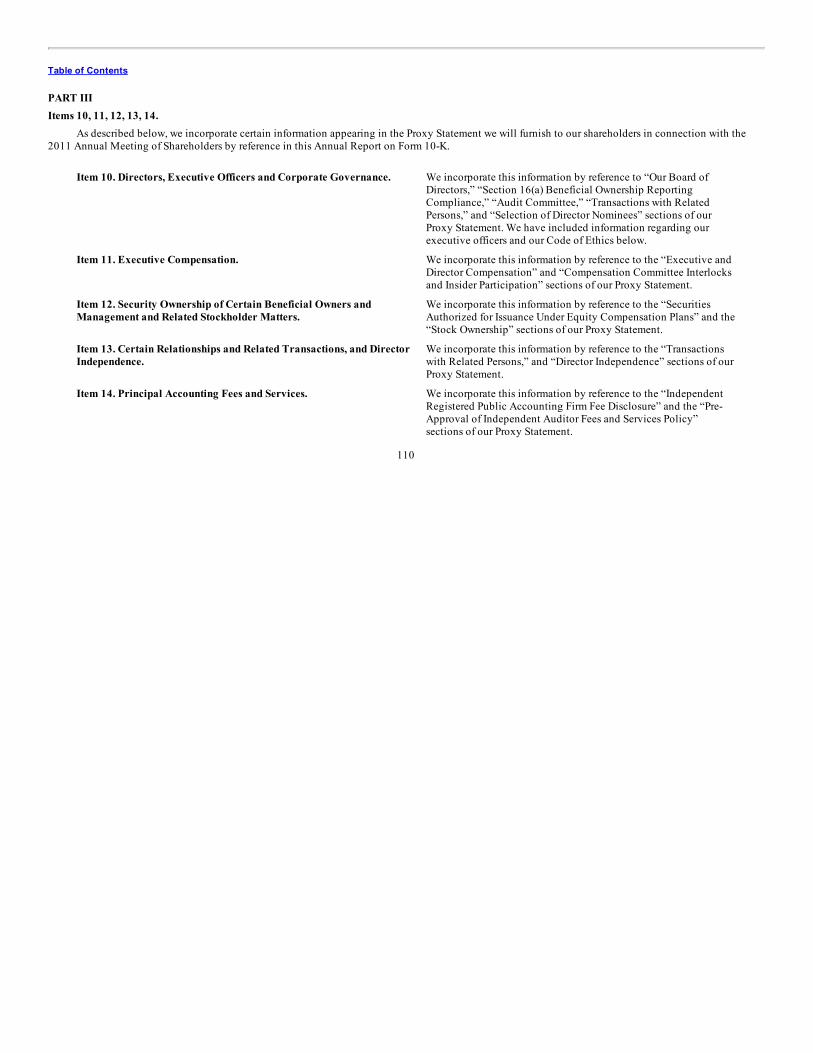
Table of Contents
PART IIIItems 10, 11, 12, 13, 14.
As described below, we incorporate certain information appearing in the Proxy Statement we will furnish to our shareholders in connection with the2011 Annual Meeting of Shareholders by reference in this Annual Report on Form 10-K.
Item 10. Directors, Executive Officers and Corporate Governance.
We incorporate this information by reference to “Our Board ofDirectors,” “Section 16(a) Beneficial Ownership ReportingCompliance,” “Audit Committee,” “Transactions with RelatedPersons,” and “Selection of Director Nominees” sections of ourProxy Statement. We have included information regarding ourexecutive officers and our Code of Ethics below.
Item 11. Executive Compensation.
We incorporate this information by reference to the “Executive andDirector Compensation” and “Compensation Committee Interlocksand Insider Participation” sections of our Proxy Statement.
Item 12. Security Ownership of Certain Beneficial Owners andManagement and Related Stockholder Matters.
We incorporate this information by reference to the “SecuritiesAuthorized for Issuance Under Equity Compensation Plans” and the“Stock Ownership” sections of our Proxy Statement.
Item 13. Certain Relationships and Related Transactions, and DirectorIndependence.
We incorporate this information by reference to the “Transactionswith Related Persons,” and “Director Independence” sections of ourProxy Statement.
Item 14. Principal Accounting Fees and Services.
We incorporate this information by reference to the “IndependentRegistered Public Accounting Firm Fee Disclosure” and the “Pre-Approval of Independent Auditor Fees and Services Policy”sections of our Proxy Statement.
110
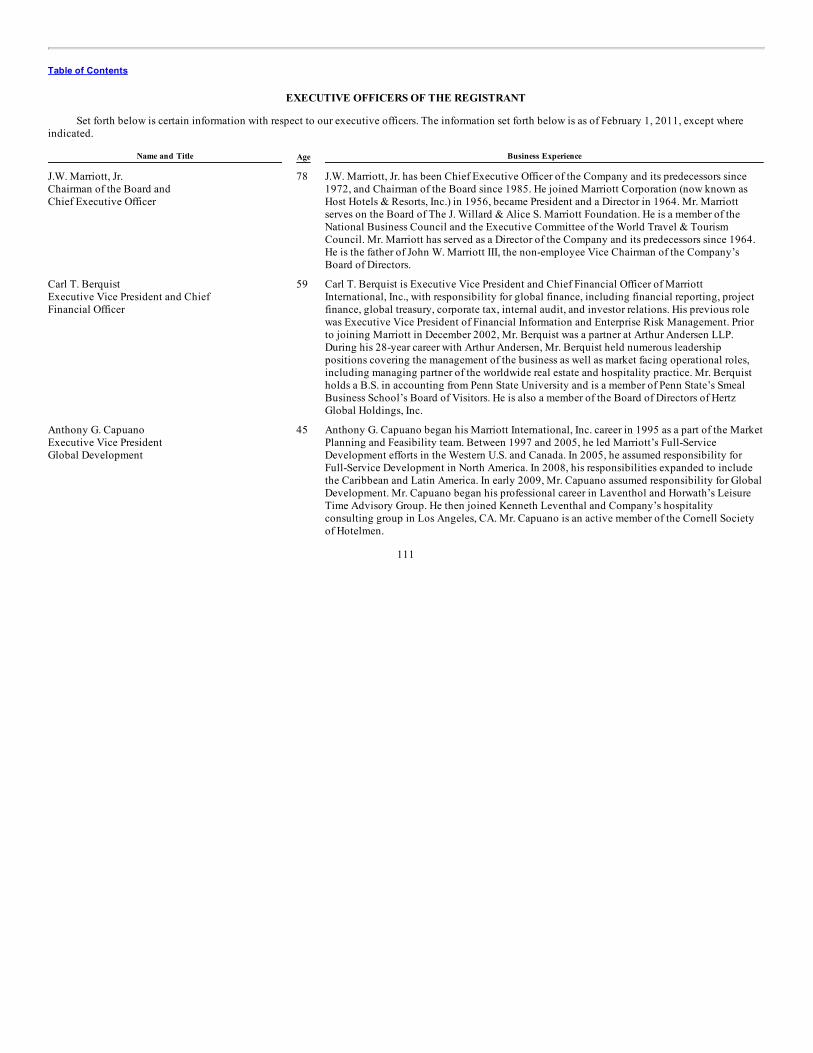
Table of Contents
EXECUTIVE OFFICERS OF THE REGISTRANT
Set forth below is certain information with respect to our executive officers. The information set forth below is as of February 1, 2011, except whereindicated.
Name and Title Age Business Experience
J.W. Marriott, Jr.Chairman of the Board andChief Executive Officer
78
J.W. Marriott, Jr. has been Chief Executive Officer of the Company and its predecessors since1972, and Chairman of the Board since 1985. He joined Marriott Corporation (now known asHost Hotels & Resorts, Inc.) in 1956, became President and a Director in 1964. Mr. Marriottserves on the Board of The J. Willard & Alice S. Marriott Foundation. He is a member of theNational Business Council and the Executive Committee of the World Travel & TourismCouncil. Mr. Marriott has served as a Director of the Company and its predecessors since 1964.He is the father of John W. Marriott III, the non-employee Vice Chairman of the Company’sBoard of Directors.
Carl T. BerquistExecutive Vice President and ChiefFinancial Officer
59
Carl T. Berquist is Executive Vice President and Chief Financial Officer of MarriottInternational, Inc., with responsibility for global finance, including financial reporting, projectfinance, global treasury, corporate tax, internal audit, and investor relations. His previous rolewas Executive Vice President of Financial Information and Enterprise Risk Management. Priorto joining Marriott in December 2002, Mr. Berquist was a partner at Arthur Andersen LLP.During his 28-year career with Arthur Andersen, Mr. Berquist held numerous leadershippositions covering the management of the business as well as market facing operational roles,including managing partner of the worldwide real estate and hospitality practice. Mr. Berquistholds a B.S. in accounting from Penn State University and is a member of Penn State’s SmealBusiness School’s Board of Visitors. He is also a member of the Board of Directors of HertzGlobal Holdings, Inc.
Anthony G. CapuanoExecutive Vice PresidentGlobal Development
45
Anthony G. Capuano began his Marriott International, Inc. career in 1995 as a part of the MarketPlanning and Feasibility team. Between 1997 and 2005, he led Marriott’s Full-ServiceDevelopment efforts in the Western U.S. and Canada. In 2005, he assumed responsibility forFull-Service Development in North America. In 2008, his responsibilities expanded to includethe Caribbean and Latin America. In early 2009, Mr. Capuano assumed responsibility for GlobalDevelopment. Mr. Capuano began his professional career in Laventhol and Horwath’s LeisureTime Advisory Group. He then joined Kenneth Leventhal and Company’s hospitalityconsulting group in Los Angeles, CA. Mr. Capuano is an active member of the Cornell Societyof Hotelmen.
111
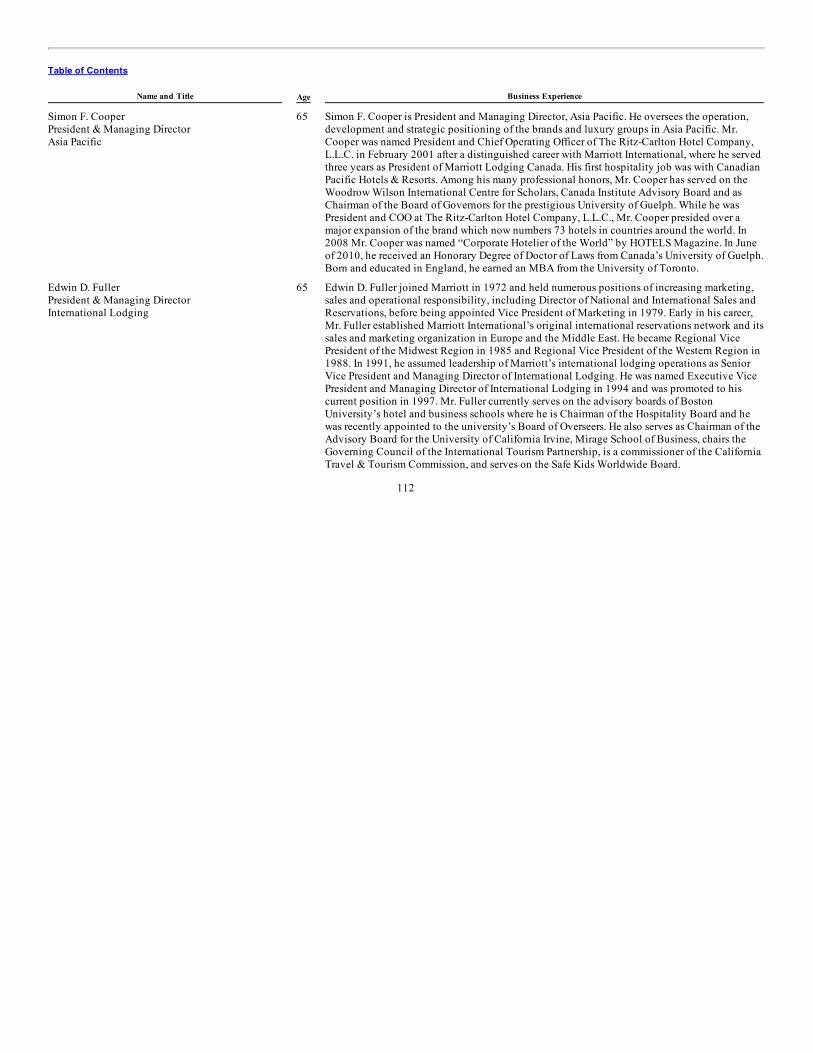
Table of Contents
Name and Title Age Business Experience
Simon F. CooperPresident & Managing DirectorAsia Pacific
65
Simon F. Cooper is President and Managing Director, Asia Pacific. He oversees the operation,development and strategic positioning of the brands and luxury groups in Asia Pacific. Mr.Cooper was named President and Chief Operating Officer of The Ritz-Carlton Hotel Company,L.L.C. in February 2001 after a distinguished career with Marriott International, where he servedthree years as President of Marriott Lodging Canada. His first hospitality job was with CanadianPacific Hotels & Resorts. Among his many professional honors, Mr. Cooper has served on theWoodrow Wilson International Centre for Scholars, Canada Institute Advisory Board and asChairman of the Board of Governors for the prestigious University of Guelph. While he wasPresident and COO at The Ritz-Carlton Hotel Company, L.L.C., Mr. Cooper presided over amajor expansion of the brand which now numbers 73 hotels in countries around the world. In2008 Mr. Cooper was named “Corporate Hotelier of the World” by HOTELS Magazine. In Juneof 2010, he received an Honorary Degree of Doctor of Laws from Canada’s University of Guelph.Born and educated in England, he earned an MBA from the University of Toronto.
Edwin D. FullerPresident & Managing DirectorInternational Lodging
65
Edwin D. Fuller joined Marriott in 1972 and held numerous positions of increasing marketing,sales and operational responsibility, including Director of National and International Sales andReservations, before being appointed Vice President of Marketing in 1979. Early in his career,Mr. Fuller established Marriott International’s original international reservations network and itssales and marketing organization in Europe and the Middle East. He became Regional VicePresident of the Midwest Region in 1985 and Regional Vice President of the Western Region in1988. In 1991, he assumed leadership of Marriott’s international lodging operations as SeniorVice President and Managing Director of International Lodging. He was named Executive VicePresident and Managing Director of International Lodging in 1994 and was promoted to hiscurrent position in 1997. Mr. Fuller currently serves on the advisory boards of BostonUniversity’s hotel and business schools where he is Chairman of the Hospitality Board and hewas recently appointed to the university’s Board of Overseers. He also serves as Chairman of theAdvisory Board for the University of California Irvine, Mirage School of Business, chairs theGoverning Council of the International Tourism Partnership, is a commissioner of the CaliforniaTravel & Tourism Commission, and serves on the Safe Kids Worldwide Board.
112
Table of Contents
Name and Title Age Business Experience
Robert J. McCarthyGroup President
57
Robert J. “Bob” McCarthy is Group President for Marriott International, Inc. Mr. McCarthy hasoverall responsibility for the financial management and leadership of over 3,000 hotels in theAmericas spanning multiple lodging brands, and a work force of 120,000 associates. In addition,Mr. McCarthy oversees The Ritz-Carlton, as well as staff support services to Marriott’scontinental organizations around the globe in sales, revenue management, marketing, brandmanagement, and operations. He chairs Marriott’s Lodging Strategy Group. Mr. McCarthy is amember of the Dean’s Advisory Board at both the Villanova University School of Business andthe Cornell University School of Hotel Administration. He serves as a board member of theAutism Learning Center as well as the ServiceSource Foundation, an organization supportingpeople with disabilities. Mr. McCarthy holds a bachelor’s degree in Business Administrationfrom Villanova University in Villanova, PA.
Amy McPhersonPresident & Managing DirectorEurope
49
Amy C. McPherson is President and Managing Director of Europe, a Division within Marriottthat encompasses Continental Europe, the United Kingdom, and Ireland. Ms. McPherson joinedMarriott in 1986 and most recently served as Executive Vice President of Global Sales andMarketing responsible for the Company’s global and field sales, marketing, Marriott Rewardsprogram, revenue management and e-commerce. Other key positions held by Ms. McPhersoninclude Senior Vice President of Business Transformation and Integration, and Vice President ofFinance and Business Development. Prior to joining Marriott, she worked for Air Products &Chemicals in Allentown, PA.
David A. RodriguezExecutive Vice PresidentGlobal Human Resources
52
David A. Rodriguez joined Marriott International and assumed the role of Senior Vice President-Staffing & Development in 1998. In 2003, he was appointed Executive Vice President-HumanResources for Marriott Lodging and in 2006 he assumed the role of Executive Vice President-Global Human Resources for Marriott International. Prior to joining Marriott International, heheld several senior roles in human resources at Citicorp (now Citigroup) from 1989-1998.
Edward A. RyanExecutive Vice President andGeneral Counsel
57
Edward A. Ryan was named Executive Vice President and General Counsel in November 2006.He joined Marriott in 1996 as Assistant General Counsel, was promoted to Senior Vice Presidentand Associate General Counsel in 1999, when he had responsibility for all new managementagreements and real estate development worldwide for full-service and limited-service hotels; in2005 he also assumed responsibility for all corporate transactions and corporate governance.Prior to joining Marriott, Mr. Ryan was a Partner at the law firm of Hogan & Hartson inWashington, D.C.
113
Table of Contents
Name and Title Age Business Experience
William J. ShawVice Chairman
65
William J. Shaw became Vice Chairman of Marriott International, Inc. in May 2009. Hepreviously served as President and Chief Operating Officer of the Company and its predecessor,the former Marriott International, from 1997 until May 2009. He joined Marriott Corporation in1974, was elected Corporate Controller in 1979 and a Corporate Vice President in 1982. In1986, Mr. Shaw was elected Senior Vice President-Finance and Treasurer of MarriottCorporation. He was appointed Chief Financial Officer and Executive Vice President of MarriottCorporation in 1988. In 1992, he was named President of the Marriott Service Group. He alsoserves on the Board of Directors of Washington Mutual Investors Fund, the Board of Directors ofthe United Negro College Fund, the Board of Trustees of the University of Notre Dame and onthe NCAA Leadership Advisory Board. Mr. Shaw served as a Director of the Company fromMarch 1997 through February 11, 2011. Mr. Shaw has announced that he is retiring from theCompany on March 31, 2011.
Arne M. SorensonPresident and Chief Operating Officer
52
Arne M. Sorenson joined Marriott in 1996 as Senior Vice President of Business Development.He was appointed Executive Vice President and Chief Financial Officer in 1998 and assumedthe additional title of President, Continental European Lodging, in January 2003. In May 2009,Mr. Sorenson was named President and Chief Operating Officer of the Company. Prior to joiningMarriott, he was a Partner in the law firm of Latham & Watkins in Washington, D.C., where heplayed a key role in 1992 and 1993 in the distribution of Old MI by Marriott Corporation. Mr.Sorenson serves on the Board of Regents of Luther College in Decorah, Iowa. He also serves onthe Board of Directors of Wal-Mart Stores, Inc. Mr. Sorenson became a member of theCompany’s Board of Directors on February 11, 2011.
Stephen P. WeiszPresidentMarriott Vacation Club International
60
Stephen P. Weisz joined Marriott Corporation in 1972 and was named Regional Vice Presidentof the Mid-Atlantic Region in 1991. Mr. Weisz had previously served as Senior Vice Presidentof Rooms Operations before being appointed Vice President of the Revenue ManagementGroup. Mr. Weisz became Senior Vice President of Sales and Marketing for Marriott Hotels,Resorts & Suites in 1992 and Executive Vice President-Lodging Brands in 1994. Mr. Weisz wasappointed to his current position in 1996. He serves as a Director of Mindshare Technologies,Inc.
Code of EthicsThe Company has long maintained and enforced an Ethical Conduct Policy that applies to all Marriott associates, including our Chief Executive
Officer, Chief Financial Officer, and Principal Accounting Officer, and to each member of our Board of Directors. We have posted our Code of Ethics(“Ethical Conduct Policy”) in the “Corporate Governance” section, “Governance Documents” subsection of our Investor Relations website,www.Marriott.com/investor. Any future changes or amendments to our Ethical Conduct Policy and any waiver of our Ethical Conduct Policy that applies toour Chief Executive Officer, Chief Financial Officer, Principal Accounting Officer, or member of the Board of Directors, will be posted towww.Marriott.com/investor.
114
Table of Contents
PART IV
Item 15. Exhibits and Financial Statement Schedules.LIST OF DOCUMENTS FILED AS PART OF THIS REPORT
(1) FINANCIAL STATEMENTSThe response to this portion of Item 15 is submitted under Item 8 of this Report on Form 10-K.
(2) FINANCIAL STATEMENT SCHEDULESInformation relating to schedules for which provision is made in the applicable accounting regulations of the SEC is included in the notes to thefinancial statements and is incorporated herein by reference.
(3) EXHIBITSAny shareholder who wants a copy of the following Exhibits may obtain one from us upon request at a charge that reflects the reproduction costof such Exhibits. Requests should be made to the Secretary, Marriott International, Inc., 10400 Fernwood Road, Department 52/862, Bethesda,MD 20817.
Exhibit No. Description
Incorporation by Reference(where a report is indicated below, that
document has been previously filed with the SECand the applicable exhibit is incorporated by
reference thereto)
3.1
Restated Certificate of Incorporation of the Company.
Exhibit No. 3.(i) to our Form 8-K filedAugust 22, 2006 (File No. 001-13881).
3.2
Amended and Restated Bylaws.
Exhibit No. 3(i) to our Form 8-K filedNovember 12, 2008 (File No. 001-13881).
4.1
Form of Common Stock Certificate.
Exhibit No. 4.5 to our Form S-3ASR filedDecember 8, 2005 (File No. 333-130212).
4.2
Indenture dated November 16, 1998, with JPMorgan Chase Bank,N.A., as Trustee, formerly known as The Chase Manhattan Bank.
Exhibit No. 4.1 to our Form 10-K for the fiscal year ended January 1,1999 (File No. 001-13881).
4.3
Form of 4.625% Series F Note due 2012.
Exhibit No. 4.2 to our Form 8-K filedJune 14, 2005 (File No. 001-13881).
4.4
Form of 5.810% Series G Note due 2015.
Exhibit No. 4.1 to our Form 10-Q for the fiscal quarter ended June16, 2006 (File No. 001-13881).
4.5
Form of 6.200% Series H Note due 2016.
Exhibit No. 4.2 to our Form 8-K filed June 14, 2006 (File No. 001-13881).
4.6
Form of 6.375% Series I Note due 2017.
Exhibit No. 4.2 to our Form 8-K filed June 25, 2007 (File No. 001-13881).
4.7
Form of 5.625% Series J Note due 2013.
Exhibit No. 4.2 to our Form 8-K filed October 19, 2007 (File No.001-13881).
10.1
U.S. $2.5 billion Amended and Restated Credit Agreement dated asof May 14, 2007, with Citibank, N.A., as Administrative Agent andcertain banks.
Exhibit No. 10 to our Form 8-K filed May 16, 2007 (File No. 001-13881).
*10.2
Marriott International, Inc. Stock and Cash Incentive Plan, AsAmended Effective May 1, 2009.
Exhibit No. 10.1 to our Form 10-Q filed July 17, 2009 (File No. 001-13881).
115
Table of Contents
Exhibit No. Description
Incorporation by Reference(where a report is indicated below, that
document has been previously filed with the SECand the applicable exhibit is incorporated by
reference thereto)
*10.3
Marriott International, Inc. Executive Deferred Compensation Plan,Amended and Restated as of January 1, 2009.
Exhibit No. 99 to our Form 8-K filed August 6, 2009 (File No. 001-13881).
*10.4
Form of Employee Non-Qualified Stock Option Agreement for theMarriott International, Inc. Stock and Cash Incentive Plan.
Exhibit No. 10.4 to our Form 10-K filed February 15, 2008 (File No.001-13881).
*10.5
Form of Employee Non-Qualified Stock Option Agreement for theMarriott International, Inc. Stock and Cash Incentive Plan (Off-Cycle Grants).
Exhibit No. 10.5 to our Form 10-K filed February 12, 2009 (File No.001-13881).
*10.6
Form of Employee Non-Qualified Stock Option Agreement for theMarriott International, Inc. Stock and Cash Incentive Plan (AnnualGrants).
Exhibit No. 10.6 to our Form 10-K filed February 12, 2009 (File No.001-13881).
*10.7
Form of Executive Restricted Stock Unit Agreement for the MarriottInternational, Inc. Stock and Cash Incentive Plan.
Exhibit No. 10.5 to our Form 10-K filed February 15, 2008 (File No.001-13881).
*10.8
Form of Executive Restricted Stock Unit Agreement for the MarriottInternational, Inc. Stock and Cash Incentive Plan, As Amended as ofMay 1, 2009.
Exhibit No. 10.2 to our Form 10-Q filed July 17, 2009 (File No. 001-13881).
*10.9
Form of MI Shares Agreement for the Marriott International, Inc.Stock and Cash Incentive Plan.
Exhibit No. 10.6 to our Form 10-K filed February 15, 2008 (File No.001-13881).
*10.10
Form of MI Shares Agreement for the Marriott International, Inc.Stock and Cash Incentive Plan (Off-Cycle Grants).
Exhibit No. 10.9 to our Form 10-K filed February 12, 2009 (File No.001-13881).
*10.11
Form of MI Shares Agreement for the Marriott International, Inc.Stock and Cash Incentive Plan (Annual Grants).
Exhibit No. 10.10 to our Form 10-K filed February 12, 2009 (FileNo. 001-13881).
*10.12
Form of MI Shares Agreement for the Marriott International, Inc.Stock and Cash Incentive Plan (Annual Grants), As Amended as ofMay 1, 2009.
Exhibit No. 10.3 to our Form 10-Q filed July 17, 2009 (File No. 001-13881).
*10.13
Form of Stock Appreciation Right Agreement for the MarriottInternational, Inc. Stock and Cash Incentive Plan.
Exhibit No. 10.7 to our Form 10-K filed February 15, 2008 (File No.001-13881).
*10.14
Form of Stock Appreciation Right Agreement for the MarriottInternational, Inc. Stock and Cash Incentive Plan (Off-CycleGrants).
Exhibit No. 10.12 to our Form 10-K filed February 12, 2009 (FileNo. 001-13881).
*10.15
Form of Stock Appreciation Right Agreement for the MarriottInternational, Inc. Stock and Cash Incentive Plan (Annual Grants).
Exhibit No. 10.13 to our Form 10-K filed February 12, 2009 (FileNo. 001-13881).
*10.16
Form of Stock Appreciation Right Agreement for the MarriottInternational, Inc. Stock and Cash Incentive Plan (For Non-Employee Directors).
Exhibit No. 10.8 to our Form 10-K filed February 15, 2008 (File No.001-13881).
116
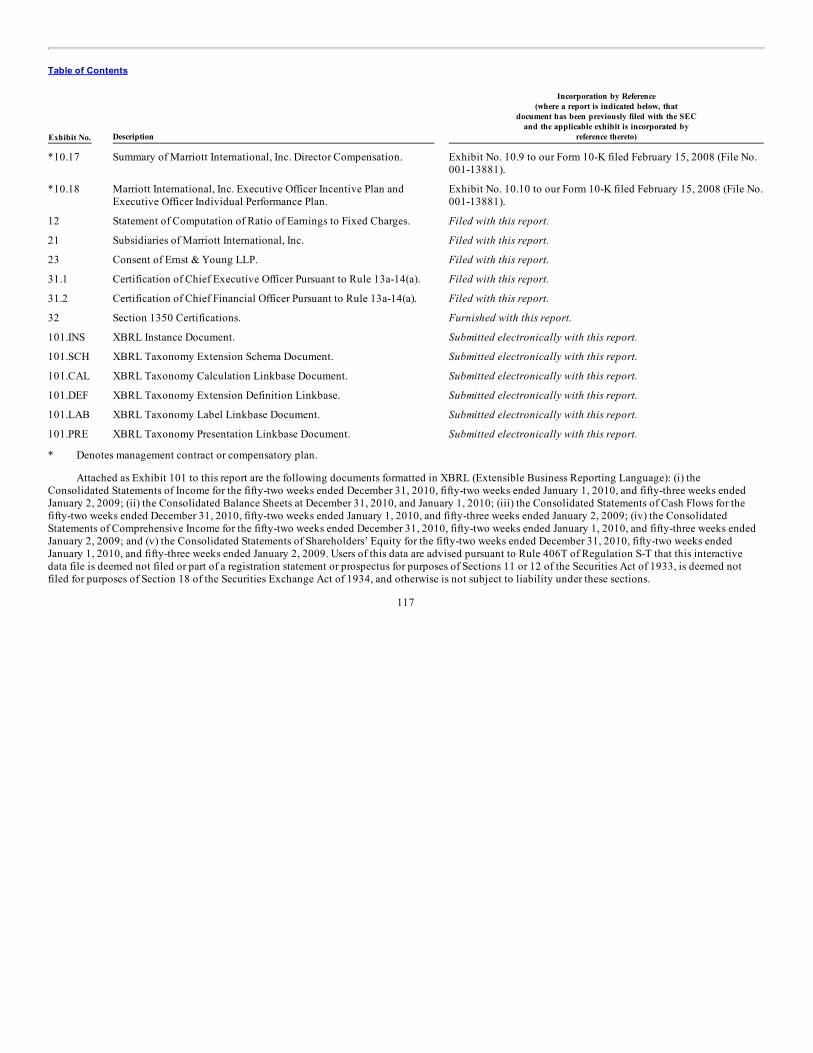
Table of Contents
Exhibit No. Description
Incorporation by Reference(where a report is indicated below, that
document has been previously filed with the SECand the applicable exhibit is incorporated by
reference thereto)
*10.17
Summary of Marriott International, Inc. Director Compensation.
Exhibit No. 10.9 to our Form 10-K filed February 15, 2008 (File No.001-13881).
*10.18
Marriott International, Inc. Executive Officer Incentive Plan andExecutive Officer Individual Performance Plan.
Exhibit No. 10.10 to our Form 10-K filed February 15, 2008 (File No.001-13881).
12 Statement of Computation of Ratio of Earnings to Fixed Charges. Filed with this report.
21 Subsidiaries of Marriott International, Inc. Filed with this report.
23 Consent of Ernst & Young LLP. Filed with this report.
31.1 Certification of Chief Executive Officer Pursuant to Rule 13a-14(a). Filed with this report.
31.2 Certification of Chief Financial Officer Pursuant to Rule 13a-14(a). Filed with this report.
32 Section 1350 Certifications. Furnished with this report.
101.INS XBRL Instance Document. Submitted electronically with this report.
101.SCH XBRL Taxonomy Extension Schema Document. Submitted electronically with this report.
101.CAL XBRL Taxonomy Calculation Linkbase Document. Submitted electronically with this report.
101.DEF XBRL Taxonomy Extension Definition Linkbase. Submitted electronically with this report.
101.LAB XBRL Taxonomy Label Linkbase Document. Submitted electronically with this report.
101.PRE XBRL Taxonomy Presentation Linkbase Document. Submitted electronically with this report. * Denotes management contract or compensatory plan.
Attached as Exhibit 101 to this report are the following documents formatted in XBRL (Extensible Business Reporting Language): (i) theConsolidated Statements of Income for the fifty-two weeks ended December 31, 2010, fifty-two weeks ended January 1, 2010, and fifty-three weeks endedJanuary 2, 2009; (ii) the Consolidated Balance Sheets at December 31, 2010, and January 1, 2010; (iii) the Consolidated Statements of Cash Flows for thefifty-two weeks ended December 31, 2010, fifty-two weeks ended January 1, 2010, and fifty-three weeks ended January 2, 2009; (iv) the ConsolidatedStatements of Comprehensive Income for the fifty-two weeks ended December 31, 2010, fifty-two weeks ended January 1, 2010, and fifty-three weeks endedJanuary 2, 2009; and (v) the Consolidated Statements of Shareholders’ Equity for the fifty-two weeks ended December 31, 2010, fifty-two weeks endedJanuary 1, 2010, and fifty-three weeks ended January 2, 2009. Users of this data are advised pursuant to Rule 406T of Regulation S-T that this interactivedata file is deemed not filed or part of a registration statement or prospectus for purposes of Sections 11 or 12 of the Securities Act of 1933, is deemed notfiled for purposes of Section 18 of the Securities Exchange Act of 1934, and otherwise is not subject to liability under these sections.
117
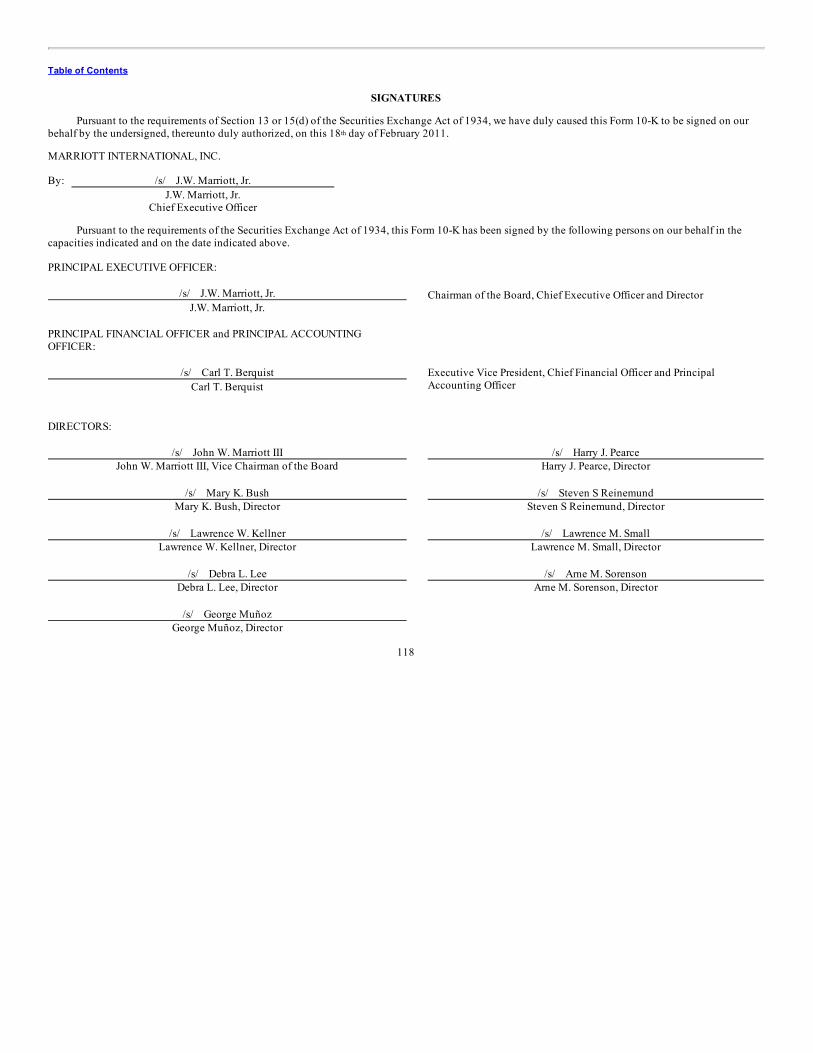
Table of Contents
SIGNATURES
Pursuant to the requirements of Section 13 or 15(d) of the Securities Exchange Act of 1934, we have duly caused this Form 10-K to be signed on ourbehalf by the undersigned, thereunto duly authorized, on this 18 day of February 2011.
MARRIOTT INTERNATIONAL, INC. By: /s/ J.W. Marriott, Jr.
J.W. Marriott, Jr. Chief Executive Officer
Pursuant to the requirements of the Securities Exchange Act of 1934, this Form 10-K has been signed by the following persons on our behalf in thecapacities indicated and on the date indicated above. PRINCIPAL EXECUTIVE OFFICER:
/s/ J.W. Marriott, Jr. Chairman of the Board, Chief Executive Officer and DirectorJ.W. Marriott, Jr.
PRINCIPAL FINANCIAL OFFICER and PRINCIPAL ACCOUNTINGOFFICER:
/s/ Carl T. Berquist Executive Vice President, Chief Financial Officer and PrincipalAccounting OfficerCarl T. Berquist
DIRECTORS:
/s/ John W. Marriott IIIJohn W. Marriott III, Vice Chairman of the Board
/s/ Harry J. PearceHarry J. Pearce, Director
/s/ Mary K. BushMary K. Bush, Director
/s/ Steven S ReinemundSteven S Reinemund, Director
/s/ Lawrence W. KellnerLawrence W. Kellner, Director
/s/ Lawrence M. SmallLawrence M. Small, Director
/s/ Debra L. LeeDebra L. Lee, Director
/s/ Arne M. SorensonArne M. Sorenson, Director
/s/ George MuñozGeorge Muñoz, Director
118
th
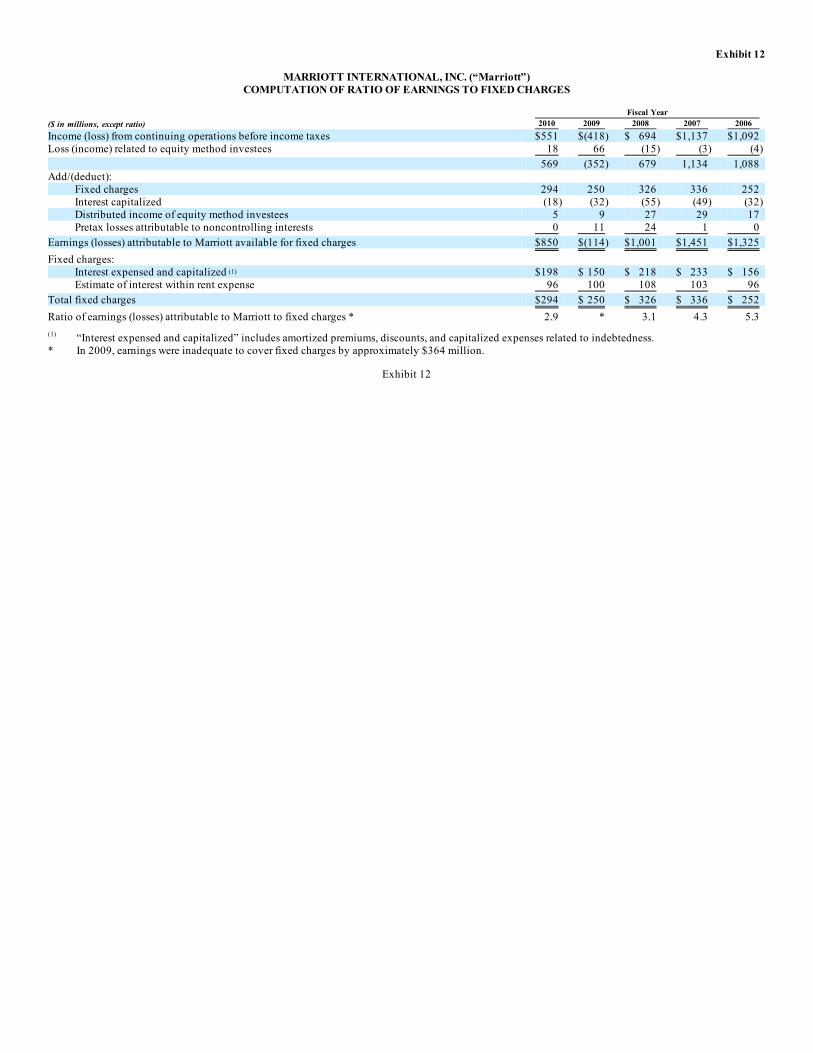
Exhibit 12
MARRIOTT INTERNATIONAL, INC. (“Marriott”)COMPUTATION OF RATIO OF EARNINGS TO FIXED CHARGES
Fiscal Year ($ in millions, except ratio) 2010 2009 2008 2007 2006 Income (loss) from continuing operations before income taxes $551 $(418) $ 694 $1,137 $1,092 Loss (income) related to equity method investees 18 66 (15) (3) (4)
569 (352) 679 1,134 1,088 Add/(deduct):
Fixed charges 294 250 326 336 252 Interest capitalized (18) (32) (55) (49) (32) Distributed income of equity method investees 5 9 27 29 17 Pretax losses attributable to noncontrolling interests 0 11 24 1 0
Earnings (losses) attributable to Marriott available for fixed charges $850 $(114) $1,001 $1,451 $1,325 Fixed charges:
Interest expensed and capitalized $198 $ 150 $ 218 $ 233 $ 156 Estimate of interest within rent expense 96 100 108 103 96
Total fixed charges $294 $ 250 $ 326 $ 336 $ 252 Ratio of earnings (losses) attributable to Marriott to fixed charges * 2.9 * 3.1 4.3 5.3
“Interest expensed and capitalized” includes amortized premiums, discounts, and capitalized expenses related to indebtedness.* In 2009, earnings were inadequate to cover fixed charges by approximately $364 million.
Exhibit 12
(1)
(1)
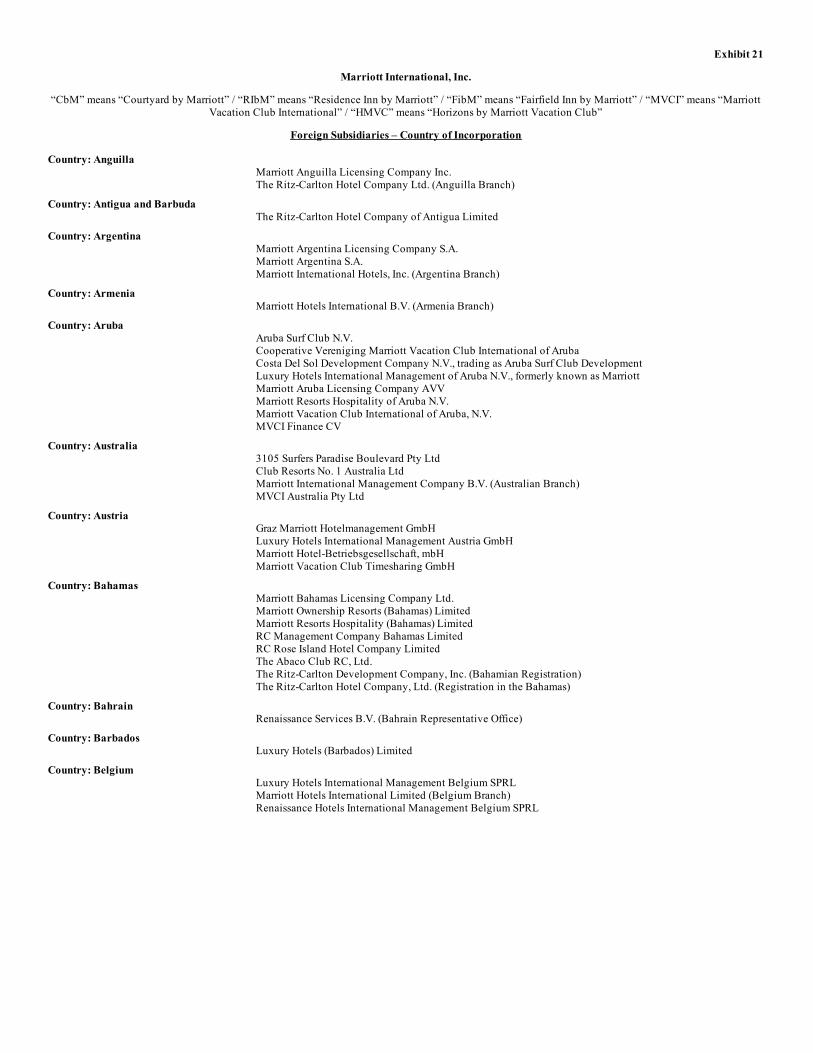
Exhibit 21
Marriott International, Inc.
“CbM” means “Courtyard by Marriott” / “RIbM” means “Residence Inn by Marriott” / “FibM” means “Fairfield Inn by Marriott” / “MVCI” means “MarriottVacation Club International” / “HMVC” means “Horizons by Marriott Vacation Club”
Foreign Subsidiaries – Country of Incorporation Country: Anguilla
Marriott Anguilla Licensing Company Inc. The Ritz-Carlton Hotel Company Ltd. (Anguilla Branch)
Country: Antigua and Barbuda The Ritz-Carlton Hotel Company of Antigua Limited
Country: Argentina Marriott Argentina Licensing Company S.A. Marriott Argentina S.A. Marriott International Hotels, Inc. (Argentina Branch)
Country: Armenia Marriott Hotels International B.V. (Armenia Branch)
Country: Aruba Aruba Surf Club N.V. Cooperative Vereniging Marriott Vacation Club International of Aruba Costa Del Sol Development Company N.V., trading as Aruba Surf Club Development Luxury Hotels International Management of Aruba N.V., formerly known as Marriott Marriott Aruba Licensing Company AVV Marriott Resorts Hospitality of Aruba N.V. Marriott Vacation Club International of Aruba, N.V. MVCI Finance CV
Country: Australia 3105 Surfers Paradise Boulevard Pty Ltd Club Resorts No. 1 Australia Ltd Marriott International Management Company B.V. (Australian Branch) MVCI Australia Pty Ltd
Country: Austria Graz Marriott Hotelmanagement GmbH Luxury Hotels International Management Austria GmbH Marriott Hotel-Betriebsgesellschaft, mbH Marriott Vacation Club Timesharing GmbH
Country: Bahamas Marriott Bahamas Licensing Company Ltd. Marriott Ownership Resorts (Bahamas) Limited Marriott Resorts Hospitality (Bahamas) Limited RC Management Company Bahamas Limited RC Rose Island Hotel Company Limited The Abaco Club RC, Ltd. The Ritz-Carlton Development Company, Inc. (Bahamian Registration) The Ritz-Carlton Hotel Company, Ltd. (Registration in the Bahamas)
Country: Bahrain Renaissance Services B.V. (Bahrain Representative Office)
Country: Barbados Luxury Hotels (Barbados) Limited
Country: Belgium Luxury Hotels International Management Belgium SPRL Marriott Hotels International Limited (Belgium Branch) Renaissance Hotels International Management Belgium SPRL
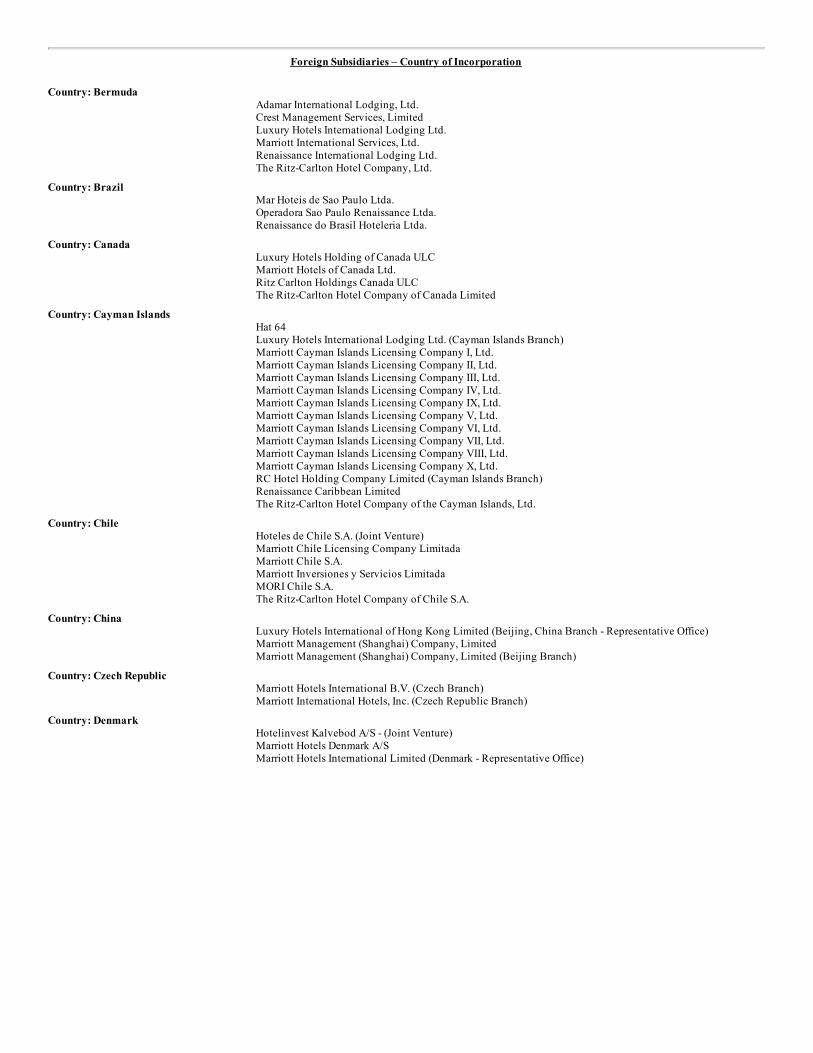
Foreign Subsidiaries – Country of Incorporation
Country: Bermuda Adamar International Lodging, Ltd. Crest Management Services, Limited Luxury Hotels International Lodging Ltd. Marriott International Services, Ltd. Renaissance International Lodging Ltd. The Ritz-Carlton Hotel Company, Ltd.
Country: Brazil Mar Hoteis de Sao Paulo Ltda. Operadora Sao Paulo Renaissance Ltda. Renaissance do Brasil Hoteleria Ltda.
Country: Canada Luxury Hotels Holding of Canada ULC Marriott Hotels of Canada Ltd. Ritz Carlton Holdings Canada ULC The Ritz-Carlton Hotel Company of Canada Limited
Country: Cayman Islands Hat 64 Luxury Hotels International Lodging Ltd. (Cayman Islands Branch) Marriott Cayman Islands Licensing Company I, Ltd. Marriott Cayman Islands Licensing Company II, Ltd. Marriott Cayman Islands Licensing Company III, Ltd. Marriott Cayman Islands Licensing Company IV, Ltd. Marriott Cayman Islands Licensing Company IX, Ltd. Marriott Cayman Islands Licensing Company V, Ltd. Marriott Cayman Islands Licensing Company VI, Ltd. Marriott Cayman Islands Licensing Company VII, Ltd. Marriott Cayman Islands Licensing Company VIII, Ltd. Marriott Cayman Islands Licensing Company X, Ltd. RC Hotel Holding Company Limited (Cayman Islands Branch) Renaissance Caribbean Limited The Ritz-Carlton Hotel Company of the Cayman Islands, Ltd.
Country: Chile Hoteles de Chile S.A. (Joint Venture) Marriott Chile Licensing Company Limitada Marriott Chile S.A. Marriott Inversiones y Servicios Limitada MORI Chile S.A. The Ritz-Carlton Hotel Company of Chile S.A.
Country: China Luxury Hotels International of Hong Kong Limited (Beijing, China Branch - Representative Office) Marriott Management (Shanghai) Company, Limited Marriott Management (Shanghai) Company, Limited (Beijing Branch)
Country: Czech Republic Marriott Hotels International B.V. (Czech Branch) Marriott International Hotels, Inc. (Czech Republic Branch)
Country: Denmark Hotelinvest Kalvebod A/S - (Joint Venture) Marriott Hotels Denmark A/S Marriott Hotels International Limited (Denmark - Representative Office)
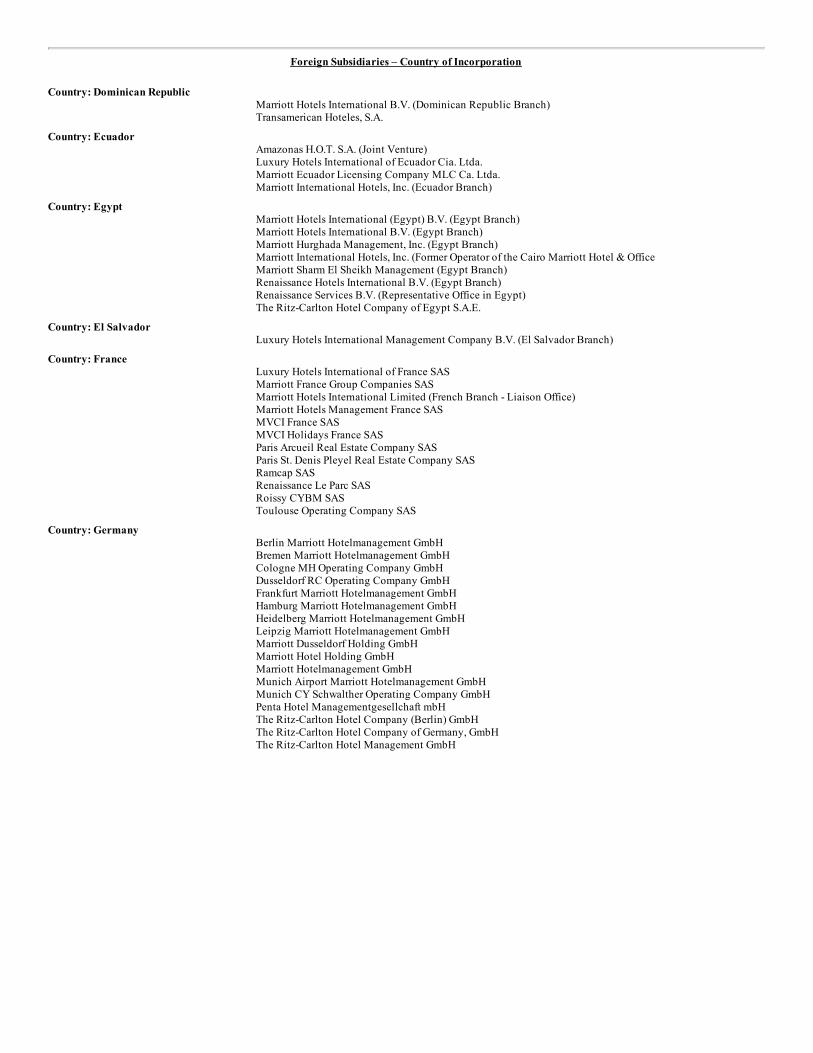
Foreign Subsidiaries – Country of Incorporation
Country: Dominican Republic Marriott Hotels International B.V. (Dominican Republic Branch) Transamerican Hoteles, S.A.
Country: Ecuador Amazonas H.O.T. S.A. (Joint Venture) Luxury Hotels International of Ecuador Cia. Ltda. Marriott Ecuador Licensing Company MLC Ca. Ltda. Marriott International Hotels, Inc. (Ecuador Branch)
Country: Egypt Marriott Hotels International (Egypt) B.V. (Egypt Branch) Marriott Hotels International B.V. (Egypt Branch) Marriott Hurghada Management, Inc. (Egypt Branch) Marriott International Hotels, Inc. (Former Operator of the Cairo Marriott Hotel & Office Marriott Sharm El Sheikh Management (Egypt Branch) Renaissance Hotels International B.V. (Egypt Branch) Renaissance Services B.V. (Representative Office in Egypt) The Ritz-Carlton Hotel Company of Egypt S.A.E.
Country: El Salvador Luxury Hotels International Management Company B.V. (El Salvador Branch)
Country: France Luxury Hotels International of France SAS Marriott France Group Companies SAS Marriott Hotels International Limited (French Branch - Liaison Office) Marriott Hotels Management France SAS MVCI France SAS MVCI Holidays France SAS Paris Arcueil Real Estate Company SAS Paris St. Denis Pleyel Real Estate Company SAS Ramcap SAS Renaissance Le Parc SAS Roissy CYBM SAS Toulouse Operating Company SAS
Country: Germany Berlin Marriott Hotelmanagement GmbH Bremen Marriott Hotelmanagement GmbH Cologne MH Operating Company GmbH Dusseldorf RC Operating Company GmbH Frankfurt Marriott Hotelmanagement GmbH Hamburg Marriott Hotelmanagement GmbH Heidelberg Marriott Hotelmanagement GmbH Leipzig Marriott Hotelmanagement GmbH Marriott Dusseldorf Holding GmbH Marriott Hotel Holding GmbH Marriott Hotelmanagement GmbH Munich Airport Marriott Hotelmanagement GmbH Munich CY Schwalther Operating Company GmbH Penta Hotel Managementgesellchaft mbH The Ritz-Carlton Hotel Company (Berlin) GmbH The Ritz-Carlton Hotel Company of Germany, GmbH The Ritz-Carlton Hotel Management GmbH
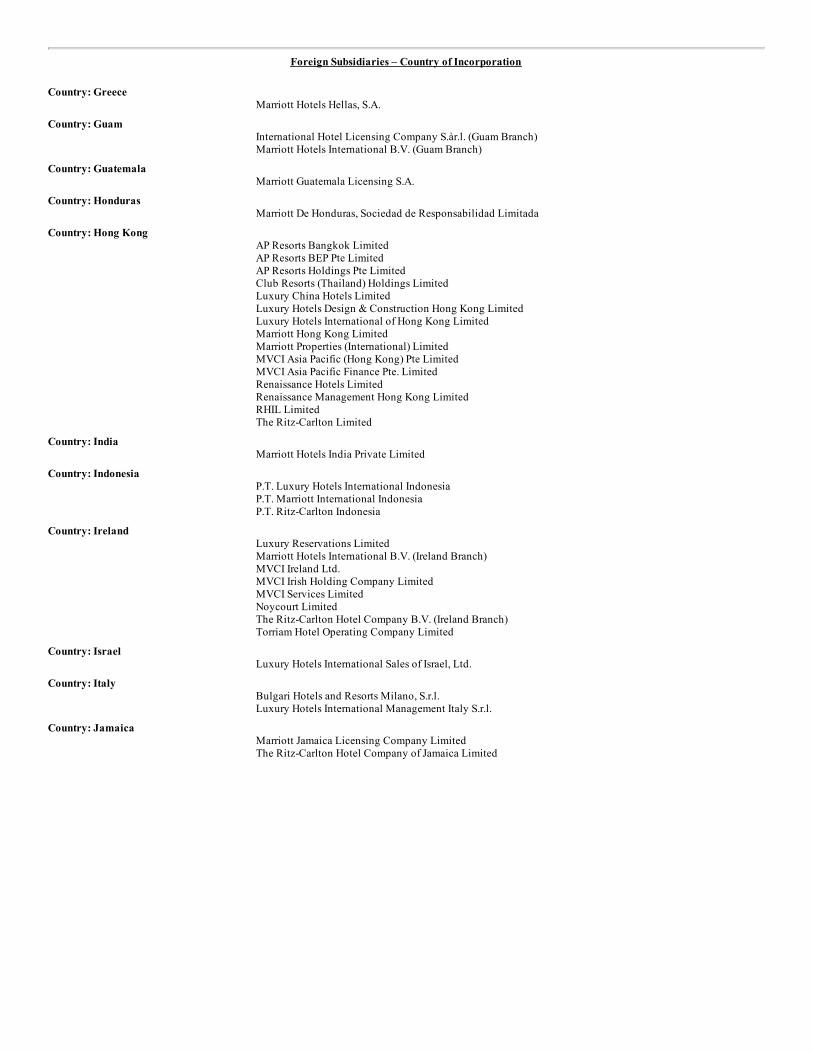
Foreign Subsidiaries – Country of Incorporation
Country: Greece Marriott Hotels Hellas, S.A.
Country: Guam International Hotel Licensing Company S.àr.l. (Guam Branch) Marriott Hotels International B.V. (Guam Branch)
Country: Guatemala Marriott Guatemala Licensing S.A.
Country: Honduras Marriott De Honduras, Sociedad de Responsabilidad Limitada
Country: Hong Kong AP Resorts Bangkok Limited AP Resorts BEP Pte Limited AP Resorts Holdings Pte Limited Club Resorts (Thailand) Holdings Limited Luxury China Hotels Limited Luxury Hotels Design & Construction Hong Kong Limited Luxury Hotels International of Hong Kong Limited Marriott Hong Kong Limited Marriott Properties (International) Limited MVCI Asia Pacific (Hong Kong) Pte Limited MVCI Asia Pacific Finance Pte. Limited Renaissance Hotels Limited Renaissance Management Hong Kong Limited RHIL Limited The Ritz-Carlton Limited
Country: India Marriott Hotels India Private Limited
Country: Indonesia P.T. Luxury Hotels International Indonesia P.T. Marriott International Indonesia P.T. Ritz-Carlton Indonesia
Country: Ireland Luxury Reservations Limited Marriott Hotels International B.V. (Ireland Branch) MVCI Ireland Ltd. MVCI Irish Holding Company Limited MVCI Services Limited Noycourt Limited The Ritz-Carlton Hotel Company B.V. (Ireland Branch) Torriam Hotel Operating Company Limited
Country: Israel Luxury Hotels International Sales of Israel, Ltd.
Country: Italy Bulgari Hotels and Resorts Milano, S.r.l. Luxury Hotels International Management Italy S.r.l.
Country: Jamaica Marriott Jamaica Licensing Company Limited The Ritz-Carlton Hotel Company of Jamaica Limited
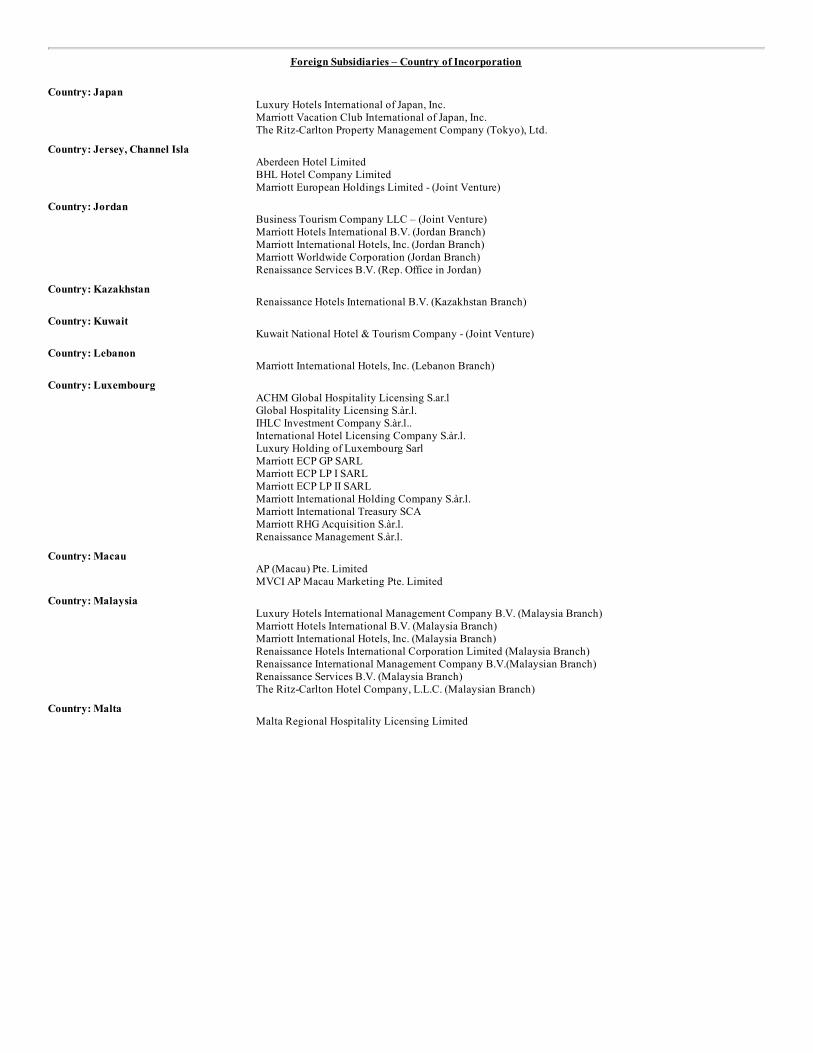
Foreign Subsidiaries – Country of Incorporation
Country: Japan Luxury Hotels International of Japan, Inc. Marriott Vacation Club International of Japan, Inc. The Ritz-Carlton Property Management Company (Tokyo), Ltd.
Country: Jersey, Channel Isla Aberdeen Hotel Limited BHL Hotel Company Limited Marriott European Holdings Limited - (Joint Venture)
Country: Jordan Business Tourism Company LLC – (Joint Venture) Marriott Hotels International B.V. (Jordan Branch) Marriott International Hotels, Inc. (Jordan Branch) Marriott Worldwide Corporation (Jordan Branch) Renaissance Services B.V. (Rep. Office in Jordan)
Country: Kazakhstan Renaissance Hotels International B.V. (Kazakhstan Branch)
Country: Kuwait Kuwait National Hotel & Tourism Company - (Joint Venture)
Country: Lebanon Marriott International Hotels, Inc. (Lebanon Branch)
Country: Luxembourg ACHM Global Hospitality Licensing S.ar.l Global Hospitality Licensing S.àr.l. IHLC Investment Company S.àr.l.. International Hotel Licensing Company S.àr.l. Luxury Holding of Luxembourg Sarl Marriott ECP GP SARL Marriott ECP LP I SARL Marriott ECP LP II SARL Marriott International Holding Company S.àr.l. Marriott International Treasury SCA Marriott RHG Acquisition S.àr.l. Renaissance Management S.àr.l.
Country: Macau AP (Macau) Pte. Limited MVCI AP Macau Marketing Pte. Limited
Country: Malaysia Luxury Hotels International Management Company B.V. (Malaysia Branch) Marriott Hotels International B.V. (Malaysia Branch) Marriott International Hotels, Inc. (Malaysia Branch) Renaissance Hotels International Corporation Limited (Malaysia Branch) Renaissance International Management Company B.V.(Malaysian Branch) Renaissance Services B.V. (Malaysia Branch) The Ritz-Carlton Hotel Company, L.L.C. (Malaysian Branch)
Country: Malta Malta Regional Hospitality Licensing Limited
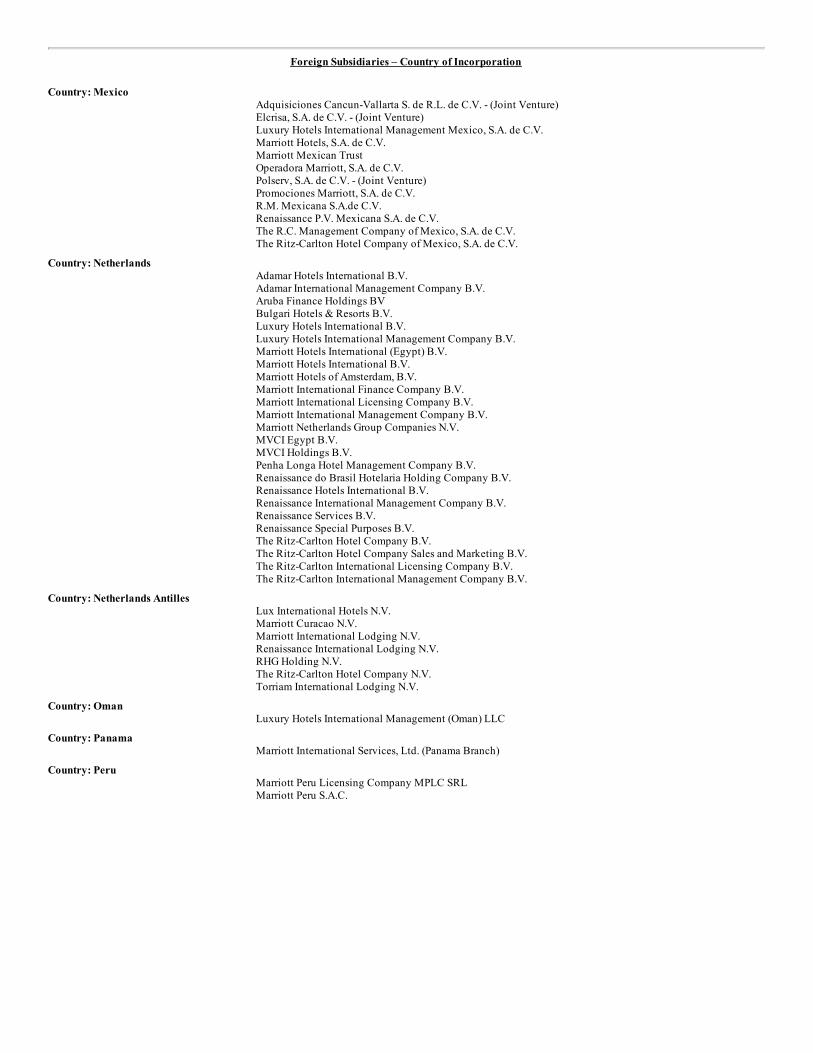
Foreign Subsidiaries – Country of Incorporation
Country: Mexico Adquisiciones Cancun-Vallarta S. de R.L. de C.V. - (Joint Venture) Elcrisa, S.A. de C.V. - (Joint Venture) Luxury Hotels International Management Mexico, S.A. de C.V. Marriott Hotels, S.A. de C.V. Marriott Mexican Trust Operadora Marriott, S.A. de C.V. Polserv, S.A. de C.V. - (Joint Venture) Promociones Marriott, S.A. de C.V. R.M. Mexicana S.A.de C.V. Renaissance P.V. Mexicana S.A. de C.V. The R.C. Management Company of Mexico, S.A. de C.V. The Ritz-Carlton Hotel Company of Mexico, S.A. de C.V.
Country: Netherlands Adamar Hotels International B.V. Adamar International Management Company B.V. Aruba Finance Holdings BV Bulgari Hotels & Resorts B.V. Luxury Hotels International B.V. Luxury Hotels International Management Company B.V. Marriott Hotels International (Egypt) B.V. Marriott Hotels International B.V. Marriott Hotels of Amsterdam, B.V. Marriott International Finance Company B.V. Marriott International Licensing Company B.V. Marriott International Management Company B.V. Marriott Netherlands Group Companies N.V. MVCI Egypt B.V. MVCI Holdings B.V. Penha Longa Hotel Management Company B.V. Renaissance do Brasil Hotelaria Holding Company B.V. Renaissance Hotels International B.V. Renaissance International Management Company B.V. Renaissance Services B.V. Renaissance Special Purposes B.V. The Ritz-Carlton Hotel Company B.V. The Ritz-Carlton Hotel Company Sales and Marketing B.V. The Ritz-Carlton International Licensing Company B.V. The Ritz-Carlton International Management Company B.V.
Country: Netherlands Antilles Lux International Hotels N.V. Marriott Curacao N.V. Marriott International Lodging N.V. Renaissance International Lodging N.V. RHG Holding N.V. The Ritz-Carlton Hotel Company N.V. Torriam International Lodging N.V.
Country: Oman Luxury Hotels International Management (Oman) LLC
Country: Panama Marriott International Services, Ltd. (Panama Branch)
Country: Peru Marriott Peru Licensing Company MPLC SRL Marriott Peru S.A.C.
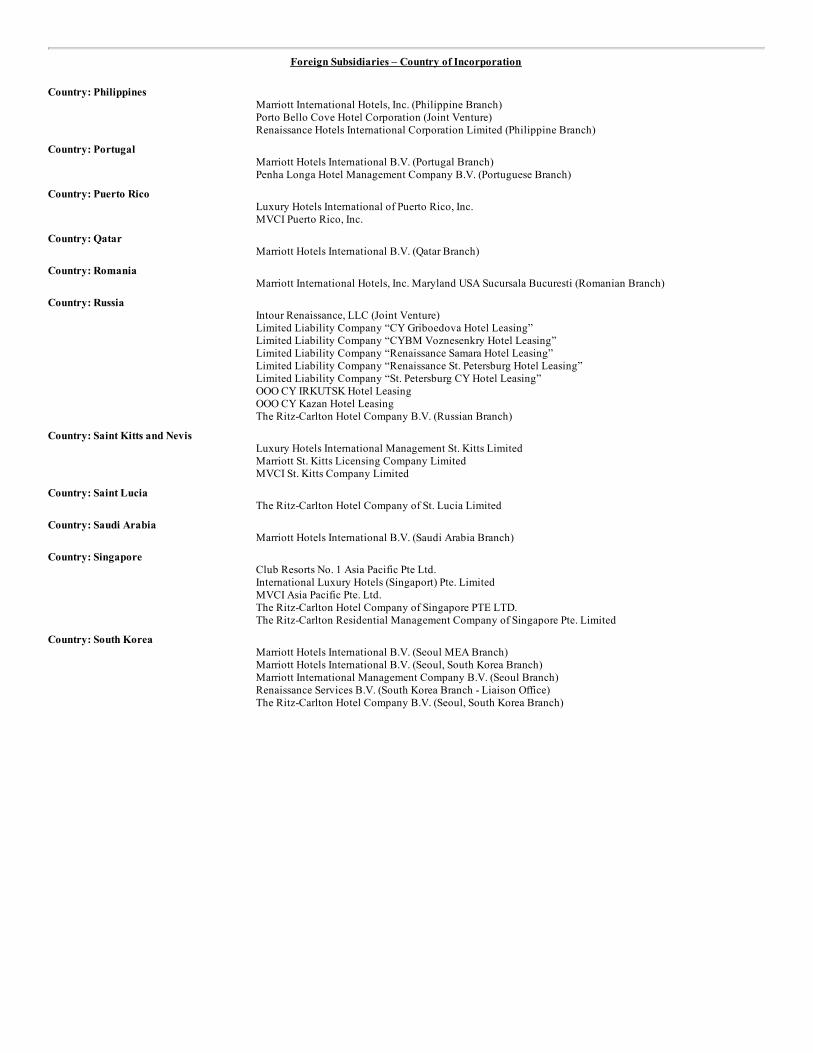
Foreign Subsidiaries – Country of Incorporation
Country: Philippines Marriott International Hotels, Inc. (Philippine Branch) Porto Bello Cove Hotel Corporation (Joint Venture) Renaissance Hotels International Corporation Limited (Philippine Branch)
Country: Portugal Marriott Hotels International B.V. (Portugal Branch) Penha Longa Hotel Management Company B.V. (Portuguese Branch)
Country: Puerto Rico Luxury Hotels International of Puerto Rico, Inc. MVCI Puerto Rico, Inc.
Country: Qatar Marriott Hotels International B.V. (Qatar Branch)
Country: Romania Marriott International Hotels, Inc. Maryland USA Sucursala Bucuresti (Romanian Branch)
Country: Russia Intour Renaissance, LLC (Joint Venture) Limited Liability Company “CY Griboedova Hotel Leasing” Limited Liability Company “CYBM Voznesenkry Hotel Leasing” Limited Liability Company “Renaissance Samara Hotel Leasing” Limited Liability Company “Renaissance St. Petersburg Hotel Leasing” Limited Liability Company “St. Petersburg CY Hotel Leasing” OOO CY IRKUTSK Hotel Leasing OOO CY Kazan Hotel Leasing The Ritz-Carlton Hotel Company B.V. (Russian Branch)
Country: Saint Kitts and Nevis Luxury Hotels International Management St. Kitts Limited Marriott St. Kitts Licensing Company Limited MVCI St. Kitts Company Limited
Country: Saint Lucia The Ritz-Carlton Hotel Company of St. Lucia Limited
Country: Saudi Arabia Marriott Hotels International B.V. (Saudi Arabia Branch)
Country: Singapore Club Resorts No. 1 Asia Pacific Pte Ltd. International Luxury Hotels (Singaport) Pte. Limited MVCI Asia Pacific Pte. Ltd. The Ritz-Carlton Hotel Company of Singapore PTE LTD. The Ritz-Carlton Residential Management Company of Singapore Pte. Limited
Country: South Korea Marriott Hotels International B.V. (Seoul MEA Branch) Marriott Hotels International B.V. (Seoul, South Korea Branch) Marriott International Management Company B.V. (Seoul Branch) Renaissance Services B.V. (South Korea Branch - Liaison Office) The Ritz-Carlton Hotel Company B.V. (Seoul, South Korea Branch)
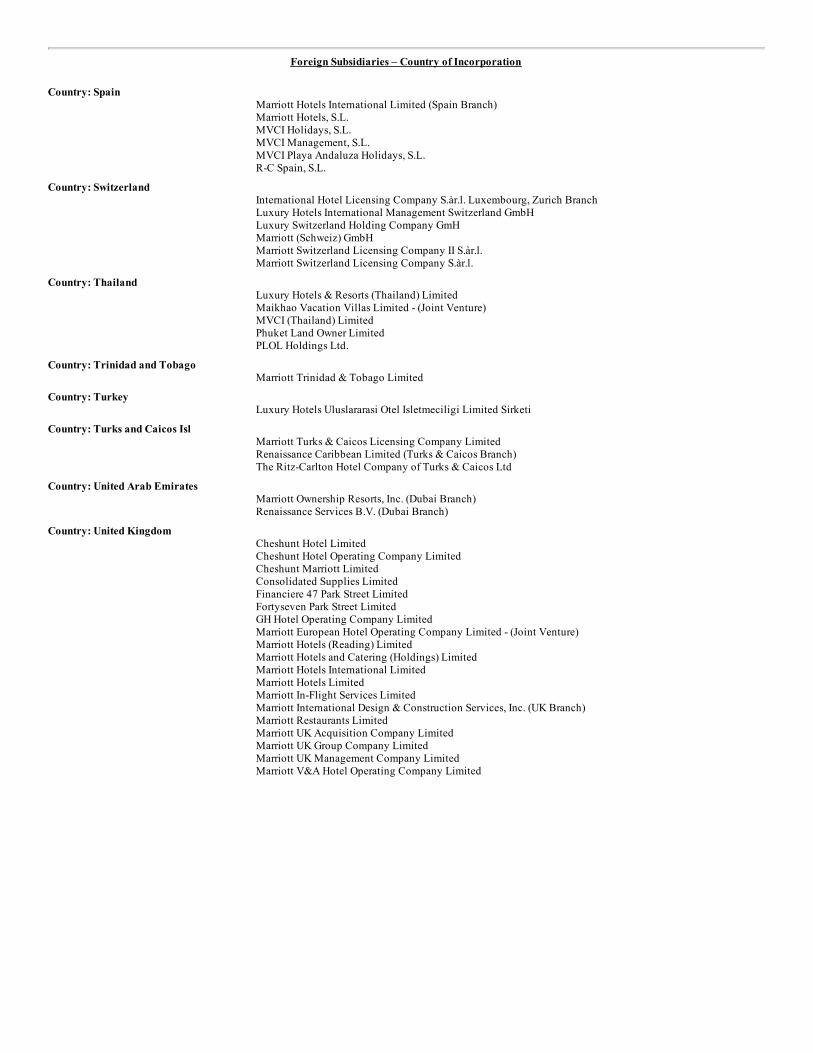
Foreign Subsidiaries – Country of Incorporation
Country: Spain Marriott Hotels International Limited (Spain Branch) Marriott Hotels, S.L. MVCI Holidays, S.L. MVCI Management, S.L. MVCI Playa Andaluza Holidays, S.L. R-C Spain, S.L.
Country: Switzerland International Hotel Licensing Company S.àr.l. Luxembourg, Zurich Branch Luxury Hotels International Management Switzerland GmbH Luxury Switzerland Holding Company GmH Marriott (Schweiz) GmbH Marriott Switzerland Licensing Company II S.àr.l. Marriott Switzerland Licensing Company S.àr.l.
Country: Thailand Luxury Hotels & Resorts (Thailand) Limited Maikhao Vacation Villas Limited - (Joint Venture) MVCI (Thailand) Limited Phuket Land Owner Limited PLOL Holdings Ltd.
Country: Trinidad and Tobago Marriott Trinidad & Tobago Limited
Country: Turkey Luxury Hotels Uluslararasi Otel Isletmeciligi Limited Sirketi
Country: Turks and Caicos Isl Marriott Turks & Caicos Licensing Company Limited Renaissance Caribbean Limited (Turks & Caicos Branch) The Ritz-Carlton Hotel Company of Turks & Caicos Ltd
Country: United Arab Emirates Marriott Ownership Resorts, Inc. (Dubai Branch) Renaissance Services B.V. (Dubai Branch)
Country: United Kingdom Cheshunt Hotel Limited Cheshunt Hotel Operating Company Limited Cheshunt Marriott Limited Consolidated Supplies Limited Financiere 47 Park Street Limited Fortyseven Park Street Limited GH Hotel Operating Company Limited Marriott European Hotel Operating Company Limited - (Joint Venture) Marriott Hotels (Reading) Limited Marriott Hotels and Catering (Holdings) Limited Marriott Hotels International Limited Marriott Hotels Limited Marriott In-Flight Services Limited Marriott International Design & Construction Services, Inc. (UK Branch) Marriott Restaurants Limited Marriott UK Acquisition Company Limited Marriott UK Group Company Limited Marriott UK Management Company Limited Marriott V&A Hotel Operating Company Limited
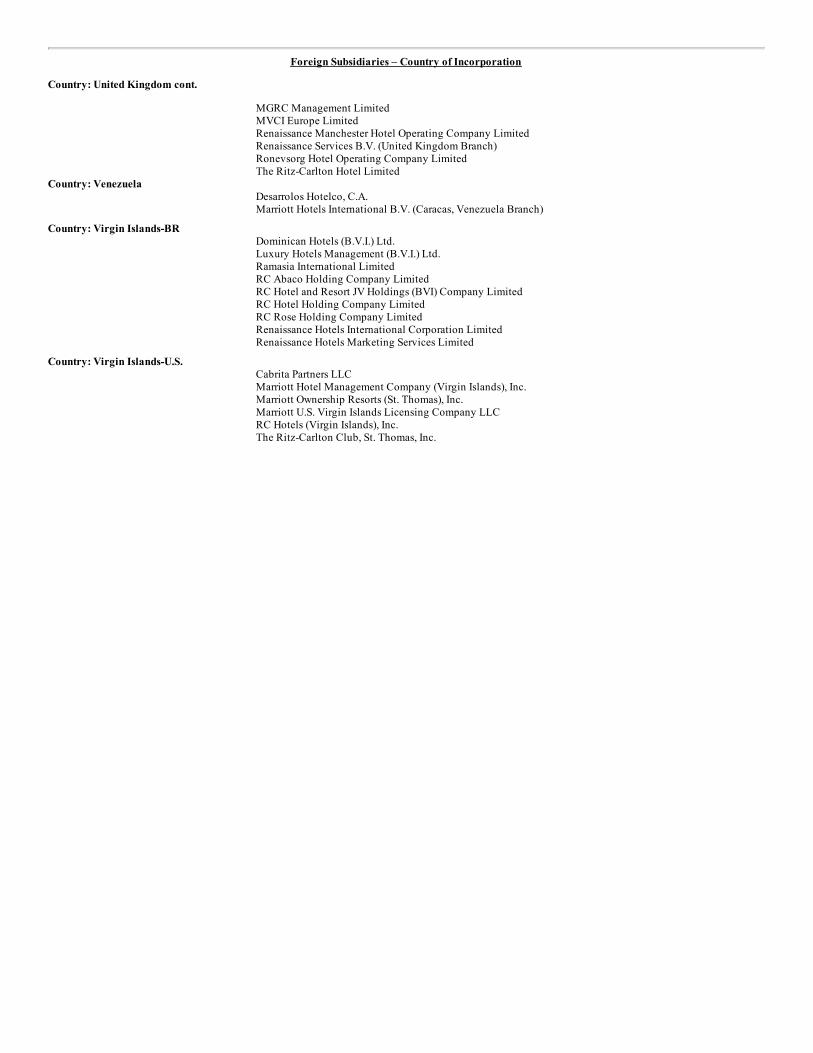
Foreign Subsidiaries – Country of Incorporation
Country: United Kingdom cont.
MGRC Management Limited MVCI Europe Limited Renaissance Manchester Hotel Operating Company Limited Renaissance Services B.V. (United Kingdom Branch) Ronevsorg Hotel Operating Company Limited The Ritz-Carlton Hotel Limited
Country: Venezuela Desarrolos Hotelco, C.A. Marriott Hotels International B.V. (Caracas, Venezuela Branch)
Country: Virgin Islands-BR Dominican Hotels (B.V.I.) Ltd. Luxury Hotels Management (B.V.I.) Ltd. Ramasia International Limited RC Abaco Holding Company Limited RC Hotel and Resort JV Holdings (BVI) Company Limited RC Hotel Holding Company Limited RC Rose Holding Company Limited Renaissance Hotels International Corporation Limited Renaissance Hotels Marketing Services Limited
Country: Virgin Islands-U.S. Cabrita Partners LLC Marriott Hotel Management Company (Virgin Islands), Inc. Marriott Ownership Resorts (St. Thomas), Inc. Marriott U.S. Virgin Islands Licensing Company LLC RC Hotels (Virgin Islands), Inc. The Ritz-Carlton Club, St. Thomas, Inc.
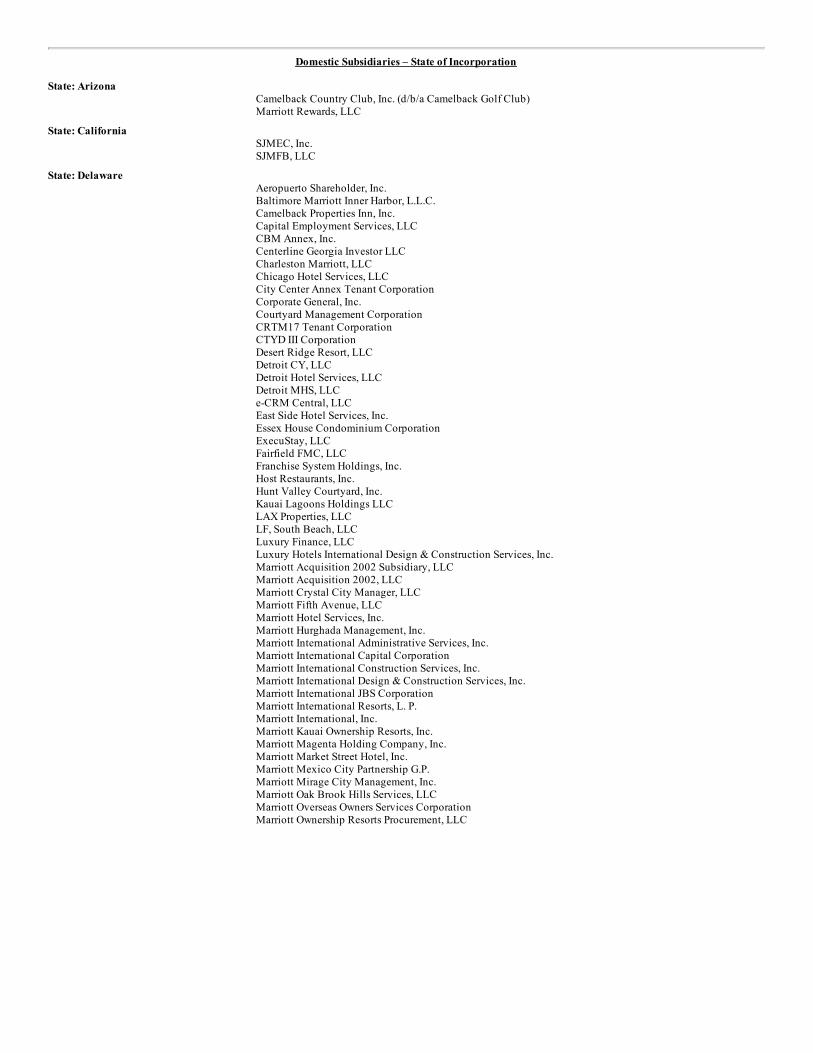
Domestic Subsidiaries – State of Incorporation State: Arizona
Camelback Country Club, Inc. (d/b/a Camelback Golf Club) Marriott Rewards, LLC
State: California SJMEC, Inc. SJMFB, LLC
State: Delaware Aeropuerto Shareholder, Inc. Baltimore Marriott Inner Harbor, L.L.C. Camelback Properties Inn, Inc. Capital Employment Services, LLC CBM Annex, Inc. Centerline Georgia Investor LLC Charleston Marriott, LLC Chicago Hotel Services, LLC City Center Annex Tenant Corporation Corporate General, Inc. Courtyard Management Corporation CRTM17 Tenant Corporation CTYD III Corporation Desert Ridge Resort, LLC Detroit CY, LLC Detroit Hotel Services, LLC Detroit MHS, LLC e-CRM Central, LLC East Side Hotel Services, Inc. Essex House Condominium Corporation ExecuStay, LLC Fairfield FMC, LLC Franchise System Holdings, Inc. Host Restaurants, Inc. Hunt Valley Courtyard, Inc. Kauai Lagoons Holdings LLC LAX Properties, LLC LF, South Beach, LLC Luxury Finance, LLC Luxury Hotels International Design & Construction Services, Inc. Marriott Acquisition 2002 Subsidiary, LLC Marriott Acquisition 2002, LLC Marriott Crystal City Manager, LLC Marriott Fifth Avenue, LLC Marriott Hotel Services, Inc. Marriott Hurghada Management, Inc. Marriott International Administrative Services, Inc. Marriott International Capital Corporation Marriott International Construction Services, Inc. Marriott International Design & Construction Services, Inc. Marriott International JBS Corporation Marriott International Resorts, L. P. Marriott International, Inc. Marriott Kauai Ownership Resorts, Inc. Marriott Magenta Holding Company, Inc. Marriott Market Street Hotel, Inc. Marriott Mexico City Partnership G.P. Marriott Mirage City Management, Inc. Marriott Oak Brook Hills Services, LLC Marriott Overseas Owners Services Corporation
Marriott Ownership Resorts Procurement, LLC
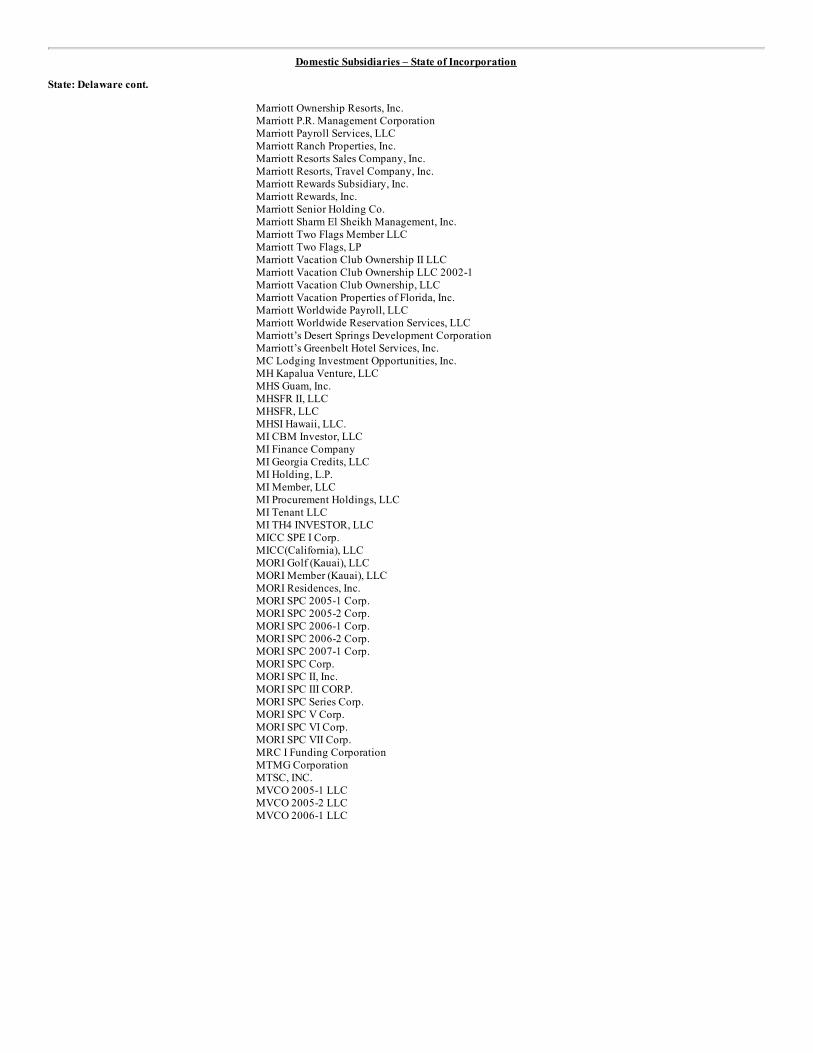
Domestic Subsidiaries – State of Incorporation
State: Delaware cont.
Marriott Ownership Resorts, Inc. Marriott P.R. Management Corporation Marriott Payroll Services, LLC Marriott Ranch Properties, Inc. Marriott Resorts Sales Company, Inc. Marriott Resorts, Travel Company, Inc. Marriott Rewards Subsidiary, Inc. Marriott Rewards, Inc. Marriott Senior Holding Co. Marriott Sharm El Sheikh Management, Inc. Marriott Two Flags Member LLC Marriott Two Flags, LP Marriott Vacation Club Ownership II LLC Marriott Vacation Club Ownership LLC 2002-1 Marriott Vacation Club Ownership, LLC Marriott Vacation Properties of Florida, Inc. Marriott Worldwide Payroll, LLC Marriott Worldwide Reservation Services, LLC Marriott’s Desert Springs Development Corporation Marriott’s Greenbelt Hotel Services, Inc. MC Lodging Investment Opportunities, Inc. MH Kapalua Venture, LLC MHS Guam, Inc. MHSFR II, LLC MHSFR, LLC MHSI Hawaii, LLC. MI CBM Investor, LLC MI Finance Company MI Georgia Credits, LLC MI Holding, L.P. MI Member, LLC MI Procurement Holdings, LLC MI Tenant LLC MI TH4 INVESTOR, LLC MICC SPE I Corp. MICC(California), LLC MORI Golf (Kauai), LLC MORI Member (Kauai), LLC MORI Residences, Inc. MORI SPC 2005-1 Corp. MORI SPC 2005-2 Corp. MORI SPC 2006-1 Corp. MORI SPC 2006-2 Corp. MORI SPC 2007-1 Corp. MORI SPC Corp. MORI SPC II, Inc. MORI SPC III CORP. MORI SPC Series Corp. MORI SPC V Corp. MORI SPC VI Corp. MORI SPC VII Corp. MRC I Funding Corporation MTMG Corporation MTSC, INC. MVCO 2005-1 LLC MVCO 2005-2 LLC MVCO 2006-1 LLC
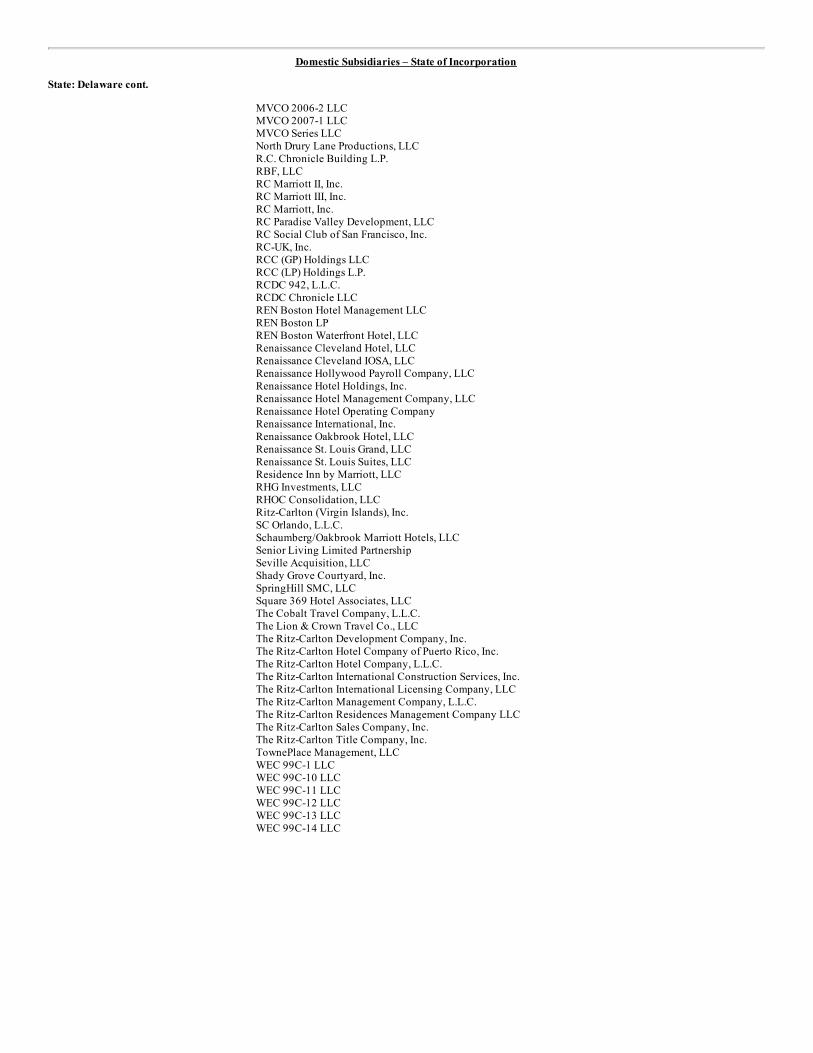
Domestic Subsidiaries – State of Incorporation
State: Delaware cont.
MVCO 2006-2 LLC MVCO 2007-1 LLC MVCO Series LLC North Drury Lane Productions, LLC R.C. Chronicle Building L.P. RBF, LLC RC Marriott II, Inc. RC Marriott III, Inc. RC Marriott, Inc. RC Paradise Valley Development, LLC RC Social Club of San Francisco, Inc. RC-UK, Inc. RCC (GP) Holdings LLC RCC (LP) Holdings L.P. RCDC 942, L.L.C. RCDC Chronicle LLC REN Boston Hotel Management LLC REN Boston LP REN Boston Waterfront Hotel, LLC Renaissance Cleveland Hotel, LLC Renaissance Cleveland IOSA, LLC Renaissance Hollywood Payroll Company, LLC Renaissance Hotel Holdings, Inc. Renaissance Hotel Management Company, LLC Renaissance Hotel Operating Company Renaissance International, Inc. Renaissance Oakbrook Hotel, LLC Renaissance St. Louis Grand, LLC Renaissance St. Louis Suites, LLC Residence Inn by Marriott, LLC RHG Investments, LLC RHOC Consolidation, LLC Ritz-Carlton (Virgin Islands), Inc. SC Orlando, L.L.C. Schaumberg/Oakbrook Marriott Hotels, LLC Senior Living Limited Partnership Seville Acquisition, LLC Shady Grove Courtyard, Inc. SpringHill SMC, LLC Square 369 Hotel Associates, LLC The Cobalt Travel Company, L.L.C. The Lion & Crown Travel Co., LLC The Ritz-Carlton Development Company, Inc. The Ritz-Carlton Hotel Company of Puerto Rico, Inc. The Ritz-Carlton Hotel Company, L.L.C. The Ritz-Carlton International Construction Services, Inc. The Ritz-Carlton International Licensing Company, LLC The Ritz-Carlton Management Company, L.L.C. The Ritz-Carlton Residences Management Company LLC The Ritz-Carlton Sales Company, Inc. The Ritz-Carlton Title Company, Inc. TownePlace Management, LLC WEC 99C-1 LLC WEC 99C-10 LLC WEC 99C-11 LLC WEC 99C-12 LLC WEC 99C-13 LLC WEC 99C-14 LLC
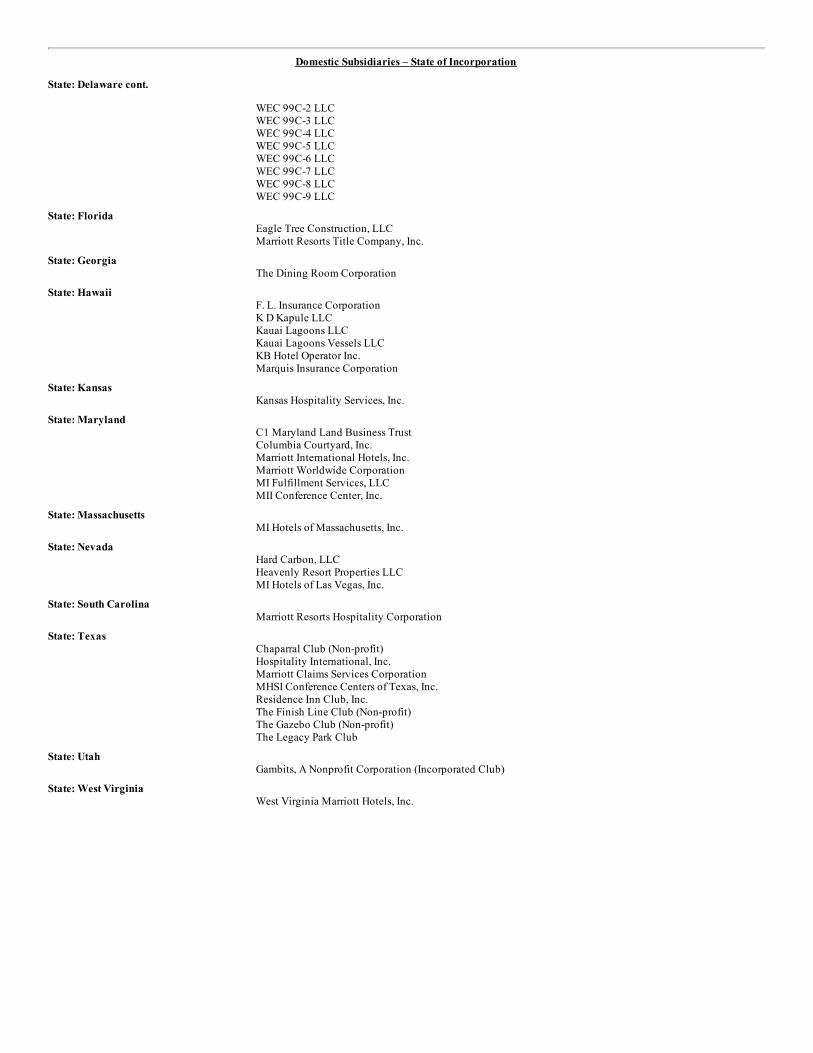
Domestic Subsidiaries – State of Incorporation
State: Delaware cont.
WEC 99C-2 LLC WEC 99C-3 LLC WEC 99C-4 LLC WEC 99C-5 LLC WEC 99C-6 LLC WEC 99C-7 LLC WEC 99C-8 LLC WEC 99C-9 LLC
State: Florida Eagle Tree Construction, LLC Marriott Resorts Title Company, Inc.
State: Georgia The Dining Room Corporation
State: Hawaii F. L. Insurance Corporation K D Kapule LLC Kauai Lagoons LLC Kauai Lagoons Vessels LLC KB Hotel Operator Inc. Marquis Insurance Corporation
State: Kansas Kansas Hospitality Services, Inc.
State: Maryland C1 Maryland Land Business Trust Columbia Courtyard, Inc. Marriott International Hotels, Inc. Marriott Worldwide Corporation MI Fulfillment Services, LLC MII Conference Center, Inc.
State: Massachusetts MI Hotels of Massachusetts, Inc.
State: Nevada Hard Carbon, LLC Heavenly Resort Properties LLC MI Hotels of Las Vegas, Inc.
State: South Carolina Marriott Resorts Hospitality Corporation
State: Texas Chaparral Club (Non-profit) Hospitality International, Inc. Marriott Claims Services Corporation MHSI Conference Centers of Texas, Inc. Residence Inn Club, Inc. The Finish Line Club (Non-profit) The Gazebo Club (Non-profit) The Legacy Park Club
State: Utah Gambits, A Nonprofit Corporation (Incorporated Club)
State: West Virginia West Virginia Marriott Hotels, Inc.
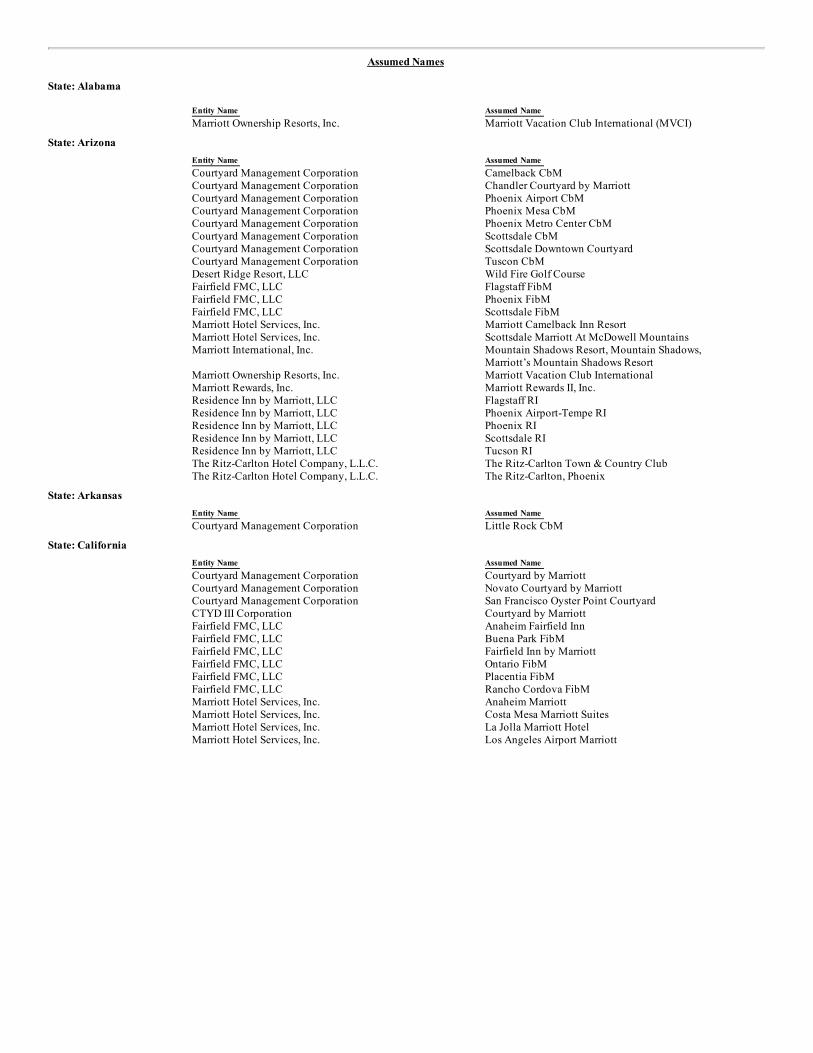
Assumed Names State: Alabama
Entity Name Assumed Name Marriott Ownership Resorts, Inc. Marriott Vacation Club International (MVCI)
State: Arizona
Entity Name Assumed Name Courtyard Management Corporation Camelback CbM Courtyard Management Corporation Chandler Courtyard by Marriott Courtyard Management Corporation Phoenix Airport CbM Courtyard Management Corporation Phoenix Mesa CbM Courtyard Management Corporation Phoenix Metro Center CbM Courtyard Management Corporation Scottsdale CbM Courtyard Management Corporation Scottsdale Downtown Courtyard Courtyard Management Corporation Tuscon CbM Desert Ridge Resort, LLC Wild Fire Golf Course Fairfield FMC, LLC Flagstaff FibM Fairfield FMC, LLC Phoenix FibM Fairfield FMC, LLC Scottsdale FibM Marriott Hotel Services, Inc. Marriott Camelback Inn Resort Marriott Hotel Services, Inc. Scottsdale Marriott At McDowell Mountains Marriott International, Inc. Mountain Shadows Resort, Mountain Shadows, Marriott’s Mountain Shadows Resort Marriott Ownership Resorts, Inc. Marriott Vacation Club International Marriott Rewards, Inc. Marriott Rewards II, Inc. Residence Inn by Marriott, LLC Flagstaff RI Residence Inn by Marriott, LLC Phoenix Airport-Tempe RI Residence Inn by Marriott, LLC Phoenix RI Residence Inn by Marriott, LLC Scottsdale RI Residence Inn by Marriott, LLC Tucson RI The Ritz-Carlton Hotel Company, L.L.C. The Ritz-Carlton Town & Country Club The Ritz-Carlton Hotel Company, L.L.C. The Ritz-Carlton, Phoenix
State: Arkansas
Entity Name Assumed Name Courtyard Management Corporation Little Rock CbM
State: California
Entity Name Assumed Name Courtyard Management Corporation Courtyard by Marriott Courtyard Management Corporation Novato Courtyard by Marriott Courtyard Management Corporation San Francisco Oyster Point Courtyard CTYD III Corporation Courtyard by Marriott Fairfield FMC, LLC Anaheim Fairfield Inn Fairfield FMC, LLC Buena Park FibM Fairfield FMC, LLC Fairfield Inn by Marriott Fairfield FMC, LLC Ontario FibM Fairfield FMC, LLC Placentia FibM Fairfield FMC, LLC Rancho Cordova FibM Marriott Hotel Services, Inc. Anaheim Marriott Marriott Hotel Services, Inc. Costa Mesa Marriott Suites Marriott Hotel Services, Inc. La Jolla Marriott Hotel Marriott Hotel Services, Inc. Los Angeles Airport Marriott

Assumed Names
State: California cont. Entity Name Assumed Name
Marriott Hotel Services, Inc. Marriott’s Desert Springs Resort and Spa Marriott Hotel Services, Inc. Monterey Marriott Hotel Marriott Hotel Services, Inc. Napa Valley Marriott Hotel Marriott Hotel Services, Inc. Newport Beach Marriott Hotel Marriott Hotel Services, Inc. Rancho Las Palmas Marriott Resort Marriott Hotel Services, Inc. Santa Clara Marriott Hotel Marriott International, Inc. Courtyard by Marriott Marriott International, Inc. Desert Springs, A JW Marriott Resort & Spa Marriott International, Inc. Irvine Marriott Hotel Marriott International, Inc. La Jolla Marriott Hotel Marriott International, Inc. Los Angeles Airport Marriott Marriott International, Inc. Manhattan Beach Marriott Marriott International, Inc. San Diego Marriott Hotel Marina Marriott Kauai Ownership Resorts, Inc. Marriott Vacation Club International (MVCI) Marriott Ownership Resorts, Inc. Grand Residences by Marriott Marriott Ownership Resorts, Inc. Marriott Vacation Club International Marriott Ownership Resorts, Inc. Marriott Vacation Club International (MVCI) Marriott Resorts Hospitality Corporation Marriott Vacation Club International (MVCI) Marriott Resorts, Travel Company, Inc. Marriott Vacation Club International (MVCI) Renaissance Hotel Management Company, LLC The Lodge at Sonoma Residence Inn by Marriott, LLC Anaheim Residence Inn Residence Inn by Marriott, LLC Anaheim RI Residence Inn by Marriott, LLC Arcadia Residence Inn Residence Inn by Marriott, LLC Arcadia Residence Inn Residence Inn by Marriott, LLC Arcadia RI Residence Inn by Marriott, LLC Bakersfield Residence Inn Residence Inn by Marriott, LLC Bakersfield RI Residence Inn by Marriott, LLC Beverly Hills Residence Inn Residence Inn by Marriott, LLC Beverly Hills Residence Inn Residence Inn by Marriott, LLC Beverly Hills RI Residence Inn by Marriott, LLC Costa Mesa Residence Inn Residence Inn by Marriott, LLC Costa Mesa RI Residence Inn by Marriott, LLC Fountain Valley Residence Inn Residence Inn by Marriott, LLC Fountain Valley RI Residence Inn by Marriott, LLC Fremont RI Residence Inn by Marriott, LLC Irvine Residence Inn Residence Inn by Marriott, LLC Irvine RI Residence Inn by Marriott, LLC Kearney Mesa Residence Inn Residence Inn by Marriott, LLC Kearney Mesa RI Residence Inn by Marriott, LLC La Jolla Residence Inn Residence Inn by Marriott, LLC La Jolla RI Residence Inn by Marriott, LLC Long Beach Residence Inn Residence Inn by Marriott, LLC Long Beach RI Residence Inn by Marriott, LLC Manhattan Beach Residence Inn Residence Inn by Marriott, LLC Manhattan Beach RI Residence Inn by Marriott, LLC Mira Mesa Residence Inn Residence Inn by Marriott, LLC MIRI Mesa Residence Inn Residence Inn by Marriott, LLC Mountain View Residence Inn Residence Inn by Marriott, LLC Mountain View RI Residence Inn by Marriott, LLC Placentia Residence Inn Residence Inn by Marriott, LLC Placentia RI Residence Inn by Marriott, LLC Pleasant Hills Residence Inn Residence Inn by Marriott, LLC Pleasant Hills RI Residence Inn by Marriott, LLC Rancho Bernardo RI Residence Inn by Marriott, LLC Residence Inn Cypress Residence Inn by Marriott, LLC Sacramento-Natomas Residence Inn Residence Inn by Marriott, LLC Sacramento-Natomas RI
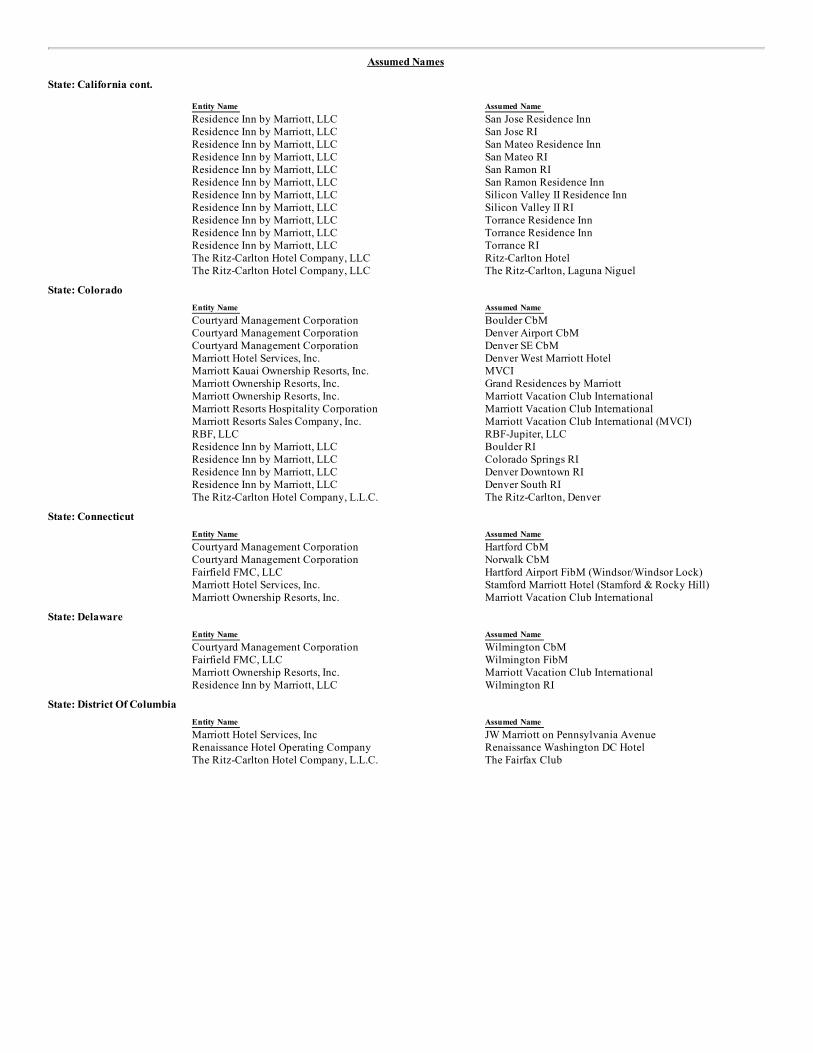
Assumed Names
State: California cont. Entity Name Assumed Name
Residence Inn by Marriott, LLC San Jose Residence Inn Residence Inn by Marriott, LLC San Jose RI Residence Inn by Marriott, LLC San Mateo Residence Inn Residence Inn by Marriott, LLC San Mateo RI Residence Inn by Marriott, LLC San Ramon RI Residence Inn by Marriott, LLC San Ramon Residence Inn Residence Inn by Marriott, LLC Silicon Valley II Residence Inn Residence Inn by Marriott, LLC Silicon Valley II RI Residence Inn by Marriott, LLC Torrance Residence Inn Residence Inn by Marriott, LLC Torrance Residence Inn Residence Inn by Marriott, LLC Torrance RI The Ritz-Carlton Hotel Company, LLC Ritz-Carlton Hotel The Ritz-Carlton Hotel Company, LLC The Ritz-Carlton, Laguna Niguel
State: Colorado
Entity Name Assumed Name Courtyard Management Corporation Boulder CbM Courtyard Management Corporation Denver Airport CbM Courtyard Management Corporation Denver SE CbM Marriott Hotel Services, Inc. Denver West Marriott Hotel Marriott Kauai Ownership Resorts, Inc. MVCI Marriott Ownership Resorts, Inc. Grand Residences by Marriott Marriott Ownership Resorts, Inc. Marriott Vacation Club International Marriott Resorts Hospitality Corporation Marriott Vacation Club International Marriott Resorts Sales Company, Inc. Marriott Vacation Club International (MVCI) RBF, LLC RBF-Jupiter, LLC Residence Inn by Marriott, LLC Boulder RI Residence Inn by Marriott, LLC Colorado Springs RI Residence Inn by Marriott, LLC Denver Downtown RI Residence Inn by Marriott, LLC Denver South RI The Ritz-Carlton Hotel Company, L.L.C. The Ritz-Carlton, Denver
State: Connecticut
Entity Name Assumed Name Courtyard Management Corporation Hartford CbM Courtyard Management Corporation Norwalk CbM Fairfield FMC, LLC Hartford Airport FibM (Windsor/Windsor Lock) Marriott Hotel Services, Inc. Stamford Marriott Hotel (Stamford & Rocky Hill) Marriott Ownership Resorts, Inc. Marriott Vacation Club International
State: Delaware
Entity Name Assumed Name Courtyard Management Corporation Wilmington CbM Fairfield FMC, LLC Wilmington FibM Marriott Ownership Resorts, Inc. Marriott Vacation Club International Residence Inn by Marriott, LLC Wilmington RI
State: District Of Columbia
Entity Name Assumed Name Marriott Hotel Services, Inc JW Marriott on Pennsylvania Avenue Renaissance Hotel Operating Company Renaissance Washington DC Hotel The Ritz-Carlton Hotel Company, L.L.C. The Fairfax Club
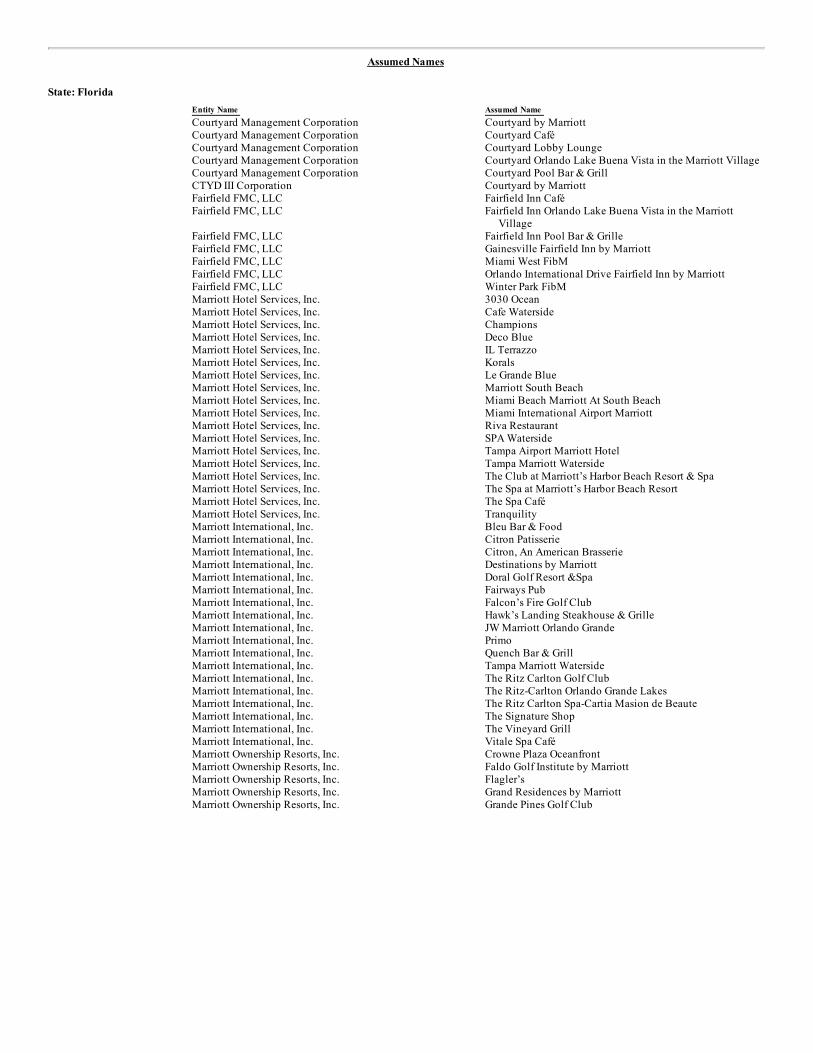
Assumed Names
State: Florida
Entity Name Assumed Name Courtyard Management Corporation Courtyard by Marriott Courtyard Management Corporation Courtyard Café Courtyard Management Corporation Courtyard Lobby Lounge Courtyard Management Corporation Courtyard Orlando Lake Buena Vista in the Marriott Village Courtyard Management Corporation Courtyard Pool Bar & Grill CTYD III Corporation Courtyard by Marriott Fairfield FMC, LLC Fairfield Inn Café
Fairfield FMC, LLC
Fairfield Inn Orlando Lake Buena Vista in the Marriott
Village Fairfield FMC, LLC Fairfield Inn Pool Bar & Grille Fairfield FMC, LLC Gainesville Fairfield Inn by Marriott Fairfield FMC, LLC Miami West FibM Fairfield FMC, LLC Orlando International Drive Fairfield Inn by Marriott Fairfield FMC, LLC Winter Park FibM Marriott Hotel Services, Inc. 3030 Ocean Marriott Hotel Services, Inc. Cafe Waterside Marriott Hotel Services, Inc. Champions Marriott Hotel Services, Inc. Deco Blue Marriott Hotel Services, Inc. IL Terrazzo Marriott Hotel Services, Inc. Korals Marriott Hotel Services, Inc. Le Grande Blue Marriott Hotel Services, Inc. Marriott South Beach Marriott Hotel Services, Inc. Miami Beach Marriott At South Beach Marriott Hotel Services, Inc. Miami International Airport Marriott Marriott Hotel Services, Inc. Riva Restaurant Marriott Hotel Services, Inc. SPA Waterside Marriott Hotel Services, Inc. Tampa Airport Marriott Hotel Marriott Hotel Services, Inc. Tampa Marriott Waterside Marriott Hotel Services, Inc. The Club at Marriott’s Harbor Beach Resort & Spa Marriott Hotel Services, Inc. The Spa at Marriott’s Harbor Beach Resort Marriott Hotel Services, Inc. The Spa Café Marriott Hotel Services, Inc. Tranquility Marriott International, Inc. Bleu Bar & Food Marriott International, Inc. Citron Patisserie Marriott International, Inc. Citron, An American Brasserie Marriott International, Inc. Destinations by Marriott Marriott International, Inc. Doral Golf Resort &Spa Marriott International, Inc. Fairways Pub Marriott International, Inc. Falcon’s Fire Golf Club Marriott International, Inc. Hawk’s Landing Steakhouse & Grille Marriott International, Inc. JW Marriott Orlando Grande Marriott International, Inc. Primo Marriott International, Inc. Quench Bar & Grill Marriott International, Inc. Tampa Marriott Waterside Marriott International, Inc. The Ritz Carlton Golf Club Marriott International, Inc. The Ritz-Carlton Orlando Grande Lakes Marriott International, Inc. The Ritz Carlton Spa-Cartia Masion de Beaute Marriott International, Inc. The Signature Shop Marriott International, Inc. The Vineyard Grill Marriott International, Inc. Vitale Spa Café Marriott Ownership Resorts, Inc. Crowne Plaza Oceanfront Marriott Ownership Resorts, Inc. Faldo Golf Institute by Marriott Marriott Ownership Resorts, Inc. Flagler’s Marriott Ownership Resorts, Inc. Grand Residences by Marriott Marriott Ownership Resorts, Inc. Grande Pines Golf Club
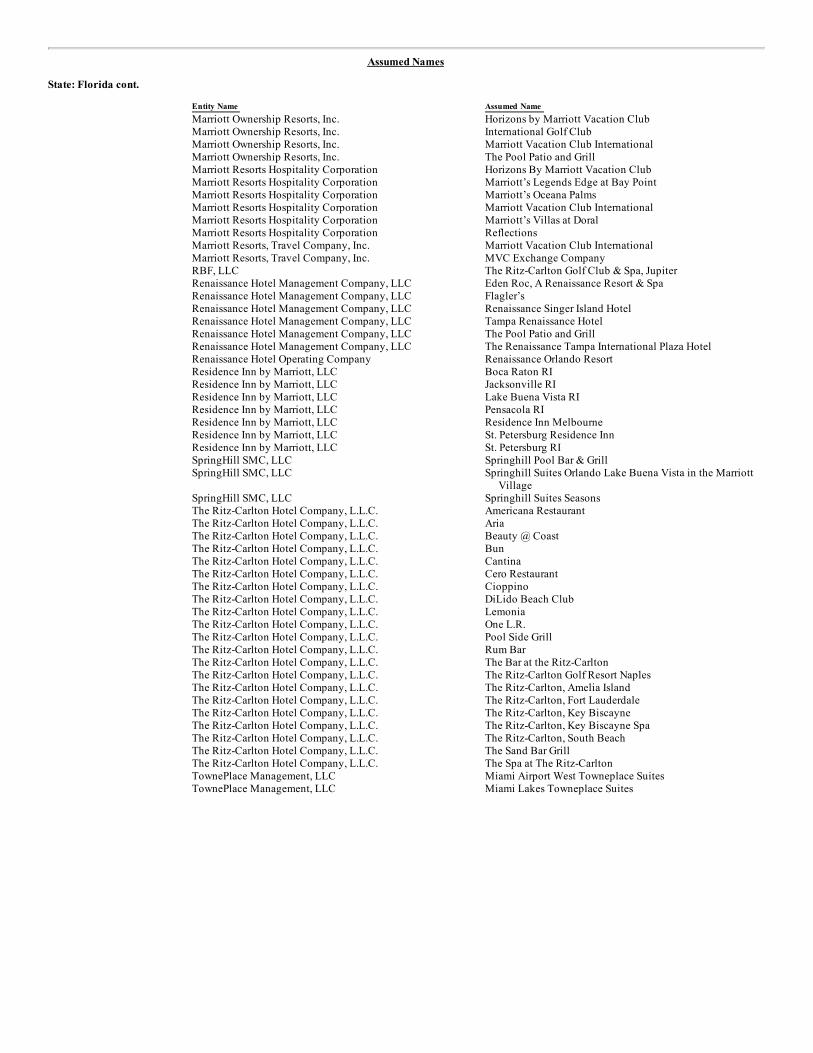
Assumed Names
State: Florida cont. Entity Name Assumed Name
Marriott Ownership Resorts, Inc. Horizons by Marriott Vacation Club Marriott Ownership Resorts, Inc. International Golf Club Marriott Ownership Resorts, Inc. Marriott Vacation Club International Marriott Ownership Resorts, Inc. The Pool Patio and Grill Marriott Resorts Hospitality Corporation Horizons By Marriott Vacation Club Marriott Resorts Hospitality Corporation Marriott’s Legends Edge at Bay Point Marriott Resorts Hospitality Corporation Marriott’s Oceana Palms Marriott Resorts Hospitality Corporation Marriott Vacation Club International Marriott Resorts Hospitality Corporation Marriott’s Villas at Doral Marriott Resorts Hospitality Corporation Reflections Marriott Resorts, Travel Company, Inc. Marriott Vacation Club International Marriott Resorts, Travel Company, Inc. MVC Exchange Company RBF, LLC The Ritz-Carlton Golf Club & Spa, Jupiter Renaissance Hotel Management Company, LLC Eden Roc, A Renaissance Resort & Spa Renaissance Hotel Management Company, LLC Flagler’s Renaissance Hotel Management Company, LLC Renaissance Singer Island Hotel Renaissance Hotel Management Company, LLC Tampa Renaissance Hotel Renaissance Hotel Management Company, LLC The Pool Patio and Grill Renaissance Hotel Management Company, LLC The Renaissance Tampa International Plaza Hotel Renaissance Hotel Operating Company Renaissance Orlando Resort Residence Inn by Marriott, LLC Boca Raton RI Residence Inn by Marriott, LLC Jacksonville RI Residence Inn by Marriott, LLC Lake Buena Vista RI Residence Inn by Marriott, LLC Pensacola RI Residence Inn by Marriott, LLC Residence Inn Melbourne Residence Inn by Marriott, LLC St. Petersburg Residence Inn Residence Inn by Marriott, LLC St. Petersburg RI SpringHill SMC, LLC Springhill Pool Bar & Grill
SpringHill SMC, LLC
Springhill Suites Orlando Lake Buena Vista in the Marriott
Village SpringHill SMC, LLC Springhill Suites Seasons The Ritz-Carlton Hotel Company, L.L.C. Americana Restaurant The Ritz-Carlton Hotel Company, L.L.C. Aria The Ritz-Carlton Hotel Company, L.L.C. Beauty @ Coast The Ritz-Carlton Hotel Company, L.L.C. Bun The Ritz-Carlton Hotel Company, L.L.C. Cantina The Ritz-Carlton Hotel Company, L.L.C. Cero Restaurant The Ritz-Carlton Hotel Company, L.L.C. Cioppino The Ritz-Carlton Hotel Company, L.L.C. DiLido Beach Club The Ritz-Carlton Hotel Company, L.L.C. Lemonia The Ritz-Carlton Hotel Company, L.L.C. One L.R. The Ritz-Carlton Hotel Company, L.L.C. Pool Side Grill The Ritz-Carlton Hotel Company, L.L.C. Rum Bar The Ritz-Carlton Hotel Company, L.L.C. The Bar at the Ritz-Carlton The Ritz-Carlton Hotel Company, L.L.C. The Ritz-Carlton Golf Resort Naples The Ritz-Carlton Hotel Company, L.L.C. The Ritz-Carlton, Amelia Island The Ritz-Carlton Hotel Company, L.L.C. The Ritz-Carlton, Fort Lauderdale The Ritz-Carlton Hotel Company, L.L.C. The Ritz-Carlton, Key Biscayne The Ritz-Carlton Hotel Company, L.L.C. The Ritz-Carlton, Key Biscayne Spa The Ritz-Carlton Hotel Company, L.L.C. The Ritz-Carlton, South Beach The Ritz-Carlton Hotel Company, L.L.C. The Sand Bar Grill The Ritz-Carlton Hotel Company, L.L.C. The Spa at The Ritz-Carlton TownePlace Management, LLC Miami Airport West Towneplace Suites TownePlace Management, LLC Miami Lakes Towneplace Suites
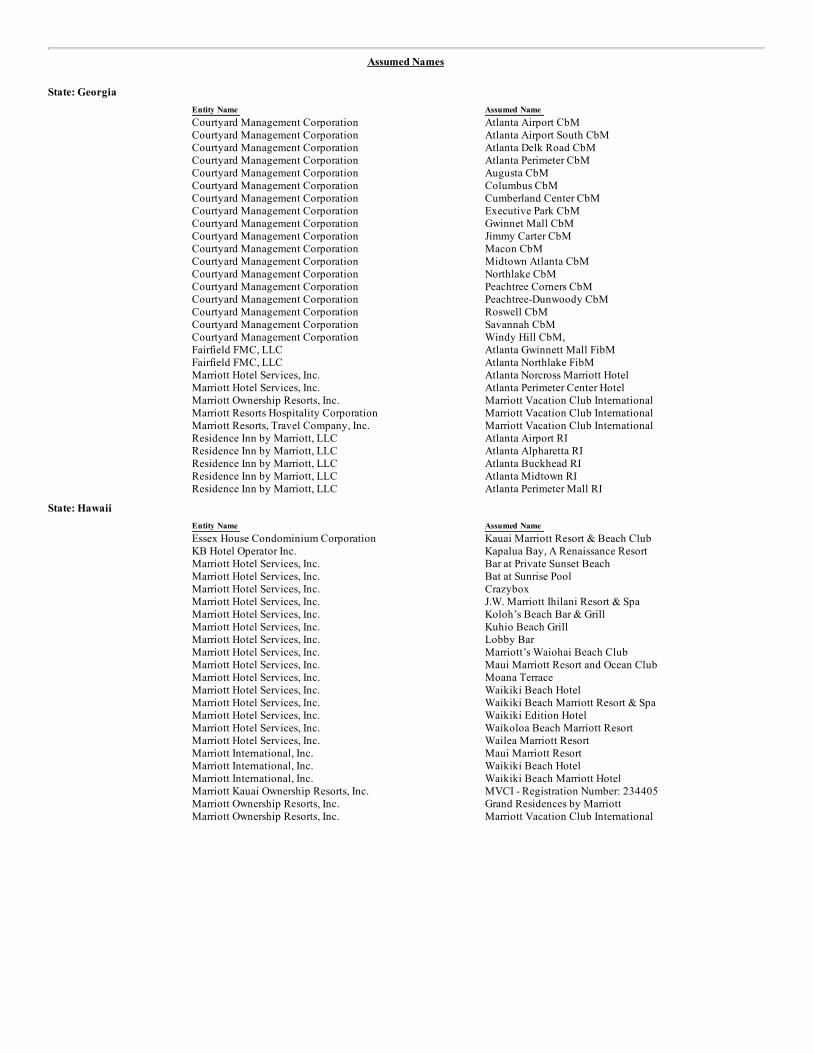
Assumed Names
State: Georgia
Entity Name Assumed Name Courtyard Management Corporation Atlanta Airport CbM Courtyard Management Corporation Atlanta Airport South CbM Courtyard Management Corporation Atlanta Delk Road CbM Courtyard Management Corporation Atlanta Perimeter CbM Courtyard Management Corporation Augusta CbM Courtyard Management Corporation Columbus CbM Courtyard Management Corporation Cumberland Center CbM Courtyard Management Corporation Executive Park CbM Courtyard Management Corporation Gwinnet Mall CbM Courtyard Management Corporation Jimmy Carter CbM Courtyard Management Corporation Macon CbM Courtyard Management Corporation Midtown Atlanta CbM Courtyard Management Corporation Northlake CbM Courtyard Management Corporation Peachtree Corners CbM Courtyard Management Corporation Peachtree-Dunwoody CbM Courtyard Management Corporation Roswell CbM Courtyard Management Corporation Savannah CbM Courtyard Management Corporation Windy Hill CbM, Fairfield FMC, LLC Atlanta Gwinnett Mall FibM Fairfield FMC, LLC Atlanta Northlake FibM Marriott Hotel Services, Inc. Atlanta Norcross Marriott Hotel Marriott Hotel Services, Inc. Atlanta Perimeter Center Hotel Marriott Ownership Resorts, Inc. Marriott Vacation Club International Marriott Resorts Hospitality Corporation Marriott Vacation Club International Marriott Resorts, Travel Company, Inc. Marriott Vacation Club International Residence Inn by Marriott, LLC Atlanta Airport RI Residence Inn by Marriott, LLC Atlanta Alpharetta RI Residence Inn by Marriott, LLC Atlanta Buckhead RI Residence Inn by Marriott, LLC Atlanta Midtown RI Residence Inn by Marriott, LLC Atlanta Perimeter Mall RI
State: Hawaii
Entity Name Assumed Name Essex House Condominium Corporation Kauai Marriott Resort & Beach Club KB Hotel Operator Inc. Kapalua Bay, A Renaissance Resort Marriott Hotel Services, Inc. Bar at Private Sunset Beach Marriott Hotel Services, Inc. Bat at Sunrise Pool Marriott Hotel Services, Inc. Crazybox Marriott Hotel Services, Inc. J.W. Marriott Ihilani Resort & Spa Marriott Hotel Services, Inc. Koloh’s Beach Bar & Grill Marriott Hotel Services, Inc. Kuhio Beach Grill Marriott Hotel Services, Inc. Lobby Bar Marriott Hotel Services, Inc. Marriott’s Waiohai Beach Club Marriott Hotel Services, Inc. Maui Marriott Resort and Ocean Club Marriott Hotel Services, Inc. Moana Terrace Marriott Hotel Services, Inc. Waikiki Beach Hotel Marriott Hotel Services, Inc. Waikiki Beach Marriott Resort & Spa Marriott Hotel Services, Inc. Waikiki Edition Hotel Marriott Hotel Services, Inc. Waikoloa Beach Marriott Resort Marriott Hotel Services, Inc. Wailea Marriott Resort Marriott International, Inc. Maui Marriott Resort Marriott International, Inc. Waikiki Beach Hotel Marriott International, Inc. Waikiki Beach Marriott Hotel Marriott Kauai Ownership Resorts, Inc. MVCI - Registration Number: 234405 Marriott Ownership Resorts, Inc. Grand Residences by Marriott Marriott Ownership Resorts, Inc. Marriott Vacation Club International
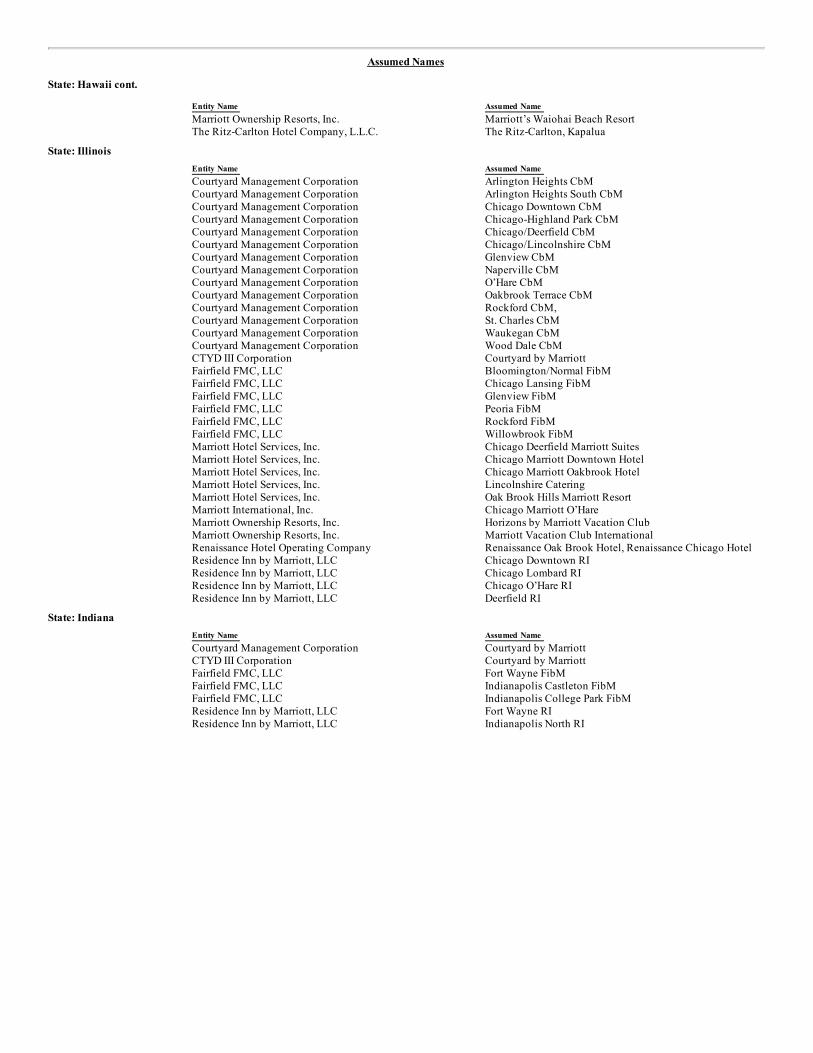
Assumed Names
State: Hawaii cont. Entity Name Assumed Name
Marriott Ownership Resorts, Inc. Marriott’s Waiohai Beach Resort The Ritz-Carlton Hotel Company, L.L.C. The Ritz-Carlton, Kapalua
State: Illinois
Entity Name Assumed Name Courtyard Management Corporation Arlington Heights CbM Courtyard Management Corporation Arlington Heights South CbM Courtyard Management Corporation Chicago Downtown CbM Courtyard Management Corporation Chicago-Highland Park CbM Courtyard Management Corporation Chicago/Deerfield CbM Courtyard Management Corporation Chicago/Lincolnshire CbM Courtyard Management Corporation Glenview CbM Courtyard Management Corporation Naperville CbM Courtyard Management Corporation O’Hare CbM Courtyard Management Corporation Oakbrook Terrace CbM Courtyard Management Corporation Rockford CbM, Courtyard Management Corporation St. Charles CbM Courtyard Management Corporation Waukegan CbM Courtyard Management Corporation Wood Dale CbM CTYD III Corporation Courtyard by Marriott Fairfield FMC, LLC Bloomington/Normal FibM Fairfield FMC, LLC Chicago Lansing FibM Fairfield FMC, LLC Glenview FibM Fairfield FMC, LLC Peoria FibM Fairfield FMC, LLC Rockford FibM Fairfield FMC, LLC Willowbrook FibM Marriott Hotel Services, Inc. Chicago Deerfield Marriott Suites Marriott Hotel Services, Inc. Chicago Marriott Downtown Hotel Marriott Hotel Services, Inc. Chicago Marriott Oakbrook Hotel Marriott Hotel Services, Inc. Lincolnshire Catering Marriott Hotel Services, Inc. Oak Brook Hills Marriott Resort Marriott International, Inc. Chicago Marriott O’Hare Marriott Ownership Resorts, Inc. Horizons by Marriott Vacation Club Marriott Ownership Resorts, Inc. Marriott Vacation Club International Renaissance Hotel Operating Company Renaissance Oak Brook Hotel, Renaissance Chicago Hotel Residence Inn by Marriott, LLC Chicago Downtown RI Residence Inn by Marriott, LLC Chicago Lombard RI Residence Inn by Marriott, LLC Chicago O’Hare RI Residence Inn by Marriott, LLC Deerfield RI
State: Indiana
Entity Name Assumed Name Courtyard Management Corporation Courtyard by Marriott CTYD III Corporation Courtyard by Marriott Fairfield FMC, LLC Fort Wayne FibM Fairfield FMC, LLC Indianapolis Castleton FibM Fairfield FMC, LLC Indianapolis College Park FibM Residence Inn by Marriott, LLC Fort Wayne RI Residence Inn by Marriott, LLC Indianapolis North RI
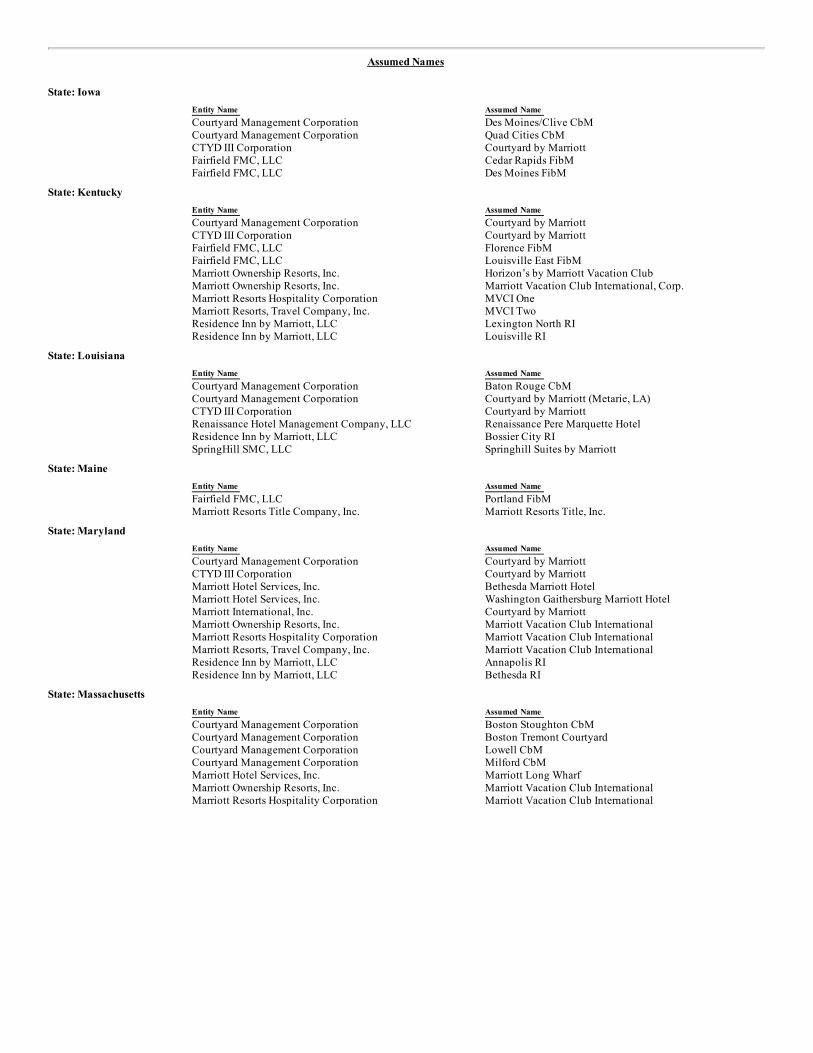
Assumed Names
State: Iowa
Entity Name Assumed Name Courtyard Management Corporation Des Moines/Clive CbM Courtyard Management Corporation Quad Cities CbM CTYD III Corporation Courtyard by Marriott Fairfield FMC, LLC Cedar Rapids FibM Fairfield FMC, LLC Des Moines FibM
State: Kentucky
Entity Name Assumed Name Courtyard Management Corporation Courtyard by Marriott CTYD III Corporation Courtyard by Marriott Fairfield FMC, LLC Florence FibM Fairfield FMC, LLC Louisville East FibM Marriott Ownership Resorts, Inc. Horizon’s by Marriott Vacation Club Marriott Ownership Resorts, Inc. Marriott Vacation Club International, Corp. Marriott Resorts Hospitality Corporation MVCI One Marriott Resorts, Travel Company, Inc. MVCI Two Residence Inn by Marriott, LLC Lexington North RI Residence Inn by Marriott, LLC Louisville RI
State: Louisiana
Entity Name Assumed Name Courtyard Management Corporation Baton Rouge CbM Courtyard Management Corporation Courtyard by Marriott (Metarie, LA) CTYD III Corporation Courtyard by Marriott Renaissance Hotel Management Company, LLC Renaissance Pere Marquette Hotel Residence Inn by Marriott, LLC Bossier City RI SpringHill SMC, LLC Springhill Suites by Marriott
State: Maine
Entity Name Assumed Name Fairfield FMC, LLC Portland FibM Marriott Resorts Title Company, Inc. Marriott Resorts Title, Inc.
State: Maryland
Entity Name Assumed Name Courtyard Management Corporation Courtyard by Marriott CTYD III Corporation Courtyard by Marriott Marriott Hotel Services, Inc. Bethesda Marriott Hotel Marriott Hotel Services, Inc. Washington Gaithersburg Marriott Hotel Marriott International, Inc. Courtyard by Marriott Marriott Ownership Resorts, Inc. Marriott Vacation Club International Marriott Resorts Hospitality Corporation Marriott Vacation Club International Marriott Resorts, Travel Company, Inc. Marriott Vacation Club International Residence Inn by Marriott, LLC Annapolis RI Residence Inn by Marriott, LLC Bethesda RI
State: Massachusetts
Entity Name Assumed Name Courtyard Management Corporation Boston Stoughton CbM Courtyard Management Corporation Boston Tremont Courtyard Courtyard Management Corporation Lowell CbM Courtyard Management Corporation Milford CbM Marriott Hotel Services, Inc. Marriott Long Wharf Marriott Ownership Resorts, Inc. Marriott Vacation Club International Marriott Resorts Hospitality Corporation Marriott Vacation Club International
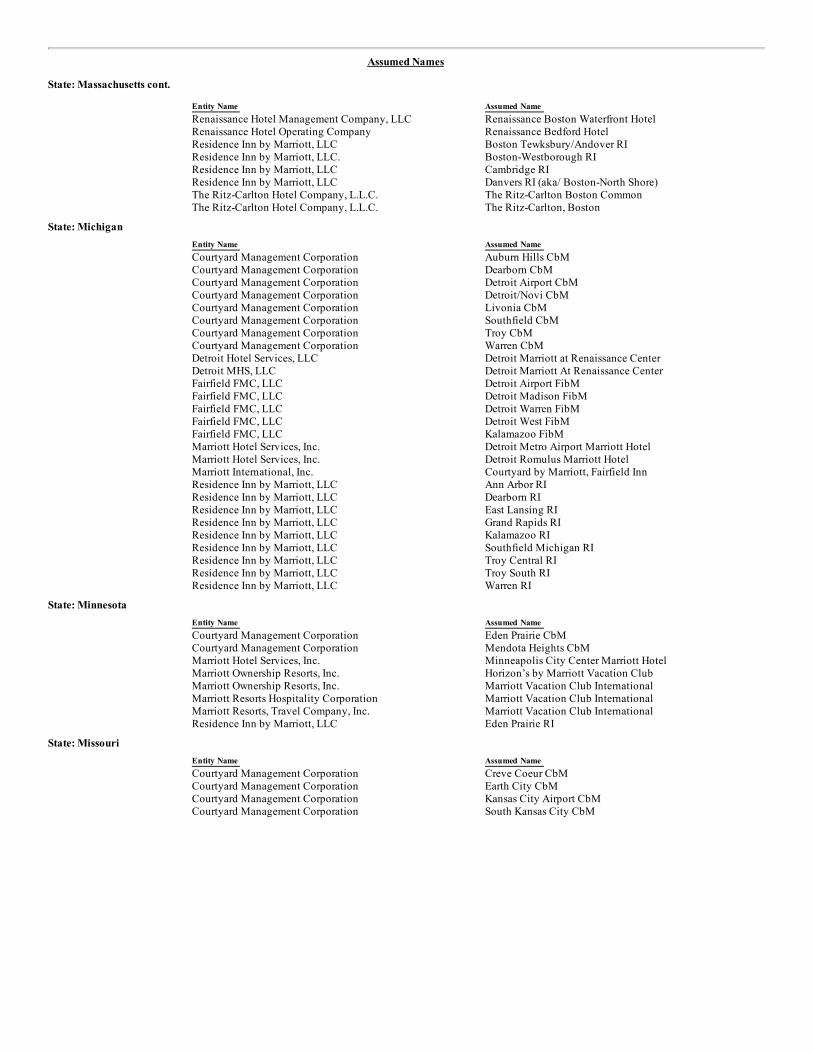
Assumed Names
State: Massachusetts cont. Entity Name Assumed Name
Renaissance Hotel Management Company, LLC Renaissance Boston Waterfront Hotel Renaissance Hotel Operating Company Renaissance Bedford Hotel Residence Inn by Marriott, LLC Boston Tewksbury/Andover RI Residence Inn by Marriott, LLC. Boston-Westborough RI Residence Inn by Marriott, LLC Cambridge RI Residence Inn by Marriott, LLC Danvers RI (aka/ Boston-North Shore) The Ritz-Carlton Hotel Company, L.L.C. The Ritz-Carlton Boston Common The Ritz-Carlton Hotel Company, L.L.C. The Ritz-Carlton, Boston
State: Michigan
Entity Name Assumed Name Courtyard Management Corporation Auburn Hills CbM Courtyard Management Corporation Dearborn CbM Courtyard Management Corporation Detroit Airport CbM Courtyard Management Corporation Detroit/Novi CbM Courtyard Management Corporation Livonia CbM Courtyard Management Corporation Southfield CbM Courtyard Management Corporation Troy CbM Courtyard Management Corporation Warren CbM Detroit Hotel Services, LLC Detroit Marriott at Renaissance Center Detroit MHS, LLC Detroit Marriott At Renaissance Center Fairfield FMC, LLC Detroit Airport FibM Fairfield FMC, LLC Detroit Madison FibM Fairfield FMC, LLC Detroit Warren FibM Fairfield FMC, LLC Detroit West FibM Fairfield FMC, LLC Kalamazoo FibM Marriott Hotel Services, Inc. Detroit Metro Airport Marriott Hotel Marriott Hotel Services, Inc. Detroit Romulus Marriott Hotel Marriott International, Inc. Courtyard by Marriott, Fairfield Inn Residence Inn by Marriott, LLC Ann Arbor RI Residence Inn by Marriott, LLC Dearborn RI Residence Inn by Marriott, LLC East Lansing RI Residence Inn by Marriott, LLC Grand Rapids RI Residence Inn by Marriott, LLC Kalamazoo RI Residence Inn by Marriott, LLC Southfield Michigan RI Residence Inn by Marriott, LLC Troy Central RI Residence Inn by Marriott, LLC Troy South RI Residence Inn by Marriott, LLC Warren RI
State: Minnesota
Entity Name Assumed Name Courtyard Management Corporation Eden Prairie CbM Courtyard Management Corporation Mendota Heights CbM Marriott Hotel Services, Inc. Minneapolis City Center Marriott Hotel Marriott Ownership Resorts, Inc. Horizon’s by Marriott Vacation Club Marriott Ownership Resorts, Inc. Marriott Vacation Club International Marriott Resorts Hospitality Corporation Marriott Vacation Club International Marriott Resorts, Travel Company, Inc. Marriott Vacation Club International Residence Inn by Marriott, LLC Eden Prairie RI
State: Missouri
Entity Name Assumed Name Courtyard Management Corporation Creve Coeur CbM Courtyard Management Corporation Earth City CbM Courtyard Management Corporation Kansas City Airport CbM Courtyard Management Corporation South Kansas City CbM
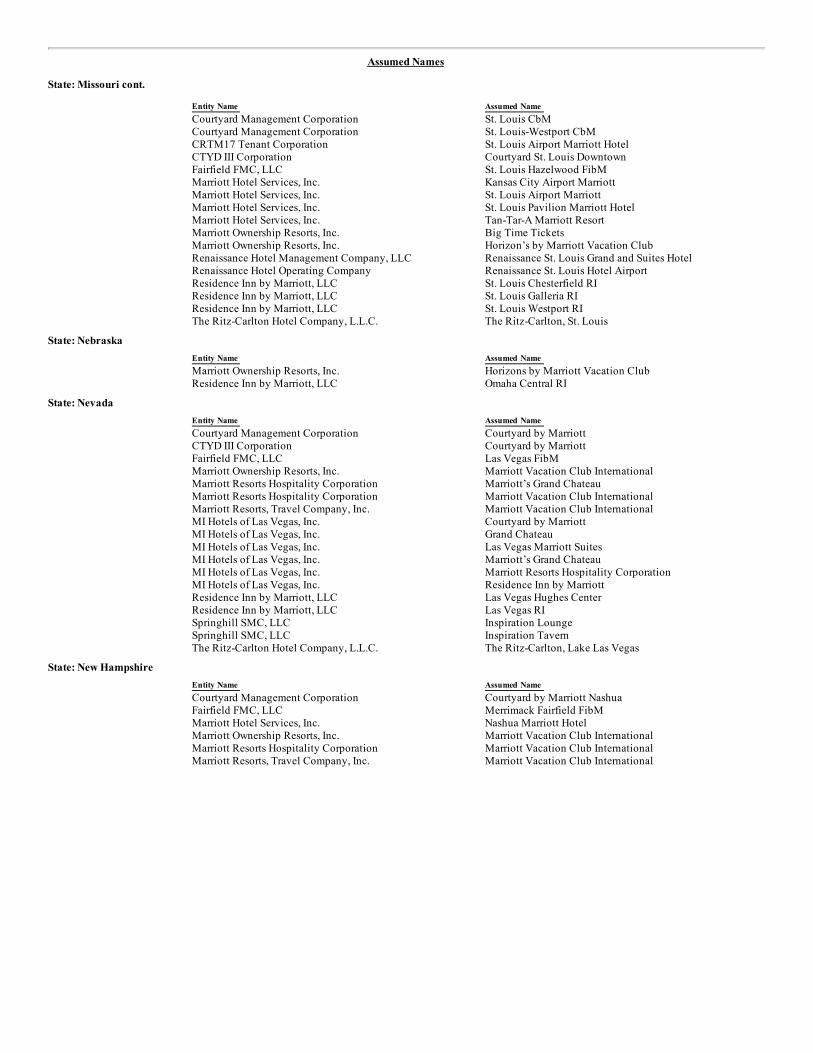
Assumed Names
State: Missouri cont. Entity Name Assumed Name
Courtyard Management Corporation St. Louis CbM Courtyard Management Corporation St. Louis-Westport CbM CRTM17 Tenant Corporation St. Louis Airport Marriott Hotel CTYD III Corporation Courtyard St. Louis Downtown Fairfield FMC, LLC St. Louis Hazelwood FibM Marriott Hotel Services, Inc. Kansas City Airport Marriott Marriott Hotel Services, Inc. St. Louis Airport Marriott Marriott Hotel Services, Inc. St. Louis Pavilion Marriott Hotel Marriott Hotel Services, Inc. Tan-Tar-A Marriott Resort Marriott Ownership Resorts, Inc. Big Time Tickets Marriott Ownership Resorts, Inc. Horizon’s by Marriott Vacation Club Renaissance Hotel Management Company, LLC Renaissance St. Louis Grand and Suites Hotel Renaissance Hotel Operating Company Renaissance St. Louis Hotel Airport Residence Inn by Marriott, LLC St. Louis Chesterfield RI Residence Inn by Marriott, LLC St. Louis Galleria RI Residence Inn by Marriott, LLC St. Louis Westport RI The Ritz-Carlton Hotel Company, L.L.C. The Ritz-Carlton, St. Louis
State: Nebraska
Entity Name Assumed Name Marriott Ownership Resorts, Inc. Horizons by Marriott Vacation Club Residence Inn by Marriott, LLC Omaha Central RI
State: Nevada
Entity Name Assumed Name Courtyard Management Corporation Courtyard by Marriott CTYD III Corporation Courtyard by Marriott Fairfield FMC, LLC Las Vegas FibM Marriott Ownership Resorts, Inc. Marriott Vacation Club International Marriott Resorts Hospitality Corporation Marriott’s Grand Chateau Marriott Resorts Hospitality Corporation Marriott Vacation Club International Marriott Resorts, Travel Company, Inc. Marriott Vacation Club International MI Hotels of Las Vegas, Inc. Courtyard by Marriott MI Hotels of Las Vegas, Inc. Grand Chateau MI Hotels of Las Vegas, Inc. Las Vegas Marriott Suites MI Hotels of Las Vegas, Inc. Marriott’s Grand Chateau MI Hotels of Las Vegas, Inc. Marriott Resorts Hospitality Corporation MI Hotels of Las Vegas, Inc. Residence Inn by Marriott Residence Inn by Marriott, LLC Las Vegas Hughes Center Residence Inn by Marriott, LLC Las Vegas RI Springhill SMC, LLC Inspiration Lounge Springhill SMC, LLC Inspiration Tavern The Ritz-Carlton Hotel Company, L.L.C. The Ritz-Carlton, Lake Las Vegas
State: New Hampshire
Entity Name Assumed Name Courtyard Management Corporation Courtyard by Marriott Nashua Fairfield FMC, LLC Merrimack Fairfield FibM Marriott Hotel Services, Inc. Nashua Marriott Hotel Marriott Ownership Resorts, Inc. Marriott Vacation Club International Marriott Resorts Hospitality Corporation Marriott Vacation Club International Marriott Resorts, Travel Company, Inc. Marriott Vacation Club International
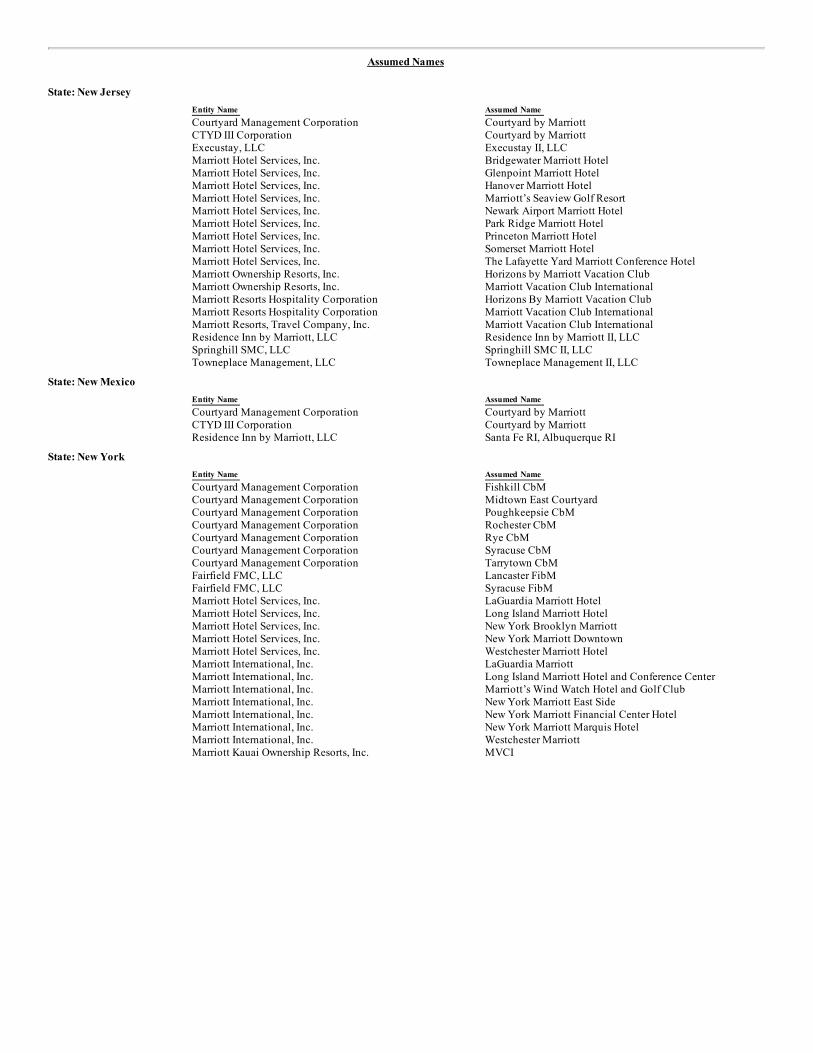
Assumed Names
State: New Jersey
Entity Name Assumed Name Courtyard Management Corporation Courtyard by Marriott CTYD III Corporation Courtyard by Marriott Execustay, LLC Execustay II, LLC Marriott Hotel Services, Inc. Bridgewater Marriott Hotel Marriott Hotel Services, Inc. Glenpoint Marriott Hotel Marriott Hotel Services, Inc. Hanover Marriott Hotel Marriott Hotel Services, Inc. Marriott’s Seaview Golf Resort Marriott Hotel Services, Inc. Newark Airport Marriott Hotel Marriott Hotel Services, Inc. Park Ridge Marriott Hotel Marriott Hotel Services, Inc. Princeton Marriott Hotel Marriott Hotel Services, Inc. Somerset Marriott Hotel Marriott Hotel Services, Inc. The Lafayette Yard Marriott Conference Hotel Marriott Ownership Resorts, Inc. Horizons by Marriott Vacation Club Marriott Ownership Resorts, Inc. Marriott Vacation Club International Marriott Resorts Hospitality Corporation Horizons By Marriott Vacation Club Marriott Resorts Hospitality Corporation Marriott Vacation Club International Marriott Resorts, Travel Company, Inc. Marriott Vacation Club International Residence Inn by Marriott, LLC Residence Inn by Marriott II, LLC Springhill SMC, LLC Springhill SMC II, LLC Towneplace Management, LLC Towneplace Management II, LLC
State: New Mexico
Entity Name Assumed Name Courtyard Management Corporation Courtyard by Marriott CTYD III Corporation Courtyard by Marriott Residence Inn by Marriott, LLC Santa Fe RI, Albuquerque RI
State: New York
Entity Name Assumed Name Courtyard Management Corporation Fishkill CbM Courtyard Management Corporation Midtown East Courtyard Courtyard Management Corporation Poughkeepsie CbM Courtyard Management Corporation Rochester CbM Courtyard Management Corporation Rye CbM Courtyard Management Corporation Syracuse CbM Courtyard Management Corporation Tarrytown CbM Fairfield FMC, LLC Lancaster FibM Fairfield FMC, LLC Syracuse FibM Marriott Hotel Services, Inc. LaGuardia Marriott Hotel Marriott Hotel Services, Inc. Long Island Marriott Hotel Marriott Hotel Services, Inc. New York Brooklyn Marriott Marriott Hotel Services, Inc. New York Marriott Downtown Marriott Hotel Services, Inc. Westchester Marriott Hotel Marriott International, Inc. LaGuardia Marriott Marriott International, Inc. Long Island Marriott Hotel and Conference Center Marriott International, Inc. Marriott’s Wind Watch Hotel and Golf Club Marriott International, Inc. New York Marriott East Side Marriott International, Inc. New York Marriott Financial Center Hotel Marriott International, Inc. New York Marriott Marquis Hotel Marriott International, Inc. Westchester Marriott Marriott Kauai Ownership Resorts, Inc. MVCI
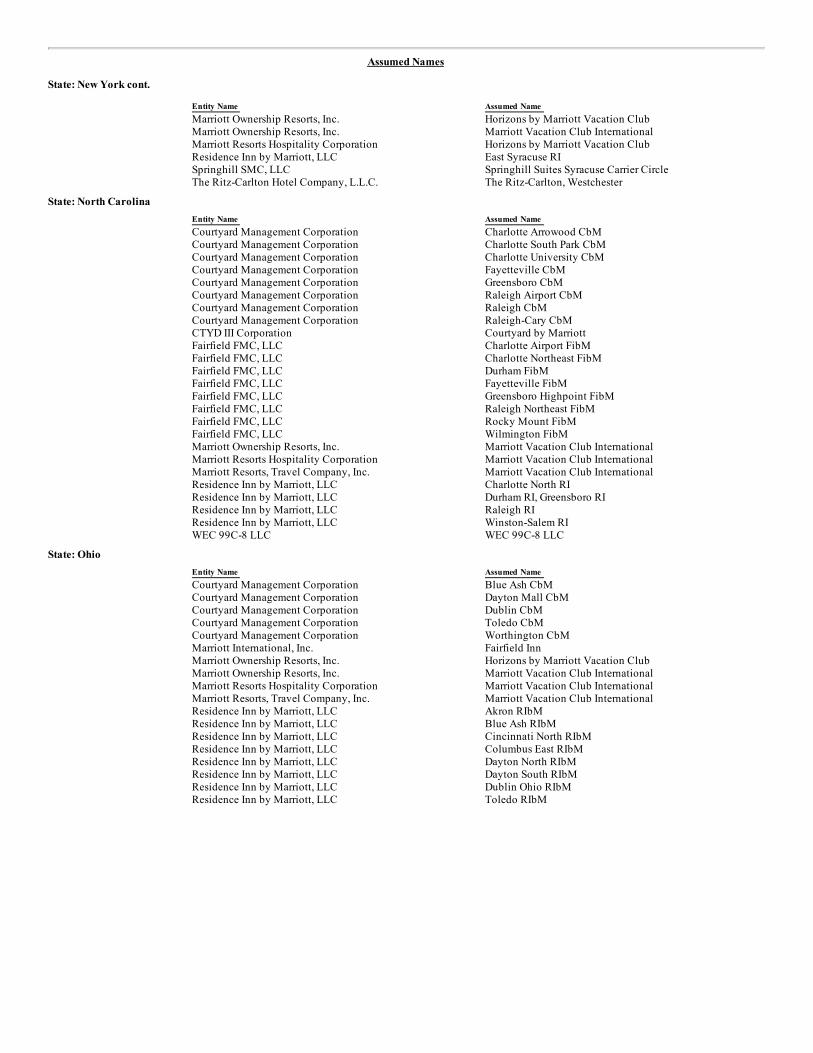
Assumed Names
State: New York cont. Entity Name Assumed Name
Marriott Ownership Resorts, Inc. Horizons by Marriott Vacation Club Marriott Ownership Resorts, Inc. Marriott Vacation Club International Marriott Resorts Hospitality Corporation Horizons by Marriott Vacation Club Residence Inn by Marriott, LLC East Syracuse RI Springhill SMC, LLC Springhill Suites Syracuse Carrier Circle The Ritz-Carlton Hotel Company, L.L.C. The Ritz-Carlton, Westchester
State: North Carolina
Entity Name Assumed Name Courtyard Management Corporation Charlotte Arrowood CbM Courtyard Management Corporation Charlotte South Park CbM Courtyard Management Corporation Charlotte University CbM Courtyard Management Corporation Fayetteville CbM Courtyard Management Corporation Greensboro CbM Courtyard Management Corporation Raleigh Airport CbM Courtyard Management Corporation Raleigh CbM Courtyard Management Corporation Raleigh-Cary CbM CTYD III Corporation Courtyard by Marriott Fairfield FMC, LLC Charlotte Airport FibM Fairfield FMC, LLC Charlotte Northeast FibM Fairfield FMC, LLC Durham FibM Fairfield FMC, LLC Fayetteville FibM Fairfield FMC, LLC Greensboro Highpoint FibM Fairfield FMC, LLC Raleigh Northeast FibM Fairfield FMC, LLC Rocky Mount FibM Fairfield FMC, LLC Wilmington FibM Marriott Ownership Resorts, Inc. Marriott Vacation Club International Marriott Resorts Hospitality Corporation Marriott Vacation Club International Marriott Resorts, Travel Company, Inc. Marriott Vacation Club International Residence Inn by Marriott, LLC Charlotte North RI Residence Inn by Marriott, LLC Durham RI, Greensboro RI Residence Inn by Marriott, LLC Raleigh RI Residence Inn by Marriott, LLC Winston-Salem RI WEC 99C-8 LLC WEC 99C-8 LLC
State: Ohio
Entity Name Assumed Name Courtyard Management Corporation Blue Ash CbM Courtyard Management Corporation Dayton Mall CbM Courtyard Management Corporation Dublin CbM Courtyard Management Corporation Toledo CbM Courtyard Management Corporation Worthington CbM Marriott International, Inc. Fairfield Inn Marriott Ownership Resorts, Inc. Horizons by Marriott Vacation Club Marriott Ownership Resorts, Inc. Marriott Vacation Club International Marriott Resorts Hospitality Corporation Marriott Vacation Club International Marriott Resorts, Travel Company, Inc. Marriott Vacation Club International Residence Inn by Marriott, LLC Akron RIbM Residence Inn by Marriott, LLC Blue Ash RIbM Residence Inn by Marriott, LLC Cincinnati North RIbM Residence Inn by Marriott, LLC Columbus East RIbM Residence Inn by Marriott, LLC Dayton North RIbM Residence Inn by Marriott, LLC Dayton South RIbM Residence Inn by Marriott, LLC Dublin Ohio RIbM Residence Inn by Marriott, LLC Toledo RIbM
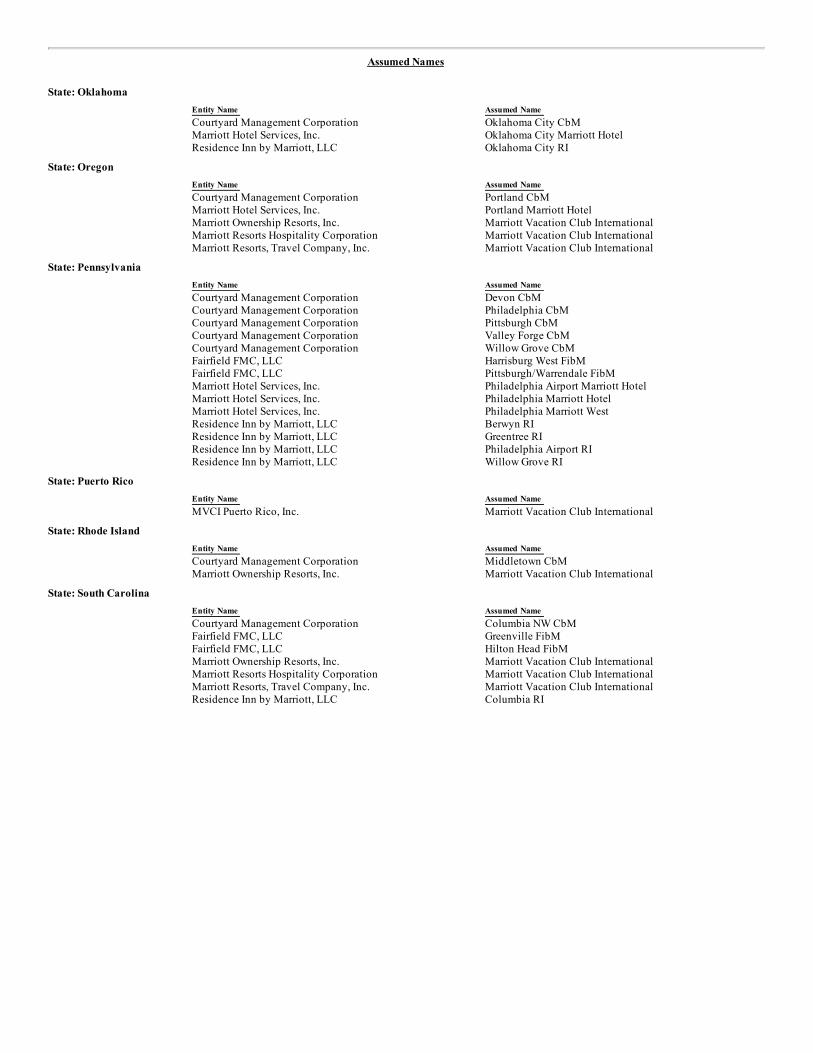
Assumed Names
State: Oklahoma
Entity Name Assumed Name Courtyard Management Corporation Oklahoma City CbM Marriott Hotel Services, Inc. Oklahoma City Marriott Hotel Residence Inn by Marriott, LLC Oklahoma City RI
State: Oregon
Entity Name Assumed Name Courtyard Management Corporation Portland CbM Marriott Hotel Services, Inc. Portland Marriott Hotel Marriott Ownership Resorts, Inc. Marriott Vacation Club International Marriott Resorts Hospitality Corporation Marriott Vacation Club International Marriott Resorts, Travel Company, Inc. Marriott Vacation Club International
State: Pennsylvania
Entity Name Assumed Name Courtyard Management Corporation Devon CbM Courtyard Management Corporation Philadelphia CbM Courtyard Management Corporation Pittsburgh CbM Courtyard Management Corporation Valley Forge CbM Courtyard Management Corporation Willow Grove CbM Fairfield FMC, LLC Harrisburg West FibM Fairfield FMC, LLC Pittsburgh/Warrendale FibM Marriott Hotel Services, Inc. Philadelphia Airport Marriott Hotel Marriott Hotel Services, Inc. Philadelphia Marriott Hotel Marriott Hotel Services, Inc. Philadelphia Marriott West Residence Inn by Marriott, LLC Berwyn RI Residence Inn by Marriott, LLC Greentree RI Residence Inn by Marriott, LLC Philadelphia Airport RI Residence Inn by Marriott, LLC Willow Grove RI
State: Puerto Rico
Entity Name Assumed Name MVCI Puerto Rico, Inc. Marriott Vacation Club International
State: Rhode Island
Entity Name Assumed Name Courtyard Management Corporation Middletown CbM Marriott Ownership Resorts, Inc. Marriott Vacation Club International
State: South Carolina
Entity Name Assumed Name Courtyard Management Corporation Columbia NW CbM Fairfield FMC, LLC Greenville FibM Fairfield FMC, LLC Hilton Head FibM Marriott Ownership Resorts, Inc. Marriott Vacation Club International Marriott Resorts Hospitality Corporation Marriott Vacation Club International Marriott Resorts, Travel Company, Inc. Marriott Vacation Club International Residence Inn by Marriott, LLC Columbia RI
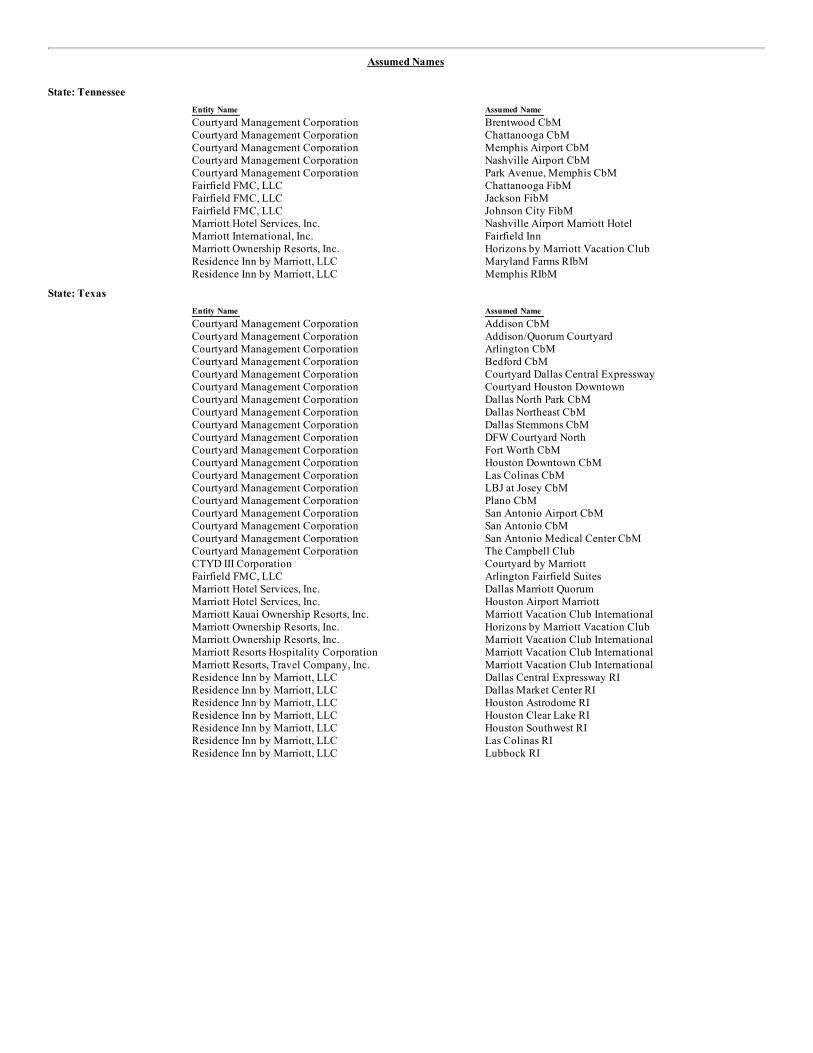
Assumed Names
State: Tennessee
Entity Name Assumed Name Courtyard Management Corporation Brentwood CbM Courtyard Management Corporation Chattanooga CbM Courtyard Management Corporation Memphis Airport CbM Courtyard Management Corporation Nashville Airport CbM Courtyard Management Corporation Park Avenue, Memphis CbM Fairfield FMC, LLC Chattanooga FibM Fairfield FMC, LLC Jackson FibM Fairfield FMC, LLC Johnson City FibM Marriott Hotel Services, Inc. Nashville Airport Marriott Hotel Marriott International, Inc. Fairfield Inn Marriott Ownership Resorts, Inc. Horizons by Marriott Vacation Club Residence Inn by Marriott, LLC Maryland Farms RIbM Residence Inn by Marriott, LLC Memphis RIbM
State: Texas
Entity Name Assumed Name Courtyard Management Corporation Addison CbM Courtyard Management Corporation Addison/Quorum Courtyard Courtyard Management Corporation Arlington CbM Courtyard Management Corporation Bedford CbM Courtyard Management Corporation Courtyard Dallas Central Expressway Courtyard Management Corporation Courtyard Houston Downtown Courtyard Management Corporation Dallas North Park CbM Courtyard Management Corporation Dallas Northeast CbM Courtyard Management Corporation Dallas Stemmons CbM Courtyard Management Corporation DFW Courtyard North Courtyard Management Corporation Fort Worth CbM Courtyard Management Corporation Houston Downtown CbM Courtyard Management Corporation Las Colinas CbM Courtyard Management Corporation LBJ at Josey CbM Courtyard Management Corporation Plano CbM Courtyard Management Corporation San Antonio Airport CbM Courtyard Management Corporation San Antonio CbM Courtyard Management Corporation San Antonio Medical Center CbM Courtyard Management Corporation The Campbell Club CTYD III Corporation Courtyard by Marriott Fairfield FMC, LLC Arlington Fairfield Suites Marriott Hotel Services, Inc. Dallas Marriott Quorum Marriott Hotel Services, Inc. Houston Airport Marriott Marriott Kauai Ownership Resorts, Inc. Marriott Vacation Club International Marriott Ownership Resorts, Inc. Horizons by Marriott Vacation Club Marriott Ownership Resorts, Inc. Marriott Vacation Club International Marriott Resorts Hospitality Corporation Marriott Vacation Club International Marriott Resorts, Travel Company, Inc. Marriott Vacation Club International Residence Inn by Marriott, LLC Dallas Central Expressway RI Residence Inn by Marriott, LLC Dallas Market Center RI Residence Inn by Marriott, LLC Houston Astrodome RI Residence Inn by Marriott, LLC Houston Clear Lake RI Residence Inn by Marriott, LLC Houston Southwest RI Residence Inn by Marriott, LLC Las Colinas RI Residence Inn by Marriott, LLC Lubbock RI
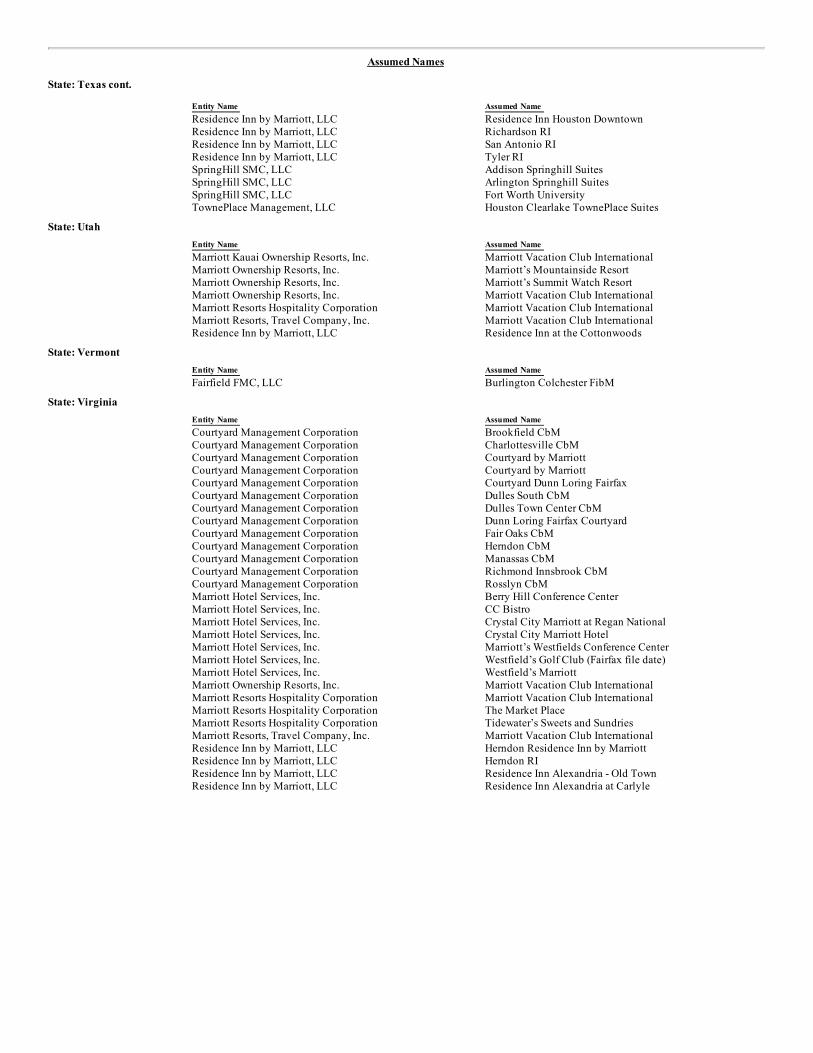
Assumed Names
State: Texas cont. Entity Name Assumed Name
Residence Inn by Marriott, LLC Residence Inn Houston Downtown Residence Inn by Marriott, LLC Richardson RI Residence Inn by Marriott, LLC San Antonio RI Residence Inn by Marriott, LLC Tyler RI SpringHill SMC, LLC Addison Springhill Suites SpringHill SMC, LLC Arlington Springhill Suites SpringHill SMC, LLC Fort Worth University TownePlace Management, LLC Houston Clearlake TownePlace Suites
State: Utah
Entity Name Assumed Name Marriott Kauai Ownership Resorts, Inc. Marriott Vacation Club International Marriott Ownership Resorts, Inc. Marriott’s Mountainside Resort Marriott Ownership Resorts, Inc. Marriott’s Summit Watch Resort Marriott Ownership Resorts, Inc. Marriott Vacation Club International Marriott Resorts Hospitality Corporation Marriott Vacation Club International Marriott Resorts, Travel Company, Inc. Marriott Vacation Club International Residence Inn by Marriott, LLC Residence Inn at the Cottonwoods
State: Vermont
Entity Name Assumed Name Fairfield FMC, LLC Burlington Colchester FibM
State: Virginia
Entity Name Assumed Name Courtyard Management Corporation Brookfield CbM Courtyard Management Corporation Charlottesville CbM Courtyard Management Corporation Courtyard by Marriott Courtyard Management Corporation Courtyard by Marriott Courtyard Management Corporation Courtyard Dunn Loring Fairfax Courtyard Management Corporation Dulles South CbM Courtyard Management Corporation Dulles Town Center CbM Courtyard Management Corporation Dunn Loring Fairfax Courtyard Courtyard Management Corporation Fair Oaks CbM Courtyard Management Corporation Herndon CbM Courtyard Management Corporation Manassas CbM Courtyard Management Corporation Richmond Innsbrook CbM Courtyard Management Corporation Rosslyn CbM Marriott Hotel Services, Inc. Berry Hill Conference Center Marriott Hotel Services, Inc. CC Bistro Marriott Hotel Services, Inc. Crystal City Marriott at Regan National Marriott Hotel Services, Inc. Crystal City Marriott Hotel Marriott Hotel Services, Inc. Marriott’s Westfields Conference Center Marriott Hotel Services, Inc. Westfield’s Golf Club (Fairfax file date) Marriott Hotel Services, Inc. Westfield’s Marriott Marriott Ownership Resorts, Inc. Marriott Vacation Club International Marriott Resorts Hospitality Corporation Marriott Vacation Club International Marriott Resorts Hospitality Corporation The Market Place Marriott Resorts Hospitality Corporation Tidewater’s Sweets and Sundries Marriott Resorts, Travel Company, Inc. Marriott Vacation Club International Residence Inn by Marriott, LLC Herndon Residence Inn by Marriott Residence Inn by Marriott, LLC Herndon RI Residence Inn by Marriott, LLC Residence Inn Alexandria - Old Town Residence Inn by Marriott, LLC Residence Inn Alexandria at Carlyle
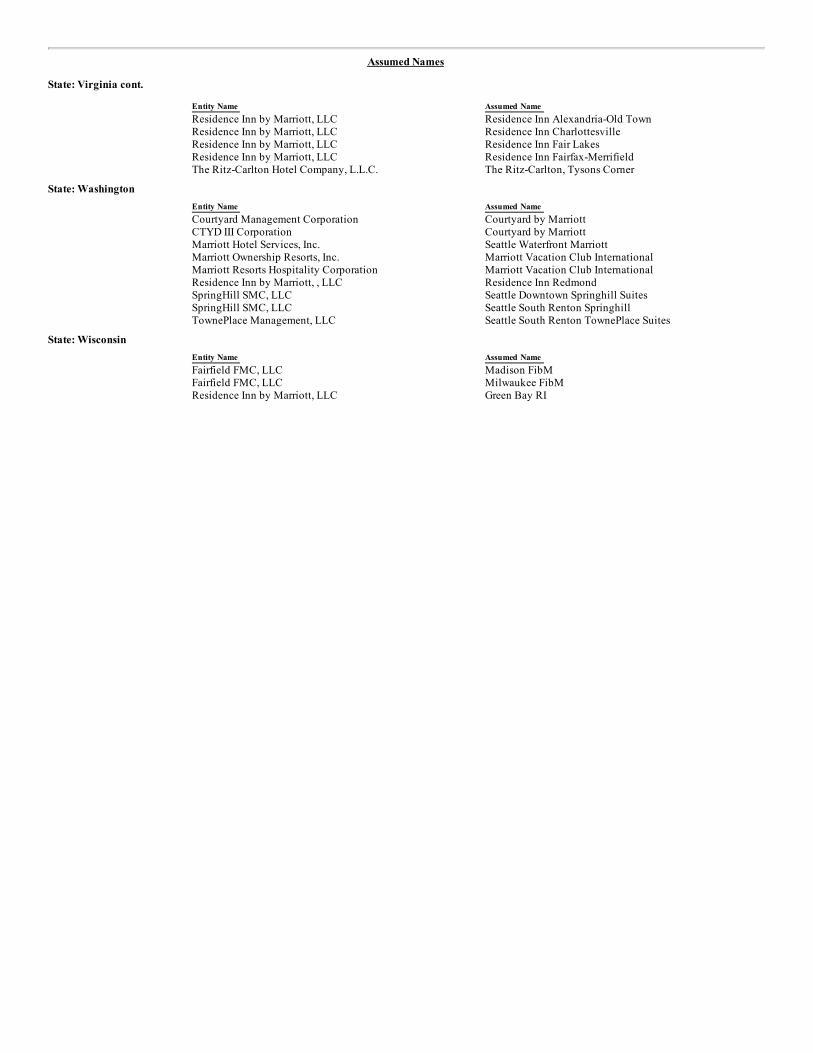
Assumed Names
State: Virginia cont. Entity Name Assumed Name
Residence Inn by Marriott, LLC Residence Inn Alexandria-Old Town Residence Inn by Marriott, LLC Residence Inn Charlottesville Residence Inn by Marriott, LLC Residence Inn Fair Lakes Residence Inn by Marriott, LLC Residence Inn Fairfax-Merrifield The Ritz-Carlton Hotel Company, L.L.C. The Ritz-Carlton, Tysons Corner
State: Washington
Entity Name Assumed Name Courtyard Management Corporation Courtyard by Marriott CTYD III Corporation Courtyard by Marriott Marriott Hotel Services, Inc. Seattle Waterfront Marriott Marriott Ownership Resorts, Inc. Marriott Vacation Club International Marriott Resorts Hospitality Corporation Marriott Vacation Club International Residence Inn by Marriott, , LLC Residence Inn Redmond SpringHill SMC, LLC Seattle Downtown Springhill Suites SpringHill SMC, LLC Seattle South Renton Springhill TownePlace Management, LLC Seattle South Renton TownePlace Suites
State: Wisconsin
Entity Name Assumed Name Fairfield FMC, LLC Madison FibM Fairfield FMC, LLC Milwaukee FibM Residence Inn by Marriott, LLC Green Bay RI
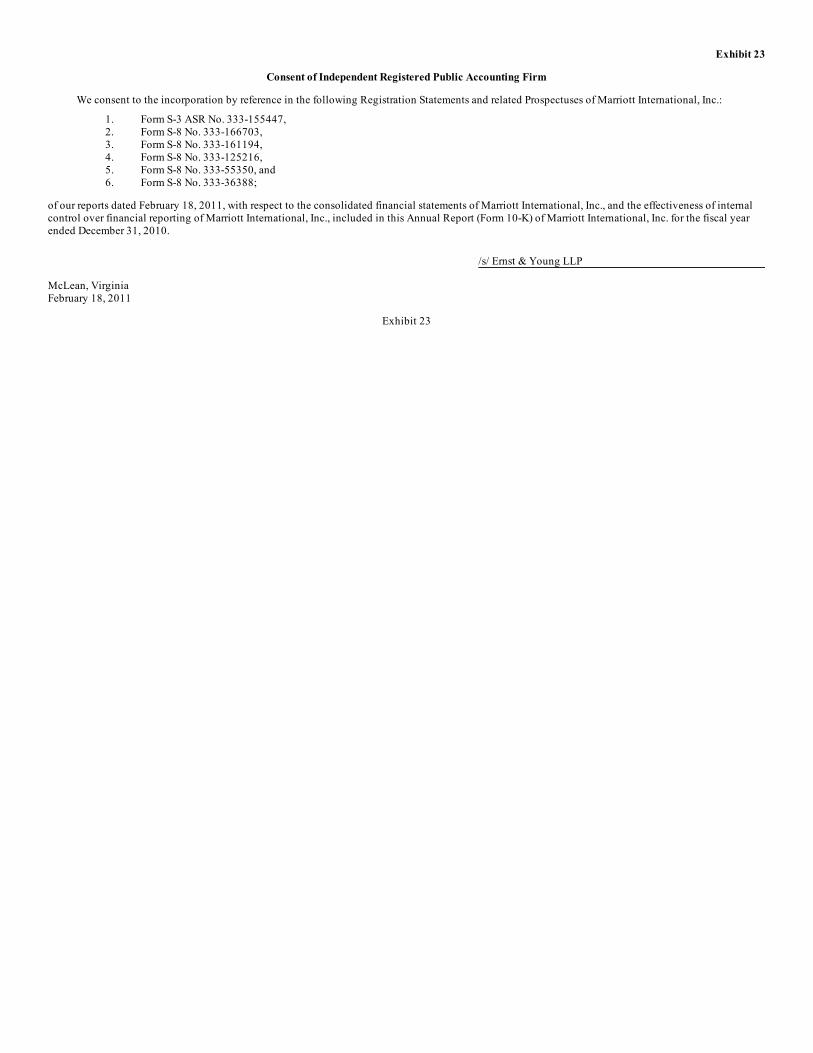
Exhibit 23
Consent of Independent Registered Public Accounting Firm
We consent to the incorporation by reference in the following Registration Statements and related Prospectuses of Marriott International, Inc.:
1. Form S-3 ASR No. 333-155447, 2. Form S-8 No. 333-166703, 3. Form S-8 No. 333-161194, 4. Form S-8 No. 333-125216, 5. Form S-8 No. 333-55350, and 6. Form S-8 No. 333-36388;
of our reports dated February 18, 2011, with respect to the consolidated financial statements of Marriott International, Inc., and the effectiveness of internalcontrol over financial reporting of Marriott International, Inc., included in this Annual Report (Form 10-K) of Marriott International, Inc. for the fiscal yearended December 31, 2010.
/s/ Ernst & Young LLP
McLean, VirginiaFebruary 18, 2011
Exhibit 23
Exhibit 31.1
Certification of Chief Executive OfficerPursuant to Rule 13a–14(a)
I, J.W. Marriott, Jr., certify that:
1. I have reviewed this annual report on Form 10-K of Marriott International, Inc.;
2. Based on my knowledge, this report does not contain any untrue statement of a material fact or omit to state a material fact necessary to make thestatements made, in light of the circumstances under which such statements were made, not misleading with respect to the period covered by thisreport;
3. Based on my knowledge, the financial statements, and other financial information included in this report, fairly present in all material respects thefinancial condition, results of operations and cash flows of the registrant as of, and for, the periods presented in this report;
4. The registrant’s other certifying officer and I are responsible for establishing and maintaining disclosure controls and procedures (as defined inExchange Act Rules 13a-15(e) and 15d-15(e)) and internal control over financial reporting (as defined in Exchange Act Rules 13a-15(f) and 15d-15(f))for the registrant and have:
a) Designed such disclosure controls and procedures, or caused such disclosure controls and procedures to be designed under our supervision, to
ensure that material information relating to the registrant, including its consolidated subsidiaries, is made known to us by others within thoseentities, particularly during the period in which this report is being prepared;
b) Designed such internal control over financial reporting, or caused such internal control over financial reporting to be designed under our
supervision, to provide reasonable assurance regarding the reliability of financial reporting and the preparation of financial statements forexternal purposes in accordance with generally accepted accounting principles;
c) Evaluated the effectiveness of the registrant’s disclosure controls and procedures and presented in this report our conclusions about theeffectiveness of the disclosure controls and procedures as of the end of the period covered by this report based on such evaluation; and
d) Disclosed in this report any change in the registrant’s internal control over financial reporting that occurred during the registrant’s most recent
fiscal quarter (the registrant’s fourth fiscal quarter in the case of an annual report) that has materially affected, or is reasonably likely to materiallyaffect, the registrant’s internal control over financial reporting; and
5. The registrant’s other certifying officer and I have disclosed, based on our most recent evaluation of internal control over financial reporting, to theregistrant’s auditors and the audit committee of the registrant’s board of directors (or persons performing the equivalent functions):
a) All significant deficiencies and material weaknesses in the design or operation of internal control over financial reporting, which are reasonablylikely to adversely affect the registrant’s ability to record, process, summarize and report financial information; and
b) Any fraud, whether or not material, that involves management or other employees who have a significant role in the registrant’s internal controlover financial reporting.
February 18, 2011
/s/ J.W. Marriott, Jr.J.W. Marriott, Jr.Chairman of the Board and Chief Executive Officer(Principal Executive Officer)
Exhibit 31.1
Exhibit 31.2
Certification of Chief Financial OfficerPursuant to Rule 13a–14(a)
I, Carl T. Berquist, certify that:
1. I have reviewed this annual report on Form 10-K of Marriott International, Inc.;
2. Based on my knowledge, this report does not contain any untrue statement of a material fact or omit to state a material fact necessary to make thestatements made, in light of the circumstances under which such statements were made, not misleading with respect to the period covered by thisreport;
3. Based on my knowledge, the financial statements, and other financial information included in this report, fairly present in all material respects thefinancial condition, results of operations and cash flows of the registrant as of, and for, the periods presented in this report;
4. The registrant’s other certifying officer and I are responsible for establishing and maintaining disclosure controls and procedures (as defined inExchange Act Rules 13a-15(e) and 15d-15(e)) and internal control over financial reporting (as defined in Exchange Act Rules 13a-15(f) and 15d-15(f))for the registrant and have:
a) Designed such disclosure controls and procedures, or caused such disclosure controls and procedures to be designed under our supervision, to
ensure that material information relating to the registrant, including its consolidated subsidiaries is made known to us by others within thoseentities, particularly during the period in which this report is being prepared;
b) Designed such internal control over financial reporting, or caused such internal control over financial reporting to be designed under our
supervision, to provide reasonable assurance regarding the reliability of financial reporting and the preparation of financial statements forexternal purposes in accordance with generally accepted accounting principles;
c) Evaluated the effectiveness of the registrant’s disclosure controls and procedures and presented in this report our conclusions about theeffectiveness of the disclosure controls and procedures as of the end of the period covered by this report based on such evaluation; and
d) Disclosed in this report any change in the registrant’s internal control over financial reporting that occurred during the registrant’s most recent
fiscal quarter (the registrant’s fourth fiscal quarter in the case of an annual report) that has materially affected, or is reasonably likely to materiallyaffect, the registrant’s internal control over financial reporting; and
5. The registrant’s other certifying officer and I have disclosed, based on our most recent evaluation of internal control over financial reporting, to theregistrant’s auditors and the audit committee of the registrant’s board of directors (or persons performing the equivalent functions):
a) All significant deficiencies and material weaknesses in the design or operation of internal control over financial reporting, which are reasonablylikely to adversely affect the registrant’s ability to record, process, summarize and report financial information; and
b) Any fraud, whether or not material, that involves management or other employees who have a significant role in the registrant’s internal controlover financial reporting.
February 18, 2011
/s/ Carl T. BerquistCarl T. BerquistExecutive Vice President andChief Financial Officer(Principal Financial Officer)
Exhibit 31.2
Exhibit 32
CertificationPursuant to Rule 13a–14(b) and Section 906 of the Sarbanes-Oxley Act of 2002
(18 U.S.C. Section 1350 (a) and (b))
I, J.W. Marriott, Jr., Chairman of the Board and Chief Executive Officer of Marriott International, Inc. (the “Company”) certify that:
(1) the annual report on Form 10-K of the Company for the year ended December 31, 2010 (the “Annual Report”) fully complies with therequirements of section 13(a) or 15(d) of the Securities Exchange Act of 1934 (15 U.S.C. 78m or 78o(d)); and
(2) the information contained in the Annual Report fairly presents, in all material respects, the financial condition and results of operations of theCompany.
February 18, 2011
/s/ J.W. Marriott, Jr.J.W. Marriott, Jr.Chairman of the Boardand Chief Executive Officer(Principal Executive Officer)
I, Carl T. Berquist, Executive Vice President and Chief Financial Officer of Marriott International, Inc. (the “Company”) certify that:
(1) the annual report on Form 10-K of the Company for the year ended December 31, 2010 (the “Annual Report”) fully complies with therequirements of section 13(a) or 15(d) of the Securities Exchange Act of 1934 (15 U.S.C. 78m or 78o(d)); and
(2) the information contained in the Annual Report fairly presents, in all material respects, the financial condition and results of operations of theCompany.
February 18, 2011/s/ Carl T. BerquistCarl T. BerquistExecutive Vice President andChief Financial Officer(Principal Financial Officer)
Exhibit 32
