marine radioactivity assessment of mururoa and fangataufa atolls
TRANSCRIPT

Ž .The Science of the Total Environment 237r238 1999 249]267
Marine radioactivity assessment of Mururoa andFangataufa atolls
Pavel P. Povineca,U, Dennis Woodheadb, Paul Blowersb, RachelBonfieldb, Malcolm Cooperc, Quingjiang Chend, Henning Dahlgaardd,Constantin Dovletea, Vanessa Foxi, Klaus Froehliche, Janine Gastauda,
Manfred Groninge, Terry Hamiltonf, Yoshihiro Ikeuchia, Gunther¨ ¨Kanisch g, Alois Kruger g, Laval Liong Wee Kwonga, Murray Matthewsh,¨Uwe Morgensterni, Sandor Mulsowa, Hakan Petterssona, Paul Smedleyb,˚
Ben Taylorb, Claude Taylor i, Rick Tinker h
aMarine En¨ironment Laboratory, International Atomic Energy Agency, 4 Quai Antoine 1er, MC 98000, MonacobCEFAS Lowestoft Laboratory, Pakefield Road Lowestoft, Suffolk NR33 OHT, UK
cAustralian Radiation Laboratory, Lower Plenty Road, Yallambie, VIC, AustraliadHealth Physics Department, Riso National Laboratory, P.O. Box 49, DK-4000 Roskilde, Denmark
eIsotope Hydrology Section, International Atomic Energy Agency, Wagramerstrasse 5, A-1400 Vienna, AustriafHealth and Ecological Assessment Di ision, Lawrence Li ermore National Laboratory, Uni ersity of California,
7000 East A¨enue, Li ermore, CA 94551-9900, USAg Federal Fisheries Research Centre, Institute of Fisheries Ecology, Wustland 2, D-22589, Hamburg, Germany¨
hNational Radiation Laboratory, 108 Victoria Street, Christchurch, New ZealandiInstitute of Geological and Nuclear Sciences, 30 Gracefield Road, Lower Hutt, New Zealand
Abstract
Ž .The International Atomic Energy Agency IAEA carried out an international project ‘The Study of theRadiological Situation at the Atolls of Mururoa and Fangataufa’ with the aim of assessing the present and futureradiological situation at the atolls and making recommendations for either monitoring or remedial actions if they aredeemed necessary. The paper concentrates on marine radioactivity aspects and gives an estimation of presentradionuclide concentrations in water, sediment and biota of the Mururoa and Fangataufa lagoons and the
Žsurrounding ocean. The dominant radionuclide in both lagoons is Pu in sediments the total inventory is approxi-.mately 30 TBq . A decline in radionuclide concentrations has been observed in recent years in lagoon water, with the
U Corresponding author. Tel.: q377-97-97-72-72; fax: q377-97-97-72-73.Ž .E-mail address: [email protected] P.P. Povinec
0048-9697r99r$ - see front matter Q 1999 Elsevier Science Ireland Ltd. All rights reserved.Ž .PII: S 0 0 4 8 - 9 6 9 7 9 9 0 0 1 4 0 - 0

( )P.P. Po¨inec et al. r The Science of the Total En¨ironment 237r238 1999 249]267250
exception of 3H and 90Sr, for which a contribution from underground sources is to be expected. Radionuclideconcentrations in biota from the lagoons and the surrounding ocean are low and consistent with previousmeasurements. The observed radionuclide concentrations in both lagoons imply that no radiological risk exists forhypothetical inhabitants of Mururoa and Fangataufa Atolls. Q 1999 Elsevier Science Ireland Ltd. All rightsreserved.
Keywords: Marine radioactivity; Radionuclides; Atoll; Nuclear sites; Nuclear weapons
1. Introduction
In recent years there has been high politicaland scientific interest in the radiological conse-quences of the French nuclear weapons tests car-ried out in French Polynesia in the South PacificOcean. At the request of the French Govern-ment, during 1996]1998 the International Atomic
Ž .Energy Agency IAEA carried out an internatio-nal project ‘The Study of the Radiological Situa-tion at the Atolls of Mururoa and Fangataufa’,with the aim of assessing the present and futureradiological situation at the atolls and makingrecommendations for either further monitoring,or remedial actions if they become necessaryŽ .IAEA, 1998a .
Mururoa and Fangataufa Atolls are situated at21850X S, 138854X W and 22814X S, 138845X Wrespectively, in French Polynesia in the SouthPacific Ocean, approximately halfway between
Ž .Australia and South America Fig. 1 . Franceconducted a total of 193 nuclear weapon experi-
Žments there 178 nuclear bomb tests and 15 Pu.safety trials above and beneath the atolls. Forty-
one atmospheric nuclear weapons tests were car-ried out between July 1966 and September 1974,and 137 underground tests between June 1975and January 1996, when testing was finally termi-nated. The total yield of atmospheric nuclearbomb tests and safety trials was estimated to be10 Mt TNT equivalent. The yield of underground
Ž .tests was smaller none exceeded 150 kt , in totalŽ .3.2 Mt TNT equivalent IAEA, 1998a .
The organisational basis for the Study consistedof an International Advisory Committee, two task
Žgroups, five working groups Terrestrial environ-ment, Marine environment, Source term, Geo-
.sphere modelling and Marine modelling , theIAEA Secretariat and a Liaison Office set up bythe French Government. The sampling expedi-tions to Mururoa and Fangataufa Atolls wereconducted in 1996 for terrestrial and marine sam-pling and in 1997 for underground sampling.
Fig. 1. The South Pacific Ocean.

( )P.P. Po¨inec et al. r The Science of the Total En¨ironment 237r238 1999 249]267 251
This paper concentrates on the marine radioac-tivity aspects of the study. Separate papers inthese proceedings deal with underwater in-situ
Ž .gamma-spectrometry Osvath et al., 1999 , under-Ž .ground sampling Mulsow et al., 1999 and marine
Ž .modelling Mittelstaedt et al., 1999 . Other as-pects of the Study can be found in the IAEA
Ž .Report IAEA, 1998a .
2. Marine sampling and laboratory analysis
The objective of the marine sampling was toconduct sufficient new independent monitoring atand around the atolls to evaluate the existingFrench data and provide representative and highquality data for radiological assessment purposes.This work included measurements of the currentradionuclide concentrations in the marine envi-ronment and estimation of concentration factorsand distributions coefficients appropriate for theregion.
The main sampling expedition to Mururoa andFangataufa Atolls was organised from 1 to 27July, 1996 to collect relevant and comparablesamples of water, biota and sediment from thelagoons of the atolls, as well as from the sur-rounding ocean. The results obtained, combined
Žwith earlier IAEA intercomparison data Bal-.lestra et al., 1995 are used for the validation of
the far more numerous data from the FrenchŽmonitoring and surveillance programme CEA,
.1996a,b .The sampling sites and the number of samples
to be collected were chosen with the view ofkeeping the IAEA study as independent as possi-ble and, at the same time, keeping the number ofsites and samples to a minimum so that theinvestigations could be completed in a short timewithin the approved budget. For a better geo-graphical orientation, the sampling sites showingthe types of samples collected are depicted inFigs. 2 and 3.
Five researchers from Member State laborato-Žries Australian Radiation Laboratory, Australia;
Riso National Laboratory, Denmark; The Centre¨for Environment, Fisheries & Aquaculture Sci-
Ž .ence ex MAFF , UK; Lawrence Livermore Na-
.tional Laboratory, USA and four from IAEA-MEL participated in the expedition to Mururoa
Ž .and Fangataufa Atolls the IAEA team . Duringthe four weeks of the expedition, the IAEA teamoperated in parallel on five vessels simultane-ously. The pre-treatment of samples was carriedout by the IAEA team in four independentlymanaged laboratories at Mururoa.
In total 33 water samples were pre-treated inlaboratories at Mururoa in order to reduce thevolume by approximately a factor of 20. Fifty-two
Žbiota samples were collected fish, shellfish,.plankton, algae in the open ocean and Mururoa
and Fangataufa lagoons. Forty sediment corescollected during the expedition were split intoslices and ten grab samples were analysed as bulksamples.
Because the total number of samples for analy-sis was over 300 and the time available very shortand reflecting the need to keep the project trans-parent and international, a network of marinelaboratories was needed to carry out the analyti-cal work. Six internationally renowned laborato-ries providing high quality data and being geo-graphically representative of Member StatesŽAustralia, Denmark, Germany, New Zealand, UK
.and USA together with IAEA-MEL were chosento carry out the complex analyses of the samples.
ŽFurther, two laboratories New Zealand and. 3IAEA analysed water samples for H. All the
results obtained by the marine network laborato-ries as well as the description of analytical tech-niques used for analysis of water, biota and sedi-ment are described in detail in the IAEA Techni-
Ž .cal Report IAEA, 1998b .
3. Results of the survey
3.1. Mururoa lagoon
3.1.1. WaterThe tritium concentrations in surface and bot-
tom water of Mururoa lagoon show that bottomconcentrations are higher, generally by 10]50%but at Exocet by a factor of 6. Higher bottomconcentrations are also confirmed by a higher
Ž y1 .tritium content of 0.7]2.2 Bq kg of water in

( )P.P. Po¨inec et al. r The Science of the Total En¨ironment 237r238 1999 249]267252
Fig
.2.
Sam
plin
gsi
tes
onM
urur
oaA
toll.

( )P.P. Po¨inec et al. r The Science of the Total En¨ironment 237r238 1999 249]267 253
Fig. 3. Sampling sites on Fangataufa Atoll.
pore water extracted from sediment close to theŽtest shafts Orque, Krill and Flet sites Nos. 31, 32
. 3and 33 . The spatial distribution of the surface Hconcentration in the lagoon shows that the west
Ž .side of the lagoon west of Flet, Fig. 2 is moreinfluenced by ocean water than the east side,where the 3H concentration is higher by a factorof 4. This is consistent with the known water
Ž .circulation pattern in the lagoon IAEA, 1998a .The average tritium concentration measured in
the lagoon was 360"50 mBq ly1, approximatelya factor of three higher than in the open ocean.The fact that, on average, the values in 1996 are
Ž .lower than those reported in 1993 CEA, 1996amay reflect insignificant inputs from the mostrecent test series, a decreasing source-term fromthe earlier underground tests, andror possiblythe fact that sampling took place after stormconditions.
The strontium-90 concentrations found in the

( )P.P. Po¨inec et al. r The Science of the Total En¨ironment 237r238 1999 249]267254
lagoon are higher by approximately a factor oftwo than those found in ocean surface water. Atsome sites, the concentrations at the bottom areclearly higher than those at the surface, but thedifference is not as significant as in the case of3H.
The distribution of caesium-137 concentrationsin surface and bottom waters are generally veryhomogeneous, i.e. showing no significant differ-ence in concentration between sites and betweenwater horizons, and they compare well with con-centrations found in the surrounding ocean sur-face water. The 137Csr 90 Sr activity ratios in sur-face and bottom water, are generally lower thanthose found in ocean surface water, the latterbeing close to that expected from global falloutdelivery, approximately 1.6. This finding may indi-cate a significant supply of 90 Sr from the atollseabed.
The distributions of plutonium isotopes in fil-tered water and particulates were studied at foursites within the atoll. The 239,240 Pu particulatefraction ranges between 0.7 and 4.3% in surfacewater and 1.0]3.3% in bottom water. The con-centrations in filtered water are in the rangesbetween 0.03 and 0.37 mBq ly1 to 0.30]0.48 mBqly1 for surface and bottom water respectively, i.e.a more than 10-fold difference in surface waterconcentrations whereas the bottom concentra-tions show moderate variation. Both surface andbottom water concentrations are between oneand two orders of magnitude higher than oceansurface water concentrations. The 238 Pur 239,240 Puactivity ratios, are 0.21 and 0.19 for surface andbottom waters respectively, slightly higher thanthe ocean surface water activity ratio 0.16. Theseresults clearly indicate a solubilization and re-lease of Pu isotopes from Mururoa Atoll.
For americium-241 the ratios of particulate tosoluble fraction are between 1.2]3.1 and 0.9]2.7in surface and bottom waters respectively, i.e. theparticulate Am fraction predominates. Althoughthe particulate Am concentrations are compara-ble to, or are at least of the same order ofmagnitude as the particulate 239,240 Pu concentra-tions, the total Am in water only constitutes 1]8%of the total 239,240 Pu in water.
3.1.2. SedimentAll sediment samples were of calcium carbo-
nate sand originating from coral rock. The typicalparticle size distribution of surface sediment sam-ples has a maximum at 150 mm. The deeperlayers contain larger particles, even stones ofcentimeter scale. A comparison of radionuclide
Ž60 137 155 238 239,240concentrations Co, Cs, Eu, Pu, Pu241 .and Am in box core sediment taken from
Dindon zone sampling Site 1 is shown in Fig. 4.As in other sediment samples taken throughoutMururoa lagoon, the dominant activity is due to239,240 Pu. Fig. 5 shows that the highest 239,240 Pulevels were measured in Colette bank sediments.Deep core samples taken by a Kullenberg corershow the highest 239,240 Pu levels in Dindon zone
Ž . ŽSite 1 zero point Sirius going down to 2 m Fig.. 239,240 Ž6 . Pu surface concentrations mean value
. y1from 0]10 cm range from 30 to 167 Bq kg ,Žexcluding those sites close to the coral rim De-
.nise and Francoise and Site 1 located near Din-don coral rim. In all cases, Pu is rather well mixedto depth.
Cumulative inventories of 239,240 Pu in Mururoalagoon sediments show that at almost all sitessaturated values were not reached. The total239,240 ŽPu inventories surface to the deepest part
.of each sediment core show values ranging from4.3 to 70.8 kBq my2 for the central part of thelagoon. The highest values are located towards
ŽColette, Denise and Dindon hotspots 530]y2 .115 000 kBq m . Considering that in most of
the sampled sites, sediment penetration was lessthan 15 cm, the inventories presented here areunderestimates of the total inventories of 239,240 Pu
Ž .for Mururoa. In only one case Site 24 , did the239,240 Pu profile show decreasing values withdepth.
210 Pb measurements in sediment cores werecarried out to estimate sedimentation rates. 210 Pband 226Ra were measured by a- and g-spectrome-try on sections of selected sediment cores fromMururoa and Fangataufa Atolls. The 210 Pb pro-files show heavy mixing of surface sediments asexpected. The sedimentation rate calculated usingthe 210 Pb method for sediment depths below 10
Ž .cm is 2 mm per year Site 12 .

( )P.P. Po¨inec et al. r The Science of the Total En¨ironment 237r238 1999 249]267 255
Ž .Fig. 4. Radionuclide concentrations in sediment from Mururoa Atoll, Site 1 Crabe .
Fig. 5. 239,240 Pu concentrations in some Mururoa lagoon surface sediments.

( )P.P. Po¨inec et al. r The Science of the Total En¨ironment 237r238 1999 249]267256
Ž .Fig. 6. Radionuclide profiles in Mururoa lagoon sediment, Site 1 Crabe .
3.1.3. Hot particles in Colette sedimentsHot particle analysis was confined to the sedi-
ment samples collected from the Colette sand-bank. To obtain hot particles from the coral sand,it was digested in 1M HCl and the resultingresidue filtered off using a 50-mm diameter and a0.45-mm membrane filter. A scan of samples on afilter paper with a thin window GM counter indi-
Žcated the presence of significant a-activity 2]220.counts per s , and this information was used to
Ž .determine an initial exposure 1]5 min for theassay of the hot particles by CR39 plastic sheetŽ .polyallyl diglycol carbonate detectors. The trackconcentrations from individual hot particles, asrecorded on the plastic sheet, were captured witha combined microscope-image analysis system andthe digitised image stored on hard disc. A gratic-ule image was similarly stored to provide a cali-bration scale. The actual dimensions of the rect-angular field captured in the image were 1.05=
Ž .0.78 mm. The hard copy image Fig. 7 used toassess the activity and size of the individual active
Žparticles was 229=171 mm an overall linear.magnification of 218= .
The total particulate activities in the two sam-
ple aliquots might be in the ranges 210]280 Bqand 2400]3200 Bq corresponding to concentra-
Ž .tions in the raw sediment samples of 1.8]2.5 =5 Ž . 5 y110 and 7.2]9.6 =10 Bq kg respectively.
These estimates may be compared with the activ-ity concentrations of 6.4=105 and 5.9=105 Bqkgy1 estimated on the basis of radiochemicalseparation. Given the evident inhomogeneity ofthe particle activities, the fact that longer expo-sure periods would probably have revealed loweractivity hot particles and the uncertainties in theestimation of the activities in the hot particles bythe track etch method, this level of agreementmay be considered satisfactory.
Spherical particles of pure plutonium with ac-tivities of 10 and 500 Bq would have diameters of8 mm and 29 mm, respectively. The apparent sizesŽ .radius from approx. 10 to 100 mm and estimated
Ž .activities from approx. 1 to 500 Bq of the inves-tigated hot particles indicate that these particlesare not pure plutonium; it is considered morelikely that the plutonium has been inhomoge-niously mixed with an inactive matrix and that thecarrier particle has a larger size.
Overall, it may be concluded that the sediment

( )P.P. Po¨inec et al. r The Science of the Total En¨ironment 237r238 1999 249]267 257
Ž .Fig. 7. Hot particles three centres of activity with 15]25 mm particles in the radius , radius of the spot ;100 mm, activity ;150Ž .Bq sample 204302-F . Scale bar 100 mm.
on the Colette sandbank contains up to 104 hotparticles kgy1 with activities in the range of10]2000 Bq and sizes less than approximately 0.5mm.
3.1.4. BiotaGenerally, the radionuclide levels observed in
biota were very low, especially for 90 Sr, wherevalues below detection limit of approximately 0.02Bq kgy1 were usually found. 60 Co concentrationsin fish were below 0.1 Bq kgy1. It was expectedthat sharks would give averaged values and this
Ž y1 .was seen in two cases 0.05 and 0.06 Bq kg .ŽOne sample, however, showed a higher level 0.4
y1 . 60Bq kg . The highest Co levels were observedin troca samples, between 0.8 and 1.2 Bq kgy1, asexpected, because this gastropod is usually at-tached to coral clusters in the lagoon and feedson seaweed. 137Cs concentrations were below 0.5Bq kgy1 except in shark samples where up to 5.1
Bq kgy1 was found. 239,240 Pu concentrations wereŽ y1 .lowest in red fish fillet 0.001 Bq kg and in
Ž y1 .sharks 0.02 to 0.05 Bq kg , and highest in oneŽ y1 .sample of black surgeon 2.6 Bq kg collected
in the highly contaminated Denise zone. In trocasamples, 239,240 Pu levels were between 4.0 and 6.1Bq kgy1. 241Am levels follow 239,240 Pu levels, hav-
Žing the highest values in troca from 0.14 to 0.19y1 . 238 239,240Bq kg . Pur Pu ratios vary between
0.03 and 0.37 confirming a local origin of Pu inbiota.
Microalgae collected on a plastic panel at Zan-Ž .clus 25 Site 6 showed higher radionuclide con-
Ž60 239,240 241centrations Co 0.28, Pu 2.87 and Amy1 .0.13 Bq kg .
Higher radionuclide levels were observed inplankton samples. For example, in the planktonsample taken in the north of the lagoon, theobserved radionuclide concentrations were: 60 Co0.4, 155Eu 0.8, 238 Pu 5.6, 239,240 Pu 52.3 and 241Am 2

( )P.P. Po¨inec et al. r The Science of the Total En¨ironment 237r238 1999 249]267258
y1 ŽBq kg . However, much lower Pu levels by.approx. a factor of 20 were observed in the
Ž .plankton sample fraction 500]1000 mm takenclose to the pass where the influence of openocean water is marked. These trends in concen-tration reflect the known variation in the abilitiesof different marine organisms to concentrate ra-dionuclides, as for Pu by approximately five or-ders of magnitude, with plankton having the high-est concentration factors and bottom fish the
Ž .lowest Baxter et al., 1995 .
3.2. Fangataufa lagoon
3.2.1. WaterThe tritium concentrations in surface and bot-
tom water at three sampling sites in Fangataufalagoon are similar. However, significantly higher3 Ž y1 y1 .H levels 1.48 kBq l and 650 Bq l waterwere measured in pore water extracted from sedi-ment collected at Site 56 and Mitre 29, respec-tively. 3H in pore water as well as the mean 3H
Ž y1 .concentration in the lagoon 177 mBq l , whichis higher by approximately a factor of two than inthe surrounding ocean, suggest that the lagoon,like Mururoa lagoon, is also a source of tritium.
Strontium-90 and caesium-137 surface concen-trations at three sites in Fangataufa lagoon arevery similar. The concentrations in bottom watershow a larger variation and for Site 44 both 90 Srand 137Cs concentrations are seemingly higherthan in surface water. However, the statisticaluncertainty is large. In general, the concentra-
90 Ž .tions of Sr are significantly higher 1.7]3 timesthan found in ocean surface waters. For 137Cs, thelagoon surface water concentrations are similar toocean surface water concentrations whereas forthe lagoon bottom water, the concentrations arebetween 1.1 and 2 times higher. As a conse-quence, the 137Csr 90 Sr activity ratios in surfaceand bottom water are generally lower than thosefound in ocean surface water. Again, therefore,there is evidence of a 90 Sr source-term to themarine environment of Fangataufa.
The distributions of plutonium isotopes con-centrations in filtered water and particulates werestudied at the three sites within the lagoon. Theparticulate fraction of 239,240 Pu is in the range of
5]17% in surface water and 5]19% in bottomwater, i.e. significantly higher than in the Mu-ruroa lagoon. The concentrations in filtered watershow moderate variation both between surfaceand bottom water and between sites, 0.38]0.64mBq ly1. The levels are approximately two ordersof magnitude higher than those in ocean surfacewaters. The 238 Pur 239,240 Pu activity ratios showvery small variation between sites and water hori-zons in filtered water: range 0.385]0.405, butlarger variation between sites for particulate Pu:range 0.25]0.38, keeping in mind the larger statis-tical uncertainty for the latter. It seems that ateach site the particulate Pu isotopic activity ratiosare lower than for filtered water, but the statisti-cal uncertainty is large. In general, the isotopicactivity ratios are significantly higher than thosein ocean surface water. As at Mururoa, then, thePu results imply a mobilisation and export of Pufrom Fangataufa.
Americium-241 concentrations in filtered watershow moderate variation between sites and water
Ž y1 . 241depth 1.6]3.4 mBq l , whereas the Am inparticulates shows consistently higher concentra-tions in bottom water, i.e. close to the seabed.The ratio between Am in particulate fraction andin filtrate ranges at 1.3]2.7 and 3.5]7.8 for sur-face and bottom waters respectively, i.e. theparticulate Am fraction predominates. The par-ticulate 241Am concentrations constitute approxi-mately from one-fifth to one-tenth of particulate239,240 Pu concentrations, whereas the total 241Amin water only constitutes 0.3]0.8% of the total239,240 Pu in water, the latter being significantlylower than found in Mururoa Atoll.
3.2.2. SedimentThe largest 239,240 Pu concentrations were mea-
sured at Site 44. A Kullenberg core taken at adepth of up to 1 m shows high 239,240 Pu concen-
Ž 4 y1.trations approx. 10 Bq kg in deeper layers.239,240 Ž .Surface Pu concentrations 0]10 cm in the
lagoon range from 14 to 3126 Bq kgy1. The total239,240 ŽPu inventories surface to the deepest part
.of each sediment core range from 0.5 to 85.3 kBqy2 Žm . The highest value was found at Site 44 850
y2 .kBq m . As for Mururoa, these values repre-sent clear underestimates of the inventories of

( )P.P. Po¨inec et al. r The Science of the Total En¨ironment 237r238 1999 249]267 259
Pu. The sedimentation rate estimated for depthsbelow 10 cm using the 210 Pb method is 1 mm
y1 Ž .year Site 50 .
3.2.3. BiotaGenerally, radionuclide concentrations found
in Fangataufa lagoon fish are comparable withthose of Mururoa lagoon. 137Cs concentrationsfound in shark flesh were approximately 0.75 Bqkgy1. Pearl oysters showed the highest concentra-
60 Ž y1 . 239,240tions of Co approx. 9.3 Bq kg and PuŽ y1 .2.6 and 3.4 Bq kg . However, these specieswere not found in Mururoa lagoon. One trocasample gave 5.3 Bq kgy1 of 60 Co and 4.5 Bq kgy1
of 239,240 Pu, values approximately a factor of fourhigher than in Mururoa lagoon.
Microalgae collected on a plastic panel in thecentre of the lagoon showed 1.2, 14.9 and 1.5 Bqkgy1 of 60 Co, 239,240 Pu and 241Am, respectively,values roughly six times higher than in Mururoalagoon.
Ž .In plankton samples fraction 500]1000 mmtaken in the centre of the lagoon, the observed239,240 Pu levels were 32.2 Bq kgy1, i.e. approxi-mately 10 times higher than in Mururoa lagoon.
3.3. Ocean
3.3.1. WaterThe tritium concentration profile in ocean wa-
ter shows the expected decrease in 3H levels fromy1 y1 Ž .approximately 100 mBq l to 6 mBq l Fig. 8 .
Except for surface water, the concentrations arehomogeneous between sites showing a rapid de-crease with water depth down to approximately1000 m and then becoming constant. The depthprofile shape is consistent with observations else-where in the Pacific Ocean, indicating the globalfallout origin of 3H. The water column inventorywas estimated for Site 63 to be 59 kBq my2 .
Strontium-90 shows very small differences inconcentrations between the sites, and a typicalprofile of global fallout origin in the Pacific Ocean.The water column inventory was estimated forSite 63 in the same manner as for 3H, and pro-duced a result of 0.55 kBq my2 . This value ishigher than estimated deposition densities from
Fig. 8. 3H profile in ocean water around Mururoa and Fan-gataufa Atolls.
Žglobal fallout for latitudes 20]308S approx. 0.3y2 .kBq m , again indicating a local source.
Caesium-137 profiles follow the same patternas 90 Sr and the differences in concentrationsbetween sites are insignificant. The resultingcolumn inventory for Site 63 is 1.03 kBq my2 , i.e.87% higher than for 90 Sr. This difference isslightly larger than expected from global falloutalone, the latter 137Csr 90 Sr inventory ratio being1.6. The indication of a localised export of nu-clides remains however.
The plutonium-239,240 depth distributions atŽ .the four sites 60]63 show rather small variabil-
ity and the distributions are typical for the PacificOcean, i.e. a gradual concentration increase withdepth until a subsurface maximum is reached atapproximately 700]1000 m, after which the con-centrations decline gradually. This is believed tobe due to plutonium scavenging in the euphoticzone and being subsequently associated withsinking particles followed by resolubilisation atdepth. The column inventory was estimated forSite 63 to be 10.4 Bq my2 . This estimate com-pares well with the global fallout estimates of 12
y2 Ž .Bq m latitudes 20]308S . The depth distribu-tions of the 238 Pur 239,240 Pu activity ratios showsignificant variation between sites for surface wa-ter, ranging between 0.11 and 0.23. Despite the

( )P.P. Po¨inec et al. r The Science of the Total En¨ironment 237r238 1999 249]267260
large statistical uncertainties, it appears that forSite 63 the isotopic activity ratios show a variationwith depth, indicating more than one source ofplutonium.
The Americium-241 depth distribution profileshows features similar to those of 239,240 Pu.
3.3.2. BiotaFish in the open ocean, as expected, show
much lower radionuclide concentrations than inthe lagoons. However, it is interesting to notethat traces of 60 Co were found in fish and deep-sea shrimps. 60 Co and 137Cs could be detected atlevels between 0.02 and 0.2 Bq kgy1, and 0.03 and0.2 Bq kgy1, respectively. 239,240 Pu levels arebetween 0.0003 and 0.1 Bq kgy1, the highestconcentrations being found in deep sea shrimps.
Ž .Plankton samples 200]4000 mm collected ap-proximately 2 km from the lagoon passes at bothMururoa and Fangataufa lagoons, showed tracesof 60 Co and 155Eu and approximately 50 Bq kgy1
of 239,240 Pu, confirming the expectation that Puwas released from the lagoons to the open ocean.
4. Discussion
4.1. Mururoa lagoon
4.1.1. WaterThe 3H concentrations measured in 1996 in
Mururoa lagoon water are significantly lower thanŽthose presented in the French report CEA,
.1996b . This is in accord with the French observa-tions of gradually declining concentrations since1990. As the precision of French measurementswas much lower, it was not possible to see thetritium enrichment in bottom waters, nor its spa-tial distribution in the lagoon.
Tritium stratigraphy in the lagoon would sup-port the hypothesis of a continuous supply oftritium water from the carbonaceous zone. This isalso supported by a higher tritium content in porewater extracted from sediment. Although the porewater sediment sites, as well as the water sam-pling sites, are not coincident with tritium ‘hot-
Ž .spots’ in the carbonaceous zone CEA, 1996b ,the higher tritium concentrations in pore water
samples are also probably due to tritium watermigration from ‘hotspot’ areas rather than to acontribution from localised shafts. The averaged3 Ž y1 .H concentration in the lagoon 360 mBq l ,approximately a factor of three higher than inocean water, can only be explained by a continu-ous supply of tritiated water from the carbona-ceous zone to the lagoon. The other possiblesources of tritium, like precipitation, can be ex-cluded as expected levels should not be above 100mBq ly1.
The 90 Sr and 137Cs concentrations in this studyof surface water compare very well with the con-
Ž .centrations reported earlier CEA, 1996b . Basedon observations made between 1989 and 1993Ž . 90CEA, 1996b , Sr concentrations, were constantor slightly increasing. On the other hand, 137Csconcentration has been decreasing with an effec-
Žtive half-life of approximately eight years CEA,.1996b .
The 239,240 Pu particulate concentrations in thisstudy are lower than or at the very low side ofprevious French data from 1993. The range of239,240 Pu in water filtrate, on the other hand, isslightly larger. The complete data set for the
Ž .period 1985]1993 CEA, 1996b suggests an ef-fective half-life of approximately seven years forthe soluble phase and a significant decrease inthe past four years for the particulate phase. Thecombined Pu data suggest export to the openocean.
Radionuclide inventories in Mururoa water aregiven in Table 1. The calculations are based onthe mean surface and bottom water radionuclideconcentrations found in this study.
4.1.2. SedimentThe spatial distributions of 239,240 Pu in the la-
Ž .goon sediment top 5 cm are compared in Fig. 9.The IAEA values are lower by at least a factor of
Ž .two than the French data Musa et al., 1996 . Asimilar conclusion can be drawn for 155Eu dis-tribution.
A comparison of the 239,240 Pu inventory in sedi-ment with French data was carried out for thecentral part of the lagoon, where, as can be seenfrom Fig. 1, 17 box cores and four grab sampleswere collected. Colette, Denise and Dindon zones

( )P.P. Po¨inec et al. r The Science of the Total En¨ironment 237r238 1999 249]267 261
Table 1Radionuclide inventories in Mururoa lagoon waters
y2Bq Bq m
Mean Range Mean Range
3 12 Ž . Ž .H 1.74=10 1.34]2.15 12 900 9900]15 90090 10 Ž . Ž .Sr 1.02=10 0.86]1.52 75.6 63.7]113129 7 Ž . Ž .I 2.0=10 0.32]2.55 0.15 0.01]0.09137 10 Ž . Ž .Cs 1.02=10 0.90]1.18 75.6 66.7]87.5238 8 Ž . Ž .Pu 2.61=10 1.76]3.26 1.9 1.3]2.4239,240 9 Ž . Ž .Pu 1.42=10 0.78]1.76 10.5 5.8]13.0241 7 Ž . Ž .Am 2.3=10 1.7]2.6 0.17 0.12]0.19
were excluded from this comparison as the num-ber of cores collected was insufficient. The239,240 Pu inventory calculated is approximately 2TBq and is in agreement with the previous esti-
Ž .mation Musa et al., 1996 .Total radionuclide inventories in Mururoa sedi-
ments are listed in Table 2. It was difficult tocalculate the inventories at Mururoa hot spotsŽ .Colette, Dindon and Denise from this study asthe number of cores taken was too small. How-ever, using the sea-bed g-spectrometry data andlaboratory data on 60 Co and 239,240 Pu in sedi-ments, a correlation analysis was carried out en-abling the estimation of the 239,240 Pu inventory atDindon hot spot to be approximately 8 TBq,which is within a factor of two with the French
Ž . Ž . 60value 5 TBq Musa et al., 1996 . The 1995 Coinventory estimated in a similar way is 0.4 TBqwhich is also in agreement with the French valueŽ .0.5 TBq .
4.1.3. BiotaAn extensive data set of biota results was re-
ported in the framework of an intercomparisonexercise organised by IAEA-MEL in 1994]1995Ž .Ballestra et al., 1995 . Although the samplingsites, as well as the species analysed, are differentto those in this report, a rough comparison ispossible.
A representative set of data for fish is com-pared in Table 3. Generally an agreement existswithin a factor of two among data sets, except forsharks, where larger fluctuations were found. Agood agreement has also been obtained for shell-fish. Results of radionuclide analysis of microal-
gae and plankton samples collected in the lagoonare also within the range given in the French
Ž .report CEA, 1996a .
4.2. Fangataufa lagoon
4.2.1. WaterThe range of 3H concentrations obtained in
this study is generally lower than or is at theŽlower limit of the French data range CEA,
.1996b . This decrease may reflect mixing of oceanwater of low 3H concentration with lagoon water
Ždue to storm conditions before sampling as at.Mururoa .
There was a slight increase in 90 Sr concentra-tion in 1996 compared with previous French mea-
Ž .surements CEA, 1996b .The 137Cs concentrations obtained in this study
are on the lower side but all fall within the rangeof concentrations obtained by France. The com-plete data set suggests a decrease in 137Cs concen-tration in recent years with an effective half-life
Ž .of approximately 10 years CEA, 1996b .239,240 Pu concentrations are on the lower side
of the French data set, both for soluble andparticulate fractions. The average 239,240 Pu con-centration of surface water in soluble fraction isdecreasing with an effective half-life of approxi-mately eight years. However, the particulate frac-tion shows larger fluctuations. The 238 Pur239,240 Ž .Pu activity ratios 0.21 and 0.19 for surfaceand bottom waters respectively, are slightly higher
Ž .than the ocean surface water activity ratio 0.16 .The ratios between 241Am in the particulate
fraction and in the filtrate are in the ranges

( )P.P. Po¨inec et al. r The Science of the Total En¨ironment 237r238 1999 249]267262
Fig. 9. 239,240 Pu in Mururoa lagoon surface sediments.

( )P.P. Po¨inec et al. r The Science of the Total En¨ironment 237r238 1999 249]267 263
Table 2aRadionuclide inventories in Mururoa sediments
Total TBqCentre of the lagoon TBqŽ .French data Musa et al., 1996IAEA study Musa et al.
239,240 Pu 1.8 3.6 18238 Pu 0.3 0.6 3.3241Am 0.04 0.2 0.6137Cs 0.02 0.7155Eu 0.07 0.08 0.660Co 0.02 0.3 0.4
a Reference date 1 January 1997.
1.2]3.1 and 0.9]2.7 for surface and bottom watersrespectively, i.e. the particulate 241Am fractionpredominates. Although the particulate 241Amconcentrations are comparable to or at least ofthe same order of magnitude as the particulate239,240 Pu concentrations, the total 241Am in wateris only 1]8% of the total 239,240 Pu in water.
Radionuclide inventories in Fangataufa lagoonwater are given in Table 4.
4.2.2. SedimentThe spatial distribution of 239,240 Pu in the la-
Ž .goon sediment top 5 cm is shown in Fig. 10. The
Table 3Ž .A comparison of IAEA and French data on Mururoa fish the number of samples is given in parentheses
90 60 137 239,240Species Sr Co Cs Pu Ref.y1Ž .Bq kg wet wt.
Ž .Black surgeon fish 4 -0.06 -0.04]0.1 0.15]0.20 0.041]0.586 This studyŽ .Parrot fish 3 -0.08 0.05]0.06 0.24]0.30 0.009]0.015
Ž .Red fish 1 -0.03 0.05"0.02 0.18"0.02 0.003]0.001Ž .Shark 3 -0.03 0.05]0.39 0.68]5.06 0.004]0.012
Ž .Grouper fish -0.07 0.03]0.05 0.26]0.35 0.001]0.004 Ballestra et al. 1995Black surgeon fish -0.14]0.85 0.20]0.38 -0.13]0.26 0.027]0.340 French data
Ž .CEA, 1996aGrouper fish -0.17 0.08"0.03 0.08"0.03 0.061"0.019Parrot fish -0.13 0.31"0.05 0.27"0.05 0.025"0.009Shark 0.32"0.05 -0.07 5.18"0.95Goat fish -0.14 0.21"0.05 0.11"0.04 0.01
Table 4Radionuclide inventories in Fangataufa lagoon waters
Mean Range Mean Rangey2 y2Ž . Ž .Bq m Bq m
3 11 Ž . Ž .H 0.99=10 0.78]1.21 2750 2150]335090 9 Ž . Ž .Sr 1.40=10 1.25]1.45 38.9 34.7]40.3137 9 Ž . Ž .Cs 1.50=10 1.19]1.72 41.7 33.1]47.8238 8 Ž . Ž .Pu 1.10=10 0.90]1.37 3.1 2.5]3.8239,240 8 Ž . Ž .Pu 2.83=10 2.32]3.49 7.9 6.4]9.7241 6 Ž . Ž .Am 5.38=10 3.6]6.4 0.15 0.10]0.18

( )P.P. Po¨inec et al. r The Science of the Total En¨ironment 237r238 1999 249]267264
Fig. 10. 239,240 Pu in Fangataufa lagoon surface sediments.
Table 5aRadionuclide inventories in Fangataufa sediments
IAEA study French dataŽ . Ž .Total TBq Musa et al., 1996
Ž .Total TBq
239,240 Pu 5.5 7.4238 Pu 2.3 2.9155Eu 0.3 0.4241Am 0.3 0.460Co 0.1 0.3137Cs 0.05 0.2
a Reference date 1 January 1997
IAEA values are lower than the French data, as is155 Ž .the case for Eu Musa et al., 1996 .
Radionuclide inventories in Fangataufa sedi-Ž .ments Table 5 are within a factor of two of the
Ž .French data Musa et al., 1996 .
4.2.3. BiotaA comparison of IAEA and French data on fish
samples collected in Fangataufa lagoon is given inTable 6. Generally, lower values were found in
Ž .the IAEA study similarly in shellfish samples .There were no available French data on mi-
croalgae from Fangataufa lagoon. The planktonsample collected in 1996 showed concentrationsof 239,240 Pu approximately 15 times higher than
Ž .those given in the French report CEA, 1996a .The discrepancy could be due to different condi-tions in the lagoon, as only two measurements arecompared.
4.3. Discussion of radionuclide concentrations in thelagoons
The explanation of the decreasing 137Cs and

( )P.P. Po¨inec et al. r The Science of the Total En¨ironment 237r238 1999 249]267 265
Table 6Ž .A comparison of IAEA and French data for fish in Fangataufa lagoon the number of samples is given in parentheses
90 60 137 239,240Species Sr Co Cs Pu Ref.y1Ž .Bq kg wet wt.
Ž .Parrot 2 -0.009 0.12]0.36 0.19]0.20 -0.005]0.013 This studyŽ .Surgeon 2 0.007]0.02 0.35]0.61 0.14]0.24 0.010]0.031
Ž .Goat 1 -0.013 0.62"0.05 0.29"0.05 0.013"0.002Ž .Shark 2 -0.008 0.19]0.44 0.68]0.84 -0.003]0.013
Black surgeon -0.16 2.00"0.18 0.26"0.05 0.08"0.02 French dataŽ .CEA, 1996a
Grouper -0.18 0.37"0.05 0.12"0.04 0.06"0.02Goat -0.16 2.01"0.18 0.16"0.04 0.07"0.02Parrot -0.15 1.17"0.12 0.27"0.09 2.11"0.04
239,240 Pu concentrations in lagoon water may beexplained by complex processes of sediment
Ž .leaching, deposition of fresh non-radioactivesediment in the lagoon, its mixing and removalŽ .especially during storms . Only the leaching ofPu from surface sediment, with a subsequentdepletions of Pu in surface layers, as suggested in
Ž .the French report 1994 , cannot be responsiblefor the observed effects. In recent years there has
Žbeen strong mixing of surface sediment up to.10]20 cm due to resuspension of sediment after
underground explosions and also due to bioturba-tion.
The 137Cs and 239,240 Pu transferred from under-ground sources will only be visible in the lagoon
Ž137 .after a few years Cs to a few hundred yearsŽ239,240 .Pu from the present. Until then, the domi-nant 137Cs and 239,240 Pu inventories are in sedi-ments and their concentrations in water can beexplained by complex processes of deposition,mixing and removal of sediment from the lagoonbottom due to tide, wind and storm effects.
On the contrary, 3H and 90 Sr concentrationsremain more or less constant. Their inventories insediment are too low to explain present concen-trations and therefore an underground contribu-tion should be considered. 3H and 90 Sr levels,therefore, reflect the transport from undergroundsources, although the increase with time would bemore likely. However, the observed levels couldbe affected by previous drilling activities and byopen shafts which resulted in higher concentra-tions in the past. With the closing of the shafts
and a cessation of drilling activities, the dominantprocess is likely to be a transfer of 3H and 90 Srthrough the carbonate zone to the lagoon whichwill result in increasing levels of 3H and 90 Sr inlagoon water.
The present radionuclide inventories estimatedŽfor lagoon sediments and water the dominant
contribution in sediment is from 239,240 Pu } ap-.prox. 30 TBq are negligible in comparison with
the total underground inventories estimated byŽ .the Source Term Working Group IAEA, 1998a :
3H } 280 000 TBq, 137Cs } 14 800 TBq, 90 Sr }10 800 TBq, 147 Pm } 11 000 TBq, 241Pu } 6800TBq, 239Pu } 1100 TBq and 240 Pu } 300 TBq.
4.4. Ocean
4.4.1. WaterThe 3H depth profiles for the shallow to inter-
mediate water depths from this study generallyshow concentrations lower than the data observedby France in 1994. The French data for 12 NM atwater depths of 600 and 900 m were all belowtheir detection limit, thus inhibiting a comparisonŽ .CEA, 1996b .
The general depth profiles of 90 Sr and 137Cscompare very well with the French 1994 data,both in magnitude and profile shape. As a conse-quence, the profiles of 137Csr 90 Sr activity ratiosare also consistent.
The 239,240 Pu depth profiles show very similarshapes and magnitudes between this study andthe 1994 French data. The 238Pur 239,240 Pu activ-
( )P.P. Po¨inec et al. r The Science of the Total En¨ironment 237r238 1999 249]267266
Table 7Ž .A comparison of IAEA and French data on ocean biota the number of samples is given in parentheses
90 60 137 239,240Species Sr Co Cs Pu Ref.y1Bq kg wet wt
Ž .Tuna 2 -0.02 0.03]0.06 0.43]0.48 0.0009]0.0054 This studyŽ .Thazard 2 -0.02 -0.03 0.29]0.38 0.00029]0.00044Ž .Red fish 1 -0.29 0.09"0.05 0.11"0.03 0.057"0.004
Ž .Ray 2 0.012, -0.022 -0.02 0.23]0.34 0.00043]0.0017Ž .Deep-sea shrimps 6 0.020]0.028 0.07]0.17 -0.03]0.04 0.012]0.106
Ž . Ž .Grouper Rangiroa -0.03 -0.03 0.24"0.06 0.00013"0.00005 Ballestra et al. 1995Ž .Tuna Skipjack -0.1 0.14]0.28 -0.0007 French data
Ž .CEA, 1996aŽ .Tuna Yellow fin -0.04 0.1]0.3 -0.004
Deep-sea shrimps -0.2 -0.06]0.72 -0.04]0.09 -0.010]0.040
ity ratio profiles compare rather well, but due tothe large statistical uncertainties, possible differ-ences are not easily observable.
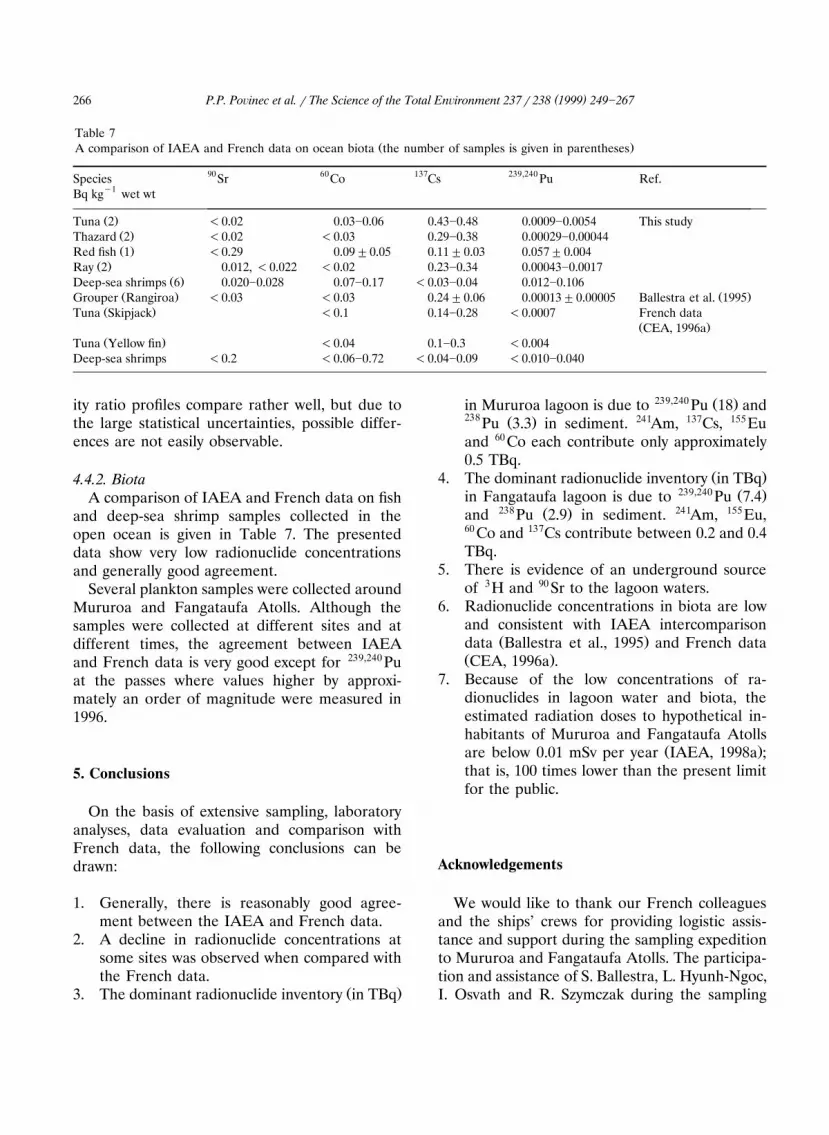
4.4.2. BiotaA comparison of IAEA and French data on fish
and deep-sea shrimp samples collected in theopen ocean is given in Table 7. The presenteddata show very low radionuclide concentrationsand generally good agreement.
Several plankton samples were collected aroundMururoa and Fangataufa Atolls. Although thesamples were collected at different sites and atdifferent times, the agreement between IAEAand French data is very good except for 239,240 Puat the passes where values higher by approxi-mately an order of magnitude were measured in1996.
5. Conclusions
On the basis of extensive sampling, laboratoryanalyses, data evaluation and comparison withFrench data, the following conclusions can bedrawn:
1. Generally, there is reasonably good agree-ment between the IAEA and French data.
2. A decline in radionuclide concentrations atsome sites was observed when compared withthe French data.
Ž .3. The dominant radionuclide inventory in TBq
239,240 Ž .in Mururoa lagoon is due to Pu 18 and238 Ž . 241 137 155Pu 3.3 in sediment. Am, Cs, Euand 60 Co each contribute only approximately0.5 TBq.
Ž .4. The dominant radionuclide inventory in TBq239,240 Ž .in Fangataufa lagoon is due to Pu 7.4
238 Ž . 241 155and Pu 2.9 in sediment. Am, Eu,60 Co and 137Cs contribute between 0.2 and 0.4TBq.
5. There is evidence of an underground sourceof 3H and 90 Sr to the lagoon waters.
6. Radionuclide concentrations in biota are lowand consistent with IAEA intercomparison
Ž .data Ballestra et al., 1995 and French dataŽ .CEA, 1996a .
7. Because of the low concentrations of ra-dionuclides in lagoon water and biota, theestimated radiation doses to hypothetical in-habitants of Mururoa and Fangataufa Atolls
Ž .are below 0.01 mSv per year IAEA, 1998a ;that is, 100 times lower than the present limitfor the public.
Acknowledgements
We would like to thank our French colleaguesand the ships’ crews for providing logistic assis-tance and support during the sampling expeditionto Mururoa and Fangataufa Atolls. The participa-tion and assistance of S. Ballestra, L. Hyunh-Ngoc,I. Osvath and R. Szymczak during the sampling

( )P.P. Po¨inec et al. r The Science of the Total En¨ironment 237r238 1999 249]267 267
expedition are highly appreciated. We also thankthe numerous colleagues in our laboratories whoparticipated in the analytical work and providedthe results for this study. IAEA-MEL operatesunder a bilateral agreement between the Interna-tional Atomic Energy Agency and the Principalityof Monaco.
References
Ballestra S, Baxter MS, Gastaud J, Pettersson H, Povinec PP,Vas D. Radionuclides in biological samples collected atMururoa Atoll. AQCS Rep. IAEArAL085. IAEArMELr60. Vienna, Austria: IAEA, 1995.
Baxter MS, Fowler SW, Povinec PP. Observations on plu-tonium in the oceans. Appl Radiat Isot 1995;46:11.
CEA. Ministere de la Defense, Direction des Centres d’Ex-perimentations Nucleaires, 1996. ‘Study of the radiologicalsituation at the atolls of Mururoa and Fangataufa’. Docu-ment No. 9, Current underground distribution of radionu-clides at Mururoa and Fangataufa. CEA DAMr
Ž .DRIFrDASE Rep. AMFr66 E . France: Montlhery, 1996.´CEA. Ministere de la Defense, Direction des Centres d’Ex-
perimentations Nucleaires, 1996. Environmental moni-
toring in French Polynesia and on the Mururoa and Fan-gataufa Sites, Year 1994. DIR.C.E.N.-C.E.A. SMSRB Rep.03rSMSRBrDIR, Montlhery, France, 1996.´
IAEA. The radiological situation at the atolls of Mururoa andFangataufa, Main Rep. Rad. Ass. Rep. Series. Vienna,Austria: IAEA, 1998.
IAEA. The radiological situation at the atolls of Mururoa andFangataufa. Radionuclide Concentrations measured in theaquatic environment of the atolls. Vienna, Austria: TechRep IAEA, 1998.
Mittelstaedt E, Osvath I, Povinec PP, Togawa O, Scott EM.Transport of radionuclides from the Mururoa and Fangata-ufa Atolls through the marine environment. TheseProceedings, 1999.
Mulsow S, Coquery M, Dovlete C, Gastaud J, Ikeuchi Y,Pham MK, Povinec PP. Underground water radionuclideconcentrations from Mururoa and Fangataufa Atolls. TheseProceedings, 1999.
Musa C, Bourlat Y, Millies-Lacroix J-C. Lagoon sedimentradioactivity in Mururoa and Fangataufa. DIR.C.E.N.-C.E.A. SMSRB Rep. 01rSMSRBrDIR. Montlhery, France,´1996.
Osvath I, Povinec PP, Huynh-Ngoc L, Comanducci J-F. Un-derwater gamma-surveys of Mururoa and Fangataufa la-goons. These Proceedings, 1999.