marimetr - edgetech sonar - 20200218.pdf
TRANSCRIPT
EdgeTech
Sonar Systems
EdgeTech
Sonar Systems
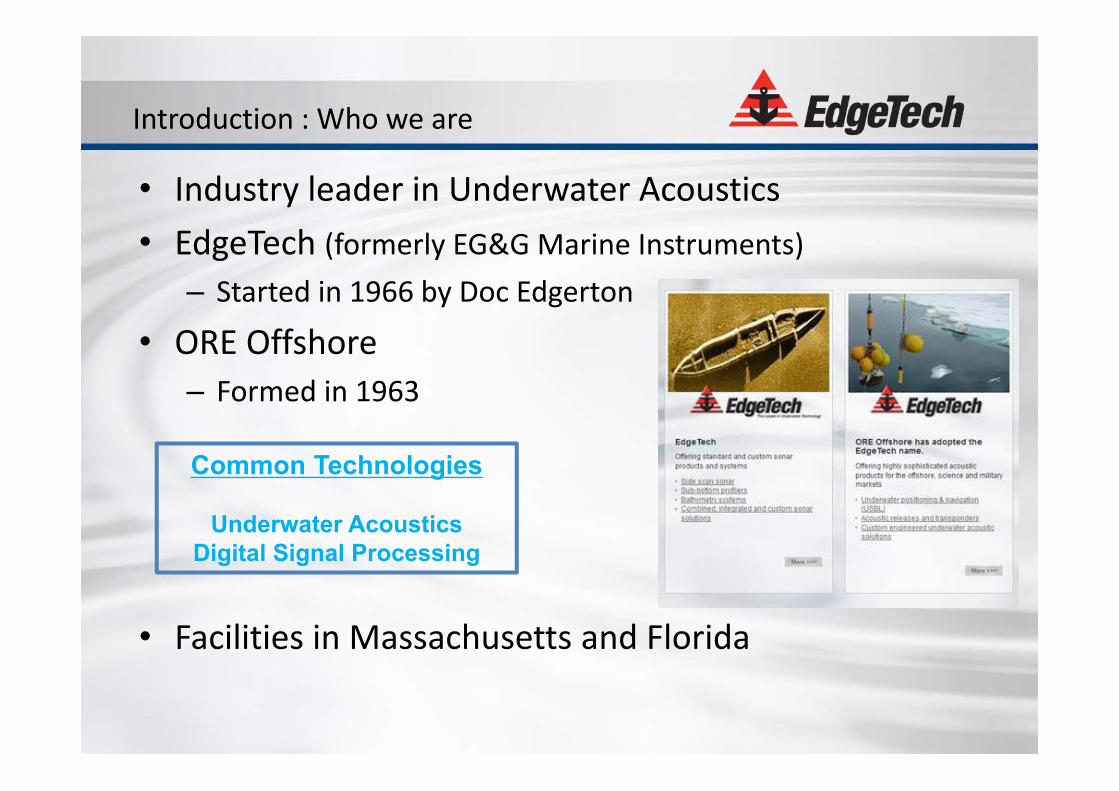
• Industry leader in Underwater Acoustics• EdgeTech (formerly EG&G Marine Instruments)
– Started in 1966 by Doc Edgerton
• ORE Offshore– Formed in 1963
• Facilities in Massachusetts and Florida
Introduction : Who we are
Common Technologies
Underwater AcousticsDigital Signal Processing
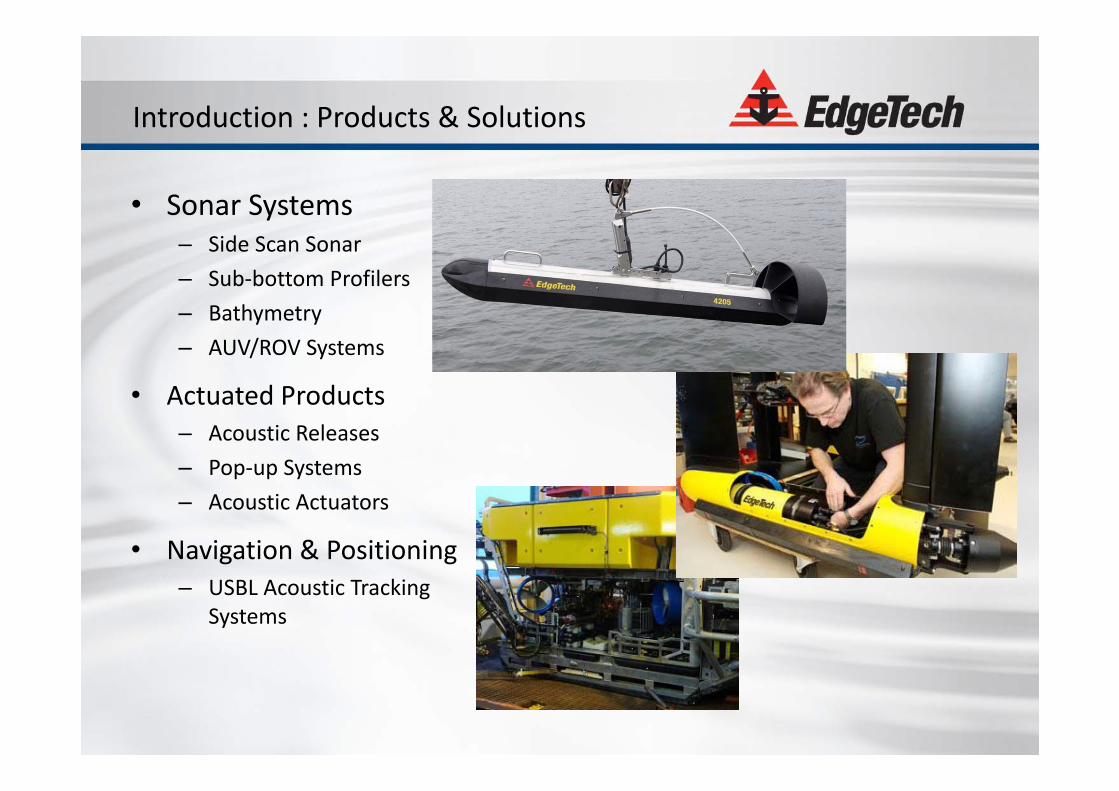
• Sonar Systems– Side Scan Sonar– Sub‐bottom Profilers– Bathymetry – AUV/ROV Systems
• Actuated Products– Acoustic Releases– Pop‐up Systems– Acoustic Actuators
• Navigation & Positioning– USBL Acoustic Tracking
Systems
Introduction : Products & Solutions
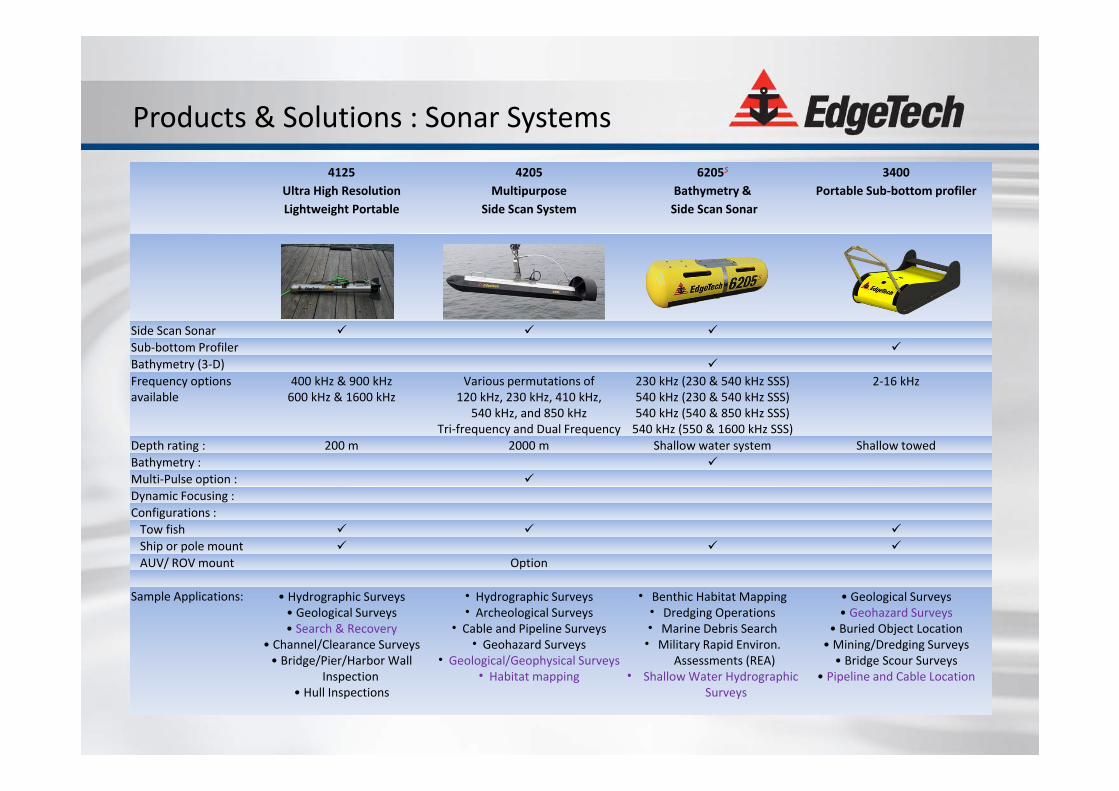
Products & Solutions : Sonar Systems4125
Ultra High ResolutionLightweight Portable
4205Multipurpose
Side Scan System
6205S
Bathymetry &Side Scan Sonar
3400Portable Sub‐bottom profiler
Side Scan Sonar Sub‐bottom Profiler Bathymetry (3‐D) Frequency options available
400 kHz & 900 kHz600 kHz & 1600 kHz
Various permutations of 120 kHz, 230 kHz, 410 kHz,
540 kHz, and 850 kHzTri‐frequency and Dual Frequency
230 kHz (230 & 540 kHz SSS)540 kHz (230 & 540 kHz SSS)540 kHz (540 & 850 kHz SSS)540 kHz (550 & 1600 kHz SSS)
2‐16 kHz
Depth rating : 200 m 2000 m Shallow water system Shallow towedBathymetry : Multi‐Pulse option : Dynamic Focusing :Configurations :Tow fish Ship or pole mount AUV/ ROV mount Option
Sample Applications: • Hydrographic Surveys• Geological Surveys• Search & Recovery
• Channel/Clearance Surveys• Bridge/Pier/Harbor Wall
Inspection• Hull Inspections
• Hydrographic Surveys• Archeological Surveys
• Cable and Pipeline Surveys• Geohazard Surveys
• Geological/Geophysical Surveys• Habitat mapping
• Benthic Habitat Mapping• Dredging Operations• Marine Debris Search• Military Rapid Environ.
Assessments (REA)• Shallow Water Hydrographic
Surveys
• Geological Surveys• Geohazard Surveys
• Buried Object Location• Mining/Dredging Surveys• Bridge Scour Surveys
• Pipeline and Cable Location
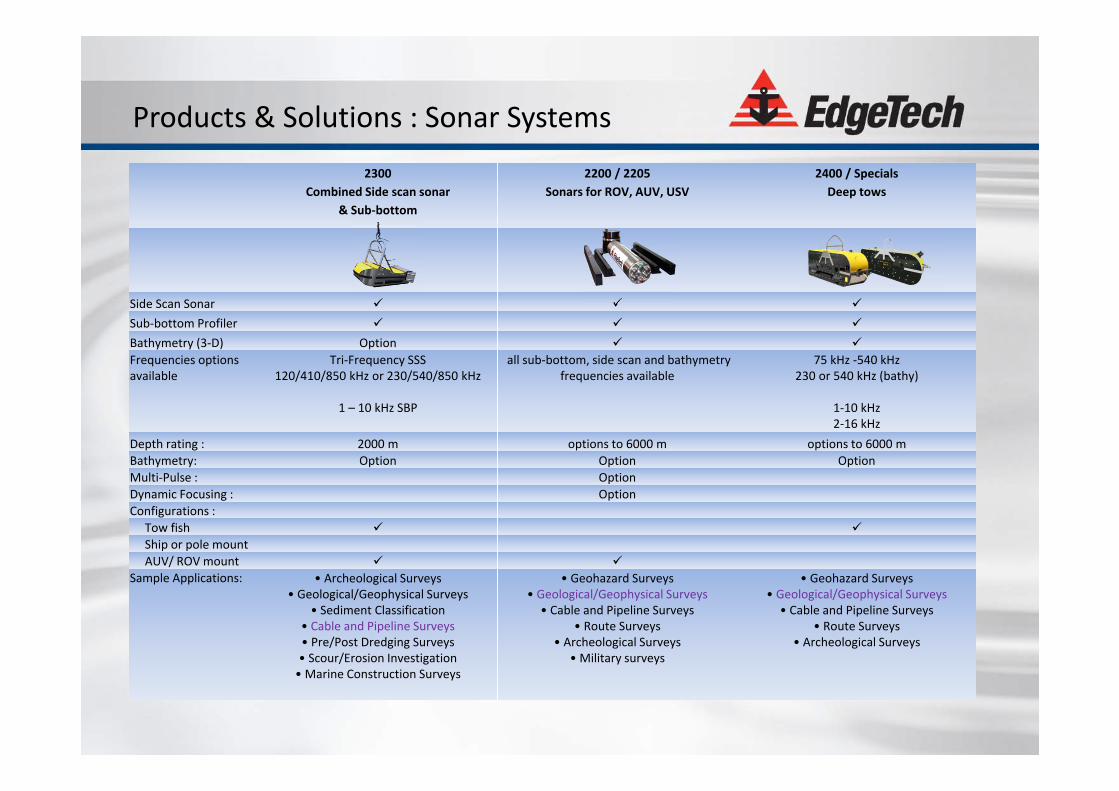
2300Combined Side scan sonar
& Sub‐bottom
2200 / 2205Sonars for ROV, AUV, USV
2400 / SpecialsDeep tows
Side Scan Sonar
Sub‐bottom Profiler
Bathymetry (3‐D) Option Frequencies options available
Tri‐Frequency SSS120/410/850 kHz or 230/540/850 kHz
1 – 10 kHz SBP
all sub‐bottom, side scan and bathymetry frequencies available
75 kHz ‐540 kHz230 or 540 kHz (bathy)
1‐10 kHz2‐16 kHz
Depth rating : 2000 m options to 6000 m options to 6000 mBathymetry: Option Option OptionMulti‐Pulse : OptionDynamic Focusing : OptionConfigurations :
Tow fish Ship or pole mountAUV/ ROV mount
Sample Applications: • Archeological Surveys• Geological/Geophysical Surveys
• Sediment Classification• Cable and Pipeline Surveys• Pre/Post Dredging Surveys• Scour/Erosion Investigation• Marine Construction Surveys
• Geohazard Surveys• Geological/Geophysical Surveys
• Cable and Pipeline Surveys• Route Surveys
• Archeological Surveys• Military surveys
• Geohazard Surveys• Geological/Geophysical Surveys
• Cable and Pipeline Surveys• Route Surveys
• Archeological Surveys
Products & Solutions : Sonar Systems
EdgeTech
Side Scan Sonar Systems
EdgeTech
Side Scan Sonar Systems
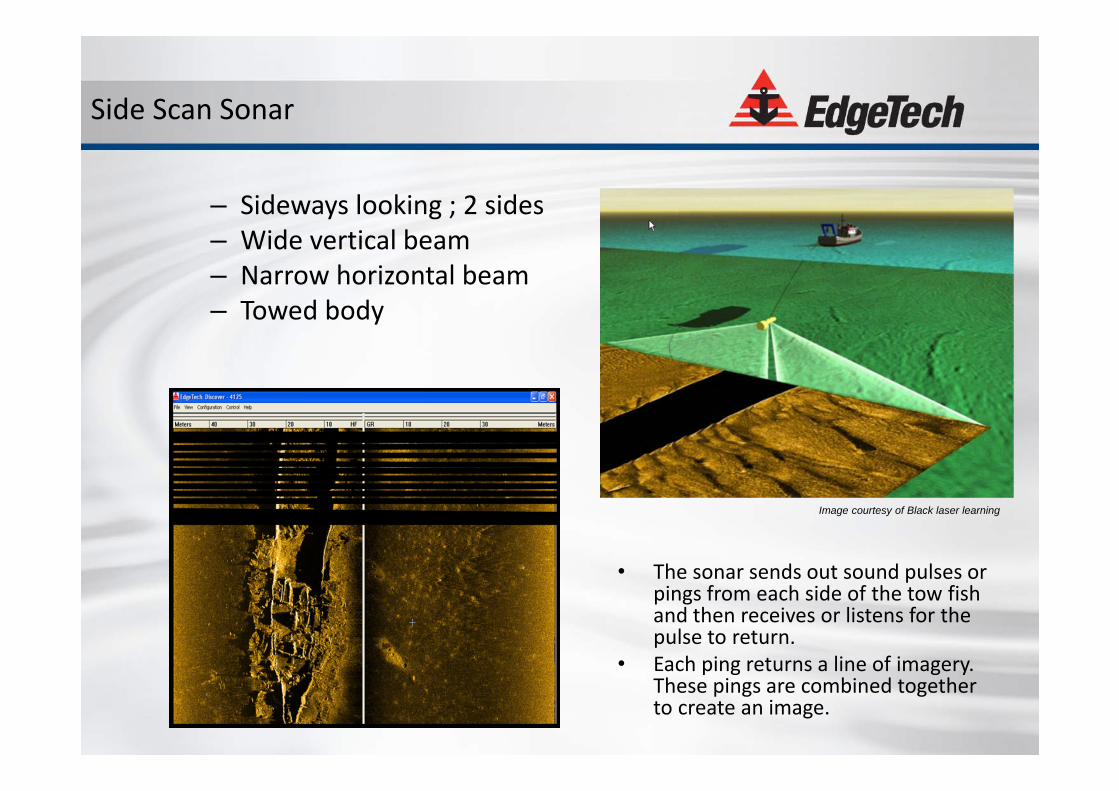
– Sideways looking ; 2 sides– Wide vertical beam– Narrow horizontal beam– Towed body
Side Scan Sonar
Image courtesy of Black laser learning
• The sonar sends out sound pulses or pings from each side of the tow fish and then receives or listens for the pulse to return.
• Each ping returns a line of imagery. These pings are combined together to create an image.
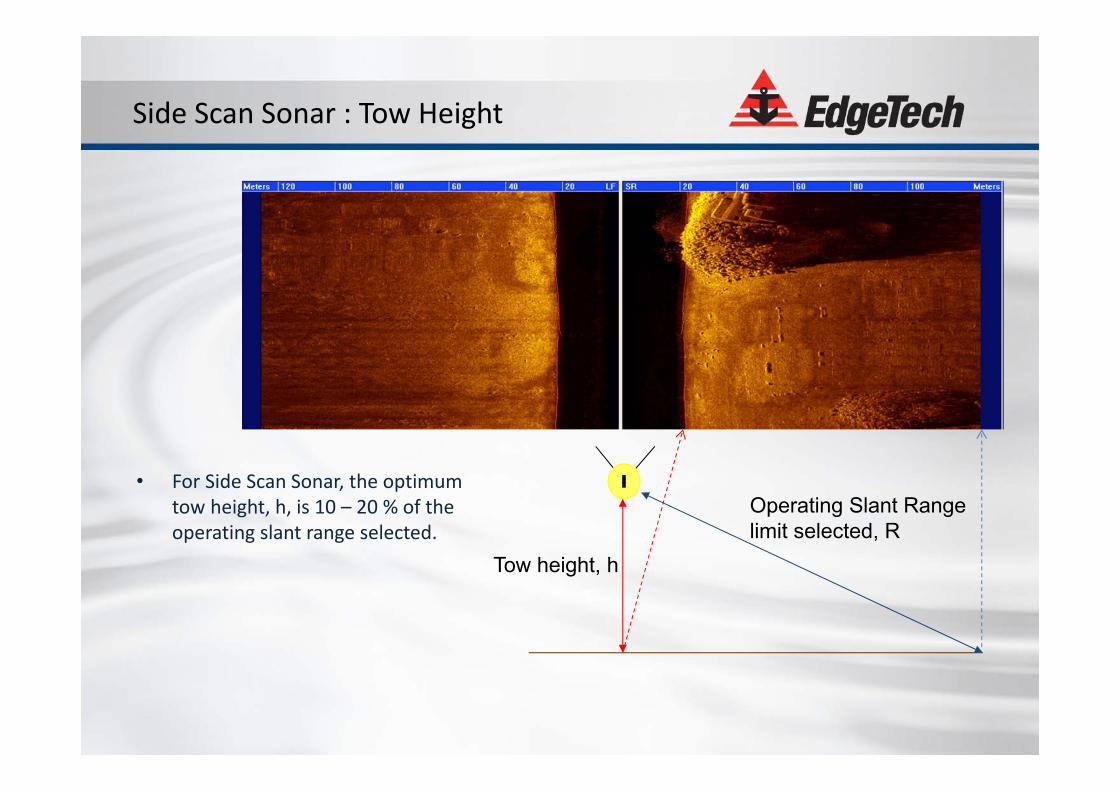
Side Scan Sonar : Tow Height
Operating Slant Range limit selected, R
Tow height, h
• For Side Scan Sonar, the optimum tow height, h, is 10 – 20 % of the operating slant range selected.
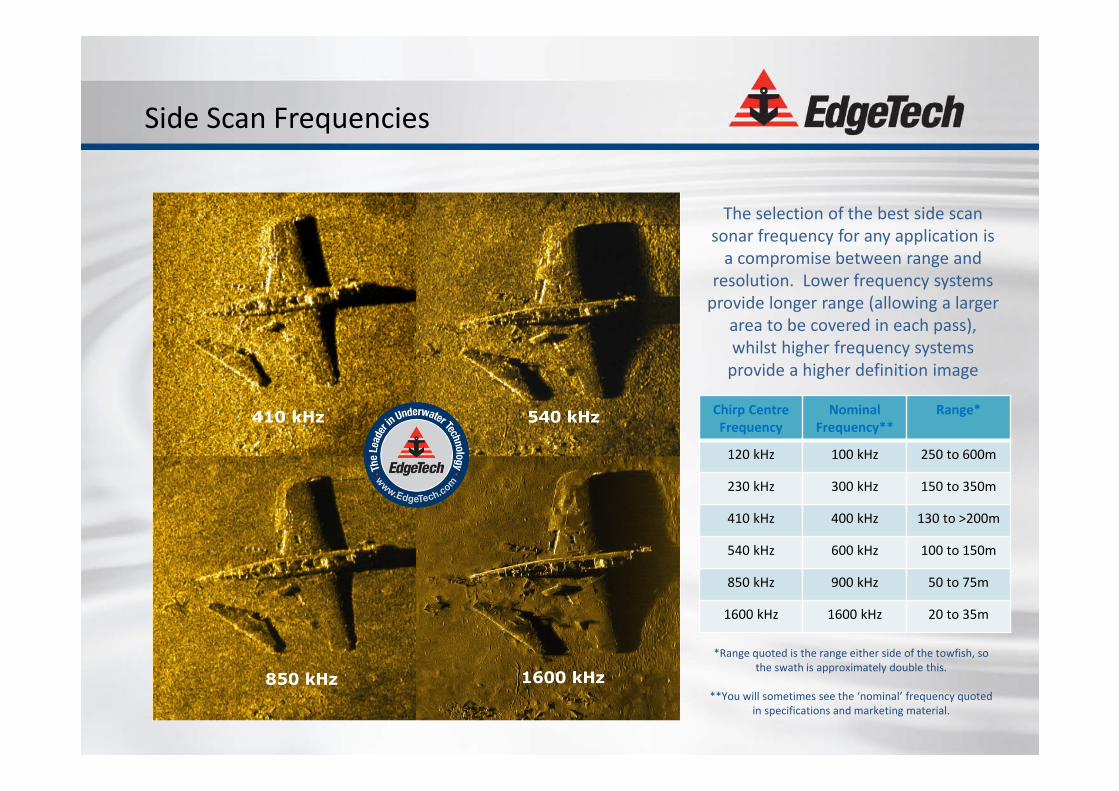
Side Scan Frequencies
Chirp CentreFrequency
NominalFrequency**
Range*
120 kHz 100 kHz 250 to 600m
230 kHz 300 kHz 150 to 350m
410 kHz 400 kHz 130 to >200m
540 kHz 600 kHz 100 to 150m
850 kHz 900 kHz 50 to 75m
1600 kHz 1600 kHz 20 to 35m
*Range quoted is the range either side of the towfish, so the swath is approximately double this.
**You will sometimes see the ‘nominal’ frequency quotedin specifications and marketing material.
The selection of the best side scan sonar frequency for any application is a compromise between range and
resolution. Lower frequency systems provide longer range (allowing a larger
area to be covered in each pass), whilst higher frequency systems provide a higher definition image
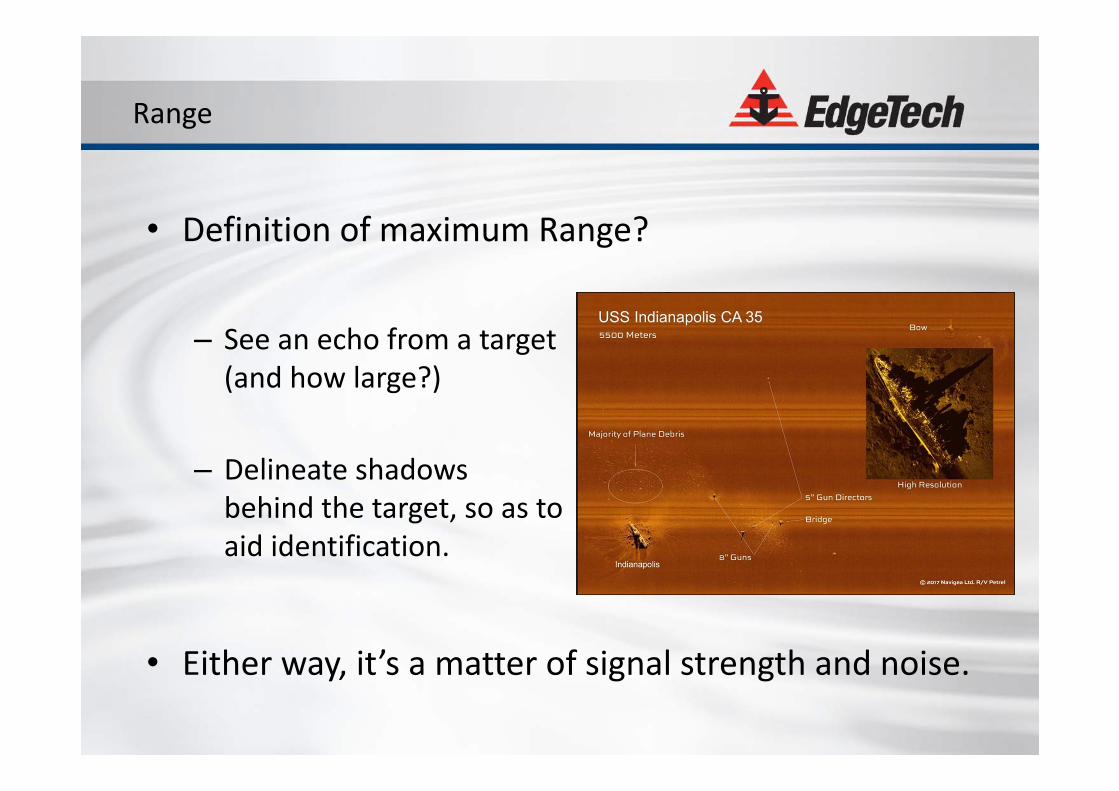
– See an echo from a target (and how large?)
– Delineate shadows behind the target, so as to aid identification.
Range
• Definition of maximum Range?
• Either way, it’s a matter of signal strength and noise.
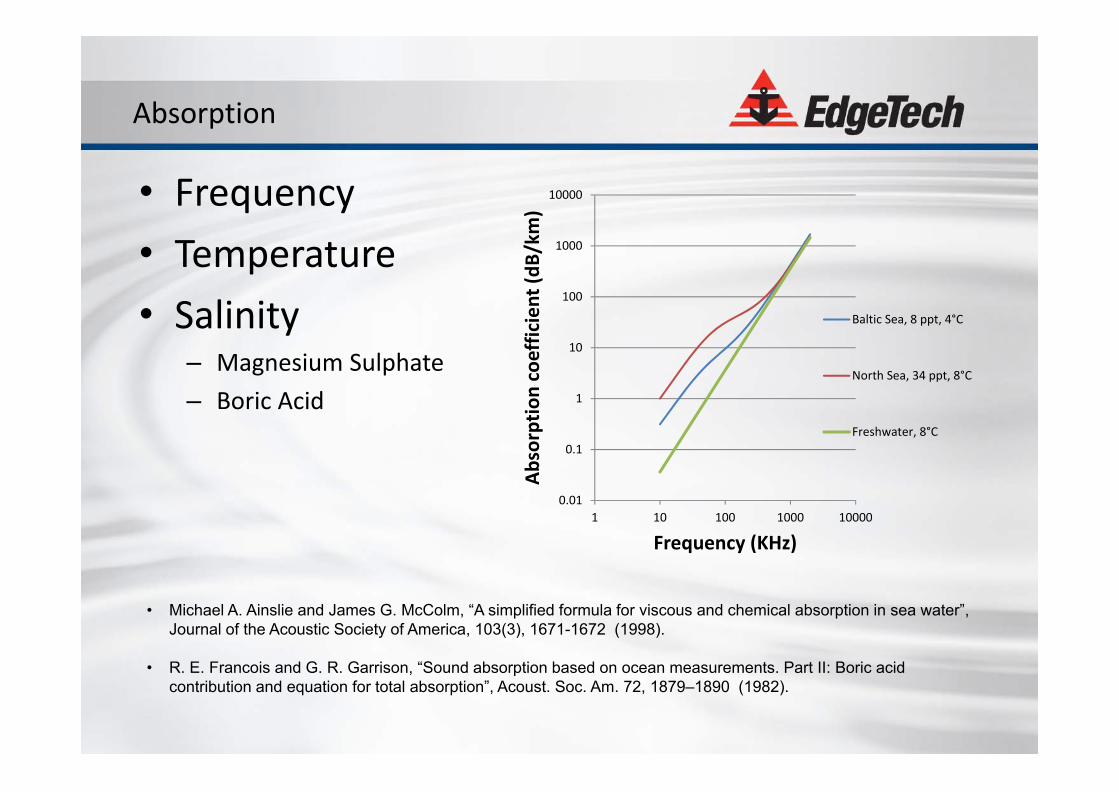
• Frequency• Temperature• Salinity
– Magnesium Sulphate– Boric Acid
Absorption
• Michael A. Ainslie and James G. McColm, “A simplified formula for viscous and chemical absorption in sea water”, Journal of the Acoustic Society of America, 103(3), 1671-1672 (1998).
• R. E. Francois and G. R. Garrison, “Sound absorption based on ocean measurements. Part II: Boric acid contribution and equation for total absorption”, Acoust. Soc. Am. 72, 1879–1890 (1982).
0.01
0.1
1
10
100
1000
10000
1 10 100 1000 10000Ab
sorptio
n coeffic
ient (d
B/km
)Frequency (KHz)
Baltic Sea, 8 ppt, 4°C
North Sea, 34 ppt, 8°C
Freshwater, 8°C
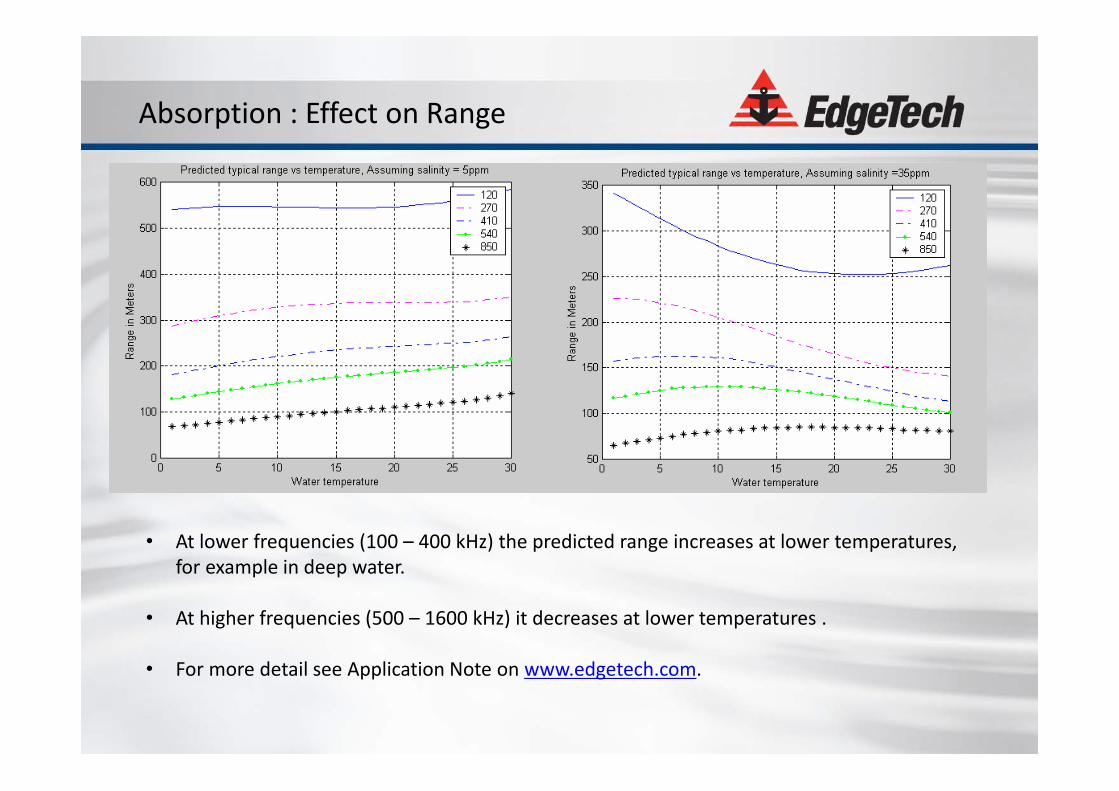
• At lower frequencies (100 – 400 kHz) the predicted range increases at lower temperatures, for example in deep water.
• At higher frequencies (500 – 1600 kHz) it decreases at lower temperatures .
• For more detail see Application Note on www.edgetech.com.
Absorption : Effect on Range
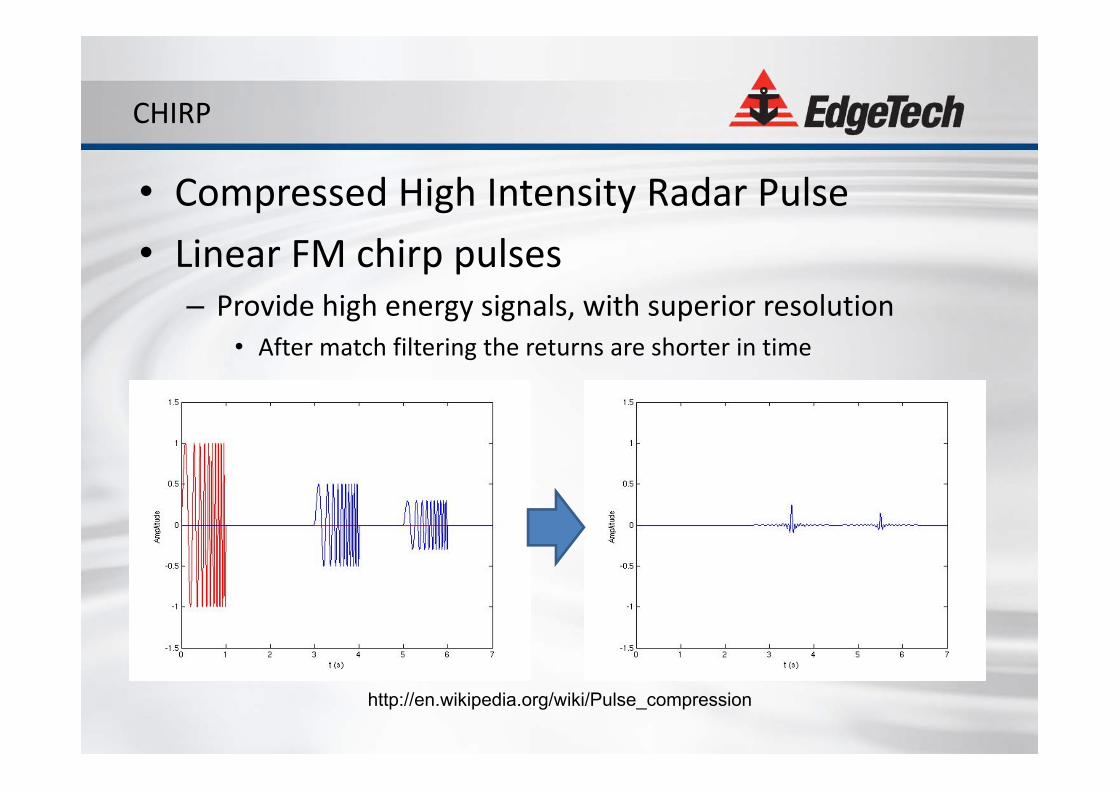
• Compressed High Intensity Radar Pulse• Linear FM chirp pulses
– Provide high energy signals, with superior resolution • After match filtering the returns are shorter in time
CHIRP
http://en.wikipedia.org/wiki/Pulse_compression
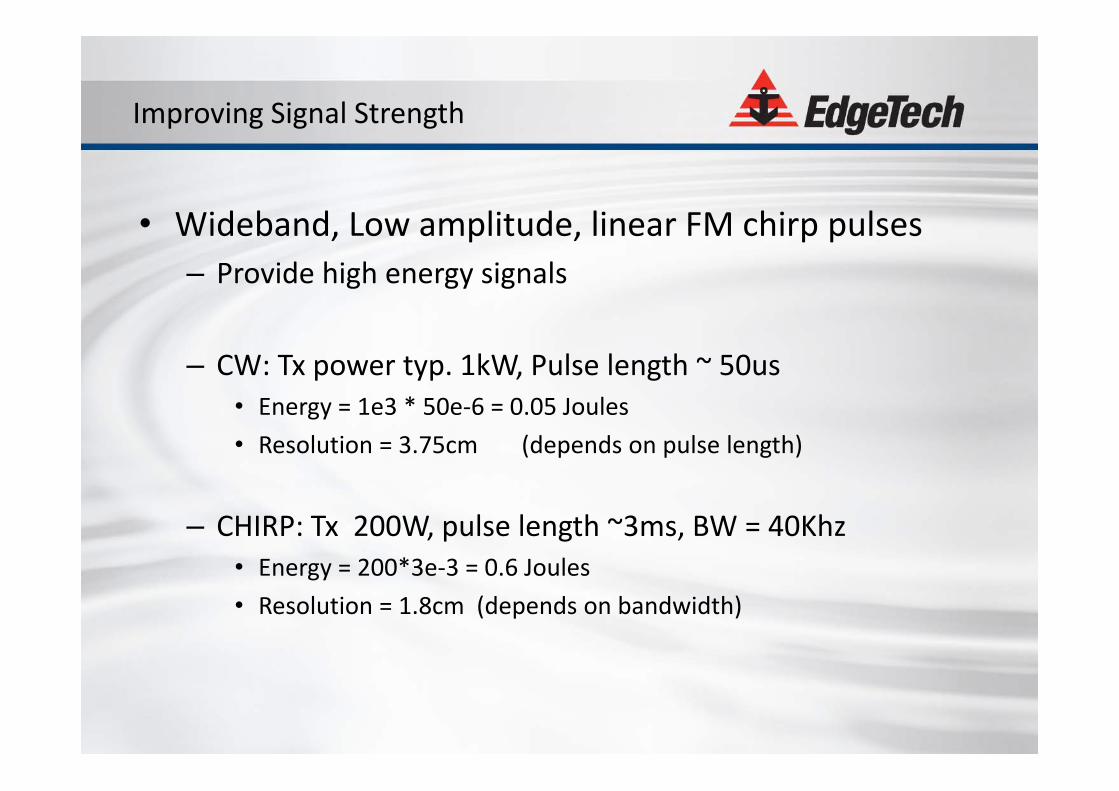
• Wideband, Low amplitude, linear FM chirp pulses– Provide high energy signals
– CW: Tx power typ. 1kW, Pulse length ~ 50us• Energy = 1e3 * 50e‐6 = 0.05 Joules • Resolution = 3.75cm (depends on pulse length)
– CHIRP: Tx 200W, pulse length ~3ms, BW = 40Khz• Energy = 200*3e‐3 = 0.6 Joules• Resolution = 1.8cm (depends on bandwidth)
Improving Signal Strength
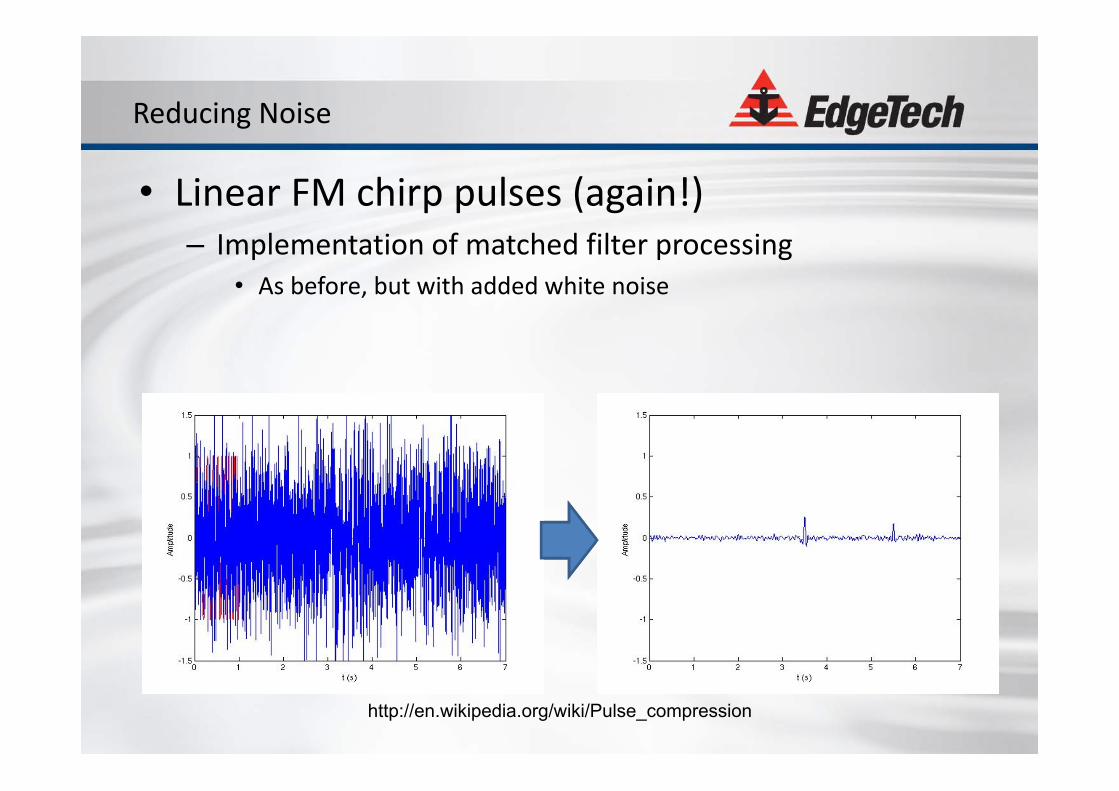
• Linear FM chirp pulses (again!)– Implementation of matched filter processing
• As before, but with added white noise
Reducing Noise
http://en.wikipedia.org/wiki/Pulse_compression
More Signal…
Less Noise….
Better Range
EdgeTech Full Spectrum®
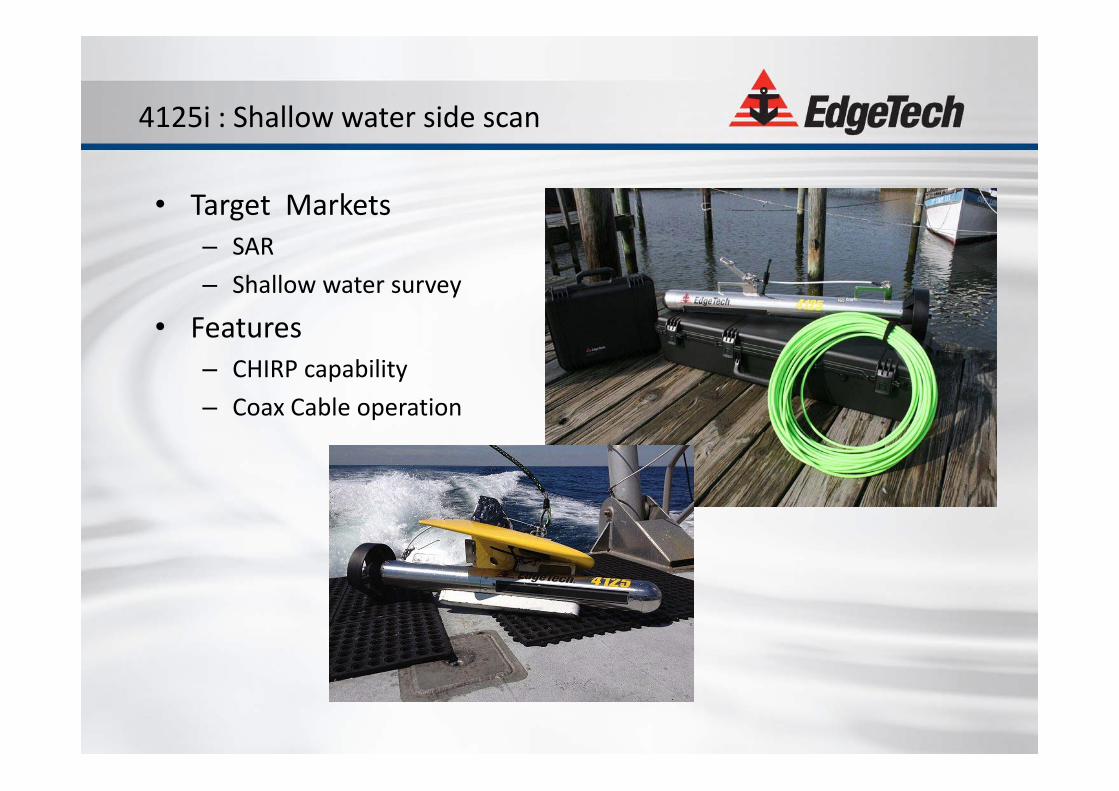
4125i : Shallow water side scan
• Target Markets– SAR– Shallow water survey
• Features– CHIRP capability– Coax Cable operation
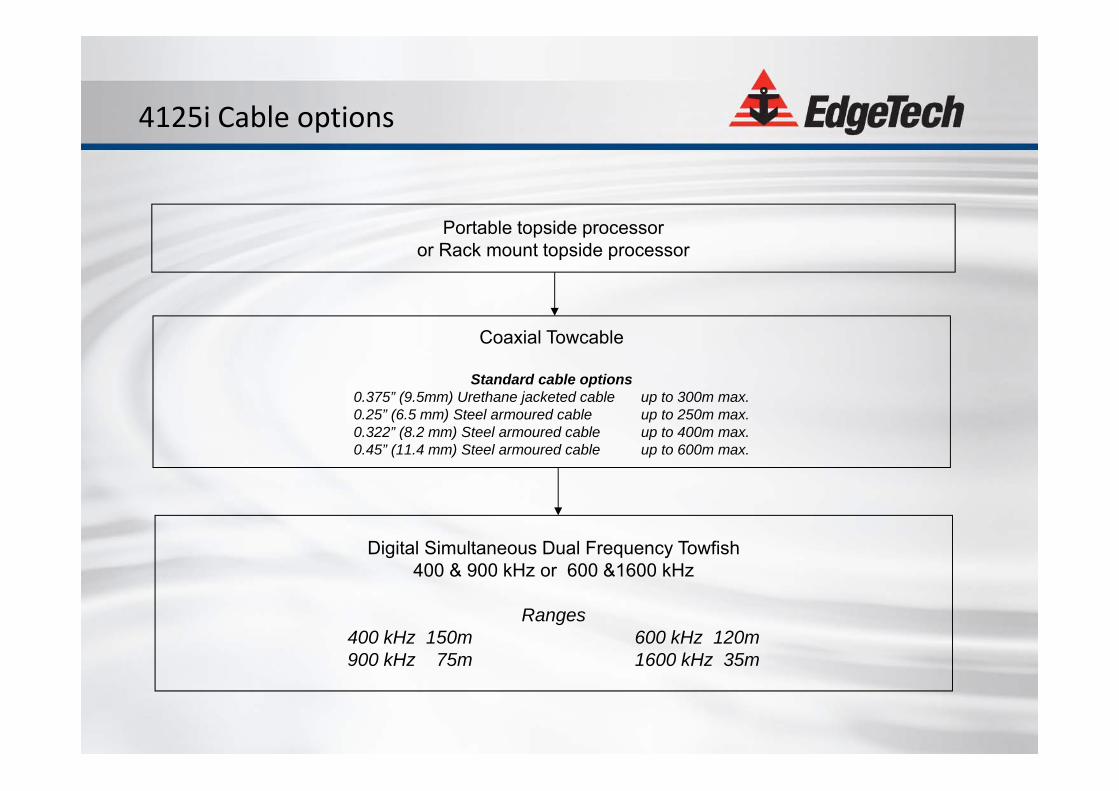
Digital Simultaneous Dual Frequency Towfish400 & 900 kHz or 600 &1600 kHz
Ranges400 kHz 150m 600 kHz 120m900 kHz 75m 1600 kHz 35m
Portable topside processoror Rack mount topside processor
4125i Cable options
Coaxial Towcable
Standard cable options0.375” (9.5mm) Urethane jacketed cable up to 300m max.0.25” (6.5 mm) Steel armoured cable up to 250m max.0.322” (8.2 mm) Steel armoured cable up to 400m max.0.45” (11.4 mm) Steel armoured cable up to 600m max.
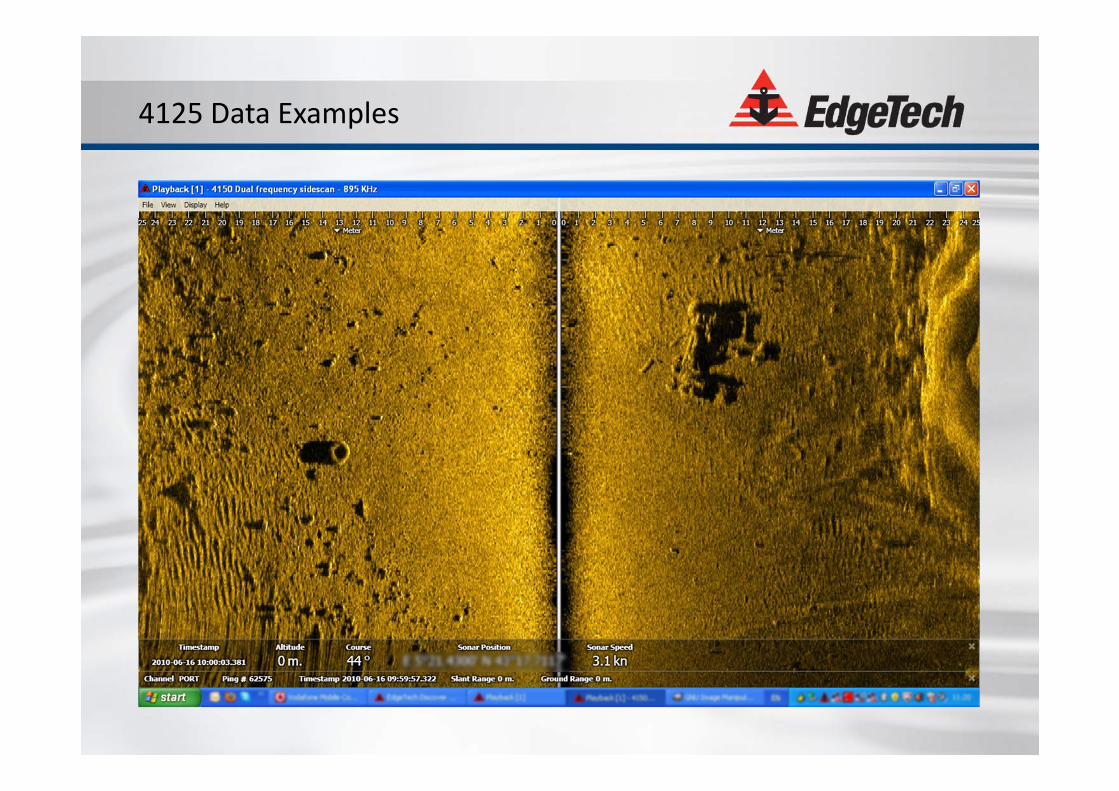
4125 Data Examples
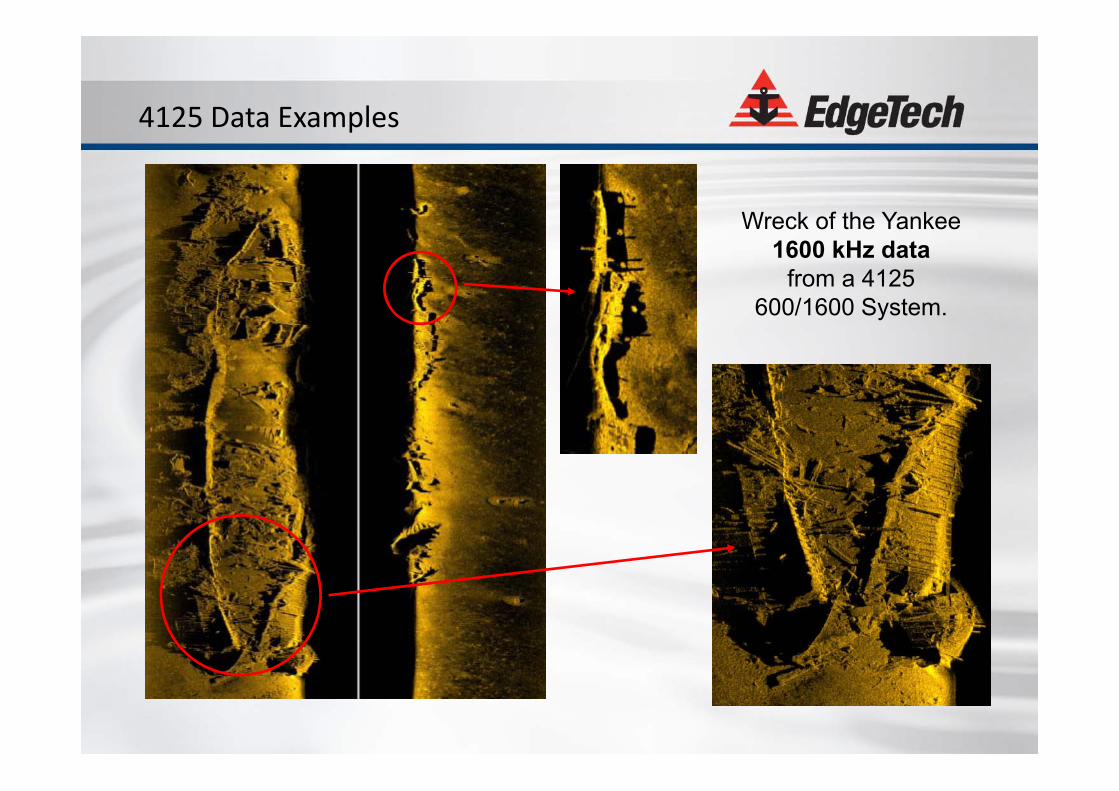
4125 Data Examples
Wreck of the Yankee1600 kHz data
from a 4125 600/1600 System.
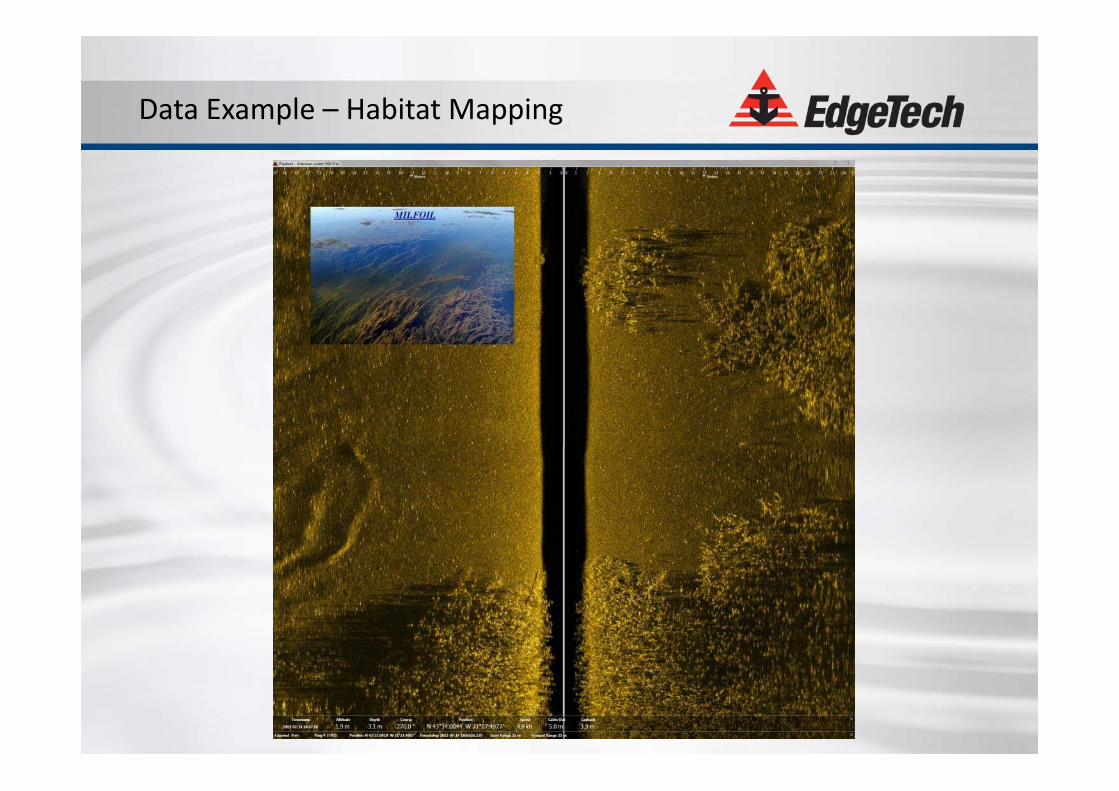
Data Example – Habitat Mapping
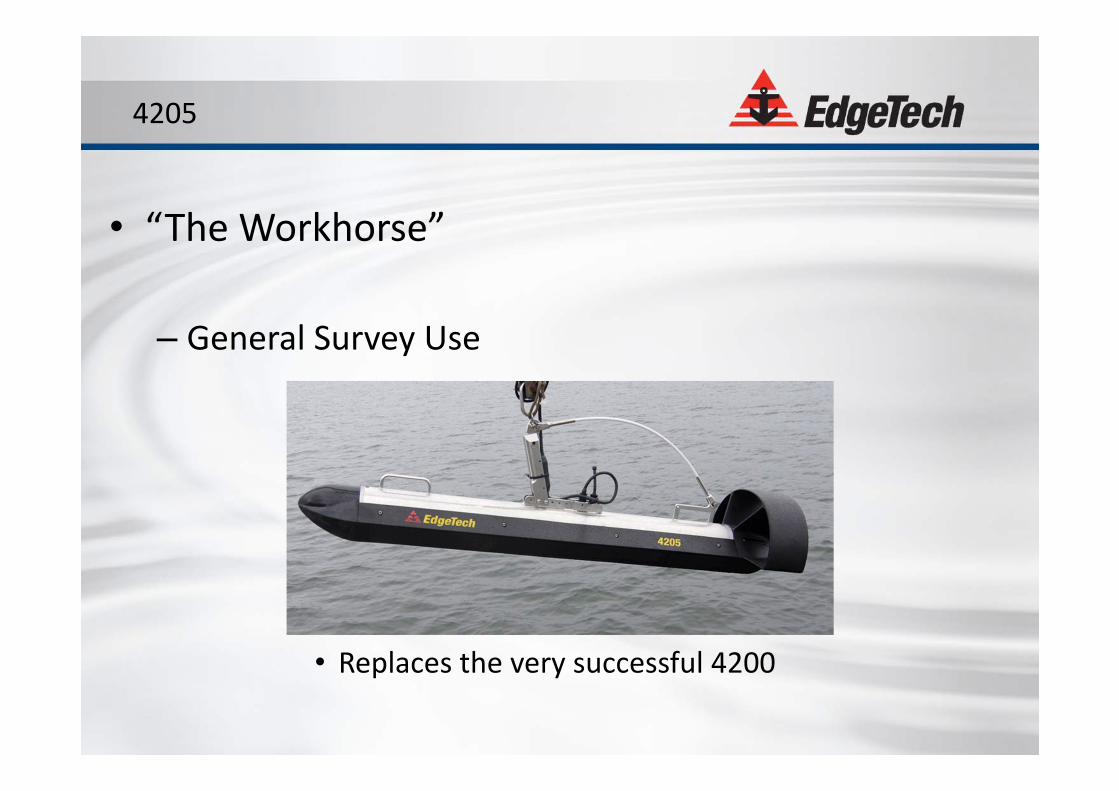
• “The Workhorse”
– General Survey Use
• Replaces the very successful 4200
4205
4205
• The EdgeTech 4205 builds on the success if the 4200, whilst providing improvements in a number of key areas :
Improved range performance
Improved resolution
Options for an improved Heading sensor
Increased power for external sensor
Backward compatibility with more recent 4200 topsides
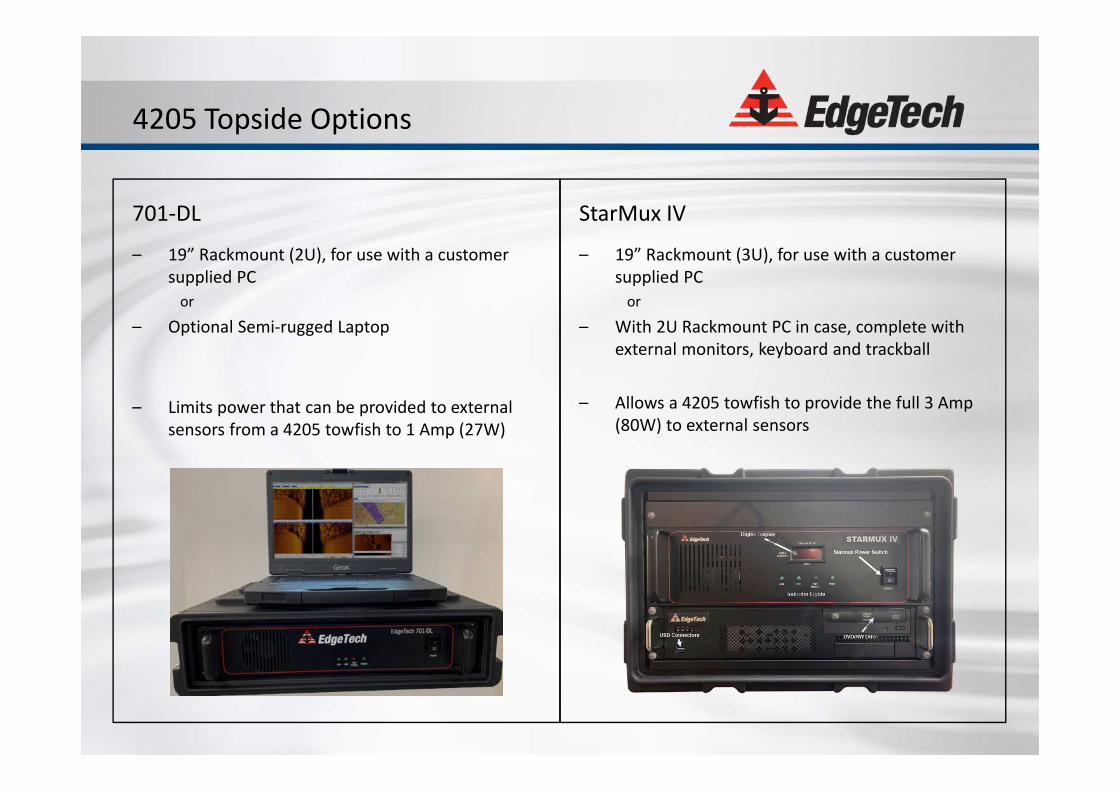
4205 Topside Options
701‐DL
– 19” Rackmount (2U), for use with a customer supplied PCor
– Optional Semi‐rugged Laptop
– Limits power that can be provided to external sensors from a 4205 towfish to 1 Amp (27W)
StarMux IV
– 19” Rackmount (3U), for use with a customer supplied PCor
– With 2U Rackmount PC in case, complete with external monitors, keyboard and trackball
– Allows a 4205 towfish to provide the full 3 Amp (80W) to external sensors
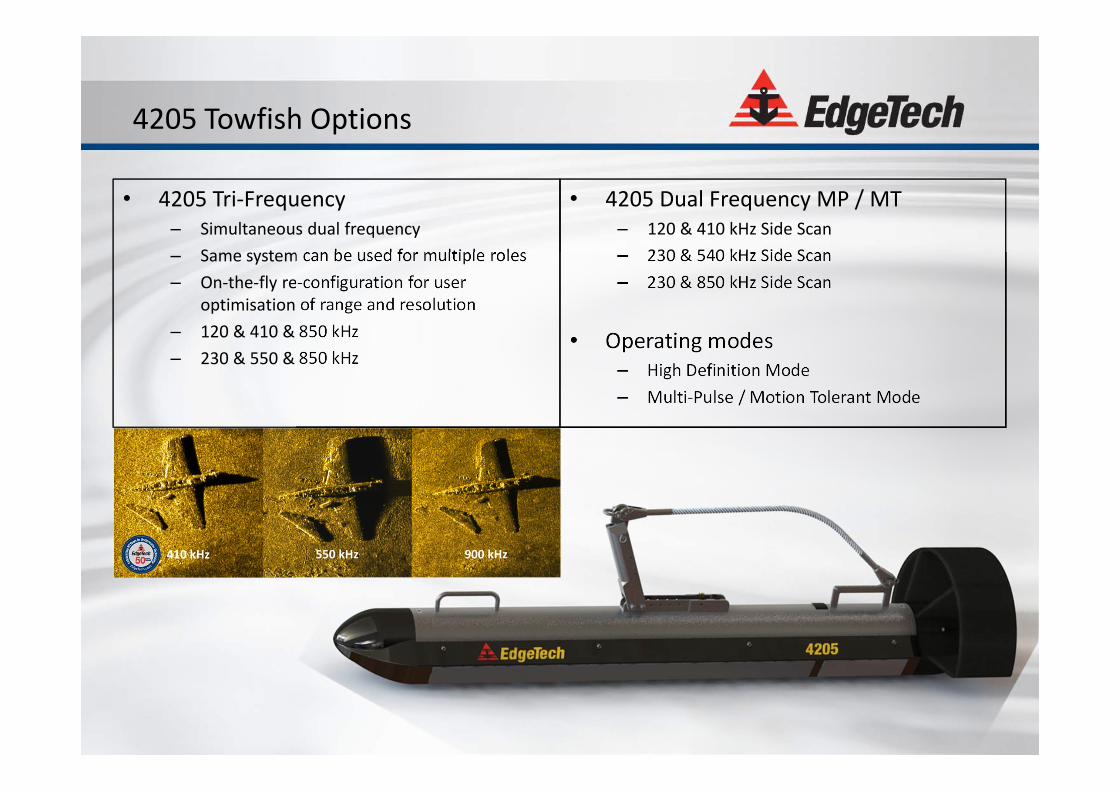
4205 Towfish Options
• 4205 Tri‐Frequency– Simultaneous dual frequency– Same system can be used for multiple roles– On‐the‐fly re‐configuration for user
optimisation of range and resolution– 120 & 410 & 850 kHz– 230 & 550 & 850 kHz
• 4205 Dual Frequency MP / MT– 120 & 410 kHz Side Scan – 230 & 540 kHz Side Scan – 230 & 850 kHz Side Scan
• Operating modes– High Definition Mode– Multi‐Pulse / Motion Tolerant Mode
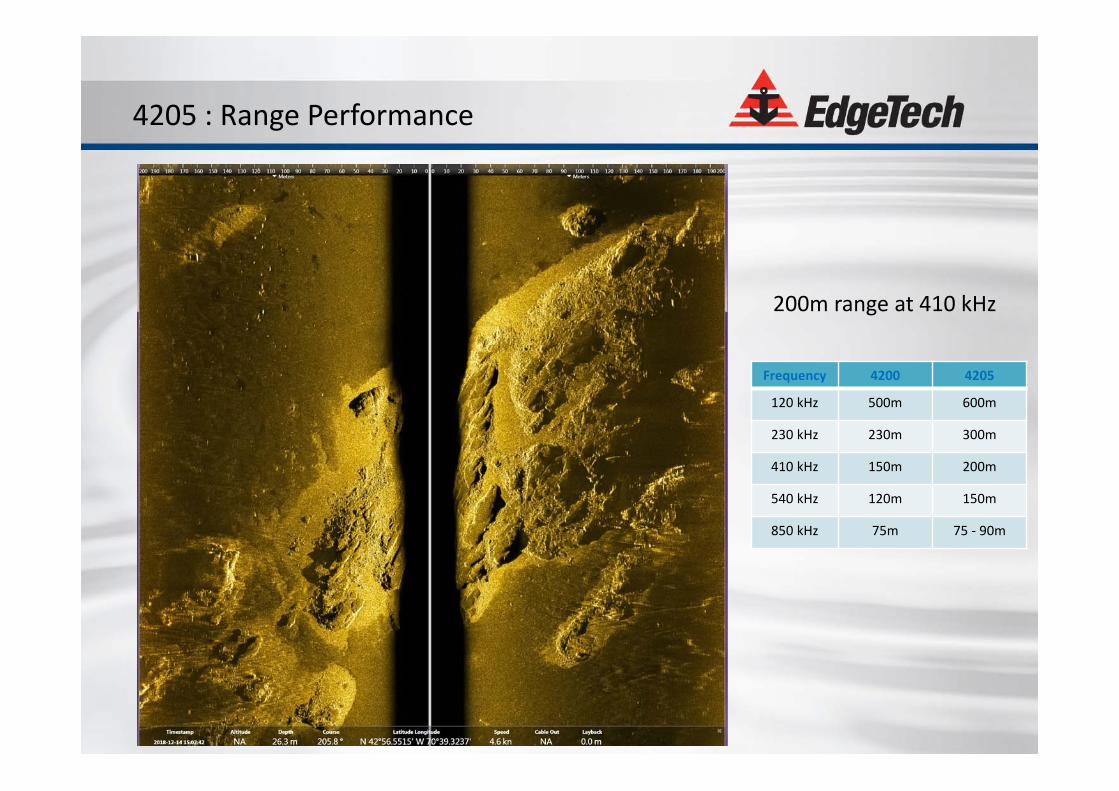
4205 : Range Performance
200m range at 410 kHz
Frequency 4200 4205
120 kHz 500m 600m
230 kHz 230m 300m
410 kHz 150m 200m
540 kHz 120m 150m
850 kHz 75m 75 ‐ 90m
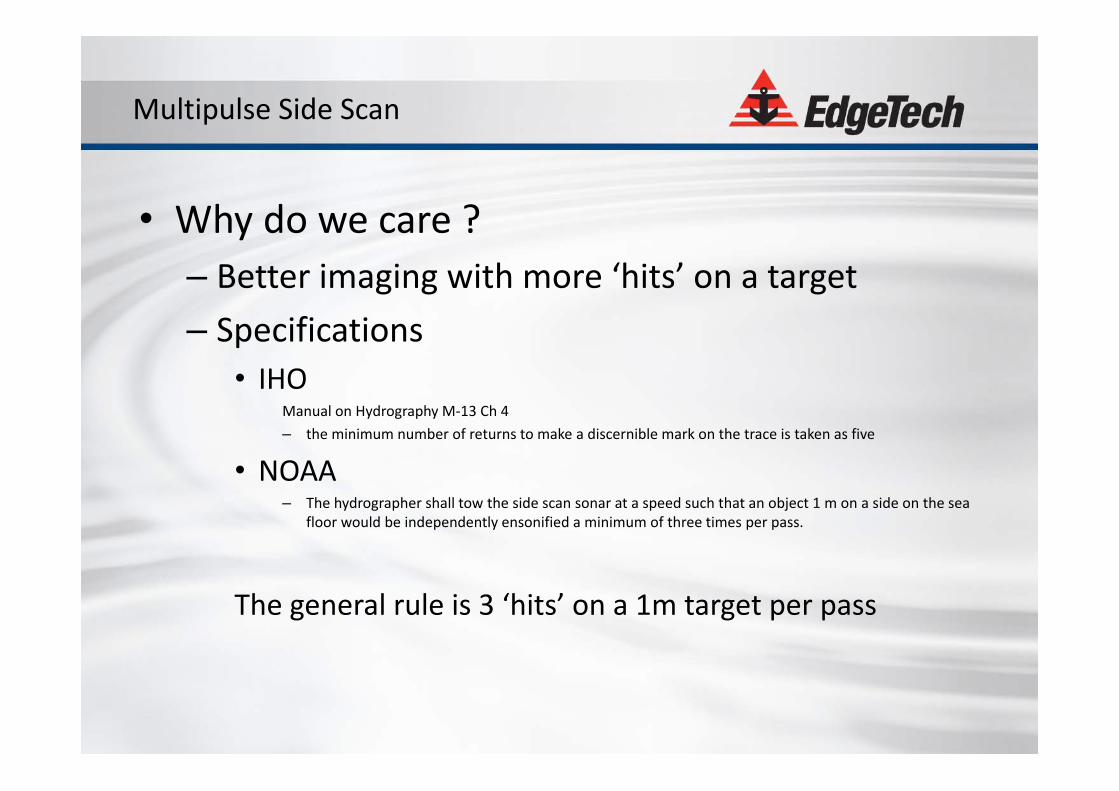
• Why do we care ?– Better imaging with more ‘hits’ on a target– Specifications
• IHOManual on Hydrography M‐13 Ch 4– the minimum number of returns to make a discernible mark on the trace is taken as five
• NOAA– The hydrographer shall tow the side scan sonar at a speed such that an object 1 m on a side on the sea
floor would be independently ensonified a minimum of three times per pass.
The general rule is 3 ‘hits’ on a 1m target per pass
Multipulse Side Scan
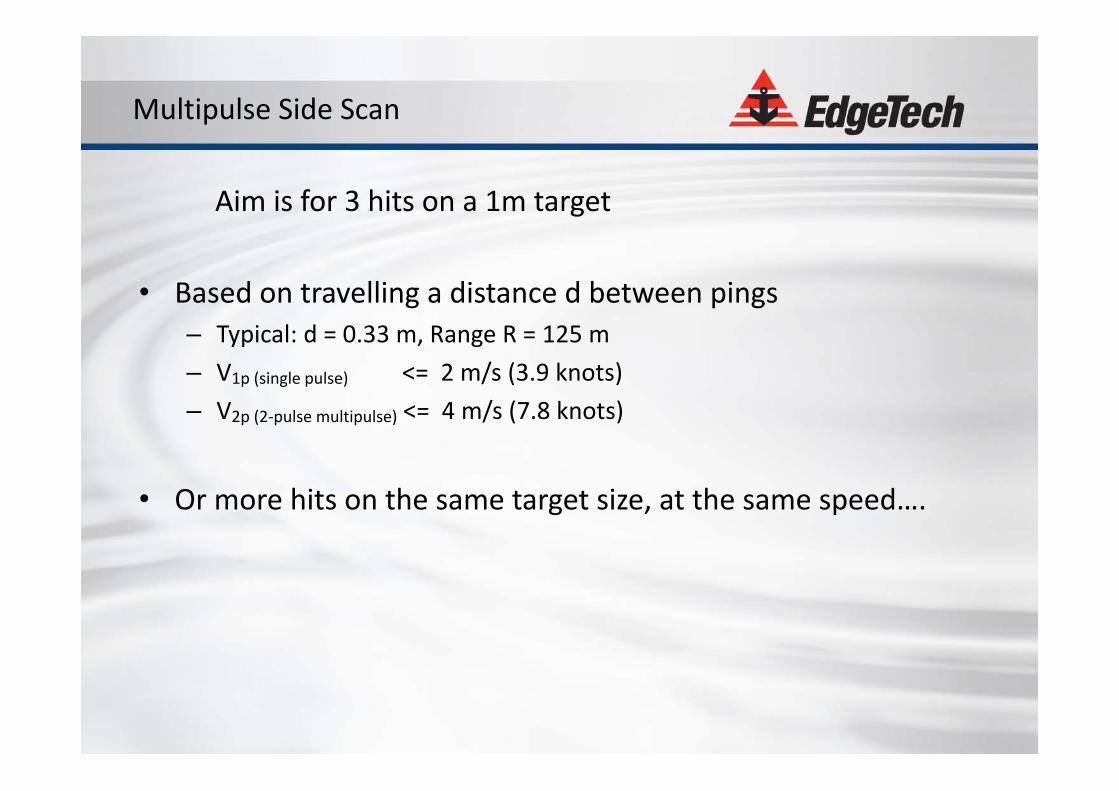
• Based on travelling a distance d between pings– Typical: d = 0.33 m, Range R = 125 m– V1p (single pulse) <= 2 m/s (3.9 knots)– V2p (2‐pulse multipulse) <= 4 m/s (7.8 knots)
• Or more hits on the same target size, at the same speed….
Multipulse Side Scan
Aim is for 3 hits on a 1m target
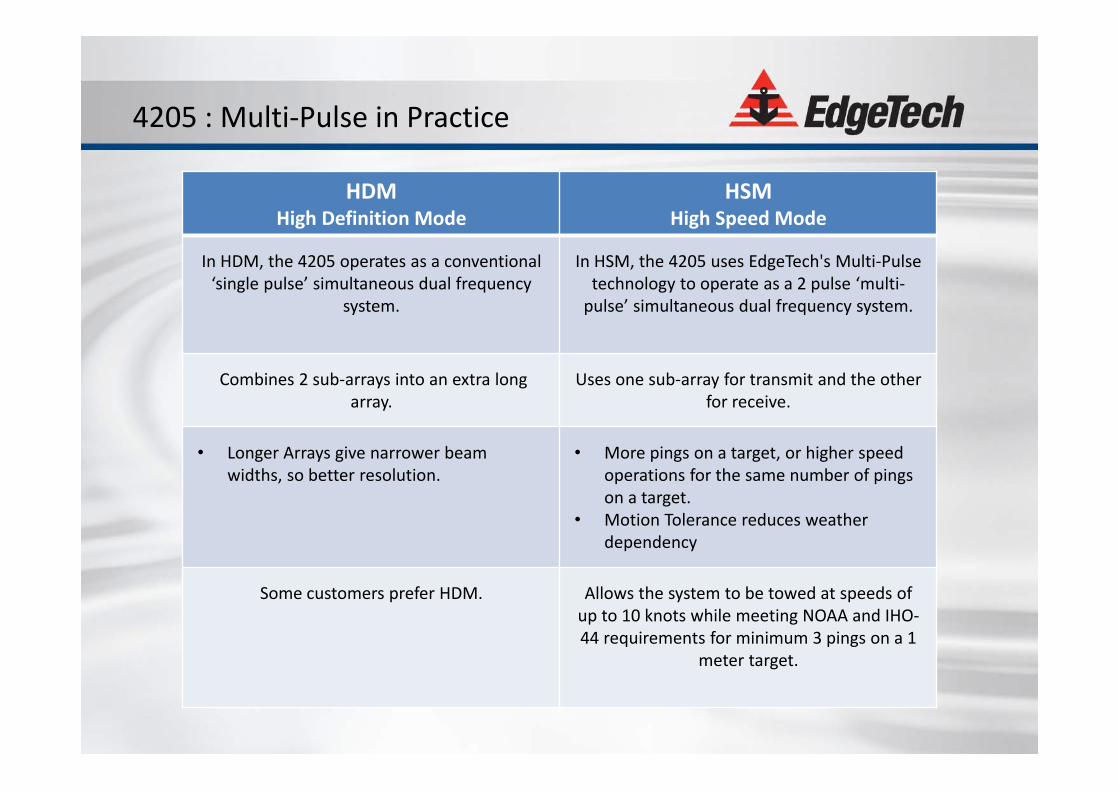
4205 : Multi‐Pulse in Practice
HDMHigh Definition Mode
HSMHigh Speed Mode
In HDM, the 4205 operates as a conventional ‘single pulse’ simultaneous dual frequency
system.
In HSM, the 4205 uses EdgeTech's Multi‐Pulse technology to operate as a 2 pulse ‘multi‐pulse’ simultaneous dual frequency system.
Combines 2 sub‐arrays into an extra long array.
Uses one sub‐array for transmit and the other for receive.
• Longer Arrays give narrower beam widths, so better resolution.
• More pings on a target, or higher speed operations for the same number of pings on a target.
• Motion Tolerance reduces weather dependency
Some customers prefer HDM. Allows the system to be towed at speeds of up to 10 knots while meeting NOAA and IHO‐44 requirements for minimum 3 pings on a 1
meter target.
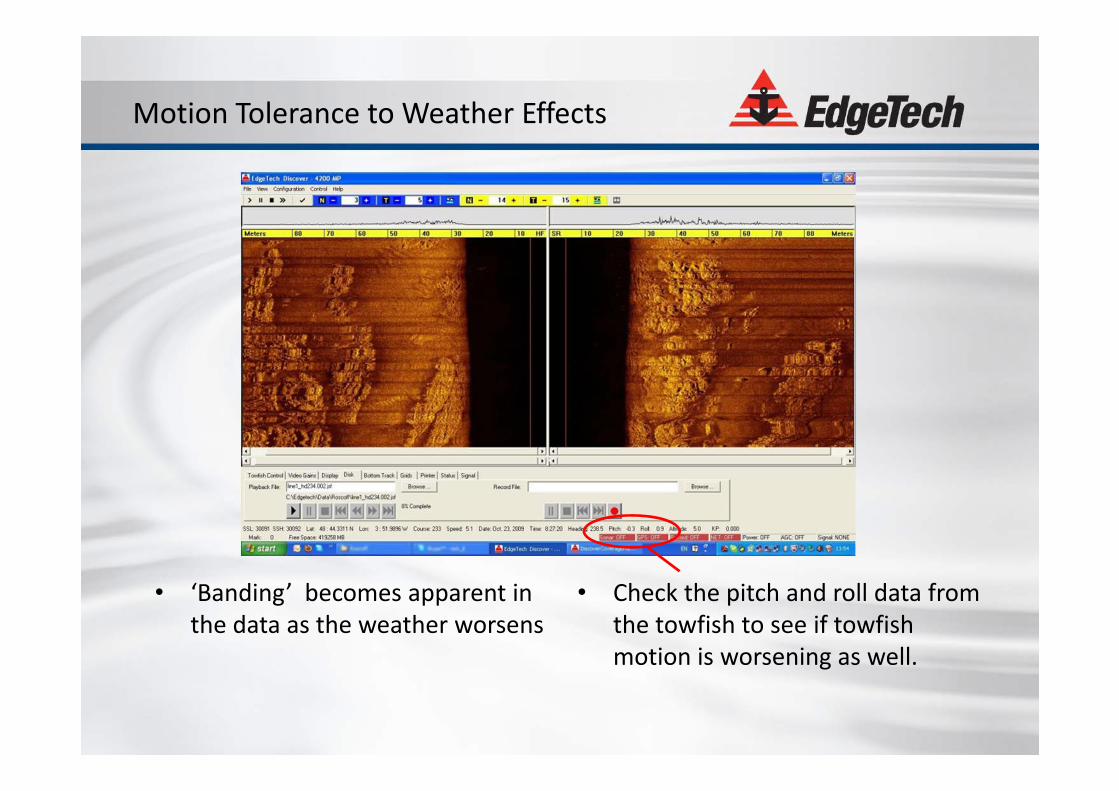
Motion Tolerance to Weather Effects
• ‘Banding’ becomes apparent in the data as the weather worsens
• Check the pitch and roll data from the towfish to see if towfish motion is worsening as well.
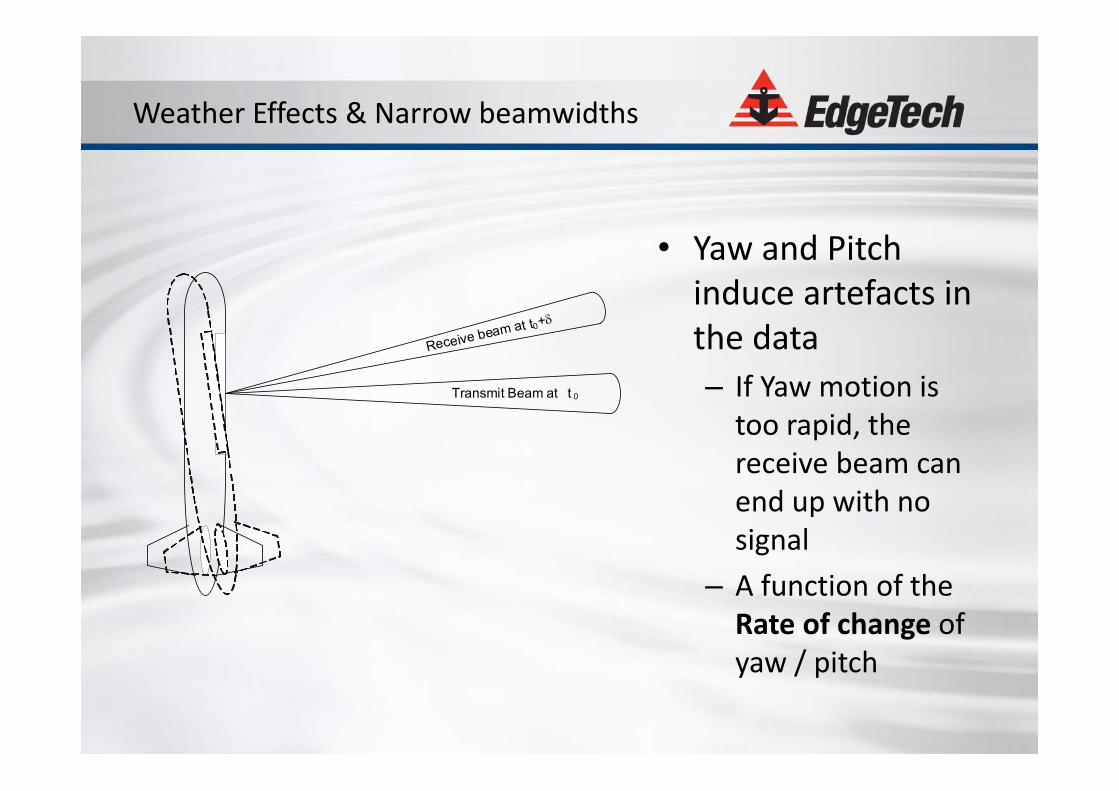
• Yaw and Pitch induce artefacts in the data– If Yaw motion is too rapid, the receive beam can end up with no signal
– A function of the Rate of change of yaw / pitch
Weather Effects & Narrow beamwidths
Transmit Beam at t 0
Receive beam at t0+
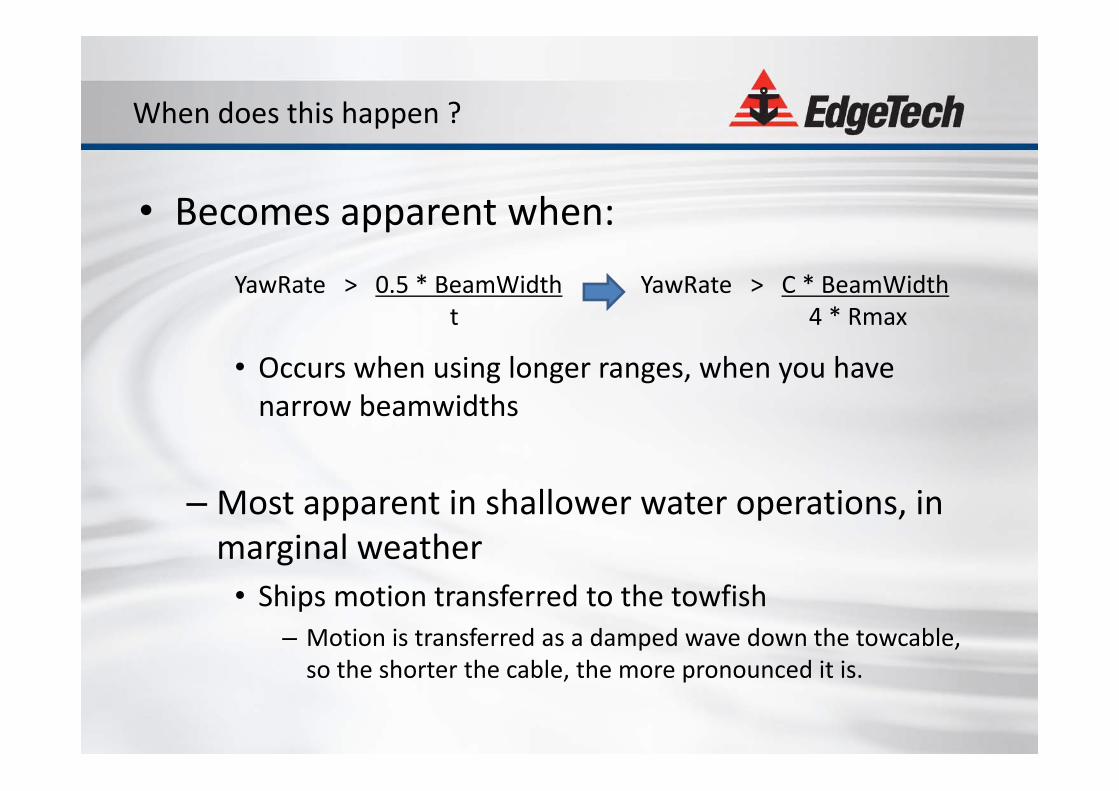
• Becomes apparent when:
YawRate > 0.5 * BeamWidth YawRate > C * BeamWidtht 4 * Rmax
• Occurs when using longer ranges, when you have narrow beamwidths
– Most apparent in shallower water operations, in marginal weather
• Ships motion transferred to the towfish– Motion is transferred as a damped wave down the towcable, so the shorter the cable, the more pronounced it is.
When does this happen ?
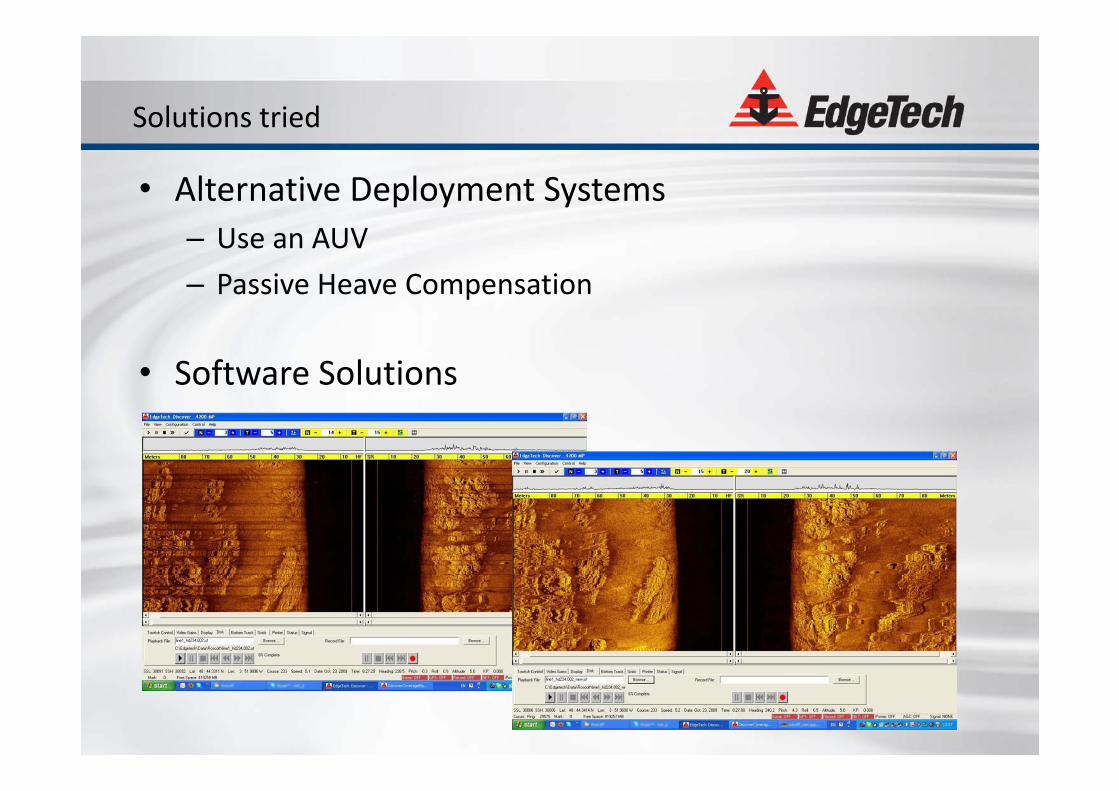
• Alternative Deployment Systems– Use an AUV– Passive Heave Compensation
• Software Solutions
Solutions tried
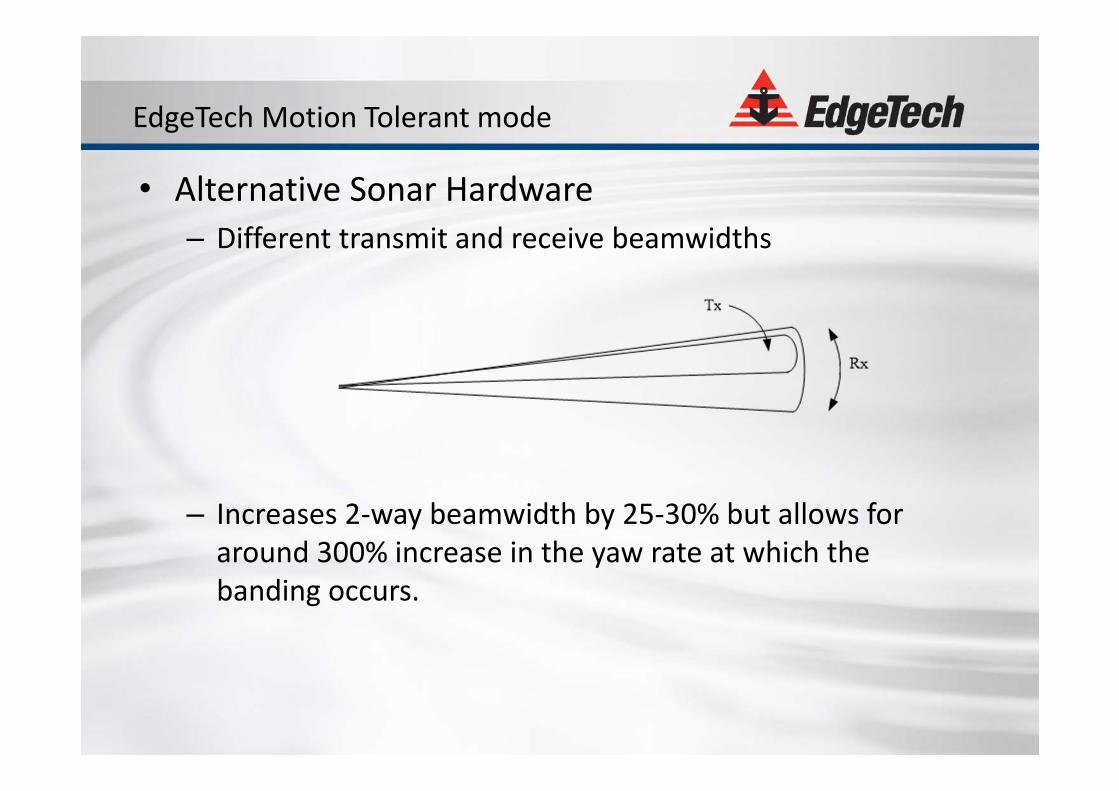
• Alternative Sonar Hardware– Different transmit and receive beamwidths
– Increases 2‐way beamwidth by 25‐30% but allows for around 300% increase in the yaw rate at which the banding occurs.
EdgeTech Motion Tolerant mode
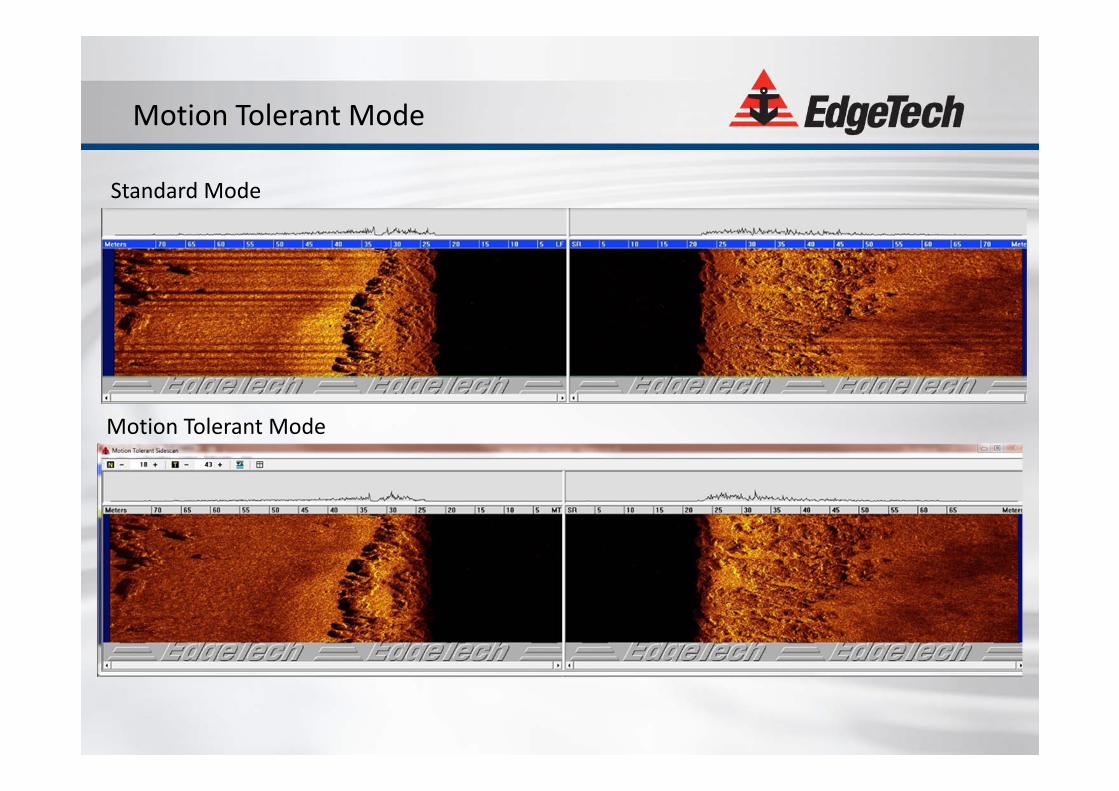
Motion Tolerant Mode
Standard Mode
Motion Tolerant Mode
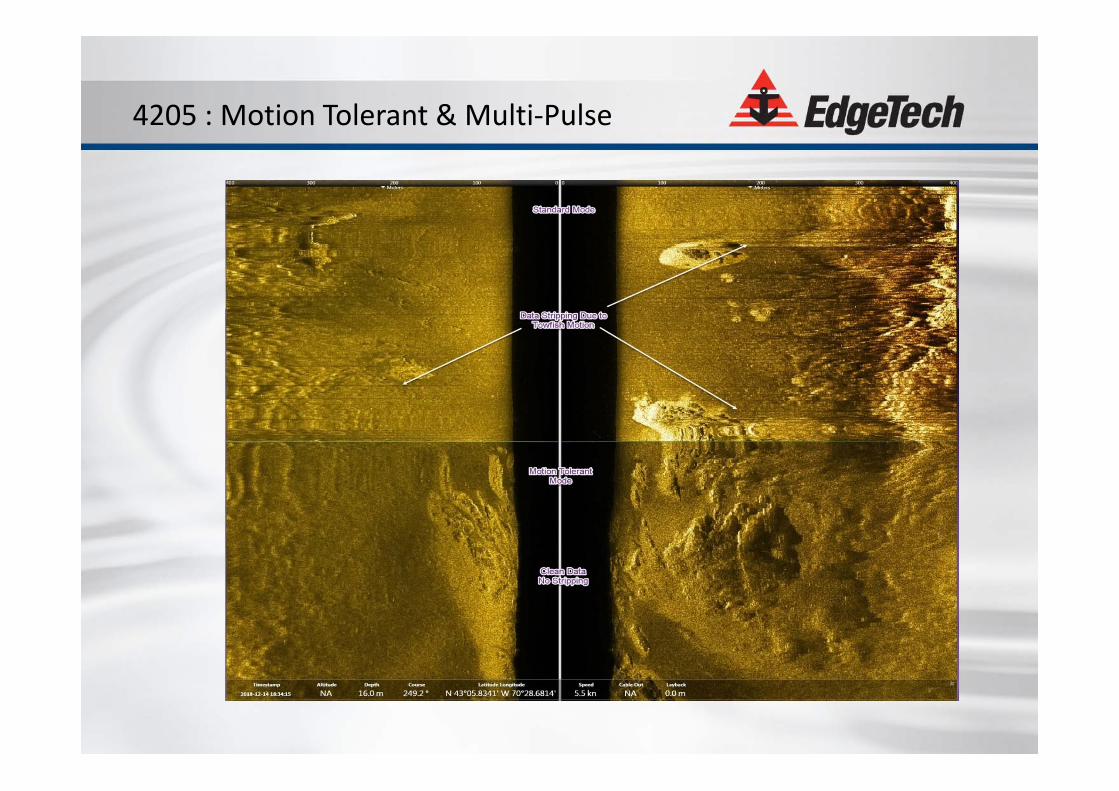
4205 : Motion Tolerant & Multi‐Pulse
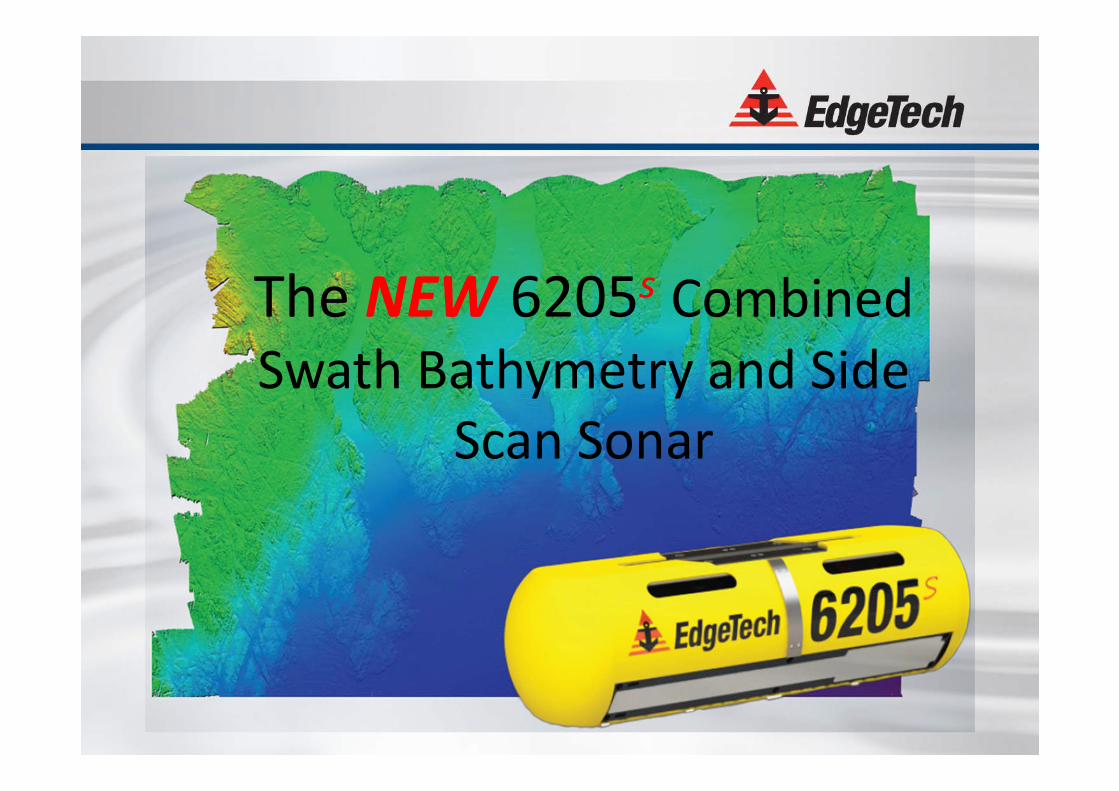
The NEW 6205s Combined Swath Bathymetry and Side
Scan Sonar
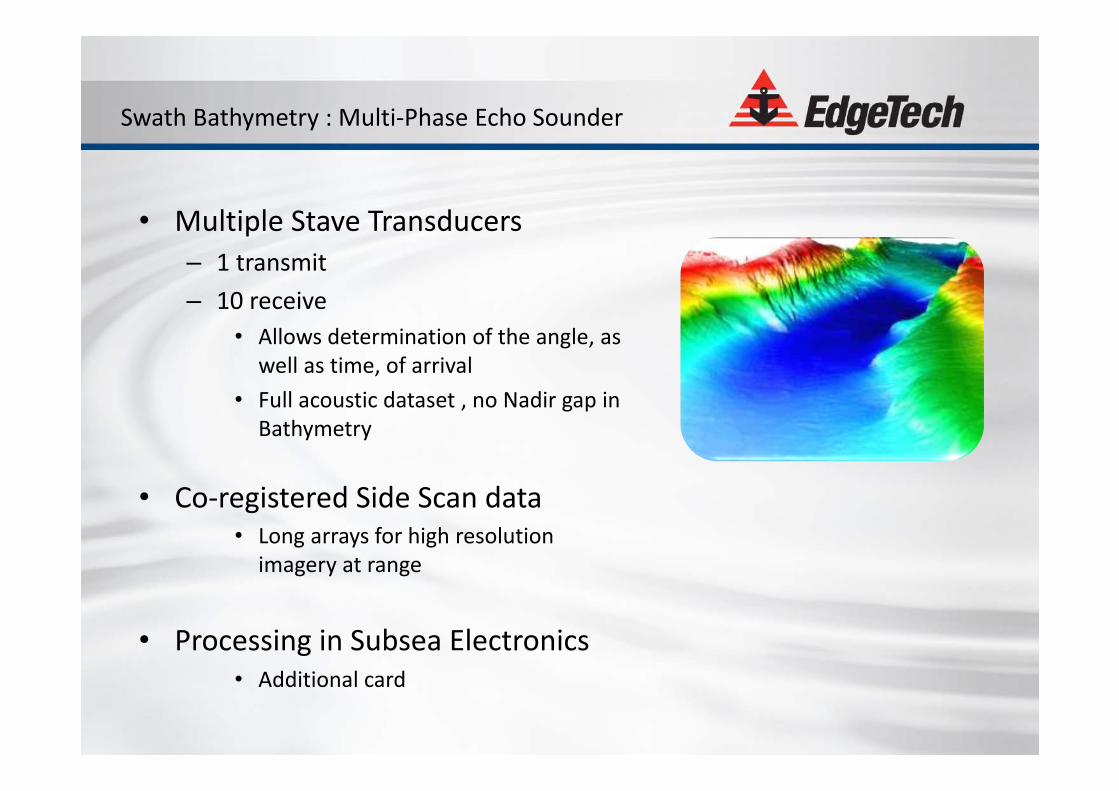
• Multiple Stave Transducers– 1 transmit– 10 receive
• Allows determination of the angle, as well as time, of arrival
• Full acoustic dataset , no Nadir gap in Bathymetry
• Co‐registered Side Scan data• Long arrays for high resolution
imagery at range
• Processing in Subsea Electronics• Additional card
Swath Bathymetry : Multi‐Phase Echo Sounder
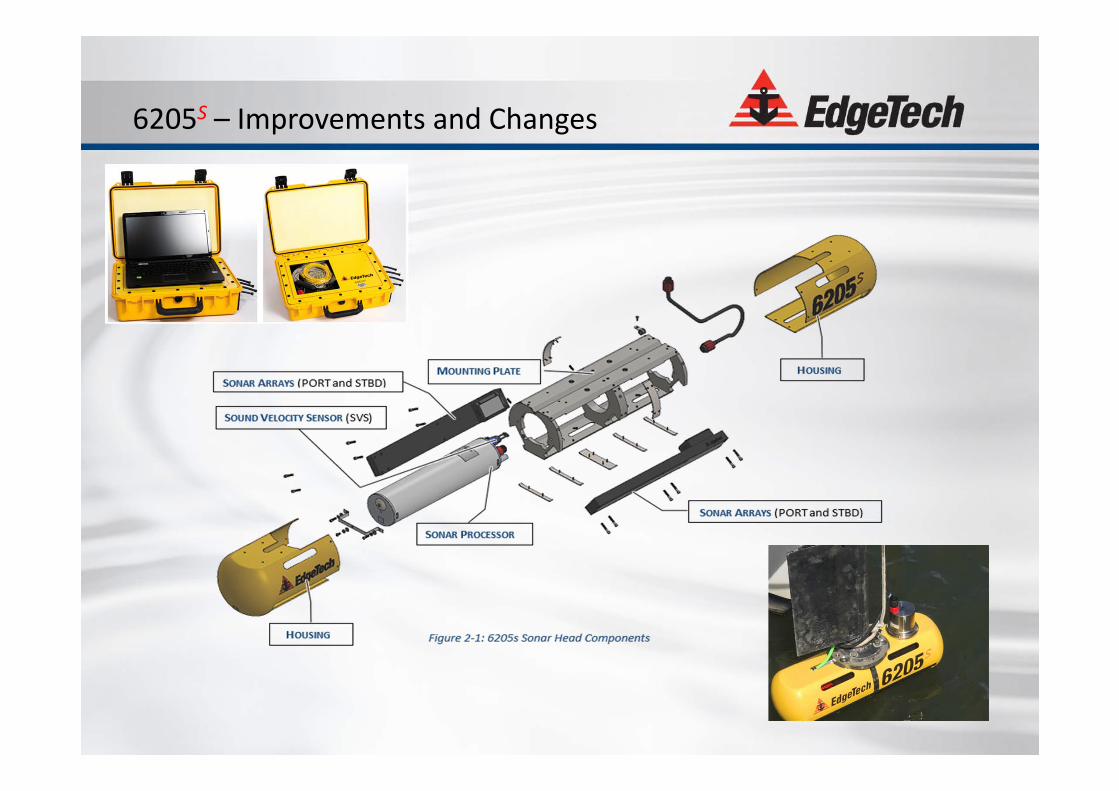
6205S – Improvements and Changes
• The EdgeTech 6205s is in a smaller, lighter package with additional features and functions that are sure to make on‐water survey operations even more effective and efficient.
• More specifically, the 6205s incorporates some new features including: Improved bathymetric algorithms that reduce the noise even further
in the wider parts of the swath Motion tolerant side scan, which reduces the banding seen in the
data in adverse weather conditions The switch to a central mounting frame has allowed us to use a
lighter housing material that both reduces weight and also significantly reduces the manufacturing cost.
Mounting points for Applanix and SBG subsea sensors on top of the sonar head
6205S – Improvements and Changes
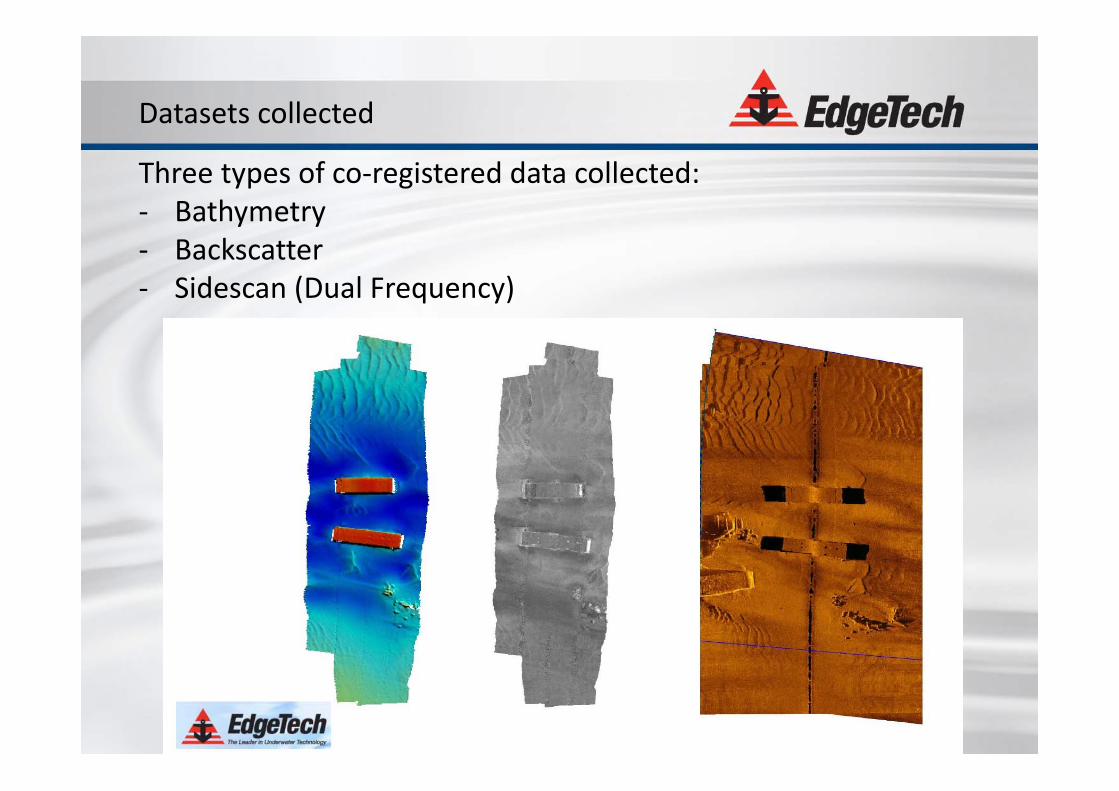
Three types of co‐registered data collected:‐ Bathymetry‐ Backscatter‐ Sidescan (Dual Frequency)
Datasets collected
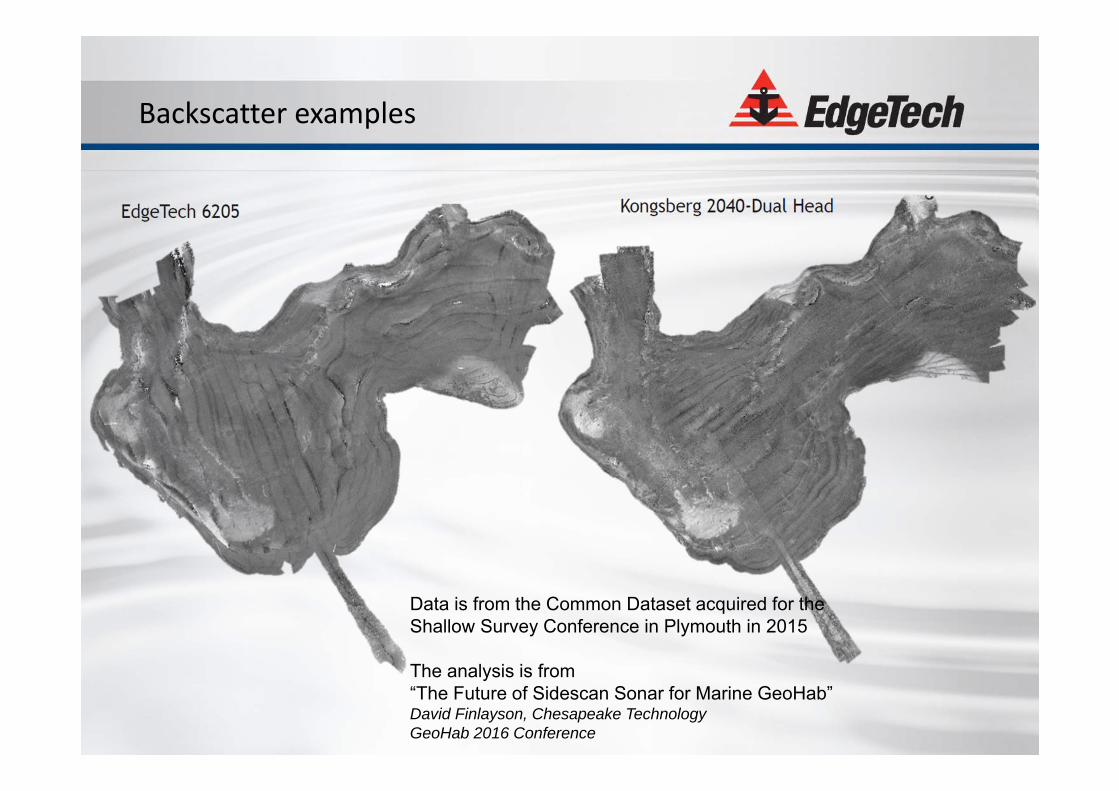
Backscatter examples
Data is from the Common Dataset acquired for the Shallow Survey Conference in Plymouth in 2015
The analysis is from “The Future of Sidescan Sonar for Marine GeoHab”David Finlayson, Chesapeake TechnologyGeoHab 2016 Conference
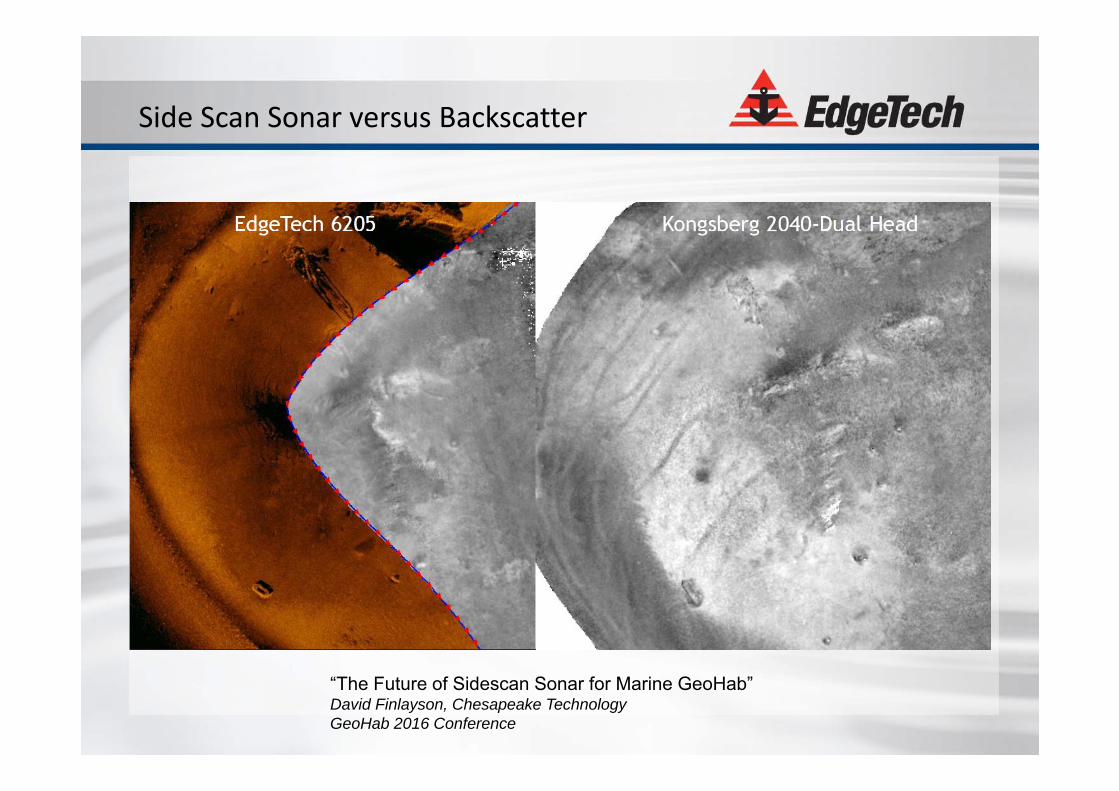
Side Scan Sonar versus Backscatter
“The Future of Sidescan Sonar for Marine GeoHab”David Finlayson, Chesapeake TechnologyGeoHab 2016 Conference
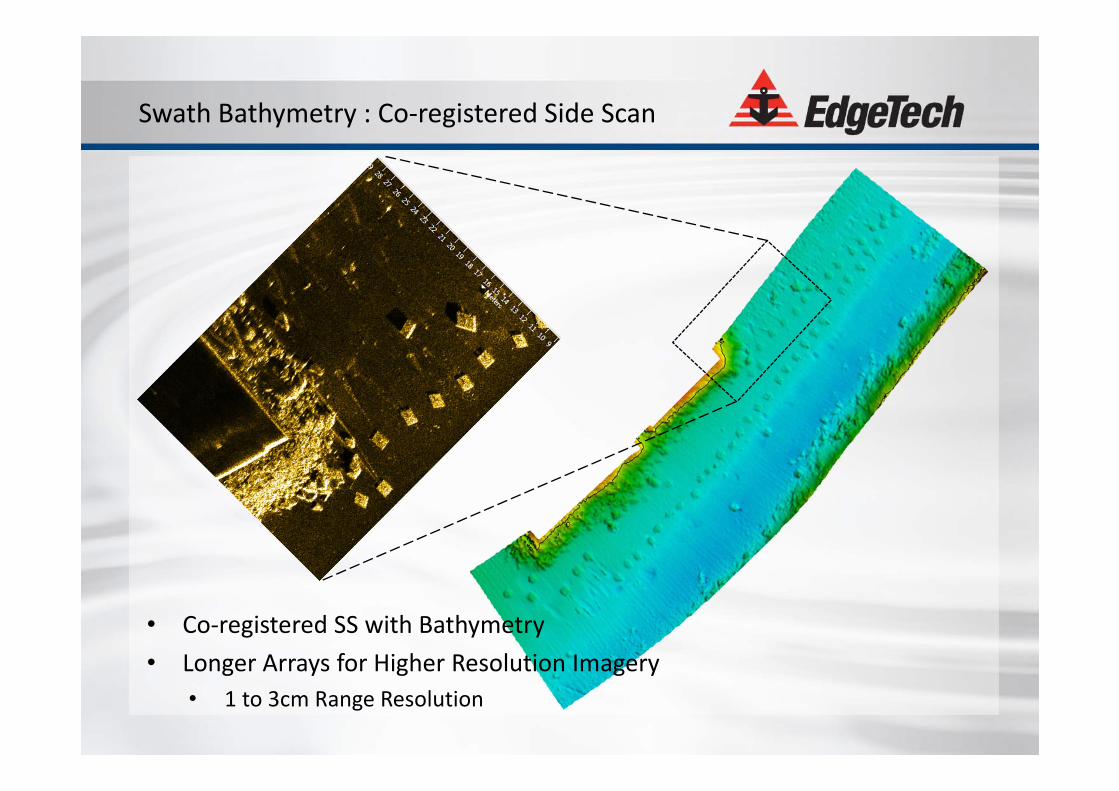
Swath Bathymetry : Co‐registered Side Scan
• Co‐registered SS with Bathymetry • Longer Arrays for Higher Resolution Imagery
• 1 to 3cm Range Resolution
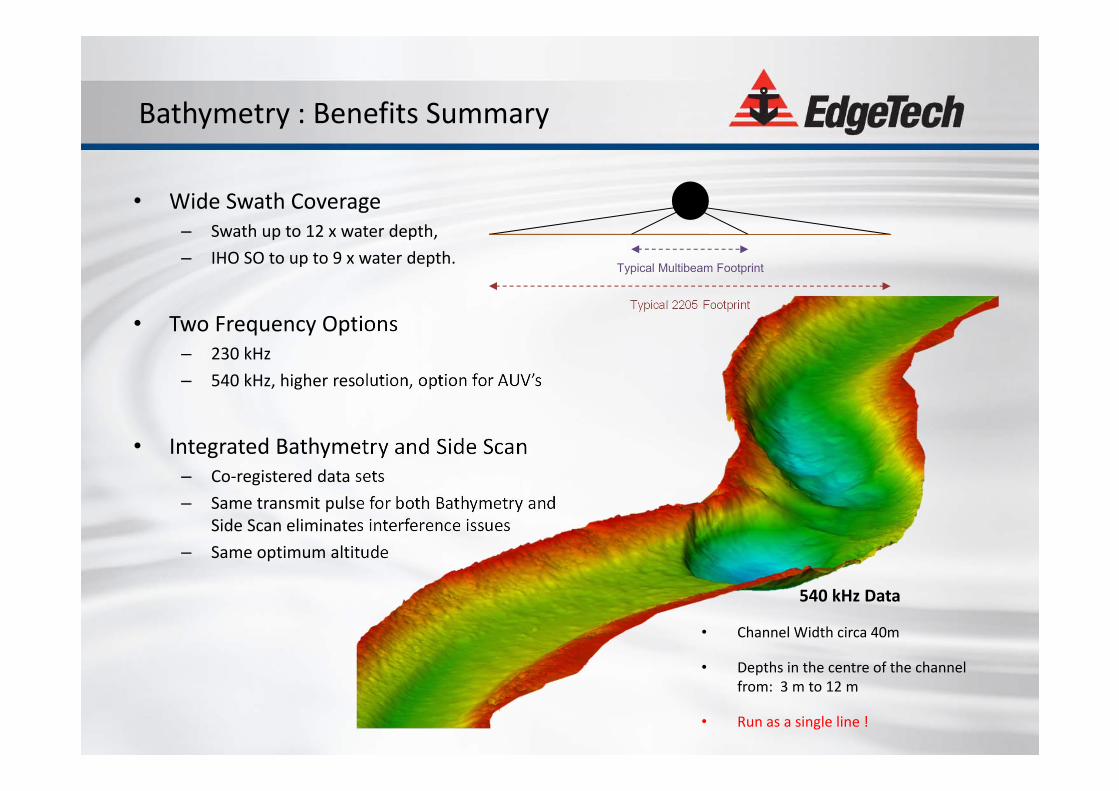
Bathymetry : Benefits Summary
• Wide Swath Coverage– Swath up to 12 x water depth, – IHO SO to up to 9 x water depth.
• Two Frequency Options– 230 kHz– 540 kHz, higher resolution, option for AUV’s
• Integrated Bathymetry and Side Scan – Co‐registered data sets– Same transmit pulse for both Bathymetry and
Side Scan eliminates interference issues– Same optimum altitude
Typical Multibeam Footprint
Typical 2205 Footprint
540 kHz Data
• Channel Width circa 40m
• Depths in the centre of the channel from: 3 m to 12 m
• Run as a single line !
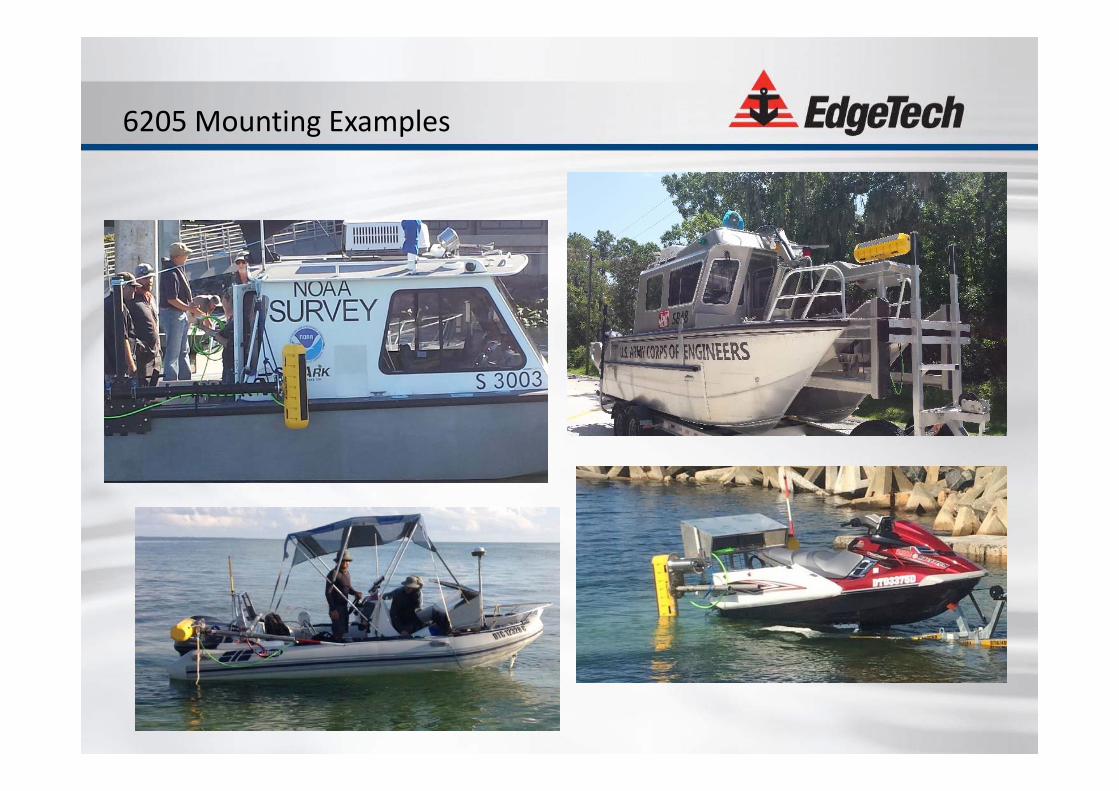
6205 Mounting Examples
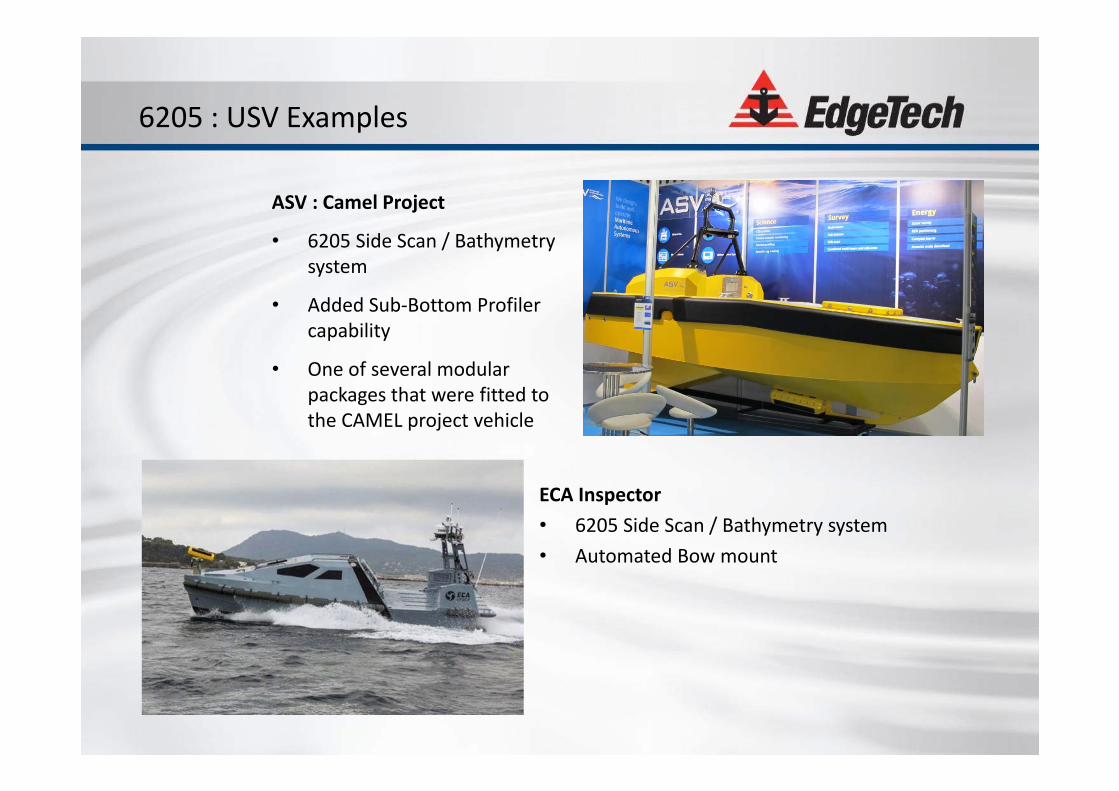
6205 : USV Examples
ASV : Camel Project
• 6205 Side Scan / Bathymetry system
• Added Sub‐Bottom Profiler capability
• One of several modular packages that were fitted to the CAMEL project vehicle
ECA Inspector• 6205 Side Scan / Bathymetry system• Automated Bow mount
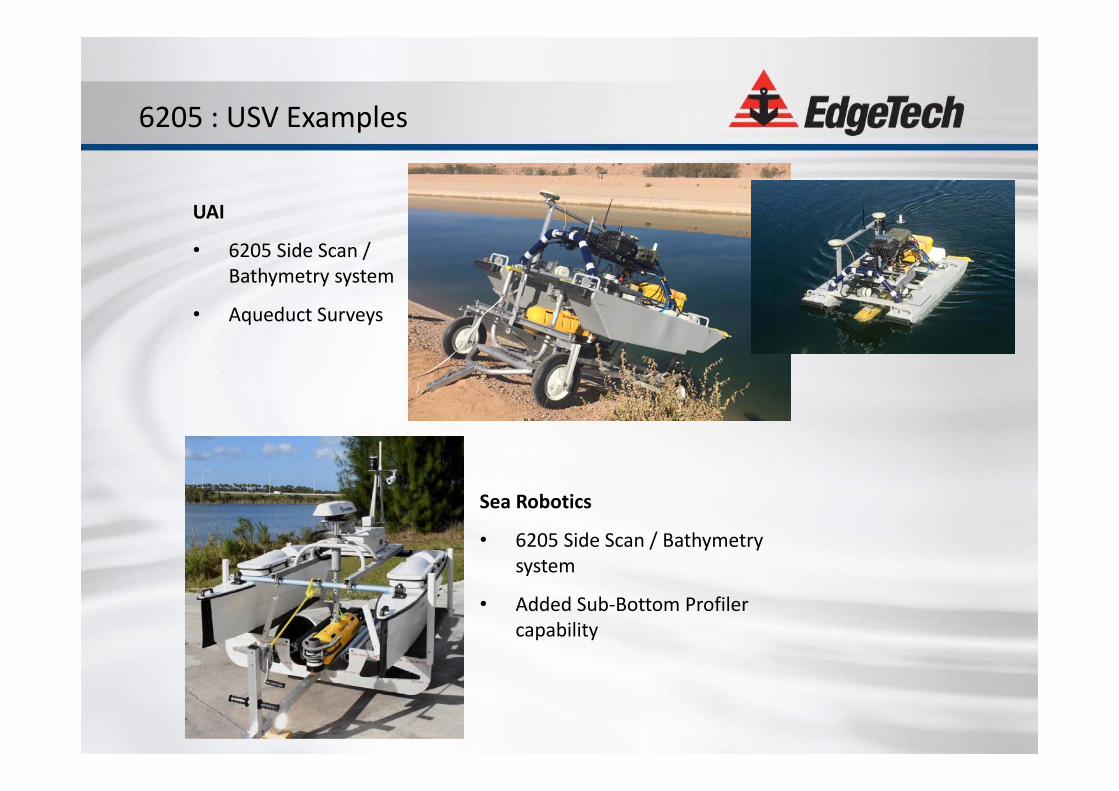
6205 : USV Examples
Sea Robotics
• 6205 Side Scan / Bathymetry system
• Added Sub‐Bottom Profiler capability
UAI
• 6205 Side Scan / Bathymetry system
• Aqueduct Surveys
EdgeTech
Sub‐Bottom Profiler Systems
EdgeTech
Sub‐Bottom Profiler Systems
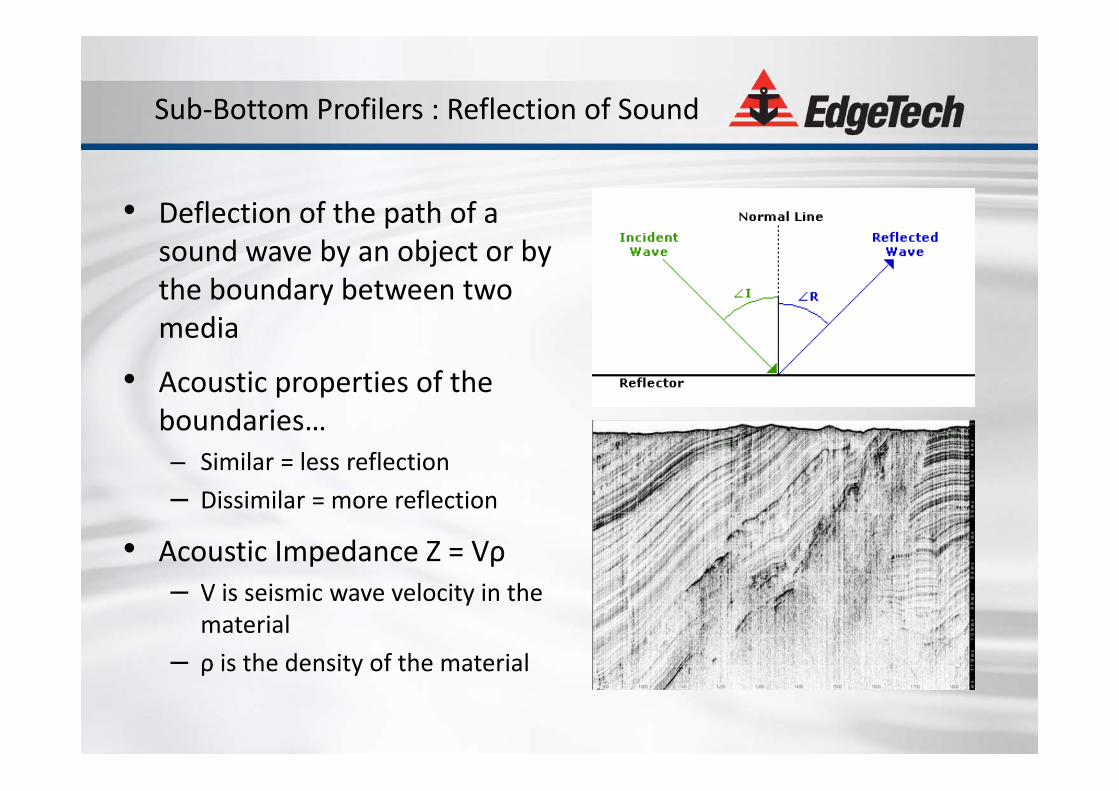
• Deflection of the path of a sound wave by an object or by the boundary between two media
• Acoustic properties of the boundaries…– Similar = less reflection– Dissimilar = more reflection
• Acoustic Impedance Z = Vρ– V is seismic wave velocity in the
material– ρ is the density of the material
Sub‐Bottom Profilers : Reflection of Sound
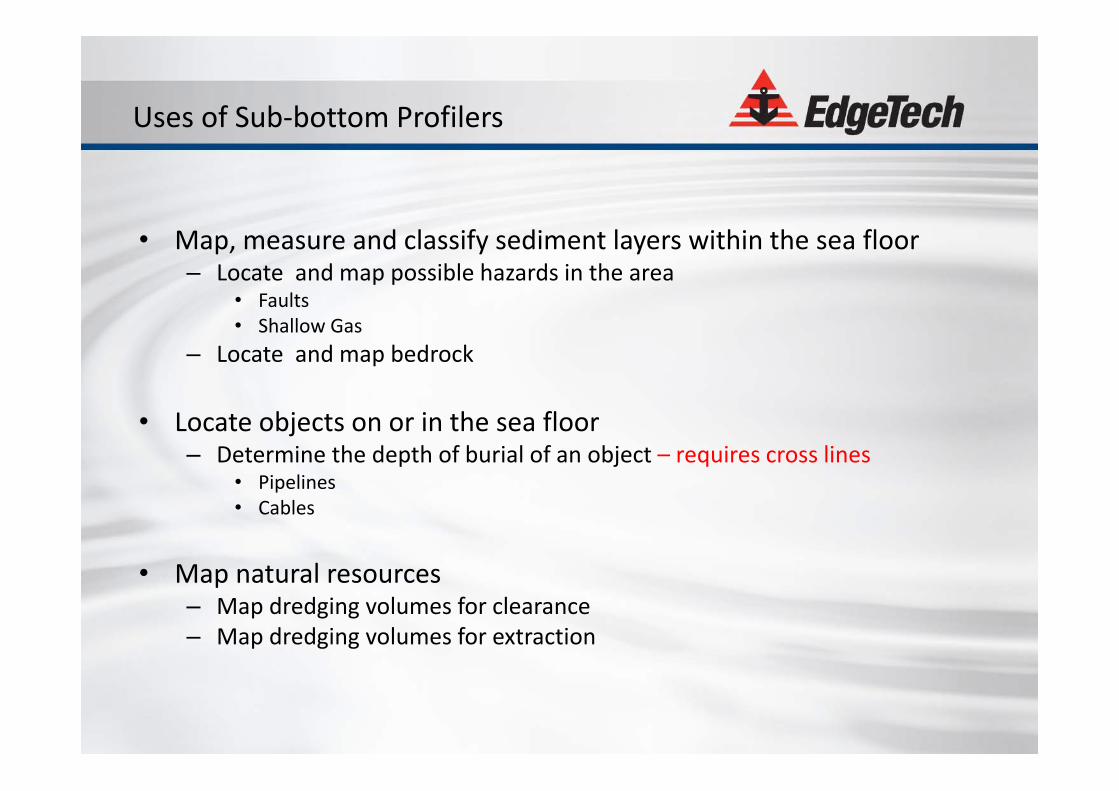
• Map, measure and classify sediment layers within the sea floor– Locate and map possible hazards in the area
• Faults• Shallow Gas
– Locate and map bedrock
• Locate objects on or in the sea floor– Determine the depth of burial of an object – requires cross lines
• Pipelines• Cables
• Map natural resources– Map dredging volumes for clearance– Map dredging volumes for extraction
Uses of Sub‐bottom Profilers
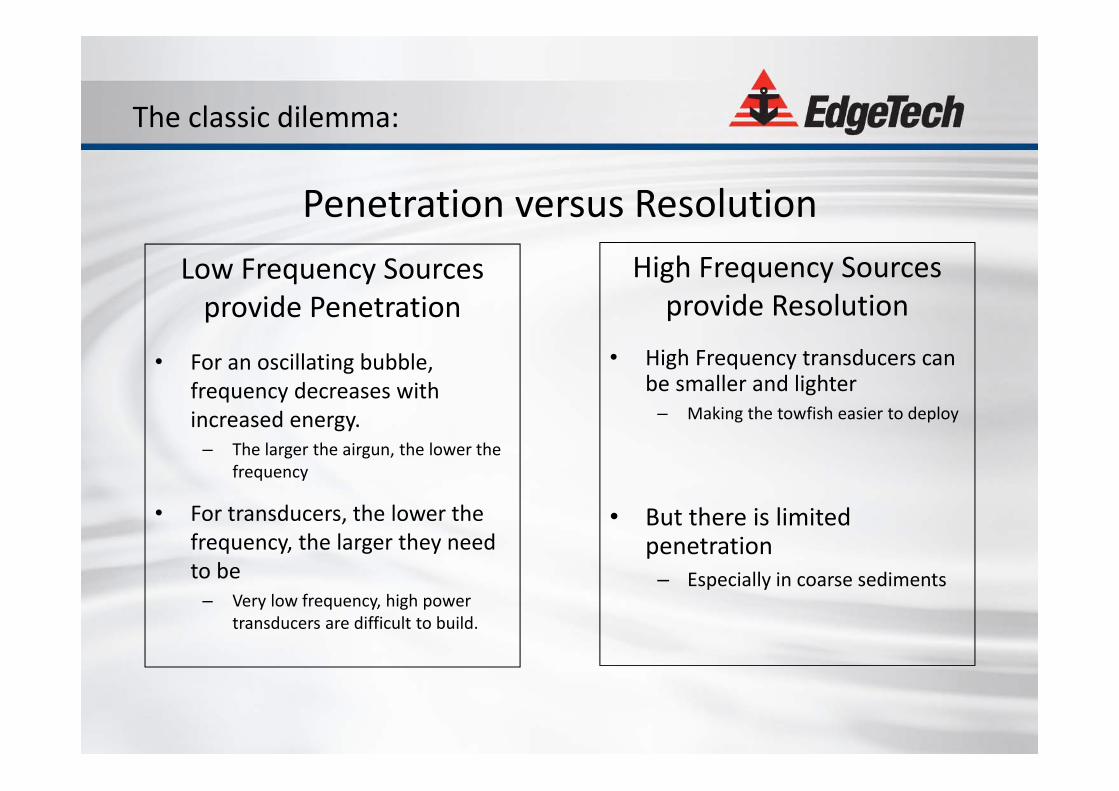
Penetration versus Resolution
The classic dilemma:
Low Frequency Sources provide Penetration
• For an oscillating bubble, frequency decreases with increased energy.
– The larger the airgun, the lower the frequency
• For transducers, the lower the frequency, the larger they need to be
– Very low frequency, high power transducers are difficult to build.
High Frequency Sources provide Resolution
• High Frequency transducers can be smaller and lighter
– Making the towfish easier to deploy
• But there is limited penetration
– Especially in coarse sediments
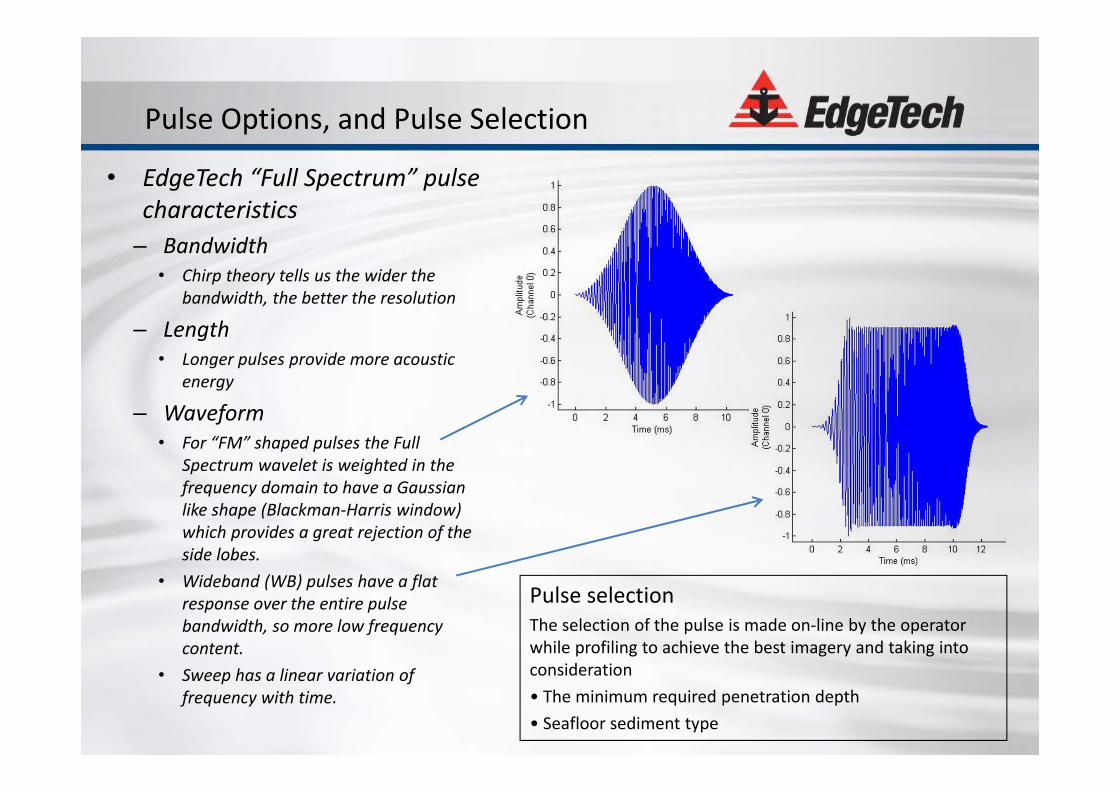
• EdgeTech “Full Spectrum” pulse characteristics
– Bandwidth• Chirp theory tells us the wider the
bandwidth, the better the resolution
– Length• Longer pulses provide more acoustic
energy
– Waveform• For “FM” shaped pulses the Full
Spectrum wavelet is weighted in the frequency domain to have a Gaussian like shape (Blackman‐Harris window) which provides a great rejection of the side lobes.
• Wideband (WB) pulses have a flat response over the entire pulse bandwidth, so more low frequency content.
• Sweep has a linear variation of frequency with time.
Pulse Options, and Pulse Selection
Pulse selectionThe selection of the pulse is made on‐line by the operator while profiling to achieve the best imagery and taking into consideration • The minimum required penetration depth • Seafloor sediment type
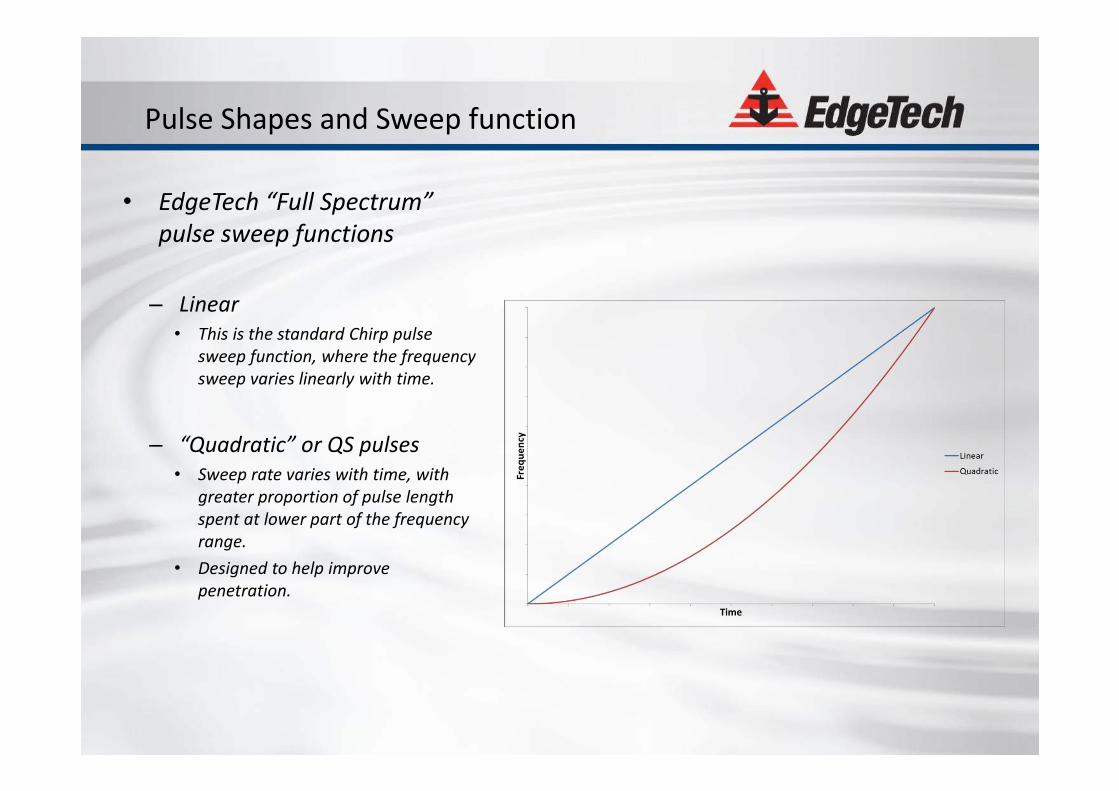
• EdgeTech “Full Spectrum” pulse sweep functions
– Linear• This is the standard Chirp pulse
sweep function, where the frequency sweep varies linearly with time.
– “Quadratic” or QS pulses• Sweep rate varies with time, with
greater proportion of pulse length spent at lower part of the frequency range.
• Designed to help improve penetration.
Pulse Shapes and Sweep function
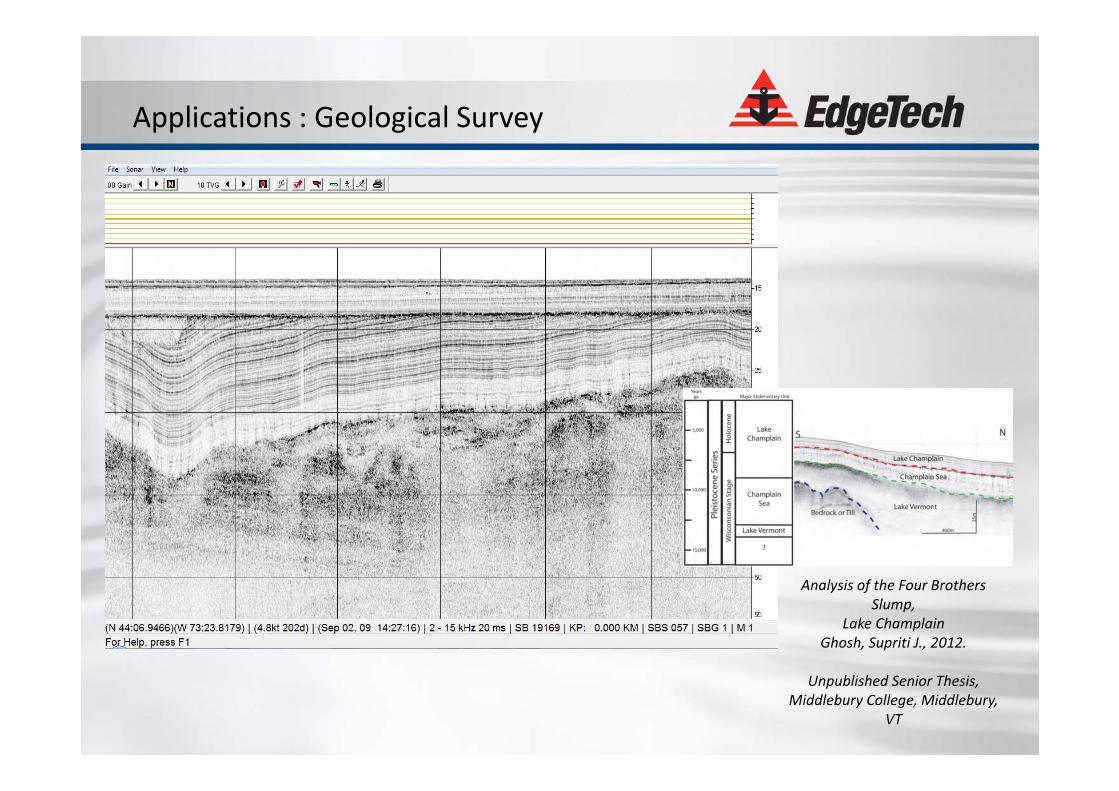
Applications : Geological Survey
Analysis of the Four Brothers Slump,
Lake ChamplainGhosh, Supriti J., 2012.
Unpublished Senior Thesis, Middlebury College, Middlebury,
VT
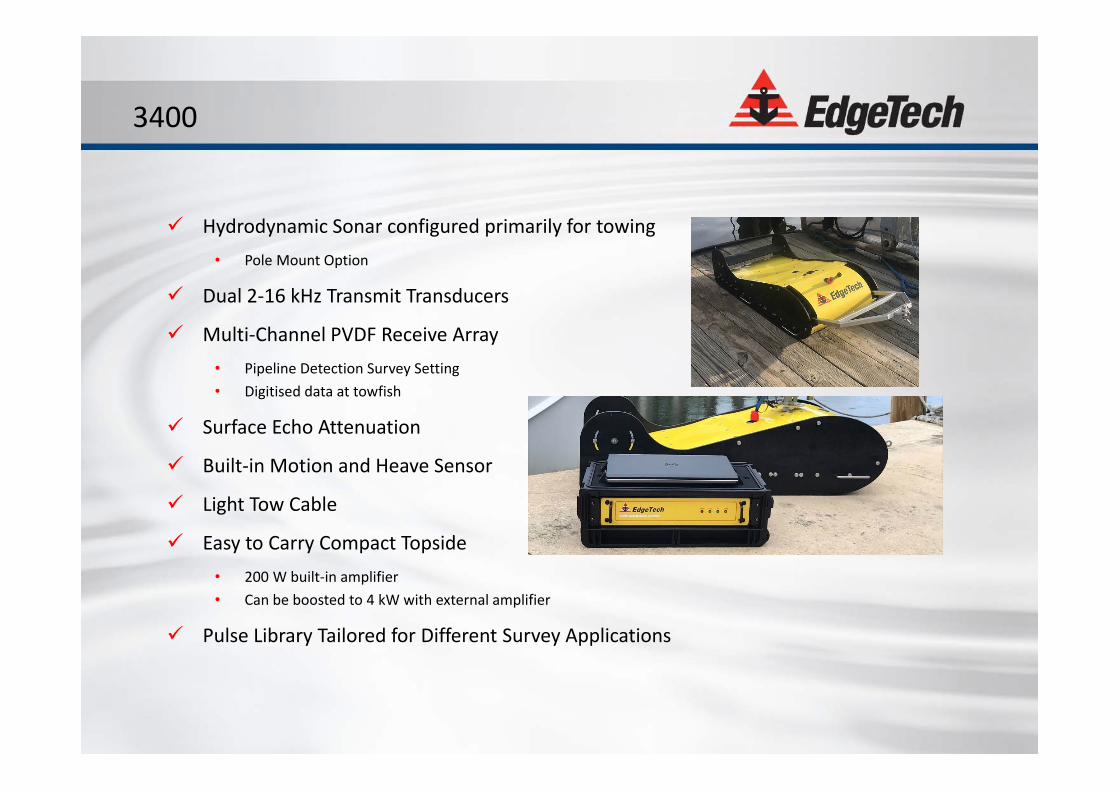
3400
Hydrodynamic Sonar configured primarily for towing• Pole Mount Option
Dual 2‐16 kHz Transmit Transducers
Multi‐Channel PVDF Receive Array• Pipeline Detection Survey Setting• Digitised data at towfish
Surface Echo Attenuation
Built‐in Motion and Heave Sensor
Light Tow Cable
Easy to Carry Compact Topside• 200 W built‐in amplifier• Can be boosted to 4 kW with external amplifier
Pulse Library Tailored for Different Survey Applications
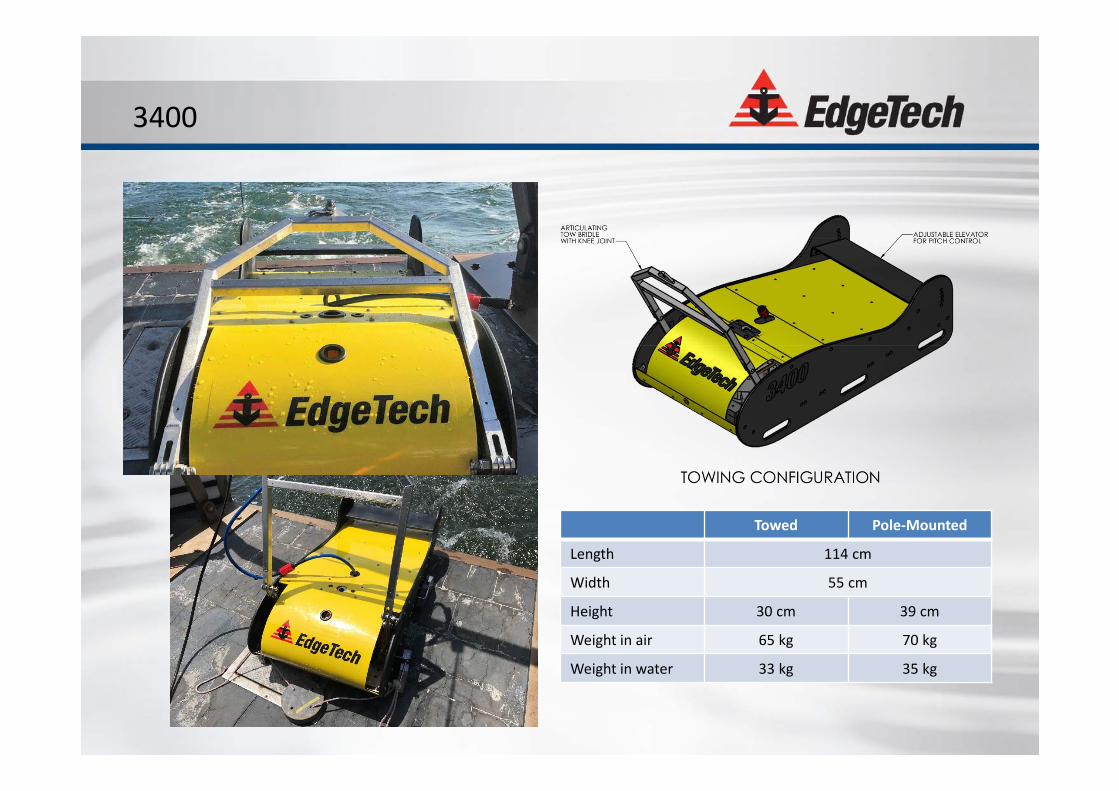
3400
Towed Pole‐Mounted
Length 114 cm
Width 55 cm
Height 30 cm 39 cm
Weight in air 65 kg 70 kg
Weight in water 33 kg 35 kg
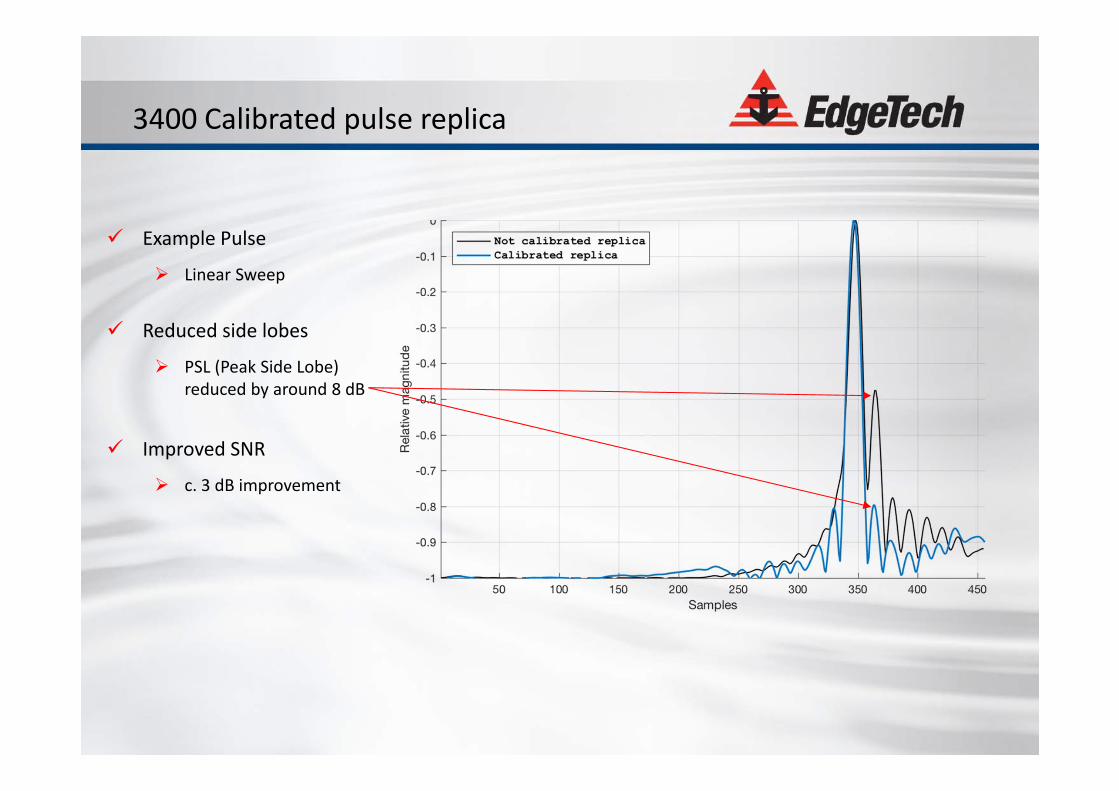
3400 Calibrated pulse replica
Example Pulse
Linear Sweep
Reduced side lobes
PSL (Peak Side Lobe) reduced by around 8 dB
Improved SNR
c. 3 dB improvement
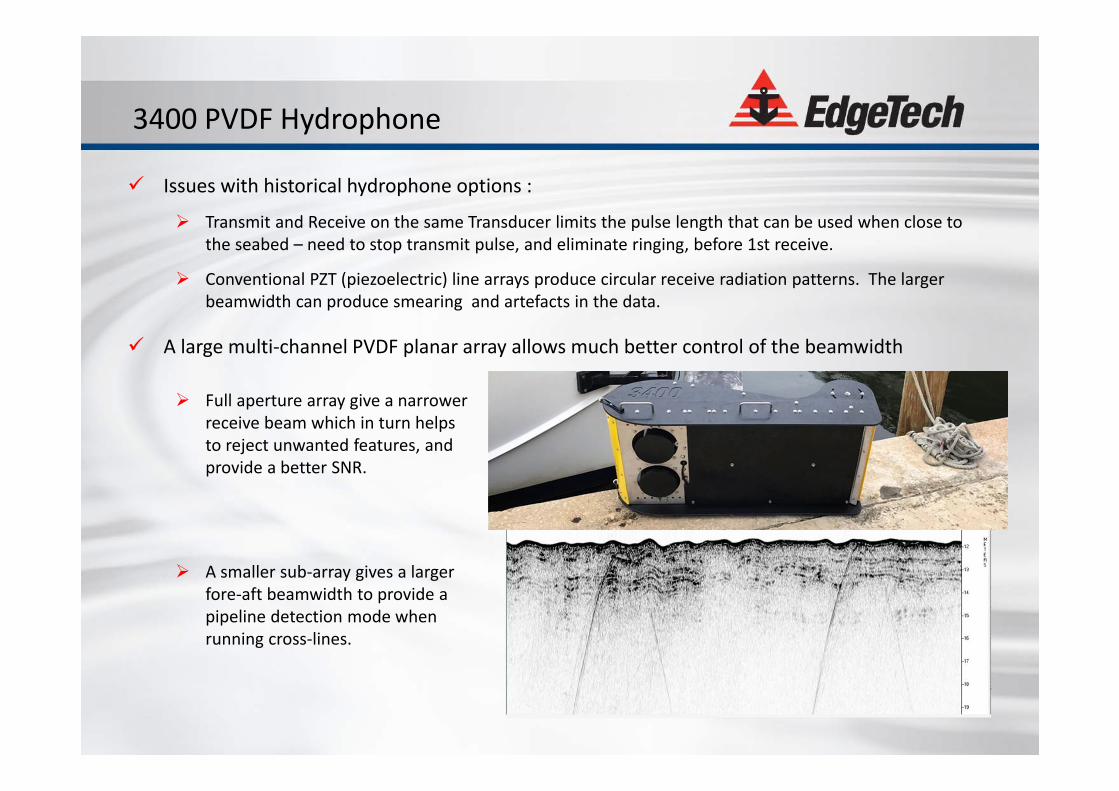
3400 PVDF Hydrophone
Issues with historical hydrophone options :
Transmit and Receive on the same Transducer limits the pulse length that can be used when close to the seabed – need to stop transmit pulse, and eliminate ringing, before 1st receive.
Conventional PZT (piezoelectric) line arrays produce circular receive radiation patterns. The larger beamwidth can produce smearing and artefacts in the data.
A large multi‐channel PVDF planar array allows much better control of the beamwidth
Full aperture array give a narrower receive beam which in turn helps to reject unwanted features, and provide a better SNR.
A smaller sub‐array gives a larger fore‐aft beamwidth to provide a pipeline detection mode when running cross‐lines.
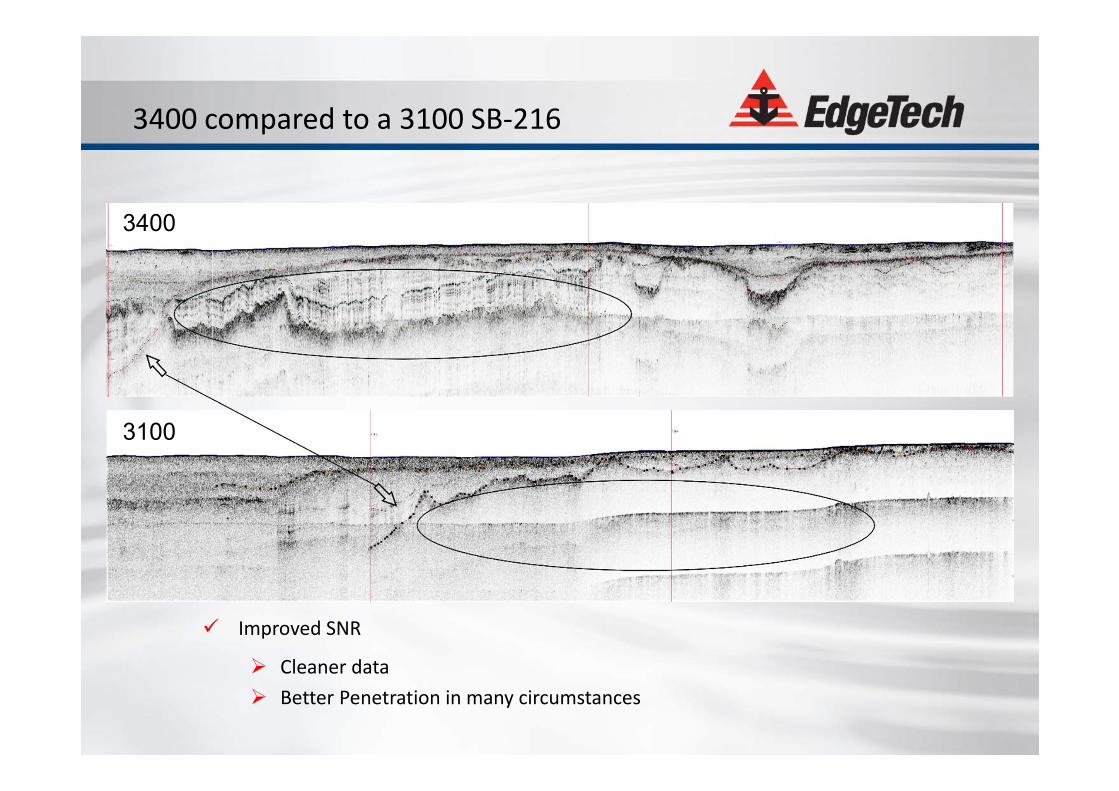
3400 compared to a 3100 SB‐216
3100
3400
Improved SNR
Cleaner data Better Penetration in many circumstances
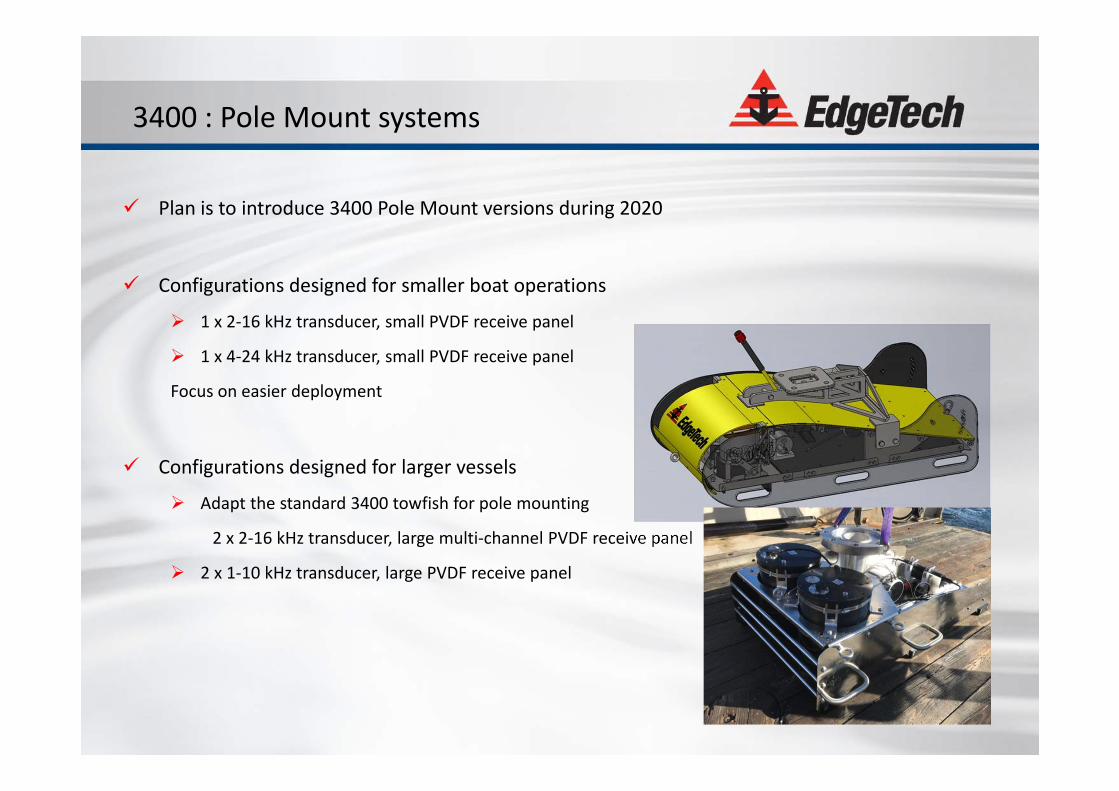
3400 : Pole Mount systems
Plan is to introduce 3400 Pole Mount versions during 2020
Configurations designed for smaller boat operations
1 x 2‐16 kHz transducer, small PVDF receive panel
1 x 4‐24 kHz transducer, small PVDF receive panel
Focus on easier deployment
Configurations designed for larger vessels
Adapt the standard 3400 towfish for pole mounting
2 x 2‐16 kHz transducer, large multi‐channel PVDF receive panel
2 x 1‐10 kHz transducer, large PVDF receive panel
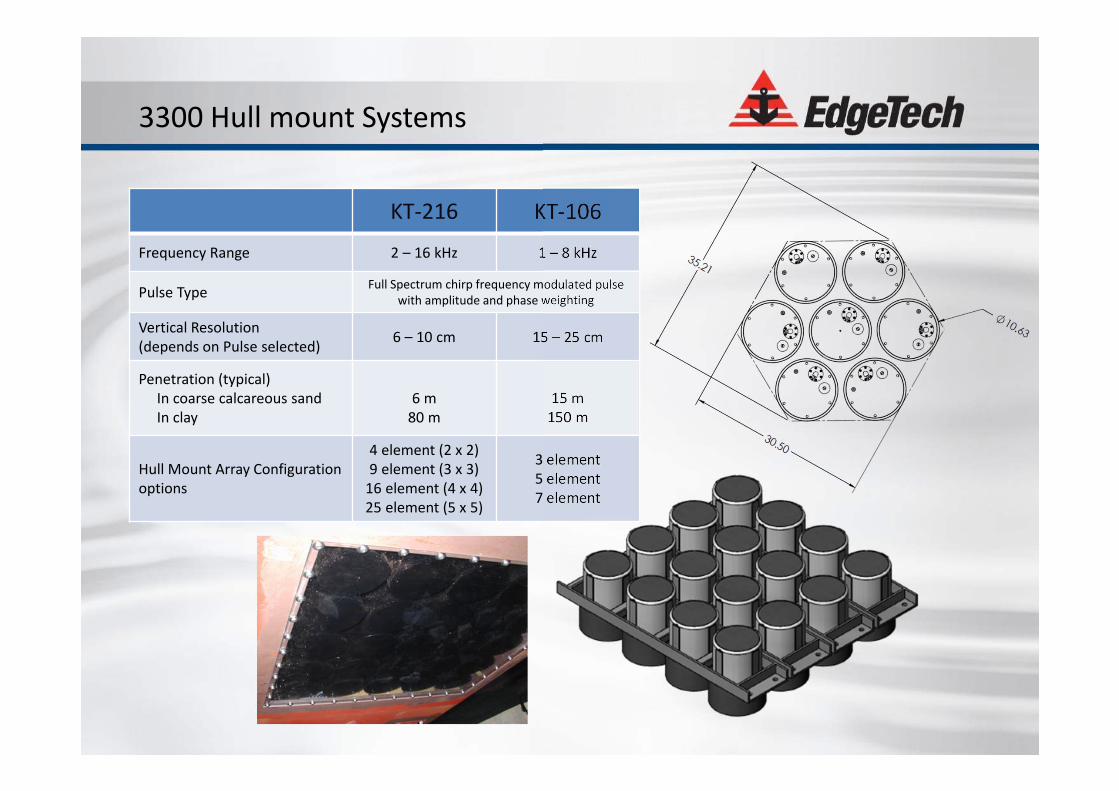
3300 Hull mount Systems
KT‐216 KT‐106
Frequency Range 2 – 16 kHz 1 – 8 kHz
Pulse Type Full Spectrum chirp frequency modulated pulse with amplitude and phase weighting
Vertical Resolution (depends on Pulse selected) 6 – 10 cm 15 – 25 cm
Penetration (typical)In coarse calcareous sandIn clay
6 m80 m
15 m 150 m
Hull Mount Array Configurationoptions
4 element (2 x 2)9 element (3 x 3)16 element (4 x 4)25 element (5 x 5)
3 element5 element7 element
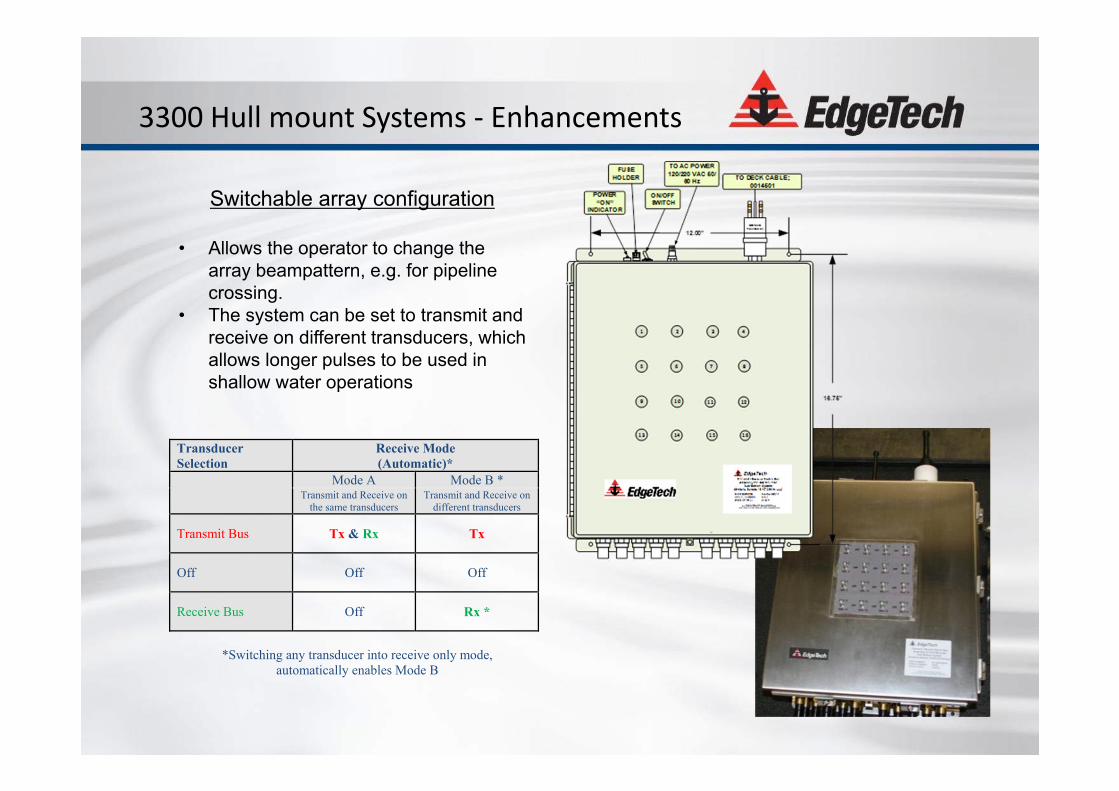
3300 Hull mount Systems ‐ Enhancements
Transducer Selection
Receive Mode(Automatic)*
Mode A Mode B *Transmit and Receive on
the same transducersTransmit and Receive on
different transducers
Transmit Bus Tx & Rx Tx
Off Off Off
Receive Bus Off Rx *
*Switching any transducer into receive only mode, automatically enables Mode B
Switchable array configuration
• Allows the operator to change the array beampattern, e.g. for pipeline crossing.
• The system can be set to transmit and receive on different transducers, which allows longer pulses to be used in shallow water operations
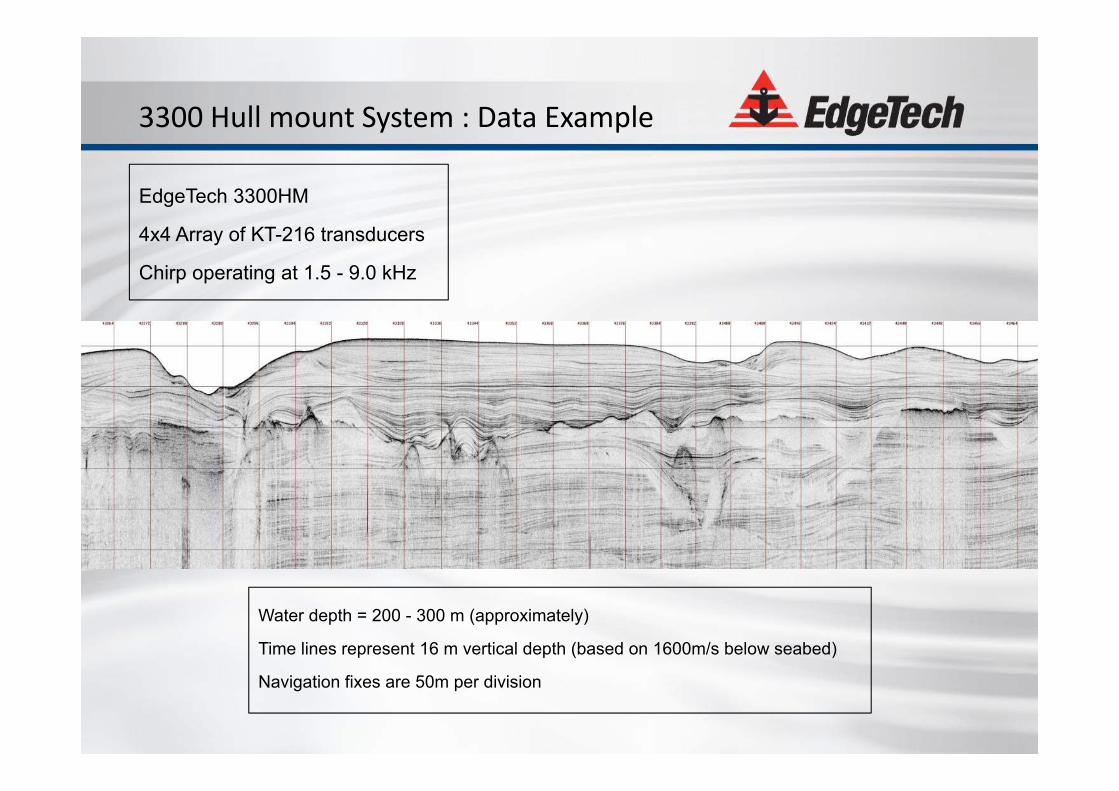
3300 Hull mount System : Data Example
EdgeTech 3300HM
4x4 Array of KT-216 transducers
Chirp operating at 1.5 - 9.0 kHz
Water depth = 200 - 300 m (approximately)
Time lines represent 16 m vertical depth (based on 1600m/s below seabed)
Navigation fixes are 50m per division
EdgeTech
Combined Systems
EdgeTech
Combined Systems
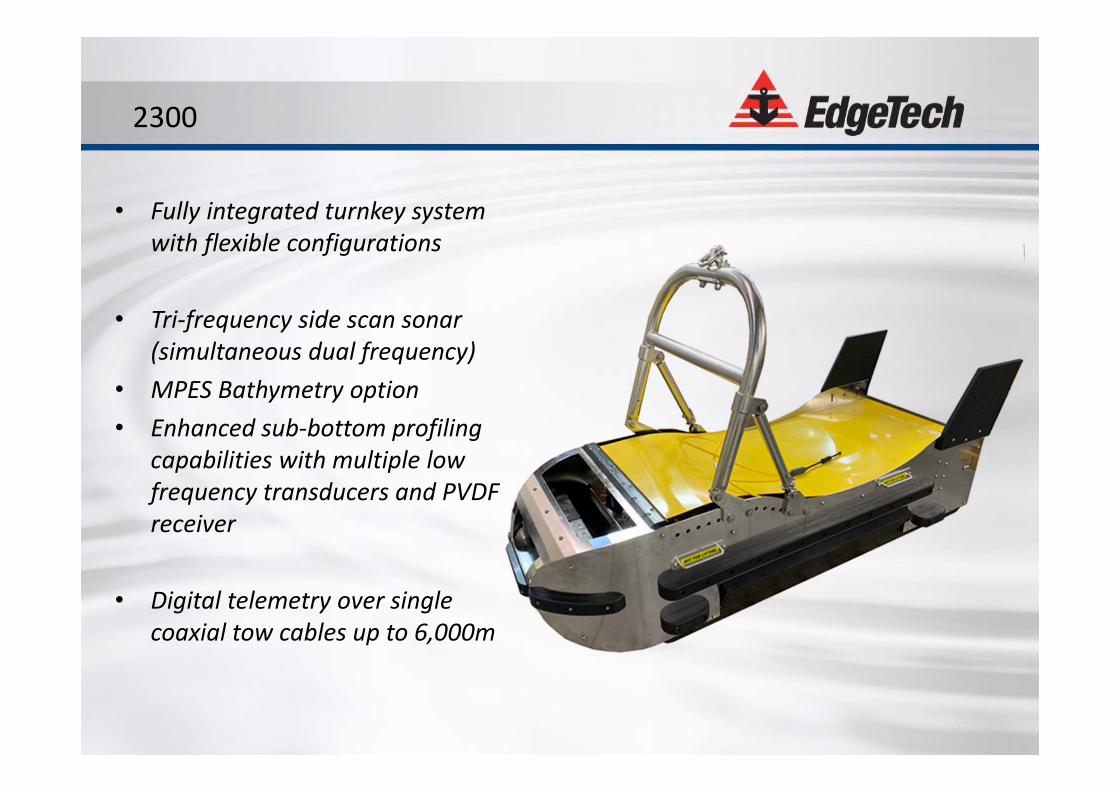
2300
• Fully integrated turnkey system with flexible configurations
• Tri‐frequency side scan sonar (simultaneous dual frequency)
• MPES Bathymetry option• Enhanced sub‐bottom profiling
capabilities with multiple low frequency transducers and PVDF receiver
• Digital telemetry over single coaxial tow cables up to 6,000m
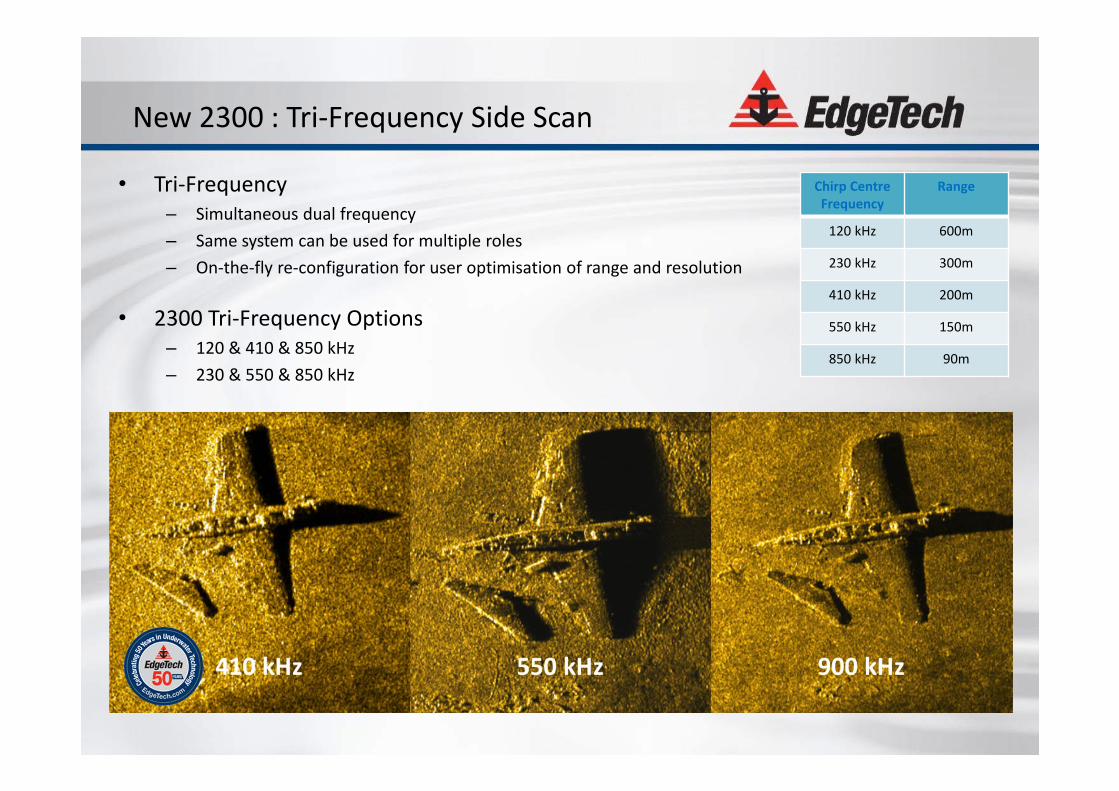
New 2300 : Tri‐Frequency Side Scan
Chirp CentreFrequency
Range
120 kHz 600m
230 kHz 300m
410 kHz 200m
550 kHz 150m
850 kHz 90m
• Tri‐Frequency– Simultaneous dual frequency– Same system can be used for multiple roles– On‐the‐fly re‐configuration for user optimisation of range and resolution
• 2300 Tri‐Frequency Options– 120 & 410 & 850 kHz– 230 & 550 & 850 kHz
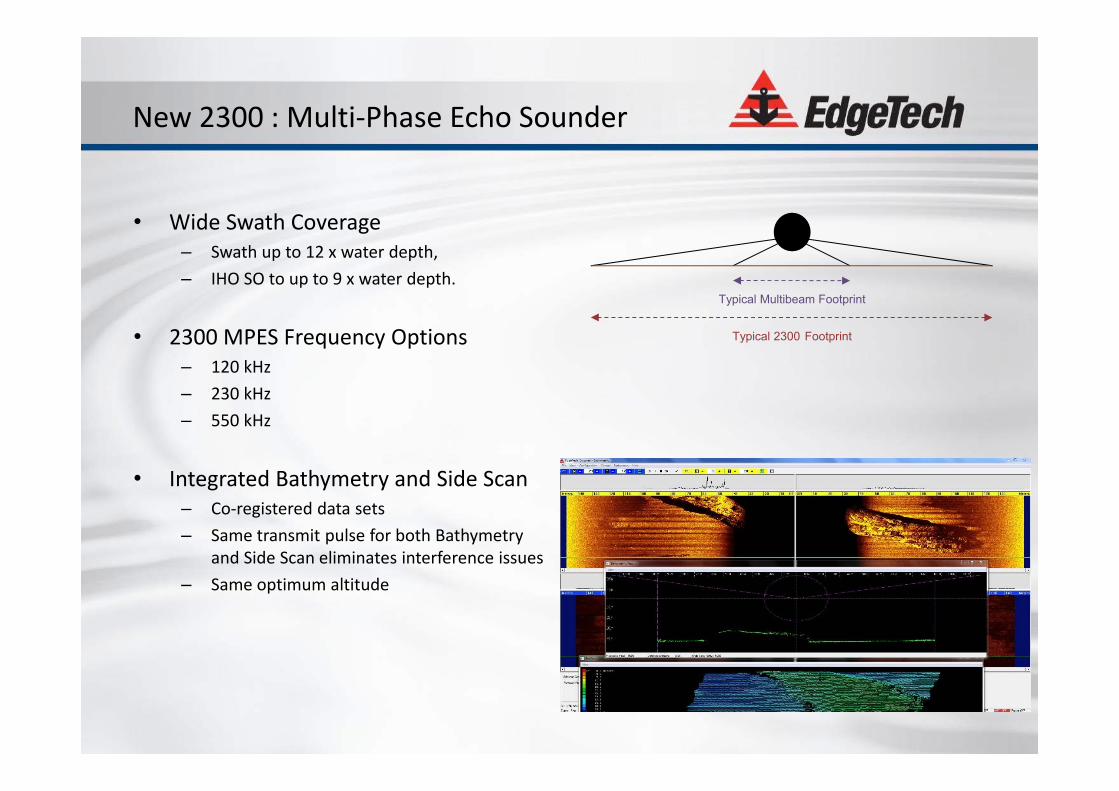
• Wide Swath Coverage– Swath up to 12 x water depth, – IHO SO to up to 9 x water depth.
• 2300 MPES Frequency Options– 120 kHz– 230 kHz– 550 kHz
• Integrated Bathymetry and Side Scan – Co‐registered data sets– Same transmit pulse for both Bathymetry
and Side Scan eliminates interference issues– Same optimum altitude
Typical Multibeam Footprint
Typical 2300 Footprint
New 2300 : Multi‐Phase Echo Sounder
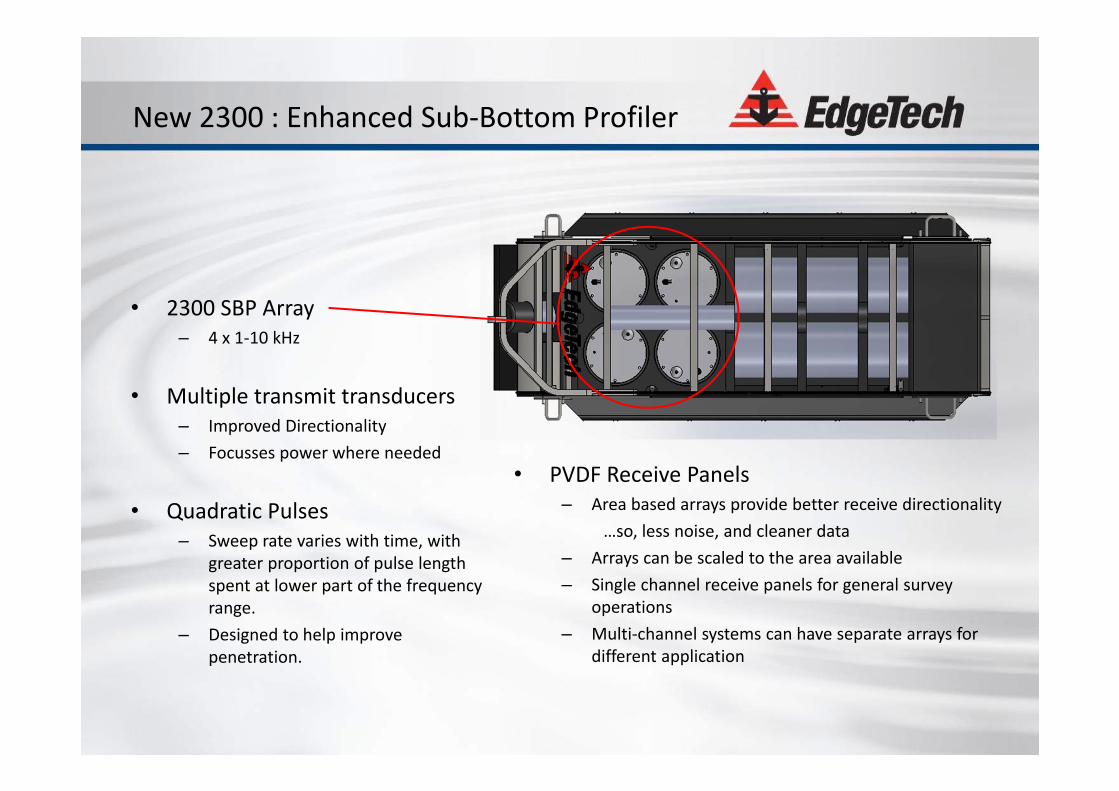
New 2300 : Enhanced Sub‐Bottom Profiler
• 2300 SBP Array – 4 x 1‐10 kHz
• Multiple transmit transducers– Improved Directionality– Focusses power where needed
• Quadratic Pulses– Sweep rate varies with time, with
greater proportion of pulse length spent at lower part of the frequency range.
– Designed to help improve penetration.
• PVDF Receive Panels– Area based arrays provide better receive directionality
…so, less noise, and cleaner data– Arrays can be scaled to the area available– Single channel receive panels for general survey
operations– Multi‐channel systems can have separate arrays for
different application
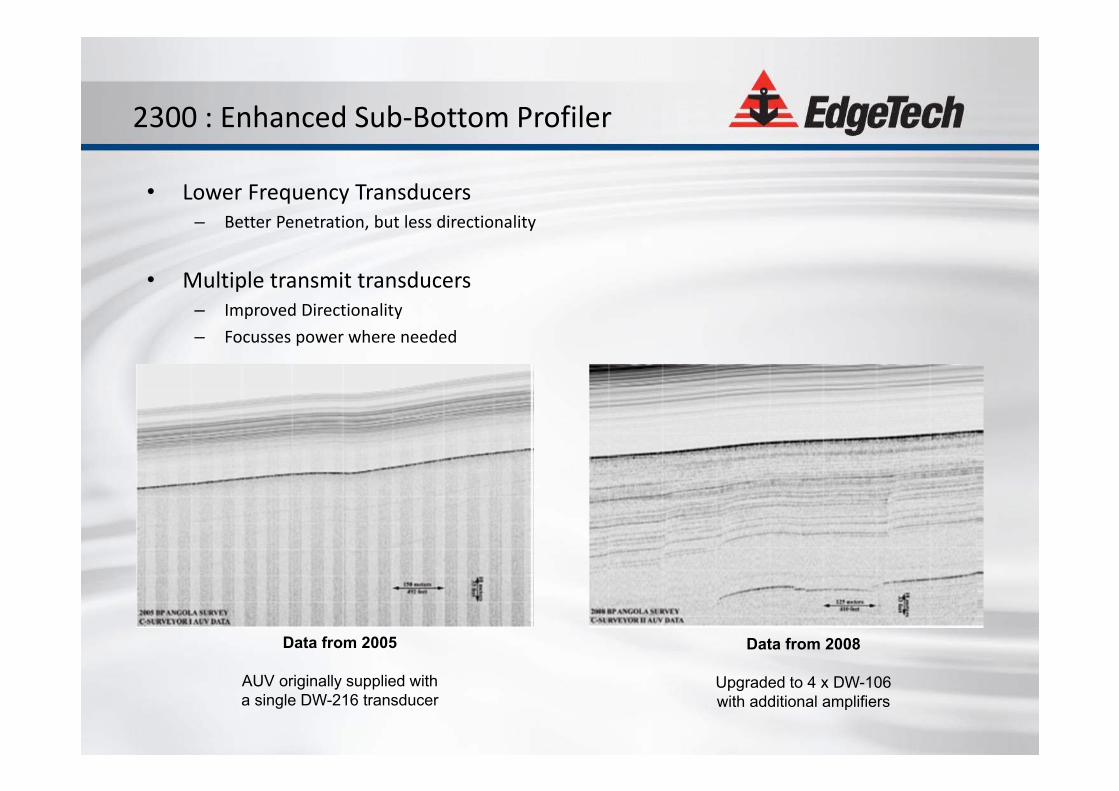
Data from 2005
AUV originally supplied with a single DW-216 transducer
Data from 2008
Upgraded to 4 x DW-106 with additional amplifiers
• Lower Frequency Transducers– Better Penetration, but less directionality
• Multiple transmit transducers– Improved Directionality– Focusses power where needed
2300 : Enhanced Sub‐Bottom Profiler
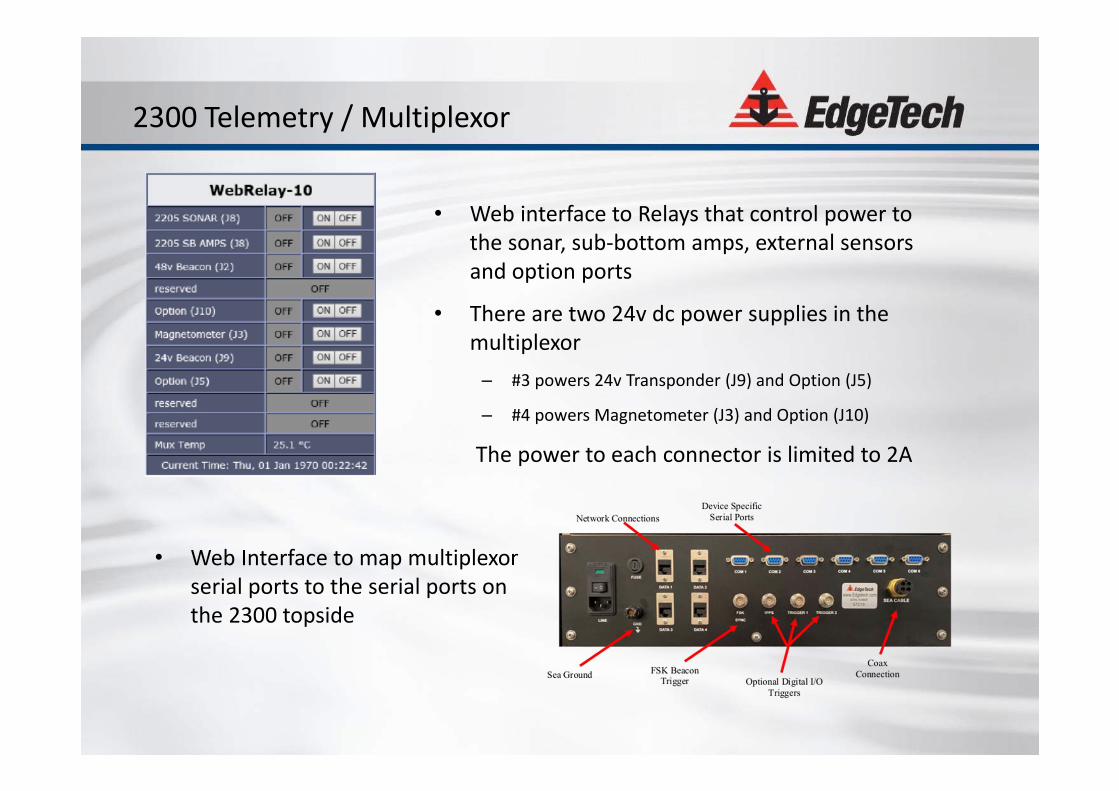
2300 Telemetry / Multiplexor
• Web interface to Relays that control power to the sonar, sub‐bottom amps, external sensors and option ports
• There are two 24v dc power supplies in the multiplexor
– #3 powers 24v Transponder (J9) and Option (J5)
– #4 powers Magnetometer (J3) and Option (J10)
The power to each connector is limited to 2A
• Web Interface to map multiplexor serial ports to the serial ports on the 2300 topside
2300 : Example Transponder Interfaces
• Kongsberg Cnode MiniS 34 transponder• Responder trigger, positive going, 5v to 25v, 2 to 6 ms• External power 20 ‐ 28v dc, draws 1A @ 24v dc• Please note that this applies to a MiniS and not the older Cnode Mini series.
• Applied Acoustics 1100 series beacon• Responder trigger, positive going, 5v to 25v, 2 to 10 ms. Trigger pulses longer than 10ms duration are ignored • External power 22 ‐ 35v dc , connect to External 24VDC Input. 80mA trickle charge @ 24v dc
• EdgeTech 4380 multi‐beacon• Responder trigger RS232 5v TTL input, optically isolated• External power 22 ‐ 55v dc, 1 A – 2.1 A, 1 A is enough to keep the batteries topped up
• Sonardyne WSM Transponder• Responder trigger, positive going, <0.5v to >4v, 24v max, 3 to 25 ms.• External power 22.5 – 28v dc. Average 100mA when transmitting 1 pulse/sec, but max 5A for 10mS.• This peak power draw is NOT supported, and so a WSM transponder should be run off it’s internal batteries
and only the responder trigger connected.
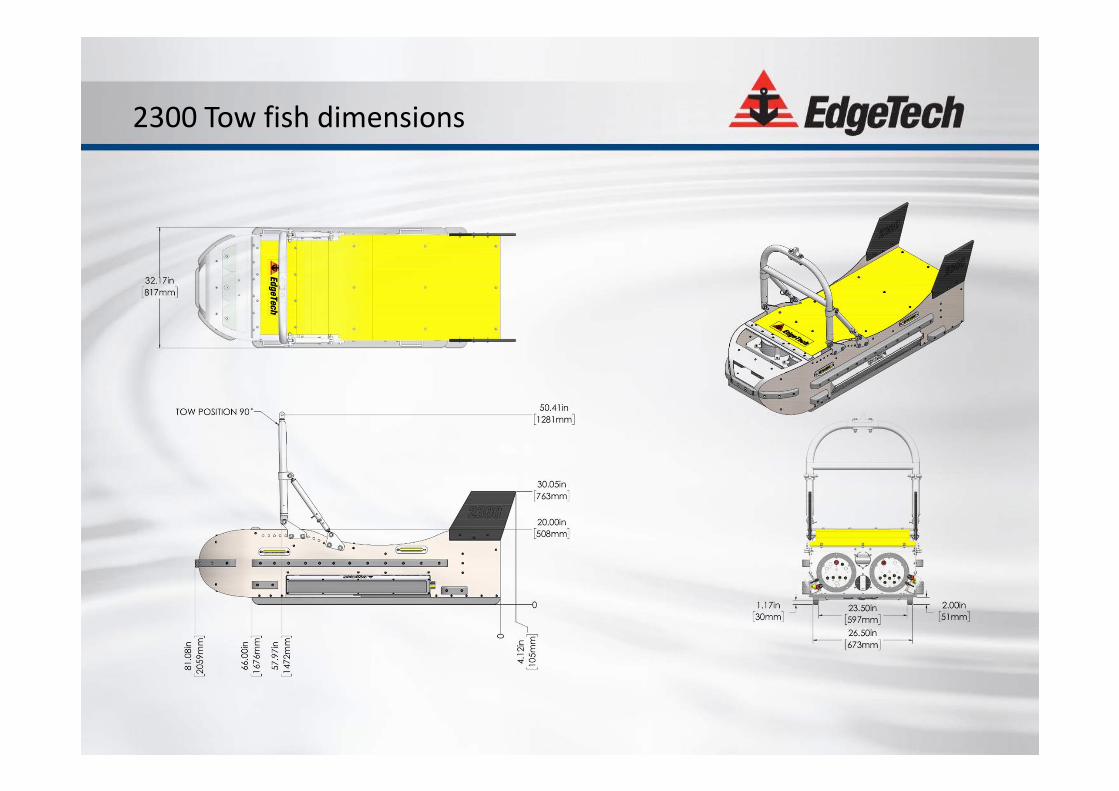
2300 Tow fish dimensions
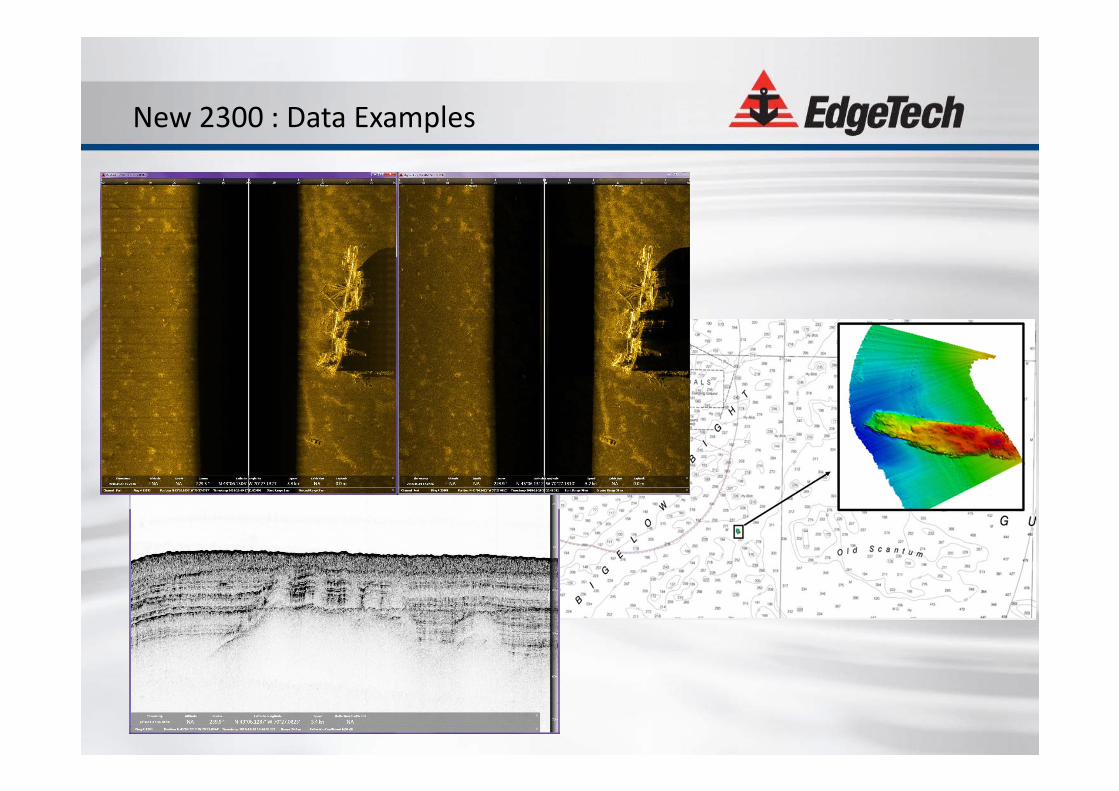
New 2300 : Data Examples
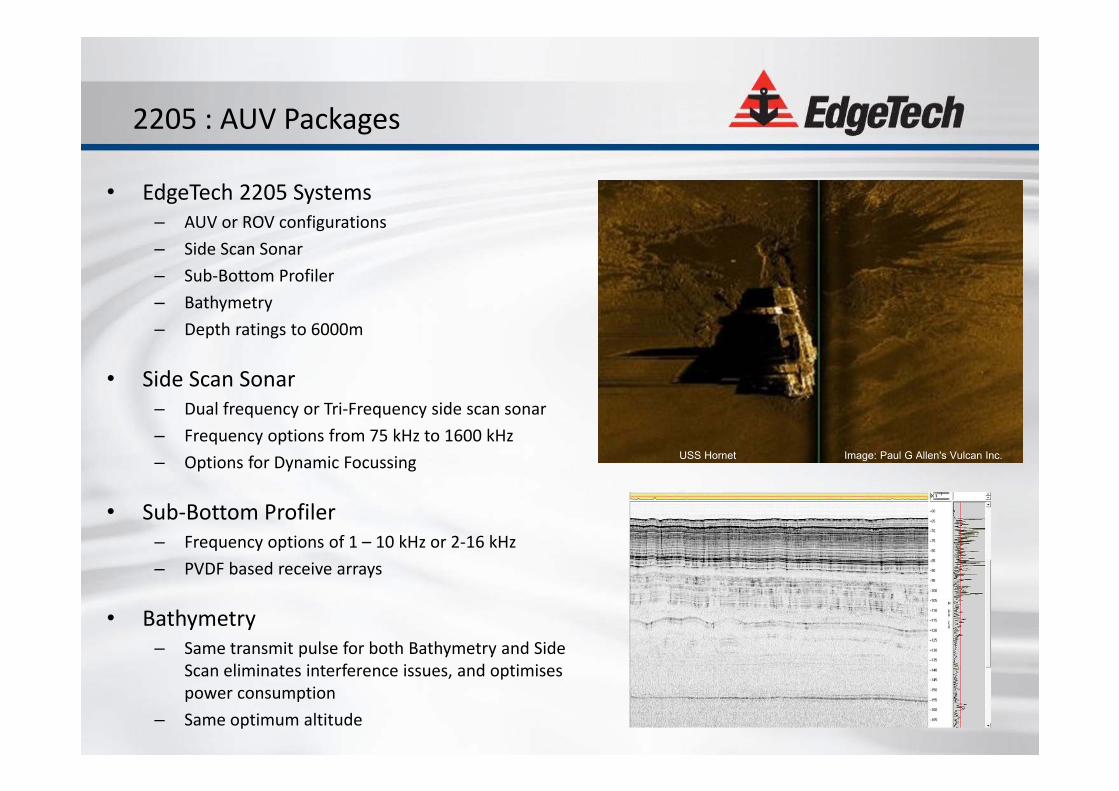
2205 : AUV Packages
• EdgeTech 2205 Systems– AUV or ROV configurations– Side Scan Sonar– Sub‐Bottom Profiler– Bathymetry– Depth ratings to 6000m
• Side Scan Sonar– Dual frequency or Tri‐Frequency side scan sonar– Frequency options from 75 kHz to 1600 kHz– Options for Dynamic Focussing
• Sub‐Bottom Profiler– Frequency options of 1 – 10 kHz or 2‐16 kHz – PVDF based receive arrays
• Bathymetry– Same transmit pulse for both Bathymetry and Side
Scan eliminates interference issues, and optimisespower consumption
– Same optimum altitude
USS Hornet Image: Paul G Allen's Vulcan Inc.
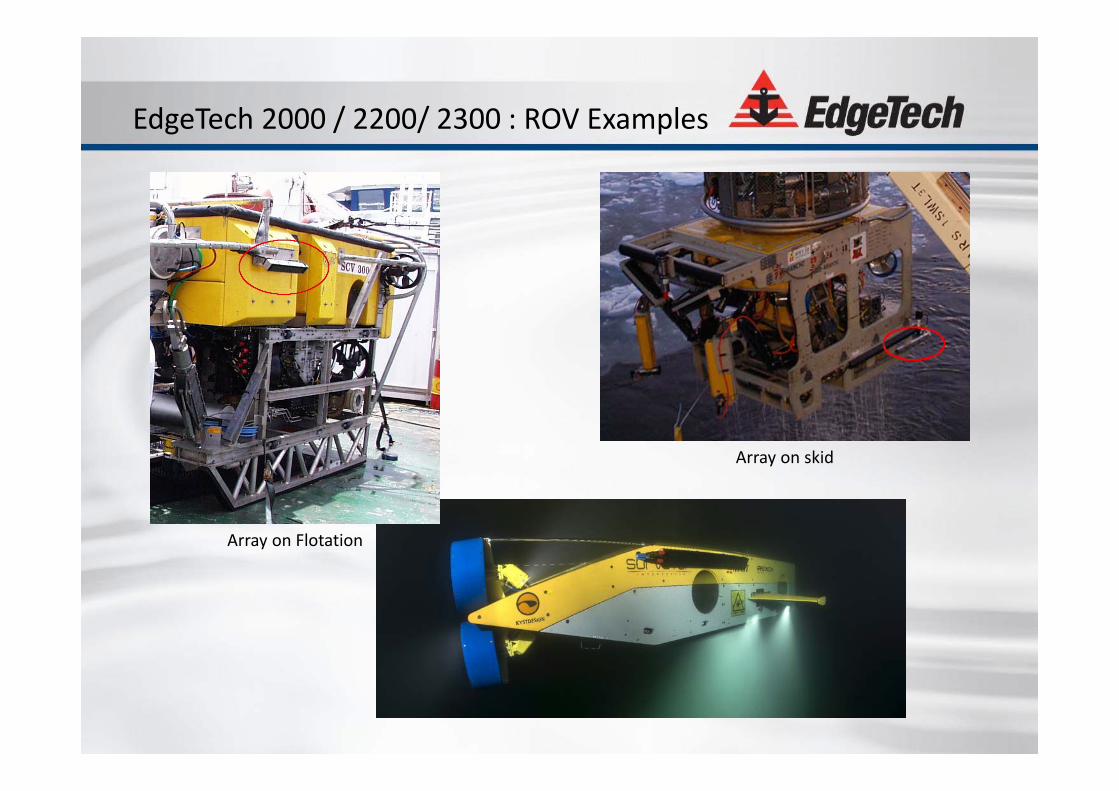
EdgeTech 2000 / 2200/ 2300 : ROV Examples
Array on skid
Array on Flotation
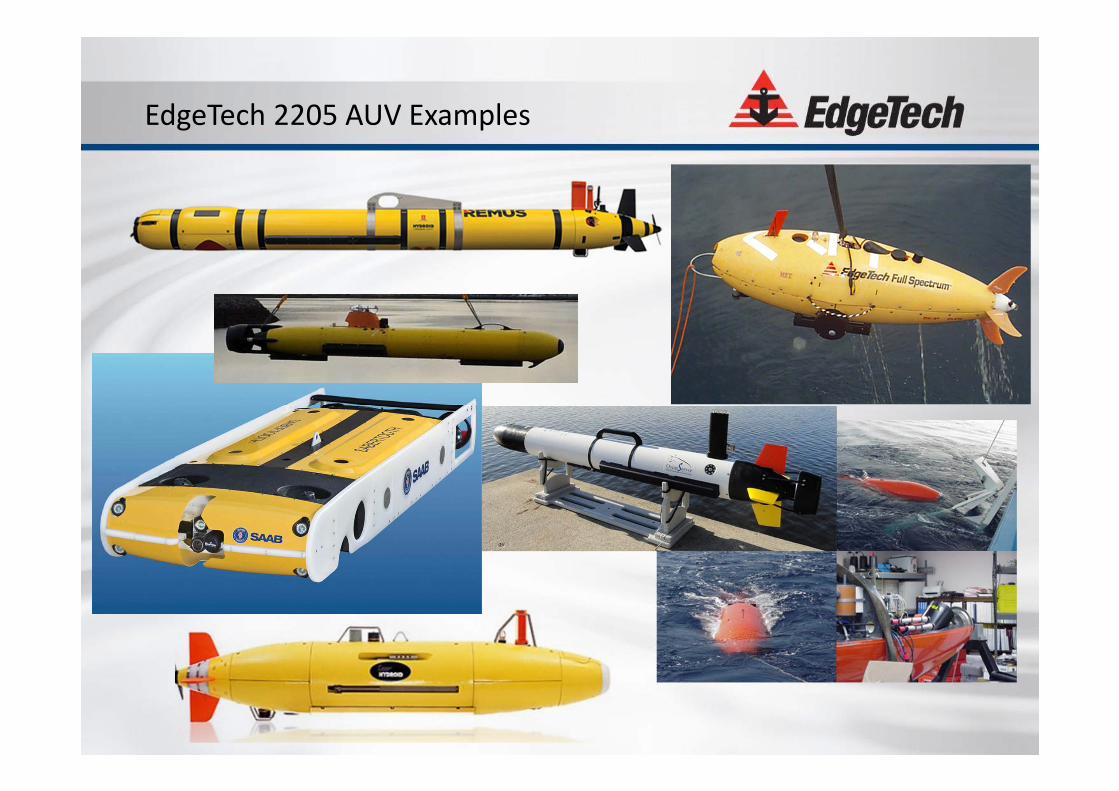
EdgeTech 2205 AUV Examples
Summary
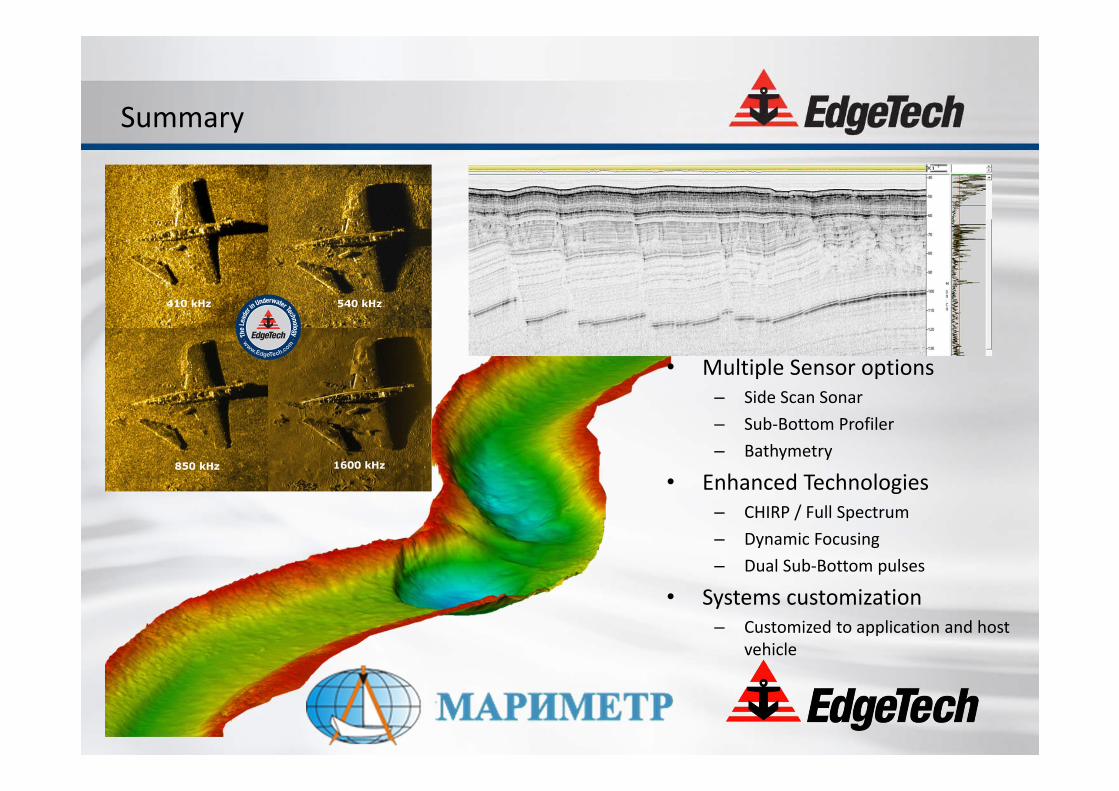
• Multiple Sensor options– Side Scan Sonar– Sub‐Bottom Profiler– Bathymetry
• Enhanced Technologies– CHIRP / Full Spectrum– Dynamic Focusing– Dual Sub‐Bottom pulses
• Systems customization– Customized to application and host
vehicle