mapwork booklet - hs elspark -germiston south africa
TRANSCRIPT
1
2
INDEX
1. WHAT IS A MAP? 3 2. FEATURES ON A MAP 3 Name of a map 4 Scale of a map 4 Direction 5 Conventional signs 5 3. HEIGHT ON MAPS 6 4. ORTHOPHOTO MAP 7 Types of aerial photographs 7 How orthophotos are made 8 Shadows on orthophoto maps 8 5. TOPOGRAPHICAL MAP 9 Natural features and constructed features 9 6. INFORMATION ON AERIAL PHOTOGRAPHS AND MAPS 9 7. MAP CALCULATIONS 10 Distance 10 Area 13 Direction 15 Bearing 16 Magnetic declination 18 Magnetic bearing 20 Coordinates 21 Gradient 26 Cross section 28 Vertical exaggeration 30 Intervisibility 31 8. CONTOURS AND LANDFORMS 32 9. GEOGRAPHICAL INFORMATION SYSTEMS (GIS) 40 Definition 40 Why was GIS developed? 40 Components of GIS 40 Remote sensing 41 Types of data 43 Raster and vector data 43 Data layering 45 Buffering 46 Data integration 47 Data manipulation 48 Resolution 48 How GIS can help farmers 49 How GIS can assist development in an area 49 Map projections 50
3
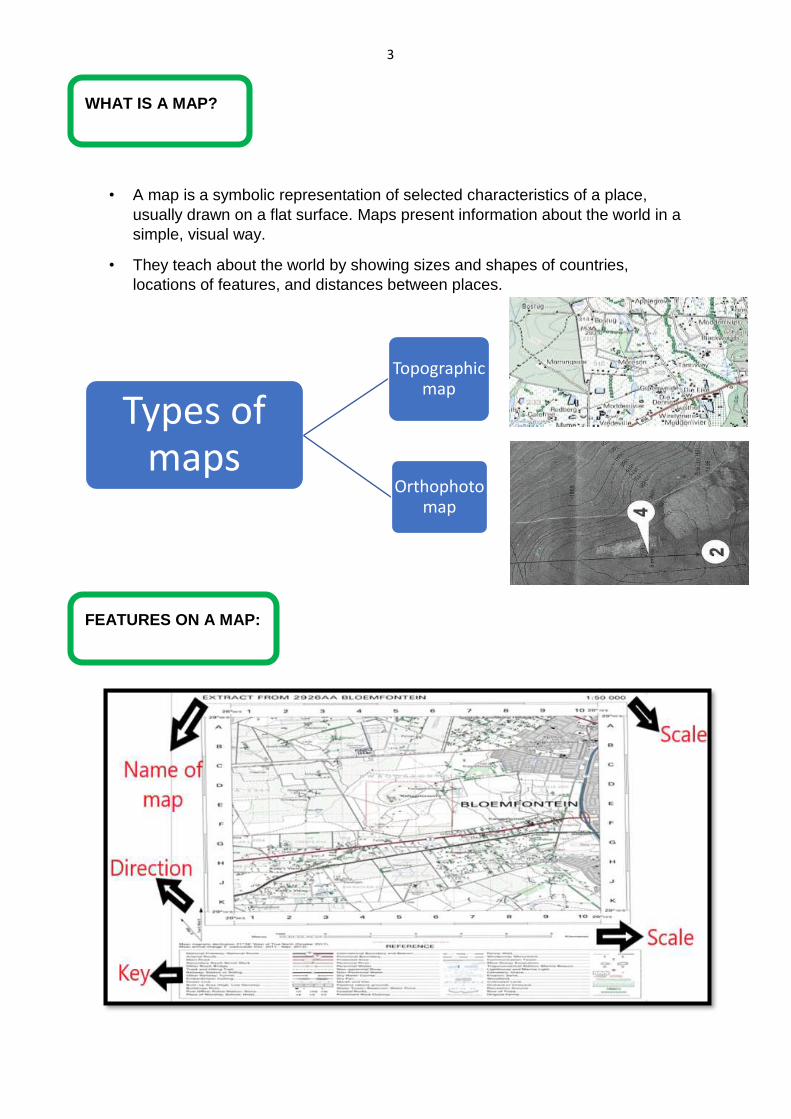
Types of maps
Topographic map
Orthophoto map
WHAT IS A MAP?
• A map is a symbolic representation of selected characteristics of a place,
usually drawn on a flat surface. Maps present information about the world in a
simple, visual way.
• They teach about the world by showing sizes and shapes of countries,
locations of features, and distances between places.
FEATURES ON A MAP:
4
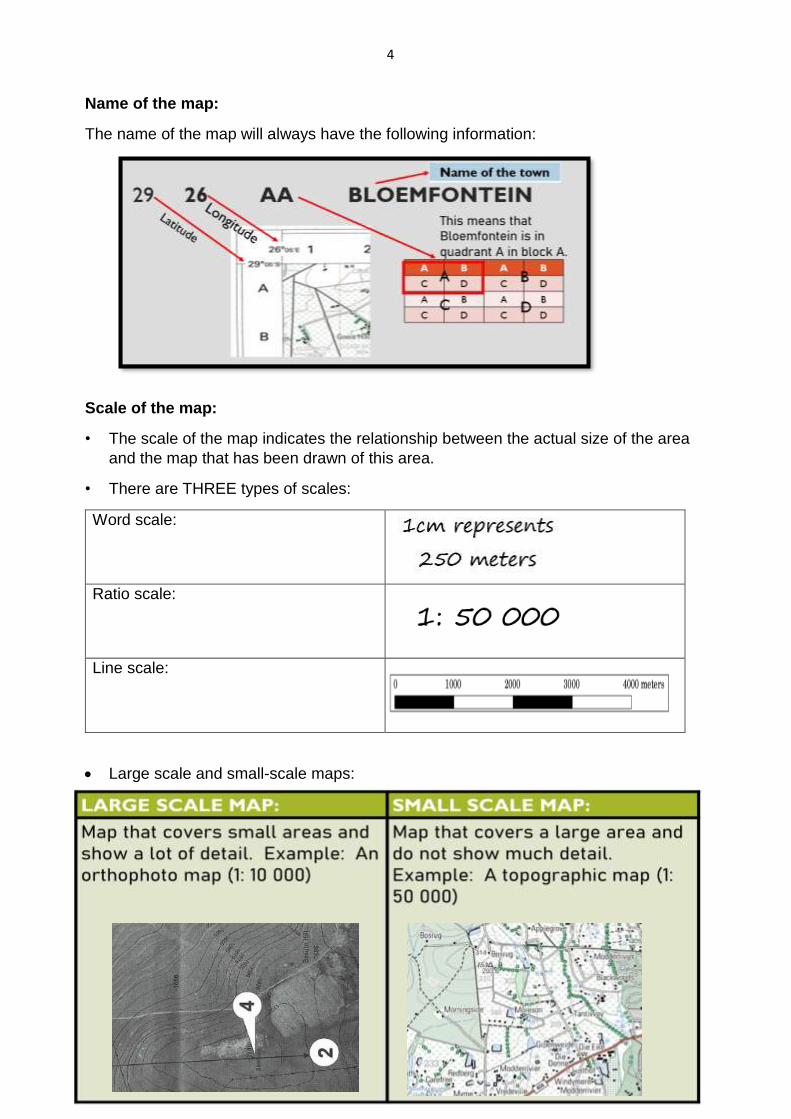
Name of the map:
The name of the map will always have the following information:
Scale of the map:
• The scale of the map indicates the relationship between the actual size of the area
and the map that has been drawn of this area.
• There are THREE types of scales:
Word scale:
Ratio scale:
Line scale:
Large scale and small-scale maps:
5
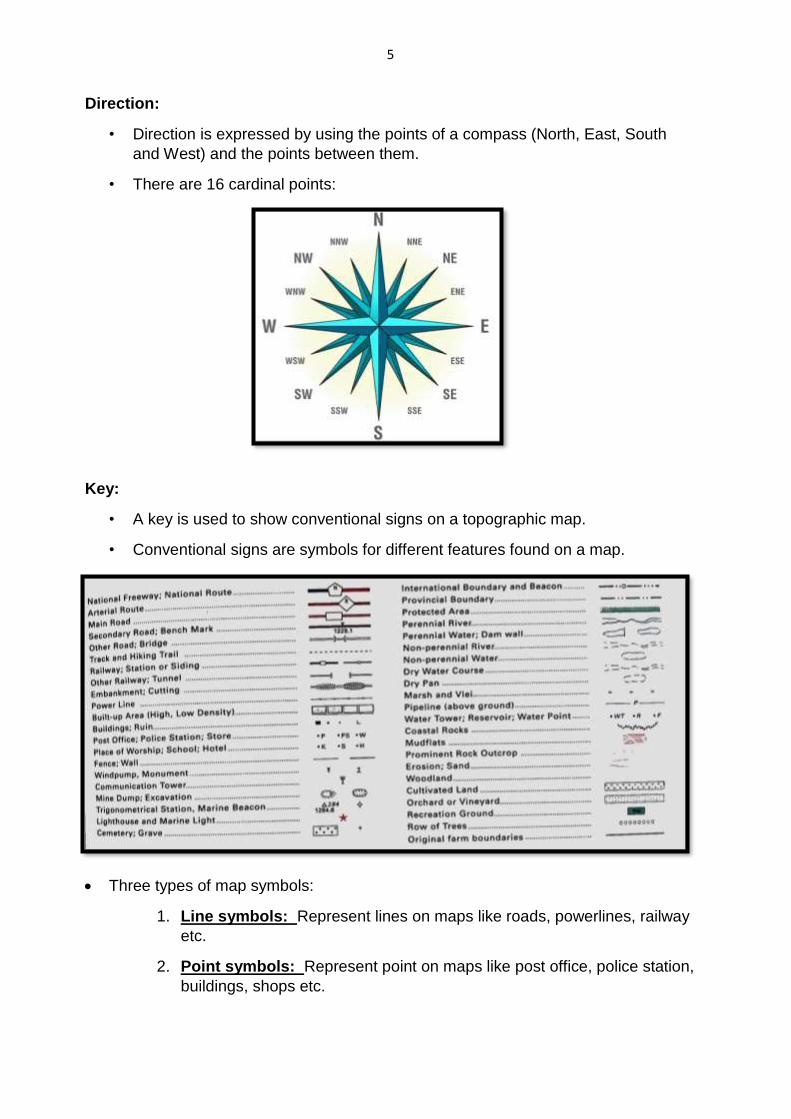
Direction:
• Direction is expressed by using the points of a compass (North, East, South
and West) and the points between them.
• There are 16 cardinal points:
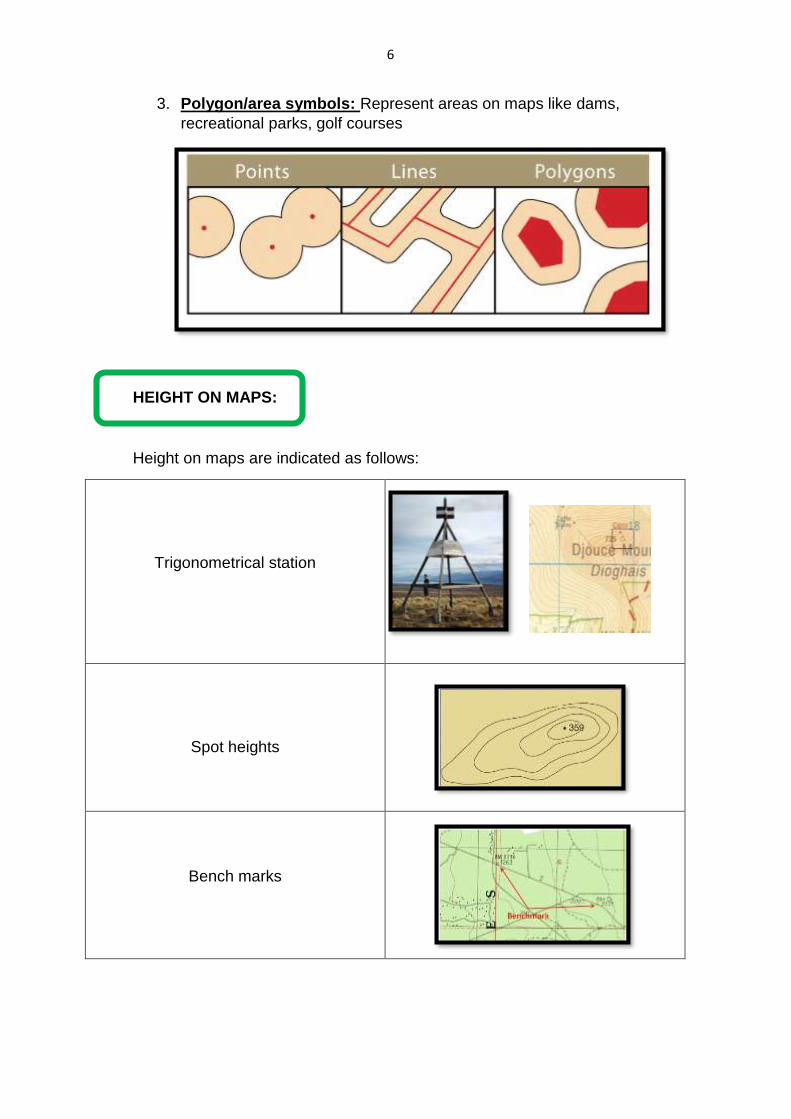
Key:
• A key is used to show conventional signs on a topographic map.
• Conventional signs are symbols for different features found on a map.
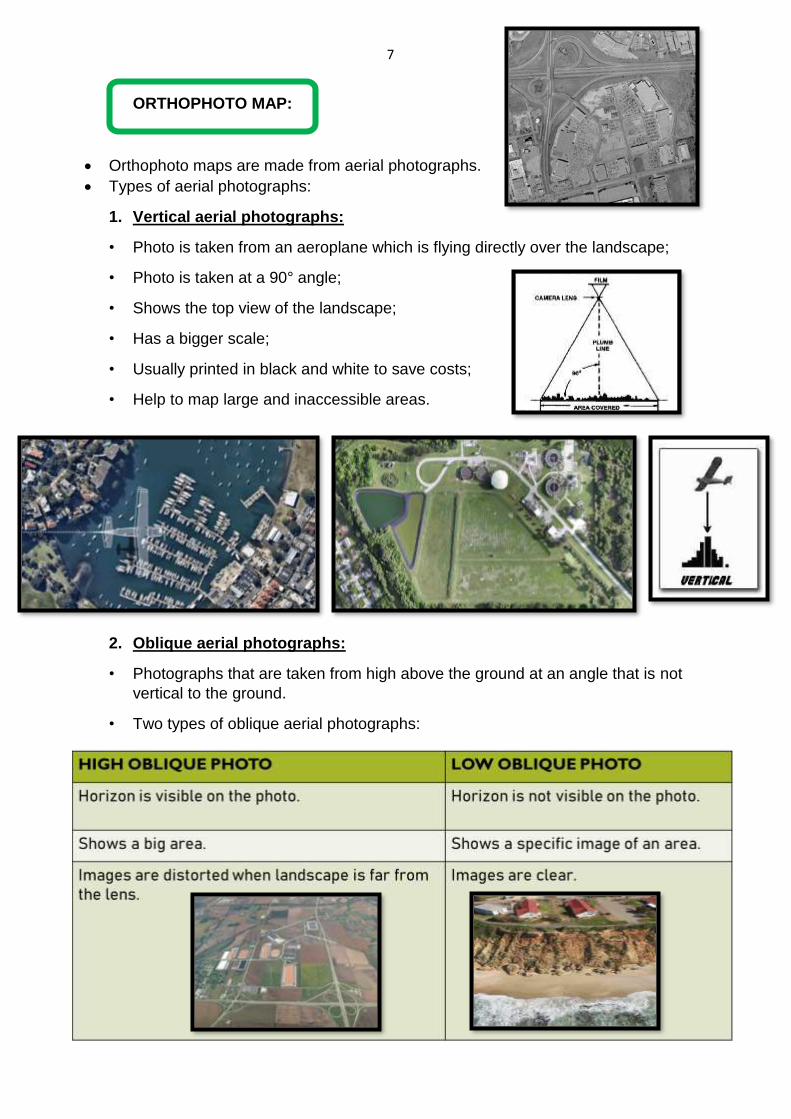
Three types of map symbols:
1. Line symbols: Represent lines on maps like roads, powerlines, railway
etc.
2. Point symbols: Represent point on maps like post office, police station,
buildings, shops etc.
6
3. Polygon/area symbols: Represent areas on maps like dams,
recreational parks, golf courses
HEIGHT ON MAPS:
Height on maps are indicated as follows:
Trigonometrical station
Spot heights
Bench marks
7
ORTHOPHOTO MAP:
Orthophoto maps are made from aerial photographs.
Types of aerial photographs:
1. Vertical aerial photographs:
• Photo is taken from an aeroplane which is flying directly over the landscape;
• Photo is taken at a 90° angle;
• Shows the top view of the landscape;
• Has a bigger scale;
• Usually printed in black and white to save costs;
• Help to map large and inaccessible areas.
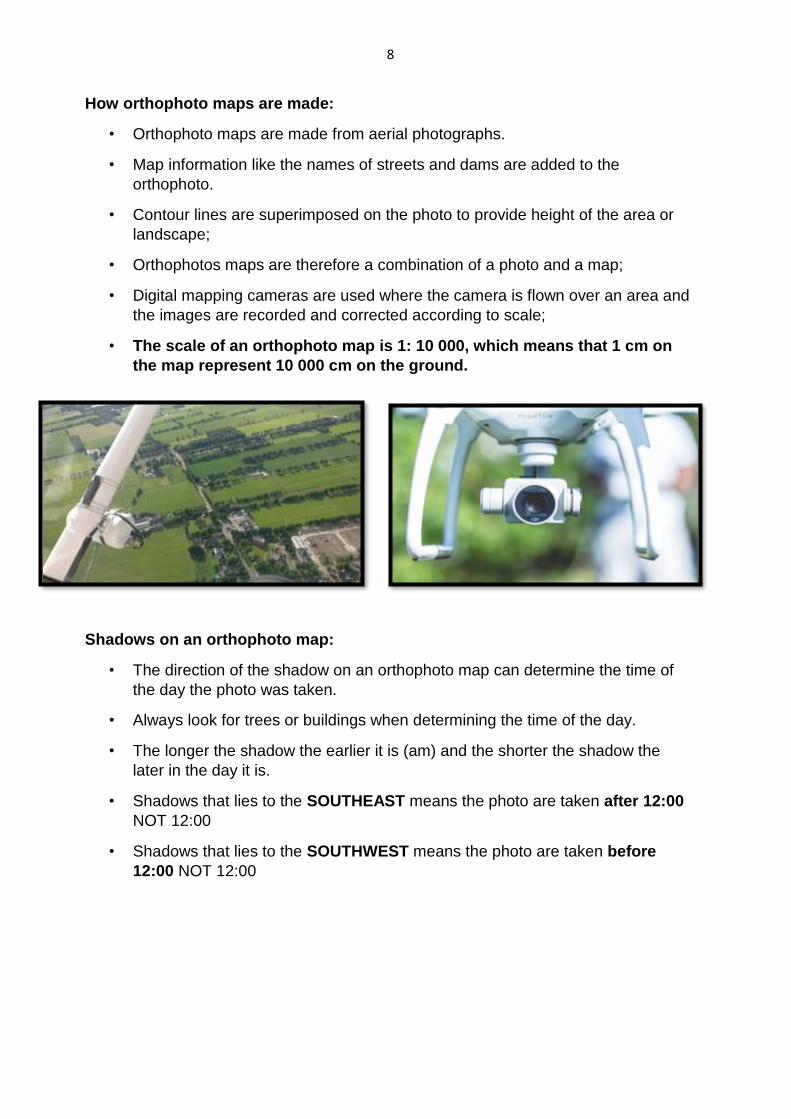
2. Oblique aerial photographs:
• Photographs that are taken from high above the ground at an angle that is not
vertical to the ground.
• Two types of oblique aerial photographs:
8
How orthophoto maps are made:
• Orthophoto maps are made from aerial photographs.
• Map information like the names of streets and dams are added to the
orthophoto.
• Contour lines are superimposed on the photo to provide height of the area or
landscape;
• Orthophotos maps are therefore a combination of a photo and a map;
• Digital mapping cameras are used where the camera is flown over an area and
the images are recorded and corrected according to scale;
• The scale of an orthophoto map is 1: 10 000, which means that 1 cm on
the map represent 10 000 cm on the ground.
Shadows on an orthophoto map:
• The direction of the shadow on an orthophoto map can determine the time of
the day the photo was taken.
• Always look for trees or buildings when determining the time of the day.
• The longer the shadow the earlier it is (am) and the shorter the shadow the
later in the day it is.
• Shadows that lies to the SOUTHEAST means the photo are taken after 12:00
NOT 12:00
• Shadows that lies to the SOUTHWEST means the photo are taken before
12:00 NOT 12:00
9
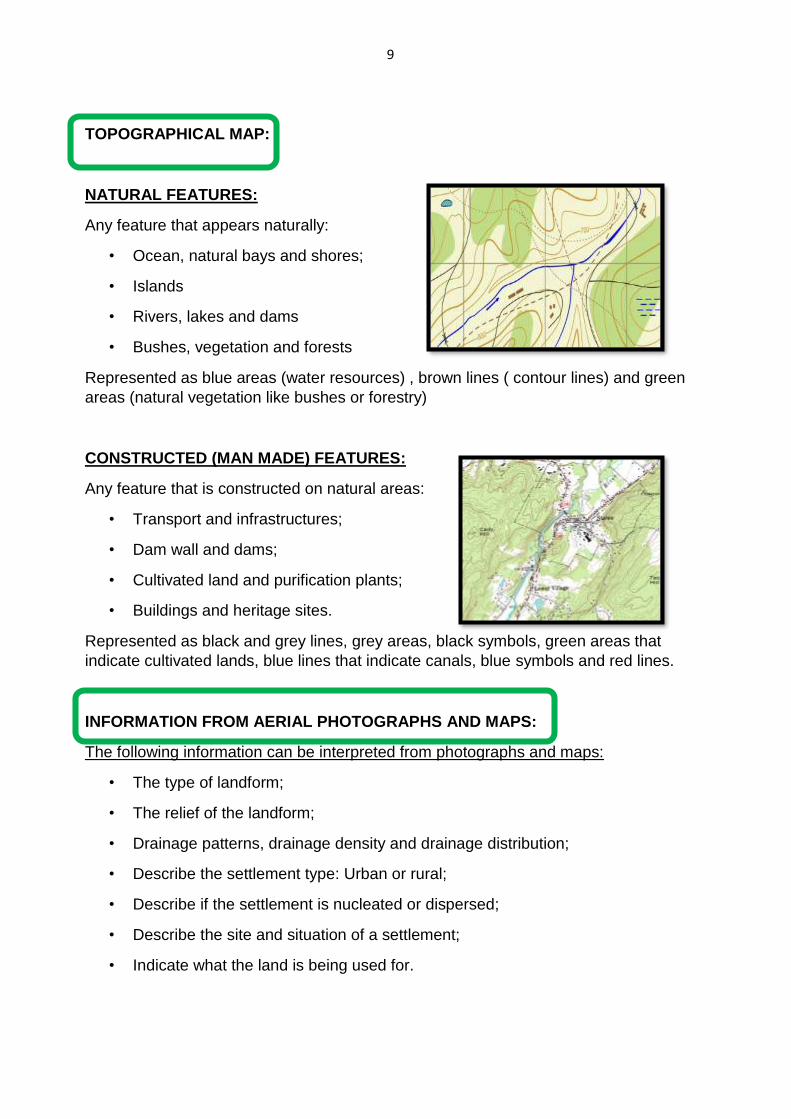
TOPOGRAPHICAL MAP:
NATURAL FEATURES:
Any feature that appears naturally:
• Ocean, natural bays and shores;
• Islands
• Rivers, lakes and dams
• Bushes, vegetation and forests
Represented as blue areas (water resources) , brown lines ( contour lines) and green
areas (natural vegetation like bushes or forestry)
CONSTRUCTED (MAN MADE) FEATURES:
Any feature that is constructed on natural areas:
• Transport and infrastructures;
• Dam wall and dams;
• Cultivated land and purification plants;
• Buildings and heritage sites.
Represented as black and grey lines, grey areas, black symbols, green areas that
indicate cultivated lands, blue lines that indicate canals, blue symbols and red lines.
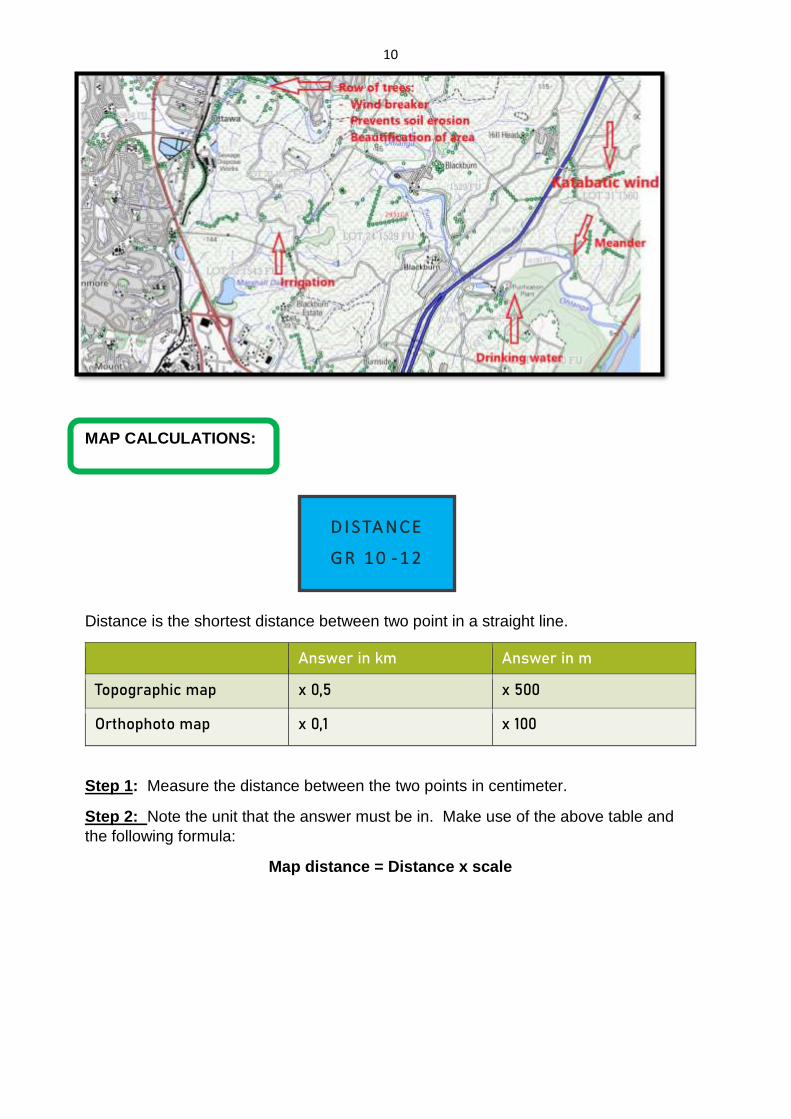
INFORMATION FROM AERIAL PHOTOGRAPHS AND MAPS:
The following information can be interpreted from photographs and maps:
• The type of landform;
• The relief of the landform;
• Drainage patterns, drainage density and drainage distribution;
• Describe the settlement type: Urban or rural;
• Describe if the settlement is nucleated or dispersed;
• Describe the site and situation of a settlement;
• Indicate what the land is being used for.
10
MAP CALCULATIONS:
Distance is the shortest distance between two point in a straight line.
Answer in km Answer in m
Topographic map x 0,5 x 500
Orthophoto map x 0,1 x 100
Step 1: Measure the distance between the two points in centimeter.
Step 2: Note the unit that the answer must be in. Make use of the above table and
the following formula:
Map distance = Distance x scale
D I S TA N C E
G R 1 0 - 1 2
11
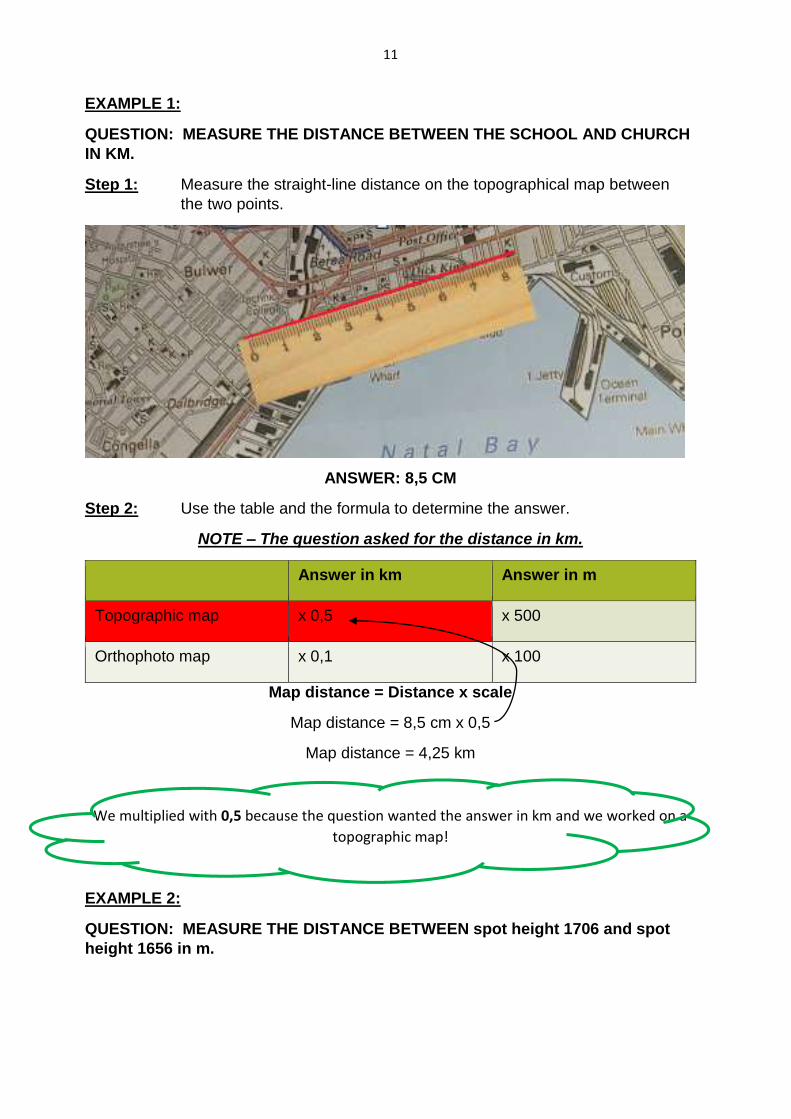
EXAMPLE 1:
QUESTION: MEASURE THE DISTANCE BETWEEN THE SCHOOL AND CHURCH
IN KM.
Step 1: Measure the straight-line distance on the topographical map between
the two points.
ANSWER: 8,5 CM
Step 2: Use the table and the formula to determine the answer.
NOTE – The question asked for the distance in km.
Answer in km Answer in m
Topographic map x 0,5 x 500
Orthophoto map x 0,1 x 100
Map distance = Distance x scale
Map distance = 8,5 cm x 0,5
Map distance = 4,25 km
We multiplied with 0,5 because the question wanted the answer in km and we worked on a
topographic map!
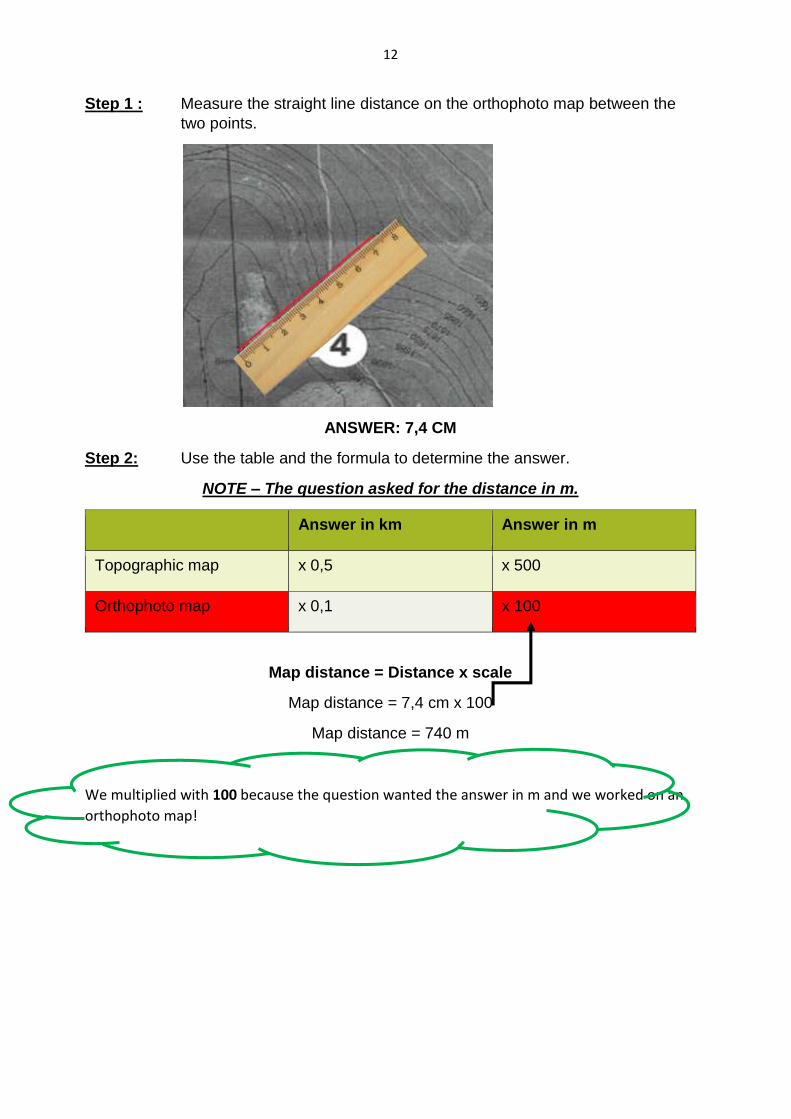
EXAMPLE 2:
QUESTION: MEASURE THE DISTANCE BETWEEN spot height 1706 and spot
height 1656 in m.
12
Step 1 : Measure the straight line distance on the orthophoto map between the
two points.
ANSWER: 7,4 CM
Step 2: Use the table and the formula to determine the answer.
NOTE – The question asked for the distance in m.
Answer in km Answer in m
Topographic map x 0,5 x 500
Orthophoto map x 0,1 x 100
Map distance = Distance x scale
Map distance = 7,4 cm x 100
Map distance = 740 m
We multiplied with 100 because the question wanted the answer in m and we worked on an
orthophoto map!
13
The measurement of the size of a surface.
REMEMBER – WITH AREA YOU MUST MEASURE THEREFORE A SCALE MUST
BE USED!!
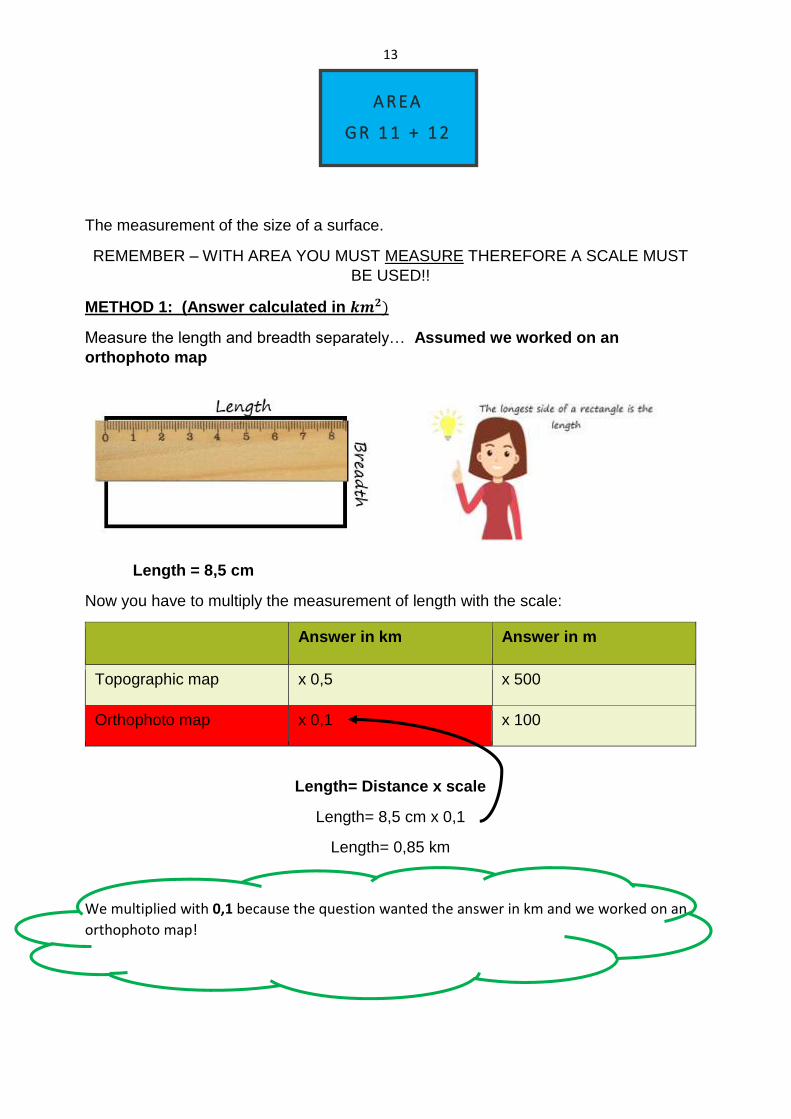
METHOD 1: (Answer calculated in 𝒌𝒎𝟐)
Measure the length and breadth separately… Assumed we worked on an
orthophoto map
Length = 8,5 cm
Now you have to multiply the measurement of length with the scale:
Answer in km Answer in m
Topographic map x 0,5 x 500
Orthophoto map x 0,1 x 100
Length= Distance x scale
Length= 8,5 cm x 0,1
Length= 0,85 km
We multiplied with 0,1 because the question wanted the answer in km and we worked on an
orthophoto map!
A R E A
G R 1 1 + 1 2
14
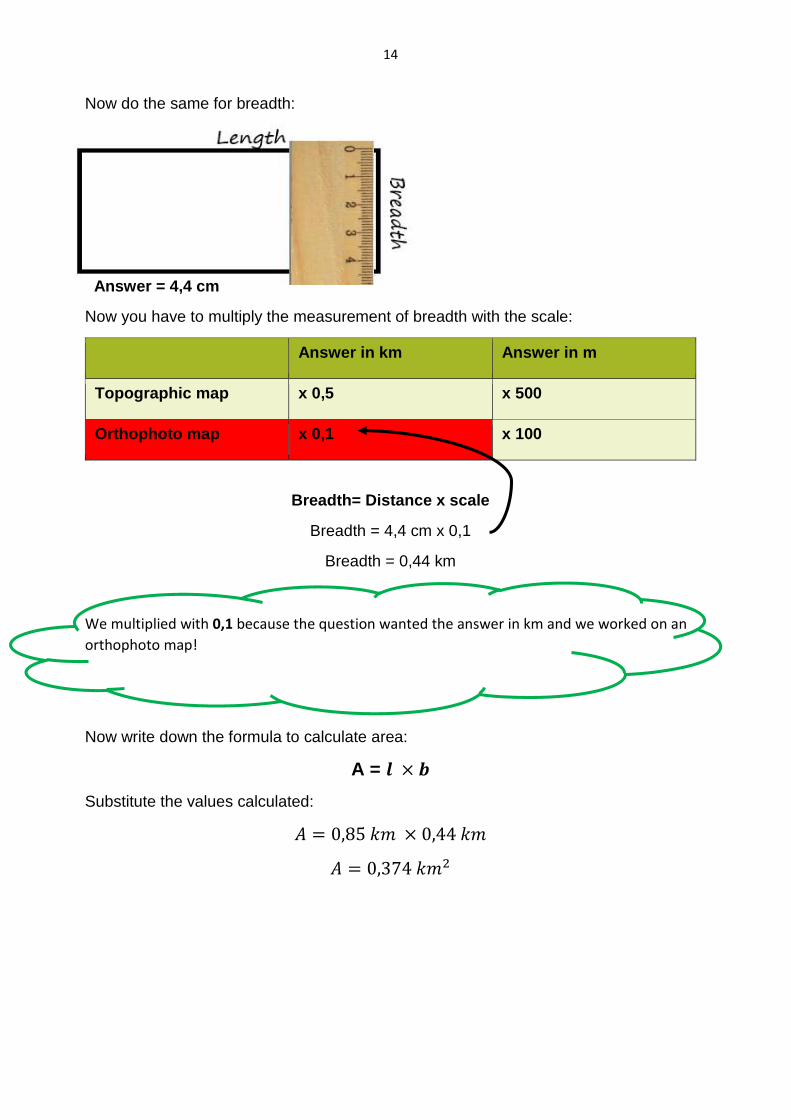
Now do the same for breadth:
Answer = 4,4 cm
Now you have to multiply the measurement of breadth with the scale:
Answer in km Answer in m
Topographic map x 0,5 x 500
Orthophoto map x 0,1 x 100
Breadth= Distance x scale
Breadth = 4,4 cm x 0,1
Breadth = 0,44 km
We multiplied with 0,1 because the question wanted the answer in km and we worked on an
orthophoto map!
Now write down the formula to calculate area:
A = 𝒍 × 𝒃
Substitute the values calculated:
𝐴 = 0,85 𝑘𝑚 × 0,44 𝑘𝑚
𝐴 = 0,374 𝑘𝑚2
15
METHOD 2: (Answer calculated in 𝒌𝒎𝟐)
We know from previous calculations that:
Length = 8,5 cm and Breadth = 4,4 cm
A = 𝒍 × 𝒃
𝐴 = (8,5 × 0,1) × (4,4 × 0,1)
𝐴 = 0,85 𝑘𝑚 × 0,44 𝑘𝑚
𝐴 = 0,374 𝑘𝑚2
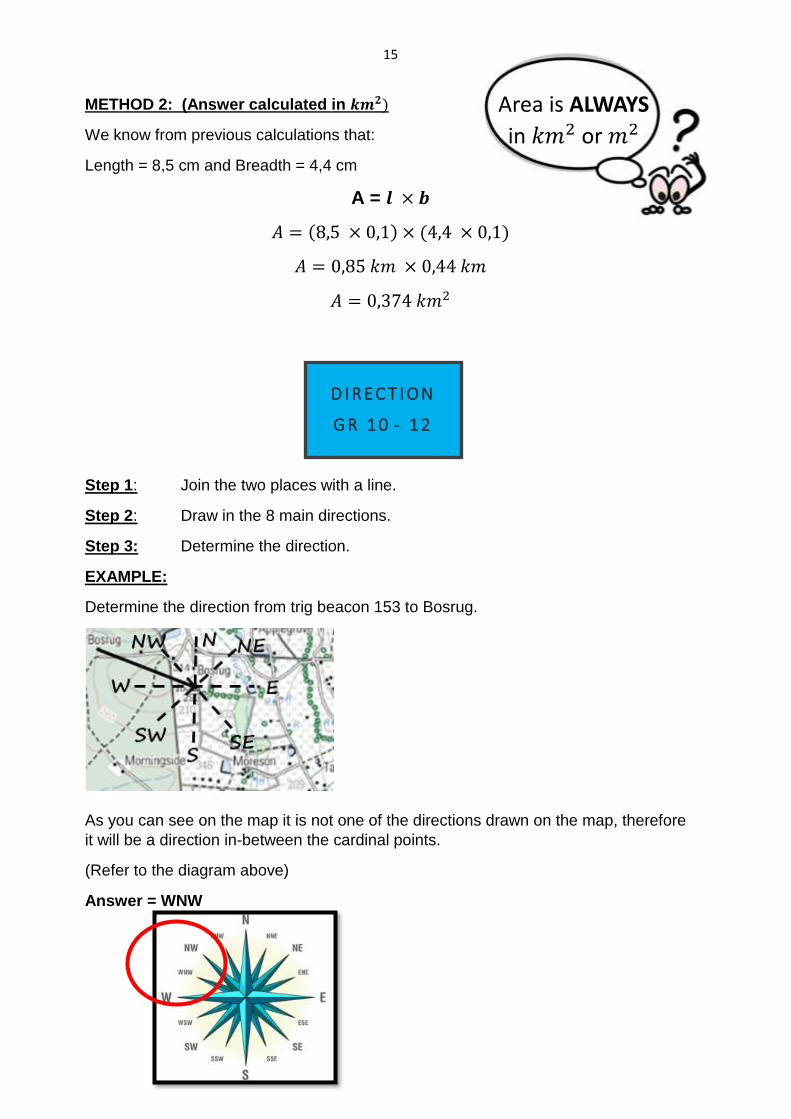
Step 1: Join the two places with a line.
Step 2: Draw in the 8 main directions.
Step 3: Determine the direction.
EXAMPLE:
Determine the direction from trig beacon 153 to Bosrug.
As you can see on the map it is not one of the directions drawn on the map, therefore
it will be a direction in-between the cardinal points.
(Refer to the diagram above)
Answer = WNW
Area is ALWAYS
in 𝑘𝑚2 or 𝑚2
D I R E C T I O N
G R 1 0 - 1 2
16
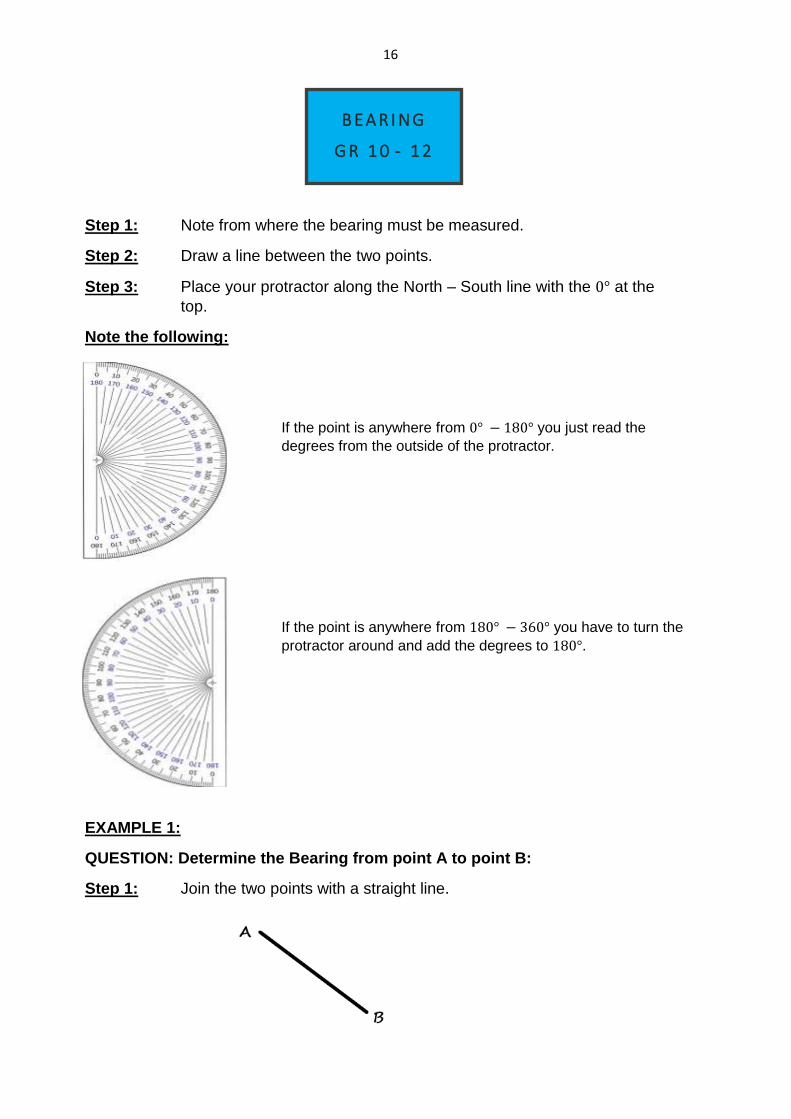
Step 1: Note from where the bearing must be measured.
Step 2: Draw a line between the two points.
Step 3: Place your protractor along the North – South line with the 0° at the
top.
Note the following:
If the point is anywhere from 0° − 180° you just read the
degrees from the outside of the protractor.
If the point is anywhere from 180° − 360° you have to turn the
protractor around and add the degrees to 180°.
EXAMPLE 1:
QUESTION: Determine the Bearing from point A to point B:
Step 1: Join the two points with a straight line.
B E A R I N G
G R 1 0 - 1 2
17
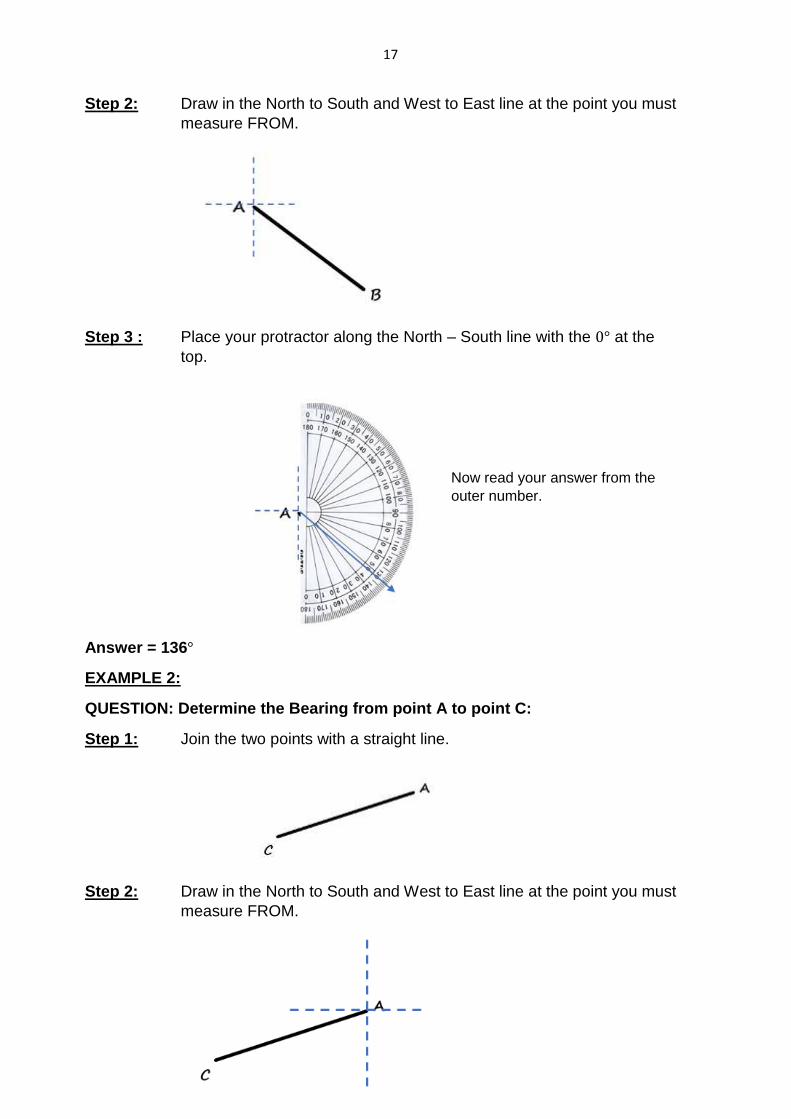
Step 2: Draw in the North to South and West to East line at the point you must
measure FROM.
Step 3 : Place your protractor along the North – South line with the 0° at the
top.
Now read your answer from the
outer number.
Answer = 136°
EXAMPLE 2:
QUESTION: Determine the Bearing from point A to point C:
Step 1: Join the two points with a straight line.
Step 2: Draw in the North to South and West to East line at the point you must
measure FROM.
18
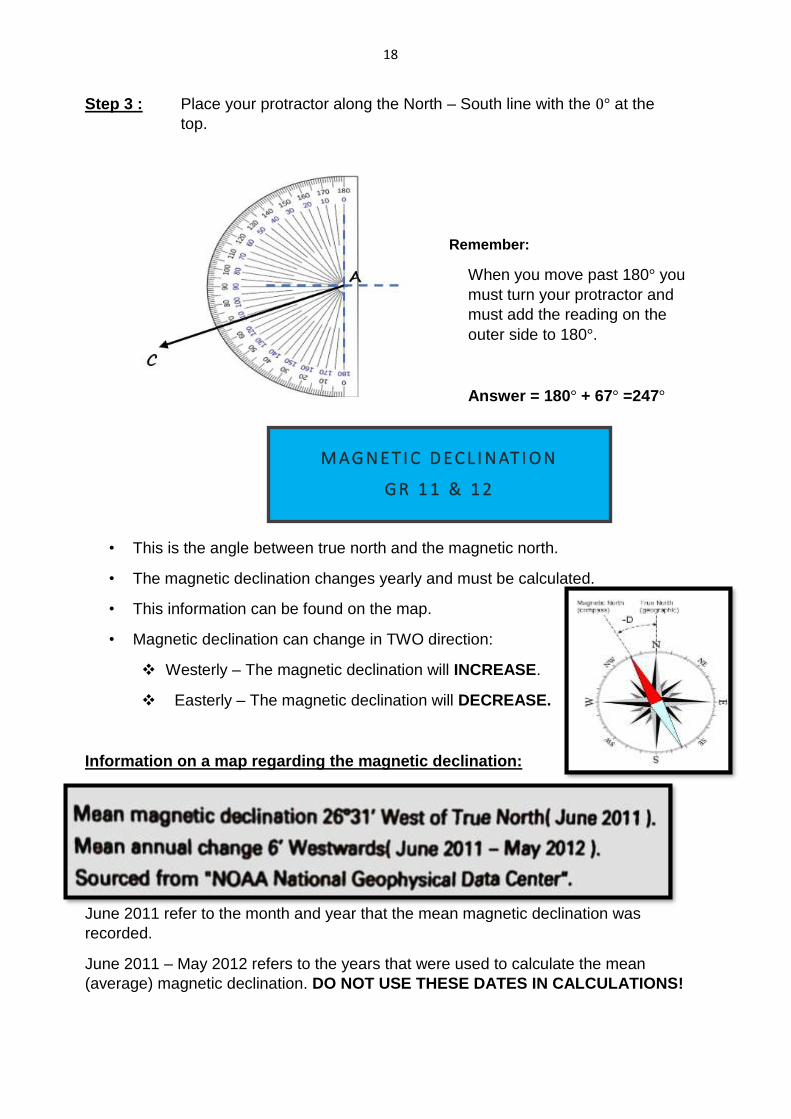
Step 3 : Place your protractor along the North – South line with the 0° at the
top.
Remember:
When you move past 180° you
must turn your protractor and
must add the reading on the
outer side to 180°.
Answer = 180° + 67° =247°
• This is the angle between true north and the magnetic north.
• The magnetic declination changes yearly and must be calculated.
• This information can be found on the map.
• Magnetic declination can change in TWO direction:
Westerly – The magnetic declination will INCREASE.
Easterly – The magnetic declination will DECREASE.
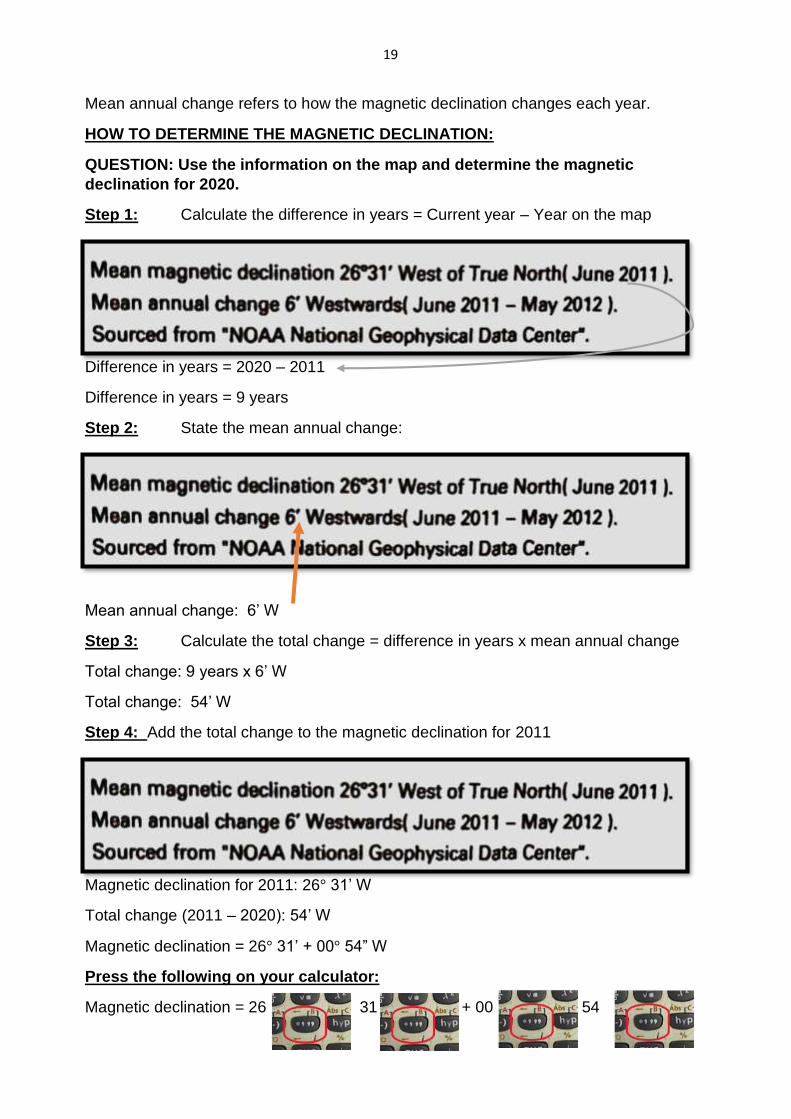
Information on a map regarding the magnetic declination:
June 2011 refer to the month and year that the mean magnetic declination was
recorded.
June 2011 – May 2012 refers to the years that were used to calculate the mean
(average) magnetic declination. DO NOT USE THESE DATES IN CALCULATIONS!
M A G N E T I C D E C L I N AT I O N
G R 1 1 & 1 2
19
Mean annual change refers to how the magnetic declination changes each year.
HOW TO DETERMINE THE MAGNETIC DECLINATION:
QUESTION: Use the information on the map and determine the magnetic
declination for 2020.
Step 1: Calculate the difference in years = Current year – Year on the map
Difference in years = 2020 – 2011
Difference in years = 9 years
Step 2: State the mean annual change:
Mean annual change: 6’ W
Step 3: Calculate the total change = difference in years x mean annual change
Total change: 9 years x 6’ W
Total change: 54’ W
Step 4: Add the total change to the magnetic declination for 2011
Magnetic declination for 2011: 26° 31’ W
Total change (2011 – 2020): 54’ W
Magnetic declination = 26° 31’ + 00° 54” W
Press the following on your calculator:
Magnetic declination = 26 31 + 00 54
20
Magnetic declination = 27°25’ W (Remember the direction MUST be indicated)
QUESTION: Calculate the magnetic bearing of trig beacon 160 to trig beacon 39.
Use the following formula: Magnetic bearing = True bearing + Magnetic
declination.
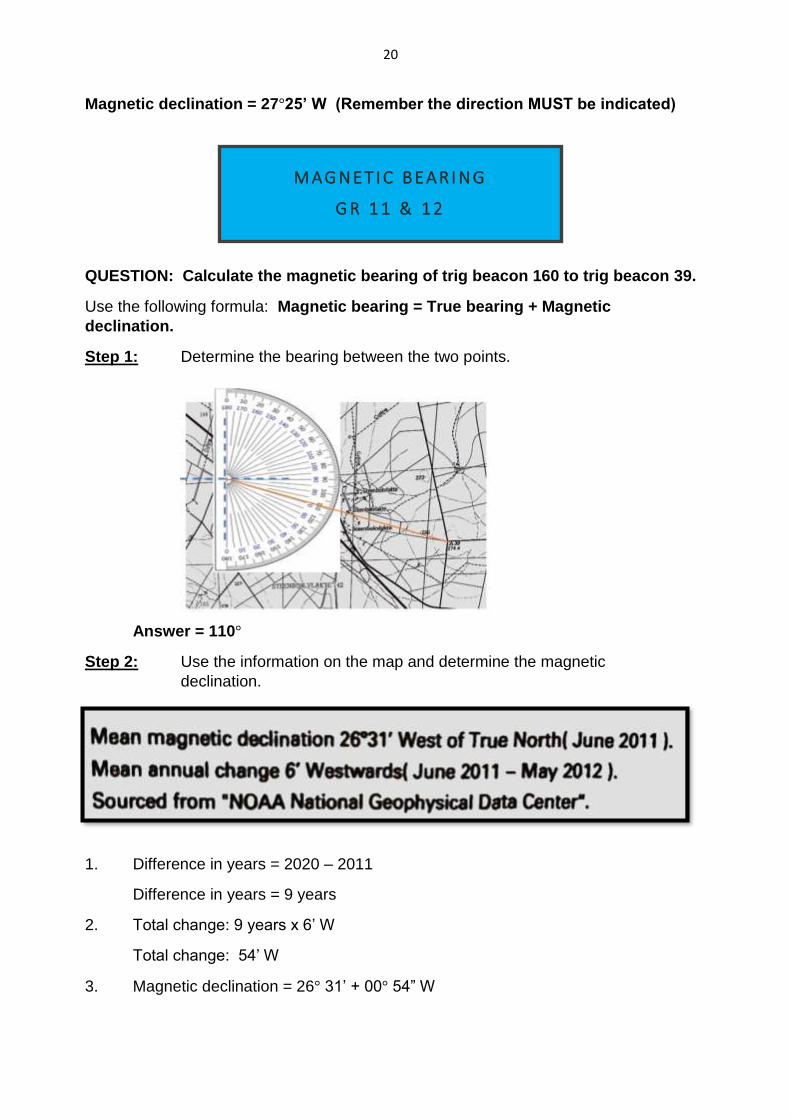
Step 1: Determine the bearing between the two points.
Answer = 110°
Step 2: Use the information on the map and determine the magnetic
declination.
1. Difference in years = 2020 – 2011
Difference in years = 9 years
2. Total change: 9 years x 6’ W
Total change: 54’ W
3. Magnetic declination = 26° 31’ + 00° 54” W
M A G N E T I C B E A R I N G
G R 1 1 & 1 2
21
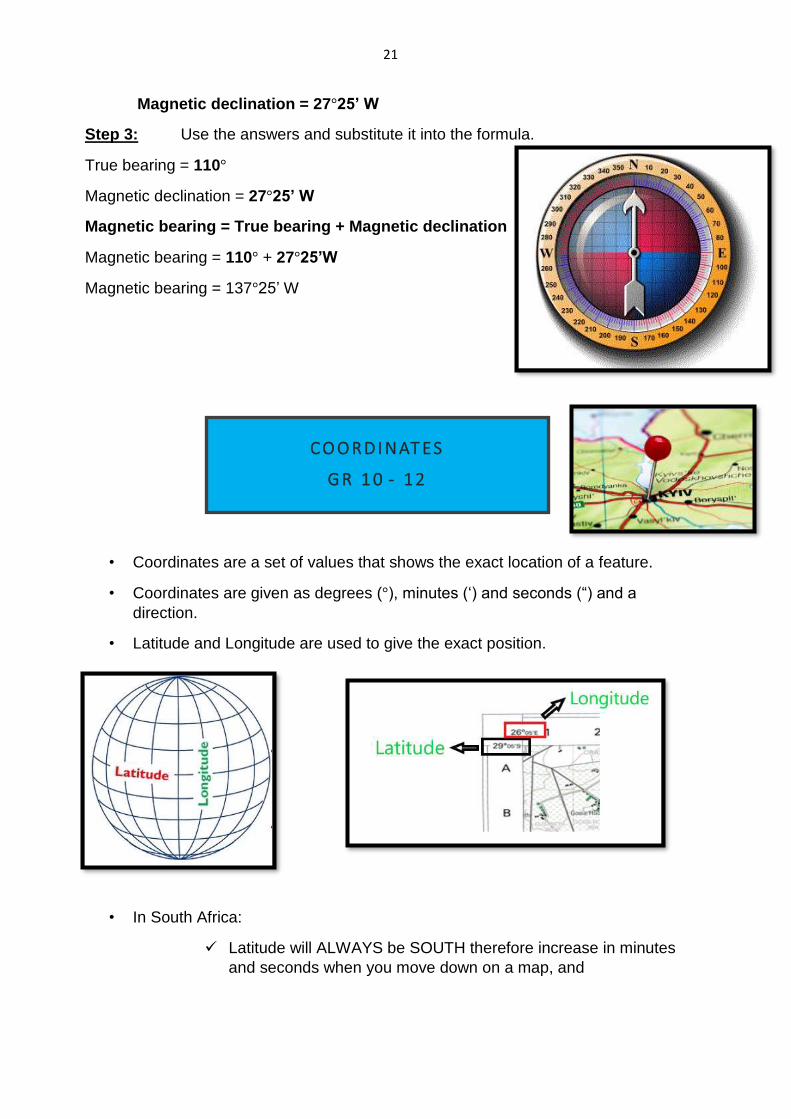
Magnetic declination = 27°25’ W
Step 3: Use the answers and substitute it into the formula.
True bearing = 110°
Magnetic declination = 27°25’ W
Magnetic bearing = True bearing + Magnetic declination
Magnetic bearing = 110° + 27°25’W
Magnetic bearing = 137°25’ W
• Coordinates are a set of values that shows the exact location of a feature.
• Coordinates are given as degrees (°), minutes (‘) and seconds (“) and a
direction.
• Latitude and Longitude are used to give the exact position.
• In South Africa:
Latitude will ALWAYS be SOUTH therefore increase in minutes
and seconds when you move down on a map, and
C O O R D I N AT E S
G R 1 0 - 1 2
22
Longitude will ALWAYS be EAST therefore increase when you
move from left to right on a map.
Remember:
• 60’ = 1°
• 60” = 1’
• With the start of a new block it changes
• to the next minute.
QUESTION: DETERMINE THE COORDINATES OF TIG BEACON 345 IN BLOCK
B1.
Note that the coordinates must be written in the following format:
00°00’00” S; 00°00’00” E
Latitude ; Longitude
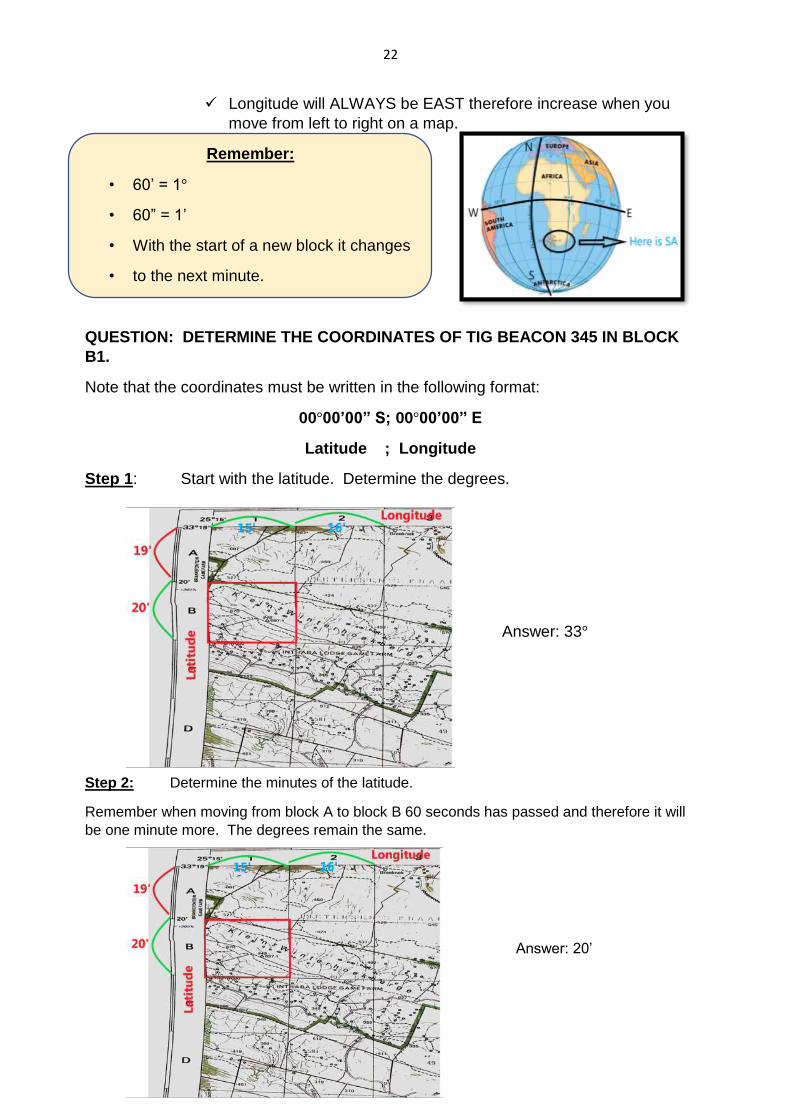
Step 1: Start with the latitude. Determine the degrees.
Answer: 33°
Step 2: Determine the minutes of the latitude.
Remember when moving from block A to block B 60 seconds has passed and therefore it will
be one minute more. The degrees remain the same.
Answer: 20’
23
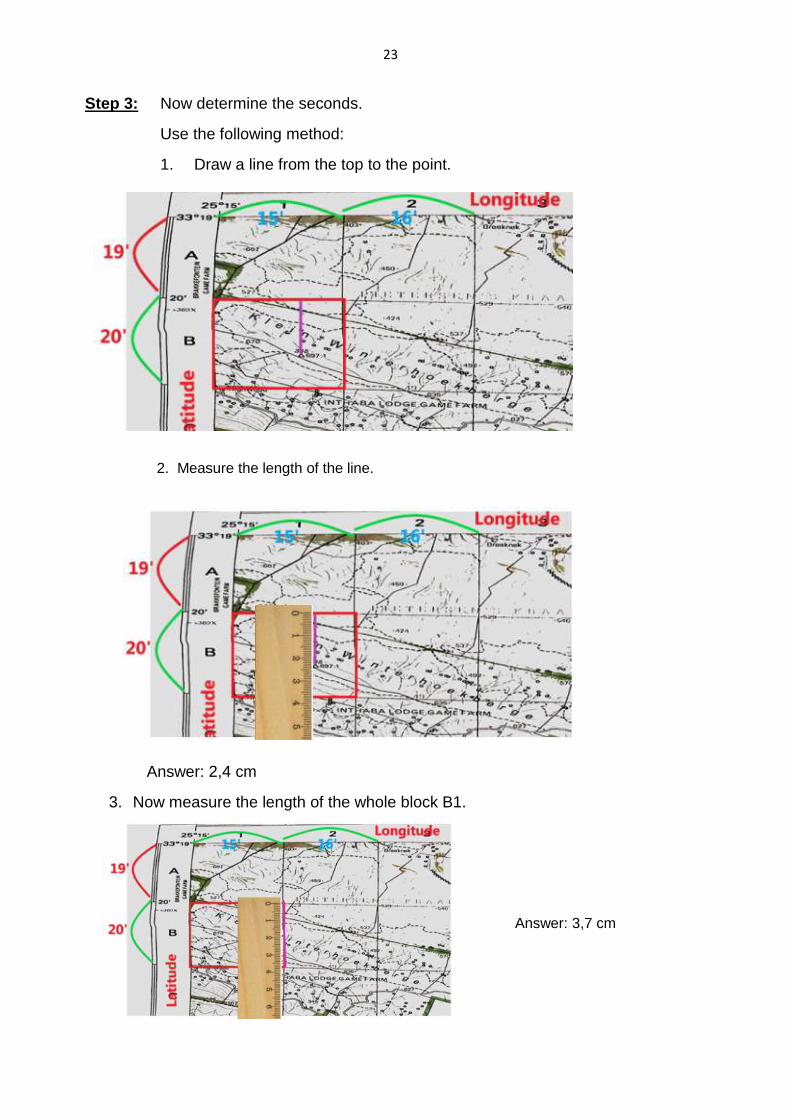
Step 3: Now determine the seconds.
Use the following method:
1. Draw a line from the top to the point.
2. Measure the length of the line.
Answer: 2,4 cm
3. Now measure the length of the whole block B1.
Answer: 3,7 cm
24
4. Now do the following calculation to determine the seconds:
Seconds = short line
long line ×
60
1
𝑆𝑒𝑐𝑜𝑛𝑑𝑠 = 2,4 𝑐𝑚
3,7 𝑐𝑚 ×
60
1
Seconds = 38,9189
𝑆𝑒𝑐𝑜𝑛𝑑𝑠 ≈ 39“
5. Now write the whole value (degrees, minutes, seconds and direction) of the
latitude:
33° 20’ 39” S
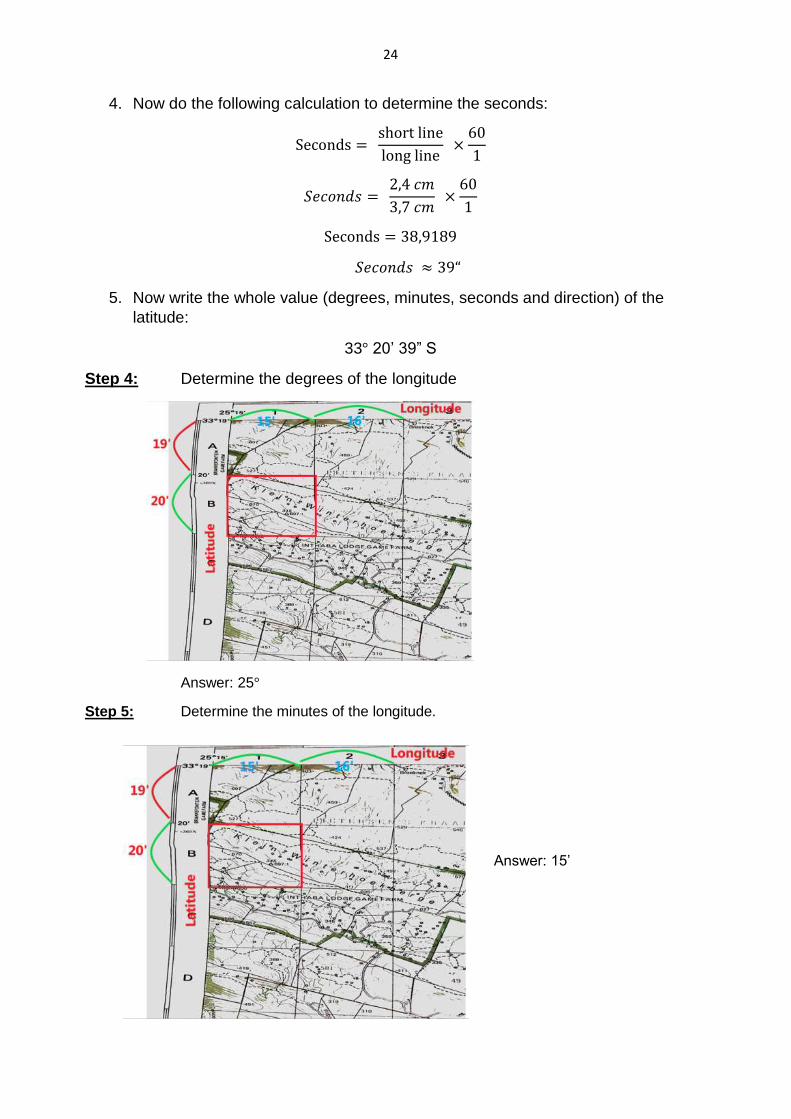
Step 4: Determine the degrees of the longitude
Answer: 25°
Step 5: Determine the minutes of the longitude.
Answer: 15’
25
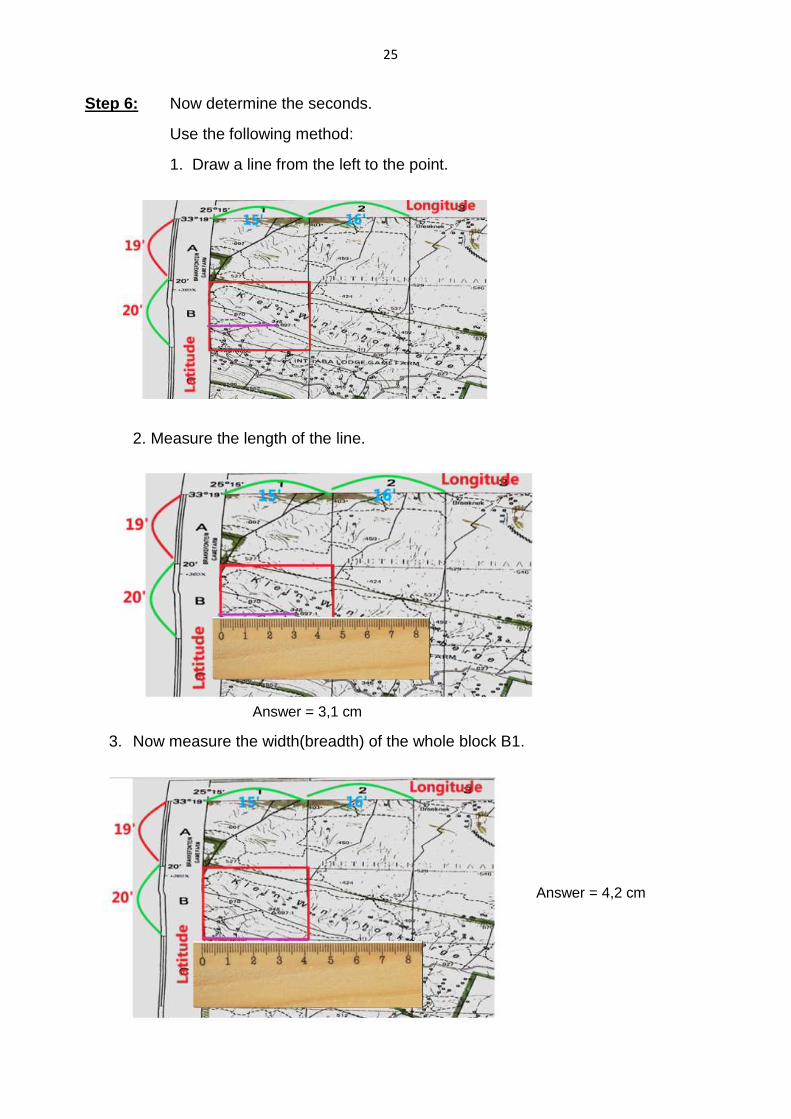
Step 6: Now determine the seconds.
Use the following method:
1. Draw a line from the left to the point.
2. Measure the length of the line.
Answer = 3,1 cm
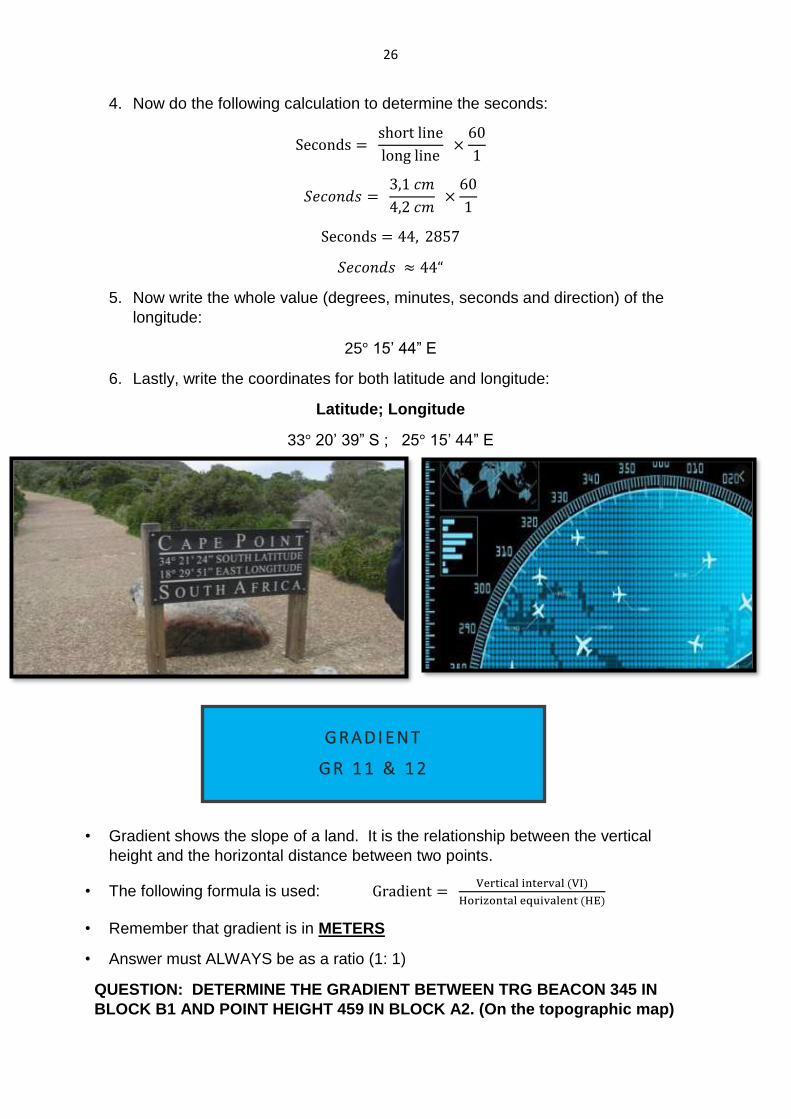
3. Now measure the width(breadth) of the whole block B1.
Answer = 4,2 cm
26
4. Now do the following calculation to determine the seconds:
Seconds = short line
long line ×
60
1
𝑆𝑒𝑐𝑜𝑛𝑑𝑠 = 3,1 𝑐𝑚
4,2 𝑐𝑚 ×
60
1
Seconds = 44, 2857
𝑆𝑒𝑐𝑜𝑛𝑑𝑠 ≈ 44“
5. Now write the whole value (degrees, minutes, seconds and direction) of the
longitude:
25° 15’ 44” E
6. Lastly, write the coordinates for both latitude and longitude:
Latitude; Longitude
33° 20’ 39” S ; 25° 15’ 44” E
• Gradient shows the slope of a land. It is the relationship between the vertical
height and the horizontal distance between two points.
• The following formula is used: Gradient = Vertical interval (VI)
Horizontal equivalent (HE)
• Remember that gradient is in METERS
• Answer must ALWAYS be as a ratio (1: 1)
QUESTION: DETERMINE THE GRADIENT BETWEEN TRG BEACON 345 IN
BLOCK B1 AND POINT HEIGHT 459 IN BLOCK A2. (On the topographic map)
G R A D I E N T
G R 1 1 & 1 2
27
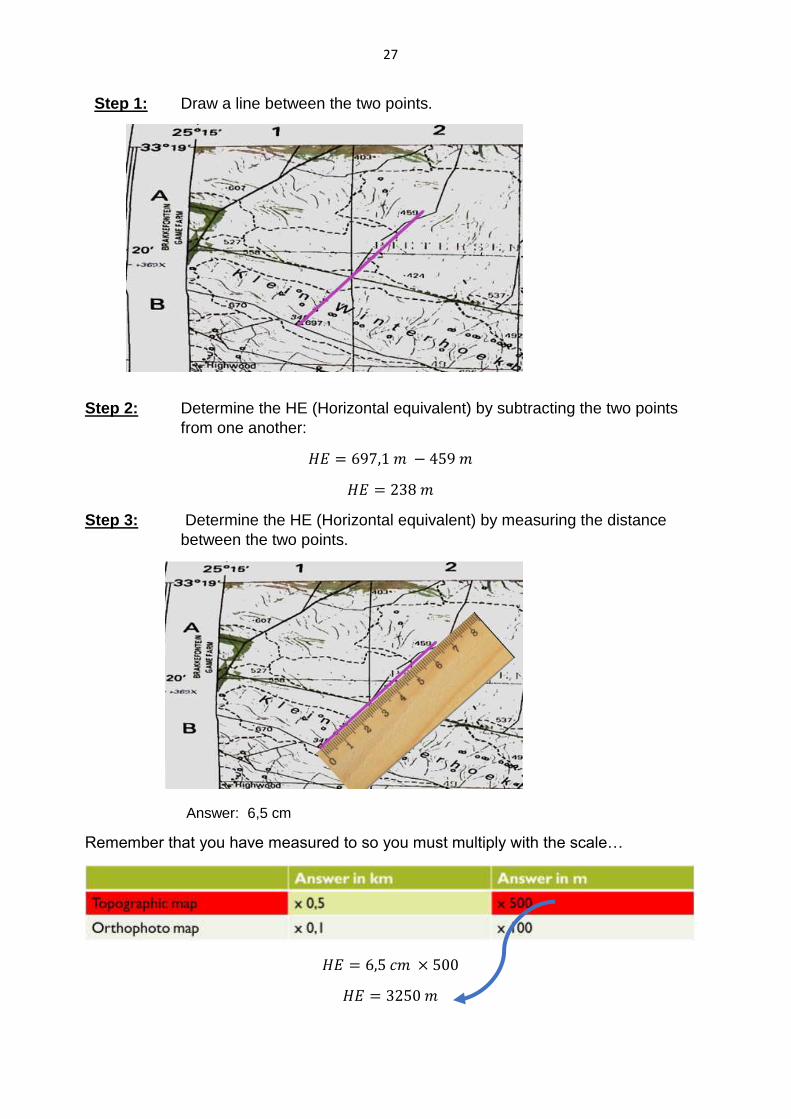
Step 1: Draw a line between the two points.
Step 2: Determine the HE (Horizontal equivalent) by subtracting the two points
from one another:
𝐻𝐸 = 697,1 𝑚 − 459 𝑚
𝐻𝐸 = 238 𝑚
Step 3: Determine the HE (Horizontal equivalent) by measuring the distance
between the two points.
Answer: 6,5 cm
Remember that you have measured to so you must multiply with the scale…
𝐻𝐸 = 6,5 𝑐𝑚 × 500
𝐻𝐸 = 3250 𝑚
28
Step 4: Substitute the values calculated into the formula:
Remember to always write the formula down..
𝐆𝐫𝐚𝐝𝐢𝐞𝐧𝐭 = 𝐕𝐞𝐫𝐭𝐢𝐜𝐚𝐥 𝐢𝐧𝐭𝐞𝐫𝐯𝐚𝐥 (𝐕𝐈)
𝐇𝐨𝐫𝐢𝐳𝐨𝐧𝐭𝐚𝐥 𝐞𝐪𝐮𝐢𝐯𝐚𝐥𝐞𝐧𝐭 (𝐇𝐄)
Gradient =238 m
3250 m (Divide the numerator and the denominator by the value
of the numerator)
OR
Insert it as follow into your calculator (𝟑𝟐𝟓𝟎
𝟐𝟑𝟖)
Step 5: Write your answer as a ratio = 1 : 13,66 (Round off to two decimals)
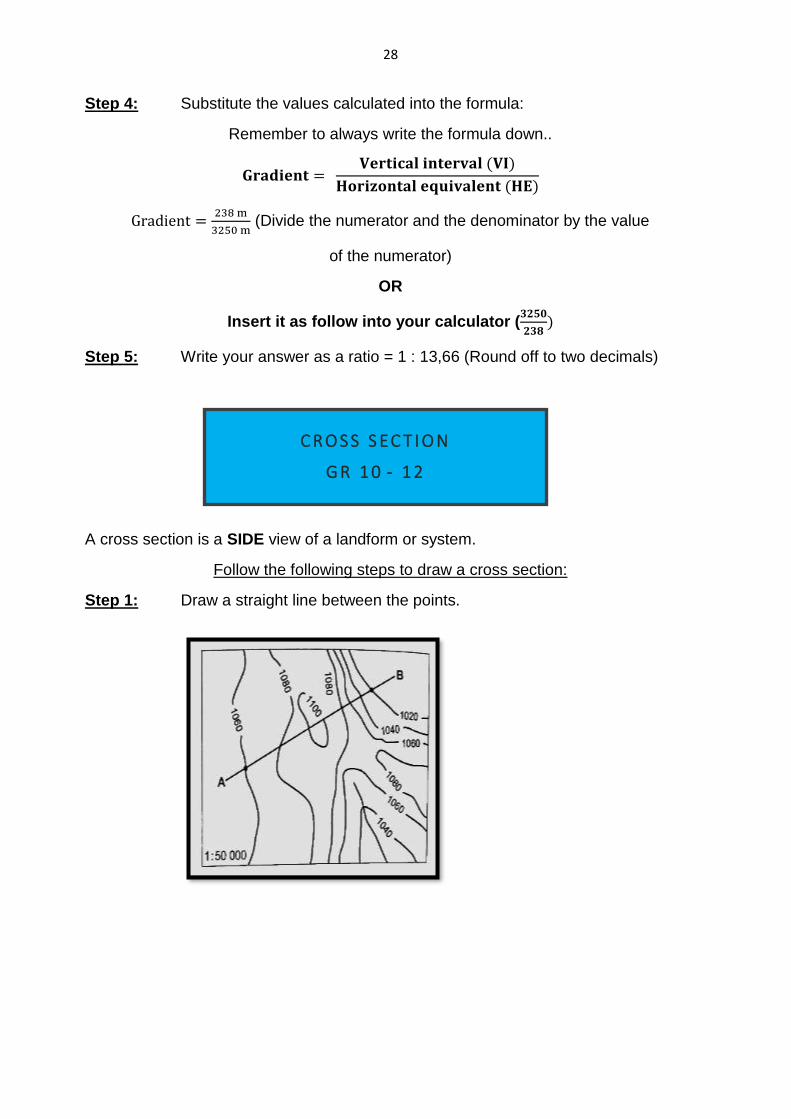
A cross section is a SIDE view of a landform or system.
Follow the following steps to draw a cross section:
Step 1: Draw a straight line between the points.
C R O S S S E C T I O N
G R 1 0 - 1 2
29
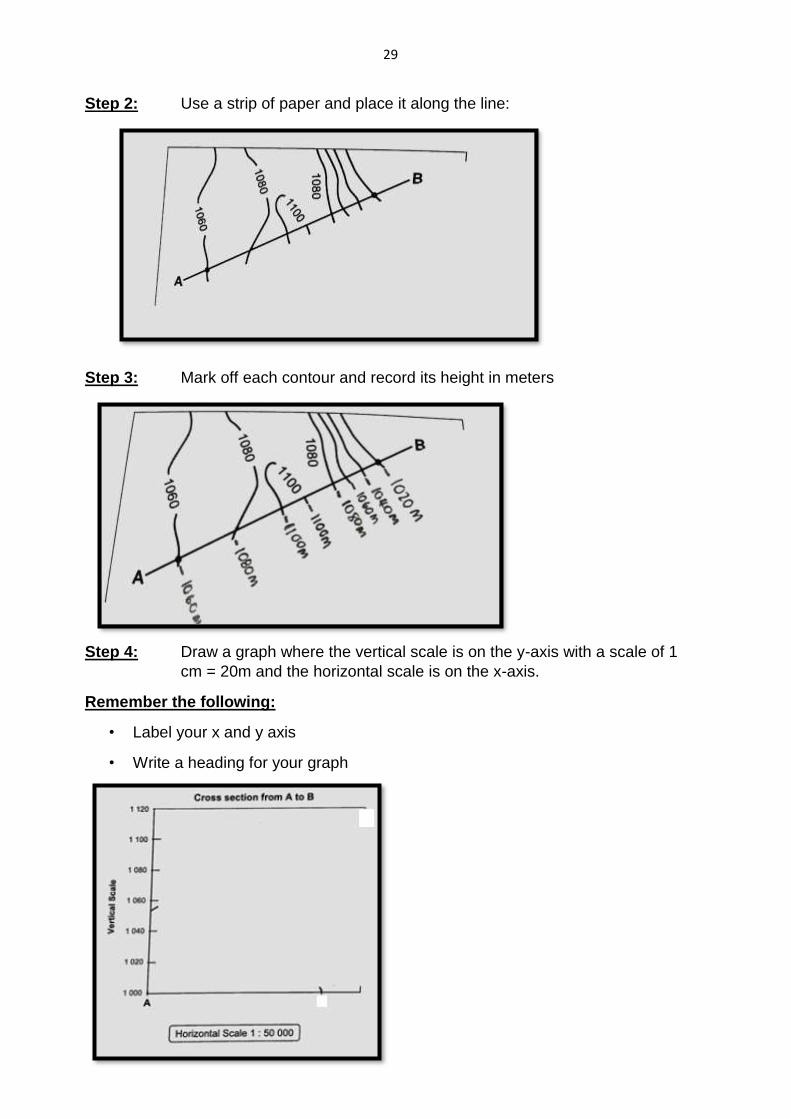
Step 2: Use a strip of paper and place it along the line:
Step 3: Mark off each contour and record its height in meters
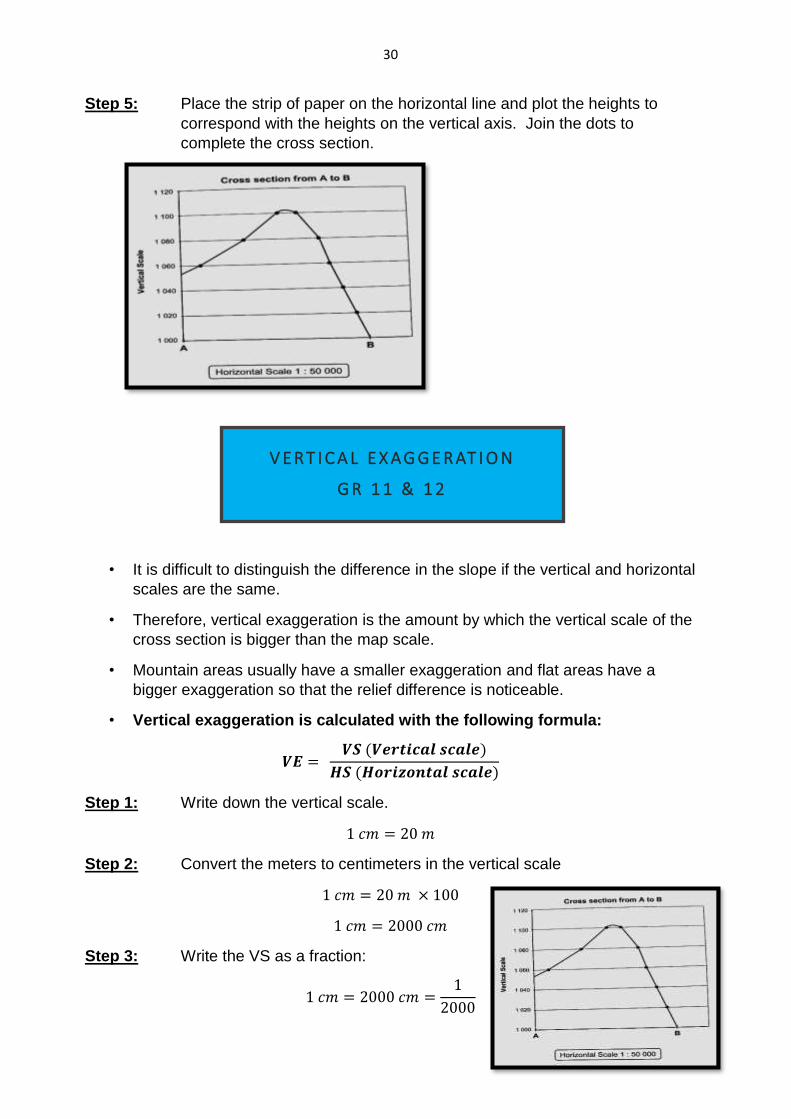
Step 4: Draw a graph where the vertical scale is on the y-axis with a scale of 1
cm = 20m and the horizontal scale is on the x-axis.
Remember the following:
• Label your x and y axis
• Write a heading for your graph
30
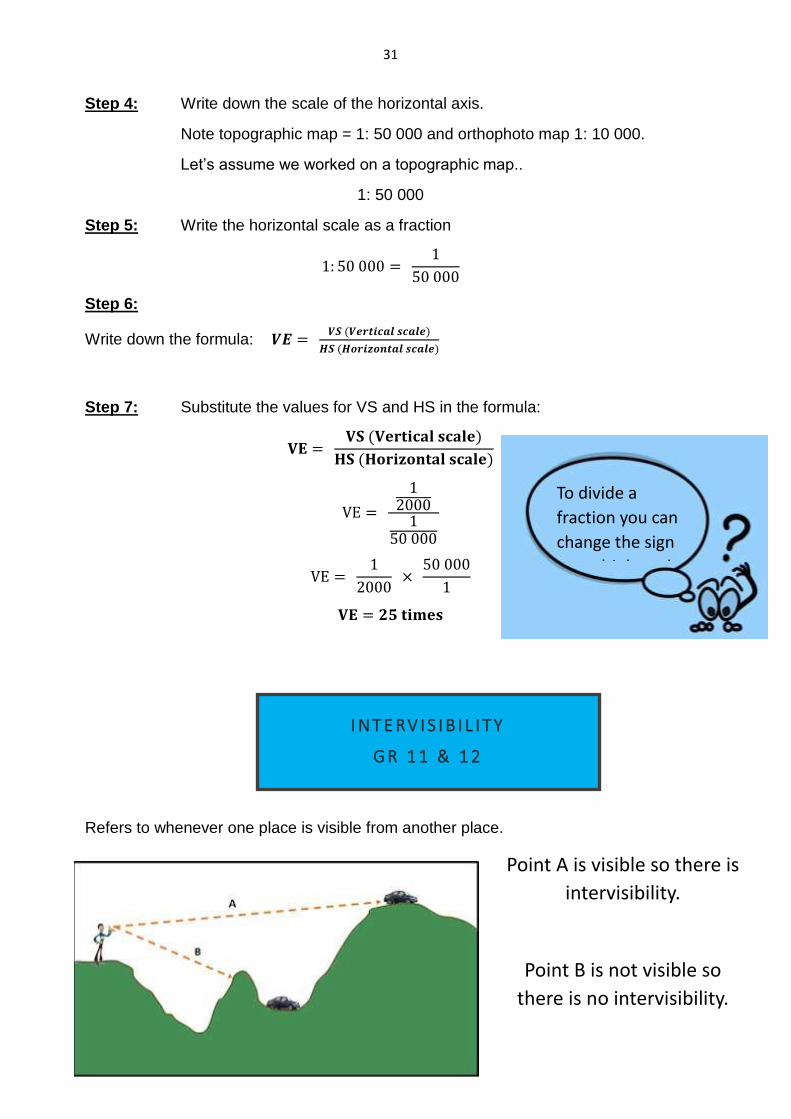
Step 5: Place the strip of paper on the horizontal line and plot the heights to
correspond with the heights on the vertical axis. Join the dots to
complete the cross section.
• It is difficult to distinguish the difference in the slope if the vertical and horizontal
scales are the same.
• Therefore, vertical exaggeration is the amount by which the vertical scale of the
cross section is bigger than the map scale.
• Mountain areas usually have a smaller exaggeration and flat areas have a
bigger exaggeration so that the relief difference is noticeable.
• Vertical exaggeration is calculated with the following formula:
𝑽𝑬 = 𝑽𝑺 (𝑽𝒆𝒓𝒕𝒊𝒄𝒂𝒍 𝒔𝒄𝒂𝒍𝒆)
𝑯𝑺 (𝑯𝒐𝒓𝒊𝒛𝒐𝒏𝒕𝒂𝒍 𝒔𝒄𝒂𝒍𝒆)
Step 1: Write down the vertical scale.
1 𝑐𝑚 = 20 𝑚
Step 2: Convert the meters to centimeters in the vertical scale
1 𝑐𝑚 = 20 𝑚 × 100
1 𝑐𝑚 = 2000 𝑐𝑚
Step 3: Write the VS as a fraction:
1 𝑐𝑚 = 2000 𝑐𝑚 =1
2000
V E R T I C A L E X A G G E R AT I O N
G R 1 1 & 1 2
31
Step 4: Write down the scale of the horizontal axis.
Note topographic map = 1: 50 000 and orthophoto map 1: 10 000.
Let’s assume we worked on a topographic map..
1: 50 000
Step 5: Write the horizontal scale as a fraction
1: 50 000 = 1
50 000
Step 6:
Write down the formula: 𝑽𝑬 = 𝑽𝑺 (𝑽𝒆𝒓𝒕𝒊𝒄𝒂𝒍 𝒔𝒄𝒂𝒍𝒆)
𝑯𝑺 (𝑯𝒐𝒓𝒊𝒛𝒐𝒏𝒕𝒂𝒍 𝒔𝒄𝒂𝒍𝒆)
Step 7: Substitute the values for VS and HS in the formula:
𝐕𝐄 = 𝐕𝐒 (𝐕𝐞𝐫𝐭𝐢𝐜𝐚𝐥 𝐬𝐜𝐚𝐥𝐞)
𝐇𝐒 (𝐇𝐨𝐫𝐢𝐳𝐨𝐧𝐭𝐚𝐥 𝐬𝐜𝐚𝐥𝐞)
VE =
12000
150 000
VE = 1
2000 ×
50 000
1
𝐕𝐄 = 𝟐𝟓 𝐭𝐢𝐦𝐞𝐬
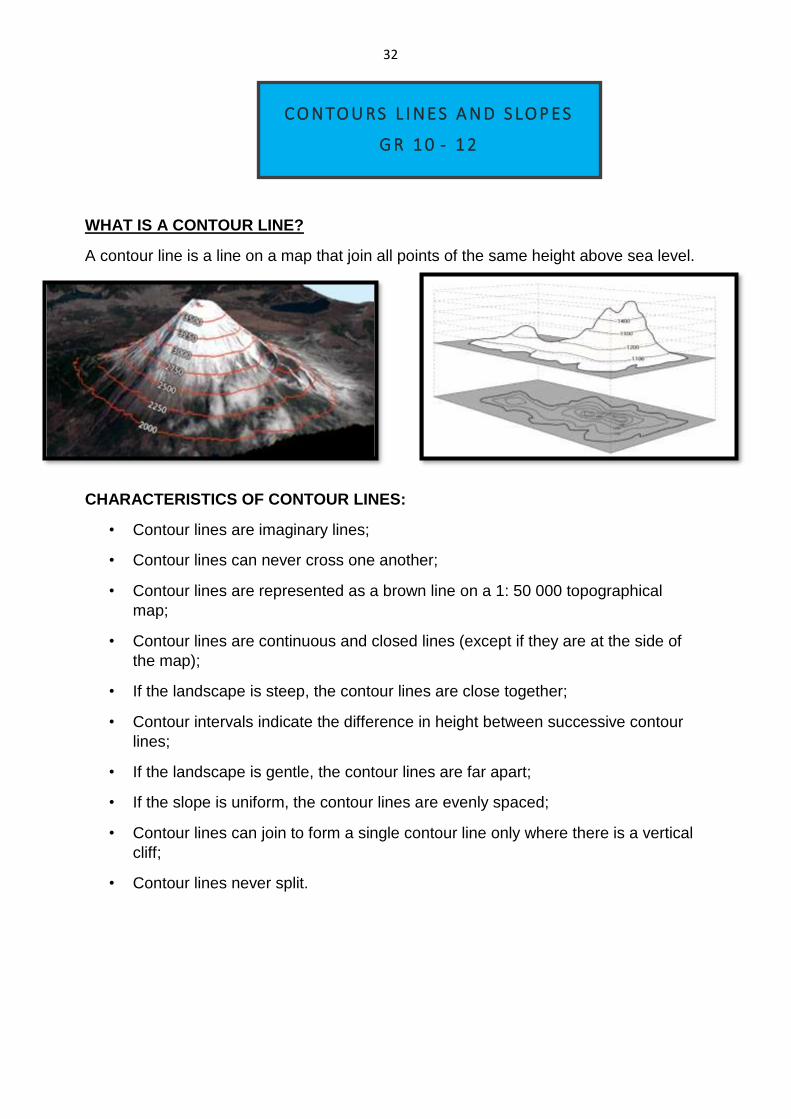
Refers to whenever one place is visible from another place.
To divide a
fraction you can
change the sign
to multiply and
invert the
fraction..
I N T E RV I S I B I L I T Y
G R 1 1 & 1 2
Point A is visible so there is
intervisibility.
Point B is not visible so
there is no intervisibility.
32
WHAT IS A CONTOUR LINE?
A contour line is a line on a map that join all points of the same height above sea level.
CHARACTERISTICS OF CONTOUR LINES:
• Contour lines are imaginary lines;
• Contour lines can never cross one another;
• Contour lines are represented as a brown line on a 1: 50 000 topographical
map;
• Contour lines are continuous and closed lines (except if they are at the side of
the map);
• If the landscape is steep, the contour lines are close together;
• Contour intervals indicate the difference in height between successive contour
lines;
• If the landscape is gentle, the contour lines are far apart;
• If the slope is uniform, the contour lines are evenly spaced;
• Contour lines can join to form a single contour line only where there is a vertical
cliff;
• Contour lines never split.
C O N TO U RS L I N E S A N D S LO P E S
G R 1 0 - 1 2
33
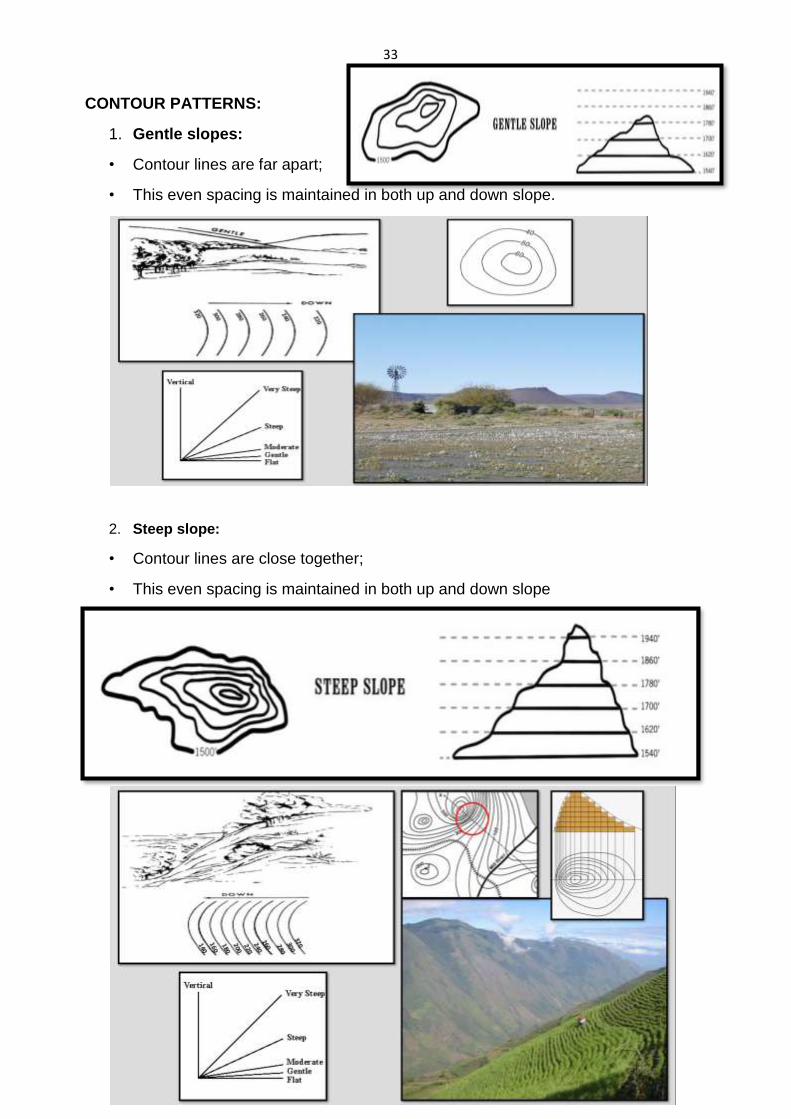
CONTOUR PATTERNS:
1. Gentle slopes:
• Contour lines are far apart;
• This even spacing is maintained in both up and down slope.
2. Steep slope:
• Contour lines are close together;
• This even spacing is maintained in both up and down slope
34
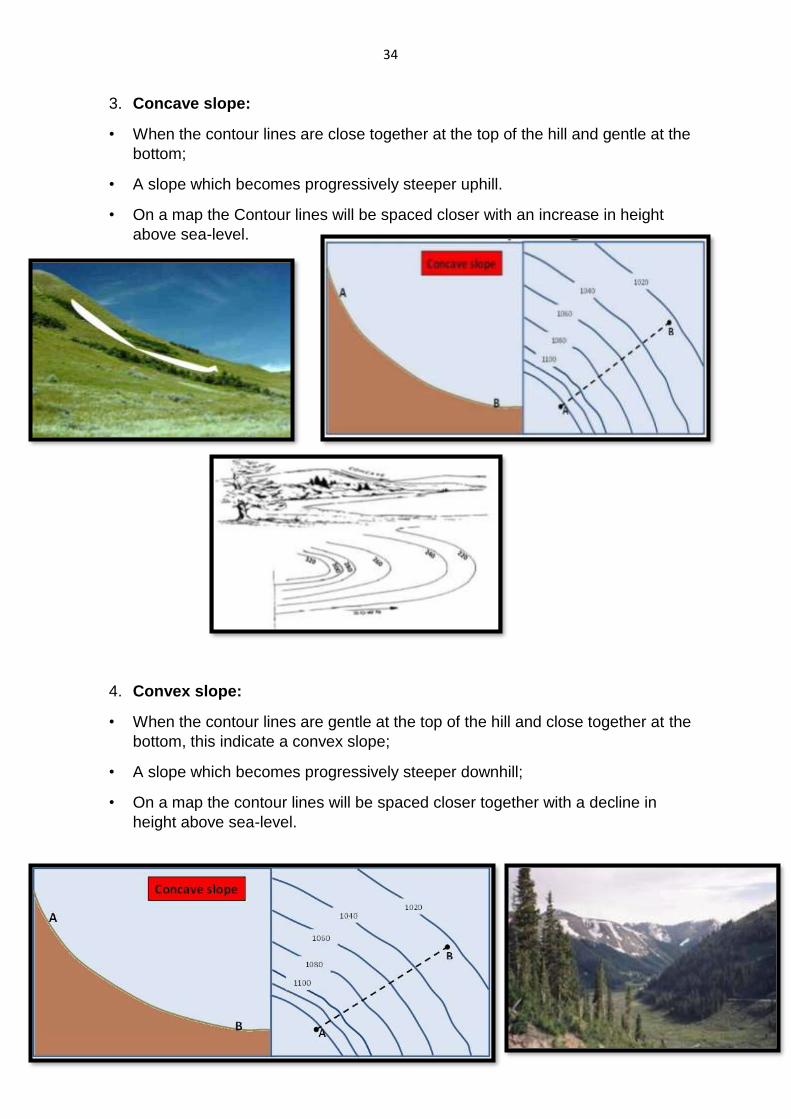
3. Concave slope:
• When the contour lines are close together at the top of the hill and gentle at the
bottom;
• A slope which becomes progressively steeper uphill.
• On a map the Contour lines will be spaced closer with an increase in height
above sea-level.
4. Convex slope:
• When the contour lines are gentle at the top of the hill and close together at the
bottom, this indicate a convex slope;
• A slope which becomes progressively steeper downhill;
• On a map the contour lines will be spaced closer together with a decline in
height above sea-level.
35
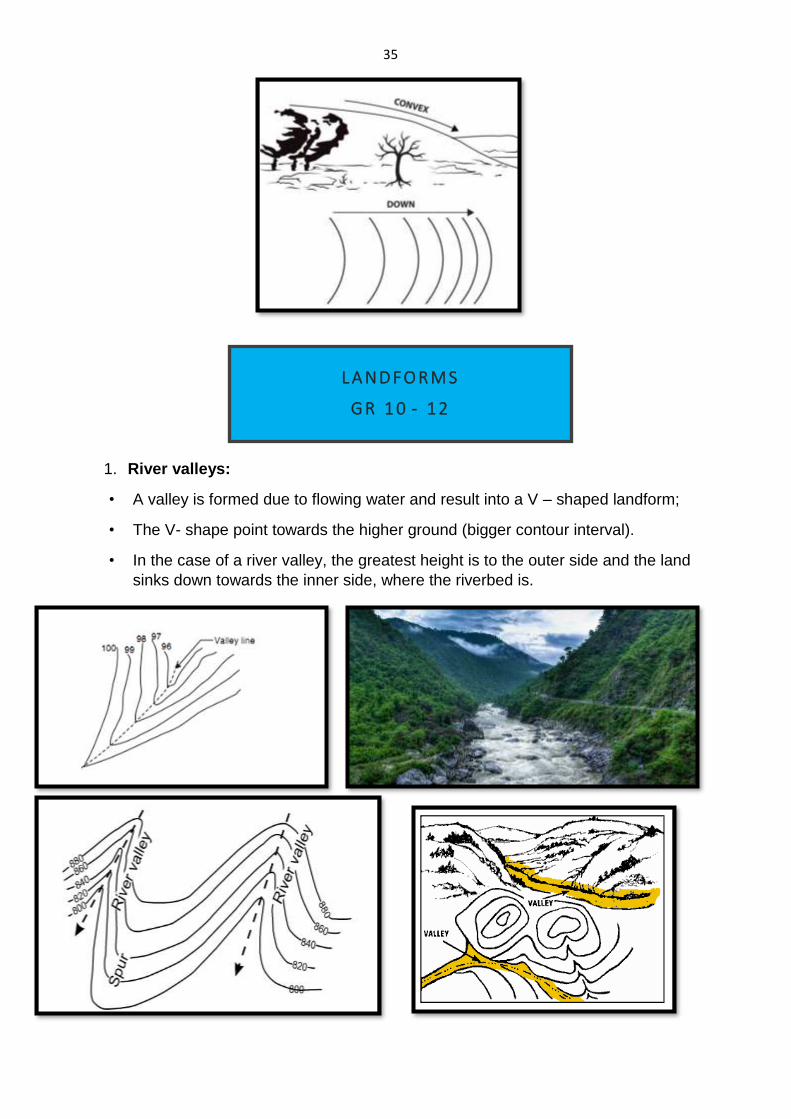
1. River valleys:
• A valley is formed due to flowing water and result into a V – shaped landform;
• The V- shape point towards the higher ground (bigger contour interval).
• In the case of a river valley, the greatest height is to the outer side and the land
sinks down towards the inner side, where the riverbed is.
L A N D F O R M S
G R 1 0 - 1 2
36
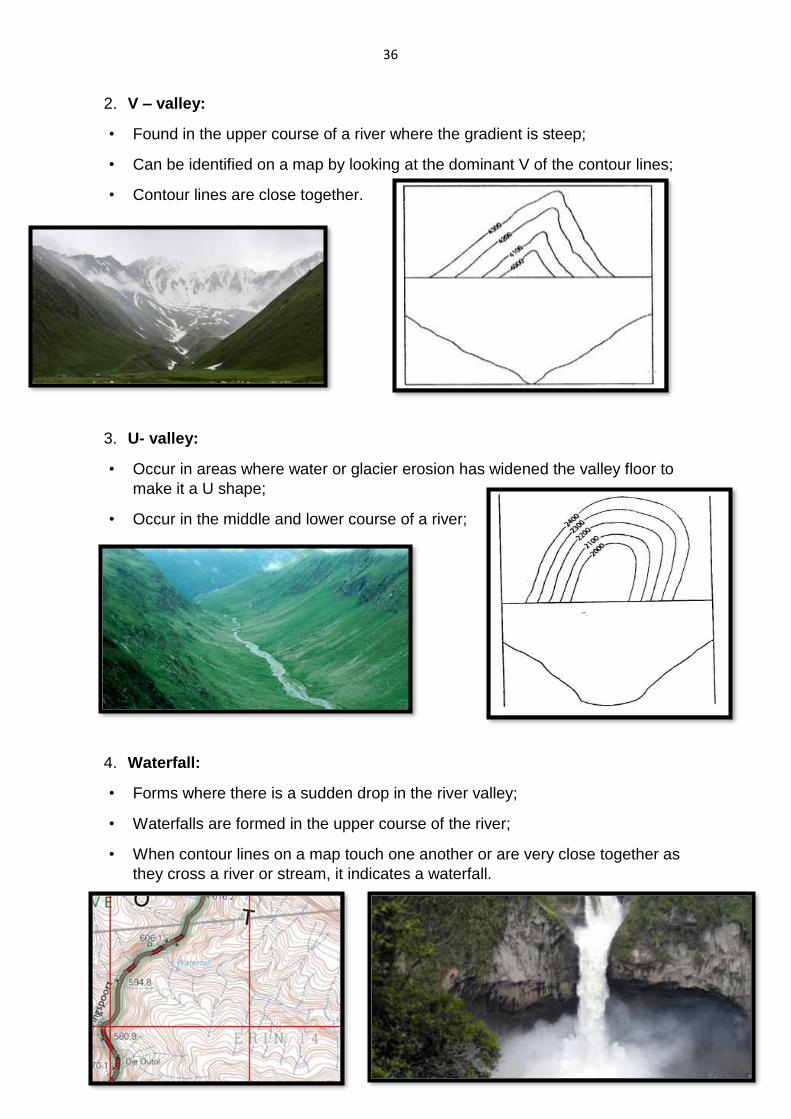
2. V – valley:
• Found in the upper course of a river where the gradient is steep;
• Can be identified on a map by looking at the dominant V of the contour lines;
• Contour lines are close together.
3. U- valley:
• Occur in areas where water or glacier erosion has widened the valley floor to
make it a U shape;
• Occur in the middle and lower course of a river;
4. Waterfall:
• Forms where there is a sudden drop in the river valley;
• Waterfalls are formed in the upper course of the river;
• When contour lines on a map touch one another or are very close together as
they cross a river or stream, it indicates a waterfall.
37
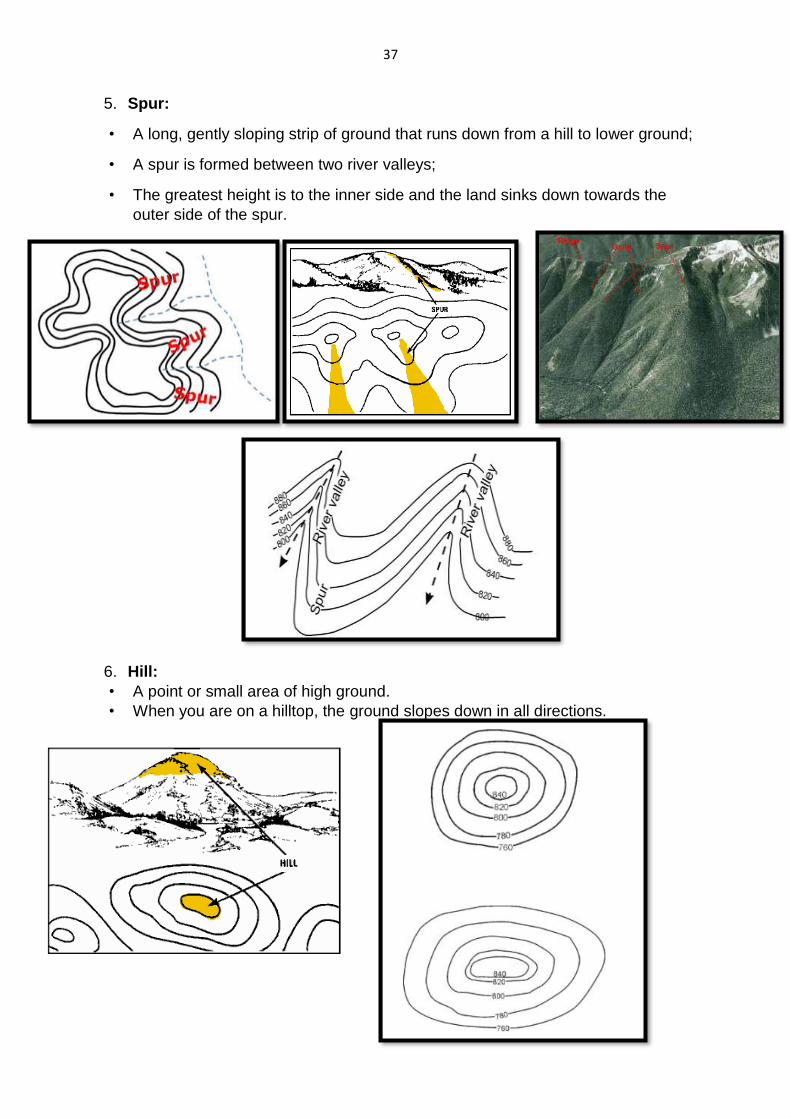
5. Spur:
• A long, gently sloping strip of ground that runs down from a hill to lower ground;
• A spur is formed between two river valleys;
• The greatest height is to the inner side and the land sinks down towards the
outer side of the spur.
6. Hill:
• A point or small area of high ground.
• When you are on a hilltop, the ground slopes down in all directions.
38
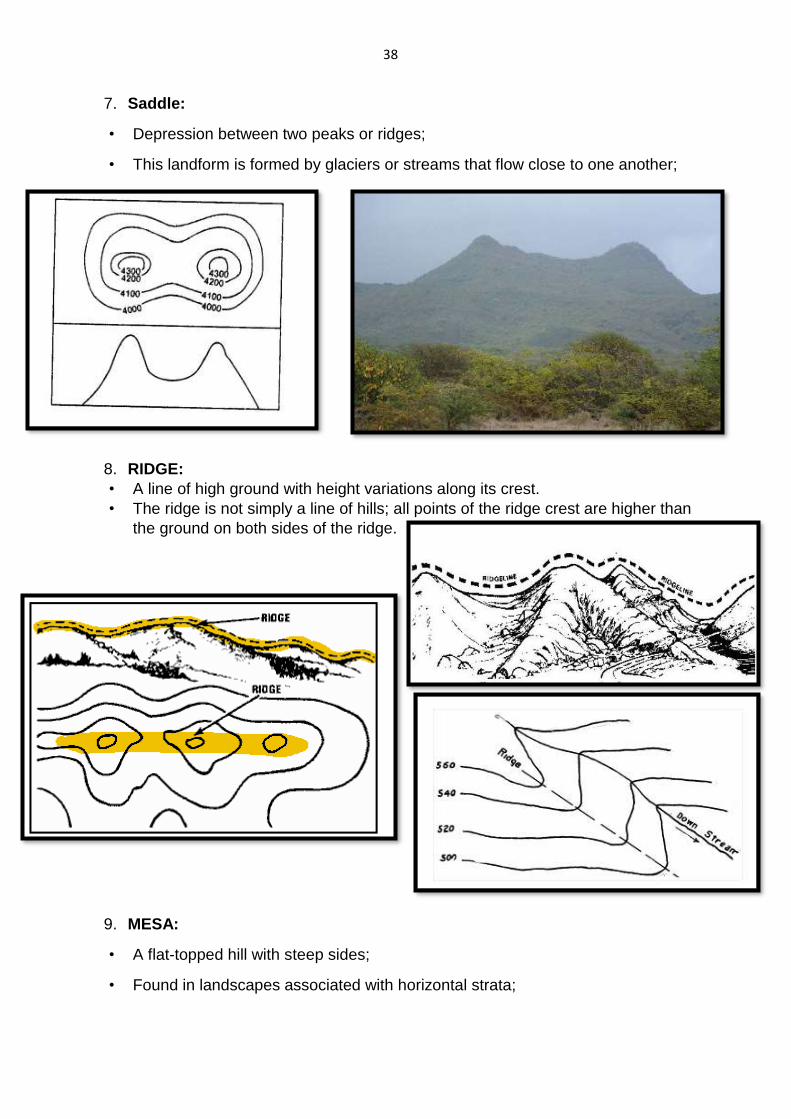
7. Saddle:
• Depression between two peaks or ridges;
• This landform is formed by glaciers or streams that flow close to one another;
8. RIDGE:
• A line of high ground with height variations along its crest.
• The ridge is not simply a line of hills; all points of the ridge crest are higher than
the ground on both sides of the ridge.
9. MESA:
• A flat-topped hill with steep sides;
• Found in landscapes associated with horizontal strata;
39
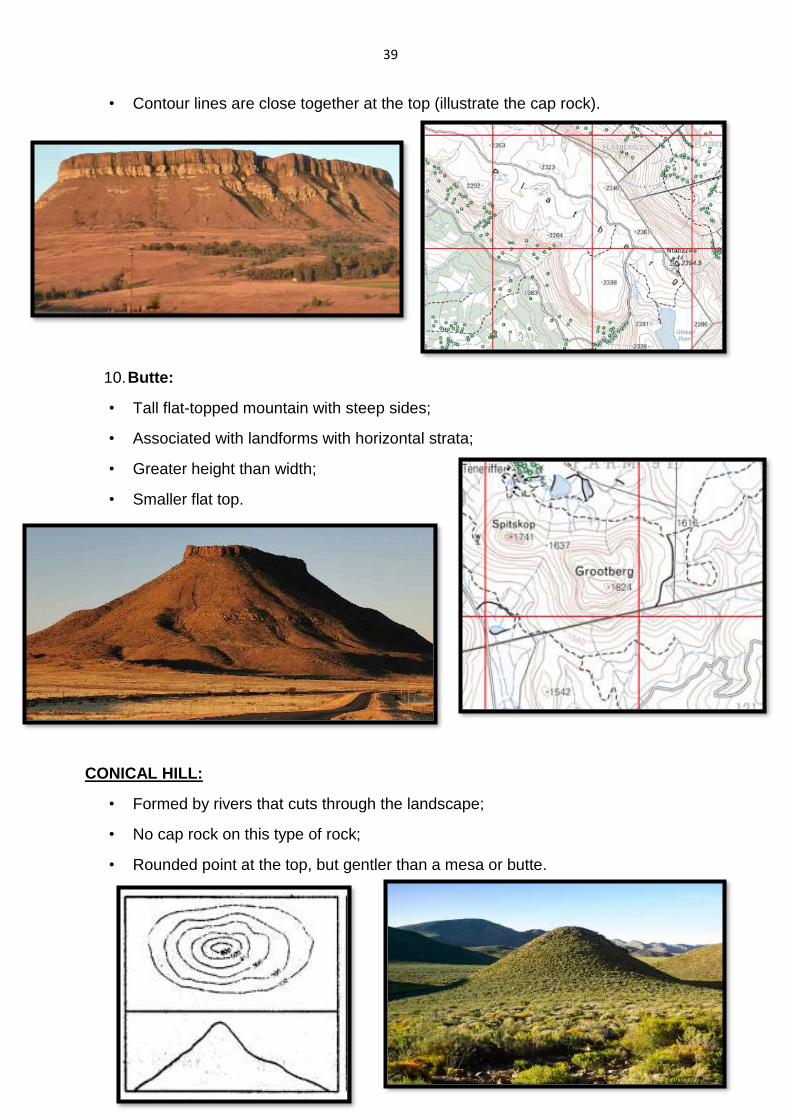
• Contour lines are close together at the top (illustrate the cap rock).
10. Butte:
• Tall flat-topped mountain with steep sides;
• Associated with landforms with horizontal strata;
• Greater height than width;
• Smaller flat top.
CONICAL HILL:
• Formed by rivers that cuts through the landscape;
• No cap rock on this type of rock;
• Rounded point at the top, but gentler than a mesa or butte.
40
WHAT IS GIS?
Geographical Information Systems
DEFINITION: A computer-based technology and method for collecting, analyzing,
managing, modelling and presenting geographical data for a wide range of users.
WHY WAS GIS DEVELOPED?
To process geographical data and to produce information can be used for decision
making.
COMPONENTS OF GIS:
HARDWARE: Computer, screen, keyboard and mouse.
SOFTWARE: A program where you can enter/capture the data, edit it and put
the data into map format.
GEOGRAPHICAL DATA: Information that can be analysed.
PERSONNEL: People that can operate the computer, enter the information
and analyse the data.
METHOD: A way how the data will be stored on the computer.
WHAT IS GEOGRAPHICAL DATA?
• Information about features that exist and events that occur on Earth.
• Example: The geographical data about a residential area can explain the
population density of that area.
HOW DO WE COLLECT GEOGRAPHICAL DATA?
People complete surveys;
Use of existing data and documents and capture it on a computer;
Remote sensing;
Photographs;
Testing of natural environment e.g. testing soil and water quality;
GIS
GRADE 10 - 12
41
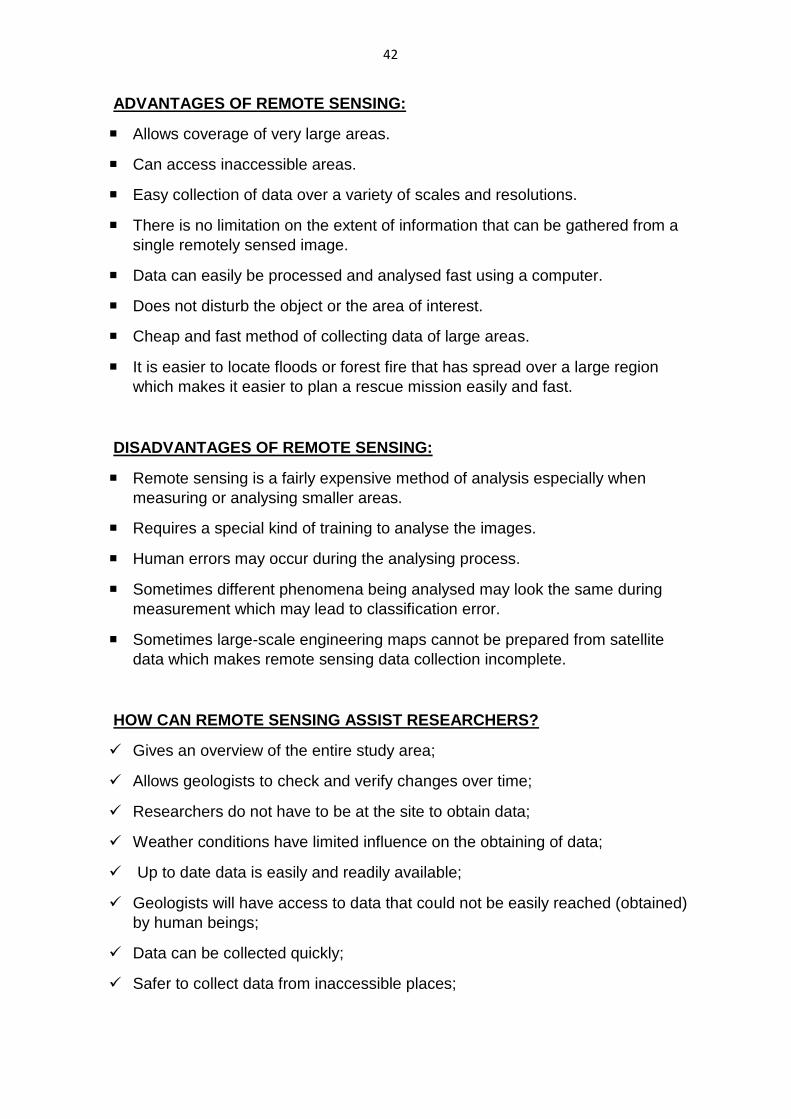
TYPES
Active remote sensing
Send radiation out and then measures the radiation that the
earth sends back. E.g. Ocean current.
Passive remote sensing
Measure the energy that is radiated from earth. E.g.
Temperature
Physical measurements using secondary data;
Using existing maps.
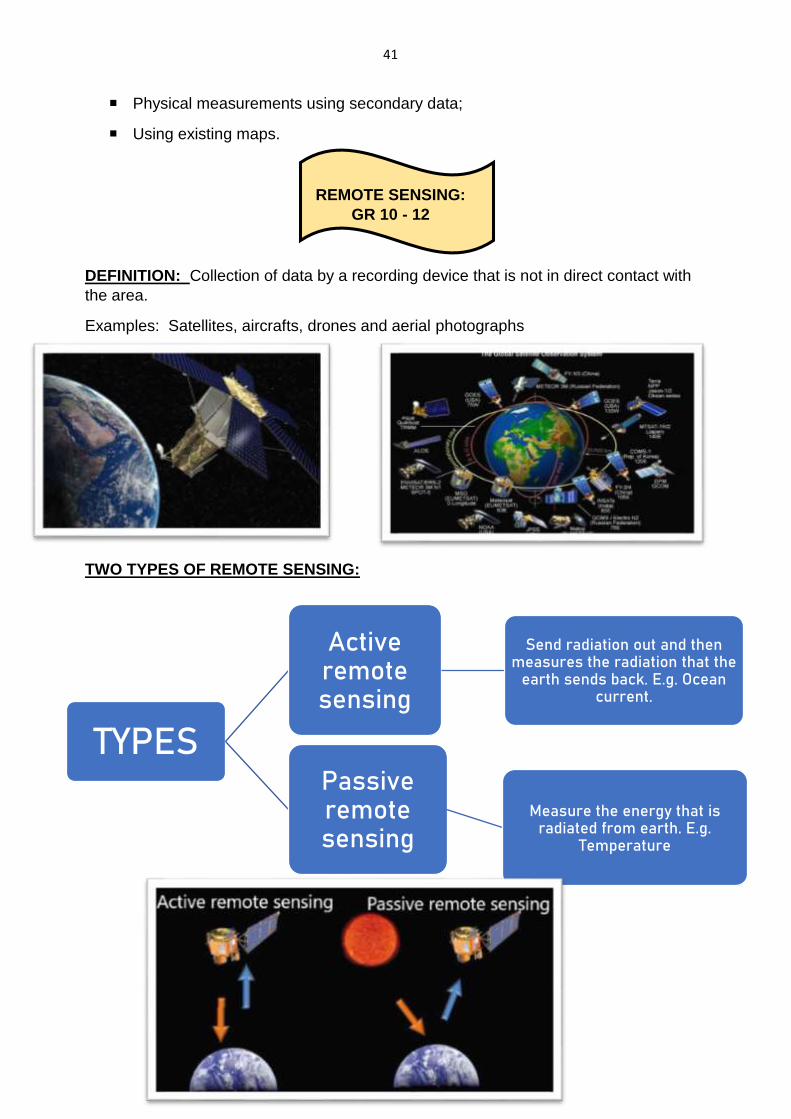
REMOTE SENSING:
GR 10 - 12
DEFINITION: Collection of data by a recording device that is not in direct contact with
the area.
Examples: Satellites, aircrafts, drones and aerial photographs
TWO TYPES OF REMOTE SENSING:
42
ADVANTAGES OF REMOTE SENSING:
Allows coverage of very large areas.
Can access inaccessible areas.
Easy collection of data over a variety of scales and resolutions.
There is no limitation on the extent of information that can be gathered from a
single remotely sensed image.
Data can easily be processed and analysed fast using a computer.
Does not disturb the object or the area of interest.
Cheap and fast method of collecting data of large areas.
It is easier to locate floods or forest fire that has spread over a large region
which makes it easier to plan a rescue mission easily and fast.
DISADVANTAGES OF REMOTE SENSING:
Remote sensing is a fairly expensive method of analysis especially when
measuring or analysing smaller areas.
Requires a special kind of training to analyse the images.
Human errors may occur during the analysing process.
Sometimes different phenomena being analysed may look the same during
measurement which may lead to classification error.
Sometimes large-scale engineering maps cannot be prepared from satellite
data which makes remote sensing data collection incomplete.
HOW CAN REMOTE SENSING ASSIST RESEARCHERS?
Gives an overview of the entire study area;
Allows geologists to check and verify changes over time;
Researchers do not have to be at the site to obtain data;
Weather conditions have limited influence on the obtaining of data;
Up to date data is easily and readily available;
Geologists will have access to data that could not be easily reached (obtained)
by human beings;
Data can be collected quickly;
Safer to collect data from inaccessible places;
43
Continuous collection of data;
Assists with more accurate geological mapping;
Improves spectral resolution of geological mapping;
Combining different datasets of geological layers;
Studying changes in geological environments;
Collection of data is reliable.
TYPES OF DATA:
GR 11 & 12
1. SPATIAL DATA:
This data use coordinates to give an exact location of a feature.
Examples of spatial data on a map: Dams, Buildings, Rivers, Roads, House
etc.
2. ATTRIBUTE DATA:
This is descriptive data that gives the characteristics of a specific feature.
Example: Attribute data of a road might be its name, height and length.
RASTER VS VECTOR DATA:
GR 11 & 12
GIS data is stored in different ways.
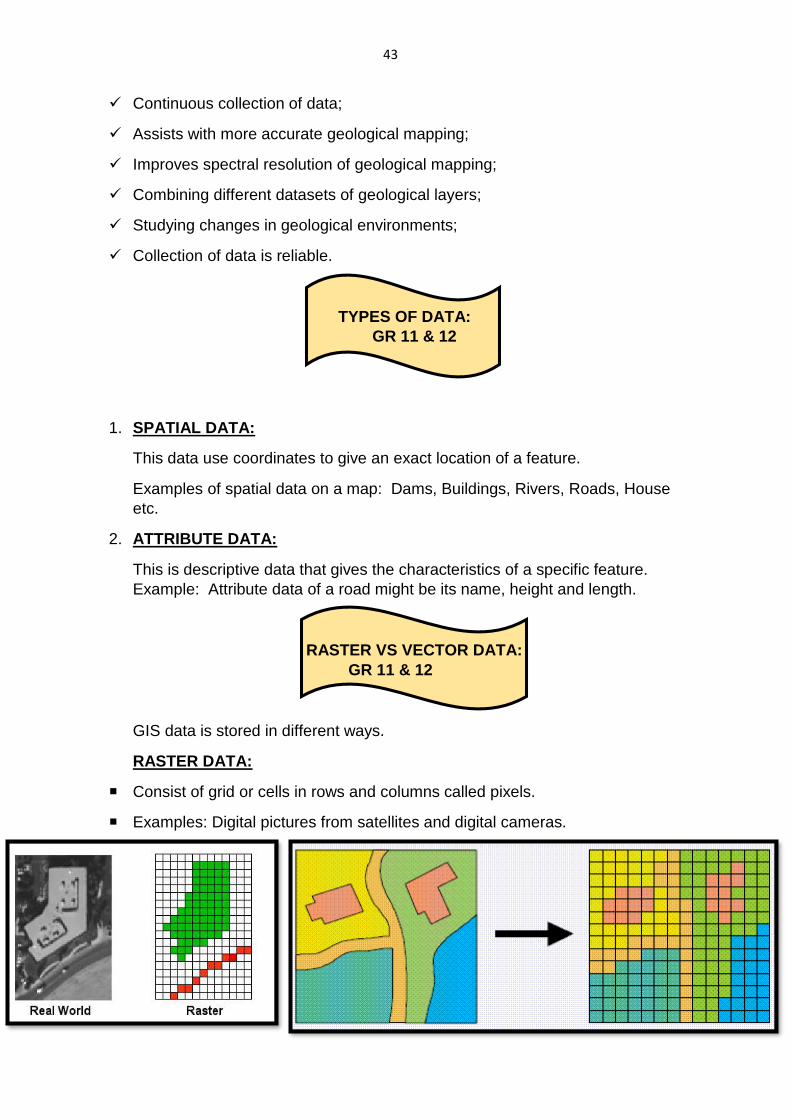
RASTER DATA:
Consist of grid or cells in rows and columns called pixels.
Examples: Digital pictures from satellites and digital cameras.
44
ADVANTAGES AND DISADVANTAGES OF RASTER DATA:
ADVANTAGES: DISADVANTAGES:
Complicated images can easily be
displayed.
When the image is enlarged it can be
blurry as it is made out of pixels.
Easily processed on computers. Large number of data might decrease
the processing speed.
Need a lot of space on the computer as
the image needs space for every pixel.
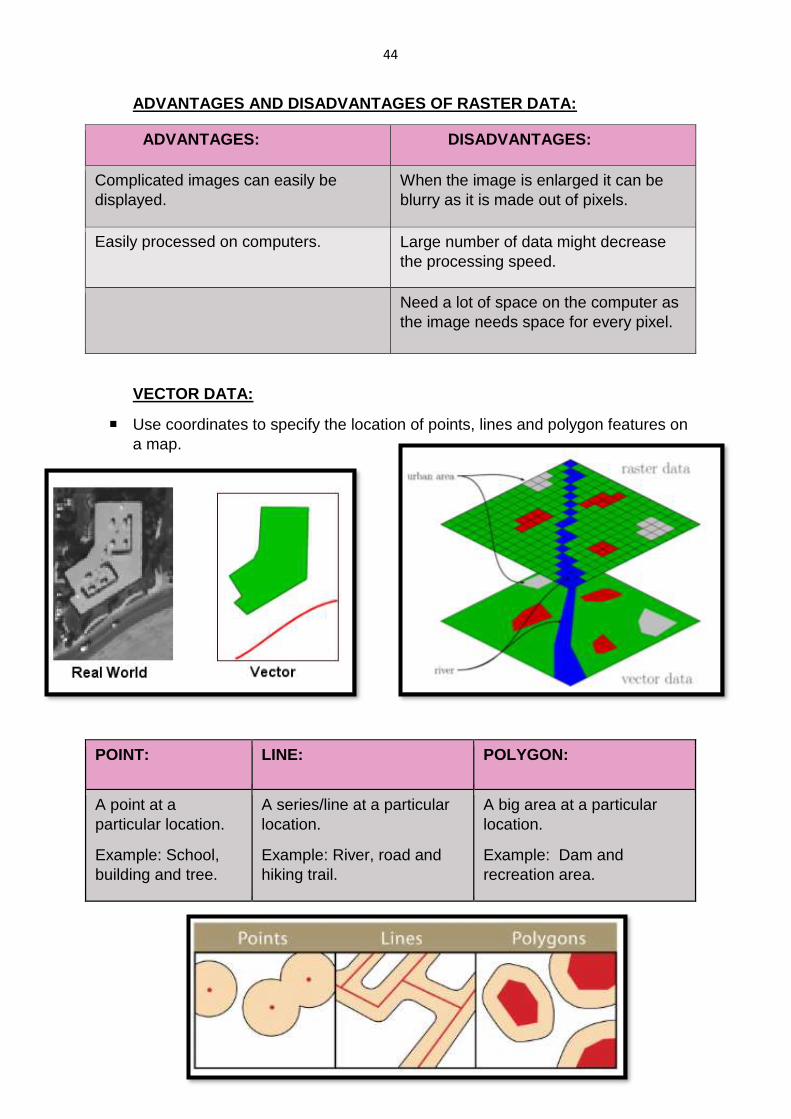
VECTOR DATA:
Use coordinates to specify the location of points, lines and polygon features on
a map.
POINT: LINE: POLYGON:
A point at a
particular location.
Example: School,
building and tree.
A series/line at a particular
location.
Example: River, road and
hiking trail.
A big area at a particular
location.
Example: Dam and
recreation area.
45
ADVANTAGES AND DISADVANTAGES OF VECTOR DATA:
ADVANTAGE: DISADVANTAGE:
Images can be scaled without
compromising the quality of the image.
Takes a long time to create.
Easy to handle as it has a few data
items.
Some shapes like curved shapes are
not shown properly.
Easier to change/update.
DATA LAYERING:
GR 12
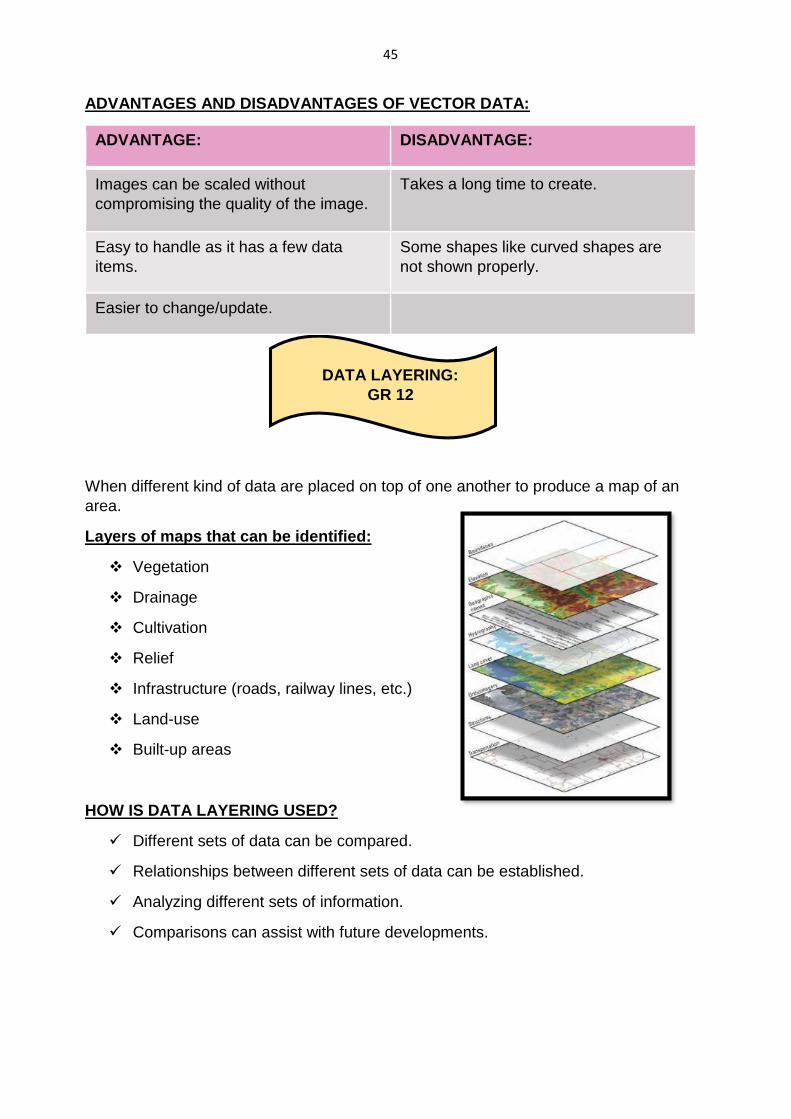
When different kind of data are placed on top of one another to produce a map of an
area.
Layers of maps that can be identified:
Vegetation
Drainage
Cultivation
Relief
Infrastructure (roads, railway lines, etc.)
Land-use
Built-up areas
HOW IS DATA LAYERING USED?
Different sets of data can be compared.
Relationships between different sets of data can be established.
Analyzing different sets of information.
Comparisons can assist with future developments.
46
IMPORTANCE OF DATA LAYERING:
Different sets of data can be compared.
Integrated picture of landscape.
Relationships between different sets of data can be established.
Analyze different sets of information.
Comparisons can assist with future developments.
Helps with querying.
BUFFERING:
Gr 10 - 12
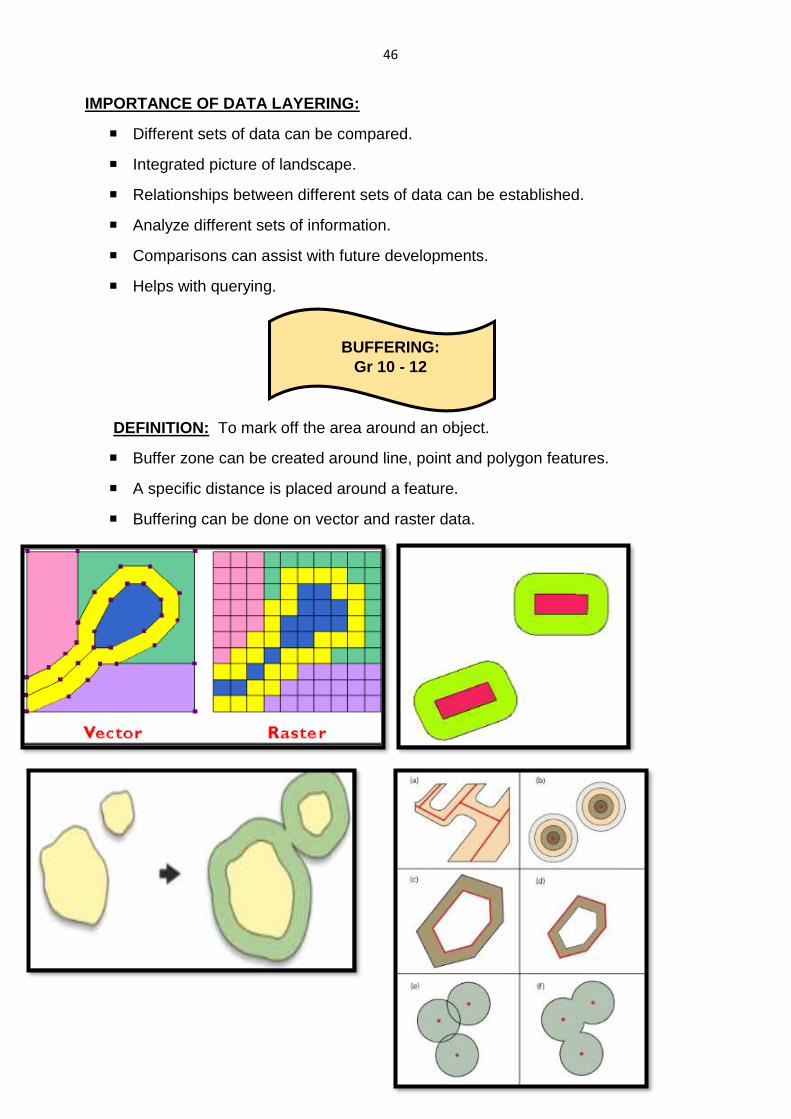
DEFINITION: To mark off the area around an object.
Buffer zone can be created around line, point and polygon features.
A specific distance is placed around a feature.
Buffering can be done on vector and raster data.
47
ADVANTAGES: DISADVANTAGES:
Can be placed around vector and raster
data.
Can be time consuming.
Can protect the area around the feature. Can limit development in the area.
A lot of information can be gathered of
the feature in the area.
Buffers must be put on the right places
otherwise it can lead to inaccuracy.
HOW CAN BUFFERING ASSIST THE AREA WHERE THERE ARE SCHOOLS AND
RIVERS THAT PASS THROUGH THE SETTLEMENT:
Can assist with the admission to schools;
Can help to determine the number of learners in the area that must attend
school;
Help with the planning of infrastructure in the area around the school e.g. roads
and sewage pipes
Determine the average distance learners travel to school;
Ecosystems around the river can be protected;
Prevent exploitation of resources;
Prevent industrial waste to be dumped in the rivers;
Prevent pesticides from entering the river system;
Decrease the amount of soil erosion in the area;
Protect the settlement from floods in rainy seasons;
It will allow the river to maintain its natural course;
Limit the effect on the natural capacity of the river.
DATA INTEGRATION:
GR 12
DEFINITION: The integration of data from different maps into one map
which summarises the overlaying process.
Data integration makes it easier for a Geographer to analyse the information on
a map.
48
PROBLEMS ASSOCIATED WITH INTEGRATING MAPS:
Maps have different scales;
Difficult to get the shapes of feature correct;
Maps have different projections;
Fieldwork information is sometimes inaccurate and incorrect.
DATA MANIPULATION:
GR 12
DEFINITION: The ability to manipulate data so that the system can perform a
wide variety of functions.
IMPORTANCE OF MANIPULATING DATA ON MAPS:
To remove unnecessary information from the map;
To use the data that is required;
Can make features lighter to be easily identified;
Making features smaller so it can be clearer;
More descriptive labels can be added;
Making images sharper in order to make it clearer.
RESOLUTION:
GR 11 & 12
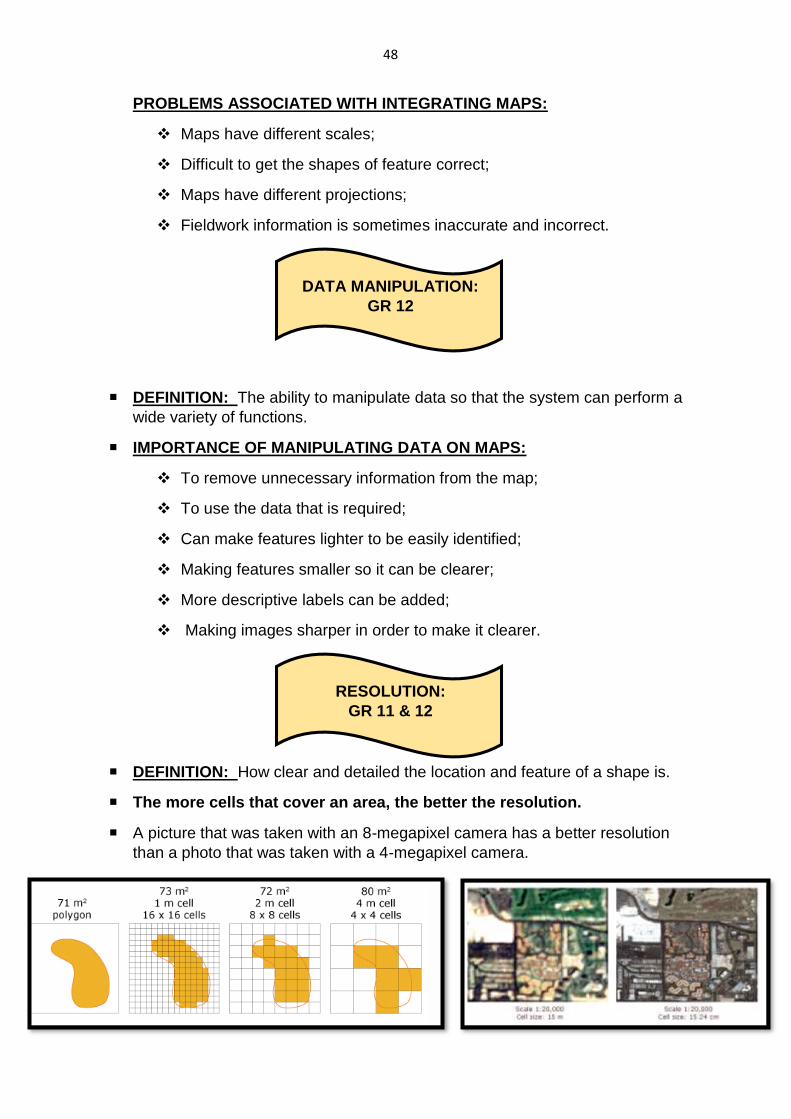
DEFINITION: How clear and detailed the location and feature of a shape is.
The more cells that cover an area, the better the resolution.
A picture that was taken with an 8-megapixel camera has a better resolution
than a photo that was taken with a 4-megapixel camera.
49
HOW CAN GIS HELP FARMERS?
Gr 10 -12
Determine soil type;
Determine soil fertility;
Determine drainage in the area;
Determine availability of underground water;
Determine slope of land (gradient);
Early detection of crop diseases/pests.
HOW CAN GIS ASSIST WITH DEVELOPMENT IN AN AREA?
Gr 10 -12
The person can compare the topography of the different areas to find the
topography that is most suitable;
The person can compare the soil fertility of different areas;
The person will look at the drainage of the different areas/Water for expansion;
Can determine what impact the development will have on job opportunities;
Can determine the accessibility/transport network of the newly planned
development;
The person can compare the existing aesthetic appeal of the areas of possible
development.
Determine crime rates;
Economic status of inhabitants;
Number of customers/market/threshold population;
What competition exists in the area;
Cost to build shopping centre;
Types of products to sell;
Zoning/Bylaws of municipality;
Availability of space for further development.
50
MAP PROJECTIONS:
DEFINITION: The representation of the spherical surface of the Earth on a flat
map.
When maps are drawn from the spherical earth onto a flat surface the shape,
distance, area and direction change and is called distortion.
Different projections have been developed so that features can be shown
accurately.
Lines of latitude (parallels) and lines of longitudes (meridians) are used as a
base to draw the maps.
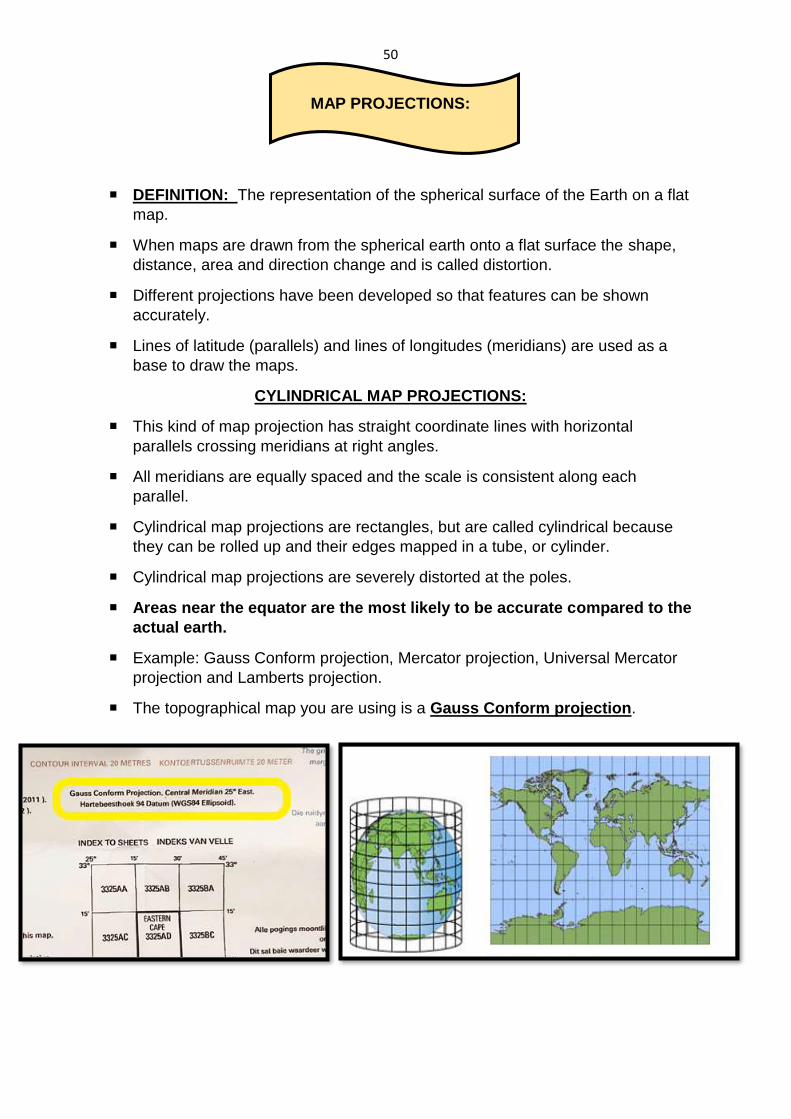
CYLINDRICAL MAP PROJECTIONS:
This kind of map projection has straight coordinate lines with horizontal
parallels crossing meridians at right angles.
All meridians are equally spaced and the scale is consistent along each
parallel.
Cylindrical map projections are rectangles, but are called cylindrical because
they can be rolled up and their edges mapped in a tube, or cylinder.
Cylindrical map projections are severely distorted at the poles.
Areas near the equator are the most likely to be accurate compared to the
actual earth.
Example: Gauss Conform projection, Mercator projection, Universal Mercator
projection and Lamberts projection.
The topographical map you are using is a Gauss Conform projection.
51
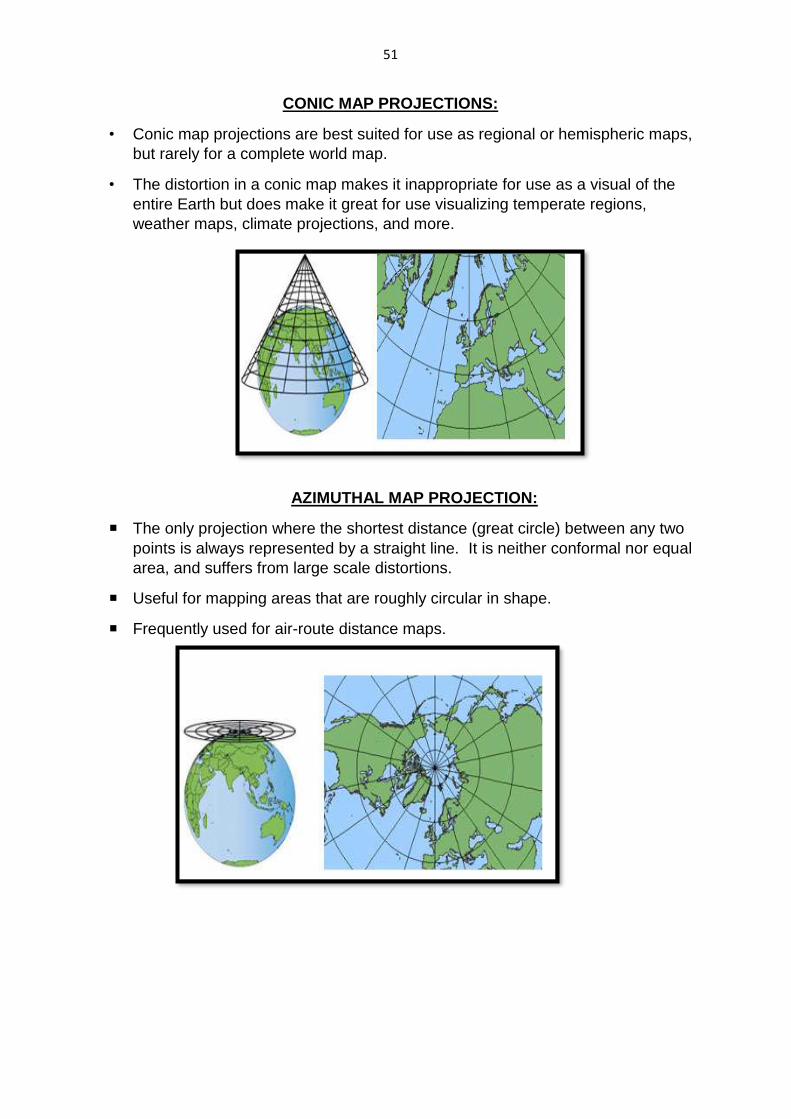
CONIC MAP PROJECTIONS:
• Conic map projections are best suited for use as regional or hemispheric maps,
but rarely for a complete world map.
• The distortion in a conic map makes it inappropriate for use as a visual of the
entire Earth but does make it great for use visualizing temperate regions,
weather maps, climate projections, and more.
AZIMUTHAL MAP PROJECTION:
The only projection where the shortest distance (great circle) between any two
points is always represented by a straight line. It is neither conformal nor equal
area, and suffers from large scale distortions.
Useful for mapping areas that are roughly circular in shape.
Frequently used for air-route distance maps.