mapping grains and their dynamics in three dimensions
TRANSCRIPT
www.elsevier.com/locate/nimb
Nuclear Instruments and Methods in Physics Research B 246 (2006) 232–237
NIMBBeam Interactions
with Materials & Atoms
Mapping grains and their dynamics in three dimensions
H.O. Sørensen a,*, B. Jakobsen a, E. Knudsen a, E.M. Lauridsen a, S.F. Nielsen a,H.F. Poulsen a, S. Schmidt a, G. Winther a, L. Margulies a,b
a Center for Fundamental Research: Metal Structures in Four Dimensions, Risø National Laboratory, DK-4000 Roskilde, Denmarkb European Synchrotron Radiation Facility, BP 220, F-38043 Grenoble, France
Available online 3 February 2006
Abstract
The three-dimensional X-ray diffraction (3DXRD) microscope has become a mature tool to investigate the microstructure in the bulkof polycrystalline materials. The present paper describes the 3DXRD method together with two applications. The first application pre-sented is a study of grain rotations during plastic tensile deformation of polycrystalline aluminium. The second is the acquisition of avideo revealing the 3D growth of an embedded nuclei during recrystallization of a deformed aluminium sample.� 2005 Elsevier B.V. All rights reserved.
PACS: 61.10.Nz; 68.37.Yz; 68.55.Ac; 68.55.Jk
Keywords: X-ray diffraction; Synchrotron radiation; 3DXRD; Plastic deformation; 3D crystal shape; Recrystallization
1. Introduction
The present publication is a review of recent resultsobtained in mapping bulk grains and their dynamicsemploying synchrotron radiation techniques. The mostwidely used technique is 3D X-ray diffraction (3DXRD)microscopy. 3DXRD has been developed to be a widelyapplicable tool for fast and non-destructive characteriza-tion of the individual grains and sub-grains inside bulkmaterials [1]. The method is based on diffraction with hardX-rays (E P 50 keV), enabling 3D studies of millimeter–centimeter thick specimens. Applying ray tracing withseveral detectors, the position, volume, orientation andelastic strain can be derived for hundreds of grains simulta-neously. Furthermore for coarse-grained materials grainboundary maps can be generated. With the present set-upat the 3DXRD microscope at the European synchrotronradiation facility (ESRF), the spatial resolution is �5 lm,
0168-583X/$ - see front matter � 2005 Elsevier B.V. All rights reserved.
doi:10.1016/j.nimb.2005.12.046
* Corresponding author.E-mail address: [email protected] (H.O. Sørensen).
while diffracting units of size 50 nm can be observed. In thispaper the methodology will be presented with focus on aset of novel reconstruction algorithms for generation ofgrain maps. These have enabled the acquisition of 3D mov-ies of the growth of individual grains during annealing pro-cesses [2].
Furthermore the paper will focus on applications of3DXRD to fundamental issues in plastic deformation. Asan example, the rotation of 100 deeply embedded grainshas been determined as function of tensile deformation inAl [3,4]. As a result ‘‘state-of-the-art’’ models for polycrys-tal plasticity were proven to be wrong, and a new slip-based model has been proposed [5].
2. The 3DXRD set-up
The 3DXRD microscope is stationed at the ESRFbeamline ID11 in Grenoble, France. An outline of theexperimental station is shown in Fig. 1. The incomingX-rays are focused in the vertical direction and monochro-matized by a bent Laue crystal and optionally horizontallyfocused by a graded multilayer [6]. With this optical

Fig. 1. 3DXRD instrumental schematic. Optics: WB: white beam, LC:bent Laue crystal, ML: bent multilayer, BS: beam stop. Sample environ-ment: A: cryostat, B: furnace, C: 25 kN stress-rig. Detectors and slits: 1:large-area detector, 2: conical slit system, 3: high-resolution detector.
H.O. Sørensen et al. / Nucl. Instr. and Meth. in Phys. Res. B 246 (2006) 232–237 233
configuration beam sizes down to around 2 · 4 lm2 in theenergy range 50–80 keV can be obtained [7].
The sample stage shown below the arrow in Fig. 1 isdesigned to carry heavy equipment, e.g. a tensile stress-rig and furnaces. The set-up is similar to what is used insingle-crystal diffraction experiments with the samplemounted on top of a vertical rotation stage perpendicularto the incoming X-ray beam. This x rotation stage canbe translated in all directions (x,y,z) to illuminate any partof the sample. Acquisitions are made by one or two 2Ddetectors while the x-table is rotated by an angle Dx.Two different types of 2D CCD detectors are available.One high-resolution detector with spatial resolution of5 lm, to be positioned close to sample, and one large-arealow-resolution detector (�45 lm) positioned far from thesample. The high-resolution detector provides spatial reso-lution whereas the low-resolution placed far from thesample provides accurate grain orientation and stressinformation. Combined use of both detectors either simul-taneously or separately can mimic a 3D detector. Ray-tracing through the centre-of-mass (CMS) of the reflectionpeaks can determine the spatial position of the diffractinggrain in the sample [8].
Generally many grains in a polycrystalline sample willdiffract simultaneously. Hence diffraction spots from manygrains will appear within the same detector image. If allgrains have the same crystal lattice, then in the far fieldthe spots will be on identical Debye–Scherrer rings. Inthe near field – where a high spatial resolution detector ispositioned close to the sample – these will be shifted withrespect to each other according to position within the sam-ple. To ensure that only diffraction from deeply embeddedgrains is obtained a conical slit system can be insertedbetween the sample and the detector allowing only reflec-tions originating in a �250 lm thick section of the materialto reach the detector [9]. If the polycrystalline material hasimpurities or other phases the conical slit will also removethe scattering from those.
3. Grain indexing and determination of orientation
GRAINDEX is a unique software program for multi-grain indexing using a monochromatic beam. Providedthe majority of the diffraction spots from the various grainsin the polycrystal do not overlap on the detector, the pro-gram sorts these spots with respect to grain of origin [8].
Initially GRAINDEX identifies all spots and determinetheir CMS positions in x and g (defined in Fig. 2). Two dif-ferent directions can be taken to sort the reflections. In thefirst approach, a 3D detector is mimicked by acquiring datawith the high-resolution detector at two or more sample–detector distances. In this case, ray-tracing can be per-formed by fitting a straight line to CMS positions ofequivalent spots in the images and extrapolate the line tothe sample. The extrapolated lines through reflections orig-inating from the same grain should join at the CMS of thegrain in the sample. In the second approach, only onedetector position is used. In this case sorting is based purelyon crystallographic criteria. The known crystal latticeparameters and space group symmetry is used to simulatethe diffraction pattern for all possible orientations in Eulerspace. In practise, this is performed by scanning over thethree Euler angles with a chosen step size. The simulatedscattering vectors are then compared with the observedscattering vectors. If they obey a number of criteria a grainis found with this orientation. Among these criteria are acompleteness criteria, on the difference between the numberof simulated and observed reflections, a uniqueness criteria
(a reflection set must not be a subset of the reflection setfrom another grain) and a peak position criteria, specifyingthe proximity of the simulated spot position with CMS ofthe spot after a least-squares fit of the grain orientationto the observed spot CMS [1].
As output GRAINDEX delivers a list of grains whereeach grain is associated with an orientation and a set ofassociated reflection intensities. The reflection intensitiescan upon calibration be used to determine the grain vol-umes [10] or the intensities can be used to determine crystalstructure if unknown [11,12]. The main limitation of GRA-INDEX is the restriction on reflection overlap. Evidentlythe possibility of overlap becomes larger with a highernumber of grains diffracting simultaneously, or with highmosaic spread. Schmidt et al. [11] showed that with grainshaving a mosaic spread of 0.1� it should be possible toindex approximately 5000 grains. GRAINDEX has atpresent successfully determined the orientations of hun-dreds of grains simultaneously [16]. Furthermore, the grainsize must have a certain minimum size to be detectable [13].This detection threshold varies depending on set-up butcan be as small as 50 nm.
4. Polycrystalline plastic deformation
As an example of results on grain dynamics obtainedwith the 3DXRD microscope we summarize in situmeasurements of the rotations of individual grains within

Fig. 2. Sketch of the 3DXRD set-up with the laboratory coordinate system (x,y,z) and angles (x,2h,g) defined. (a) A set-up with a point focused beamand a conical slit system (from [4]). (b) Set-up with a line focused beam as used for 3D grain shape determination. The insert shows the principle of forming3D maps by stacking the 2D maps obtained in this configuration (from [2]).
234 H.O. Sørensen et al. / Nucl. Instr. and Meth. in Phys. Res. B 246 (2006) 232–237
polycrystalline Al during plastic tensile deformation. Thefirst results, which proved the principles of the method,were obtained on high-purity Al [3]. In this experimentthe orientation of four grains with an average size of300 lm embedded in the bulk of the 3 mm thick samplewere followed during tensile deformation of up to 11%.Despite the low number of grains followed it showedclearly that the predictions made by both the Sachs [14]model and the Taylor [15] model fail to account for theexperimental data. To study this phenomenon in muchgreater detail a study following 95 grains during tensileplastic deformation of a sample of 99.5% pure Al consist-ing of equi-axed grains with an average size of 75 lm has
been performed [4]. The 4 mm thick specimen was placedin 25 kN stress-rig and irradiated with a point focu-sed monochromatic beam of 55 keV with the dimensions5 · 5 lm2. Furthermore, a conical slit system [9] wasmounted between the specimen and the detector assketched in Fig. 2(a), to define that the diffraction gaugevolume (5 · 5 · 250 lm3) is entirely in the bulk. This alsominimizes the background as well as limiting the spot over-lap. Data sets at strain-levels 0%, 2%, 4% and 6% were col-lected by x-scans of 0.25� in the x-range �11� to 11� [4].The indexing program GRAINDEX [8] determined the ori-entation of 95 embedded grains at each strain-level. Therotation of the tensile axis for these is shown in Fig. 3. It

Fig. 3. Stereographic triangle of the rotation of the tensile axis from 0% to6% strain. The circles signify the final orientation. The triangle is dividedinto four areas based on the rotation behavior (from [5]).
H.O. Sørensen et al. / Nucl. Instr. and Meth. in Phys. Res. B 246 (2006) 232–237 235
is clear from Fig. 3 that there is dependence of the grainrotation on the initial grain orientation [5]. The stereo-graphic triangle shown in Fig. 3 have been divided intofour main areas of which a certain rotation trends arefound
1. Grains in this area (h110i) rotate towards the h100i–h111i line.
2. Grains close to the h110i–h111i line follow the linetowards the h11 1i corner.
3. Grains around h22 1i rotates towards the h11 1i corner.4. Grains in the h100i corner rotate in three different ways:
(a) along the h100i–h111i line towards h100i, (b)directly towards the h10 0i–h11 1i line or (c) the orienta-tion of the tensile axis is unchanged [16].
Fig. 4. Predictions of the rotation of the tensile direction by the Sachsmodel are shown as black lines together with the experimental data. Thesmall stereographic triangle shows in which areas acceptable agreementbetween experiment and prediction is found (from [5]).
The average rotation of the tensile axis in the four areasare 2.7�, 1.7�, 2.5� and 1.5�, respectively. Due to this depen-dence on initial orientation it is concluded that grain inter-action has a limited effect on the grain rotation behavior, atleast at lower strains. Though the spread in rotation behav-ior within the four regions might indicate some degree ofgrain interactions [5].
Since the primary effect determining grain rotation dur-ing plastic deformation is the initial orientation it is likelythat the rotation models of Sachs [14] and Taylor [15],which are purely based on grain orientations, could makereliable predictions. Predictions of the rotations of the ten-sile axis by the Sachs model are shown in Fig. 4 togetherwith the experimental rotations. It is evident that the pre-dicted rotation only matches the experimental directionsin area 1. Generally the Sachs model overestimates themagnitude of the rotations. Both positive and negative
Fig. 5. Predictions of the rotation of the tensile direction by two differentTaylor models, (a) using the average of different solutions to the ambiguityproblem and (b) using the solution of maximum primary slip. The smallstereographic triangles show in which areas acceptable agreement betweenexperiment and prediction is found (from [5]).
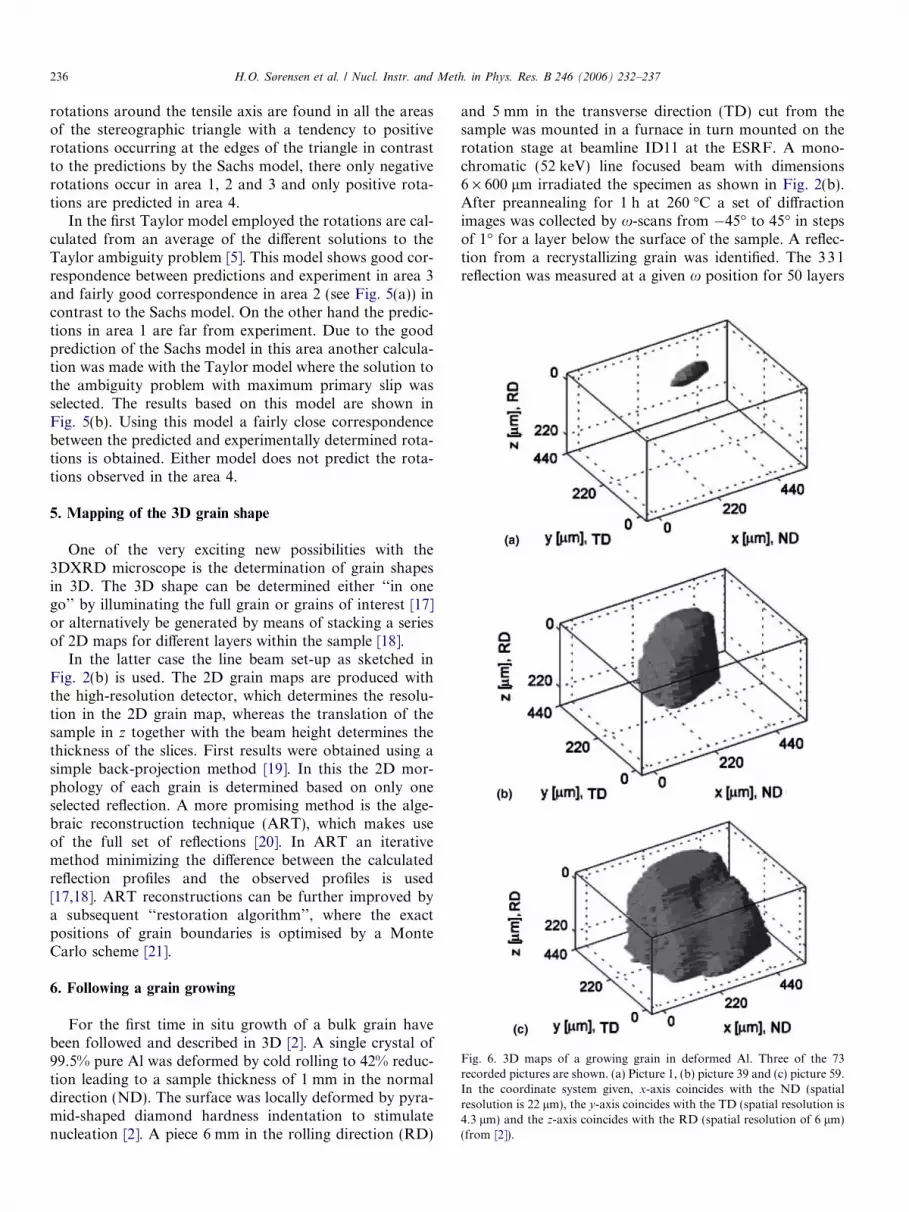
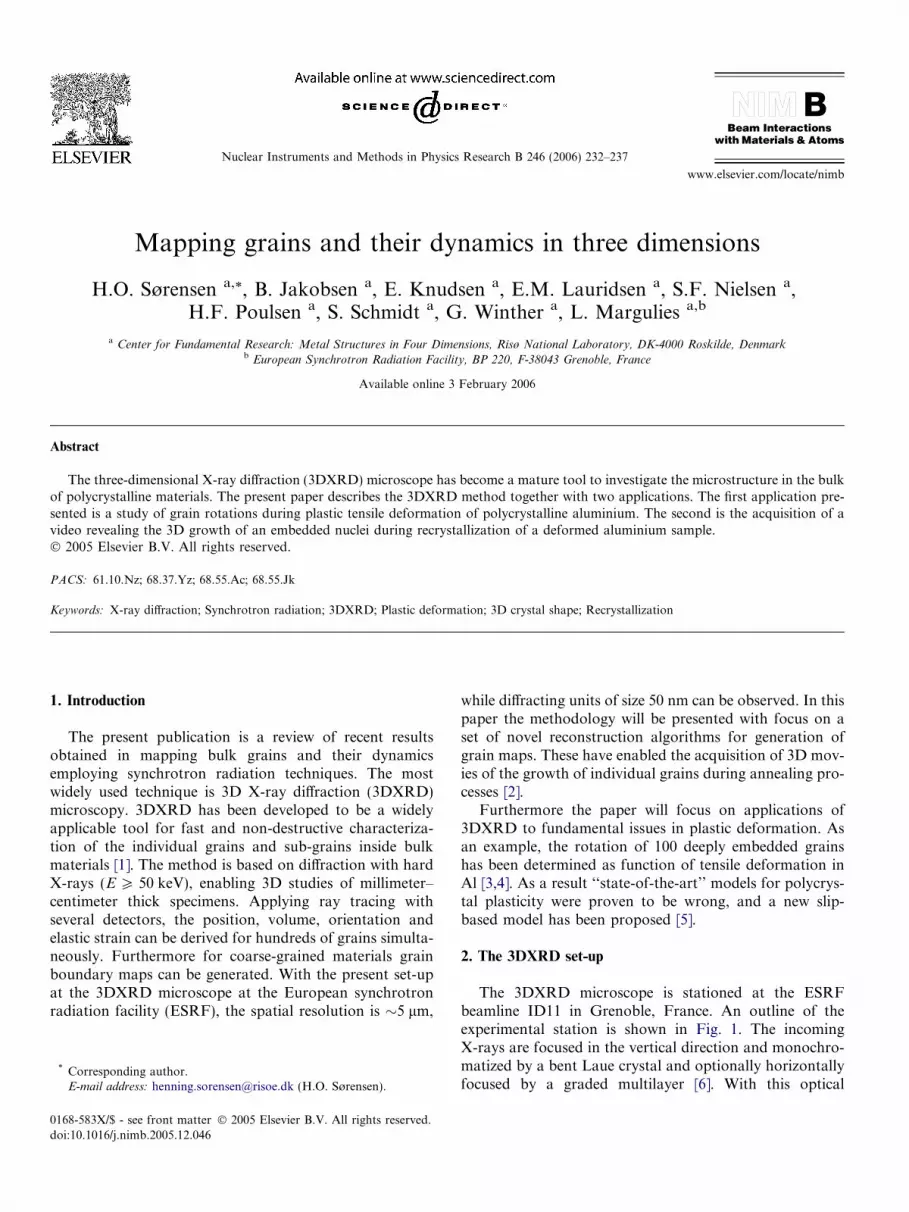
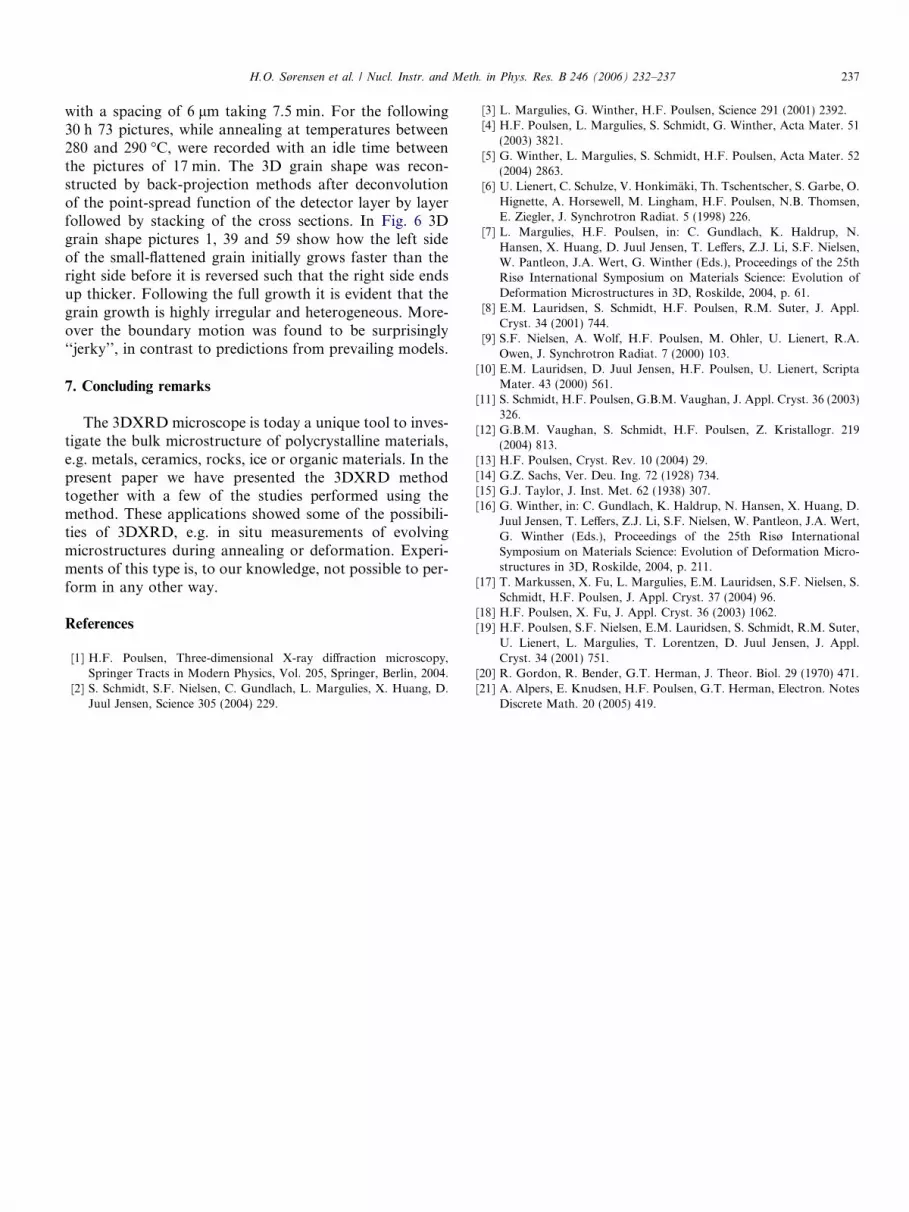
Fig. 6. 3D maps of a growing grain in deformed Al. Three of the 73recorded pictures are shown. (a) Picture 1, (b) picture 39 and (c) picture 59.In the coordinate system given, x-axis coincides with the ND (spatialresolution is 22 lm), the y-axis coincides with the TD (spatial resolution is4.3 lm) and the z-axis coincides with the RD (spatial resolution of 6 lm)(from [2]).
236 H.O. Sørensen et al. / Nucl. Instr. and Meth. in Phys. Res. B 246 (2006) 232–237
rotations around the tensile axis are found in all the areasof the stereographic triangle with a tendency to positiverotations occurring at the edges of the triangle in contrastto the predictions by the Sachs model, there only negativerotations occur in area 1, 2 and 3 and only positive rota-tions are predicted in area 4.
In the first Taylor model employed the rotations are cal-culated from an average of the different solutions to theTaylor ambiguity problem [5]. This model shows good cor-respondence between predictions and experiment in area 3and fairly good correspondence in area 2 (see Fig. 5(a)) incontrast to the Sachs model. On the other hand the predic-tions in area 1 are far from experiment. Due to the goodprediction of the Sachs model in this area another calcula-tion was made with the Taylor model where the solution tothe ambiguity problem with maximum primary slip wasselected. The results based on this model are shown inFig. 5(b). Using this model a fairly close correspondencebetween the predicted and experimentally determined rota-tions is obtained. Either model does not predict the rota-tions observed in the area 4.
5. Mapping of the 3D grain shape
One of the very exciting new possibilities with the3DXRD microscope is the determination of grain shapesin 3D. The 3D shape can be determined either ‘‘in onego’’ by illuminating the full grain or grains of interest [17]or alternatively be generated by means of stacking a seriesof 2D maps for different layers within the sample [18].
In the latter case the line beam set-up as sketched inFig. 2(b) is used. The 2D grain maps are produced withthe high-resolution detector, which determines the resolu-tion in the 2D grain map, whereas the translation of thesample in z together with the beam height determines thethickness of the slices. First results were obtained using asimple back-projection method [19]. In this the 2D mor-phology of each grain is determined based on only oneselected reflection. A more promising method is the alge-braic reconstruction technique (ART), which makes useof the full set of reflections [20]. In ART an iterativemethod minimizing the difference between the calculatedreflection profiles and the observed profiles is used[17,18]. ART reconstructions can be further improved bya subsequent ‘‘restoration algorithm’’, where the exactpositions of grain boundaries is optimised by a MonteCarlo scheme [21].
6. Following a grain growing
For the first time in situ growth of a bulk grain havebeen followed and described in 3D [2]. A single crystal of99.5% pure Al was deformed by cold rolling to 42% reduc-tion leading to a sample thickness of 1 mm in the normaldirection (ND). The surface was locally deformed by pyra-mid-shaped diamond hardness indentation to stimulatenucleation [2]. A piece 6 mm in the rolling direction (RD)
and 5 mm in the transverse direction (TD) cut from thesample was mounted in a furnace in turn mounted on therotation stage at beamline ID11 at the ESRF. A mono-chromatic (52 keV) line focused beam with dimensions6 · 600 lm irradiated the specimen as shown in Fig. 2(b).After preannealing for 1 h at 260 �C a set of diffractionimages was collected by x-scans from �45� to 45� in stepsof 1� for a layer below the surface of the sample. A reflec-tion from a recrystallizing grain was identified. The 331reflection was measured at a given x position for 50 layers
H.O. Sørensen et al. / Nucl. Instr. and Meth. in Phys. Res. B 246 (2006) 232–237 237
with a spacing of 6 lm taking 7.5 min. For the following30 h 73 pictures, while annealing at temperatures between280 and 290 �C, were recorded with an idle time betweenthe pictures of 17 min. The 3D grain shape was recon-structed by back-projection methods after deconvolutionof the point-spread function of the detector layer by layerfollowed by stacking of the cross sections. In Fig. 6 3Dgrain shape pictures 1, 39 and 59 show how the left sideof the small-flattened grain initially grows faster than theright side before it is reversed such that the right side endsup thicker. Following the full growth it is evident that thegrain growth is highly irregular and heterogeneous. More-over the boundary motion was found to be surprisingly‘‘jerky’’, in contrast to predictions from prevailing models.
7. Concluding remarks
The 3DXRD microscope is today a unique tool to inves-tigate the bulk microstructure of polycrystalline materials,e.g. metals, ceramics, rocks, ice or organic materials. In thepresent paper we have presented the 3DXRD methodtogether with a few of the studies performed using themethod. These applications showed some of the possibili-ties of 3DXRD, e.g. in situ measurements of evolvingmicrostructures during annealing or deformation. Experi-ments of this type is, to our knowledge, not possible to per-form in any other way.
References
[1] H.F. Poulsen, Three-dimensional X-ray diffraction microscopy,Springer Tracts in Modern Physics, Vol. 205, Springer, Berlin, 2004.
[2] S. Schmidt, S.F. Nielsen, C. Gundlach, L. Margulies, X. Huang, D.Juul Jensen, Science 305 (2004) 229.
[3] L. Margulies, G. Winther, H.F. Poulsen, Science 291 (2001) 2392.[4] H.F. Poulsen, L. Margulies, S. Schmidt, G. Winther, Acta Mater. 51
(2003) 3821.[5] G. Winther, L. Margulies, S. Schmidt, H.F. Poulsen, Acta Mater. 52
(2004) 2863.[6] U. Lienert, C. Schulze, V. Honkimaki, Th. Tschentscher, S. Garbe, O.
Hignette, A. Horsewell, M. Lingham, H.F. Poulsen, N.B. Thomsen,E. Ziegler, J. Synchrotron Radiat. 5 (1998) 226.
[7] L. Margulies, H.F. Poulsen, in: C. Gundlach, K. Haldrup, N.Hansen, X. Huang, D. Juul Jensen, T. Leffers, Z.J. Li, S.F. Nielsen,W. Pantleon, J.A. Wert, G. Winther (Eds.), Proceedings of the 25thRisø International Symposium on Materials Science: Evolution ofDeformation Microstructures in 3D, Roskilde, 2004, p. 61.
[8] E.M. Lauridsen, S. Schmidt, H.F. Poulsen, R.M. Suter, J. Appl.Cryst. 34 (2001) 744.
[9] S.F. Nielsen, A. Wolf, H.F. Poulsen, M. Ohler, U. Lienert, R.A.Owen, J. Synchrotron Radiat. 7 (2000) 103.
[10] E.M. Lauridsen, D. Juul Jensen, H.F. Poulsen, U. Lienert, ScriptaMater. 43 (2000) 561.
[11] S. Schmidt, H.F. Poulsen, G.B.M. Vaughan, J. Appl. Cryst. 36 (2003)326.
[12] G.B.M. Vaughan, S. Schmidt, H.F. Poulsen, Z. Kristallogr. 219(2004) 813.
[13] H.F. Poulsen, Cryst. Rev. 10 (2004) 29.[14] G.Z. Sachs, Ver. Deu. Ing. 72 (1928) 734.[15] G.J. Taylor, J. Inst. Met. 62 (1938) 307.[16] G. Winther, in: C. Gundlach, K. Haldrup, N. Hansen, X. Huang, D.
Juul Jensen, T. Leffers, Z.J. Li, S.F. Nielsen, W. Pantleon, J.A. Wert,G. Winther (Eds.), Proceedings of the 25th Risø InternationalSymposium on Materials Science: Evolution of Deformation Micro-structures in 3D, Roskilde, 2004, p. 211.
[17] T. Markussen, X. Fu, L. Margulies, E.M. Lauridsen, S.F. Nielsen, S.Schmidt, H.F. Poulsen, J. Appl. Cryst. 37 (2004) 96.
[18] H.F. Poulsen, X. Fu, J. Appl. Cryst. 36 (2003) 1062.[19] H.F. Poulsen, S.F. Nielsen, E.M. Lauridsen, S. Schmidt, R.M. Suter,
U. Lienert, L. Margulies, T. Lorentzen, D. Juul Jensen, J. Appl.Cryst. 34 (2001) 751.
[20] R. Gordon, R. Bender, G.T. Herman, J. Theor. Biol. 29 (1970) 471.[21] A. Alpers, E. Knudsen, H.F. Poulsen, G.T. Herman, Electron. Notes
Discrete Math. 20 (2005) 419.