magnetometry with nitrogen-vacancy ensembles in diamond based on infrared absorption in a doubly...
TRANSCRIPT
arX
iv:1
301.
0808
v1 [
phys
ics.
optic
s] 4
Jan
201
3
Magnetometry with nitrogen-vacancy ensembles in diamond based on infrared
absorption in a doubly resonant optical cavity
Y. Dumeige,1, ∗ M. Chipaux,2 V. Jacques,3 F. Treussart,3 J.-F. Roch,3
T. Debuisschert,2 V. Acosta,4, 5 A. Jarmola,5 K. Jensen,5 P. Kehayias,5 and D. Budker5
1UEB, Universite Europeenne de Bretagne, Universite de Rennes I and CNRS,
UMR 6082 FOTON, Enssat, 6 rue de Kerampont, CS 80518, 22305 Lannion cedex, France2Thales Research and Technology, Campus Polytechnique, 91767 Palaiseau, France
3Laboratoire Aime Cotton, CNRS, Universite Paris-Sud and ENS Cachan, 91405 Orsay, France4Hewlett-Packard Laboratories, Palo Alto, CA, USA
5Department of Physics, University of California at Berkeley, CA 94720-7300 USA
(Dated: December 11, 2013)
We propose to use an optical cavity to enhance the sensitivity of magnetometers relying on thedetection of the spin state of high-density nitrogen-vacancy ensembles in diamond using infraredoptical absorption. The role of the cavity is to obtain a contrast in the absorption-detected magneticresonance approaching unity at room temperature. We project an increase in the photon shot-noise limited sensitivity of two orders of magnitude in comparison with a single-pass approach.Optical losses can limit the enhancement to one order of magnitude which could still enable roomtemperature operation. Finally, the optical cavity also allows to use smaller pumping power whenit is designed to be resonant at both the pump and the signal wavelength.
PACS numbers: 76.30.Mi, 78.30.Am, 07.55.Ge, 42.60.Da
I. INTRODUCTION
The negatively charged nitrogen-vacancy (NV−) cen-ter in diamond can be used as a solid-state mag-netic sensor due to its electron spin resonance (ESR).The center can be optically polarized and its polariza-tion detected through the spin-state dependence of theluminescence1,2. Sensors based on a single NV− cen-ter have the potential to achieve atomic-scale spatialresolution3–5. On the other hand, magnetic field sensitiv-ity can be enhanced by engineering the diamond materialin order to increase the spin dephasing time which limitsthe ESR linewidth6. The magnetic response of an ensem-ble of NV− centers7–10 leads to a luminescence magnifiedby the number N of the sensing spins. Such collectiveresponse also improves the signal to noise ratio and thesensitivity by a factor
√N since the quantum projection
noise associated with the spin-state determination scalesas2,11
√N .
Currently, the sensitivity of practical magnetometersbased on the detection of red luminescence of the NV−
ensemble is limited by background fluorescence andpoor collection efficiency. Recent advances in diamondengineering have enabled improvements in collectionefficiency which should improve fluorescence basedsensors,12–16 but here we consider a different approach.In addition to the well-known transitions leading to redfluorescence, it has been shown recently the existenceof an infrared (IR) transition related to the singletstates17,18. This transition can be exploited in anIR-absorption scheme with an increased sensitivity ascompared to the usual scheme19. In this paper we showthat using IR absorption detection in combination witha high-finesse optical cavity, it is possible to tune theabsorption contrast to order unity thereby dramatically
improving the magnetic field sensitivity. We first recallthe parameters which set the magnetometer sensitivity.We then theoretically investigate the extension ofthis detection scheme to the case where the diamondcrystal hosting the NV− ensemble is inserted inside ahigh-finesse optical cavity, as it is usually done in cavityring-down spectroscopy20. Finally we determine theimprovement of the magnetometer response associatedwith the cavity quality (Q) factor.
II. SINGLE-PASS PHOTON SHOT-NOISE
LIMITED MAGNETIC FIELD SENSITIVITY
The principle of the method is similar to the one usedin optical magnetometers based on the precession of spin-polarized atomic gases21. The applied magnetic fieldvalue is obtained by optically measuring the Zeemanshifts of the NV− defect spin sublevels via the absorptionmonitoring of the IR probe signal. The photodynam-ics of NV− centers are modeled using the level structuredepicted in Fig 1.a). The spin sublevels ms = 0 andms = ±1 of the 3A2 ground triplet state are labeled |1〉and |2〉 and separated by D = 2.87 GHz in zero mag-netic field. |3〉 and |4〉 are the respective spin sublevelsof the 3E excited level. Levels |5〉 and |6〉 are single-state levels related to the infrared absorption transition.The relaxation rate from state i to j is denoted kij . Ask35 ≪ k45 (see Table I in Appendix E), the system isoptically polarized in ms = 0 while pumping the NV−
centers via the phonon sideband. Without microwavesapplied, there is reduced population in the metastablesinglet state, |6〉, corresponding to a minimal IR absorp-tion signal. Under application of resonant microwaves

2
with frequency D ± γB/(2π), where B is the magneticfield projection along one of the four NV− orientationsand γ = 1.761× 10¹¹ s−1T−1 is the gyromagnetic ratio,population is transfered from ms = 0 to ms = ±1 sub-level resulting in greater population in the metastablesinglet and lower IR signal transmission. The experi-mental configuration for single-pass absorption measure-ments is shown in Fig 1.b). The output transmission is
Ground state 3A2
Iout,S
k45
k35
k61
k62
k42
k31W
P
Wmw
WS
Γ
Excited state 3E
Metastable
singlet level
1⟩
2⟩
3⟩
4⟩
5⟩
6⟩
I0,S
0 Lz
I0,P Iout,P
b)NV
ms=0
ms=±1
a)
ms=0
ms=±1
IP(z)
IS(z)
T1D
IR :
FIG. 1. a) Level structure of NV− center in diamond. Thephotophysical parameters related to this six-level system aregiven in Tab. I of Appendix E. The solid (dot) lines corre-spond to radiative (non-radiative) transitions. D ≈ 2.87 GHzis the zero-field splitting of the ground state. b) Diagram ofthe experimental configuration used to measure the single-pass contrast of the IR absorption under resonant microwaveapplication19. I0,P and I0,S are the pump (wavelength λP )and the probe input intensities.
measured either with or without applying the resonantmicrowaves. The contrast C is defined as the relative dif-ference in the IR signal detected after propagation in thediamond crystal of length L
C =Iout,S(0)− Iout,S(ΩR)
Iout,S(0), (1)
where Iout,S(0) [Iout,S(ΩR)] denotes the IR signal inten-sity without [with] the application of the microwave fieldwhose Rabi angular frequency is denoted ΩR. We can es-timate the photon shot-noise limited sensitivity at roomtemperature for an optical power compatible with theIR saturation intensity. For an ESR full-width-at-half-maximum (FWHM) Γmw, the magnetic field sensitivity(or the minimum detectable magnetic field) of a mag-netometer based on IR absorption measurement is given
by19,22,23
δB =Γmw
γC
√
hc
PStmλS
, (2)
where PS is the measured IR probe beam signal out-put power (wavelength λS), and tm is the measurementtime. Assuming no power broadening from either pumpor microwaves, the ESR FWHM is related to the electronspin dephasing time by Γmw = 2/T ∗
2 (in rad/s). For adetected IR signal power PS = 300 mW using Eq. (2)with parameter values given in Tab. II of Appendix Ewe obtain a shot-noise limited magnetic field sensitiv-ity of 20 pT/
√Hz in a single-pass configuration at room
temperature. Note that considering this IR signal powerand a beam waist diameter of 2w0 = 50 µm there isno saturation of the IR absorption (see Appendix B).For this single-pass configuration, the contrast cannot beimproved by increasing the thickness of the sample sincefor L larger than the pump penetration depth (≈ 120 µmfrom the absorption cross section and NV− center densityof Tab. I and II) its absorption becomes too strong. Thephoton shot-noise limited sensitivity can be compared tothe spin-noise limited sensitivity
δBq =2
γ√
nV T ∗
2 tm, (3)
where we take into account through the factor of 2 thatonly one fourth of the NV− centers are oriented along themagnetic field24, n is the NV−-center density and V isthe illuminated diamond volume. In the single pass con-figuration of Ref. [19], the spin-noise limited sensitivity
is about 0.02 pT/√Hz.
III. SENSITIVITY ENHANCEMENT
According to Eq. (2), the magnetic-field sensitivity islimited by the low contrast C. In particular, at room tem-perature the contrast is an order of magnitude smallerthan at 75 K due to homogeneous broadening19. It canalso be seen as limited by the optical depth estimatedto only 2.2 × 10⁻² for the experimental demonstrationreported in Ref. [19]. However, the optical depth canbe increased by using a cavity resonant at the IR signalwavelength resulting in an increase of the optical path bya factor proportional to the finesse of the cavity. More-over, using a diamond crystal thickness smaller than thepump absorption length allows to overcome the issue ofthe pump depletion and to obtain a good microwave fieldhomogeneity along the crystal. We consider the Fabry-Perot cavity configuration depicted in Fig 2a), consist-ing of a two-side coated bulk-diamond plate containing ahigh NV−-center density (larger than 4× 10²³ m−3). Weconsider an all-pass Fabry-Perot cavity for the IR signal.This means that the amplitude reflectivity of the backmirror is ρback,S = 1 and of the input mirror reflectivityis ρin,S < 1. Regarding the pump, we consider either
3
λP=532nm
λS=1042nm
ρin
NV-
L
ρback
I0,S
Iout,S
I0,P
Iout,P
FPλ
Sλ0
mw on
mw off
b) RS=Iout,S/I0,S
100%
a)
1
10
L=L0
L=10L0
c) Maximal intracavity pump
intensity magnification factor
1
102
10 102
RS(0)
RS(ΩR)
0
fPbP
fSbS
z
C
D F
0λ1
RS(0,λ1)
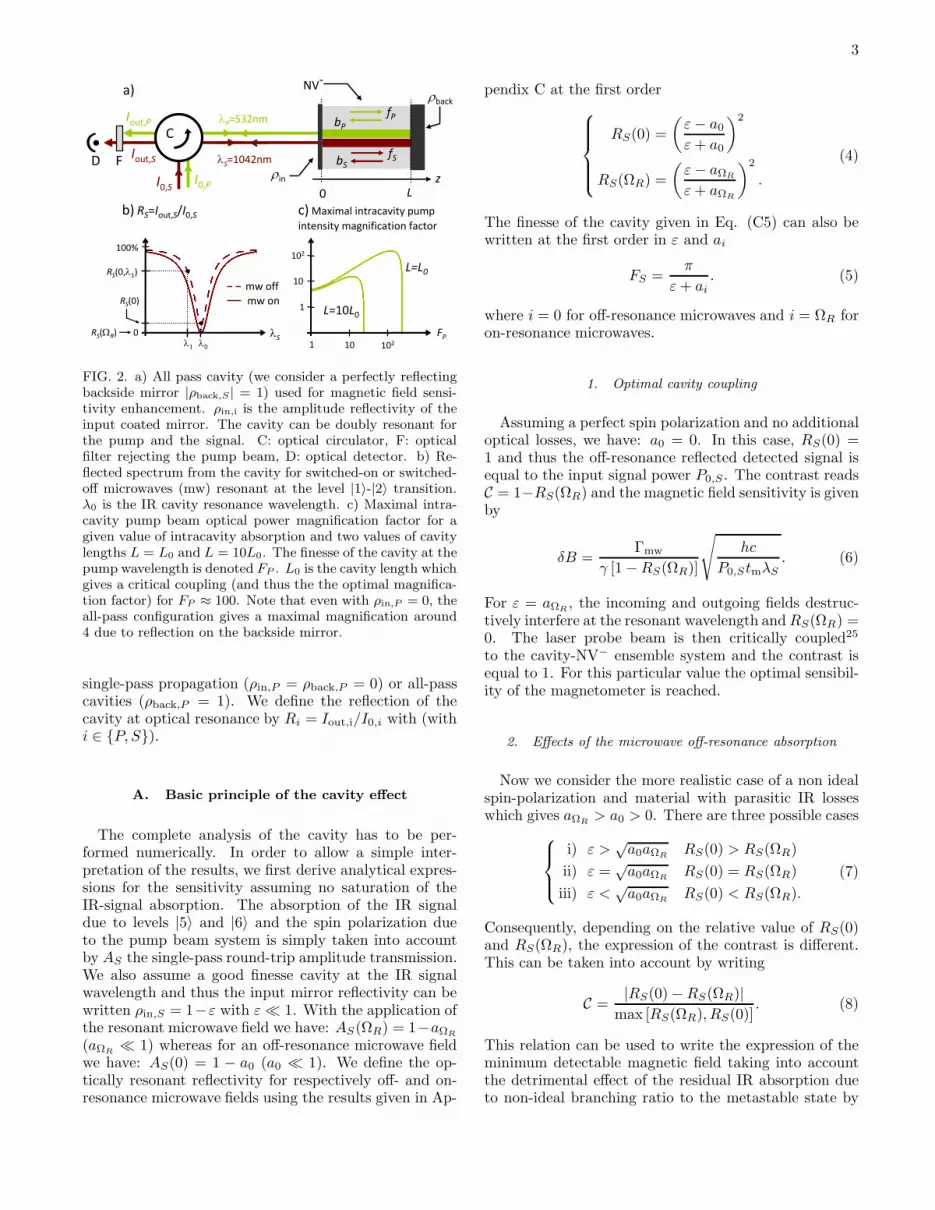
FIG. 2. a) All pass cavity (we consider a perfectly reflectingbackside mirror |ρback,S | = 1) used for magnetic field sensi-tivity enhancement. ρin,i is the amplitude reflectivity of theinput coated mirror. The cavity can be doubly resonant forthe pump and the signal. C: optical circulator, F: opticalfilter rejecting the pump beam, D: optical detector. b) Re-flected spectrum from the cavity for switched-on or switched-off microwaves (mw) resonant at the level |1〉-|2〉 transition.λ0 is the IR cavity resonance wavelength. c) Maximal intra-cavity pump beam optical power magnification factor for agiven value of intracavity absorption and two values of cavitylengths L = L0 and L = 10L0. The finesse of the cavity at thepump wavelength is denoted FP . L0 is the cavity length whichgives a critical coupling (and thus the the optimal magnifica-tion factor) for FP ≈ 100. Note that even with ρin,P = 0, theall-pass configuration gives a maximal magnification around4 due to reflection on the backside mirror.
single-pass propagation (ρin,P = ρback,P = 0) or all-passcavities (ρback,P = 1). We define the reflection of thecavity at optical resonance by Ri = Iout,i/I0,i with (withi ∈ P, S).
A. Basic principle of the cavity effect
The complete analysis of the cavity has to be per-formed numerically. In order to allow a simple inter-pretation of the results, we first derive analytical expres-sions for the sensitivity assuming no saturation of theIR-signal absorption. The absorption of the IR signaldue to levels |5〉 and |6〉 and the spin polarization dueto the pump beam system is simply taken into accountby AS the single-pass round-trip amplitude transmission.We also assume a good finesse cavity at the IR signalwavelength and thus the input mirror reflectivity can bewritten ρin,S = 1−ε with ε ≪ 1. With the application ofthe resonant microwave field we have: AS(ΩR) = 1−aΩR
(aΩR≪ 1) whereas for an off-resonance microwave field
we have: AS(0) = 1 − a0 (a0 ≪ 1). We define the op-tically resonant reflectivity for respectively off- and on-resonance microwave fields using the results given in Ap-
pendix C at the first order
RS(0) =
(
ε− a0ε+ a0
)2
RS(ΩR) =
(
ε− aΩR
ε+ aΩR
)2
.
(4)
The finesse of the cavity given in Eq. (C5) can also bewritten at the first order in ε and ai
FS =π
ε+ ai. (5)
where i = 0 for off-resonance microwaves and i = ΩR foron-resonance microwaves.
1. Optimal cavity coupling
Assuming a perfect spin polarization and no additionaloptical losses, we have: a0 = 0. In this case, RS(0) =1 and thus the off-resonance reflected detected signal isequal to the input signal power P0,S . The contrast readsC = 1−RS(ΩR) and the magnetic field sensitivity is givenby
δB =Γmw
γ [1−RS(ΩR)]
√
hc
P0,StmλS
. (6)
For ε = aΩR, the incoming and outgoing fields destruc-
tively interfere at the resonant wavelength andRS(ΩR) =0. The laser probe beam is then critically coupled25
to the cavity-NV− ensemble system and the contrast isequal to 1. For this particular value the optimal sensibil-ity of the magnetometer is reached.
2. Effects of the microwave off-resonance absorption
Now we consider the more realistic case of a non idealspin-polarization and material with parasitic IR losseswhich gives aΩR
> a0 > 0. There are three possible cases
i) ε >√a0aΩR
RS(0) > RS(ΩR)
ii) ε =√a0aΩR
RS(0) = RS(ΩR)
iii) ε <√a0aΩR
RS(0) < RS(ΩR).
(7)
Consequently, depending on the relative value of RS(0)and RS(ΩR), the expression of the contrast is different.This can be taken into account by writing
C =|RS(0)−RS(ΩR)|
max [RS(ΩR), RS(0)]. (8)
This relation can be used to write the expression of theminimum detectable magnetic field taking into accountthe detrimental effect of the residual IR absorption dueto non-ideal branching ratio to the metastable state by
4
multiplying P0,S by max [RS(ΩR), RS(0)] to obtain thedetected IR power PS of Eq. (2). The fundamental ad-vantage of the present method is that this quantity fallsunder the square root whereas for methods based on thevisible-fluorescence monitoring the non-ideal branchingratio reduces the contrast C by a similar amount, butthis quantity falls outside the square root. One can esti-mate that in the same conditions, the minimal detectablemagnetic field δB is reduced by a factor of ≈ 5 in com-parison with δBf obtained via fluorescence method witha collection efficiency η ≈ 0.47 (see details and discussionin Appendix F). The sensitivity thus reads
δB =Γmw
γ |RS(0)−RS(ΩR)|
√
hc×max [RS(ΩR), RS(0)]
P0,StmλS
.
(9)In the present case, there are two critical-coupling condi-tions, thus the sensitivity δB can reach two optimal val-ues obtained for ε = aΩR
(solid line in Fig 2b) or ε = a0.
Note that due to the factor√
max [RS(ΩR), RS(0)] inthe numerator of Eq. (9), the minimum values of δB isactually reached for values of ε slightly different from theexact critical-coupling finesse. This will be accurately de-scribed in the numerical calculations. We first considerthe case i) of Eqs. (7). Assuming ε ≫ aΩR
we have
δB ≈ πΓmw
4γFS(aΩR− a0)
√
hc
P0,StmλS
. (10)
This means that for low cavity finesses the effect of thecavity is to reduce the minimum detectable magnetic fieldvalue by a factor equal to the finesse FS ≈ π/ε. Forε =
√a0aΩR
(case ii), the contrast is equal to zero andδB reaches a singular value as shown in Eq. (2). Finally,for ε <
√a0aΩR
(case iii), assuming ε ≪ a0 the sensitivityreads
δB ≈ ΓmwaΩRa0
4γε(aΩR− a0)
√
hc
P0,StmλS
. (11)
This shows that the sensitivity can be greatly impaired(i.e. δB increases) if the empty cavity finesse (π/ε) islarger than that of a critically coupled cavity given byπ/(2a0). Moreover, Eqs. (10) and (11) show that if theoff- and on-resonance loss values a0 and aΩR
are too close,the sensitivity is also impaired.As a conclusion, the level |6〉 is always partly popu-
lated due to the non ideal branching ratio to the darksinglet state (k35 6= 0). This results in absorption ofthe IR probe beam, even in the microwave-off state (i.e.no resonant microwaves applied) and the implementa-tion of a cavity will also increase this effect and reducethe detected IR photon number Iout,S . Thus, the cav-ity induces simultaneously an increase in the contrast Cand a reduction of the detected photon number in the IRbeam. Consequently, for a given single-pass absorption,the cavity finesse cannot be arbitrarily increased and themagnetic field sensitivity δB reaches a minimum value
intrinsically limited by NV− photophysical parametersand by diamond intrinsic IR optical losses. Those effectsare quantitatively described in the next section wherenumerical results are reported.
B. Numerical calculations
The output fields Eout,i both for the pump and IRsignal are deduced from the input and intracavity for-ward and backward propagating fields fi(z) and bi(z)described Fig. 2a) using the slowly varying envelope ap-proximation. Note that the intracavity absorption (ob-tained by solving the six-level rate equations) dependsnonlinearly on the intracavity intensity Ii(z) and thus anumerical optimization routine on fi(L) must be usedto deduce the reflected powers both at pump and signalwavelengths for the target values26 of I0,i (see AppendixD for details on the calculation method).We consider two NV− center concentrations19,27 i) con-
figuration 1: n = 4.4×10²³ m−3 and T ∗
2 = 390 ns ii) con-figuration 2: n = 28 × 1023 m−3 and T ∗
2 = 150 ns. Forhigh NV−-center density, single-pass absorption is highand the system is less sensitive to parasitic optical losses,but the electron spin dephasing time is shorter than forless low density samples. For each of these configurationswe analyze: i) the effect of the diamond crystal samplethickness, ii) the effect of the input power, and iii) thatof the Q-factor of the cavity. The Q-factors are definedby Qi = 2ndLFi/λi, (i ∈ P, S) nd = 2.4 being the dia-mond refractive index and where we recall (see Eq. (C5)in Appendix C) that the finesse Fi is defined by
Fi =π√
ρin,iAi
1− ρin,iAi
. (12)
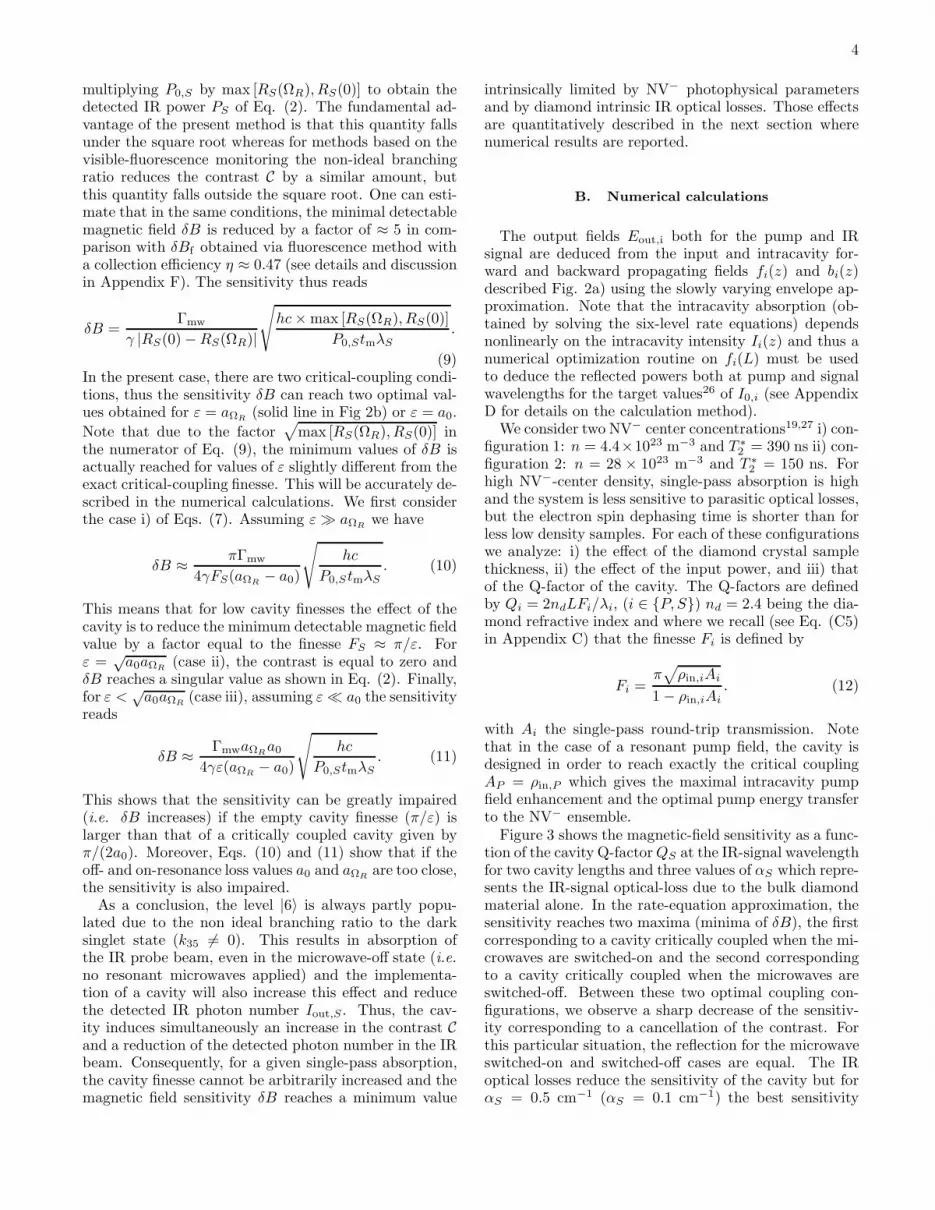
with Ai the single-pass round-trip transmission. Notethat in the case of a resonant pump field, the cavity isdesigned in order to reach exactly the critical couplingAP = ρin,P which gives the maximal intracavity pumpfield enhancement and the optimal pump energy transferto the NV− ensemble.Figure 3 shows the magnetic-field sensitivity as a func-
tion of the cavity Q-factorQS at the IR-signal wavelengthfor two cavity lengths and three values of αS which repre-sents the IR-signal optical-loss due to the bulk diamondmaterial alone. In the rate-equation approximation, thesensitivity reaches two maxima (minima of δB), the firstcorresponding to a cavity critically coupled when the mi-crowaves are switched-on and the second correspondingto a cavity critically coupled when the microwaves areswitched-off. Between these two optimal coupling con-figurations, we observe a sharp decrease of the sensitiv-ity corresponding to a cancellation of the contrast. Forthis particular situation, the reflection for the microwaveswitched-on and switched-off cases are equal. The IRoptical losses reduce the sensitivity of the cavity but forαS = 0.5 cm−1 (αS = 0.1 cm−1) the best sensitivity
5
102 103 104 105
0.1
1
10
100
102 103 104 105
0.1
1
10
100
102 103 104 105
0.1
1
10
100
102 103 104 105
0.1
1
10
100
Config. 2 - n=28x1023m-3
B (p
T/Hz
0.5 )
Config. 1 - n=4.4x10²³m-3
b) L=10µm / FP=160 / I
P=8MW/m2
B (p
T/Hz
0.5 )
S=0.1cm-1
S=0.5cm-1
S=3cm-1
a) L=100µm / FP=23 / I
P=80MW/m2
B (p
T/Hz
0.5 )
Cavity quality factor QS at
S
d) L=10µm / FP=31 / I
P=40MW/m2
B (p
T/Hz
0.5 )
c) L=100µm / IP=400MW/m2
FIG. 3. Shot noise limited magnetic field sensitivity vs Q-factor of the cavity at the signal wavelength and for dif-ferent values of IR-signal optical losses (αS). Calculationsare done for ΩR = 2π × 1.5 MHz, P0,S = 300 mW withI0,S = 150 MW/m2 and no optical losses for the pump(αP = 0). c) Config. 2 and L = 100 µm, we assume a singlepass pumping. For each plot, the value of δB obtained for lowQs is about half compared to that obtained for single-passpropagation as expected from the use of a high reflectivitybackside mirror.
can reach 0.6 pT/√Hz (0.3 pT/
√Hz) corresponding to
almost two orders of magnitude enhancement in compar-ison to single-pass approaches. For strong optical losses(αS = 3 cm−1) the sensitivity is still enhanced by morethan one order of magnitude and the performance of thecavity system is comparable with that of the same sam-ple in a single-pass configuration at low temperature19.We now discuss the results for IR optical losses set to
αS = 0.5 cm−1. For n = 4.4× 10²³ m−3, it is possible touse a doubly resonant cavity to increase the intracavityoptical pump intensity and thus to reduce the requiredexternal intensity as illustrated in Fig. 2c). By diminish-ing the length of the cavity, the single pass attenuationis reduced and thus it is possible to increase the pump
10-3 10-2 10-1 100 1010.1
1
10 Config 2. L=10µm/QS=1.8x104/F
P=31/I
P=40MW/m2
Config 2. L=100µm/QS=2.5x104/I
P=400MW/m2
B (p
T/Hz
0.5 )
P0,S
(W)
Config 1. L=10µm/QS=5.3x104/F
P=160/I
P=8MW/m2
Config 1. L=100µm/QS=5.1x104/F
P=23/I
P=80MW/m2
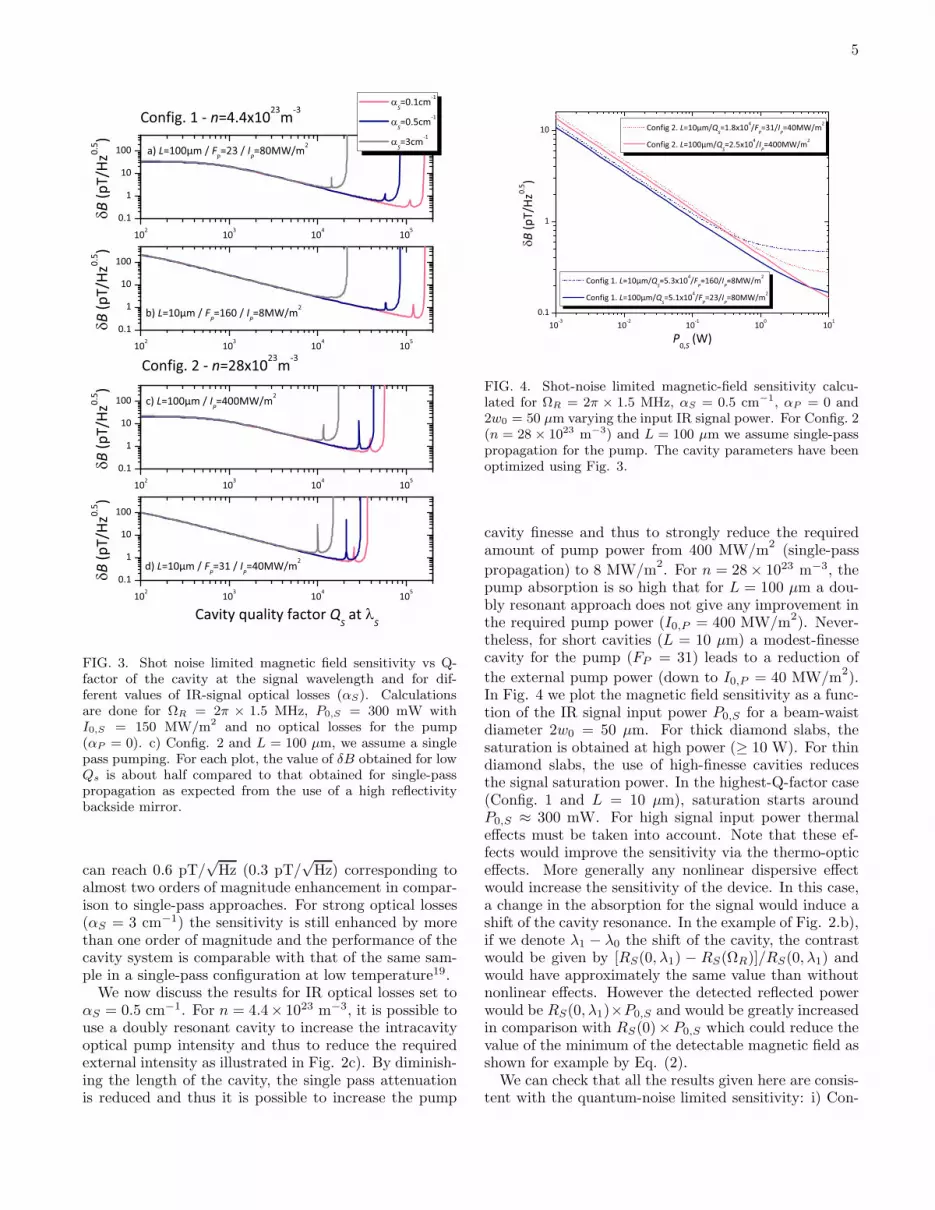
FIG. 4. Shot-noise limited magnetic-field sensitivity calcu-lated for ΩR = 2π × 1.5 MHz, αS = 0.5 cm−1, αP = 0 and2w0 = 50 µm varying the input IR signal power. For Config. 2(n = 28 × 1023 m−3) and L = 100 µm we assume single-passpropagation for the pump. The cavity parameters have beenoptimized using Fig. 3.
cavity finesse and thus to strongly reduce the requiredamount of pump power from 400 MW/m
2(single-pass
propagation) to 8 MW/m2. For n = 28× 1023 m−3, the
pump absorption is so high that for L = 100 µm a dou-bly resonant approach does not give any improvement inthe required pump power (I0,P = 400 MW/m2). Never-theless, for short cavities (L = 10 µm) a modest-finessecavity for the pump (FP = 31) leads to a reduction of
the external pump power (down to I0,P = 40 MW/m2).
In Fig. 4 we plot the magnetic field sensitivity as a func-tion of the IR signal input power P0,S for a beam-waistdiameter 2w0 = 50 µm. For thick diamond slabs, thesaturation is obtained at high power (≥ 10 W). For thindiamond slabs, the use of high-finesse cavities reducesthe signal saturation power. In the highest-Q-factor case(Config. 1 and L = 10 µm), saturation starts aroundP0,S ≈ 300 mW. For high signal input power thermaleffects must be taken into account. Note that these ef-fects would improve the sensitivity via the thermo-opticeffects. More generally any nonlinear dispersive effectwould increase the sensitivity of the device. In this case,a change in the absorption for the signal would induce ashift of the cavity resonance. In the example of Fig. 2.b),if we denote λ1 − λ0 the shift of the cavity, the contrastwould be given by [RS(0, λ1) − RS(ΩR)]/RS(0, λ1) andwould have approximately the same value than withoutnonlinear effects. However the detected reflected powerwould be RS(0, λ1)×P0,S and would be greatly increasedin comparison with RS(0)×P0,S which could reduce thevalue of the minimum of the detectable magnetic field asshown for example by Eq. (2).We can check that all the results given here are consis-
tent with the quantum-noise limited sensitivity: i) Con-
6
fig. 1 δBq = 0.2 pT/√Hz and δBq = 0.06 pT/
√Hz ii)
Config 2. δBq = 0.13 pT/√Hz and δBq = 0.04 pT/
√Hz
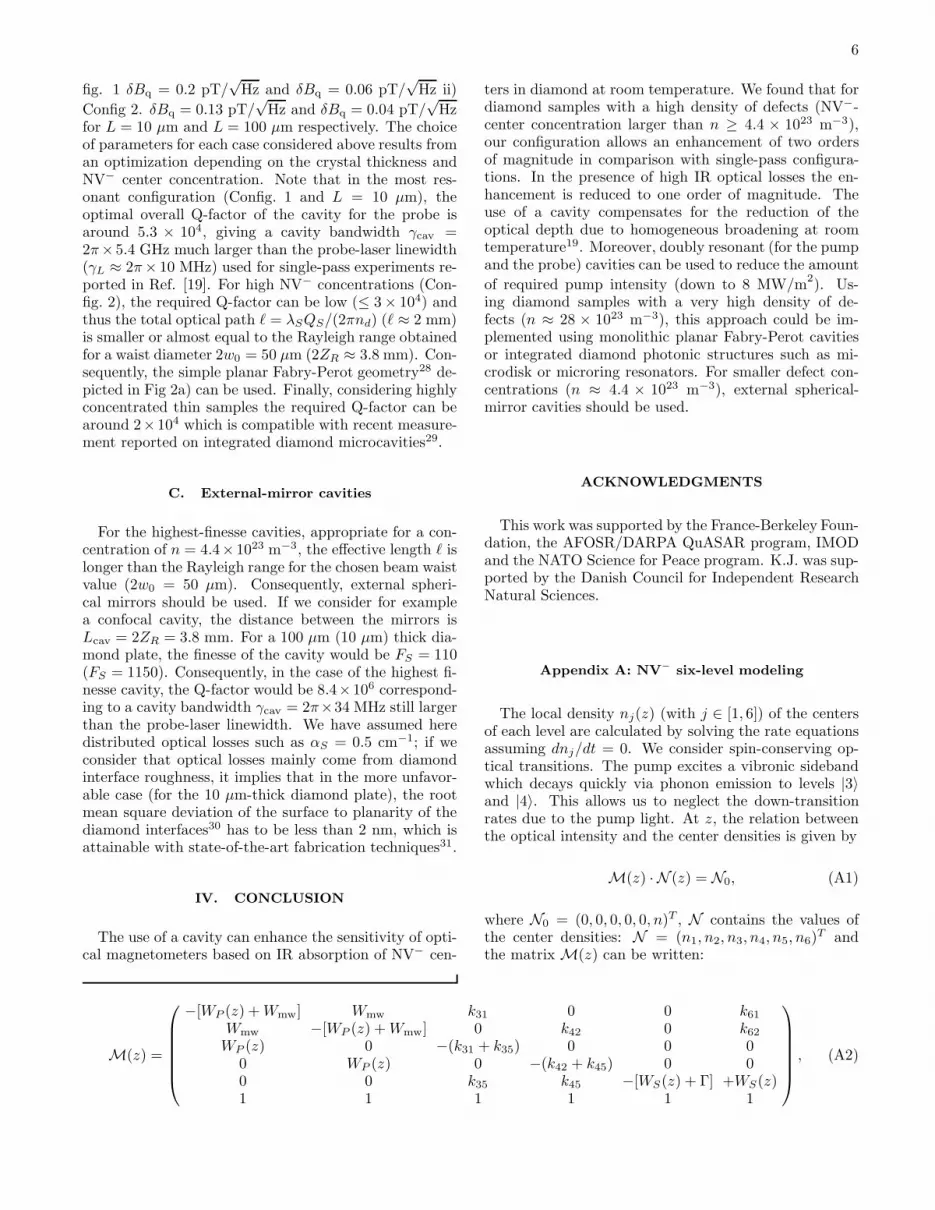
for L = 10 µm and L = 100 µm respectively. The choiceof parameters for each case considered above results froman optimization depending on the crystal thickness andNV− center concentration. Note that in the most res-onant configuration (Config. 1 and L = 10 µm), theoptimal overall Q-factor of the cavity for the probe isaround 5.3 × 10⁴, giving a cavity bandwidth γcav =2π× 5.4 GHz much larger than the probe-laser linewidth(γL ≈ 2π× 10 MHz) used for single-pass experiments re-ported in Ref. [19]. For high NV− concentrations (Con-fig. 2), the required Q-factor can be low (≤ 3× 10⁴) andthus the total optical path ℓ = λSQS/(2πnd) (ℓ ≈ 2 mm)is smaller or almost equal to the Rayleigh range obtainedfor a waist diameter 2w0 = 50 µm (2ZR ≈ 3.8 mm). Con-sequently, the simple planar Fabry-Perot geometry28 de-picted in Fig 2a) can be used. Finally, considering highlyconcentrated thin samples the required Q-factor can bearound 2× 10⁴ which is compatible with recent measure-ment reported on integrated diamond microcavities29.
C. External-mirror cavities
For the highest-finesse cavities, appropriate for a con-centration of n = 4.4× 10²³ m−3, the effective length ℓ islonger than the Rayleigh range for the chosen beam waistvalue (2w0 = 50 µm). Consequently, external spheri-cal mirrors should be used. If we consider for examplea confocal cavity, the distance between the mirrors isLcav = 2ZR = 3.8 mm. For a 100 µm (10 µm) thick dia-mond plate, the finesse of the cavity would be FS = 110(FS = 1150). Consequently, in the case of the highest fi-nesse cavity, the Q-factor would be 8.4×10⁶ correspond-ing to a cavity bandwidth γcav = 2π×34 MHz still largerthan the probe-laser linewidth. We have assumed heredistributed optical losses such as αS = 0.5 cm−1; if weconsider that optical losses mainly come from diamondinterface roughness, it implies that in the more unfavor-able case (for the 10 µm-thick diamond plate), the rootmean square deviation of the surface to planarity of thediamond interfaces30 has to be less than 2 nm, which isattainable with state-of-the-art fabrication techniques31.
IV. CONCLUSION
The use of a cavity can enhance the sensitivity of opti-cal magnetometers based on IR absorption of NV− cen-
ters in diamond at room temperature. We found that fordiamond samples with a high density of defects (NV−-center concentration larger than n ≥ 4.4 × 10²³ m−3),our configuration allows an enhancement of two ordersof magnitude in comparison with single-pass configura-tions. In the presence of high IR optical losses the en-hancement is reduced to one order of magnitude. Theuse of a cavity compensates for the reduction of theoptical depth due to homogeneous broadening at roomtemperature19. Moreover, doubly resonant (for the pumpand the probe) cavities can be used to reduce the amount
of required pump intensity (down to 8 MW/m2). Us-
ing diamond samples with a very high density of de-fects (n ≈ 28 × 1023 m−3), this approach could be im-plemented using monolithic planar Fabry-Perot cavitiesor integrated diamond photonic structures such as mi-crodisk or microring resonators. For smaller defect con-centrations (n ≈ 4.4 × 10²³ m−3), external spherical-mirror cavities should be used.
ACKNOWLEDGMENTS
This work was supported by the France-Berkeley Foun-dation, the AFOSR/DARPA QuASAR program, IMODand the NATO Science for Peace program. K.J. was sup-ported by the Danish Council for Independent ResearchNatural Sciences.
Appendix A: NV− six-level modeling
The local density nj(z) (with j ∈ [1, 6]) of the centersof each level are calculated by solving the rate equationsassuming dnj/dt = 0. We consider spin-conserving op-tical transitions. The pump excites a vibronic sidebandwhich decays quickly via phonon emission to levels |3〉and |4〉. This allows us to neglect the down-transitionrates due to the pump light. At z, the relation betweenthe optical intensity and the center densities is given by
M(z) · N (z) = N0, (A1)
where N0 = (0, 0, 0, 0, 0, n)T , N contains the values ofthe center densities: N = (n1, n2, n3, n4, n5, n6)
T andthe matrix M(z) can be written:
M(z) =
−[WP (z) +Wmw] Wmw k31 0 0 k61Wmw −[WP (z) +Wmw] 0 k42 0 k62WP (z) 0 −(k31 + k35) 0 0 0
0 WP (z) 0 −(k42 + k45) 0 00 0 k35 k45 −[WS(z) + Γ] +WS(z)1 1 1 1 1 1
, (A2)
7
we assume here a closed system:∑6
j=1 nj = n. The
transition rates Wi (i = P for the pump and i = Sfor the IR signal) are related to the optical intensity Ii,the wavelength λi and the absorption cross section σi
by Wi = σiIiλi/(hc). Assuming a low Rabi angular fre-quency ΩR, in the rate-equation approximation, the mi-crowave transition rate is calculated as Wmw = Ω2
RT∗
2 /2where T ∗
2 is the electron spin dephasing time. The centerdensity in each level is calculated by N = M−1N0.
Appendix B: IR-absorption cross section estimation
In order to model the system we have to evaluate theIR absorption (due to singlet states) cross section σS
which has not been measured so far. With the aim of de-signing a cavity based magnetometer, the value of σS isimportant to evaluate the intracavity IR signal intensitysaturation. This completes the already reported list ofphotophysical properties of the NV− centers in diamondsthat are summarized in Tab. I given in Appendix E. Herewe estimate σS by using the single-pass IR-absorptionmeasurements described in Ref. [19]. We assume thatthe measured magnetic field is oriented in such a waythat the microwaves are only resonant with NV− centersof a particular orientation, i.e., one quarter of all theNV− centers24. In the single-pass configuration C can becalculated by integrating the two differential equationsconsidering off-resonance pumping and a resonant exci-tation (including stimulated emission) for the signal
dIPdz
= −σP [n1(z) + n2(z)] + αP IP (z)dISdz
= −σS [n6(z)− n5(z)] + αS IS(z),(B1)
where the densities ni(z) with i ∈ [1, 6] are the station-ary solutions of the rate equations corresponding to Fig.1a) (see Appendix A). αi with i ∈ P, S are the op-tical losses due to light scattering or parasitic absorp-tion. Calculations are carried out using the parametersgiven in Ref. [19] recalled in Tab. II (see AppendixE). The two unknown values are the IR absorption crosssection σS and the optical losses αP at the pump wave-length. The method consists in numerically finding thevalues of σS which gives the contrast value defined inEq. (1) and reported in Ref. [19]. We have then de-duced that for a monochromatic excitation (the linewidthof the IR laser is γL ≈ 2π × 10 MHz ≪ γIR), the IRabsorption cross section due to the metastable level isσS = (2.0 ± 0.3) × 10−22 m2. The uncertainties comefrom the value of αP which has been assumed to varyfrom 0 to 10 cm−1. The associated saturation intensityis Isat,S = hcΓ/(2λSσS) ≈ 500 GW/m2.
Appendix C: Analytic expression of the
cavity-reflectivity in the linear regime
Here we consider the cavity described in Fig. 2a) withρback,S = 1. We denote the probe input field E0,S , thereflected field Eout,S and the forward propagating fieldinside the cavity at the input mirror FS(0). Introduc-ing the amplitude mirror IR transmission coefficient κin,S
verifying κ2in,S + ρ2in,S = 1 and the round-trip phase ϕ,
we can write
FS(0) = jκin,SE0,S + ρin,SASFS(0)ejϕ
Eout,S = ρin,SE0,S + jκin,SASFS(0)ejϕ.
(C1)
By eliminating FS(0), we can deduce the amplitudetransfer function of the cavity
Eout,S
E0,S
=ρin,S −ASe
jϕ
1− ρin,SASejϕ. (C2)
The intensity reflectivity of the cavity is thus given by
∣
∣
∣
∣
Eout,S
E0,S
∣
∣
∣
∣
2
=ρ2in,S +A2
S − 2ρin,SAS cosϕ
1 + ρ2in,SA2S − 2ρin,SAS cosϕ
. (C3)
At resonance ϕ = 0 (2π) the reflectivity of the cavity canbe written
RS =
(
ρin,S −AS
1− ρin,SAS
)2
. (C4)
In the all-pass configuration, the finesse of the cavity isgiven by
FS =π√
ρin,SAS
1− ρin,SAS
. (C5)
Appendix D: Numerical cavity-reflectivity
calculation
For i ∈ S, P, if Fi and Bi denote the forward andbackward propagating fields, the intracavity field Ei canbe written
Ei(z) = Fi(z) + Bi(z). (D1)
With fi and bi, the slowly varying envelope amplitudesof the forward and backward propagating fields shown inFig. 2a), we obtain
Ei(z) = fi(z)e−jβiz + bi(z)e
jβiz , (D2)
with βi = 2πnd/λi. The field amplitudes are normalized
in order to have Ii(z) = |Ei(z)|2. The calculation of thecavity reflection is a two point boundary value problem.It can be solved by a shooting method. The first bound-ary condition is that there is no incoming field from the
8
z > 0. This can be written by the following relation be-tween the forward and backward propagating field valuesat the back mirror
bi(L) = ρback,ifi(L)e−2jβiL. (D3)
From this starting values we can deduce the values of theenvelope amplitudes at the input mirror by integratingthe following differential coupled equations
dfPdz
= −1
2σP [n1(z) + n2(z)] + αP fP (z)
dbPdz
=1
2σP [n1(z) + n2(z)] + αP bP (z)
dfSdz
= −1
2σS [n6(z)− n5(z)] + αS fS(z)
dbSdz
=1
2σS [n6(z)− n5(z)] + αS bS(z),
(D4)
where the values of the NV− center density are deducedfrom Eq. (A1). We can obtain the input I0,i = |E0,i|2and output Iout,i = |Eout,i|2 intensities from
E0,i =1
jκin,i
[fi(0)− ρin,ibi(0)]
Eout,i = ρin,iE0,i + jκin,ibi(0),
(D5)
where κin,i for i ∈ P, S (κ2in,i + ρ2in,i = 1) are the am-
plitude mirror transmission coefficients. The calculationmethod consists in numerically optimizing the values offi(L) to obtain the target values of I0,i. The value ofRS = Iout,S/I0,S is then deduced with and without themicrowave field applied. This is used to calculate thecontrast C using Eq. (8) and the effective detected powermax[RS(ΩR), RS(0)] × PS . Finally, the minimum de-tectable magnetic field δB is evaluated using Eq. (9).
Appendix E: Tables
The large value of T1 shows that spin relaxation isnegligible. Thus this is not taken into account in therate-equation modeling of the six-level system.
Appendix F: Sensitivity fundamental limit
In this Appendix we derive the fundamental limit ofthe minimal detectable magnetic field value for methodsbased on IR absorption or visible fluorescence monitoringconsidering that the methods are limited by the photonshot-noise.
1. IR absorption based magnetometer
Using the expression of the ESR FWHM and Eq. (2)we obtain the following relation for the minimal de-
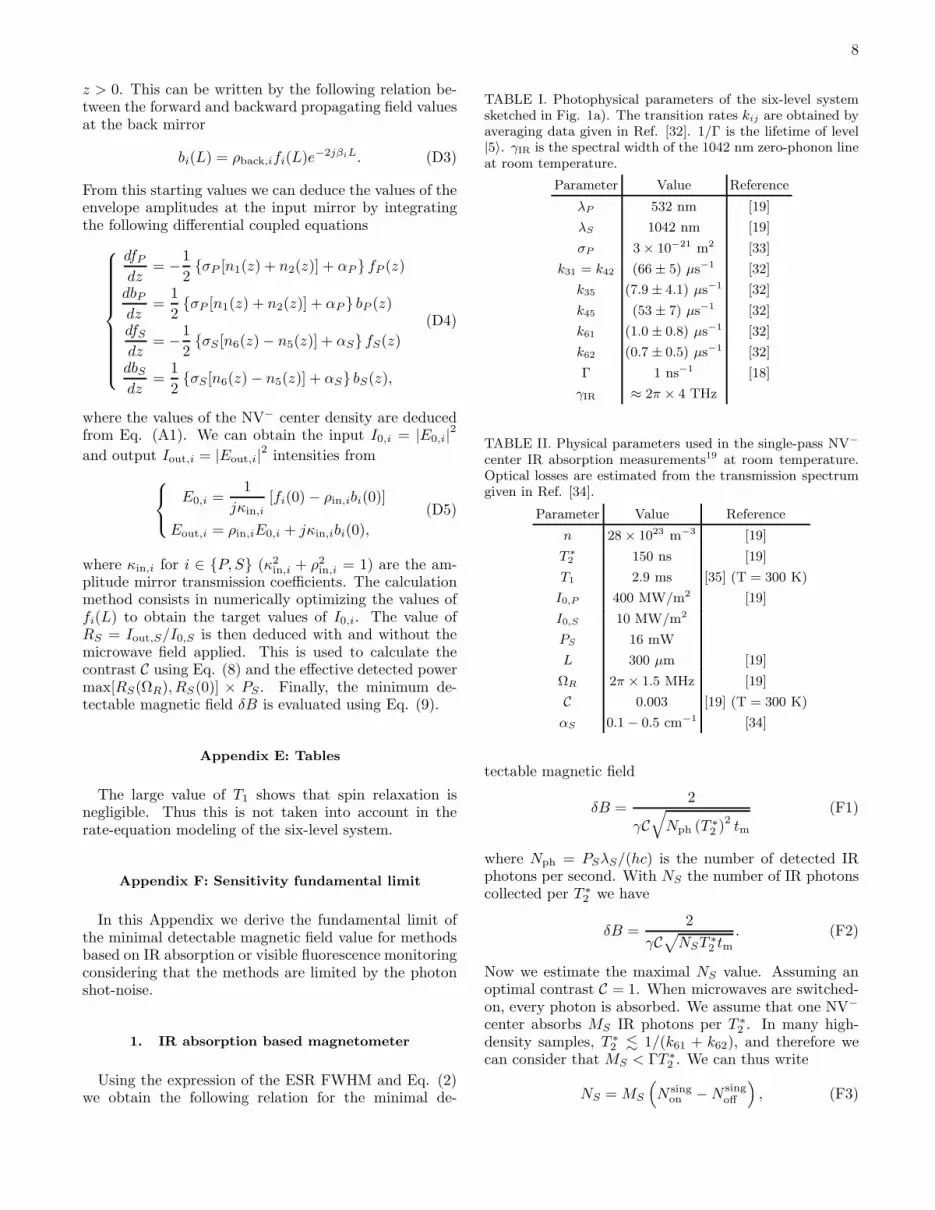
TABLE I. Photophysical parameters of the six-level systemsketched in Fig. 1a). The transition rates kij are obtained byaveraging data given in Ref. [32]. 1/Γ is the lifetime of level|5〉. γIR is the spectral width of the 1042 nm zero-phonon lineat room temperature.
Parameter Value Reference
λP 532 nm [19]
λS 1042 nm [19]
σP 3× 10⁻²¹ m2 [33]
k31 = k42 (66± 5) µs−1 [32]
k35 (7.9± 4.1) µs−1 [32]
k45 (53± 7) µs−1 [32]
k61 (1.0± 0.8) µs−1 [32]
k62 (0.7± 0.5) µs−1 [32]
Γ 1 ns−1 [18]
γIR ≈ 2π × 4 THz
TABLE II. Physical parameters used in the single-pass NV−
center IR absorption measurements19 at room temperature.Optical losses are estimated from the transmission spectrumgiven in Ref. [34].
Parameter Value Reference
n 28× 1023 m−3 [19]
T ∗
2 150 ns [19]
T1 2.9 ms [35] (T = 300 K)
I0,P 400 MW/m2 [19]
I0,S 10 MW/m2
PS 16 mW
L 300 µm [19]
ΩR 2π × 1.5 MHz [19]
C 0.003 [19] (T = 300 K)
αS 0.1− 0.5 cm−1 [34]
tectable magnetic field
δB =2
γC√
Nph (T ∗
2 )2 tm
(F1)
where Nph = PSλS/(hc) is the number of detected IRphotons per second. With NS the number of IR photonscollected per T ∗
2 we have
δB =2
γC√
NST ∗
2 tm. (F2)
Now we estimate the maximal NS value. Assuming anoptimal contrast C = 1. When microwaves are switched-on, every photon is absorbed. We assume that one NV−
center absorbs MS IR photons per T ∗
2 . In many high-density samples, T ∗
2 . 1/(k61 + k62), and therefore wecan consider that MS < ΓT ∗
2 . We can thus write
NS = MS
(
N singon −N sing
off
)
, (F3)
9
where N singon is the number of NV− centers in the singlet
state when the microwave are switched-on and N singoff the
number of NV− centers in the singlet for switched-offmicrowaves. This gives the number of photons whichcan be detected when the microwaves are switched-off
NS = MSN
[(
3
4× P35 +
1
4× P45
)
− P35
]
, (F4)
where N = nV is the number of centers with P35 =k35/(k35 + k31) being the probability that NV− centersin level |3〉 (ms = 0) decay to the singlet and P45 =k45/(k45+ k42) the probability that NV− centers in level|4〉 (ms = ±1) decay to the singlet. The 1
4and 3
4allow
to take into account that only one quarter of the NV−
centers are resonant with the microwaves24. We thenhave NS = RSMSN with
RS =1
4
(
k45k45 + k42
− k35k35 + k31
)
, (F5)
which is an approximated value for RS(ΩR) definedin section III B. Note that if the IR power is such asRSMS ≥ 1 the sensitivity is limited by the spin-noise.
2. Fluorescence measurement based magnetometer
For a magnetometer using the fluorescence signal mon-itoring and assuming that the ESR FWHM is 2/T ∗
2 , thesensitivity is given by22,23
δBf =2
γCf√
NfT ∗
2 tm, (F6)
where Cf is the contrast of the fluorescence signal andNf the number of collected photons per T ∗
2 . When themicrowaves are switched-off, the fluorescence signal is
proportional to P31 = k31/(k31 + k35) the probabilitythat NV− centers in level |3〉 decay immediately to level|1〉. When the microwaves are switched-on the fluores-cence signal is proportional to P42/4 + 3P31/4 whereP42 = k42/(k42 + k45) is the probability that NV− cen-ters in level |4〉 decay to level |2〉. Assuming that P31 ≈ 1(k35 ≪ k31), the contrast Cf is given by
Cf =1
4
(
k31k31 + k35
− k42k42 + k45
)
. (F7)
The number of collected photons per T ∗
2 is Nf = ηNMf
where η is the collection efficiency and Mf the numberof emitted photons per T ∗
2 by one NV− center. Since1/k35 < T ∗
2 we have Mf < k31/k35.
3. Comparison
The two techniques can be compared by calculating
δBf
δB≈ 1
Cf
√
RSMS
ηMf
, (F8)
where we assume C ≈ 1. For k35 ≪ k31 and k42 ≈ k45,we have RS ≈ Cf and thus
δBf
δB≈
√
MS
Mf
· 1
ηRS
. (F9)
Note that with values recalled in Tab. II, we obtainRS ≈8.5% which corresponds to the optimal case asuming atotal spin polarization. We deduce that MS ≤ 11 andMf ≤ 8. Assuming that MS = Mf and considering ahigh value of the collection efficiceny (η ≈ 0.47 has beenreported in Ref. [15]) we obtain δBf/δB ≈ 5.
∗ [email protected] F. Jelezko and J. Wrachtrup, phys. stat. sol. (a), 203, 3207(2006).
2 J. Taylor, P. Cappellaro, L. Childress, L. Jiang, D. Budker,P. Hemmer, A. Yacobi, R. Walsworth, and M. Lukin, Nat.Phys., 4, 810 (2008).
3 C. L. Degen, Appl. Phys. Lett., 92, 243111 (2008).4 J. Maze, P. Stanwix, J. Hodges, S. Hong, J. Taylor, P. Cap-pellaro, L. Jiang, M. Gurudev Dutt, E. Togan, A. Zibrov,A. Yacoby, R. Walworth, and L. M.D., Nature, 455, 644(2008).
5 G. Balasubramanian, I. Chan, R. Kolesov, M. Al-Hmoud,J. Tisler, C. Shin, C. Kim, A. Wojcik, P. Hemmer,A. Krueger, T. Hanke, A. Leitenstorfer, R. Bratschitsch,F. Jelezko, and J. Wrachtrup, Nature, 455, 648 (2008).
6 G. Balasubramanian, P. Neumann, D. Twitchen,M. Markham, R. Kolesov, N. Mizuochi, J. Isoya, J. Achard,J. Beck, J. Tissler, V. Jacques, P. Hemmer, F. Jelezko, andJ. Wrachtrup, Nature Mater., 8, 383 (2009).
7 N. D. Lai, D. Zheng, F. Jelezko, F. Treussart, and J.-F.Roch, Appl. Phys. Lett., 95, 133101 (2009).
8 B. J. Maertz, A. P. Wijnheijmer, G. D. Fuchs, M. E.Nowakowski, and D. D. Awschalom, Appl. Phys. Lett.,96, 092504 (2010).
9 S. Steinert, F. Dolde, P. Neumann, A. Aird, B. Naydenov,G. Balasubramanian, F. Jelezko, and J. Wrachtrup, Rev.Sci. Instr., 81, 043705 (2010).
10 L. M. Pham, D. L. Sage, P. L. Stanwix, T. K. Yeung,D. Glenn, A. Trifonov, P. Cappellaro, P. R. Hemmer,M. D. Lukin, H. Park, A. Yacoby, and R. L. Walsworth,New J. Phys., 13, 045021 (2011).
11 W. M. Itano, J. C. Bergquist, J. J. Bollinger, J. M. Gilli-gan, D. J. Heinzen, F. L. Moore, M. G. Raizen, and D. J.Wineland, Phys. Rev. A, 47, 3554 (1993).
12 J. P. Hadden, J. P. Harrison, A. C. Stanley-Clarke,L. Marseglia, Y.-L. D. Ho, B. R. Patton, J. L. O’Brien,and J. G. Rarity, Appl. Phys. Lett., 97, 241901 (2010).
10
13 P. Siyushev, F. Kaiser, V. Jacques, I. Gerhardt, S. Bischof,H. Fedder, J. Dodson, M. Markham, D. Twitchen,F. Jelezko, and J. Wrachtrup, Appl. Phys. Lett., 97,241902 (2010).
14 L. Marseglia, J. P. Hadden, A. C. Stanley-Clarke, J. P.Harrison, B. Patton, Y.-L. D. Ho, B. Naydenov, F. Jelezko,J. Meijer, P. R. Dolan, J. M. Smith, J. G. Rarity, and J. L.O’Brien, Appl. Phys. Lett., 98, 133107 (2011).
15 D. Le Sage, L. M. Pham, N. Bar-Gill, C. Belthangady,M. D. Lukin, A. Yacoby, and R. L. Walsworth, Phys.Rev. B, 85, 121202 (2012).
16 P. Maletinsky, S. Hong, M. Grinolds, B. Hausmann,M. Lukin, R. Walsworth, M. Loncar, and A. Yacoby, Na-ture Nanotech., 7, 320 (2012).
17 L. J. Rogers, S. Armstrong, M. J. Sellars, and N. B. Man-son, New J. Phys., 10, 103024 (2008).
18 V. M. Acosta, A. Jarmola, E. Bauch, and D. Budker,Phys. Rev. B, 82, 201202 (2010).
19 V. M. Acosta, E. Bauch, A. Jarmola, L. J. Zipp, M. P.Ledbetter, and D. Budker, Appl. Phys. Lett., 97, 174104(2010).
20 G. Berden, R. Peeters, and G. Meijer, Int. Rev. Phys.Chem., 19, 565 (2000).
21 D. Budker and M. Romalis, Nat. Phys., 3, 227 (2007).22 A. Dreau, M. Lesik, L. Rondin, P. Spinicelli, O. Arcizet,
J.-F. Roch, and V. Jacques, Phys. Rev. B, 84, 195204(2011).
23 L. Rondin, J.-P. Tetienne, P. Spinicelli, C. D. Savio,K. Karrai, G. Dantelle, A. Thiaville, S. Rohart, J.-F. Roch,and V. Jacques, Appl. Phys. Lett., 100, 153118 (2012).
24 L. M. Pham, N. Bar-Gill, D. Le Sage, C. Belthangady,A. Stacey, M. Markham, D. J. Twitchen, M. D. Lukin,
and R. L. Walsworth, Phys. Rev. B, 86, 121202 (2012).25 Y. Dumeige, S. Trebaol, L. Ghisa, T. K. N. Nguyen,
H. Tavernier, and P. Feron, J. Opt. Soc. Am. B, 25, 2073(2008).
26 J. Danckaert, K. Fobelets, I. Veretennicoff, G. Vitrant,and R. Reinisch, Phys. Rev. B, 44, 8214 (1991).
27 Y. Kubo, C. Grezes, A. Dewes, T. Umeda, J. Isoya,H. Sumiya, N. Morishita, H. Abe, S. Onoda, T. Ohshima,V. Jacques, A. Dreau, J.-F. Roch, I. Diniz, A. Auffeves,D. Vion, D. Esteve, and P. Bertet, Phys. Rev. Lett., 107,220501 (2011).
28 Y. Dumeige, R. Alleaume, P. Grangier, F. Treussart, andJ.-F. Roch, New J. Phys., 13, 025015 (2011).
29 B. J. M. Hausmann, B. Shields, Q. Quan, P. Maletinsky,M. McCutcheon, J. T. Choy, T. M. Babinec, A. Kubanek,A. Yacoby, M. D. Lukin, and M. Loncar, Nano Lett., 12,1578 (2012).
30 G. Lerondel and R. Romestain, Appl. Phys. Lett., 74, 2740(1999).
31 B. Koslowski, S. Strobel, and P. Ziemann, Diamond andRelat. Mater., 9, 1159 (2000).
32 J.-P. Tetienne, L. Rondin, P. Spinicelli, M. Chipaux, T. De-buisschert, J.-F. Roch, and V. Jacques, New J. Phys., 14,103033 (2012).
33 T.-L. Wee, Y.-K. Tzeng, C.-C. Han, H.-C. Chang,W. Fann, J.-H. Hsu, K.-M. Chen, and Y.-C. Yu, J. Phys.Chem. A, 111, 9379 (2007).
34 V. M. Acosta, E. Bauch, M. P. Ledbetter, C. Santori,K.-M. C. Fu, P. E. Barclay, R. G. Beausoleil, H. Linget,J. F. Roch, F. Treussart, S. Chemerisov, W. Gawlik, andD. Budker, Phys. Rev. B, 80, 115202 (2009).
35 A. Jarmola, V. M. Acosta, K. Jensen, S. Chemerisov, andD. Budker, Phys. Rev. Lett., 108, 197601 (2012).