lucas, francis, and teresa lingan-debuque. philippine agriculture situationer
TRANSCRIPT
TABLE OF CONTENTS
Chapter 1 Poverty and the Millennium Development Goals ............... 2
Chapter 2 National Agriculture Situationers ............................................. 7India ............................................................................................................... 8
Indonesia ..................................................................................................... 45
Philippines .................................................................................................. 60
Chapter 3 Project Site Profiles ..................................................................... 8 3
Khamkalan and Parmalpur
Kaimur, Bihar, India .................................................................................... 84
Moravapalli and Kothapalli
Pulicherla Mandal, Chitoor District, Andra Pradesh, India .................. 89
Banjaroya, Banjarasi, Jatisarono, Pagerharjo, Giripurwo and Hargorejo
Kulon Progo, Jogyakarta, Indonesia ........................................................ 93
Banjarnegara, Punggelan and Paseh Sub-Districts
Propinsi Jateng, Indonesia ........................................................................ 96
Bgys. Sinayawan and Tongantongan
Valencia City, Bukidnon, Philippines ...................................................... 100
Brgys. Tuato and Tual
Pres. Quirino, Sultan Kudarat, Philippines ............................................ 104
Chapter 4 Site Development Plans .......................................................... 1 0 9
Khamkalan and Parmalpur
Kaimur, Bihar, India .................................................................................. 110
Moravapalli and Kothapalli
Pulicherla Mandal, Chitoor District, Andra Pradesh, India ................ 116
Banjaroya, Banjarasi, Jatisarono, Pagerharjo, Giripurwo and Hargorejo
Kulon Progo, Jogyakarta, Indonesia ...................................................... 122
Banjarnegara, Punggelan and Paseh Sub-Districts
Propinsi Jateng, Indonesia ...................................................................... 132
Bgys. Sinayawan and Tongantongan
Valencia City, Bukidnon, Philippines ...................................................... 139
Brgys. Tuato and Tual
Pres. Quirino, Sultan Kudarat, Philippines ............................................ 148
Chapter 5 Preliminary Impact Assessment Report and Conclusions .............. 155
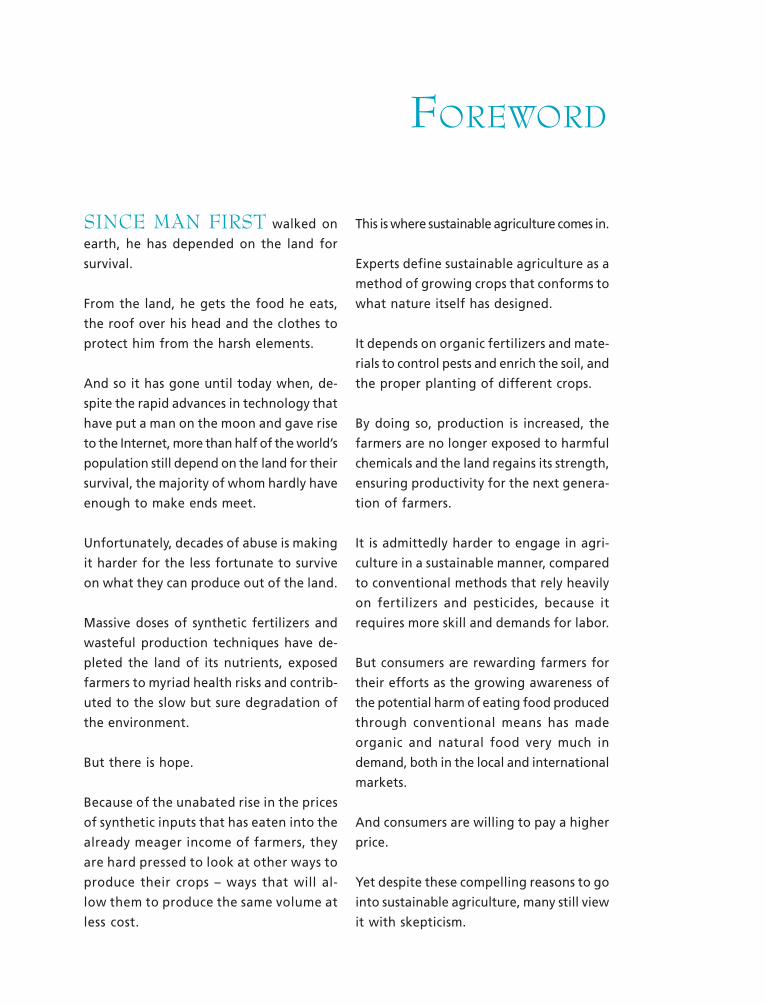
SINCE MAN FIRST walked on
earth, he has depended on the land for
survival.
From the land, he gets the food he eats,
the roof over his head and the clothes to
protect him from the harsh elements.
And so it has gone until today when, de-
spite the rapid advances in technology that
have put a man on the moon and gave rise
to the Internet, more than half of the world’s
population still depend on the land for their
survival, the majority of whom hardly have
enough to make ends meet.
Unfortunately, decades of abuse is making
it harder for the less fortunate to survive
on what they can produce out of the land.
Massive doses of synthetic fertilizers and
wasteful production techniques have de-
pleted the land of its nutrients, exposed
farmers to myriad health risks and contrib-
uted to the slow but sure degradation of
the environment.
But there is hope.
Because of the unabated rise in the prices
of synthetic inputs that has eaten into the
already meager income of farmers, they
are hard pressed to look at other ways to
produce their crops – ways that will al-
low them to produce the same volume at
less cost.
FOREWORD
This is where sustainable agriculture comes in.
Experts define sustainable agriculture as a
method of growing crops that conforms to
what nature itself has designed.
It depends on organic fertilizers and mate-
rials to control pests and enrich the soil, and
the proper planting of different crops.
By doing so, production is increased, the
farmers are no longer exposed to harmful
chemicals and the land regains its strength,
ensuring productivity for the next genera-
tion of farmers.
It is admittedly harder to engage in agri-
culture in a sustainable manner, compared
to conventional methods that rely heavily
on fertilizers and pesticides, because it
requires more skill and demands for labor.
But consumers are rewarding farmers for
their efforts as the growing awareness of
the potential harm of eating food produced
through conventional means has made
organic and natural food very much in
demand, both in the local and international
markets.
And consumers are willing to pay a higher
price.
Yet despite these compelling reasons to go
into sustainable agriculture, many still view
it with skepticism.
Can sustainable agriculture really deliver on
its promise of higher production and im-
proved income for the farmers when con-
ventional wisdom supports the use of syn-
thetic inputs?
The Asia Japan Partnership Network for
Poverty Reduction believes that it can.
To prove it, it has embarked on a two-year
project to determine whether sustainable
agriculture techniques have helped improve
the lives of six chosen pilot sites in India,
Indonesia and the Philippines.
While AJPN admits that two years is not
enough to make definite conclusions, the
results are nevertheless encouraging enough
to make AJPN and partner organizations
and local government units persevere with
their efforts to promote sustainable agri-
culture.
The results are given in great detail in this
publication that documents the experience
in the pilot sites and the efforts put in by
the farmers to improve their lives and those
of their families, while protecting the land
that they depend on so heavily.
AJPN hopes that by the example of the
intrepid farmers and partner organiza-
tions that have made great strides toward
full adoption of sustainable agriculture
techniques, others may learn from their
example.
Future generations are depending on it.
To the benefactors of the project, especially
the Government of Japan and the UNDP
offices in the Philippines and in New York
that have guided us in project implementa-
tion, we convey our deep appreciation for
their assistance. To our project partners, their
farming communities, the AJPN network,
especially Mr. Michio Ito, and our short-term
consultants, we sincerely acknowledge their
contribution in making this project a success.
We would also like to thank Ms. Tina Arceo-
Dumlao for editing the papers, Ms. Liza
Almojuela for making the layout and Mr.
Jupito for the cover design.
All these would not have been possible
without the diligence and commitment of
the project team – Ms. Faina L Diola, Ms.
Mary Grace Santos and Ms. Joy Dumalanta
– who continue to work for the well be-
ing of the farmers.
ROEL RAVANERAAJPN Project Coordinator
This publication is made possible with the funding support of
the United Nations Development Programme (UNDP).
Editor
Ma. Cristina Arceo–Dumlao
Inside Page Layout Artist
Maria Liza S. Almojuela
Cover Design
Jupito Tan
Proofreader
Lanelyn R. Carillo
Copyright 2005Asia–Japan Partnership Network for Poverty Reduction (AJPN)
c/o ANGOC, 6–A Malumanay St.
UP Village, Diliman
Quezon City 1103
Philippines
Telefax: (63-2) 9283882
Email: [email protected]
Asia-Japan Partnership Network for Poverty Reduction (AJPN)
The AJPN is a consortium of national and regional NGO networks and civil so-
ciety organizations working actively on various poverty reduction initiatives. It
aims to promote and contribute to the reduction by half of the Asian people
living in poverty by 2015 and to improve quality of life.
AJPN thrives on the commitment of Asian and Japanese NGOs to exchange in-
formation and collaborate in implementing field level initiatives while linking
this to policy advocacy work. It promotes the use of participatory approaches
in the development of site-specific interventions as perceived by the commu-
nities themselves.
AJPN focuses its interventions on three program areas, namely: basic edu-
cation and human resource development, sustainable agriculture and micro
finance.
Asian NGO Coalition for Agrarian Reform and Rural Development (ANGOC)
The ANGOC is a regional organization of 21 network and regional networks of
non-government organizations (NGOs) from 11 countries actively engaged in
food security, agrarian reform, sustainable agriculture and rural development
activities. Its member-networks have an effective reach of some 3,000 NGOs
throughout the region. Its mission is to create a policy and social environment
that enables Asian and rural poor communities to exercise their rights to par-
ticipatory development, gain access to and control of their natural resources,
and engage in sustainable livelihoods while drawing from Asia’s rich spiritual
and cultural traditions.
United Nations Development Programme (UNDP)
UNDP is the UN’s global development network, an organization advocating for
change and connecting countries to knowledge, experience and resources to
help people build a better life. We are on the ground in 166 countries, working
with them on their own solutions to global and national development chal-
lenges. As they develop local capacity, they draw on the people of UNDP and
wide range of partners.
AJPN logo
ANGOC logo
UNDP logo

Enhancing Capacities on Sustainable Agriculture for Poverty Reduction 1
chapter
2 Poverty and the Millennium Development Goals
Asia–Japan Partnership Network for Poverty Reduction (AJPN)
LIZA, AN AETA from a village at the foot
of Mt. Pinatubo in Zambales, Philippines, of-
ten went to school hungry because her par-
ents’ income as farmers was not enough to
support her and her four siblings.
She also worked as a health worker in the
village to have a little allowance to keep her
in school. It was not nearly enough to meet
her needs, so she was forced to stop school
to look for another job.
Liza ended up a domestic helper in the Phil-
ippines’ capital of Metro Manila, around 160
kilometers away from her hometown.
In Tondo, Manila, 19-year old Lovelyn Bacani
who sells slippers at the public market, still
dreams of becoming a high school teacher.
So she saves a little of her income to pursue
her studies.
Her mother had died of skin cancer and her
father could not raise enough money from
farming to fend for her and her four other
siblings, forcing her to stop school after get-
ting her high school diploma.
Liza and Lovelyn’s stories are unfortunately
shared by millions of others who are consid-
ered among the world’s extremely poor, or
those who live on less than $1 a day.
Never before in the history of man has there
been so many hungry and poor people in the
world, this despite the significant advances
in science and technology.
Consider these disturbing facts:
799 million people go to bed hungry
every day.
Around 115 million of the 680 million
children who are supposed to go to school
are not enrolled, mostly girls, because
their parents do not have enough money.
879 million people are not able to read
and write, mostly women.
Every day, more than 30,000 of the world’s
children die from preventable diseases,
such as malaria and tuberculosis.
In 2002, 3.1 million people died of AIDS
and around 42 million are still suffer-
ing from it.
1.1 billion of the world’s population, or
about one in five, do not have access
to safe water.
It is also a fact that two of three of the world’s
poor are in Asia. Most of them live in rural
areas and are dependent on agriculture for
a living, but lack access to land and suffer
from low productivity.
Hardly anyone thinks that they will ever get
out of the pits of poverty.
POVERTY AND THE
MILLENNIUM
DEVELOPMENT GOALS
Enhancing Capacities on Sustainable Agriculture for Poverty Reduction 3
But such a situation of having so many poor
people in a world that is also characterized
by excess food production in industrialized
countries can not continue if the world is to
survive to the next millennium.
The heads of the world’s governments re-
alized this and decided to finally act together
to alleviate poverty, the biggest scourge of
the 21st century.
MILLENNIUM DEVELOPMENT GOALS
Thus, at the start of the new millennium six
years ago, the world’s governments unified
to make a remarkable promise to the victims
of global poverty.
Meeting at the United Nations, they signed
the Millennium Declaration, a solemn pledge
“to free our fellow men, women and chil-
dren from the abject and dehumanizing con-
ditions of extreme poverty.”
In short, they wanted to make poverty history.
The declaration provides a bold mission
rooted in a shared commitment to universal
human rights and social justice backed by
clear time-bound targets.
These targets, popularly known as the Mil-
lennium Development Goals, include halv-
ing extreme poverty, cutting child deaths,
providing all of the world’s children with
an education, rolling back infectious diseases
and forging a new global partnership to
deliver results.
All these targets are expected to be met by 2015.
There have been significant steps toward
meeting these ambitious goals, but with just
nine years left to meet the deadline, most of
the targets are in danger of not being met,
particularly in the area of poverty reduction,
the overarching goal of the MDGs.
But there is hope.
This comes from the increasing recognition
on the part of governments and decision
makers of the role that a dynamic agricul-
ture sector can play in poverty and hunger
reduction.
The bulk of the poor, after all, depend on
agriculture for a living. As agriculture devel-
ops, so will the farmers’ standard of living.
Even the United Nations has realized this
basic truth.
In 2005, the UN Millennium Project Report
concluded that “the global epicenter of ex-
treme poverty is the smallholder farmer.”
A report by the UN Secretary General recog-
nized agricultural reform as “one of the ma-
jor means of wealth creation and income re-
distribution in the newly industrialized coun-
tries of East Asia.”
The Food and Agriculture Organization
added that the battle to achieve the MDGs,
in particular the goals on poverty and hun-
ger reduction, would be lost or won in the
rural areas of the developing countries.
4 Poverty and the Millennium Development Goals
Asia–Japan Partnership Network for Poverty Reduction (AJPN)
RURAL DEVELOPMENT
The promotion of rural development increases
employment opportunities in rural areas, re-
duces regional income disparities, stems pre-
mature rural-urban migration and ultimately re-
duces poverty at the very source, the FAO said.
Agriculture has not always been considered
a priority. In fact, the opposite is true: it has
been neglected and the people that depend
on it left to fend for themselves.
It is partly due to this neglect by governments
that rural poverty in Asia has grown over the
last 10 to 20 years.
World Bank data showed that its investments
in agriculture declined from around $50 bil-
lion in 1980 to just $15 billion today, or from
around 30 percent of its total loan portfolio
to as low as 10 percent.
Even development agencies seemed to have
taken agriculture for granted.
In the 1990s, multilateral donor investments
in agriculture fell by 58 percent and bilat-
eral investments by 36 percent.
Governments and development agencies are
fortunately taking a fresh look at agricul-
ture and the opportunity that it presents
to achieving the MDGs.
So too are non-government organizations
and development organizations.
In 2001, more than a hundred representatives
of NGOs, workers unions, universities and civil
society groups met in Tokyo to discuss how
to support the achievement of the MDGs.
Focusing on their experiences and exper-
tise, they decided to focus on three program
areas: basic education and human resource
development; microfinance and sustainable
agriculture.
AJPN
To follow up on their commitments, they
formed a loose coalition called the Asia Japan
Partnership Network for Poverty Reduction.
It aims to promote and contribute to the halv-
ing of the number of Asian people living in
poverty by 2015 and the improvement of
their quality of life.
And while other agencies have focused on
merely raising agriculture production, AJPN
argues for the promotion of sustainable ag-
riculture, one that increases production while
protecting the environment, ultimately rais-
ing the farmers’ income.
Some policy makers have questioned the ca-
pacity of sustainable agriculture to supply the
food needs of the increasing population, and
consequently the increasing ranks of the poor.
The yields are low and the technology back-
ward. It is labor intensive and the products
are not attractive market, they said.
The allegations are not entirely correct and
Enhancing Capacities on Sustainable Agriculture for Poverty Reduction 5
SUSTAINABLE AGRICULTURE
Proponents argue that sustainable agricul-
ture stands a better chance of providing the
basic needs of rural poor communities since
it is not dependent on expensive chemicals
and fertilizers.
Its potential lies in its indigenous local agri-
cultural traditions that are ecologically sound,
culturally appropriate and cost-effective.
Yet, the question remains: Is sustainable agri-
culture an effective tool for poverty reduction?
It is this fundamental question that AJPN
has tried to answer through its “Enhanc-
ing Capacities on Sustainable Agriculture
for Poverty Reduction” project.
The Government of Japan provided the
needed funds, which were coursed through
the United Nations Development Program.
The timing could not be better as the un-
abated rise in the cost of chemical inputs
and the increasing demand for natural and
organic products in the market have forced
policy makers to look more closely at adopt-
ing sustainable agriculture practices.
It is slowly being recognized that farmers,
who comprise the majority of the poor
people in Asia, can increase their income
by adopting sustainable farming practices
while taking advantage of premium prices
for organic products.
Demand for natural and organic products
have increased in the last five years by 15-20
percent, as consumers become more aware
of the ill effects of chemically-produced food.
have been proven wrong in a number of sci-
entific studies. But what is unfortunate is that
agriculture development has come to mean
increasing productivity alone.
This thinking has dominated agriculture poli-
cies and programs, but as the growth in the
number of poor people has proven, modern
agriculture programs have not been of much
help, despite all that support.
While productivity is an important goal, sta-
bility and sustainability of the farming sys-
tems are equally important.
In sustainable agriculture, diversification and
integration are integral components of pro-
duction technologies.
Diversification stabilizes the production sys-
tem as natural processes come into play,
while integration reduces production cost
and maximizes the output.
The recent study conducted by Jules Pretty
of the University of Essex in England, in co-
ordination with colleagues in Thailand,
China, Sri Lanka and Mexico, also belies alle-
gations that yields of sustainable agriculture
technologies are low.
The study covering 286 farm projects in 57
countries concluded that “crop yields on
farms in developing countries that used sus-
tainable agriculture rose nearly 80 percent
in four years.”
6 Poverty and the Millennium Development Goals
Asia–Japan Partnership Network for Poverty Reduction (AJPN)
This demand has pushed up prices, giving
farmers an incentive to consider sustainable
agriculture that produces organic products.
A number of Asian governments have sup-
ported this trend toward organic food by for-
mulating organic standards and setting up cer-
tification processes over the last three years.
NGOs and farmer organizations played key
roles in fostering a more friendly policy envi-
ronment for organic food and sustainable ag-
riculture practices as they have the experience.
AJPN is one of these organizations.
With this project, AJPN aims to further contrib-
ute to the movement toward sustainable agri-
culture by seeing exactly how natural farming
practices can work at the farmers’ level.
Six project sites were selected: Bihar and
Andhra Pradesh in India; Central Java and
Jogjakarta in Indonesia; and Bukidnon and
Sultan Kudarat in the Philippines.
The knowledge of and capabilities of the com-
munities in these sites to implement different
sustainable agriculture techniques were en-
hanced. Development plans were devised
based on the unique set of capabilities of the
farmers in these areas and the resources that
they have at their disposal.
The communities were involved at the start
in coming up with the development plans to
enhance their sense of ownership of the
project, which is vital if the projects’ gains
are to be sustained in the long term.
ENCOURAGING RESULTS
The two-year project came to an end in 2006
and this paper attempts to document the ex-
perience at these sites, from which other
AJPN members can learn.
As to the question of whether sustainable
agriculture is viable for poverty reduction,
the initial answer is yes, it is.
This paper provides proof by looking more
closely at the project sites, what the farmers
there have done as they adopted sustainable
agriculture techniques, the results of their
efforts and finally, the lessons learned and
the recommendations to those who want to
follow the example of the farmers that par-
ticipated in the project.
This puts particular focus on how sustainable
agriculture has contributed to reducing pov-
erty in these sites.
It looks at the economic benefits measured
in terms of net income and analyzes various
factors contributing to the increase or de-
crease of net income, particularly yield, pro-
duction cost and the price of products.
While two years is not enough to make de-
finitive conclusions, the results have been en-
couraging: They show the unmistakable
trend of farmers and their communities do-
ing better than they did before the field stud-
ies began in 2004, putting them firmly on
their way out of the clutches of poverty.

Enhancing Capacities on Sustainable Agriculture for Poverty Reduction 7
chapter
Asia–Japan Partnership Network for Poverty Reduction (AJPN)
8 National Agriculture Situationers
INDIANational AgricultureSituationerPrepared by: Association of Voluntary Agencies for
Rural Development (AVARD)Edited by: Teresa Lingan–Debuque
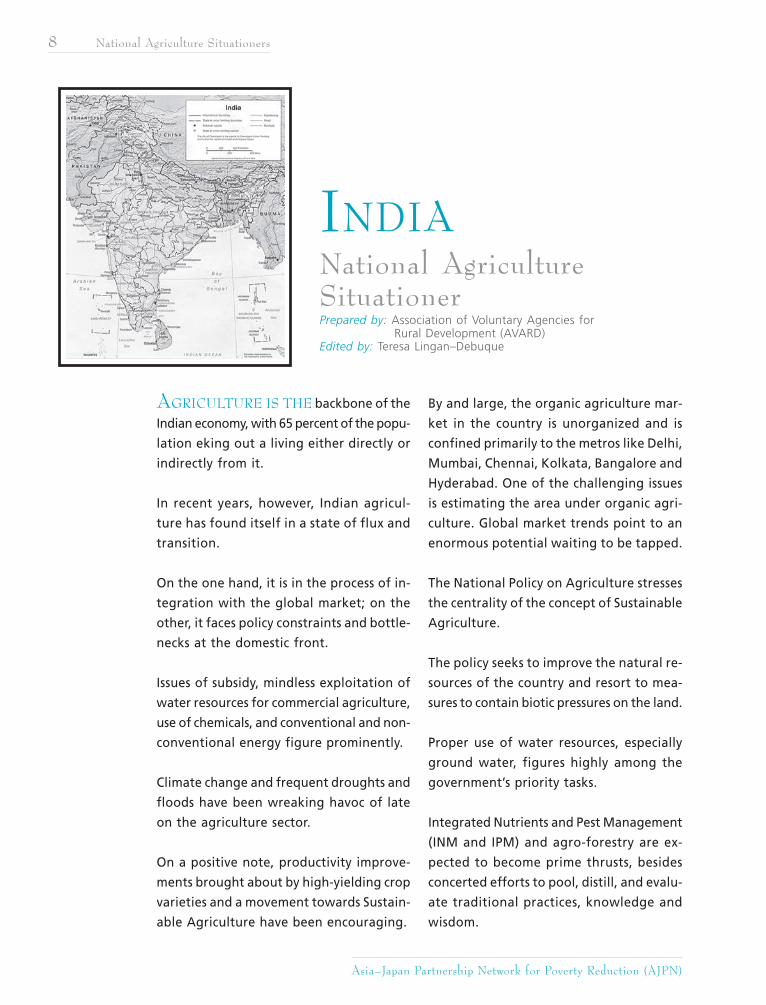
AGRICULTURE IS THE backbone of the
Indian economy, with 65 percent of the popu-
lation eking out a living either directly or
indirectly from it.
In recent years, however, Indian agricul-
ture has found itself in a state of flux and
transition.
On the one hand, it is in the process of in-
tegration with the global market; on the
other, it faces policy constraints and bottle-
necks at the domestic front.
Issues of subsidy, mindless exploitation of
water resources for commercial agriculture,
use of chemicals, and conventional and non-
conventional energy figure prominently.
Climate change and frequent droughts and
floods have been wreaking havoc of late
on the agriculture sector.
On a positive note, productivity improve-
ments brought about by high-yielding crop
varieties and a movement towards Sustain-
able Agriculture have been encouraging.
By and large, the organic agriculture mar-
ket in the country is unorganized and is
confined primarily to the metros like Delhi,
Mumbai, Chennai, Kolkata, Bangalore and
Hyderabad. One of the challenging issues
is estimating the area under organic agri-
culture. Global market trends point to an
enormous potential waiting to be tapped.
The National Policy on Agriculture stresses
the centrality of the concept of Sustainable
Agriculture.
The policy seeks to improve the natural re-
sources of the country and resort to mea-
sures to contain biotic pressures on the land.
Proper use of water resources, especially
ground water, figures highly among the
government’s priority tasks.
Integrated Nutrients and Pest Management
(INM and IPM) and agro-forestry are ex-
pected to become prime thrusts, besides
concerted efforts to pool, distill, and evalu-
ate traditional practices, knowledge and
wisdom.
Enhancing Capacities on Sustainable Agriculture for Poverty Reduction 9
Despite showing positive signs, India’s or-
ganic agricultural market is not growing fast
enough to persuade a larger chunk of the
farming community to shift to organic farm-
ing and practices.
Some of the major stumbling blocks in
this regard are poor quality bio-inputs
in the market, and lack of proper infra-
structure for the distribution and stor-
age of bio-inputs, among others.
Bio-fertilizers are also perceived as less ef-
fective and as a result, the farmers are not
keen to adopt the new practice.
In addition, changing the cropping pat-
tern is a slow and time-consuming pro-
cess and, given that majority of Indian
farmers are illiterate, quite complicated.
On the flip side, the growing export mar-
ket, the price premium for organically pro-
duced crops, increasing involvement of pri-
vate companies in the field of agricultural
extension and greater government atten-
tion, is opening up new vistas in sustain-
able agriculture.
SITUATIONER
Agriculture has a vital role in the eco-
nomic development of India as it accounts
for 24.2 percent of the country’s gross
domestic product (GDP), employs 56.7
percent of the country’s work force, and
accounts for 14.7 percent of total export
earnings.
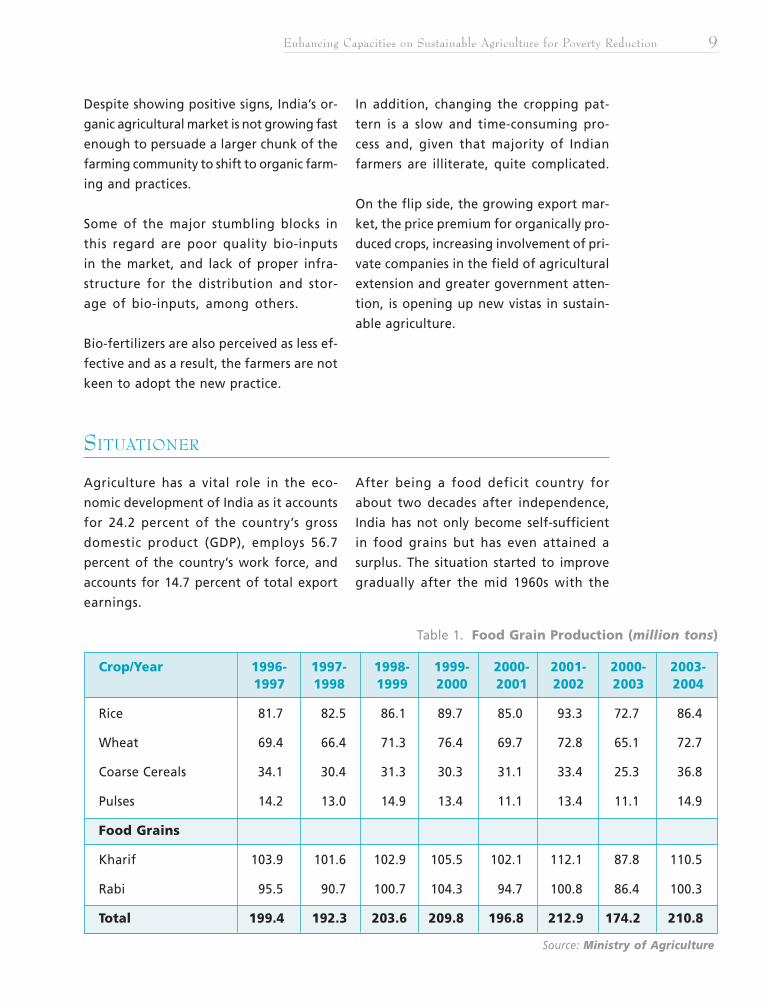
After being a food deficit country for
about two decades after independence,
India has not only become self-sufficient
in food grains but has even attained a
surplus. The situation started to improve
gradually after the mid 1960s with the
Table 1. Food Grain Production (million tons)
Source: Ministry of Agriculture
Crop/Year 1996- 1997- 1998- 1999- 2000- 2001- 2000- 2003-1997 1998 1999 2000 2001 2002 2003 2004
Rice 81.7 82.5 86.1 89.7 85.0 93.3 72.7 86.4
Wheat 69.4 66.4 71.3 76.4 69.7 72.8 65.1 72.7
Coarse Cereals 34.1 30.4 31.3 30.3 31.1 33.4 25.3 36.8
Pulses 14.2 13.0 14.9 13.4 11.1 13.4 11.1 14.9
Food Grains
Kharif 103.9 101.6 102.9 105.5 102.1 112.1 87.8 110.5
Rabi 95.5 90.7 100.7 104.3 94.7 100.8 86.4 100.3
Total 199.4 192.3 203.6 209.8 196.8 212.9 174.2 210.8
Asia–Japan Partnership Network for Poverty Reduction (AJPN)
10 National Agriculture Situationers
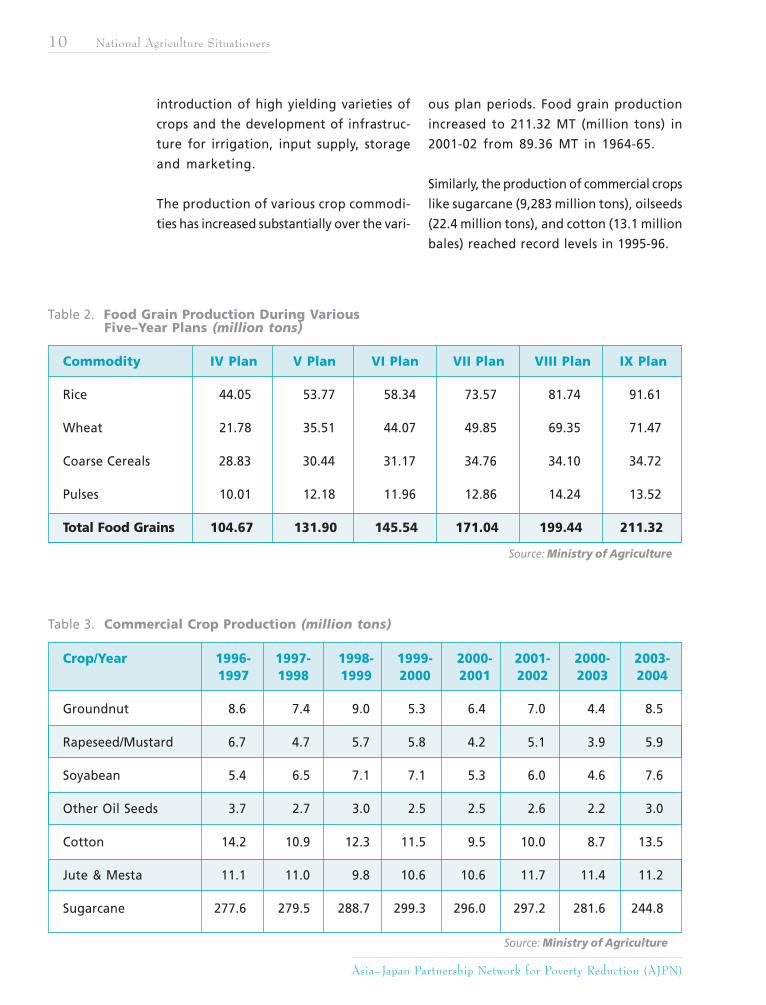
Table 3. Commercial Crop Production (million tons)
Crop/Year 1996- 1997- 1998- 1999- 2000- 2001- 2000- 2003-1997 1998 1999 2000 2001 2002 2003 2004
Groundnut 8.6 7.4 9.0 5.3 6.4 7.0 4.4 8.5
Rapeseed/Mustard 6.7 4.7 5.7 5.8 4.2 5.1 3.9 5.9
Soyabean 5.4 6.5 7.1 7.1 5.3 6.0 4.6 7.6
Other Oil Seeds 3.7 2.7 3.0 2.5 2.5 2.6 2.2 3.0
Cotton 14.2 10.9 12.3 11.5 9.5 10.0 8.7 13.5
Jute & Mesta 11.1 11.0 9.8 10.6 10.6 11.7 11.4 11.2
Sugarcane 277.6 279.5 288.7 299.3 296.0 297.2 281.6 244.8
introduction of high yielding varieties of
crops and the development of infrastruc-
ture for irrigation, input supply, storage
and marketing.
The production of various crop commodi-
ties has increased substantially over the vari-
ous plan periods. Food grain production
increased to 211.32 MT (million tons) in
2001-02 from 89.36 MT in 1964-65.
Similarly, the production of commercial crops
like sugarcane (9,283 million tons), oilseeds
(22.4 million tons), and cotton (13.1 million
bales) reached record levels in 1995-96.
Table 2. Food Grain Production During Various Five–Year Plans (million tons)
Commodity IV Plan V Plan VI Plan VII Plan VIII Plan IX Plan
Rice 44.05 53.77 58.34 73.57 81.74 91.61
Wheat 21.78 35.51 44.07 49.85 69.35 71.47
Coarse Cereals 28.83 30.44 31.17 34.76 34.10 34.72
Pulses 10.01 12.18 11.96 12.86 14.24 13.52
Total Food Grains 104.67 131.90 145.54 171.04 199.44 211.32
Source: Ministry of Agriculture
Source: Ministry of Agriculture
Enhancing Capacities on Sustainable Agriculture for Poverty Reduction 11
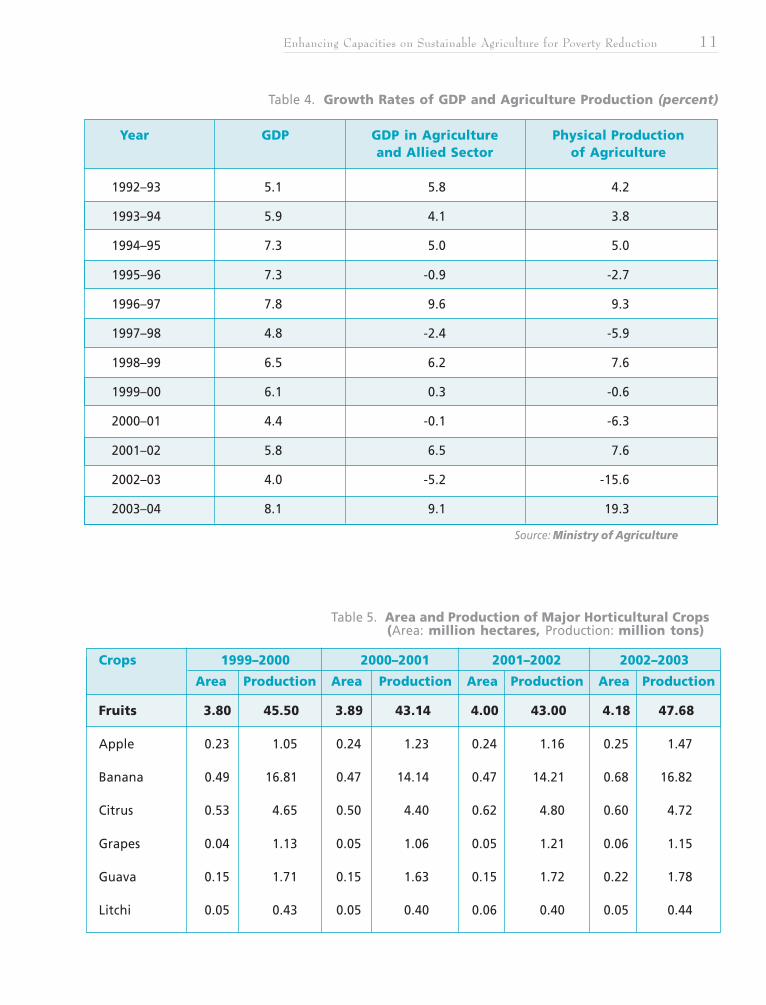
Table 5. Area and Production of Major Horticultural Crops (Area: million hectares, Production: million tons)
Crops 1999–2000 2000–2001 2001–2002 2002–2003
Area Production Area Production Area Production Area Production
Fruits 3.80 45.50 3.89 43.14 4.00 43.00 4.18 47.68
Apple 0.23 1.05 0.24 1.23 0.24 1.16 0.25 1.47
Banana 0.49 16.81 0.47 14.14 0.47 14.21 0.68 16.82
Citrus 0.53 4.65 0.50 4.40 0.62 4.80 0.60 4.72
Grapes 0.04 1.13 0.05 1.06 0.05 1.21 0.06 1.15
Guava 0.15 1.71 0.15 1.63 0.15 1.72 0.22 1.78
Litchi 0.05 0.43 0.05 0.40 0.06 0.40 0.05 0.44
Table 4. Growth Rates of GDP and Agriculture Production (percent)
Year GDP GDP in Agriculture Physical Productionand Allied Sector of Agriculture
1992–93 5.1 5.8 4.2
1993–94 5.9 4.1 3.8
1994–95 7.3 5.0 5.0
1995–96 7.3 -0.9 -2.7
1996–97 7.8 9.6 9.3
1997–98 4.8 -2.4 -5.9
1998–99 6.5 6.2 7.6
1999–00 6.1 0.3 -0.6
2000–01 4.4 -0.1 -6.3
2001–02 5.8 6.5 7.6
2002–03 4.0 -5.2 -15.6
2003–04 8.1 9.1 19.3
Source: Ministry of Agriculture
Asia–Japan Partnership Network for Poverty Reduction (AJPN)
12 National Agriculture Situationers
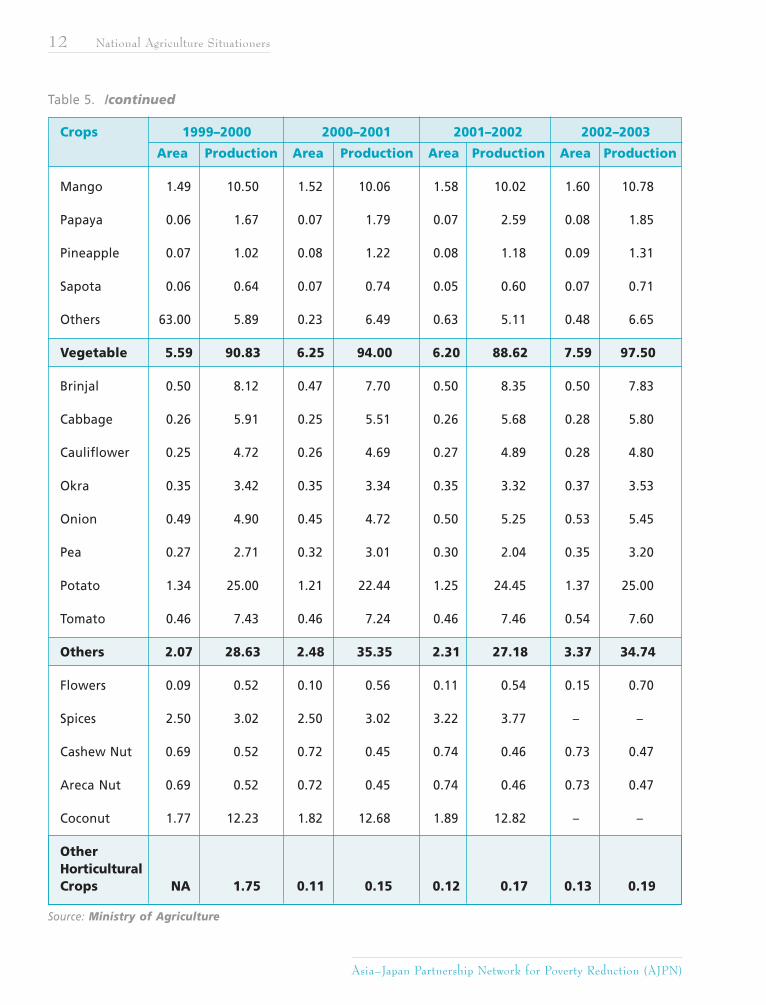
Table 5. /continued
Source: Ministry of Agriculture
Crops 1999–2000 2000–2001 2001–2002 2002–2003
Area Production Area Production Area Production Area Production
Mango 1.49 10.50 1.52 10.06 1.58 10.02 1.60 10.78
Papaya 0.06 1.67 0.07 1.79 0.07 2.59 0.08 1.85
Pineapple 0.07 1.02 0.08 1.22 0.08 1.18 0.09 1.31
Sapota 0.06 0.64 0.07 0.74 0.05 0.60 0.07 0.71
Others 63.00 5.89 0.23 6.49 0.63 5.11 0.48 6.65
Vegetable 5.59 90.83 6.25 94.00 6.20 88.62 7.59 97.50
Brinjal 0.50 8.12 0.47 7.70 0.50 8.35 0.50 7.83
Cabbage 0.26 5.91 0.25 5.51 0.26 5.68 0.28 5.80
Cauliflower 0.25 4.72 0.26 4.69 0.27 4.89 0.28 4.80
Okra 0.35 3.42 0.35 3.34 0.35 3.32 0.37 3.53
Onion 0.49 4.90 0.45 4.72 0.50 5.25 0.53 5.45
Pea 0.27 2.71 0.32 3.01 0.30 2.04 0.35 3.20
Potato 1.34 25.00 1.21 22.44 1.25 24.45 1.37 25.00
Tomato 0.46 7.43 0.46 7.24 0.46 7.46 0.54 7.60
Others 2.07 28.63 2.48 35.35 2.31 27.18 3.37 34.74
Flowers 0.09 0.52 0.10 0.56 0.11 0.54 0.15 0.70
Spices 2.50 3.02 2.50 3.02 3.22 3.77 – –
Cashew Nut 0.69 0.52 0.72 0.45 0.74 0.46 0.73 0.47
Areca Nut 0.69 0.52 0.72 0.45 0.74 0.46 0.73 0.47
Coconut 1.77 12.23 1.82 12.68 1.89 12.82 – –
OtherHorticulturalCrops NA 1.75 0.11 0.15 0.12 0.17 0.13 0.19
Enhancing Capacities on Sustainable Agriculture for Poverty Reduction 13
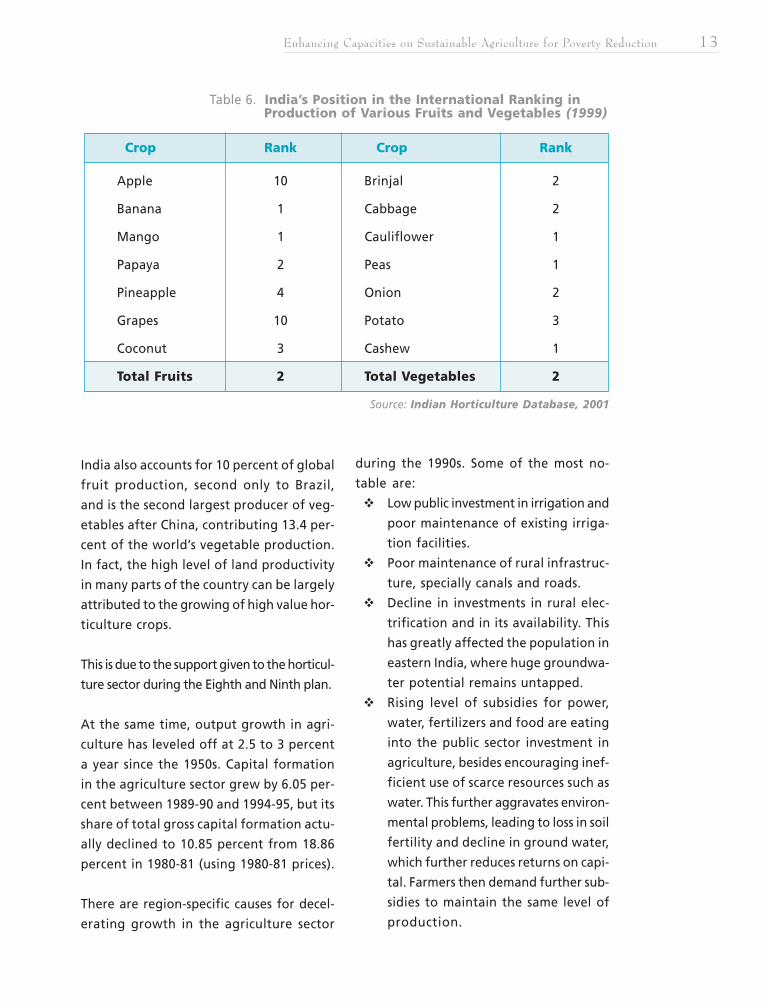
Table 6. India’s Position in the International Ranking in Production of Various Fruits and Vegetables (1999)
Source: Indian Horticulture Database, 2001
Crop Rank Crop Rank
Apple 10 Brinjal 2
Banana 1 Cabbage 2
Mango 1 Cauliflower 1
Papaya 2 Peas 1
Pineapple 4 Onion 2
Grapes 10 Potato 3
Coconut 3 Cashew 1
Total Fruits 2 Total Vegetables 2
India also accounts for 10 percent of global
fruit production, second only to Brazil,
and is the second largest producer of veg-
etables after China, contributing 13.4 per-
cent of the world’s vegetable production.
In fact, the high level of land productivity
in many parts of the country can be largely
attributed to the growing of high value hor-
ticulture crops.
This is due to the support given to the horticul-
ture sector during the Eighth and Ninth plan.
At the same time, output growth in agri-
culture has leveled off at 2.5 to 3 percent
a year since the 1950s. Capital formation
in the agriculture sector grew by 6.05 per-
cent between 1989-90 and 1994-95, but its
share of total gross capital formation actu-
ally declined to 10.85 percent from 18.86
percent in 1980-81 (using 1980-81 prices).
There are region-specific causes for decel-
erating growth in the agriculture sector
during the 1990s. Some of the most no-
table are:
Low public investment in irrigation and
poor maintenance of existing irriga-
tion facilities.
Poor maintenance of rural infrastruc-
ture, specially canals and roads.
Decline in investments in rural elec-
trification and in its availability. This
has greatly affected the population in
eastern India, where huge groundwa-
ter potential remains untapped.
Rising level of subsidies for power,
water, fertilizers and food are eating
into the public sector investment in
agriculture, besides encouraging inef-
ficient use of scarce resources such as
water. This further aggravates environ-
mental problems, leading to loss in soil
fertility and decline in ground water,
which further reduces returns on capi-
tal. Farmers then demand further sub-
sidies to maintain the same level of
production.
Asia–Japan Partnership Network for Poverty Reduction (AJPN)
14 National Agriculture Situationers
Inadequate credit support.
Continuing imbalanced use of N, P
and K fertilizers (6.69:2.59:1.0 in
2001-02 as against the desirable norm
of 4:2:1) and increasing deficiency
of micro-nutrients in soil.
Stringent controls on movement,
marketing, credit, stock and export of
agri- products that affect their prof-
itability. In the face of pressure from
the WTO, there is an apprehension that
without speedy domestic market re-
forms, attempts to access world mar-
kets would actually threaten the fu-
ture growth of Indian agriculture. The
classic case is that of sugar where im-
ports were opened at zero duty when
controls on domestic markets remained
widespread.
Growth in Total Factor Productivity
(TFP)1 appears to be decelerating,
suggesting a decline in the use of
technology.
Demand constraints (slow growth of
the urban economy, restrictions on
exports, lack of land reforms, failure
of poverty alleviation schemes, slow
growth in rural wages).
Controls on the agro processing in-
dustry.
Poor extension service.
Several changes have taken place in the
agriculture sector in recent years. For in-
stance, the contribution to output growth
of area expansion and yield increases has
changed significantly in the last 50 years.
Between 1950-51 and 1970-71, or before
the Green Revolution made such headway,
total cropland grew by 30 percent and the
index of yield per unit area, by 43 percent.
However, between 1970-71 and 1996-97,
the total area planted to crops shrank to
just 11 percent while yield growth shot up
to 61 percent, reflecting primarily the effects
of the Green Revolution.
Secondly, the contribution of the differ-
ent regions and crops to aggregate
growth has also changed.
1 Total Factor Productivity (TFP), which is a comprehensive measure of technical progress, has beendiscouraging. According to the World Bank (WB), India’s TFP registered negative growth (-0.59percent a year) in the first half of the 1990s compared to a healthy 1.39 per cent annual averagein the 1980s. The states of Assam, Gujarat, Haryana, Madhya Pradesh, and Rajasthan recordedlarger declines in TFP in the first half of the 1990s compared to the 1980s. Maharashtra and TamilNadu both registered a decline, while Andhra Pradesh and West Bengal saw positive though slowergrowth in the latter period. In contrast, the states of Bihar, Karnataka, and Kerala experienced anacceleration in TFP growth. Evidently, productivity growth is the source of increases in factor re-turns, including returns to labor. It is no surprise then that the slowdown in productivity growth hashad an impact on the average rate of growth of real wages in rural areas, which declined from ahealthy 3.56 per cent per annum in the 1990s to 0.77 per cent in 1990-93, during which Indiaexperienced an agricultural cum macroeconomic crisis (1991-92). Thereafter, though, except in1994-95, TFP has steadily increased every year.
Enhancing Capacities on Sustainable Agriculture for Poverty Reduction 15
For example, the eastern states of Assam,
Bihar, Orissa and West Bengal performed
dramatically better in the 1980s and 1990s
than they did in the previous three decades.
Oilseed production doubled in the last
decade, while the contribution of kharif
crops (mainly rice) has declined over the
years in relation to annual output.
In 1996-97, the output of kharif cereals
was 99 million tons compared to the rabi
output of 86 million tons. Near self-suf-
ficiency has been achieved, though at
low levels of consumption, with respect
to foodgrains and oilseeds.
Many of these changes were the result
of policies adopted at the time.
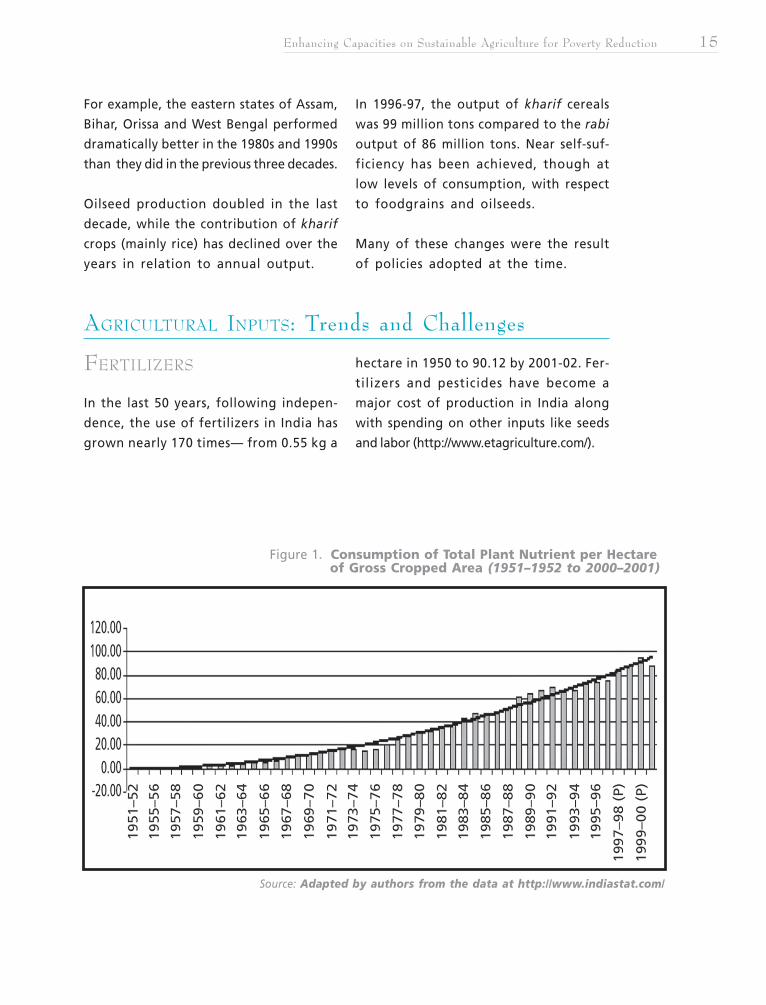
AGRICULTURAL INPUTS: Trends and Challenges
FERTILIZERS
In the last 50 years, following indepen-
dence, the use of fertilizers in India has
grown nearly 170 times— from 0.55 kg a
hectare in 1950 to 90.12 by 2001-02. Fer-
tilizers and pesticides have become a
major cost of production in India along
with spending on other inputs like seeds
and labor (http://www.etagriculture.com/).
Figure 1. Consumption of Total Plant Nutrient per Hectare of Gross Cropped Area (1951–1952 to 2000–2001)
Source: Adapted by authors from the data at http://www.indiastat.com/
Asia–Japan Partnership Network for Poverty Reduction (AJPN)
16 National Agriculture Situationers
Given the differences in the intensity of
agriculture and cropping patterns across
the country, there are wide variations in
fertilizer consumption in India.
For instance, states like Punjab, Andhra
Pradesh, Haryana, Karnataka, Tamilnadu,
West Bengal and Uttar Pradesh have very
high fertilizer consumption a hectare com-
pared to Rajasthan, Madhya Pradesh,
Himachal Pradesh, Orissa, Goa and the
Northeastern states. Per hectare fertilizer
use in Andhra Pradesh was as high as 179.2 kg in
2000-01, while in many Eastern states, it was less
than 10 kg a hectare. Unfortunately, this increase
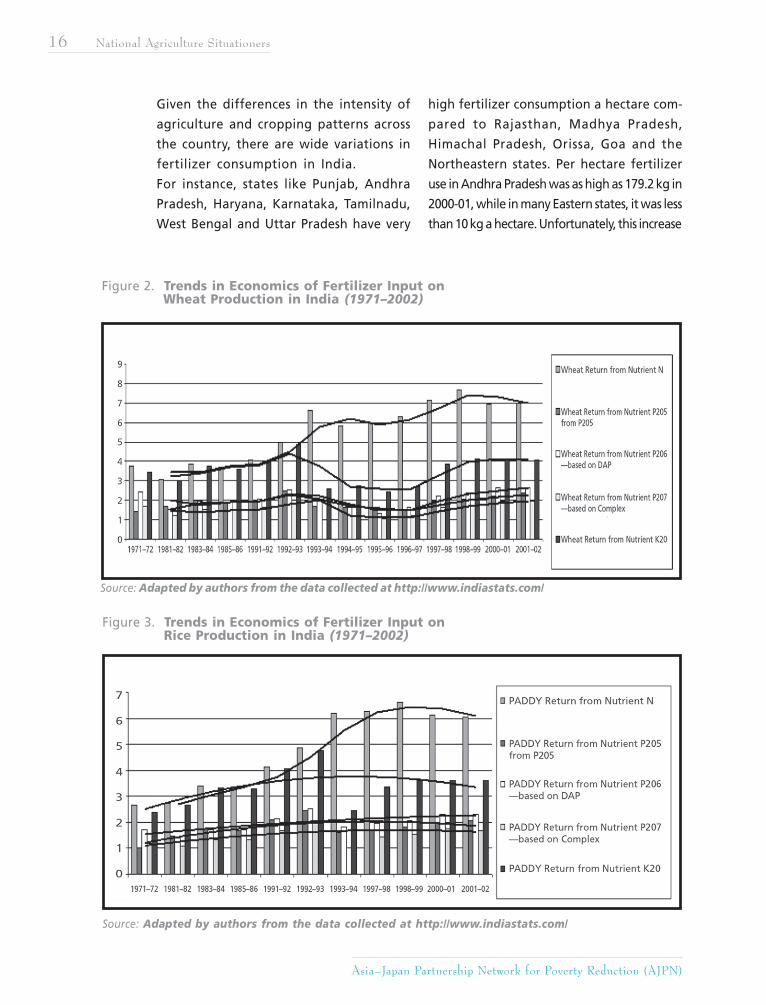
Figure 2. Trends in Economics of Fertilizer Input on Wheat Production in India (1971–2002)
Source: Adapted by authors from the data collected at http://www.indiastats.com/
Figure 3. Trends in Economics of Fertilizer Input on Rice Production in India (1971–2002)
Source: Adapted by authors from the data collected at http://www.indiastats.com/
Enhancing Capacities on Sustainable Agriculture for Poverty Reduction 17
in chemical usage has not always translated to
increased incomes for farmers (See Figs. 2 and 3).
The marginal income from land from each addi-
tional unit of chemical fertilizer and pesticide
used is decreasing. This is due to the soil’s low
fertility (in regard to the N [nitrogen], P [phos-
phorous] and K [potassium] components). The
deficiency of carbon in the soil has also become
widespread, especially in the green revolution
areas. This scenario makes the use of organic inputs
more imperative.
PESTICIDES
Consumption of insecticides has increased
by more than 100 percent from 1971 to
1994-95, or from 22,013 tons to 51,755 tons (http:/
/www.indiastat.com/). Consumption of all kinds of
pesticides more than doubled in the same period,
from 24,305 tons to 61,357 tons.
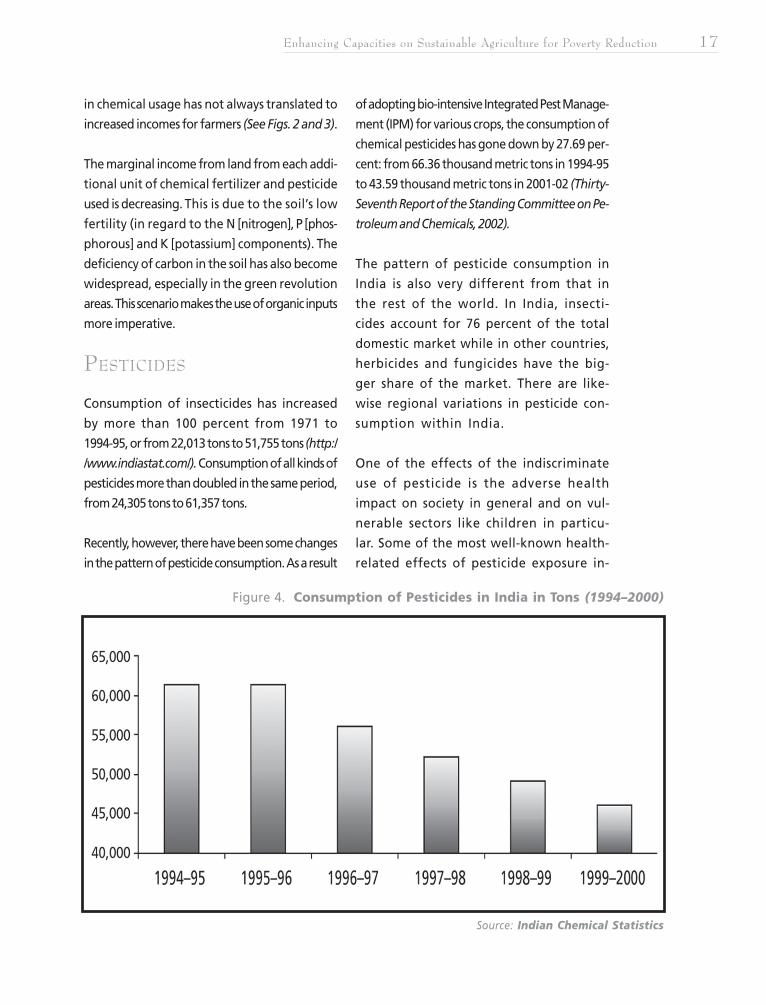
Recently, however, there have been some changes
in the pattern of pesticide consumption. As a result
of adopting bio-intensive Integrated Pest Manage-
ment (IPM) for various crops, the consumption of
chemical pesticides has gone down by 27.69 per-
cent: from 66.36 thousand metric tons in 1994-95
to 43.59 thousand metric tons in 2001-02 (Thirty-
Seventh Report of the Standing Committee on Pe-
troleum and Chemicals, 2002).
The pattern of pesticide consumption in
India is also very different from that in
the rest of the world. In India, insecti-
cides account for 76 percent of the total
domestic market while in other countries,
herbicides and fungicides have the big-
ger share of the market. There are like-
wise regional variations in pesticide con-
sumption within India.
One of the effects of the indiscriminate
use of pesticide is the adverse health
impact on society in general and on vul-
nerable sectors like children in particu-
lar. Some of the most well-known health-
related effects of pesticide exposure in-
Source: Indian Chemical Statistics
Figure 4. Consumption of Pesticides in India in Tons (1994–2000)
Asia–Japan Partnership Network for Poverty Reduction (AJPN)
18 National Agriculture Situationers
clude acute poisoning, cancer, neurologi-
cal effects and reproductive and devel-
opmental harm (CSE, 1997).
IRRIGATION
Agriculture, or more accurately irrigated
agriculture, is now considered the largest
consumer of water, accounting for as much
as 80 percent of total water use in India.
In 1951, irrigation facilities had the po-
tential to service 22.6 million hectares and
to produce 50 million tons of food.
Today, due to a four-fold increase in ir-
rigation potential (over 10 million hect-
ares), food production has quadrupled to
about 200 million tons. The Ministry of
Water Resources estimated the country’s
ultimate irrigation potential at 139.89
million hectares, with 58.46 million hect-
ares being serviced by major and medium
irrigation and 81.43 million hectares by
minor irrigation.
The attainment of this ultimate irrigation
potential through the construction of ma-
jor, medium and minor irrigation projects
by 2025 is essential to meeting the food re-
quirements of the projected population
increase.
With few exceptions, however, all the sur-
face irrigation—conducted through large
storage systems—has been used up. The
improvement of groundwater resources and
streamlining of the prevailing irrigation
system are therefore imperative.
After all, the return on investment on op-
erations improvements and moderniza-
tion of existing systems is still much higher
than the return on investments on new
projects.
More than 5,000 million tons of topsoil
are lost to erosion every year in India. A
close look at the present health of the
country’s soil and water resources reveals
their misuse and degraded state.
Almost 173.64 million hectares, or close
to half of the country, are threatened by
various types of degradation, such as
salinity, alkalinity, waterlogging, deser-
tification, etc.
India’s forests and grasslands have also been
overexploited. The frequent floods and
droughts in different parts of the country
is evidence of improper land use in the catchments
and inadequate conservation of rainwater.
The problem of land degradation has brought
India face-to-face with the rapid depletion of the
land’s productivity, on the one hand, and the
ever-growing demand for food, fodder, fiber, fuel,
land-based industrial raw materials, and many
non-farm land uses, on the other.
In the meantime, India’s population is more
than likely to outstrip agricultural pro-
duction. In 1951, India’s population stood
at 361 million; in 2000, this figure nearly
trebled, to 1004.5 million. Although there
are indications of a decline in India’s popu-
lation growth, from 2.14 to 1.70 percent,
the country is still likely to add another
INDIAN AGRICULTURE AT A CROSSROADS
Enhancing Capacities on Sustainable Agriculture for Poverty Reduction 19
420.5 million people by the year 2020,
or about 21 million people every year.
The total food grain demand by 2020 is
estimated at 294 MT (122 MT rice, 103 MT
wheat, 41 MT coarse grains and 28 MT pulses).
Thus, by 2020, India will have to produce
about 100 MT of additional food grain a
year from the same or even less area (some
more area will go to meet the increasing
needs for roads, rails, buildings, etc.).
Some sectors have suggested that the situ-
ation leaves India with little choice but
to increase its use of fertilizers. Others
argue, however, that biodiversity inten-
sification rather than chemical intensifi-
cation is the way forward.
MARKET TRENDS AND
POTENTIALS OF ORGANIC
PRODUCTS IN INDIA
Given the unorganized nature of the do-
mestic organic agriculture market in India,
it is difficult to estimate the magnitude
and trends in this growing market.
In general, the sale of organic produce
has been limited to metros like Mumbai,
Delhi, Kolkata, Chennai, Bangalore and
Hyderabad. To a large extent, this sale is
based on the individual initiative of farm-
ers, Non Governmental Organizations and
some entrepreneurial traders.
The current demand for domestic green
products is mainly for fruits, vegetables,
rice and wheat. Other products include
tea, coffee and pulses (ORG-MARG Sur-
vey, 2002).
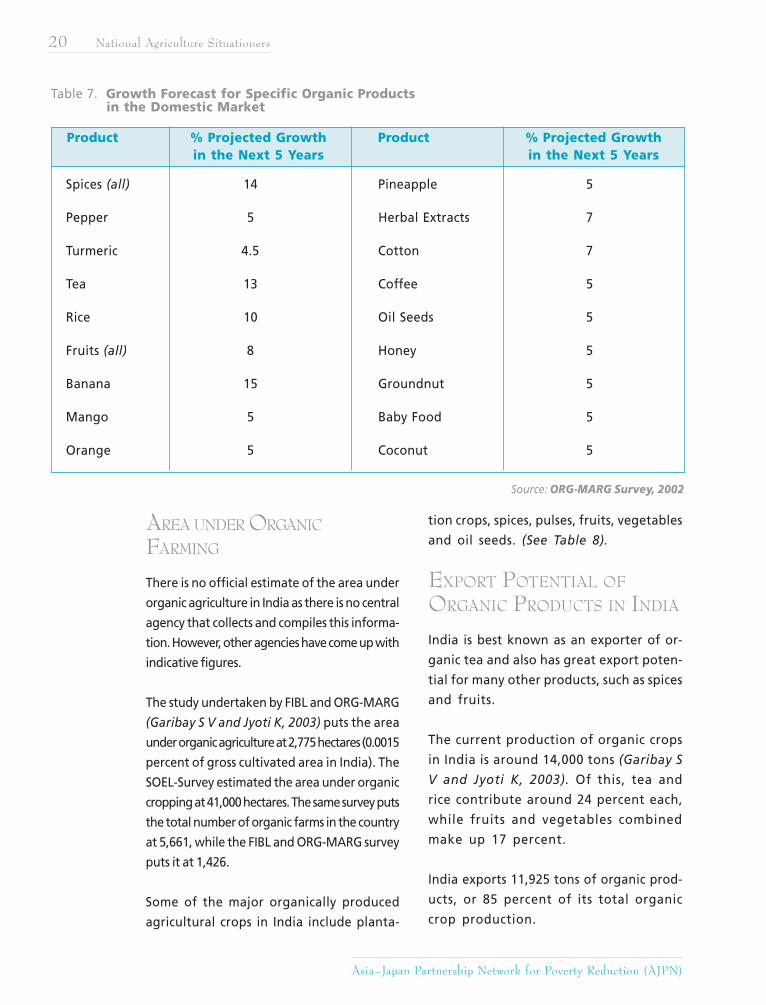
The market prospects for other commodities
like organic spices, fruits, herbal plants
and cotton are relatively high. In the next
five years, it is projected that demand for
organic spices will grow by 14 percent,
fruits by eight percent, and herbal plants
and cotton by seven percent (ORG-MARG
Survey, 2002). The market for a range of
organic agricultural products as shown in
Table 7 is estimated to reach 1,568 tons in
2006-07.
ORGANIC AGRICULTURE IN INDIA
Asia–Japan Partnership Network for Poverty Reduction (AJPN)
20 National Agriculture Situationers
AREA UNDER ORGANIC
FARMING
There is no official estimate of the area under
organic agriculture in India as there is no central
agency that collects and compiles this informa-
tion. However, other agencies have come up with
indicative figures.
The study undertaken by FIBL and ORG-MARG
(Garibay S V and Jyoti K, 2003) puts the area
under organic agriculture at 2,775 hectares (0.0015
percent of gross cultivated area in India). The
SOEL-Survey estimated the area under organic
cropping at 41,000 hectares. The same survey puts
the total number of organic farms in the country
at 5,661, while the FIBL and ORG-MARG survey
puts it at 1,426.
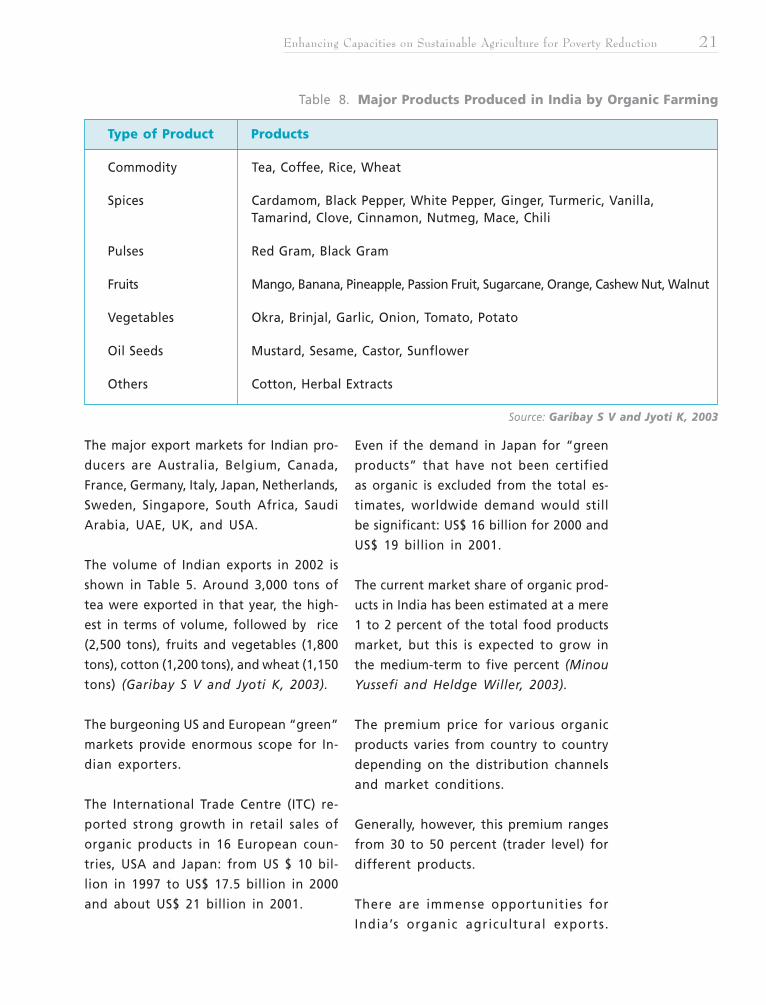
Some of the major organically produced
agricultural crops in India include planta-
tion crops, spices, pulses, fruits, vegetables
and oil seeds. (See Table 8).
EXPORT POTENTIAL OF
ORGANIC PRODUCTS IN INDIA
India is best known as an exporter of or-
ganic tea and also has great export poten-
tial for many other products, such as spices
and fruits.
The current production of organic crops
in India is around 14,000 tons (Garibay S
V and Jyoti K, 2003). Of this, tea and
rice contribute around 24 percent each,
while fruits and vegetables combined
make up 17 percent.
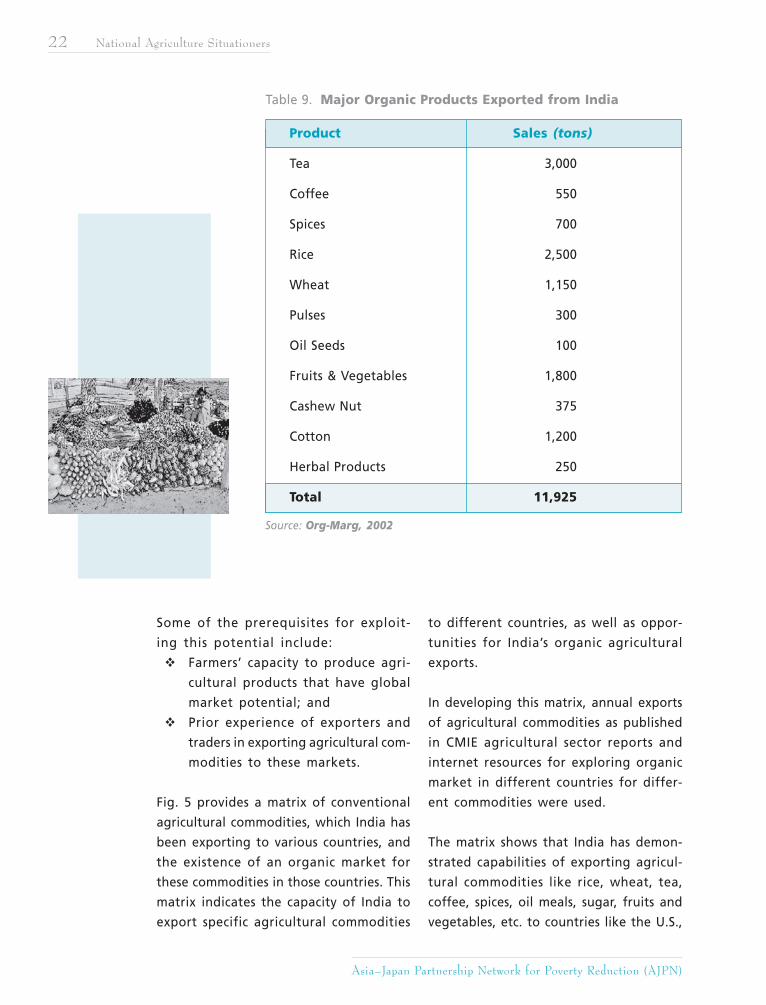
India exports 11,925 tons of organic prod-
ucts, or 85 percent of its total organic
crop production.
Table 7. Growth Forecast for Specific Organic Products in the Domestic Market
Product % Projected Growth Product % Projected Growthin the Next 5 Years in the Next 5 Years
Spices (all) 14 Pineapple 5
Pepper 5 Herbal Extracts 7
Turmeric 4.5 Cotton 7
Tea 13 Coffee 5
Rice 10 Oil Seeds 5
Fruits (all) 8 Honey 5
Banana 15 Groundnut 5
Mango 5 Baby Food 5
Orange 5 Coconut 5
Source: ORG-MARG Survey, 2002
Enhancing Capacities on Sustainable Agriculture for Poverty Reduction 21
Table 8. Major Products Produced in India by Organic Farming
Source: Garibay S V and Jyoti K, 2003
Type of Product Products
Commodity Tea, Coffee, Rice, Wheat
Spices Cardamom, Black Pepper, White Pepper, Ginger, Turmeric, Vanilla,Tamarind, Clove, Cinnamon, Nutmeg, Mace, Chili
Pulses Red Gram, Black Gram
Fruits Mango, Banana, Pineapple, Passion Fruit, Sugarcane, Orange, Cashew Nut, Walnut
Vegetables Okra, Brinjal, Garlic, Onion, Tomato, Potato
Oil Seeds Mustard, Sesame, Castor, Sunflower
Others Cotton, Herbal Extracts
The major export markets for Indian pro-
ducers are Australia, Belgium, Canada,
France, Germany, Italy, Japan, Netherlands,
Sweden, Singapore, South Africa, Saudi
Arabia, UAE, UK, and USA.
The volume of Indian exports in 2002 is
shown in Table 5. Around 3,000 tons of
tea were exported in that year, the high-
est in terms of volume, followed by rice
(2,500 tons), fruits and vegetables (1,800
tons), cotton (1,200 tons), and wheat (1,150
tons) (Garibay S V and Jyoti K, 2003).
The burgeoning US and European “green”
markets provide enormous scope for In-
dian exporters.
The International Trade Centre (ITC) re-
ported strong growth in retail sales of
organic products in 16 European coun-
tries, USA and Japan: from US $ 10 bil-
lion in 1997 to US$ 17.5 billion in 2000
and about US$ 21 billion in 2001.
Even if the demand in Japan for “green
products” that have not been certified
as organic is excluded from the total es-
timates, worldwide demand would still
be significant: US$ 16 billion for 2000 and
US$ 19 billion in 2001.
The current market share of organic prod-
ucts in India has been estimated at a mere
1 to 2 percent of the total food products
market, but this is expected to grow in
the medium-term to five percent (Minou
Yussefi and Heldge Willer, 2003).
The premium price for various organic
products varies from country to country
depending on the distribution channels
and market conditions.
Generally, however, this premium ranges
from 30 to 50 percent (trader level) for
different products.
There are immense opportunities for
India’s organic agricultural exports.
Asia–Japan Partnership Network for Poverty Reduction (AJPN)
22 National Agriculture Situationers
Some of the prerequisites for exploit-
ing this potential include:
Farmers’ capacity to produce agri-
cultural products that have global
market potential; and
Prior experience of exporters and
traders in exporting agricultural com-
modities to these markets.
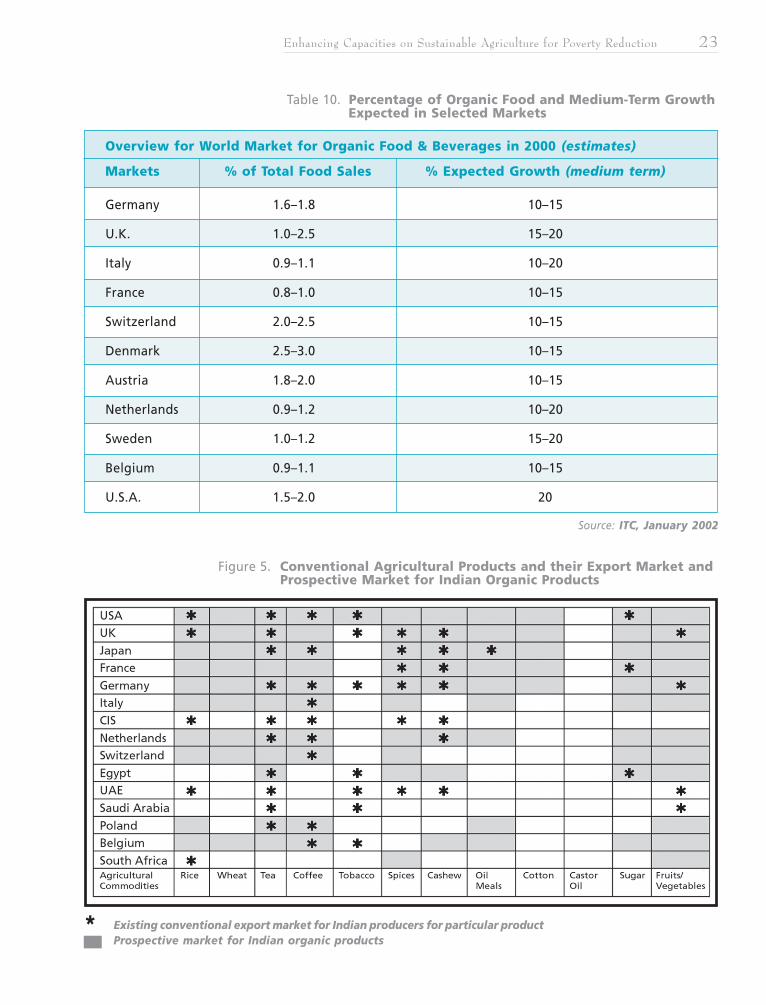
Fig. 5 provides a matrix of conventional
agricultural commodities, which India has
been exporting to various countries, and
the existence of an organic market for
these commodities in those countries. This
matrix indicates the capacity of India to
export specific agricultural commodities
Table 9. Major Organic Products Exported from India
Source: Org-Marg, 2002
Product Sales (tons)
Tea 3,000
Coffee 550
Spices 700
Rice 2,500
Wheat 1,150
Pulses 300
Oil Seeds 100
Fruits & Vegetables 1,800
Cashew Nut 375
Cotton 1,200
Herbal Products 250
Total 11,925
to different countries, as well as oppor-
tunities for India’s organic agricultural
exports.
In developing this matrix, annual exports
of agricultural commodities as published
in CMIE agricultural sector reports and
internet resources for exploring organic
market in different countries for differ-
ent commodities were used.
The matrix shows that India has demon-
strated capabilities of exporting agricul-
tural commodities like rice, wheat, tea,
coffee, spices, oil meals, sugar, fruits and
vegetables, etc. to countries like the U.S.,
Enhancing Capacities on Sustainable Agriculture for Poverty Reduction 23
Table 10. Percentage of Organic Food and Medium-Term Growth Expected in Selected Markets
* Existing conventional export market for Indian producers for particular productProspective market for Indian organic products
Figure 5. Conventional Agricultural Products and their Export Market and Prospective Market for Indian Organic Products
Source: ITC, January 2002
Overview for World Market for Organic Food & Beverages in 2000 (estimates)
Markets % of Total Food Sales % Expected Growth (medium term)
Germany 1.6–1.8 10–15
U.K. 1.0–2.5 15–20
Italy 0.9–1.1 10–20
France 0.8–1.0 10–15
Switzerland 2.0–2.5 10–15
Denmark 2.5–3.0 10–15
Austria 1.8–2.0 10–15
Netherlands 0.9–1.2 10–20
Sweden 1.0–1.2 15–20
Belgium 0.9–1.1 10–15
U.S.A. 1.5–2.0 20
Asia–Japan Partnership Network for Poverty Reduction (AJPN)
24 National Agriculture Situationers
U. K, Germany, Japan, France, Saudi Arabia,
South Africa, CIS Countries, Poland, Neth-
erlands, Italy, etc.
It also shows that in most of these coun-
tries there is a demand for organically pro-
duced commodities, which attract price pre-
miums ranging from 10 to as much as 100
percent. This is a window of opportunity
that should be exploited fully by Indian
exporters and producers of agricultural
commodities.
INDIA’S GREEN INPUT MARKET
It is very difficult to estimate the size of
the green inputs market in India because
of its diversity in terms of products and
its unorganized state.
Green inputs into agriculture include bio-
fertilizers, bio-pesticides, compost, Farm
Yard Manure (FYM), green manure, etc.
As most of these inputs are either not traded,
or if they were, only informally, available infor-
mation regarding production capacity, demand
and sales is at best a sketchy estimation and hence
inadequate.
The green inputs market is currently controlled
by the small and local producers of bio-fertil-
izer, vermi compost and other inputs; only a
few well-established firms have a presence here.
It is easier to come up with estimates of the bio-
fertilizer market in India because it is more orga-
nized than the the green inputs market and because
of the presence of some large producers.
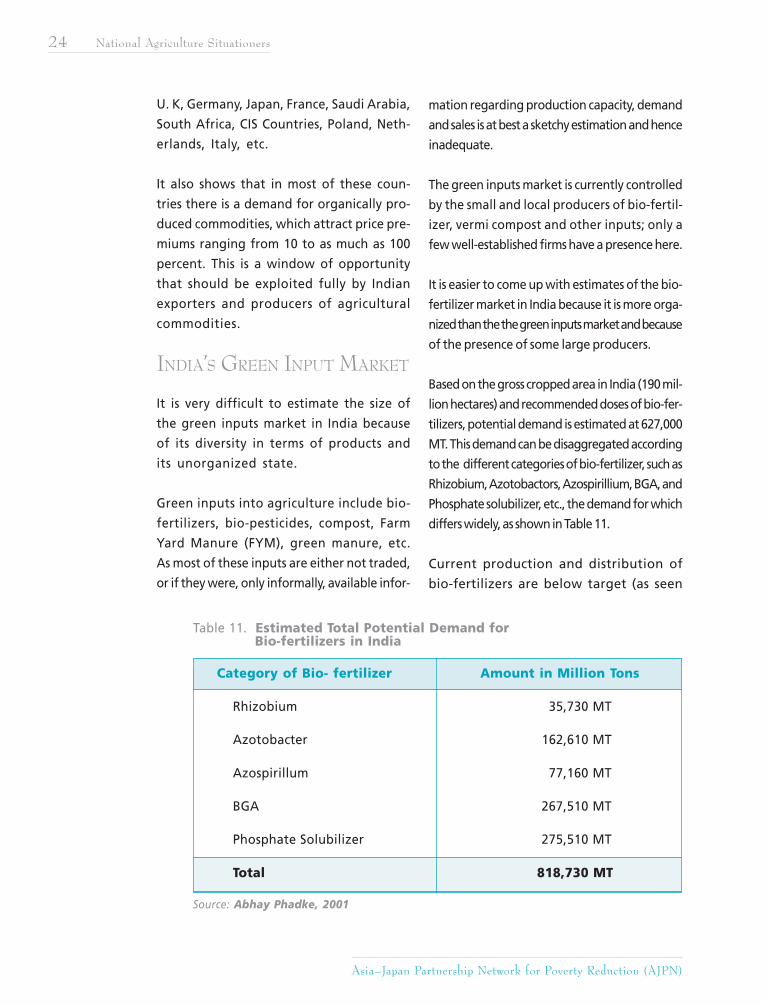
Based on the gross cropped area in India (190 mil-
lion hectares) and recommended doses of bio-fer-
tilizers, potential demand is estimated at 627,000
MT. This demand can be disaggregated according
to the different categories of bio-fertilizer, such as
Rhizobium, Azotobactors, Azospirillium, BGA, and
Phosphate solubilizer, etc., the demand for which
differs widely, as shown in Table 11.
Current production and distribution of
bio-fertilizers are below target (as seen
Table 11. Estimated Total Potential Demand for Bio-fertilizers in India
Source: Abhay Phadke, 2001
Category of Bio- fertilizer Amount in Million Tons
Rhizobium 35,730 MT
Azotobacter 162,610 MT
Azospirillum 77,160 MT
BGA 267,510 MT
Phosphate Solubilizer 275,510 MT
Total 818,730 MT
Enhancing Capacities on Sustainable Agriculture for Poverty Reduction 25
Source: The Fertilizer Association of India Bio-fertilizer Statistics, 1999–2000
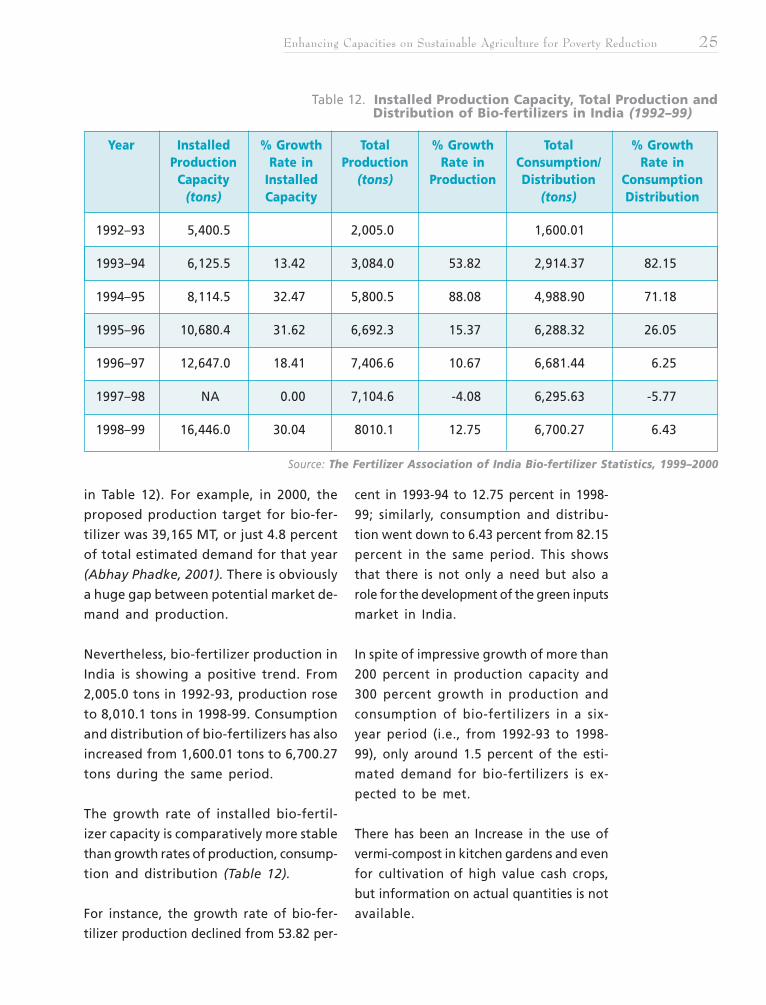
Table 12. Installed Production Capacity, Total Production and Distribution of Bio-fertilizers in India (1992–99)
Year Installed % Growth Total % Growth Total % GrowthProduction Rate in Production Rate in Consumption/ Rate in
Capacity Installed (tons) Production Distribution Consumption(tons) Capacity (tons) Distribution
1992–93 5,400.5 2,005.0 1,600.01
1993–94 6,125.5 13.42 3,084.0 53.82 2,914.37 82.15
1994–95 8,114.5 32.47 5,800.5 88.08 4,988.90 71.18
1995–96 10,680.4 31.62 6,692.3 15.37 6,288.32 26.05
1996–97 12,647.0 18.41 7,406.6 10.67 6,681.44 6.25
1997–98 NA 0.00 7,104.6 -4.08 6,295.63 -5.77
1998–99 16,446.0 30.04 8010.1 12.75 6,700.27 6.43
in Table 12). For example, in 2000, the
proposed production target for bio-fer-
tilizer was 39,165 MT, or just 4.8 percent
of total estimated demand for that year
(Abhay Phadke, 2001). There is obviously
a huge gap between potential market de-
mand and production.
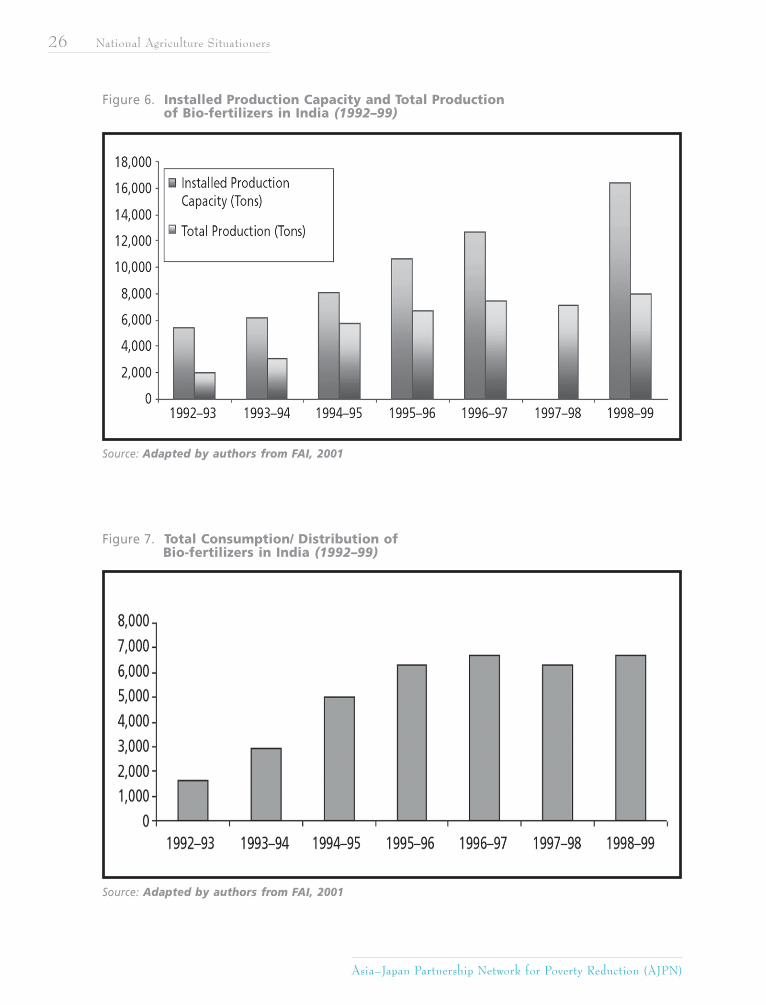
Nevertheless, bio-fertilizer production in
India is showing a positive trend. From
2,005.0 tons in 1992-93, production rose
to 8,010.1 tons in 1998-99. Consumption
and distribution of bio-fertilizers has also
increased from 1,600.01 tons to 6,700.27
tons during the same period.
The growth rate of installed bio-fertil-
izer capacity is comparatively more stable
than growth rates of production, consump-
tion and distribution (Table 12).
For instance, the growth rate of bio-fer-
tilizer production declined from 53.82 per-
cent in 1993-94 to 12.75 percent in 1998-
99; similarly, consumption and distribu-
tion went down to 6.43 percent from 82.15
percent in the same period. This shows
that there is not only a need but also a
role for the development of the green inputs
market in India.
In spite of impressive growth of more than
200 percent in production capacity and
300 percent growth in production and
consumption of bio-fertilizers in a six-
year period (i.e., from 1992-93 to 1998-
99), only around 1.5 percent of the esti-
mated demand for bio-fertilizers is ex-
pected to be met.
There has been an Increase in the use of
vermi-compost in kitchen gardens and even
for cultivation of high value cash crops,
but information on actual quantities is not
available.
Asia–Japan Partnership Network for Poverty Reduction (AJPN)
26 National Agriculture Situationers
Figure 6. Installed Production Capacity and Total Production of Bio-fertilizers in India (1992–99)
Source: Adapted by authors from FAI, 2001
Source: Adapted by authors from FAI, 2001
Figure 7. Total Consumption/ Distribution of Bio-fertilizers in India (1992–99)
Enhancing Capacities on Sustainable Agriculture for Poverty Reduction 27
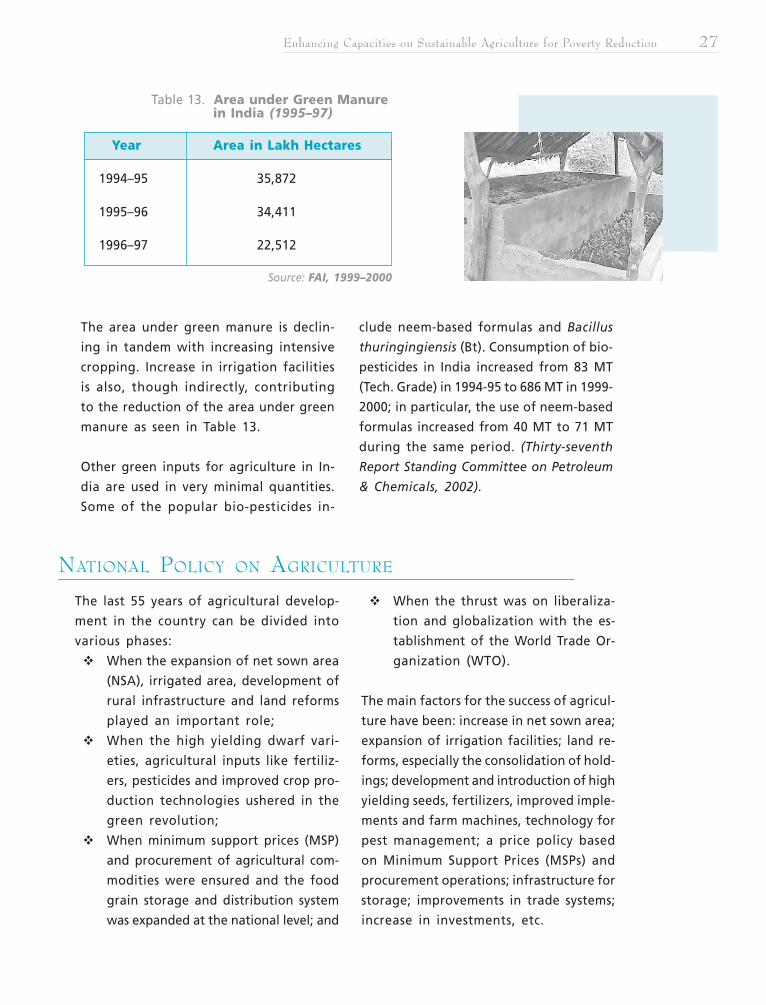
The area under green manure is declin-
ing in tandem with increasing intensive
cropping. Increase in irrigation facilities
is also, though indirectly, contributing
to the reduction of the area under green
manure as seen in Table 13.
Other green inputs for agriculture in In-
dia are used in very minimal quantities.
Some of the popular bio-pesticides in-
Table 13. Area under Green Manure in India (1995–97)
Year Area in Lakh Hectares
1994–95 35,872
1995–96 34,411
1996–97 22,512
Source: FAI, 1999–2000
clude neem-based formulas and Bacillus
thuringingiensis (Bt). Consumption of bio-
pesticides in India increased from 83 MT
(Tech. Grade) in 1994-95 to 686 MT in 1999-
2000; in particular, the use of neem-based
formulas increased from 40 MT to 71 MT
during the same period. (Thirty-seventh
Report Standing Committee on Petroleum
& Chemicals, 2002).
NATIONAL POLICY ON AGRICULTURE
The last 55 years of agricultural develop-
ment in the country can be divided into
various phases:
When the expansion of net sown area
(NSA), irrigated area, development of
rural infrastructure and land reforms
played an important role;
When the high yielding dwarf vari-
eties, agricultural inputs like fertiliz-
ers, pesticides and improved crop pro-
duction technologies ushered in the
green revolution;
When minimum support prices (MSP)
and procurement of agricultural com-
modities were ensured and the food
grain storage and distribution system
was expanded at the national level; and
When the thrust was on liberaliza-
tion and globalization with the es-
tablishment of the World Trade Or-
ganization (WTO).
The main factors for the success of agricul-
ture have been: increase in net sown area;
expansion of irrigation facilities; land re-
forms, especially the consolidation of hold-
ings; development and introduction of high
yielding seeds, fertilizers, improved imple-
ments and farm machines, technology for
pest management; a price policy based
on Minimum Support Prices (MSPs) and
procurement operations; infrastructure for
storage; improvements in trade systems;
increase in investments, etc.
Asia–Japan Partnership Network for Poverty Reduction (AJPN)
28 National Agriculture Situationers
AGRICULTURAL
DEVELOPMENT STRATEGY
The Agricultural Development Strategy was re-
vised in 1999 as the national strategy on sustain-
able agriculture and rural development (SARD).
The Strategy is essentially based on the goals of
food security and alleviation of hunger.
A regionally differentiated strategy, based on agro-
climatic regional planning which takes into ac-
count agronomic, climatic and environmental con-
ditions, will be adopted to realize the growth
potential of every region in the country.
The thrust of the Strategy is an ecological, sus-
tainable use of basic resources such as land, water,
and vegetation that serves the objectives of ac-
celerated growth, employment and alleviation
of hunger.
In the accelerated growth scenario for the Ninth
Five Year Plan (1997-2002), an agricultural growth
rate of 4.5 percent a year was expected. Allied sec-
tors such as horticulture, including fruits and veg-
etables, fisheries, livestock, and dairy continued to
register greater growth during the Ninth Plan pe-
riod.
In the Ninth Plan, targets were to be achieved
through a regionally differentiated strategy based
on agronomic, climatic, and environment-friendly
conditions.
At the macro level, the agriculture development strat-
egy was differentiated by broad regional character-
istics of an agro-economic character.
The Northwestern high productivity regions pro-
moted diversification and high value crops, and
strengthened linkages with agro-processing in-
dustries and exports.
The Eastern region, with abundant water, ex-
ploited this productivity potential through flood
control, drainage management, improvement
of irrigation facilities, and improved input de-
livery systems.
The water scarce peninsular region, including
Rajasthan, focused on efficient water harvest-
ing and conservation methods and technolo-
gies based on a watershed approach and ap-
propriate farming systems. Ecologically fragile
regions, including Himalayan and desert ar-
eas, concentrated on eco-friendly agriculture.
Animal husbandry and dairying received greater
attention for development during the Ninth Five
Year Plan as this sector plays an important role
in generating employment opportunities for small
marginal farmers and landless laborers, especially
in rainfed and drought-prone areas.
The growth value of the output from the live-
stock sector was estimated at 26 percent of the
total value from the agricultural sector.
Access to land was a key element of the
anti-poverty strategy in rural areas. The
program of action for land reform in the
Ninth Five Year Plan included the follow-
ing: detection as well as redistribution
of ceiling surplus land; upgrading of land
records on a regular basis; tenancy re-
forms to record the rights of tenants and
share croppers; consolidation of holdings;
prevention of the alienation of tribal lands;
providing access to wastelands and com-
mon property resources to the poor on
a group basis; leasing-in and leasing-out
of land were permitted within the ceil-
ing limits; and preference to women in
the distribution of ceiling surplus land
Enhancing Capacities on Sustainable Agriculture for Poverty Reduction 29
and legal provisions for protecting their rights
to land.
POLICIES RELATED TO
AGRICULTURAL DEVELOPMENT
A. Sustainable Agricultureand Rural Development(SARD)
The major thrust of agricultural de-
velopment programs in India is im-
proving efficiency in the use of scarce
natural resources, namely: land, wa-
ter and energy.
This can be achieved only through im-
proved productivity in a cost-effective
manner.
Balanced and integrated use of fertil-
izers, agricultural credit, institutional
support, accelerated investments in ag-
riculture, enhancing the competitive-
ness of agro-exports, creation of ad-
ditional irrigation facilities, etc. have
been given encouragement through
various schemes and activities of the
Government.
1. Rehabilitation of DegradedLand
A wide range of approaches have been
employed to address problems of land
degradation, some of these include:
Prevention of soil loss from the
catchments.
Promotion of multi-disciplinary
integrated approach to catch-
ment treatment.
Improvement of land capabil-
ity and moisture regime in the
watersheds.
Promotion of land use to
match land capability.
Reduction of run-off from the
catchments to reduce peak flow
into the river system.
Upgrading of skil ls in the
planning and execution of
watershed development
programme.
Increase of productivity of land
affected by alkalinity for in-
creasing sustainable agriculture
production.
Identification of critical de-
graded areas.
Generation of data on land
suitability and capability for
regulating land use.
Preparation of soil resource map
and inventory of soil and land
resources.
Development of technical skills
in soil and water conservation.
Building up and strengthen-
ing of land capability of State
Land Use Boards.
Various soil and water conservation
programs have been launched in re-
sponse to the need to conserve and
rehabilitate degraded land, includ-
ing:
Strengthening of State Land
Use Boards (SLUBS);
Creation of the National Land
Use and Conservation Board
(NLCB);
Asia–Japan Partnership Network for Poverty Reduction (AJPN)
30 National Agriculture Situationers
Setting up of a Soil Conser-
vation Training Centre DVC
Hazaribagh;
Centrally sponsored Scheme
of Soil Conservation for En-
hancing Productivity of De-
graded Lands in the
Catchments of River Valley
Projects;
Centrally Sponsored Scheme of
Soil Conservation in the
Catchments of Flood Prone
Rivers;
Centrally Sponsored Scheme for
Reclamation of Alkali (Usar)
Soils;
EFC Assisted Project for Recla-
mation and Development of
Alkali land in Bihar and U.P.;
Uttar Pradesh Sodic Land Rec-
lamation Project with World
Bank assistance;
Watershed Development Project
in shifting Cultivation Areas of
North Eastern States
(WDPSCA);
Indo- German Bilateral Project
on Watershed Management;
Reclamation of Marginal and
shallow ravines in the states of
Uttar Pradesh, Madhya
Pradesh, Gujarat and Rajasthan;
Centrally Sponsored Scheme for
Reclamation of Saline Soils in-
cluding Coastal Saline and
Sandy Areas;
Centrally Sponsored Scheme
for Amelioration of Acid Soils.
2. Integrated Pest Management
To alleviate the ill effects of pesti-
cides, India adopted Integrated Pest
Management (IPM) as a policy in 1985, and
it has been a prominent feature of Five
Year Plans since.
In fact, India was the first country in Asia
to adopt the policy. One concrete offshoot
of this policy is the establishment of the
Central IPM Centre (CIPMC), which has a
presence in each state. Its tasks include con-
duct of crop surveys, training of IPM trainors,
and rearing natural control agents.
3. Water Resources Management
The projected total water demand by the
year 2025 is around 1,050 cubic kilometres
against the country’s utilizable water re-
sources of 1,132 cubic kilometres.
The share of agriculture in total wa-
ter demand by the year 2025 is ex-
pected to be about 74 to 75 percent.
Irrigation, being the major water user,
will have to take a lower share by 2025,
from the present 83 percent to 74
percent, due to more pressing and com-
peting demands from other sectors.
Water has already become one of the
most limited resources in the country.
To address the scarcity of water both
in quantity and quality, national pro-
grams (Preventive & Mitigative Ac-
tion Plans) have been launched, in-
cluding:
1. Setting up guidelines forground water extractionand use.
Enhancing Capacities on Sustainable Agriculture for Poverty Reduction 31
The use of ground water for
irrigation as well as industrial
and household use has been
increasing in the last two de-
cades. Aquifers are at risk of
drying up in some parts of the
country because of indiscrimi-
nate extraction of ground
water.
The Central and State Ground
Water Boards have, therefore,
prepared Ground Water Avail-
ability Maps and prescribed ex-
traction rates to ensure that
extraction is balanced with re-
plenishment.
The country has been ZONED
depending upon whether wa-
ter is available in plenty, or has
already become scarce in the
region.
Accurate determination of
ground water reserves can be
done through actual Bore Hole
Data in a given region.
Extraction of ground water is
prohibited in some regions
where water depletion has al-
ready become critical.
2. Management of lakes.Natural and man-made lakes
happen to be a major source of
water supply in many regions
in India.
Water use efficiency is presently
estimated to be only 38 to 40
percent for canal irrigation
and about 60 percent for
ground water irrigation
schemes.
3. Water pricing.The Committee on Pricing Wa-
ter (formed in accordance with
the National Water Policy, 1987)
is charged with rationalizing
water rates and has suggested
an increase in irrigation water
rates in a phased manner.
The pricing of water for vari-
ous uses will have to take into
account the paying capacity of
the users, including farmers and
large sectors of the population
living below the poverty line.
B. De-regulation andLiberalization of Agriculture
Since the start of liberalization, sev-
eral policy measures have been taken
with regard to regulation and control,
fiscal policy, exports and imports,
taxation, exchange and interest rate
control, export promotion and in-
centives for high priority industries.
Food processing and agro industries
have been given high priority and enjoy
a number of incentives.
Wide-ranging fiscal policy changes
have been introduced progressively.
Excise and import duty rates have
been reduced substantially. Many
processed food items are totally
exempt from excise duty.
Asia–Japan Partnership Network for Poverty Reduction (AJPN)
32 National Agriculture Situationers
Custom duty rates have been substantially
reduced on plants and equipment, as well
as on raw materials and intermediates, es-
pecially for export production.
Overall, the rates of protection and de-
protection of the sector resulting from
agricultural policies have been relatively
low; however, there have been substantial
variations in the rates of protection across
commodities. Non-tariff barriers have had
a bigger impact than tariff barriers.
According to the WB, before 1991, or the
year of accession to the Agreement on
Agriculture (AoA), almost all of India’s
tradable agricultural commodities were
protected by non-tariff barriers.
Exports of most agricultural goods, except
traditional exports such as tea, coffee, spices,
and jute, were subject to quantitative re-
strictions (QRs).
In the 1950s and 1960s, export taxes were
imposed on traditional exports. Although
trade has been greatly liberalized between
1991 and 1995, there have been reversals
as well.
Barriers have gone up on more than three-
quarters of agricultural commodities, in-
cluding rice and wheat imports. QRs now
apply to exports of most commodities, with
the exception of Basmati rice and durum
wheat.
C. Public Investment inAgriculture
Public sector investment has played
a crucial role in the development
of infrastructure like irrigation, elec-
tricity, agriculture research, roads,
markets and communications.
Investment in agriculture declined from
1.6 percent of GDP in 1993-94 to 1.3
percent in 1998-99. This decline was
due to a fall in public investment from
Rs. 4,467 crores in 1993-94 to Rs. 3,869
crores in 1998-99.
The declining trend in public sector in-
vestment will need to be reversed by
better targeting of subsidies, increas-
ing investment in productive assets such
as irrigation, power, credit and devel-
oping rural infrastructure.
On the whole, however, public spend-
ing on agriculture as a proportion of
GDP has been much higher in India than
in other countries.
Despite this, agricultural growth in
India has been slower.
The WB (1996) has suggested two
reasons for this: (1) that public
spending across regions or states is
not geared towards a more rapid,
broad-based and poverty-alleviat-
ing agricultural growth; and (2) that
apart from the fact that public
spending is disproportionately
skewed towards subsidies and against
growth-enhancing investments and
expenditure on operations and main-
tenance of existing stock of capi-
tal, this skewing also contributes
to the poor quality and reliability
of the delivery of inputs, such as
power and water.
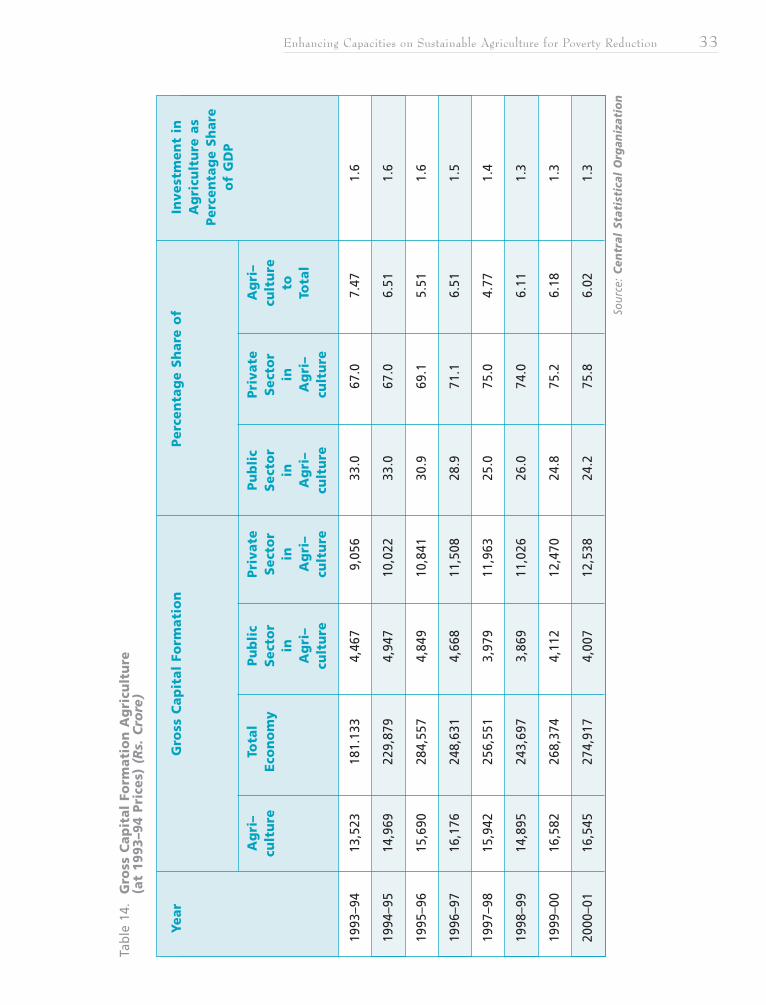
Enhancing Capacities on Sustainable Agriculture for Poverty Reduction 33
Tabl
e 14
. G
ross
Cap
ital
Fo
rmat
ion
Ag
ricu
ltu
re
(at
199
3–94
Pri
ces)
(R
s. C
rore
)
Sour
ce:
Cen
tral
Sta
tist
ical
Org
aniz
atio
n
Year
Gro
ss C
apit
al F
orm
atio
nPe
rcen
tag
e Sh
are
of
Inve
stm
ent
inA
gri
cult
ure
as
Perc
enta
ge
Shar
eo
f G
DP
Ag
ri–
Tota
lPu
bli
cPr
ivat
ePu
bli
cPr
ivat
eA
gri
–cu
ltu
reEc
on
om
ySe
cto
rSe
cto
rSe
cto
rSe
cto
rcu
ltu
rein
inin
into
Ag
ri–
Ag
ri–
Ag
ri–
Ag
ri–
Tota
lcu
ltu
recu
ltu
recu
ltu
recu
ltu
re
1993
–94
13,5
2318
1.13
34,
467
9,05
633
.067
.07.
471.
6
1994
–95
14,9
6922
9,87
94,
947
10,0
2233
.067
.06.
511.
6
1995
–96
15,6
9028
4,55
74,
849
10,8
4130
.969
.15.
511.
6
1996
–97
16,1
7624
8,63
14,
668
11,5
0828
.971
.16.
511.
5
1997
–98
15,9
4225
6,55
13,
979
11,9
6325
.075
.04.
771.
4
1998
–99
14,8
9524
3,69
73,
869
11,0
2626
.074
.06.
111.
3
1999
–00
16,5
8226
8,37
44,
112
12,4
7024
.875
.26.
181.
3
2000
–01
16,5
4527
4,91
74,
007
12,5
3824
.275
.86.
021.
3
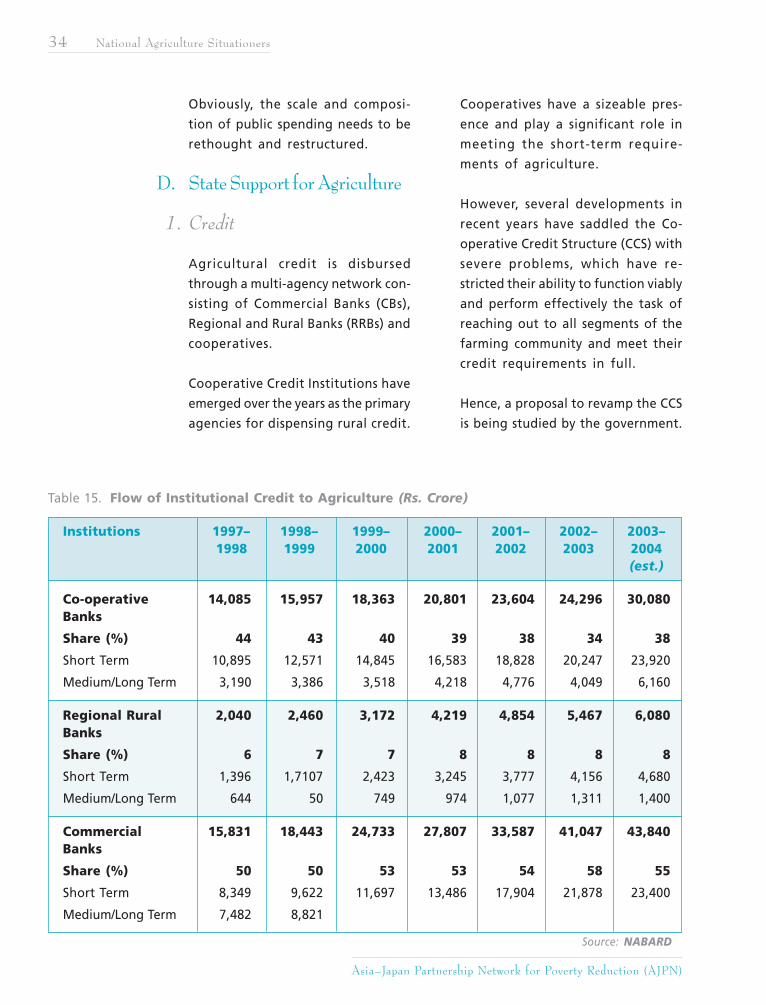
Asia–Japan Partnership Network for Poverty Reduction (AJPN)
34 National Agriculture Situationers
Obviously, the scale and composi-
tion of public spending needs to be
rethought and restructured.
D. State Support for Agriculture
1. Credit
Agricultural credit is disbursed
through a multi-agency network con-
sisting of Commercial Banks (CBs),
Regional and Rural Banks (RRBs) and
cooperatives.
Cooperative Credit Institutions have
emerged over the years as the primary
agencies for dispensing rural credit.
Cooperatives have a sizeable pres-
ence and play a significant role in
meeting the short-term require-
ments of agriculture.
However, several developments in
recent years have saddled the Co-
operative Credit Structure (CCS) with
severe problems, which have re-
stricted their ability to function viably
and perform effectively the task of
reaching out to all segments of the
farming community and meet their
credit requirements in full.
Hence, a proposal to revamp the CCS
is being studied by the government.
Table 15. Flow of Institutional Credit to Agriculture (Rs. Crore)
Institutions 1997– 1998– 1999– 2000– 2001– 2002– 2003–1998 1999 2000 2001 2002 2003 2004
(est.)
Co-operative 14,085 15,957 18,363 20,801 23,604 24,296 30,080Banks
Share (%) 44 43 40 39 38 34 38
Short Term 10,895 12,571 14,845 16,583 18,828 20,247 23,920
Medium/Long Term 3,190 3,386 3,518 4,218 4,776 4,049 6,160
Regional Rural 2,040 2,460 3,172 4,219 4,854 5,467 6,080Banks
Share (%) 6 7 7 8 8 8 8
Short Term 1,396 1,7107 2,423 3,245 3,777 4,156 4,680
Medium/Long Term 644 50 749 974 1,077 1,311 1,400
Commercial 15,831 18,443 24,733 27,807 33,587 41,047 43,840Banks
Share (%) 50 50 53 53 54 58 55
Short Term 8,349 9,622 11,697 13,486 17,904 21,878 23,400
Medium/Long Term 7,482 8,821
Source: NABARD
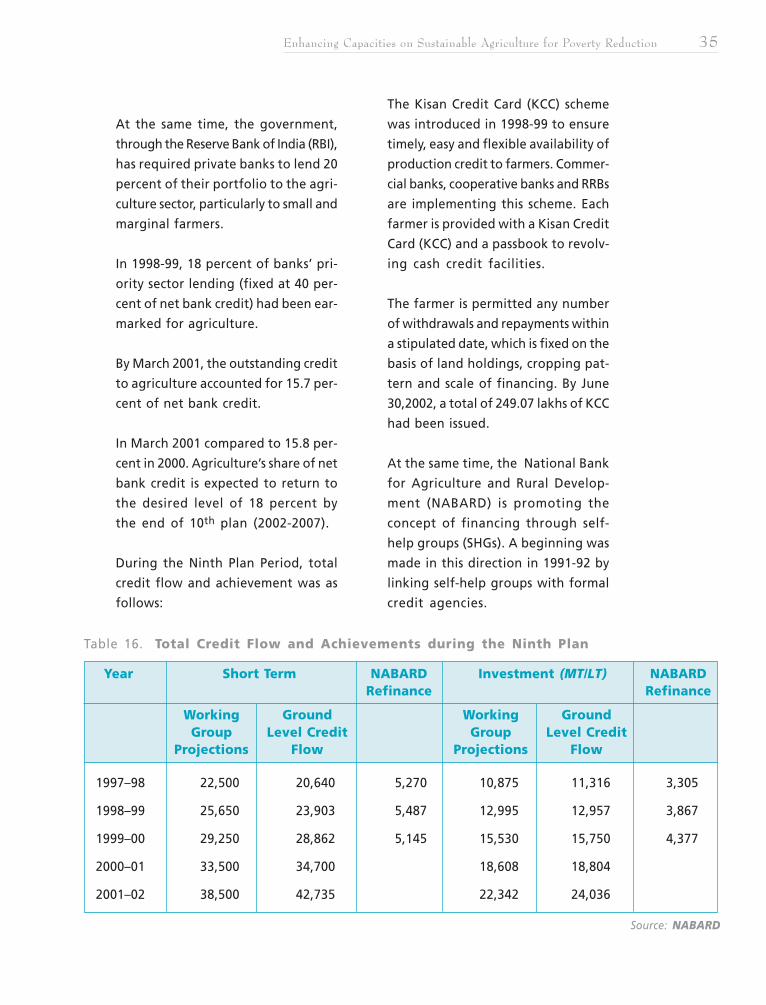
Enhancing Capacities on Sustainable Agriculture for Poverty Reduction 35
At the same time, the government,
through the Reserve Bank of India (RBI),
has required private banks to lend 20
percent of their portfolio to the agri-
culture sector, particularly to small and
marginal farmers.
In 1998-99, 18 percent of banks’ pri-
ority sector lending (fixed at 40 per-
cent of net bank credit) had been ear-
marked for agriculture.
By March 2001, the outstanding credit
to agriculture accounted for 15.7 per-
cent of net bank credit.
In March 2001 compared to 15.8 per-
cent in 2000. Agriculture’s share of net
bank credit is expected to return to
the desired level of 18 percent by
the end of 10th plan (2002-2007).
During the Ninth Plan Period, total
credit flow and achievement was as
follows:
The Kisan Credit Card (KCC) scheme
was introduced in 1998-99 to ensure
timely, easy and flexible availability of
production credit to farmers. Commer-
cial banks, cooperative banks and RRBs
are implementing this scheme. Each
farmer is provided with a Kisan Credit
Card (KCC) and a passbook to revolv-
ing cash credit facilities.
The farmer is permitted any number
of withdrawals and repayments within
a stipulated date, which is fixed on the
basis of land holdings, cropping pat-
tern and scale of financing. By June
30,2002, a total of 249.07 lakhs of KCC
had been issued.
At the same time, the National Bank
for Agriculture and Rural Develop-
ment (NABARD) is promoting the
concept of financing through self-
help groups (SHGs). A beginning was
made in this direction in 1991-92 by
linking self-help groups with formal
credit agencies.
Year Short Term NABARD Investment (MT/LT) NABARDRefinance Refinance
Working Ground Working GroundGroup Level Credit Group Level Credit
Projections Flow Projections Flow
1997–98 22,500 20,640 5,270 10,875 11,316 3,305
1998–99 25,650 23,903 5,487 12,995 12,957 3,867
1999–00 29,250 28,862 5,145 15,530 15,750 4,377
2000–01 33,500 34,700 18,608 18,804
2001–02 38,500 42,735 22,342 24,036
Source: NABARD
Table 16. Total Credit Flow and Achievements during the Ninth Plan
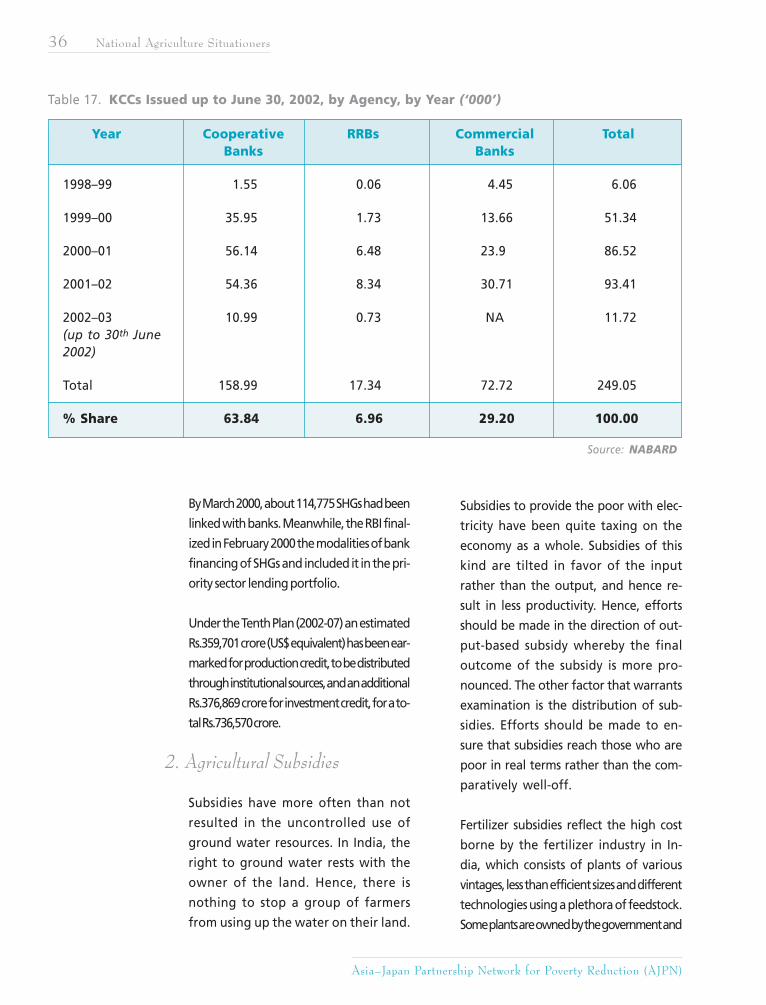
Asia–Japan Partnership Network for Poverty Reduction (AJPN)
36 National Agriculture Situationers
By March 2000, about 114,775 SHGs had been
linked with banks. Meanwhile, the RBI final-
ized in February 2000 the modalities of bank
financing of SHGs and included it in the pri-
ority sector lending portfolio.
Under the Tenth Plan (2002-07) an estimated
Rs.359,701 crore (US$ equivalent) has been ear-
marked for production credit, to be distributed
through institutional sources, and an additional
Rs.376,869 crore for investment credit, for a to-
tal Rs.736,570 crore.
2. Agricultural Subsidies
Subsidies have more often than not
resulted in the uncontrolled use of
ground water resources. In India, the
right to ground water rests with the
owner of the land. Hence, there is
nothing to stop a group of farmers
from using up the water on their land.
Subsidies to provide the poor with elec-
tricity have been quite taxing on the
economy as a whole. Subsidies of this
kind are tilted in favor of the input
rather than the output, and hence re-
sult in less productivity. Hence, efforts
should be made in the direction of out-
put-based subsidy whereby the final
outcome of the subsidy is more pro-
nounced. The other factor that warrants
examination is the distribution of sub-
sidies. Efforts should be made to en-
sure that subsidies reach those who are
poor in real terms rather than the com-
paratively well-off.
Fertilizer subsidies reflect the high cost
borne by the fertilizer industry in In-
dia, which consists of plants of various
vintages, less than efficient sizes and different
technologies using a plethora of feedstock.
Some plants are owned by the government and
Table 17. KCCs Issued up to June 30, 2002, by Agency, by Year (‘000’)
Year Cooperative RRBs Commercial TotalBanks Banks
1998–99 1.55 0.06 4.45 6.06
1999–00 35.95 1.73 13.66 51.34
2000–01 56.14 6.48 23.9 86.52
2001–02 54.36 8.34 30.71 93.41
2002–03 10.99 0.73 NA 11.72(up to 30th June2002)
Total 158.99 17.34 72.72 249.05
% Share 63.84 6.96 29.20 100.00
Source: NABARD
Enhancing Capacities on Sustainable Agriculture for Poverty Reduction 37
others by cooperatives and the private sector.
The fertilizer pricing committee (1998) pointed
out that the present retention-pricing scheme
for producers almost guarantees inefficiency. As
more income-earning opportunities in agricul-
ture arise, in part due to enabling policies, it is
only fair that the income from the agriculture
sector be taxed as well.
3. Support Price forAgricultural Products
Minimum support prices for major
agricultural products are fixed and
announced each year after taking
into account the recommendations
of the Commission for Agricultural
Costs and Prices (CACP). The CACP,
for its part, makes its recommenda-
tions after considering the follow-
ing factors:
Cost of Production
Changes in Input Prices
Input/Output Price Parity
Trends in Market Prices
Inter-crop Price Parity
Demand and Supply Situation
Effect on Industrial Cost Struc-
ture
Effect on General Price Level
Effect on Cost of Living
International Market Price Situ-
ation (MSP)
Parity between Prices Paid and
Prices Received by farmers
(Terms of Trade)
4. Farm Insurance
The Comprehensive Crop Insurance
Scheme (CCIS) has been operating since
1985. It has thus far been implemented
in 19 states and three Union Territo-
ries. It is based on an area approach
and is linked to short-term credit. To
improve the scope and content of the
CCIS, a broad based National Agricul-
ture Insurance Scheme (NAIS) or
Rashtriya Krishi Bima Yojana was in-
troduced in the country in the rabi
season of 1999-2000. This scheme is
available to all the states and Union
Territories and covers food crops, hor-
ticultural crops, oilseed crops and
commercial crops. All farmers are en-
titled to such insurance coverage. All
yield losses due to natural, non-pre-
ventable risks are covered. Premium
rates vary from 1.5 percent to 3.5 per-
cent of the sum insured for food
grain crops and oil seed crops. Small
and marginal farmers are entitled to
a premium subsidy of 50 percent,
which would be phased out over a
five-year period . The General Insur-
ance Corporation (GIC) is the imple-
menting agency.
The National Agriculture Insurance
Scheme (NAIS) would be further
strengthened during the 10th plan.
Its coverage in terms of farmers, crops
and risk commitments has been ex-
panded and its premium structure
rationalized.
5. Agriculture Extension
The Government is encouraging NGOs to
take on a pro-active role in agriculture ex-
tension. In fact, the Department of Agricul-
ture and Cooperation, along with NABARD,
has already introduced a scheme to estab-
lish agri-clinics/ agri-business centers/
Asia–Japan Partnership Network for Poverty Reduction (AJPN)
38 National Agriculture Situationers
ventures to be run by agriculture
graduates. The Indian Council of Ag-
ricultural Research (ICAR) is also in-
volved in agriculture extension ac-
tivities through its 314 Krishi Vigyan
Kendra (Farm Science Centers), its In-
stitute Village Linkage Programme
(IVLP) and also through its institutes/
centers all over the country. It plans
to strengthen links between research
and extension to improve the qual-
ity and effectiveness of the research
and extension system. The extension
system will be revitalized and made
more broad-based through KVKs,
NGOs, farmer’s organization, Coop-
eratives, agri-clinics, etc.
FACTORS AGGRAVATING UNSUSTAINABILITY
FACTORS CONSTRAINING
THE GREENING OF INDIAN
AGRICULTURE:Though the prospects are good for green
agriculture in India, it is still not growing
fast enough to motivate a larger section of
the farming community to opt for organic
agriculture.
The major problems hindering the growth
of organic agriculture in India are listed
as follows:
From producers/distributors/trad-ers’ point of view:
Lack of proper infrastructure for dis-
tribution and conservation of bio-in-
puts is a major constraint that hinders
the access of farmers to these inputs.
Poor quality bio-inputs reduces the
credibility of input providers. Lack of
quality control mechanisms for bio-in-
puts reinforces the mistrust among
farmers.
The low penetration of the bio-in-
puts market and the limited shelf-
life of the product are a disincen-
tive to traders to store and sell bio-
inputs.
From users’ (farmers’) point of view:Bio-fertilizers and bio-pesticides are perceived
as less effective than chemicals.
Some climatic regions and soil conditions
are not suitable for specific strains of or-
ganic production.
The limited shelf life (e.g., 4-6 months) of
bio-inputs is another constraint to their adop-
tion.
Given the time it takes for a conventional
farm to become fully organic (i.e., three
years), farmers, in general, and small and
marginal farmers, in particular, are unable
to appreciate the benefits from switching
to organic farming given their short-term
orientation practice.
From promoters’ (Government’s) pointof view:
Agricultural departments, research institu-
tions and extension services have for long
been oriented towards chemical input
agriculture and would therefore need to
be reoriented towards organic (green)
agriculture.
Changing the cropping and cultivation
patterns is a slow and time-consuming pro-
cess given the high levels of illiteracy and
large number of small and marginal farm-
ers.
Enhancing Capacities on Sustainable Agriculture for Poverty Reduction 39
Subsidies on chemical fertilizers and pes-
ticides impede the growth of organic ag-
riculture.
FACTORS LIMITING THE
GROWTH OF THE ORGANIC
PRODUCTS MARKET
Lack of market information in general and
organic market information in particular is
the biggest barrier faced by Indian organic
agriculture. The current information base
is low and even the limited information
available does not get disseminated due
to lack of adequate channels for dissemi-
nation. As a result, farmers are in a pre-
dicament, as they are unable to attune their
production practices to market changes. A
marketing network specifically for organic
products has not yet been developed for
both the domestic and export markets.
The quality of the Indian food industry is
always a constraint to growth; incon-
sistent quality and contamination in
food products are hindrances to
capturing a big share of the inter-
national market.
The high cost (Rs.22,000 to Rs.29,200 per certi-
fication) (Garibay S V and Jyoti K, 2003), not to
mention the time it takes to get farms
certified as organic, and the complex-
ity of the whole process is a major de-
terrent to the development of organic
production in the country, particularly
among small farmers.
Government has shown little inter-
est in organic agriculture, i.e., there
is still no direct support from gov-
ernment in terms of subsidy or mar-
ket support for organic agriculture.
Lack of proper infrastructure, i.e.,
farm-to-market roads, cold storage fa-
cilities, and transportation, affects the
cost, quality and reach of producers.
Indian organic agriculture is very frag-
mented; there are no organizations
managing the entire value chain of
organic products.
Many of the problems listed above are due
to the relative newness of this sector from
the point of view of the different play-
ers.
FACTORS THAT PROMOTE
THE GREENING OF INDIAN
AGRICULTURE
Despite constraints, groups still push for organic
agriculture because it offers economic opportu-
nities for different stakeholders. Some of the drivers
that facilitate the growth of organic agriculture
in India are:
Growing export market for organically
grown crops (Kortbech-Olesen, 2003)
Price premium of 10-100 percent for
organic agriculture products (V.
Garibay, K. Jyoti, 2003)
Diverse agro-climate regions across the
country that can support a wide range
of crops that cater to different mar-
ket demands
Increasing awareness and health con-
sciousness, especially among certain
sectors of domestic consumers
SUSTAINABLE AGRICULTURE INITIATIVES AND INSIGHTS
Asia–Japan Partnership Network for Poverty Reduction (AJPN)
40 National Agriculture Situationers
is dedicated to providing informa-
tion on organic agricultural export
market potentials in different parts
of the world and the price premium
that different products command
Establishment of a Special Organic
Agriculture Trade Zone (OATZ) for the
domestic and export markets that can
help traders get access to farm prod-
ucts, and consumers, to agro- based
food processors and retailers
Tax breaks/ incentives for traders/ex-
porters dealing in organic products.
Government subsidies and financial as-
sistance for organic food processing in-
dustries, as well as the necessary facili-
ties to enhance the prospects of organic
exports.
From producers’ point of view:Popularization of existing schemes
to promote the use of bio-fertiliz-
ers as well as other bio-inputs
Assistance in the marketing of bio-in-
puts, specifically through the govern-
ment network, and also involving the
network of co-operative societies at
village level in the distribution of these
bio-inputs
Improvement of infrastructure, like
roads, transportation facilities, stor-
age facilities, etc., to enhance the for-
ward and backward links in the or-
ganic products supply chain
Promotion of corporate research on or-
ganic agronomic practices, bio- control
of diseases and pests, and bio-fertiliz-
ers, etc.
Gradual phasing out of the subsidy
for synthetic fertilizers/pesticides and
grant of subsidies for promotion of
bio-inputs
Availability of comparatively cheap
labor for labor-intensive organic ag-
riculture
Huge numbers of small farmers that
are engaged in traditional farming
and have very limited capacity to
pay for chemical inputs for agricul-
ture (Planning Commission, 2001)
Presence of non-government orga-
nizations (NGOs) as active promot-
ers of organic farming in different
agro-climatic regions (Donthi N.
Reddy, 2001)
Increasing involvement of private com-
panies in agricultural extension, trade,
consulting and other services
Greater government attention and sup-
port for organic agriculture through
various policy initiations and action pro-
grams.
Non-Government Organizations have been
playing a crucial role in promoting or-
ganic agricultural practices in the coun-
try. However, changing agricultural prac-
tices requires change in the culture and
mindset of farmers, which can only be
achieved by a long-drawn program. NGOs
have demonstrated capabilities to this
effect. An example of public-private part-
nership is the successful story of Spice
Board’s involvement of NGOs to enhance
organic production of spices in Kerala,
Tamilnadu, Andhra Pradesh and North
Eastern states (Shenoy, 2003).
The following measures/initiatives have
been recommended to promote Green Ag-
riculture in India:
From traders’ point of view:Establishment of a unit within the
Ministry of Commerce and Trade that
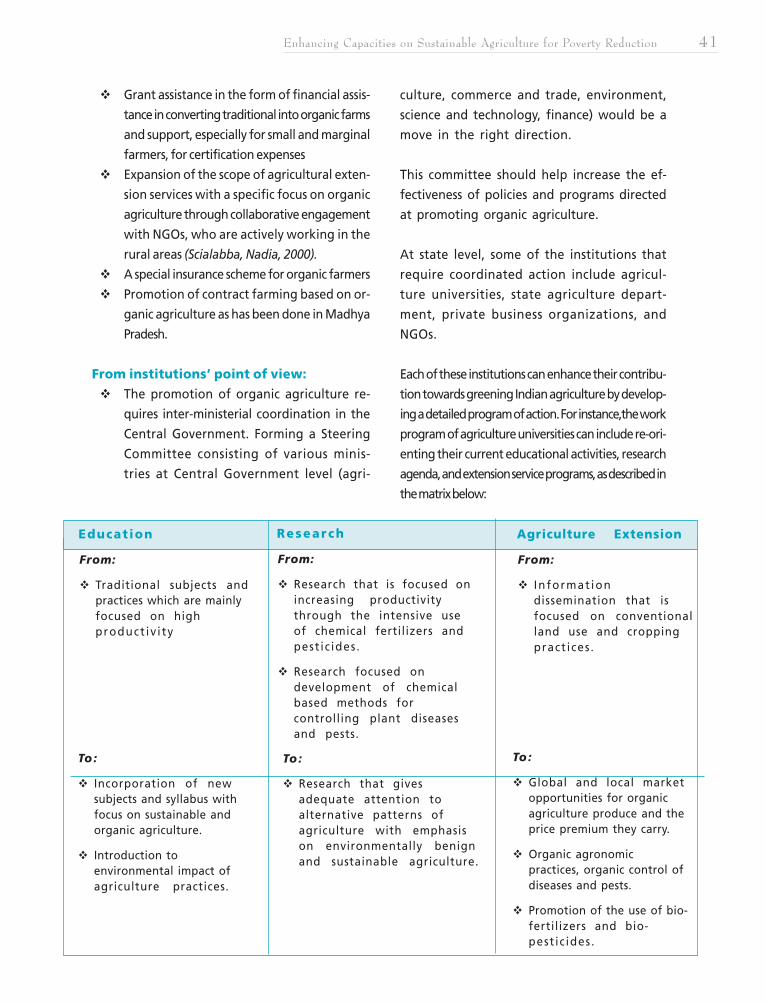
Enhancing Capacities on Sustainable Agriculture for Poverty Reduction 41
Grant assistance in the form of financial assis-
tance in converting traditional into organic farms
and support, especially for small and marginal
farmers, for certification expenses
Expansion of the scope of agricultural exten-
sion services with a specific focus on organic
agriculture through collaborative engagement
with NGOs, who are actively working in the
rural areas (Scialabba, Nadia, 2000).
A special insurance scheme for organic farmers
Promotion of contract farming based on or-
ganic agriculture as has been done in Madhya
Pradesh.
From institutions’ point of view:The promotion of organic agriculture re-
quires inter-ministerial coordination in the
Central Government. Forming a Steering
Committee consisting of various minis-
tries at Central Government level (agri-
culture, commerce and trade, environment,
science and technology, finance) would be a
move in the right direction.
This committee should help increase the ef-
fectiveness of policies and programs directed
at promoting organic agriculture.
At state level, some of the institutions that
require coordinated action include agricul-
ture universities, state agriculture depart-
ment, private business organizations, and
NGOs.
Each of these institutions can enhance their contribu-
tion towards greening Indian agriculture by develop-
ing a detailed program of action. For instance,the work
program of agriculture universities can include re-ori-
enting their current educational activities, research
agenda, and extension service programs, as described in
the matrix below:
Agriculture Extension
From:
Informat iondissemination that isfocused on conventionalland use and croppingpract ices .
Educat ion
From:
Traditional subjects andpractices which are mainlyfocused on highproduct iv i ty
Research
From:
Research that is focused onincreasing productivitythrough the intensive useof chemical fertilizers andpest ic ides.
Research focused ondevelopment of chemicalbased methods forcontrolling plant diseasesand pests.
To:
Incorporation of newsubjects and syllabus withfocus on sustainable andorganic agriculture.
Introduction toenvironmental impact ofagriculture practices.
To:
Research that givesadequate attention toalternative patterns ofagriculture with emphasison environmentally benignand sustainable agriculture.
To:
Global and local marketopportunities for organicagriculture produce and theprice premium they carry.
Organic agronomicpractices, organic control ofdiseases and pests.
Promotion of the use of bio-fertilizers and bio-pest ic ides.
Asia–Japan Partnership Network for Poverty Reduction (AJPN)
42 National Agriculture Situationers
Experience elsewhere shows that govern-
ment has to play a key role in the develop-
ment of organic agricultural production and
in enhancing marketing opportunities for
such products (Scialabba Nadia, 2000).
Towards this end, there is a need for a policy
framework to support the greening of ag-
riculture in India.
A favorable policy environment can help
create the market conditions that would
encourage the production of bio-inputs,
which could in turn propel changes in crop-
ping patterns in favor of organic practices.
The attention being given by government
to organic agriculture, both in terms of policy
CASE STUDY
In the past 10 years, Institute for Intergrated Rural Development (IIRD) hascontributed effectively to promoting organic agriculture through informa-tion exchange, awareness raising, standards development, and by increas-ing the role of women in multi-dimensional functions of agriculture at thelocal (Paithan Taluka of Maharashtra State), national (India) and regional(Asia) levels.
IIRD’s objective is to find alternatives to the current chemical, non-viable andenvironmentally destructive modes of conventional agriculture, as well as tobring about environmental, socio-economic and cultural stability andsustainability through agriculture.
Objectives and purpose:To find alternatives to the current chemical, non-viable and environmen-tally destructive modes of conventional agriculture.To bring about environmental, socio economic and cultural stability andsustainability through agriculture.
Duration: From 1987 to present
The process was initiated by: Social activists, reformers and women leadersfrom Maharashtra, India and the chief functionary of the project, Dr. AlexanderDaniel.
Needs addressed:poverty alleviationfood security
to next page
environmental sustainabilitycapacity-building of communities
FUTURE DIRECTIONS AND ACTIONS: A Perspective
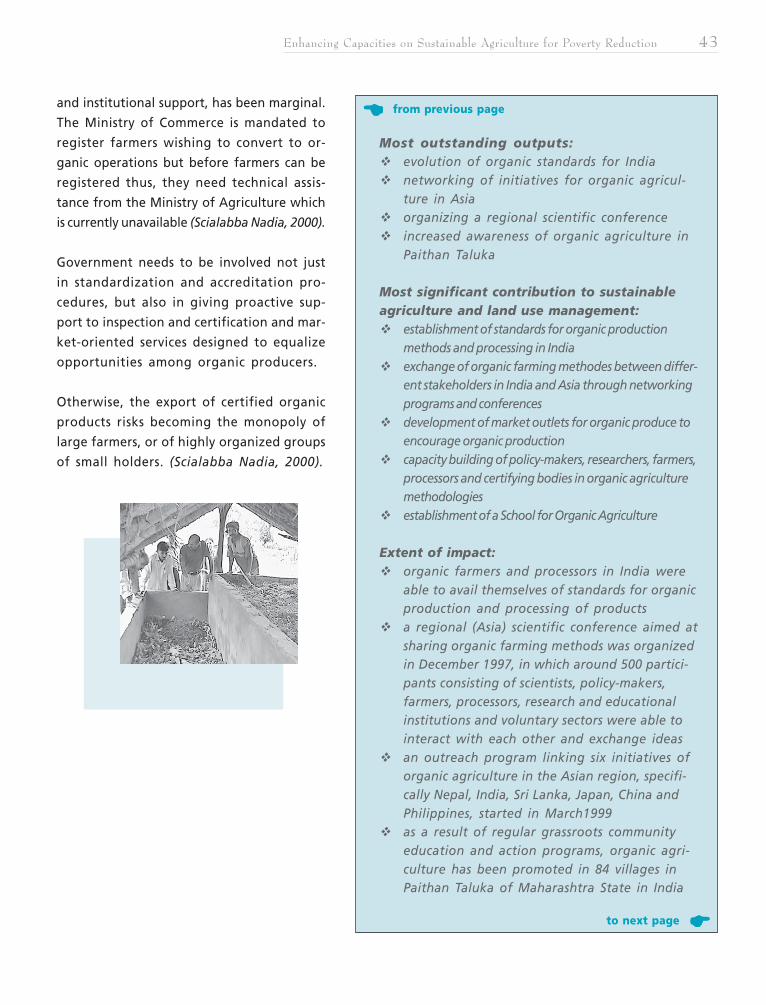
Enhancing Capacities on Sustainable Agriculture for Poverty Reduction 43
Most outstanding outputs:evolution of organic standards for Indianetworking of initiatives for organic agricul-ture in Asiaorganizing a regional scientific conferenceincreased awareness of organic agriculture inPaithan Taluka
Most significant contribution to sustainableagriculture and land use management:
establishment of standards for organic productionmethods and processing in Indiaexchange of organic farming methodes between differ-ent stakeholders in India and Asia through networkingprograms and conferencesdevelopment of market outlets for organic produce toencourage organic productioncapacity building of policy-makers, researchers, farmers,processors and certifying bodies in organic agriculturemethodologiesestablishment of a School for Organic Agriculture
Extent of impact:organic farmers and processors in India wereable to avail themselves of standards for organicproduction and processing of productsa regional (Asia) scientific conference aimed atsharing organic farming methods was organizedin December 1997, in which around 500 partici-pants consisting of scientists, policy-makers,farmers, processors, research and educationalinstitutions and voluntary sectors were able tointeract with each other and exchange ideasan outreach program linking six initiatives oforganic agriculture in the Asian region, specifi-cally Nepal, India, Sri Lanka, Japan, China andPhilippines, started in March1999as a result of regular grassroots communityeducation and action programs, organic agri-culture has been promoted in 84 villages inPaithan Taluka of Maharashtra State in India
and institutional support, has been marginal.
The Ministry of Commerce is mandated to
register farmers wishing to convert to or-
ganic operations but before farmers can be
registered thus, they need technical assis-
tance from the Ministry of Agriculture which
is currently unavailable (Scialabba Nadia, 2000).
Government needs to be involved not just
in standardization and accreditation pro-
cedures, but also in giving proactive sup-
port to inspection and certification and mar-
ket-oriented services designed to equalize
opportunities among organic producers.
Otherwise, the export of certified organic
products risks becoming the monopoly of
large farmers, or of highly organized groups
of small holders. (Scialabba Nadia, 2000).
from previous page
to next page
Asia–Japan Partnership Network for Poverty Reduction (AJPN)
44 National Agriculture Situationers
Methods used to monitor and evaluate multi-functional impacts:increase in awareness among the different stakeholders of organic agri-culture in the regionchanges in agricultural policy at local, national and regional levelsincrease in demand and expansion of markets for organic produce
The most import elements (key ingredients) which contributed tosuccess:
the need expressed by stakeholders involved in food production and byconsumers for alternative, environmentally sound methodologies forfood productionpresent depressing socio-economic situation among farmers due to non-viability of existing resource-intensive methodologies
Factors that might affect replicability:local environmental conditionsexisting agricultural policysocial attitudes and consumer behaviorpolitical situationtrade relations
Factors that influence sustainability:ethical behavior of societyproper policy mechanismsproper inter-linking mechanisms of different roles in agricultureeffective interaction and participative mechanisms
The most important lessons learned:proper networking was possible at all levels (local, national and regional level)information exchange was made possible at all levelssocial and cultural importance was emphasizedwomen have to be involved as prime mobilizers in the process of shift-ing from conventional agriculture to organic agricultural system.
How this case enhanced the multiple use of agricultural land and water:land use, which was perceived only from the economic context, is nowseen as a way to transform social behavior to bring about environmen-tal sustainability. With this change in the thought process, all the com-ponents of nature would be effectively and sustainably managedopening of market outlets for marketing of organic producean increased role for women in decision-making in organic agriculture
from previous page
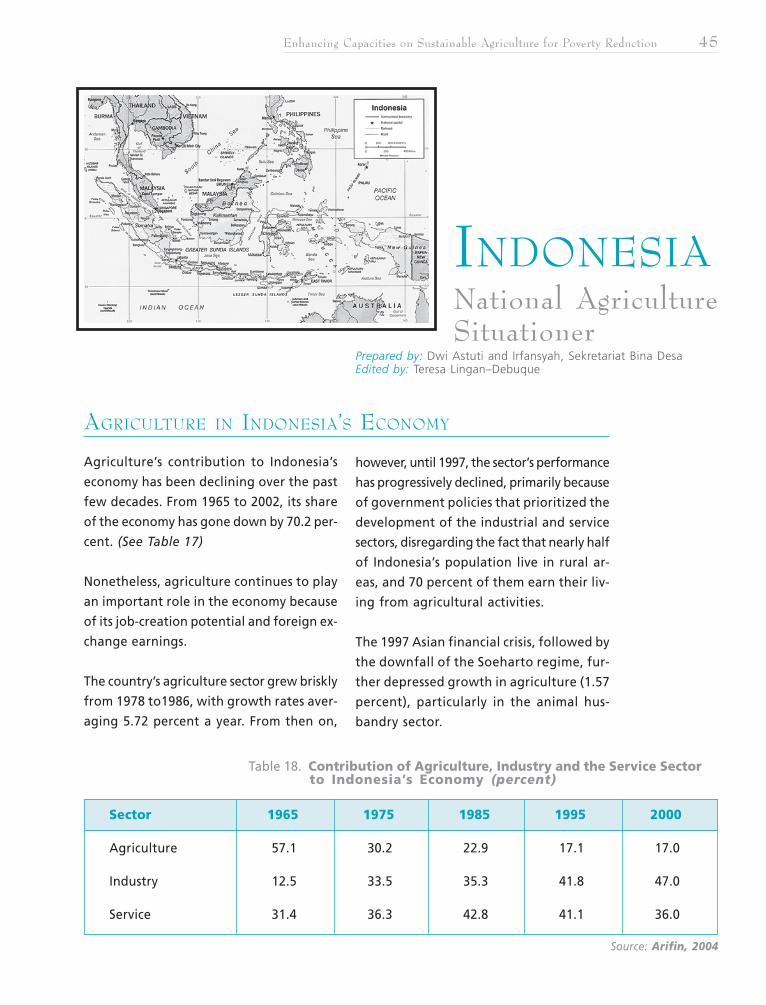
Enhancing Capacities on Sustainable Agriculture for Poverty Reduction 45
AGRICULTURE IN INDONESIA’S ECONOMY
INDONESIANational AgricultureSituationer
Agriculture’s contribution to Indonesia’s
economy has been declining over the past
few decades. From 1965 to 2002, its share
of the economy has gone down by 70.2 per-
cent. (See Table 17)
Nonetheless, agriculture continues to play
an important role in the economy because
of its job-creation potential and foreign ex-
change earnings.
The country’s agriculture sector grew briskly
from 1978 to1986, with growth rates aver-
aging 5.72 percent a year. From then on,
however, until 1997, the sector’s performance
has progressively declined, primarily because
of government policies that prioritized the
development of the industrial and service
sectors, disregarding the fact that nearly half
of Indonesia’s population live in rural ar-
eas, and 70 percent of them earn their liv-
ing from agricultural activities.
The 1997 Asian financial crisis, followed by
the downfall of the Soeharto regime, fur-
ther depressed growth in agriculture (1.57
percent), particularly in the animal hus-
bandry sector.
Prepared by: Dwi Astuti and Irfansyah, Sekretariat Bina DesaEdited by: Teresa Lingan–Debuque
Source: Arifin, 2004
Sector 1965 1975 1985 1995 2000
Agriculture 57.1 30.2 22.9 17.1 17.0
Industry 12.5 33.5 35.3 41.8 47.0
Service 31.4 36.3 42.8 41.1 36.0
Table 18. Contribution of Agriculture, Industry and the Service Sector to Indonesia’s Economy (percent)
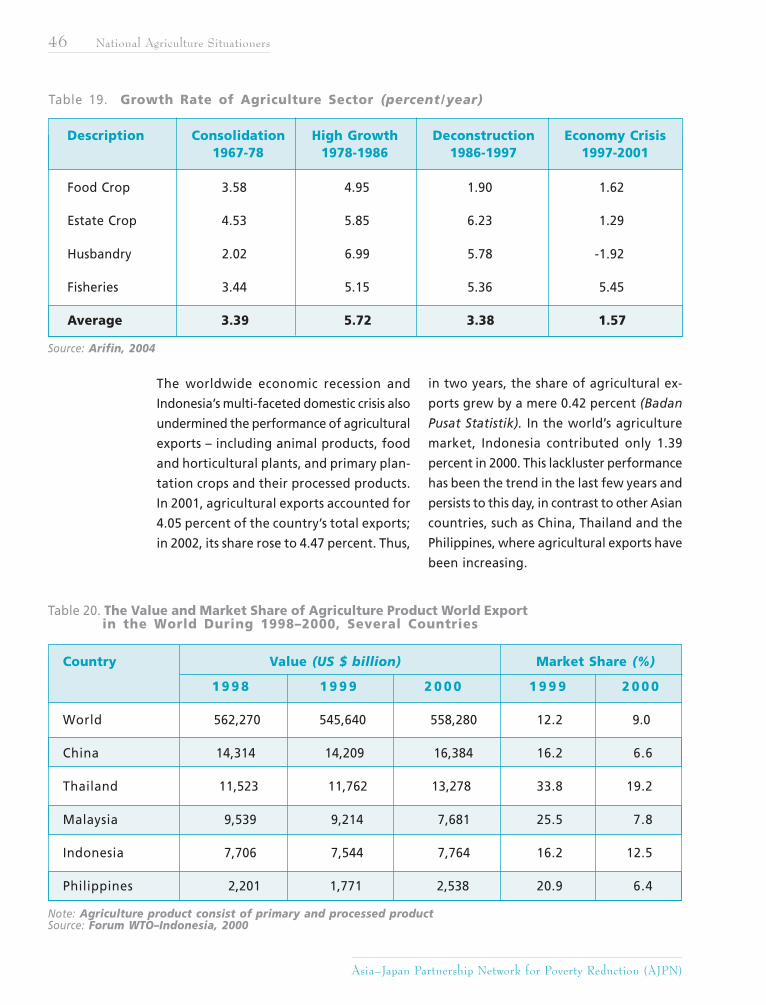
Asia–Japan Partnership Network for Poverty Reduction (AJPN)
46 National Agriculture Situationers
The worldwide economic recession and
Indonesia’s multi-faceted domestic crisis also
undermined the performance of agricultural
exports – including animal products, food
and horticultural plants, and primary plan-
tation crops and their processed products.
In 2001, agricultural exports accounted for
4.05 percent of the country’s total exports;
in 2002, its share rose to 4.47 percent. Thus,
in two years, the share of agricultural ex-
ports grew by a mere 0.42 percent (Badan
Pusat Statistik). In the world’s agriculture
market, Indonesia contributed only 1.39
percent in 2000. This lackluster performance
has been the trend in the last few years and
persists to this day, in contrast to other Asian
countries, such as China, Thailand and the
Philippines, where agricultural exports have
been increasing.
Table 19. Growth Rate of Agriculture Sector (percent/year)
Description Consolidation High Growth Deconstruction Economy Crisis1967-78 1978-1986 1986-1997 1997-2001
Food Crop 3.58 4.95 1.90 1.62
Estate Crop 4.53 5.85 6.23 1.29
Husbandry 2.02 6.99 5.78 -1.92
Fisheries 3.44 5.15 5.36 5.45
Average 3.39 5.72 3.38 1.57
Source: Arifin, 2004
Table 20. The Value and Market Share of Agriculture Product World Export in the World During 1998–2000, Several Countries
Note: Agriculture product consist of primary and processed productSource: Forum WTO–Indonesia, 2000
Country Value (US $ billion) Market Share (%)
1 9 9 8 1 9 9 9 2 0 0 0 1 9 9 9 2 0 0 0
World 562,270 545,640 558,280 12.2 9.0
China 14,314 14,209 16,384 16.2 6.6
Thailand 11,523 11,762 13,278 33.8 19.2
Malaysia 9,539 9,214 7,681 25.5 7.8
Indonesia 7,706 7,544 7,764 16.2 12.5
Philippines 2,201 1,771 2,538 20.9 6.4
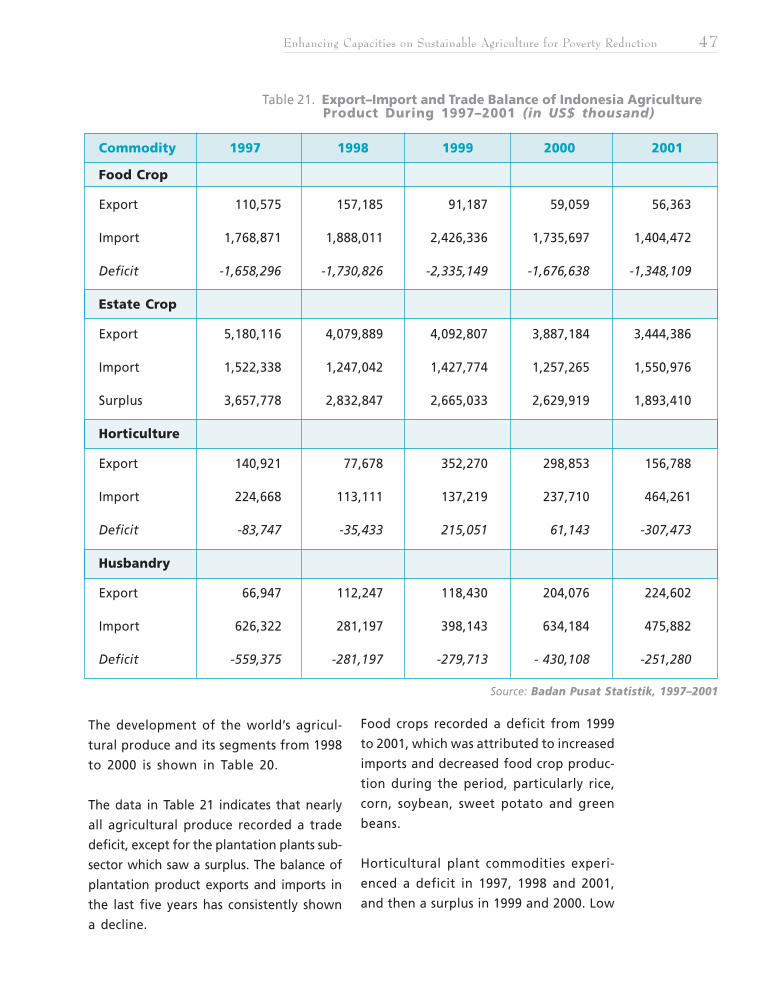
Enhancing Capacities on Sustainable Agriculture for Poverty Reduction 47
The development of the world’s agricul-
tural produce and its segments from 1998
to 2000 is shown in Table 20.
The data in Table 21 indicates that nearly
all agricultural produce recorded a trade
deficit, except for the plantation plants sub-
sector which saw a surplus. The balance of
plantation product exports and imports in
the last five years has consistently shown
a decline.
Food crops recorded a deficit from 1999
to 2001, which was attributed to increased
imports and decreased food crop produc-
tion during the period, particularly rice,
corn, soybean, sweet potato and green
beans.
Horticultural plant commodities experi-
enced a deficit in 1997, 1998 and 2001,
and then a surplus in 1999 and 2000. Low
Table 21. Export–Import and Trade Balance of Indonesia Agriculture Product During 1997–2001 (in US$ thousand)
Source: Badan Pusat Statistik, 1997–2001
Commodity 1997 1998 1999 2000 2001
Food Crop
Export 110,575 157,185 91,187 59,059 56,363
Import 1,768,871 1,888,011 2,426,336 1,735,697 1,404,472
Deficit -1,658,296 -1,730,826 -2,335,149 -1,676,638 -1,348,109
Estate Crop
Export 5,180,116 4,079,889 4,092,807 3,887,184 3,444,386
Import 1,522,338 1,247,042 1,427,774 1,257,265 1,550,976
Surplus 3,657,778 2,832,847 2,665,033 2,629,919 1,893,410
Horticulture
Export 140,921 77,678 352,270 298,853 156,788
Import 224,668 113,111 137,219 237,710 464,261
Deficit -83,747 -35,433 215,051 61,143 -307,473
Husbandry
Export 66,947 112,247 118,430 204,076 224,602
Import 626,322 281,197 398,143 634,184 475,882
Deficit -559,375 -281,197 -279,713 - 430,108 -251,280
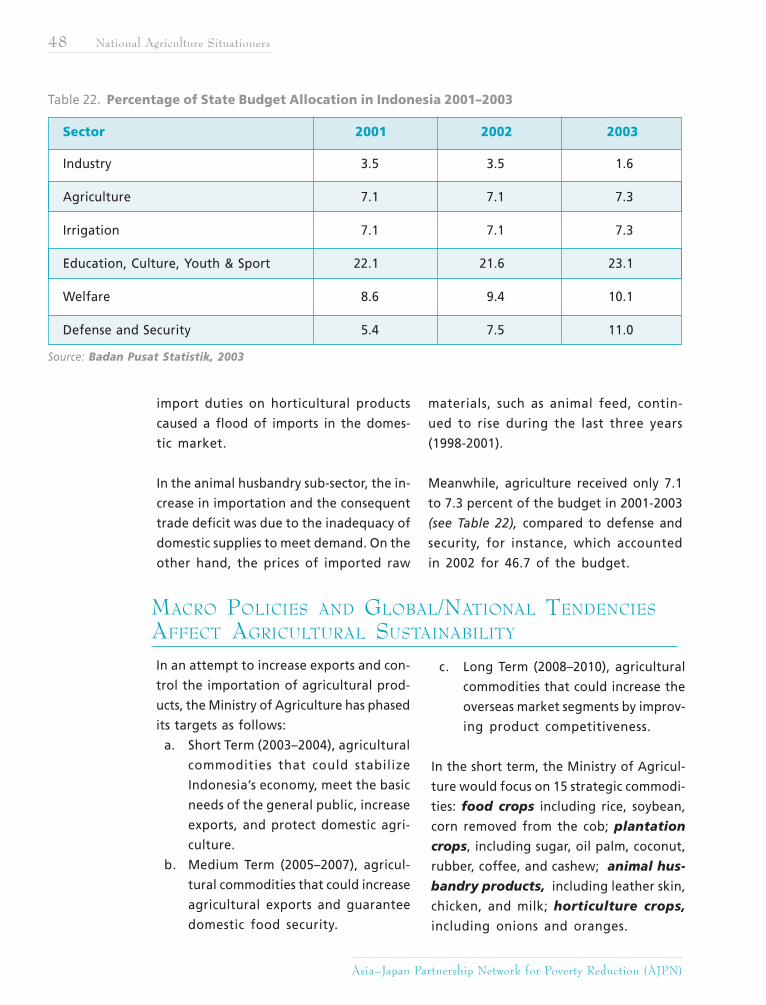
Asia–Japan Partnership Network for Poverty Reduction (AJPN)
48 National Agriculture Situationers
import duties on horticultural products
caused a flood of imports in the domes-
tic market.
In the animal husbandry sub-sector, the in-
crease in importation and the consequent
trade deficit was due to the inadequacy of
domestic supplies to meet demand. On the
other hand, the prices of imported raw
materials, such as animal feed, contin-
ued to rise during the last three years
(1998-2001).
Meanwhile, agriculture received only 7.1
to 7.3 percent of the budget in 2001-2003
(see Table 22), compared to defense and
security, for instance, which accounted
in 2002 for 46.7 of the budget.
MACRO POLICIES AND GLOBAL/NATIONAL TENDENCIES
AFFECT AGRICULTURAL SUSTAINABILITY
In an attempt to increase exports and con-
trol the importation of agricultural prod-
ucts, the Ministry of Agriculture has phased
its targets as follows:
a. Short Term (2003–2004), agricultural
commodities that could stabilize
Indonesia’s economy, meet the basic
needs of the general public, increase
exports, and protect domestic agri-
culture.
b. Medium Term (2005–2007), agricul-
tural commodities that could increase
agricultural exports and guarantee
domestic food security.
c. Long Term (2008–2010), agricultural
commodities that could increase the
overseas market segments by improv-
ing product competitiveness.
In the short term, the Ministry of Agricul-
ture would focus on 15 strategic commodi-
ties: food crops including rice, soybean,
corn removed from the cob; plantation
crops, including sugar, oil palm, coconut,
rubber, coffee, and cashew; animal hus-
bandry products, including leather skin,
chicken, and milk; horticulture crops,
including onions and oranges.
Table 22. Percentage of State Budget Allocation in Indonesia 2001–2003
Source: Badan Pusat Statistik, 2003
Sector 2001 2002 2003
Industry 3.5 3.5 1.6
Agriculture 7.1 7.1 7.3
Irrigation 7.1 7.1 7.3
Education, Culture, Youth & Sport 22.1 21.6 23.1
Welfare 8.6 9.4 10.1
Defense and Security 5.4 7.5 11.0
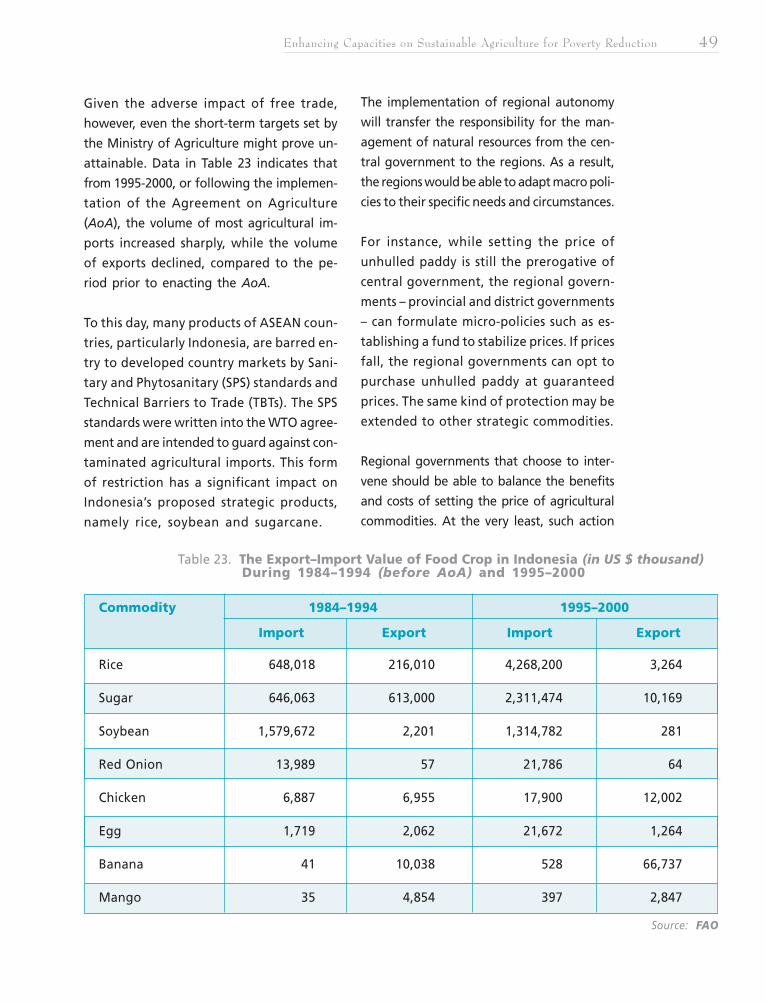
Enhancing Capacities on Sustainable Agriculture for Poverty Reduction 49
Given the adverse impact of free trade,
however, even the short-term targets set by
the Ministry of Agriculture might prove un-
attainable. Data in Table 23 indicates that
from 1995-2000, or following the implemen-
tation of the Agreement on Agriculture
(AoA), the volume of most agricultural im-
ports increased sharply, while the volume
of exports declined, compared to the pe-
riod prior to enacting the AoA.
To this day, many products of ASEAN coun-
tries, particularly Indonesia, are barred en-
try to developed country markets by Sani-
tary and Phytosanitary (SPS) standards and
Technical Barriers to Trade (TBTs). The SPS
standards were written into the WTO agree-
ment and are intended to guard against con-
taminated agricultural imports. This form
of restriction has a significant impact on
Indonesia’s proposed strategic products,
namely rice, soybean and sugarcane.
The implementation of regional autonomy
will transfer the responsibility for the man-
agement of natural resources from the cen-
tral government to the regions. As a result,
the regions would be able to adapt macro poli-
cies to their specific needs and circumstances.
For instance, while setting the price of
unhulled paddy is still the prerogative of
central government, the regional govern-
ments – provincial and district governments
– can formulate micro-policies such as es-
tablishing a fund to stabilize prices. If prices
fall, the regional governments can opt to
purchase unhulled paddy at guaranteed
prices. The same kind of protection may be
extended to other strategic commodities.
Regional governments that choose to inter-
vene should be able to balance the benefits
and costs of setting the price of agricultural
commodities. At the very least, such action
Table 23. The Export–Import Value of Food Crop in Indonesia (in US $ thousand) During 1984–1994 (before AoA) and 1995–2000
Source: FAO
Commodity 1984–1994 1995–2000
Import Export Import Export
Rice 648,018 216,010 4,268,200 3,264
Sugar 646,063 613,000 2,311,474 10,169
Soybean 1,579,672 2,201 1,314,782 281
Red Onion 13,989 57 21,786 64
Chicken 6,887 6,955 17,900 12,002
Egg 1,719 2,062 21,672 1,264
Banana 41 10,038 528 66,737
Mango 35 4,854 397 2,847
Asia–Japan Partnership Network for Poverty Reduction (AJPN)
50 National Agriculture Situationers
should not be detrimental to peasant pro-
ducers.
Fluctuating prices of food products and farm
production facilities are quickly reflected
at the peasant level. Price changes in the
world market translate to relatively bigger
price changes in the domestic market.
A. RICE
Table 24 shows that rice consumption from
1998-2002 fluctuated from year to year, and
tended to increase. Rice imports grew in
the same period following the implemen-
tation of the AoA and in the aftermath of
the country’s economic crisis. After 2001,
the volume of rice imports declined, due
to higher import duties: from 0percent to
Rp. 430/kg (US$ 0.05).
In 2004, the government increased the basic prices
of dried, husked paddy from Rp. 1,500 to Rp.
1,725 (US$ 0.18-0.20) a kilogram. Due to the
inadequate implementation of price controls,
however, dried, husked paddy generally sell for
much less at Rp. 900 to Rp. 1,200 (US$ 0.11-
0.14).
Siregar, M. (2001) cites several factors that work against
price controls for paddy, as follows:
1. The recommended price of dried, husked
paddy (Rp. 1,500/kg) (US$ 0.18) is consid-
ered too high given the current economic
condition;
2. There are not enough funds for food pro-
curement, especially after the abolition of
KLBI (Liquidity Credit of Bank Indonesia)
for Cooperatives and Bulog;
3. Under liberalization, the private sector is free
to import rice at 0 percent duty;
4. The Special Market Operation (OPK),
which bought rice in greater volumes
and at lower prices (200,000 tons/
month at Rp. 1,000/kg [US$ 0.12/kg])
affected the demand; and
5. Traders/the private sector doubt
government’s commitment to maintain
the basic price for paddy.
The incongruence of policies related to this
crop has also tended to undermine efforts
to stabilize paddy prices.
For instance, while the Ministry of Agricul-
ture has raised the basic price of paddy for
the benefit of the peasants, the Ministry
of Industry and Trade has opened the country
to a flood of cheaper-priced imports, send-
ing rice prices on a nosedive.
In August 2000, rice was selling at US$ 169/
ton or Rp.1,850/kg in the world market, while
domestic rice was priced as high as Rp. 2,450/
kg (US$ 0.29/kg). The trend continued in the
first quarter of 2001, when world rice prices
reached US$ 150/ton, while domestic rice
prices averaged Rp. 2,100/kg (US$ 0.25).
B. SOYBEAN
The demand for soybeans increased from 1997
to 2002 by an average of 3.48 percent a year,
while soybean production decreased by 8.6
percent a year in the last decade. The demand
was fueled by several food processing indus-
tries, such as makers of tofu, tempe, ketchup
and tauco.
Domestic soybean production has been able
to meet only 70 percent of domestic de-
mand. The shortfall has been made up by
imports, which are cheaper. Soybean im-
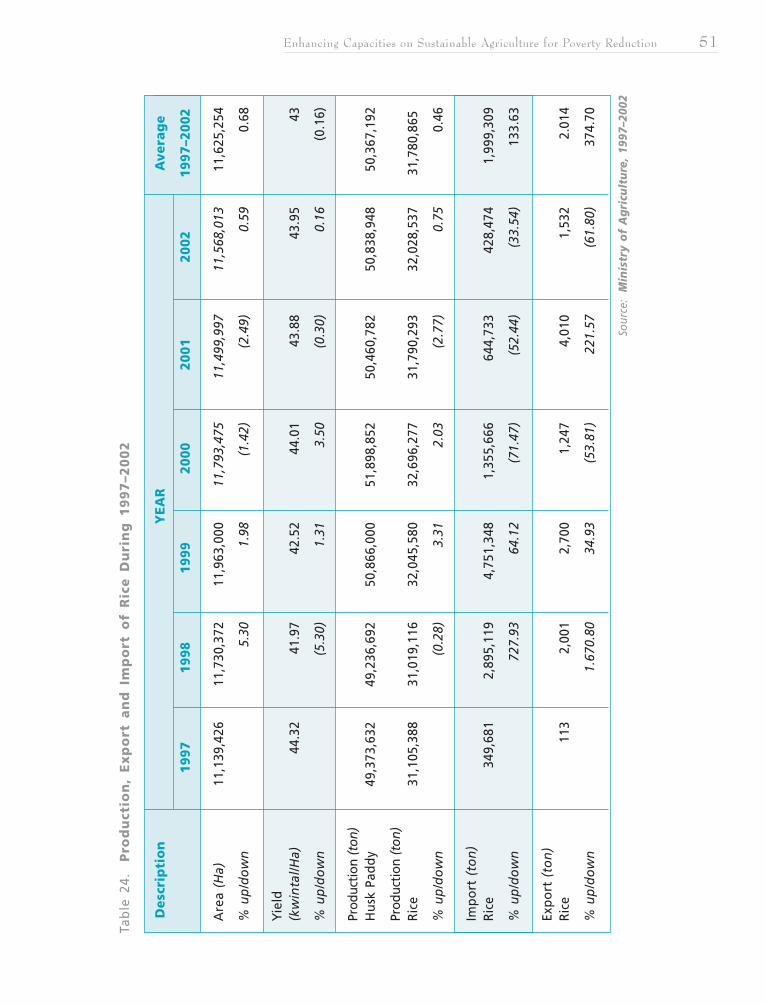
Enhancing Capacities on Sustainable Agriculture for Poverty Reduction 51
Tab
le 2
4.
Pro
du
ctio
n,
Ex
po
rt a
nd
Im
po
rt o
f R
ice
Du
rin
g 1
99
7–2
00
2
Sour
ce:
Min
istr
y o
f A
gri
cult
ure
, 19
97–2
002
Des
crip
tio
nY
EAR
Ave
rag
e
1997
1998
1999
2000
2001
2002
1997
–200
2
Are
a (H
a)11
,139
,426
11,7
30,3
7211
,963
,000
11,7
93,4
7511
,499
,997
11,5
68,0
1311
,625
,254
% u
p/d
ow
n5.
301.
98(1
.42)
(2.4
9)0.
590.
68
Yie
ld(k
win
tal/H
a)44
.32
41.9
742
.52
44.0
143
.88
43.9
543
% u
p/d
ow
n(5
.30)
1.31
3.50
(0.3
0)0.
16(0
.16)
Prod
ucti
on (t
on)
Hus
k Pa
ddy
49,3
73,6
3249
,236
,692
50,8
66,0
0051
,898
,852
50,4
60,7
8250
,838
,948
50,3
67,1
92
Prod
ucti
on (t
on)
Rice
31,1
05,3
8831
,019
,116
32,0
45,5
8032
,696
,277
31,7
90,2
9332
,028
,537
31,7
80,8
65
% u
p/d
ow
n(0
.28)
3.31
2.03
(2.7
7)0.
750.
46
Impo
rt (
ton
)Ri
ce34
9,68
12,
895,
119
4,75
1,34
81,
355,
666
644,
733
428,
474
1,99
9,30
9
% u
p/d
ow
n72
7.93
64.1
2(7
1.47
)(5
2.44
)(3
3.54
)13
3.63
Exp
ort
(to
n)
Rice
113
2,00
12,
700
1,24
74,
010
1,53
22.
014
% u
p/d
ow
n1.
670.
8034
.93
(53.
81)
221.
57(6
1.80
)37
4.70
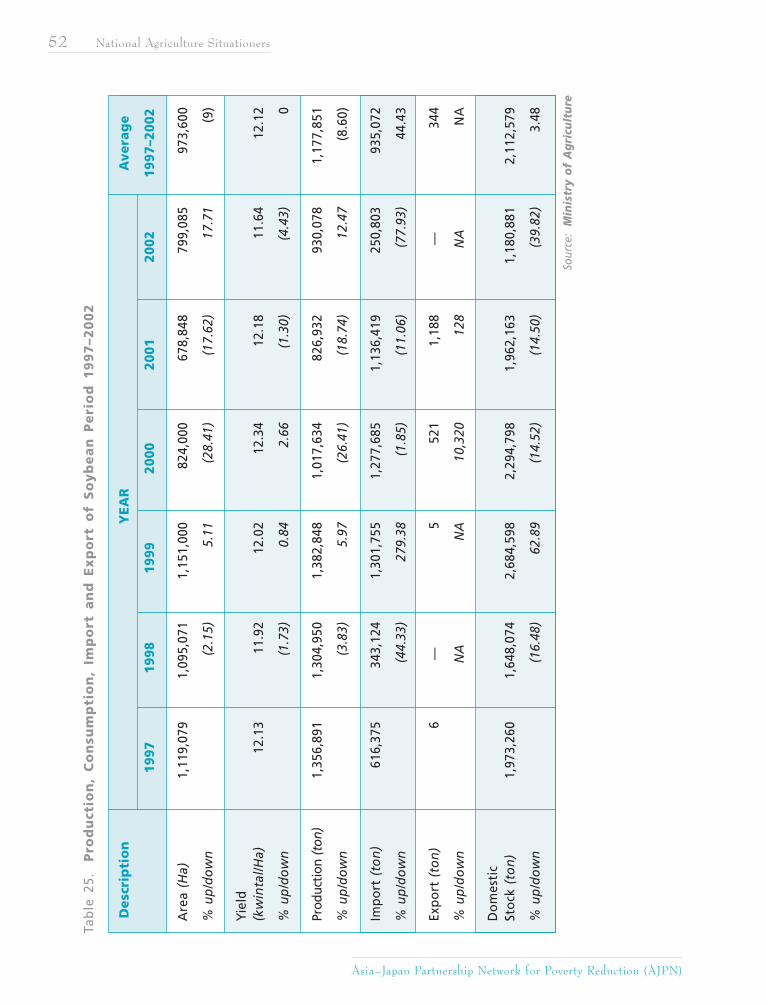
Asia–Japan Partnership Network for Poverty Reduction (AJPN)
52 National Agriculture Situationers
Tab
le 2
5.
Pro
du
ctio
n,
Co
nsu
mp
tio
n,
Imp
ort
an
d E
xp
ort
of
So
yb
ea
n P
eri
od
19
97
–20
02
Sour
ce:
Min
istr
y o
f A
gri
cult
ure
Des
crip
tio
nY
EAR
Ave
rag
e
1997
1998
1999
2000
2001
2002
1997
–200
2
Are
a (H
a)1,
119,
079
1,09
5,07
11,
151,
000
824,
000
678,
848
799,
085
973,
600
% u
p/d
ow
n(2
.15)
5.11
(28.
41)
(17.
62)
17.7
1(9
)
Yie
ld(k
win
tal/H
a)12
.13
11.9
212
.02
12.3
412
.18
11.6
412
.12
% u
p/d
ow
n(1
.73)
0.84
2.66
(1.3
0)(4
.43)
0
Prod
ucti
on (t
on)
1,35
6,89
11,
304,
950
1,38
2,84
81,
017,
634
826,
932
930,
078
1,17
7,85
1
% u
p/d
ow
n(3
.83)
5.97
(26.
41)
(18.
74)
12.4
7(8
.60)
Impo
rt (
ton
)61
6,37
534
3,12
41,
301,
755
1,27
7,68
51,
136,
419
250,
803
935,
072
% u
p/d
ow
n(4
4.33
)27
9.38
(1.8
5)(1
1.06
)(7
7.93
)44
.43
Exp
ort
(to
n)
6—
552
11,
188
—34
4
% u
p/d
ow
nN
AN
A10
,320
128
NA
NA
Dom
esti
cSt
ock
(to
n)
1,97
3,26
01,
648,
074
2,68
4,59
82,
294,
798
1,96
2,16
31,
180,
881
2,11
2,57
9
% u
p/d
ow
n(1
6.48
)62
.89
(14.
52)
(14.
50)
(39.
82)
3.48
Enhancing Capacities on Sustainable Agriculture for Poverty Reduction 53
ports, encouraged by the 0 percent duty that
took effect in 1999, are expected to grow
even further, especially following the aboli-
tion of the BULOG (Logistics Business
Agency) as the country’s exclusive soybean
importer. An import duty of 27 percent has
been proposed by the Ministry of Agricul-
ture to protect local soybean production.
C. CORN
From 1997 to 2002 corn production showed
an upward trend, growing by 1.8 percent a
year.
Demand also tended to increase in the same
period, by 1.17 percent a year, mainly be-
cause of increased consumption and rising
demand from the corn-processing and ani-
mal-feed industries.
The Ministry of Agriculture has proposed a
40 percent import duty on corn in place of
the current 0 percent duty.
D. SUGAR
Table 27 indicates that sugar consump-
tion exceeded average production from
1997 to 2001. Indonesia had therefore
needed to import 1.64 million tons of
sugar. Several problems plague the sugar
industry in Indonesia, namely:
a. Many of the sugar factories are on
Java island, and most of these are
idle due to shortage of raw materi-
als.
b. Because of the relatively high (com-
pared to other agricultural imports)
5 percent duty on imported sugar,
smuggling has become rampant,
making imported sugar cheaper than
local sugar.
To cope with the national sugar problem,
the productivity of the existing sugar fac-
tories should be increased or, as a sec-
ond option, new sugar factories should
be constructed, particularly in outer Java.
In addition, the government has decreed that
raw sugar imports can only be brought in for
processing and should not be traded or consumed
as such. Processed (crystal white) sugar may only
be imported by registered sugar importers. The
government has also guaranteed the farm gate
price of sugar at no lower than Rp. 3,100/kg
(US $ 0.36 ).
AFTA-CEPT (ASEAN Free Trade Area CommonEffective Preferential Tariff Scheme)
The ASEAN Free Trade Area (AFTA) refers to
the regional agreement whereby tariff and
non-tariff barriers to products traded among
ASEAN member countries are reduced to 0-
5 percent.
The Common Effective Preferential Tariff Scheme
(CEFT) is a phased program for tariff reduction and
elimination of non-tariff barriers agreed jointly
by the ASEAN countries.
Under the AFTA-CEPT, Sadewa (2003) fore-
cast that Indonesia will see a mere 0.5
percent improvement in its Gross Domestic
Product (GDP), compared to its Asian
neighbors.
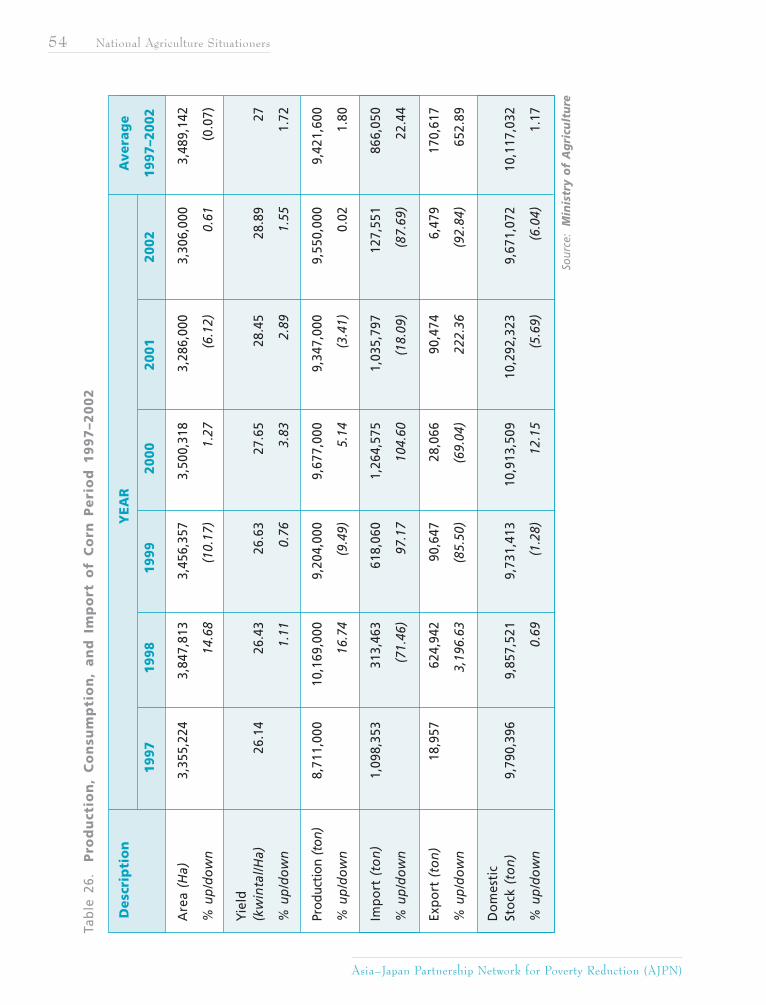
Asia–Japan Partnership Network for Poverty Reduction (AJPN)
54 National Agriculture Situationers
Tab
le 2
6.
Pro
du
ctio
n,
Co
nsu
mp
tio
n,
an
d I
mp
ort
of
Co
rn P
eri
od
19
97
–20
02
Sour
ce:
Min
istr
y o
f A
gri
cult
ure
Des
crip
tio
nY
EAR
Ave
rag
e
1997
1998
1999
2000
2001
2002
1997
–200
2
Are
a (H
a)3,
355,
224
3,84
7,81
33,
456,
357
3,50
0,31
83,
286,
000
3,30
6,00
03,
489,
142
% u
p/d
ow
n14
.68
(10.
17)
1.27
(6.1
2)0.
61(0
.07)
Yie
ld(k
win
tal/H
a)26
.14
26.4
326
.63
27.6
528
.45
28.8
927
% u
p/do
wn
1.11
0.76
3.83
2.89
1.55
1.72
Prod
ucti
on (t
on)
8,71
1,00
010
,169
,000
9,20
4,00
09,
677,
000
9,34
7,00
09,
550,
000
9,42
1,60
0
% u
p/d
ow
n16
.74
(9.4
9)5.
14(3
.41)
0.02
1.80
Impo
rt (
ton
)1,
098,
353
313,
463
618,
060
1,26
4,57
51,
035,
797
127,
551
866,
050
% u
p/d
ow
n(7
1.46
)97
.17
104.
60(1
8.09
)(8
7.69
)22
.44
Exp
ort
(to
n)
18,9
5762
4,94
290
,647
28,0
6690
,474
6,47
917
0,61
7
% u
p/d
ow
n3,
196.
63(8
5.50
)(6
9.04
)22
2.36
(92.
84)
652.
89
Dom
esti
cSt
ock
(to
n)
9,79
0,39
69,
857,
521
9,73
1,41
310
,913
,509
10,2
92,3
239,
671,
072
10,1
17,0
32
% u
p/d
ow
n0.
69(1
.28)
12.1
5(5
.69)
(6.0
4)1.
17
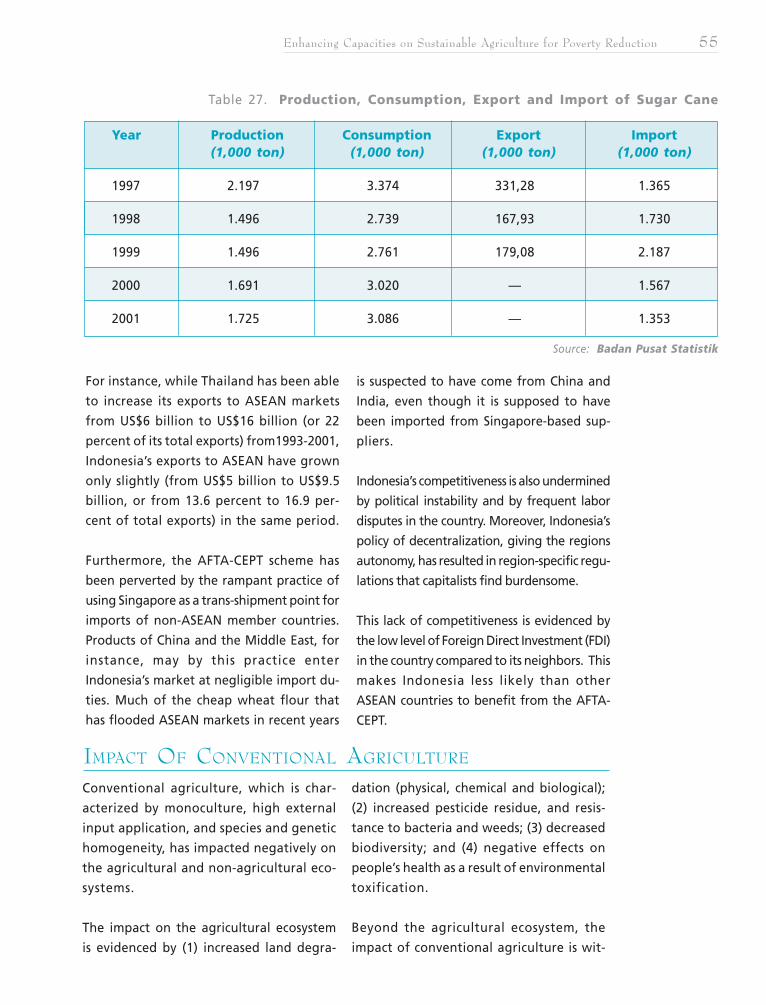
Enhancing Capacities on Sustainable Agriculture for Poverty Reduction 55
Table 27. Production, Consumption, Export and Import of Sugar Cane
Source: Badan Pusat Statistik
Year Production Consumption Export Import(1,000 ton) (1,000 ton) (1,000 ton) (1,000 ton)
1997 2.197 3.374 331,28 1.365
1998 1.496 2.739 167,93 1.730
1999 1.496 2.761 179,08 2.187
2000 1.691 3.020 — 1.567
2001 1.725 3.086 — 1.353
For instance, while Thailand has been able
to increase its exports to ASEAN markets
from US$6 billion to US$16 billion (or 22
percent of its total exports) from1993-2001,
Indonesia’s exports to ASEAN have grown
only slightly (from US$5 billion to US$9.5
billion, or from 13.6 percent to 16.9 per-
cent of total exports) in the same period.
Furthermore, the AFTA-CEPT scheme has
been perverted by the rampant practice of
using Singapore as a trans-shipment point for
imports of non-ASEAN member countries.
Products of China and the Middle East, for
instance, may by this practice enter
Indonesia’s market at negligible import du-
ties. Much of the cheap wheat flour that
has flooded ASEAN markets in recent years
is suspected to have come from China and
India, even though it is supposed to have
been imported from Singapore-based sup-
pliers.
Indonesia’s competitiveness is also undermined
by political instability and by frequent labor
disputes in the country. Moreover, Indonesia’s
policy of decentralization, giving the regions
autonomy, has resulted in region-specific regu-
lations that capitalists find burdensome.
This lack of competitiveness is evidenced by
the low level of Foreign Direct Investment (FDI)
in the country compared to its neighbors. This
makes Indonesia less likely than other
ASEAN countries to benefit from the AFTA-
CEPT.
IMPACT OF CONVENTIONAL AGRICULTURE
Conventional agriculture, which is char-
acterized by monoculture, high external
input application, and species and genetic
homogeneity, has impacted negatively on
the agricultural and non-agricultural eco-
systems.
The impact on the agricultural ecosystem
is evidenced by (1) increased land degra-
dation (physical, chemical and biological);
(2) increased pesticide residue, and resis-
tance to bacteria and weeds; (3) decreased
biodiversity; and (4) negative effects on
people’s health as a result of environmental
toxification.
Beyond the agricultural ecosystem, the
impact of conventional agriculture is wit-
Asia–Japan Partnership Network for Poverty Reduction (AJPN)
56 National Agriculture Situationers
nessed in (1) diseases resulting from chemi-
cally contaminated food; (2) economic in-
justice due to monopolistic practices in
the procurement of agricultural produc-
tion facilities; and (3) social imbalance
between peasants and non-peasants in the
community.
Studies conducted by the Ministry of Agri-
culture indicate that there has been a real
increase in the area of critical land, or land
with less than 1 percent organic content.
(To be suitable for agriculture, land must
have an organic content of at least 2 to 5
percent.)
Between 1990 and 1999, land on Java is-
land and in outer Java that is classified
as critical increased from 65 percent to
as much as 80 percent.
GMO PRODUCTS
A genetically modified organism (GMO)
that has caused a stir in Indonesia is the
Bt cotton produced by PT Monagro Kimia,
which is a part of the multinational com-
pany Monsanto and operates in South
Sulawesi. PT Monagro began research on
the Bt cotton in 1996. In 1999, the gov-
ernment pronounced Bt cotton as envi-
ronmentally safe. In 2001, Bt cotton un-
derwent trial tests on 4,400 hectares. Peas-
ants complained that the Bt cotton caused
drought and increased the bacteria popu-
lation.
Meanwhile, studies conducted by YLKI (In-
donesian Consumer Institution Foundation)
in 2001-2002 showed that several food
products processed from soybeans, corn, and
potatoes contained genetically-engineered
materials.
Before then, consumers had been unaware
that many of their food purchases contained
transgenic materials, despite the existence
of Law Number 7/1996 on Food, which
stipulates that “any food products con-
taining transgenic raw materials shall be
inspected in terms of their safety and shall
be provided with a transgenic label”.
SUSTAINABLE AGRICULTURE
These trends support the shift toward sus-
tainable agriculture practices.
Apart from being environmentally friendly,
sustainable agriculture is a farming system
that is efficient when outputs are compared
to inputs.
The development of sustainable agricul-
ture is particularly directed towards (1)
reducing the negative impact on the land
physically, chemically and biologically;
(2) reducing the resistance and persistence
of bacteria and shifting the emphasis to
biological control; (3) improving the health
of the agricultural ecosystem, so as to
improve the health of the people and the
peasants; (4) reducing the peasants’ de-
pendency on inputs in the form of ex-
ternal production facilities; (5) giving peas-
ants’ the right to make strategic plans
and decisions.
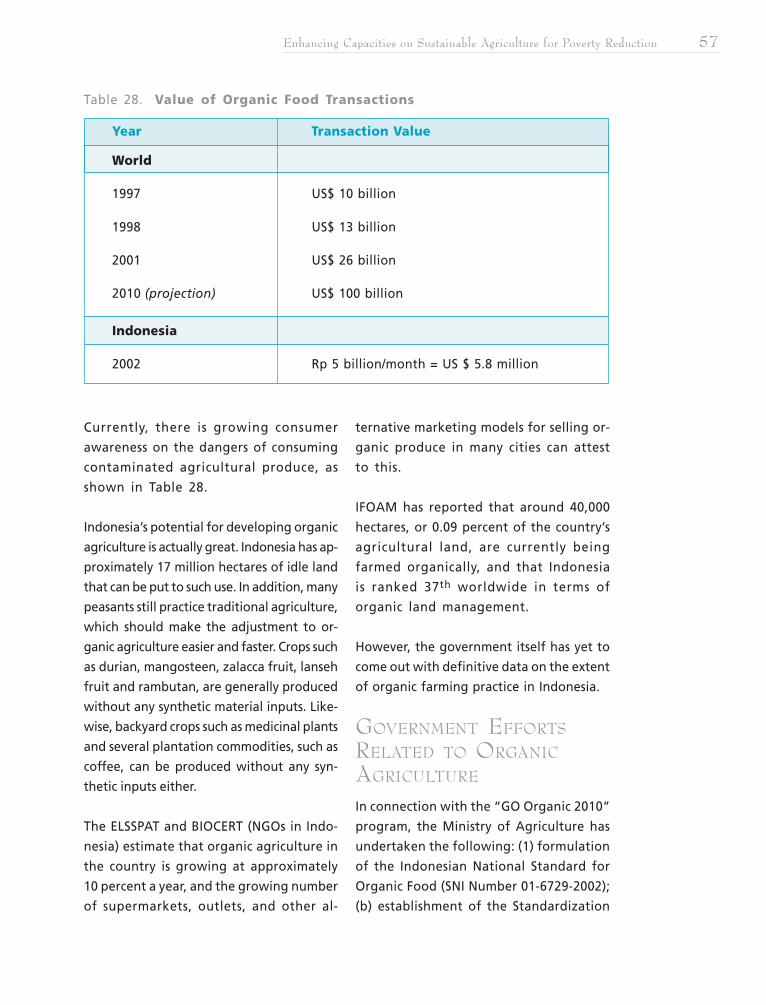
Enhancing Capacities on Sustainable Agriculture for Poverty Reduction 57
Table 28. Value of Organic Food Transactions
Year Transaction Value
World
1997 US$ 10 billion
1998 US$ 13 billion
2001 US$ 26 billion
2010 (projection) US$ 100 billion
Indonesia
2002 Rp 5 billion/month = US $ 5.8 million
Currently, there is growing consumer
awareness on the dangers of consuming
contaminated agricultural produce, as
shown in Table 28.
Indonesia’s potential for developing organic
agriculture is actually great. Indonesia has ap-
proximately 17 million hectares of idle land
that can be put to such use. In addition, many
peasants still practice traditional agriculture,
which should make the adjustment to or-
ganic agriculture easier and faster. Crops such
as durian, mangosteen, zalacca fruit, lanseh
fruit and rambutan, are generally produced
without any synthetic material inputs. Like-
wise, backyard crops such as medicinal plants
and several plantation commodities, such as
coffee, can be produced without any syn-
thetic inputs either.
The ELSSPAT and BIOCERT (NGOs in Indo-
nesia) estimate that organic agriculture in
the country is growing at approximately
10 percent a year, and the growing number
of supermarkets, outlets, and other al-
ternative marketing models for selling or-
ganic produce in many cities can attest
to this.
IFOAM has reported that around 40,000
hectares, or 0.09 percent of the country’s
agricultural land, are currently being
farmed organically, and that Indonesia
is ranked 37th worldwide in terms of
organic land management.
However, the government itself has yet to
come out with definitive data on the extent
of organic farming practice in Indonesia.
GOVERNMENT EFFORTS
RELATED TO ORGANIC
AGRICULTURE
In connection with the “GO Organic 2010”
program, the Ministry of Agriculture has
undertaken the following: (1) formulation
of the Indonesian National Standard for
Organic Food (SNI Number 01-6729-2002);
(b) establishment of the Standardization
Asia–Japan Partnership Network for Poverty Reduction (AJPN)
58 National Agriculture Situationers
and Accreditation Center (PSA) as the com-
petent authority on organic food pursu-
ant to Decree of the Minister of Agricul-
ture Number 432/Kpts/OT.130/9/ 2003.
The PSA has the following duties: (1) for-
mulating policy on arrangements for, and
control and supervision of the organic food
production system; (2) designing and for-
mulating the system and references for the
establishment of the organic food certifi-
cation institution; (c) supervising the certi-
fication institution and/or the business board
that would implement the quality control
system for organic agriculture in the certi-
fication program.
In connection with the above mandate, the
Organic Food Task Force was established with
representatives from: Government, Private
Sector, Technical Experts, Drug and Food Su-
pervisory Board (BPOM), National Standard-
ization Board (BSN), National Accreditation
Committee (KAN), Universities, Practitioners,
Peasants/ Producers and Consumers.
OBSTACLES TO DEVELOPMENT
OF ORGANIC AGRICULTURE
There are several obstacles to the devel-
opment of organic agriculture in Indone-
sia, such as (1) lack of consumer confidence
in the organic certification system and/or
institution; (2) lack of international accredi-
tation for the organic certification; (3) not
enough organic inspectors, particularly
those who are acknowledged internation-
ally; (4) insufficient awareness/knowledge
among peasants of organic agriculture; (5)
the long recovery and de-contamination
period of land that had long been farmed
with chemicals.
OPPORTUNITIES FOR
PEASANT GROUPS ENGAGED
IN ORGANIC AGRICULTURE
There is a big domestic market for organic
products. Supermarkets are a particularly
lucrative market for organic growers in In-
donesia. Unfortunately, peasants have gen-
erally been unable to take advantage of this
opportunity because the big agribusinesses,
especially those dealing in organically grown
vegetables, have a corner on this market.
There are other obstacles to access to su-
permarkets by peasant organizations:
1. Consumers are still skeptical onwhether the organic requirementshave been met.
Organic products grown by peas-
ant groups have not been formally
certified as such. Only the big
agribusinesses have been able to
get organic certification for their
products. Second-crop and veg-
etable peasants have a hard time
because their land still contains
chemical residues from the previ-
ous conventional agricultural prac-
tice. It would take three to five
years to completely rid the land
of such residues. Several peasant
groups and NGOs have suggested
that rather than the produce, the
farming method may be certified
as organic.
Irrigation water sources are not yet
free from chemical contamination.
Hence, peasants in a given area
should agree not to use chemi-
cals that could contaminate their
common water source.
Enhancing Capacities on Sustainable Agriculture for Poverty Reduction 59
2. There is no well-functioningquality control system at thepeasant level.In regard to organic rice, peasant
organizations can help guarantee
uniformity in the quality of their mem-
bers’ produce and that this complies
with market demands.
3. In general, the supermarket prac-tice of delayed payment worksagainst peasants who need tobe paid on the spot to meet theirhousehold daily needs and toprepare for the next plantingseason.
Apart from the difficulty of marketing
their products, organic peasants often find
that their products fetch prices that are
not much higher than those offered for
conventional commodities. And ironically,
after selling their organic produce, peas-
ants buy cheaper non-organic food for
themselves.
There is therefore a need to help peasants
realize that the point of organic farming
is not merely to get a higher price for their
crops, but to improve the fertility of the
land, to restore to peasants the right to
make farming decisions, to provide healthy
food for their families, and to mobilize the
spirit to resist the negative impacts of glo-
balization.
CONCLUSION
As a result of the government’s policy to
prioritize the industrial and services sec-
tors, the role and contribution of the ag-
riculture sector has declined, despite the
fact that the majority of the Indonesian
population depend on agriculture for a
living.
This situation is made worse by the country’s
economic crisis and free trade regulations
imposed under the WTO and AFTA regimes
which undermine the competitiveness of the
country’s agricultural products.
Environmental destruction, as evidenced by
the increase in critical land, has worsened
the condition of the peasants who have to
use more fertilizers to maintain their land’s
productivity. The introduction of GMOs
is expected to exacerbate this problem.
There are high hopes that sustainable ag-
riculture would help offset the impact
of globalized trade and recover land fer-
tility and preserve the ecosystem. How-
ever, the introduction of sustainable ag-
riculture should be followed by a pro-
cess to help peasants become aware of
the long-term benefits of this new farm-
ing practice apart from the guarantee of
a higher selling prices for their products.
Asia–Japan Partnership Network for Poverty Reduction (AJPN)
60 National Agriculture Situationers
PHILIPPINESNational AgricultureSituationer
PHILIPPINE AGRICULTURE IN CRISIS
Agriculture and agribusiness make up the
backbone of the Philippine economy. The
country’s population is predominantly ru-
ral (70 percent of the total) and two-thirds
of these depend on farming for their live-
lihood. Seventy-one percent of the country’s
Gross Domestic Product (GDP) is produced
by agribusiness, while primary agriculture
and fisheries turn out some 21 percent.
(Tolentino, 2002)
Since the early 1980s, however, Philippine
agriculture has been in crisis. A number of
trends in the sector gives proof of this, in
particular, expensive food; stagnant produc-
tivity; increasing agri imports and falling agri
exports; high production cost; market con-
straints; monopolies; and weak governance.
Despite growth since 1985, the Philippines
has been unable to duplicate the peak per-
formance of the 1976-81 period. In fact, the
Philippines has fallen out of the group of
best performers to join that of the under-
achievers in agriculture Gross Value Added
(GVA) and exports in Southeast Asia.
STAGNANT PRODUCTIVITY
Throughout the 1990s, the country’s popu-
lation had grown at an average of 2.35 per-
cent a year. In the meantime, rice produc-
tion had not kept pace, registering a mere
1.9 percent growth in the same period. Since
the 1980s, the productivity of Filipino rice
farmers has largely stagnated, growing by
only 0.4 percent a year. In contrast, Thai-
Prepared by: Fr. Francis B. Lucas and Teresa Lingan–Debuque
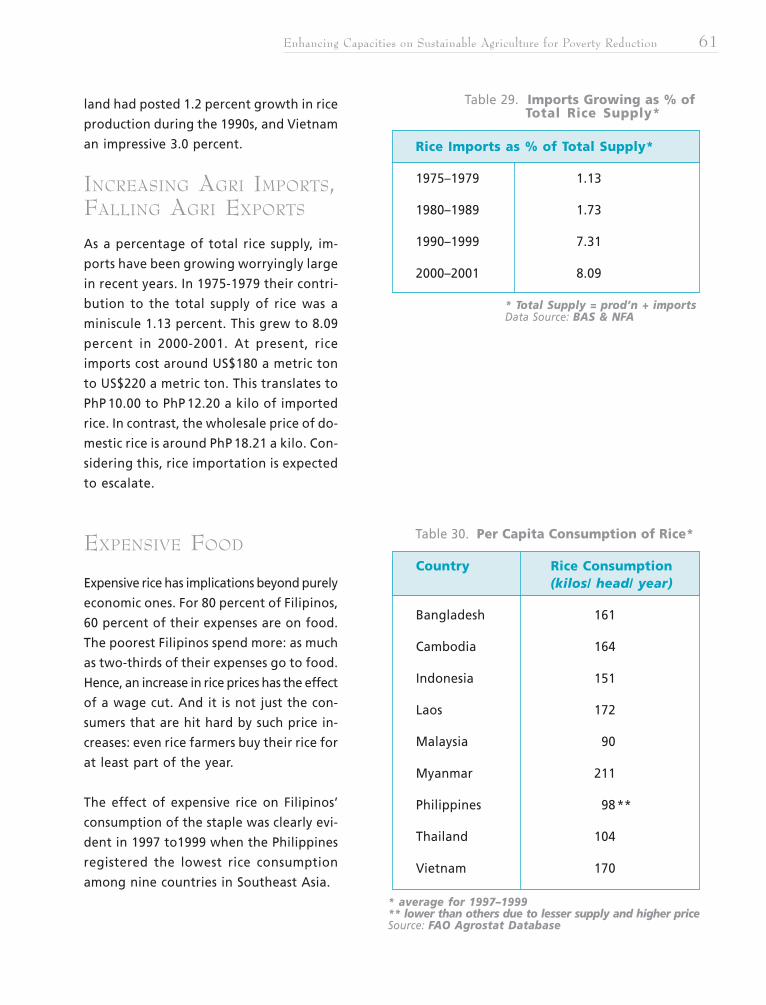
Enhancing Capacities on Sustainable Agriculture for Poverty Reduction 61
land had posted 1.2 percent growth in rice
production during the 1990s, and Vietnam
an impressive 3.0 percent.
INCREASING AGRI IMPORTS,FALLING AGRI EXPORTS
As a percentage of total rice supply, im-
ports have been growing worryingly large
in recent years. In 1975-1979 their contri-
bution to the total supply of rice was a
miniscule 1.13 percent. This grew to 8.09
percent in 2000-2001. At present, rice
imports cost around US$180 a metric ton
to US$220 a metric ton. This translates to
PhP 10.00 to PhP 12.20 a kilo of imported
rice. In contrast, the wholesale price of do-
mestic rice is around PhP 18.21 a kilo. Con-
sidering this, rice importation is expected
to escalate.
EXPENSIVE FOOD
Expensive rice has implications beyond purely
economic ones. For 80 percent of Filipinos,
60 percent of their expenses are on food.
The poorest Filipinos spend more: as much
as two-thirds of their expenses go to food.
Hence, an increase in rice prices has the effect
of a wage cut. And it is not just the con-
sumers that are hit hard by such price in-
creases: even rice farmers buy their rice for
at least part of the year.
The effect of expensive rice on Filipinos’
consumption of the staple was clearly evi-
dent in 1997 to1999 when the Philippines
registered the lowest rice consumption
among nine countries in Southeast Asia.
Table 30. Per Capita Consumption of Rice*
* average for 1997–1999** lower than others due to lesser supply and higher priceSource: FAO Agrostat Database
Country Rice Consumption(kilos/ head/ year)
Bangladesh 161
Cambodia 164
Indonesia 151
Laos 172
Malaysia 90
Myanmar 211
Philippines 98**
Thailand 104
Vietnam 170
Table 29. Imports Growing as % of Total Rice Supply*
* Total Supply = prod’n + importsData Source: BAS & NFA
Rice Imports as % of Total Supply*
1975–1979 1.13
1980–1989 1.73
1990–1999 7.31
2000–2001 8.09
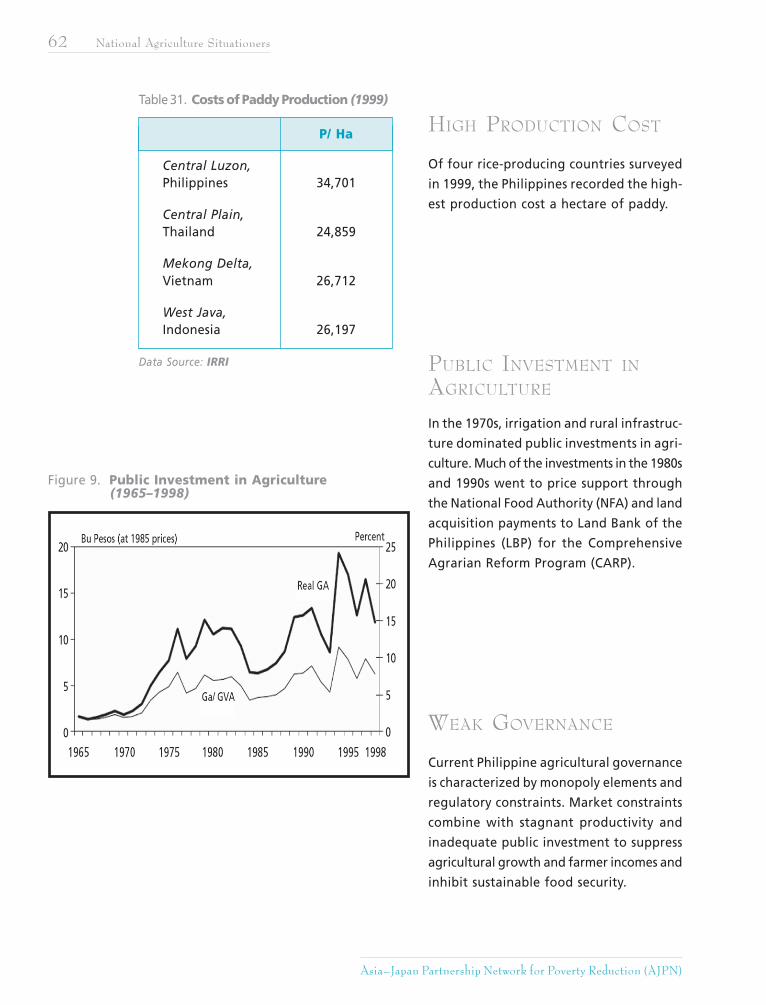
Asia–Japan Partnership Network for Poverty Reduction (AJPN)
62 National Agriculture Situationers
Table 31. Costs of Paddy Production (1999)
Data Source: IRRI
P/ Ha
Central Luzon,Philippines 34,701
Central Plain,Thailand 24,859
Mekong Delta,Vietnam 26,712
West Java,Indonesia 26,197
HIGH PRODUCTION COST
Of four rice-producing countries surveyed
in 1999, the Philippines recorded the high-
est production cost a hectare of paddy.
PUBLIC INVESTMENT IN
AGRICULTURE
In the 1970s, irrigation and rural infrastruc-
ture dominated public investments in agri-
culture. Much of the investments in the 1980s
and 1990s went to price support through
the National Food Authority (NFA) and land
acquisition payments to Land Bank of the
Philippines (LBP) for the Comprehensive
Agrarian Reform Program (CARP).
WEAK GOVERNANCE
Current Philippine agricultural governance
is characterized by monopoly elements and
regulatory constraints. Market constraints
combine with stagnant productivity and
inadequate public investment to suppress
agricultural growth and farmer incomes and
inhibit sustainable food security.
Figure 9. Public Investment in Agriculture (1965–1998)
Enhancing Capacities on Sustainable Agriculture for Poverty Reduction 63
Reform efforts are constrained by disconti-
nuity (i.e., the DA head has an average ser-
vice of 19 months because of frequent lead-
ership changes) and short-term political as-
pects in decision-making.
AGRICULTURAL POLICIES IN
RECENT YEARS
After experiencing one of the highest growth
rates in the region during the 1970s (4.9
percent average annual growth in Gross
Value Added [GVA]), Philippine agricultural
growth slowed down considerably in the
1980s (1.0 percent annual growth in GVA),
and virtually stagnated during the 1990s (0.4
percent GVA growth).
To a large extent, the decline that started
in the 1980s was a direct consequence of
the severe financial crisis the country suf-
fered during the Marcos regime’s terminal
phase. The government stopped building
farm-to-market roads, irrigation facilities and
other agri-related infrastructure, and be-
came less generous with credit programs
directed at farmers and fisher folk.
The shift to democratic governance in 1986
failed to arrest agriculture’s decline. To some
extent, this was due to the Aquino and
Ramos governments’ benign neglect of the
rural sector.
The Aquino government was simply too pre-
occupied with the pressing task of keeping
itself alive, thwarting one military-backed
coup after another.
Rural development took a back seat to sat-
isfying the economic requirements of the
military and security establishment, even as
the country went through another economic
crisis during the early 1990s.
Funds allotted for irrigation, for instance,
were not even enough to keep the exist-
ing infrastructure from deteriorating.
The Ramos government came up with the
“Gintong Ani” program, which focused on
providing cheap loans to farmers. Loans were
offered to farmers at 25 percent less than
the prevailing rates offered by the Land Bank
of the Philippines (LBP). However, “Gintong
Ani” failed in its avowed mission to revive
Philippine agriculture as a prolonged drought
caused by El Niño wreaked havoc in the late
nineties with agricultural production drop-
ping by more than 10 percent in 1998.
The dry spell coincided with another financial
crisis precipitated by the devaluation of the
peso. This made it impossible for the gov-
ernment to come up with the massive re-
sources needed to turn the sector around.
President Gloria Arroyo’s “Ginintuang
Masaganang Ani” (GMA), on the other hand,
envisions a modernized and productive ag-
riculture and fisheries sector.
In particular, it aims to promote food secu-
rity and competitive self-sufficiency in rice
through four main measures: (1) modern-
ized productivity in corn and other feed
crops; (2) diversification; (3) livestock en-
terprise development; and (4) recovery and
growth of the fisheries sector.
The Medium-Term Philippine Development
Plan for 2000-2004 commits the Arroyo gov-
ernment to the pursuit of comprehensive
rural development based on three key strat-
Asia–Japan Partnership Network for Poverty Reduction (AJPN)
64 National Agriculture Situationers
egies, namely, productivity improvements,
asset distribution reform, and sustainable
development.
Raising agricultural productivity entails giv-
ing farmers and fisherfolk access to mod-
ern agricultural and fishery inputs devel-
oped through research and development.
Complementing this strategy are efforts to
promote rural industrialization, particularly
by putting up viable enterprises, and ac-
celerate the development of infrastructure
facilities like irrigation and farm-to-mar-
ket roads.
Under the strategy for Asset Distribution
Reform, the government pledges to con-
tinue the land reform process, along with
the provision of support services for agrar-
ian reform beneficiaries (ARBs). Meanwhile,
as agriculture is being modernized, the gov-
ernment promises to ensure that intensi-
fied production activities would not under-
mine the integrity of the environment.
Hence, it espouses policies that promote en-
vironment friendly technologies and sustain-
able farming practices.
Notwithstanding her government’s formal
declarations, this paper would argue that
a number of specific policies and strategies
endorsed by the Arroyo administration are
advertently or inadvertently undermining
its avowed goals. While some of these policies
and strategies may have preceded the cur-
rent government, it has nonetheless done
its share to exacerbate their effects on Phil-
ippine agriculture.
WHAT AILS PHILIPPINE AGRICULTURE?
A CASE OF OPENING UP
TOO MUCH, TOO SOON
The Magna Carta for Small Farmers prohibits
the importation of agricultural products ex-
cept where there is a shortage and only in
volumes that approximate the expected
shortfall. This prohibition was intended to
protect domestic farm products from cheap,
highly subsidized imports.
However, in 1994, the Philippines abandoned
this policy when it ratified the General Agree-
ment on Tariffs and Trade (GATT), includ-
ing the Agreement on Agriculture, which
mandates the opening up of the country’s
market to imports.
Ten years after, the impact of this policy is
evident in the following trends in the per-
formance of the country’s agriculture sec-
tor. Data from the Bureau of Agricultural
Trade Statistics (BAS) show that aggregate
agricultural imports rose from US$1.3 bil-
lion in 1993, a year prior to GATT ratifica-
tion, to US$2.1 billion in 2001.
In the same period, total agricultural exports
declined, from US$1.9 billion to US$1.2 bil-
lion. Meanwhile, in contrast to optimistic
forecasts by the Department of Agriculture
(DA), the country’s agricultural trade deficit
ballooned by as much as 265 percent in 1996,
and by 427 percent in 1997. Gross value added
in agriculture (GVA) was virtually at a stand-
Enhancing Capacities on Sustainable Agriculture for Poverty Reduction 65
still, growing from PhP171 billion in 1995 to
a mere PhP183 billion in 1999.
Rural employment in agriculture proved just
as disappointing: from 11.14 million in 1993,
it dropped to 10.8 million in 2001. It will
be recalled that pro-liberalization econo-
mists had projected the creation of at least
500,000 new jobs in agriculture every year
as a result of increased export trade.
The following section discusses in greater
detail the effects of trade liberalization on
three sub-sectors of agriculture: rice, live-
stock and poultry and vegetables and fruits.
Removal of QuantitativeRestrictions on Rice Importsand Tariffication of Rice
In compliance with the country’s GATT-WTO
commitments, the Philippine Congress passed
Republic Act (RA) 8178, or the Agriculture
Tariffication Act, in 1994. This law, which
replaces quantitative restrictions (QRs) on
agricultural products with tariffs, went into
effect immediately, except in the case of
rice, where tariffication was deferred for
10 years.2
The 10-year deferment expired in Decem-
ber 2004, after which in lieu of a QR a
proposed 100 percent tariff would be slapped
on rice imports.
At this tariff level, the price of imported
rice would approximate the price of domes-
tically produced rice. As such, the tariff rate
would not benefit consumers. Nor would
it provide any real protection to local rice
farmers because it is still more cost-effec-
tive, not-to-mention more convenient, to
deal with a single source abroad rather than
to build stocks from many small suppliers
and farmers.
Farmers groups are protesting the cancel-
lation of the rice QR, saying that tariffs are
bound to be progressively scaled down and
so offer little in the way of future protec-
tion for local producers. In fact, there are
already talks within the DA of slashing the
proposed tariff rate by half. At this level,
tariffs would provide virtually no protec-
tion to local producers: at PhP 11.00–
PhP12.00 a kilo the maximum landed value
of imported rice would still be lower than
the selling price of domestically produced
rice (PhP 14.00 a kilo).
The country’s inability to compete on price
is not the only argument presented by farm-
ers groups against rice tariffication.
Just as importantly, the decision to import, in-
cluding the volume of rice to be sourced from
abroad, would henceforth be triggered mainly
by price differentials in the market rather than
by projected shortfalls in production.
2 Annex 5 of the WTO Agreement allows a member country to suspend the tariffication of QRs of apolitically sensitive staple food.
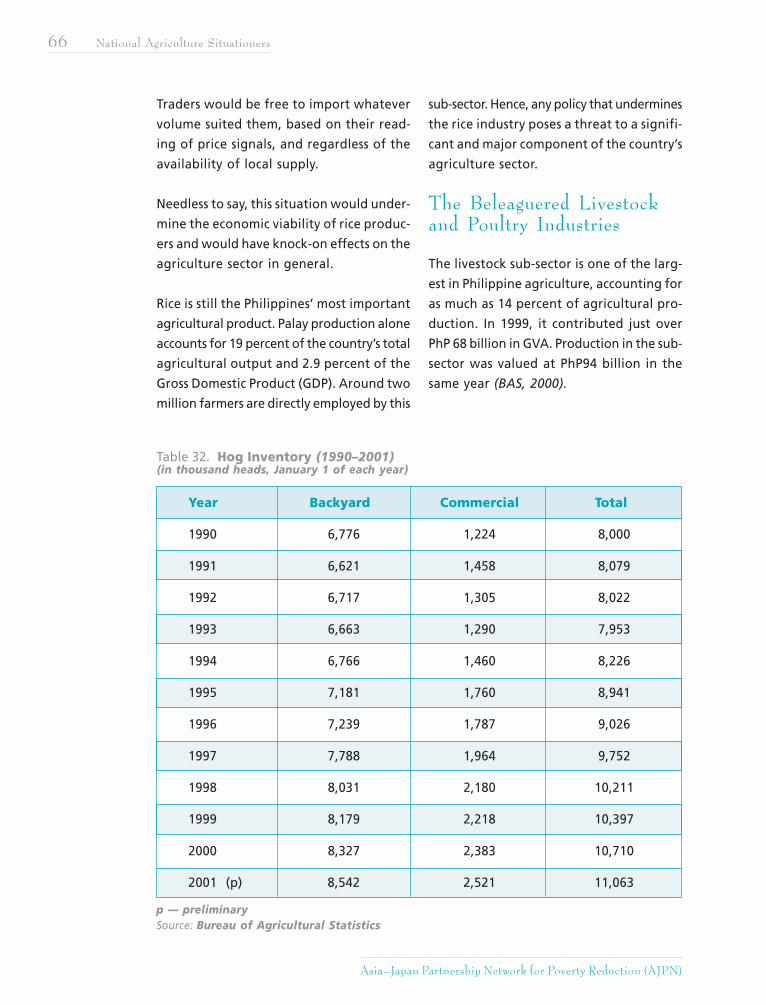
Asia–Japan Partnership Network for Poverty Reduction (AJPN)
66 National Agriculture Situationers
Traders would be free to import whatever
volume suited them, based on their read-
ing of price signals, and regardless of the
availability of local supply.
Needless to say, this situation would under-
mine the economic viability of rice produc-
ers and would have knock-on effects on the
agriculture sector in general.
Rice is still the Philippines’ most important
agricultural product. Palay production alone
accounts for 19 percent of the country’s total
agricultural output and 2.9 percent of the
Gross Domestic Product (GDP). Around two
million farmers are directly employed by this
sub-sector. Hence, any policy that undermines
the rice industry poses a threat to a signifi-
cant and major component of the country’s
agriculture sector.
The Beleaguered Livestockand Poultry Industries
The livestock sub-sector is one of the larg-
est in Philippine agriculture, accounting for
as much as 14 percent of agricultural pro-
duction. In 1999, it contributed just over
PhP 68 billion in GVA. Production in the sub-
sector was valued at PhP94 billion in the
same year (BAS, 2000).
Table 32. Hog Inventory (1990–2001)(in thousand heads, January 1 of each year)
p — preliminarySource: Bureau of Agricultural Statistics
Year Backyard Commercial Total
1990 6,776 1,224 8,000
1991 6,621 1,458 8,079
1992 6,717 1,305 8,022
1993 6,663 1,290 7,953
1994 6,766 1,460 8,226
1995 7,181 1,760 8,941
1996 7,239 1,787 9,026
1997 7,788 1,964 9,752
1998 8,031 2,180 10,211
1999 8,179 2,218 10,397
2000 8,327 2,383 10,710
2001 (p) 8,542 2,521 11,063
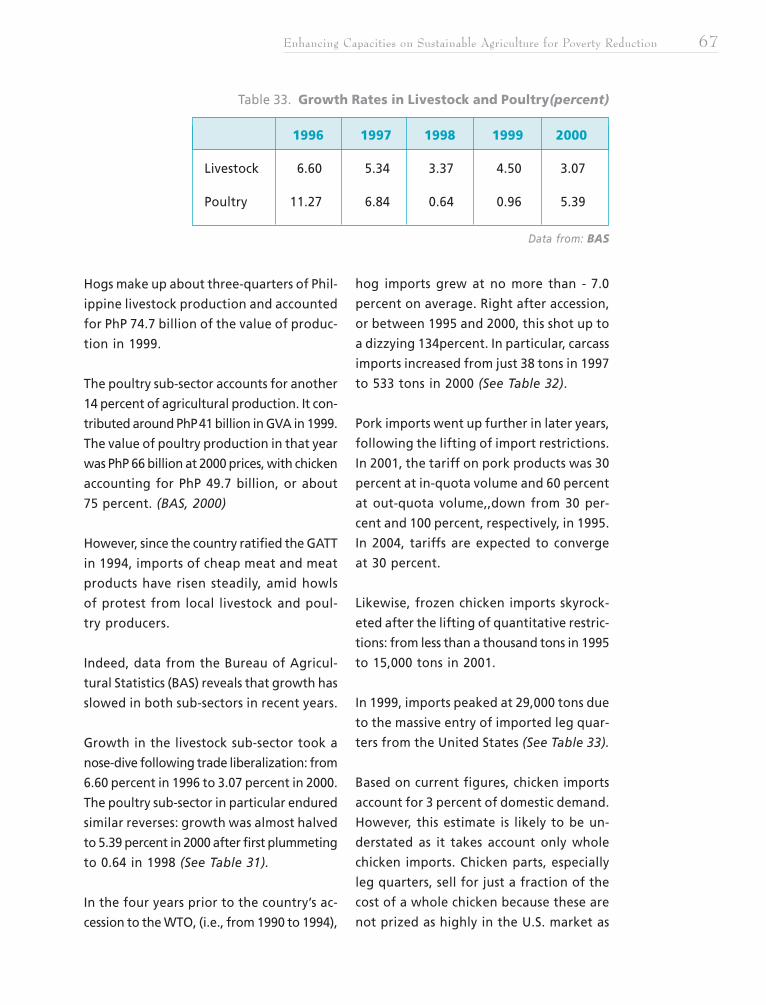
Enhancing Capacities on Sustainable Agriculture for Poverty Reduction 67
Hogs make up about three-quarters of Phil-
ippine livestock production and accounted
for PhP 74.7 billion of the value of produc-
tion in 1999.
The poultry sub-sector accounts for another
14 percent of agricultural production. It con-
tributed around PhP41 billion in GVA in 1999.
The value of poultry production in that year
was PhP 66 billion at 2000 prices, with chicken
accounting for PhP 49.7 billion, or about
75 percent. (BAS, 2000)
However, since the country ratified the GATT
in 1994, imports of cheap meat and meat
products have risen steadily, amid howls
of protest from local livestock and poul-
try producers.
Indeed, data from the Bureau of Agricul-
tural Statistics (BAS) reveals that growth has
slowed in both sub-sectors in recent years.
Growth in the livestock sub-sector took a
nose-dive following trade liberalization: from
6.60 percent in 1996 to 3.07 percent in 2000.
The poultry sub-sector in particular endured
similar reverses: growth was almost halved
to 5.39 percent in 2000 after first plummeting
to 0.64 in 1998 (See Table 31).
In the four years prior to the country’s ac-
cession to the WTO, (i.e., from 1990 to 1994),
hog imports grew at no more than - 7.0
percent on average. Right after accession,
or between 1995 and 2000, this shot up to
a dizzying 134percent. In particular, carcass
imports increased from just 38 tons in 1997
to 533 tons in 2000 (See Table 32).
Pork imports went up further in later years,
following the lifting of import restrictions.
In 2001, the tariff on pork products was 30
percent at in-quota volume and 60 percent
at out-quota volume,,down from 30 per-
cent and 100 percent, respectively, in 1995.
In 2004, tariffs are expected to converge
at 30 percent.
Likewise, frozen chicken imports skyrock-
eted after the lifting of quantitative restric-
tions: from less than a thousand tons in 1995
to 15,000 tons in 2001.
In 1999, imports peaked at 29,000 tons due
to the massive entry of imported leg quar-
ters from the United States (See Table 33).
Based on current figures, chicken imports
account for 3 percent of domestic demand.
However, this estimate is likely to be un-
derstated as it takes account only whole
chicken imports. Chicken parts, especially
leg quarters, sell for just a fraction of the
cost of a whole chicken because these are
not prized as highly in the U.S. market as
Table 33. Growth Rates in Livestock and Poultry(percent)
Data from: BAS
1996 1997 1998 1999 2000
Livestock 6.60 5.34 3.37 4.50 3.07
Poultry 11.27 6.84 0.64 0.96 5.39
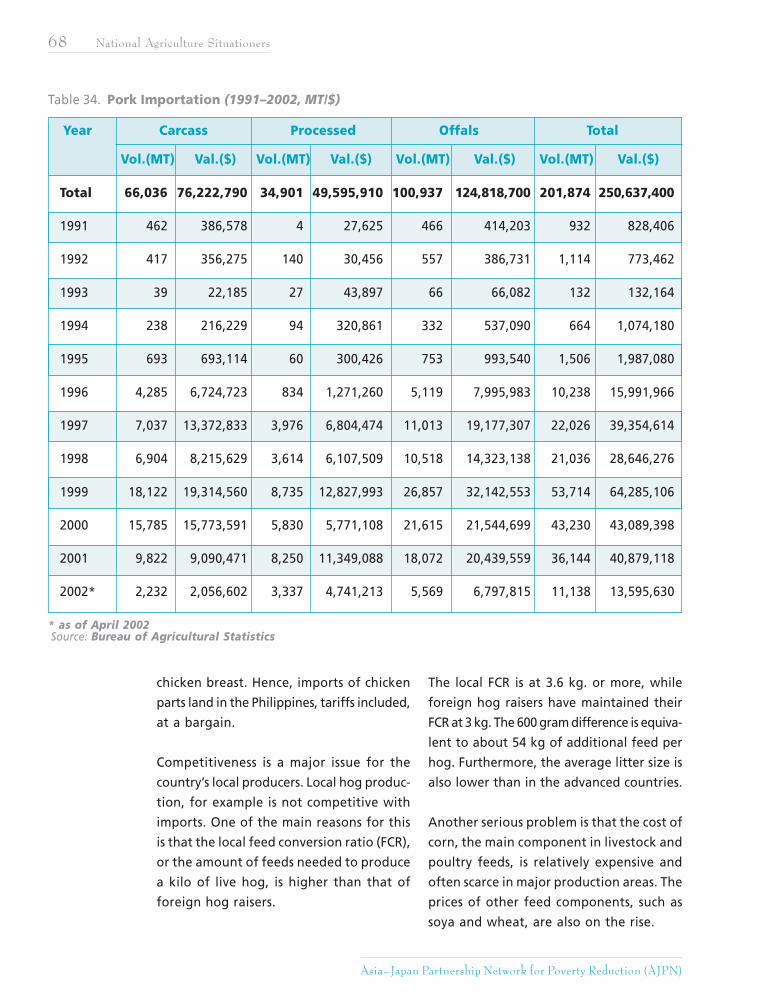
Asia–Japan Partnership Network for Poverty Reduction (AJPN)
68 National Agriculture Situationers
chicken breast. Hence, imports of chicken
parts land in the Philippines, tariffs included,
at a bargain.
Competitiveness is a major issue for the
country’s local producers. Local hog produc-
tion, for example is not competitive with
imports. One of the main reasons for this
is that the local feed conversion ratio (FCR),
or the amount of feeds needed to produce
a kilo of live hog, is higher than that of
foreign hog raisers.
The local FCR is at 3.6 kg. or more, while
foreign hog raisers have maintained their
FCR at 3 kg. The 600 gram difference is equiva-
lent to about 54 kg of additional feed per
hog. Furthermore, the average litter size is
also lower than in the advanced countries.
Another serious problem is that the cost of
corn, the main component in livestock and
poultry feeds, is relatively expensive and
often scarce in major production areas. The
prices of other feed components, such as
soya and wheat, are also on the rise.
Table 34. Pork Importation (1991–2002, MT/$)
Year Carcass Processed Offals Total
Vol.(MT) Val.($) Vol.(MT) Val.($) Vol.(MT) Val.($) Vol.(MT) Val.($)
Total 66,036 76,222,790 34,901 49,595,910 100,937 124,818,700 201,874 250,637,400
1991 462 386,578 4 27,625 466 414,203 932 828,406
1992 417 356,275 140 30,456 557 386,731 1,114 773,462
1993 39 22,185 27 43,897 66 66,082 132 132,164
1994 238 216,229 94 320,861 332 537,090 664 1,074,180
1995 693 693,114 60 300,426 753 993,540 1,506 1,987,080
1996 4,285 6,724,723 834 1,271,260 5,119 7,995,983 10,238 15,991,966
1997 7,037 13,372,833 3,976 6,804,474 11,013 19,177,307 22,026 39,354,614
1998 6,904 8,215,629 3,614 6,107,509 10,518 14,323,138 21,036 28,646,276
1999 18,122 19,314,560 8,735 12,827,993 26,857 32,142,553 53,714 64,285,106
2000 15,785 15,773,591 5,830 5,771,108 21,615 21,544,699 43,230 43,089,398
2001 9,822 9,090,471 8,250 11,349,088 18,072 20,439,559 36,144 40,879,118
2002* 2,232 2,056,602 3,337 4,741,213 5,569 6,797,815 11,138 13,595,630
* as of April 2002 Source: Bureau of Agricultural Statistics
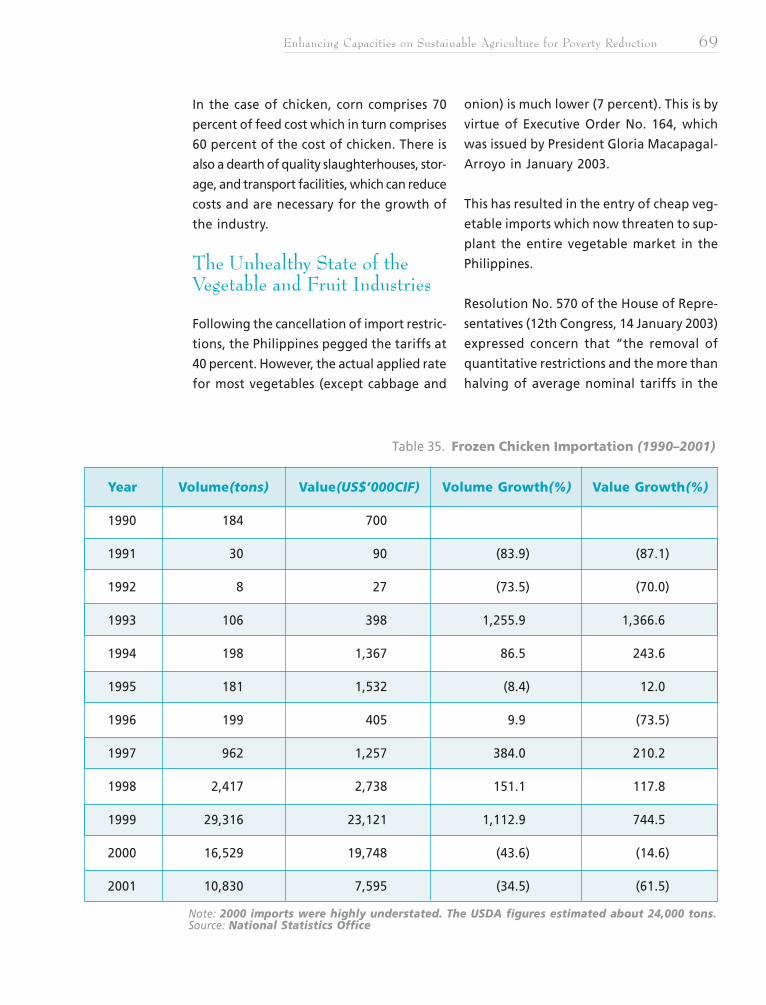
Enhancing Capacities on Sustainable Agriculture for Poverty Reduction 69
In the case of chicken, corn comprises 70
percent of feed cost which in turn comprises
60 percent of the cost of chicken. There is
also a dearth of quality slaughterhouses, stor-
age, and transport facilities, which can reduce
costs and are necessary for the growth of
the industry.
The Unhealthy State of theVegetable and Fruit Industries
Following the cancellation of import restric-
tions, the Philippines pegged the tariffs at
40 percent. However, the actual applied rate
for most vegetables (except cabbage and
onion) is much lower (7 percent). This is by
virtue of Executive Order No. 164, which
was issued by President Gloria Macapagal-
Arroyo in January 2003.
This has resulted in the entry of cheap veg-
etable imports which now threaten to sup-
plant the entire vegetable market in the
Philippines.
Resolution No. 570 of the House of Repre-
sentatives (12th Congress, 14 January 2003)
expressed concern that “the removal of
quantitative restrictions and the more than
halving of average nominal tariffs in the
Table 35. Frozen Chicken Importation (1990–2001)
Note: 2000 imports were highly understated. The USDA figures estimated about 24,000 tons.Source: National Statistics Office
Year Volume(tons) Value(US$’000CIF) Volume Growth(%) Value Growth(%)
1990 184 700
1991 30 90 (83.9) (87.1)
1992 8 27 (73.5) (70.0)
1993 106 398 1,255.9 1,366.6
1994 198 1,367 86.5 243.6
1995 181 1,532 (8.4) 12.0
1996 199 405 9.9 (73.5)
1997 962 1,257 384.0 210.2
1998 2,417 2,738 151.1 117.8
1999 29,316 23,121 1,112.9 744.5
2000 16,529 19,748 (43.6) (14.6)
2001 10,830 7,595 (34.5) (61.5)
Asia–Japan Partnership Network for Poverty Reduction (AJPN)
70 National Agriculture Situationers
sector especially since the mid-1990s. . . has
caused imported vegetables to flood the
domestic market with an almost three-fold
increase from 42,000 metric tons (MT) in 1995
to 115,000 MT in 2000, not even counting
thousands of metric tons which were
smuggled into the country as a result of the
more liberal import policies.”
Farmers in Benguet province, the country’s
prime vegetable production area, as well
as in other parts of the country have sus-
tained huge losses as a result. For instance,
Benguet Governor Raul Molintas reported
that vegetable importation is costing farmers,
booth holders and traders some PhP3.5 mil-
lion a month in La Trinidad alone. Other
reports have estimated the loss in income
due to vegetable smuggling at an average
of PhP 25 million a week.
At the current rate of importation,, the lo-
cal industry is forecast to lose more than a
billion pesos a year and thousands of farmers’
families in Benguet and Mt. Province,
Pangasinan and other vegetable-producing
provinces in the country would be displaced.
Government Capitulation
Like the now discredited structural adjust-
ment programmes (SAPs) imposed by the
IMF and the World Bank on debtor coun-
tries, the WTO Agreement on Agriculture
is forcing the pace of liberalization of ag-
ricultural trade in a manner that erodes the
right of governments and communities to
determine the appropriate balance between
liberalization and protectionism. Such “lib-
eralization under pressure” has not only
adversely affected the development of Phil-
ippine agriculture sub-sectors in the short-
to medium-term, but threatens their very
survival along with the small farmers that
depend on them for their livelihood.
At the Asia-Pacific Economic Summit (APEC)
Summit in Mexico last October 2002, Presi-
dent Arroyo decried the unfair trade rules
of the WTO. Following the collapse of talks
at the WTO Ministerial Meeting in Cancun
in September 2003, both the Department
of Agriculture and the Department of Trade
and Industry announced that the Philippine
government would oppose any further
opening up of the country’s markets.
When it came down to it, however, the
Arroyo government could not be counted
on to put its money where its mouth was.
On January 9, 2004, President Arroyo signed
Executive Order 268, which reduces tariff
rates on all agricultural and industrial prod-
ucts under the ASEAN Free Trade (AFTA) Com-
mon Effective Preferential Tariff (CEPT)
Scheme. Farmer groups complained that even
among its ASEAN partners, the Philippines
is ill-prepared for competition. For example,
the country’s sugar yield of 4.93 MT trails
both Indonesia’s and Thailand’s at 5.76 and
6.71 MT, respectively. They added that by
going full-blast in opening the country’s
markets via regional agreements like the
AFTA-CEPT, the Philippines is squandering
the gains it had made in Cancun.
Another example of the Arroyo government’s
flip-flopping on agricultural trade liberal-
ization is its declared intention, on the one
hand, to negotiate for an extension of the
country’s rice QR, and the announcement
by its top agriculture trade negotiator, As-
sistant Secretary for Policy and Planning
Enhancing Capacities on Sustainable Agriculture for Poverty Reduction 71
Segfredo Serrano, that the government is
considering the inclusion of rice in a pro-
posed Special Products (SP) list in the WTO.
This could seriously weaken the country’s
bargaining position because it sends the
signal that the Philippines might be per-
suaded to give up its QR in exchange for
the protection offered under an SP mecha-
nism. SPs do not provide the same level of
protection as QRs because they do not give
government the flexibility to stop impor-
tation altogether where the supply is enough
to meet local demand.
VACILLATING ON ASSET
REFORM
President Arroyo has singled out asset re-
form as her administration’s main economic
development strategy and pledged to com-
plete land distribution by 2008. However,
her government’s recent actions and poli-
cies fell short of its rhetoric.
In March 2004, for instance, the government
came under fire when it became known that
it had not made any budget allocations for
agrarian reform implementation. Apparently,
it intended to take the entire budget for
CARP out of the Agrarian Reform Fund (ARF),
which is intended to fast-track the land ac-
quisition and distribution (LAD) process and
which includes the recovered PhP38 billion
ill-gotten wealth of the Marcoses.
By law, 70 percent of the ARF should go
towards LAD, while 30 percent should be
devoted to support services delivery.
The ARF is not meant to pay the salaries of
DAR personnel or to be used for any other
purpose. Unless the government stops raiding
the ARF and restores the mandatory allo-
cations for CARP, it will virtually ensure the
failure of its land redistribution efforts.
Another indication of the government’s less-
than-steadfast commitment to the agrar-
ian reform effort is the recent request (July
2004) by the DAR, through its OIC-Secre-
tary Jose Mari Ponce, to postpone the in-
stallation of ARBs by as much as two years.
Sec. 24 (Award to Beneficiaries) of Repub-
lic Act 6657 or the Comprehensive Agrar-
ian Reform Law provides that the rights and
responsibilities of the beneficiary shall com-
mence from the time the DAR makes an
award to her/him, and the award should
be completed within 180 days from the time
the DAR takes possession of the land. The
request for a two-year extension is not only
illegal but, if allowed, would give landlords
more opportunity to obstruct the already
flawed process of land distribution.
The Farmland as Collateral Bill (Senate Bill
No. 2553) seeks to collateralize the Certifi-
cate of Landownership Award (CLOA) and
emancipation patents (EPs) for the avowed
purpose of providing access to credit to ARBs.
President Arroyo included the passage of
such a law among her administration’s Spe-
cific Anti-Poverty Measures for this osten-
sible reason. However, this bill also seeks
to lift the CARL’s five-hectare retention limit
(Sec. 6) and the 10-year prohibition on the
transfer (i.e., sale, mortgage, transfer, usu-
fruct) of CARP lands (Sec. 27).
In effect, any person may buy or reacquire
lands that have been redistributed by vir-
tue of CARP. Farmers groups anticipate that
the bill, if enacted, would lead to massive
foreclosures of EPs and CLOAs and the
Asia–Japan Partnership Network for Poverty Reduction (AJPN)
72 National Agriculture Situationers
reconsolidation of agricultural lands in the
hands of a few.
That President Arroyo is especially keen to
see this bill pass casts serious doubt on the
depth of her commitment to asset reform.
MODERNIZING AGRICULTURE
TO EXTINCTION
Like other governments in Southeast Asia,
the government of President Arroyo is pre-
occupied with enhancing agricultural pro-
ductivity, especially of rice. To meet the de-
mand for this staple food in the next few
decades, experts have estimated that the
yield ceiling of irrigated rice will need to
increase from its late 1980s level of about
10 tons a hectare to around 13 tons a hect-
are, while average yields will need to reach
about 6 tons a hectare, nearly twice the
current level. And this will have to be
achieved using less land, less water, less
labor, and fewer chemical inputs, particu-
larly pesticides.
Green Revolution technologies are now con-
sidered “almost exhausted” of any further
productivity gains. In fact, yearly produc-
tion increases have slipped to around 1.25
percent since 1990.
Productivity declines are especially notice-
able in an increasing number of favorable
rice-growing areas due to long-term deg-
radation of the paddy resource base.
Even experimental plots at the International
Rice Research Institute (IRRI) are giving sig-
nificantly lower yields today than in the
early 1970s.
Furthermore, soil salinization, waterlogging
and other degradation associated with in-
tensive rice cropping will lead to a net drop
in Asia’s total irrigated area.
Land suitable for further expansion of rice
is also disappearing, due in part to water
and wind erosion and chemical and physi-
cal abuse. The quantity and quality of water
available for rice growing is also expected
to decline.
As a result, rice farmers face declining profit
margins. Since the beginning of the 1990s, a
stagnant yield frontier and diminishing re-
turns to further intensification have pushed
up production costs.
Other changes in factor markets—rapid with-
drawal of labor from the farming sector, di-
version of land for other agricultural and
non-agricultural purposes, increased compe-
tition for water, and withdrawal of input sub-
sidies—are driving up input prices and will
only intensify in future.
Unfortunately, the failure of Green Revo-
lution technologies to live up to their promise
of eliminating food shortages, not to men-
tion their social and environmental cost, have
not disabused governments in the region
of their preference for high-tech solutions.
This time they have latched on “hybrid rice”
or “super rice” developed in China, whose
yields are touted to be 20 percent higher
than those of conventional High-Yielding
Varieties (HYVs).
The Philippines’ Department of Agriculture
(DA) had targeted to increase hybrid rice
production to 200,000 hectares by the end
of 2003. However, as it turned out, not even
Enhancing Capacities on Sustainable Agriculture for Poverty Reduction 73
half this area is currently planted with hybrid
rice. The poor uptake was attributed to a
shortage of hybrid rice seed.
Consequently, the Bureau of Plant Indus-
try (BPI) is thinking of adopting varieties
developed by Syngenta, the Swiss multina-
tional agribusiness giant that is attempt-
ing to establish monopoly control of the
rice crop.
Syngenta has sequenced more than 99.5
percent of the rice genome, beating
Monsanto to the punch. It thereafter de-
clared that it would restrict access to the
genome map and expects proprietary con-
trol over any research carried out using this
information. While the company said that
it would not seek to patent the entire
genome, it admitted it would try to get
patents on individual genes. The implica-
tions of Syngenta’s current and potential
claims on rice genes are so far-reaching that
critics have jokingly suggested that rice
should henceforth be called Oryza Syngenta.
Equally worrying is the precedent set by the
DA, when it approved in December 2002
the commercial propagation of Monsanto’s
Bacillus thuringensis (Bt) corn variety called
YieldGard Corn Borer. Bt corn is a corn variety
developed through genetic modification to
resist the Asiatic corn borer, a major cause
of declining corn yields.
Data from China show that the use of Bt
crops can exacerbate populations of second-
ary pests. Long-term soil health may also
be affected since the Bt gene stays with the
soil even after harvest, and thus may im-
pact on other microorganisms present in the
soil and disturb the process of decomposi-
tion. But aside from effects on the soil and
other microorganisms, Bt corn’s target in-
sects may develop a resistance to the Bt gene,
making the variety’s ability to resist the insect
ineffective over time. This would almost
certainly lead to the application of new and
even more toxic chemical pesticides.
Adopting the technology may also lead to
socio-economic problems. The non-govern-
ment organization Southeast Asia Research
Institute for Community Education
(SEARICE) noted that in the US, where
Monsanto has commercialized a number
of GM crops such as soybeans, corn and
cotton, farmers have been sued over vio-
lations of patent rights. Monsanto asks US
farmers to sign a contract upon the pur-
chase of their GM seeds. The agreement
states that Monsanto is not selling the seeds
but is merely leasing these to farmers based
on the following conditions:
Farmers are not allowed to replant the
offspring produced from the seeds;
Farmers are prohibited from exchang-
ing or giving seeds to other farmers;
and
Asia–Japan Partnership Network for Poverty Reduction (AJPN)
74 National Agriculture Situationers
Monsanto will be allowed to monitor
the field of farmers at anytime within
three years from the time of purchase.
Since Monsanto owns the patent rights over
the GM seeds, it has complete control the
product and the processes involved in its
propagation. SEARICE said farmers may lose
the market for their corn products in the same
manner that US farmers experienced losses
when their GM crop exports were barred from
entering countries that have stringent rules
on the usage and adoption of GM crops.
Further, that producing bumper corn may
also result in lower prices and losses for the
farmers who may have to pay a premium
for the Bt seeds.
On April 22, 2003, farmers and environmental
groups staged a hunger strike to demand
a moratorium on Bt corn commercialization.
On May 14, 2003, the Department of Agri-
culture (DA) thumbed down their petition,
citing lack of “compelling evidence” in sup-
port of it.
Monsanto’s patent for an herbicide called
Glifocate, which goes by the brand name
‘Round-up’, expired in 2000. ‘Round-up’ ac-
counts for a major portion of Monsanto’s
income. In its despair to stay afloat,
Monsanto is turning to GMOs (genetically-
modified organisms) as a new source of in-
come. Indeed, there is a gold mine in GMOs
more than in the pioneer chemicals it has
produced in the past. Once Monsanto is able
to propagate its Bt corn, it would be the
exclusive monopolistic source of Bt seed-
lings. And if all corn farmers were to buy
Bt corn seedlings from Monsanto, it will more
than make up for Monsanto’s losses on ex-
pired chemical patents. The windfall is pro-
jected to be so huge, Monsanto will do
anything to control the GMO market.
Another argument leveled against Bt corn
is that its effects are IRREVERSIBLE. Once a
field is planted with Bt corn, its pollen would
infect every other corn crop in other fields.
If evidence of Bt corn’s side effects were
later to emerge, the damage could no longer
be corrected. Modifications on the corn crop
cannot be undone at the gene level. By ac-
ceding to Monsanto’s designs, the Philip-
pine government has wittingly or unwittingly
played right into the hands of this monopo-
listic agribusiness giant.
SUSTAINABLE AGRICULTURE
IN THE PHILIPPINES
Background
The concept of sustainable agriculture first
came to light in the Philippines with the
publication in 1980 of a report called “Profits
from Poison”. This report, prepared by the
Farmers Assistance Board, a non-government
organization (NGO) working in rural devel-
opment, cited the negative impact of chemi-
cal agriculture on rice farmers. Another study,
this time by the Agency for Community Edu-
cation and Services (ACES), confirmed the
findings of the earlier report, and showed
moreover that rice farmers were economi-
cally better-off before their adoption of
Green Revolution technologies. This study
was eventually published in the mid-1980s
as a small book called “The Miracle That
Never Was”.
The ACES findings were presented at the
National Convention of Rice Farmers held
Enhancing Capacities on Sustainable Agriculture for Poverty Reduction 75
at the University of the Philippines Los Baños
in July 1985. Soon after, the very first pro-
test rally of rice farmers against the Inter-
national Rice Research Institute (IRRI) was
witnessed. Another offshoot of the Farm-
ers Convention was the creation of an NGO
called Farmer-Scientist Partnership for De-
velopment, Inc. In May 1986 this new or-
ganization launched its first project called
MASIPAG (Magsasaka at Siyentipiko para
sa Ikauunlad ng Agham Pang-Agrikultura).
The MASIPAG project focused on rice breed-
ing, allowing farmers to select the parent
materials, based on desired plant charac-
ters, and to perform rice breeding (after
intensive training). In the process of selecting
progenies from varietal crosses, the farm-
ers made it a policy to use no synthetic fer-
tilizers or pesticides in the trial farms.
MASIPAG started with one trial farm in Nueva
Ecija in 1986; it now has 219 such farms in
Luzon, Visayas, and Mindanao, all being
maintained by people’s organizations (POs).
Towards the late 1980s, other initiatives
sprung up, including the biodynamic farm-
ing of the Centre for Alternative Develop-
ment Initiatives (CADI); the International
Institute for Rural Reconstruction (IIRR)’s bio-
intensive gardening; and organic farms by
the Organic Farming Field Experimental and
Research Station.
In 1990, 15 Philippine NGOs formed the
Sustainable Agriculture Coalition (SAC). Their
initial activity was to each hold SA fairs in
different parts of the country. Soon after,
the Philippine Forum for Sustainable Agri-
culture was put together in 1991 by four
NGOs primarily to exchange experience
among themselves and with their partners.
Awareness of SA spread further among NGOs
with the holding of the highly publicized
1992 Earth Summit, at which SA-related con-
cerns were given some prominence.
Xavier University in Cagayan de Oro estab-
lished its Sustainable Agriculture Centre (SAC)
in 1992. PAKISAMA, a national federation
of peasant organizations, implemented its
SA project in seven provinces.
SA also drew the interest and a certain degree
of support from the government. For in-
stance, the Department of Agriculture (DA),
complying with the government’s Agenda
21 commitments, started an integrated pest
management (IPM) program. The College
of Agriculture at the University of the Phil-
ippines Los Baños began to reorient its ag-
riculture curricula towards SA by including
courses on farming systems and ecological
agriculture.
Meanwhile, some NGOs were hard at work
trying to clarify what they meant by Low
External Input Sustainable Agriculture
(LEISA).
An NGO called AGTALON, based in
Pangasinan (Luzon), defined LEISA for rice
production as applying at least 10 bags of
organic fertilizer plus a maximum of two
bags of synthetic fertilizer (instead of 8-10
bags in the conventional system) and no pes-
ticides at all.
Others qualified it as applying synthetic
inputs at below recommended levels (for
conventional agriculture). This continued de-
pendence on agrochemicals put the LEISA
adoptors in conflict with organic growers,
who claimed that their products were su-
perior to those of SA farmers.
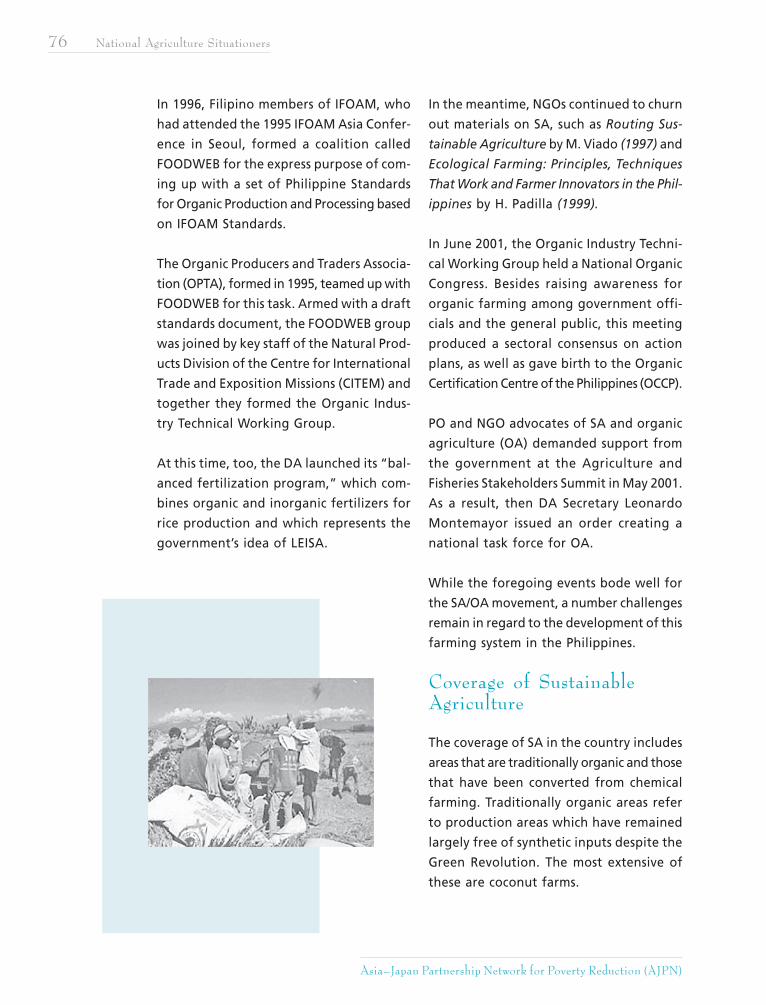
Asia–Japan Partnership Network for Poverty Reduction (AJPN)
76 National Agriculture Situationers
In 1996, Filipino members of IFOAM, who
had attended the 1995 IFOAM Asia Confer-
ence in Seoul, formed a coalition called
FOODWEB for the express purpose of com-
ing up with a set of Philippine Standards
for Organic Production and Processing based
on IFOAM Standards.
The Organic Producers and Traders Associa-
tion (OPTA), formed in 1995, teamed up with
FOODWEB for this task. Armed with a draft
standards document, the FOODWEB group
was joined by key staff of the Natural Prod-
ucts Division of the Centre for International
Trade and Exposition Missions (CITEM) and
together they formed the Organic Indus-
try Technical Working Group.
At this time, too, the DA launched its “bal-
anced fertilization program,” which com-
bines organic and inorganic fertilizers for
rice production and which represents the
government’s idea of LEISA.
In the meantime, NGOs continued to churn
out materials on SA, such as Routing Sus-
tainable Agriculture by M. Viado (1997) and
Ecological Farming: Principles, Techniques
That Work and Farmer Innovators in the Phil-
ippines by H. Padilla (1999).
In June 2001, the Organic Industry Techni-
cal Working Group held a National Organic
Congress. Besides raising awareness for
organic farming among government offi-
cials and the general public, this meeting
produced a sectoral consensus on action
plans, as well as gave birth to the Organic
Certification Centre of the Philippines (OCCP).
PO and NGO advocates of SA and organic
agriculture (OA) demanded support from
the government at the Agriculture and
Fisheries Stakeholders Summit in May 2001.
As a result, then DA Secretary Leonardo
Montemayor issued an order creating a
national task force for OA.
While the foregoing events bode well for
the SA/OA movement, a number challenges
remain in regard to the development of this
farming system in the Philippines.
Coverage of SustainableAgriculture
The coverage of SA in the country includes
areas that are traditionally organic and those
that have been converted from chemical
farming. Traditionally organic areas refer
to production areas which have remained
largely free of synthetic inputs despite the
Green Revolution. The most extensive of
these are coconut farms.
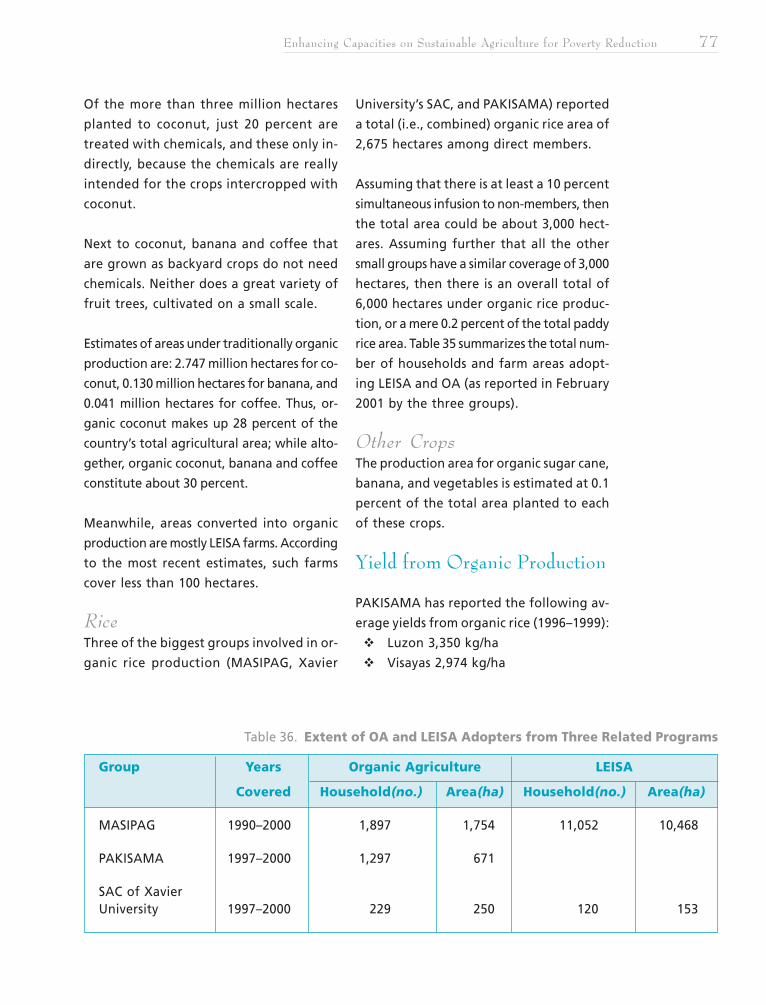
Enhancing Capacities on Sustainable Agriculture for Poverty Reduction 77
Of the more than three million hectares
planted to coconut, just 20 percent are
treated with chemicals, and these only in-
directly, because the chemicals are really
intended for the crops intercropped with
coconut.
Next to coconut, banana and coffee that
are grown as backyard crops do not need
chemicals. Neither does a great variety of
fruit trees, cultivated on a small scale.
Estimates of areas under traditionally organic
production are: 2.747 million hectares for co-
conut, 0.130 million hectares for banana, and
0.041 million hectares for coffee. Thus, or-
ganic coconut makes up 28 percent of the
country’s total agricultural area; while alto-
gether, organic coconut, banana and coffee
constitute about 30 percent.
Meanwhile, areas converted into organic
production are mostly LEISA farms. According
to the most recent estimates, such farms
cover less than 100 hectares.
RiceThree of the biggest groups involved in or-
ganic rice production (MASIPAG, Xavier
University’s SAC, and PAKISAMA) reported
a total (i.e., combined) organic rice area of
2,675 hectares among direct members.
Assuming that there is at least a 10 percent
simultaneous infusion to non-members, then
the total area could be about 3,000 hect-
ares. Assuming further that all the other
small groups have a similar coverage of 3,000
hectares, then there is an overall total of
6,000 hectares under organic rice produc-
tion, or a mere 0.2 percent of the total paddy
rice area. Table 35 summarizes the total num-
ber of households and farm areas adopt-
ing LEISA and OA (as reported in February
2001 by the three groups).
Other CropsThe production area for organic sugar cane,
banana, and vegetables is estimated at 0.1
percent of the total area planted to each
of these crops.
Yield from Organic Production
PAKISAMA has reported the following av-
erage yields from organic rice (1996–1999):
Luzon 3,350 kg/ha
Visayas 2,974 kg/ha
Table 36. Extent of OA and LEISA Adopters from Three Related Programs
Group Years Organic Agriculture LEISA
Covered Household(no.) Area(ha) Household(no.) Area(ha)
MASIPAG 1990–2000 1,897 1,754 11,052 10,468
PAKISAMA 1997–2000 1,297 671
SAC of XavierUniversity 1997–2000 229 250 120 153
Asia–Japan Partnership Network for Poverty Reduction (AJPN)
78 National Agriculture Situationers
Mindanao 3,250 kg/ha
Average 3,191 kg/ha/season
Meanwhile, MASIPAG organic farmers in
Surigao del Sur have reported an overall
average of 3,191 kg/ha/season for organic
rice. This is only slightly less than the country’s
average of 3,350 kg/ha for irrigated rice un-
der conventional or high-external-input
farming.
The average organic rice yield by SAC was
3,440 kg/ha which is about 1,000 kg/ha less
than the average of 4,400 kg/ha from con-
ventional farms in the vicinity; however, the
return on investment (ROI) from organic rice
was 2.37, compared to 1.10 from conven-
tional rice. In this instance, the ROI was based
on the cash cost of production only; if both
cash + non-cash costs were taken into ac-
count, the production cost would exceed
the net profit from the conventional pro-
duction system.
In the MASIPAG site in Surigao del Sur, an
income analysis of the 30 organic farms gave
an average ROI of 2.15.
Constraints to Conversion
Insecure Land TenureBy far, the biggest constraint to conversion
to organic production in the Philippines is
the lack of land tenure security. Experience
has shown that the best-managed organic
farms are those that are owned by the cul-
tivators themselves. Alternatively, some
wealthy land developers have successfully
put lands under organic production of veg-
etables and herbs using farm managers and
workers. Tenants, lessees, and renters can
hardly be expected to show any interest in
converting to organic production unless the
landowners themselves are determined to
convert their lands and to pay for the cost
of conversion.
Lack of Support Services forOrganic Production for “NewLandowners”Agrarian reform beneficiaries (ARBs) are
potential and strategic adoptors of organic
farming. However, they must be given tech-
nical and production support for organic
production, storage and processing, as well
as assistance in certifying and marketing their
products as organic.
Lack of Accredited OrganicCertification and Instability ofthe Organic Market
Inadequate Education andTrainingFarmers, especially those in marginal ar-
eas, need to be helped to appreciate the
benefits of going into organic farming. Cur-
rent education and training programs are
limited to POs/NGOs and church-based or-
ganizations that already have OA and SA
programs.
Lack of FinancingThere is no proactive financing program for
organic farming. On the other hand, stud-
ies have shown that successful organic farm-
ers had access to financial support.
Unreliability of Organic InputSupplyConversion is constrained by the lack of
organic seeds, certified organic fertilizers
and for the livestock industry, certified or-
ganic feeds.
Enhancing Capacities on Sustainable Agriculture for Poverty Reduction 79
duction project by the Benguet State Uni-
versity, whose vice-president is an individual
member of OCCP.
Marketing
The Agricultural Marketing and Support
Services of the DA has offered groups of
organic producers the free use of some
space near the DA for the marketing of
their products.
REGULATORY FRAMEWORK FOR
SUSTAINABLE AGRICULTURE
A document containing organic certification
standards adopted from the IFOAM Basic
Standards was prepared by FOODWEB in the
mid-1990s, and refined in a series of regional
consultations/workshops held in Luzon,
Visayas and Mindanao. In the middle of year
2000, at a national workshop, the document
was adopted as the Standards for the or-
ganic industry.
GOVERNMENT SUPPORT
FOR SUSTAINABLE
AGRICULTURE
Research and Development,Education and Extension
In the last few years, certain units in some
government agencies have begun to show
an interest in SA, or more specifically,OA.
In 1997, the Philippines Council for Agri-
culture, Forestry, Fisheries and Natural
Resources Research and Development
(PCARRD) sponsored a national consultation
workshop on OA at which representatives
of organic producers and members of IFOAM
were given the chance to interact with gov-
ernment researchers.
In 1998, PCARRD funded case studies of
selected farms (organic, LEISA and conven-
tional) which showed, among others, that
the organic farm that used on-farm biom-
ass gave a higher return on investment values
than the LEISA and conventional farms.
In 1999, PCARRD and the Bureau of Agri-
cultural Research of the DA funded a five-
year R&D program, “Organic Vegetable
Production,” to be implemented by the
University of the Philippines Los Baños In-
stitute of Plant Breeding. Sometime after,
PCARRD conducted a workshop-consultation
on organic livestock production, focusing
on organic chicken. The workshop was sup-
posed to encourage support for organic
chicken breeding and production by the In-
stitute of Animal Science at the University
of the Philippines Los Baños.
Another government initiative was a
regionwide (Northern Luzon) organic pro-
CHARACTERISTICS OF FARMER-ADOPTORS
Most Filipino farmers engaged inorganic production are members ofPOs/NGOs or PO/church-based orga-nization partners. Some of the POshave their own cooperatives, whichare generally multi-purpose coopera-tives and less frequently, women’sorganizations. A small percentage ofthe organic farmers are not mem-bers of any organization. Even fewerare adoptors involved in contractfarming.
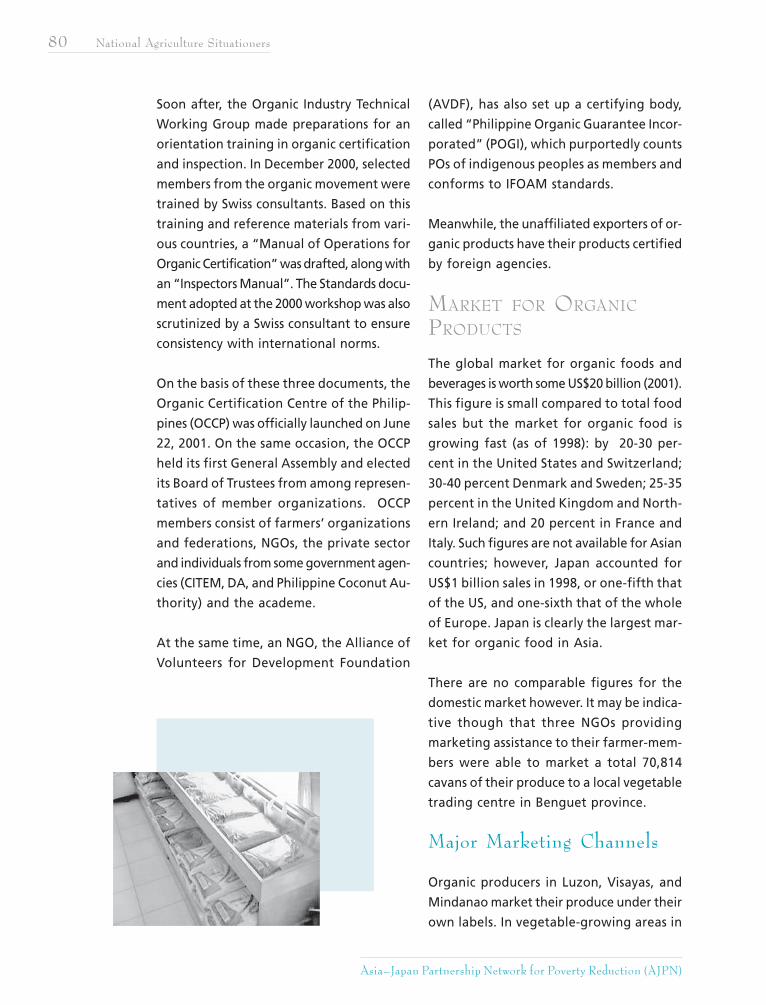
Asia–Japan Partnership Network for Poverty Reduction (AJPN)
80 National Agriculture Situationers
Soon after, the Organic Industry Technical
Working Group made preparations for an
orientation training in organic certification
and inspection. In December 2000, selected
members from the organic movement were
trained by Swiss consultants. Based on this
training and reference materials from vari-
ous countries, a “Manual of Operations for
Organic Certification” was drafted, along with
an “Inspectors Manual”. The Standards docu-
ment adopted at the 2000 workshop was also
scrutinized by a Swiss consultant to ensure
consistency with international norms.
On the basis of these three documents, the
Organic Certification Centre of the Philip-
pines (OCCP) was officially launched on June
22, 2001. On the same occasion, the OCCP
held its first General Assembly and elected
its Board of Trustees from among represen-
tatives of member organizations. OCCP
members consist of farmers’ organizations
and federations, NGOs, the private sector
and individuals from some government agen-
cies (CITEM, DA, and Philippine Coconut Au-
thority) and the academe.
At the same time, an NGO, the Alliance of
Volunteers for Development Foundation
(AVDF), has also set up a certifying body,
called “Philippine Organic Guarantee Incor-
porated” (POGI), which purportedly counts
POs of indigenous peoples as members and
conforms to IFOAM standards.
Meanwhile, the unaffiliated exporters of or-
ganic products have their products certified
by foreign agencies.
MARKET FOR ORGANIC
PRODUCTS
The global market for organic foods and
beverages is worth some US$20 billion (2001).
This figure is small compared to total food
sales but the market for organic food is
growing fast (as of 1998): by 20-30 per-
cent in the United States and Switzerland;
30-40 percent Denmark and Sweden; 25-35
percent in the United Kingdom and North-
ern Ireland; and 20 percent in France and
Italy. Such figures are not available for Asian
countries; however, Japan accounted for
US$1 billion sales in 1998, or one-fifth that
of the US, and one-sixth that of the whole
of Europe. Japan is clearly the largest mar-
ket for organic food in Asia.
There are no comparable figures for the
domestic market however. It may be indica-
tive though that three NGOs providing
marketing assistance to their farmer-mem-
bers were able to market a total 70,814
cavans of their produce to a local vegetable
trading centre in Benguet province.
Major Marketing Channels
Organic producers in Luzon, Visayas, and
Mindanao market their produce under their
own labels. In vegetable-growing areas in
Enhancing Capacities on Sustainable Agriculture for Poverty Reduction 81
Northern Luzon, some NGOs purchase or-
ganic products from farmers (with little
vegetable plots) and sell these at urban
centres. In places where there are POs of
organic rice farmers, market outlets for
organic rice are few, if any. In some cases,
the NGO partners take on the task of mar-
keting the rice, but these are the exception.
Organic vegetable growers had been sell-
ing their produce haphazardly until OPTA
set up special outlets in Manila for organic
vegetables, and thereby distinguished these
from conventional farm produce.
Meanwhile, organic food exports are
handled by only a few groups. One of these,
Altertrade, is a private corporation based in
Bacolod City in the Visayas that supports
small and marginalized farmers. An IFOAM
member, Altertrade is the only Philippine
company with international organic certifi-
cation to export organic sugar (muscovado)
and table banana. Altertrade buys organic
banana from small growers in Negros and
Bicol and exports these to Japan. It also ex-
ports organic banana chips to Canada in part-
nership with the Organic Verification of
North America based in Winnipeg, Manitoba.
Altertrade is itself a producer of muscovado
(sugar produced by heating sugar cane juice
in open pans) and regularly exports this
product to Europe and Japan.
Pricing Sustainable AgricultureProducts
The price differential between organic and
conventional products is determined prima-
rily by quality and the target market. For in-
stance, prices for organic fancy rice (red rice,
black rice, aromatic rice), patronized by the
high-income class, can go up to 100 percent
more than ordinary conventional rice, which
has no equivalent fancy varieties. For the
middle-income class, a slightly higher price
(10-15 percent more) is tolerable. Once the
products have been certified as organic,
prices are expected to go up even higher.
Post-harvest Handling
There is no major post-harvest facility for
handling organic products.
Each trading group handles only such vol-
umes as they can manage.
SUCCESS STORIES IN INCOMEGENERATION AND EMPLOYMENT
At the household level, a selected successstory is the one-half hectare irrigated or-ganic rice farm within which diversifiedeconomic activities gave much higher in-come than the main rice crop. Net incomefrom its various components within the six-month period of the case study gave amonthly income of more than PhP 20,000,which reached the income level of an assis-tant professor of a local state college in thearea. Other success stories, but no incomemeasurements, are given in the book, Eco-logical Farming (Padilla 1999).
With respect to organic enterprises beyondhousehold employment, a success story isthe A.P. Inocencio Teresa Farms which pro-duces organic chicken. As mentioned previ-ously, the farm meets all the requirements
to next page
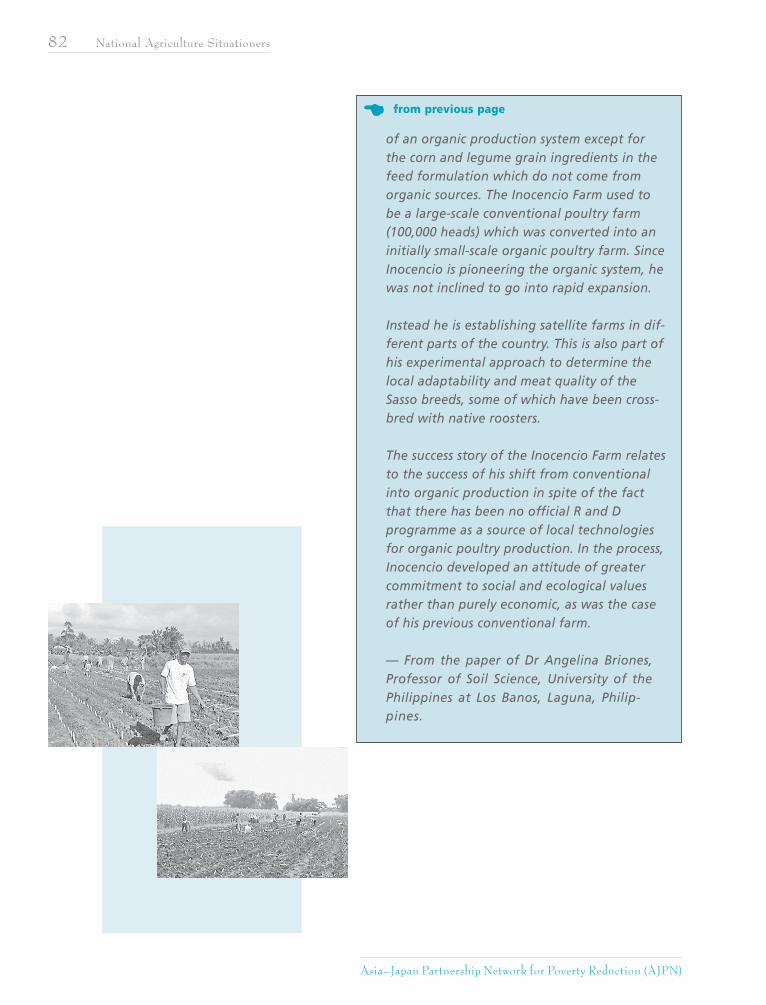
Asia–Japan Partnership Network for Poverty Reduction (AJPN)
82 National Agriculture Situationers
of an organic production system except forthe corn and legume grain ingredients in thefeed formulation which do not come fromorganic sources. The Inocencio Farm used tobe a large-scale conventional poultry farm(100,000 heads) which was converted into aninitially small-scale organic poultry farm. SinceInocencio is pioneering the organic system, hewas not inclined to go into rapid expansion.
Instead he is establishing satellite farms in dif-ferent parts of the country. This is also part ofhis experimental approach to determine thelocal adaptability and meat quality of theSasso breeds, some of which have been cross-bred with native roosters.
The success story of the Inocencio Farm relatesto the success of his shift from conventionalinto organic production in spite of the factthat there has been no official R and Dprogramme as a source of local technologiesfor organic poultry production. In the process,Inocencio developed an attitude of greatercommitment to social and ecological valuesrather than purely economic, as was the caseof his previous conventional farm.
— From the paper of Dr Angelina Briones,Professor of Soil Science, University of thePhilippines at Los Banos, Laguna, Philip-pines.
from previous page

Enhancing Capacities on Sustainable Agriculture for Poverty Reduction 83
chapter
84 Project Site Profiles
Asia–Japan Partnership Network for Poverty Reduction (AJPN)
THE PROJECT SITE in North India con-
sists of two small villages in Bihar: Khamkalan
and Parmalpur.
Agriculture is the major source of income
in both villages. Khamkalan households get
71 percent of their income from farming,
and the rest from non-farm activities. In
Parmalpur, households appear to have more
alternate sources of income, although over
half of their income comes from agriculture-
related activities.
KHAMKALAN AND
PARMALPURKaimur, Bihar, IndiaProject Site Profile
Prepared by: Association of Voluntary Agencies for Rural Development (AVARD)
Edited by: Teresa Lingan–Debuque
The average annual income a household in
Khamkalan is Rs. 19,239 (US$458), or US$1.25
a day. In Parmalpur, both farm and non-farm
activities yield better returns than in
Khamkalan; the average annual household
income there is almost three times higher:
Rs.57,446 (US$1,367). Nonetheless, this in-
come level is still considered quite low for
a six- to eight-member household—the av-
erage household size in Khamkalan.
AGRICULTURAL PRACTICE
Khamkalan has a rainfed agriculture system.
Kharif (autumnal) crops are primarily grown
with rainwater, but in the latter stages of
cropping, some farmers use the lift irriga-
tion system when necessary. On the other
hand, Rabi (spring) crops are wholly depen-
dent on lift irrigation.
Meanwhile, Parmalpur’s semi-arid agricul-
ture system is characterized by an irriga-
tion canal system and tube wells owned by
individual farmers. Both Kharif and Rabi crops
are completely dependent on irrigation ca-
nals. Alternatively, farmers use tube wells
when the irrigation canal dries up.
Enhancing Capacities on Sustainable Agriculture for Poverty Reduction 85
The total area planted in Parmalpur is 57
percent higher than in Khamkalan.
Parmalpur farmers also have larger (i.e., by
almost a hectare) combined and per parcel
landholdings than farmers in Khamkalan.
Cropping intensity, or the rate of land use
during cropping seasons, is also higher (by
44 percent) in Parmalpur than in Khamkalan.
Parmalpur likewise grows more crops on its
lands. Rice and wheat are its major crops,
while mustard, linseed, gram and lentil are
common secondary crops. Khamkalan farm-
ers tend to observe a longer fallow period
and focus on growing paddy and wheat.
Farmers in Parmalpur and Khamkalan have
fairly good access to land. Almost all farm-
ers in both villages are owner-cultivators
and only a few are mortgagors and share-
holders. These lands are mostly acquired by
inheritance while the rest are either bought
or acquired through agrarian reform.
Both Parmalpur and Khamkalan farmers
know little of Sustainable Agriculture tech-
nologies, the former being much less knowl-
edgeable than the latter.
SOIL MANAGEMENT
The application of animal manure is the most
common practice adopted by the farmers
to enhance soil fertility. Some farmers also
practice a form of composting but none of
them is trained to do it properly.
In Khamkalan, as much as 81 percent of
farmers use animal manure on their farms;
5 percent practice composting; and 10 per-
cent apply chemical fertilizers. In Parmalpur,
all farmers use chemicals to fertilize their
farms, although 41 percent also use animal
manure and 20 percent practice composting.
PLANT PEST MANAGEMENT
None of the farmers in either village prac-
tices sustainable pest management tech-
niques. In fact, almost all farmers (98 per-
cent) in Parmalpur and 8 percent of those
in Khamkalan use chemical pesticides.
CROPPING PATTERN
The two villages are characterized by dif-
ferent cropping patterns, which are in turn
determined by the source of water for ag-
riculture. Khamkalan farmers observe a
longer fallow period for paddy and wheat
cultivation, while in Parmalpur, wheat is
rotated with secondary crops like mustard
and lentils, with a fallow period observed
after the second cropping.
SEED AND PLANTING
MATERIAL
Different seed varieties are used in the two
villages. In Khamkalan, most farmers (86 per-
cent) use traditional varieties, while in
Parmalpur, most (87 percent) prefer the
improved lines. Generally, however, farm-
ers in both villages use high-yielding vari-
eties: 93 percent in Khamkalan and 81
percent in Parmalpur.
ADOPTION OF ALTERNATIVE FARMING PRACTICE
86 Project Site Profiles
Asia–Japan Partnership Network for Poverty Reduction (AJPN)
UTILIZATION OF ORGANIC
MATERIALS
There are enough organic materials for use
in the farm, as farmers in both villages at-
tested. Such materials may be sourced within
the farm, or within or outside the village.
COST OF AGRICULTURAL INPUTS
ers, and thus get lower yields than they
should.
Farmers in Parmalpur allot 1.3 to 1.8 per-
cent of their total production cost on irri-
gation for all of its crops except paddy where
irrigation costs twice as much. Farmers in
Khamkalan do not spend on irrigation since
their crops are mainly rainfed.
On the other hand, farmers in Khamkalan
spend more on seeds than do those in
Parmalpur. In fact, the cost of seeds makes
up a bigger portion of the total production
cost in Khamkalan than in Parmalpur, es-
pecially in the case of gram, lentils, linseed,
and wheat.
Labor makes up the bulk of spending of
farmers in both villages. Labor requirements
are highest during planting and harvesting,
particularly for paddy.
Parmalpur’s farmers spend more than
Khamkalan’s farmers do in growing both
major and secondary crops. In particular,
they spend 107 percent more on second-
ary crops, and some 55-64 percent more
on major crops. The discrepancy could be
explained by differences in farming prac-
tice in the two villages.
For example, Parmalpur’s farmers use as
much as 20 times more chemical fertiliz-
ers than do farmers in Khamkalan. In fact,
Parmalpur’s higher production cost can be
attributed to this difference in fertilizer
spending. Khamkalan’s farmers spend a lot
less on fertilizers partly because they use
animal manure in place of chemicals, but
mostly because they can’t afford to buy
more of it.
However, in both villages, wheat and paddy
production use up more chemical fertiliz-
ers than other crops. Farmers in Khamkalan
as well as Parmalpur are also generally un-
aware of the proper application of fertiliz-
Enhancing Capacities on Sustainable Agriculture for Poverty Reduction 87
FARM PRODUCTIVITY AND FARM INCOME
In Parmalpur, the highest farm yields are
derived from paddy and wheat production
while in Khamkalan, the top grossers are
gram/pigeon pea and wheat. Mustard trails
the other crops in both villages. Livestock
products, particularly cow’s milk, are also
underperformers in both villages.
Most of Parmalpur’s farmers sell their crops,
while those in Khamkalan either use their
produce to repay loans or consume it them-
selves. Yet, Parmalpur’s farmers are no better
off financially from selling their produce.
Some 14-30 percent of their wheat and paddy
produce goes towards repaying loans; 6-8
percent is used to pay their farmworkers;
and 1-11 percent is put aside as planting
material for the next cropping.
In Khamkalan, farming is largely subsistence
rather than income-generating. Yet, farm-
ers set aside more of their produce (espe-
cially of wheat and paddy) to pay off their
loans than to feed their families.
The net income from the production of major
and secondary crops in both Khamkalan and
Palmarpur is quite low.
Gram/pigeon pea and lentil cultivation
appear to be the most profitable for farm-
ers in Khamkalan. The average net income
per cropping from gram/pigeon pea culti-
vation is Rs 5,390 or US$128, while from lentil
it is Rs3,650 or US$87.
Farmers earn only half as much from grow-
ing major crops, i.e., paddy and wheat. For
instance, paddy production earns only Rs
2,250 or US$53 a hectare, or a net income
of US$101 a cropping (duration: four
months). Farmers earn just a little more from
growing wheat, at US$118 a cropping.
In Parmalpur, paddy, lentil and wheat pro-
duction generate the highest income. With
earnings from major crops and few secondary
crops, Parmalpur is in a bit better condi-
tion than Khamkalan. Its highest profit is
generated from paddy production, at an av-
erage net income of Rs 9,050 or US$215.
Lentil production comes second, with an
average net income equivalent to US$198;
followed by wheat, with US$165.
In general, net returns are higher in
Parmalpur than in Khamkalan, except for
gram/pigeon pea. It is particularly higher in
paddy, wheat and lentil production. Mustard
growing has the lowest return in both areas.
ACCESS TO CREDIT
In Khamkalan, farmers choose between lo-
cal moneylenders and the rural bank, which
lend at 5 percent and 10 percent interest,
respectively. Relatives and neighbors are like-
wise immediate sources of credit. However,
in all cases, the loan amount is minimal, in-
cluding loans taken out from the bank. On
the other hand, Parmalpur farmers appear
to borrow only from the State Bank of In-
dia, which lends at 9 percent interest.
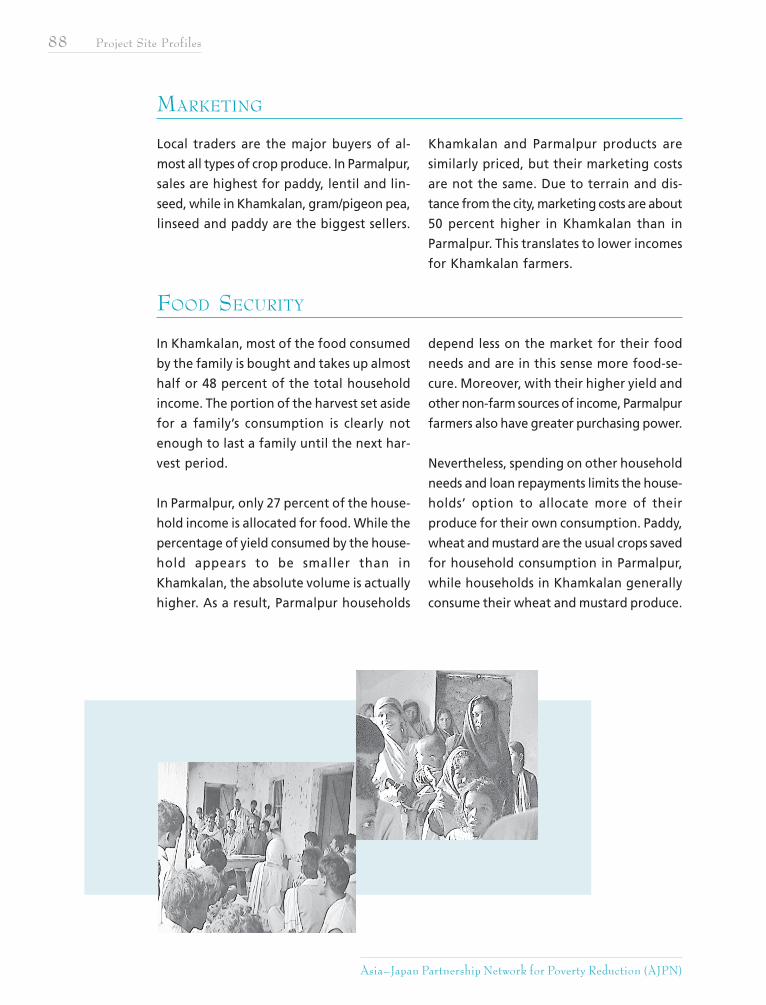
88 Project Site Profiles
Asia–Japan Partnership Network for Poverty Reduction (AJPN)
MARKETING
FOOD SECURITY
Local traders are the major buyers of al-
most all types of crop produce. In Parmalpur,
sales are highest for paddy, lentil and lin-
seed, while in Khamkalan, gram/pigeon pea,
linseed and paddy are the biggest sellers.
Khamkalan and Parmalpur products are
similarly priced, but their marketing costs
are not the same. Due to terrain and dis-
tance from the city, marketing costs are about
50 percent higher in Khamkalan than in
Parmalpur. This translates to lower incomes
for Khamkalan farmers.
In Khamkalan, most of the food consumed
by the family is bought and takes up almost
half or 48 percent of the total household
income. The portion of the harvest set aside
for a family’s consumption is clearly not
enough to last a family until the next har-
vest period.
In Parmalpur, only 27 percent of the house-
hold income is allocated for food. While the
percentage of yield consumed by the house-
hold appears to be smaller than in
Khamkalan, the absolute volume is actually
higher. As a result, Parmalpur households
depend less on the market for their food
needs and are in this sense more food-se-
cure. Moreover, with their higher yield and
other non-farm sources of income, Parmalpur
farmers also have greater purchasing power.
Nevertheless, spending on other household
needs and loan repayments limits the house-
holds’ option to allocate more of their
produce for their own consumption. Paddy,
wheat and mustard are the usual crops saved
for household consumption in Parmalpur,
while households in Khamkalan generally
consume their wheat and mustard produce.
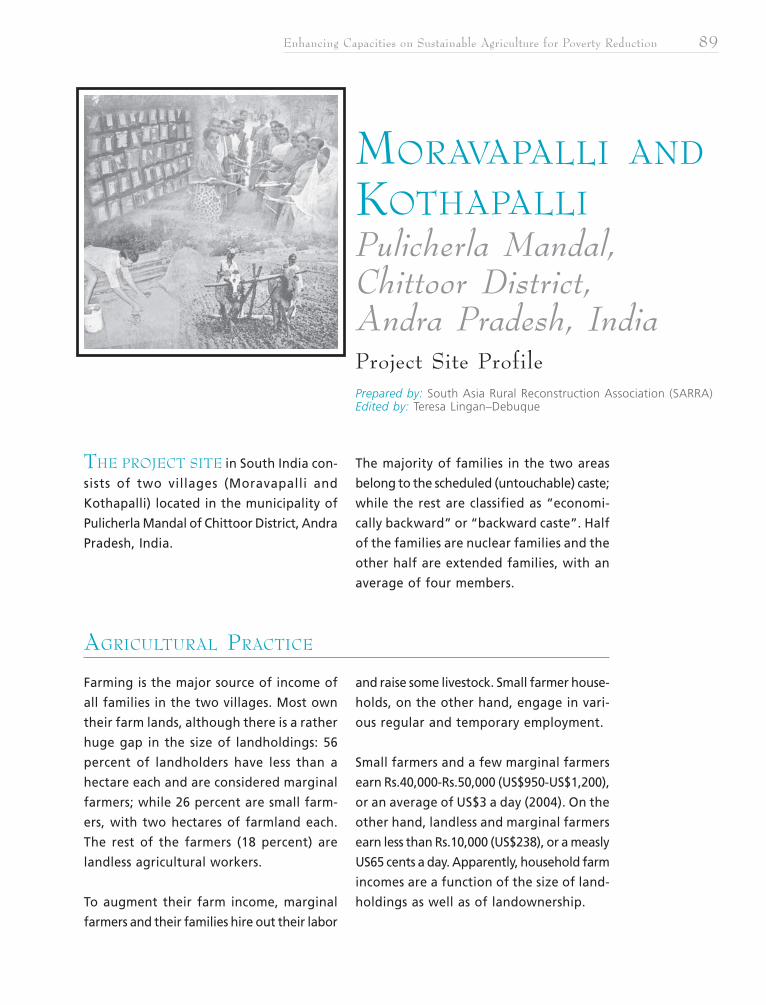
Enhancing Capacities on Sustainable Agriculture for Poverty Reduction 89
MORAVAPALLI AND
KOTHAPALLIPulicherla Mandal,Chittoor District,Andra Pradesh, IndiaProject Site ProfilePrepared by: South Asia Rural Reconstruction Association (SARRA)Edited by: Teresa Lingan–Debuque
THE PROJECT SITE in South India con-
sists of two villages (Moravapalli and
Kothapalli) located in the municipality of
Pulicherla Mandal of Chittoor District, Andra
Pradesh, India.
The majority of families in the two areas
belong to the scheduled (untouchable) caste;
while the rest are classified as “economi-
cally backward” or “backward caste”. Half
of the families are nuclear families and the
other half are extended families, with an
average of four members.
AGRICULTURAL PRACTICE
Farming is the major source of income of
all families in the two villages. Most own
their farm lands, although there is a rather
huge gap in the size of landholdings: 56
percent of landholders have less than a
hectare each and are considered marginal
farmers; while 26 percent are small farm-
ers, with two hectares of farmland each.
The rest of the farmers (18 percent) are
landless agricultural workers.
To augment their farm income, marginal
farmers and their families hire out their labor
and raise some livestock. Small farmer house-
holds, on the other hand, engage in vari-
ous regular and temporary employment.
Small farmers and a few marginal farmers
earn Rs.40,000-Rs.50,000 (US$950-US$1,200),
or an average of US$3 a day (2004). On the
other hand, landless and marginal farmers
earn less than Rs.10,000 (US$238), or a measly
US65 cents a day. Apparently, household farm
incomes are a function of the size of land-
holdings as well as of landownership.
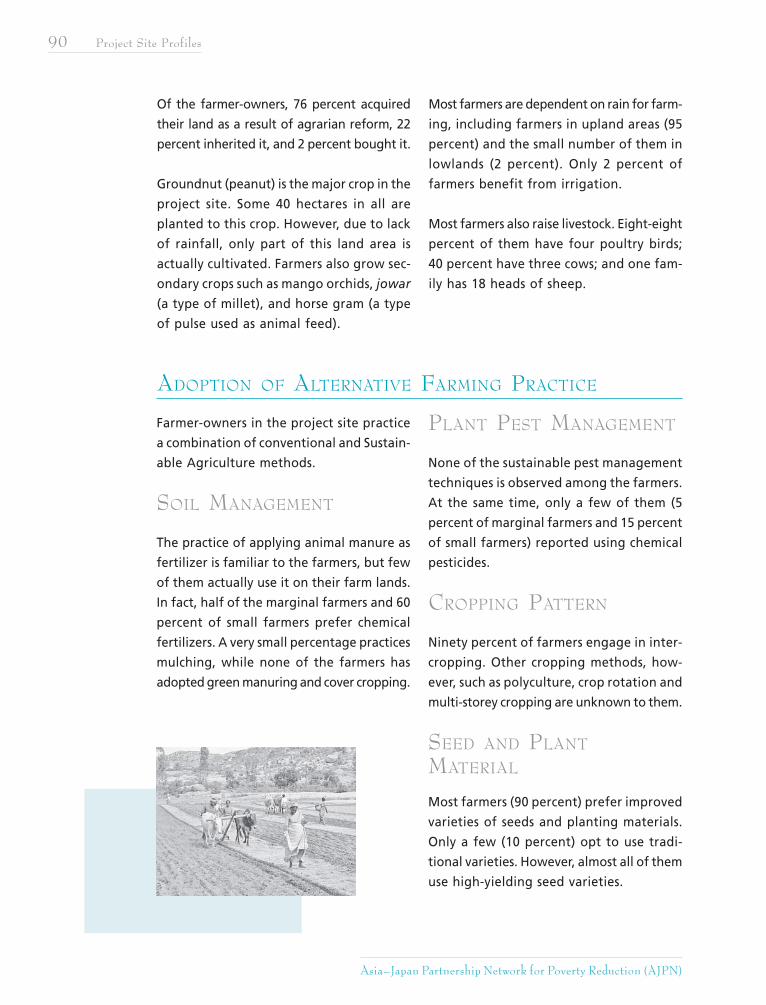
90 Project Site Profiles
Asia–Japan Partnership Network for Poverty Reduction (AJPN)
Of the farmer-owners, 76 percent acquired
their land as a result of agrarian reform, 22
percent inherited it, and 2 percent bought it.
Groundnut (peanut) is the major crop in the
project site. Some 40 hectares in all are
planted to this crop. However, due to lack
of rainfall, only part of this land area is
actually cultivated. Farmers also grow sec-
ondary crops such as mango orchids, jowar
(a type of millet), and horse gram (a type
of pulse used as animal feed).
Most farmers are dependent on rain for farm-
ing, including farmers in upland areas (95
percent) and the small number of them in
lowlands (2 percent). Only 2 percent of
farmers benefit from irrigation.
Most farmers also raise livestock. Eight-eight
percent of them have four poultry birds;
40 percent have three cows; and one fam-
ily has 18 heads of sheep.
ADOPTION OF ALTERNATIVE FARMING PRACTICE
Farmer-owners in the project site practice
a combination of conventional and Sustain-
able Agriculture methods.
SOIL MANAGEMENT
The practice of applying animal manure as
fertilizer is familiar to the farmers, but few
of them actually use it on their farm lands.
In fact, half of the marginal farmers and 60
percent of small farmers prefer chemical
fertilizers. A very small percentage practices
mulching, while none of the farmers has
adopted green manuring and cover cropping.
PLANT PEST MANAGEMENT
None of the sustainable pest management
techniques is observed among the farmers.
At the same time, only a few of them (5
percent of marginal farmers and 15 percent
of small farmers) reported using chemical
pesticides.
CROPPING PATTERN
Ninety percent of farmers engage in inter-
cropping. Other cropping methods, how-
ever, such as polyculture, crop rotation and
multi-storey cropping are unknown to them.
SEED AND PLANT
MATERIAL
Most farmers (90 percent) prefer improved
varieties of seeds and planting materials.
Only a few (10 percent) opt to use tradi-
tional varieties. However, almost all of them
use high-yielding seed varieties.
Enhancing Capacities on Sustainable Agriculture for Poverty Reduction 91
COST OF AGRICULTURAL INPUTS
Seeds account for the bulk of spending by
both marginal and small farmers. Besides
their high cost, the high-yielding seeds which
the farmers prefer are not easily accessible
and are prone to pest infestation.
A few farmers have been observed to use
pesticides, although there is no available
data on actual spending.
Since most of the farms are rainfed, farm-
ers do not spend on irrigation.
Marginal farmers pay hired hands only during
planting, and spend an average of Rs.300.
The rest of the time, farm work is done by
family members and other relatives and is
therefore unpaid.
An average of eight people are needed for
each farming task. Except for planting, where
females dominate, all other activities are
done by an equal number of men and
women. Male and female workers are paid
the same wages.
Small farmers have more labor requirements.
Some 20 to 25 people, mostly women (77
percent), are hired for planting, weeding
and threshing. These get Rs.10 for land prepa-
ration and Rs. 40 for planting, but much
less for the other tasks. Hence, 40 percent
of small farmers’ spending on labor is allo-
cated for planting.
Women are paid the same as the men.
However, the women also make up the
majority of unpaid laborers who are recruited
for land preparation and drying.
Small farmers pay double the amount paid
by marginal farmers on machine rental and
workers’ food, since their bigger farm lands
require more work than family members can
handle.
FARM PRODUCTIVITY AND FARM INCOME
Recent records of gross production value
generated would indicate that marginal
farmers are more productive than small
farmers. However, this may be explained by
the fact that fewer small farmers than
marginal ones actually did any farming in
that cropping, and on a smaller area than
that planted by marginal farmers (i.e., 4.4
hectares compared to 6.4 hectares planted
by marginal farmers).
As it happened, the small farmers opted to
concentrate on other income sources rather
than risk crop failure due to limited rains.
In the meantime, landless households that
raised livestock yielded only 10 percent of
the gross production value attained by small
and marginal farmers.
Groundnut production yielded a high re-
turn, despite the reduced effective area
planted (less than a hectare each for small
92 Project Site Profiles
Asia–Japan Partnership Network for Poverty Reduction (AJPN)
and marginal farmers). The farmers also
earned from residual products from ground-
nut production, such as fodder and pulses.
Cow’s milk production yielded a return of
79 to 94 percent, excluding the income from
selling the calf and manure.
ACCESS TO CREDIT
The majority of farmers have outstanding
obligations ranging from Rs.5,000-Rs.15,000
(US$120-US$360), while a few have much
larger loans.
Self-help groups (SHGs), money lenders,
banks and other groups are common sources
of credit. However, farmers prefer to go to
SHGs (44 percent) and even moneylenders
(20 percent), who charge as much as 24-28
percent interest a year, because of the ease
and speed at which loans are released. For
bigger loans, however, banks are still popular.
Meanwhile, among landless workers, SHGs
are the only option.
Loans are frequently used to buy food or
to pay for health, education and other house-
hold expenses. Only the small farmers take
out loans for farming purposes.
MARKETING
The farmers sell 50-60 percent of their
groundnut produce and 80 percent of the
cow’s milk. Groundnuts are generally sold
to middlemen, cow’s milk to dairies, and
mangoes and sheep at the market. All these
products are sold fresh and unprocessed,
as none of the farmers is engaged in pro-
cessing their products.
Groundnut producers complain of various
marketing-related problems, namely: (1) lack
of storage space and facilities; (2) absence
of a credit facility or village-level market
support from the Government; (3) lack of
skills in product processing; (4) absence or
inaccessibility of other market outlets, such
as factories, which forces farmers to sell only
to middlemen; and (5) corruption in the
marketing of groundnuts.
FOOD SECURITY
Some 13 to 14 percent of livestock prod-
ucts and 21-28 percent of the groundnut
produce are set aside for household con-
sumption. This indicates a level of house-
hold food security, at least insofar as pea-
nut and milk consumption are concerned.
Purchasing power among the farmers is also
rather high, since half of them spend just
Rs.10,000-Rs.20,000 (US$238-476) on food.
Only 14 percent spend more than this. How-
ever, this food budget is still small consid-
ering that farmers buy all of their rice.
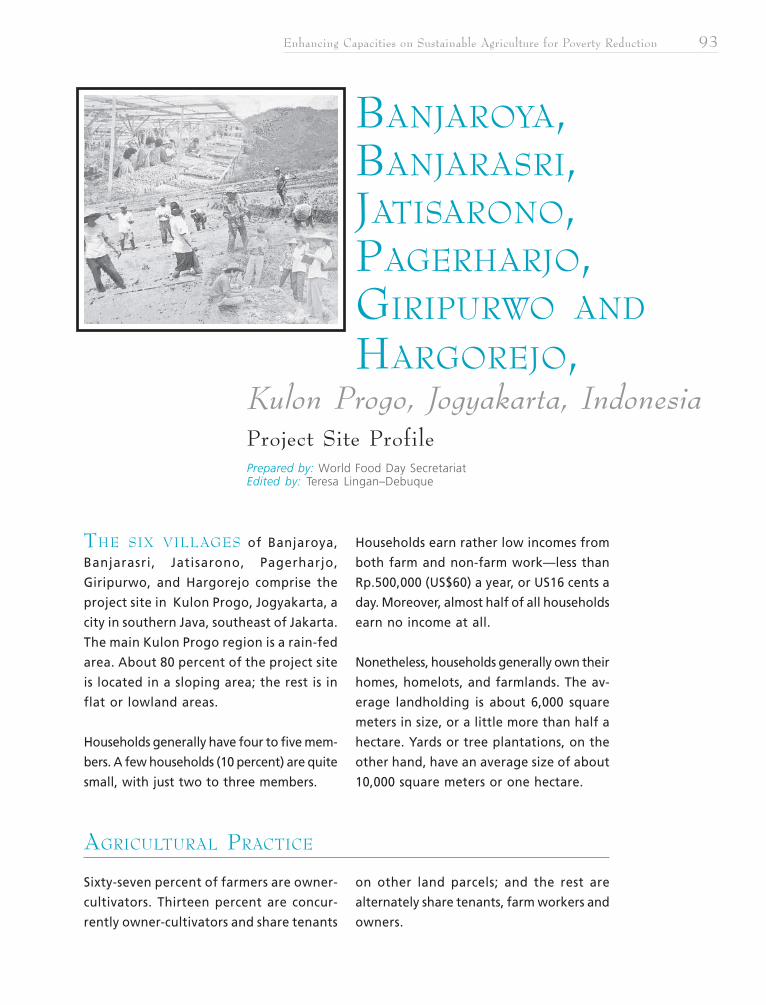
Enhancing Capacities on Sustainable Agriculture for Poverty Reduction 93
BANJAROYA,BANJARASRI,JATISARONO,PAGERHARJO,GIRIPURWO AND
HARGOREJO,
THE SIX VILLAGES of Banjaroya,
Banjarasri, Jatisarono, Pagerharjo,
Giripurwo, and Hargorejo comprise the
project site in Kulon Progo, Jogyakarta, a
city in southern Java, southeast of Jakarta.
The main Kulon Progo region is a rain-fed
area. About 80 percent of the project site
is located in a sloping area; the rest is in
flat or lowland areas.
Households generally have four to five mem-
bers. A few households (10 percent) are quite
small, with just two to three members.
Households earn rather low incomes from
both farm and non-farm work—less than
Rp.500,000 (US$60) a year, or US16 cents a
day. Moreover, almost half of all households
earn no income at all.
Nonetheless, households generally own their
homes, homelots, and farmlands. The av-
erage landholding is about 6,000 square
meters in size, or a little more than half a
hectare. Yards or tree plantations, on the
other hand, have an average size of about
10,000 square meters or one hectare.
Kulon Progo, Jogyakarta, IndonesiaProject Site Profile
AGRICULTURAL PRACTICE
Sixty-seven percent of farmers are owner-
cultivators. Thirteen percent are concur-
rently owner-cultivators and share tenants
on other land parcels; and the rest are
alternately share tenants, farm workers and
owners.
Prepared by: World Food Day SecretariatEdited by: Teresa Lingan–Debuque
94 Project Site Profiles
Asia–Japan Partnership Network for Poverty Reduction (AJPN)
Kulon Progo gets its water from the rain
and the river. Hence, farmers generally
depend on the rain and other natural water
sources, such as the river and deep wells.
Access to irrigation is rare.
Rice and cassava are the most common crops
planted by farmers. However, many of them
are also engaged in the cultivation of co-
conut, maize, cloves and tubers.
On hilly land, farmers usually plant more
than one secondary crop. Lemongrass, soy-
bean, vanilla, etc. are planted alongside
cassava, fruit trees, palm trees and clove. A
number of fruit trees, such as durian, jack-
fruit, avocado and others, can also be found
being grown on farmlands.
Chicken is the most common livestock raised
in the villages, although goats, cows, rab-
bits and ducks are also seen around the vil-
lages. A very small percentage of households
are engaged in fish cultivation.
ADOPTION OF ALTERNATIVE FARMING PRACTICES
Many of the farmers practice Sustainable
Agriculture, especially in regard to soil fer-
tility management and cropping method.
SOIL MANAGEMENT
Farmers use animal dung (36 percent) and
compost (31 percent) to enhance soil fer-
tility. A few others use rice straw and green
manure. Farmers have access to a variety
of organic materials to fertilize the soil.
PLANT PEST MANAGEMENT
To control pest infestation, farmers have a
wide range of local materials to choose from,
including bitter leaves, ginger, galangal and
other medicinal crops. By adopting multiple
crops, the farmers help stabilize the agro-
ecosystem, thus reducing plant pest infes-
tation and diseases.
CROPPING PATTERN
A little over half of the farmers are engaged
in multiple cropping (i.e., combining major
crops and fruit trees with secondary crops),
as evidenced by the diversity of agricultural
products in the project site. On rice lands, a
number of farmers adopt variations in crop
rotation, for example, alternating rice culti-
vation with cash crop production.
COST OF AGRICULTURAL INPUTS
Because of their heavy reliance on local ma-
terials to fertilize the soil and to control
pests, the farmers spend little, if at all, on
agricultural chemicals.
They also generally don’t have to pay farm
workers as much of the work is done by them
or by household members and relatives—
a common enough practice among poor
farming communities.
Enhancing Capacities on Sustainable Agriculture for Poverty Reduction 95
FARM PRODUCTIVITY AND FARM INCOME
Farmers get their highest yields from cas-
sava, at 10 tons a hectare. Rice is a dis-
tant second, yielding 4.5 tons a hectare,
followed closely by maize/corn, at four tons
a hectare.
However, growing rice is by far the most
profitable, yielding an average gross income
of Rp 6,750,000.00, or about US$ 794. Corn
comes next, with US$470, and cassava, with
Rp 294.
ACCESS TO CREDIT
There are various credit sources in the project
site. Formal sources include banks, the credit
union and cooperatives. Farmers who are
members of cooperatives can acquire collat-
eral-free loans at 1-3 percent interest a month.
The banks charge 16-20 percent interest a
year and require collateral. Banks gener-
ally give out bigger loans (average:
Rp3,000,000 [US$353]) than do cooperatives
(average: Rp1,200,000 [US$143]).
Neighbors and local stores are alternative
(informal) credit sources. Such loans usu-
ally pay for the seeds and are repaid upon
harvest. Farmers also borrow money to pay
for farm labor, especially during land prepa-
ration and planting, but they have to pay
this back soon after (i.e., after one to two
weeks). Credit from local stores—usually
for food items—has to be repaid in one to
five days.
MARKETING
The traditional market is the most common
venue for selling produce. The local mar-
ket and middlemen are also common dis-
tribution channels, especially for bulk sales.
Other farmers sell their products to coop-
eratives and selected groups or contacts.
FOOD SECURITY
Households generally consume their fruit
products, and sell these only when necessary.
Rice is the staple food, but is sometimes re-
placed by cassava and taro, especially dur-
ing a drought.
In the uplands, vegetables are grown mainly
for household consumption. In the lowlands,
however, vegetables are mostly sold.
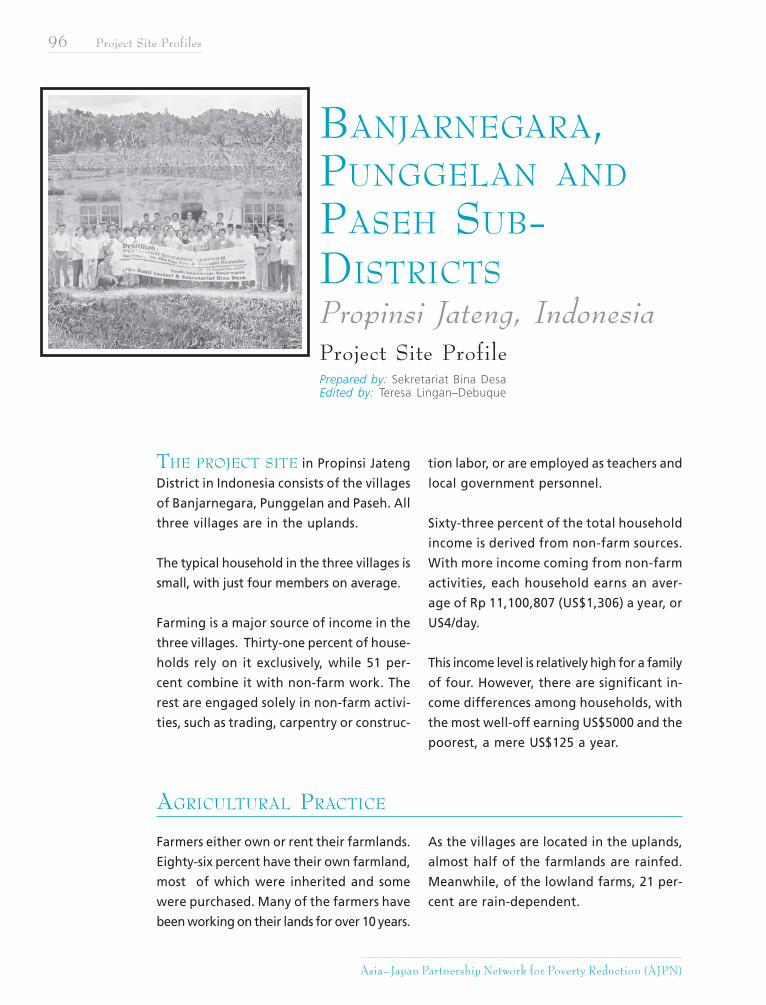
96 Project Site Profiles
Asia–Japan Partnership Network for Poverty Reduction (AJPN)
BANJARNEGARA,PUNGGELAN AND
PASEH SUB-DISTRICTSPropinsi Jateng, IndonesiaProject Site Profile
THE PROJECT SITE in Propinsi Jateng
District in Indonesia consists of the villages
of Banjarnegara, Punggelan and Paseh. All
three villages are in the uplands.
The typical household in the three villages is
small, with just four members on average.
Farming is a major source of income in the
three villages. Thirty-one percent of house-
holds rely on it exclusively, while 51 per-
cent combine it with non-farm work. The
rest are engaged solely in non-farm activi-
ties, such as trading, carpentry or construc-
tion labor, or are employed as teachers and
local government personnel.
Sixty-three percent of the total household
income is derived from non-farm sources.
With more income coming from non-farm
activities, each household earns an aver-
age of Rp 11,100,807 (US$1,306) a year, or
US4/day.
This income level is relatively high for a family
of four. However, there are significant in-
come differences among households, with
the most well-off earning US$5000 and the
poorest, a mere US$125 a year.
AGRICULTURAL PRACTICE
Farmers either own or rent their farmlands.
Eighty-six percent have their own farmland,
most of which were inherited and some
were purchased. Many of the farmers have
been working on their lands for over 10 years.
As the villages are located in the uplands,
almost half of the farmlands are rainfed.
Meanwhile, of the lowland farms, 21 per-
cent are rain-dependent.
Prepared by: Sekretariat Bina DesaEdited by: Teresa Lingan–Debuque
Enhancing Capacities on Sustainable Agriculture for Poverty Reduction 97
Despite this, the farmers are able to grow a
number of major crops, such as zallaca palm,
rice paddy and cassava. A variety of second-
ary crops, along with various tree species,
are also cultivated in the villages. Banana is
a common secondary crop, frequently planted
on farmers’ second parcel of land. Other sec-
ondary crops are coconut, albasia, long beans
and corn, among others.
Some livestock are also raised in the villages,
such as goats, chickens and ducks. A few
farmers maintain fishponds.
The practice of Sustainable Agriculture is
widespread in the three villages. Sustain-
able agriculture adoptors attest to the ini-
tial decline in production following the shift
to Sustainable Agriculture, and to the even-
tual recovery of the soil, leading to improved
fertility and better yields in future.
However, a significant number of farmers (20
percent) are unfamiliar with Sustainable
Agriculture technologies and unaware that
these are being implemented in their village.
ADOPTION OF ALTERNATIVE FARMING PRACTICE
SOIL MANAGEMENT
Almost all of the farmers are used to or have
tried out some form of soil conservation/
enhancement method. Seventy-five percent
of the farmers apply animal manure on their
crops; a smaller percentage practices mulch-
ing and composting; while some maintain
hedgerows and cover cropping.
The diversity of soil conservation practices
indicates the farmers’ high level of aware-
ness of how local materials can be used to
conserve and manage the soil.
At the same time, however, 25 percent of
the farmers use chemical fertilizers and lime
for the same purpose, especially in paddy
cultivation.
PLANT PEST MANAGEMENT
The farmers are rather less familiar with sus-
tainable pest management practices. None-
theless, there is at least one farmer prac-
ticing each type of pest management tech-
nology, the most common of which is Inte-
grated Pest Management (IPM), which has
been adopted by a number of farmers.
However, the use of pesticides, particularly,
nematocides, is still quite prevalent.
CROPPING PATTERN
Seventy-two percent of the farmers prac-
tice polyculture, or the cultivation of mul-
tiple crop species on the same land, which
is more sustainable than the conventional
monoculture.
Other farmers engage in crop rotation,
multi-storey cropping and intercropping.
However, some 12 percent of the farmers
have kept to monoculture, especially in
paddy cultivation.
SEED AND PLANT MATERIAL
Judging solely by the kind of seed and plant-
ing material used, almost 75 percent of the
98 Project Site Profiles
Asia–Japan Partnership Network for Poverty Reduction (AJPN)
farmlands may be classified as under Sus-
tainable Agriculture.
Fifty-three percent of the farmers prefer to
use improved lines, especially for zallaca palm
production. Other farmers (21 percent) pro-
ducing paddy, albasia and cassava use both
improved lines and the traditional variety.
On the other hand, hybrid and high yield-
ing varieties are also used by some farmers
(22 percent), especially for paddy production.
UTILIZATION OF ORGANIC
MATERIAL
Farmers have easy access to organic materi-
als; hence the widespread practice of apply-
ing them on the farmlands. Half of them get
such materials within the farm itself; others
outside the farm, but within the village.
COST OF AGRICULTURAL INPUTS
Paddy production using chemicals is 15
percent more expensive than organic pro-
duction, owing primarily to the high cost
of chemical fertilizers and pesticides. Seed,
labor and milling costs, however, are about
the same for both farming systems.
Labor costs may seem to be slightly higher
for organic farming (68 percent of the to-
tal cost for organic farming vs. 59 percent
of the cost of chemical farming) but in fact,
both systems require the same manpower
for all farming activities. Labor costs are par-
ticularly high during land preparation, plant-
ing and harvesting.
In particular, the cost of zallaca palm pro-
duction is highest in the first year and tapers
off towards the fifth year. After the initial
spending on seeds, which accounts for as
much as 71 percent of the total cost, the
zallaca palm stem generates yield for sev-
eral years, thus reducing the production cost
by 70 percent on the second year.
Fertilizer costs are also higher in the initial
year and then level off at 40 percent of total
cost until the fifth year. Labor makes up the
bulk of spending till the fifth year, at 60
percent of total cost, but is still cheaper on
the second year onwards because there is
no longer need for land preparation, planting
and re-planting.
FARM PRODUCTIVITY AND INCOME
The highest yields are derived from cassava,
followed by coconut and banana.
The yields of major crops like paddy and
zallaca palm are quite low. This is due to
the small size of holdings (the average land-
holding per farmer is 4,300 sq. meters) and
the lack of irrigation. Yet, farmers still earn
more from cultivating them compared to
other crops.
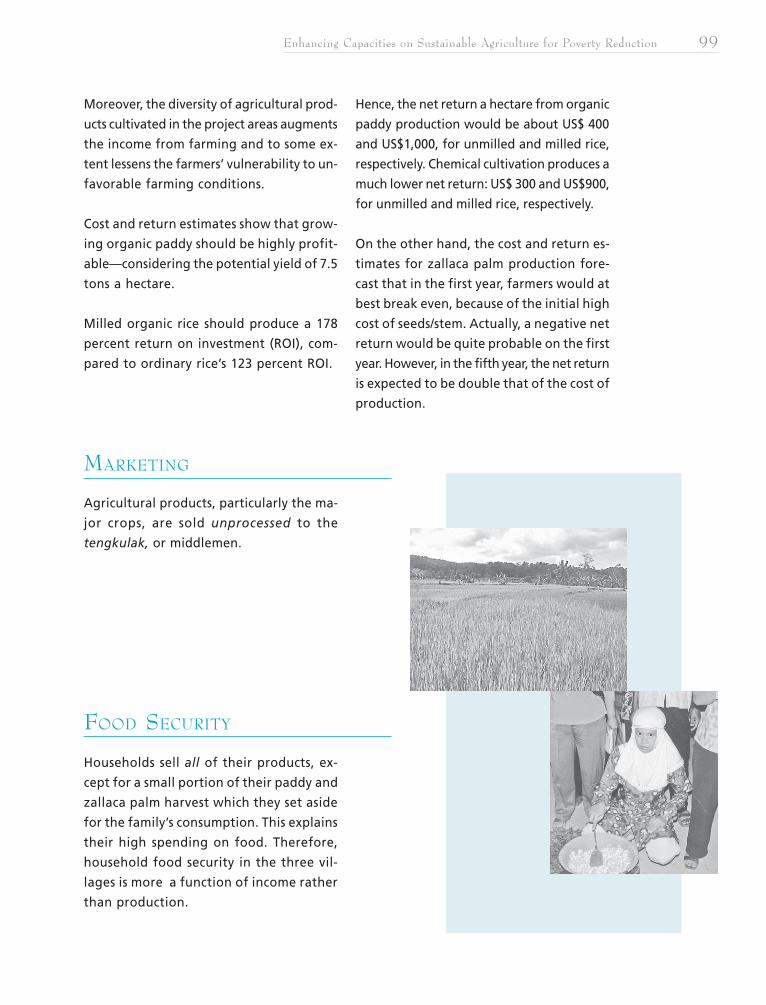
Enhancing Capacities on Sustainable Agriculture for Poverty Reduction 99
Moreover, the diversity of agricultural prod-
ucts cultivated in the project areas augments
the income from farming and to some ex-
tent lessens the farmers’ vulnerability to un-
favorable farming conditions.
Cost and return estimates show that grow-
ing organic paddy should be highly profit-
able—considering the potential yield of 7.5
tons a hectare.
Milled organic rice should produce a 178
percent return on investment (ROI), com-
pared to ordinary rice’s 123 percent ROI.
Hence, the net return a hectare from organic
paddy production would be about US$ 400
and US$1,000, for unmilled and milled rice,
respectively. Chemical cultivation produces a
much lower net return: US$ 300 and US$900,
for unmilled and milled rice, respectively.
On the other hand, the cost and return es-
timates for zallaca palm production fore-
cast that in the first year, farmers would at
best break even, because of the initial high
cost of seeds/stem. Actually, a negative net
return would be quite probable on the first
year. However, in the fifth year, the net return
is expected to be double that of the cost of
production.
MARKETING
Agricultural products, particularly the ma-
jor crops, are sold unprocessed to the
tengkulak, or middlemen.
FOOD SECURITY
Households sell all of their products, ex-
cept for a small portion of their paddy and
zallaca palm harvest which they set aside
for the family’s consumption. This explains
their high spending on food. Therefore,
household food security in the three vil-
lages is more a function of income rather
than production.
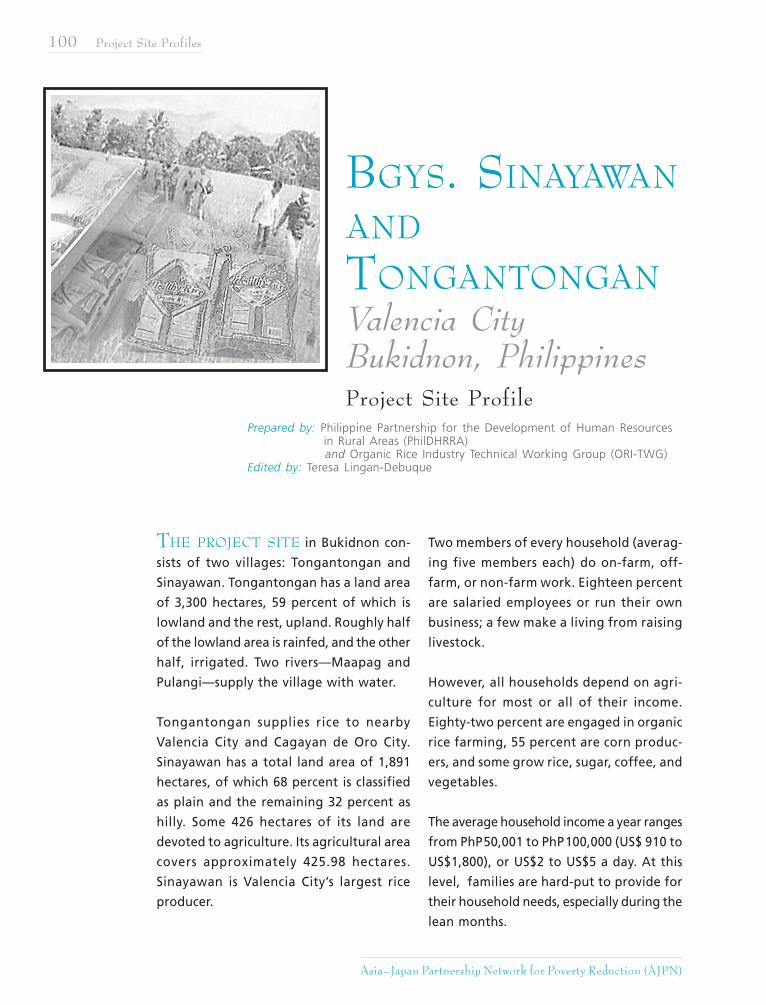
100 Project Site Profiles
Asia–Japan Partnership Network for Poverty Reduction (AJPN)
BGYS. SINAYAWAN
AND
TONGANTONGANValencia CityBukidnon, PhilippinesProject Site Profile
Prepared by: Philippine Partnership for the Development of Human Resources in Rural Areas (PhilDHRRA) and Organic Rice Industry Technical Working Group (ORI-TWG)
Edited by: Teresa Lingan-Debuque
THE PROJECT SITE in Bukidnon con-
sists of two villages: Tongantongan and
Sinayawan. Tongantongan has a land area
of 3,300 hectares, 59 percent of which is
lowland and the rest, upland. Roughly half
of the lowland area is rainfed, and the other
half, irrigated. Two rivers—Maapag and
Pulangi—supply the village with water.
Tongantongan supplies rice to nearby
Valencia City and Cagayan de Oro City.
Sinayawan has a total land area of 1,891
hectares, of which 68 percent is classified
as plain and the remaining 32 percent as
hilly. Some 426 hectares of its land are
devoted to agriculture. Its agricultural area
covers approximately 425.98 hectares.
Sinayawan is Valencia City’s largest rice
producer.
Two members of every household (averag-
ing five members each) do on-farm, off-
farm, or non-farm work. Eighteen percent
are salaried employees or run their own
business; a few make a living from raising
livestock.
However, all households depend on agri-
culture for most or all of their income.
Eighty-two percent are engaged in organic
rice farming, 55 percent are corn produc-
ers, and some grow rice, sugar, coffee, and
vegetables.
The average household income a year ranges
from PhP50,001 to PhP100,000 (US$ 910 to
US$1,800), or US$2 to US$5 a day. At this
level, families are hard-put to provide for
their household needs, especially during the
lean months.
Enhancing Capacities on Sustainable Agriculture for Poverty Reduction 101
AGRICULTURAL PRACTICE
The majority of farmers (65 percent) own
the land they cultivate. This means that they
are able to make decisions concerning their
farmlands. Most of the lands were purchased,
inherited, or awarded through agrarian
reform.
Agricultural landholdings are quite small,
averaging 1.31 hectares a farmer. In fact,
almost 25 percent of farmers have less than
a hectare each, while a few have five hect-
ares or more. The majority have one to two
hectares.
Most farm lands are irrigated and found in
the lowlands. Only a few are rainfed.
Rice is cultivated exclusively on 42 percent
of the farm lands. Rice, as well as livestock,
is grown on another 42 percent of lands,
while the rest combine major and second-
ary crops, and livestock.
The other major crops are vegetables, ba-
nana, corn, and mango. Fruit trees are sec-
ondary crops.
ADOPTION OF ALTERNATIVE AGRICULTURAL PRACTICE
The farmers have a rather wide knowledge
of sustainable agricultural practices. How-
ever, conventional farming is still prevalent.
SOIL MANAGEMENT
A large number of farmers have adopted
practices such as mulching and planting of
hedgerows. Cover cropping, composting,
and use of green manure are other com-
mon practices to enhance the fertility of
the soil. However, nearly half of the farm-
ers are still dependent on synthetic fertil-
izers and lime.
PLANT PEST MANAGEMENT
Only a few farmers here use chemical pes-
ticides. Ecological pest management (EPM),
which uses the interactions among pests,
predators, and microorganisms on the farm
to control pest infestation, is the most
popular system for managing plant pests,
followed by the use of biological pest re-
pellants and Integrated Pest Management.
CROPPING PATTERN
The majority of farmers still practice crop
monoculture. Very few have adopted
polyculture, and other forms of crop diver-
sification on their farm lands.
SEED AND PLANT
MATERIAL
Most farmers (65 percent) use or prefer tra-
ditional crop varieties, especially the im-
proved (by plant breeding) ones. A few use
hybrid varieties.
AVAILABILITY OF ORGANIC
MATERIAL
Organic matter for soil management is plen-
tiful and easily available in the project site.
102 Project Site Profiles
Asia–Japan Partnership Network for Poverty Reduction (AJPN)
PLANS TO ADOPT OR
UPSCALE ORGANIC FARMING
Farmers who are the most informed or
knowledgeable about Sustainable Agricul-
ture are the most inclined to adopt new
techniques. Many of them in fact are mak-
ing plans to adopt organic farming, while
others would like to convert more of their
lands to organic farming.
COST OF AGRICULTURAL INPUTS
The high rate of adoption of Sustainable
Agriculture, particularly LEISA (Low Exter-
nal Input Agriculture) in the project site is
reflected in their relatively low spending
on inputs—PhP 3,925 or 28.3 percent of the
total production cost—and their high labor
costs—65 percent of total production cost.
Spending on seeds is low, as farmers pro-
duce their own or trade seeds with other
farmers. Land rent is paid only by the few
who do not own their lands. Water is mostly
supplied by the two big rivers in the area.
Other expenses amount to some PhP 600 a
hectare. These include food for workers, fuel
and oil among those who have their own
irrigation pump and other equipment, and
rent on equipment for those who do not
have their own.
FARM PRODUCTIVITY AND FARM INCOME
The average rice yield is 4.12 tons or 82 cavans
a hectare. This is a better than average per-
formance, and proves that organic rice
farming can be just as viable as conventional
rice farming.
In fact, rice production in the project site
shows a 208 percent return on the cost of
production, and gives farmers a net income
of PhP7,261.60 a month.
ACCESS TO CREDIT
The most popular source of credit in the
project site are private individuals, who also
happen to charge the highest interest rates
(5-9 percent a month on loans ranging from
PhP9,000 to PhP23,000) but are frequented
nonetheless because they supply credit
quickly.
Cooperatives and NGOs also give out loans
ranging from PhP 5,000 to PhP 24,000, and
charge a lower interest rate (2.5 percent,
and 3-4 percent a month, respectively). Local
traders and investors are another common
credit source, charging six percent interest
on loans not bigger than PhP 37,500. Banks
and government lending institutions are the
least popular source of credit.
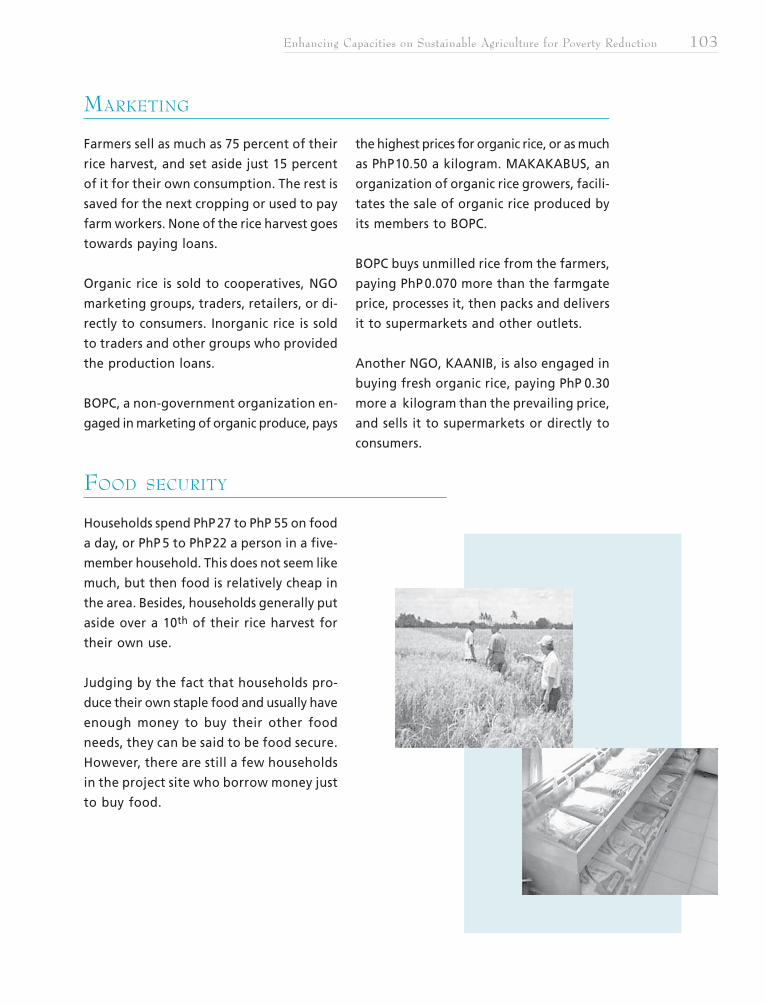
Enhancing Capacities on Sustainable Agriculture for Poverty Reduction 103
MARKETING
Farmers sell as much as 75 percent of their
rice harvest, and set aside just 15 percent
of it for their own consumption. The rest is
saved for the next cropping or used to pay
farm workers. None of the rice harvest goes
towards paying loans.
Organic rice is sold to cooperatives, NGO
marketing groups, traders, retailers, or di-
rectly to consumers. Inorganic rice is sold
to traders and other groups who provided
the production loans.
BOPC, a non-government organization en-
gaged in marketing of organic produce, pays
the highest prices for organic rice, or as much
as PhP10.50 a kilogram. MAKAKABUS, an
organization of organic rice growers, facili-
tates the sale of organic rice produced by
its members to BOPC.
BOPC buys unmilled rice from the farmers,
paying PhP 0.070 more than the farmgate
price, processes it, then packs and delivers
it to supermarkets and other outlets.
Another NGO, KAANIB, is also engaged in
buying fresh organic rice, paying PhP 0.30
more a kilogram than the prevailing price,
and sells it to supermarkets or directly to
consumers.
FOOD SECURITY
Households spend PhP 27 to PhP 55 on food
a day, or PhP 5 to PhP22 a person in a five-
member household. This does not seem like
much, but then food is relatively cheap in
the area. Besides, households generally put
aside over a 10th of their rice harvest for
their own use.
Judging by the fact that households pro-
duce their own staple food and usually have
enough money to buy their other food
needs, they can be said to be food secure.
However, there are still a few households
in the project site who borrow money just
to buy food.
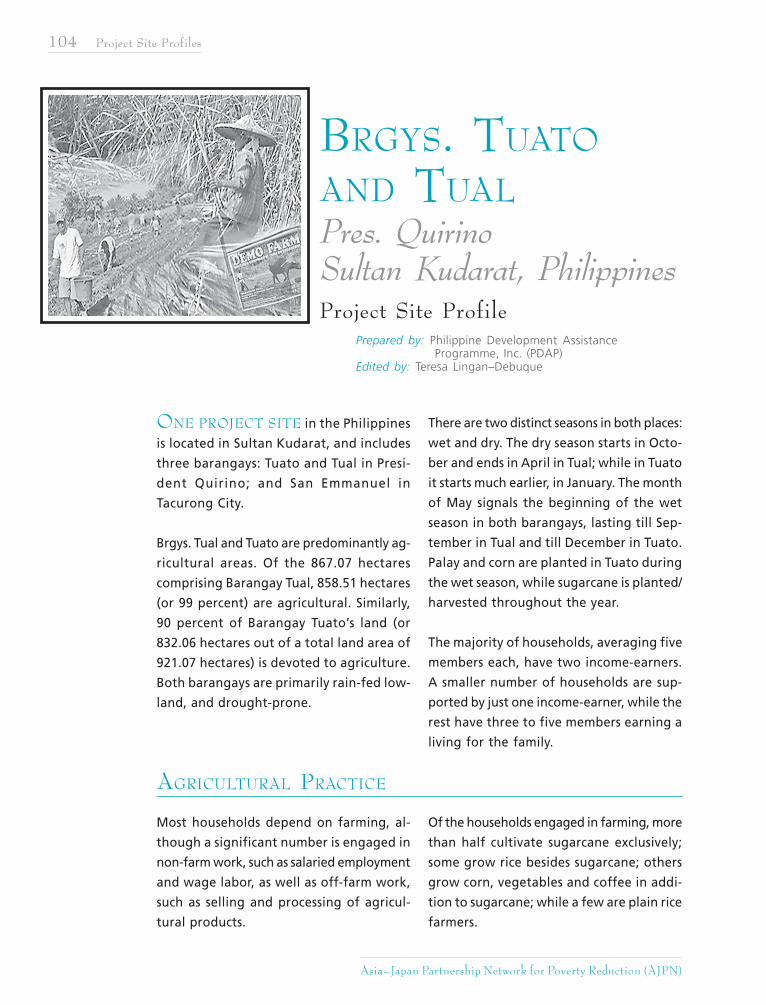
104 Project Site Profiles
Asia–Japan Partnership Network for Poverty Reduction (AJPN)
BRGYS. TUATO
AND TUALPres. QuirinoSultan Kudarat, PhilippinesProject Site Profile
Prepared by: Philippine Development Assistance Programme, Inc. (PDAP)Edited by: Teresa Lingan–Debuque
ONE PROJECT SITE in the Philippines
is located in Sultan Kudarat, and includes
three barangays: Tuato and Tual in Presi-
dent Quirino; and San Emmanuel in
Tacurong City.
Brgys. Tual and Tuato are predominantly ag-
ricultural areas. Of the 867.07 hectares
comprising Barangay Tual, 858.51 hectares
(or 99 percent) are agricultural. Similarly,
90 percent of Barangay Tuato’s land (or
832.06 hectares out of a total land area of
921.07 hectares) is devoted to agriculture.
Both barangays are primarily rain-fed low-
land, and drought-prone.
There are two distinct seasons in both places:
wet and dry. The dry season starts in Octo-
ber and ends in April in Tual; while in Tuato
it starts much earlier, in January. The month
of May signals the beginning of the wet
season in both barangays, lasting till Sep-
tember in Tual and till December in Tuato.
Palay and corn are planted in Tuato during
the wet season, while sugarcane is planted/
harvested throughout the year.
The majority of households, averaging five
members each, have two income-earners.
A smaller number of households are sup-
ported by just one income-earner, while the
rest have three to five members earning a
living for the family.
AGRICULTURAL PRACTICE
Most households depend on farming, al-
though a significant number is engaged in
non-farm work, such as salaried employment
and wage labor, as well as off-farm work,
such as selling and processing of agricul-
tural products.
Of the households engaged in farming, more
than half cultivate sugarcane exclusively;
some grow rice besides sugarcane; others
grow corn, vegetables and coffee in addi-
tion to sugarcane; while a few are plain rice
farmers.
Enhancing Capacities on Sustainable Agriculture for Poverty Reduction 105
In Barangay Tual, sugarcane, rice, and corn
are the main crops. The area planted to sug-
arcane is the largest agricultural area devoted
to a single crop, but it has been declining in
recent years: from 368.25 hectares in 2001
to 254.25 hectares in 2003. However, its pro-
duction yield (recovery) has held steady at
5.0 tons a hectare. Rice lands occupied some
300 hectares from 2001 to 2003, with yield
rising in 2002 then declining in 2003. Mean-
while, corn productivity increased from 2.5
tons a hectare in 2001 to 3.2 tons a hectare
in 2002, and held at that level in 2003.
Livestock are also raised in Tual. In 2001,
these included buffaloes, cattle, pigs, sheep,
goats, ducks and poultry. Except for a creek,
there are no water bodies large enough to
support fisheries-based livelihood. The
barangay has 35 variety/convenience stores,
and this number has remained constant from
2001 to 2003. It also has two agricultural
input suppliers and 10 traders of muscovado
or raw sugar.
Barangay Tuato’s households are mostly en-
gaged in farming. While some of its resi-
dents are engaged in non-farm work, their
number has remained constant from 2001
to 2003. They would be found doing con-
struction-related work, vending, driving tri-
cycles, and doing other service-related work.
Livestock are raised, of which the most
common are ducks and chicken, for the
household’s consumption and as an added
source of income. Fisheries are non-existent.
Commerce has not grown much in recent
years. The number of variety/convenience
stores, traders, and muscovado dealers and
millers has stayed the same in three years
(2001-2003).
Less than half of farmers have security of
tenure as owner-cultivators. An almost equal
number are share tenants, and the rest are
leaseholders.
Close to half of landholders have one to
two hectares of land; about a fourth of them
have as much as five hectares and more;
while a few have less than a hectare of land.
The average size of landholdings is 3.575
hectares.
Most of the farmer-owners also own two
parcels of land; about a fourth of them have
one parcel each; while some have as many
as eight parcels.
Land was acquired on the basis of a “ver-
bal agreement”, or was bought or inher-
ited. Only a small percentage of the land
was acquired through agrarian reform, or
was held by virtue of “cultivation rights”.
ADOPTION OF ALTERNATIVE FARMING PRACTICE
Most of the farmers are engaged in con-
ventional farming. However, a number of
them have been observed to practice Sus-
tainable Agriculture, primarily in their
choice of seeds, and to a lesser extent, in
the way they maintain/conserve the soil,
manage pests, etc.
SOIL MANAGEMENT
The use of compost as fertilizer is the most
common form of alternative soil man-
agement practice in the project site. Many
farmers have also been seen to use mulch-
106 Project Site Profiles
Asia–Japan Partnership Network for Poverty Reduction (AJPN)
ing material, animal and green manure,
cover cropping and hedgerows.
Nonetheless, the greater majority of farm-
ers still prefer to use chemical fertiliz-
ers, especially in rice farming.
PLANT PEST MANAGEMENT
A small number of farmers practice a vari-
ety of sustainable plant pest management
techniques, such as Integrated Pest Man-
agement (IPM), Ecological Pest Management
(EPM) and the use of pest repellants and
bio-sprays. However, close to half of farm-
ers use chemical pesticides, while others use
nematocides.
CROPPING PATTERN
The majority of farmers practice monocul-
ture, especially since they are mostly sug-
arcane farmers. On the other hand, most
of the rice farmers have adopted such prac-
tices as crop rotation, intercropping and
polyculture.
SEED AND PLANTING
MATERIAL
More farmers opt for traditional and mix
varieties over the improved lines.
UTILIZATION OF ORGANIC
MATERIALS
Almost all of the farmers utilizing local
materials for feeds get those materials from
their own farms.
WILLINGNESS TO TRY NEW
FARMING TECHNOLOGIES
Almost half of the farmers are not consid-
ering changing their crop/s or the practices
they have grown used to. However, some
have said that they are willing to try new
farming technologies, such as intercropping,
“mudpress” and other Sustainable Agricul-
ture practices. A few are inclined to changing
crops. This indicates that it might not be
too difficult to introduce Sustainable Agri-
culture technologies.
COST OF AGRICULTURAL INPUTS
Labor accounts for the biggest expense
in both sugarcane and rice cultivation.
Spending on seed cane is minimal, ranging
from PhP 70-200 only, since much of the
planting material is taken from the previ-
ous stands of sugarcane. For rice farming,
the cost of seed makes up the smallest per-
centage of the total production cost a
hectare. On the average, farmers spend
about PhP 1,000 on seeds. However, users
of hybrid seed varieties spend more—al-
most PhP 2,000 a hectare.
Rice farmers spend PhP 2,000 a hectare on
chemical fertilizers. This comes out to about
15 percent of their total production cost.
On the other hand, a mere 2 percent of total
spending by sugarcane farmers goes on
chemical fertilizers.
Rice farmers spend PhP 1,700 a hectare on
chemical pesticides and other inputs, and
Enhancing Capacities on Sustainable Agriculture for Poverty Reduction 107
this accounts for 10 percent of their to-
tal production cost. On the other hand,
none of the sugarcane farmers report buy-
ing or using chemical pesticides on their
crops.
At least among the farmers with no hold-
ings of their own, land rent accounts for
the one of the major costs in sugarcane
production, next only to labor. It averages
at PhP 16,454.30 a hectare.
In rice production, land rents amount
to over PhP 5,000 a hectare. Hence, for
those that have to pay it, they account
for about 30 percent of the production
cost, and, consequently, a much lower
income from farming.
Processing is a major cost in sugarcane pro-
duction, since income is derived from sell-
ing its by-products rather than fresh canes.
Sugarcane farmers earn more than rice
farmers. The net income from sugarcane
is about PhP 76,000, or US$1,400, a hect-
are. This is a return of 171 percent on cost.
Given that sugarcane is harvested in batches,
this income is spread throughout the year
and comes out to an average of PhP 6,300
a month.
Sugarcane farmers also earn from sugar-
cane by-products. Muscovado is the high-
est income-earner among the by-products.
While sugarcane farming is profitable, many
sugarcane farmers also grow rice, which earns
for them an average yearly net income of
PhP11,000, or US$ 200, a hectare. This trans-
lates to a monthly net income of PhP 2,750,
or US$50.
FARM PRODUCTIVITY AND FARM INCOME
ACCESS TO CREDIT
The most common sources of credit among
the residents are informal ones, such as
private individuals, variety stores, and
landlords. Banks are rarely approached
for loans because of their collateral re-
quirements and longer processing times.
Banks usually charge 14.8 percent inter-
est a year. Private individuals have been
reported to charge as much as 22 percent
interest, but others give out loans with no
interest at all.
Landlords traditionally lend without in-
terest, since part of their arrangement
with their tenants is to provide the capital
for farm inputs. Variety stores charge the
lowest interest rates on loans, at 1.8 per-
cent a year.
Tual has access to three nearby rural banks:
the Rural Bank of Isulan, offering credit at
2 percent a month; the Rural Bank of
Tacurong, charging the same interest rate;
and the Rural Bank of Lebak, which charges
a lower interest rate (21 percent a year) and
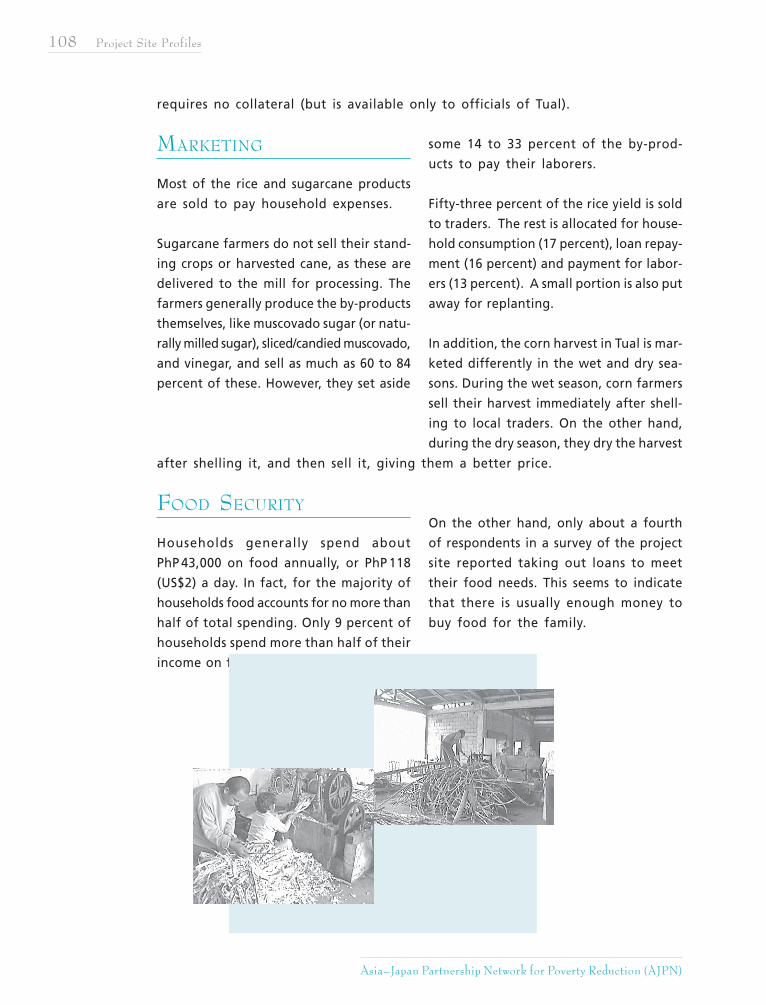
108 Project Site Profiles
Asia–Japan Partnership Network for Poverty Reduction (AJPN)
requires no collateral (but is available only to officials of Tual).
MARKETING
Most of the rice and sugarcane products
are sold to pay household expenses.
Sugarcane farmers do not sell their stand-
ing crops or harvested cane, as these are
delivered to the mill for processing. The
farmers generally produce the by-products
themselves, like muscovado sugar (or natu-
rally milled sugar), sliced/candied muscovado,
and vinegar, and sell as much as 60 to 84
percent of these. However, they set aside
some 14 to 33 percent of the by-prod-
ucts to pay their laborers.
Fifty-three percent of the rice yield is sold
to traders. The rest is allocated for house-
hold consumption (17 percent), loan repay-
ment (16 percent) and payment for labor-
ers (13 percent). A small portion is also put
away for replanting.
In addition, the corn harvest in Tual is mar-
keted differently in the wet and dry sea-
sons. During the wet season, corn farmers
sell their harvest immediately after shell-
ing to local traders. On the other hand,
during the dry season, they dry the harvest
after shelling it, and then sell it, giving them a better price.
FOOD SECURITY
Households generally spend about
PhP 43,000 on food annually, or PhP 118
(US$2) a day. In fact, for the majority of
households food accounts for no more than
half of total spending. Only 9 percent of
households spend more than half of their
income on food.
On the other hand, only about a fourth
of respondents in a survey of the project
site reported taking out loans to meet
their food needs. This seems to indicate
that there is usually enough money to
buy food for the family.

Enhancing Capacities on Sustainable Agriculture for Poverty Reduction 109
chapter
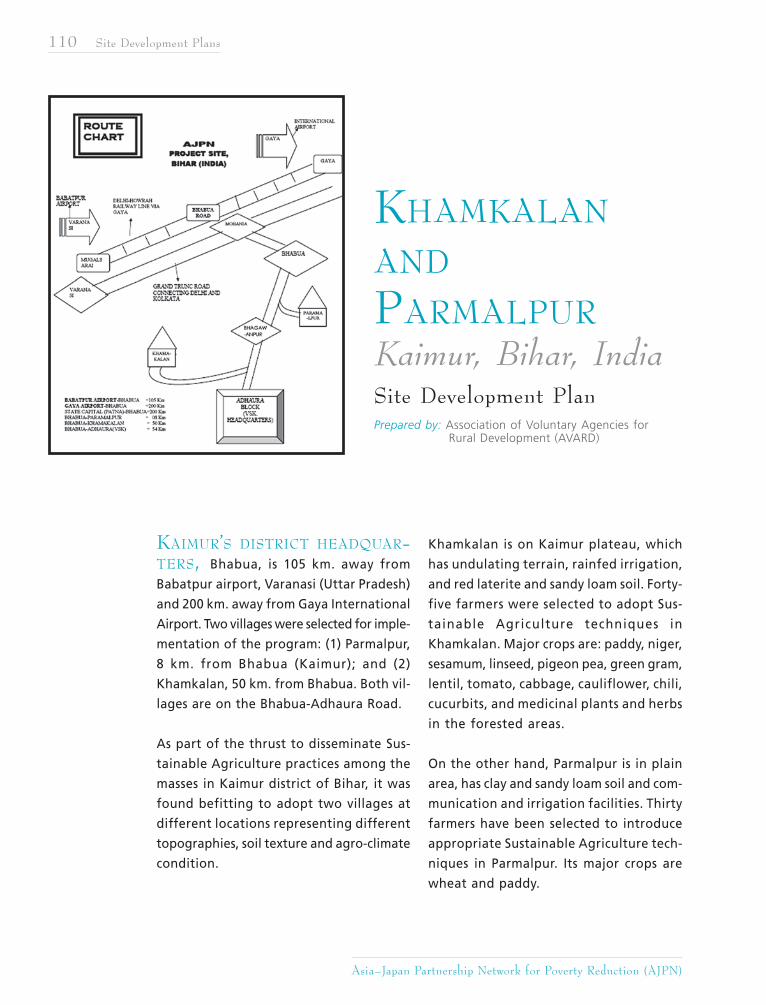
110 Site Development Plans
Asia–Japan Partnership Network for Poverty Reduction (AJPN)
KAIMUR’S DISTRICT HEADQUAR-TERS, Bhabua, is 105 km. away from
Babatpur airport, Varanasi (Uttar Pradesh)
and 200 km. away from Gaya International
Airport. Two villages were selected for imple-
mentation of the program: (1) Parmalpur,
8 km. from Bhabua (Kaimur); and (2)
Khamkalan, 50 km. from Bhabua. Both vil-
lages are on the Bhabua-Adhaura Road.
As part of the thrust to disseminate Sus-
tainable Agriculture practices among the
masses in Kaimur district of Bihar, it was
found befitting to adopt two villages at
different locations representing different
topographies, soil texture and agro-climate
condition.
Khamkalan is on Kaimur plateau, which
has undulating terrain, rainfed irrigation,
and red laterite and sandy loam soil. Forty-
five farmers were selected to adopt Sus-
tainable Agriculture techniques in
Khamkalan. Major crops are: paddy, niger,
sesamum, linseed, pigeon pea, green gram,
lentil, tomato, cabbage, cauliflower, chili,
cucurbits, and medicinal plants and herbs
in the forested areas.
On the other hand, Parmalpur is in plain
area, has clay and sandy loam soil and com-
munication and irrigation facilities. Thirty
farmers have been selected to introduce
appropriate Sustainable Agriculture tech-
niques in Parmalpur. Its major crops are
wheat and paddy.
KHAMKALAN
AND
PARMALPURKaimur, Bihar, IndiaSite Development PlanPrepared by: Association of Voluntary Agencies for
Rural Development (AVARD)
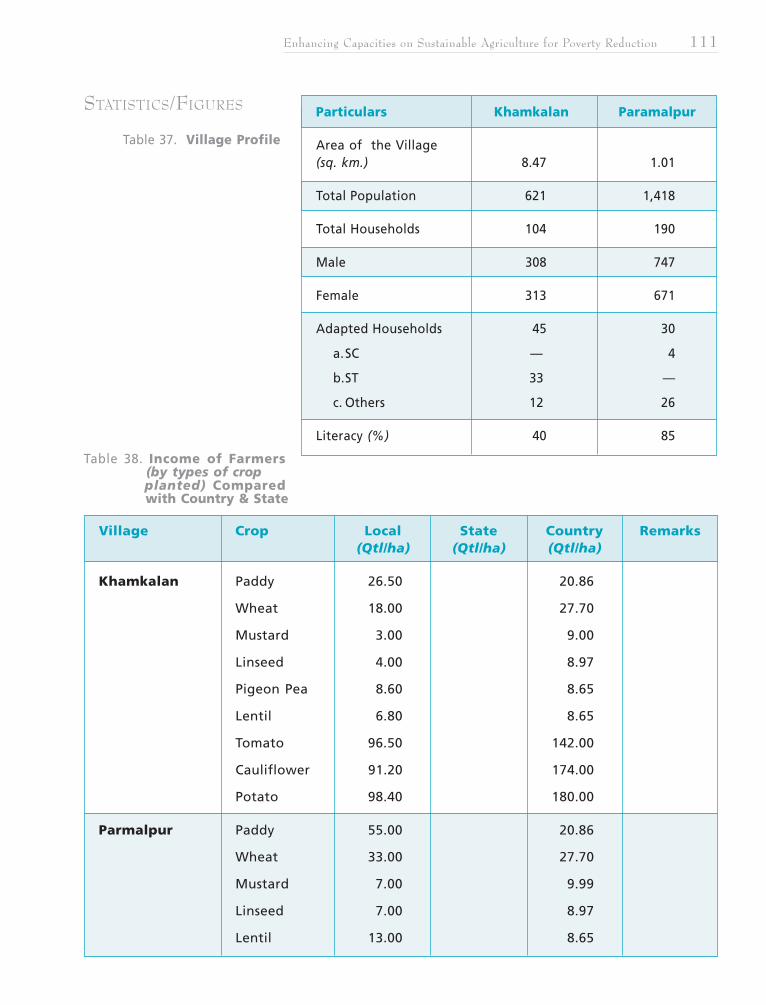
Enhancing Capacities on Sustainable Agriculture for Poverty Reduction 111
STATISTICS/FIGURES
Table 37. Village Profile
Table 38. Income of Farmers (by types of crop planted) Compared with Country & State
Village Crop Local State Country Remarks(Qtl/ha) (Qtl/ha) (Qtl/ha)
Khamkalan Paddy 26.50 20.86
Wheat 18.00 27.70
Mustard 3.00 9.00
Linseed 4.00 8.97
Pigeon Pea 8.60 8.65
Lentil 6.80 8.65
Tomato 96.50 142.00
Cauliflower 91.20 174.00
Potato 98.40 180.00
Parmalpur Paddy 55.00 20.86
Wheat 33.00 27.70
Mustard 7.00 9.99
Linseed 7.00 8.97
Lentil 13.00 8.65
Particulars Khamkalan Paramalpur
Area of the Village(sq. km.) 8.47 1.01
Total Population 621 1,418
Total Households 104 190
Male 308 747
Female 313 671
Adapted Households 45 30
a.SC — 4
b.ST 33 —
c. Others 12 26
Literacy (%) 40 85
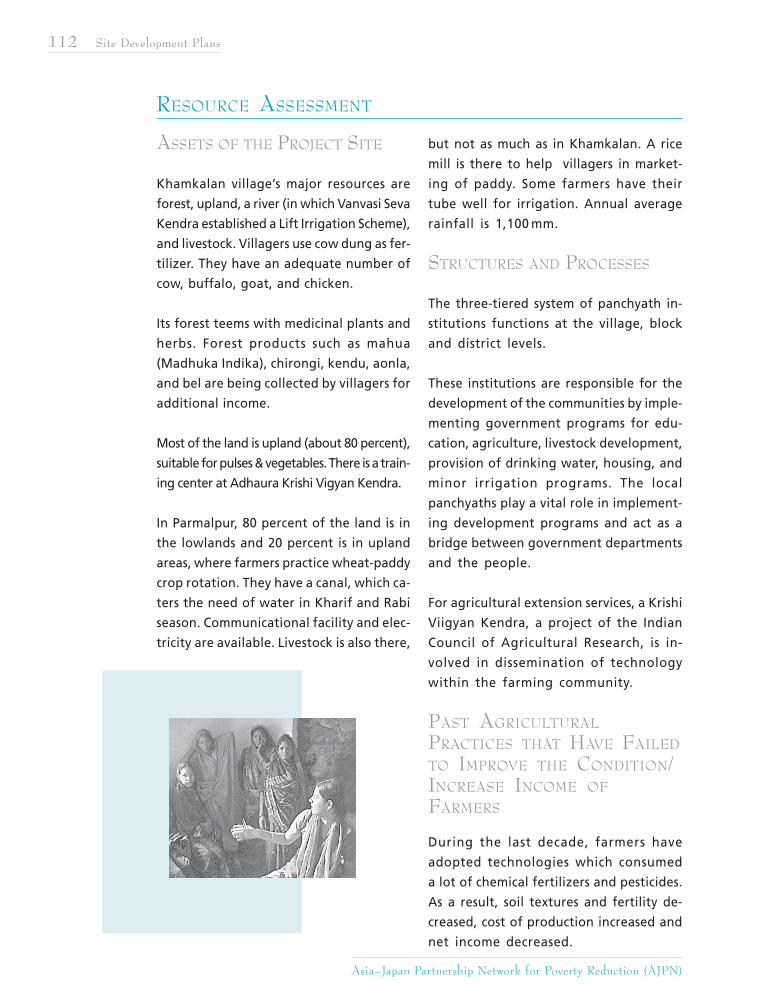
112 Site Development Plans
Asia–Japan Partnership Network for Poverty Reduction (AJPN)
ASSETS OF THE PROJECT SITE
Khamkalan village’s major resources are
forest, upland, a river (in which Vanvasi Seva
Kendra established a Lift Irrigation Scheme),
and livestock. Villagers use cow dung as fer-
tilizer. They have an adequate number of
cow, buffalo, goat, and chicken.
Its forest teems with medicinal plants and
herbs. Forest products such as mahua
(Madhuka Indika), chirongi, kendu, aonla,
and bel are being collected by villagers for
additional income.
Most of the land is upland (about 80 percent),
suitable for pulses & vegetables. There is a train-
ing center at Adhaura Krishi Vigyan Kendra.
In Parmalpur, 80 percent of the land is in
the lowlands and 20 percent is in upland
areas, where farmers practice wheat-paddy
crop rotation. They have a canal, which ca-
ters the need of water in Kharif and Rabi
season. Communicational facility and elec-
tricity are available. Livestock is also there,
but not as much as in Khamkalan. A rice
mill is there to help villagers in market-
ing of paddy. Some farmers have their
tube well for irrigation. Annual average
rainfall is 1,100 mm.
STRUCTURES AND PROCESSES
The three-tiered system of panchyath in-
stitutions functions at the village, block
and district levels.
These institutions are responsible for the
development of the communities by imple-
menting government programs for edu-
cation, agriculture, livestock development,
provision of drinking water, housing, and
minor irrigation programs. The local
panchyaths play a vital role in implement-
ing development programs and act as a
bridge between government departments
and the people.
For agricultural extension services, a Krishi
Viigyan Kendra, a project of the Indian
Council of Agricultural Research, is in-
volved in dissemination of technology
within the farming community.
PAST AGRICULTURAL
PRACTICES THAT HAVE FAILED
TO IMPROVE THE CONDITION/INCREASE INCOME OF
FARMERS
During the last decade, farmers have
adopted technologies which consumed
a lot of chemical fertilizers and pesticides.
As a result, soil textures and fertility de-
creased, cost of production increased and
net income decreased.
RESOURCE ASSESSMENT
Enhancing Capacities on Sustainable Agriculture for Poverty Reduction 113
GOAL
The project aimed to promote Sustainable
Agriculture as a means of improving the qual-
ity of life of the people of the two villages.
OBJECTIVES
1. Increase awareness on the importance
of the organic farming;
2. Upgrading farmers’ knowledge on
organic farming;
3. Mobilize local resources;
4. Increase productivity and cropping
intensity;
5. Decrease soil toxicity using SA tech-
nologies;
6. Maintain the area’s ecological balance;
7. Promote group activities for minimizing
risks;
8. Promote “value addition” and market
facilities; and
9. Increase net profit from agricultural
activities.
STRATEGIES
The project started via a series of training
programs in both villages. Farmers were first
made aware of, then got interested in,
Sustainable Agriculture. They were then
introduced to the different substitutes to
chemical fertilizers and pesticides.
Then, selected farmers were trained on
different sources of organic fertilizers and
integrated pest management. Training on
composting and green manuring, among
other types of organic fertilizers and pes-
ticides, was provided selected farmers.
The second stage of the project involved
training selected farmers on sustainable
farming practices for paddy, wheat, pulses,
oilseeds, vegetables, and medicinal plants.
It included post harvest management, like
safe storage and value addition.
The third stage was the conduct of demon-
strations on improved varieties of selected
crops using organic fertilizers to show that
there is no effect on yield. This greatly helped
in the dissemination and adoption of SA
technology. Farmers’ visits to agricultural
schools that have been proponents of Sus-
tainable Agriculture technology were also
undertaken.
The fourth stage was the introduction of
“value addition” in organic produce and es-
tablishment of markets for selling of pro-
duce at a handsome price.
Self Help Groups (SHGs) were formed and
were themselves involved in processing, col-
lection and marketing of medicinal plants,
forest products and other agricultural pro-
duce. These SHGs were critical to the success-
ful implementation and impact of the project.
Workshops were held at the district level,
with the help of selected SA farmers, to
disseminate SA technologies among the
farmers of the district and adjoining ar-
eas.
OUTPUTS
1. Assured substitutes for chemical fer-
tilizers and pesticides;
THE PROJECT SITE DEVELOPMENT PLAN
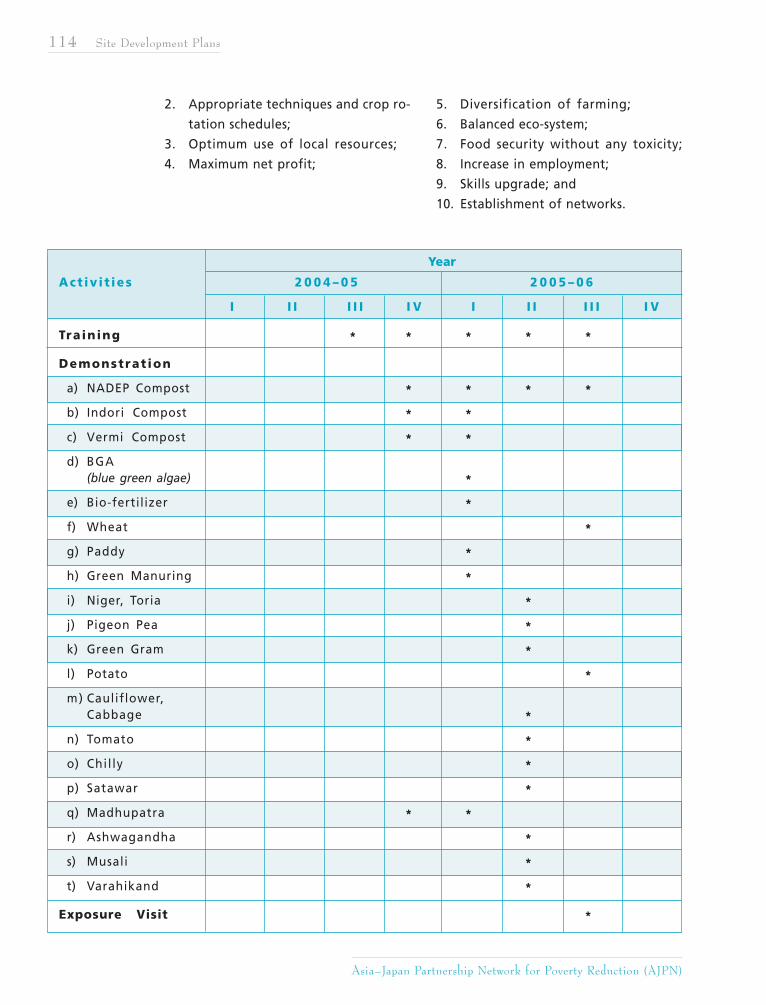
114 Site Development Plans
Asia–Japan Partnership Network for Poverty Reduction (AJPN)
2. Appropriate techniques and crop ro-
tation schedules;
3. Optimum use of local resources;
4. Maximum net profit;
5. Diversification of farming;
6. Balanced eco-system;
7. Food security without any toxicity;
8. Increase in employment;
9. Skills upgrade; and
10. Establishment of networks.
Year
Act iv i t ies 2 0 0 4 – 0 5 2 0 0 5 – 0 6
I I I I I I I V I I I I I I I V
Training * * * * *
Demonstrat ion
a) NADEP Compost * * * *
b) Indori Compost * *
c) Vermi Compost * *
d) BGA(blue green algae) *
e) Bio-fertilizer *
f) Wheat *
g) Paddy *
h) Green Manuring *
i) Niger, Toria *
j) Pigeon Pea *
k) Green Gram *
l) Potato *
m) Cauliflower,Cabbage *
n) Tomato *
o) Chilly *
p) Satawar *
q) Madhupatra * *
r) Ashwagandha *
s) Musali *
t) Varahikand *
Exposure Visit *
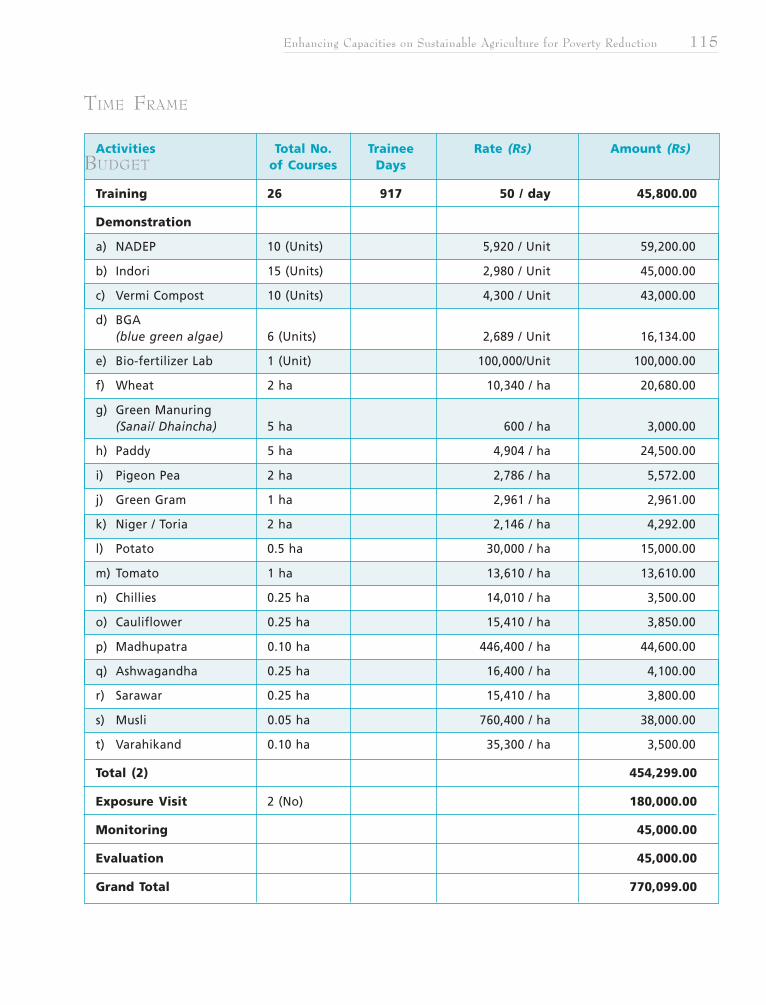
Enhancing Capacities on Sustainable Agriculture for Poverty Reduction 115
Activities Total No. Trainee Rate (Rs) Amount (Rs)of Courses Days
Training 26 917 50 / day 45,800.00
Demonstration
a) NADEP 10 (Units) 5,920 / Unit 59,200.00
b) Indori 15 (Units) 2,980 / Unit 45,000.00
c) Vermi Compost 10 (Units) 4,300 / Unit 43,000.00
d) BGA(blue green algae) 6 (Units) 2,689 / Unit 16,134.00
e) Bio-fertilizer Lab 1 (Unit) 100,000/Unit 100,000.00
f) Wheat 2 ha 10,340 / ha 20,680.00
g) Green Manuring(Sanai/ Dhaincha) 5 ha 600 / ha 3,000.00
h) Paddy 5 ha 4,904 / ha 24,500.00
i) Pigeon Pea 2 ha 2,786 / ha 5,572.00
j) Green Gram 1 ha 2,961 / ha 2,961.00
k) Niger / Toria 2 ha 2,146 / ha 4,292.00
l) Potato 0.5 ha 30,000 / ha 15,000.00
m) Tomato 1 ha 13,610 / ha 13,610.00
n) Chillies 0.25 ha 14,010 / ha 3,500.00
o) Cauliflower 0.25 ha 15,410 / ha 3,850.00
p) Madhupatra 0.10 ha 446,400 / ha 44,600.00
q) Ashwagandha 0.25 ha 16,400 / ha 4,100.00
r) Sarawar 0.25 ha 15,410 / ha 3,800.00
s) Musli 0.05 ha 760,400 / ha 38,000.00
t) Varahikand 0.10 ha 35,300 / ha 3,500.00
Total (2) 454,299.00
Exposure Visit 2 (No) 180,000.00
Monitoring 45,000.00
Evaluation 45,000.00
Grand Total 770,099.00
TIME FRAME
BUDGET
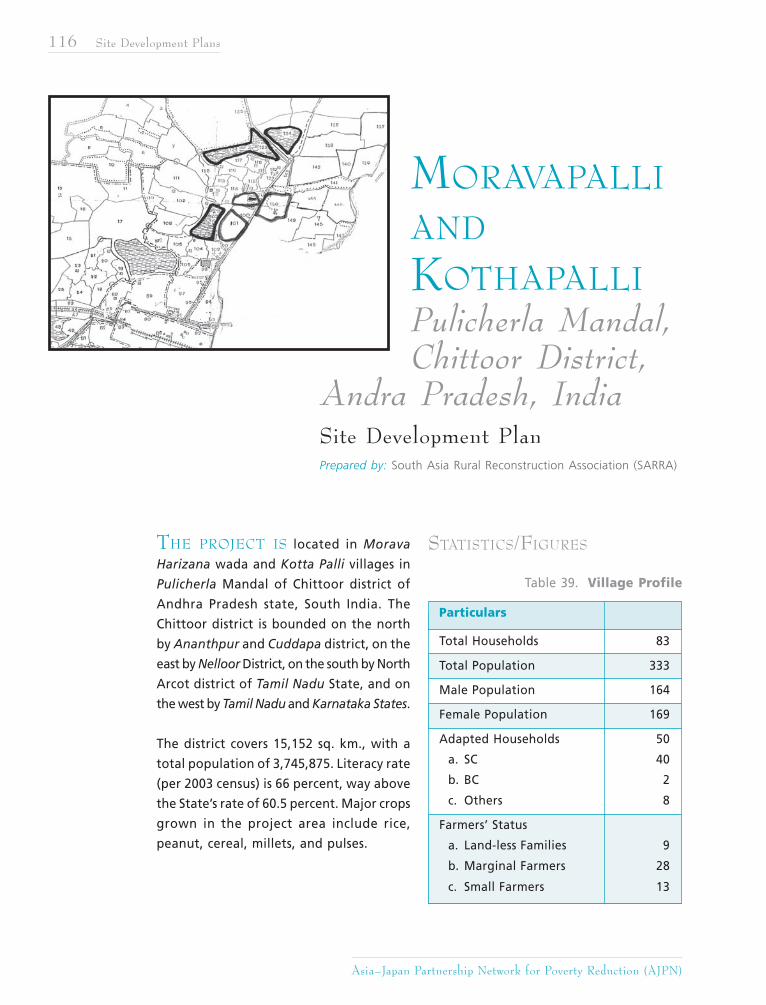
116 Site Development Plans
Asia–Japan Partnership Network for Poverty Reduction (AJPN)
THE PROJECT IS located in Morava
Harizana wada and Kotta Palli villages in
Pulicherla Mandal of Chittoor district of
Andhra Pradesh state, South India. The
Chittoor district is bounded on the north
by Ananthpur and Cuddapa district, on the
east by Nelloor District, on the south by North
Arcot district of Tamil Nadu State, and on
the west by Tamil Nadu and Karnataka States.
The district covers 15,152 sq. km., with a
total population of 3,745,875. Literacy rate
(per 2003 census) is 66 percent, way above
the State’s rate of 60.5 percent. Major crops
grown in the project area include rice,
peanut, cereal, millets, and pulses.
STATISTICS/FIGURES
Table 39. Village Profile
Particulars
Total Households 83
Total Population 333
Male Population 164
Female Population 169
Adapted Households 50
a. SC 40
b. BC 2
c. Others 8
Farmers’ Status
a. Land-less Families 9
b. Marginal Farmers 28
c. Small Farmers 13
MORAVAPALLI
AND
KOTHAPALLIPulicherla Mandal,Chittoor District,
Prepared by: South Asia Rural Reconstruction Association (SARRA)
Andra Pradesh, IndiaSite Development Plan
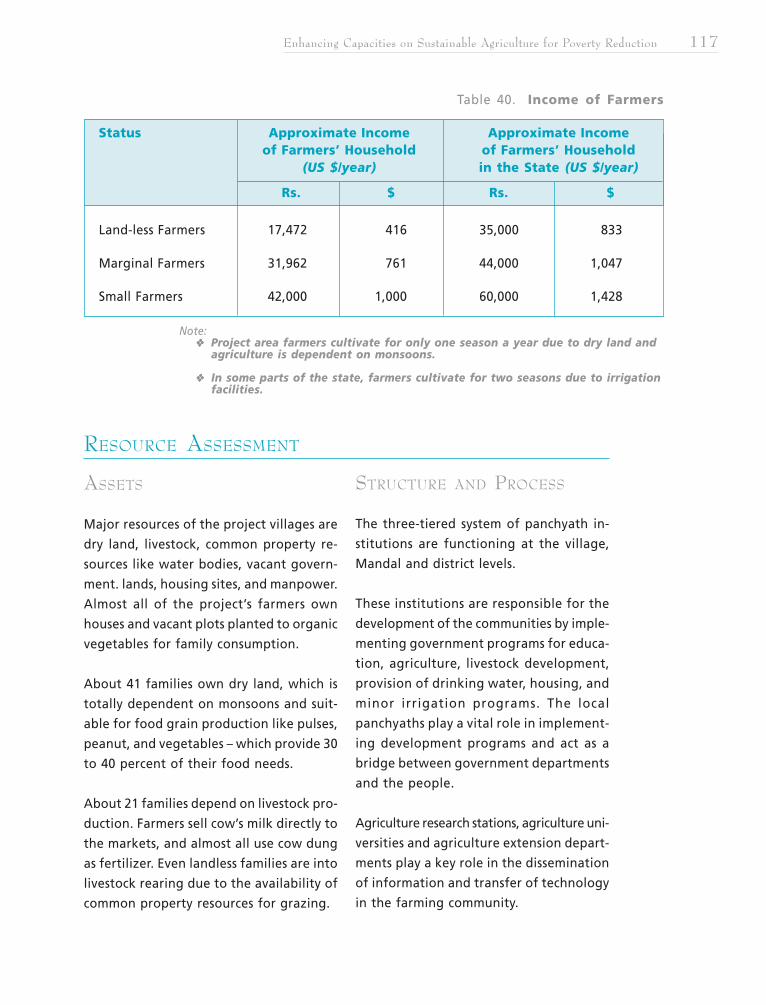
Enhancing Capacities on Sustainable Agriculture for Poverty Reduction 117
RESOURCE ASSESSMENT
Note:Project area farmers cultivate for only one season a year due to dry land andagriculture is dependent on monsoons.
In some parts of the state, farmers cultivate for two seasons due to irrigationfacilities.
Status Approximate Income Approximate Incomeof Farmers’ Household of Farmers’ Household
(US $/year) in the State (US $/year)
Rs. $ Rs. $
Land-less Farmers 17,472 416 35,000 833
Marginal Farmers 31,962 761 44,000 1,047
Small Farmers 42,000 1,000 60,000 1,428
Table 40. Income of Farmers
ASSETS
Major resources of the project villages are
dry land, livestock, common property re-
sources like water bodies, vacant govern-
ment. lands, housing sites, and manpower.
Almost all of the project’s farmers own
houses and vacant plots planted to organic
vegetables for family consumption.
About 41 families own dry land, which is
totally dependent on monsoons and suit-
able for food grain production like pulses,
peanut, and vegetables – which provide 30
to 40 percent of their food needs.
About 21 families depend on livestock pro-
duction. Farmers sell cow’s milk directly to
the markets, and almost all use cow dung
as fertilizer. Even landless families are into
livestock rearing due to the availability of
common property resources for grazing.
STRUCTURE AND PROCESS
The three-tiered system of panchyath in-
stitutions are functioning at the village,
Mandal and district levels.
These institutions are responsible for the
development of the communities by imple-
menting government programs for educa-
tion, agriculture, livestock development,
provision of drinking water, housing, and
minor irrigation programs. The local
panchyaths play a vital role in implement-
ing development programs and act as a
bridge between government departments
and the people.
Agriculture research stations, agriculture uni-
versities and agriculture extension depart-
ments play a key role in the dissemination
of information and transfer of technology
in the farming community.
118 Site Development Plans
Asia–Japan Partnership Network for Poverty Reduction (AJPN)
Cooperatives and banks only extend limited
financial support services to the farmers,
forcing farmers to depend on money lend-
ers to fund their agricultural inputs.
VULNERABLE CONDITIONS
Agriculture is heavily-dependent on
the monsoons;
Monocropping is a serious issue;
Lack of access to markets is a com-
mon problem in the area. Prices of
agricultural products and livestock
are very low, particularly during
harvest season. As a result, farm-
ers’ incomes are sometimes even less
than the input costs;
Lack of effective farmers’ associa-
tions in the area resulting in less
bargaining power;
Most of the agriculture products are
sold to middlemen at bargain prices;
Lack of value-added technologies
for agricultural products; and
The majority of the farmers are illiter-
ate and have no access to information.
ASSOCIATIONS AND NETWORKS
While farmers’ associations are promoted
at the village level, they need to be trained
on Sustainable Agriculture polices and gov-
ernmental laws. The agriculture department
already started training farmers groups on
Sustainable Agriculture practices, market-
ing, and pest control methods.
CURRENT SA TECHNOLOGIES
AND PRACTICES
At the end of the project period, SARRA
aimed to introduce the following SA tech-
nologies for enhancing food security:
1. Soil and water conservation tech-nologies
Composting
Biomass production
Mulching practices
Bunding
Trenching
Rainwater harvesting
2. Crop production improvementSeed
a) Selection
b) Treatment
c) Production
d) Preservation
Crop rotation
Intercropping
Seed networking
3. Pest managementIntegrated pest management (IPM)
Natural pest management (NPM)
Biological pest management (BPM)
PAST AGRICULTURAL
PRACTICES THAT HAVE FAILED
TO IMPROVE THE CONDITION/INCREASE INCOME OF
FARMERS
During the past four decades, under the
patronage of international development
agencies as well as the national govern-
ment, the area’s farmers have been intro-
duced to green revolution technologies such
as hybrid seeds, chemical fertilizers, pesti-
cides and other external inputs for secur-
ing higher production levels of various crops.
Substantial incentives were offered by the
national government to apply these tech-
Enhancing Capacities on Sustainable Agriculture for Poverty Reduction 119
nologies. Although farmers witnessed
higher production levels in the initial stages,
they could not maintain the same levels
of production due to the decreasing fer-
tility levels of the soil, as well as pest and
disease problems due to the heavy appli-
cation of external inputs.
OVERALL STRENGTHS AND
OPPORTUNITIES OF THE
PROJECT SITE
Strengths:Almost all households depend on
agriculture;
Big cattle rearing, the by-product
of which can be used as organic
fertilizer; and
The partner NGO, SARRA, has
substantial experience in the area
of sustainable development.
Opportunities:The agricultural sector in Andhra
Pradesh is very much in crisis.
Farmers recognize that unless they
organize themselves and look for
alternatives, it is highly impossible
to come out of the crisis;
The state government gives much
priority and focus on agriculture.
The government is very much in-
terested in strengthening new in-
terventions related to agriculture;
and
NABARD and other banks were
also interested to support farm-
ers’ groups, if they fulfill their mini-
mum required standards.
THE PROJECT SITE DEVELOPMENT PLAN
GOAL OF THE PROJECT SITE
The goal of the project site was “to make
agriculture viable and remunerative to small
and marginal farmers through Sustainable
Agriculture practices and sustainable mar-
keting interventions…”.
OBJECTIVES
1. To enhance awareness, knowledge and
motivation levels of area’s families to
function as demonstration farmers in
the application of SA practices and tech-
nology transfer;
2. To enable the farmers to undertake
practical demonstrations in order to
apply SA technologies in the area of
vegetable production for home con-
sumption and marketing;
3. To enable the demonstration farmers
to share their knowledge and experi-
ences with other farmers and build
farmers’ networks for advancing the
agenda of food security and Sustain-
able Agriculture; and
4. To document the experiences of the
SA initiatives and its effects on income,
employment and poverty reduction.
OPERATIONAL STRATEGY
Since SARRA has more than 15 years of
experience in working with SA networks in
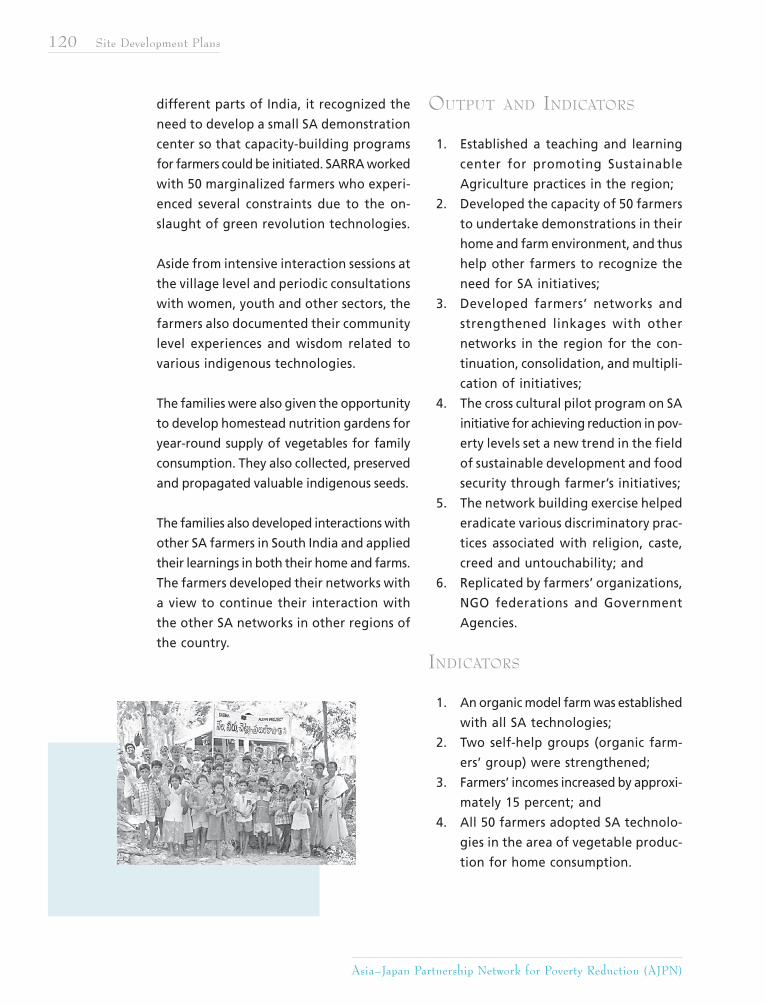
120 Site Development Plans
Asia–Japan Partnership Network for Poverty Reduction (AJPN)
different parts of India, it recognized the
need to develop a small SA demonstration
center so that capacity-building programs
for farmers could be initiated. SARRA worked
with 50 marginalized farmers who experi-
enced several constraints due to the on-
slaught of green revolution technologies.
Aside from intensive interaction sessions at
the village level and periodic consultations
with women, youth and other sectors, the
farmers also documented their community
level experiences and wisdom related to
various indigenous technologies.
The families were also given the opportunity
to develop homestead nutrition gardens for
year-round supply of vegetables for family
consumption. They also collected, preserved
and propagated valuable indigenous seeds.
The families also developed interactions with
other SA farmers in South India and applied
their learnings in both their home and farms.
The farmers developed their networks with
a view to continue their interaction with
the other SA networks in other regions of
the country.
OUTPUT AND INDICATORS
1. Established a teaching and learning
center for promoting Sustainable
Agriculture practices in the region;
2. Developed the capacity of 50 farmers
to undertake demonstrations in their
home and farm environment, and thus
help other farmers to recognize the
need for SA initiatives;
3. Developed farmers’ networks and
strengthened linkages with other
networks in the region for the con-
tinuation, consolidation, and multipli-
cation of initiatives;
4. The cross cultural pilot program on SA
initiative for achieving reduction in pov-
erty levels set a new trend in the field
of sustainable development and food
security through farmer’s initiatives;
5. The network building exercise helped
eradicate various discriminatory prac-
tices associated with religion, caste,
creed and untouchability; and
6. Replicated by farmers’ organizations,
NGO federations and Government
Agencies.
INDICATORS
1. An organic model farm was established
with all SA technologies;
2. Two self-help groups (organic farm-
ers’ group) were strengthened;
3. Farmers’ incomes increased by approxi-
mately 15 percent; and
4. All 50 farmers adopted SA technolo-
gies in the area of vegetable produc-
tion for home consumption.
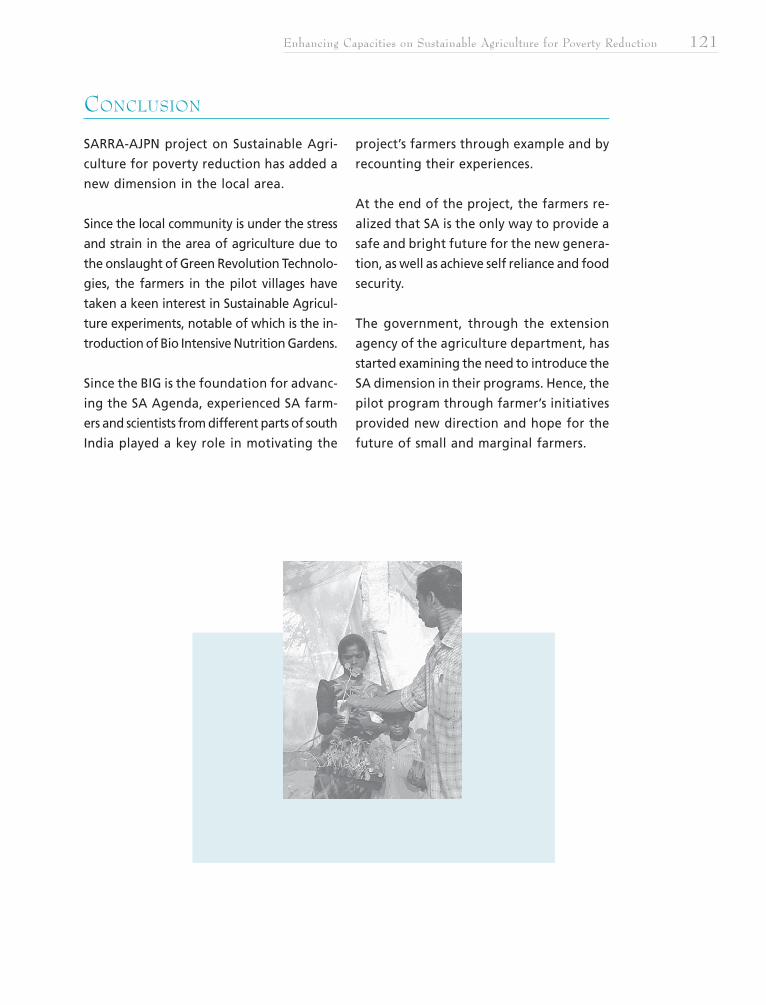
Enhancing Capacities on Sustainable Agriculture for Poverty Reduction 121
CONCLUSION
SARRA-AJPN project on Sustainable Agri-
culture for poverty reduction has added a
new dimension in the local area.
Since the local community is under the stress
and strain in the area of agriculture due to
the onslaught of Green Revolution Technolo-
gies, the farmers in the pilot villages have
taken a keen interest in Sustainable Agricul-
ture experiments, notable of which is the in-
troduction of Bio Intensive Nutrition Gardens.
Since the BIG is the foundation for advanc-
ing the SA Agenda, experienced SA farm-
ers and scientists from different parts of south
India played a key role in motivating the
project’s farmers through example and by
recounting their experiences.
At the end of the project, the farmers re-
alized that SA is the only way to provide a
safe and bright future for the new genera-
tion, as well as achieve self reliance and food
security.
The government, through the extension
agency of the agriculture department, has
started examining the need to introduce the
SA dimension in their programs. Hence, the
pilot program through farmer’s initiatives
provided new direction and hope for the
future of small and marginal farmers.
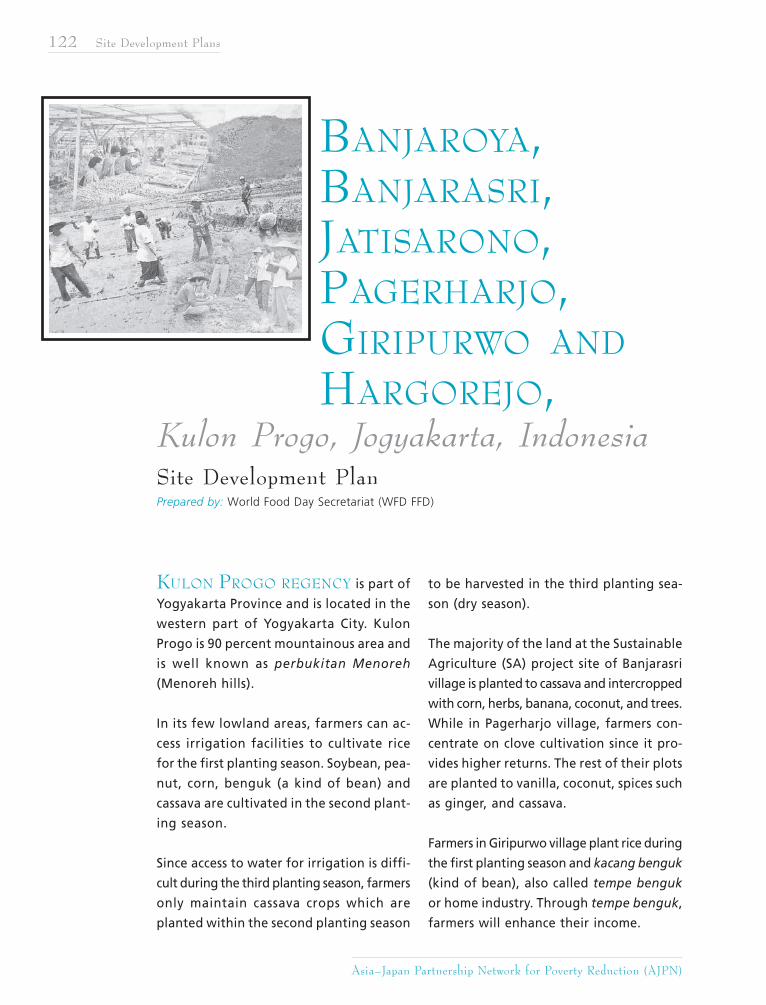
122 Site Development Plans
Asia–Japan Partnership Network for Poverty Reduction (AJPN)
KULON PROGO REGENCY is part of
Yogyakarta Province and is located in the
western part of Yogyakarta City. Kulon
Progo is 90 percent mountainous area and
is well known as perbukitan Menoreh
(Menoreh hills).
In its few lowland areas, farmers can ac-
cess irrigation facilities to cultivate rice
for the first planting season. Soybean, pea-
nut, corn, benguk (a kind of bean) and
cassava are cultivated in the second plant-
ing season.
Since access to water for irrigation is diffi-
cult during the third planting season, farmers
only maintain cassava crops which are
planted within the second planting season
to be harvested in the third planting sea-
son (dry season).
The majority of the land at the Sustainable
Agriculture (SA) project site of Banjarasri
village is planted to cassava and intercropped
with corn, herbs, banana, coconut, and trees.
While in Pagerharjo village, farmers con-
centrate on clove cultivation since it pro-
vides higher returns. The rest of their plots
are planted to vanilla, coconut, spices such
as ginger, and cassava.
Farmers in Giripurwo village plant rice during
the first planting season and kacang benguk
(kind of bean), also called tempe benguk
or home industry. Through tempe benguk,
farmers will enhance their income.
BANJAROYA,BANJARASRI,JATISARONO,PAGERHARJO,GIRIPURWO AND
HARGOREJO,Kulon Progo, Jogyakarta, IndonesiaSite Development PlanPrepared by: World Food Day Secretariat (WFD FFD)
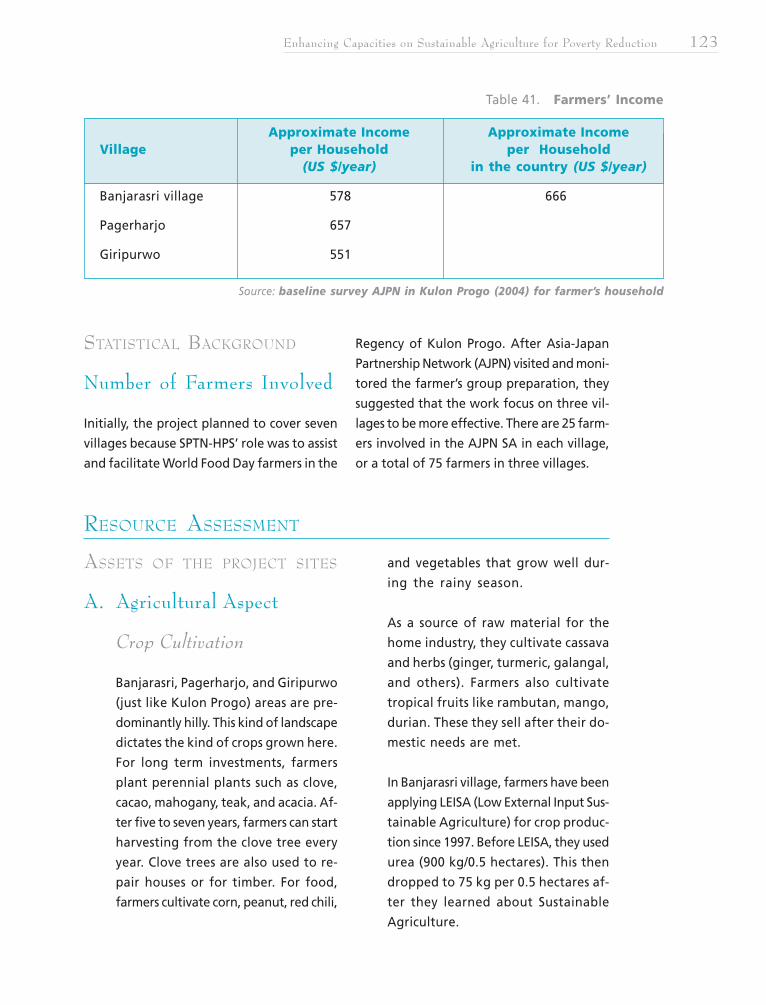
Enhancing Capacities on Sustainable Agriculture for Poverty Reduction 123
STATISTICAL BACKGROUND
Number of Farmers Involved
Initially, the project planned to cover seven
villages because SPTN-HPS’ role was to assist
and facilitate World Food Day farmers in the
Regency of Kulon Progo. After Asia-Japan
Partnership Network (AJPN) visited and moni-
tored the farmer’s group preparation, they
suggested that the work focus on three vil-
lages to be more effective. There are 25 farm-
ers involved in the AJPN SA in each village,
or a total of 75 farmers in three villages.
RESOURCE ASSESSMENT
Source: baseline survey AJPN in Kulon Progo (2004) for farmer’s household
Table 41. Farmers’ Income
Approximate Income Approximate IncomeVillage per Household per Household
(US $/year) in the country (US $/year)
Banjarasri village 578 666
Pagerharjo 657
Giripurwo 551
ASSETS OF THE PROJECT SITES
A. Agricultural Aspect
Crop Cultivation
Banjarasri, Pagerharjo, and Giripurwo
(just like Kulon Progo) areas are pre-
dominantly hilly. This kind of landscape
dictates the kind of crops grown here.
For long term investments, farmers
plant perennial plants such as clove,
cacao, mahogany, teak, and acacia. Af-
ter five to seven years, farmers can start
harvesting from the clove tree every
year. Clove trees are also used to re-
pair houses or for timber. For food,
farmers cultivate corn, peanut, red chili,
and vegetables that grow well dur-
ing the rainy season.
As a source of raw material for the
home industry, they cultivate cassava
and herbs (ginger, turmeric, galangal,
and others). Farmers also cultivate
tropical fruits like rambutan, mango,
durian. These they sell after their do-
mestic needs are met.
In Banjarasri village, farmers have been
applying LEISA (Low External Input Sus-
tainable Agriculture) for crop produc-
tion since 1997. Before LEISA, they used
urea (900 kg/0.5 hectares). This then
dropped to 75 kg per 0.5 hectares af-
ter they learned about Sustainable
Agriculture.
124 Site Development Plans
Asia–Japan Partnership Network for Poverty Reduction (AJPN)
In Pagerharjo village, Samigaluh sub-
district farmers have been practicing
SA since 1992. While in Wadas
Giripurwo village, farmers have been
using SA since 1998.
Traditional Methods are Usedfor Compost Processing
The raw material consists of cow/goat
manure and straws/leaves/trunks.
In three sites of the project, a lot of
organic material like leaves, legume
crops, cow dung are available for com-
post processing.
Climate
Samigaluh is about 900 m above sea
level, so this site enjoys a relatively
cooler climate than the others.
Banjarasri is about 700 m above sea
level, while Giripurwo is about 400 m
above sea level.
Like most parts of Java, the rainy sea-
son starts October and ends in April.
Strong winds are present in August.
Physical-agriculturalInfrastructure
Most of the irrigation canals in many
sites are traditional. In Samigaluh, farm-
ers use water more for domestic con-
sumption than for farming. Baseline
data showed that in Pagerharjo village,
upland irrigation reached only 54 hect-
ares. In Giripurwo village, lowland irri-
gation reached 36 hectares while upland
irrigation is at around 860.27 hectares.
B. Economic DevelopmentAspect
Kulon Progo area is well known for
snacks made from cassava. Like most
parts of Kulon Progo, farmers also
make local snack from cassava in these
three sites.
Income earned from home industry is
used to pay for: (1) children’s school
fees; (2) capital investment: (3) health
care; home repairs. Most children have
finished high school and several have
graduated from university.
Farmers sustainable consumption pat-
tern are also implemented through al-
ternative foods like taro, corn, and yam.
They also grow vegetables for their
household needs.
To overcome health problems, farm-
ers grow traditional plants in their
home garden where they produce
medicinal herbs such as ginger, tur-
meric, white turmeric, galangal, and
pepper battle leaves.
They also maintain traditions such as:
‘Wiwit ‘ and Merti Desa. Wiwit is thank-
ing and praying to the Gods before
harvest, while Merti Desa is thanks-
giving after harvest.
In October 2004, the group of Ngudi
Makmur in Banjarasri village and
Pagerharjo village were also visited by
participants in the SEA Farmer confer-
ence hosted by SPTN in collaboration
with APHD (Asia Partnership for Hu-
man Development, based in Bangkok).
Enhancing Capacities on Sustainable Agriculture for Poverty Reduction 125
Participants from Southeast Asian
countries, like the Philippines, Thai-
land, Cambodia, and Indonesia
shared their experiences and knowl-
edge on Sustainable Agriculture and
marketing.
STRUCTURES AND PROCESSES
The local government in the three project
sites wholeheartedly supports Sustainable
Agriculture.
In Banjarasri village, they provide a revolv-
ing fund to raise goats in order to aug-
ment farmers’ incomes and produce more
organic fertilizer.
The local government of Banjarasri always
reminds farmers during meetings that they
should develop and use organic fertilizers
since they understand the negative effects
of using chemical fertilizers on soil fertility.
The government supports AJPN’s interven-
tion to augment farmers’ incomes through
Sustainable Agriculture.
In Pagerharjo village, local authorities fa-
cilitated farmers’ meetings on selling of ag-
ricultural products aimed at stabilizing prices.
The village has long been used as a demon-
stration plot for NGO research, and also for
cross-visitation programs on food security and
development of alternative food sources. Taro,
yam, and others alternative food sources are
cultivated in farmers’ gardens.
The local government ecourages women’s
groups to set up small savings and loan fa-
cilities, and gave them an initial capital of
Rp 600,000 in 1997 (USD 60) – which has
now risen to Rp 2,600,000 (USD 270).
Women use this capital for their “enting-
enting jahe” business.
In Giripurwo village, the local government
is very supportive of agriculture develop-
ment. They encourage farmers to grow
kacang benguk, a local snack.
A. Cooperatives
Pagerharjo Village
There are five cooperatives that sup-
port farmer’s activities in the village.
To access credit from the cooperatives,
farmer should meet requirements such
as: (1) joining the group; and (2) set-
ting-up a small business.
Giripurwo Village
There are four cooperatives that pro-
vide credit to members with interest
rates of 1.5 to 2 percent a month. Period
of return is 5 to 10 months.
Banjarasri Village
There is one credit cooperative named
UB Mekar Bhakti that gives credit to its
members with interest of 1.5 percent a
month. Period of return is 10 months.
B. Agricultural Laws andPolicies
The local government in Kulon Progo’s
motto is ijo royo-royo, which means
encourage the community to estab-
lish Kulon Progo as a green area with
diversified crops.
126 Site Development Plans
Asia–Japan Partnership Network for Poverty Reduction (AJPN)
The district government demon-
strated their commitment to this
motto by supporting farmer’s activi-
ties in Sustainable Agriculture de-
velopment.
In October 2004, the farmers’ forum
of Sabar-subur (World Food Day farmer’s
movements in Kulon Progo established
in 1999) celebrated World Food Day in
Promasan Kalibawang sub-district. The
regent came and encouraged farmers
to develop alternative food products.
Farmers also sold their organic prod-
ucts to the regent and his staff.
VULNERABILITY CONDITION
Hindrances met by farmers in Kulon Progo:
1. Lack of knowledge and access tech-
nology weaken farmers’ condition and
position. In the three project sites, farm-
ers do not clearly understand the ma-
terials used in organic fertilizers and
methods of organic pest management.
In all the three project sites, farmers’
groups do not plan their activities well,
i.e., they did not carry out proper book-
keeping and business management
practices. This caused their enterprises
to grow very slowly or even stagnate,
thus farmers in this village remain poor.
2. Lack of water for irrigation, particu-
larly in Banjarasri village. During the
dry season, farmers have to get wa-
ter for domestic consumption two
kilometer from their houses.
3. Lack of market access was a com-
mon problem for most of the farm-
ers in the three project sites. The prices
of the agricultural products and
home industry products are quite
low, particularly during the harvest
season, resulting in low incomes.
In Giripurwo village, for instance, farm-
ers use 5 percent of their harvest to make
tempe benguk, a local snack made from
beans. The remaining 95 percent is sold
to middlemen at cheap prices (approxi-
mately Rp 1,500 to 2,000/kg or 0.15-
0.2 USD). In Banjarasri village, the price
of cassava and snacks made from cas-
sava during harvest season (August) is
approximately Rp 2,000/kg. Sometimes
it can rise to Rp 5,000/kg.
In Pagerhajo village, the price fluctua-
tions of raw materials, like ginger, co-
conut, millet and white sugar, influ-
ence the profit earned by the farm-
ers’ group who are into the Enting-
enting Jahe business.
4. Lack of networking among farmer’s
groups in each site of the project has
weakened the farmers’ bargaining po-
sition. This condition resulted in farm-
ers losing out when determining prices
for their produce and in fighting for
their rights.
ASSOCIATIONS AND NETWORKS
World Food Day farmers’ groups in Kulon
Progo have collaborated with institutions/
NGOs that advocate for farmer’s rights so
as to create opportunities to improve their
condition and position.
Enhancing Capacities on Sustainable Agriculture for Poverty Reduction 127
They established an agricultural product
network to sell organic rice and other
products with Satu Nama Foundation
based in Jogjakarta, gain access to credit
cooperatives, and inquire from the vil-
lage government about Sustainable Ag-
riculture policies.
These farmers’ groups also held World Food
Day celebration every October to thank God
for the success of their harvest for the cur-
rent year and hope for a better harvest the
following year.
The celebrations also run concurrently with
a bazaar for organic agricultural products.
They also conduct farmers’ workshops on
relevant issues regarding Sustainable Agri-
culture. Usually the group invites the head
of the district (regent) to give the opening
remarks and hold dialogues with farmers.
At the end of the meeting, they make reso-
lutions to solve problems and disseminate
information to the media and government
to advocate farmer’s rights.
In Banjarasri village, there are five farm-
ers’ groups working on nurturing Sustain-
able Agriculture. In Pagerharjo village, there
are three farmers’ groups and in Giripurwo
village, there are two farmers’ groups in-
volved in promoting SA agriculture.
Mostly at the village level, there are com-
munity groups that have a long history of
communal activities.
PKK: Formed in Java in 1979, the PKK
women’s group exists in most villages
of Kulon Progo. This group, whose
membership is 100 percent women,
aims to empower women on fam-
ily and child care, increase their busi-
ness skills, upgrade their knowledge,
and other related issues of human
development. They have meetings
every month. Many issues are dis-
cussed during the meeting, such as:
dissemination of information from
the district government relating to
healthy life, environmental preser-
vation, savings and loan, and oth-
ers.
Cooperatives: There are many coop-
eratives established in each village.
These support farmers in running their
farming enterprise and meeting their
daily needs, such as pay electricity,
provide family health care, help de-
fray cost of their children’s education.
Salawatan group: Formed in 1999
in Pagerharjo village, Salawatan is a
traditional folk song group which aims
to revive and maintain local culture
and practices and encourage the
younger generation to embrace local
culture. The group composes traditional
songs that encourage people to con-
serve the ecosystem and maintain
diversity of crops.
CURRENT SA TECHNOLOGIES AND
PRACTICES THAT ARE PROMOTED
AND HAVE ADDRESSED POVERTY
OF FARMERS
1. SPTN-HPS has promoted Sustainable
Agriculture in Kulon Progo sub-district
since 1991 in Wates (the head city of
Kulon Progo) mostly through World
Food Day activities. After one year, a
farmer’s group was put up in
Pagerharjo, Samigaluh sub-district
Kulon Progo and one farmer’s group
128 Site Development Plans
Asia–Japan Partnership Network for Poverty Reduction (AJPN)
in Girimulyo village that implement
SA. They cultivated local rice variet-
ies and applied organic fertilizer on
their fields. They later found out that
their soil became more fertile, thus
sustaining their SA activities to date.
From 1996 to present, there are 14
farmer’s groups involved in the World
Food Day farmers’ movement in Kulon
Progo. All of them adopted Sustain-
able Agriculture practices.
2. The promotion of Sustainable Agricul-
ture matches the farmers’ needs since
they feel that overuse of chemical fer-
tilizers and pesticides has killed the soil
biota and is hazardous to human
health. They gradually abandoned
chemical inputs and converted to or-
ganic inputs.
Some technological aspects of SA that
have been introduced to the farmers
include: use of local seeds varieties to
replace hybrid seeds, use of organic
compost to replace chemical fertiliz-
ers, and use of biological pesticide to
control pests and diseases.
3. SPTN-HPS has strategies to address
poverty through several aspects of
Sustainable Agriculture, as follows:
a. Pattern of production through:Promotion of local seed varieties
such as: local rice, corn, soybean,
and cash crops in order to re-
place hybrid or even genetically
engineered seeds. Use of local
seeds reduced cost of produc-
tion so the farmers choose this
strategy in their agriculture
enterprise.
Technical assistance and train-
ing on organic fertilizer and
organic pest management prac-
tices. To control pest and dis-
ease, the SA farmers in Kulon
Progo use organic pesticide.
Through SA assistance, the farm-
ers have converted from chemi-
cal to organic fertilizer. This
reduced cost of production and
enriched the soil’s fertility.
Promoting farmers to conserve
biodiversity in nature to main-
tain ecosystem balance.
Increased sustainable produc-
tion of food and snacks.
Set standard of production
process.
b. Pattern of consumptionEncouraging farmers to con-
sume healthy food
Promoting simple lifestyle re-
ferred to as the truth, justice
and peace.
c. Alternative economySavings and loan group as an
embryo to establish credit
unions (CU).
Home industry development
Organic product marketing
PAST AGRICULTURAL PRACTICES
THAT HAVE FAILED TO IMPROVE
THE CONDITION/INCREASE
INCOMES OF FARMERS
1. After the Green Revolution, farmers
were so dependent on high external
inputs such as hybrid seeds, chemical
fertilizers and pesticides thus result-
ing in negative effects on soil fertility
and productivity. The loss of local
rice varieties, traditional wisdom and
Enhancing Capacities on Sustainable Agriculture for Poverty Reduction 129
agricultural culture are also felt be-
cause reduction in soil productivity
simultaneously reduced their income.
2. Onerous agricultural trade policies
continue to marginalize poor farm-
ers. Farmers have no bargaining
position with middlemen, since there
are no clear-cut policies to protect
them.
OVERALL OPPORTUNITIES AND
STRENGTHS OF THE PROJECT SITE
1. Farmers are organized under World
Food Day farmers’ group networks,
which is a strong base for the farmers
to advocate for their rights.
2. Farmers started practicing Sustainable
Agriculture five to 10 years ago, thus
their soil is more fertile and produc-
tive. Their productive soils have si-
multaneously reduced their opera-
tions costs (for buying chemical fer-
tilizers) and increased their income.
3 . Farmers have started home indus-
tries to process sustainable agricul-
tural products so as to increase the
product’s value, making them more
marketable and able to demand a
bigger price.
4. Farmers have a strong desire to be
successful. This was evident to the
team from AJPN which monitored
their activities in December of 2004.
5. The government is supportive of Sus-
tainable Agriculture development be-
cause they know its positive impact
to the agricultural ecosystem and
farmers’ income.
6. Many businesses are interested to
collaborate in the selling of organi-
cally soorced snacks like cassava and
enting-enting jahe (ginger snack)
GOAL OF THE PROJECT SITE
Enhanced capacity for Sustainable Agri-
culture to reduce poverty in the three sites
and in the whole of Kulon Progo.
OBJECTIVES
1. Increase knowledge and skills of farm-
ers on Sustainable Agriculture culti-
vation and processing of snacks made
from the farmers’ produce;
2. Increase income of farmers from their
home industries; and
3. Strengthen networking among farm-
ers’ and consumers’ groups.
STRATEGIES
1. Sustainable agriculture:
a. Set up organic model farms in each
farmers’ group.
b. Establish biological pesticide pro-
cessing – in-vitro processing prac-
tices in each site.
2. Rural economic development:
a. Set-up marketing teams per site to
strengthen market access.
b. Promote organic farmers’ products the
consumers.
c. Strengthen farmers’ home industries per
group through packing, labeling, and
quality control practices.
THE PROJECT SITE DEVELOPMENT PLAN
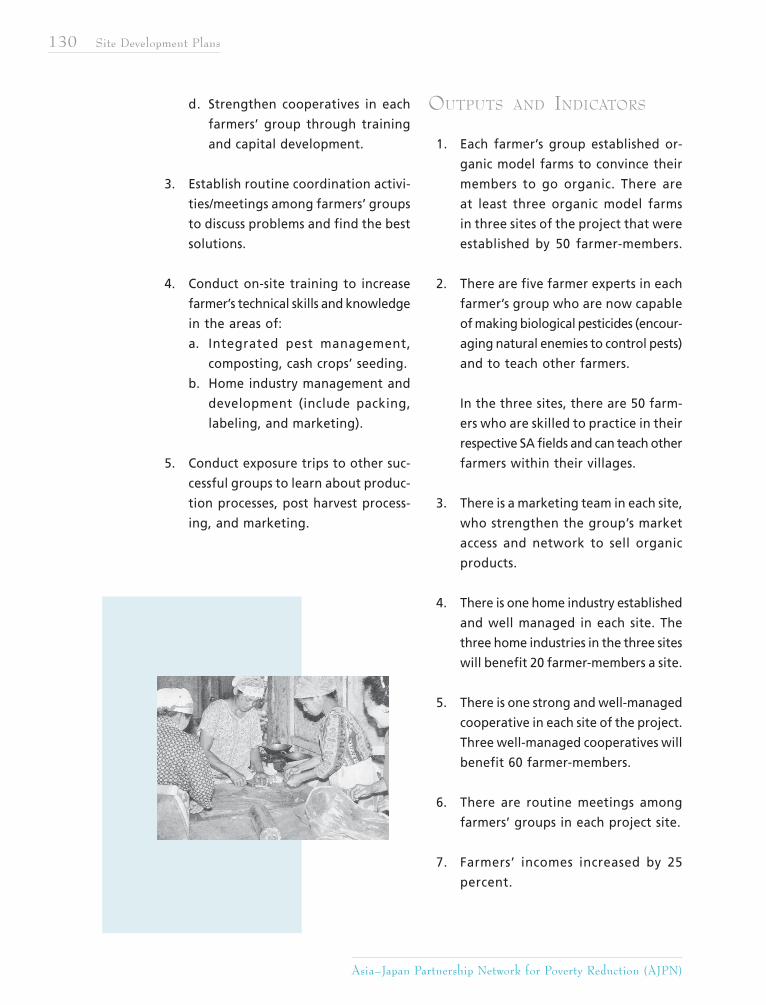
130 Site Development Plans
Asia–Japan Partnership Network for Poverty Reduction (AJPN)
d. Strengthen cooperatives in each
farmers’ group through training
and capital development.
3. Establish routine coordination activi-
ties/meetings among farmers’ groups
to discuss problems and find the best
solutions.
4. Conduct on-site training to increase
farmer’s technical skills and knowledge
in the areas of:
a. Integrated pest management,
composting, cash crops’ seeding.
b. Home industry management and
development (include packing,
labeling, and marketing).
5. Conduct exposure trips to other suc-
cessful groups to learn about produc-
tion processes, post harvest process-
ing, and marketing.
OUTPUTS AND INDICATORS
1. Each farmer’s group established or-
ganic model farms to convince their
members to go organic. There are
at least three organic model farms
in three sites of the project that were
established by 50 farmer-members.
2. There are five farmer experts in each
farmer’s group who are now capable
of making biological pesticides (encour-
aging natural enemies to control pests)
and to teach other farmers.
In the three sites, there are 50 farm-
ers who are skilled to practice in their
respective SA fields and can teach other
farmers within their villages.
3. There is a marketing team in each site,
who strengthen the group’s market
access and network to sell organic
products.
4. There is one home industry established
and well managed in each site. The
three home industries in the three sites
will benefit 20 farmer-members a site.
5. There is one strong and well-managed
cooperative in each site of the project.
Three well-managed cooperatives will
benefit 60 farmer-members.
6. There are routine meetings among
farmers’ groups in each project site.
7. Farmers’ incomes increased by 25
percent.
Enhancing Capacities on Sustainable Agriculture for Poverty Reduction 131
CONCLUSION
1. A medium for community/farmerss
learning was established, through: or-
ganic model farms and home indus-
try enterprises. The model is chosen
to create alternative learning strategy
from farmer to farmer (farmer as
teacher and learner) farmers/commu-
nity will share, learn, and extend Sus-
tainable Agriculture practices.
2. Capacity of farmers was increased,
whereby they are now capable to
implement Sustainable Agriculture
practices in their respective villages
manage their organization and enter-
prise as well.
3. Established marketing teams to expand
market access to ensure that farmers’
products are sellable.
4. Strengthened home industries in each
site which are adopted and practiced
by each member.
5. Assisted farmers’ groups in imple-
menting Sustainable Agriculture
practices.
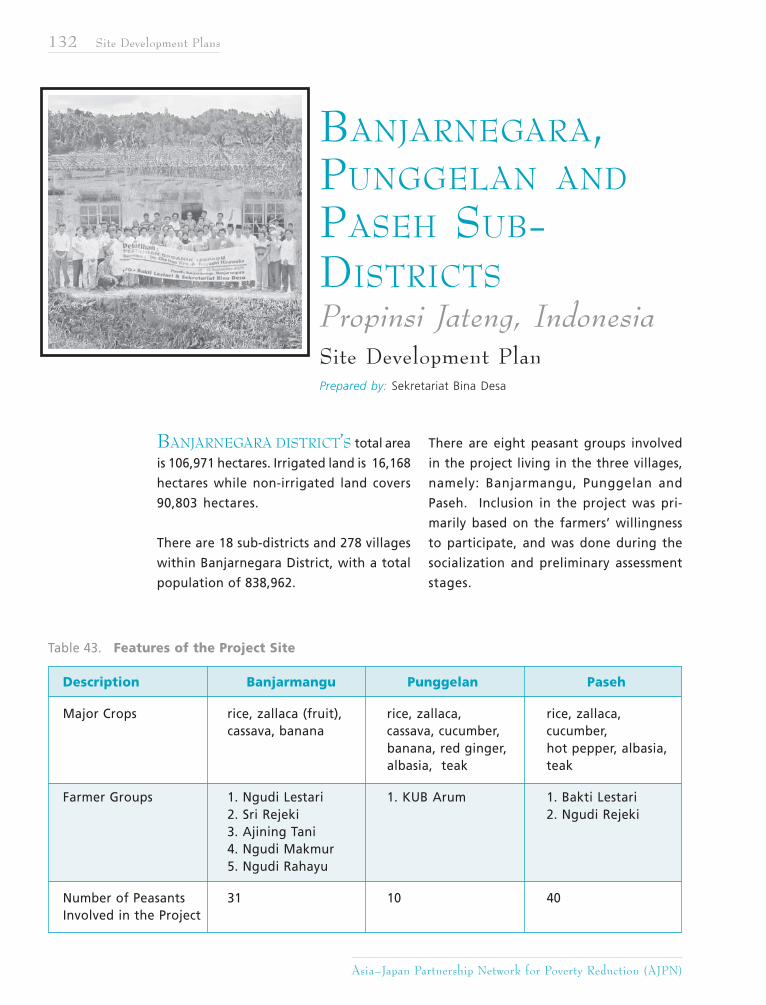
132 Site Development Plans
Asia–Japan Partnership Network for Poverty Reduction (AJPN)
BANJARNEGARA DISTRICT’S total area
is 106,971 hectares. Irrigated land is 16,168
hectares while non-irrigated land covers
90,803 hectares.
There are 18 sub-districts and 278 villages
within Banjarnegara District, with a total
population of 838,962.
There are eight peasant groups involved
in the project living in the three villages,
namely: Banjarmangu, Punggelan and
Paseh. Inclusion in the project was pri-
marily based on the farmers’ willingness
to participate, and was done during the
socialization and preliminary assessment
stages.
BANJARNEGARA,PUNGGELAN AND
PASEH SUB-DISTRICTSPropinsi Jateng, IndonesiaSite Development PlanPrepared by: Sekretariat Bina Desa
Table 43. Features of the Project Site
Description Banjarmangu Punggelan Paseh
Major Crops rice, zallaca (fruit), rice, zallaca, rice, zallaca,cassava, banana cassava, cucumber, cucumber,
banana, red ginger, hot pepper, albasia,albasia, teak teak
Farmer Groups 1. Ngudi Lestari 1. KUB Arum 1. Bakti Lestari2. Sri Rejeki 2. Ngudi Rejeki3. Ajining Tani4. Ngudi Makmur5. Ngudi Rahayu
Number of Peasants 31 10 40Involved in the Project
Enhancing Capacities on Sustainable Agriculture for Poverty Reduction 133
STATISTICAL BACKGROUND
Profile of Farmers
The three villages have 81 households,
with a total population of 421 (48 per-
cent male and 52 percent female). The
average number persons per household
is four, while the average age of respon-
dents is 38.
In relation to enhancing soil fertility, it seems
that farmers prefer three kinds of sustain-
able practices, namely: mulching, composting
and animal manure.
About 65 percent of farmers used animal
manure, followed by 16 percent who use
mulching, and 10 percent do composting.
In addition, 25 percent of the farmers use
chemical fertilizers and lime, mostly for
paddy cultivation.
Only 16 percent of farmers use IPM (in-
tegrated pest management) methods
which involves applying chemical pesti-
cides whenever there is an attack from
pests and diseases. As for cropping pat-
terns, 72 percent of farmers adopt sus-
tainable agricultural practices such as
polyculture, crop rotation, multi-storey
cropping and intercropping. Only 12 per-
cent of the farmers adopt monoculture,
which is mostly practiced in paddy cul-
tivation.
At least 31 percent of household rely only
on farming for their income, while 51 per-
cent derive their income from a combina-
tion of farming and non-farming sources.
The rest are engaged in non-farming activi-
ties such as trading, carpentry or construc-
tion, and as employees (teachers and local
government personnel).
RESOURCE ASSESSMENT
THE ASSETS OF THE PROJECT SITE
The main crops cultivated by the farm-
ers in this area are paddy, cassava, zallaca
palm, tomatoes, long bean, cucumber,
and hot pepper. Some farmers also grow
teak and albasia. The soil in the villages
is fertile because of its proximity to vol-
canoes.
Table 44. Household Annual Income in the Three Villages
* exchange rate: 1 US$ = 8,500 IDR
Description Amount (IDR) Amount (US $)*
Average of Farm Incomea. Cash 4,548,809 535b. In kind 456,740 54c. Sub-total 5,005,549 589
Average of Non-farm Income (cash) 7,662,541 901
134 Site Development Plans
Asia–Japan Partnership Network for Poverty Reduction (AJPN)
Only a few farmers in the three villages
have any experience in organic and LEISA
practices, and only for crops such as to-
matoes, rice, hot pepper, long bean, and
mustard. As for the fruit crops (zallaca
and bananas) and cassava, all farmers in
the areas have never used chemical fer-
tilizers and pesticide after planting.
Banjarmangu village is well known as a pro-
ducer of snack foods such as TORAMA (to-
mato tasty date), cassava and banana chips,
and flour products.
In Paseh or Punggelan village, many house-
holds raise cattle, goat, buffalo and poul-
try for additional income, which is a good
and easy source of animal manure for pro-
ducing compost.
Most irrigation systems for paddy lands are
still traditional. About 50 percent of land
relies on rain-fed irrigation.
STRUCTURE AND PROCESS
Farmers’ organizations in the area have good
relations with the district government and
were very much willing to support Sustain-
able Agriculture development in
Banjarnegara District.
In previous years, the district government
requested farmer organizations, especially
in Paseh village, to provide compost prod-
ucts in large quantities.
Unfortunately, the farmers’ organization
were not ready to fulfill this requirement.
The district government even invites farm-
ers’ groups to participate in agricultural
exhibitions at the district and provincial
level.
An agricultural laboratory of the Agri-
culture Ministry, located in Purwokerto
District (aprox. 90 minutes from
Banjarnegara city), is also available for
farmers.
UNSUD (Sudirman University), based in
Purwokerto city, can provide agricultural in-
formation and consultation services for farm-
ers. Some agricultural experiments of UNSUD
are carried out in Banjarnegara District.
A branch of BRI-Bank Rakyat Indonesia (a
state bank) located in Banjarnegara district
gives micro-finance to farmers’ groups in
Banjarmangu village. The amount of credit
varies from IDR 300,000 to 1,000,000 (US$
36 to 118) and at an interest rate of 10
percent a year. Credit is delivered through
the farmers’ groups.
VULNERABILITY CONDITION
About 50 percent of the land is rain
fed, which affects rice production. In
fact, during the dry season, rice pro-
duction is down to only half the usual
production;
Prices of SA products are higher than
conventional agricultural products in
order to compensate for lower yield over
the first three years. Unfortunately, the
market in Banjarnegara district does not
yet appreciate SA products;
Some farmers are wary of shifting to
SA due to their long dependence on
chemical fertilizers and pesticides;
Price of fresh agricultural products
always fluctuate;
Lack of knowledge about soil ecol-
ogy management; and
Enhancing Capacities on Sustainable Agriculture for Poverty Reduction 135
Four farmers’ groups were already
involved in related projects prior to
the start of this project. However,
the empowerment approach is quite
different from the Bina Desa ap-
proach.
ASSOCIATIONS AND NETWORKS
A few of association and networks are able
to support SA technology in the three villages:
IPPHTI (Association of IPM Farmer in
Indonesia) – provides technical assis-
tance on SA
API (Indonesia Peasant Alliance) – with
links to the agriculture ministry in
Jakarta
KRKP (People Committee of Food
Sovereignty) – able to forward the issue
of food sovereignty
CURRENT SA TECHNOLOGIES
AND PRACTICES THAT ARE
PROMOTED/PRACTICED AND
HAVE ADDRESSED POVERTY OF
FARMERS
Sekretariat Bina Desa has been introducing
the SA concept and practices to farmers in
Banjarnegara District since 2002, such as:
“Ideological” Sustainable Agriculture;
Promotion of the use of local varieties;
Production of organic fertilizers and
bio-pesticides by using existing local
resources;
Integrated Pest Management; and
Enhancing the added value of SA prod-
ucts (such as processing organic tomato
into a tasty date product)
Food processing and marketing capacities in
the promotion of SA technologies and prac-
tices should be considered. With an inte-
grated approach, an increase in farmers’
incomes from Sustainable Agriculture is
more realistic.
PAST AGRICULTURAL PRACTICES
THAT HAVE FAILED TO IMPROVE
THE CONDITION/INCREASE
INCOMES OF FARMERS
In order to achieve self reliance in food, the
government pushed agriculture production
by encouraging farmers to use hybrid vari-
eties and high chemical fertilizer and pes-
ticide inputs. This led to a decrease in soil
fertility and environmental destruction. In-
comes of farmers have also grown smaller
due to the high cost of chemical inputs.
Indonesia is a WTO member-country. Conse-
quently, the country’s farmers no longer receive
subsidies while farmers in developed countries
still get the subsidies from their governments.
OVERALL OPPORTUNITIES AND
STRENGTHS OF THE PROJECT SITE
Bina Desa has organized the farmers in
Banjarnegara District in 2002 within the SA
framework. Several farmers’ groups have
emerged as a result of these efforts.
Women in the three villages are very en-
thusiastic about SA, particularly in making
value added products to augment their
household. Recently, farmers have started
growing red ginger used as raw material
for making enting-enting jahe (ginger snack).
Slegreng, a local upland rice which can
be harvested in 105 days in Punggelan vil-
lage has a high yield of three tons a hect-
are via the LEISA method, making this local
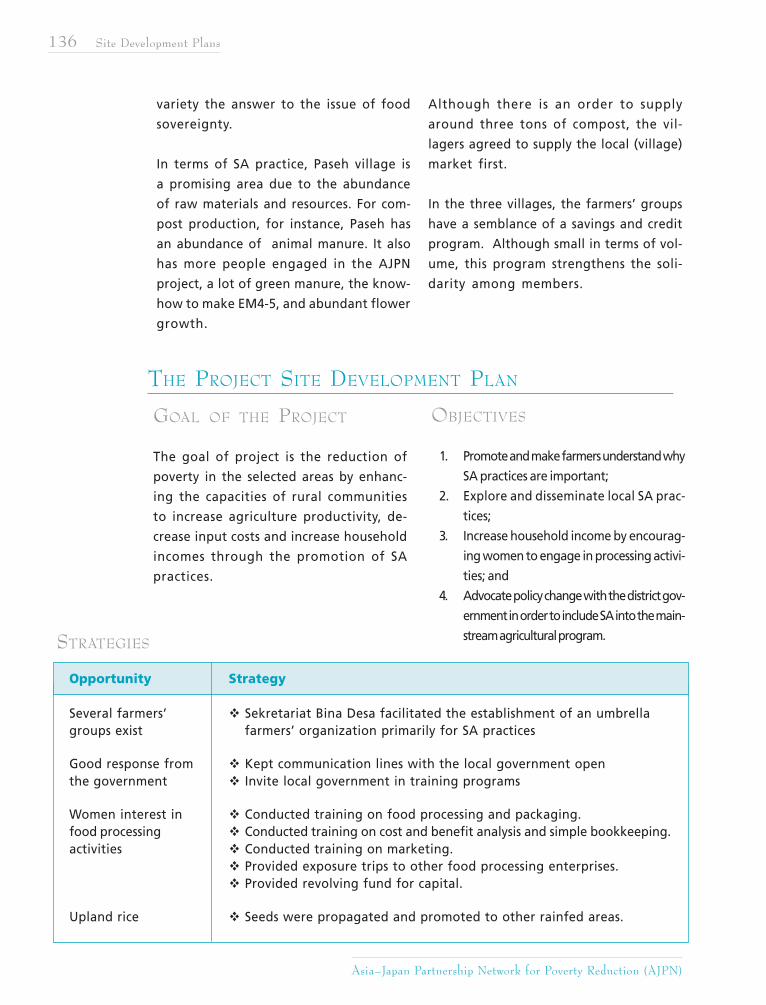
136 Site Development Plans
Asia–Japan Partnership Network for Poverty Reduction (AJPN)
variety the answer to the issue of food
sovereignty.
In terms of SA practice, Paseh village is
a promising area due to the abundance
of raw materials and resources. For com-
post production, for instance, Paseh has
an abundance of animal manure. It also
has more people engaged in the AJPN
project, a lot of green manure, the know-
how to make EM4-5, and abundant flower
growth.
Although there is an order to supply
around three tons of compost, the vil-
lagers agreed to supply the local (village)
market first.
In the three villages, the farmers’ groups
have a semblance of a savings and credit
program. Although small in terms of vol-
ume, this program strengthens the soli-
darity among members.
THE PROJECT SITE DEVELOPMENT PLAN
GOAL OF THE PROJECT
The goal of project is the reduction of
poverty in the selected areas by enhanc-
ing the capacities of rural communities
to increase agriculture productivity, de-
crease input costs and increase household
incomes through the promotion of SA
practices.
OBJECTIVES
1. Promote and make farmers understand why
SA practices are important;
2. Explore and disseminate local SA prac-
tices;
3. Increase household income by encourag-
ing women to engage in processing activi-
ties; and
4. Advocate policy change with the district gov-
ernment in order to include SA into the main-
stream agricultural program.
Opportunity Strategy
Several farmers’ Sekretariat Bina Desa facilitated the establishment of an umbrellagroups exist farmers’ organization primarily for SA practices
Good response from Kept communication lines with the local government openthe government Invite local government in training programs
Women interest in Conducted training on food processing and packaging.food processing Conducted training on cost and benefit analysis and simple bookkeeping.activities Conducted training on marketing.
Provided exposure trips to other food processing enterprises.Provided revolving fund for capital.
Upland rice Seeds were propagated and promoted to other rainfed areas.
STRATEGIES
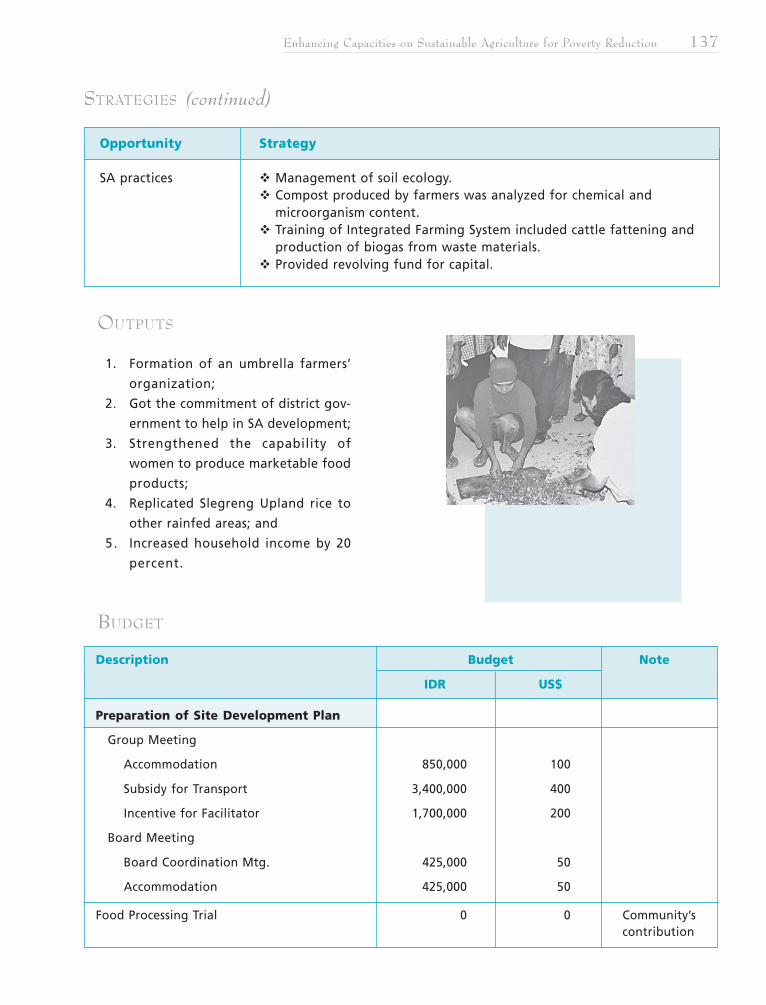
Enhancing Capacities on Sustainable Agriculture for Poverty Reduction 137
OUTPUTS
1. Formation of an umbrella farmers’
organization;
2. Got the commitment of district gov-
ernment to help in SA development;
3. Strengthened the capability of
women to produce marketable food
products;
4. Replicated Slegreng Upland rice to
other rainfed areas; and
5. Increased household income by 20
percent.
BUDGET
CONCLUSION
STRATEGIES (continued)
Opportunity Strategy
SA practices Management of soil ecology.Compost produced by farmers was analyzed for chemical andmicroorganism content.Training of Integrated Farming System included cattle fattening andproduction of biogas from waste materials.Provided revolving fund for capital.
Description Budget Note
IDR US$
Preparation of Site Development Plan
Group Meeting
Accommodation 850,000 100
Subsidy for Transport 3,400,000 400
Incentive for Facilitator 1,700,000 200
Board Meeting
Board Coordination Mtg. 425,000 50
Accommodation 425,000 50
Food Processing Trial 0 0 Community’scontribution
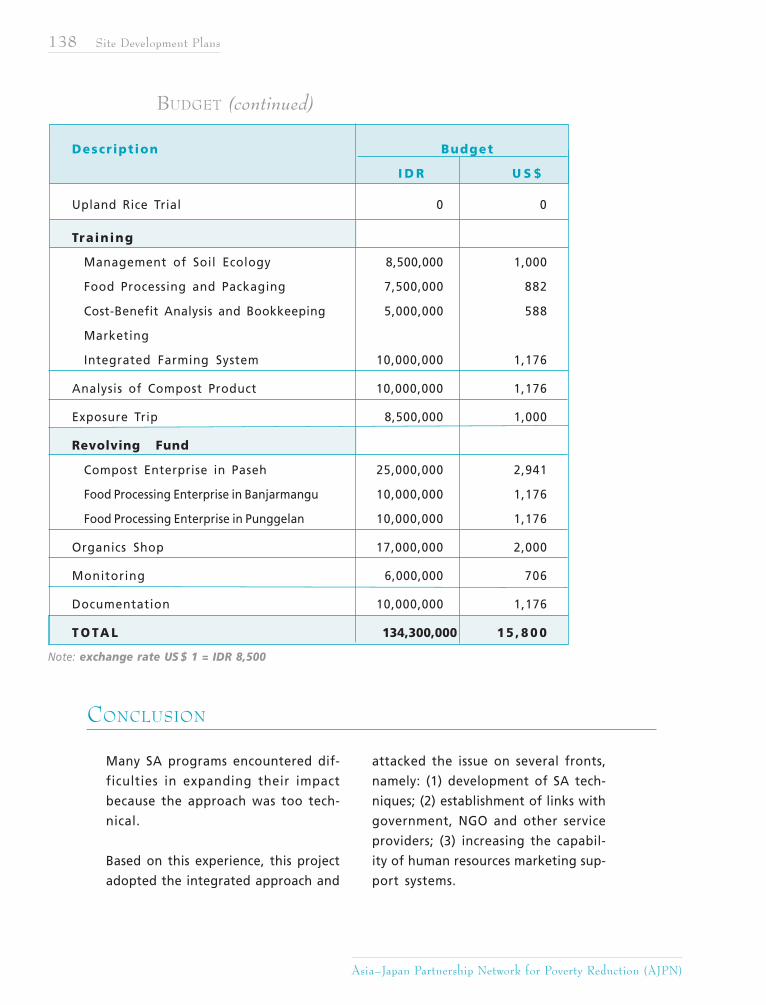
138 Site Development Plans
Asia–Japan Partnership Network for Poverty Reduction (AJPN)
BUDGET (continued)
Many SA programs encountered dif-
ficulties in expanding their impact
because the approach was too tech-
nical.
Based on this experience, this project
adopted the integrated approach and
Note: exchange rate US $ 1 = IDR 8,500
Descr ipt ion Budget
I D R U S $
Upland Rice Trial 0 0
Training
Management of Soil Ecology 8,500,000 1,000
Food Processing and Packaging 7,500,000 882
Cost-Benefit Analysis and Bookkeeping 5,000,000 588
Marketing
Integrated Farming System 10,000,000 1,176
Analysis of Compost Product 10,000,000 1,176
Exposure Trip 8,500,000 1,000
Revolving Fund
Compost Enterprise in Paseh 25,000,000 2,941
Food Processing Enterprise in Banjarmangu 10,000,000 1,176
Food Processing Enterprise in Punggelan 10,000,000 1,176
Organics Shop 17,000,000 2,000
Monitoring 6,000,000 706
Documentation 10,000,000 1,176
T O TA L 134,300,000 1 5 , 8 0 0
CONCLUSION
attacked the issue on several fronts,
namely: (1) development of SA tech-
niques; (2) establishment of links with
government, NGO and other service
providers; (3) increasing the capabil-
ity of human resources marketing sup-
port systems.
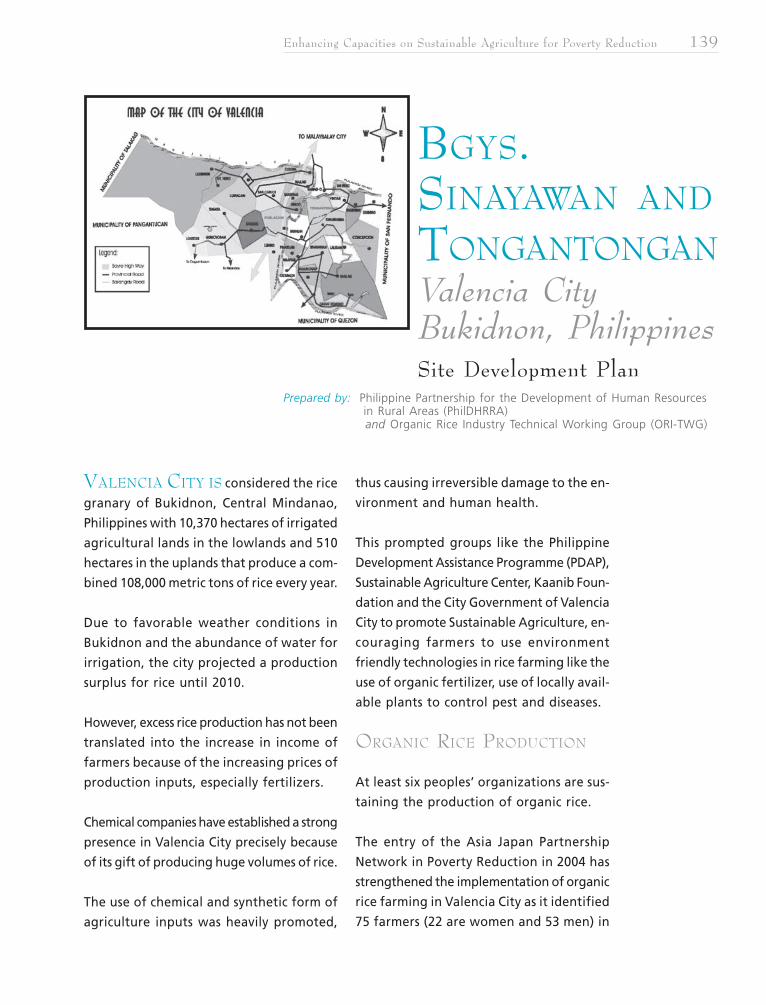
Enhancing Capacities on Sustainable Agriculture for Poverty Reduction 139
VALENCIA CITY IS considered the rice
granary of Bukidnon, Central Mindanao,
Philippines with 10,370 hectares of irrigated
agricultural lands in the lowlands and 510
hectares in the uplands that produce a com-
bined 108,000 metric tons of rice every year.
Due to favorable weather conditions in
Bukidnon and the abundance of water for
irrigation, the city projected a production
surplus for rice until 2010.
However, excess rice production has not been
translated into the increase in income of
farmers because of the increasing prices of
production inputs, especially fertilizers.
Chemical companies have established a strong
presence in Valencia City precisely because
of its gift of producing huge volumes of rice.
The use of chemical and synthetic form of
agriculture inputs was heavily promoted,
thus causing irreversible damage to the en-
vironment and human health.
This prompted groups like the Philippine
Development Assistance Programme (PDAP),
Sustainable Agriculture Center, Kaanib Foun-
dation and the City Government of Valencia
City to promote Sustainable Agriculture, en-
couraging farmers to use environment
friendly technologies in rice farming like the
use of organic fertilizer, use of locally avail-
able plants to control pest and diseases.
ORGANIC RICE PRODUCTION
At least six peoples’ organizations are sus-
taining the production of organic rice.
The entry of the Asia Japan Partnership
Network in Poverty Reduction in 2004 has
strengthened the implementation of organic
rice farming in Valencia City as it identified
75 farmers (22 are women and 53 men) in
BGYS.SINAYAWAN AND
TONGANTONGANValencia CityBukidnon, PhilippinesSite Development Plan
Prepared by: Philippine Partnership for the Development of Human Resources in Rural Areas (PhilDHRRA) and Organic Rice Industry Technical Working Group (ORI-TWG)
140 Site Development Plans
Asia–Japan Partnership Network for Poverty Reduction (AJPN)
the villages of Sinayawan3 (21 farmers),
Tongan-Tongan (26 farmers) and Kahaponan
(28 farmers) as the project beneficiaries.
These farmers have a combined 125.65
hectares of land, of which 61.05 hectares
are planted with organic rice while 54.70
hectares is planted with in-conversion rice.
In 1998, there were seven types of post har-
vest facilities scattered throughout the three
identified villages. Most common post har-
vest facilities in the area were rice threshers,
solar driers, corn mills, rice mills, warehouses,
corn shellers and organic fertilizer plant.
Transportation in the three villages is not
a problem considering that the area is only
15 kilometers from the city and farm to
market roads traverse the three villages.
Jeepneys, hauling trucks, motorcycles serve
as the primary means of transportation in
these areas.
Although there were no training facilities
that could accommodate large number of
participants, each barangay has its own
barangay hall used as a venue for seminar
and training.
In Tongan-Tongan, the local group Tongan-
Tongan Organic Farmers Society for SA
(TOFSSA) has a small training center con-
structed by the Sustainable Agriculture Cen-
ter. Irrigation facilities were also available
in the three villages.
THE PEOPLE AND AREA OF PRODUCTION
Prior to the implementation of the AJPN
project in these villages, farmers were al-
ready organized and practice organic farming
and SA, making it easier to step up organic
production programs.
Their formation was facilitated by NGOs who
were also the prime advocates of organic
rice farming.
In Sinayawan, there were two organizations
into organic farming, the Makakabus and
BMFMC or the Bukidnon Masipag Farmers
Multi-Purpose Cooperative.
3 Since the Bukidnon Masipag Farmers Multi-Purpose Cooperative is based in Sinayawan, 6 farmersare incorporated in Sinayawan although they are living in the adjacent villages of Paitan andMabuhay.
Two organizations are based in Tongan-
Tongan (Tongan-Tongan Organic Farmers
Society for SA and the Tongan-Tongan Multi-
Purpose Cooperative) and two in Kahaponan
(AFARBAMCO and Kahaponan Multi-Purpose
Cooperative). Seventy-five (75) of their mem-
bers were identified as AJPN beneficiaries.
The six organizations have a combined pro-
duction area of 272.04 hectares. Of this,
72.55 hectares of rice farms used organic
technology; 45.2 hectares used LEISA tech-
nology while 154.29 hectares were being
farmed in conventional way.
Enhancing Capacities on Sustainable Agriculture for Poverty Reduction 141
Average production was estimated at 92.5
cavans (50 kilograms) a hectare.
STRUCTURES AND PROCESS
In 1997, the Philippine Development Assis-
tance Programme (PDAP) implemented its
Promoting Participation in Sustainable En-
terprises (PPSE) in partnership with the Social
Action Center of Malaybalay.
The partnership of PDAP and the Social
Action Center has facilitated the organiza-
tion of Makakabus and the establishment
of the organic fertilizer plant.
Kaanib Foundation, a local NGO in Bukidnon
has also entered the two adjacent villages
in the city, bringing also its expertise in
organic farming.
The Xavier University-Sustainable Agricul-
ture Center (XU-SAC) and the Social Action
Center of Malaybalay were instrumental in
the formation of the Bukidnon Masipag
Multi-Purpose Cooperative.
In 2003, XU-SAC in partnership with the
Tongan-Tongan Barangay Council formu-
lated the Community Base SA Master Plan
for Tongan-Tongan, which outlines the 10-
Year Development Plan of the village. It
also conducted training and seminars on
Sustainable Agriculture and Systems on Rice
Intensification (SRI).
The Local Government Units of Valencia has
also actively promoted organic farming in
the city. Through the City Agriculture Of-
fice (CagO), the city mobilizes its 24 Agri-
culture Technicians to provide technical
assistance to farmers.
It also provided organic fertilizers and funds
for the conduct of the Farmers’ Field School
(FFS) and the School on the Air as part of
its extension work. It also provided free
soil analysis to farmers so that proper nu-
trient recommendation will be provided.
The Department of Agrarian Reform (DAR)
has also provided organic fertilizers to the
farmers in Tongan-Tongan and Kahaponan
in the form of soft loan.
Such a strong support from NGOs and the
active participation of the farmers and the
local government unit provided fertile
ground for the further development of
Sustainable Agriculture practices in the city.
The entry of AJPN played a big role in this
development as it was instrumental in shift-
ing the agriculture policy of the city.
The Local Government in cooperation with
the farmers’ cooperatives and NGOs has
agreed to declare the city as the “Organic
Rice Capital of the Philippines”.
Subsequently, the City Council approved the
City Ordinance No 03-2005 creating a Task
Force Organic to formulate and implement
the SA and Organic Rice Master Develop-
ment Plan.
This policy declaration presented an oppor-
tunity to mainstream and upscale rural com-
munity initiatives in Valencia City and pro-
duce healthy food while protecting the en-
vironment and its agricultural resource base.
It is hoped that this initiative will spur lo-
cal economic growth and provide increased
local employment. It is also hoped that this
142 Site Development Plans
Asia–Japan Partnership Network for Poverty Reduction (AJPN)
initiative will increase competitiveness of
the local rice industry and prepare local
communities to the impending negative
impact of the inclusion of rice in the inter-
national trade under WTO.
VULNERABILITIES
There are some pressing issues, however,
that hinder the implementation of Sustain-
able Agriculture and organic rice farming
in Valencia City. One of these is the land
tenure problem.
Rich families own large track of lands in the
area. These families also known as land-
lords who provide farmers with readily
available assistance during emergency and
credit for production.
When these lands were distributed through
the Comprehensive Agrarian Reform Pro-
gram (CARP), this assistance was cut off.
Although government has provided capac-
ity building and infrastructure support, little
has been done to address the economic needs
of these CARP beneficiaries.
Due to lack of capitalization coupled with fam-
ily needs, some of the distributed lands were
rented or leased out to other farmers and trad-
ers who later managed the farm. Land leases
or rental averaged between PhP150,000.00
to PhP 200,000.00 over three years.
This scheme limited the introduction and ex-
pansion of SA and organic rice farming in the
area. All decisions must come from the cur-
rent manager (lessee) of the land. To encour-
age the introduction of organic rice farming,
both the new owner and the maintainer
should be convinced to go into organic.
During lean season (usually from land
preparation until the months before
harvest), farmers need financing to sup-
port or their family needs such as food,
education and other providential needs.
Conventional and hybrid farmers can eas-
ily look or financial support since govern-
ment has available financial assistance for
them, unlike organic rice farmers. Though
traders and private businessmen served as
alternative sources of capital and finances
for family needs, they also charged exorbi-
tant interest that ranges between 10-20
percent a month.
Marketing support for organic rice farm-
ers was also limited. Of the six organiza-
tions assisted by the AJPN, only two were
into organic rice trading in partnership with
either a marketing group or NGO.
The Makakabus has a marketing contract
with the Bukidnon Organic Products Cor-
poration (BOPC). With this agreement,
BOPC purchase the organic rice of
Makakabus farmers at a guaranteed price
plus other incentives ranging from PhP 0.20
to PhP 0.70 a kilogram.
The Kaanib Foundation also assists the
AFARBAMCO in the marketing of their or-
ganic rice. Kaanib provides incentive of
about PhP 0.20 a kilogram.
Other farmers that do not have market-
ing agreements with BOPC and Kaanib have
to sell their organic products individually
or to private traders that provide no in-
centives and do not recognize their prod-
uct as organic.
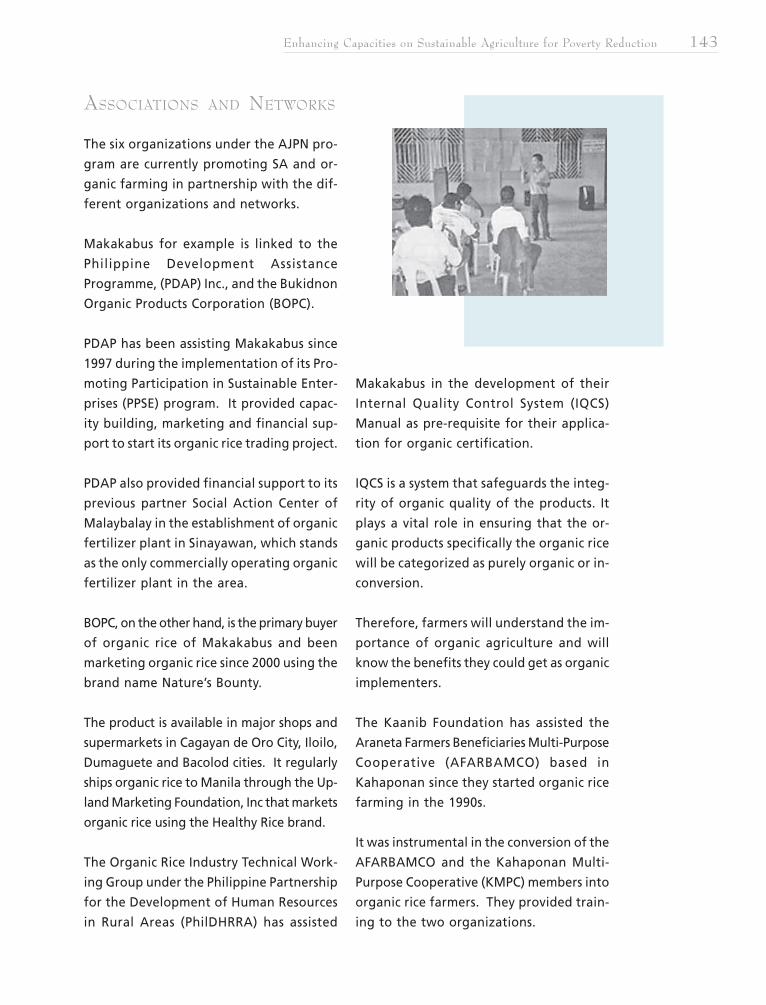
Enhancing Capacities on Sustainable Agriculture for Poverty Reduction 143
ASSOCIATIONS AND NETWORKS
The six organizations under the AJPN pro-
gram are currently promoting SA and or-
ganic farming in partnership with the dif-
ferent organizations and networks.
Makakabus for example is linked to the
Philippine Development Assistance
Programme, (PDAP) Inc., and the Bukidnon
Organic Products Corporation (BOPC).
PDAP has been assisting Makakabus since
1997 during the implementation of its Pro-
moting Participation in Sustainable Enter-
prises (PPSE) program. It provided capac-
ity building, marketing and financial sup-
port to start its organic rice trading project.
PDAP also provided financial support to its
previous partner Social Action Center of
Malaybalay in the establishment of organic
fertilizer plant in Sinayawan, which stands
as the only commercially operating organic
fertilizer plant in the area.
BOPC, on the other hand, is the primary buyer
of organic rice of Makakabus and been
marketing organic rice since 2000 using the
brand name Nature’s Bounty.
The product is available in major shops and
supermarkets in Cagayan de Oro City, Iloilo,
Dumaguete and Bacolod cities. It regularly
ships organic rice to Manila through the Up-
land Marketing Foundation, Inc that markets
organic rice using the Healthy Rice brand.
The Organic Rice Industry Technical Work-
ing Group under the Philippine Partnership
for the Development of Human Resources
in Rural Areas (PhilDHRRA) has assisted
Makakabus in the development of their
Internal Quality Control System (IQCS)
Manual as pre-requisite for their applica-
tion for organic certification.
IQCS is a system that safeguards the integ-
rity of organic quality of the products. It
plays a vital role in ensuring that the or-
ganic products specifically the organic rice
will be categorized as purely organic or in-
conversion.
Therefore, farmers will understand the im-
portance of organic agriculture and will
know the benefits they could get as organic
implementers.
The Kaanib Foundation has assisted the
Araneta Farmers Beneficiaries Multi-Purpose
Cooperative (AFARBAMCO) based in
Kahaponan since they started organic rice
farming in the 1990s.
It was instrumental in the conversion of the
AFARBAMCO and the Kahaponan Multi-
Purpose Cooperative (KMPC) members into
organic rice farmers. They provided train-
ing to the two organizations.
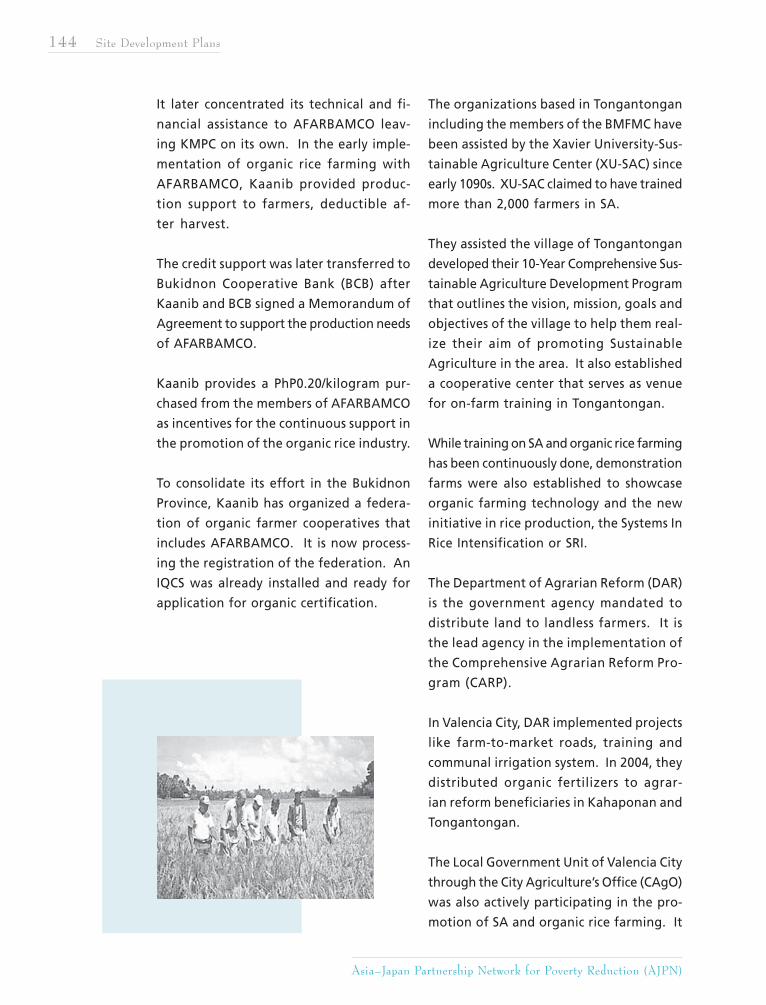
144 Site Development Plans
Asia–Japan Partnership Network for Poverty Reduction (AJPN)
It later concentrated its technical and fi-
nancial assistance to AFARBAMCO leav-
ing KMPC on its own. In the early imple-
mentation of organic rice farming with
AFARBAMCO, Kaanib provided produc-
tion support to farmers, deductible af-
ter harvest.
The credit support was later transferred to
Bukidnon Cooperative Bank (BCB) after
Kaanib and BCB signed a Memorandum of
Agreement to support the production needs
of AFARBAMCO.
Kaanib provides a PhP0.20/kilogram pur-
chased from the members of AFARBAMCO
as incentives for the continuous support in
the promotion of the organic rice industry.
To consolidate its effort in the Bukidnon
Province, Kaanib has organized a federa-
tion of organic farmer cooperatives that
includes AFARBAMCO. It is now process-
ing the registration of the federation. An
IQCS was already installed and ready for
application for organic certification.
The organizations based in Tongantongan
including the members of the BMFMC have
been assisted by the Xavier University-Sus-
tainable Agriculture Center (XU-SAC) since
early 1090s. XU-SAC claimed to have trained
more than 2,000 farmers in SA.
They assisted the village of Tongantongan
developed their 10-Year Comprehensive Sus-
tainable Agriculture Development Program
that outlines the vision, mission, goals and
objectives of the village to help them real-
ize their aim of promoting Sustainable
Agriculture in the area. It also established
a cooperative center that serves as venue
for on-farm training in Tongantongan.
While training on SA and organic rice farming
has been continuously done, demonstration
farms were also established to showcase
organic farming technology and the new
initiative in rice production, the Systems In
Rice Intensification or SRI.
The Department of Agrarian Reform (DAR)
is the government agency mandated to
distribute land to landless farmers. It is
the lead agency in the implementation of
the Comprehensive Agrarian Reform Pro-
gram (CARP).
In Valencia City, DAR implemented projects
like farm-to-market roads, training and
communal irrigation system. In 2004, they
distributed organic fertilizers to agrar-
ian reform beneficiaries in Kahaponan and
Tongantongan.
The Local Government Unit of Valencia City
through the City Agriculture’s Office (CAgO)
was also actively participating in the pro-
motion of SA and organic rice farming. It
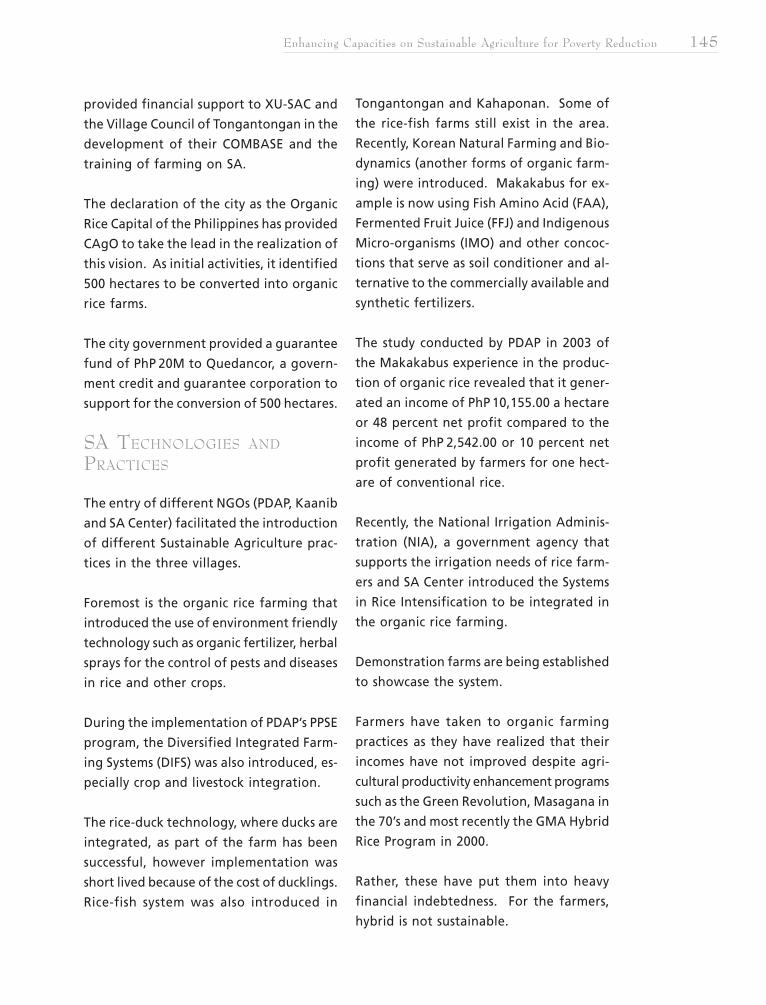
Enhancing Capacities on Sustainable Agriculture for Poverty Reduction 145
provided financial support to XU-SAC and
the Village Council of Tongantongan in the
development of their COMBASE and the
training of farming on SA.
The declaration of the city as the Organic
Rice Capital of the Philippines has provided
CAgO to take the lead in the realization of
this vision. As initial activities, it identified
500 hectares to be converted into organic
rice farms.
The city government provided a guarantee
fund of PhP 20M to Quedancor, a govern-
ment credit and guarantee corporation to
support for the conversion of 500 hectares.
SA TECHNOLOGIES AND
PRACTICES
The entry of different NGOs (PDAP, Kaanib
and SA Center) facilitated the introduction
of different Sustainable Agriculture prac-
tices in the three villages.
Foremost is the organic rice farming that
introduced the use of environment friendly
technology such as organic fertilizer, herbal
sprays for the control of pests and diseases
in rice and other crops.
During the implementation of PDAP’s PPSE
program, the Diversified Integrated Farm-
ing Systems (DIFS) was also introduced, es-
pecially crop and livestock integration.
The rice-duck technology, where ducks are
integrated, as part of the farm has been
successful, however implementation was
short lived because of the cost of ducklings.
Rice-fish system was also introduced in
Tongantongan and Kahaponan. Some of
the rice-fish farms still exist in the area.
Recently, Korean Natural Farming and Bio-
dynamics (another forms of organic farm-
ing) were introduced. Makakabus for ex-
ample is now using Fish Amino Acid (FAA),
Fermented Fruit Juice (FFJ) and Indigenous
Micro-organisms (IMO) and other concoc-
tions that serve as soil conditioner and al-
ternative to the commercially available and
synthetic fertilizers.
The study conducted by PDAP in 2003 of
the Makakabus experience in the produc-
tion of organic rice revealed that it gener-
ated an income of PhP 10,155.00 a hectare
or 48 percent net profit compared to the
income of PhP 2,542.00 or 10 percent net
profit generated by farmers for one hect-
are of conventional rice.
Recently, the National Irrigation Adminis-
tration (NIA), a government agency that
supports the irrigation needs of rice farm-
ers and SA Center introduced the Systems
in Rice Intensification to be integrated in
the organic rice farming.
Demonstration farms are being established
to showcase the system.
Farmers have taken to organic farming
practices as they have realized that their
incomes have not improved despite agri-
cultural productivity enhancement programs
such as the Green Revolution, Masagana in
the 70’s and most recently the GMA Hybrid
Rice Program in 2000.
Rather, these have put them into heavy
financial indebtedness. For the farmers,
hybrid is not sustainable.
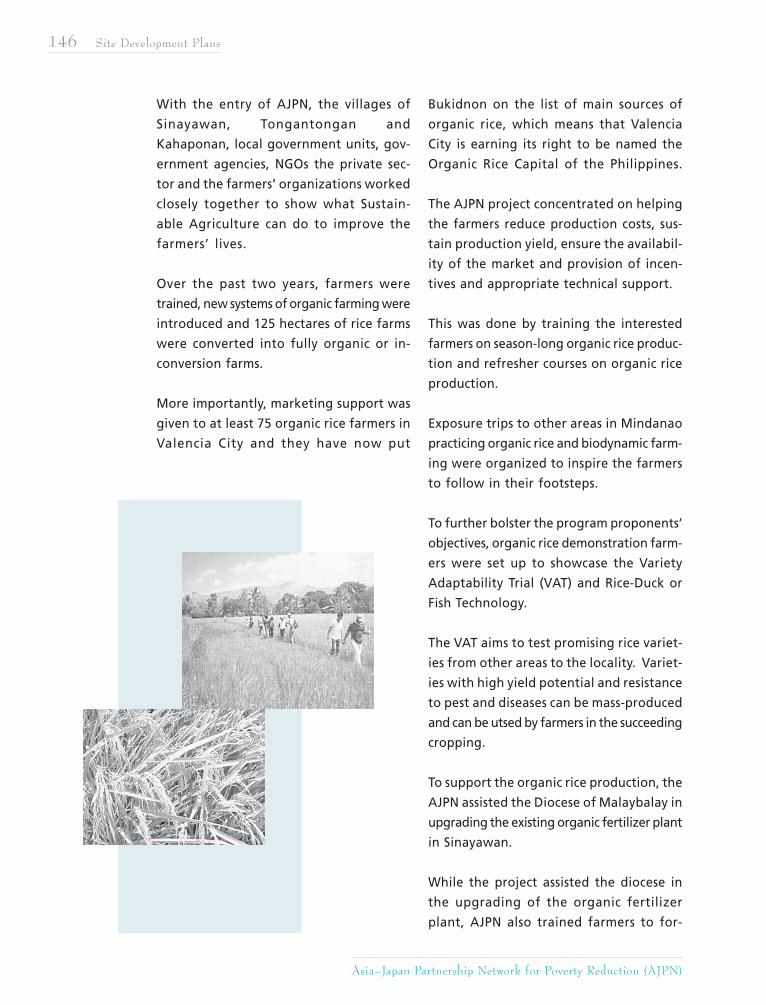
146 Site Development Plans
Asia–Japan Partnership Network for Poverty Reduction (AJPN)
With the entry of AJPN, the villages of
Sinayawan, Tongantongan and
Kahaponan, local government units, gov-
ernment agencies, NGOs the private sec-
tor and the farmers’ organizations worked
closely together to show what Sustain-
able Agriculture can do to improve the
farmers’ lives.
Over the past two years, farmers were
trained, new systems of organic farming were
introduced and 125 hectares of rice farms
were converted into fully organic or in-
conversion farms.
More importantly, marketing support was
given to at least 75 organic rice farmers in
Valencia City and they have now put
Bukidnon on the list of main sources of
organic rice, which means that Valencia
City is earning its right to be named the
Organic Rice Capital of the Philippines.
The AJPN project concentrated on helping
the farmers reduce production costs, sus-
tain production yield, ensure the availabil-
ity of the market and provision of incen-
tives and appropriate technical support.
This was done by training the interested
farmers on season-long organic rice produc-
tion and refresher courses on organic rice
production.
Exposure trips to other areas in Mindanao
practicing organic rice and biodynamic farm-
ing were organized to inspire the farmers
to follow in their footsteps.
To further bolster the program proponents’
objectives, organic rice demonstration farm-
ers were set up to showcase the Variety
Adaptability Trial (VAT) and Rice-Duck or
Fish Technology.
The VAT aims to test promising rice variet-
ies from other areas to the locality. Variet-
ies with high yield potential and resistance
to pest and diseases can be mass-produced
and can be utsed by farmers in the succeeding
cropping.
To support the organic rice production, the
AJPN assisted the Diocese of Malaybalay in
upgrading the existing organic fertilizer plant
in Sinayawan.
While the project assisted the diocese in
the upgrading of the organic fertilizer
plant, AJPN also trained farmers to for-
Enhancing Capacities on Sustainable Agriculture for Poverty Reduction 147
mulate their own organic fertilizer us-
ing locally available materials.
Technologies learned from exposure trips
like formulation of Fish Amino Acid (FAA),
Fermented Fruit Juice (FFJ) and Indigenous
Micro-organisms (IMO) as alternative sources
of fertilizer, soil conditioners and food
supplements were encouraged.
The project’s success would also not have
been possible without the production as-
sistance given by the local government unit
and the Bukidnon Organic Products Corp.,
which helped look for buyers of the farmer
beneficiaries’ organic rice.
BOPC provides incentives to farmers rang-
ing from PhP0.20-PhP0.70 a kilogram above
the prevailing market price of palay. This
incentive is expected to encourage farmers
to continue practicing organic rice farming.
The marketing assistance covers at least
75 hectares of organic and in-conversion
farms in the three villages.
A central processing facility for organic rice
was likely established in Valencia City to cater
to the increasing organic rice farmers. This
was also in line with the Local Government’s
efforts to declare Valencia as the Organic
Rice Capital of the Philippines.
Results show that at the end of two years,
AJPN has made a difference in the lives of
the farmers here.
Income has been increased and the results
are encouraging enough to make one be-
lieve that the farmers will continue what
they started and make Valencia City a show-
case for successful organic farming.
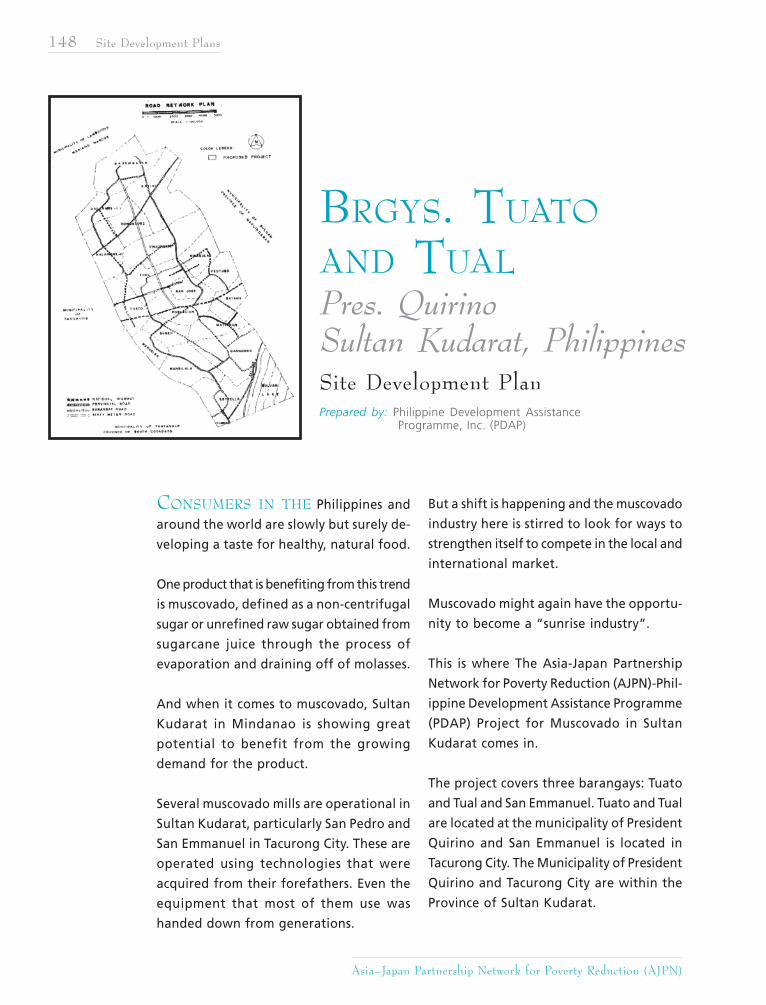
148 Site Development Plans
Asia–Japan Partnership Network for Poverty Reduction (AJPN)
CONSUMERS IN THE Philippines and
around the world are slowly but surely de-
veloping a taste for healthy, natural food.
One product that is benefiting from this trend
is muscovado, defined as a non-centrifugal
sugar or unrefined raw sugar obtained from
sugarcane juice through the process of
evaporation and draining off of molasses.
And when it comes to muscovado, Sultan
Kudarat in Mindanao is showing great
potential to benefit from the growing
demand for the product.
Several muscovado mills are operational in
Sultan Kudarat, particularly San Pedro and
San Emmanuel in Tacurong City. These are
operated using technologies that were
acquired from their forefathers. Even the
equipment that most of them use was
handed down from generations.
But a shift is happening and the muscovado
industry here is stirred to look for ways to
strengthen itself to compete in the local and
international market.
Muscovado might again have the opportu-
nity to become a “sunrise industry”.
This is where The Asia-Japan Partnership
Network for Poverty Reduction (AJPN)-Phil-
ippine Development Assistance Programme
(PDAP) Project for Muscovado in Sultan
Kudarat comes in.
The project covers three barangays: Tuato
and Tual and San Emmanuel. Tuato and Tual
are located at the municipality of President
Quirino and San Emmanuel is located in
Tacurong City. The Municipality of President
Quirino and Tacurong City are within the
Province of Sultan Kudarat.
BRGYS. TUATO
AND TUALPres. QuirinoSultan Kudarat, PhilippinesSite Development PlanPrepared by: Philippine Development Assistance Programme, Inc. (PDAP)
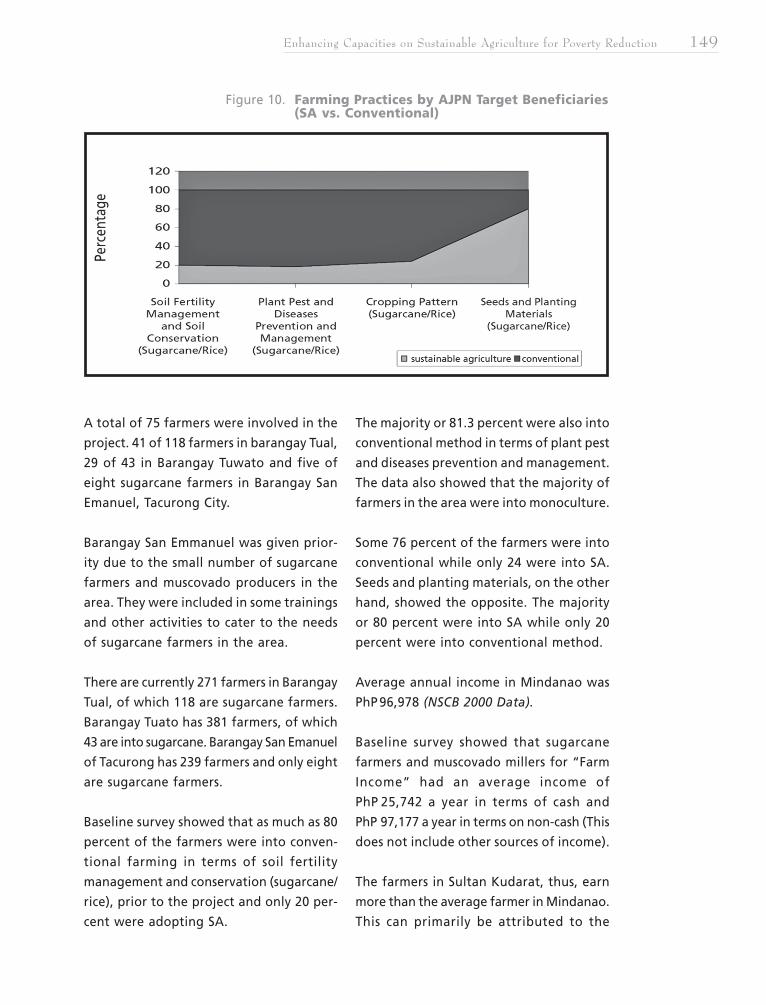
Enhancing Capacities on Sustainable Agriculture for Poverty Reduction 149
A total of 75 farmers were involved in the
project. 41 of 118 farmers in barangay Tual,
29 of 43 in Barangay Tuwato and five of
eight sugarcane farmers in Barangay San
Emanuel, Tacurong City.
Barangay San Emmanuel was given prior-
ity due to the small number of sugarcane
farmers and muscovado producers in the
area. They were included in some trainings
and other activities to cater to the needs
of sugarcane farmers in the area.
There are currently 271 farmers in Barangay
Tual, of which 118 are sugarcane farmers.
Barangay Tuato has 381 farmers, of which
43 are into sugarcane. Barangay San Emanuel
of Tacurong has 239 farmers and only eight
are sugarcane farmers.
Baseline survey showed that as much as 80
percent of the farmers were into conven-
tional farming in terms of soil fertility
management and conservation (sugarcane/
rice), prior to the project and only 20 per-
cent were adopting SA.
The majority or 81.3 percent were also into
conventional method in terms of plant pest
and diseases prevention and management.
The data also showed that the majority of
farmers in the area were into monoculture.
Some 76 percent of the farmers were into
conventional while only 24 were into SA.
Seeds and planting materials, on the other
hand, showed the opposite. The majority
or 80 percent were into SA while only 20
percent were into conventional method.
Average annual income in Mindanao was
PhP 96,978 (NSCB 2000 Data).
Baseline survey showed that sugarcane
farmers and muscovado millers for “Farm
Income” had an average income of
PhP 25,742 a year in terms of cash and
PhP 97,177 a year in terms on non-cash (This
does not include other sources of income).
The farmers in Sultan Kudarat, thus, earn
more than the average farmer in Mindanao.
This can primarily be attributed to the
Figure 10. Farming Practices by AJPN Target Beneficiaries (SA vs. Conventional)
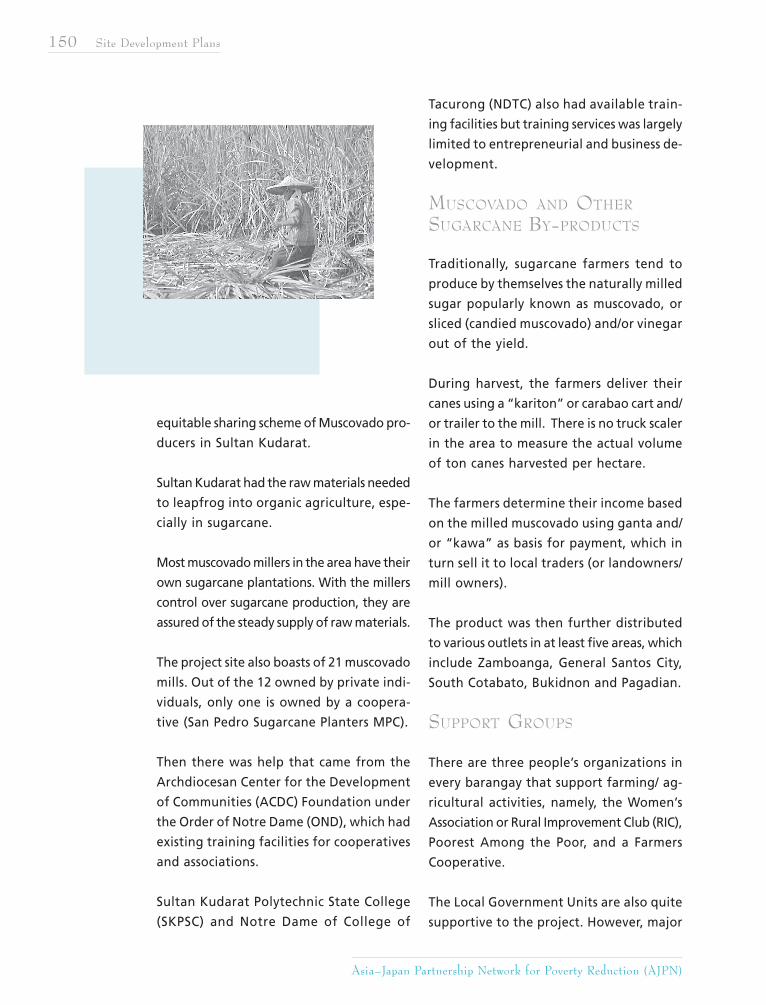
150 Site Development Plans
Asia–Japan Partnership Network for Poverty Reduction (AJPN)
equitable sharing scheme of Muscovado pro-
ducers in Sultan Kudarat.
Sultan Kudarat had the raw materials needed
to leapfrog into organic agriculture, espe-
cially in sugarcane.
Most muscovado millers in the area have their
own sugarcane plantations. With the millers
control over sugarcane production, they are
assured of the steady supply of raw materials.
The project site also boasts of 21 muscovado
mills. Out of the 12 owned by private indi-
viduals, only one is owned by a coopera-
tive (San Pedro Sugarcane Planters MPC).
Then there was help that came from the
Archdiocesan Center for the Development
of Communities (ACDC) Foundation under
the Order of Notre Dame (OND), which had
existing training facilities for cooperatives
and associations.
Sultan Kudarat Polytechnic State College
(SKPSC) and Notre Dame of College of
Tacurong (NDTC) also had available train-
ing facilities but training services was largely
limited to entrepreneurial and business de-
velopment.
MUSCOVADO AND OTHER
SUGARCANE BY-PRODUCTS
Traditionally, sugarcane farmers tend to
produce by themselves the naturally milled
sugar popularly known as muscovado, or
sliced (candied muscovado) and/or vinegar
out of the yield.
During harvest, the farmers deliver their
canes using a “kariton” or carabao cart and/
or trailer to the mill. There is no truck scaler
in the area to measure the actual volume
of ton canes harvested per hectare.
The farmers determine their income based
on the milled muscovado using ganta and/
or “kawa” as basis for payment, which in
turn sell it to local traders (or landowners/
mill owners).
The product was then further distributed
to various outlets in at least five areas, which
include Zamboanga, General Santos City,
South Cotabato, Bukidnon and Pagadian.
SUPPORT GROUPS
There are three people’s organizations in
every barangay that support farming/ ag-
ricultural activities, namely, the Women’s
Association or Rural Improvement Club (RIC),
Poorest Among the Poor, and a Farmers
Cooperative.
The Local Government Units are also quite
supportive to the project. However, major
Enhancing Capacities on Sustainable Agriculture for Poverty Reduction 151
focus of LGU’s in Sultan Kudarat, particu-
larly in President Quirino and Tacurong is
on hybrid rice, hybrid corn and Palm Oil.
The Archdiocesan Center for the Develop-
ment of Communities (ACDC) Foundation
under the Order of Notre Dame (OND) has
been assisting farmers cooperatives and
associations in Sultan Kudarat.
ACDC is currently producing Organic Fer-
tilizers for the use of farmers that are into
Sutainable Agriculture farming.
TECHNOLOGY
While muscovado production is a traditional
industry in Sultan Kudarat, it has not pros-
pered because technology has been largely
unchanged since it was first introduced cen-
turies ago and handed down through gen-
erations.
The same is true with equipment as most
millers inherited these from their forefa-
thers or bought them from other old hands
in the business.
Most people are resistant to change, includ-
ing farmers. Many prefer to hold on to
traditional practices for fear of failure when
new technologies are introduced.
Such barriers to innovations have prevented
farmers from improving the sugarcane pro-
duction technology.
Most farmers are also using conventional
inputs to sugarcane production. Prices of
conventional inputs are increasing year after
year which greatly affected the return of
investments of farmers.
As the farmers’ return on investments and
profit become smaller, they will eventually
become poorer and end up entangled in
the vicious web of poverty.
Government programs have not helped im-
prove production. Previous efforts, for instance,
saw the introduction of plant varieties that
were either not applicable to communities
or required too much capital for inputs.
Government programs have also overlapped
in many cases and were not complemen-
tary. As a result, there was replication of
programs and activities.
ASSOCIATIONS AND NETWORKS
There are organizations, however, that have
been helping bring about significant change
in these barangays.
In Barangay Tual, there are four people’s
organizations, namely, the Women’s Asso-
ciation with 40 members, Poorest Among
the Poor with 15 members, San Pedro Sugar
Planters MPC with 43 members, and the Par-
ent-Teacher Association with 94 members.
Along with the presence of these barangay–
based organizations are several social
projects, which are currently being imple-
mented in the barangay. This includes live-
stock raising, which started in 2004, ben-
efited a total of 55 beneficiaries. The
muscovado marketing, also started in 2004,
involves 21 beneficiaries.
Among the organizations in the village, the
San Pedro Sugarcane Planters MPC
(SPSPMPC), established on February 6, 2001
is the pride of the barangay.
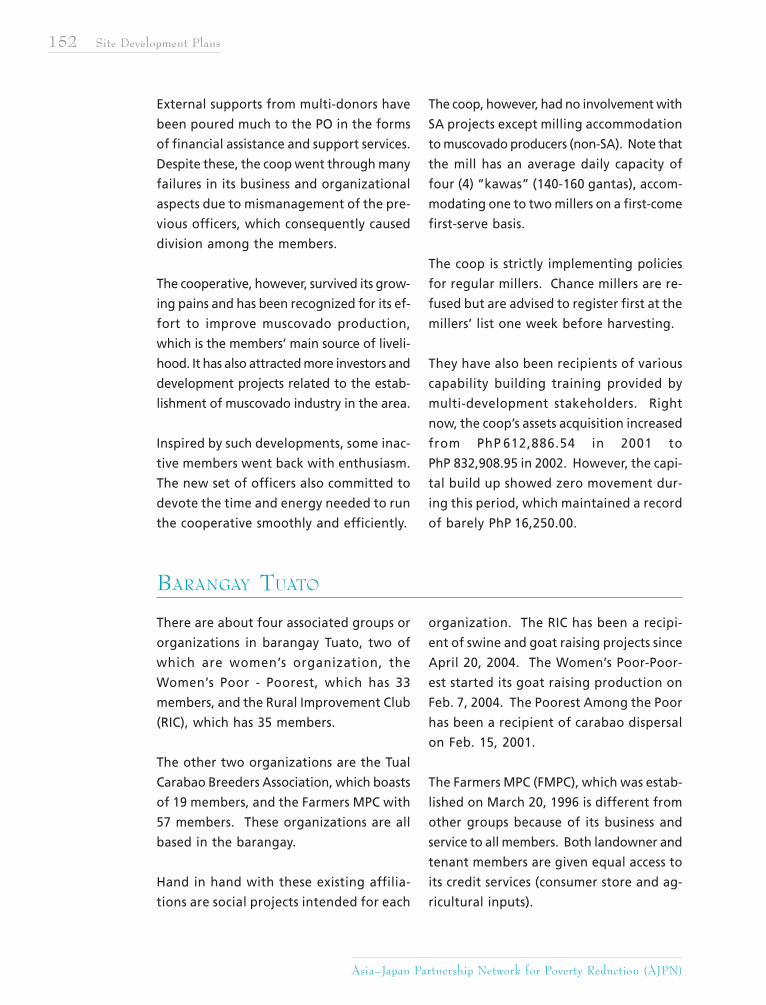
152 Site Development Plans
Asia–Japan Partnership Network for Poverty Reduction (AJPN)
External supports from multi-donors have
been poured much to the PO in the forms
of financial assistance and support services.
Despite these, the coop went through many
failures in its business and organizational
aspects due to mismanagement of the pre-
vious officers, which consequently caused
division among the members.
The cooperative, however, survived its grow-
ing pains and has been recognized for its ef-
fort to improve muscovado production,
which is the members’ main source of liveli-
hood. It has also attracted more investors and
development projects related to the estab-
lishment of muscovado industry in the area.
Inspired by such developments, some inac-
tive members went back with enthusiasm.
The new set of officers also committed to
devote the time and energy needed to run
the cooperative smoothly and efficiently.
The coop, however, had no involvement with
SA projects except milling accommodation
to muscovado producers (non-SA). Note that
the mill has an average daily capacity of
four (4) “kawas” (140-160 gantas), accom-
modating one to two millers on a first-come
first-serve basis.
The coop is strictly implementing policies
for regular millers. Chance millers are re-
fused but are advised to register first at the
millers’ list one week before harvesting.
They have also been recipients of various
capability building training provided by
multi-development stakeholders. Right
now, the coop’s assets acquisition increased
from PhP 612,886.54 in 2001 to
PhP 832,908.95 in 2002. However, the capi-
tal build up showed zero movement dur-
ing this period, which maintained a record
of barely PhP 16,250.00.
BARANGAY TUATO
organization. The RIC has been a recipi-
ent of swine and goat raising projects since
April 20, 2004. The Women’s Poor-Poor-
est started its goat raising production on
Feb. 7, 2004. The Poorest Among the Poor
has been a recipient of carabao dispersal
on Feb. 15, 2001.
The Farmers MPC (FMPC), which was estab-
lished on March 20, 1996 is different from
other groups because of its business and
service to all members. Both landowner and
tenant members are given equal access to
its credit services (consumer store and ag-
ricultural inputs).
There are about four associated groups or
organizations in barangay Tuato, two of
which are women’s organization, the
Women’s Poor - Poorest, which has 33
members, and the Rural Improvement Club
(RIC), which has 35 members.
The other two organizations are the Tual
Carabao Breeders Association, which boasts
of 19 members, and the Farmers MPC with
57 members. These organizations are all
based in the barangay.
Hand in hand with these existing affilia-
tions are social projects intended for each
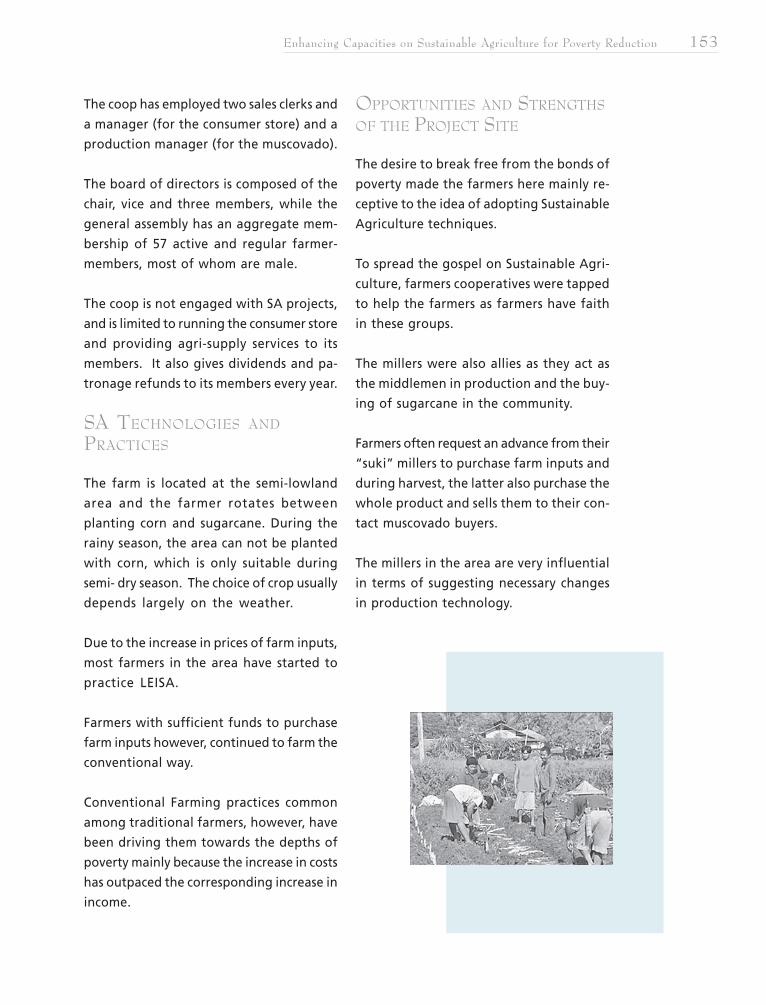
Enhancing Capacities on Sustainable Agriculture for Poverty Reduction 153
The coop has employed two sales clerks and
a manager (for the consumer store) and a
production manager (for the muscovado).
The board of directors is composed of the
chair, vice and three members, while the
general assembly has an aggregate mem-
bership of 57 active and regular farmer-
members, most of whom are male.
The coop is not engaged with SA projects,
and is limited to running the consumer store
and providing agri-supply services to its
members. It also gives dividends and pa-
tronage refunds to its members every year.
SA TECHNOLOGIES AND
PRACTICES
The farm is located at the semi-lowland
area and the farmer rotates between
planting corn and sugarcane. During the
rainy season, the area can not be planted
with corn, which is only suitable during
semi- dry season. The choice of crop usually
depends largely on the weather.
Due to the increase in prices of farm inputs,
most farmers in the area have started to
practice LEISA.
Farmers with sufficient funds to purchase
farm inputs however, continued to farm the
conventional way.
Conventional Farming practices common
among traditional farmers, however, have
been driving them towards the depths of
poverty mainly because the increase in costs
has outpaced the corresponding increase in
income.
OPPORTUNITIES AND STRENGTHS
OF THE PROJECT SITE
The desire to break free from the bonds of
poverty made the farmers here mainly re-
ceptive to the idea of adopting Sustainable
Agriculture techniques.
To spread the gospel on Sustainable Agri-
culture, farmers cooperatives were tapped
to help the farmers as farmers have faith
in these groups.
The millers were also allies as they act as
the middlemen in production and the buy-
ing of sugarcane in the community.
Farmers often request an advance from their
“suki” millers to purchase farm inputs and
during harvest, the latter also purchase the
whole product and sells them to their con-
tact muscovado buyers.
The millers in the area are very influential
in terms of suggesting necessary changes
in production technology.
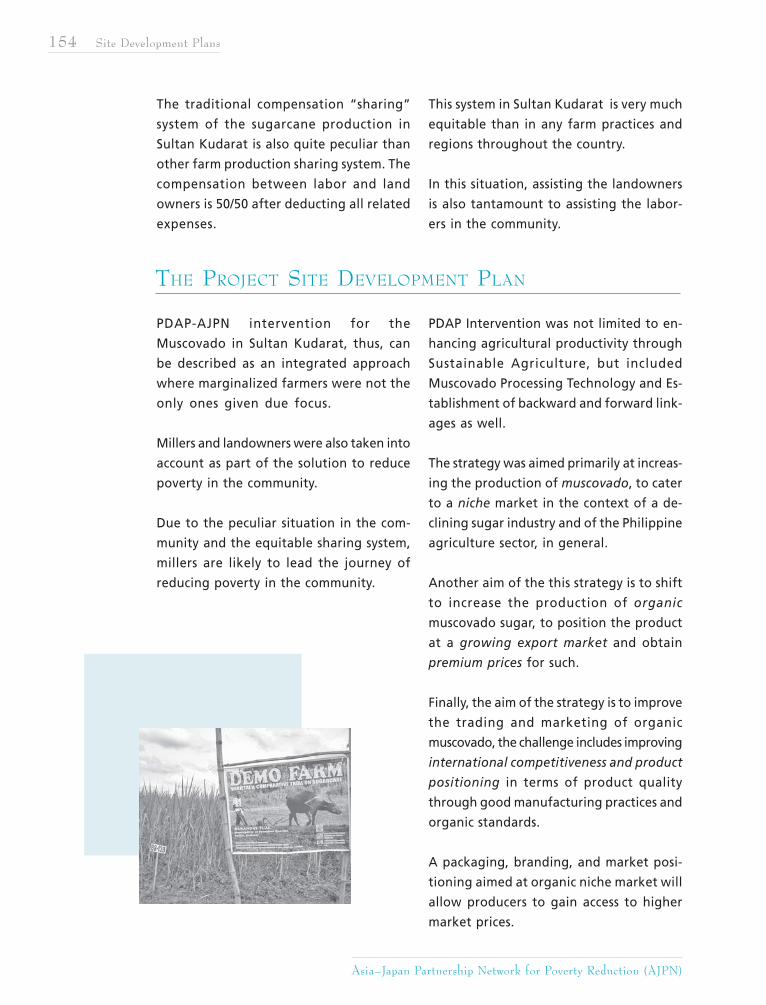
154 Site Development Plans
Asia–Japan Partnership Network for Poverty Reduction (AJPN)
The traditional compensation “sharing”
system of the sugarcane production in
Sultan Kudarat is also quite peculiar than
other farm production sharing system. The
compensation between labor and land
owners is 50/50 after deducting all related
expenses.
This system in Sultan Kudarat is very much
equitable than in any farm practices and
regions throughout the country.
In this situation, assisting the landowners
is also tantamount to assisting the labor-
ers in the community.
THE PROJECT SITE DEVELOPMENT PLAN
PDAP-AJPN intervention for the
Muscovado in Sultan Kudarat, thus, can
be described as an integrated approach
where marginalized farmers were not the
only ones given due focus.
Millers and landowners were also taken into
account as part of the solution to reduce
poverty in the community.
Due to the peculiar situation in the com-
munity and the equitable sharing system,
millers are likely to lead the journey of
reducing poverty in the community.
PDAP Intervention was not limited to en-
hancing agricultural productivity through
Sustainable Agriculture, but included
Muscovado Processing Technology and Es-
tablishment of backward and forward link-
ages as well.
The strategy was aimed primarily at increas-
ing the production of muscovado, to cater
to a niche market in the context of a de-
clining sugar industry and of the Philippine
agriculture sector, in general.
Another aim of the this strategy is to shift
to increase the production of organic
muscovado sugar, to position the product
at a growing export market and obtain
premium prices for such.
Finally, the aim of the strategy is to improve
the trading and marketing of organic
muscovado, the challenge includes improving
international competitiveness and product
positioning in terms of product quality
through good manufacturing practices and
organic standards.
A packaging, branding, and market posi-
tioning aimed at organic niche market will
allow producers to gain access to higher
market prices.

Enhancing Capacities on Sustainable Agriculture for Poverty Reduction 155
chapter
156 Preliminary Impact Assessment Report and Conclusions
Asia–Japan Partnership Network for Poverty Reduction (AJPN)
INITIAL PROJECT RESULTS
PRELIMINARY IMPACT
ASSESSMENT REPORT
AND CONCLUSIONS
A quick survey was conducted in the first
part of 2006 to make an initial assessment
of progress in the six project sites.
Four indicators guided the quantitative
documentation of the project experience:
yield, production cost, labor inputs, and
product selling price.
While it is too early to assess the actual
impact of the project, the results of the
survey could serve as indicators of the
potential effect of Sustainable Agriculture
on farm income.
And the results have been encouraging,
further bolstering AJPN’s firm belief that
Sustainable Agriculture practices can lead
to increased income and bigger yields,
contrary to popular belief.
WITH SUSTAINABLE
AGRICULTURE, YIELD
INCREASES OVER TIME
Selected crops in four project sites have
shown significant increases in yield.
Rice, the staple food and the common crop
among the project sites, responded favor-
ably to natural farming technologies.
Rice yield per hectare increased significantly
from 7–10 percent in three of the four project
sites that promoted sustainable rice produc-
tion.
This was largely due to the use of organic
fertilizers and reduction in the use of chemi-
cals for pest control.
In the case of Bukidnon, infestation caused
a slight decrease in production, yet the har-
vest remained at par with conventional rice
harvests in the area.
The other major crops in project sites in In-
dia, such as wheat, pea and tomato, also
showed significant increases in yield.
The farmers attributed this performance,
especially of pea and tomatoes, to the
greater use of organic fertilizers and new
seed varieties. Integrated pest management
was another common practice in the pro-
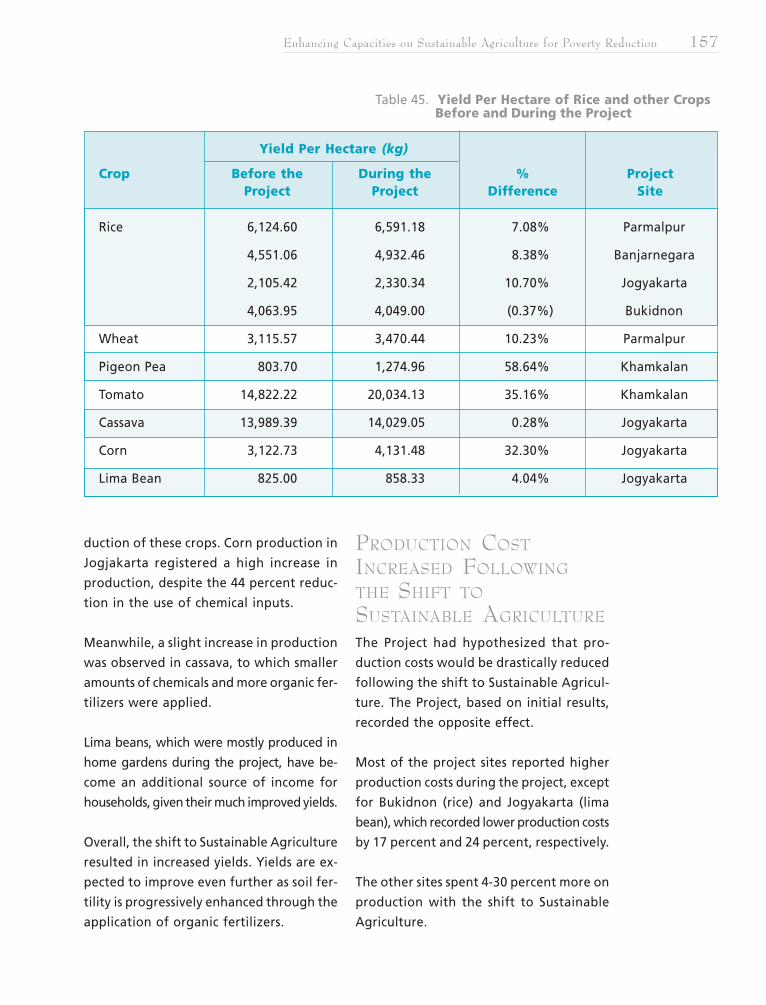
Enhancing Capacities on Sustainable Agriculture for Poverty Reduction 157
duction of these crops. Corn production in
Jogjakarta registered a high increase in
production, despite the 44 percent reduc-
tion in the use of chemical inputs.
Meanwhile, a slight increase in production
was observed in cassava, to which smaller
amounts of chemicals and more organic fer-
tilizers were applied.
Lima beans, which were mostly produced in
home gardens during the project, have be-
come an additional source of income for
households, given their much improved yields.
Overall, the shift to Sustainable Agriculture
resulted in increased yields. Yields are ex-
pected to improve even further as soil fer-
tility is progressively enhanced through the
application of organic fertilizers.
PRODUCTION COST
INCREASED FOLLOWING
THE SHIFT TO
SUSTAINABLE AGRICULTURE
The Project had hypothesized that pro-
duction costs would be drastically reduced
following the shift to Sustainable Agricul-
ture. The Project, based on initial results,
recorded the opposite effect.
Most of the project sites reported higher
production costs during the project, except
for Bukidnon (rice) and Jogyakarta (lima
bean), which recorded lower production costs
by 17 percent and 24 percent, respectively.
The other sites spent 4-30 percent more on
production with the shift to Sustainable
Agriculture.
Table 45. Yield Per Hectare of Rice and other Crops Before and During the Project
Yield Per Hectare (kg)
Crop Before the During the % ProjectProject Project Difference Site
Rice 6,124.60 6,591.18 7.08% Parmalpur
4,551.06 4,932.46 8.38% Banjarnegara
2,105.42 2,330.34 10.70% Jogyakarta
4,063.95 4,049.00 (0.37%) Bukidnon
Wheat 3,115.57 3,470.44 10.23% Parmalpur
Pigeon Pea 803.70 1,274.96 58.64% Khamkalan
Tomato 14,822.22 20,034.13 35.16% Khamkalan
Cassava 13,989.39 14,029.05 0.28% Jogyakarta
Corn 3,122.73 4,131.48 32.30% Jogyakarta
Lima Bean 825.00 858.33 4.04% Jogyakarta
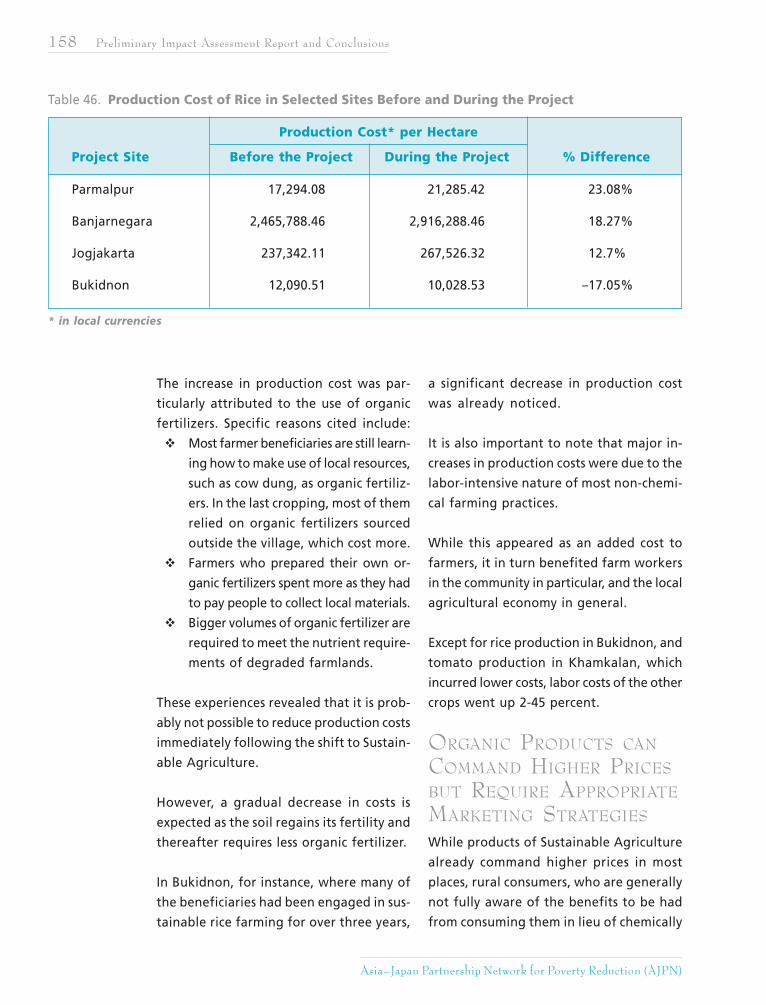
158 Preliminary Impact Assessment Report and Conclusions
Asia–Japan Partnership Network for Poverty Reduction (AJPN)
The increase in production cost was par-
ticularly attributed to the use of organic
fertilizers. Specific reasons cited include:
Most farmer beneficiaries are still learn-
ing how to make use of local resources,
such as cow dung, as organic fertiliz-
ers. In the last cropping, most of them
relied on organic fertilizers sourced
outside the village, which cost more.
Farmers who prepared their own or-
ganic fertilizers spent more as they had
to pay people to collect local materials.
Bigger volumes of organic fertilizer are
required to meet the nutrient require-
ments of degraded farmlands.
These experiences revealed that it is prob-
ably not possible to reduce production costs
immediately following the shift to Sustain-
able Agriculture.
However, a gradual decrease in costs is
expected as the soil regains its fertility and
thereafter requires less organic fertilizer.
In Bukidnon, for instance, where many of
the beneficiaries had been engaged in sus-
tainable rice farming for over three years,
a significant decrease in production cost
was already noticed.
It is also important to note that major in-
creases in production costs were due to the
labor-intensive nature of most non-chemi-
cal farming practices.
While this appeared as an added cost to
farmers, it in turn benefited farm workers
in the community in particular, and the local
agricultural economy in general.
Except for rice production in Bukidnon, and
tomato production in Khamkalan, which
incurred lower costs, labor costs of the other
crops went up 2-45 percent.
ORGANIC PRODUCTS CAN
COMMAND HIGHER PRICES
BUT REQUIRE APPROPRIATE
MARKETING STRATEGIES
While products of Sustainable Agriculture
already command higher prices in most
places, rural consumers, who are generally
not fully aware of the benefits to be had
from consuming them in lieu of chemically
Table 46. Production Cost of Rice in Selected Sites Before and During the Project
* in local currencies
Production Cost* per Hectare
Project Site Before the Project During the Project % Difference
Parmalpur 17,294.08 21,285.42 23.08%
Banjarnegara 2,465,788.46 2,916,288.46 18.27%
Jogjakarta 237,342.11 267,526.32 12.7%
Bukidnon 12,090.51 10,028.53 –17.05%
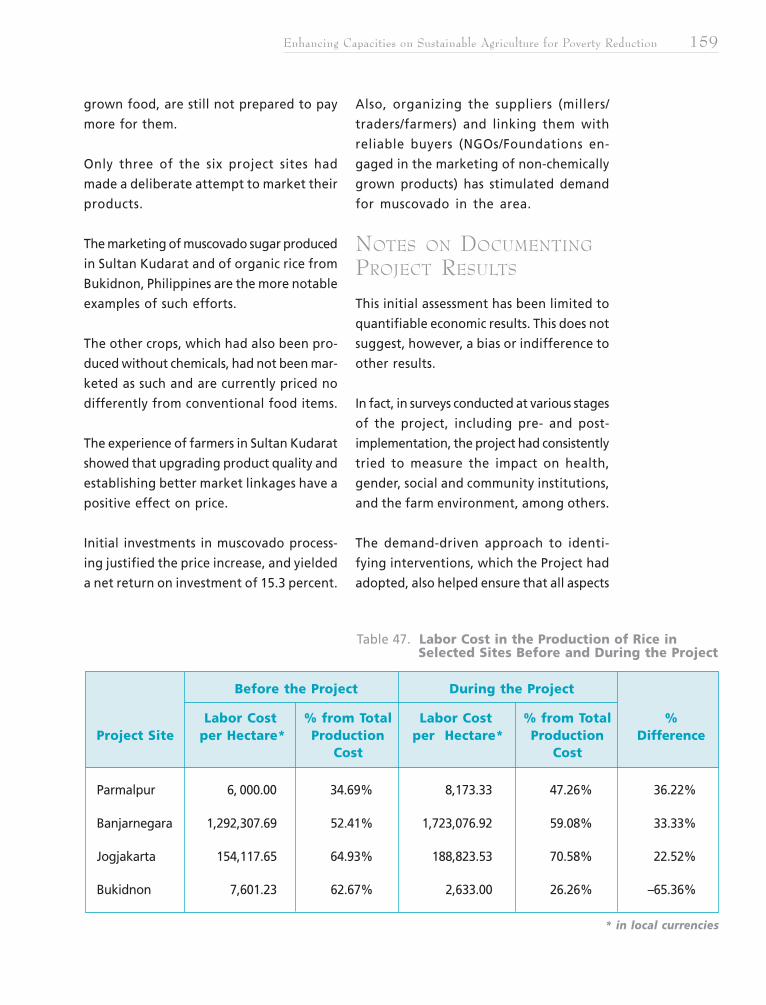
Enhancing Capacities on Sustainable Agriculture for Poverty Reduction 159
grown food, are still not prepared to pay
more for them.
Only three of the six project sites had
made a deliberate attempt to market their
products.
The marketing of muscovado sugar produced
in Sultan Kudarat and of organic rice from
Bukidnon, Philippines are the more notable
examples of such efforts.
The other crops, which had also been pro-
duced without chemicals, had not been mar-
keted as such and are currently priced no
differently from conventional food items.
The experience of farmers in Sultan Kudarat
showed that upgrading product quality and
establishing better market linkages have a
positive effect on price.
Initial investments in muscovado process-
ing justified the price increase, and yielded
a net return on investment of 15.3 percent.
Also, organizing the suppliers (millers/
traders/farmers) and linking them with
reliable buyers (NGOs/Foundations en-
gaged in the marketing of non-chemically
grown products) has stimulated demand
for muscovado in the area.
NOTES ON DOCUMENTING
PROJECT RESULTS
This initial assessment has been limited to
quantifiable economic results. This does not
suggest, however, a bias or indifference to
other results.
In fact, in surveys conducted at various stages
of the project, including pre- and post-
implementation, the project had consistently
tried to measure the impact on health,
gender, social and community institutions,
and the farm environment, among others.
The demand-driven approach to identi-
fying interventions, which the Project had
adopted, also helped ensure that all aspects
Table 47. Labor Cost in the Production of Rice in Selected Sites Before and During the Project
Before the Project During the Project
Labor Cost % from Total Labor Cost % from Total %Project Site per Hectare* Production per Hectare* Production Difference
Cost Cost
Parmalpur 6, 000.00 34.69% 8,173.33 47.26% 36.22%
Banjarnegara 1,292,307.69 52.41% 1,723,076.92 59.08% 33.33%
Jogjakarta 154,117.65 64.93% 188,823.53 70.58% 22.52%
Bukidnon 7,601.23 62.67% 2,633.00 26.26% –65.36%
* in local currencies
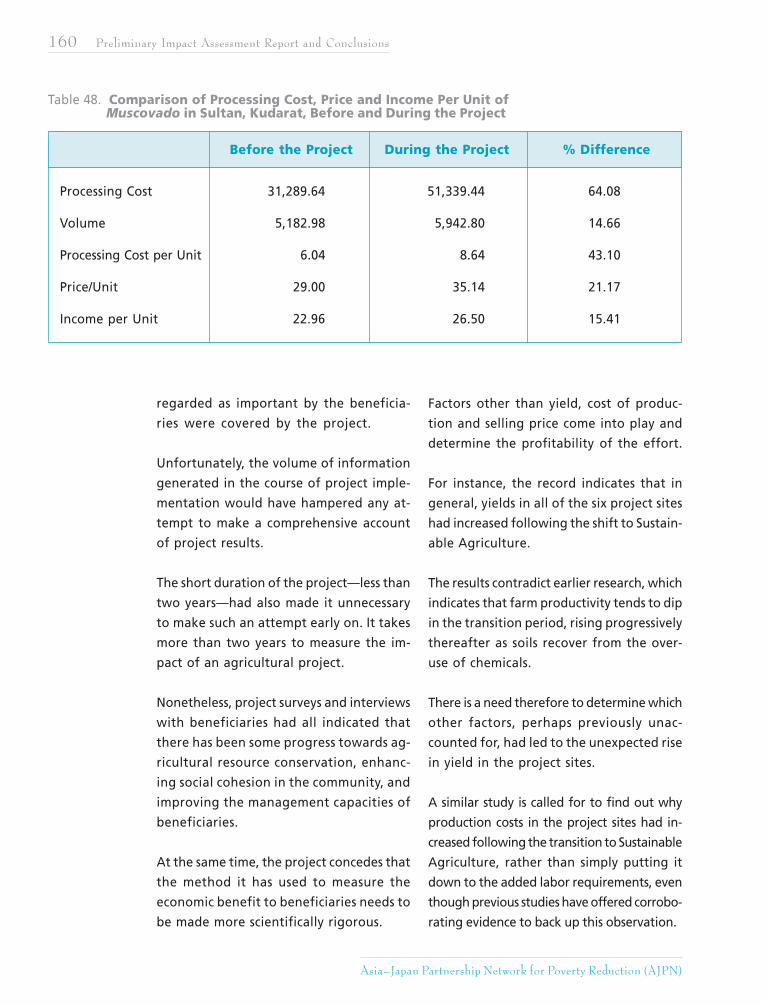
160 Preliminary Impact Assessment Report and Conclusions
Asia–Japan Partnership Network for Poverty Reduction (AJPN)
regarded as important by the beneficia-
ries were covered by the project.
Unfortunately, the volume of information
generated in the course of project imple-
mentation would have hampered any at-
tempt to make a comprehensive account
of project results.
The short duration of the project—less than
two years—had also made it unnecessary
to make such an attempt early on. It takes
more than two years to measure the im-
pact of an agricultural project.
Nonetheless, project surveys and interviews
with beneficiaries had all indicated that
there has been some progress towards ag-
ricultural resource conservation, enhanc-
ing social cohesion in the community, and
improving the management capacities of
beneficiaries.
At the same time, the project concedes that
the method it has used to measure the
economic benefit to beneficiaries needs to
be made more scientifically rigorous.
Factors other than yield, cost of produc-
tion and selling price come into play and
determine the profitability of the effort.
For instance, the record indicates that in
general, yields in all of the six project sites
had increased following the shift to Sustain-
able Agriculture.
The results contradict earlier research, which
indicates that farm productivity tends to dip
in the transition period, rising progressively
thereafter as soils recover from the over-
use of chemicals.
There is a need therefore to determine which
other factors, perhaps previously unac-
counted for, had led to the unexpected rise
in yield in the project sites.
A similar study is called for to find out why
production costs in the project sites had in-
creased following the transition to Sustainable
Agriculture, rather than simply putting it
down to the added labor requirements, even
though previous studies have offered corrobo-
rating evidence to back up this observation.
Table 48. Comparison of Processing Cost, Price and Income Per Unit of Muscovado in Sultan, Kudarat, Before and During the Project
Before the Project During the Project % Difference
Processing Cost 31,289.64 51,339.44 64.08
Volume 5,182.98 5,942.80 14.66
Processing Cost per Unit 6.04 8.64 43.10
Price/Unit 29.00 35.14 21.17
Income per Unit 22.96 26.50 15.41
Enhancing Capacities on Sustainable Agriculture for Poverty Reduction 161
Despite these limitations, the results lead
to one conclusion: it is viable for farmers
to shift to Sustainable Agriculture practice.
Yes, there will be some major adjustments
needed both in mindset and farming tech-
niques to effect such a shift.
But the effort will be worth it as Sus-
tainable Agriculture will not only even-
tually lead to higher yields and lower pro-
duction costs, it will also bring in long-
term benefits, such as environmental
protection and community collaboration,
that conventional agriculture will never
be able to do.
LESSONS AND CHALLENGES
SUSTAINABLE AGRICULTURE
AS A TOOL FOR POVERTY
REDUCTION
The project has demonstrated the po-
tential of Sustainable Agriculture for
raising farm productivity while keeping
inputs to a minimum.
While labor costs had increased in many of
the project sites, the case of Bukidnon, where
farmers had been engaged in sustainable
farming for some time, showed that labor
costs could eventually be reduced as well.
On the other hand, the initial increase in
labor requirements had proven to be ben-
eficial to the communities as it created jobs
for the many unemployed rural workers.
The premium prices for natural or organic
products had also contributed significantly
to increasing farm incomes.
But poverty constitutes not only material
want but other forms and levels of impov-
erishment as well—psycho-social, gender,
ecological among others.
Hence, while the project had given pri-
ority to the attainment of household
food security—over increasing aggregate
food supply, for instance—because it re-
gards food security in the home as in-
dispensable to poverty alleviation, it had
also sought to encourage farmers to make
their own decisions.
Conventional, or chemical, agriculture may
have raised farm productivity to impressive
levels, giving farmers more disposable in-
come in the process.
However, by prescribing a strict regimen for
things like which varieties to grow, how to
control pest infestation, among others,
conventional agriculture had also stripped
farmers of the right—and the need—to make
decisions for themselves.
This form of dependency has impoverished
farmers socially and psychologically.
Sustainable agriculture in general has the
potential to halt and reverse this pattern
of psycho-social impoverishment.
Aside from seeking to tailor the type of
crops and farming systems to the agro-
climatic conditions in the area, Sustain-
able Agriculture also takes into consid-
eration the socio-economic conditions of
the farmers.
162 Preliminary Impact Assessment Report and Conclusions
Asia–Japan Partnership Network for Poverty Reduction (AJPN)
Within the project, in particular, it was
emphasized that while yield or produc-
tivity is an important gauge of perfor-
mance, other indicators of performance
were also emphasized, such as resilience
to external shocks, access to markets, and
enhancement of technical capacity.
Farmers’ participation is central in all these
processes as it enhanced the farmers’ sense
of ownership of the project, and has im-
proved the chances of it being sustained
beyond the project life.
On the other hand, while Sustainable Ag-
riculture requires less external input, it re-
quires time to enhance farmers’ capacities.
It is knowledge intensive.
Investments would have to be made in train-
ing extension workers, in incorporating
Sustainable Agriculture in academic curricula
and in allocating budget for researches.
ENGAGING THE MARKET
The increasing demand for organic prod-
ucts favors the mainstreaming of Sustain-
able Agriculture.
However, engaging the market imposes strict
requirements on producers, specifically in
terms of volume, reliability of supply, con-
sistency in product quality, and packaging.
This presents a major challenge to small and
marginal farmers who cultivate small par-
cels and produce little surplus. They need
to consolidate their products and reduce
transaction costs to be able to compete in
the market.
A number of challenges and limitations
which have bedeviled other attempts to
market organic products had confounded
project efforts to build market linkages
as well.
Some of these are:
1. Lack of needed financing.As producer/farmers groups get ready
to market their products, they will need
financial assistance. Much of the cur-
rently available financing for agricul-
ture is earmarked for production.
Farmers looking to market their prod-
ucts would be focusing on product
processing and promotion, rather than
production.
2. Lack of clear and enforceable cer-tification standards.While there have been notable at-
tempts by governments to establish
formal certification standards and
systems, these have not been imple-
mented quickly or broadly enough. The
proliferation of products falsely labeled
as “organic” tends to crowd out new,
legitimate entrants into the organic
food business.
3. Lack of a marketing system tailoredto support Sustainable Agriculture.The infrastructure that supports the
trade in and marketing of agricultural
produce was and still is tailored to the
requirements of conventional, chemi-
cally grown products. A new system,
one which takes account of the unique
processing, storage, and even packag-
ing needs of organic producers, must
be established.
Enhancing Capacities on Sustainable Agriculture for Poverty Reduction 163
SHARING THE BENEFITS OF
SUSTAINABLE AGRICULTURE
In the 2005 UN Human Development Re-
port, it has been stressed that extreme
inequality is a break on progress towards
the Millennium Development Goals.
It argues that economic growth alone will
be insufficient to enable most countries to
achieve the goal of halving poverty by 2015.
Thus, equal emphasis should be given to
creating conditions under which the rural
poor can increase their share of benefits from
greater farm productivity.
One approach that had been initiated by
the project is to strengthen local develop-
ment planning, specifically through the for-
mulation of master plans for organic prod-
ucts that have significant potential in local
and export markets.
As many governments in Asia have started
to devolve agricultural functions to local gov-
ernment units (LGUs), this initiative provides
an opportunity for more participatory ag-
ricultural development and hopefully more
equitable sharing of the benefits.
Under such master plans, the LGU could fa-
cilitate the consolidation of organic prod-
ucts from small farmers by setting up a
common framework and program for par-
ticipation by the various stakeholders in the
locality.
These master plans can also be the basis for
formulating business plans which the private
sector can jointly implement.
Another approach being implemented by
other NGOs is the “industry approach”, which
consists of organizing and linking emerging
rural enterprises in the value chain of produc-
tion, post harvest processing and marketing.
Consolidating their products would help the
farmers attain economies of scale, while link-
ing their products in the value chain would
enhance their competitiveness in the market.
The key strategy in both approaches is to in-
crease farmers’ productivity and competitive-
ness while strengthening their bargaining abil-
ity to ensure that they get their rightful share.
Both approaches also promote better coor-
dination among participating stakeholders,
avoid duplication of efforts, and would
hopefully promote greater efficiency in
transactions.
As such, they result in greater competitiveness,
not only for individual stakeholders but also
for the sector or the community as a whole.
Just as importantly, these approaches en-
hance transparency and facilitate better in-
formation management. Thus, they help en-
sure that the benefits are fairly distributed
among the stakeholders.
CHALLENGES AND ACTION
POINTS
The project has identified the following
challenges to more widespread adoption of
Sustainable Agriculture:
1. There is a need to refine the principles
and methods of Sustainable Agricul-
164 Preliminary Impact Assessment Report and Conclusions
Asia–Japan Partnership Network for Poverty Reduction (AJPN)
ture according to a framework for
poverty alleviation.
2. Social and behavioral changes within
a community that has adopted Sustain-
able Agriculture must be documented.
Empirical measures of its impact on
rural households (e.g., whether more
of them are able to send their chil-
dren to school or to procure medical
care) must also be conducted to
strengthen the case for Sustainable
Agriculture as a poverty alleviating
strategy. Sustainable agriculture im-
pacts not on the farm environment but
on the whole community. It is, in fact,
a community’s life-support system.
3. Agricultural extension workers, as well
as NGOs, need to be “retooled” to
better promote the adoption and
practice of Sustainable Agriculture.
4. There is a need to develop a cur-
riculum for Sustainable Agriculture,
and to keep updating such with other
“knowledge products” as they are de-
veloped. A concerted effort must be
made to integrate this curriculum into
agricultural courses. Libraries should
be provided with more materials on
Sustainable Agriculture.
5. Approaches to scale up Sustainable
Agriculture operations must be ex-
plored. The example of how China had
been able to put millions of hectares
under organic rice production has
shown that scaling up Sustainable
Agriculture is not a matter of technol-
ogy, but of approach.
6. More resources must be mobilized in
support of Sustainable Agriculture re-
search. Development agencies and gov-
ernments must be persuaded to aug-
ment their investments in Sustainable
Agriculture.
Enhancing Capacities on Sustainable Agriculture for Poverty Reduction 165
REFERENCES
AJPN (2005). Narrative reports: Enhancing Capacities for Sustainable Agriculture
Towards Poverty Reduction. April 2004- March 2005; July 1- Sept.30, 2005; Oct.
1-Dec.31, 2005.
AJPN SA Grassroots Action Issue No. 19, August 22, 2005.
Arifin, B. 2004. Analisis ekonomi pertanian Indonesia in Indonesia language. Jakarta:
PT Kompas Media Nusantara.
Asia–Japan Partnership Network for Sustainable Agriculture (2005). Regional Re-
sources Development Plan: Enhancing capacities for Sustainable Agriculture
towards Poverty Reduction.
Badan Pusat Statistik (Central Bureau Statistic). (several years). Statistik Indonesia.
Jakarta: BPS.
Departement Pertanian (The Ministry of Agriculture). (several years). Statistik Pertanian
Indonesia. Jakarta: Departemen Pertanian.
Diola, Faina, AJPN Regional Resource Development Plan 2005.
“Ends without means”, The Economist, September 9, 2004.
FAO, IFAD, WFP (2005). High-level Dialogue on Financing for Development: Meet-
ing the Millennium Development Goals. New York.
Food and Agricultural Organization (FAO). (several years). Annual report. Rome:
FAO.
166 Preliminary Impact Assessment Report and Conclusions
Asia–Japan Partnership Network for Poverty Reduction (AJPN)
Forum WTO-Indonesia. 2000. Annual Report. Jakarta: Departemen Luar Negeri.
Human Development Report 2005. International cooperation at a crossroads: Aid,
trade and security in an unequal world. UNDP 2005.
IFAD, 2001. Rural Poverty Report 2001: The Challenge of Ending Rural Poverty.
IFAD: Rome, Italy.
Khomsan, A. 2004. Perlu kebijakan mikro yang memihak petani in Indonesia lan-
guage. Jakarta: Harian Kompas tanggal 16 Januari 2004.
PAN-AP (Pesticide Network-Asia Pacific). 2004. Perjalanan masyarakat 2004 untuk
kedaulatan pangan mengutamakan hak kita atas tanah dan pangan in Indo-
nesia language. Jakarta: PAN-AP Indonesia.
Sadewa, Y.S. 2003. Indonesia Perlu Mengoptimalkan AFTA in Indonesia language.
Jakarta: Harian kompas 27 Agustus 2003.
Siregar, M. 2001. Analisis kebijaksanaan perdagangan komoditas pangan in Indo-
nesia language. Bulletin Agro Ekonomi I (3) 2001: 12-17.
Statement from 59th Session High-Level Dialogue on Financing for Development:
Financing for Food Security, Agriculture and Rural Development by FAO, IFAD
and WFP; New York, June 2005.
“Sustainable Farm Practices Improve Third World Food Production,” posted on
January 24, 2006; URL: http://www.sciencedaily.com/releases/2006/01/
060123163315.htm.
UN Millennium Declaration.