lower snake river compensation plan chinook salmon fi sh hatchery evaluations—idaho
TRANSCRIPT

LOWER SNAKE RIVER COMPENSATION PLAN CHINOOK SALMON FISH HATCHERY
EVALUATIONS—IDAHO
Project Progress Report
Report Period October 1, 2004 to September 30, 2005
John Cassinelli Fisheries Research Biologist
David Lindley
Sr. Fisheries Technician
IDFG Report Number 08-15 August 2008
Lower Snake River Compensation Plan Chinook Salmon Fish Hatchery Evaluations—Idaho
Part 1: Chinook Salmon
2005 Annual Report October 1, 2004 to September 30, 2005
By John Cassinelli David Lindley
Idaho Department of Fish and Game 600 South Walnut Street
P.O. Box 25 Boise, ID 83707
To
U.S. Fish and Wildlife Service Lower Snake River Compensation Plan Office
1387 S. Vinnell Way, Suite 343 Boise, ID 83709
Cooperative Agreement 141107J007
IDFG Report Number 08-15 August 2008

TABLE OF CONTENTS Page
ABSTRACT................................................................................................................................... 1 INTRODUCTION .......................................................................................................................... 2
LSRCP Hatcheries Operated by IDFG ...................................................................................... 4 McCall Fish Hatchery .............................................................................................................. 4 Sawtooth Fish Hatchery .......................................................................................................... 4 Clearwater Fish Hatchery........................................................................................................ 5
Red River Satellite ............................................................................................................... 5 Crooked River Satellite ........................................................................................................5 Powell Satellite..................................................................................................................... 6
Hatchery Evaluation Component of LSRCP .............................................................................. 6 METHODS .................................................................................................................................... 9
Smolt Survival From Release To LGD....................................................................................... 9 Estimating Downstream Harvest (Ocean and Columbia River) ................................................. 9 Adult Returns to LGD................................................................................................................. 9 Estimating Harvest from Fisheries in Idaho ............................................................................. 10 Adult Age Classification ........................................................................................................... 10 Determination of Origin ............................................................................................................ 10 Brood Year Reconstruction, SARs, and Progeny-to-Parent Ratios ......................................... 11
RESULTS ................................................................................................................................... 11 Brood Year 2003 Juvenile Releases........................................................................................ 11 Migration Timing and Survival of Brood Year 2003 Juvenile Chinook Salmon........................ 13
Hatchery-Origin Yearling Smolts........................................................................................... 13 Hatchery-Origin Subyearling Parr and Presmolts ................................................................. 13 Naturally Produced Chinook Salmon .................................................................................... 16
2005 Adult Returns to LGD......................................................................................................16 2005 Adult Returns and Harvest Information by Hatchery Facility........................................... 18
McCall Fish Hatchery ............................................................................................................ 18 Adult Returns ..................................................................................................................... 18 Run Timing......................................................................................................................... 19 Age Structure ..................................................................................................................... 21 2000 Brood Year Reconstruction and SAR........................................................................ 23 Female Progeny-to-Parent ratio......................................................................................... 23
Sawtooth Fish Hatchery ........................................................................................................ 25 Adult Returns ..................................................................................................................... 25 Run Timing......................................................................................................................... 25 Age Structure ..................................................................................................................... 27 2000 Brood Year Reconstruction and SAR........................................................................ 29 Female Progeny-to-Parent Ratio ....................................................................................... 29
Clearwater Fish Hatchery...................................................................................................... 30 Adult Returns and Harvest ................................................................................................. 30
Powell Satellite Facility.......................................................................................................... 30 Adult Returns ..................................................................................................................... 30 Run Timing......................................................................................................................... 31 Age Structure ..................................................................................................................... 32 2000 Brood Year Reconstruction and SAR........................................................................ 33 Female Progeny-to-Parent Ratio ....................................................................................... 33
i

Table of Contents, continued. Page
South Fork Clearwater River Satellites (Red River and Crooked River)............................... 34
Adult Returns ..................................................................................................................... 34 Run Timing......................................................................................................................... 35 Age Structure ..................................................................................................................... 37 2000 Brood Year Run Reconstruction and SAR ................................................................ 38 Female Progeny-to-Parent Ratio ....................................................................................... 39
SUMMARY.................................................................................................................................. 40 ACKNOWLEDGMENTS ............................................................................................................. 42 LITERATURE CITED.................................................................................................................. 43
ii

LIST OF TABLES Page
Table 1. Adult spring and summer run Chinook salmon return goals for the LSRCP
program. ...................................................................................................................... 3
Table 2. Adult spring and summer run Chinook salmon return goals for LSRCP funded hatcheries located in Idaho and operated by IDFG. Return goals listed for satellite facilities are a subset of the overall hatchery return goal (in bold font). ......... 3
Table 3. Brood Year 2003 juvenile Chinook salmon released in 2004 (subyearling parr and presmolts) and 2005 (yearling smolts) from hatcheries located in Idaho. .......... 12
Table 4. Estimated survival, migration and arrival timing of brood year 2003 juvenile Chinook salmon released from fish hatcheries located in Idaho and from natural-origin juveniles PIT tagged in populations adjacent to the hatchery release sites. Probability of detection is based on output from the SURPH computer program and represents collection efficiency of the juvenile detection system at Lower Granite Dam. Survival data for natural-origin fish is from Dave Venditti (IDFG, personal communication). Interrogation data is from the PTAGIS database (www.ptagis.org). .......................................................... 14
Table 5. Hatchery- and natural-origin spring and summer Chinook salmon counted at Lower Granite Dam (LGD) in 2005. Spring Chinook salmon are defined as crossing LGD March 1 to June 17 and summer Chinook salmon as crossing June 18 to August 17. Data obtained from Fish Passage Center (http://www.fpc.org). .................................................................................................. 17
Table 6. Estimated harvest and escapement of hatchery-origin Chinook salmon in 2005. Recoveries are from fish released from McCall Fish Hatchery into the South Fork Salmon River (SFSR) above the adult weir and include fish from brood year 2000, 2001, and 2002. ............................................................................ 19
Table 7. Estimated age structure of hatchery-origin Chinook salmon that returned to South Fork Salmon River trap in 2005. Average length-at-age is based on fish recovered with CWTs. Fish lengths are in centimeters. SD = standard deviation. The “Number Represented” and 95% confidence interval are based on the Rmix analysis. ................................................................................................ 21
Table 8. Estimated age composition of natural-origin Chinook salmon that returned to the South Fork Salmon River trap in 2005. ............................................................... 23
Table 9. Number of females spawned and survival of resultant progeny from egg to release at the McCall Fish Hatchery for brood year 2000 fish released above the SFSR weir as yearling smolts. The “# of Females Spawned” does not include females whose eggs were culled and is an estimate based on average green egg to release survival. ..................................................................... 24
Table 10. Estimated escapement and harvest of brood year 2000 hatchery-origin Chinook salmon adults from McCall Fish Hatchery in 2003, 2004, and 2005. Numbers in parentheses represent the percentage of the total for each recovery type. Estimated harvest and strays are reported for the area downstream of LGD (Blw. LGD) and upstream of LGD (Abv. LGD) separately. ....... 24
Table 11. Estimated harvest and escapement of hatchery-origin Chinook salmon in 2005. Recoveries are from fish released from Sawtooth Fish Hatchery. .................. 25
iii
List of Tables, continued. Page
Table 12. Estimated age structure of hatchery-origin Chinook salmon that returned to
Sawtooth Fish Hatchery in 2005. Average length-at-age is based on fish recovered with CWTs. Fish lengths are in centimeters. SD = standard deviation. The “Number Represented” and associated confidence intervals are based on the Rmix and FiSAT II analysis................................................................... 27
Table 13. Estimated age composition of natural-origin Chinook salmon trapped at the Sawtooth Fish Hatchery weir in 2005. Lengths are in centimeters and measured as fork length............................................................................................ 29
Table 14. Number of females spawned and survival of resultant progeny from egg to release at the Sawtooth Fish Hatchery for brood year 2000. .................................... 29
Table 15. Estimated escapement and harvest of brood year 2000 hatchery-origin Chinook salmon adults from Sawtooth Fish Hatchery in 2003, 2004, and 2005. Numbers in parentheses represent the percentage of the total for the recovery type. Estimated harvest and strays are reported for the area downstream of LGD (Blw. LGD) and upstream of LGD (Abv. LGD) separately. ....... 30
Table 16. Estimated harvest and escapement of hatchery-origin Chinook salmon in 2005. Recoveries are from fish released from the Powell satellite facility................. 31
Table 17. Estimated age composition of hatchery-origin Chinook salmon that returned to the Powell and Crooked Fork traps in 2005. ......................................................... 33
Table 18. Number of females spawned and survival of resultant progeny from egg to release at the Powell satellite facility for brood year 2000. ....................................... 33
Table 19. Estimated escapement and harvest of brood year 2000 Chinook salmon from the Powell satellite facility in 2003, 2004, and 2005. Numbers in parentheses represent the percentage of the total for the recovery type. Estimated harvest and strays are reported for the area upstream of LGD (Abv. LGD). ......................... 34
Table 20. Estimated harvest and escapement of hatchery-origin Chinook salmon in 2005. Recoveries are from fish released from the Red and Crooked River satellite facilities. ....................................................................................................... 35
Table 21. Estimated age composition of hatchery-origin Chinook salmon that returned to Red and Crooked river satellite facilities in 2005. ................................................. 38
Table 22. Estimated age composition of natural-origin Chinook salmon trapped at the Red River and Crooked River satellite facilities in 2005. Lengths are in centimeters and measured as fork length. ................................................................ 38
Table 23. Number of females spawned and survival of resultant progeny from egg to release at the Red and Crooked River release sites for brood year 2000. ............... 39
Table 24. Estimated escapement and harvest of brood year 2000 Chinook salmon adults from the Red and Crooked river satellite facilities in 2003, 2004, and 2005. Numbers in parentheses represent the percentage of the total for that recovery type. Estimated harvest only includes the terminal fishery on the Clearwater and South Fork Clearwater rivers. .......................................................... 39
iv

v
LIST OF FIGURES Page
Figure 1. Locations of Chinook salmon hatcheries and trapping facilities in Idaho. Solid
circles represent adult trapping or hatchery locations. Circles with dot matrix represent locations where natural-origin Chinook salmon are PIT tagged in order to estimate survival to Lower Granite Dam. ....................................................... 8
Figure 2. Estimated survival to Lower Granite Dam (LGD) of hatchery- and natural-origin Chinook salmon tagged and released as yearling smolts, spring 2005. Release sites are ordered in increasing distance from LGD (see Table 4). Error bars represent two standard errors. ................................................................. 15
Figure 3. Relationship between estimated survival and distance from release site to Lower Granite Dam (LGD) for hatchery-origin Chinook salmon PIT tagged and released as yearling smolts, 2005. Error bars represent two standard errors. ........................................................................................................................ 15
Figure 4. Run timing of hatchery- and natural-origin Chinook salmon at the South Fork Salmon River Trap in 2005........................................................................................ 20
Figure 5. Length frequency and estimated age composition of natural-origin Chinook salmon trapped at the South Fork Salmon River Trap in 2005. Solid vertical bars represent length cutoffs between age classes. These cutoffs were determined after the number of fish in each age-class was determined in NORMSEP. ............................................................................................................... 22
Figure 6. Run timing of hatchery- and natural-origin Chinook salmon at Sawtooth Fish Hatchery in 2005. ...................................................................................................... 26
Figure 7. Length frequency and estimated age composition of natural-origin Chinook salmon trapped at the Sawtooth Fish Hatchery weir in 2005. Solid vertical bars represent length cutoffs between age classes. These cutoffs were determined after the number of fish in each age-class was determined in NORMSEP. ............................................................................................................... 28
Figure 8. Run timing of hatchery- and natural-origin Chinook salmon at the Powell satellite facility in 2005. ............................................................................................. 32
Figure 9. Run timing of hatchery- and natural-origin Chinook salmon at the Crooked River satellite facility in 2005. .................................................................................... 36
Figure 10. Run timing of hatchery- and natural- origin Chinook salmon at the Red River satellite facility in 2005. ............................................................................................. 37
ABSTRACT
This annual report summarizes BY2003 juvenile survival and 2005 adult return data for Chinook salmon at Lower Snake River Compensation Plan (LSRCP) hatcheries operated by Idaho Department of Fish and Game (IDFG).
Idaho-LSRCP hatcheries (McCall, Clearwater, and Sawtooth) released a combined
3,267,575 BY2003 Chinook salmon including 416,543 subyearling parr and presmolts in 2004 and 2,793,195 yearling smolts in 2005.
Representative groups of BY2003 hatchery-origin Chinook salmon juveniles were
tagged with passive integrated transponder (PIT) tags to estimate survival to Lower Granite Dam (LGD). Estimated survival rates ranged from 12.2% for presmolts released from Powell Pond to 83.6% for smolts released from Powell Pond.
In 2005, 35,100 adult and jack spring and summer Chinook salmon were counted at
LGD, which was 2.5 times less than the 2004 return of 86,501, and 1.7 times lower than the previous 10 year average (1995-2004) of 61,345. Of the total 2005 return, 25,238 were estimated to be hatchery-origin.
Contribution of adult Chinook salmon from individual LSRCP fish hatcheries operated by
IDFG include 5,154 for McCall stock released at Knox Bridge, 1,280 for Sawtooth stock released at Sawtooth Fish Hatchery, and 916 for the Clearwater Fish Hatchery satellite facilities (400 at Powell, 516 at Red and Crooked rivers). These numbers include the estimated number of fish harvested in the Pacific Ocean, the Columbia and Snake river basins, and those trapped at the hatchery weirs.
Smolt-to-adult return (SAR) rates for BY2000 LSRCP spring and summer Chinook
salmon released as yearling smolts (including the estimated harvest) ranged from 0.27% for the South Fork Clearwater to 1.0% for fish released from McCall Fish Hatchery.
Authors: John Cassinelli Fisheries Research Biologist David Lindley Sr. Fisheries Technician
1

INTRODUCTION
The U.S. Army Corps of Engineers (USACE) constructed four hydroelectric dams (Ice Harbor, Lower Monumental, Little Goose, and Lower Granite) on the lower Snake River between 1961 and 1975. Fishery managers and biologists expected the survival of downstream migrating smolts and upstream migrating adults to be reduced by dam construction and operation as well as by the alteration of the river ecosystem. A joint Coordination Act Report (CAR) written by the U.S. Fish and Wildlife Service (USFWS) and National Marine Fisheries Service (NMFS) in 1972 was submitted to the USACE describing the impacts of the four lower Snake River dams on both fish and wildlife. Based on that report, the USACE submitted a Special Report to Congress which was used to authorize the Lower Snake River Compensation Plan (LSRCP) through the Water Resources Development Act of 1976 (90 Stat. 2917). Intent of the LSRCP is to mitigate for the reduced survival of anadromous fish resulting from dam construction and operation. The primary compensation tool specified in the LSRCP is a hatchery mitigation program. In 1977, the USFWS was given budgeting and administrative responsibility for operation and maintenance funding of LSRCP fish hatchery programs through an interagency agreement among the USACE, NMFS, and the USFWS.
The LSRCP hatchery program specified the use of fish hatcheries to produce and
release enough juvenile anadromous salmonids to meet adult return goals that were established to offset the estimated mortality caused by the four lower Snake River dams. Original mortality estimates for spring and summer run Chinook salmon Oncorhynchus tshawytscha attributable to the four lower Snake River dams were derived by applying a 15% smolt mortality rate at each of the four projects (a total estimated loss of 48%) (U.S. Army Engineer District, 1975). That expected loss was multiplied by the estimated return of spring/summer Chinook salmon adults (122,200) to the Snake River in 1957 (pre-dam construction) resulting in a mitigation goal of 58,677 spring and summer run (50,677 spring run and 8,000 summer run) Chinook salmon above Lower Granite Dam (LGD) (LSRCP 1991, Table 1). Additionally, a return goal of 18,300 fall run Chinook salmon above LGD was also established using similar criteria, but those fish are not included in this report.
To achieve the established mitigation goals, LSRCP-funded hatcheries were constructed
in Idaho, Oregon, and Washington. Hatcheries located in Idaho include three operated by Idaho Department of Fish and Game (IDFG) and one operated by the USFWS. Facilities operated by IDFG include Clearwater, McCall, and Sawtooth fish hatcheries (with four associated satellite facilities) (Figure 1; Table 2). Facilities operated by USFWS include Dworshak National Fish Hatchery (DNFH) and the associated Kooskia satellite facility (Figure 1). Adult return goals for LSRCP hatcheries operated by IDFG account for 39,360 of the 58,677 return goal above LGD (Table 2). Hatchery capacity specifications for LSRCP facilities operated by IDFG were based on adult escapement goals (Table 2) and an average smolt-to-adult return (SAR) rate of 0.87% (U.S. Army Engineer District, 1975).
In addition to the LSRCP funded hatcheries located in Idaho, Idaho Power Company
(IPC) owns and maintains three additional Chinook salmon hatcheries that are operated by IDFG. Idaho Power Company’s Rapid River Hatchery rears spring Chinook salmon, Pahsimeroi Hatchery rears summer Chinook salmon, and Oxbow Hatchery rears fall Chinook salmon (Figure 1). Specific information pertaining to the DNFH and IPC hatcheries are summarized in separate reports.
2

Table 1. Adult spring and summer run Chinook salmon return goals for the LSRCP program.
Agency / River System Run Type Adult Return Goal
IDFG S.F. Salmon River Summer 8,000
Upper Salmon River Spring 19,445 Clearwater River Spring 11,915
39,360
USWFS Clearwater River Spring 9,135
9,135
ODFW Grande Ronde River Spring 5,820
Imnaha River Spring 3,210 9,030
WDFW Tucannon River Spring 1,152
1,152
TOTAL 58,677 Table 2. Adult spring and summer run Chinook salmon return goals for LSRCP funded
hatcheries located in Idaho and operated by IDFG. Return goals listed for satellite facilities are a subset of the overall hatchery return goal (in bold font).
Hatchery and Satellite First Year
of Operation Run Type Adult Return
Goal
McCall 1979 Summer 8,000
Sawtooth 1985 Spring 19,445 E.F. Salmon 1984 Spring 6,090
Clearwater 1990 Spring 11,915
Powell 1989 Spring 2,553 Red River 1986 Spring 2,553
Crooked River 1990 Spring 6,809
TOTAL 39,360
3

LSRCP Hatcheries Operated by IDFG
McCall Fish Hatchery
McCall Fish Hatchery was built in 1979 and is located in the city of McCall, Idaho on the North Fork of the Payette River approximately 0.16 km below the outlet of Payette Lake (Figure 1). The hatchery is the incubation and rearing facility for the South Fork Salmon River (SFSR) summer Chinook salmon program and has a rearing capacity for 1,100,000 smolts at 17 fish per pound. An adult trapping and spawning satellite facility is located on the upper SFSR near Warm Lake (Figure 1). The adult escapement goal for the SFSR is 8,000 adults above LGD.
The original broodstock for the SFSR program was composed of summer run adults
collected at Little Goose Dam from 1974 to 1978, from Lower Granite Dam (LGD) in 1979, and from LGD and the SFSR trap in 1980 (Kiefer et al. 1992). Adults collected between 1974 and 1980 were spawned at Rapid River or Dworshak National fish hatcheries. Resulting juveniles were released into the upper SFSR near the current location of the adult trap. Beginning in 1981, broodstock collection has come exclusively from adults captured at the adult trap site on the SFSR. From the inception of the SFSR program through BY1990, not all of the juvenile Chinook salmon released were marked with a fin clip. Therefore, an unknown proportion of the unmarked retuning adults through 1995 were hatchery-origin. Beginning with BY1991, all juvenile Chinook salmon released into the upper SFSR were marked with a fin clip, a visual implant tag, or tagged with coded wire, allowing the differentiation of hatchery and naturally produced adults.
Sawtooth Fish Hatchery
Sawtooth Fish Hatchery (SFH) was completed in 1985. The hatchery is located on the main stem Salmon River approximately 10 km upstream from the town of Stanley, Idaho (Figure 1). The hatchery consists of an adult weir, adult trap, spawning and incubation facilities, and rearing space for 2.3 million Chinook salmon smolts at 15 fish per pound. The original escapement goal for Sawtooth Fish Hatchery was 19,445 adult spring Chinook salmon above LGD from juvenile releases at Sawtooth Fish Hatchery, the East Fork Salmon River, and Valley Creek.
The history of the Chinook broodstock at Sawtooth is complex. In 1966, a rearing pond
was constructed at the current Sawtooth Fish Hatchery site and received fry releases from Hayden Creek and Rapid River fish hatcheries in Idaho and Marion Forks Fish Hatchery in Oregon (Bowles and Leitzinger 1991). During the 1970s, several releases from the Rapid River stock were made into the rearing pond. However, Bowles and Leitzinger (1991) note that adult returns from these releases were negligible. The original brood source for the Sawtooth Fish Hatchery program came from adults captured at a temporary weir operated from 1981-1984 at the site of the current hatchery location. It was estimated that at least 50% of the adults trapped in 1981 resulted from a hatchery smolt release (914,000) in 1979 that was comprised of Rapid River stock raised at the Mullen Fish Hatchery (Moore 1981). Also, an unknown proportion of adults trapped in 1982 consisted of age-5 adults from the same Rapid River smolt release. Beginning in 1983, all returning hatchery adults were Sawtooth Fish Hatchery stock. Eggs collected from adults trapped at the temporary weir were incubated and reared at the McCall Fish Hatchery from 1981-1983 and at Pahsimeroi Fish Hatchery in 1984 and released in the Upper Salmon at the current hatchery location. Brood Year 1985 was the first year that all adult
4
trapping, incubation, and rearing occurred at the Sawtooth Fish Hatchery. Through BY1990, not all of the juvenile Chinook salmon released were marked with a fin clip. Because of this, an unknown proportion of the unmarked retuning adults through 1995 were hatchery origin. Beginning with BY1991, all juvenile Chinook salmon released at or above the Sawtooth Fish Hatchery weir were fin clipped or coded-wire tagged (CWT) and the origin of the retuning adults could be distinguished from naturally produced adults.
The East Fork Salmon River adult trap is a satellite facility of SFH that began operation
in 1984. The trap is located approximately 29 km upstream of the mouth of the East Fork Salmon River (Figure 1). The escapement goal for the East Fork weir is 6,090 above LGD (Table 2). Eggs from adults that are trapped and spawned at the East Fork satellite are transferred to the Sawtooth Fish Hatchery for incubation and rearing. Adult collection and spawning occurred at the East Fork satellite from 1985-1993. However, due to low numbers of returning adults, all adults captured were released above the weir to spawn naturally from 1994-1997. Trapping operations for Chinook salmon were discontinued from 1998-2003 due to low numbers of returning adults. Trapping resumed in 2004 but all Chinook salmon trapped in 2004 and 2005 were released above the trap to spawn naturally.
Valley Creek, a tributary to the Salmon River just below the town of Stanley, was initially
slated to receive off-site releases of up to 300,000 smolts annually. However, due to lack of adult returns to Sawtooth Fish Hatchery, no juvenile releases have occurred in Valley Creek.
Clearwater Fish Hatchery
Clearwater Fish Hatchery (CFH) was constructed in 1992 and is located on the North Fork Clearwater River approximately one km above the mouth near the town of Orofino, Idaho. The original adult escapement goal for Clearwater Fish Hatchery was set at 11,915 adult spring Chinook salmon above LGD. Clearwater Fish Hatchery contains adult holding, spawning, incubating facilities, and rearing space for 1,500,000 Chinook smolts and 1,700,000 steelhead smolts. Three satellite facilities (Red River, Crooked River, and Powell) associated with Clearwater Fish Hatchery were constructed prior to Clearwater Fish Hatchery (Table 2; Figure 1). Incubation and initial rearing of all Chinook salmon juveniles released at the three satellite facilities occurs at Clearwater Fish Hatchery.
Red River Satellite—The facility is located 15 miles east of Elk City, Idaho on the Red
River, a tributary to the South Fork Clearwater River. The Red River satellite facility is located approximately 21 km upstream from the mouth of the Red River and approximately 183 km upstream from Clearwater Fish Hatchery. The mitigation goal for the Red River facility is 2,553 adult spring Chinook salmon above LGD. In 1976, a rearing pond and temporary weir were constructed at the site of the current satellite facility as part of the Columbia River Fisheries Development Program (Kiefer et al. 1992). In 1986, the satellite facility was updated and a permanent weir was installed near the rearing pond as part of the LSRCP program. Both fall presmolt and spring smolt releases have occurred at the Red River. All adult fish trapped at the Red River are temporarily held and then spawned at the Red River facility or transported to Clearwater Fish Hatchery for final holding and spawning.
Crooked River Satellite—An adult trap and juvenile rearing ponds were constructed on
Crooked River, a tributary to the South Fork Clearwater River, in 1989. The adult trap is located on Crooked River approximately 1 km upstream from the mouth. The juvenile rearing ponds are located approximately 16 km upstream of the adult trap. The Crooked River satellite facility is
5

located approximately 150 km upstream from the Clearwater Fish Hatchery. The mitigation goal for the Crooked River facility is 6,809 adult spring Chinook salmon above LGD. Both fall presmolt and spring smolt releases have occurred at Crooked River. There are no adult holding facilities at Crooked River so all adults retained for broodstock are transported to the Red River satellite facility. Initially, the Red River and Crooked River adults were kept separate and treated as two different stocks. However, in 1997 it was decided to treat the Red River and Crooked River adults as a single stock, and adults trapped from each of the facilities are combined into the same holding ponds and are referred to as the “South Fork” stock (McGhee and Patterson 1999). For this report, harvest and escapement estimates for the South Fork stock will represent the combined juvenile release and adult recovery data from Red River and Crooked River satellite facilities.
Powell Satellite—The Powell facility is located on the upper Lochsa River
approximately 200 km upstream from the Clearwater Fish Hatchery at the confluence of Crooked Fork and Colt Killed creeks (Figure 1). Both fall presmolt and spring smolt releases occur at the Powell facility and the mitigation goal is to return 2,553 adults above LGD. Construction of an adult trap, weir, holding ponds, and a juvenile rearing pond was completed in 1989 but adult trapping began in 1988. Originally, a floating weir that spanned the Lochsa River was used to guide fish into Walton Creek where another weir guided them into the trap box. The floating weir was operated from 1988 to 1992. High water events in 1992 caused extensive damage to weir panels and the floating weir has not been operated since. Since 1992, fish have no longer been guided to Walton Creek by a mechanical structure, but rather by attraction flow from the creek, which is a small tributary with no natural run of Chinook salmon and the water source for the Powell satellite facility. Adults retained for broodstock are spawned at the Powell facility and eggs are transferred to Clearwater Fish Hatchery for incubation and rearing.
Hatchery Evaluation Component of LSRCP
The LSRCP includes a Hatchery Evaluation Study (HES) component to monitor and evaluate the hatchery mitigation program. The primary goal of the HES is to work with individual hatcheries to help determine the best hatchery management practices that allow the hatcheries to meet LSRCP and IDFG anadromous fisheries goals. The objectives of the HES are: 1) to monitor and document the extent to which hatcheries meet their mitigation goals, and 2) to conduct small-scale manipulative studies involving modified or alternative hatchery practices that show potential for increasing adult returns and achieving LSRCP and IDFG goals. These small-scale studies may be printed and bound as independent reports.
In addition to monitoring production and productivity of the LSRCP hatcheries, some
production and productivity data collected from natural populations that are adjacent to the LSRCP hatchery programs are also reported. These data are typically collected by ongoing IDFG research programs (e.g., Idaho Supplementation Studies and Idaho Natural Production Monitoring & Evaluation programs).
The primary purpose of this report is to summarize activities at each of the LSRCP
funded hatcheries operated by IDFG and to estimate at what level each facility contributed to fisheries in the Pacific Ocean and Columbia River as well as to the adult return above LGD and back to the respective hatchery trapping facilities. This includes reporting adult returns to hatchery facilities and juvenile rearing and release information on a yearly basis. Additionally, life-stage specific survival during periods when fish are not directly associated with the hatcheries is reported to address overall survival from release to return. In each annual report, a
6

brood year is summarized or “closed out” by consolidating the juvenile rearing and release information and the adult returns from a given brood year. Because of the five-year generation length of Chinook salmon, there is a five-year lag associated with summarizing the productivity of a brood year. Hence, BY2000 is finalized in the current 2005 report while some preliminary data is reported for brood years 2001, 2002, and 2003. To avoid unnecessary duplication of data reporting, only the major components of data collected by hatchery staff are reported. Specific hatchery broodstock collection, spawning, incubation, and rearing summaries can be found in hatchery-specific brood year reports available from IDFG.
This report is organized into three major sections: 1) juvenile release and survival
information for BY2003 juveniles including parr or presmolts released in 2004 and yearling smolts released in 2005; 2) adult return information, by age class (BY2000-2002), collected in 2005 including the estimated number of spring and summer Chinook salmon harvested in the Pacific Ocean, Columbia and Snake river fisheries, the number that passed over LGD, and the number of adults that returned to each hatchery; and 3) productivity estimates of the adults that returned to each hatchery facility from BY2000 (e.g., brood year reconstruction and parent:progeny relationships).
7

Figure 1. Locations of Chinook salmon hatcheries and trapping facilities in Idaho. Solid circles
represent adult trapping or hatchery locations. Circles with dot matrix represent locations where natural-origin Chinook salmon are PIT tagged in order to estimate survival to Lower Granite Dam.
Hatchery
Clearwater Anadromous Fish Hatchery
DworshakNational Fish
Hatchery
Red River TrapCrooked River Trap
Kooskia NationalFish Hatchery
Rapid RiverFish Hatchery
McCall FishHatchery
Oxbow Trap
Powell Trap
Crooked Fork Cr.
Pahsimeroi FishHatchery
Sawtooth Fish
East Fork SalmonRiver Trap
South Fork Salmon River Trap
Clearwater River
Lochsa River
Selway River
South ForkClearwater River
Salmon River
South ForkSalmon River
Lemhi River
Pahsimeroi River
Middle ForkSalmon River
Colt Killed Cr.
Knox Br. Release
8

METHODS
Smolt Survival From Release To LGD
PIT-tagged Chinook salmon groups are released every year from LSRCP facilities and one of the roles of the PIT tags is to help evaluate migration timing and survival of hatchery-reared juveniles to LGD. We calculated survival estimates of hatchery-origin juvenile Chinook salmon from release to arrival at LGD using PIT tag release groups from the various hatchery facilities. We used the Survival Under Proportional Hazards (SURPH) computer program (Lady et al. 2001) that generates a point estimate of survival and 95% confidence intervals. The program uses the Cormack-Jolly-Seber model (Cormack 1964; Jolly 1965; Seber 1965) for single release and multiple recapture events, which accounts for differences in collection efficiency at the dams. For BY2003, PIT tag groups of Chinook salmon ranged in size from 300 fish at Crooked and Red rivers to 52,000 fish at McCall. In addition to reporting survival rates of hatchery-origin fish, survival rates for several groups of natural-origin Chinook salmon that are tagged from other ongoing research projects in Idaho are also reported for comparison. All PIT-tagged natural-origin fish were captured using rotary screw traps as they volitionally emigrated from the rearing areas. In order to make comparisons with the hatchery-origin parr, presmolt, and smolt releases, natural-origin fish were also classified as parr, presmolts, or smolts based on the date they were captured and tagged. Subyearlings trapped prior to September 1 are considered parr and those captured on or after September 1 are considered presmolts. Yearling smolts are captured between February and June of the following year.
To compare arrival timing at LGD among different release groups, we also report the
“arrival window” in which the middle 80% of PIT tag detections occurred. This interval provides a measure of when fish arrive at LGD and how “spread out” the major component of each release group of juveniles were as they passed LGD.
Estimating Downstream Harvest (Ocean and Columbia River)
In order to estimate the total production of the LSRCP hatchery facilities in Idaho, estimates of harvest from fisheries in the Pacific Ocean and Columbia River must also be evaluated. We generated harvest estimates by utilizing CWT harvest data retrieved from the Regional Mark Information System (RMIS) database that is maintained by the Pacific States Marine Fisheries Commission (PSMFC). Coded-wire tags recovered from harvested fish were expanded based on two criteria: 1) the estimated sample rate of the fishery, and 2) the proportion of the release group that was tagged with CWTs. These expanded values represent the total estimated harvest of each release group within each fishery.
Adult Returns to LGD
Adult Chinook salmon returns to LGD associated with this report are comprised of both spring and summer run components. Adult counting facilities operated by the Fish Passage Center (FPC) at Lower Snake and Columbia river hydroelectric projects categorize spring and summer runs based on the arrival timing at individual projects. At LGD, Chinook salmon arriving between March 1 and June 17 are classified as spring run while Chinook salmon arriving between June 18 and August 17 are classified as summer run. The FPC does not differentiate returning Chinook salmon by their respective origins (wild or hatchery) because some hatchery-origin Chinook salmon have no external mark, and a visual determination of origin is not possible. However, the U.S. v. Oregon Technical Advisory Committee (TAC) further breaks
9

down the adult escapement crossing LGD into hatchery- or wild-origin by using data collected at hatcheries and from fisheries. It should be noted that the TAC estimate does not include jacks. Adult Chinook salmon return data presented in this report is from both sources (FPC and TAC).
Estimating Harvest from Fisheries in Idaho
Chinook salmon sport fisheries in Idaho are variable and between 1979 and 1996 only occurred on the Little Salmon River, a terminal fishery for the Rapid River Fish Hatchery. From 1996 to 2005, more widespread sport fisheries occurred in the Salmon and Clearwater rivers. Estimates of harvest from these fisheries were calculated by IDFG regional staff and by IDFG staff funded through the LSRCP Harvest Monitoring Program (HMP) from data collected through a combination of angler check stations, roving creel, and voluntary drop-off check station boxes. When available, CWTs are used to aid in estimating the age composition of harvested fish. CWTs are also used in the mixed-stock fisheries to help determine the proportion of the harvest that each stock represents. An example of a mixed-stock fishery is the lower Salmon River, where anglers may encounter fish destined for the South Fork Salmon River, Rapid River, Pahsimeroi, or Sawtooth hatcheries.
Adult Age Classification
We determined the age composition of adults returning to individual LSRCP hatchery facilities by one of two methods, depending on the availability of known age information (e.g., CWTs, PIT tags, or other age-specific marks) recovered from returning adults. In cases where some known age information is available, the computer program Rmix was used. Rmix was developed by Du (2002) as an add-on program to the R (R-Development Core Team 2004) computing environment that utilized the original MIX program developed by Macdonald and Pitcher (1979). Rmix was designed to estimate the parameters of a mixture distribution with overlapping components, such as the overlapping length distributions associated with adult salmon returns composed of multiple age classes. Rmix utilizes the maximum likelihood estimation method. If known age information were lacking, then age composition was determined using length frequency histograms and the estimated mean length at age imputed into the NORMSEP feature in the FAO-ICLARM Stock Assessment Tools (FiSat) II software (FAO Computerized Information Series, 2005). This method applies the maximum likelihood concept to the separation of the normally distributed components of a length frequency sample and provides an estimated number of fish for each age class.
The age notations used throughout this report for retuning adults refer to the total age of
the fish (fresh- plus saltwater) and assume all juveniles migrate to the ocean as age 1+ smolts. Therefore, fish that spend one, two, or three years in the ocean are classified as three, four, and five-year-olds, respectively.
Determination of Origin
Chinook salmon that originate in a hatchery can carry one or more marks, depending on the program the fish is from. Chinook salmon bearing an external mark, typically an adipose or ventral fin clip, are classified as hatchery-origin. However, some hatchery-origin fish have no external mark but do have a CWT and are also classified as hatchery-origin. Hatchery-origin fish are referred to as either reserve/production fish or supplementation fish. The terms reserve and production are used in reference to a hatchery-origin Chinook salmon with an adipose fin clip (AD) that can be legally harvested in a mark selective fishery, while supplementation fish refers to Chinook salmon that are part of the Idaho Supplementation Study (ISS) or the Nez Perce
10

Tribal (NPT) hatchery program and are not intended to contribute to selective sport fisheries. Supplementation fish are typically marked with a right ventral (RV) or left ventral (LV) fin clip or with a CWT and no external mark. For a more detailed explanation of the ISS program, refer to Bowles and Leitzinger (1991).
Brood Year Reconstruction, SARs, and Progeny-to-Parent Ratios
In order to reconstruct a brood year of hatchery-origin Chinook salmon, adults that return from a given brood year over three return years are summarized. For example, the 2000 brood year includes age-3 fish that return in 2003, age-4 fish that return in 2004, and age-5 fish that return in 2005. These returns include fish recovered at hatchery weirs, in fisheries, and those recovered as strays, at trap sites, or during spawning ground surveys. For adult fish recovered in mixed-stock fisheries (Pacific Ocean and Columbia and Snake rivers), the total number of fish harvested from each age class is estimated based on the number of CWTs recovered from each age class expanded by both the sample rate of the fishery and the tagging rate. For fish recovered in terminal fisheries, the number of fish harvested in each age class is estimated based on the number of CWTs recovered from each age class expanded by the tagging rate. Then, the proportion of each age class (as determined from known-age CWTs) is applied to the total estimated harvest in that terminal fishery. If insufficient numbers of CWTs are recovered in the terminal fishery, length frequency data from fish sampled during the fishery will be used to estimate age-composition of the harvest.
Smolt-to-adult survival rates (SARs) were estimated by summing the total returns from a
given brood year (brood year reconstruction as described above) divided by the number of smolts released from the brood in question.
Female progeny-to-parent ratios were estimated by dividing the total number of female
returns from a brood year by the number of females that were spawned to create the brood in question. For example, BY2000 female progeny-to-parent ratio was calculated by dividing the number of age-4 and age-5 females that returned in 2004 and 2005, respectively, by the number of females that were spawned in 2000. A one-to-one ratio signifies the brood was at replacement or, simply stated, that each female spawned in 2000 produced one returning female adult. Two different female progeny-to-parent ratios are provided in this report. The first includes only the number of female-progeny that returned to the hatchery weir, and the second includes the estimated number of females harvested in addition to those returning to the weir. Harvest information includes Pacific Ocean, Columbia and Snake rivers, and terminal fisheries. The number of females harvested is estimated by applying the sex ratio of adults recovered at the hatchery weir to the estimated number of fish harvested in each fishery with the assumption that there is no gender bias either at the trap or in the fisheries.
RESULTS
Brood Year 2003 Juvenile Releases
From September 23, 2004 through April 1, 2005, a total of 3,487,575 BY2003 juvenile spring and summer Chinook salmon were released from three LSRCP hatcheries (Table 3). An additional 6,183,018 BY2003 juvenile spring and summer Chinook salmon were released in Idaho from IPC’s Rapid River and Pahsimeroi facilities and the USFWS’s Dworshak facilities (Table 3). Smolt releases occurred from March 14 through April 1, 2005 and subyearling parr were released from September 23 through September 26, 2004 (Table 3).
11

Table 3. Brood Year 2003 juvenile Chinook salmon released in 2004 (subyearling parr and presmolts) and 2005 (yearling smolts) from hatcheries located in Idaho.
Rearing Hatchery
Life Stage Release Date Release Location Marks Purposea
Number Released
Clearwater Parr 9/24 Powell Pond AD LSCRP 66,150 Parr 9/24 Powell Pond AD LSCRP 343,967 Parr 9/23 Crooked R. AD LSCRP 64,263 Smolt 3/29 Crooked R. Pond AD LSCRP 261,677 Smolt 3/29 Crooked R. Pond AD/CWT LSCRP 88,517 Smolt 3/29 Crooked R. Trap NO MARK LSCRP 350,193 Smolt 3/21 Red R. AD LSCRP 311,124 Smolt 3/21 Red R. AD/CWT LSCRP 90,238 Smolt 3/24 Walton Cr. AD LSRCP 314,612 Smolt 3/24 Walton Cr. AD/CWT LSRCP 89,305 Total 1,980,046
McCall Parr 9/23-9/24 Knox Bridge AD LSRCP 220,000 Smolt 3/14-3/16 Johnson Cr. CWT/VIE NPT 105,230 Smolt 3/18-3/21 Knox Bridge AD LSCRP 774,444 Smolt 3/18-3/21 Knox Bridge AD/CWT LSCRP 273,086 Total 1,372,760
Sawtooth Smolt 3/31 Sawtooth Weir LV LSCRP 134,769 Total 134,769
Pahsimeroi Smolt 3/22 Pahsimeroi R. AD/CWT IPC 109,118 Smolt 3/22 Pahsimeroi R. AD IPC 866,134 Total 975,252
Rapid River Presmolt 9/8-10/1 Selway R.* AD NPT 183,923 Smolt 3/15 Rapid R. AD IPC 2,652,229 Smolt 3/15 Rapid R. AD/CWT IPC 109,201 Smolt 3/11 Hazard Cr. AD IPC 200,000 Smolt 3/8 Hells Canyon Dam AD IPC 300,000 Total 3,445,353
Dworshaka Presmolt 9/21 Selway R. AD LSRCP 70,191 Smolt 3/31-4/1 N.F. Clearwater R. AD LSRCP 1,072,359 Total 1,142,413
Kooskiaa Smolt 3/30 Clearwater R. AD USFWS 620,000 Grand Total 9,670,593
* This is an offsite release and no adult trapping facilities exists to evaluate adult returns. a Data is from Burge et al. 2007.
12

13
Migration Timing and Survival of Brood Year 2003 Juvenile Chinook Salmon
Representative groups from all hatchery facilities were PIT tagged to evaluate migration timing and survival to LGD. These evaluation groups include fish released as subyearling parr and presmolts as well as yearling smolts.
Hatchery-Origin Yearling Smolts
The majority of PIT tagged juvenile Chinook salmon released as yearling smolts from Idaho fish hatcheries arrived at LGD from late April to mid-May (Table 4). The “80% arrival window” for yearling smolt releases averaged 14.5 days and ranged from 11 to 21 days (Table 4).
Survival estimates for yearling smolts from release to LGD averaged 59.8% and ranged
from 22.0% for the Sawtooth weir release to 83.6% for the Powell Pond release group (Table 4, Figure 2). Survival of hatchery-origin yearling smolts released in 2005 is inversely related (r2 = 0.84) with distance from the release sites to Lower Granite Dam (Figure 3). This relationship is typical of previous years (Leth et. al. 2004; Leth 2007).
Hatchery-Origin Subyearling Parr and Presmolts
There was only one presmolt release of hatchery origin Chinook salmon from BY2003 that contained PIT tags. The majority of individuals from this release arrived at LGD from mid-April through early May. The “80% arrival window” for the presmolt release was 30 days compared to 14.5 days for the yearling smolt releases (Table 4).
The estimated survival to LGD of hatchery-origin juveniles released as presmolts was
12.18%. This is a substantial decrease from the hatchery-origin smolt survival and is likely due to the overwinter mortality associated with fish released as subyearlings. Differential survival of subyearling and yearling hatchery-origin juveniles observed in 2005 is typical of previous years (Leth et al. 2004; Leth 2007; Leth and Lindley 2008).

Table 4. Estimated survival, migration and arrival timing of BY2003 juvenile Chinook salmon released from fish hatcheries located in Idaho and from natural-origin juveniles PIT tagged in populations adjacent to the hatchery release sites. Probability of detection is based on output from the SURPH computer program and represents collection efficiency of the juvenile detection system at Lower Granite Dam. Survival data for natural-origin fish is from Dave Venditti (IDFG, personal communication). Interrogation data is from the PTAGIS database (www.ptagis.org).
Rearing Hatchery
Life Stage Release Site Program*
Distance to LGD (Km)
Number PIT
Tagged
Number of Unique
Detections at LGD
Estimated Survival (%) to LGD
(95% CI) Probability
of Detection
Median Arrival Date
80% Arrival Window (# of Days)
Clearwater Presmolt Powell Pond LSRCP 321 707 66 12.18 (9.62-14.74) 0.7700 4/27 4/12 - 5/10 (30)
Presmolt Colt Killed Ck. Natural 341 380 89 30.0 (26.0-34.0) 0.7800 5/5 4/20 - 5/30 (41) Smolt Crooked R. (low) RR.(lower) LSRCP 266 147 69 67.6 (58.6-76.6) 0.6946 4/29 4/20 - 5/6 (17) Smolt Crooked R. Pond LSRCP 280 150 39 47.9 (37.8-57.8) 0.5435 5/2 4/27 - 5/17 (21) Smolt Powell Pond LSRCP 321 300 151 83.6 (77.1-90.1) 0.6021 4/28 4/21 - 5/2 (13) Smolt Red R. Pond LSRCP 299 300 113 67.6 (60.0-75.1) 0.5576 5/1 4/26 - 5/9 (14)
Smolt Colt Killed Ck. Natural 341 230 84 59.0 (51.0-67.0) 0.6200 5/11 4/30 - 6/7 (39) Smolt Crooked Fork Cr. Natural 323 285 86 49.0 (43.0-55.0) 0.6200 5/22 5/4 - 6/12 (40) Smolt Crooked River Natural 266 1,196 216 36.0 (32.0-40.0) 0.5100 6/8 5/11 - 6/19 (40) Smolt Red R. Natural 299 1,930 437 43.0 (39.0-47.0) 0.5300 6/8 5/22 - 6/19 (29) Smolt American R. Natural 272 1,231 524 70.0 (66.0-74.0) 0.6100 6/3 5/11-6/16 (37)
McCall Smolt S. Fork Salmon R. CSS 457 51,850 21,142 60.4 (59.9-60.9) 0.6756 5/6 4/29 - 5/12 (14) Sawtooth Smolt Sawtooth Weir LSRCP 747 500 79 21.97 (18.1-25.9) 0.7191 5/6 4/30 - 5/10 (11) Smolt Sawtooth Weir Natural 747 4,126 1,032 53.0 (51.0-55.0) 0.4700 5/21 5/8 - 6/4 (28) Pahsimeroi Smolt Pahsimeroi R. IPC 630 499 92 22.1 (18.1-26.1) 0.8358 4/27 4/20 - 5/3 (14) Rapid River Smolt Rapid River Hatchery IPC 283 51,926 26,573 73.6 (73.1-74.0) 0.6957 5/5 4/27 - 5/9 (13) Dworshak Smolt N.F. Clearwater R. LSRCP 116 51,817 25,466 83.19 (82.7-83.71) 0.5908 5/5 4/27 - 5/10 (14) Kooskia Smolt Clear Cr. LSRCP 176 723 341 70.14 (66.1-74.3) 0.6724 5/1 4/26 - 5/9 (14)
14
* Natural = refers to natural-origin fish and is used as a comparison to hatchery-origin fish in areas adjacent hatchery programs; Supp. = fish released as part of the Idaho
Supplementation Study; LSRCP = fish released as part of the LSRCP mitigation program; IPC = fish released as part of the Idaho Power Co. mitigation program.

0%
10%
20%
30%
40%
50%
60%
70%
80%
90%
100%
N.F C
learwater R
.
Clear
Cr.
Clear C
r.
Amer
ican R.
Crook
ed R
. Pon
d
Crook
ed R
.
Crook
ed R
.
Rap
id R
.
Red
R.
Red
R.
Powe
ll Po
nd
Crook
ed Fork Cr.
Colt K
illed Cr.
S. F
k. S
almon
R.
S. F
k. S
almon
R.
Pahs
imer
oi R
.
Upp
er Salmon
R.
Upp
er Salmon
R.
Release Site
Estim
ate
d S
urv
ival
Hatchery-Origin Natural-Origin
Figure 2. Estimated survival to Lower Granite Dam (LGD) of hatchery- and natural-origin Chinook salmon tagged and released as yearling smolts, spring 2005. Release sites are ordered in increasing distance from LGD (see Table 4). Error bars represent two standard errors.
R2 = 0.8395
0%
10%
20%
30%
40%
50%
60%
70%
80%
90%
100%
0 200 400 600 800
Distance from release to LDG (km)
Es
tim
ate
d S
urv
iva
l
Figure 3. Relationship between estimated survival and distance from release site to Lower Granite Dam (LGD) for hatchery-origin Chinook salmon PIT tagged and released as yearling smolts, 2005. Error bars represent two standard errors.
15

Naturally Produced Chinook Salmon
Naturally produced Chinook salmon were PIT tagged throughout the Salmon and Clearwater river subbasins as both subyearling parr and presmolts and yearling smolts (Table 4, Figure 2). Arrival timing to LGD of natural-origin juveniles that were tagged as yearling smolts was later and more protracted than the hatchery-origin smolts. The date at which 50% of the natural-origin juveniles arrived at LGD was four weeks later, on average, than the hatchery-origin smolts. The “80% arrival window” for natural-origin smolts ranged from 28 to 40 days and averaged 35.5 days compared to a range of 11 to 21 days and an average of 14.5 days for hatchery-origin smolts. Averaged over all release sites, the estimated survival rate for natural-origin yearling smolts was 51.7% (range: 36.0-70.0%) compared to 59.8% (range: 22.0-83.6%) for the hatchery-origin smolts.
2005 Adult Returns to LGD
During the 2005 adult migration, an estimated 35,100 combined hatchery- and natural-origin Chinook salmon crossed LGD between March 23 and August 17 of which 32,764 were adults and 2,336 were jacks. The 2005 return was 41% of the return in 2004 and 57% of the most recent 10-year average of 61,345 (Table 5).
16

Table 5. Hatchery- and natural-origin spring and summer Chinook salmon counted at Lower Granite Dam (LGD) in 2005. Spring Chinook salmon are defined as crossing LGD March 1 to June 17 and summer Chinook salmon as crossing June 18 to August 17. Data obtained from Fish Passage Center (http://www.fpc.org).
LGD Count Return Year
Spring Adult
Spring Jack
Spring Total
Summer Adult
Summer Jack
Summer Total
Spring and Summer Combined
2005 26,028 1,258 27,286 6,736 1,078 7,814 35,100 2004 70,742 4,482 75,224 8,767 2,510 11,277 86,501 2003 70,609 8,295 78,904 16,422 4,137 20,559 99,463 2002 75,025 2,089 77,114 22,159 1,953 24,112 101,226 2001 171,958 3,135 175,093 13,735 3,804 17,539 192,632 2000 33,822 10,318 44,140 3,939 3,756 7,695 51,835 1999 3,296 2,507 5,803 3,260 1,584 4,844 10,647 1998 9,854 109 9,963 4,355 328 4,683 14,646 1997 33,855 81 33,936 10,709 127 10,836 44,772 1996 4,207 1,639 5,846 2,607 944 3,551 9,397 1995 1,105 373 1,478 692 157 849 2,327 1994 3,120 43 3,163 795 73 868 4,031 1993 21,035 183 21,218 7,889 130 8,019 29,237 1992 21,391 533 21,924 3,014 298 3,312 25,236 1991 6,623 980 7,603 3,809 1,179 4,988 12,591 1990 17,315 244 17,559 5,093 128 5,221 22,780 1989 12,955 1,549 14,504 3,169 902 4,071 18,575 1988 29,495 924 30,419 6,145 362 6,507 36,926 1987 28,835 946 29,781 5,891 660 6,551 36,332 1986 31,576 1,307 32,883 6,154 1,255 7,409 40,292 1985 25,207 2,530 27,737 4,938 1,568 6,506 34,243 1984 6,511 1,410 7,921 5,429 1,815 7,244 15,165 1983 9,517 509 10,026 3,895 767 4,662 14,688 1982 12,367 379 12,746 4,210 318 4,528 17,274 1981 13,115 527 13,642 3,326 479 3,805 17,447 1980 5,461 1,298 6,759 2,688 759 3,447 10,206 1979 6,753 786 7,539 2,714 858 3,572 11,111 1995-2004 Ten Year Average 61,345
17

The estimated number of natural-origin adult Chinook salmon crossing LGD in 2005 from the TAC estimates was 9,862 fish. Therefore, the total adult hatchery escapement above LGD was estimated at 22,902, which is below the LSRCP escapement goal of 58,000 spring/summer Chinook salmon. It should also be noted that not all hatchery fish crossing LGD are from LSRCP funded hatcheries, but also include fish destined to return to IPC-funded hatcheries.
2005 Adult Returns and Harvest Information by Hatchery Facility
McCall Fish Hatchery
Adult Returns—Trapping of adult Chinook salmon at the South Fork Salmon River Trap began on June 10 and continued until September 15 when the weir was removed. The first Chinook salmon was captured on June 20 and the last was captured on September 15. During the 2005 trapping period, 3,214 Chinook salmon were captured including 2,960 (1,603 males and 1,357 females) hatchery- and 254 (137 males and 117 females) natural-origin fish (McPherson et al. 2006). The 2005 adult return was well below the 2004 total return of 5,594, and 1.5 times lower than the previous ten-year average (IDFG unpublished data).
During the 2005 adult migration, 39 CWTs were recovered from McCall hatchery
Chinook salmon from fisheries in the Pacific Ocean, Columbia River, Snake River below LGD, and from strays in Columbia and Snake river tributaries. Expansions for these tags resulted in a harvest estimate of 339 McCall Hatchery fish (Table 6). Estimated harvest from the terminal fishery that occurred on the South Fork Salmon River from June 17 to July 10 included 1,131 fish harvested from the sport fishery and 672 fish harvested from the tribal fisheries. During spawning ground surveys above the SFSR weir, IDFG research staff collected three adipose clipped Chinook salmon that had escaped above the weir. It is suspected that some hatchery-origin fish spawned below the SFSR weir, but data was not available to make that estimate. Total estimated harvest and escapement of McCall hatchery-origin Chinook salmon for 2005 was 5,154 (Table 6).
Of the 2,960 hatchery origin fish that were trapped at the South Fork Trap in 2005, 2,829
were adipose clipped production fish. These fish, combined with the 1,806 production fish from the fisheries and strays, create a total return of 4,766 production fish. This return was made up of fish from brood years 2000, 2001, and 2002 and release groups were PIT tagged at a ratio of 4.8 to 5.6%. Based on PIT tag detections of returning adults at LGD, expansions based on tagging rate indicate a return over the dam of 3,863 fish. This total is 903 fish fewer than the return based on rack returns, harvest, and strays, indicating some error in harvest estimates. This error could have been caused by a difference in survival between PIT and non-PIT-tagged fish, some shed PIT tags, some PIT tag malfunction, PIT tag detection problems, or a combination of all of the above.
18
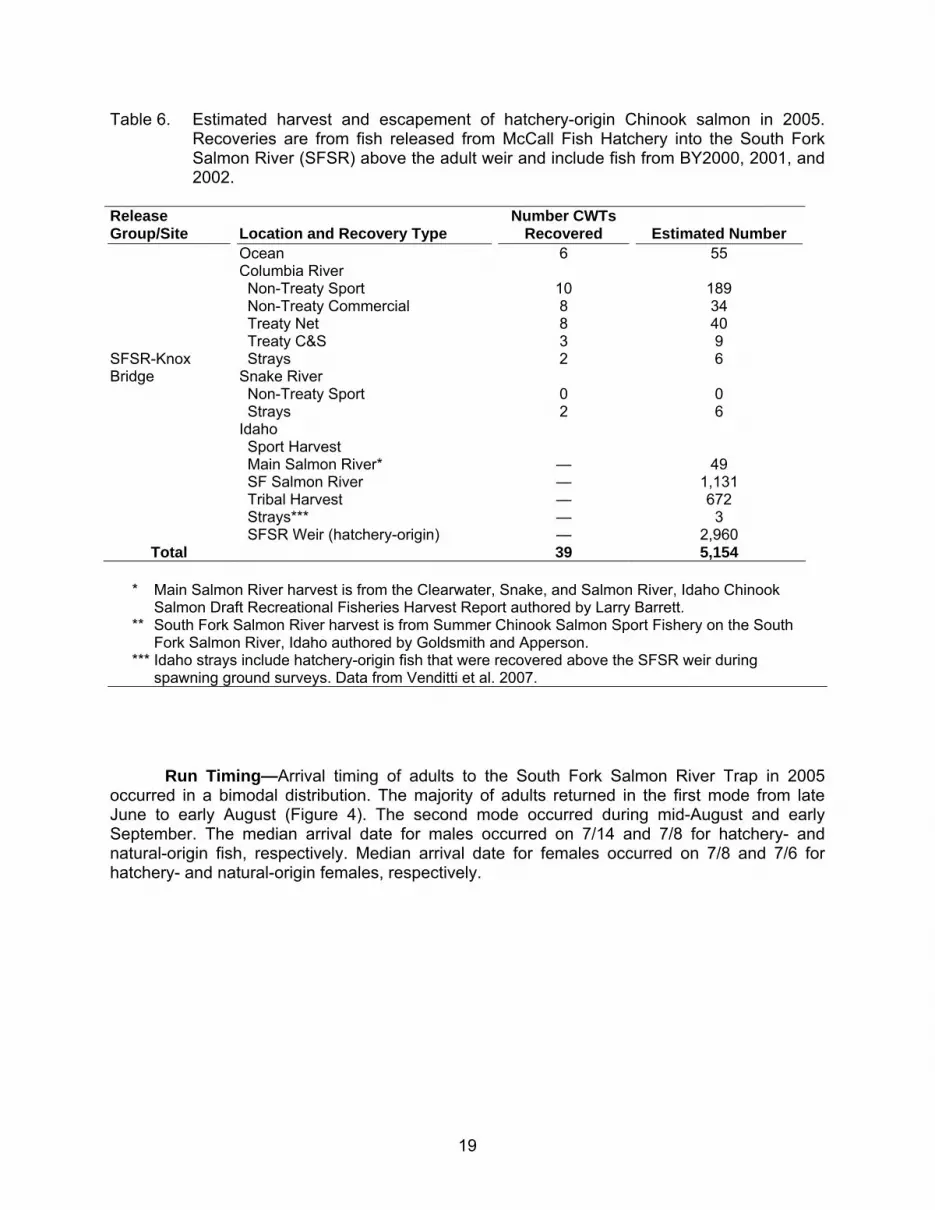
Table 6. Estimated harvest and escapement of hatchery-origin Chinook salmon in 2005. Recoveries are from fish released from McCall Fish Hatchery into the South Fork Salmon River (SFSR) above the adult weir and include fish from BY2000, 2001, and 2002.
Release Group/Site Location and Recovery Type
Number CWTs Recovered Estimated Number
Ocean 6 55 Columbia River Non-Treaty Sport 10 189 Non-Treaty Commercial 8 34 Treaty Net 8 40 Treaty C&S 3 9 SFSR-Knox Strays 2 6 Bridge Snake River Non-Treaty Sport 0 0 Strays 2 6 Idaho Sport Harvest Main Salmon River* — 49 SF Salmon River — 1,131 Tribal Harvest — 672 Strays*** — 3 SFSR Weir (hatchery-origin) — 2,960
Total 39 5,154
* Main Salmon River harvest is from the Clearwater, Snake, and Salmon River, Idaho Chinook Salmon Draft Recreational Fisheries Harvest Report authored by Larry Barrett.
** South Fork Salmon River harvest is from Summer Chinook Salmon Sport Fishery on the South Fork Salmon River, Idaho authored by Goldsmith and Apperson.
*** Idaho strays include hatchery-origin fish that were recovered above the SFSR weir during spawning ground surveys. Data from Venditti et al. 2007.
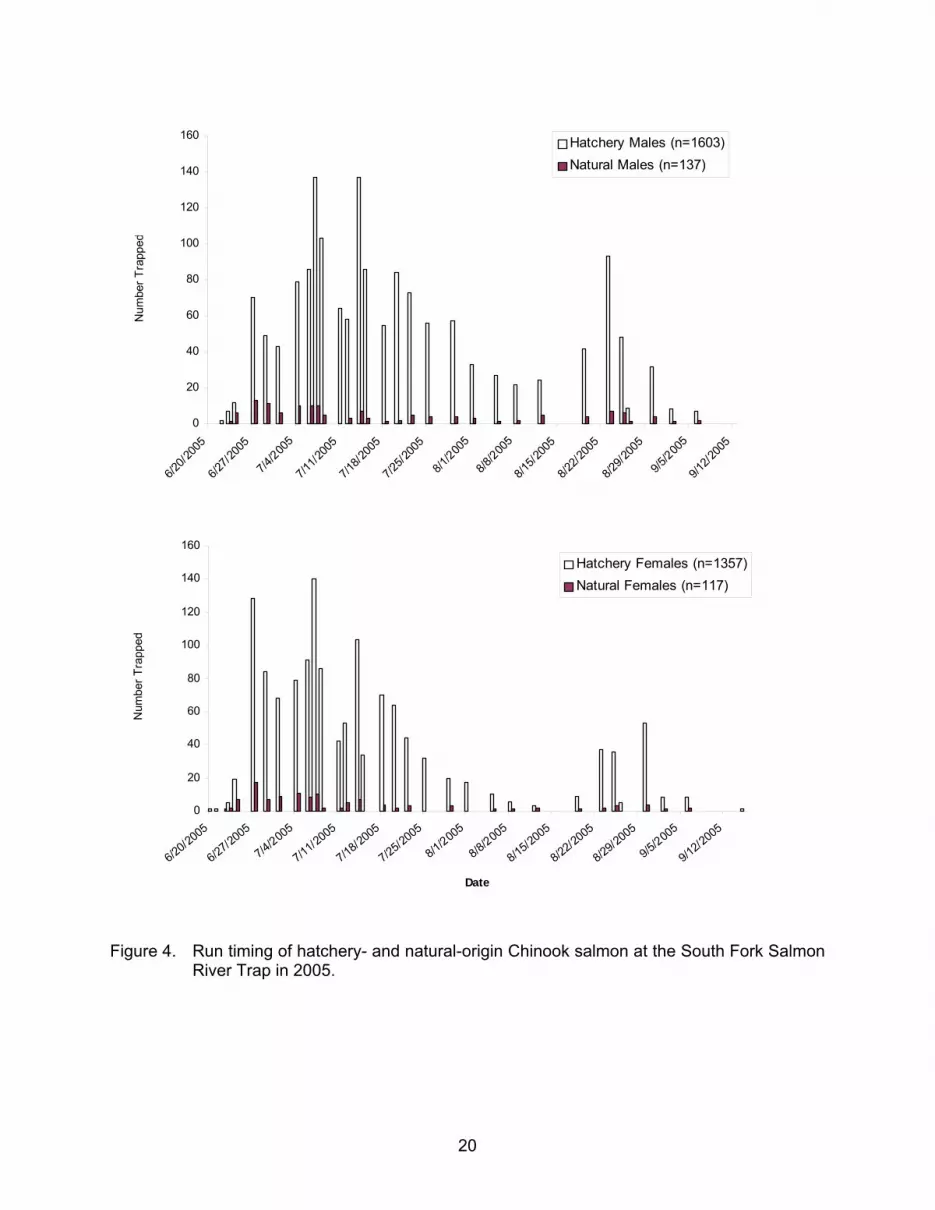
Run Timing—Arrival timing of adults to the South Fork Salmon River Trap in 2005
occurred in a bimodal distribution. The majority of adults returned in the first mode from late June to early August (Figure 4). The second mode occurred during mid-August and early September. The median arrival date for males occurred on 7/14 and 7/8 for hatchery- and natural-origin fish, respectively. Median arrival date for females occurred on 7/8 and 7/6 for hatchery- and natural-origin females, respectively.
19
0
20
40
60
80
100
120
140
160
6/20
/200
5
6/27
/200
5
7/4/
2005
7/11
/200
5
7/18
/200
5
7/25
/200
5
8/1/
2005
8/8/
2005
8/15
/200
5
8/22
/200
5
8/29
/200
5
9/5/
2005
9/12
/200
5
Num
ber
Tra
pped
Hatchery Males (n=1603)
Natural Males (n=137)
0
20
40
60
80
100
120
140
160
6/20/2005
6/27/2005
7/4/2005
7/11/2005
7/18/2005
7/25/2005
8/1/2005
8/8/2005
8/15/2005
8/22/2005
8/29/2005
9/5/2005
9/12/2005
Date
Num
ber
Tra
pped
Hatchery Females (n=1357)
Natural Females (n=117)
Figure 4. Run timing of hatchery- and natural-origin Chinook salmon at the South Fork Salmon
River Trap in 2005.
20
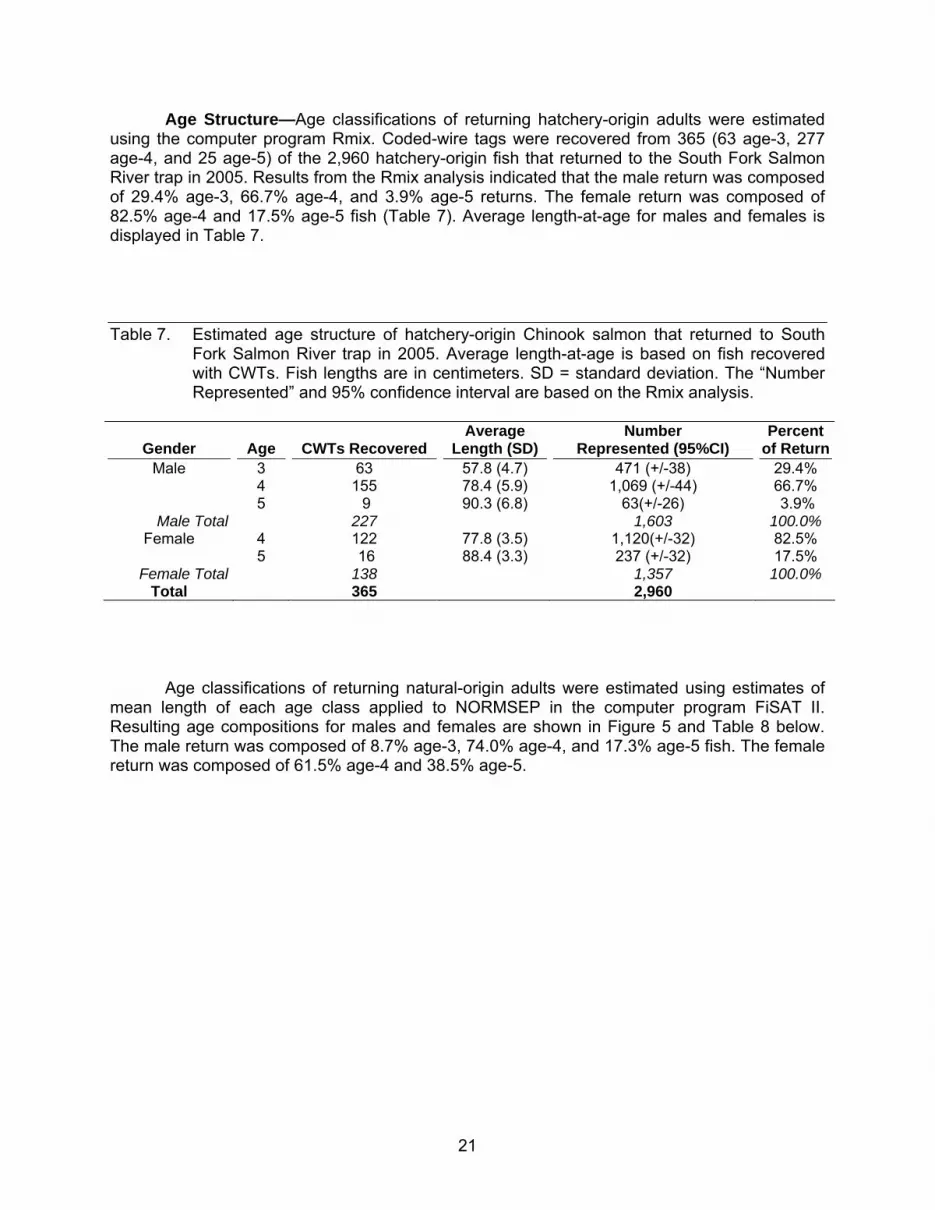
Age Structure—Age classifications of returning hatchery-origin adults were estimated using the computer program Rmix. Coded-wire tags were recovered from 365 (63 age-3, 277 age-4, and 25 age-5) of the 2,960 hatchery-origin fish that returned to the South Fork Salmon River trap in 2005. Results from the Rmix analysis indicated that the male return was composed of 29.4% age-3, 66.7% age-4, and 3.9% age-5 returns. The female return was composed of 82.5% age-4 and 17.5% age-5 fish (Table 7). Average length-at-age for males and females is displayed in Table 7.
Table 7. Estimated age structure of hatchery-origin Chinook salmon that returned to South Fork Salmon River trap in 2005. Average length-at-age is based on fish recovered with CWTs. Fish lengths are in centimeters. SD = standard deviation. The “Number Represented” and 95% confidence interval are based on the Rmix analysis.
Gender Age CWTs Recovered Average
Length (SD) Number
Represented (95%CI) Percent
of ReturnMale 3 63 57.8 (4.7) 471 (+/-38) 29.4%
4 155 78.4 (5.9) 1,069 (+/-44) 66.7% 5 9 90.3 (6.8) 63(+/-26) 3.9%
Male Total 227 1,603 100.0% Female 4 122 77.8 (3.5) 1,120(+/-32) 82.5%
5 16 88.4 (3.3) 237 (+/-32) 17.5% Female Total 138 1,357 100.0%
Total 365 2,960
Age classifications of returning natural-origin adults were estimated using estimates of mean length of each age class applied to NORMSEP in the computer program FiSAT II. Resulting age compositions for males and females are shown in Figure 5 and Table 8 below. The male return was composed of 8.7% age-3, 74.0% age-4, and 17.3% age-5 fish. The female return was composed of 61.5% age-4 and 38.5% age-5.
21

Males (n = 137)
0
3
6
9
12
15
48 51 55 59 63 66 69 72 75 78 81 84 87 90 93 96 102
Nu
mb
er C
aptu
red
Females (n = 117)
0
3
6
9
12
15
48 51 55 59 63 66 69 72 75 78 81 84 87 90 93 96 102
Fork Length (cm)
Nu
mb
er C
aptu
red
Age- 5 Age- 4 Age- 3
Age- 4 Age- 5
Figure 5. Length frequency and estimated age composition of natural-origin Chinook salmon trapped at the South Fork Salmon River Trap in 2005. Solid vertical bars represent length cutoffs between age classes. These cutoffs were determined after the number of fish in each age-class was determined in NORMSEP.
22

Table 8. Estimated age composition of natural-origin Chinook salmon that returned to the South Fork Salmon River trap in 2005.
Gender Age Length Criteria Number Trapped
Percent of Return
Male 3 <64 31 22.6% 4 64-88 88 64.2% 5 >88 18 13.1%
Male Total 137 Female 4 <83 45 38.5%
5 >83 72 61.5% Female Total 117
Total 254 2000 Brood Year Reconstruction and SAR—In 2005, the last of the progeny from the
2000 broodstock returned to the SFSR. In 2000, 303 females were spawned to create the release of 46,981 parr and 1,064,250 smolts in March of 2002 above the SRSR weir (Table 9). The parr were not marked and could not be differentiated from returning natural fish. Therefore, they were not used in calculating the SAR.
From the 1,064,250 smolt released above the SFSR weir, a total of 6,374 adults
returned back to the weir and an estimated 4,357 fish were harvested or recovered as strays above LGD in 2003, 2004, and 2005 (Table 10) resulting in an estimated 10,731 BY2000 fish over LGD. Additionally, an estimated 1,081 fish were harvested or recovered as strays below LGD resulting in 11,812 fish and an overall SAR of 1.11% for BY2000.
PIT tag expansions from unique detections at LGD for BY2000 fish returning in 2003,
2004, and 2005 resulted in an estimate of 9,159 fish over the dam. This estimate is 1,572 fish fewer than the estimate obtained from rack returns combined with harvest and estimated strays (10,731 fish). Assuming PIT tag detection at LGD is close to 100%, this discrepancy would indicate that for BY2000 South Fork Salmon River stock, fish with functioning PIT tags did not return to LGD at the same rate as non-PIT-tagged fish. This could be due to a higher rate of mortality in PIT-tagged fish, loss of PIT tags in a portion of tagged fish, or tag malfunction resulting in nondetection. There could also be some discrepancy in the harvest estimates that contributes to the variation in total estimates.
Female Progeny-to-Parent ratio—From the 303 females that were spawned in 2000, a
total of 2,417 females returned to the SFSR weir in 2004 and 2005 resulting in a female-progeny-to-parent ratio of 8.0 (Table 10). In addition to the 2,417 females recovered at the weir, an estimated 2,227 BY2000 females were harvested or recovered as strays in 2004 and 2005 resulting in 4,644 females and a female progeny-to-parent ratio of 15.3 indicating, that for BY2000, the SFSR Hatchery program was above replacement.
23
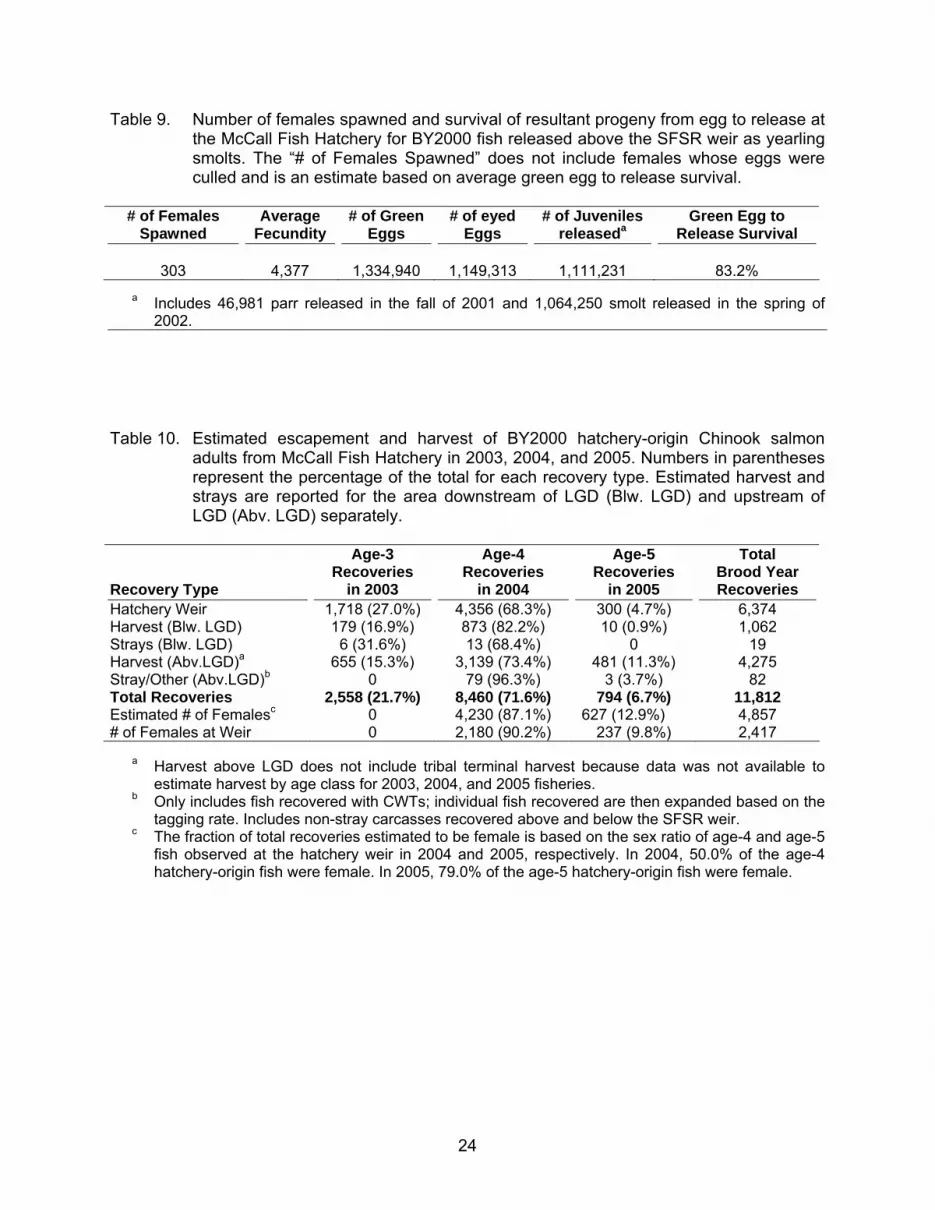
Table 9. Number of females spawned and survival of resultant progeny from egg to release at the McCall Fish Hatchery for BY2000 fish released above the SFSR weir as yearling smolts. The “# of Females Spawned” does not include females whose eggs were culled and is an estimate based on average green egg to release survival.
# of Females
Spawned Average
Fecundity # of Green
Eggs # of eyed
Eggs # of Juveniles
releaseda Green Egg to
Release Survival
303 4,377 1,334,940 1,149,313 1,111,231 83.2%
a Includes 46,981 parr released in the fall of 2001 and 1,064,250 smolt released in the spring of 2002.
Table 10. Estimated escapement and harvest of BY2000 hatchery-origin Chinook salmon
adults from McCall Fish Hatchery in 2003, 2004, and 2005. Numbers in parentheses represent the percentage of the total for each recovery type. Estimated harvest and strays are reported for the area downstream of LGD (Blw. LGD) and upstream of LGD (Abv. LGD) separately.
Recovery Type
Age-3 Recoveries
in 2003
Age-4 Recoveries
in 2004
Age-5 Recoveries
in 2005
Total Brood Year Recoveries
Hatchery Weir 1,718 (27.0%) 4,356 (68.3%) 300 (4.7%) 6,374 Harvest (Blw. LGD) 179 (16.9%) 873 (82.2%) 10 (0.9%) 1,062 Strays (Blw. LGD) 6 (31.6%) 13 (68.4%) 0 19 Harvest (Abv.LGD)a 655 (15.3%) 3,139 (73.4%) 481 (11.3%) 4,275 Stray/Other (Abv.LGD)b 0 79 (96.3%) 3 (3.7%) 82 Total Recoveries 2,558 (21.7%) 8,460 (71.6%) 794 (6.7%) 11,812 Estimated # of Femalesc 0 4,230 (87.1%) 627 (12.9%) 4,857 # of Females at Weir 0 2,180 (90.2%) 237 (9.8%) 2,417
a Harvest above LGD does not include tribal terminal harvest because data was not available to estimate harvest by age class for 2003, 2004, and 2005 fisheries.
b Only includes fish recovered with CWTs; individual fish recovered are then expanded based on the tagging rate. Includes non-stray carcasses recovered above and below the SFSR weir.
c The fraction of total recoveries estimated to be female is based on the sex ratio of age-4 and age-5 fish observed at the hatchery weir in 2004 and 2005, respectively. In 2004, 50.0% of the age-4 hatchery-origin fish were female. In 2005, 79.0% of the age-5 hatchery-origin fish were female.
24

Sawtooth Fish Hatchery
Adult Returns—Trapping of adult Chinook salmon at the Sawtooth Fish Hatchery began on June 5 and continued until September 19 when the weir panels were removed. The first Chinook salmon was captured on June 13 and the last was captured on September 15. During the 2005 trapping period, 1,561 Chinook salmon were captured including 1,280 (694 males, 586 females) hatchery- and 281 (156 males, 125 females) natural-origin fish (Snider et al. 2006). The 2005 adult return was less than the 2004 total return of 2,018 Chinook salmon and 2.46 times higher than the previous ten-year average (IDFG unpublished data).
There was no recovery of Sawtooth Fish Hatchery CWTs in 2005 from Pacific Ocean
and Columbia River fisheries or from stray fish (Table 11). No fisheries targeting Sawtooth Fish Hatchery stock occurred in Idaho in 2005 and none of the age-4 fish returning in 2005 that were ad-clipped contained CWTs. In total, an estimated 1,280 hatchery-origin fish contributed to the weir return in 2005 (Table 11).
Table 11. Estimated harvest and escapement of hatchery-origin Chinook salmon in 2005. Recoveries are from fish released from Sawtooth Fish Hatchery.
Release Group/Site
Location and Recovery Type
Number CWTs Recovered Estimated Number
Ocean 0 0 Sawtooth Weir Columbia River Non-Treaty Sport 0 0 Non-Treaty Commercial 0 0 Treaty Net 0 0 Treaty C&S 0 0 Strays 0 0 Idaho Harvest — 0 Strays — 0 Sawtooth Hatchery Weir — 1,280
Total 0 1,280 Run Timing—Arrival timing of adults to the Sawtooth Fish Hatchery facility in 2005 is
unimodal in distribution and did not show a second spike in returns in late August and early September that is typical of previous years. The majority of adults returned from mid-June to early August (Figure 6). The median arrival date for males occurred on 7/8 for both hatchery- and natural-origin adults. Likewise, the median arrival date for females occurred on 7/6 for both hatchery- and natural-origin adults.
25

0
5
10
15
20
25
30
35
40
45
50
6/13
/200
5
6/20
/200
5
6/27
/200
5
7/4/
2005
7/11
/200
5
7/18
/200
5
7/25
/200
5
8/1/
2005
8/8/
2005
8/15
/200
5
8/22
/200
5
8/29
/200
5
9/5/
2005
9/12
/200
5
Date
Num
ber
Tra
pped
Hatchery Females (n=586)
Natural Females (n=125)
0
5
10
15
20
25
30
35
40
45
50
6/13
/200
5
6/20
/200
5
6/27
/200
5
7/4/20
05
7/11
/200
5
7/18
/200
5
7/25
/200
5
8/1/200
5
8/8/20
05
8/15
/200
5
8/22
/200
5
8/29
/200
5
9/5/20
05
9/12
/200
5
Num
ber
Tra
pped
Hatchery Males (n =694)
Natural Males (n=156)
Figure 6. Run timing of hatchery- and natural-origin Chinook salmon at Sawtooth Fish
Hatchery in 2005.
26

Age Structure—Age classification of returning hatchery-origin adult females was estimated using the computer program Rmix while male age classification was estimated using NORMSEP in the computer program FiSAT II, because only one piece of wire was recovered for 5-year-old males. Coded-wire tags were recovered from 61 (5 age-3, 27 age-4, and 29 age-5) of the 1,280 hatchery-origin fish that returned to the Sawtooth Fish Hatchery in 2005.
Table 12. Estimated age structure of hatchery-origin Chinook salmon that returned to Sawtooth Fish Hatchery in 2005. Average length-at-age is based on fish recovered with CWTs. Fish lengths are in centimeters. SD = standard deviation. The “Number Represented” and associated confidence intervals are based on the Rmix and FiSAT II analysis.
Gender Age CWTs
Recovered Length Criteria Number Trapped
Percent of Return
Male 3 5 ≤62 144 20.7 4 16 63-85 539 77.7 5 1 ≥86 11 1.6
Male Total 22 694 100
Gender Age CWTs
Recovered Average Length
(SD)
Number Represented
(95% CI) Percent of
Return Female 4 11 76.3 (3.8) 538 (524-554) 92.0
5 28 90.6 (4.3) 47 (32-62) 8.0 Female Total 39 586 100
Total 61 1,280
Results from the NORMSEP analysis indicate that the male return was composed of 18.3% age-3, 73.2% age-4, and 8.5% age-5 returns. The Rmix analysis indicates the female return was composed of 92.0% age-4 and 8.0% age-5 fish (Table 12). No age-3 females with CWTs were recovered in 2005. Average length at age for males and females is displayed in Table 12.
27

Males (n = 156)
0
3
6
9
12
15
40 46 50 53 60 63 66 69 72 75 78 81 84 87 90 93 96 100
Nu
mb
er C
aptu
red
Females (n = 125)
0
3
6
9
12
15
40 46 50 53 60 63 66 69 72 75 78 81 84 87 90 93 96 100
Fork Length (cm)
Nu
mb
er C
aptu
red
Age- 3 Age- 4 Age- 5
Age- 4 Age- 5
Figure 7. Length frequency and estimated age composition of natural-origin Chinook salmon
trapped at the Sawtooth Fish Hatchery weir in 2005. Solid vertical bars represent length cutoffs between age classes. These cutoffs were determined after the number of fish in each age-class was determined in NORMSEP.
28

Age classification of returning natural-origin adults was estimated using estimates of mean length of each age class applied to NORMSEP in the computer program FiSAT II. Resulting age compositions for males and females are shown in Figure 7 and Table 13 below. Based on these length criteria, the male return was composed of 10.2% age-3, 73.7% age-4, and 16.1% age-5 fish. The female return was composed 47.2% age-4 and 52.8% age-5 adults.
Table 13. Estimated age composition of natural-origin Chinook salmon trapped at the Sawtooth Fish Hatchery weir in 2005. Lengths are in centimeters and measured as fork length.
Gender Age Length CriteriaNumber Trapped
Percent of Return
Male 3 <56 16 10.2 4 57-81 115 73.7 5 >81 25 16.1
Male Total 156 100 Female 4 <83 59 47.2
5 ≥83 66 52.8 Female Total 125 100
Total 281
2000 Brood Year Reconstruction and SAR—In 2005, the last of the progeny from the 2000 broodstock returned to the Sawtooth Fish Hatchery. In 2000, 88 females were spawned resulting in the release of 385,761 smolts in April of 2002 (Table 14). From this smolt release, 265,642 fish had CWTs and an adipose clip while 120,119 had only CWTs. From BY2000, 1,498 adults were produced that returned to the hatchery weir and an estimated six strays were recovered above Lower Granite (none were harvested in fisheries above LGD) resulting in an overall return of 1,504 adults and an SAR of 0.39% (Table 14 and Table 15).
Female Progeny-to-Parent Ratio—From the 88 females that were spawned in 2000, a
total of 564 females returned to the Sawtooth Fish Hatchery weir in 2004 and 2005 resulting in a female progeny-to-parent ratio of 6.4 (Table 15). In addition to the 564 females recovered at the weir, an estimated 44 BY2000 females were harvested or recovered as strays in 2004 and 2005 resulting in 608 females and a female progeny-to-parent ratio of 6.9 indicating, that for BY2000, the SFSR Hatchery program was above replacement.
Table 14. Number of females spawned and survival of resultant progeny from egg to release at the Sawtooth Fish Hatchery for BY2000.
# of Females
Spawned Average
Fecundity # of Green
Eggs # of eyed
Eggs # of Smolts
released Green Egg to Release
Survival
88 5,163 454,355 420,733 385,761 84.9%
29

Table 15. Estimated escapement and harvest of BY2000 hatchery-origin Chinook salmon adults from Sawtooth Fish Hatchery in 2003, 2004, and 2005. Numbers in parentheses represent the percentage of the total for the recovery type. Estimated harvest and strays are reported for the area downstream of LGD (Blw. LGD) and upstream of LGD (Abv. LGD) separately.
Recovery Type
Age-3 Recoveries
in 2003
Age-4 Recoveries
in 2004
Age-5 Recoveries
in 2005
Total Brood Year Recoveries
Hatchery Weir 483 (32.2%) 957 (63.9%) 58 (3.9%) 1,498 Harvest (Blw. LGD) 28 (27.5%) 74 (72.5%) 0 102 Strays (Blw. LGD) 6 (85.7%) 1 (14.3%) 0 7 Harvest (Abv.LGD) 0 0 0 0 Strays (Abv.LGD) 5 (83.3%) 1 (16.7%) 0 6 Total Recoveries 483 (30.7%) 1033 (65.6%) 58 (3.7%) 1,574 Estimated # of Femalesa 0 (0%) 578 (91.7%) 52 (8.3%) 630 # of Females at Weir 0 (0%) 536 (91.2%) 52 (8.8%) 588
a The fraction of total recoveries estimated to be female is based on the sex ratio of age-4 and age-5 fish observed at the hatchery weir in 2004 and 2005, respectively. In 2004, 56.0% of the age-4 hatchery-origin fish were female. In 2005, 96.6% of the age-5 hatchery-origin fish were female.
Clearwater Fish Hatchery
Adult Returns and Harvest—All three of the Clearwater Fish Hatchery satellite trapping facilities were operated in 2005 and adult returns to each facility are described below. Beginning in 1997, broodstocks for Red River and Crooked River satellites have been combined and are referred to as the “South Fork” stock. For this report, brood year reconstruction for the South Fork stock includes the combined juvenile releases, adult returns, and harvest estimates from both Red River and Crooked River satellites.
Chinook salmon sport fisheries were held on sections of the main stem Clearwater River
and its tributaries in 2005. These fisheries were targeting fish destined for Dworshak Fish Hatchery, Kooskia Fish Hatchery, and the three satellite facilities of Clearwater Fish Hatchery.
Powell Satellite Facility
Adult Returns—Trapping of adult Chinook salmon at the Powell Satellite facility began on May 27 and continued until September 9 when the trap was taken out of operation. The first Chinook salmon was captured on June 17 and the last was captured on September 4. During the 2005 trapping period, 161 (161 hatchery-origin, and zero natural-origin) Chinook salmon were captured at the Powell satellite facility. Additionally, 48 hatchery-origin and 32 natural-origin Chinook salmon were captured at a temporary weir on Crooked Fork Creek. This trap is operated by IDFG staff associated with the ISS study to monitor the escapement of natural-origin Chinook salmon in Crooked Fork Creek and to intercept hatchery-origin strays. Hatchery-origin fish captured at this trap are considered strays from the Powell release site and, in 2005, were transferred to the Powell holding ponds. The combined total of hatchery-origin fish captured at both traps was 209 fish.
30

Chinook salmon returning to the Powell facility in 2005 are from groups released from
brood years 2000, 2001 and 2002. None of the adipose clipped fish released from these three brood years were tagged with coded wire and, therefore, no estimates of harvest from the Pacific Ocean or Columbia River are made. Harvest evaluation staff from IDFG estimated that 184 Chinook salmon destined for the Powell facility were harvested in the Clearwater and Lochsa rivers (IDFG unpublished data, Table 16). Including the harvest estimate, 400 Powell fish were accounted for in the 2005 return (Table 16).
Table 16. Estimated harvest and escapement of hatchery-origin Chinook salmon in 2005. Recoveries are from fish released from the Powell satellite facility.
Release Group/Site
Location and Recovery Type Estimated Number
Powell Satellite Idaho Harvest 184 Strays* 7 Powell Satellite Trap** 209
Total 400 * Strays include hatchery-origin fish that were recovered above the Crooked Fork weir during
spawning ground surveys. Data from Venditti et al. 2007. ** Includes hatchery-origin fish captured at the Crooked Fork Creek weir.
Run Timing—Arrival timing of adults to the Powell trap in 2005 is unimodal in distribution. The majority of adults returned in June and July and lower numbers of adults continued to consistently return through mid-September (Figure 13). The median arrival date for hatchery-origin and natural-origin adults occurred on 7/8 and 7/7, respectively.
31
0
3
6
9
12
15
6/6/2
005
6/13
/200
5
6/20
/200
5
6/27
/200
5
7/4/2
005
7/11
/200
5
7/18
/200
5
7/25
/200
5
8/1/2
005
8/8/2
005
8/15
/200
5
8/22
/200
5
8/29
/200
5
9/5/2
005
9/12
/200
5
Nu
mb
er
Tra
pp
ed
Hatchery Origin Adults (n= 157)
Natural Origin Adults (n=7)
Figure 8. Run timing of hatchery- and natural-origin Chinook salmon at the Powell satellite
facility in 2005. Age Structure—Age classification of returning hatchery-origin adults was estimated
from the length frequency data of fish recovered at the Powell trap using NORMSEP in the FiSAT II program. Based on length frequency data, the 2005 male return was composed of 22% age-3, 54% age-4, and 24% age-5 hatchery-origin fish and the female return was composed of 83% age-4 and 17% age-5 hatchery-origin fish (Table 17).
32
Table 17. Estimated age composition of hatchery-origin Chinook salmon that returned to the Powell and Crooked Fork traps in 2005.
Gender Age Length Criteria (cm) Number of Fish Percent
of Return Male 3 <61 27 22.0%
4 61-84 67 54.5% 5 >84 29 23.5% Male Total 123 100.0%
Female 4 ≤82 71 82.5% 5 >82 15 17.5%
Female Total 86 100.0% Total 209
2000 Brood Year Reconstruction and SAR—For the BY2000 releases at Powell, no
adipose clipped fish were tagged with CWTs; therefore, no estimate of harvest was generated for the mixed stock fisheries that occurred in the Pacific Ocean and Columbia and Snake rivers in 2003, 2004, and 2005. However, estimates of harvest are included for the terminal fisheries that occurred in the Clearwater and Lochsa rivers. In 2005, the last of the progeny from the 2000 broodstock returned to the Powell satellite facility. In the fall of 2001 and the spring of 2002, a total of 519,070 parr and 349,890 smolts, respectively, were released from the Powell facility (Table 18). From the 868,960 fish released, 1,623 adults returned to the hatchery weir and 833 contributed to the harvest, resulting in an overall adult return of 2,456 and an SAR of 0.28%. However, it should be noted that almost 60% of the release were parr and their survival compared to yearling smolt releases is very low. The SAR, not including the parr, is 0.70%.
Female Progeny-to-Parent Ratio—From the 259 females that were spawned in 2000
(Table 18), a total of 1,242 females returned to the Powell satellite facility or were harvested in 2004 and 2005 resulting in a female progeny-to-parent ratio of 4.8 indicating, that for BY2000, the Powell stock was above replacement (Table 19).
Table 18. Number of females spawned and survival of resultant progeny from egg to release at the Powell satellite facility for BY2000.
# of Females
Spawned Average
Fecundity # of Green
Eggs # of eyed
Eggs # of Juveniles
Releaseda Green Egg to
Release Survival
259 4,006 1,036,945 914,695 868,960 83.8%
a Includes 519,070 parr released in the fall of 2001 and 349,890 smolt released in the spring of 2002 at the Powell Satellite Facility.
33

Table 19. Estimated escapement and harvest of BY2000 Chinook salmon from the Powell satellite facility in 2003, 2004, and 2005. Numbers in parentheses represent the percentage of the total for the recovery type. Estimated harvest and strays are reported for the area upstream of LGD (Abv. LGD).
Recovery Type
Age-3 Recoveries
in 2003
Age-4 Recoveries
in 2004
Age-5 Recoveries
in 2005
Total Brood Year Recoveries
Hatchery Weira 116 (7.1%) 1,463 (90.1%) 44 (2.8%) 1,623 Harvest (Abv.LGD)b 7 (0.8%) 793 (95.2%) 33 (4.0%) 833 Strays (Abv.LGD) 0 0 0 0 Total Recoveries 123 (5.0%) 2,256 (91.9%) 77 (3.1%) 2,456 Estimated # of Femalesc 0 (0%) 1,216 (97.9%) 26 (`2.1%) 1,242 # of Females at Weir 0 (0%) 788 (98.1%) 15 (1.9%) 803
a Age composition at the hatchery weir in 2003 and 2004 is from Leth 2007 and Leth and Lindley
2008. b Idaho harvest data is from Barrett 2003, 2004, 2005 IDFG draft harvest reports. c The fraction of total recoveries estimated to be female is based on the sex ratio of age-4 and age-5
fish observed at the hatchery weir in 2004 and 2005 respectively. In 2004, 53.9% of the age-4 hatchery-origin fish were female. In 2005, 34.1% of the age-5 hatchery-origin fish were female.
South Fork Clearwater River Satellites (Red River and Crooked River)
Adult Returns—Trapping of adult Chinook salmon at the Crooked River satellite began on March 14 and continued until September 14. During the 2005 trapping period, 166 Chinook salmon were trapped at Crooked River including 140 hatchery-origin and 26 (17 males, 8 females and 1 unknown sex) natural-origin fish. Trapping at Red River began on March 14 and continued until September 14. During the 2005 trapping period, 155 Chinook salmon were trapped including 140 hatchery-origin and 13 (7 males, 5 females and 1 unknown sex) natural origin fish. All ponded fish from the Red and Crooked river traps were combined at the Red River adult holding facility.
Chinook salmon returning to the Red and Crooked river traps in 2005 were from groups
released from brood years 2000, 2001, and 2002. None of the adipose clipped fish released from these three brood years were tagged with CWTs and, therefore, no estimates of harvest from the Pacific Ocean or Columbia River is made. Using previous year’s methods incorporated by harvest evaluation staff from IDFG to estimate harvest of hatchery-origin Chinook salmon destined for the Red and Crooked river traps harvested in the Clearwater and South Fork Clearwater rivers, harvest was estimated at 236 fish for 2005 (Table 20). In all, 516 hatchery-origin Chinook salmon destined for the Red and Crooked river traps were accounted for in 2005 (Table 20).
34

Table 20. Estimated harvest and escapement of hatchery-origin Chinook salmon in 2005. Recoveries are from fish released from the Red and Crooked River satellite facilities.
Release Group/Site Location and Recovery Type Estimated Number Red and Crooked river satellites Idaho Harvest 236 Strays 0 Red and Crooked River Traps 280
Total 516 Run Timing—Adults returning to the Crooked River trap arrived primarily in a single
mode during June and July with a much smaller second mode towards the end of August (Figure 10).The median arrival date for hatchery- and natural-origin adults occurred on 6/25 and 6/23, respectively.
Adults returning to the Red River trap arrived primarily in a single mode during late June
and early July with a few more fish arriving towards the end of August and the first part of September (Figure 11). The median arrival date for hatchery- and natural-origin adults occurred on 6/23 and 6/24, respectively.
35

0
5
10
15
20
25
6/8/2
005
6/15
/200
5
6/22
/200
5
6/29
/200
5
7/6/2
005
7/13
/200
5
7/20
/200
5
7/27
/200
5
8/3/2
005
8/10
/200
5
8/17
/200
5
8/24
/200
5
8/31
/200
5
Nu
mb
er
Tra
pp
ed
Hatchery Adults
Natural Adults
Figure 9. Run timing of hatchery- and natural-origin Chinook salmon at the Crooked River
satellite facility in 2005.
36

0
5
10
15
20
25
6/7/2
005
6/14
/200
5
6/21
/200
5
6/28
/200
5
7/5/2
005
7/12
/200
5
7/19
/200
5
7/26
/200
5
8/2/2
005
8/9/2
005
8/16
/200
5
8/23
/200
5
8/30
/200
5
9/6/2
005
Nu
mb
er
Tra
pp
ed
Hatchery Origin Adults (n=140)
Natural Origin Adults (n=13)
Figure 10. Run timing of hatchery- and natural- origin Chinook salmon at the Red River satellite
facility in 2005. Age Structure—We estimated age classification of returning hatchery-origin adults to
the Red and Crooked river traps using estimates of mean length of each age class applied to NORMSEP in the computer program FiSAT II (Figure 12). Resulting age compositions show the 2005 male return was composed of 21.9% age-3, 67.1% age-4, and 11.0% age-5 hatchery-origin fish and the female return was composed of 79.9% age-4 and 20.1% age-5 hatchery-origin fish (Table 21).
37

Table 21. Estimated age composition of hatchery-origin Chinook salmon that returned to Red and Crooked river satellite facilities in 2005.
Gender Age Length Criteria (cm) Number of Fish Percent
of Return Male 3 <61 32 21.9%
4 61-88 98 67.1% 5 >88 16 11.0%
Male Total 146 100.0%
Female 4 ≤81 107 79.9% 5 >81 27 20.1%
Female Total 134 100.0% Total 280
We estimated the age classification of natural-origin adults from the length frequency
data of fish recovered at the Red and Crooked river traps using NORMSEP in the FiSAT II program. Age composition for males is estimated at 36.4% age-3, 50.0% age-4, and 13.6% age-5. Female age composition is estimated to be 84.6% age-4 and 15.4% age-5 (Table 22).
Table 22. Estimated age composition of natural-origin Chinook salmon trapped at the Red River and Crooked River satellite facilities in 2005. Lengths are in centimeters and measured as fork length.
Gender Age Length CriteriaNumber Trapped
Percent of Return
Male 3 <62 8 36.4% 4 62-85 11 50.0% 5 >85 3 13.6%
Male Total 22 100.0%
Female 4 60-80 11 84.6%
5 ≥80 1 2 15.4%
Female Total 13 100.0% Total 35
2000 Brood Year Run Reconstruction and SAR—For the BY2000 releases in Red
River and Crooked River, no adipose clipped fish were tagged with CWTs; therefore, no estimate of harvest was generated for the mixed stock fisheries that occurred in the ocean and Columbia and Snake rivers in 2003, 2004, and 2005. However, estimates of harvest are included for the terminal fisheries that occurred in the Clearwater and South Fork Clearwater rivers. Smolt-to-adult survival and female progeny-to-parent relationships only reflect the number of adults that returned to the weir and the estimated number harvested in the terminal fishery and, therefore, should be considered minimum estimates.
38

From the 240,125 presmolts released from the Red and Crooked river release sites in 2001, 31 adults were accounted for at the Red and Crooked river traps in 2003, 2004, and 2005 resulting in an SAR of 0.01%. This SAR of presmolts for BY2000 is the same as it was for BY1999. These fish were all ventral clipped and not subject to harvest in the mark selective terminal fishery. From the 1,076,807 smolts released in 2002, 2,283 adults were accounted for in the terminal fishery and the Red and Crooked river traps in 2003, 2004, and 2005 (Table 24) resulting in an SAR of 0.21%. These fish were all adipose clipped and subject to harvest in mark-selective fisheries. Fish released as smolts showed a twenty-fold smolt-to-adult return advantage over the fish released as presmolts.
Female Progeny-to-Parent Ratio—A total of 434 females were spawned in 2000
(Table 23) to create the presmolt and smolt releases in 2001 and 2002. Of the 434 females, 85 were used to create the presmolt release and 349 were used to create the smolt release. Fourteen females returned from the presmolt release resulting in a female progeny-to-parent ratio of 0.16, which indicates the presmolt release was not above replacement. A total of 1,032 adult females returned from the smolt release resulting in a female progeny-to-parent ratio of 2.9, which indicates that they were above replacement.
Table 23. Number of females spawned and survival of resultant progeny from egg to release at the Red and Crooked River release sites for BY2000.
# of Females Spawned
Average Fecundity
# of Green Eggs
# of Eyed Eggs
# of Juveniles Releaseda
Green Egg to Release Survival
434 3,715 1,612,283 1,384,567 1,316,932 81.7%
a Includes 240,125 presmolts released in September of 2000 and 1,076,807 smolts released in
March and April 2001.
Table 24. Estimated escapement and harvest of BY2000 Chinook salmon adults from the Red and Crooked river satellite facilities in 2003, 2004, and 2005. Numbers in parentheses represent the percentage of the total for that recovery type. Estimated harvest only includes the terminal fishery on the Clearwater and South Fork Clearwater rivers.
Age-3 Recoveries
in 2003
Age-4 Recoveries
in 2004
Age-5 Recoveries
in 2005
Total Brood Year Recoveries Recovery Type
Hatchery Weir 189 (15.1%) 1,059 (84.5%) 5 (0.4%) 1,253 Terminal Harvest 7 (0.7%) 1,012 (95.4%) 42 (3.9%) 1,061 Total Recoveries 196 (8.4%) 2,071 (89.5%) 47 (2.1%) 2,314 Estimated # of Femalesa 0 1,027 (98.2%) 19 (1.8%) 1,046 # of Females at Weir 0 525 (99.6%) 2 (0.4%) 527
a The fraction of total recoveries estimated to be female is based on the sex ratio of age-4 and age-5
fish observed at the hatchery weir in 2004 and 2005 respectively. In 2004, 49.6% of the age-4 hatchery fish were females. In 2005, 40% of the age-5 hatchery-origin fish were females.
39

SUMMARY
The basis of this report is to provide a summary of Chinook salmon juvenile releases and adult returns for the three IDFG LSRCP hatcheries in 2005 as well as to “close out” BY2000 Chinook salmon. The LSRCP mitigation goal for the three IDFG facilities is 39,360 summer/spring Chinook salmon returning to Lower Granite Dam. Original adult return goals were calculated using a SAR rate of 0.87% (U.S. Army Engineer District, 1975). To facilitate the return goal, the combined annual release goal of the three facilities is roughly 4.5 million juveniles.
McCall Hatchery has an annual release goal of 1,100,000 yearling smolts that was
established to return approximately 8,000 adults to LGD. Since the inception of the facility in 1979, release numbers have ranged from a low of 122,247 smolts in 1982 to a high of 1,182,615 smolts in 1999. In March of 2002, 1,064,250 BY2000 smolts were released above the SFSR weir at Knox Bridge. From this release, 6,374 adults returned to the SFSR weir in 2003, 2004, and 2005 and an additional 4,357 fish were harvested or recovered as strays above LGD resulting in a return of 10,731 adults. Therefore, for BY2000, adult returns surpassed the mitigation goal of 8,000 fish. However, for return year 2005, which included fish from BY2000, 2001, and 2002, only 4,815 adults were trapped, harvested, or accounted for as strays above LGD indicating that for this return year, McCall Hatchery did not meet its mitigation goal. By comparison, 9,523 SFSR adults returned over LGD in 2004, 13,527 returned in 2003, 14,685 returned in 2002, and 17,021 returned in 2001.
Sawtooth Hatchery has a production goal of 1,400,000 smolts. The original smolt
production goal for Chinook salmon was 2,300,000, which included 600,000 released into the East Fork Salmon River and 300,000 into Valley Creek. Due to low adult returns, broodstock collection in the East Fork Salmon River was discontinued in 1993 and no releases have ever occurred in Valley Creek. Currently, all Chinook salmon releases are conducted on site at the hatchery. The original adult return goal for Sawtooth Hatchery was 19,445 adults and included returns from juveniles released at Valley Creek and the E. Fork Salmon River. To date, hatchery-origin adult returns to the Sawtooth adult trap have ranged from 10-1,535 fish. Based on the original modeled SAR of 0.87%, expectations of adult returns from the current juvenile release goal of 1.4 million smolts would result in approximately 12,000 adults over Lower Granite Dam. In March of 2002, 385,761 BY2000 smolts were released above the Sawtooth Hatchery weir. From this release, 1,498 adults returned to the weir in 2003, 2004, and 2005 and an additional six fish were recovered as strays above Lower Granite Dam resulting in a return of 1,504 fish indicating that for BY2000, the Sawtooth Hatchery was well below its mitigation goal. For return year 2005, 1,280 adults return to the Sawtooth trap. In 2004, 1,540 adults returned above LGD, 698 returned in 2003, 923 returned in 2002, and 1,427 returned in 2001.
Clearwater Fish Hatchery has historically released Chinook salmon at various sites in
the Clearwater basin and the release goals for those release sites have varied. Currently, Chinook salmon releases are done at the three Clearwater satellite facilities. Also, Clearwater Fish Hatchery releases about 300,000 Chinook salmon smolts and 300,000 parr into the Selway River on an annual basis. The smolt release goal for the Powell satellite is 334,000 juveniles to meet the return goal of 2,553 adults above LGD. In 2002, a total of 519,070 parr and 349,890 smolts were released from the Powell facility. From the 868,960 fish released, 1,623 adults returned to the hatchery weir and 833 contributed to harvest in 2003, 2004, and 2005 resulting in an overall adult return of 2,456 BY2000 adults, just below the mitigation goal for this facility. For return year 2005, 400 Powell adults returned above LGD, well below the mitigation goal for
40
this facility. By comparison, 2,496 Powell adults returned above LGD in 2004, 1,678 returned in 2003, and 1,837 returned in 2002.
The smolt release goal of the South Fork Clearwater is 1,134,000 juveniles (800,000 fish
from Crooked River and 334,000 from Red River) to meet a return goal of 9,362 adults (6,809 for Crooked River and 2,553 for Red River) above LGD. In the fall of 2001, 240,125 BY2000 presmolts were released from the Red and Crooked river release sites. From this release, 31 adults were accounted for at the Red and Crooked river traps in 2003, 2004, and 2005. From the 1,076,807 BY2000 smolts released in 2002, 2,283 adults were accounted for in the terminal fishery and the Red and Crooked river traps in 2003, 2004, and 2005. Fish released as smolts showed a twenty-fold smolt-to-adult return advantage over the fish released as presmolts. The total return for BY2000 adults for the South Fork Clearwater was 2,314 fish, well below the mitigation goal for this facility. For return year 2005, 516 South Fork adults returned above LGD. By comparison, 2,170 adults returned above LGD in 2004, 1,579 returned in 2003, and 925 returned in 2002.
41

ACKNOWLEDGMENTS
We would like to acknowledge the Pacific States Marine Fisheries Commission (PSMFC) for providing assistance with data collection and compilation. We thank all of the hatchery managers and their staffs for providing data. We thank Brian Leth, Tony Lamansky, and Christine Kozfkay for providing comments on the draft report and Cheryl Leben for providing formatting and editing.
42

LITERATURE CITED
Barrett, L. Draft. Clearwater, Snake, and Salmon river, Idaho Chinook salmon (Oncorhynchus tshawytscha) 2003 recreational fishery harvest report. IDFG Draft Report.
Barrett, L. Draft. Clearwater, Snake, and Salmon river, Idaho Chinook salmon (Oncorhynchus
tshawytscha) 2004 recreational fishery harvest report. IDFG Draft Report. Barrett, L. Draft. Clearwater, Snake, and Salmon river, Idaho Chinook salmon (Oncorhynchus
tshawytscha) 2005 recreational fishery harvest report. IDFG Draft Report. Bowles, E., and E Leitzinger. 1991. Salmon Supplementation Studies in Idaho Rivers; Idaho
Supplementation Studies. Technical Report, Project No. 198909800, 204 electronic pages, (BPA Report DOE/BP-01466-1).
Burge, H. L., M. Faler, R. Roseberg, R. N. Jones, and J. Olson. 2007. Adult spring Chinook
salmon returns to Dworshak and Kooskia Nation Fish Hatchery in 2006 and prognosis for 2007. Idaho Fishery Resource Office. Dworshak Fishery Complex. U.S. Fish and Wildlife Service. Ahsahka, Idaho.
Cormack, R. M. 1964. Estimates of survival from the sighting of marked animals. Biometrica
51:429-438. Du, Juan B. Sc. 2002. Combined algorithms for constrained estimation of finite mixture
distributions with grouped data and conditional data. Masters thesis. McMaster University, Hamilton, Ontario, California.
FAO Computerized Information Series (Fisheries). 2005 No. 8, Revised version. Rome, FAO.
168 p. Goldsmith, J. T., and K. A. Apperson. Draft. Summer Chinook Salmon sport fishery on the
South Fork Salmon River, Idaho 2005. IDFG Draft Report. Jolly, G. M. 1965. Explicit estimates from capture-recapture data with both death and
immigrations—stochastic model. Biometrica 52:225-247. Kiefer, S.; Idaho Department of Fish and Game, M. Rowe Shoshone-Bannock Tribes, K. Hatch
Columbia River Inter-Tribal Fish Commission. 1992. U.S. Department of Energy, Bonneville Power Administration, Division of Fish and Wildlife, Project No. 88-108, Contract No. DE-FC79-89BP94402, 548 electronic pages (BPA Report DOE/BP-94402-4).
Lady, J., P. Westhagen, and J. R. Skalski. 2001. SURPH 2.1 Survival under proportional
hazards. User Manual. School of Aquatic and Fishery Sciences. University of Washington. Seattle, Washington.
Leth, B., T. Petering, D. Vidergar, and P. Kline. 2004. Snake River compensation plan Chinook
salmon fish hatchery evaluations-Idaho. Project progress report- Oct. 1, 2000 to Sep. 30, 2001. IDFG Report Number 04-37.
43

Leth, B. 2007. Lower Snake River compensation plan Chinook salmon fish hatchery evaluations-Idaho. Project progress report- Oct 1, 2001 to Sep 30, 2002. IDFG Report Number 07-21.
Leth, B., and D. Lindley. 2008. Lower Snake River compensation plan Chinook salmon fish
hatchery evaluations-Idaho. Project progress report- Oct. 1, 2003 to Sep. 30, 2004. IDFG Report Number 08-03.
LSRCP. 1991. Snake River hatchery review workshop. Compiled by Lower Snake River
Compensation Plan Office. US Fish and Wildlife Service. Boise, Idaho. Macdonald, P. D. M., and Pitcher, T. J. (1979). Age-groups from size-frequency data: a versatile
and efficient method of analyzing distribution mixtures. Journal of the Fisheries Research Board of Canada, 36, 987-1001.
McGhee, J., and S. Patterson. 1999. Clearwater fish hatchery brood year 1997 Chinook and
brood year 1998 steelhead report. Idaho Department of Fish and Game. Boise, Idaho. McPherson, D. E., S. Kammeyer, J. Patterson, and D. Munson. 2006. McCall fish hatchery 2004
summer Chinook salmon brood year report. Idaho Department of Fish and Game. Boise, Idaho.
Moore, B. 1981. Sawtooth salmon trap annual report. Idaho Department of Fish and Game.
Boise, Idaho. R Development Core Team (2004). R: A language and environment for statistical computing. R
Foundation for Statistical Computing, Vienna, Austria. ISBN 3-900051-07-0, URL http://www.R-project.org.
Seber, G. A. F. 1965. A note on the multiple recapture census. Biometerica.52:249-252. Snider, B. R., R. Elmore, M Hughes, H. Smith, and D. Munson. 2006. Sawtooth hatchery and
east fork satellite 2004 Chinook and 2005 steelhead brood year report. Idaho Department of Fish and Game. Boise, Idaho.
United States Army Engineer District. 1975. Special report Lower Snake River Fish and Wildlife
Compensation Plan. Department of the Army, Walla Walla District, Corps of Engineers. Walla Walla, Washington.
Venditti, D. A., J. Lockhart, A. Kohler, A. Brimmer, K. Apperson, B. Bowersox, and C. Bretz.
2007. Idaho supplementation studies brood year 2004 cooperative report. Idaho Fish and Game Annual report to Bonneville Power Administration. Report No. 07-24. Contract Nos. 6630, 20863, 27839, 4998, 16291, 20972, 26686, 4127, 20899, 27234, 4012, and 21086.
44
45
Prepared by: Approved by: IDAHO DEPARTMENT OF FISH AND GAME John Cassinelli Edward B. Schriever, Chief Fisheries Research Biologist Bureau of Fisheries David Lindley Daniel J. Schill Sr. Fisheries Technician Fisheries Research Manager