lotteries as an instrument to increase voter turnout
TRANSCRIPT
1
Lotteries as an Instrument to Increase Voter Turnout
Marian Manic∗ University of South Carolina
I. Motivation Democracy is usually defined as a form of government in which all adult citizens have equal rights in the decision-making that affects their welfare. Normally, this includes participation in the proposal, development and passage of legislation into law. In the major forms of democracy (representative, consensus and deliberative), people will elect their representatives that will then form the government based on a majority vote1. Furthermore, there are instances when the general population needs to express their preference for major legislative changes (for example: referendums to change the constitution, adopt a different national currency, or other questions that can’t be decided by the legislative body alone). Thus, we can infer two major characteristics of democracy: firstly, this political system can be considered as a public good to which citizens will contribute in the form of participating at elections and voting for their preferred parties or representatives; secondly, voter turnout at elections will determine the provision of this public goods (and low voter turnout can be viewed as the free riding externality in Voluntary Contribution Mechanisms of public good provision).
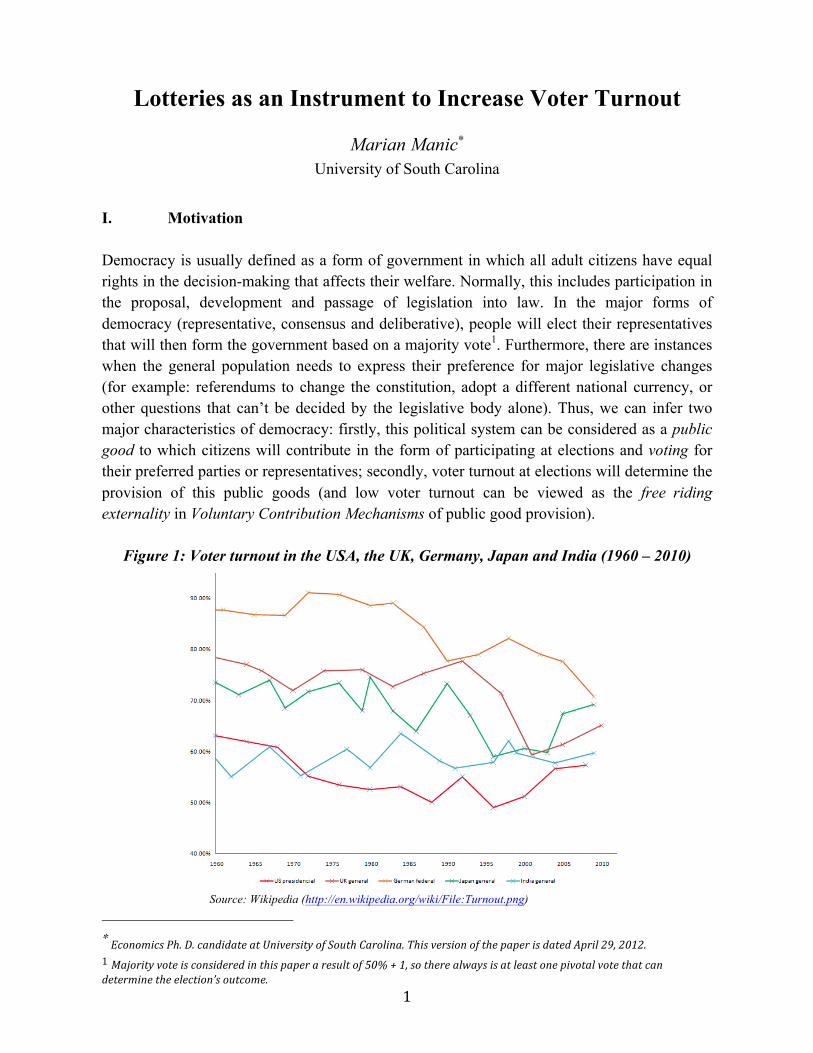
Figure 1: Voter turnout in the USA, the UK, Germany, Japan and India (1960 – 2010)
Source: Wikipedia (http://en.wikipedia.org/wiki/File:Turnout.png)
∗ Economics Ph. D. candidate at University of South Carolina. This version of the paper is dated April 29, 2012. 1 Majority vote is considered in this paper a result of 50% + 1, so there always is at least one pivotal vote that can determine the election’s outcome.
2
Beginning in the 1960’s, most Western countries started to experience negative dynamics of the voter turnout in national elections (see Figure 1). Low voter turnouts may create significant problems for the effective functioning of the democratic systems. One such problem is related to the financial aspect of running elections/referendums (low turnout rates may require additional election rounds or repeated referendums with significant financial costs for the society). Another issue with low voter turnout is that the results of the election/referendum might not be representative of the entire population, in which case future policy decisions might not be popular and result in social unrest. A very good example of what can go wrong because of low voter turnout is that of the Republic of Moldova (a small parliamentary republic2 in Eastern Europe). Due to its current political system, the president of Moldova must be elected by the parliament with at least 61 votes, while the executive branch is elected through a simple majority or coalition. If the legislative body fails to elect a president in two attempts then it is dissolved and the country goes into another round of elections that will determine the political structure of a new parliament. After repeated elections, the new parliament will have to elect a new executive branch and president; so this process repeats until the president is elected. The problem with this system is that although a political party (or coalition) may have a majority in the parliament and be able to form the executive branch and vote on legislative projects, it will not be able to elect a president and thus be forced to eventually dissolve the parliament. This aspect of the Moldovan political system gives considerable leverage to the opposition that now has the ability to indirectly dissolve the legislative body. Since 2009, Moldova had three parliamentary elections (in April 2009, July 2009 and November 2010) and one referendum to change the constitution so that the president is elected directly by the population. Although the voter turnout in all three elections mentioned above was around 60% (well above the required 50% validation rate), the referendum experienced a very low turnout rate (30.29%) and was invalidated because it did not pass the required rate of 33%. As a result, the current political system still persists and such situations may repeat in the future. The Moldovan parliament will most probably organize another national referendum in the near future3 so that it can make the appropriate legislative changes and avoid the vicious circle from 2009-2010. During this period, Moldova has experienced very high social tensions (the violent demonstrations in April 2009, also known as “The Twitter Revolution”, of approximately 40,000 students, in which at least four persons were killed by police forces and hundreds were tortured in police detention). Moreover, after the elections in July 2009 and November 2010, the communist opposition has constantly organized demonstrations as well as acts of civil disobedience in protest to the ruling coalition’s position on various regulations and policies. In addition, the Central Election Commission of Moldova has estimated that one round of 2 A system of government in which the parliament sets up the executive branch and elects a president. 3 In Moldova, a referendum on the same issue can be repeated at intervals not shorter than 2 years.
3
national elections or a referendum costs at least MDL40 million (approximately USD $3.5 million), which means that Moldova spent at least USD $14 million in the last three years on elections alone. This is a significant cost for a country that is dubbed “the poorest country in Europe”. During a period of high austerity in most of Europe and stringent need of funds to promote economic reforms, Moldova has wasted a considerable amount of funds for its electoral needs. The example above shows that low voter turnout rates may have negative effects on social welfare. To address this issue, many countries have introduced compulsory voting: the citizens of these countries are obligated to show up at the voting centers and cast their votes; otherwise they may face civil penalties.4 However, this solution has a lot of evident shortcomings. Firstly, it is not consistent with the freedom associated with democracy, which assumes free elections and doesn’t impose any restrictions on citizens. Another issue with this system is that citizens generally cast more invalid or blank votes in countries that enforce voting compared to countries that don’t. The same is true for citizens that might vote arbitrarily and thus the result of elections might not be entirely representative. An alternative solution to the problem of low voter turnout may be the introduction of lotteries in the electoral process. In this setup, each voter receives a chance to win a fixed prize after he casts his vote and the probability of winning will depend on the total number of voters as well as the total number of prizes (more people will reduce the odds, but more prizes will increase the odds of winning something – assuming that a voter can’t win more than one prize). Thus, the lottery may have one fixed prize or multiple prizes and these prizes may take monetary form (cash), some alternative monetary form (like tax deductions, social security benefits, health insurance benefits, waiver of utility bills for a specific period, etc.), non-monetary form (cars, apartments/houses or travel tickets, etc.) or a so called “extra social gratification” form (like the ability of the winner to participate in some governmental decision-making process, or some other legislative process). In the USA, lotteries in general represent a very sensitive topic and in some states they are still illegal5. Many consider lotteries to be degrading citizens’ morals and to prey on the poor and uneducated people. As a result, introducing the concept of monetary lotteries in real life elections might prove very challenging. In 2006 there was an attempt in Arizona6 to introduce a monetary election lottery in the amount of $1,000,000 (coming from a state lottery fund of unclaimed prizes), but this proposal was rejected by voters. Most of the critics of the Arizona proposal considered this system illegal and that it would actually hurt democracy as it put a price on voting, which should remain purely voluntary.
4 Currently, there are 23 countries with compulsory voting, with 10 of them actively enforcing it. 5 Alabama, Alaska, Hawaii, Mississippi, Nevada, Utah and Wyoming 6 http://www.nytimes.com/2006/07/17/us/17voter.html
4
To the best of my knowledge, such a system of lottery incentive elections has never been implemented anywhere in the world. The biggest concern is centered on the fact that this system might be seen as buying votes and that it may become fraudulent without serious oversight. However, as I mentioned above, the monetary prizes may take various other forms (tax deductions or social security benefits) or they might have an exciting extra social gratification aspect (for example the prize might be the opportunity to take some part in the decision making of a personal sensitive issue or some other legislative process). These design modifications should resolve most of the moral hazard issues associated with monetary lotteries in elections as well as the free riding externality when voting is considered purely voluntary. In section II, I will discuss the relevant literature on lotteries and experiments concerning voter turnout. In section III, I will propose a simple two-person model that describes the equilibrium outcome of the ordinary election, the compulsory election and the lottery election, along with the main hypotheses. In section IV I will describe a potential experiment design with brief procedures that could provide empirical support to the theoretical model. Finally, Section V will contain the concluding remarks. II. Literature Review There is considerable literature on lotteries and public good provision. Voluntary contributions to the public good has the intrinsic free rider problem because some subjects tend to contribute nothing, but enjoy its full benefits once it is implemented. In this sense, lotteries provide additional incentives for people to increase their contributions and thus avoid the free rider externality. One of the prominent papers that analyzes the usage of lotteries as a better tool to provide public goods, Morgan and Sefton (2000), contrasts the Voluntary Contribution Mechanism (VCM) to the lottery mechanism. They test the hypothesis that lotteries will outperform the VCM using laboratory experiments with undergraduate students at Pennsylvania State University and University of Iowa. The authors do find that usage of lotteries increases the contributions and may be a more effective tool for the provision of public goods. Another more recent paper by Landry et al (2006) also compares the VCM and lottery treatments. The authors use field subjects to prove their hypothesis that lotteries tend to increase the contributions for public goods. They also discuss the aspect of using seed money in both the VCM and lottery treatments. The results of their field experiment confirm the findings of Morgan and Sefton (2000) laboratory experiment. In addition, they present an annex in which they replicate the Morgan and Sefton study as well as analyze the case of lotteries that are earmarked with special purposes (for example lotteries that support projects in education) and find that people are more responsive to lotteries with special social benefit earmarks.
5
Voter turnout literature is also very diverse, however I have not found any academic studies that link lotteries with the voting process. One of the original studies that has formalized the rational choice theory of turnout belongs to Anthony Downs (1957). Downs introduces several important characteristics of voter behavior:
“Voters actually vote according to (a) changes in their utility incomes from government activity and (b) the alternatives offered by the opposition. ”
“In a two-party system, if either party moves away from the extreme nearest it toward the other party, extremist voters at its end of the scale may abstain because they see no significant difference between the choices offered them”
“But, as soon as ignorance appears, the clear path from taste structure to voting decisions becomes obscured by lack of knowledge. Though some voters want a specific party to win because its policies are clearly the most beneficial to them, others are highly uncertain about which party they prefer. They are not sure just what is happening to them or what would happen to them if another party were in power. They need more facts to establish a clear preference.”
A modern prominent paper about voter turnout that follows Downs’ foundation is that of Levine and Palfrey (2007)7. These authors analyze the paradox of voter participation in a laboratory experiment and look at three specific effects: group size effect, the competition effect (when election results for both candidates are expected to be close) and the underdog effect (when one of the two groups has fewer supporters). In this experiment, Levine and Palfrey use a population of university students divided in two groups (supporters of candidate A and supporters of candidate B) that differ in size (group A < group B, and group A is dubbed as the underdog, while group B as the frontrunner). This experiment has a modified 4x2 design; it uses four population size sessions (𝑁 ∈ {3, 9, 27, 51}), and for each of these situations the authors had two sub-treatments (NB = 2NA and NB = NA+1; the authors denoted the former treatment as landslide and the latter treatment as toss-up). In the larger groups, the sessions had 50 rounds for the landslide sub-treatment and another 50 rounds for the toss-up sub-treatment. This allowed participants to gain experience in both situations. Another interesting characteristic of this experiment setup is that the cost of voting is expressed as an opportunity cost (they call it the Y bonus, and it is added to the earnings of the subject if he/she chose Y over X, where Y represents abstaining and X represents voting; moreover the Y bonus is drawn randomly from a uniform distribution between 0 and 55). 7 This paper also mirrors some of the games studied in Goeree and Holt (2005).

6
The authors try to institute a very neutral environment, in which there is no mentioning of voting, winning, losing or costs. Moreover, the authors give abstract labels to all outcomes and even to the group names (they call group A the alpha group and group B the beta group). Subjects in the experiment received points that were then converted into cash at the end of the experiment at a rate of 37 cents per 100 points earned. Finally, the authors run a session with a group of 9 subjects in which they change the names of X and Y with Vote and Abstain and compare it to the abstract results, however, they do not find any significant differences in turnouts. The results of this study confirm the initial hypotheses: 1) as group size increases turnout rates go down; 2) when elections are expected to be close turnout rates go up; and 3) turnout is higher for voters that support the less popular candidate. Another interesting example of the voter turnout literature is given by Gerber, Green and Larimer (2008), in which the authors discuss the effects of social pressure on voter turnout based on a large-scale field experiment (involving several hundred thousand registered voters). In this experiment the authors used mailings to analyze the intrinsic satisfaction effects of voting and the extrinsic incentives to comply with the social norm. The authors observed a significantly higher turnout rate among voters that received mailings informing them that their participation or non-participation in elections is being studied and that this information will be shared with their neighbors in the community. Thus, they demonstrate that social pressure is important to induce political participation. III. The Model In this section, I will present a simple two-person model (N = 2) that describes the equilibrium outcomes of the ordinary election, the compulsory election and that of the lottery incentive election. In each case I will present a payoff matrix for each player and will also assume that players have heterogeneous preferences towards candidates (so, if a player decides to vote then he only votes for his favored candidate, otherwise he does not participate in the election). Throughout this section I will use the following variables to determine the Nash Equilibrium outcome:
1. u – total benefit from voting (u>0) 2. c – cost/effort of voting (c>0) 3. F – punishment/penalty for not voting (F>0, exogenously determined) 4. D – Social or personal gratification from voting (D≥0) 5. B – perceived political benefit when the player’s favored candidate wins (B>0) 6. 𝜋i – probability of player i’s vote being pivotal (i = 1,2) 7. E(v) – expected value of the lottery prize v (with a success probability of 1 2).
Based on Downs’ analysis, B is determined in the following way:
7
Bi = E(U1t+1)i – E(U2
t+1)i, i=1,2 (1)
where Ux represents individual’s next period utility after candidate x wins the election (x = 1,2), and
(U1)i > (U2)i (2)
In the case of the ordinary election (in which players are free to make the voting decision), the necessary voting condition is given by:
𝜋i∙B + D > c (3)
According to Riker and Ordeshook (1968), social or personal gratification (D) may take one of the following forms:
1. The satisfaction from compliance with the ethic of voting (if the citizen is well informed of the democratic process this will be positive when he votes and negative, due to guilt, when he does not).
2. The satisfaction from affirming allegiance to the political system. 3. The satisfaction from affirming a partisan preference (this is also commonly referred to
expressive voting, when a citizen has the chance to stand up and let his preferences be known).
4. The satisfaction of deciding/going to the polls (the individual gives importance to his participation in the political system).
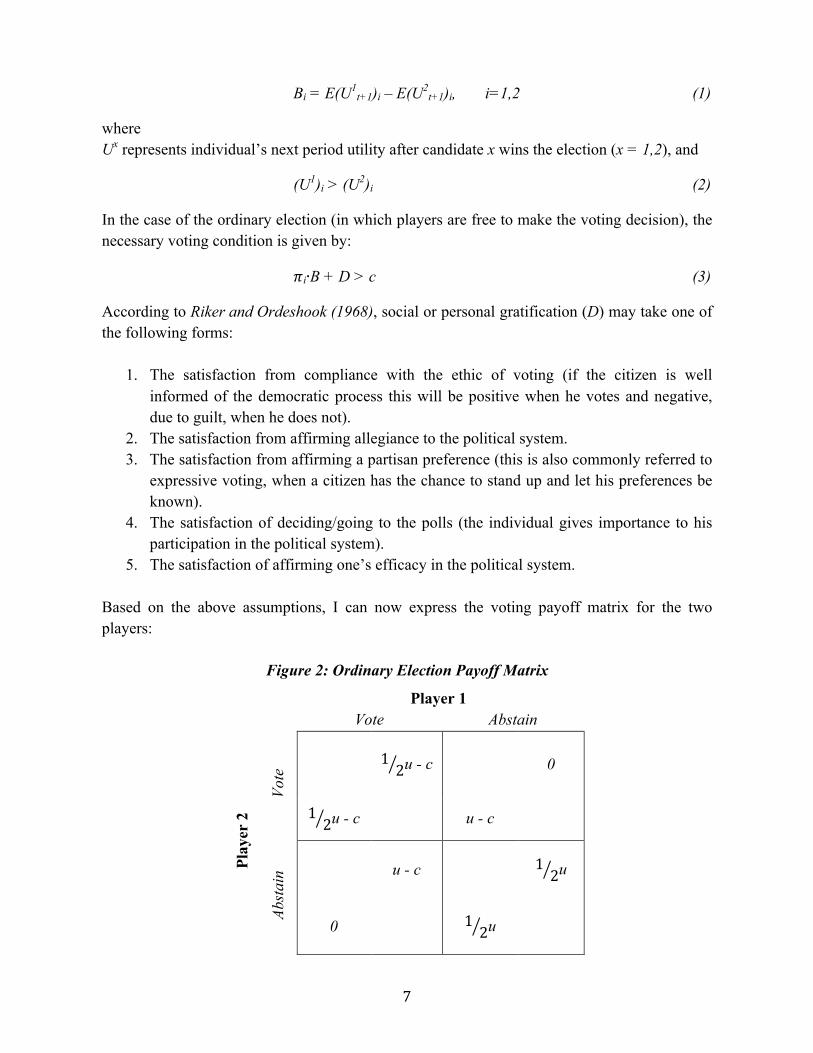
5. The satisfaction of affirming one’s efficacy in the political system. Based on the above assumptions, I can now express the voting payoff matrix for the two players:
Figure 2: Ordinary Election Payoff Matrix
Player 1
Vote Abstain
Play
er 2
Vote
12u - c
0
12u - c u - c
Abst
ain u - c
12u
0 12u
8
where u = 𝜋i∙B + D (4)
When we have only two players and there is a tie (either both players vote or neither of them votes) then they will split the election benefit equally. If neither of them votes then the winning candidate is determined randomly (for a example, based on a coin toss). These two conditions will apply to the following cases of compulsory and lottery incentive elections as well. Please note that, for simplicity, I am assuming that both players are facing the same cost of voting. From the above payoff matrix we can see that the Nash Equilibrium will be (Abstain, Abstain) only if:
12𝑢 − 𝑐 < 0 (5)
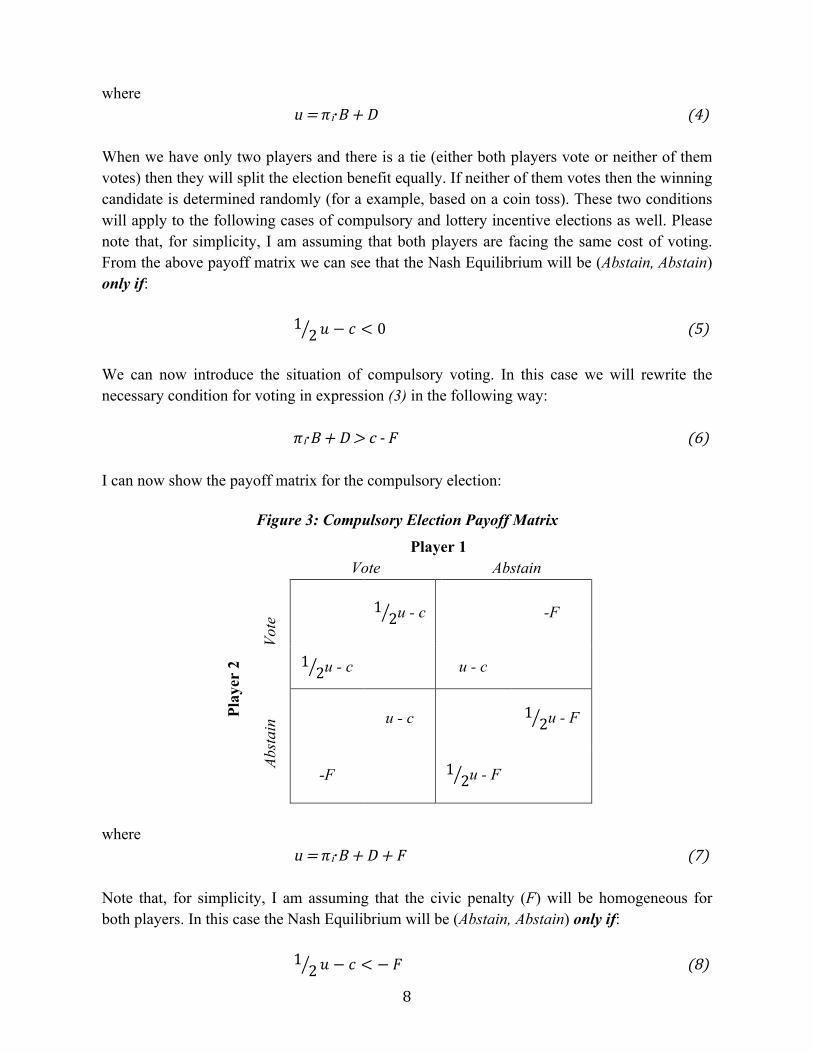
We can now introduce the situation of compulsory voting. In this case we will rewrite the necessary condition for voting in expression (3) in the following way:
𝜋i∙B + D > c -‐ F (6) I can now show the payoff matrix for the compulsory election:
Figure 3: Compulsory Election Payoff Matrix
Player 1
Vote Abstain
Play
er 2
Vote
12u - c -F
12u - c u - c
Abst
ain u - c
12u - F
-F 12u - F
where
u = 𝜋i∙B + D + F (7) Note that, for simplicity, I am assuming that the civic penalty (F) will be homogeneous for both players. In this case the Nash Equilibrium will be (Abstain, Abstain) only if:
12𝑢 − 𝑐 < − 𝐹 (8)
9
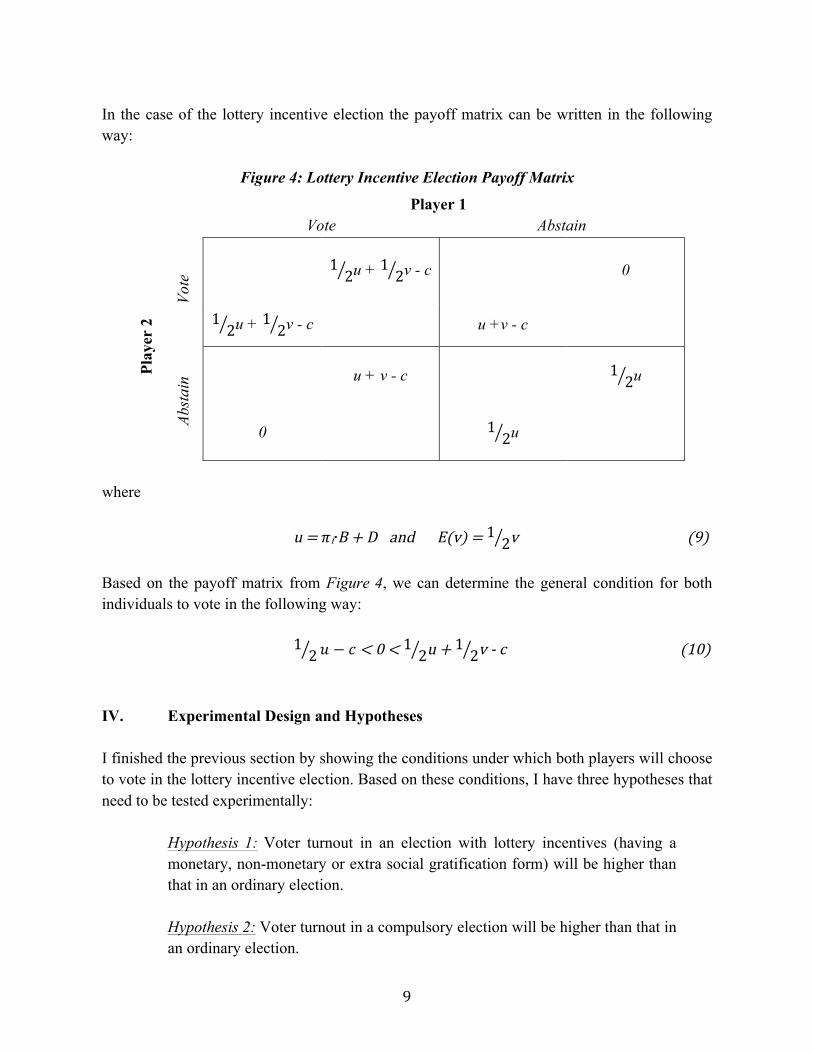
In the case of the lottery incentive election the payoff matrix can be written in the following way:
Figure 4: Lottery Incentive Election Payoff Matrix
Player 1
Vote Abstain
Play
er 2
Vote
12u + 1 2v - c
0
12u + 1 2v - c
u +v - c
Abst
ain u + v - c
12u
0 12u
where
u = 𝜋i∙B + D and E(v) = 1 2v (9) Based on the payoff matrix from Figure 4, we can determine the general condition for both individuals to vote in the following way:
12𝑢 − 𝑐 < 0 <
12u +
12v -‐ c (10)
IV. Experimental Design and Hypotheses I finished the previous section by showing the conditions under which both players will choose to vote in the lottery incentive election. Based on these conditions, I have three hypotheses that need to be tested experimentally:
Hypothesis 1: Voter turnout in an election with lottery incentives (having a monetary, non-monetary or extra social gratification form) will be higher than that in an ordinary election. Hypothesis 2: Voter turnout in a compulsory election will be higher than that in an ordinary election.
10
Hypothesis 3: Voter turnout in an election with lottery incentives (having a monetary, non-monetary or extra social gratification form) will be higher than that in a compulsory election.
So, by denoting voter turnout in a lottery incentive election by VTL, that of a compulsory election by VTC, and that of an ordinary election by VTO, I can summarize my three hypotheses in the following simple expression:
VTL > VTC > VTO (11) For simplicity, the number of players (N) will be fixed to 2. Also for simplicity, I will assume that the probability that the player has the pivotal vote (𝜋i) is 1, so that if they vote then their candidate definitely wins. There will be three treatments that will be called alpha, beta and gamma. The instructions of the game will be abstract and will not include any references to the words “voting”, “winning”, “losing”, “cost” or “election”. I plan to have a total pool of 180 students; each student will have to fill out a short behavioral questionnaire. Before the actual experiment the students will go through a rigorous training seminar in which all the rules of the game will be explained and the subjects will have a chance to play one practice round (the practice round treatment will be randomly chosen). The experiment will be computerized and each student will be required to put on special sound isolating headphones (this will decrease the EDE effects from other students in the room as well as be part of the alternative option of abstaining, which will be explained below). There will be two big groups playing the game: group one will play 10 one-shot sessions, while the second group will play the game in 1 session with 10 rounds. In addition, each group will have one extra session round with modified definitions (I will explain this in more detail below). The 180 students will be randomly assigned to each group (so each group will have 90 randomly assigned students). In the first group, students will then be randomly shuffled into one of the three treatments after which the subjects of each treatment will be assigned into random pairs for each of the 11 consecutive sessions (in the last session I will reveal the election terminology). In the second group, students will be randomly allocated to treatments and then into pairs once and the same pairs will play the same game in 10 rounds (this setup is designed to help identify whether subjects’ behavior will change while they are gaining experience), and after the 10 rounds they will be randomized one last time into the three specific treatments and then randomized in pairs that will play a game in which I will reveal the election terminology for each treatment (this will be explained in more detail below). Students will be seated so that no two players are next to each other (if possible, I will have two separate rooms in order to easier separate the players). I plan to introduce the concept of cost in the form of an intellectual exercise. Thus, if a player decides to participate in the game (s)he will have to take a GRE test containing 10 math questions (in each group, the complexity of the questions will increase in each consecutive
11
session and/or round). If the player does not want to take the GRE test (s)he will have to chose either to listen to music8 or play a popular internet game (for example Angry Birds) and the player will also either pay a specific point-penalty or incur no other costs. I plan to have each session/round last not more than 20 minutes (15 minutes for the GRE test plus up to 5 minutes for additional steps (discussed below) as well as processing and recording of earnings; I assume that the big majority of songs will not be longer than 4 minutes, so that players listening to music or playing Angry Birds will also have up to 20 minutes). After the player takes the GRE test (s)he will be taken to a new screen that will ask to choose between two options (A and B). Each option will have two lines of information: the first line will tell the subject the range of potential payoffs for the specific option, while the second line will give him a moving average of historic payoffs for this option. Option A will have a payoff range of [-250,+250] and in the first session/round will start with a moving average payoff of 50; option B will have a payoff range of [0,+100] and the first session/round will start with a moving average of 20. This corresponds to choosing between two candidates, one of whom promises risky future reforms, while the second has a more stable platform. Thus, the payoff that the player gets in each session/round from voting corresponds to the value of B discussed in section III; also, based on Downs’ theory, negative values of B should influence voters to either switch their votes in the next round or abstain from voting. The game will start with an initial endowment of 1250 points (or $5, which corresponds to the show-up bonus for coming to the experiment and passing the training seminar). At the end of the experiment each student will be paid based on the success function:
Payoffj = max{$5; $0.10 for every 25 points earned}, (12) j = 1,…,180
Thus, each student will be guaranteed the show-up fee of $5; any extra income will depend on the activity in the game and on chance. The maximum that a student can earn in treatments alpha and beta is $66 and the maximum earning in treatment gamma is $77; also based on the maximum potential payoffs, the maximum experiment budget (including a 20% overhead) would be around $15,000. During the experiment, the computer screen will also indicate the average cumulative earnings per capita in each player’s own treatment. In this way, subjects will be able to compare their individual earnings with those of the entire population. All payments will be done at the end of the experiment using cash or money orders. The payoff in each treatment will be determined in the following way:
8 The system will select randomly five songs from the general list of songs given by all the participants in their initial questionnaires.
12
1) Alpha: If both players choose to take the GRE math test then each of them will get 625 points (or $2.5) plus a random payoff uniformly distributed between -250 and +250 points for choosing option A or between 0 and +100 for choosing option B. If however, player 1 chooses to take the GRE test while player 2 chooses to listen to music or play a game then player 1 will receive the full 1250 points (or $5) plus the random payoff from choosing A or B, while player 2 receives nothing; the opposite is true if player 2 decides to take the GRE test and then chooses between A or B while player 1 decides to listen to music or play a game. Finally, if both players decide to listen to music or play a game instead of taking the GRE test, then both of them will receive 625 points (the cost will thus incorporate only the time and mental effort that subjects will need for each GRE test) plus a random payoff that will be based on a random choice between A or B (for example, a coin toss will determine the final option which will then give a random payoff).
2) Beta: If both players choose to take the GRE test then each of them will get 625 points (or $2.5) plus a random payoff uniformly distributed between -250 and +250 points for choosing option A or between 0 and +100 for choosing option B. If however, player 1 chooses to take the GRE test while player 2 chooses to listen to music or play a game then player 1 will receive 1250 points (or $5) plus the random payoff from choosing A or B and player 2 will have to pay a penalty of 200 points (or $0.8); the opposite is true if player 2 decides to take the GRE test and then chooses between A or B while player 1 decides to listen to music or play a game. If both players decide to listen to music or play a game instead of taking the GRE test, then both of them will receive 625 points and will have to pay a penalty of 200 points plus they will receive a random payoff that will be based on a random choice between A or B (for example, a coin toss will determine the final option which will then give a random payoff).
3) Gamma: If both players choose to take the GRE math test then each of them will get 625 points plus a chance to win 250 points (expected value is $0.5) plus a random payoff uniformly distributed between -250 and +250 points for choosing option A or between 0 and +100 for choosing option B. If player 1 chooses to take the GRE test and player 2 chooses to listen to music or play a game instead, then player 1 will get 1250 points and will win the prize of 250 points plus will also get the random payoff from choosing A or B; the opposite is true if player 2 chooses to take the GRE test and then chooses between A or B while player 1 chooses to listen to music or play a game. Finally, if both players choose to listen to music instead of taking the GRE test, then both of them get a payoff of 625 points (or $2.5) plus a random payoff that will be based on a random choice between A or B (for example, a coin toss will determine the final option which will then give a random payoff).
Note that choosing to take the GRE test is similar to choosing whether to participate in the election or abstain, and the payoff received as a result of this action corresponds to the benefit expressed by parameter D (social or personal gratification from voting) in section III.
13
Similar instructions as above will appear on each subject’s computer screen (based on the treatment that (s)he will be assigned to; however, the keywords win, prize and penalty will be replaced by more general words like “get/receive”, “extra earnings” and “pay for music or game”). In the beta treatment, subjects will be told that if they choose to listen to music or play a game, then they will have to pay for it. In the gamma treatment, subjects will be told that if they decide to take the GRE test, then they will have a 50/50 chance of getting/receiving extra earnings but if they choose to listen to music or play a game instead, then they will renounce such extra earnings. In the final session in each group, the three treatments will be renamed with their real meanings: alpha will become “Ordinary Election”, beta will become “Compulsory Election” and gamma will become “Lottery Incentive Election”. Before the initiation of the game, all participants will be given instructions about what a compulsory voting is and what a lottery incentive election is, along with details regarding the odds of winning the prize and the civic penalty for abstaining to vote in a compulsory election. In addition, the two choices in the game will be renamed in the following way: “To vote please complete the following Intelligence Test” and the second choice will be “Abstain and listen to music”/”Abstain and play a game”. For the lottery incentive election treatment, the “get extra earnings” term will be replaced by “win a lottery prize” and the “50/50 chance” will be replaced by “the probability of winning the lottery is 50%”. In the case of the compulsory election treatment, the phrase “pay for music or game” will be replaced by “pay civic penalty”. Also, if the candidate decides to vote and takes the Intelligence Test he will be taken to the second screen that will ask him to vote for Candidate A or Candidate B. In the box of Candidate A the player will read the following information: if you decide to vote for Candidate A then you will obtain a political benefit that will be randomly determined from the interval [-250,+250] points. The second line of information in this box will read: This candidate has a historic political benefit record of XX points9. In the box of Candidate B will be displayed the same information except for the range of political benefits that will be [0,+100]. The results from this final real session will be compared to the results of the previous 10 abstract sessions in order to study whether knowledge of the purpose of the experiment will make any significant changes in the subjects’ behavior. Unfortunately it is difficult to simulate data for such an experiment because I don’t have characteristics about each subject’s preferences. However, if this experiment is to be implemented in real life, it will be easy to gather all the data and compare them to the Nash Equilibrium values. I will also be able to use this data in a simple probit regression of the probability that the voter turns out as a function of whether (s)he was a member of group 1 (not gaining experience) or group 2 (gaining experience), as well as whether the election was ordinary, compulsory or lottery incentive.
9 Every candidate’s political benefit record will be a moving average of all the benefits this candidate offered once she was voted for in the previous 10 rounds by any of the subjects in each specific treatment.

14
V. Conclusion The voter turnout rate has long been studied around the world due to its implications on social welfare. Low voter turnout rates may have considerable negative impacts on social welfare due to the rising financial costs of running elections or referendums as well as the potential social unrest when elections are not fully representative. To the best of my knowledge, lottery incentives have never been associated with elections and no academic research has been done in this direction. As a result, I introduce a framework in which lotteries can be linked with elections and provide various forms of benefits that can potentially increase voter turnout and thus improve social welfare. I propose a simple theoretical framework using game theory to model the equilibrium outcomes in the case of the ordinary, compulsory and lottery incentive elections. My theoretical model borrows important elements from Downs’ (1957) and Riker and Ordeshook (1968). Based on this model, I then propose an experimental design to test the three main hypotheses: voter turnout in lottery incentive elections is higher than that in ordinary elections; voter turnout in compulsory elections is greater than that in ordinary elections; and finally, voter turnout in lottery incentive elections is higher than that in compulsory elections. The experimental design is partially based on some methodologies used in Levine and Palfrey (2007). Unfortunately, I don’t have any data to test my hypotheses at this point. However, various laboratory and field research done on the topic of public good provision using the VCM and lottery alternatives has shown that lotteries increase the contributions to the public good. Thus, I use the same logic in the case of elections and expect to see similar results. An important extension of this model may apply to the case of surveys as well. It is well known that participation in surveys is problematic due to lack of incentives. That is why introduction of the lottery incentive may have a positive effect on survey response rates. There seems to be academic literature on this topic, so my future steps would be to analyze this literature in more detail and find ways to improve this paper on it. Also, I intend to expand my theoretical model to include a larger population number (N), which will then affect the probability of the players’ vote being pivotal (𝜋i). Acknowledgement: I thank Dr. Alexander Matros (University of South Carolina) for his guidance in developing the theoretical model presented in section III.

15
References [1] Bowler, Shaun, David Brockington, and Todd Donovan, 2001, “Election Systems and
Voter Turnout: Experiments in the United States,” The Journal of Politics, Vol. 63, No. 3, pp. 902-915
[2] Downs, Anthony, 1957, “An Economic Theory of Political Action in a Democracy,” Journal of Political Economy, Vol. 65, No. 2, pp. 135-150
[3] Gerber, Alan S., Donald P. Green, and Christopher W. Larimer, 2008, “Social Pressure and Voter Turnout: Evidence from a Large- scale Field Experiment,” The American Political Science Review, Vol. 102, No. 1, pp. 33-48
[4] Goeree, Jacob K. and Charles A. Holt, 2005, “An Explanation of Anomalous Behavior in Models of Political Participation,” The American Political Science Review, Vol. 99, No. 2, pp. 201-213.
[5] Landry, Craig, Andreas Lange, John A. List, Michael K. Price, and Nicholas Rupp, 2006, “Toward an Understanding of the Economics of Charity: Evidence from a Field Experiment,” The Quarterly Journal of Economics, Vol. 121, No. 2, pp. 747-782
[6] Levine, David K. and Thomas R. Palfrey, 2007, “The Paradox of Voter Participation? A Laboratory Study,” The American Political Science Review, Vol. 101, No. 1, pp. 143-158
[7] Morgan, John and Martin Sefton, 2000, “Funding Public Goods with Lotteries: Experimental Evidence,” The Review of Economic Studies, Vol. 67, No. 4, pp. 785-810
[8] Riker, William H. and Peter C. Ordeshook, 1968, “A Theory of the Calculus of Voting,” The American Political Science Review, Vol. 62, No. 1, pp. 25-42
[9] Smith, Jennifer K., Alan S. Gerber, and Anton Orlich, 2003, “Self-Prophecy Effects and Voter Turnout: An Experimental Replication,” Political Psychology, Vol. 24, No. 3, pp. 593-604