loss of heterozygosity at 1p-19q induces a global change in oligodendroglial tumor gene expression
TRANSCRIPT

LABORATORY INVESTIGATION - HUMAN/ANIMAL TISSUE
Loss of heterozygosity at 1p-19q induces a global changein oligodendroglial tumor gene expression
Ruben Ferrer-Luna Æ Manuel Mata Æ Lina Nunez Æ Jorge Calvar ÆFrancisco Dası Æ Eugenia Arias Æ Jose Piquer Æ Miguel Cerda-Nicolas ÆAna Lıa Taratuto Æ Gustavo Sevlever Æ Bernardo Celda Æ Horacio Martinetto
Received: 7 April 2009 / Accepted: 15 June 2009 / Published online: 12 July 2009
� Springer Science+Business Media, LLC. 2009
Abstract Oligodendroglial tumors presenting loss of het-
erozygosity (LOH) at 1p and 19q have been shown to be
sensitive to chemotherapy, thus making 1p-19q status test-
ing a key aspect in oligodendroglioma diagnosis and prog-
nosis. Twenty-nine tumor samples (19 oligodendrogliomas,
10 oligoastrocytomas) were analyzed in order to obtain a
molecular profile identifying those bearing 1p-19q LOH.
Other genomic anomalies usually present in gliomas, such as
EGFR amplification, CDKN2A/ARF deletion, 10q LOH and
TP53 mutation, were also studied. Tumors with 1p-19q LOH
overexpressed genes related to neurogenesis. Genes linked
to immune response, proliferation and inflammation were
overexpressed in the group with intact 1p-19q; this group
could in turn be further divided in two subgroups: one
overexpressing genes involved in immune response and
inflammation that did not show major genetic aberrations
other than the TP53 mutation and EGFR trisomy in a few
cases, and another overexpressing genes related to immune
response and proliferation that had a predominance of
samples carrying several anomalies and presenting worse
outcomes. This molecular signature was validated by ana-
lyzing a set of ten tumor samples (three oligodendrogliomas,
seven oligoastrocytomas); all ten samples were correctly
assigned. LOH at 1p-19q results in haploinsufficiency and
copy number reduction of several genes, including NOTCH
2; this phenomenon produces a global change in gene
expression inducing a pro-neural status that results in
restrictions to cell migration and proliferation. Tumors
without LOH at 1p-19q exhibit the opposite characteristics,
explaining their more aggressive behavior.
Electronic supplementary material The online version of thisarticle (doi:10.1007/s11060-009-9944-y) contains supplementarymaterial, which is available to authorized users.
R. Ferrer-Luna � B. Celda (&)
Department of Physical Chemistry, Universitat de Valencia,
Dr. Moliner sn., 46100 Burjassot, Valencia, Spain
e-mail: [email protected]
M. Mata
Research Foundation, Hospital General Universitario
de Valencia, Valencia, Spain
L. Nunez � E. Arias � A. L. Taratuto � G. Sevlever �H. Martinetto (&)
Department of Neuropathology, FLENI, Montaneses
2325 (C1428AQK), Buenos Aires, Argentina
e-mail: [email protected]
J. Calvar
Department of Neuroimaging, FLENI, Buenos Aires, Argentina
F. Dası
Research Foundation, Hospital Clınico Universitario,
Valencia, Spain
J. Piquer
Neurosurgery Service, Hospital de la Ribera-Alzira,
Valencia, Spain
M. Cerda-Nicolas
Department of Pathology, University of Valencia,
Valencia, Spain
B. Celda
CIBER BBN, ISC-III, Valencia, Spain
123
J Neurooncol (2009) 95:343–354
DOI 10.1007/s11060-009-9944-y

Keywords Oligodendroglial tumors � Loss of
heterozygosity � Microarray � Genomic alterations
Introduction
Malignant gliomas are the most common subtype of pri-
mary central nervous system (CNS) tumors. They are
aggressive, highly invasive and destructive, and have been
defined as tumors presenting histological, immunohisto-
chemical and ultrastructural features of glial differentiation
[1]. They are classified into three groups according to their
hypothetical differentiation line and population predomi-
nance. The cellular origin of these tumors is unknown;
however, it has been postulated that they derive from stem
cells or from differentiated cells that suffer dedifferentia-
tion and later acquire features resembling those of astro-
cytes, oligodendrocytes or ependymal cells [1].
The World Health Organization (WHO) has established
classification criteria, grouping these tumors into four
classes of increasing clinical malignancy [1].
Oligodendrogliomas are believed to represent about 5%
of CNS primary tumors, but this is just an estimation; ever
increasing accuracy in diagnosis methods is generating a
greater incidence than previously reported. There is a well-
known variation in oligodendroglioma diagnosis [2], even
among experts. The lack of reliable immunohistochemical
markers for oligodendroglial lineage and the absence of
universally accepted morphological delineators contribute
to this ambiguity. WHO has established two histological
degrees for oligodendroglioma classification: grade II,
which presents differentiated cells, and grade III, which
presents anaplatic cells as well as histological features
indicating increased malignancy, such as high cellularity,
cellular pleomorphism, prominent mitotic activity, micro-
vascular proliferation and necrosis [1].
Oligodendrogliomas have been shown to be very sen-
sitive to radio- and chemotherapeutic treatments [3, 4].
This feature is the opposite of what has been observed in
astrocytic tumors, making it a most meaningful clinical
difference [5].
Because of these differences in chemosensitivity, differ-
ential diagnosis becomes crucial in order to decide the proper
oncologic strategy. Unfortunately, current anatomopatho-
logical and immunohistochemical methods do not allow an
absolutely reliable distinction between oligodendrogliomas,
mixed gliomas and astrocytomas; this was the reason that led
many researchers to search for genetic markers to complete
the diagnosis and to establish prognostic correlations.
The most common genetic anomaly detected in oligo-
dendrogliomas is the allelic loss of chromosomes 1p and
19q [6, 7]; many reports have shown that about 80% of
grade II oligodendrogliomas present combined loss of
heterocigozity (LOH) in 1p and 19q, while 50–70% of
grade III oligodendrogliomas have this alteration. It has
been shown that concurrent loss of 1p and 19q results from
the balanced translocation between chromosomes 1 and 19,
rendering two derivative chromosomes, one of which, the
der(1;19)(p10;q10), is subsequently lost [8]. It is still not
known which genes lost in these regions are important for
tumor development, but what has been well documented is
that combined LOH at 1p and 19q has a strong predictive
value for chemosensitivity [5].
Grade II oligodendrogliomas may carry, although to a
lesser extent, other genetic alterations, such as growth
factor receptor (EGFR, PDGFRa, PDGFRb) overexpres-
sion and CDKN2A/ARF gene (encoding for tumor sup-
pressor p16) inactivation by promoter hypermethylation.
Histological progression to grade III is due to further
accumulation of genetic anomalies linked to tumor sup-
pressor inactivation or mitogen hyperactivation, including:
CDKN2A/ARF gene homozygous deletion, LOH at 10q
(associated to PTEN and DMBT-1 inactivation), TP53 gene
mutations and EGFR gene amplification [1].
By using high-throughput expression arrays, it was pos-
sible to distinguish WHO grades in oligodendrogliomas [9].
Supervised learning approaches were applied on glioblas-
tomas and anaplastic oligodendrogliomas with classic his-
tology; this model provided a more accurate prognosis
prediction in non-classic lesions when compared to patho-
logical classification, suggesting that class prediction models
based on expression profiling correlate better with survival
than histological classification [10]. In oligodendrogliomas,
the gene expression profile has been correlated both with
chromosomal aberrations, with treatment response and with
survival; 1p and 19q deletions decisively determined the
gene expression profile, and transcripts found identified
patients with higher likelihood to respond to treatment and
defined patient subgroups with favorable prognosis [11]. In
another study several genes located in these regions showed
significantly lower expression levels, supporting the notion
that these genes could contribute to oligodendroglioma ini-
tiation and glioma progression [12]. On the other hand,
tumors with 1pLOH have similar expression profiles to
normal brain, and many overexpressed genes are presumed
to have functions in nervous tissues [13]. Most of the genes
located at 1p and 19q have an expression level dependent on
allele number. Loss of one allele on 1p and 19q reduces
expression levels by 50%, showing a haplo-insufficiency
state that may play an important role in oligodendroglial
tumor pathogenesis and explain the attenuated phenotype
observed in 1p/19q LOH oligodendroglial tumors.
The heterogeneous nature of these tumors along with the
complexity of the signaling network that generates them
has prevented researchers from finding a global set of
markers to establish a clear classification, thus precluding
344 J Neurooncol (2009) 95:343–354
123

targeted therapy development. As a first step towards the
development of molecular classification, we have
employed expression profiling as a means to distinguish
between tumors carrying 1p-19q LOH from those retaining
heterozygosity (ROH). We have identified a set of tran-
scripts that may be considered as potential markers for
these particular traits. Moreover, our results suggest that
LOH at 1p-19q results in a global change in gene expres-
sion, explaining the differences observed between tumors
carrying the alteration from those without it.
Materials and methods
Tissue samples
Tissue samples were collected at La Ribera-Alzira Hospital
(Valencia, Spain) and FLENI (Buenos Aires, Argentina).
Samples were collected immediately after surgical resection,
snap frozen and stored at -808 C. Samples were visually
inspected on H&E frozen sections by experienced neuro-
pathologists (ALT, GS); these sections were diagnosed and
graded according to WHO criteria. Tissue adjacent to the
inspected sections was used for nucleic acid isolation.
Twenty-nine samples from oligodendroglial tumors were
selected for the training set, including 16 oligodendroglio-
mas (OD), 3 anaplastic oligodendrogliomas (AOD), 7 oli-
goastrocytomas (OA) and 3 anaplastic oligoastrocytomas
(AOA) (Table 1). Ten samples (three OD, one OA and six
AOA) were included in the validation independent test set.
This investigation was previously approved by both
institutional ethics committees and by the European Project
e-TUMOUR. Subjects gave written informed consent.
Nucleic acid isolation
For total RNA extraction, 15–25 mg of frozen tumor
sample was homogenized with Ultraturrax, and total RNA
was isolated employing the mirVANA kit (Ambion Inc.,
Austin, TX) following the manufacturer’s instructions.
Purified RNA was quantified by UV absorbance at 260
and 280 nm, and RNA quality was assessed on a spectro-
photometer and Agilent 2100 Bioanalyzer (Agilent Tech-
nologies, Palo Alto, CA). Samples with a 28S/18S ratio of
[1.1 and no evidence of ribosomal peak degradation were
included.
Microarray experiments
Total RNA (1–15 lg) was used to generate double-stranded
cDNA. cDNA synthesis and cRNA labeling were per-
formed using the protocol for one-cycle cDNA synthesis.
Biotin-labeled cRNA (20 lg) was fragmented and
hybridized overnight to the Affymetrix HU133plus2.0
genechip. Protocols were performed as recommended by
Affymetrix (Santa Clara, CA). Arrays were washed, stained
with streptavidin phycoerythrin and scanned to generate an
image file. Scan quality was assessed by the inspection of
visible microarrays artifacts, grid placement, background
intensity and housekeeping gene expression. GeneChip
operating software (GCOS) was used to define ‘‘Absent’’ or
‘‘Present’’ calls and generate CEL files. Arrays with\35%
‘‘Present’’ calls for the 47,000 probe sets and signal 30/50
ratio of GDAPH control B0.5 ratio B4.5 were omitted.
Data analysis
CEL files were imported into the dCHIP program [14] to
compute the model based on the expression index for each
gene. The arrays were normalized against the array with
median overall intensity employing the invariant set
method. Differentially expressed probe sets were identified
using a threshold approach. Probe sets with a P value
B0.01, lower bound of fold change (FC) C1.5 and presence
(P) in at least [20% of samples of each group were
selected. The resulting gene group showed a false discov-
ery rate (FDR)\1.6%. Differentially expressed genes were
evaluated in unsupervised approaches such as hierarchical
clustering and principal component analysis.
Hierarchical clustering is an approach that allowed us to
group samples and genes based on their score similarity.
Before this analysis, gene expression values were stan-
dardized (linearly scaled) to have mean 0 and standard
deviation 1. Standardized values were used as the basis to
merge nodes. One-Correlation was used as metric distance,
and the linkage method was the average, where the dis-
tance between two gene clusters (super-gene) was the
average of all pair-wise distances between two genes not
belonging to the same gene cluster. Finally, the gene
ordering was stated by cluster tightness.
To reduce the dimensionality we employed a mathe-
matical procedure known as PCA. This procedure converts
high-dimension data containing a number of correlated
variables into a new data set containing fewer uncorrelated
variables called principal components. To perform the
PCA, differentially expressed genes were imported into the
Spotfire Decision Site (Spotfire, Somerville, MA).
A supervised learning approach, linear discriminant
analysis (LDA) [15], was used in order to classify ten
samples with a priori unknown molecular status in a system
based on a differential gene expression profile established
among 1p/19q oligodendroglial tumor train groups.
In order to identify critical biological functions of genes
differentially expressed between tumors with LOH or ROH
at 1p-19q, we performed an analysis with the Babelomics
suite [16].
J Neurooncol (2009) 95:343–354 345
123

Genomic analysis
Genomic DNA was extracted from 1 to 5 mg frozen tissue
using Promega’s Wizard kit following the manufacturer’s
instructions. Samples were quantified spectrophotometri-
cally, and 5 ng DNA was used in each determination. LOH
was assessed by the QuMA method [17] using Applied
Biosystems 7500 Real-Time PCR system; the following
Table 1 Summary of histological diagnosis and clinical data used in this analysis
Sample ID Age Diagnostic Location Contrast enhanced Ki67 (%) Progression
1 Ho-1 65 AOA T ? 40 Dead
2 Ho-4 2 OD T ? 4 No
3 Ho-13 49 OD F - 3 No
4 Ho-17 33 AOA F ? 10 No
5 Ho-20 44 OA F - 13 No
6 Ho-31 15 OA T ? 4 No
7 Ho-32 42 OD FT - 2 No
8 Ho-35 34 OD FT - 9 Yes
9 Ho-36 15 OD F - 1 No
10 Ho-37 42 OD F - 2 No
11 Ho-40 29 OD FT - 4 No
12 Ho-52 65 AOD F ? 8 Dead
13 Ho-53 39 OD F - 7 No
14 Ho-54 43 OD F - 11 Yes
15 Ho-56 39 OD F - 12 No
16 T-58 43 OA P - N/A No
17 T-63 38 OA F N/A N/A No
18 Ho-74 30 OD F - 5 No
19 T-87 66 OA F - N/A No
20 Ho-89 48 OD FT - 3 No
21 Ho-108 38 OD T ? 1 Yes
22 Ho-109 40 OD F - 2 No
23 Ho-110 43 OA T - 6 Dead
24 Ho-113 42 AOD F ? 9 No
25 Ho-118 5 AOA P ? 29 Dead
26 Ho-120 62 OD F - 3 No
27 Ho-124 54 OD F - 3 No
28 Ho-129 53 OA F - 9 Yes
29 T-472 31 AOD FT - N/A No
30 Ho-160 27 OD T - 5 No
31 Ho-161 63 AOA T ? 5 Dead
32 Ho-167 41 OD P - 1 No
33 Ho-194 66 AOA P ? 28 Dead
34 Ho-196 35 AOA F ? 8 Yes
35 Ho-202 49 OD T - 1 Yes
36 Ho-203 39 AOA T ? 20 Yes
37 Ho-206 40 OA F - 4 No
38 Ho-207 28 AOA PT - 6 No
39 Ho-210 66 AOD F ? 1 Yes
Diagnosis: anaplastic oligodendroglioma (AOD), anaplastic oligoastrocitoma (AOA), oligodendroglioma (OD), oligoastrocytoma (OA)
Anatomic location: temporal lobe (T), frontal temporal (FT), frontal lobe (T), parietal lobe (P), parietal temporal lobe (PT). Progression
determined after 2-year follow-up
N/A Not assessed
346 J Neurooncol (2009) 95:343–354
123

markers were studied: D1S468, D1S214 and D1S199 for 1p
loss and D19S596, D19S408 and D19S867 for 19q loss.
Markers for LOH at 10q were D10S536 (located near the
PTEN gene) and D10S1683 (mapping close to DMBT-1
gene).
Homozygous deletions in the CDKN2A/ARF gene were
detected following a published protocol [18].
EGFR gene amplifications were assessed in a multiplex
real-time reaction employing the same conditions described
for CDKN2A, including GAPDH as reference gene. Primers
for the EGFR gene have the following sequences: forward
50-GAAGCTTGCTGGTAGCACTTG-30 and reverse 50-GT
GGAAGCCTTGAAGCAGAAC-30; the probe has the fol-
lowing sequence: 50-6FAMCCCAACTGTGAGCAAGGA
GCACATAMRA-30.TP53 gene mutations were scanned by SSCP-PCR as
described [19] and confirmed by direct sequencing.
Quantitative RT-PCR analysis: SYBR
Green assay
Quantitative RT-PCR (qRT-PCR) was performed on 27
samples used for microarray analysis. cDNA was syn-
thesized from 1 lg total RNA using random primers
employing the High Capacity cDNA Archive kit (Applied
Biosystems; P/N 4322171). Thermal cycler conditions for
reverse transcription were 25�C for 10 m, 37�C for
120 m and 85�C for 5 s. Quantitative real-time PCR
(qPCR) was carried out using SYBR Green PCR master
mix (Applied Biosystems) according to the manufac-
turer’s instructions. cDNA aliquots (1 ll) were used as
template for real-time PCR containing primers of control
and target genes. Each cDNA sample was analyzed in
triplicate. Expression levels were evaluated relative to
GAPDH housekeeping gene control. Primers were
obtained from QuantiTect Primer assay (Qiagen, Ger-
many) (Table 1S, Supplementary Material). PCR condi-
tions were as follows: 50�C 2 min, 95�C 10 min and 40
cycles of 95�C, 15 s and 60�C, 1 min. Cycling was done
on an ABI 7900 HT Fast Real-Time PCR System
(Applied Biosystem; Foster, CA). Relative expression
was assessed by the 2-DDCt method.
Statistical analysis
Fisher’s exact test was used to assess the significant asso-
ciation between 1p and 19q, 10q allelic losses versus tumor
type (mixed or pure) and gene expression profile versus
tumor location. Statistical test significance was determined
at P-value B0.05.
Results
Genomic alterations in oligodendroglial tumors:
train set
We performed genomic and transcriptomic studies on 29
oligodendroglial tumors. Tables 1 and 2 show the histo-
pathological diagnoses and chromosomal and genetic
alterations found.
LOH at 1p was found in 48% of the samples, while 41%
of them carried LOH at 19q. In most cases (38%) both
alterations were detected simultaneously.
When tumor grade was considered, these alterations
were more frequent, either alone or in combination, in
high-grade tumors; namely, 83% of grade III oligoden-
droglial tumors carried 1p or 19q loss, while combined loss
was detected in 50% of the high-grade samples. In grade II
tumors, these alterations were present in 43% of the sam-
ples with 35% showing the combined alteration. On the
other hand, combined LOH at 1p-19q was more common in
mixed oligodendrogliomas, but no significant association
was found between 1p/19q status and tumor morphology or
class (P value = 0.08).
LOH at 10q was detected in 45% of the samples and was
more prevalent in high-grade (66%) than low-grade (39%)
tumors. Similarly, this alteration commonly affected mixed
(70%) rather than pure (32%) oligodendrogliomas. We
detected a statistically significant association between 10q
deletion and mixed morphology (P-value B 0.05). Inter-
estingly, simultaneous deletions at both loci analyzed
(D10S536 and D10S1683) were detected only in 24% of
the samples, corresponding mostly to high-grade tumors;
the remaining 21% of samples only showed loss at
D10S1683 (neighboring DMBT-1 gene location) and were
low-grade tumors.
EGFR gene amplification was detected in 14% of the
samples, and positive cases were equally distributed
between low- and high-grade tumors, although high-grade
samples always presented a higher copy number. This
alteration was predominant in mixed tumors. We found a
positive association between EGFR gene amplification and
LOH at 10q (P = 0.03).
CDKN2A/ARF gene homozygous deletion was present
in 17% of cases, mostly affecting low-grade tumors. When
the type of tumor was considered, 16% of pure and 20% of
mixed oligodendrogliomas carried this anomaly. One AOA
presented LOH at this locus. This alteration was predom-
inant in the group of samples without 1p-19q LOH. One
sample bearing interstitial losses at 1p-19q presented
CDKN2A/ARF homozygous deletion together with EGFR
amplification and 10q loss.
J Neurooncol (2009) 95:343–354 347
123

Finally, two samples (7%) were shown to carry muta-
tions at exon 5 of the TP53 gene. Sample Ho-124 carried
C489 T[C (changing tyrosine for hystidine at position
163), while sample Ho-37 carried C418delA, which
introduces a stop codon at position 169.
Supervised clustering for tumors with 1p-19q LOH
versus 1p-19q ROH
In order to identify genes associated with chromosomal
alterations in 1p and 19q, we carried out three supervised
Table 2 Summary of molecular data used in this analysis
Group Sample D1S 468 D1S 214 D1S 199 D19S 867 D19S 596 D19S 408 D10S 536 D10S 1683 P16/p14del EGFR
amp.
P53 mut.
A Ho-109 LOH LOH LOH ROH ROH ROH ROH ROH No No No
A Ho-56 LOH LOH LOH ROH LOH ROH ROH ROH No No No
A T-87 LOH LOH LOH LOH LOH LOH ROH ROH No No No
A T-58 LOH LOH LOH ROH LOH ROH ROH ROH No No No
A Ho-32 LOH LOH LOH ROH LOH ROH ROH ROH No No No
A T-472 LOH LOH LOH ROH LOH LOH LOH LOH No No No
A Ho-113 LOH LOH LOH LOH LOH LOH ROH ROH No No No
A Ho-13 LOH LOH LOH LOH LOH LOH ROH ROH No No No
A* Ho-167 LOH LOH LOH LOH LOH ROH LOH ROH No No No
A T-63 LOH LOH LOH LOH LOH LOH ROH LOH No No No
A Ho-17 LOH LOH LOH LOH LOH LOH ROH ROH No No No
A Ho-20 LOH LOH LOH LOH LOH LOH LOH LOH No No No
A* Ho-206 ROH ROH ROH ROH ROH LOH ROH LOH LOH No No
A* Ho-160 LOH LOH LOH ROH ROH ROH LOH ROH No No No
A* Ho-202 ROH ROH ROH LOH ROH LOH LOH LOH No No No
B1 Ho-124 ROH ROH ROH ROH ROH ROH ROH ROH No No Yes
B1 Ho-37 ROH ROH ROH ROH ROH ROH ROH LOH No No Yes
B1 Ho-54 ROH ROH ROH ROH ROH ROH ROH ROH Yes No No
B1 Ho-36 ROH ROH ROH ROH ROH ROH ROH LOH No No No
B1 Ho-35 ROH ROH ROH ROH ROH ROH ROH ROH No No No
B1* Ho-207 ROH ROH ROH ROH ROH ROH ROH ROH No Trisomy No
B1 Ho-120 ROH ROH ROH ROH ROH ROH ROH ROH No No No
B1 Ho-40 ROH ROH ROH ROH ROH ROH ROH LOH No Trisomy No
B2 Ho-118 ROH ROH ROH ROH ROH ROH LOH LOH No No No
B2* Ho-210 ROH LOH ROH ROH ROH ROH LOH LOH Yes Yes (124) No
B2* Ho-161 LOH LOH LOH ROH ROH ROH LOH LOH Yes Yes (165) No
B2* Ho-194 ROH ROH ROH ROH ROH ROH LOH LOH LOH Yes (164) No
B2* Ho-196 ROH LOH ROH ROH ROH ROH LOH LOH Yes Yes (29) No
B2 Ho-1 ROH ROH ROH ROH LOH ROH LOH LOH Yes Yes (59) No
B2 Ho-129 ROH ROH ROH ROH ROH ROH LOH LOH Yes Yes (24) No
B2 Ho-89 ROH ROH ROH ROH ROH ROH ROH ROH Yes No No
B2 Ho-31 ROH LOH LOH ROH ROH ROH ROH LOH No No No
B2 Ho-4 ROH ROH ROH ROH ROH ROH ROH ROH No No No
B2 Ho-52 LOH ROH ROH ROH ROH ROH LOH LOH Yes No No
B2 Ho-110 ROH LOH ROH ROH LOH ROH LOH LOH Yes Yes (5) No
B2* Ho-203 ROH ROH ROH ROH ROH ROH LOH LOH No Yes (197) No
B2 Ho-108 ROH ROH ROH ROH ROH ROH ROH LOH No No No
B2 Ho-53 ROH ROH ROH ROH ROH ROH ROH LOH No No No
B2 Ho-74 ROH ROH ROH ROH ROH ROH ROH LOH No No No
Samples marked with * were those used in the validation experiment. Allelic status: Loss of heterozygosity (LOH); retention (ROH). EGFR
amplification: numbers in brackets indicate copy number
348 J Neurooncol (2009) 95:343–354
123

analyses comparing expression patterns from samples car-
rying LOH (n = 14) against ROH (n = 15) at 1p, LOH
(n = 12) and ROH (n = 17) at 19q and finally combined
LOH (n = 11) versus ROH (n = 18) at 1p-19q. The fol-
lowing parameters were selected to perform the compari-
sons: P-value B 0.01, lower bound of FC [ 1.5, P C 20%
and FDR B 1.6%. Statistical analysis identified 309, 748
and 702 probe sets corresponding to 260, 689 and 622 genes
that were differentially expressed between categories.
Among the 260 genes differentially expressed between
tumors with LOH and ROH at 1p, 217 genes were over-
expressed in samples carrying LOH, while 43 were over-
expressed in tumors with ROH at 1p; 37% of the latter
genes were located within the deleted region (Fig. 1S,
Table 2S). When the same analysis was performed for
LOH versus ROH at 19q, we found 359 genes overex-
pressed in ROH samples, of which 11% were located in the
deleted region (Fig. 2S, Table 3S).
Tumors presenting combined loss at 1p-19q presented
251 genes overexpressed (Table 4S) when compared to
tumors with ROH at both chromosomal arms; of the 371
genes overexpressed in the ROH group, 71 mapped to the
deleted regions, resulting in a known location of 26% of
genes (Fig. 3S, Tables 5S, 6S and 7S).
The ROH/LOH ratio was 2.28 ± 0.26 for genes located
in 1p, 2.50 ± 0.58 for 19q and 2.31 ± 0.29 for combined
alterations, suggesting that the loss of one allele leads to a
gene expression reduction by about one half. Genes located
in the affected regions showed lower expression, thus
highlighting the probable link between allelic copy number
and expression dosage. This haploinsufficiency state
acquires special relevance in genes such as NOTCH2.
Figure 1 shows the hierarchical clustering and PCA
analysis corresponding to the 234 more differentially
expressed genes in tumors bearing combined LOH versus
ROH at 1p-19q. To reduce analysis dimensionality, we
selected those genes presenting differences greater than
100 between media. Tumors with combined LOH at 1p-
19q (group A) were grouped with the exception of one
sample (Ho-110); of note, this sample carried interstitial
deletions in both regions. Main features in this group were
frontal localization, lack of progression 24 months after
surgery, low percentage of samples (29%) showing con-
trast enhancement and lack of other genomic aberrations
except for three samples carrying LOH at 10q.
The main cluster branch included tumors with ROH at
both regions; inside this branch, two groups with different
molecular and histological profiles were identified. The
first group (group B1) contained seven pure low-grade ol-
igodendrogliomas; TP53 gene mutations were distinctive
in this group. Tumors in this group did not show contrast
enhancement and had frontal localization, and two patients
(29%) progressed in the first 24 months.
Group B2 showed a higher content of samples displaying
contrast enhancement and progression (or death) in the first
24 months; samples within this group carried LOH at 10q
associated with EGFR gene amplification and/or CDKN2A/
ARF homozygous deletion. This group was the only one
presenting samples with temporal localization.
Next, we performed a functional study employing the
Babelomics suite. Of 409 probe sets and the corresponding
371 genes overexpressed in the ROH group, 268 presented
correspondence in the Ensembl database, and 211 of them
had annotations for biological process functions. The LOH
group, with 293 probe sets and 251 corresponding genes,
presented 173 genes with correspondence in the Ensembl
database, and 126 of them had annotations for biological
processes (Fig. 2).
Functional annotation for biological processes, based on
different levels of gene ontology (GO), is shown in
Tables 8S, 9S and 10S for the differentially expressed genes
that presented significant differences and no redundancies
in the different GO levels. Tumors with ROH showed a
predominance of genes implicated in immune and inflam-
matory responses and proliferation, while the LOH group
was enriched with genes linked to neurogenesis. A 21-gene
set allowed us to distinguish between subgroups B1 and B2
in the ROH group, (Fig. 1, Table 11S), although we could
not find any functional enrichment. From the inspection of
the entire data set, we conclude that subgroup B2 expressed
higher levels of genes involved in proliferation when
compared to subgroup B1. Tumors presenting LOH at 1p-
19q and a neurogenic expression profile occurred most
frequently on frontal lobes (P value = 0.05).
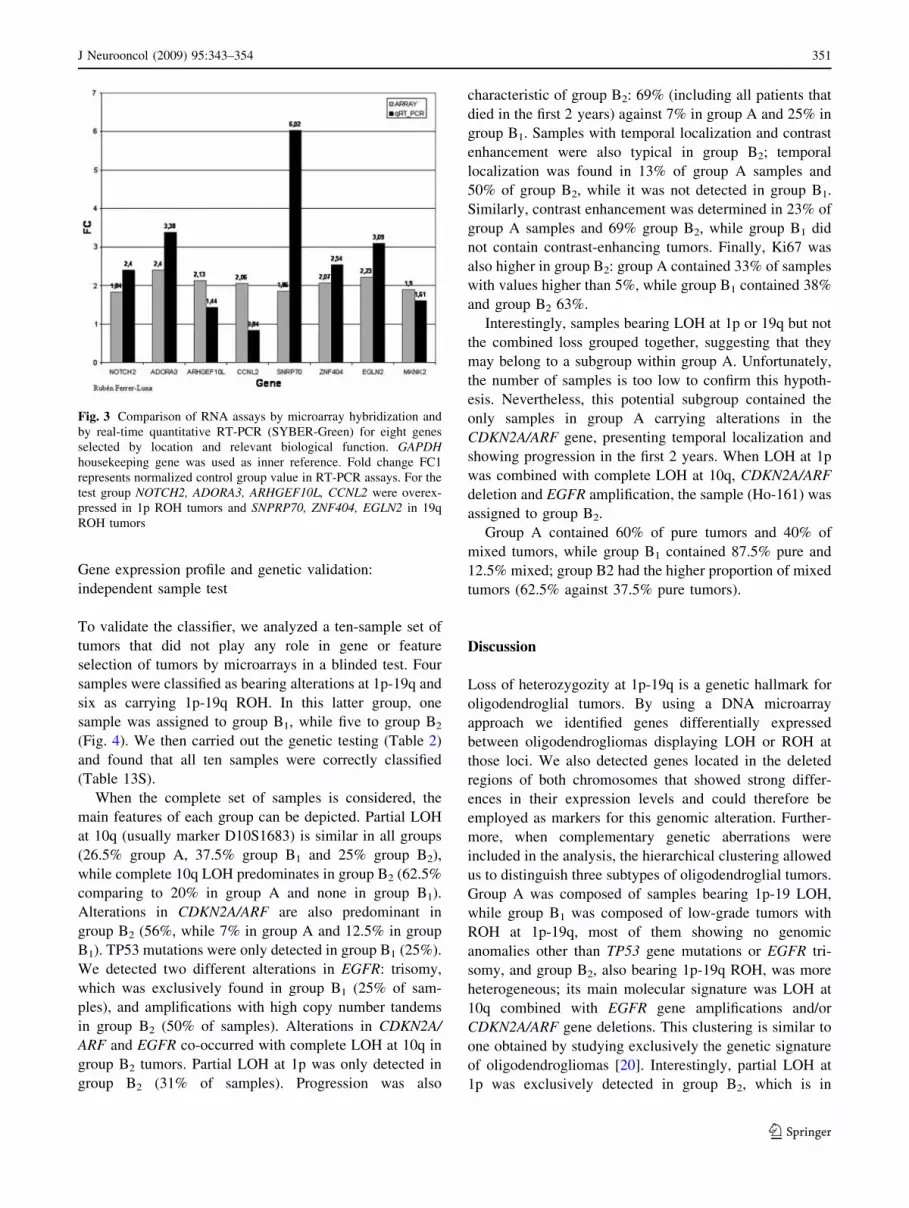
Real-time RT-PCR quantitation
Genes displaying the most significant differences between
samples with and without LOH and located in the affected
regions (1p36 and 19q13.3) were selected to perform val-
idation by real-time RT-PCR quantitation. For 1p loss we
tested CCNL2, NOTCH2, ADORA3 and ARHGEF10L,
while SNRP70, ZNF404, EGLN2 were assayed for 19q and
MKNK2 for 19p, which surprisingly was the region more
represented in samples with 19q loss. RT-PCR quantitation
confirmed microarray results (Fig. 3). ARHGEF10L,
NOTCH2, ADORA3, ZNF404, EGLN2 and MKNK2 gave
similar expression patterns when analyzed by either
method. SNRP70 displayed higher levels when measured
by quantitative RT-PCR, while CCNL2 was the only
marker that showed a lower level of induction compared to
microarray results (the difference between both groups was
0.84-fold for this gene, Table 12S). These markers could
thus be considered as good candidates for 1p-19q LOH
detection by alternative means such as quantitative RT-
PCR or immunohistochemistry.
J Neurooncol (2009) 95:343–354 349
123

Overexpressedin group A vsB1 and B2.
Overexpressedin group B1 vsA and B2
Overexpressedin group B1 andB2 vs A
A B
C
Fig. 1 PCA and hierarchical clustering analysis based on expression
of 262 probe sets is significantly different between 1p-19q LOH and
ROH tumors. Probe sets were selected according to a limit approach
among groups (P-value B 0.01; lower bound of fold change [1.5;
presence C20% in each group; differences among means[100; FDR
of 0.8%). PCA and hierarchical clustering identify two main clusters:
tumors with LOH on 1p-19q (blue) and tumors with ROH on 1p-19q
(yellow). a Relative expression levels of 262 probe sets corresponding
to 234 genes are plotted against tumor samples. Normalized intensity
value of each gene was standardized to have a mean of 0 and SD of 1
before clustering. Red is relatively higher expression, and green is
relatively lower expression. A total of 94 genes were overexpressed in
tumors with LOH1p-19q, whereas 140 genes showed overexpression
on tumors with ROH. b Dendrogram enlargement of clustered
samples shown in A. The colorgram displays type: Oligodendrogli-
oma (OD, light green), oligoastrocytoma (OA, light red), anaplastic
oligodendoglioma (AOD, green), anaplastic oligoastrocytoma (AOA,
red). Location: Frontal lobe (F, light blue), front temporal (FT, lightyellow), temporal (T, orange). Grade: Low grade (2, purple) and high
grade (3, red). Contrast enhancement: Positive (P, red), negative (B,
blue). Diagnostic: Mixed (M, orange), pure (P, green). Age: Young
(Y, blue B16 years), adult (A, blue light). Chromosomal status for 1p,
19q, simultaneous 1p-19q, 10q: Loss of heterozygosity (L, blue),
retention (R, yellow). Molecular status: CDK2NA deletion (D, lightblue), EGFR amplification (A, red), TP53 mutation (M, red), no
alterations (N, yellow). Note that chromosomal aberrations showed a
decisive role in gene expression profile clustered by histological type.
c Principal component analysis based on expression of the 262 most
significant probe sets, demonstrating that 1p-19q LOH tumors (blue)
and 1p-19q ROH tumors (yellow) have a distinct global gene
expression profile. Additionally, PCA identifies two 1p-19q ROH
tumor subgroups, group B1 (circled in yellow) and group B2 (circledin blue)
Fig. 2 Functional annotation for biological processes according to
GO. Tumors presenting ROH at 1p-19q are shown in red, while those
presenting LOH at 1p-19q are shown in green. Non-adjusted P value
is shown in the left column, while the right column shows the P-value
after FDR correction. An adjusted P value\0.05 was considered to be
statistically significant
350 J Neurooncol (2009) 95:343–354
123
Gene expression profile and genetic validation:
independent sample test
To validate the classifier, we analyzed a ten-sample set of
tumors that did not play any role in gene or feature
selection of tumors by microarrays in a blinded test. Four
samples were classified as bearing alterations at 1p-19q and
six as carrying 1p-19q ROH. In this latter group, one
sample was assigned to group B1, while five to group B2
(Fig. 4). We then carried out the genetic testing (Table 2)
and found that all ten samples were correctly classified
(Table 13S).
When the complete set of samples is considered, the
main features of each group can be depicted. Partial LOH
at 10q (usually marker D10S1683) is similar in all groups
(26.5% group A, 37.5% group B1 and 25% group B2),
while complete 10q LOH predominates in group B2 (62.5%
comparing to 20% in group A and none in group B1).
Alterations in CDKN2A/ARF are also predominant in
group B2 (56%, while 7% in group A and 12.5% in group
B1). TP53 mutations were only detected in group B1 (25%).
We detected two different alterations in EGFR: trisomy,
which was exclusively found in group B1 (25% of sam-
ples), and amplifications with high copy number tandems
in group B2 (50% of samples). Alterations in CDKN2A/
ARF and EGFR co-occurred with complete LOH at 10q in
group B2 tumors. Partial LOH at 1p was only detected in
group B2 (31% of samples). Progression was also
characteristic of group B2: 69% (including all patients that
died in the first 2 years) against 7% in group A and 25% in
group B1. Samples with temporal localization and contrast
enhancement were also typical in group B2; temporal
localization was found in 13% of group A samples and
50% of group B2, while it was not detected in group B1.
Similarly, contrast enhancement was determined in 23% of
group A samples and 69% group B2, while group B1 did
not contain contrast-enhancing tumors. Finally, Ki67 was
also higher in group B2: group A contained 33% of samples
with values higher than 5%, while group B1 contained 38%
and group B2 63%.
Interestingly, samples bearing LOH at 1p or 19q but not
the combined loss grouped together, suggesting that they
may belong to a subgroup within group A. Unfortunately,
the number of samples is too low to confirm this hypoth-
esis. Nevertheless, this potential subgroup contained the
only samples in group A carrying alterations in the
CDKN2A/ARF gene, presenting temporal localization and
showing progression in the first 2 years. When LOH at 1p
was combined with complete LOH at 10q, CDKN2A/ARF
deletion and EGFR amplification, the sample (Ho-161) was
assigned to group B2.
Group A contained 60% of pure tumors and 40% of
mixed tumors, while group B1 contained 87.5% pure and
12.5% mixed; group B2 had the higher proportion of mixed
tumors (62.5% against 37.5% pure tumors).
Discussion
Loss of heterozygozity at 1p-19q is a genetic hallmark for
oligodendroglial tumors. By using a DNA microarray
approach we identified genes differentially expressed
between oligodendrogliomas displaying LOH or ROH at
those loci. We also detected genes located in the deleted
regions of both chromosomes that showed strong differ-
ences in their expression levels and could therefore be
employed as markers for this genomic alteration. Further-
more, when complementary genetic aberrations were
included in the analysis, the hierarchical clustering allowed
us to distinguish three subtypes of oligodendroglial tumors.
Group A was composed of samples bearing 1p-19 LOH,
while group B1 was composed of low-grade tumors with
ROH at 1p-19q, most of them showing no genomic
anomalies other than TP53 gene mutations or EGFR tri-
somy, and group B2, also bearing 1p-19q ROH, was more
heterogeneous; its main molecular signature was LOH at
10q combined with EGFR gene amplifications and/or
CDKN2A/ARF gene deletions. This clustering is similar to
one obtained by studying exclusively the genetic signature
of oligodendrogliomas [20]. Interestingly, partial LOH at
1p was exclusively detected in group B2, which is in
Fig. 3 Comparison of RNA assays by microarray hybridization and
by real-time quantitative RT-PCR (SYBER-Green) for eight genes
selected by location and relevant biological function. GAPDHhousekeeping gene was used as inner reference. Fold change FC1
represents normalized control group value in RT-PCR assays. For the
test group NOTCH2, ADORA3, ARHGEF10L, CCNL2 were overex-
pressed in 1p ROH tumors and SNPRP70, ZNF404, EGLN2 in 19q
ROH tumors
J Neurooncol (2009) 95:343–354 351
123

agreement with the notion that partial 1p losses may have a
worse prognosis than 1p ROH [21]. Several samples in this
subgroup closely resemble glioblastoma multiforme
(GBM) both in molecular signature and clinical course.
The observed differences in tumor location between groups
go in parallel with previous reports [22].
The heterogeneity of samples (most of them are low
grade in train set, while high grade in test set) could be a
weakness in a histopathological study. However, our study
has been designed using objective molecular biomarkers
independently of their subjective histopathological features
in order to identify differential gene expression profiles
among molecular classes. Taking into account these
aspects, validation of the gene expression profile was
consistent with our initial genetic findings.
Genes defining tumors within group A were mainly
associated with neurogenesis (Table 8S). This significant
functional enrichment was concordant with other analyses
where many genes showing higher expression in tumors
with 1p LOH were presumed to exert functions in nervous
tissues [13].
This result may reflect an origin from precursor cells
rather than from mature oligodendrocytes; in this regard, a
common developmental pathway for both oligodendrocytes
and motor neurons has been reported [23]. Among the most
significant genes identified in this group, many of them
play important roles in several cellular functions, such as
extracellular signaling (BMP2, BMPR2, CELSR3, APP,
THY1), cell cycle inhibition (CCNG2, E2F5, CDK5R1),
cAMP pathway inhibition (PK1A, PRKAR2B), cytoskele-
ton organization (MCF2, DCX, PAFAH1B1, CDK5R1,
SLITRK2, SLITRK5) and cell membrane composition
(ACSL6, SMPD3).
The most significant genes identified in the group with
1p-19q ROH, many of them related to inflammatory and
immune responses and proliferation (Tables 9S and 10S),
also participate in diverse cellular functions such as cyto-
skeleton organization, cell motility and invasiveness (IQ-
GAP1, VCL, ITGB2, ARPC1B, DOCK4, WASF2,
ARHGEF10L, ADORA3), proliferation (SALL1, GLIS3,
PLCE1, EMP1, CSF1R, TLR2, TLR5, AKT2, ITPKC,
NOTCH2), cell cycle progression (CCNL2), stress response
(HMOX1, MT2A), translation efficiency (MKNK2,
MKNK1, RPS6KA1) and complement system (CF1,
C3AR1, C1S, C1QB, C1QC, C2, C1QA, SERPING1). This
result suggests that samples with 1p-19q ROH overexpress
genes that induce cell proliferation and cell motility. Glial
tumor cells are known to express components of the
complement pathway; astrocytes and glial precursors also
express these proteins, playing a role in cell protection
[24]. Inflammation plays a significant role in neural stem
cell self-renewal and migration and can be considered as an
innate immune response. It has been reported that inflam-
matory signals induce stem cells to switch from slow
asymmetrical divisions to rapid symmetrical divisions [25].
We were not able to find differences in inflammatory fea-
tures between tumors with LOH and ROH at 1p-19q on
histopathological analysis. However, the possibility exists
Fig. 4 PCA and hierarchical
clustering analysis including
test set samples. See Fig. 2 for
details. Test set samples are
distinguished from train set by
shadowing in the clustering and
by grey spots in PCA
352 J Neurooncol (2009) 95:343–354
123
that gliomagenic mutations may induce the expression of a
set of genes involved in that response, taking advantage of
their ability to induce cell proliferation and migration, but
without triggering it. For a more detailed discussion about
genes identified in this study, see the supplementary text.
When 1p-19q LOH was first identified as a marker for
good prognosis and chemo-sensitivity, it was suggested
that these alterations could lead to the loss of a tumor
suppressor and of a group of genes involved in chemo-
resistance. The picture emerging from our study seems to
be more complex than the initial explanation. The hedge-
hog (Shh) pathway has been shown to stimulate stemness
and self-renewal of glioma stem cells [26], while pathways
regulated by EGFR, PI3 K/AKT, WNT and NOTCH stim-
ulate tumor cell and glial precursor proliferation [27]. The
loss of 1p and 19q seems to de-repress the expression of a
set of genes counteracting these pathways. A recent study
reported that the translocation t(1;19) does not lead to an
abnormal NOTCH2 structure, because the gene was not
physically rearranged by translocation, and furthermore no
mutations were found in gene sequence analysis [28].
These results show that NOTCH2 does not present classic
tumor suppressor gene characteristics. It is well known that
the Notch family plays a dual role in tumorogenesis [29].
On the other hand, Notch signaling has been shown to
inhibit neuronal differentiation and instruct glial differen-
tiation [30]. In this study we detected differential expres-
sion in BMP2 and NOTCH2, two key partners in this
mechanism, making it possible that NOTCH2 haploinsufi-
ciency could be responsible for the neurogenic gene
expression profile observed in tumors with 1p-19q dele-
tions. The pro-neural expression signature could help to
explain why oligodendroglial tumors with classic mor-
phology more often had a combined loss of 1p-19q.
As a concluding remark, we postulate that LOH at 1p-
19q confers on the cell a global change in gene expression
inducing a pro-neural status that results in a phenotype
presenting restriction to cell migration and proliferation,
reflecting their contribution as prognostic (rather than
predictive) biomarkers. In this line, many authors [31] have
reported longer survival for patients with oligodendroglial
tumors with 1p LOH who did not receive adjuvant therapy
after surgery compared with 1p ROH; in the same way, in a
low-grade glioma series a favorable prognostic effect for
1p-19q losses has been reported in patients never treated
with chemotherapy [32]. Tumors with ROH at 1p-19q
exhibit the opposite characteristics, namely increased cell
migration and proliferation, together with increased trans-
lation efficiency and cell survival.
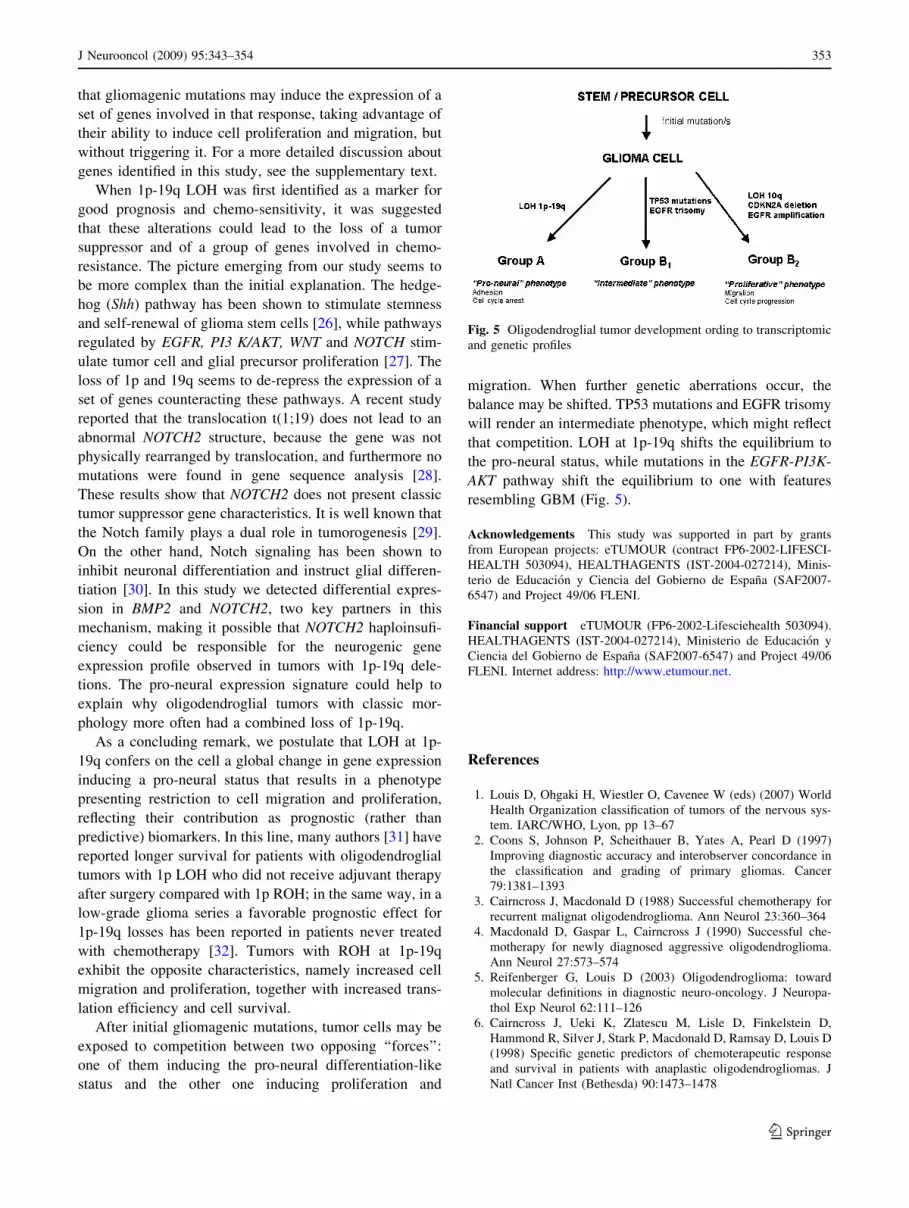
After initial gliomagenic mutations, tumor cells may be
exposed to competition between two opposing ‘‘forces’’:
one of them inducing the pro-neural differentiation-like
status and the other one inducing proliferation and
migration. When further genetic aberrations occur, the
balance may be shifted. TP53 mutations and EGFR trisomy
will render an intermediate phenotype, which might reflect
that competition. LOH at 1p-19q shifts the equilibrium to
the pro-neural status, while mutations in the EGFR-PI3K-
AKT pathway shift the equilibrium to one with features
resembling GBM (Fig. 5).
Acknowledgements This study was supported in part by grants
from European projects: eTUMOUR (contract FP6-2002-LIFESCI-
HEALTH 503094), HEALTHAGENTS (IST-2004-027214), Minis-
terio de Educacion y Ciencia del Gobierno de Espana (SAF2007-
6547) and Project 49/06 FLENI.
Financial support eTUMOUR (FP6-2002-Lifesciehealth 503094).
HEALTHAGENTS (IST-2004-027214), Ministerio de Educacion y
Ciencia del Gobierno de Espana (SAF2007-6547) and Project 49/06
FLENI. Internet address: http://www.etumour.net.
References
1. Louis D, Ohgaki H, Wiestler O, Cavenee W (eds) (2007) World
Health Organization classification of tumors of the nervous sys-
tem. IARC/WHO, Lyon, pp 13–67
2. Coons S, Johnson P, Scheithauer B, Yates A, Pearl D (1997)
Improving diagnostic accuracy and interobserver concordance in
the classification and grading of primary gliomas. Cancer
79:1381–1393
3. Cairncross J, Macdonald D (1988) Successful chemotherapy for
recurrent malignat oligodendroglioma. Ann Neurol 23:360–364
4. Macdonald D, Gaspar L, Cairncross J (1990) Successful che-
motherapy for newly diagnosed aggressive oligodendroglioma.
Ann Neurol 27:573–574
5. Reifenberger G, Louis D (2003) Oligodendroglioma: toward
molecular definitions in diagnostic neuro-oncology. J Neuropa-
thol Exp Neurol 62:111–126
6. Cairncross J, Ueki K, Zlatescu M, Lisle D, Finkelstein D,
Hammond R, Silver J, Stark P, Macdonald D, Ramsay D, Louis D
(1998) Specific genetic predictors of chemoterapeutic response
and survival in patients with anaplastic oligodendrogliomas. J
Natl Cancer Inst (Bethesda) 90:1473–1478
Fig. 5 Oligodendroglial tumor development ording to transcriptomic
and genetic profiles
J Neurooncol (2009) 95:343–354 353
123

7. Smith J, Perry A, Borel T, Lee H, O’Fallon J, Hosek S, Kimmel
D, Yates A, Burger P, Scheithauer B, Jenkins R (2000) Altera-
tions of chromosome arms 1p and 19q as predictors of survival in
oligodendrogliomas, astrocytomas, and mixed oligosatrocytomas.
J Clin Oncol 18:636–645
8. Griffin C, Burger P, Morsberger L, Yonescu R, Swierczynski S,
Weingart J, Murphy K (2006) Identification of der(1;19)
(q10;p10) in five oligodendrogliomas suggests mechanism of
concurrent 1p and 19q loss. J Neuropathol Exp Neurol 65:988–
994
9. Watson M, Perry A, Budhjara V, Hicks C, Shannon W, Rich K
(2001) Gene expression profiling with oligonucleotides micro-
arrays distinguish WHO grade of oligodendrogliomas. Cancer
Res 61:1825–1829
10. Nutt C, Mani D, Betensky R, Tamayo P, Cairncross J, Ladd C,
Pohl U, Hatmann C, McLauglin M, Batchelor T, Black P, von
Deimling A, Pomeroy S, Golub T, Louis D (2003) Gene
expression based classification of malignant gliomas correlates
better with survival than histological classification. Cancer Res
63:1602–1607
11. French P, Swagemakers S, Nagel J, Kouwenhoven M, Brouwer
E, van der Spek P, Luider T, Kros J, van den Bent M, Sillevis
Smitt P (2005) Gene expression profiles associated with treatment
response in oligodendrogliomas. Cancer Res 65:11335–11344
12. Tews B, Felsberg J, Hartmann C, Kunitz A, Hahn M, Toedt G,
Neben K, Hummerich L, von Deimling A, Reifenberger G,
Lichter P (2006) Identification of novel oligodendroglioma-
associated candidate tumor supressor genes in 1p36 and 19q13
using microarrays-based expression profiling. Int J Cancer
119:792–800
13. Mukasa A, Ueki K, Matsumoto S, Tsutsumi S, Nishikawa R,
Fujimaki T, Asai A, Kirino T, Aburatani H (2002) Distinction in
gene expression profile of oligodendrogliomas with and without
allelic loss of 1p. Oncogene 21:3961–3968
14. Li C, Wong W (2001) Model based analysis of oligonucleotide
arrays: expression index computation and outlier detection. Proc
Natl Acad Sci 98:31–36
15. Dudoit S, Fridlyand J, Speed T (2002) Comparision of discrim-
ination methods for the classification of tumours using gene
expression data. J Am Stat Assoc 97:457
16. Al-Shahrour F, Minguez P, Tarraga J, Montaner D, Alloza E,
Vaquerizas J, Conde L, Blaschke C, Vera J, Dopazo J (2006)
BABELOMICS: a systems biology perspective in the functional
annotation of genome-scale experiments. Nucleic Acids Res
(Web Server issue) 34:W472–W476
17. Nigro J, Takahashi M, Ginzinger D, Law M, Passe S, Jenkins R,
Aldape K (2001) Detection of 1p and 19q loss in oligodendro-
glioma by quantitative microsatellite analysis, a real-time quan-
titative polymerase chain reaction assay. Am J Pathol 158:1253–
1262
18. Berggren P, Kumar R, Sakano S, Hemminki L, Wada T, Steineck
G, Adolfsson J, Larsson P, Norming U, Wijkstrom H, Hemminki
K (2003) Detecting homozygous deletions in the CDKN2A(-
p16(INK4a))/ARF(p14(ARF)) gene in urinary bladder cancer
using real-time quantitative PCR. Clin Cancer Res 9:235–242
19. Soong R, Iacopetta B (1997) A rapid and nonisotopic method for
the screening and sequencing of p53 gene mutations in formalin-
fixed, paraffin-embedded tumors. Mod Pathol 10:252–258
20. Ino Y, Betensky R, Zlatescu M, Sasaki H, Macdonald D, Stem-
mer-Rachamimov A, Ramsay D, Cairncross J, Louis D (2001)
Molecular subtypes of anaplastic oligodendroglioma: implica-
tions for patient management at diagnosis. Clin Cancer Res
7:839–845
21. Idbaih A, Marie Y, Pierron G, Brennetot C, Hoang-Xuan K,
Kujas M, Mokhtari K, Sanson M, Lejeune J, Aurias A, Delattre
O, Delattre J (2005) Two types of chromosme 1p losses with
opposite significance in gliomas. Ann Neurol 58:483–487
22. Zlatescu M, Yazdi A, Sasaki H, Megyesi J, Betensky R, Louis D,
Cairncross J (2001) Tumor location and growth pattern correlate
with genetic signature in oligodendroglial neoplasms. Cancer Res
61:6713–6715
23. Lu Q, Sun T, Zhu Z, Ma N, Garcıa M, Stiles C, Rowitch D (2002)
Common developmental requirement for Olig function indicates
a motor neuron/oligodendrocyte connection. Cell 109:75–86
24. Farina C, Aloisi F, Meini E (2007) Astrocytes are active players
in cerebral innate immunity. Trends Immunol 28:138–145
25. Widera D, Kaus A, Kaltschmidt C, Kaltschmidt B (2007) Neural
stem cells, inflammation and NF-kappaB: basic principle of
maintenance and repair or origin of brain tumours? J Cell Mol
Med 12:459–470
26. Clement V, Sanchez P, de Tribolet N, Radovanovic I, Ruiz i
Altaba A (2007) HEDGEHOG-GLI1 signaling regulates human
glioma growth, cancer stem cell self-renewal, and tumorigenicity.
Curr Biol 17:165–172
27. Dressen O, Brivanlou A (2007) Signaling pathways in cancer and
embryonic stem cells. Stem Cell Rev 3:7–17
28. Benetkiewicz M, Idbaih A, Cousin P, Boisselier B, Marie Y,
Criniere E, Hoang-Xuan K, Delattre J, Sanson M, Delattre O
(2009) NOTCH2 is neither rearranged nor mutated in t(1;19)
positive oligodendrogliomas. PLoS ONE 4:e4107
29. Radtke F, Kenneth R (2003) The role of notch in tumorigenesis:
oncogene or tumour suppressor. Nat Rev Cancer 3:756–767
30. Morrison S, Perez S, Qiao Z, Verdi J, Hicks C, Weinmaster G,
Anderson D (2000) Transient Notch activation initiates an irre-
versible switch from neurogenesis to gliogenesis by neural crest
stem cells. Cell 101:499–510
31. Kanner A, Staugaitis S, Castilla E, Chernova O, Prayson R,
Vogelbaum M, Stevens G, Peereboom D, Suh J, Lee S, Tubbs R,
Barnett G (2006) The impact of genotype on outcome in oligo-
dendroglioma: validation of the loss of chromosome arm 1p as an
important factor in clinical decision making. J Neurosurg
104:542–550
32. Mariani L, Deiana G, Vassella E, Fathi A, Arnold M, Murtin,
Vijtai I, Weis J, Siegenthaler P, Schobesberger M, Reinert M
(2006) Loss of heterozygosity 1p36 and 19q13 is a prognostic
factor for overall survival in patients with diffuse WHO grade 2
gliomas treated without chemotherapy. J Clin Oncol 24:4758–
4763
354 J Neurooncol (2009) 95:343–354
123