london properties - the rics report on relativities
TRANSCRIPT

Research
RESEARCH REPORT OCTOBER 2009
RICSRESEARCHLEASEHOLD REFORM: GRAPHS OF RELATIVITY

02
RICS would like to thank the Leasehold Relativities Group for their work in the preparation of this paper. The group was chaired by Jonathan Gaunt, QC, Falcon Chambers, and the members were: Peter Beckett, FRICS, Beckett and Kay; Jennifer Ellis, FRICS, Langley-Taylor; Richard Inniss BSc FRICS FCIArb, South East Surveys; Cerian Jones, BSc FRICS, Cluttons; Laurence Nesbitt, BSc FRICS, Nesbitt and Co; Andrew Pridell, FRICS, Andrew Pridell Associates Ltd; and James Wilson, MRICS FCIArb, W A Ellis.
RICS would like to thank the producers of the various graphs for their consent to reproduce them in this report.
The information in this report can be reproduced without specific agreement, provided the source is noted.
No responsibility is taken for the completeness, correctness or accuracy of the data, and RICS accepts no liability arising from the use of this publication.
©RICS – August 2009
Published by: RICSParliament SquareLondon SW1P 3ADUnited Kingdom

03
01 Introduction 04
02 What is relativity? 05
03 Use of open market sales 06
04 Use of graphs of relativity 07
05 Relativity graphs 09
- Prime Central London 10
- Greater London and England 24
- Published research 36
Contents
LEASEHOLD REFORM: GRAPHS OF RELATIVITY

04
01 Introduction
1.1. In assessing marriage value in a valuation under the leasehold reform legislation, where the lease has 80 years or less unexpired, two values for the subject property are required, both of which are on the assumptions that there are no statutory rights to enfranchise (this is commonly called ‘the no-Act world’) and that any increase in value due to the tenant’s (including predecessors’) improvements is disregarded:
a. The freehold value or, in the case of a new lease, the new leasehold value.
b. The value of the existing lease.
1.2. Although there may be market evidence available of enfranchiseable leases of similar properties, there is unlikely to be any evidence of sales of leases without rights under the Act, since there are few leases these days which would not qualify for a new lease or enfranchisement. This lack of market evidence of unenfranchiseable leases causes the problem which confronts valuers today.
1.3. In their decision in Arrowdell Ltd v Coniston Court (North) Hove Ltd 2006, LRA/72/2005 (the Arrowdell case) the Lands Tribunal observed:
‘57. As we have said above, we have been acutely aware of the difficulty of reaching a satisfactory conclusion on relativity in the light of the inadequacy of the available evidence, and it is clear that this is a problem that is liable to confront LVTs in all such cases. The likelihood is that decisions will be varied and inconsistent, while if local perceptions of relativities are built up as the result of decisions and settlements it is improbable that these will properly reflect no-Act values. Against this background we consider that graphs of relativity are capable of providing the most useful guidance. While it may be that relativities will vary between one type of property and another and from area to area, we think that there is little doubt that the predominant factor is the length of the term. It ought, we believe, to be possible to produce standard graphs, distinguishing between mortgage-dependent markets and those that are not so dependent, on the basis of a survey of assessments
made by experienced valuers addressing themselves properly to the hypothetical no-Act world. We express the hope that the Royal Institution of Chartered Surveyors may find itself able to carry out such an exercise and to produce guidance in the form of standard graphs that can readily be applied by valuers in carrying out enfranchisement valuations. Such graphs could be used as evidence by LVTs, with the relativities shown being applied by them in the absence of evidence compelling the adoption of other figures.’
The RICS established a working group to consider that request.
1.4. It has not been possible for the members of the Working Group to agree upon definitive graphs that could be used for this purpose. Therefore, this report draws together the various graphs of relativity that are in existence together with details of the data that lies behind each. It is hoped that this will provide useful guidance to practitioners considering them.
1.5. In considering the available data the group identified several areas where it has not been possible to reconcile the views of practitioners. These include:
• Longleases
For unexpired terms of over about 90 years there is no agreement on the maximum percentage of freehold value that should be adopted. Opinions range from 95% to 100%.

05
• Onerousgroundrent
Where there is a high ground rent in fact or in prospect (i.e. after a forthcoming review) this has the effect of depressing the value of the existing lease interest and thus the relativity. This is known as an onerous ground rent. The level of rent which has no effect on value is generally accepted to be in the range 0.05% to 0.25% of the freehold vacant possession value. The assumption made in the graphs of relativity is that the ground rent is nominal, so an adjustment will need to be made when valuing an existing lease with an onerous ground rent. The usual method is to capitalise the onerous element of the rent until reversion and to deduct this sum from the “unaffected” existing lease value. However, the basis and rates of capitalisation are not agreed amongst valuers.
• Locationandpropertytype
Relativity may vary according to local markets, mortgage dependency, and other factors. For example relativity in Prime Central London may differ from that applicable in other locations; different relativities may apply to houses as opposed to flats in some markets.
• Deferment rate
It has been suggested that relativity may also vary according to the deferment rate adopted at a particular time or in a particular location. However, this suggestion is not accepted by all practitioners.
• Purchasers may overpay
Purchasers of short/medium term leases may overpay for the interest. For example, they may not take into account the reasonable cost of the freehold interest or a new lease; and the sets of professional fees that they will be liable to pay (their own solicitors’ and valuers’ fees, and the landlord’s recoverable costs).
• Changes in economic conditions
Changes in economic conditions may impact on freehold or leasehold values to a greater or lesser extent, thereby affecting relativity.
2.1. In the context of statutory valuations under leasehold reform legislation, “leasehold relativity” is the value of a dwelling held on an existing lease at any given unexpired term divided by the value of the same dwelling in possession to the freeholder, expressed as a percentage.
2.2. In considering ‘no-Act world’ relativity the following assumptions should be made in respect of the existing lease:
• therightsundertheleaseholdreformActsdonotapply to the dwelling;
• anon-onerousgroundrent;
• noonerousleasetermsandnodefectsintitle.
LEASEHOLD REFORM: GRAPHS OF RELATIVITY
02 What is relativity?

06
03 Use of open market sales
3.1. One method of arriving at a no-Act world value is to consider sales of comparable properties with enfranchisement rights that are held on leases of similar unexpired terms to the subject property, and to make an adjustment to reflect the benefit of rights under the Act. The problem inherent with this method is that there is no reliable market evidence upon which to base the adjustment for rights under the Act.
3.2. In Nailrile Ltd v Earl Cadogan LRA/114/2006 (the Nailrile case) the Lands Tribunal commented:
‘ 228. Looking at the evidence overall we agree with the comments of the Tribunal in Arrowdell:
‘ In such circumstances, in our view, it is necessary for the tribunal to do the best it can with any evidence of transactions that can usefully be applied, even though such transactions take place in the real world rather than the no-Act world. Regard can also be had to graphs of relativity...’
and
‘ 229 (s) Relativity is best established by doing the best one can with such transaction evidence as may be available and graphs of relativity.’
3.3. Some criticisms of this method include:
• Openmarketevidenceofenfranchiseablesalesisso tainted by the effects of the Act that an accurate adjustment cannot be made;
• Anyadjustmentsusedaresubjectiveandnotbasedupon fact.

07
LEASEHOLD REFORM: GRAPHS OF RELATIVITY
04 Use of graphs of relativity
4.1. In Nailrile, the Lands Tribunal commented, in para 228, ‘Regard can also be had to graphs of relativity’. Some practitioners take the relativities from a graph, or a range drawn from a graph or a number of graphs, and apply it to the values that have been established from market evidence.
4.2. There are a number of graphs in existence, compiled by various organisations (for example LEASE (the Leasehold Advisory service) and the College of Estate Management) and firms of surveyors practising in this field. It is noted that:
• Thesupportingdatamaybescatteredquitewidelyon either side of the line;
• Thedifferentgraphsmaygivequitedisparatereadings at a given lease length;
• Thereisnotnecessarilyanydatatosupporttheposition of the line at every lease length;
• Someofthelinesarecomputergenerated,best-fit lines and some are hand drawn.
4.3. It is important, therefore, that users are aware of the bases of the various graphs before deciding which is the most appropriate to use in any particular case; sometimes valuers may use more than one graph which may provide a range of relativities.
4.4. Broadly, the data can be categorised as follows and a given graph may incorporate several different categories of data:
• Settlementevidence:thedatacomesfromanalysesof settlements of claims under the Acts in which the compiler of the graph has been involved. Many practitioners believe settlement evidence to be useful because it gives an indication of a relativity which has been freely negotiated by two valuers acting in the best interests of their clients. However, settlement evidence is open to criticism where the analysis is not agreed between the parties; and settlements per se may tend to become self perpetuating. In addition, any settlement may have been influenced by the Delaforce effect. The
Delaforce effect was originally thought only to apply to a tenant, but it has been accepted that it can apply equally to a landlord.
• Evidenceofnon-enfranchiseablesales:Somegraphs include data derived from open market non-enfranchiseable sales. Whilst such evidence is scarce these days, it was in more plentiful supply before the Leasehold Reform, Housing and Urban Development Act 1993 became law. This type of data can be criticised for being historic, but it provides direct market evidence of unenfranchiseable values. Those who use this evidence say that the relativity indicated by such transactions is untainted by the Act and provides a better indication of no-Act world values than is obtainable by adjusting current open market values.
• Tribunaldecisions:InArrowdell the Lands Tribunal made the following comment: ‘In our judgement LVT decisions on relativity are not inadmissible, but the mere percentage figure adopted in a particular case is of no evidential value’. The background information to the graphs indicates those that include LVT decisions.
• Opinion:Someofthegraphsincorporatevaluers’views, or the views of those consulted, as to the level at which transactions would have taken place as opposed to the level of actual sales. Some graphs are hand drawn and may incorporate the valuer’s view as to how the market would behave between the points for which data exists.

08
04 Use of graphs of relativity
4.5. The graphs have been arranged into three sections which follow:
a. Those compiled by practitioners operating in Prime Central London (PCL);
b. Those compiled by practitioners operating outside PCL;
c. Graphs published in reports of formal research into relativities.
4.6. For leases with very short unexpired terms (say, under 5-10 years), the graphs may be found to be unreliable because, in most cases, they simply have a straight line from zero to the five year point. Most practitioners will establish this value by capitalising the net rental value over the unexpired term. When valuing a lease with a short unexpired term, consideration needs to be given to any dilapidations obligation.

09
LEASEHOLD REFORM: GRAPHS OF RELATIVITY
05 Relativity graphs
Prime Central London 10
• WAEllis 12
• KnightFrank 14
• Cluttons 16
• JohnDWood&Co(1996)andGeraldEve 18
• JohnDWood&Co 20
• CharlesBoston 22
Greater London and England 24
• BeckettandKay(Mortgage–dependent) 26
• SouthEastLeasehold 28
• NesbittandCo 30
• AustinGray 32
• AndrewPridellAssociatesLtd 34
Published research 36
• CollegeofEstateManagement 38
• Savills 40
• TheLeaseholdAdvisoryService(LEASE) 42

10
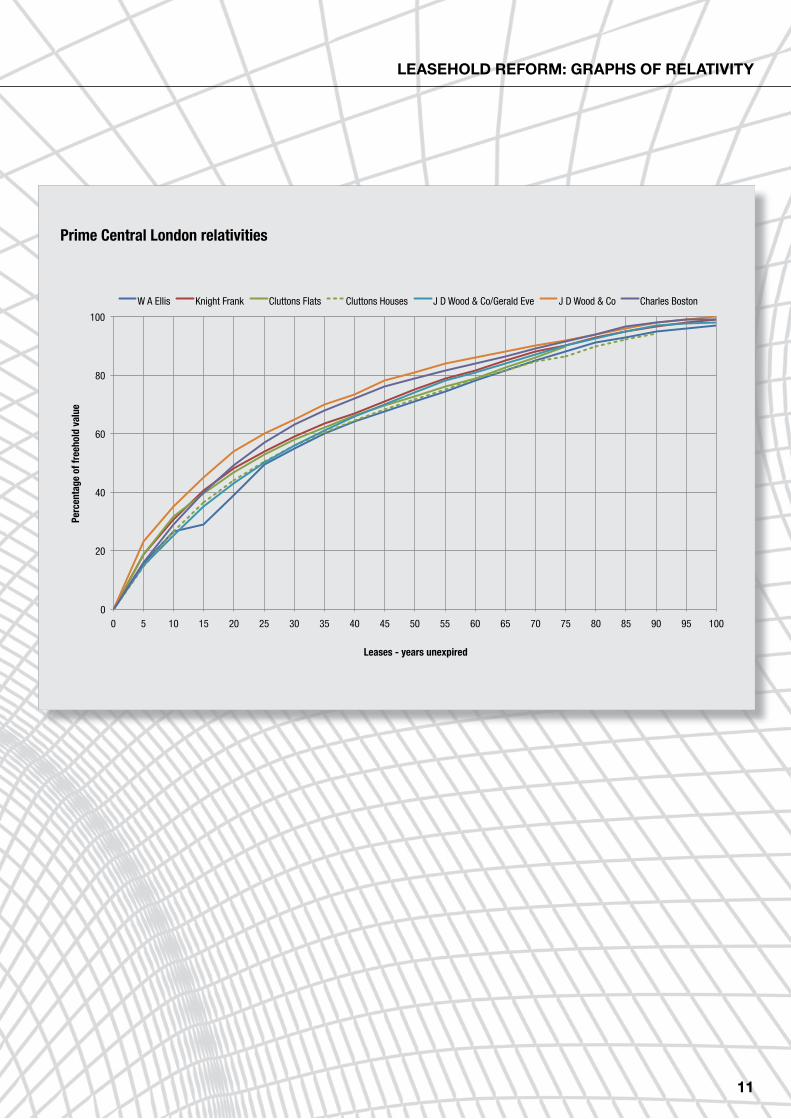
Section 1 – Prime Central London relativities
This section of the report contains the graphs relevant to central London produced by the following firms:
• WAEllis 12
• KnightFrank 14
• Cluttons 16
• JohnDWood&Co(1996)andGeraldEve 18
• JohnDWood&Co 20
• CharlesBoston 22
11
0
20
40
60
80
100
0 5 10 15 20 25 30 35 40 45 50 55 60 65 70 75 80 85 90 95 100
W A Ellis Knight Frank Cluttons Flats Cluttons Houses J D Wood & Co/Gerald Eve J D Wood & Co Charles Boston
Perc
enta
ge o
f fre
ehol
d va
lue
Leases - years unexpired
LEASEHOLD REFORM: GRAPHS OF RELATIVITY
Prime Central London relativities
12
0
20
40
60
80
100
0 5 10 15 20 25 30 35 40 45 50 55 60 65 70 75 80 85 90 95 100
Perc
enta
ge o
f fre
ehol
d va
lue
Leases - years unexpired
Section 1 – Prime Central London relativities
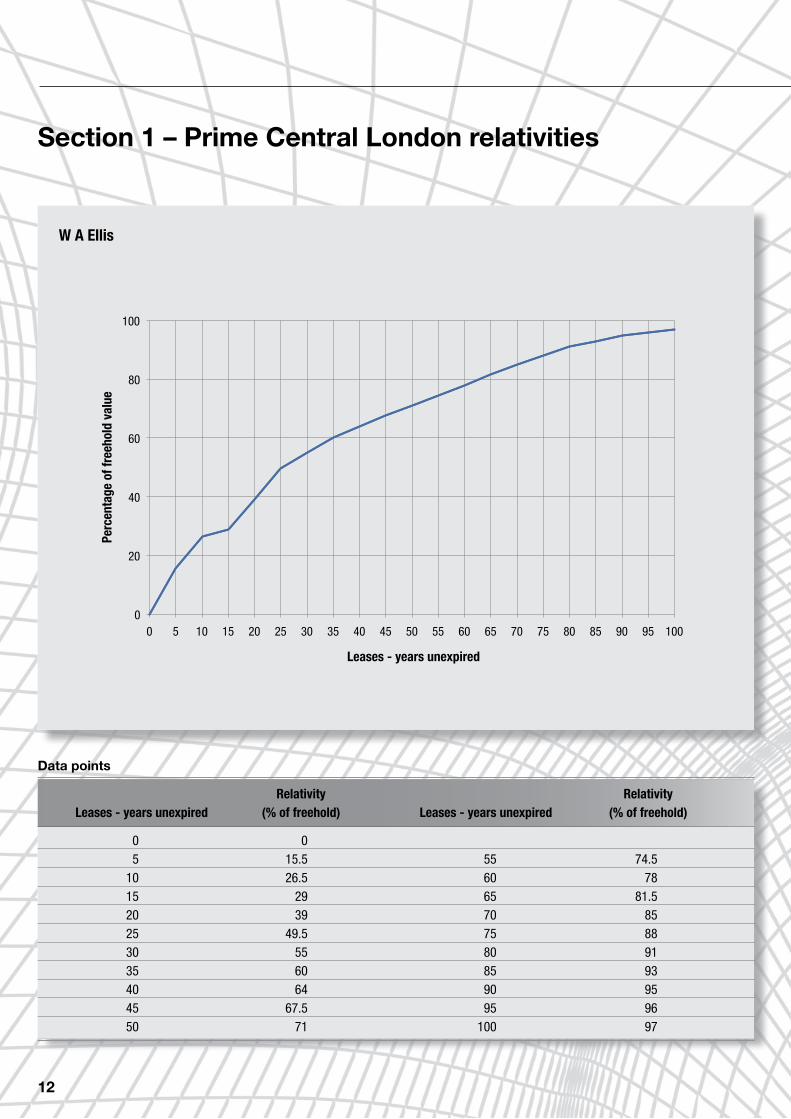
Relativity RelativityLeases - years unexpired (% of freehold) Leases - years unexpired (% of freehold)
0 0 5 15.5 55 74.5 10 26.5 60 78 15 29 65 81.5 20 39 70 85 25 49.5 75 88 30 55 80 91 35 60 85 93 40 64 90 95 45 67.5 95 96 50 71 100 97
Data points
W A Ellis

13
Further information on the graph produced by W A Ellis (as at August 2008)
Types of property and approximate numbers analysed:
100% housesApprox numbers: 200 houses
Geographical spread:
Mayfair,Belgravia,Knightsbridge,Kensington&Chelsea
Time spread of data:
Graph originally published in 2001Data from Mid 1980s onwards
Nature of data:
Transactions
Tenant/landlord:
Equally divided between tenants and landlords
Contact for further information:
www.waellis.co.uk
LEASEHOLD REFORM: GRAPHS OF RELATIVITY
14
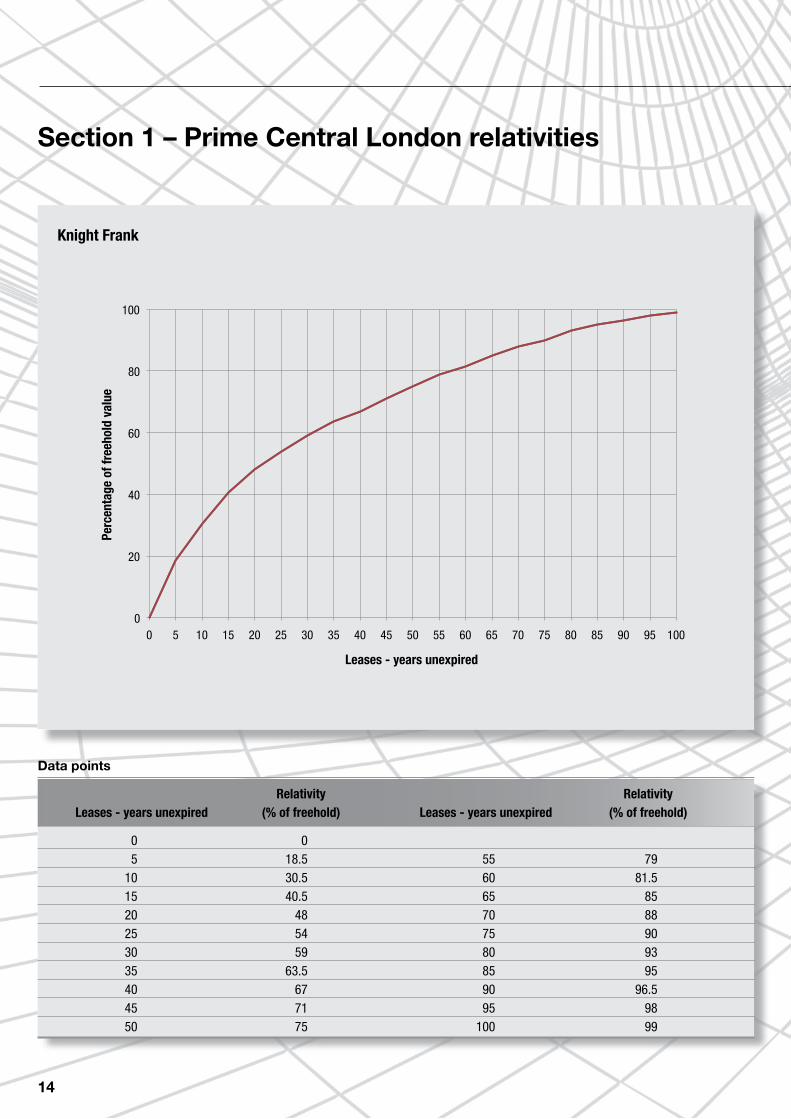
Section 1 – Prime Central London relativities
Relativity RelativityLeases - years unexpired (% of freehold) Leases - years unexpired (% of freehold)
0 0 5 18.5 55 79 10 30.5 60 81.5 15 40.5 65 85 20 48 70 88 25 54 75 90 30 59 80 93 35 63.5 85 95 40 67 90 96.5 45 71 95 98 50 75 100 99
Data points
0
20
40
60
80
100
0 5 10 15 20 25 30 35 40 45 50 55 60 65 70 75 80 85 90 95 100
Perc
enta
ge o
f fre
ehol
d va
lue
Leases - years unexpired
Knight Frank
15
Further information on the graph produced by Knight Frank (as at September 2008)
Types of property and approximate numbers analysed:
Combination of flats and housesApprox numbers: More than 200
Geographical spread:
Mainly Prime Central London (above 75%)
Time spread of data:
2002 onwards
Nature of data:
Settlement, LVT, Lands Tribunal
Tenant/Landlord:
Combination of tenants and landlords
Contact for further information:
LEASEHOLD REFORM: GRAPHS OF RELATIVITY
16
Section 1 – Prime Central London relativities
Relativity RelativityLeases - years unexpired (% of freehold) Leases - years unexpired (% of freehold)
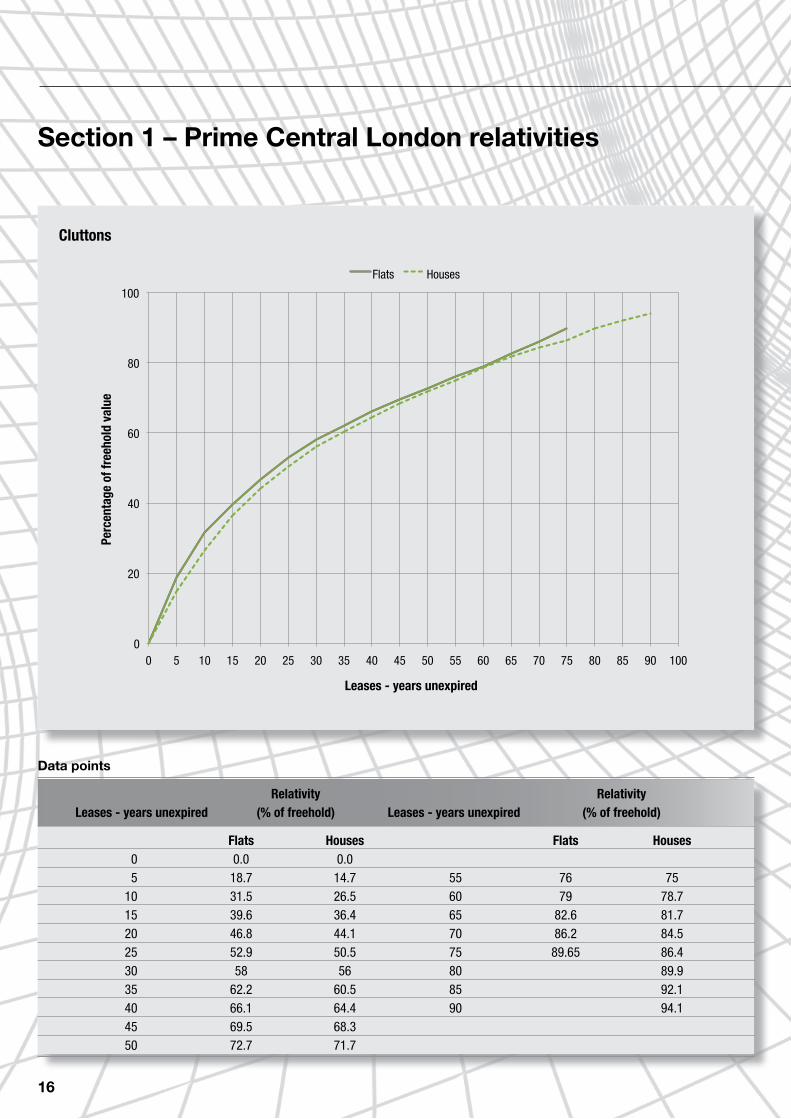
Flats Houses Flats Houses 0 0.0 0.0 5 18.7 14.7 55 76 75 10 31.5 26.5 60 79 78.7 15 39.6 36.4 65 82.6 81.7 20 46.8 44.1 70 86.2 84.5 25 52.9 50.5 75 89.65 86.4 30 58 56 80 89.9 35 62.2 60.5 85 92.1 40 66.1 64.4 90 94.1 45 69.5 68.3 50 72.7 71.7
Data points
0
20
40
60
80
100
0 5 10 15 20 25 30 35 40 45 50 55 60 65 70 75 80 85 90 100
Flats Houses
Perc
enta
ge o
f fre
ehol
d va
lue
Leases - years unexpired
Cluttons

17
Further information on the graph produced by Cluttons (as at November 2008)
Types of property and approximate numbers analysed:
Flats: Around 250 properties Houses: Around 150 properties
Geographical spread:
Flats and houses: NW8, W9, St John’s Wood and Maida Vale
Time spread of data:
Flats: 1996 to present day Houses: 1997 to present day
Nature of data:
Settlement Evidence Tenant/landlord:
Landlord
Contact for further information:
www.cluttons.com
LEASEHOLD REFORM: GRAPHS OF RELATIVITY
18
Section 1 – Prime Central London relativities
Relativity RelativityLeases - years unexpired (% of freehold) Leases - years unexpired (% of freehold)
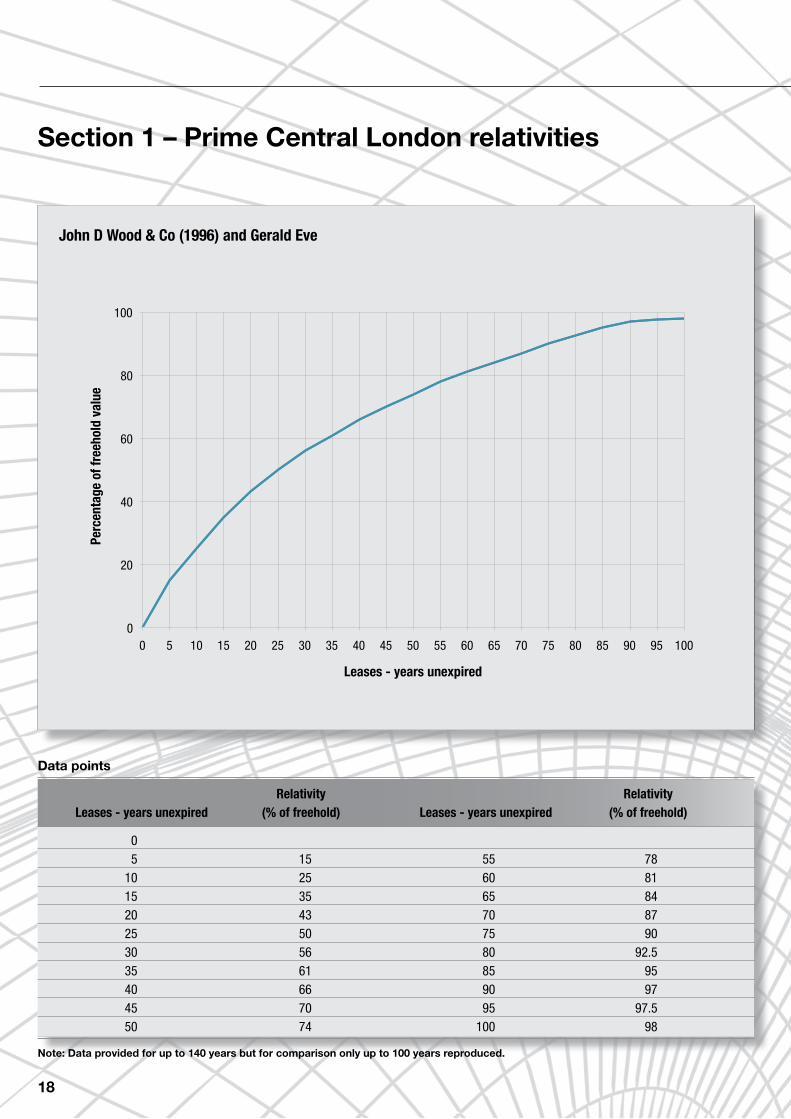
0 5 15 55 78 10 25 60 81 15 35 65 84 20 43 70 87 25 50 75 90 30 56 80 92.5 35 61 85 95 40 66 90 97 45 70 95 97.5 50 74 100 98
Data points
Note: Data provided for up to 140 years but for comparison only up to 100 years reproduced.
Perc
enta
ge o
f fre
ehol
d va
lue
Leases - years unexpired
0
20
40
60
80
100
0 5 10 15 20 25 30 35 40 45 50 55 60 65 70 75 80 85 90 95 100
John D Wood & Co (1996) and Gerald Eve
19
Further information on the graph produced by Gerald Eve, in conjunction with John D Wood & Co, who were commissioned in 1996 by the Grosvenor Estate to compile a graph of leasehold relativities.
Types of property and approximate numbers analysed:
Mainly Houses (above 90%)Approx numbers: Above 200 by 1996Geographical spread:
CentralLondon(W1,SW1,SW3postcodes),comprisingtheGrosvenorBelgravia&MayfairEstatesandthe Cadogan Estate.
Time spread of data:
1974 to 1996
Nature of data:
a. settlements struck between 1974 and 1996 of prices for enfranchisements and lease extensions under the Leasehold Reform 1967, as amended, (houses) and the Leasehold Reform, Housing and Urban Development Act 1993, as amended, (flats). The settlement evidence is the outcome of negotiations. In most cases, both tenants and the landlords were represented by valuers experienced in leasehold reform and who had knowledge of the market at the time.
b. prices realised on sales of non-enfranchiseable leases were used as comparables during the negotiations over the LRA claims referred to in (a) above. There was an abundance of such evidence in the 1970s / 80s.
c. prices realised on sales for freeholds with vacant possession were also used as comparables during negotiations over the LRA claims.
d. opinion derived from market experience.
The leasehold interests are assumed to be subject to nominal ground rents and exclusive of tenants’ rights to enfranchise.
The Graph has been tested continuously by challenges in negotiations and in evidence given to the Leasehold Valuation Tribunal and the Lands Tribunal. The Graph has been reviewed in the light of those challenges. It has not been amended, because it is believed that the evidence that was available then is stronger than that which has emerged since 1996. The underlying reason for this is that since 1993, and more so since 2002, there has been a drastic contraction in the supply of non-enfranchiseable leases, following the fundamental extension of rights to enfranchise permitted by the LRHUDA 1993 and latterly by the Commonhold and Leasehold Reform Act 2002. It is considered that there is no reason for relativity to have changed over time.
Gerald Eve’s data base of settlements for the Grosvenor and Cadogan Estates has grown since 1996 and, in October 2008, includes circa 750 houses, 730 individual flats and 90 blocks of flats. For the majority, these further settlements are consistent with the Graph.
JohnDWood&CowithdrewtheirsupportfortheGraphinMarch2000,whenthatfirmwasnolongerinstructed by Grosvenor.
Tenant/landlord:
The Graph has evolved from Gerald Eve’s advice given to landlords.
Contact for further information:[email protected]
LEASEHOLD REFORM: GRAPHS OF RELATIVITY

Section 1 – Prime Central London relativities
Relativity RelativityLeases - years unexpired (% of freehold) Leases - years unexpired (% of freehold)
0 0 5 23 55 84 10 35 60 86 15 45 65 88 20 54 70 90 25 60 75 92 30 65 80 94 35 70 85 96 40 73.5 90 98 45 78 95 99 50 81 100 100
Data points
0
20
40
60
80
100
0 5 10 15 20 25 30 35 40 45 50 55 60 65 70 75 80 85 90 95 100
Perc
enta
ge o
f fre
ehol
d va
lue
Leases - years unexpired
20
John D Wood & Co

Further information on the chart produced John D Wood & Co. (as at October 2008)
Types of property and approximate numbers analysed:Combination of houses and flats Approx numbers: Over 930 cases
Geographical spread:
Prime Central London
Time spread of data:
From 1978 to 2004
Nature of data:
Graph originally published in June 2004 and maintained.
The data is settlement (including JDW opinion of settlements where explicit agreement on components is not possible) and LVT/LT. There is no transaction evidence within the graph, i.e. No Act sales
Tenant/landlord:
Mainly (above 75%) acting for tenant
Contact for further information:
21
LEASEHOLD REFORM: GRAPHS OF RELATIVITY

22
Section 1 – Prime Central London relativities
Relativity RelativityLeases - years unexpired (% of freehold) Leases - years unexpired (% of freehold)
0 0 5 19.71 55 78 10 32 60 81 15 40 65 84 20 48 70 87 25 55 75 90 30 60 80 93 35 64 85 96 40 68 90 98 45 72 95 99 50 75 100 99
Data points
0
20
40
60
80
100
0 5 10 15 20 25 30 35 40 45 50 55 60 65 70 75 80 85 90 95 100
Perc
enta
ge o
f fre
ehol
d va
lue
Leases - years unexpired
Charles Boston

23
Further information on the graph produced by Charles Boston (as at October 2009)
Types of property and approximate numbers analysed:
Combination of flats and houses Approx numbers: More than 120
Geographical spread:
Primarily Prime Central London but also Greater London
Time spread of data:
1993 to 2009
Nature of data:
Settlement, transaction, LVT
Tenant/landlord:
Mainly (above 75%) acting for tenant
Contact for further information:
LEASEHOLD REFORM: GRAPHS OF RELATIVITY

Section 2 – Greater London and England
This section of the report contains the graphs relevant to Greater London and England produced by the following firms:
• BeckettandKay(Mortgage–dependent) 26
• SouthEastLeasehold 28
• NesbittandCo 30
• AustinGray 32
• AndrewPridellAssociatesLtd 34
24

0
20
40
60
80
100
0 5 10 15 20 25 30 35 40 45 55 60 65 70 75 80 85 90 95 99 100
Beckett and Kay South East LeaseholdNesbitt and Co Austin Gray
Andrew Pridell Ltd
Perc
enta
ge o
f fre
ehol
d va
lue
Leases - years unexpired
25
LEASEHOLD REFORM: GRAPHS OF RELATIVITY
Greater London and England
26
Section 2 – Greater London and England
Relativity RelativityLeases - years unexpired (% of freehold) Leases - years unexpired (% of freehold)
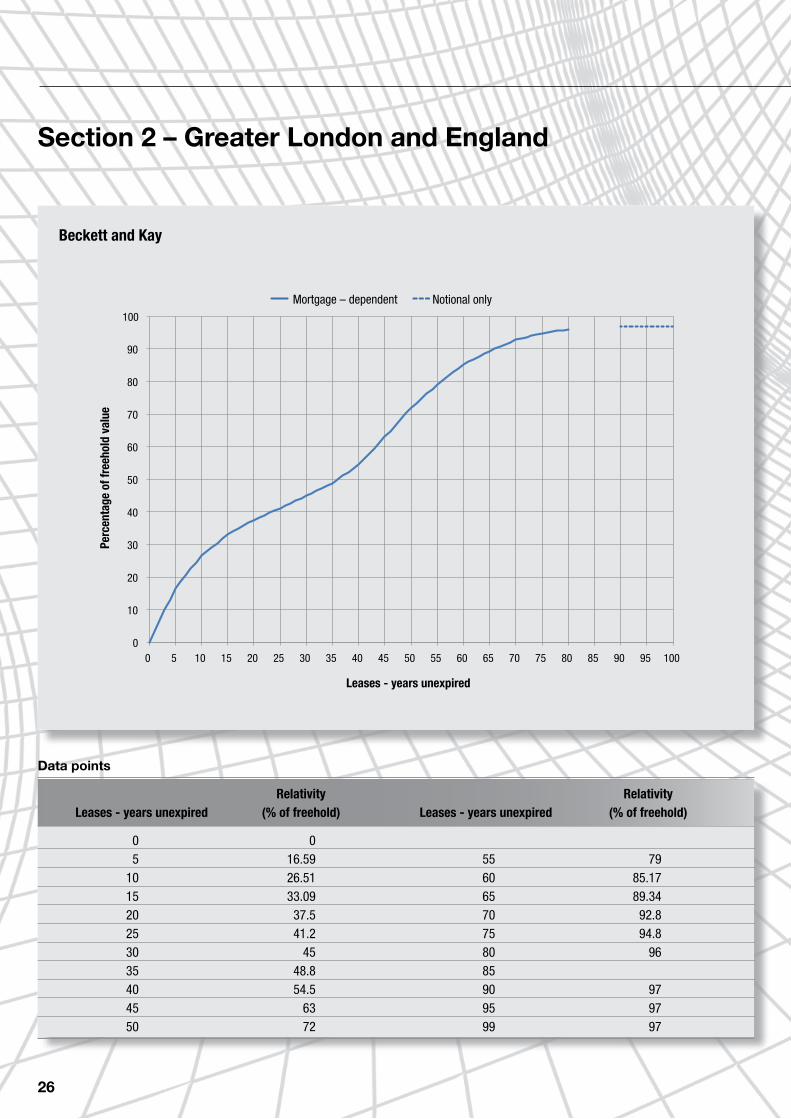
0 0 5 16.59 55 79 10 26.51 60 85.17 15 33.09 65 89.34 20 37.5 70 92.8 25 41.2 75 94.8 30 45 80 96 35 48.8 85 40 54.5 90 97 45 63 95 97 50 72 99 97
Data points
0
10
20
30
40
50
60
70
80
90
100
0 5 10 15 20 25 30 35 40 45 50 55 60 65 70 75 80 85 90 95 100
Perc
enta
ge o
f fre
ehol
d va
lue
Leases - years unexpired
Mortgage – dependent Notional only
Beckett and Kay

27
Further information on the graph produced by Beckett and Kay (as at June 2009)
Types of property and approximate numbers analysed:
The line relates to mortgage-dependent markets, which consist generally of lower value properties. The line was adopted by the Lands Tribunal in Arrowdell, albeit above the more controversial terms unexpired. The extreme upper and lower reaches of the line may be applicable to non-mortgage-dependent markets as well.
Geographical spread:
Non-mortgage-dependent markets are typically in Prime Central London. Mortgage-dependent markets are typically elsewhere.
Time spread of data:
Not applicable
Nature of data:
Opinion
Tenant/landlord:
Most of the firm’s instructions in non-mortgage-dependent markets are for tenants, most in mortgage-dependent markets for landlords.
Contact for further information:
LEASEHOLD REFORM: GRAPHS OF RELATIVITY

Section 2 – Greater London and England
Relativity RelativityLease - years unexpired (% of freehold) Leases - years unexpired (% of freehold)
0 5 55 85 10 60 90 15 65 91 20 70 93 25 75 95 30 68 80 97 35 70 85 100 40 73.5 90 100 45 77 95 100 50 82 100 100
Data points
0
20
40
60
80
100
0 5 10 15 20 25 30 35 40 45 50 55 60 65 70 75 80 85 90 95 100
Perc
enta
ge o
f fre
ehol
d va
lue
Leases - years unexpired
28
South East Leasehold

Further information on the graph produced by South East Leasehold.
Types of property and approximate numbers analysed:
Only flats.Approx numbers: Original research was based on 1,090 flats in LB Bromley of which 560 had sold, 416 (74%) purpose built. Full details obtained on 185 purpose built flats of which 87 had sold in 12 month period. Subsequent rolling programme of checking open market sales of flats in Outer London and the South East.
Geographical spread:
Outer London, primarily Bromley and Beckenham
Time spread of data:
Principally based on open market research including analysis of sales and questionnaires completed by estate agents, undertaken in 1997.
Nature of data:
Transaction.
The original research included converted flats as well as purpose built blocks. Because of the variations in the former it was decided to concentrate on the purpose built flats in the Beckenham area of the London Borough of Bromley, thus limiting the variables.
The initial research indicated that there would not be a smooth curve to the graph as the difference in value between a shorter lease and an assumed 999 year lease was a capital sum within a range of flat values and this meant that the schedule on which the graph is based provided a range. In order to make this graph consistent with other graphs this has been averaged and smoothed.
Tenant/landlord:
Approximately equal number of cases acting for tenants and landlords.
Contact for further information:
www.lease-extension.co.uk
29
LEASEHOLD REFORM: GRAPHS OF RELATIVITY

Section 2 – Greater London and England
Relativity RelativityLease - years unexpired (% of freehold) Leases - years unexpired (% of freehold)
0 5 55 80 10 60 83 15 65 88 20 70 91 25 54 75 93.5 30 58 80 96 35 63 85 97 40 68 90 98 45 72 95 99 50 75 100 100
Data points
0
20
40
60
80
100
0 5 10 15 20 25 30 35 40 45 50 55 60 65 70 75 80 85 90 95 100
Perc
enta
ge o
f fre
ehol
d va
lue
Leases - years unexpired
30
Nesbitt and Co
Further information on the graph produced by Nesbitt and Co (as at June 2009)
Types of property and approximate numbers analysed:
Predominantly flats (above 90%)More than 250.
Geographical spread:
Predominantly Greater London and the outer suburbs. A proportion of provincial towns covering the South coast and Midlands region.
Time spread of data:
1995 to November 2008
Nature of data:
Settlements conducted under the terms of the Act and LVTs where I have appeared.
Tenant/landlord:
Mainly acting for Landlords (above 80%)
Contact for further information:
31
LEASEHOLD REFORM: GRAPHS OF RELATIVITY

32
Section 2 – Greater London and England
Relativity RelativityLeases - years unexpired (% of freehold) Leases - years unexpired (% of freehold)
0 0 5 9.2 55 80.24 10 20.7 60 85.47 15 32.2 65 89.29 20 43.4 70 93.46 25 46.92 75 96.62 30 48.8 80 97.09 35 50 85 97.09 40 52.75 90 97.09 45 63.88 95 97.09 50 75 100 97.09
Data points
0
20
40
60
80
100
0 5 10 15 20 25 30 35 40 45 50 55 60 65 70 75 80 85 90 95 100
Perc
enta
ge o
f fre
ehol
d va
lue
Leases - years unexpired
Austin Gray
33
Further information on the graph produced by Austin Gray (as at November 2008)
Types of property and approximate numbers analysed:
Only FlatsApprox Numbers: 250+
Nature of Data:
Settlement, transaction (including pre-1993), LVT
We have interpreted the Arrowdell Lands Tribunal decision as an important anchor point on our graph. In a pre Act world questionable mortgageability starts to affect the sale price of property more dramatically at 60 years.
We have very limited pre Act sales experience of leases with less than 50 years remaining. This part of the graph relies solely on settlement data which is very limited and on opinion. The assumption has been made that investors will enter the market for leases sub 40 years at around 50% relativity for rental income with a diminishing capital return, for this reason the curve levels somewhat at 40 years.
Geographical Spread:
South East – primarily Brighton and Hove
Time Spread of Data:
Transactional data pre 1993 Questionnaires completed by estate agents 2007Settlement and LVT data 1995 – present.
Tenant / Landlord:
Approximately equal number of cases acting for tenants and landlords
Contact for further information:
www.austingray.co.uk
LEASEHOLD REFORM: GRAPHS OF RELATIVITY

Section 2 – Greater London and England
Relativity RelativityLeases - years unexpired (% of freehold) Leases - years unexpired (% of freehold)
0 0 5 12 55 82.5 10 27 60 86 15 40 65 89 20 52 70 92.5 25 60.5 75 95.5 30 63.25 80 97.5 35 65 85 97.75 40 66.25 90 98.5 45 68 95 99 50 78 100 100
Data points
Perc
enta
ge o
f fre
ehol
d va
lue
Leases - years unexpired
0
20
40
60
80
100
0 5 10 15 20 25 30 35 40 45 50 55 60 65 70 75 80 85 90 95 100
34
Andrew Pridell Associates Ltd

Further information on the graph produced by Andrew Pridell Associates (as at August 2008)
Types of property and approximate numbers analysed:
Flats. Over 500
Geographical spread:
Predominantly the South East and Suburban London
Time spread of data:
6 years
Nature of data:
Opinion, Settlement, transaction, LVT and Lands Tribunal
Tenant/landlord:
Mainly (above 90%) acting for tenantRoughly 10% acting for landlord
Contact for further information:
Andrew Pridell Associates75 Church Road Hove BN3 2FNTel: 01273 202620
35
LEASEHOLD REFORM: GRAPHS OF RELATIVITY

Section 3 – Published research
This section of the report includes graphs incorporated in published research papers by:
• CollegeofEstateManagement 38
• Savills 40
• TheLeaseholdAdvisoryService(LEASE) 42
36

0
20
40
60
80
100
0 5 10 15 20 25 30 35 40 45 50 55 60 65 70 75 80 85 90 95 100
CEM Inner London CEM Rest of England and Wales Savills 1992 Savills 2002 Lease
Perc
enta
ge o
f fre
ehol
d va
lue
Leases - years unexpired
37
LEASEHOLD REFORM: GRAPHS OF RELATIVITY
Published research
38
Section 3 – Published research
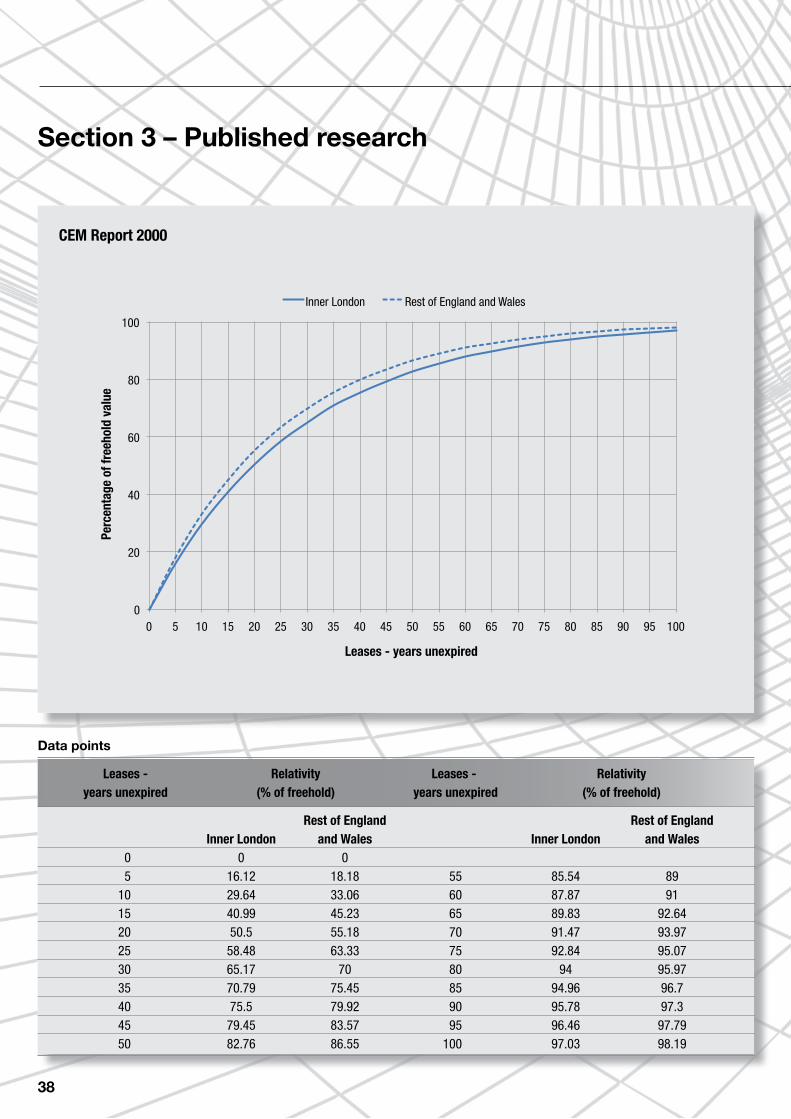
Leases - Relativity Leases - Relativity years unexpired (% of freehold) years unexpired (% of freehold)
Rest of England Rest of England Inner London and Wales Inner London and Wales 0 0 0 5 16.12 18.18 55 85.54 89 10 29.64 33.06 60 87.87 91 15 40.99 45.23 65 89.83 92.64 20 50.5 55.18 70 91.47 93.97 25 58.48 63.33 75 92.84 95.07 30 65.17 70 80 94 95.97 35 70.79 75.45 85 94.96 96.7 40 75.5 79.92 90 95.78 97.3 45 79.45 83.57 95 96.46 97.79 50 82.76 86.55 100 97.03 98.19
Data points
0
20
40
60
80
100
0 5 10 15 20 25 30 35 40 45 50 55 60 65 70 75 80 85 90 95 100
Inner London Rest of England and Wales
Perc
enta
ge o
f fre
ehol
d va
lue
Leases - years unexpired
CEM Report 2000
39
Further information on the graphs reproduced from the College of Estate Management report ‘Relative values’ published in August 2000
Types of property and approximate numbers analysed:
This research set out to explore the scope for prescribing key factors in valuations for the collective enfranchisement and lease extension of flats without seriously compromising the equity of the end results. The research was commissioned by the DETR from the College of Estate Management, Reading and conducted from September 1999 to March 2000. The findings suggest separate formulae for both yields and relativity could be prescribed and that an appropriate cut-off point for ‘de minimis’ or nil marriage value is 90 years. Market data (Valuation Office (VO) transaction data and auction data) was examined but no discernible patterns of yields or relativity emerged, reflecting the imperfect nature of the market. The research conclusions therefore rest on arguments from first principles regarding yield prescription, based on gilt-edged stock benchmarks and risk premia. An analysis of LVT decisions was used to determine relativity prescription and the cut-off point for nil or ‘de minimis’ marriage value.
Geographical spread:
London, England and Wales
Time spread of data:
1994 to 1999
Nature of data:
LVT decisions only
Tenant/landlord:
Not specified
Contact for further information:
The report is available at http://www.cem.ac.uk/ourresearch/reportsandpublications/relativevalues.aspx
LEASEHOLD REFORM: GRAPHS OF RELATIVITY
40
Points interpolated from two year data set
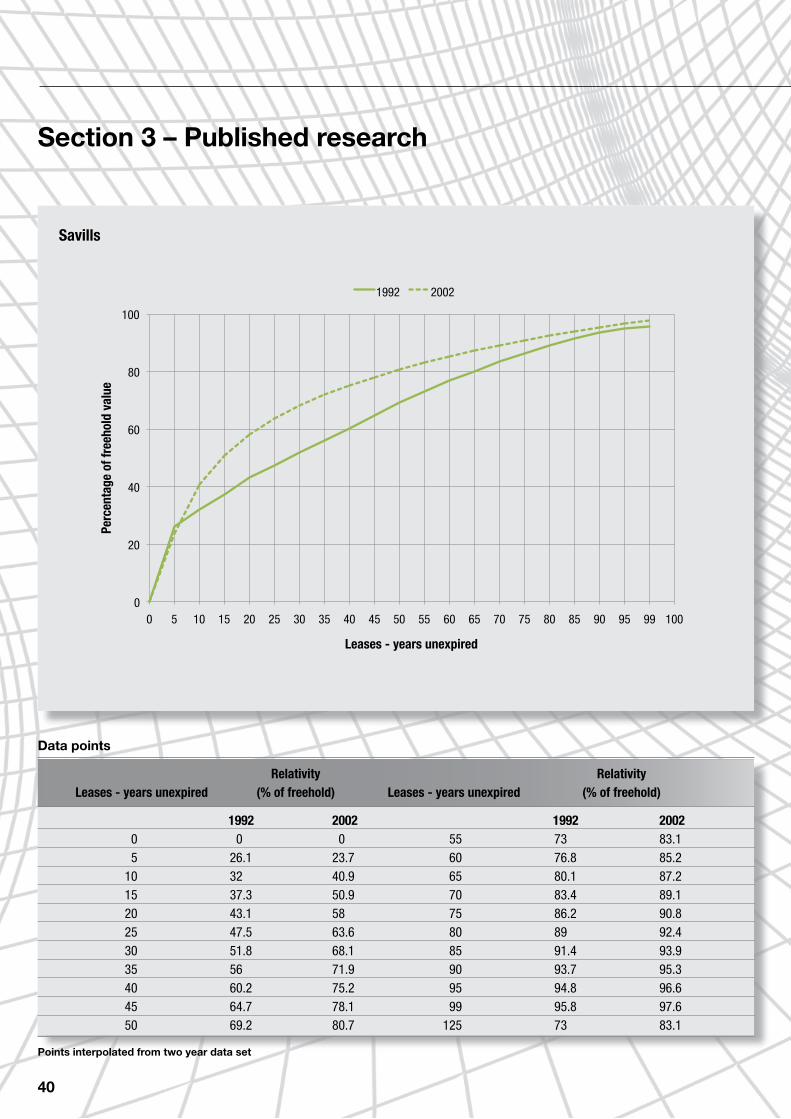
Section 3 – Published research
Relativity RelativityLeases - years unexpired (% of freehold) Leases - years unexpired (% of freehold)
1992 2002 1992 2002 0 0 0 55 73 83.1 5 26.1 23.7 60 76.8 85.2 10 32 40.9 65 80.1 87.2 15 37.3 50.9 70 83.4 89.1 20 43.1 58 75 86.2 90.8 25 47.5 63.6 80 89 92.4 30 51.8 68.1 85 91.4 93.9 35 56 71.9 90 93.7 95.3 40 60.2 75.2 95 94.8 96.6 45 64.7 78.1 99 95.8 97.6 50 69.2 80.7 125 73 83.1
Data points
0
20
40
60
80
100
0 5 10 15 20 25 30 35 40 45 50 55 60 65 70 75 80 85 90 95 99 100
1992 2002
Perc
enta
ge o
f fre
ehol
d va
lue
Leases - years unexpired
Savills

41
Further information from the Savills report ‘The Impact of leasehold reform on the Prime Central London residential market’ published Spring 2003
Types of property and approximate numbers analysed:
Combination of houses and flats based on beacons
Geographical spread:
10 specified central London areas
Time spread of data:
Up to 1992 (prior to the 1993 Act)Revised up to 2002 (includes enfranchisable leases)
Nature of data:
This report contains results of new and independent research into the value of leasehold property in Central London. It follows up on similar research that was conducted in 1992.
FPDSavills have created an up to date, transparent series of leasehold relativity tables for residential property in central London. The data is based on open market valuations for 240 leasehold properties with varying lease lengths across defined market areas in central London.
For each of the properties in the sample we collected sufficient data to enable a desk-top valuation to be made. These valuations were carried out by agents and valuers from thirteen agency and surveying practices who are expert in the particular sub-markets.
Each person was asked to provide three different valuations for a sample of 10 properties under a standard set of assumptions:
1. The open market valuation at the stated lease assuming an enfranchiseable lease;
2. The open market valuation at the stated lease assuming a non-enfranchiseable lease;
3. The freehold value.
Tenant/landlord:
Not applicable
Contact for further information:
www.savills.co.uk
LEASEHOLD REFORM: GRAPHS OF RELATIVITY
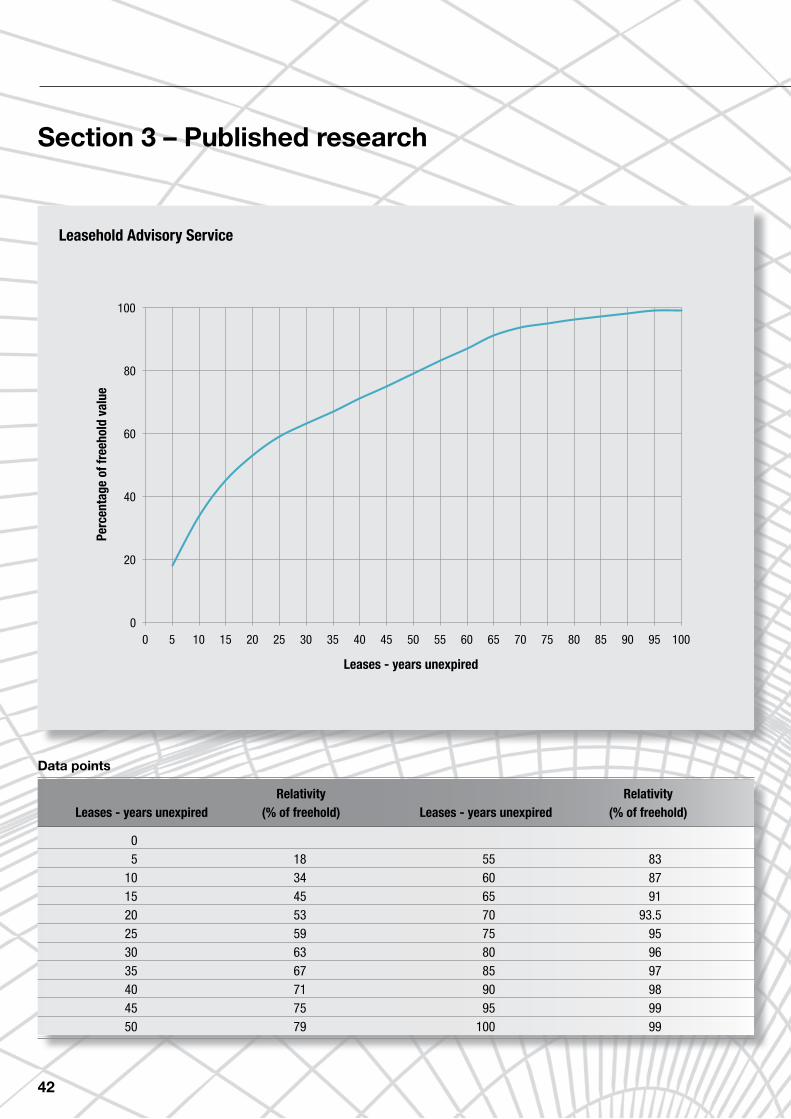
Section 3 – Published research
Relativity RelativityLeases - years unexpired (% of freehold) Leases - years unexpired (% of freehold)
0 5 18 55 83 10 34 60 87 15 45 65 91 20 53 70 93.5 25 59 75 95 30 63 80 96 35 67 85 97 40 71 90 98 45 75 95 99 50 79 100 99
Data points
0
20
40
60
80
100
0 5 10 15 20 25 30 35 40 45 50 55 60 65 70 75 80 85 90 95 100
Perc
enta
ge o
f fre
ehol
d va
lue
Leases - years unexpired
42
Leasehold Advisory Service

Further information on the graph reproduced from The Leasehold Advisory Service (LEASE) web site
Types of property and approximate numbers analysed:
All types of decisions over the stated time period
Geographical spread:
England and Wales
Time spread of data:
1994 - 2007
Nature of data:
Derived from LVT decisions
Tenant/landlord:
Not applicable
Contact for further information:
www.lease-advice.org
43
LEASEHOLD REFORM: GRAPHS OF RELATIVITY

Advancing standards in land, property and construction.
RICS is the world’s leading qualification when it comes to professional standards in land, property and construction.
In a world where more and more people, governments, banks and commercial organisations demand greater certainty of professional standards and ethics, attaining RICS status is the recognised mark of property professionalism.
Over 100 000 property professionals working in the major established and emerging economies of the world have already recognised the importance of securing RICS status by becoming members.
RICS is an independent professional body originally established in the UK by Royal Charter. Since 1868, RICS has been committed to setting and upholding the highest standards of excellence and integrity – providing impartial, authoritative advice on key issues affecting businesses and society.
RICS is a regulator of both its individual members and firms enabling it to maintain the highest standards and providing the basis for unparalleled client confidence in the sector.
RICS has a worldwide network. For further information simply contact the relevant RICS office or our Contact Centre.
RICS HQ
Parliament Square London SW1P 3AD United Kingdom
Worldwide media enquiries:
Contact Centre:
E [email protected] T +44 (0)870 333 1600 F +44 (0)20 7334 3811
Asia Room 1804 Hopewell Centre 183 Queen’s Road East Wanchai Hong Kong
T +852 2537 7117 F +852 2537 2756 [email protected]
Americas 60 East 42nd Street Suite 2918 New York, NY 10165 USA
T +1 212 847 7400 F +1 212 847 7401 [email protected]
Oceania Suite 2, Level 16 1 Castlereagh Street Sydney NSW 2000 Australia
T +61 2 9216 2333 F +61 2 9232 5591 [email protected]
Europe (excluding United Kingdom) Rue Ducale 67 1000 Brussels Belgium
T +32 2 733 10 19 F +32 2 742 97 48 [email protected]
Africa PO Box 3400 Witkoppen 2068 South Africa
T +27 11 467 2857 F +27 86 514 0655 [email protected]
Middle East Office F07, Block 11 Dubai Knowledge Village Dubai United Arab Emirates
T +971 4 375 3074 F +971 4 427 2498 [email protected]
India 48&49CentrumPlaza Sector Road Sector 53, Gurgaon – 122002 India
T +91 124 459 5400 F +91 124 459 5402 [email protected]
United Kingdom Parliament Square London SW1P 3AD United Kingdom
T +44 (0)870 333 1600 F +44 (0)207 334 3811 [email protected]
AU
GU
ST
2009
/VP
/566
RS
rics.org/research