local structural studies of the cubic cd1–xcaxo system through cdk-edge extended x-ray absorption...
TRANSCRIPT
electronic reprintJournal of
SynchrotronRadiation
ISSN 0909-0495
Editor: G. Ice
Local structural studies of the cubic Cd1−−xCaxO systemthrough Cd K-edge extended X-ray absorption spectroscopicstudies
Velaga Srihari, V. Sridharan, Masaharu Nomura, V. Sankara Sastry and C. SSundar
J. Synchrotron Rad. (2012). 19, 541–546
Copyright c© International Union of Crystallography
Author(s) of this paper may load this reprint on their own web site or institutional repository provided thatthis cover page is retained. Republication of this article or its storage in electronic databases other than asspecified above is not permitted without prior permission in writing from the IUCr.
For further information see http://journals.iucr.org/services/authorrights.html
Synchrotron radiation research is rapidly expanding with many new sources of radiationbeing created globally. Synchrotron radiation plays a leading role in pure science andin emerging technologies. The Journal of Synchrotron Radiation provides comprehensivecoverage of the entire field of synchrotron radiation research including instrumentation,theory, computing and scientific applications in areas such as biology, nanoscience andmaterials science. Rapid publication ensures an up-to-date information resource for sci-entists and engineers in the field.
Crystallography Journals Online is available from journals.iucr.org
J. Synchrotron Rad. (2012). 19, 541–546 Velaga Srihari et al. · Local structural studies of the cubic Cd1−−xCaxO
research papers
J. Synchrotron Rad. (2012). 19, 541–546 doi:10.1107/S0909049512018419 541
Journal of
SynchrotronRadiation
ISSN 0909-0495
Received 30 January 2012
Accepted 24 April 2012
# 2012 International Union of Crystallography
Printed in Singapore – all rights reserved
Local structural studies of the cubic Cd1–xCaxOsystem through Cd K-edge extended X-rayabsorption spectroscopic studies
Velaga Srihari,a V. Sridharan,b* Masaharu Nomura,c V. Sankara Sastryb and
C. S Sundarb
aSurface Physics Division, Saha Institute of Nuclear Physics, Kalkata 700064, India, bCondensed
Matter Physics Division, Materials Science Group, Indira Gandhi Centre for Atomic Research,
Kalpakkam 603102, India, and cPhoton Factory, Institute of Materials Structure Science,
High Energy Accelerator Research Organization, Oho 1-1, Tsukuba 305-0801, Japan.
E-mail: [email protected]
Cd K-edge extended X-ray absorption fine-structure spectroscopic studies were
carried out on Cd1–xCaxO (0 � x �0.9) solid solutions and the first and second
nearest neighbour (NN) distances and their mean square relative displacement
�2 were estimated. The first NN distance, dCd–O(x), was found to be smaller than
its expected value, a(x)/2, obtained from the X-ray diffraction measurements. It
increases monotonically and non-linearly with a negative curvature, comparable
with that of the a(x) value variation. The variation �2 of the 1NN with x is
consistent with a disordered solid solution model. The 2NN distances dCd–Cd(x)
and dCd–Ca(x) are found to follow the average values obtained by X-ray
diffraction with dCd–Ca(x) > dCd–Cd(x). From detailed analysis it is argued that the
solid solution exhibits a bimodal distribution of the 1NN distances, dCd–O(x) and
dCa–O(x), and that the system belongs to a persistent type.
Keywords: EXAFS; CdO; CaO; ternary solid solution; oxide semiconductors.
1. Introduction
The effect of local atomic rearrangements on the properties of
semiconductor alloys has been emphasized recently on the
basis of both experimental and theoretical results (Kuzmin et
al., 1993; Tsai et al., 1990; Aldrich et al., 1994; Koteski et al.,
2004). Such studies received further impetus with the avail-
ability of synchrotron radiation facilities to carry out extended
X-ray absorption fine-structure (EXAFS) (Stern, 1974; Lytle
et al., 1975; Stern et al., 1975; Bunker, 2010) and atomic pair
distribution function (PDF) (Egami & Billinge, 2003) studies.
These studies confirm that the local atomic arrangements
show substantial deviation from the average structure, though
the translational symmetry prevails over much larger length
scales (Kuzmin et al., 1995; Lebedev et al., 2001). The effects
of such deviation include the reduced point-group symmetry,
lattice distortions and the modification in the bonding. These
in turn affect the physical, optical and electronic properties,
which are of fundamental importance for the semiconducting
materials. Hence, detailed local structural studies have
become of importance to understand not only the average
structural changes on alloying but also optical and electronic
properties.
Recently we reported a wide and tunable band gap II–VI
semiconducting oxide Cd1–xCaxO system. Although the end
members CdO and CaO crystallize in the NaCl structure with
a lattice parameter mismatch of 2.5%, the lattice parameter
(a) variation of their solid solution deviates from a linear
variation (Vegard’s law). The variation exhibits a negative
curvature characterized by a bowing parameter b = 0.03088
(Srihari et al., 2011). Employing a Williamson–Hall type plot
(Williamson & Hall, 1953) obtained from the profile analysis
of powder X-ray diffraction (XRD), the strain as a function of
Ca substitution was calculated. It is found that the strain is
negligibly small, a generic feature of the oxides. This implies
the absence of strain as a field over the coherently diffracting
volume. This clearly indicates that substitution results in
local structure deviation from the average cubic symmetry,
warranting a detailed structural study at the atomic level.
EXAFS spectroscopy is a widely used tool for such studies and
is preferred over PDF studies since it selectively probes the
local structure around an absorbing species. In this paper we
report Cd K-edge EXAFS studies on the Cd1–xCaxO system.
Our studies indicate that the first nearest neighbour (1NN)
distance dCd–O(x) is smaller than a(x)/2 and exhibits a negative
deviation with a bowing parameter same as that of a(x)/2. On
electronic reprint
the other hand, the second nearest neighbour (2NN) distance
dCd–Cd/Ca(x) closely follows the variation of a(x)/21/2. It is
shown that the 1NN distances dCd–O(x) and dCa–O(x) are
different and the optical properties of this system would
exhibit characteristics of a persistence mode system.
2. Experimental details
Solid solutions of the Cd1–xCaxO system with x = 0, 0.1, 0.2, 0.3,
0.4, 0.5, 0.6, 0.7, 0.8 and 0.9 were prepared by solid state
reaction described in an earlier work (Srihari et al., 2011). Cd
K-edge EXAFS measurements on the Cd1–xCaxO system were
carried out on beamline NW10A of the Photon Factory
Advanced Ring (PF-AR), Tsukuba, Japan (Nomura, 2001;
Nomura et al., 2007). The energy was varied from 500 eV
below the Cd K-absorption edge, E0 (= 26711 eV), to 1100 eV
above it using a Si (311) double-crystal monochromator (d =
1.63747 A). Measurements were carried out on finely ground
powders of the Cd1–xCaxO system. The optimum sample
quantity for each composition was estimated such that the
effective thickness of the sample corresponds to approxi-
mately one absorption length for that composition. The
required quantity of a diluting medium, boron nitride powder,
was thoroughly mixed with the sample and pressed under
moderate pressure into pellets of diameter 10 mm for
measurement. Measurements under ambient conditions were
carried out in transmission mode using ionization chambers
for I0 and It. Energy calibration was carried out using a
standard Cd foil.
3. Data processing and analysis
The absorption spectra were processed using the Athena
software package (Ravel & Newville, 2005) for edge alignment
and pre-edge treatment (�500 to �150 eV before E0) and
background parameters were carefully chosen so that the data
suffer the least from artefacts of such a processing. The post-
edge treatment corresponding to removal of the K-edge
absorption of free Cd2+ ions in the range 100–1100 eV above
E0 was carried out to obtain the EXAFS signal, �(k). The �(k)
signal was then Fourier transformed (FT) in the range 2 A�1 �k � 14.5 A�1 to obtain the real, Re[�(R)], imaginary, Im[�(R)]
and absolute magnitude, |�(R)|, of �(R). The obtained �(R)
was weighted by k3 and fitted to a structural model using
Artemis software (Newville, 2001) to obtain local structural
information; interatomic distances or the effective path length
and mean square relative displacement, �2, with reference to
the absorbing Cd2+ ion. In the analysis, single-scattering (SS)
and multiple-scattering (MS) paths with up to four legs within
a cluster size Rmax = 6 A were included. In the present study,
the fitting was carried out in the range 2 A � Reff � 6 A with
the Hanning window and dR = 1 A; Reff is the effective path
length. Although our primary interest is limited to the first and
second NN, paths with higher Reff need to be included since
they form ‘leakage’ paths into the low-R range.
The following strategy was adopted to incorporate atom
substitution, which is not a standard feature of the Artemis
package. It is assumed that the substitution is random, a fair
assumption for the NaCl-type structure. Additional Ca2+
backscattering paths were included such that for every path
(SS or/and MS paths) involving the Cd2+ ion a corresponding
identical path involving the Ca2+ ion is also present. The
degeneracy N (coordination number in the case of SS paths or
multiplicity in the case of MS paths) of such paths was
proportioned between Cd2+ and Ca2+ paths conforming to the
nominal composition of the sample: NCd = Nx; NCa = N(1 � x).
This methodology provides a scope to extract the EXAFS
parameters of both the 2NN paths, Cd–Cd and Cd–Ca. In the
case of random alloys it is known that the distribution of NN
atoms around the associated average coordination shell is
non-Gaussian (Crozier et al., 1988), especially so in the case of
the Cd1–xCaxO system, wherein the atomic mass difference
between Cd and Ca is large. Hence, the cumulant expansion
method, which does not assume any specific form for the
distribution, was adopted to fit the �(R) signal (Bunker, 2010;
Crozier et al., 1988). Accordingly, the first (C1), second (C2),
third (C3) and fourth (C4) cumulants correspond to the NN
distance or effective (scattering) path length Reff, the mean
square relative displacement (MSRD) �2 of the NN atoms
with reference to the absorbing atom, skewness in the distri-
bution and its weightage, respectively. While fitting, correlated
parameters were consistently floated and it was seen that the
number of floating parameters is always less than the number
of independent parameters Nind, as given by the Nyquist
criteria (Stern, 1993).
Although we have considered 2–6 A for obtaining struc-
tural parameters, the analysis was broken to overlapping
windows in R-space. For a given fitting, only a few paths were
included such that the total number of floated parameters
obeys the Nyquist criteria. In all the fitting procedures the
pairs of correlated parameters, S0 and �2 and E0 and �R,
floated simultaneously. Subsequently, this window range (in R)
was sifted so as to include at least one path of the previous
fitting session and its parameters were fixed. The entire
process was iterated so that good fitting and meaningful errors
in the floated parameter were obtained.
4. Results and discussion
Fig. 1 shows the Cd K-edge absorption spectra of the
Cd1–xCaxO solid solution. The spectra did not show percep-
tible changes in the XANES range (26611–26775 eV), except
for a shift in the position of the first peak to higher energies
with x. This shift implies changes in bond lengths and in the
nature of bonding, corroborating our earlier inference
deduced from the electron density distribution from the
powder XRD data (Srihari et al., 2011). On the other hand,
substantial and systematic changes are observed in the
EXAFS, the k3-weighted signal �(k) (Fig. 2), especially in the
range 4 A�1 � k � 12.5 A�1, indicating changes in the
environment of Cd with Ca substitution. In passing, it is
remarked that the absence of noise in k3�(k), even up to
16 A�1, indicates that the samples are free of pin holes. The
absolute magnitude of �(R) of the solid solution in the range
research papers
542 Velaga Srihari et al. � Local structural studies of the cubic Cd1–xCaxO J. Synchrotron Rad. (2012). 19, 541–546
electronic reprint
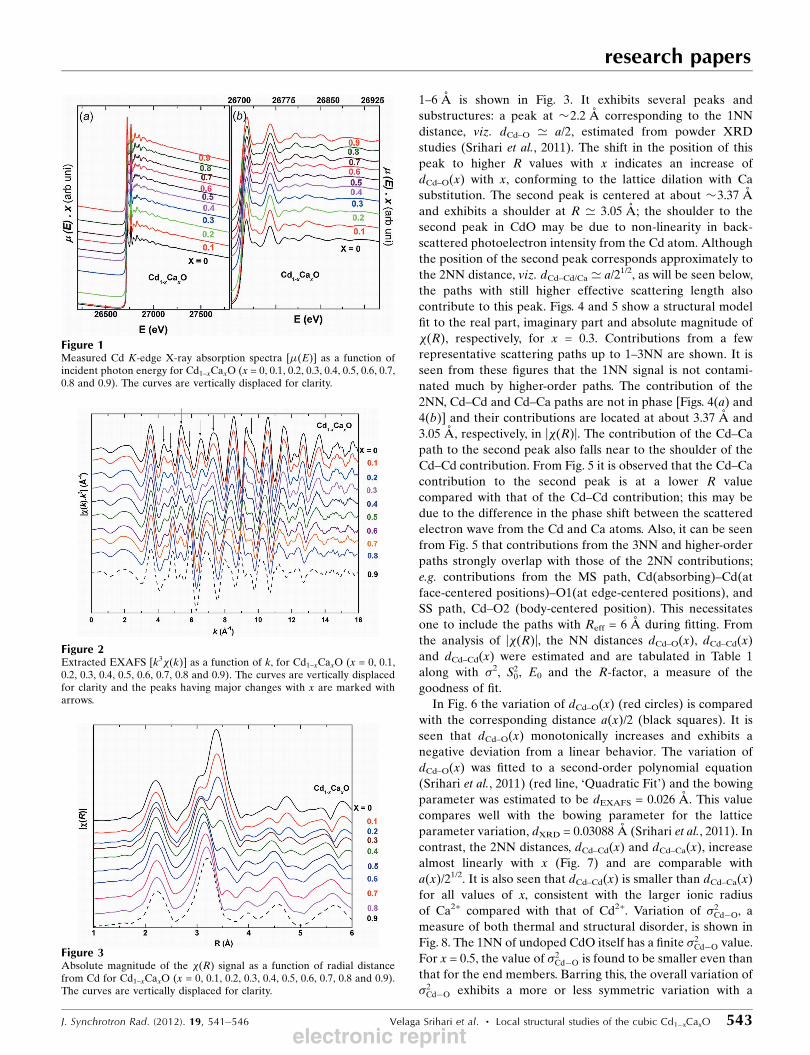
1–6 A is shown in Fig. 3. It exhibits several peaks and
substructures: a peak at �2.2 A corresponding to the 1NN
distance, viz. dCd–O ’ a/2, estimated from powder XRD
studies (Srihari et al., 2011). The shift in the position of this
peak to higher R values with x indicates an increase of
dCd–O(x) with x, conforming to the lattice dilation with Ca
substitution. The second peak is centered at about �3.37 A
and exhibits a shoulder at R ’ 3.05 A; the shoulder to the
second peak in CdO may be due to non-linearity in back-
scattered photoelectron intensity from the Cd atom. Although
the position of the second peak corresponds approximately to
the 2NN distance, viz. dCd–Cd/Ca ’ a/21/2, as will be seen below,
the paths with still higher effective scattering length also
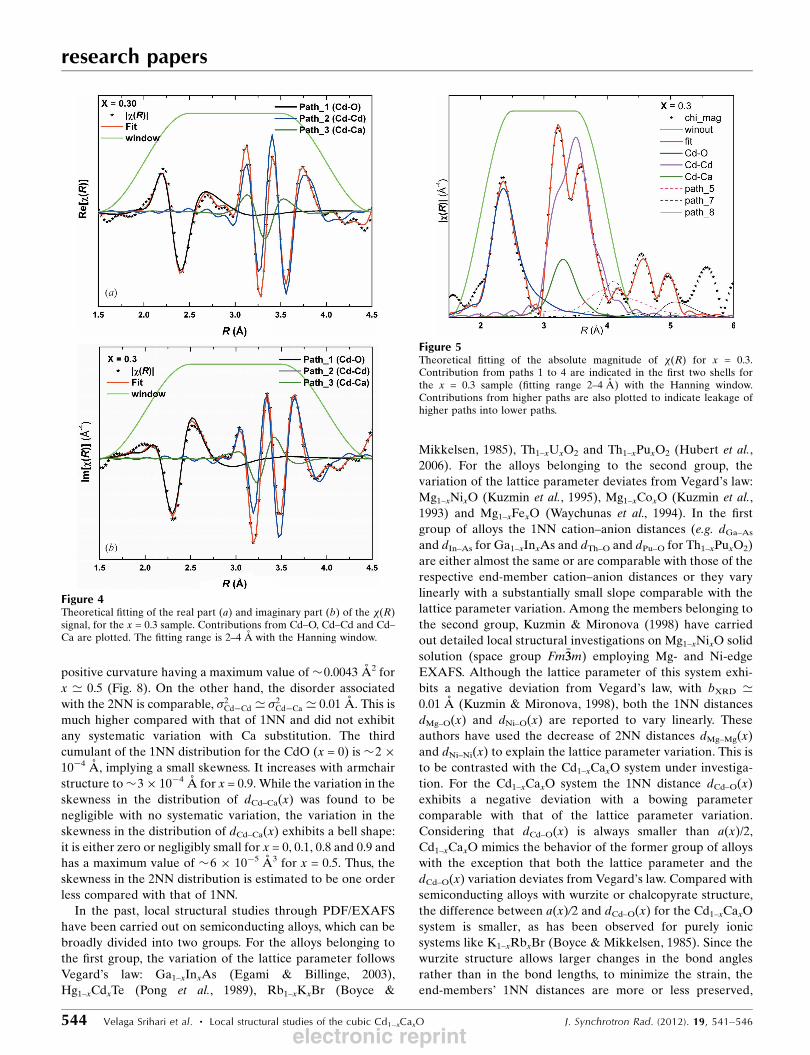
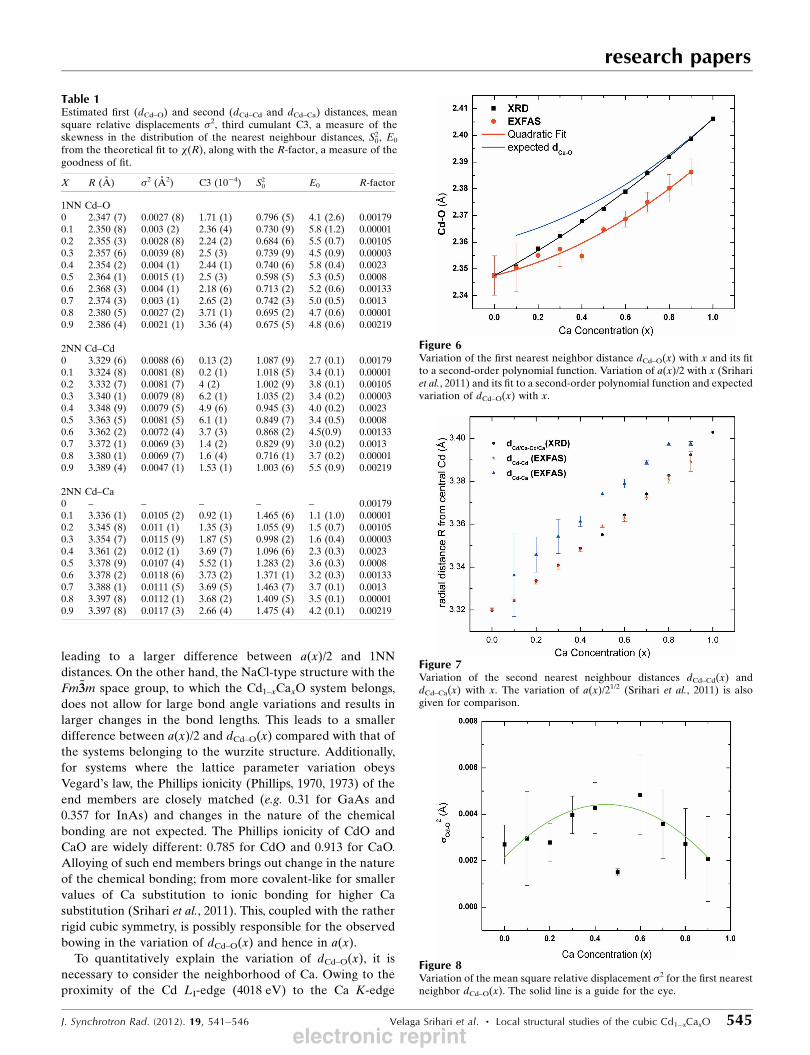
contribute to this peak. Figs. 4 and 5 show a structural model
fit to the real part, imaginary part and absolute magnitude of
�(R), respectively, for x = 0.3. Contributions from a few
representative scattering paths up to 1–3NN are shown. It is
seen from these figures that the 1NN signal is not contami-
nated much by higher-order paths. The contribution of the
2NN, Cd–Cd and Cd–Ca paths are not in phase [Figs. 4(a) and
4(b)] and their contributions are located at about 3.37 A and
3.05 A, respectively, in |�(R)|. The contribution of the Cd–Ca
path to the second peak also falls near to the shoulder of the
Cd–Cd contribution. From Fig. 5 it is observed that the Cd–Ca
contribution to the second peak is at a lower R value
compared with that of the Cd–Cd contribution; this may be
due to the difference in the phase shift between the scattered
electron wave from the Cd and Ca atoms. Also, it can be seen
from Fig. 5 that contributions from the 3NN and higher-order
paths strongly overlap with those of the 2NN contributions;
e.g. contributions from the MS path, Cd(absorbing)–Cd(at
face-centered positions)–O1(at edge-centered positions), and
SS path, Cd–O2 (body-centered position). This necessitates
one to include the paths with Reff = 6 A during fitting. From
the analysis of |�(R)|, the NN distances dCd–O(x), dCd–Cd(x)
and dCd–Cd(x) were estimated and are tabulated in Table 1
along with �2, S20, E0 and the R-factor, a measure of the
goodness of fit.
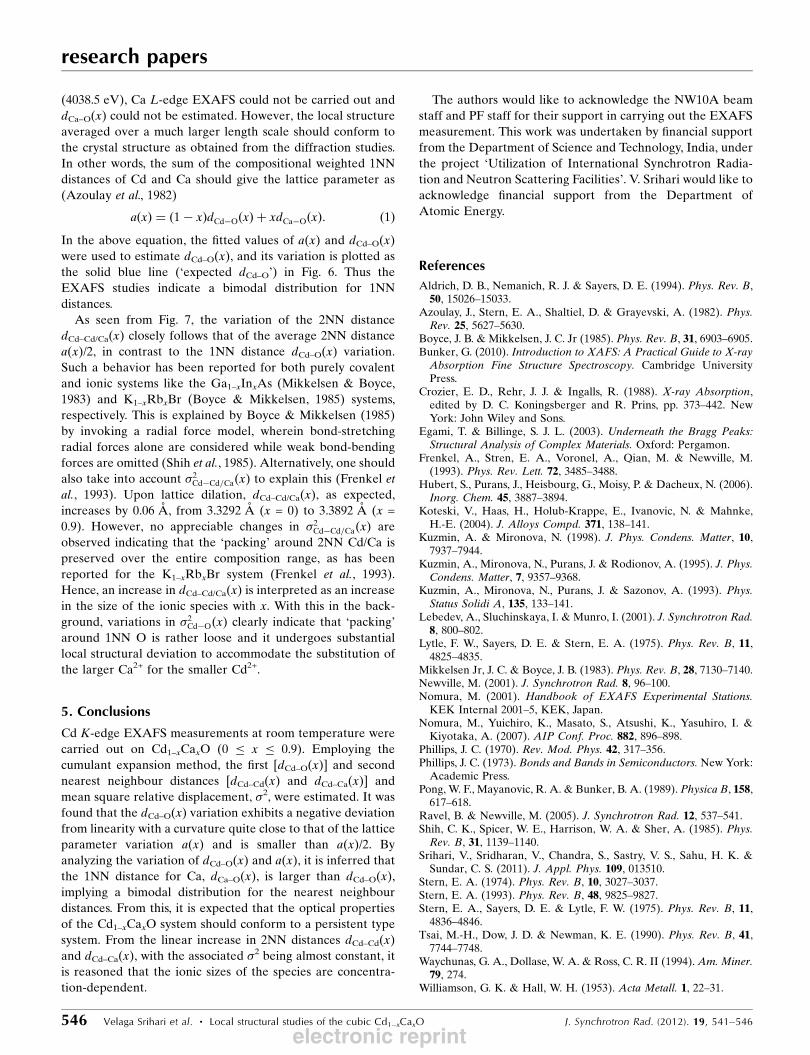
In Fig. 6 the variation of dCd–O(x) (red circles) is compared
with the corresponding distance a(x)/2 (black squares). It is
seen that dCd–O(x) monotonically increases and exhibits a
negative deviation from a linear behavior. The variation of
dCd–O(x) was fitted to a second-order polynomial equation
(Srihari et al., 2011) (red line, ‘Quadratic Fit’) and the bowing
parameter was estimated to be dEXAFS = 0.026 A. This value
compares well with the bowing parameter for the lattice
parameter variation, dXRD = 0.03088 A (Srihari et al., 2011). In
contrast, the 2NN distances, dCd–Cd(x) and dCd–Ca(x), increase
almost linearly with x (Fig. 7) and are comparable with
a(x)/21/2. It is also seen that dCd–Cd(x) is smaller than dCd–Ca(x)
for all values of x, consistent with the larger ionic radius
of Ca2+ compared with that of Cd2+. Variation of �2Cd�O, a
measure of both thermal and structural disorder, is shown in
Fig. 8. The 1NN of undoped CdO itself has a finite �2Cd�O value.
For x = 0.5, the value of �2Cd�O is found to be smaller even than
that for the end members. Barring this, the overall variation of
�2Cd�O exhibits a more or less symmetric variation with a
research papers
J. Synchrotron Rad. (2012). 19, 541–546 Velaga Srihari et al. � Local structural studies of the cubic Cd1–xCaxO 543
Figure 2Extracted EXAFS [k3�(k)] as a function of k, for Cd1–xCaxO (x = 0, 0.1,0.2, 0.3, 0.4, 0.5, 0.6, 0.7, 0.8 and 0.9). The curves are vertically displacedfor clarity and the peaks having major changes with x are marked witharrows.
Figure 3Absolute magnitude of the �(R) signal as a function of radial distancefrom Cd for Cd1–xCaxO (x = 0, 0.1, 0.2, 0.3, 0.4, 0.5, 0.6, 0.7, 0.8 and 0.9).The curves are vertically displaced for clarity.
Figure 1Measured Cd K-edge X-ray absorption spectra [�(E)] as a function ofincident photon energy for Cd1–xCaxO (x = 0, 0.1, 0.2, 0.3, 0.4, 0.5, 0.6, 0.7,0.8 and 0.9). The curves are vertically displaced for clarity.
electronic reprint
positive curvature having a maximum value of �0.0043 A2 for
x ’ 0.5 (Fig. 8). On the other hand, the disorder associated
with the 2NN is comparable, �2Cd�Cd ’ �2
Cd�Ca ’ 0.01 A. This is
much higher compared with that of 1NN and did not exhibit
any systematic variation with Ca substitution. The third
cumulant of the 1NN distribution for the CdO (x = 0) is �2 �10�4 A, implying a small skewness. It increases with armchair
structure to �3 � 10�4 A for x = 0.9. While the variation in the
skewness in the distribution of dCd–Ca(x) was found to be
negligible with no systematic variation, the variation in the
skewness in the distribution of dCd–Ca(x) exhibits a bell shape:
it is either zero or negligibly small for x = 0, 0.1, 0.8 and 0.9 and
has a maximum value of �6 � 10�5 A3 for x = 0.5. Thus, the
skewness in the 2NN distribution is estimated to be one order
less compared with that of 1NN.
In the past, local structural studies through PDF/EXAFS
have been carried out on semiconducting alloys, which can be
broadly divided into two groups. For the alloys belonging to
the first group, the variation of the lattice parameter follows
Vegard’s law: Ga1–xInxAs (Egami & Billinge, 2003),
Hg1–xCdxTe (Pong et al., 1989), Rb1–xKxBr (Boyce &
Mikkelsen, 1985), Th1–xUxO2 and Th1–xPuxO2 (Hubert et al.,
2006). For the alloys belonging to the second group, the
variation of the lattice parameter deviates from Vegard’s law:
Mg1–xNixO (Kuzmin et al., 1995), Mg1–xCoxO (Kuzmin et al.,
1993) and Mg1–xFexO (Waychunas et al., 1994). In the first
group of alloys the 1NN cation–anion distances (e.g. dGa–As
and dIn–As for Ga1–xInxAs and dTh–O and dPu–O for Th1–xPuxO2)
are either almost the same or are comparable with those of the
respective end-member cation–anion distances or they vary
linearly with a substantially small slope comparable with the
lattice parameter variation. Among the members belonging to
the second group, Kuzmin & Mironova (1998) have carried
out detailed local structural investigations on Mg1–xNixO solid
solution (space group Fm�33m) employing Mg- and Ni-edge
EXAFS. Although the lattice parameter of this system exhi-
bits a negative deviation from Vegard’s law, with bXRD ’0.01 A (Kuzmin & Mironova, 1998), both the 1NN distances
dMg–O(x) and dNi–O(x) are reported to vary linearly. These
authors have used the decrease of 2NN distances dMg–Mg(x)
and dNi–Ni(x) to explain the lattice parameter variation. This is
to be contrasted with the Cd1–xCaxO system under investiga-
tion. For the Cd1–xCaxO system the 1NN distance dCd–O(x)
exhibits a negative deviation with a bowing parameter
comparable with that of the lattice parameter variation.
Considering that dCd–O(x) is always smaller than a(x)/2,
Cd1–xCaxO mimics the behavior of the former group of alloys
with the exception that both the lattice parameter and the
dCd–O(x) variation deviates from Vegard’s law. Compared with
semiconducting alloys with wurzite or chalcopyrate structure,
the difference between a(x)/2 and dCd–O(x) for the Cd1–xCaxO
system is smaller, as has been observed for purely ionic
systems like K1–xRbxBr (Boyce & Mikkelsen, 1985). Since the
wurzite structure allows larger changes in the bond angles
rather than in the bond lengths, to minimize the strain, the
end-members’ 1NN distances are more or less preserved,
research papers
544 Velaga Srihari et al. � Local structural studies of the cubic Cd1–xCaxO J. Synchrotron Rad. (2012). 19, 541–546
Figure 4Theoretical fitting of the real part (a) and imaginary part (b) of the �(R)signal, for the x = 0.3 sample. Contributions from Cd–O, Cd–Cd and Cd–Ca are plotted. The fitting range is 2–4 A with the Hanning window.
Figure 5Theoretical fitting of the absolute magnitude of �(R) for x = 0.3.Contribution from paths 1 to 4 are indicated in the first two shells forthe x = 0.3 sample (fitting range 2–4 A) with the Hanning window.Contributions from higher paths are also plotted to indicate leakage ofhigher paths into lower paths.
electronic reprint
leading to a larger difference between a(x)/2 and 1NN
distances. On the other hand, the NaCl-type structure with the
Fm�33m space group, to which the Cd1–xCaxO system belongs,
does not allow for large bond angle variations and results in
larger changes in the bond lengths. This leads to a smaller
difference between a(x)/2 and dCd–O(x) compared with that of
the systems belonging to the wurzite structure. Additionally,
for systems where the lattice parameter variation obeys
Vegard’s law, the Phillips ionicity (Phillips, 1970, 1973) of the
end members are closely matched (e.g. 0.31 for GaAs and
0.357 for InAs) and changes in the nature of the chemical
bonding are not expected. The Phillips ionicity of CdO and
CaO are widely different: 0.785 for CdO and 0.913 for CaO.
Alloying of such end members brings out change in the nature
of the chemical bonding; from more covalent-like for smaller
values of Ca substitution to ionic bonding for higher Ca
substitution (Srihari et al., 2011). This, coupled with the rather
rigid cubic symmetry, is possibly responsible for the observed
bowing in the variation of dCd–O(x) and hence in a(x).
To quantitatively explain the variation of dCd–O(x), it is
necessary to consider the neighborhood of Ca. Owing to the
proximity of the Cd LI-edge (4018 eV) to the Ca K-edge
research papers
J. Synchrotron Rad. (2012). 19, 541–546 Velaga Srihari et al. � Local structural studies of the cubic Cd1–xCaxO 545
Table 1Estimated first (dCd–O) and second (dCd–Cd and dCd–Ca) distances, meansquare relative displacements �2, third cumulant C3, a measure of theskewness in the distribution of the nearest neighbour distances, S2
0, E0
from the theoretical fit to �(R), along with the R-factor, a measure of thegoodness of fit.
X R (A) �2 (A2) C3 (10�4) S20 E0 R-factor
1NN Cd–O0 2.347 (7) 0.0027 (8) 1.71 (1) 0.796 (5) 4.1 (2.6) 0.001790.1 2.350 (8) 0.003 (2) 2.36 (4) 0.730 (9) 5.8 (1.2) 0.000010.2 2.355 (3) 0.0028 (8) 2.24 (2) 0.684 (6) 5.5 (0.7) 0.001050.3 2.357 (6) 0.0039 (8) 2.5 (3) 0.739 (9) 4.5 (0.9) 0.000030.4 2.354 (2) 0.004 (1) 2.44 (1) 0.740 (6) 5.8 (0.4) 0.00230.5 2.364 (1) 0.0015 (1) 2.5 (3) 0.598 (5) 5.3 (0.5) 0.00080.6 2.368 (3) 0.004 (1) 2.18 (6) 0.713 (2) 5.2 (0.6) 0.001330.7 2.374 (3) 0.003 (1) 2.65 (2) 0.742 (3) 5.0 (0.5) 0.00130.8 2.380 (5) 0.0027 (2) 3.71 (1) 0.695 (2) 4.7 (0.6) 0.000010.9 2.386 (4) 0.0021 (1) 3.36 (4) 0.675 (5) 4.8 (0.6) 0.00219
2NN Cd–Cd0 3.329 (6) 0.0088 (6) 0.13 (2) 1.087 (9) 2.7 (0.1) 0.001790.1 3.324 (8) 0.0081 (8) 0.2 (1) 1.018 (5) 3.4 (0.1) 0.000010.2 3.332 (7) 0.0081 (7) 4 (2) 1.002 (9) 3.8 (0.1) 0.001050.3 3.340 (1) 0.0079 (8) 6.2 (1) 1.035 (2) 3.4 (0.2) 0.000030.4 3.348 (9) 0.0079 (5) 4.9 (6) 0.945 (3) 4.0 (0.2) 0.00230.5 3.363 (5) 0.0081 (5) 6.1 (1) 0.849 (7) 3.4 (0.5) 0.00080.6 3.362 (2) 0.0072 (4) 3.7 (3) 0.868 (2) 4.5(0.9) 0.001330.7 3.372 (1) 0.0069 (3) 1.4 (2) 0.829 (9) 3.0 (0.2) 0.00130.8 3.380 (1) 0.0069 (7) 1.6 (4) 0.716 (1) 3.7 (0.2) 0.000010.9 3.389 (4) 0.0047 (1) 1.53 (1) 1.003 (6) 5.5 (0.9) 0.00219
2NN Cd–Ca0 – – – – – 0.001790.1 3.336 (1) 0.0105 (2) 0.92 (1) 1.465 (6) 1.1 (1.0) 0.000010.2 3.345 (8) 0.011 (1) 1.35 (3) 1.055 (9) 1.5 (0.7) 0.001050.3 3.354 (7) 0.0115 (9) 1.87 (5) 0.998 (2) 1.6 (0.4) 0.000030.4 3.361 (2) 0.012 (1) 3.69 (7) 1.096 (6) 2.3 (0.3) 0.00230.5 3.378 (9) 0.0107 (4) 5.52 (1) 1.283 (2) 3.6 (0.3) 0.00080.6 3.378 (2) 0.0118 (6) 3.73 (2) 1.371 (1) 3.2 (0.3) 0.001330.7 3.388 (1) 0.0111 (5) 3.69 (5) 1.463 (7) 3.7 (0.1) 0.00130.8 3.397 (8) 0.0112 (1) 3.68 (2) 1.409 (5) 3.5 (0.1) 0.000010.9 3.397 (8) 0.0117 (3) 2.66 (4) 1.475 (4) 4.2 (0.1) 0.00219
Figure 6Variation of the first nearest neighbor distance dCd–O(x) with x and its fitto a second-order polynomial function. Variation of a(x)/2 with x (Srihariet al., 2011) and its fit to a second-order polynomial function and expectedvariation of dCd–O(x) with x.
Figure 7Variation of the second nearest neighbour distances dCd–Cd(x) anddCd–Ca(x) with x. The variation of a(x)/21/2 (Srihari et al., 2011) is alsogiven for comparison.
Figure 8Variation of the mean square relative displacement �2 for the first nearestneighbor dCd–O(x). The solid line is a guide for the eye.
electronic reprint
(4038.5 eV), Ca L-edge EXAFS could not be carried out and
dCa–O(x) could not be estimated. However, the local structure
averaged over a much larger length scale should conform to
the crystal structure as obtained from the diffraction studies.
In other words, the sum of the compositional weighted 1NN
distances of Cd and Ca should give the lattice parameter as
(Azoulay et al., 1982)
aðxÞ ¼ ð1 � xÞdCd�OðxÞ þ xdCa�OðxÞ: ð1ÞIn the above equation, the fitted values of a(x) and dCd–O(x)
were used to estimate dCd–O(x), and its variation is plotted as
the solid blue line (‘expected dCd–O’) in Fig. 6. Thus the
EXAFS studies indicate a bimodal distribution for 1NN
distances.
As seen from Fig. 7, the variation of the 2NN distance
dCd–Cd/Ca(x) closely follows that of the average 2NN distance
a(x)/2, in contrast to the 1NN distance dCd–O(x) variation.
Such a behavior has been reported for both purely covalent
and ionic systems like the Ga1–xInxAs (Mikkelsen & Boyce,
1983) and K1–xRbxBr (Boyce & Mikkelsen, 1985) systems,
respectively. This is explained by Boyce & Mikkelsen (1985)
by invoking a radial force model, wherein bond-stretching
radial forces alone are considered while weak bond-bending
forces are omitted (Shih et al., 1985). Alternatively, one should
also take into account �2Cd�Cd=Ca(x) to explain this (Frenkel et
al., 1993). Upon lattice dilation, dCd–Cd/Ca(x), as expected,
increases by 0.06 A, from 3.3292 A (x = 0) to 3.3892 A (x =
0.9). However, no appreciable changes in �2Cd�Cd=Ca(x) are
observed indicating that the ‘packing’ around 2NN Cd/Ca is
preserved over the entire composition range, as has been
reported for the K1–xRbxBr system (Frenkel et al., 1993).
Hence, an increase in dCd–Cd/Ca(x) is interpreted as an increase
in the size of the ionic species with x. With this in the back-
ground, variations in �2Cd�O(x) clearly indicate that ‘packing’
around 1NN O is rather loose and it undergoes substantial
local structural deviation to accommodate the substitution of
the larger Ca2+ for the smaller Cd2+.
5. Conclusions
Cd K-edge EXAFS measurements at room temperature were
carried out on Cd1–xCaxO (0 � x � 0.9). Employing the
cumulant expansion method, the first [dCd–O(x)] and second
nearest neighbour distances [dCd–Cd(x) and dCd–Ca(x)] and
mean square relative displacement, �2, were estimated. It was
found that the dCd–O(x) variation exhibits a negative deviation
from linearity with a curvature quite close to that of the lattice
parameter variation a(x) and is smaller than a(x)/2. By
analyzing the variation of dCd–O(x) and a(x), it is inferred that
the 1NN distance for Ca, dCa–O(x), is larger than dCd–O(x),
implying a bimodal distribution for the nearest neighbour
distances. From this, it is expected that the optical properties
of the Cd1–xCaxO system should conform to a persistent type
system. From the linear increase in 2NN distances dCd–Cd(x)
and dCd–Ca(x), with the associated �2 being almost constant, it
is reasoned that the ionic sizes of the species are concentra-
tion-dependent.
The authors would like to acknowledge the NW10A beam
staff and PF staff for their support in carrying out the EXAFS
measurement. This work was undertaken by financial support
from the Department of Science and Technology, India, under
the project ‘Utilization of International Synchrotron Radia-
tion and Neutron Scattering Facilities’. V. Srihari would like to
acknowledge financial support from the Department of
Atomic Energy.
References
Aldrich, D. B., Nemanich, R. J. & Sayers, D. E. (1994). Phys. Rev. B,50, 15026–15033.
Azoulay, J., Stern, E. A., Shaltiel, D. & Grayevski, A. (1982). Phys.Rev. 25, 5627–5630.
Boyce, J. B. & Mikkelsen, J. C. Jr (1985). Phys. Rev. B, 31, 6903–6905.Bunker, G. (2010). Introduction to XAFS: A Practical Guide to X-ray
Absorption Fine Structure Spectroscopy. Cambridge UniversityPress.
Crozier, E. D., Rehr, J. J. & Ingalls, R. (1988). X-ray Absorption,edited by D. C. Koningsberger and R. Prins, pp. 373–442. NewYork: John Wiley and Sons.
Egami, T. & Billinge, S. J. L. (2003). Underneath the Bragg Peaks:Structural Analysis of Complex Materials. Oxford: Pergamon.
Frenkel, A., Stren, E. A., Voronel, A., Qian, M. & Newville, M.(1993). Phys. Rev. Lett. 72, 3485–3488.
Hubert, S., Purans, J., Heisbourg, G., Moisy, P. & Dacheux, N. (2006).Inorg. Chem. 45, 3887–3894.
Koteski, V., Haas, H., Holub-Krappe, E., Ivanovic, N. & Mahnke,H.-E. (2004). J. Alloys Compd. 371, 138–141.
Kuzmin, A. & Mironova, N. (1998). J. Phys. Condens. Matter, 10,7937–7944.
Kuzmin, A., Mironova, N., Purans, J. & Rodionov, A. (1995). J. Phys.Condens. Matter, 7, 9357–9368.
Kuzmin, A., Mironova, N., Purans, J. & Sazonov, A. (1993). Phys.Status Solidi A, 135, 133–141.
Lebedev, A., Sluchinskaya, I. & Munro, I. (2001). J. Synchrotron Rad.8, 800–802.
Lytle, F. W., Sayers, D. E. & Stern, E. A. (1975). Phys. Rev. B, 11,4825–4835.
Mikkelsen Jr, J. C. & Boyce, J. B. (1983). Phys. Rev. B, 28, 7130–7140.Newville, M. (2001). J. Synchrotron Rad. 8, 96–100.Nomura, M. (2001). Handbook of EXAFS Experimental Stations.
KEK Internal 2001–5, KEK, Japan.Nomura, M., Yuichiro, K., Masato, S., Atsushi, K., Yasuhiro, I. &
Kiyotaka, A. (2007). AIP Conf. Proc. 882, 896–898.Phillips, J. C. (1970). Rev. Mod. Phys. 42, 317–356.Phillips, J. C. (1973). Bonds and Bands in Semiconductors. New York:
Academic Press.Pong, W. F., Mayanovic, R. A. & Bunker, B. A. (1989). Physica B, 158,
617–618.Ravel, B. & Newville, M. (2005). J. Synchrotron Rad. 12, 537–541.Shih, C. K., Spicer, W. E., Harrison, W. A. & Sher, A. (1985). Phys.
Rev. B, 31, 1139–1140.Srihari, V., Sridharan, V., Chandra, S., Sastry, V. S., Sahu, H. K. &
Sundar, C. S. (2011). J. Appl. Phys. 109, 013510.Stern, E. A. (1974). Phys. Rev. B, 10, 3027–3037.Stern, E. A. (1993). Phys. Rev. B, 48, 9825–9827.Stern, E. A., Sayers, D. E. & Lytle, F. W. (1975). Phys. Rev. B, 11,
4836–4846.Tsai, M.-H., Dow, J. D. & Newman, K. E. (1990). Phys. Rev. B, 41,
7744–7748.Waychunas, G. A., Dollase, W. A. & Ross, C. R. II (1994). Am. Miner.79, 274.
Williamson, G. K. & Hall, W. H. (1953). Acta Metall. 1, 22–31.
research papers
546 Velaga Srihari et al. � Local structural studies of the cubic Cd1–xCaxO J. Synchrotron Rad. (2012). 19, 541–546
electronic reprint