loan repayment under sugar beans and banana contract farming in irrigation schemes in chipinge...
TRANSCRIPT

i
A comparative assessment of factors influencing loan repayment under
contract farming for sugar-beans and bananas in Mutema and Chibuwe-
Musikavanhu irrigation schemes in Chipinge district.
A DISSERTATION SUBMITTED
IN PARTIAL FULFILMENT OF THE REQUIREMENTS FOR THE
DEGREE OF MASTER OF SCIENCEAGRIBUSINESS
BY
THOMAS TSAHA
FACULTY OF AGRICULTURE AND NATURAL RESOURCES
AFRICA UNIVERSITY
2015
ii
ABSTRACT
Contract farming offers finance and creates reliable market linkages for farmers as
well as supply of raw-materials to agro-processors. The contract farming
relationship is dependent on loan repayment by contracted farmers. Therefore the
main objective of this study was to find the factors influencing loan repayment
under contract farming. A total of 134 questionnaires were administered through
face-to-face interviews for sugar-beans and banana contract farmers, structured
schedules for sugar-beans contractors and unstructured interviews. The study was
conducted inirrigation schemes in Chipinge District, located in the south-eastern
part of Manicaland Province.One-Way ANOVA and Decision Tree Analysis were
concurrently used to ascertain the primary predictors that influence loan
repayment and out of ten independent variables only four variables were
statistically significant (p≤0.05) to influence loan repayment for sugar-beans
contracts. These are age of contract farmer, number of trainings attended,
household size and output. Multivariate Approach was also used to determine the
linear regression model for the study and only two predictors were found to be
statistically significant in influencing loan repayment. These are number of
trainings attended and age of contract farmer. The loans issued were concessionary
in nature.The contractors did not request for collateral from contract farmers. Two-
tier screening mechanism was found to be a mitigation measure to minimize loan
defaults, whereby all farmers in need of contract loans are vetted by their
Irrigation Management Committee and then by Agriculture Extension officers.
Reducing of funding and group lending were the other mitigation measures found
to reducethe default rate. Insuring of risks associated with agriculture activities
should be designed to minimize exposure of parties in contract farming. Group
lending and training of farmers are recommended as ways to enhance contract
farmers’ capacity to repay their loans and ensure sustainability of the contract
farming arrangement.
iii
DECLARATION
I, Thomas Tsaha, (Student ID: 991119), declare that the work contained in this
dissertation is my own original work, where other people’s work has been used it
is properly acknowledged and referenced in accordance with departmental
requirements. I have not used work previously produced by me or another person
for degree purposes at this university or any other university.
_______________________________ ________________________
Student’s name: Thomas Tsaha Date
_______________________________ ________________________
Supervisor: Mrs M. Mrema Date

iv
COPYRIGHT
No part of this thesis shall be reproduced, stored or duplicated in any retrieval system or
transmitted in any form or by any means for scholarly purposes without prior written
permission of the author or Africa University on behalf of the author.

v
ACKNOWLEDGEMENTS
This research study was achieved through the assistance of many organizations
and persons who are acknowledged here: -
The Faculty of Agriculture and Natural Resources at Africa University and
theirrespective staff who provided me with initial guidance to undertake research
in Chipinge District. Special mention goes to my supervisor MrsMrema I am very
grateful for your assistance, patience and guidance in the entire research process
and Dr L. Dube who gave the initial insight of undertaking the research process.
The support given by Mr Kennedy Zimunya and his fellow colleagues working for
Fintrac Inc. Zimbabwe among them Mr Mark Benzon, Gift Chidoko and
GodknowsMasunda and many others who contributed in various ways to the
information required for this researchis greatly appreciated.
I am grateful to the Agritex Officers in Chipinge District. Special mention goes to
Mr. Chagwesha, Mr.Pondo, Mr.Chitekuteku and Mr. D. Mlambo and their team.
In Mutema Irrigation Scheme I thank Ms.Mayakayaka andMr.Mutocho.
I thank Mr. Gary Ngara for assistingin the statistical analysis process of the
research.
My appreciationalso goes to my fellow classmatesat Africa University for keeping
Last but not least, my sincere gratitude to my familywhose unwavering support is
beyond words to describe I thank you.
And to all, who in one way or the other contributed to my study, may God richly
bless you.

vi
DEDICATION
To my familyI dedicate this study,especially Daniel, my father, for the unwavering
support and inspiration to forge against odds.
vii
TABLE OFCONTENTS
ABSTRACT .................................................................................................................................... i
DECLARATION ......................................................................................................................... iii
COPYRIGHT ............................................................................................................................... iv
ACKNOWLEDGEMENTS ......................................................................................................... v
DEDICATION ............................................................................................................................. vi
TABLE OF CONTENTS ........................................................................................................... vii
LIST OF TABLES ........................................................................................................................ x
LIST OF FIGURES ..................................................................................................................... xi
APPENDICES ............................................................................................................................ xiii
CHAPTER ONE: INTRODUCTION .........................................................................................1
1.1 Background .........................................................................................................................1
1.2 Statement of the problem ...................................................................................................3
1.3 Justification for the study ...................................................................................................4
1.4 Research objectives .............................................................................................................6
Overall Objective ..................................................................................................................6
Specific Aims .........................................................................................................................7
1.5 Research questions ..............................................................................................................7
1.6 Ethical considerations .........................................................................................................7
1.7 Limitations and delimitation for the study .......................................................................8
1.8 Scope of the study ...............................................................................................................9
1.9 Significance and value of the study ................................................................................ 10
CHAPTER TWO: LITERATURE REVIEW ......................................................................... 13
2.1 Contract farming arrangements in Zimbabwe ............................................................. 13
2.2 Contract farming models ................................................................................................ 15
2.3 Sources of finance for farmers ........................................................................................ 16
2.4 Key enablers for access to finance and loan repayment performance ........................ 22
2.5 Factors influencing loan repayment performance ........................................................ 25
Demographic factors .......................................................................................................... 25
Agronomic factors .............................................................................................................. 28
Financial factors ................................................................................................................. 30
Socio-economic factors ...................................................................................................... 33
Political factors ................................................................................................................... 34

viii
2.6 Types of loans and their conditions ................................................................................ 36
Zimbabwe context .............................................................................................................. 38
2.7 Mitigation measures to avert loan defaulting ................................................................ 42
CHAPTER THREE: METHODOLOGY ................................................................................ 44
3.1 Research design ................................................................................................................ 44
3.2 Area of study .................................................................................................................... 44
3.3 Study population and sampling technique .................................................................... 48
The Sample and the Sampling Techniques ...................................................................... 49
Determination of the study’s sample size ......................................................................... 50
Determination of unit of analysis ...................................................................................... 51
3.4 Data collection .................................................................................................................. 52
Research instruments used for the study ......................................................................... 53
Data analysis and presentation ......................................................................................... 54
CHAPTER FOUR: RESULTS AND DISCUSSION .............................................................. 58
4.1 Response rate of the respondents in the study .............................................................. 58
4.3 Reliability analysis results ............................................................................................... 59
4.4 Demographic results of the study ................................................................................... 59
Gender distribution of contract farmers ......................................................................... 59
Distribution of contract farmers by marital status ......................................................... 60
Distribution of contract farmers by age ........................................................................... 61
Distribution of contract farmers by household size ........................................................ 62
Number of school-going children ..................................................................................... 63
4.5 Sugar-beans farmers production and sales performance ............................................ 64
Sugar-beans harvested, sold and retained output in kilograms (kgs) ........................... 65
Yield (t/ha) of contracted sugar-beans ............................................................................. 67
Revenue (US$) for sugar-beans contract farmers. .......................................................... 68
4.6 Banana farmers production and sales performance ..................................................... 69
4.7 Default status .................................................................................................................... 73
4.8 Farming characteristics ................................................................................................... 74
Source of labor for all contract farmers .......................................................................... 74
Number of trainings attended by contract farmer ......................................................... 75
Number of Agritex Officer’s visit per week .................................................................... 77
4.9 Factors influencing loan repayment for sugar-beans contract .................................... 78
ix
Age as a factor influencing loan repayment .................................................................... 80
Household size as a Factor influencing loan repayment for sugar-beans ..................... 81
Number of trainings attended by farmer as a factor influencing loan repayment ...... 83
Cross validation – factors affecting loan repayment for sugar-beans contract............ 85
4.10 Determinants of loan default – Output ........................................................................ 87
4.11 Linear regression model for the study ......................................................................... 91
4.12 Types and conditions of loans issued under contract farming in study area ........... 95
4.13 Mitigation measures to reduce default risk by farmers ............................................. 99
4.14Discussion of the research findings ............................................................................. 101
Gender............................................................................................................................... 102
Marital status ................................................................................................................... 102
Age of contract farmer .................................................................................................... 103
Household size of contract farmer and source of labor ................................................ 104
Number of school-going children ................................................................................... 105
Output, yield and revenue for sugar-beans contract .................................................... 106
Number of trainings attended by contract farmer ....................................................... 107
Number of Agritex Officer’s visits per week ................................................................. 108
Banana contract farming loan repayment performance .............................................. 109
CHAPTER 5: SUMMARY, CONCLUSION AND RECOMMENDATIONS ................... 110
5.1 Summary of the study .................................................................................................... 110
Factors influencing loan repayment under contract farming. ..................................... 111
Type and the conditions of loans offered to farmers under contract farming. .......... 112
Mitigation measures to avert defaults among contract farmers. ................................. 113
5.2 Conclusion ...................................................................................................................... 114
5.3 Recommendations .......................................................................................................... 116
REFERENCES......................................................................................................................... 120
APPENDICES .......................................................................................................................... 127

x
LIST OF TABLES
Table 2.1: Contract farming players in Zimbabwe 13
Table 2.2: Contract farming models and characteristics 15
Table 2.3: Informal sources of finance and their characteristics 17
Table 3.1: Information on Chibuwe-Musikavanhu Irrigation Schemes 45
Table 3.2: Important information relating to the Irrigation Schemes 46
Table 3.3: Population size of the study 48
Table 3.4: Working sample size of the study 50
Table 3.5: List of Key informants 53
Table 3.6: Independent variables investigated for the study 55
Table 4.1: Questionnaire Response rate 57
Table 4.2 Reliability Analysis of research questionnaire 58
Table 4.3: ANOVA Analysis – Eight independent variables 78
Table 4.4: Classification Accuracy (Risk Estimate) – Age and Default Status 80
Table 4.5: Classification Accuracy (Risk Estimate) – household size 81
Table 4.6: Classification Accuracy (Risk Estimate) – Training 84
Table 4.7: t-Test Group Statisticsfor independent variables 85
Table 4.8: ANOVA Analysis – Determinants of Loan Defaults 87
Table 4.9: Group Statistics – Output levels of sugar-beans in kilograms 89
Table 4.10: Co-variances of primary independent variables 91
Table 4.11 Regression model summary for sugar-beans contract farmers 92
Table 4.12: Regression weights for independent variables 93
Table 4.13: Regression coefficients of four primary independent variables 93

xi
LIST OF FIGURES
Figure 1: Symbiotic relationship under contract farming 2
Figure 2: Credit distribution from Banks in Zimbabwe 2009-2014 38
Figure 3: Loans from commercial banks in Zimbabwe to Agriculture sector 39
Figure 4: Musikavanhu Constituency location of Irrigation Schemes in
ManicalandProvince 44
Figure 5: FAO irrigation statistics 2013 46
Figure 6: Distribution by gender of the contract farmers 59
Figure 7: Distribution of contract farmers by marital status 60
Figure 8: Age distribution of contract farmers for sugar-beans and bananas 61
Figure 9: Distribution of contract farmers by household size 62
Figure 10: Distribution of farmers by number of school-going children 63
Figure 11: Sugar-beans plot in Chibuwe-Musikavanhu under flood irrigation
system 64
Figure 12: Consolidated graph showing average output for sugar-beans 65
Figure 13: Average sugar-beans yield per contract farmer 67
Figure14: Average sugar-beans revenue (US$) distribution per contact farmer 68
Figure 15: Average banana sales (kgs) per contract farmer 69
Figure 16: Average banana yield (t/ha) achieved by contract farmer 70
Figure 17: Average banana revenue earned by contract farmer in US$ 71
Figure 18: Banana plot in Mutema Irrigation Scheme irrigated using
micro-jet system 72
Figure 19: Default status of sugar-beans contract farmers 72
Figure 20: Source of labor for all contract farmers 74
xii
Figure 21: Number of trainings attended by contract farmer 75
Figure 22: Number of Agritexofficer’s visits/week 76
Figure 23: Decision Tree Analysis – age and default status 79
Figure 24: Decision Tree Analysis – household size 82
Figure 25: Decision Tree Analysis – Number of trainings attended by
contract farmer 83
Figure 26: Correlations of primary independent variables-sugar-beans farmers 91
Figure 27: Loans issued to sugar-beans contract farmers in value (US$) 95
Figure 28: Form of loanas required by all contract farmers 97
Figure 29: Zim-AIED and Agritex officials witness handover of inputs to farmers 98
Figure 30: Factors leading to default under contract farming 110

xiii
APPENDICES
Appendix 1: ANOVA Analysis – Determinants of Loan Defaults ...................................................... 126
Appendix 2: Banana contract farmers questionnaire ........................................................................... 127
Appendix 3: Sugar-beans contract farmers questionnaire ................................................................... 130
Appendix 4: Assessment of Sugar-beans Contract Performance for 2012-2014 by
Agritex Officers ................................................................................................................................... 133
Appendix 5: Sugar-beans Loan performance schedule by contractor from 2012 to
2014……………………………………………………………………………………133

1
CHAPTER ONE: INTRODUCTION
1.1 Background
With the introduction of the multi-currency regime a set of new challenges emerged in
the Zimbabwe financial landscape. The first being liquidity constraints to service the
dire need of credit in the economy in order to revive all socio-economic sectors
including agriculture which had virtually collapsed (Gono 2010). These major monetary
changes in February 2009 (Kramarenko, Engtrom, Verdieret al2010) also brought in
new paradigms in the financial markets and credit access systems in Zimbabwe. This
had a direct impact on the agricultural financing models in Zimbabwe.
One model that had always existed and that crossed over in the new monetary
dispensation was the offering of loans to contract farmers by major agro-commodity
buyers. These arrangements are done directly between the contract farmer and the
respective agro-commodity buyer. An intermediary can also be nominated by the agro-
commodity dealer especially a commercial bank to provide finance for inputs to the
contract farmer on behalf of the agro-commodity dealer.
The financing of agricultural production through contract farming has brought a good
fortune to both smallholder and commercial farmers and provided agro-processors with
the required raw materials. Thus farmers and agro-processors create a binding business
relationship which can only be sustained when each of the parties stick to their
obligations as stipulated in the contract. This has the tendency to perpetuate the funding
cycle in the agriculture sector of any country.

2
As previously stated, an intermediary player may exist in contract farming arrangements.
The intermediary party is mainly a finance house which might bea commercial bank,
micro-finance institution, informal credit scheme and agricultural development bank
among many others. They come in handy to provide with requisite finance for
agricultural production allowing for a tripartite business relationship to work as long as
there are manageable risks. This conventional contract farming relationship can be
summarized in Figure 1 below.
Figure 1: Symbiotic relationship under contract farming
Source: Author
In view of the business relationship brought about by contract farming it has to be noted
that challenges arise to manage and sustain the relationship. The asymmetric and
disruptive pattern around contract farming on Figure 1 symbolizes the strains the
Agro-processor/buyer
Farmer
Finance House
Access to Market
Access to raw produce
Access to finance
Access to market for financial
services
Contract Farming
3
tripartite relationship can experience if contractual obligations are not honored by
anyone of the parties to the contract. The disruptive pattern is also indicative of the
business risks that accrue to honest parties to the arrangement.
The major dilemma being faced by the economic players in the contract farming
arrangement arise from the fact that some farmers successfully honor their contractual
obligations whilst others default in repaying loans accessed under the same contract
arrangement. It is the interest of this research to identify factors that influence farmers to
repay loans under contract farming. It tries to find the answers to why other farmers fail
to perform (default) as expected, when other farmers are successful in repaying their
loans, bearing in mind that all the farmers are assured of a ready market for their
produce.
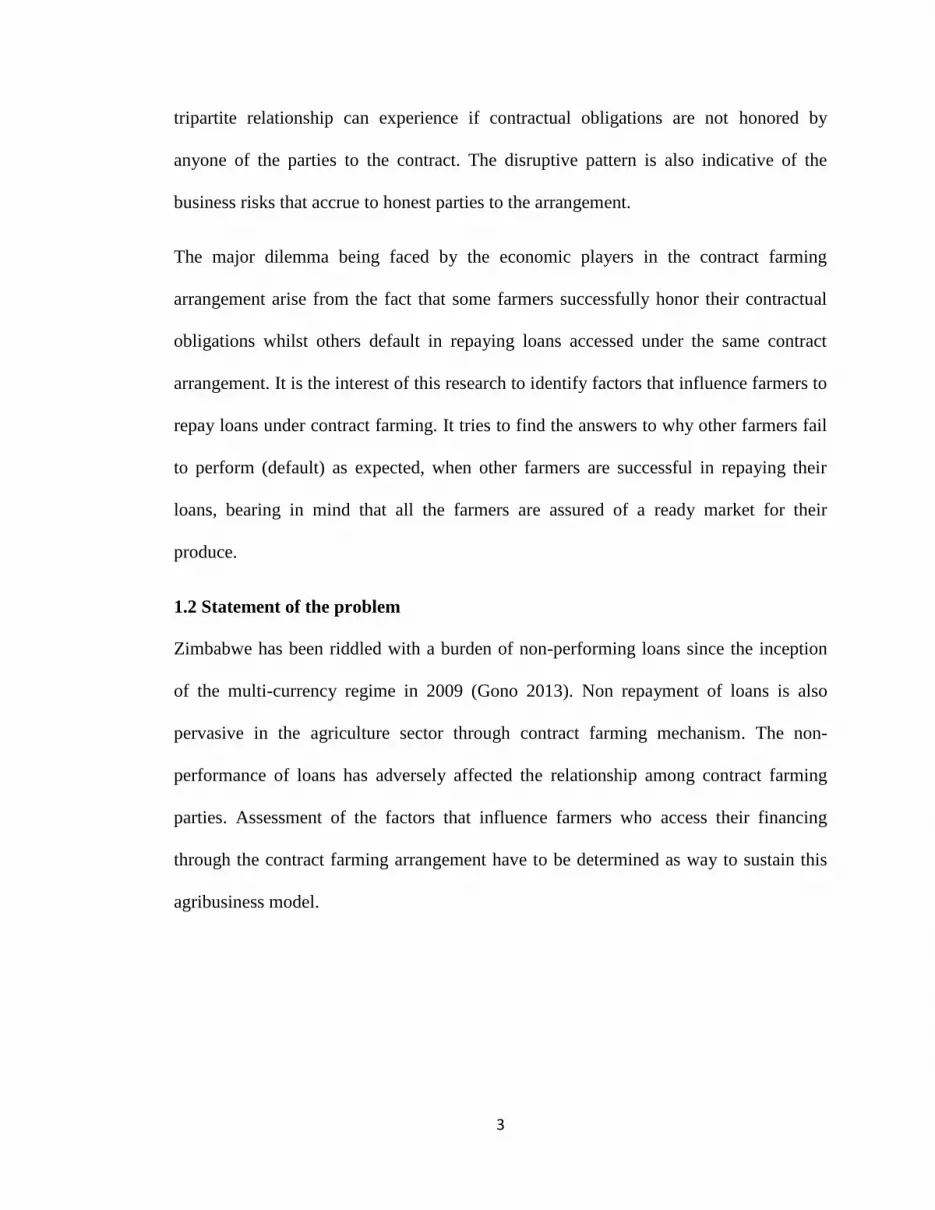
1.2 Statement of the problem
Zimbabwe has been riddled with a burden of non-performing loans since the inception
of the multi-currency regime in 2009 (Gono 2013). Non repayment of loans is also
pervasive in the agriculture sector through contract farming mechanism. The non-
performance of loans has adversely affected the relationship among contract farming
parties. Assessment of the factors that influence farmers who access their financing
through the contract farming arrangement have to be determined as way to sustain this
agribusiness model.

4
1.3 Justification for the study
The reality of non-performing loans in Zimbabwe has been heralded by the monetary
authorities in their monetary policy statements since the commencement of the multiple
currency regime in 2009. In a recent announcement for the 2013 Monetary Policy
Statement, the rate of non-performing loans stood at 15.92% as at December 2013 from
as low as 1.80% in 2009 surging to 4.24% in December 2010; 8.21% in December 2011
and 11.59% in December 2012 for loans issued by commercial banks (Dhliwayo 2014).
This has had an adverse effect on provision of loans to the agriculture sector which
received the lion’s share of loans and advances in 2012 at 19% (Gono 2013) of all loans
issued by banks that year but it dropped to 15.12% in 2013 (Dhliwayo 2014). Sao Tome
e’Principe, a Central African island nation, is also steeped in this precarious state of non-
performing loans at a rate of 20% as of 2013 (Synge and Van-Valen2014). Yet
according to the United Nations country report on Zimbabwe for 2013,states that
agriculture is still the single largest source of employment for the economy of Zimbabwe
with over 65% of the working population directly or indirectly employed in agriculture
related operations.
The scourge of non-performing loans was not only limited to the conventional financial
services sector but also affected loan arrangements done under the contract farming
model. This has been noted from recent headlines in the print media.
In a newspaper publication in November 2013 titled ‘Zimbabwe Contract Farming at
Crossroads’.The newspaper article noted that Amalgamated Industrial Corporation
Africa Limited (AICO) now called Cottco announced that it had suspended contracting

5
farmers to grow soya beans after it lost more than US$1 million through side-marketing.
This was quoted from a statement by the Chief Executive Officer of the Zimbabwe
Stock Exchange listed agro-industrial conglomerate in September 2013. Under the same
report, DuPont Pioneer a seed manufacturing entity had suspended its maize seed
contract farming arrangements after farmers had failed to repay their loans (Muza 2013).
This then raises questions within the agricultural sector, chief among them, “is contract
farming a viable arrangement in engaging farmers in the face of loan repayment
defaults?” This might also see the dearth of contract farming mechanisms in Zimbabwe
if answers are not proffered to mitigate defaulting by contract farmers in repaying their
loans.
On the contrary contract farming has had a fair share of its successes. This has been
acknowledged by Will (2013) that the adoption of contract farming model has been on
the increase. In the report, Will (2013) noted that in the United States of America (USA)
agricultural production coming from contract farming rose from 12% in 1969 to 36% in
2004. The same report also highlights that 75% of poultry production in Brazil comes
from contract farming. In Gezira,that is Central Sudan, small scale farmers were
contracted to grow cotton and it has been hailed as a success as espoused by Eaton and
Shepherd (2001).In another study conducted by Natural Resource Institute in 2001, ithas
shown that the issuing of loans through the contract farming model has worked in
Uganda for sugar-beans production which was initiated by The Agricultural
Development Corporation (ADC) (Kindness and Gordon 2001).

6
In addition to these success stories of contract farming Olam International stands out as
beneficiary a of this agribusiness model in Africa. Olam International is a Singapore
based agribusiness entity. It operates one of the most successful contract farming
schemes in Africa. In an interview in African Business magazine of August-September
2013, Sunny Verghese, the agribusiness entity’s Chief Executive, notes that the
company through the nucleus model contracted ten thousand small holder farmers
growing different crops in various regions of Africa. This makes it the largest out grower
scheme and most successful contract farming arrangement in Africa. This has seen the
company grow from Africa to be one of the largest global agribusiness players(Versi and
Verghese2013). This shows that contract farming has been and is a success. What
remains to be answeredis to identify the factors leadingfarmers to successfully
honortheir contract farming obligations through repaying their dues whether in kind or
in cash.
1.4 Research objectives
Overall Objective
To identify factors influencing loan repayment (success or default) under contract
farming.

7
Specific Aims
To identify factors that lead farmers to successfully repay loans or default
repayment under contract farming.
To find out the type and the conditions of loans offered to farmers under contract
farming.
To identify the mitigation measures available to contractors to recover unpaid
loans from defaulting contract farmers.
1.5 Research questions
What are the factors influencing loan repayment under contract farming?
What type of loans and the conditions under which they were disbursed to
farmers under contract farming?
What mitigation measures exist for contractors to recover unpaid loans?
1.6 Ethical considerations
The research was conducted through the consideration of the following ethical
principles:
Right to confidentiality: The data is confidentially kept to avoid conflict with contract
farmers the key respondents in the survey. Relevant sources of literature that have been
accessed from various key informants is safely stored and has not been used for any
other purpose than to meet the academic objective of this research.
Right to Informed Consent: the researcher sought informed consent from each of the
participating parties in the research without coercing or inducing undue pressure on key

8
informants. The researcher ensured that explanation was given to parties concerned prior
to accessing information,of why the research is being undertaken.
Right to anonymity: No names have been used for data analysis and in reporting of the
research findings.
Right to privacy: whatever it is the participants deem to be private information and
cannot be accessed by the researcher then the researcher was bound not to further seek
such information.
Adherence to copyright laws: Relevant sources of literature that have been cited in this
researchhave been referenced accordingly. This has been done not to infringe copyright
laws.
1.7 Limitations and delimitation for the study
Time constraint:The research has been time constrained to fully evaluate all the
information gathered and to have more farmers and other crops to be taken on board in
the research. In order to effectively manage the timelines for the research only two
crops, sugar-beans and bananas, have been considered.
Furthermore accessingkey respondents was difficult as they were tied to their scheduled
scheme and community events. The researcher had to ask for a schedule of dates of
Scheme meetings and then plan accordingly to meet key respondents. This was done in
collaboration with Irrigation Management Committee leadership,government’s
Agriculture Extension (Agritex) Officers and Zim-AIED officials.

9
Financial constraint: A research requires financial input that necessitates for the
seamless flow of personnel to execute the research plan within the required time without
restraint. Due to limited financial resources, the research objectives have been narrowed
down to three. The research plan was streamlined in accordance with the available
financial resources.
Lack of control on key respondents and informants: The researcher had no direct control
on key respondents and informants as the researcher was independent of the work
processes ofresearch subjects in the study area. The key informants had their own
pressing schedules to attend to and could not give the researcher enough attention to get
essential data for the research. The researcher had to use negotiating skills and build
relationships to have access to key resource persons and have access to confidential
information. The researcherhad an introductory letter from the Faculty of Agriculture
and Natural Resources as a tool to access key informants. This gave key informants
confidence towork with the researcher. The introductory letter was stating the intention
of the research and status of the researcher.
1.8 Scope of the study
The study was undertaken in Manicaland Province in the south-eastern part of
Zimbabwe. It focused onfarmers who have been assisted by Zimbabwe Agricultural
Income and Employment Development Program (Zim-AIED) in various ways to
increase their yields and have access to market and finance through contract farming.
The program is being implemented by Fintrac Incorporation on behalf of the United
10
States Agency for International Development (USAID) under Feed the Future Program
in Zimbabwe.
The research has been narrowed down to focus on contract farmers who have benefited
from market linkages and finance arrangements organized through the Zim-AIED
Program. The farmers operate in Chibuwe-Musikavanhu and Mutema Irrigation
Schemes in Chipinge District. The major crops which the farmers have grown under
contract farming are sugar-beans and bananas. In addition to contractors who came into
the Irrigation Schemes through the Zim-AIED Program, the study has also considered
other contractors who were active in the Irrigation Schemes prior to commencement of
the Zim-AIED Program. For sugar-beansfive contractors have been active from 2012 to
2014, which is theperiod of study for the research. For bananas there is only one
contractor who was introduced by the Zim-AIED Program to the Schemes and it was the
first time farmers in the Irrigation Schemes have grown bananas on a commercial basis.
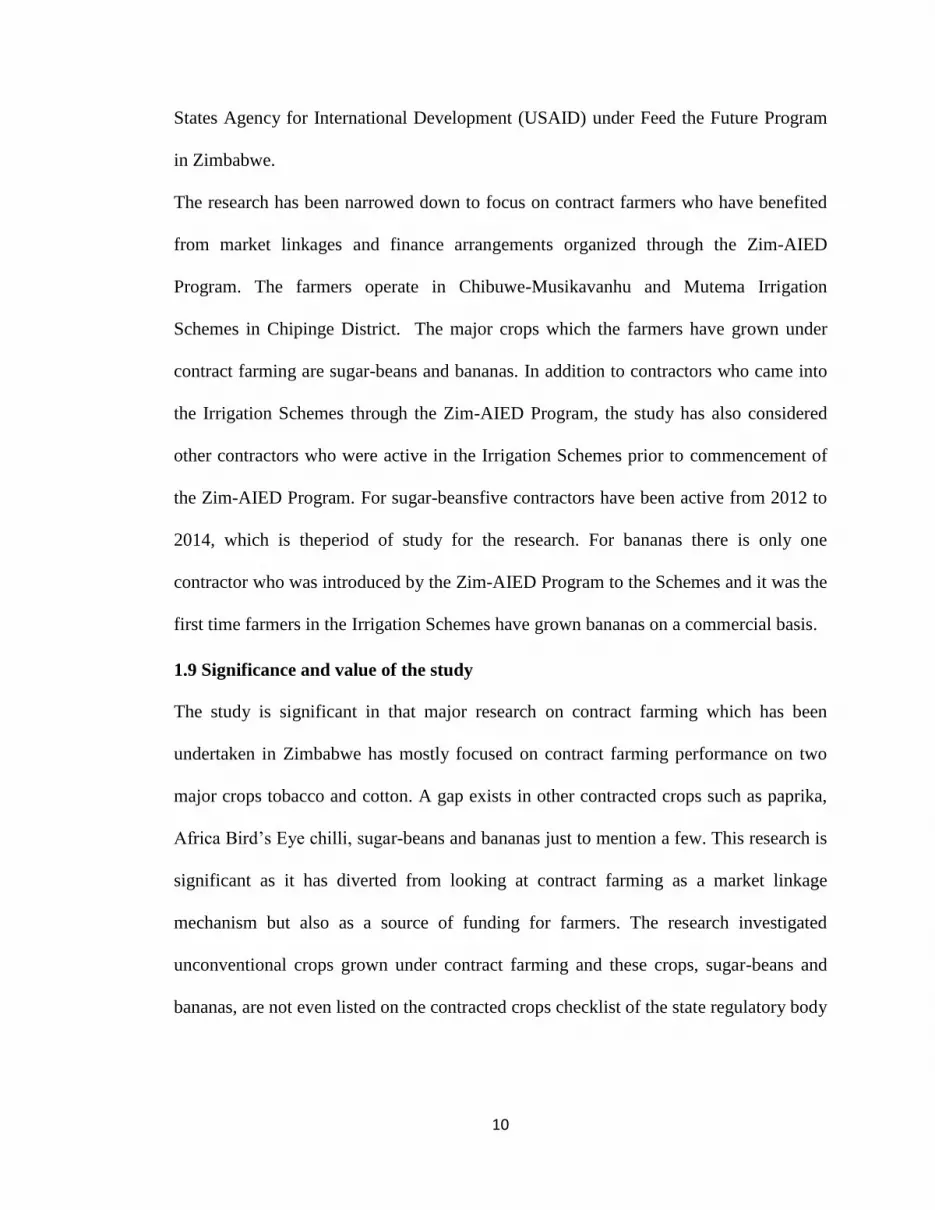
1.9 Significance and value of the study
The study is significant in that major research on contract farming which has been
undertaken in Zimbabwe has mostly focused on contract farming performance on two
major crops tobacco and cotton. A gap exists in other contracted crops such as paprika,
Africa Bird’s Eye chilli, sugar-beans and bananas just to mention a few. This research is
significant as it has diverted from looking at contract farming as a market linkage
mechanism but also as a source of funding for farmers. The research investigated
unconventional crops grown under contract farming and these crops, sugar-beans and
bananas, are not even listed on the contracted crops checklist of the state regulatory body

11
in Zimbabwe for marketing agricultural produce the Agriculture Marketing Authority
(AMA).
There are quite a number of stakeholders who will benefit from this research among
them farmers, policymakers, sponsors of contract farming, non-governmental
organizations, players in the business of issuing loans (banks, informal credit providers
and microfinance institutions) and other researchers.
Farmers: Farmers need to be aware of the consequences that accrue from failure to
service their loans to other farmers and this research will act to bridge the gap by
providing the research results to them.
Policymakers: These include government agriculture institutions, non-governmental
organizations involved in agriculture value chain financing, academia and farmer
organizations such as Zimbabwe Farmers Union; Commercial Farmers Union and
Zimbabwe Commercial Farmers Union. The research will create awareness to these
stakeholders on current trends in contract farmers’ performance in servicing their loans
and act as a checkpoint on the relevance of contract-farming agreements and the
respective business dynamics with this agriculturemarket model. This will also help in
policy development that is relevant to the needs of farmer’s loan arrangements and
providers of loans and contract farming agents.
Financiers of smallholder farmers - companies who provide the platform for contract
farming need to have understanding of the current issues that are transpiring in the field.
It is the purpose of this research to offer such knowledge to industrial players and
financiers alike, so that they decide on an informed basis and avoid blind spotswhen they

12
are deciding to engage smallholder farmers in contract farming and issuing them with
loans.
13
CHAPTER TWO: LITERATURE REVIEW
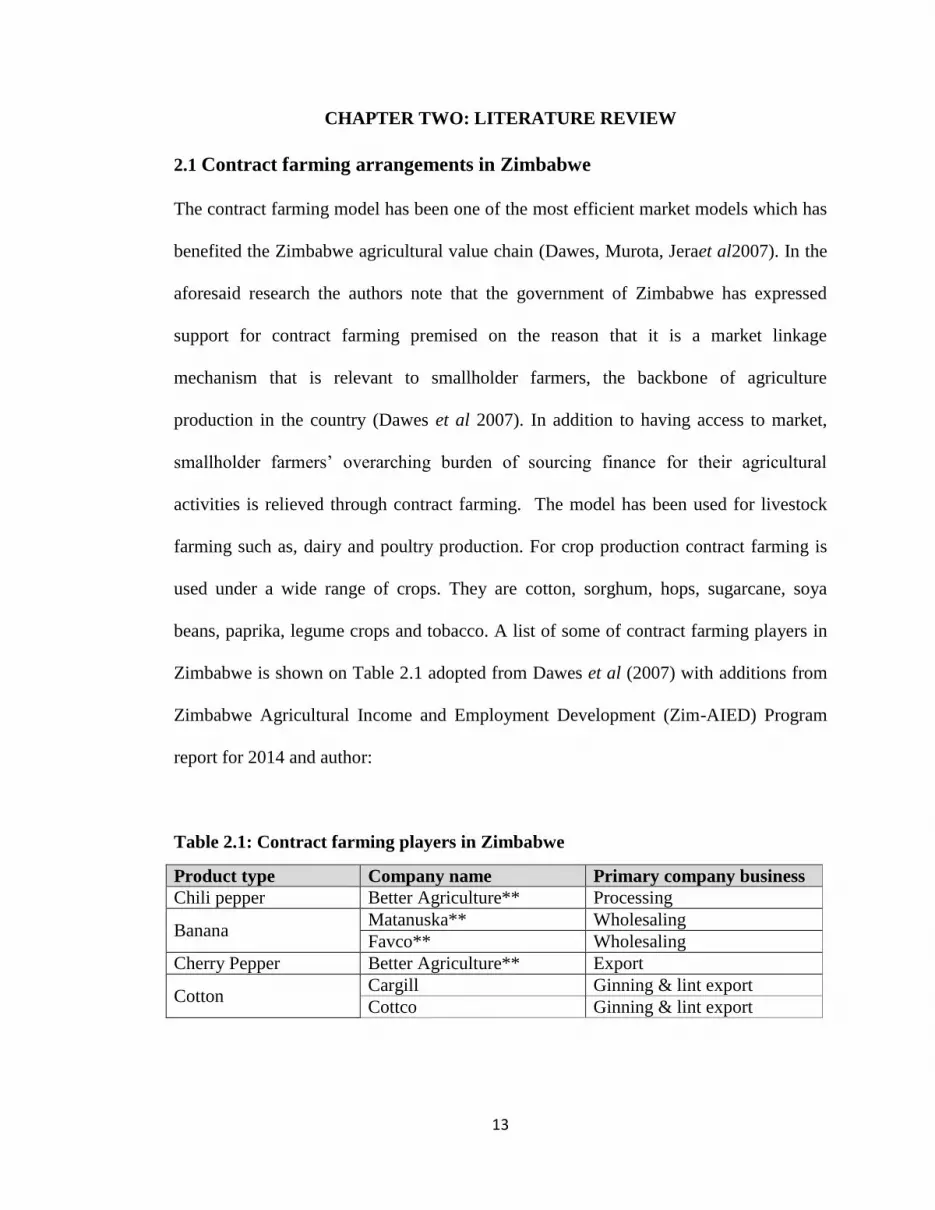
2.1 Contract farming arrangements in Zimbabwe
The contract farming model has been one of the most efficient market models which has
benefited the Zimbabwe agricultural value chain (Dawes, Murota, Jeraet al2007). In the
aforesaid research the authors note that the government of Zimbabwe has expressed
support for contract farming premised on the reason that it is a market linkage
mechanism that is relevant to smallholder farmers, the backbone of agriculture
production in the country (Dawes et al 2007). In addition to having access to market,
smallholder farmers’ overarching burden of sourcing finance for their agricultural
activities is relieved through contract farming. The model has been used for livestock
farming such as, dairy and poultry production. For crop production contract farming is
used under a wide range of crops. They are cotton, sorghum, hops, sugarcane, soya
beans, paprika, legume crops and tobacco. A list of some of contract farming players in
Zimbabwe is shown on Table 2.1 adopted from Dawes et al (2007) with additions from
Zimbabwe Agricultural Income and Employment Development (Zim-AIED) Program
report for 2014 and author:
Table 2.1: Contract farming players in Zimbabwe
Product type Company name Primary company business
Chili pepper Better Agriculture** Processing
Banana Matanuska** Wholesaling
Favco** Wholesaling
Cherry Pepper Better Agriculture** Export
Cotton Cargill Ginning & lint export
Cottco Ginning & lint export

14
Olam International* Ginning & lint export
Quton Seed sales
Legume crops
Grain Marketing Board Wholesaling
Olivine Canning
Reapers Wholesale
Ostriches and chickens
Ostrindo Poultry processing
Irvine’s* Chickens processing
Hy-veld Oleoresin extraction
Seed crops
AgriSeeds Seed sales
ARDA Seeds Seed sales
SeedCo Seed sales
Du Pont Pioneer* Seed sales
Sorghum Delta Brewing
Sugar cane TongaatHulets Zimbabwe* Sugar manufacture
Green Fuel* Ethanol manufacture
Sweet potatoes SimFresh International** Wholesale
Tobacco
Northern Tobacco Processing and export
Tribac Processing and export
Tian-ze* Processing and export
Zimbabwe Leaf Tobacco Processing and export
Vegetables and/or fruit
Cairns Canning
Favco Wholesaling
Honeywood Canning
Wholesale Fruiterers Wholesaling
Selby Enterprises Processing and export
Source:Dawes et al (2007); *Author (2014); **Fintrac Inc. Zimbabwe (2014).
According to the Food and Agricultural Organisation of the United Nations, contract
farming is defined, as an agricultural production system carried out according to an
agreement between a buyer and farmers, which establishes conditions for the production
and marketing of a farm product or products (Pultrone, da Silva and Shepherd 2012). It
has also been defined as forward agreements specifying the obligations of farmers and
buyers as partners in business (Will 2013). The intent is that the buyer will make
provision of efficient extension services and appropriate inputs (Shepherd 2012).
Pultroneet al (2012) asserts that contract farming should include the provision of product

15
quality standards and land preparation services. Additionally, timely distribution of
inputs; collection of produce and payment of farmers, are some of the factors that will
sustain the contract agreement on the part of the buyer and enhance loan repayments on
time by farmers (Dawes et al 2007). This arrangement minimizes risks of default of loan
repayments if it is properly executed between the parties involved.
2.2 Contract farming models
Five business models under contract farming have been identified by Eaton and
Shepherd (2001). These are centralized model; the nucleus estate model; multipartite
model; informal model and the intermediary model. Each of these has its inherent
advantages and disadvantages either to the farmer or to the buyer. The model to be used
depends on the farm product, resources of the sponsors and the relational dynamics
between buyer and farmer (Will 2013). The multipartite model has been noted to have a
desirable success rate in a research done by
StichtingNederlandseVrijwilligers(SNV)Netherlands Development Organisation
translated as Foundation of Netherlands Volunteers in 2007 in Zimbabwe (Dawes et al
2007).
In order to bring out a thorough understanding of these models Table 2.2 shows a brief
description of each model as outlined by Eaton and Shepherd (2001).
Table 2.2: Contract farming models and characteristics
Model Characteristics
Centralized
model
Involves a centralized processor and/or packer buying from a
large number of small farmers.
Is used for tree crops, annual crops, poultry and dairy. Products

16
often require a high degree of processing, such as tea or
vegetables for canning or freezing.
Is vertically coordinated, with quota allocation and tightquality
control.
Sponsor involvement varies from minimal to extremely involved
depending with produce sensitive.
Nucleus estate
model
It is a variation of the centralized model.
The sponsor manages a central estate or plantation.
The central estate is usually used to guarantee throughput for the
processing plant but is sometimes used only for research or
breeding purposes.
Is often used with resettlement or transmigration schemes.
Involves a significant provision of material and management
inputs.
Multipartite
model
This model describes contract conditions when more than one
organization jointly participates to contract the farmer.
Involves statutory bodies.
Separate organizations may be responsible for credit provision,
production, and management, processing and marketing.
Informal model
Is characterized by individual entrepreneurs or small companies.
Involves informal production contracts, usually on a seasonal
basis.
Often requires government support services such as research and
extension.
Involves greater risk of extra-contractual marketing.
Intermediary
model
Involves sponsor in subcontracting linkages with farmers to
intermediaries.
There is a danger that the sponsor loses control of productionand
quality as well as prices received by farmers.
Source: Eaton and Shepherd (2001)
2.3 Sources of finance for farmers
Globally farmers have a wide array of options to finance their farming activities and
Zimbabwean farmers are no exception. The sources of finance vary from informal
finance schemes to formal finance houses. In between there are other funding
mechanisms and this is where sponsors of contract farming fall into and these are what

17
Klein, Meyer, Hanniget al(1999) term as interlinked credit arrangements providers.
These sources of finance, but not all of them, are ultimately the source of loans that can
and are advanced to farmers either in terms of cash or kind as noted by Kohansal and
Mansoori (2008) in their study in Iran. Giehler (1999) mentions that loans to farmers are
financed by various sources which include but not limited to the following; farmers
household savings, capital markets, equity, fiscal allocations, monetary policy
authorities financing interventions and international borrowing. In addition to these
sources of finance Muchati (2015) mentions that contract farming isa funding
mechanism that farmers accessto finance their agriculture activities.
Informal sources of finance are described as unregulated sources of finance that are
arranged without any formalities and strict conditions on performance. The players in
the informal credit system are not registered with any regulatory authority and the
transactions are usually based on social relationships and trust between members of the
community (Giehler 1999). One thing that makes informal finance sources to thrive is
there proximity to clients. They are very prevalent in rural economic systems and poor
societies whose bankability status is viewed with skepticism by conventional banking
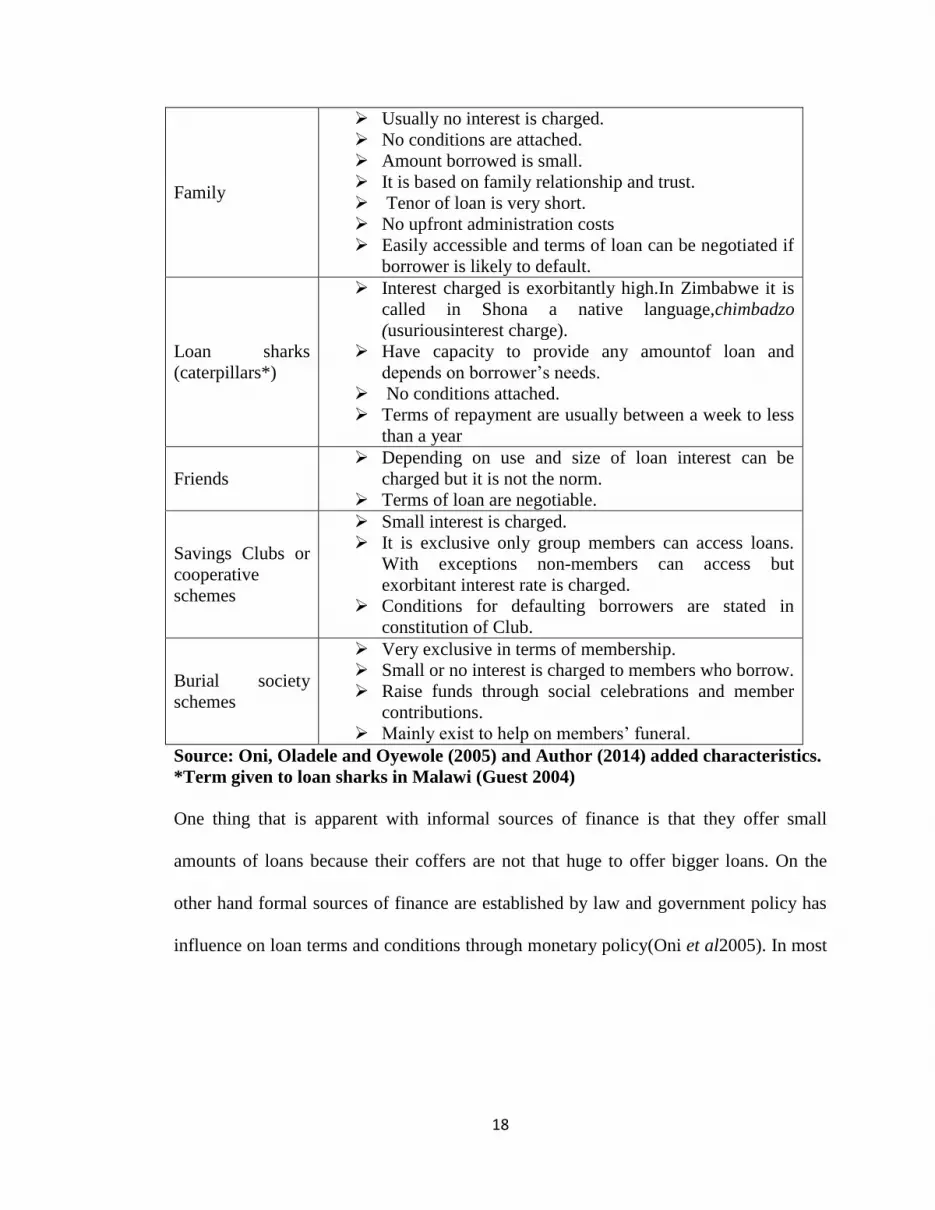
system. Table 2.3 shows a list of some informal sources of finance and their respective
characteristics.
Table 2.3: Informal sources of finance and their characteristics
Source Characteristics
18
Family
Usually no interest is charged.
No conditions are attached.
Amount borrowed is small.
It is based on family relationship and trust.
Tenor of loan is very short.
No upfront administration costs
Easily accessible and terms of loan can be negotiated if
borrower is likely to default.
Loan sharks
(caterpillars*)
Interest charged is exorbitantly high.In Zimbabwe it is
called in Shona a native language,chimbadzo
(usuriousinterest charge).
Have capacity to provide any amountof loan and
depends on borrower’s needs.
No conditions attached.
Terms of repayment are usually between a week to less
than a year
Friends
Depending on use and size of loan interest can be
charged but it is not the norm.
Terms of loan are negotiable.
Savings Clubs or
cooperative
schemes
Small interest is charged.
It is exclusive only group members can access loans.
With exceptions non-members can access but
exorbitant interest rate is charged.
Conditions for defaulting borrowers are stated in
constitution of Club.
Burial society
schemes
Very exclusive in terms of membership.
Small or no interest is charged to members who borrow.
Raise funds through social celebrations and member
contributions.
Mainly exist to help on members’ funeral.
Source: Oni, Oladele and Oyewole (2005) and Author (2014) added characteristics.
*Term given to loan sharks in Malawi (Guest 2004)
One thing that is apparent with informal sources of finance is that they offer small
amounts of loans because their coffers are not that huge to offer bigger loans. On the
other hand formal sources of finance are established by law and government policy has
influence on loan terms and conditions through monetary policy(Oni et al2005). In most
19
countriesformal sources of finance’s operations are either monitored by central or
reserve bank authorities.
In Zimbabwe, according to Kramarenko et al (2010), the rise of informal finance
schemes came to being during persistent economic difficulties experienced during
the,‘lost decade’ of 1999 to 2009. Dhliwayo (2014) further alludes to this fact when
presenting the 2013 Monetary Policy Statement. The statement noted that a major source
of finance for Zimbabweans has been money coming through informal channels from
the Diaspora but bemoaned that the funds are usually used for consumptive purposes
rather than productive endeavors to stimulate economic growth. Meaning that even
agriculture, one of Zimbabwe’s key productive sectors, was not benefiting from this
informal source of finance. Whereas in Nigeria, Adebayo and Adeola (2008) reported
that agricultural production undertaken by smallholder farmers relied on loans from
informal sources mainly from unregistered cooperatives.
One key element of accessing finance in the form of loan arrangements, whether it is
cash or kind, is that the funds carry a cost of borrowing charged to the borrower by the
issuer of loan, called interest. Due to the prohibitive lending rates averaging 22% in
2012 and following a similar pattern in 2013 as noted by Gono (2013) and Dhliwayo
(2014) in their annual monetary policy statements, most farmers in Zimbabwe have been
deterred to borrow from conventional banks. This has also been exacerbated by the short
term nature of loans being offered by commercial banks in Zimbabwe. Because of these

20
adverse conditions, most farmers have shunned this all too familiar source of finance for
their farming activities.
In an article by Cox (2014) in Spore Magazineit highlighted the issue of high interest
charged for agricultural loans issued to farmers in Ghana.The farmers are charged
exorbitant rates of 25% to 40% per annum. To worsen the situation of farmers only 6%
of commercial lending in Ghana has been earmarked for the agriculture sector (Cox
2014). Truly this gives a reason for the existence of informal sources of finance. World
Bank (2008) summed it by saying, “agriculture continues to be a fundamental instrument
for sustainable development and poverty reduction yet, financial constraints in
agriculture remain pervasive, and they are costly and inequitably distributed, severely
limiting smallholders’ ability to compete” in various lucrative agricultural value chains.
These adverse conditions did not shut other avenues of financing for farmers that are
available to the Zimbabwean agricultural sector because of its pivotal role in the
economy. Apart from accessing loans for agricultural production from conventional
banking system with their punitive conditions on the borrower, farmers have also
accessed loans through contract farming arrangements by accessing inputs, technical
expertise and land preparation from buyers of their commodities. It has proved to be a
familiar arrangement with buyers of major cash crops in Zimbabwe as shown on Table
2.1. Therefore contract farming becomes a recognizable loan arrangement mechanism in
agricultural production in Zimbabwe to assist farmers with inputs, ready markets for
their crops and many other benefits organized by the buyers. Contract farming can

21
therefore be classified as either a formal or informal source of finance depending on how
it has been crafted by the sponsors.
In addition to loan arrangements advanced by agro-commodity buyers another source of
funding has emerged to the convenience of farmers. In recent years the donor
community has remodeled their aid mechanisms moving away from issuing handouts to
offering pro-business development solutions to their recipient communities. One such
arrangement has been financial intervention through issue of loans to smallholder
farmers and ensuring that farmers are trained so that they operate their farming activities
as profit making ventures. This ensures that farmers produce for their food security
needs, have reliable income streams to meet other pressing financial needs in the home
and operate their farming activities as businesses (Fintrac 2014). Zimbabwe has
benefited from the presence of these not-for-profit organizations such as SNV
Netherlands, Development Alternatives Incorporation (DAI Inc.) and Fintrac
Incorporation a United States Agency for International Development (USAID)
agribusiness contractor among many others. These have offered financial reprieve to
many farmers and the non-governmental organizations are offering these funds not as
free handouts but as loans. Farmers are required to payback once they sale their produce.
This has added to the portfolio of loan arrangements available to farmers. The
arrangement has not been spurred from the dismal performance of loan repayments
foregoing in the Zimbabwe economy.

22
2.4 Key enablers for access to finance and loan repayment performance
To ensure viability of loans issued under contract farming there are key enablers that are
expected for all the parties concerned to do their role in the arrangement with
transparency. Viability in this instance is measured by either success in repayment of
loan or default in repaying loans.
A critical component that necessitates factor mobility such as capital in the form loans
for farmers is the institutional environment. These institutions constitute the legal and
administrative systems within which individuals, enterprises and governments function
and interact properly to create wealth as outlined in The Global Competitiveness Report
2013-14 (Schwab and Sala-i-Martin 2013). The report further states that the quality of
institutions has a bearing on productivity of major sectors of the economy key among
them the agriculture sector. These include quality of political governance institutions,
enforcement of the rule of law, respect for property rights, proper management of public
finance and transparency in reporting by private enterprises (Schwab and Sala-i-
Martin2013).
Apart from institutional environment, the report enlists eleven other key enablers for
productivity but only seven are mentioned here because of their direct link to agriculture
finance. These are infrastructure (roads, dams and telecommunication), macroeconomic
environment (fiscal and monetary issues), higher education and training, goods market
efficiency and financial market development. All these key enablers are very critical in
agriculture production especially for smallholder farmers’ finance and market needs.
23
These are necessary for smallholder farmers who have been deemed to be too risk to
provide loans and un-bankable (Klein et al 1999). Concurrently smallholder farmers are
very much in need of the State as a conduit to advocate for their financial inclusion.
They also need the state to create an enabling environment so that they have access to
the mainstream economy through access to markets offering competitive prices for their
produce. More so for contract farming arrangements, which need enforcement through
the provision of a viable legal framework. To sum it Fan, Voegele and Pandya-Lorch
(2010) wrote that, “An enabling policy environment and legal framework, enforcement
of rules and regulations, and a supportive rural infrastructure all contribute to making
access to finance a reality” for smallholder farmers.
Miller and Jones (2010) mention that lenders should look at five key areas to assess
borrowers prior to issuing them with loans. These have been termed as the five Cs of
loan assessments. Character, capacity, capital, collateral and conditions constitute the
five Cs that lenders have to use to assess borrowers. These are key enablers on the part
of lenders and can also be appliedby sponsors of contract farming. Among these five Cs
the major one which formal finance houses mostly put as a key requirement to issue
their funds is the need for collateral. The need for collateral always excludes smallholder
farmers, from access to financial services such as loans, whose assets such as indigenous
livestock and huts have low economic value and they are not easily tradable on the open
market. Another setback is that most financially deprived rural farmers do not have
tenure of land in which they practice their farming activities. The land is State owned. In
some regions land is communally or customary owned but it will be under the auspice of
24
traditional leaders to determine its exchangeability on the open market. This leaves most
smallholder farmers with few “dead assets” (De Soto 2000) to use as collateral.
Moreover one key explanation to Africa’s incessant poverty is that most of its populace
are unable to turn their assets into liquid capital as noted by Guest (2004) in his book
The Shackled Continent. This then leads most Africans to be starved of capital which is
a key factor of production and the lifeblood of capitalism (Guest 2004). This is very
profound especially when farmers need loans to finance their activities and lenders insist
on collateral. In the same script Guest cites De Soto (2000), a Peruvian economist who
noted that the value of rural land, where Africans plough and graze their livestock, is
worth USD390 billion. The valuation was done in 2000. This is a huge sum of money if
farmers’ land was formally registered and owned (Guest 2004).
The issue of land security still remains one of Africa’s unresolved colonial legacy. After
fourteen years nothing much has changed since De Soto (2000) published his work in
2000. African countries stand to benefit by effecting this necessary change. The change
is effective with this in mind that the USD390 billion, the estimate value for rural land,
is still a huge sum of money today even without adjusting for the time value of money.
If this process of giving land entitlement to smallholder farmers is pragmatically pursued
it would unlock value to the benefit of all African economies. And the term dead capital
will cease to exist in agriculture finance vocabulary.

25
2.5 Factors influencing loan repayment performance
Factors that influence farmers to either repay their loans or default are as varied as the
farming systems that farmers undertake to earn their livelihood.These are analyzed and
reviewed by looking at five factors. These are demographic, agronomic,financial,socio-
economic and political.
Demographic factors
Demographic structure of any nation contributes either positively or negatively to the
performance of an economy and its effects are even more pronounced in agriculture
based economies especially in most African economies.
The United Nations Country Analysis Report for Zimbabwe (2010) shows that seventy
percent of Zimbabwe’s population relies on agriculture production for food, employment
and income. It is also a major foreign exchange earner contributing 40% to export
receipts and 60% of raw materials required in the manufacturing sector coming directly
from the agriculture sector (UN Country Report, 2010). Thus a great proportion of the
economically active age group of between 20 to 65 years is directly or indirectly
dependent on agriculture. As of 2012, Zimbabwe’s population stood at 13 million
comprising 48% male and 52% female (ZimStat 2013).
Age is defined as the amount of time a person has lived from the date of birth to the
current date of existence, measured in years (Merriam –Webster 2015). The age of the
farmer has been found to have an effect in loan repayment by many researchers.
Research in Iran by Kohansaland Mansoori(2008) made a conclusion that age was
26
negatively related to loan repayment performance among farmers in Khorasan-Rasavi
Province. The researchers came to thisconclusion by sampling 175 farmers and using the
logit model to analyze their data. On the other hand studies in Ghana and Nigeria show
different results to Kohansal’s study in Iran. Wongnaaand Awunyo-Vitor(2013) in Sene
Districtand Awunyo-Vitor (2012) in BrongAhafo Region inGhana noted that age of
farmers was positively related to loan repayment performance. The study by
Wongnaaand Awunyo-Vitor(2013) was based on surveys conducted on one hundred
yam farmers and probit regression model was used to analyze factors influencing loan
repayment performance by farmers. This was also related to research findings in other
studies carried out in Ogun State of Nigeria key among them Ayandaand Ogunsekan
(2012) and Oni et al (2005). For the study done by Oni et al (2005) age was the
dominant factor affecting loan repayment performance compared to other eleven
independent variables.
In Zimbabwe through a government initiated empowerment loan facility, popularly
known as Kurera-Ukondla Youth Fund, provided by Old Mutual Zimbabwe to the tune
of USD10 million earmarked to benefit the youth had a default rate of over 60%
(Zhangazha 2014). This then labelled the age group between 18 to 35 years as loan
defaulters in the Zimbabwean context. The loan limit that was supposed to be accessible
to each youth initiated project was USD5 thousand. Yet it is on record that some youths
accessed USD300 thousand as individuals, sixty times more than the prescribed limit.
The statistics did not make further breakdown to category of activity – that is sector
specific loan repayment performance, which had the most non-performing loans.
27
Information is currently lacking on the availability of the factors that contributed to this
dismal failure of the Youth Fund apart from age.
Household size, gender and marital status are the other variables that have influence in
loan repayment performance under demographic factors. Gender for the purpose of this
study means male and female. Household size is defined as the number of people under
the care of the farmer. Udoh (2008) in AkwaIbom State in Nigeria came to a conclusion
that household size was statistically significant to loan performance and noted that those
farmers with a large household size are likely to default than those with smaller
household sizes. Whilst a study by Wongnaaand Awunyo-Vitor (2013) concluded that
household size was not clear. It was ambiguous in their findings. In the same study,
gender and marriage were known to have a negative effect on yam farmers’ loan
repayment abilities.
In relation to genderUdoh (2008) notes that male beneficiaries had higher tendencies to
default than females. The research noted that the multiplicity of responsibilities of men
as breadwinners, which may require them to divert the proceeds from their farms to
offset domestic financial commitments rather than fulfilling their loan obligations might
have contributed to defaulting. This was also confirmed by a study in Vietnam by Duy
(2013). The study made an observation that women are generally good borrowers. The
reason being that they are likely not to spend on non-productive expenses such as social
pleasures like alcohol.In this study, Duy (2013) employed three analysis models. The
determinants of repayment performance of borrowers were analyzed using the double
28
hurdle approach and an instrumental variable probit model while scheduled repayment
performance was analyzed by a Tobit model. The same sentiments that women perform
better that men in loan repayment is shared by Kleinet al (1999) in their booktitled
Better Practices in Agricultural Lending.
Agronomic factors
The list of agronomic factors includes but is not limited to type of crops grown and the
respective variety, type of soil where crops are grown, access to extension services and
training, good agricultural practices such as crop rotation and conservation farming, use
and application of fertilizers and crop protection chemicals.
Gates and Gates (2015) put an emphasis on the need for agricultural extension services.
They assert that many farmers would not be productive if they have no access to
agricultural extension services. The report noted that agricultural extension is the
process by which farmers get information — what seeds to plant, how to rotate crops to
protect their soil, how to get the best prices on the market. Furthermore, traditionally
agriculture extension services require highly trained agricultural experts who know the
best crops grow in every region of they operate in (Gates and Gates 2015). This sets
agriculture extension services as a key factor that contributes positively to loan
repayment. This is a special requisite under contract farming as farmers need the help of
contract farming sponsor’s extension workers to fully operationalize the contract in
relationship to agronomic issues. This includes expected yield, quality of output and
29
standards that have to be adhered to in terms of application of crop chemicals and post-
harvest management of the output (Dawes et al2007 and Will 2013).
Roslanand Karim (2009) concurs that training in credit management and good
agricultural practices reduces loan repayment default among microcredit beneficiaries in
Malaysia. On the contrary the study showed that farmers who did not undergo any form
of training defaulted in repaying their loans. The study did not specify the courses that
farmers undertook, it just generically mentions training in good agricultural practices
which in essence covers many issues some of them not related to loan repayment
performance or contract farming. Similarly a study in Ghana byAwunyo-Vitor(2012)
came to the same results that the larger the loan amount and the longer the repayment
period as well as access to training are more likely to reduce loan repayment default.
Althoughthe study did not give the actual length of time spent on training farmers and
when the training was conducted, that is prior to loans issued or after farmers had
received their loans, the study still validates training as a factor influencing loan
repayment. The data collected for the research in Ghana came from a survey of 374
farmers in five districts whilst the probit model was used to analyze the data.
In Zimbabwe a study carried out by SNV Netherlands in 2007 noted that farmers with
very low yields will not often be able to repay their input loans jeopardizing the contract
agreement. This was experienced by Olivine Industries with their contract arrangement
for missy navy beans with Hama Mavhaire farmers in Chirimuhanzu in Midlands
Province. The company suspended the arrangement in the 2006/07 season (Dawes et al

30
2007).The study could not show the number of hours spent per day training farmers on
good agricultural practices by Olivine Industries in order for contract farmers to produce
the expected yield. Perhaps this could have been the missing link in averting the mishap
of terminating the contract arrangement and failure by farmers to repay their loans for
inputs received.
A related factor to extension services and training is regular visits either by loan issuer
or contract farming sponsor. In the same study undertaken by Dawes et al (2007) it
noted that contracting companies who regularly visited their contract farmers had low
contract defaults than those contractors who never visited at all. The issue of resources
and distance to where contract farmers are located might be a deterring factor for
contractors to regularly follow up on their contract farmers. This leaves them with one
alternative. In the case of Zimbabwe the exercise can be done by Agritex officers, where
each district ward has one or more officers depending on productivity of region, to
conduct the regular visits on behalf of the contract farming sponsors or providers of
loans.
Financial factors
The key determinants of loan repayment performance to be considered under financial
factors are:
Loan size measured as the amount of loan issued to farmer in monetary value though
it might be in kind that is inputs and other services.

31
Interest on loan measured by the interest rate per annum or per month charged by
lender.
Tenor of loan measured as the time of repaying the loan as stipulated by lender.
Upfront costs: these are total application costs including administrative charges.
Collateral issues: this is usually requested by formal lenders and collateral is usually
an asset with a value that the lender can dispose after borrower has defaulted.
Post-harvest price: this is the price of farmers’ commodity on the open market. It is
usually affected by demand and supply factors of the commodity in question and is
measured as price per kilogram or price per ton for most agriculture products.
Profit earned from farming venture this is determined by calculating the gross
margin by using monetary values.
Off-farm income is any amount in monetary value that the farmerearns from other
activities besides farming.
Repayment frequency measured as number of times the loan is repaid it might be
weekly, monthly (instalments) or a terminal loan (principal amount and interest are
fully paid at the end of loan tenor).
These are generally the financial factors that influence farmers when they either default
or successfully repay their loans. These are major determinants that each farmer has to
take cognizance of prior to tying themselves to a debt provider. And the need for
financial prudence is highly valuable as this will determine whether the farmer will be
able to repay or not.

32
With reference to the same research carried out Iran in 2008 the researchersfound out
that loan interest rate is the most important factor affecting the repayment of agricultural
loans (Kohansaland Mansoori2008). It also made a conclusion that farmer’s experience,
income received; loan size and collateral value have positive effect on farmer’s loan
repayment.This was also confirmed in a research done in Nigeria in 2011. It noted that
farmers were unable to repay their loans due to high interest rate. In addition to the high
interest rate factor, the other factors contributing to loan repayment default was delayed
farm output due to late rainfall and weak recovery efforts by the officials of the Bank of
Agriculture (Ayandaand Ogunsekan 2012). The researchers used multi-staged sampling
method to survey 120 respondents with the descriptive and Pearson Moment Correlation
Statistics being employed for data analysis.
In a research done in India byDeiningerand Liu (2010), though not for loans issued
under contract farming, its findings are worth noting as it focused on factors influencing
loan repayment. First the researchers, Deininger,a World Bank economist, and Liu from
the International Food Policy Research Instituterevealed that high installment frequency
enhance loan repayment performance. This, they said, is in line with the notion that
frequent small repayments will inhibit loan repayment default for households who have
little access to credit. Data for this study was collected from a survey of 299 village
organizations with a mandate of issuing loans to their members. Secondly the study
came to the conclusion that the probability of loan repayment increases with the size of
the group with an optimum number of fourteen group members. Beyond a group with
fourteen members the results showed that the probability for a group to repay decreases.

33
This is a necessary consideration when seeking guidance on group formation with the
intention of provision of loans to groups. The results did not specify the composition of
the age groups that defaulted and that repaid. Lastly their research indicated that the
probability to default increased with the length of time a group has been in existence up
to approximately five years. The opposite is true that the lesser the years a group has
been in existence the better the repayment performance.
Hamza (2007) asserts that the level of livelihood diversification with the relative
importance of off-farm income of farm households seems to be important for credit
repayment by both poor and non-poor households with the view that if farm activities
fail to raise income to repay loans other sources of income can be a source of funds to
liquidate the loan burden.
Socio-economic factors
Education is a necessary tool to improve the livelihood of most poor people. It helps in
the process of decision making and for farmers it is essential in that they have an
understanding of the consequences of the decisions they undertake especially in relation
to loan repayment. Education is therefore a socio-economic factor that has an influence
on loan repayment. It is generally agreed among researchers (Duy 2013; Awunyo-Vitor
2012 and Heney 2000) on loan repayment performance that the higher the education
attained or completed by a farmer the better is their loan repayment performance holding
other factors constant.
34
Apart from education another relevant socio-economic factor that affects loan repayment
performance is size of landholding where farmers practice farming and in what form the
landholding exists.
According to research done in Ghana the results showed that educational level, number
of years of farming experience, profit gained from loan, age of farmer, supervisory visits
to farmers and access to off-farm income have positive effects on yam farmers’ ability to
repay the loans given to them by financial institutions (Awunyo-Vitor 2012). A rise in
each of these factors enhanced yam farmers’ loan repayment abilities.Those with a
higher level of education fared better in servicing their loans than their peers whose
educational level was deemed low. In the same vain,in Vietnam, Duy (2013) found that
farmers grouped according to their educational level fared better in terms of their loan
repayment status.
Another factor for consideration leading to loan repayment default is expenditure on
traditional social ceremonies which include weddings, funerals and circumcision rites.
These results emerged from a study carried out in two regions of Ethiopia. Those small
scale farmers who were recipients of agricultural loan inputs who encountered a
traditional social ceremony, prior to the loan falling due, were likely to default in
repaying their loans (Bekele, Kassa and Demeke2004).
Political factors
Political factors are the issuesto do with governance of group schemes and affiliation of
individual farmers to farmer organizations. For most irrigation schemes they have
35
irrigation management committees (IMCs). These affiliations act as confluences for key
information for most farmers as some have capacity to organize loans for farmers,
encourage group buying for inputs to cut transactions costs and organize market
linkages. All these then, affects the conduct of farmers when it comes to loan repayment.
If farmers are loyal and know they accrue benefits from the leadership governing their
group or scheme they usually will not default as a way to protect the group or scheme
from bad publicity and perpetuate its existence (Deininger and Liu 2010).This is equally
the same with members who are affiliated to a farmer organization. Unfortunately this is
based on farmer’s perception and it cannot easily be measured because human
perception is complex.
In Zimbabwe there are various farmer organizations that advocate for farmers. There is
Commercial Farmers Union (CFU), Zimbabwe Commercial Farmers Union (ZCFU) and
Zimbabwe Farmers Union (ZFU). These are the major ones. Not much information is
available on the effectiveness of these organizations’ role to ensure that their members
repay their loans.
The list which has been used for literature review is a guide for further investigation and
it has summarized some findings and related issues from empirical evidence that impact
on loan repayment performance. Some of the factors have overlaps in terms of
classification. Citing collateral as an example.It can either be classified under socio-
economic factors or financial factors but what is important is that the objective was
achieved of revealing how it influences loan repayment.

36
2.6 Types of loans and their conditions
There are various categories of loans that farmers can access depending with the source
of the funds and the loan portfolio of the respective issuing institution. These include
government loans, monetary authorities finance schemes, commercial bank loans, multi-
lateral financial loan packages, donor loans and microfinance credit (Giehler 1999). The
types of loans farmers need depend on many aspects which include but not limited to
type of crops grown, landholding type, farm size (Kumar, Singh and Sinha 2010) and
farmer’s own financial resources.
The loans are further classified into secured loans or unsecured loans and capital loans
or working capital loans. Capital loans are usually long term that is one year and beyond
whilst working capital loans are for short term financingthat is for less than one year
(International Finance Corporation (IFC) 2015).
A key international leader in financing agriculture, International Fund for Agriculture
Development (IFAD), has various type of loans. The type of loans are offered in three
categories which are highly concessional,intermediate and ordinary loans (IFAD 2012).
Each of these financial products have different lending terms and conditions. Eligibility
to access these loans is based on Gross National Product (GNP) with the highly
concessional loan carrying no interest charge and earmarked for borrowers operating in
countries with GNP per capita of less than or equal to USD805. Whilst the other loans
that accrue interest and the respectiveloan tenor is between 10 to 20 years which is
different from the 40 years for the highly concessional loan (IFAD 2012). Smallholder
37
farmers can only access these funds indirectly through eligible borrowers such as
bilateral agencies, international non-governmental organizations and agriculture-related
state institutions or agricultural development banks.
According to the World Bank’s International Finance Corporation (IFC) (2015)secured
lending, in other terms secured loans, is the most preferred form of lending in formal
credit markets. Yet property valued about US$9.3 trillion in developing countries, Africa
included, is not translated to productive use and thus classified as “dead capital” (De
Soto 2000) because of non-existing or poorly functioning collateral laws and registries
(IFC 2015). As previously noted that smallholder farmers have few collateralized assets,
this condition attached to secured loans prohibits them from accessing such type of
loans. On the part of the lenders this is a well understood condition to request for
collateral on loans as a way to ring fence their funds from default risk by borrowers
(Giehler 1999). Usually secured loans are used for long term capital projects. On the
other hand unsecured loans are accessible through informal credit schemes and their
tenor is short term. These are very much accessible to smallholder farmers. One thing
with unsecured loans is that they carry a high interest rate due to the perceived high
default risk (Klein et al 1999). In most formal financial literature contract farming seems
to be out of context yet it is a recognized credit arrangement (Will 2013,Klein et al 1999
and Giehler 1999) which farmers, both commercial and smallholder farmers, have
access to.
38
In addition to informal credit schemes Official Development Assistance (ODA) agencies
have come in to assist with non-collateralized financial packages which smallholder
farmers can access. One such key player is the United States Agency for International
Development (USAID) whichthrough its Feed the Future Program, has provided
unsecured loans to smallholder farmers globally. The organization made a provision of
over US$170 million to more than 340 thousand farmers (USAID 2014). This also
includes loans issued through the contract farming arrangement which made sure that
farmers had an assured market for their produce (USAID 2014). The report did not
outline the loan repayment performance especially on loans earmarked for contract
farming purposes.
In India, Ahangar, Ganie and Padder (2013) make a clear contrast of three major types
of loans that farmers have access to. They mention short to medium term loans accessed
from cooperatives set up by the state, scheduled commercial banks and regional rural
banks. The other type of loans that they identify is long-term loans and their provision
comes from primary cooperative agricultural and rural development banks. Whilst the
National Bank for Agriculture and Rural Development (NABARD) exists to provide
loans at national level and does onward lending to the above-mentioned agricultural
financing agencies.
Zimbabwe context
At the onset of the multi-currency regime in February 2009 the monetary and fiscal
authorities set out to revive the economy by stipulating expected distribution of credit
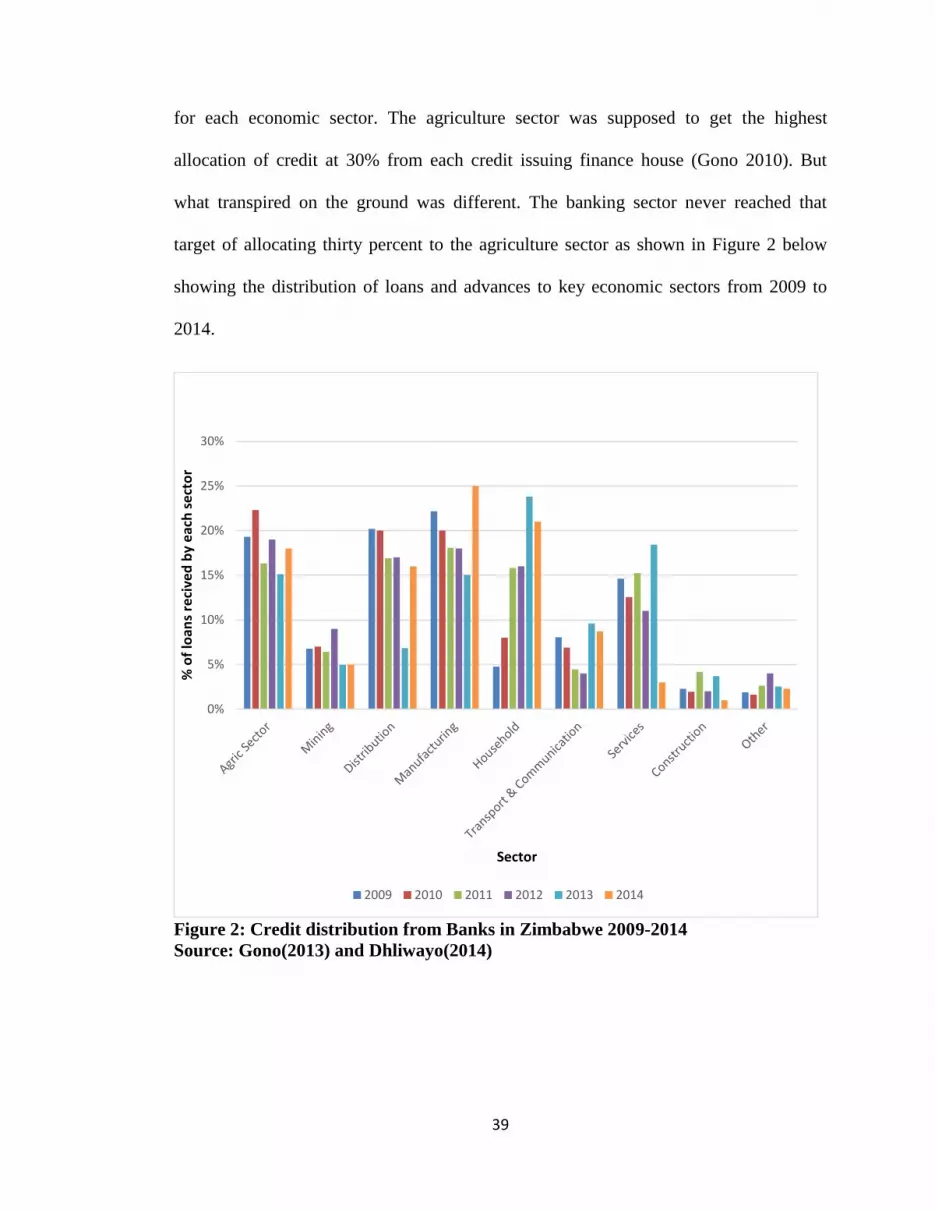
39
for each economic sector. The agriculture sector was supposed to get the highest
allocation of credit at 30% from each credit issuing finance house (Gono 2010). But
what transpired on the ground was different. The banking sector never reached that
target of allocating thirty percent to the agriculture sector as shown in Figure 2 below
showing the distribution of loans and advances to key economic sectors from 2009 to
2014.
Figure 2: Credit distribution from Banks in Zimbabwe 2009-2014
Source: Gono(2013) and Dhliwayo(2014)
0%
5%
10%
15%
20%
25%
30%
% o
f lo
ans
reci
ved
by
eac
h s
ect
or
Sector
2009 2010 2011 2012 2013 2014

40
It is a worrying situation. The highest allocation that the agriculture sector ever received,
since the inception of the multi-currency regime, was 22% in 2009. It was also the sector
that received the lion’s share of loans and advances that year. The following graph,
Figure 3, shows the amounts that have been issued as loans to agriculture from
commercial banks from 2009 to 2014.The amount of loans issued to agriculture
modestly increased from US$123 million in 2009 to over US$700 million in 2014 as
shown in Figure 3 below.
Figure 3: Loans from commercial banks in Zimbabwe to Agriculture sector
Source: Gono(2013) and Dhliwayo(2014)
The data shown in Figure 3 lacks critical information on the analysis of the amount
received by each component of the agricultural value chain in Zimbabwe. The figures
2009 2010 2011 2012 2013 2014
123,381,307.84
331,244,200.00
461,104,000.00
668,610,000.00
559,607,832.00
720,000,000.00
0.00
100,000,000.00
200,000,000.00
300,000,000.00
400,000,000.00
500,000,000.00
600,000,000.00
700,000,000.00
800,000,000.00
1 2 3 4 5 6
AM
OU
NT
IN U
S$
Year Amount (USD)

41
exclude borrowings from external sources that the agriculture sector accessed and
through private arrangements such as contract farming. The other key missing
information is loan repayment performance analysis to show which sector is performing
well in repaying their loans and which sectors are leading in non-performing loans. Due
to limited information on other forms of loans that farmers have access to such as
contract farming, informal credit arrangements and non-governmental financial
interventions, it can be said that currently the major source of loans for Zimbabwean
farmers is through the formal banking system as depicted in Figure 3.This has been the
same scenario in India where commercial banks are the major source of credit for the
agriculture sector (Kumar, Singh and Sinha 2010).
For the performance of contract farming in Zimbabwe and the funds which have flowed
through this interlinked credit arrangement is managed by the Agricultural Marketing
Authority (AMA). The Authority focuses on grains and oilseeds as stipulated in the
AMA Statutory instrument 140 of 2013 (AMA 2013). With the availability of
information from AMA on loans accessed through contract farming it will be prudent to
have a consolidated position in terms of loans issued to the agriculture sector. This helps
in giving a clear understanding of the contribution of contract farming performance to
the national economy in general and to the agriculture sector in particular. But currently
the information is not readily available to make such comparisons and draw empirical
conclusions.
42
2.7 Mitigation measures to avert loan defaulting
In order to proffer mitigation measures to avert the tide of loan default by farmersthere is
need to understand the risks that accrue in lending to the agriculture economic
system.More so Wenner (2010) admits that agriculture activity is inherently a risk
economic undertaking.Olofsson (2009) presenting on Risk in Agriculture enlists
production (yield), price (market issues), institutional, financial and personal as some of
the sources of risk in agriculture.Whereas Miller and Jones (2010) group the risks into
three types which are production, price, and credit (client)risk.The focus of this
discussion will be limited to credit (default) risk.Thisis not down grading the other two
risks of production and priceto be irrelevant.Giehler(1999) concurs thatdefault risk is
apparent and seems to be a prominent challengein lending to agriculture. Default risk is
defined by Giehler (1999)as the failure by borrower to pay their loan when it is due.
Among some of the ways that have been known to reduce default is group lending.
Wenner (2010) and Khandker (2012), in their studies found empirical evidence that
loans issued to groups are likely to be paid than those issued to individuals. Locally the
Reserve Bank of Zimbabwe (RBZ) has recommended group lending in its lending
guidelines for the Small to Medium Enterprises (SMES) Revolving Fund in 2006 (RBZ
2006). Whilst a research on strategies to curb side-marketing in the cotton industry by
Nyamwanzaet al (2014), found that group lending had little impact in solving the
challenge of side marketing which ultimately leads to loan default.
43
Wenner (2010)outlined some of the other mitigating measures to counter default. He
mentions four measures which are expert-credit evaluation system, portfolio
diversification, portfolio exposure limit and lastly excessive provisioning. But some of
these measures such as expert credit evaluation system will be expensive to administer
especially for a widely dispersed client base such as rural farmers. This measure is also
limited in its implementation to rural farmers because of its dependence on proper record
keeping by farmers. Yet many of rural farmers do not keep proper financial records and
filing of evidence of financial transactions unless they are thoroughly trained (Wenner
2010).
The International Finance Corporation (IFC 2015) enlistsinsurance products as an
antidote to various risks that lead borrowers to default. Weather insurance,personal
insurance, production risk insurance are some of the insurance products that the IFC
advices farmers to have in case any of the adverse conditions associated with these
insurance policies occur. Weather insurance is mainly for farmers who practice rain-fed
agriculture which is not so much of a risk (holding all other things constant) in this
research as it is limited to irrigation schemes. These insurance costs are incorporated in
the loan package and they become a cost that the borrower incurs.
44
CHAPTER THREE: METHODOLOGY
3.1Research design
There are various research designs that are used to undertake a research. Research
design is the strategy that guides the research to see it being effectively carried out (De
Vaus 2001). This study further asserts that a research design encompasses the
framework that is used for collection, measurement and analysis of data. The research
design to be adopted is determined by the research problem. There are a number of
research designs. Yeong (2011) mentions three of the most common which are
descriptive, causal and exploratory research designs. Other authors include cross
sectional research, experimental design, historical design, observational design and case
study but essentially they fall into the three main categories of research designs as noted
by Yeong (2011). Each of these research designs have their advantages and
disadvantages which are numerous to discuss in this report.
The decision to use a causal research design was premised on the research topic which
sought to find the causes of loan repayment performance by contract farmers and its
effect on the contract relationships forged prior to and during the implementation of the
contract. The research was mainly based on quantitative research and as Yeong (2011)
states, causal research design is normally used for quantitative data.
3.2 Area of study
The research was conducted inManicaland Province in the south-eastern part of
Zimbabwe (see Figure 4). The research was delineated to irrigation schemes operated by

45
smallholder farmers in Chipinge District, who accessed agribusiness services offered by
Fintrac Incorporation (Fintrac Inc.) which was contracted by the United States Agency
for International Development to carry out the objectives of the Zimbabwe Agricultural
Income and Employment Development Program (Zim-AIED).
Figure 4: Musikavanhu Constituencylocation of irrigation schemes in Manicaland
Province.
Source: http://en.wikipedia.org/wiki/Manicaland_Province
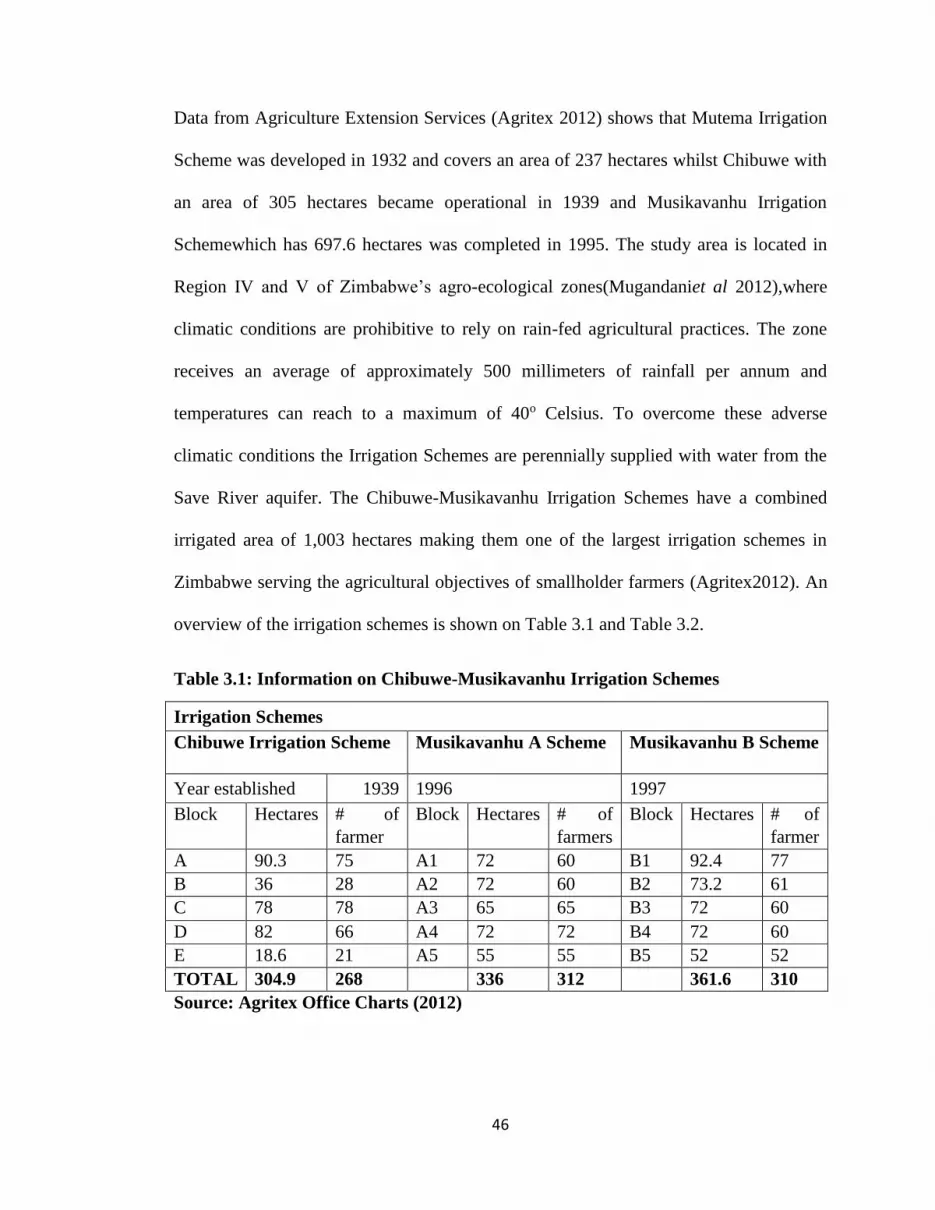
46
Data from Agriculture Extension Services (Agritex 2012) shows that Mutema Irrigation
Scheme was developed in 1932 and covers an area of 237 hectares whilst Chibuwe with
an area of 305 hectares became operational in 1939 and Musikavanhu Irrigation
Schemewhich has 697.6 hectares was completed in 1995. The study area is located in
Region IV and V of Zimbabwe’s agro-ecological zones(Mugandaniet al 2012),where
climatic conditions are prohibitive to rely on rain-fed agricultural practices. The zone
receives an average of approximately 500 millimeters of rainfall per annum and
temperatures can reach to a maximum of 40o Celsius. To overcome these adverse
climatic conditions the Irrigation Schemes are perennially supplied with water from the
Save River aquifer. The Chibuwe-Musikavanhu Irrigation Schemes have a combined
irrigated area of 1,003 hectares making them one of the largest irrigation schemes in
Zimbabwe serving the agricultural objectives of smallholder farmers (Agritex2012). An
overview of the irrigation schemes is shown on Table 3.1 and Table 3.2.
Table 3.1: Information on Chibuwe-Musikavanhu Irrigation Schemes
Irrigation Schemes
Chibuwe Irrigation Scheme
Musikavanhu A Scheme
Musikavanhu B Scheme
Year established 1939 1996 1997
Block Hectares # of
farmer
Block Hectares # of
farmers
Block Hectares # of
farmer
A 90.3 75 A1 72 60 B1 92.4 77
B 36 28 A2 72 60 B2 73.2 61
C 78 78 A3 65 65 B3 72 60
D 82 66 A4 72 72 B4 72 60
E 18.6 21 A5 55 55 B5 52 52
TOTAL 304.9 268 336 312 361.6 310
Source: Agritex Office Charts (2012)
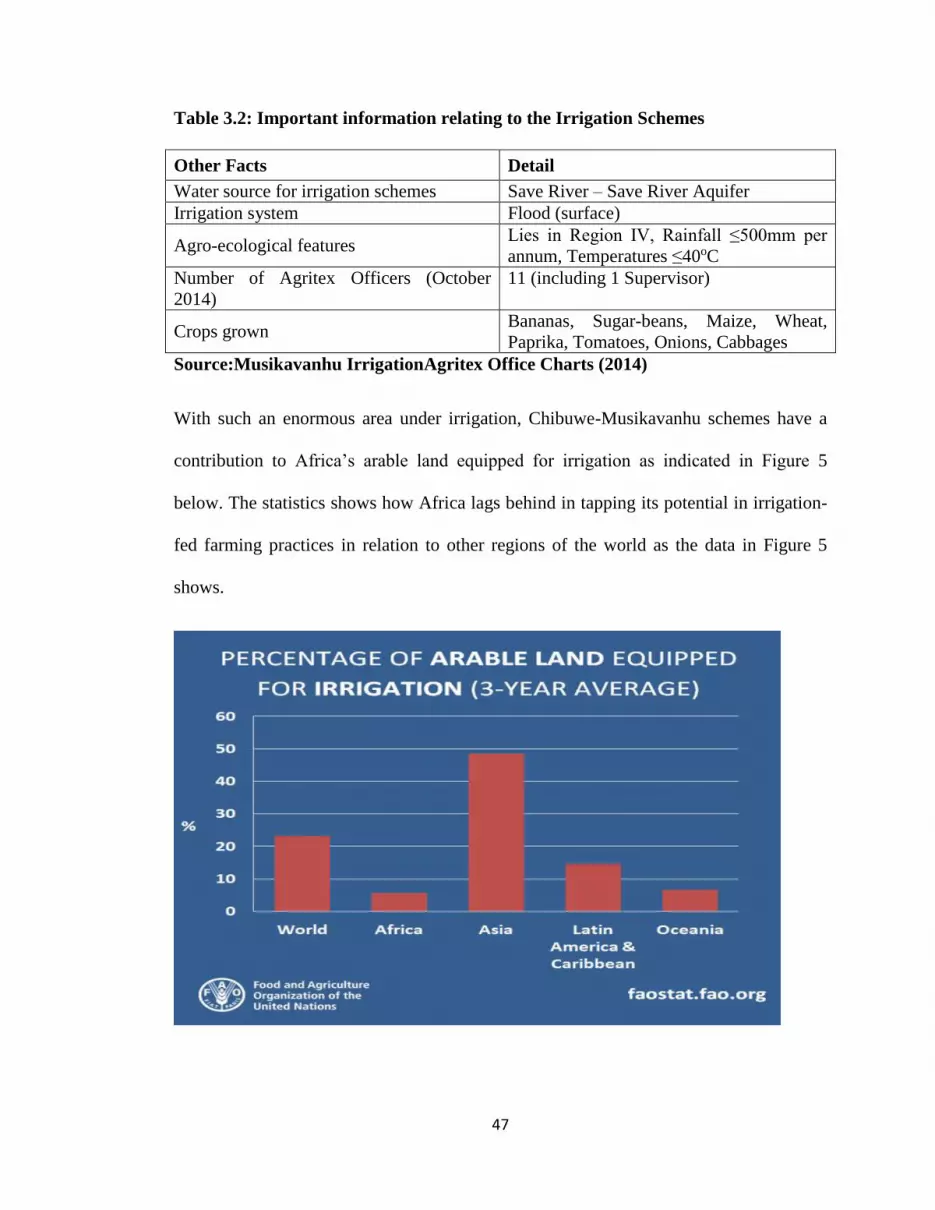
47
Table 3.2: Important information relating to the Irrigation Schemes
Other Facts Detail
Water source for irrigation schemes Save River – Save River Aquifer
Irrigation system Flood (surface)
Agro-ecological features Lies in Region IV, Rainfall ≤500mm per
annum, Temperatures ≤40oC
Number of Agritex Officers (October
2014)
11 (including 1 Supervisor)
Crops grown Bananas, Sugar-beans, Maize, Wheat,
Paprika, Tomatoes, Onions, Cabbages
Source:Musikavanhu IrrigationAgritex Office Charts (2014)
With such an enormous area under irrigation, Chibuwe-Musikavanhu schemes have a
contribution to Africa’s arable land equipped for irrigation as indicated in Figure 5
below. The statistics shows how Africa lags behind in tapping its potential in irrigation-
fed farming practices in relation to other regions of the world as the data in Figure 5
shows.

48
Figure 5: FAO irrigation statistics 2013
Source: faostat.fao.org
3.3 Study population and sampling technique
In every research study a population exists that forms the universal characteristics of the
study being undertaken (Kothari 2004). The author further notes that the entire
enumeration of all the subjects of a population is called a census and no element of the
population is left out and the highest degree of accuracy is achieved. This is the major
advantage of the use of the whole population. This is mostly used for a country’s
population census which in most countries take place after every decade and for some
developed nations it happens after every five years (CBS 2015). The major disadvantage
of using the whole population for a study is the enormity of costs and resources required
to undertake it (Office for National Statistics UK 2001). This limits most academic
researchers to use a proportion or smaller representation of the population which is a
sample of the population. The sample is derived from the population.
Description of the population of the study
The study’s population is comprised of all the farmers who have accessed contract
farming arrangements for bananas and sugar-beans as from the year 2011. The farmers
do their farming practices in Chibuwe-Musikavanhu and Mutema Irrigation Schemes.
Banana farming was introduced to the Irrigation Schemes in 2011 for the first time by
the Zim-AIED Program. Sugar-beans has always been a crop grown in the Irrigation
Schemes either under contract farming (Fintrac 2014) or sold on the open market. Table
3.3 shows the population of contract farmers totaling 1,001 and how they are distributed
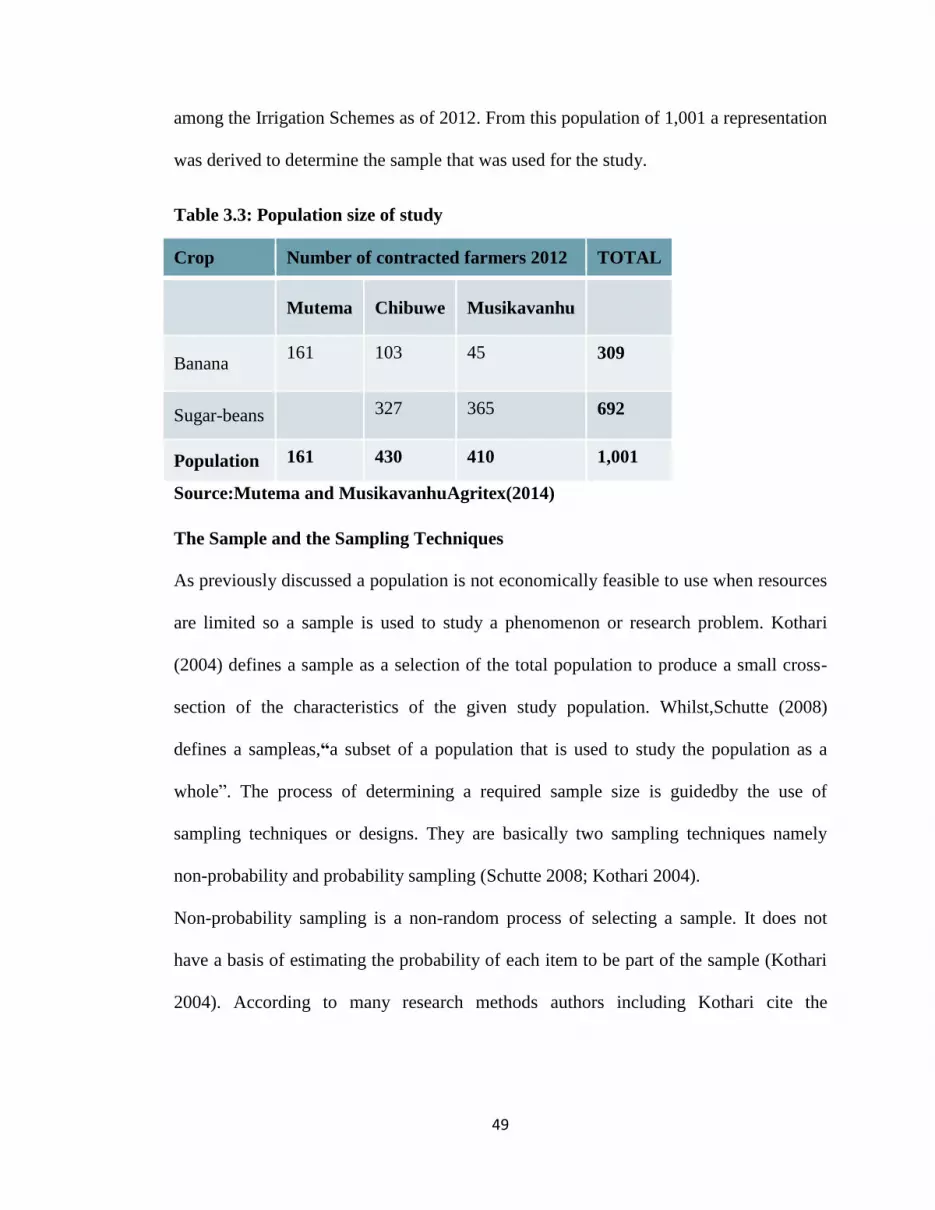
49
among the Irrigation Schemes as of 2012. From this population of 1,001 a representation
was derived to determine the sample that was used for the study.
Table 3.3: Population size of study
Crop Number of contracted farmers 2012 TOTAL
Mutema Chibuwe Musikavanhu
Banana 161 103 45 309
Sugar-beans 327 365 692
Population 161 430 410 1,001
Source:Mutema and MusikavanhuAgritex(2014)
The Sample and the Sampling Techniques
As previously discussed a population is not economically feasible to use when resources
are limited so a sample is used to study a phenomenon or research problem. Kothari
(2004) defines a sample as a selection of the total population to produce a small cross-
section of the characteristics of the given study population. Whilst,Schutte (2008)
defines a sampleas,“a subset of a population that is used to study the population as a
whole”. The process of determining a required sample size is guidedby the use of
sampling techniques or designs. They are basically two sampling techniques namely
non-probability and probability sampling (Schutte 2008; Kothari 2004).
Non-probability sampling is a non-random process of selecting a sample. It does not
have a basis of estimating the probability of each item to be part of the sample (Kothari
2004). According to many research methods authors including Kothari cite the

50
following, purposive sampling, quota sampling and judgment sampling as techniques
that fall under non-probability sampling. Whereas probability sampling is also known as
random sampling. Every unit in the population has an equal chance of being selected to
be part of the sample (Kothari 2004). Simple random sampling, cluster sampling,
systematic sampling and stratified sampling comprise the methods under probability
sampling (Kothari 2004).
This study has employed probability sampling using the cluster sampling method. This
is convenient for the study in that each Irrigation scheme forms a cluster to determine
the sample for the study. Each farmer who was contracted to grow sugar beans or
bananas in any of the blocks had an equal opportunity to be randomly interviewed for
the study. It can also be noted that purposive sampling was used to identify the study
area, the irrigation schemes and the crops grown under contract farming in the respective
schemes.
Determination of the study’s sample size
Greene(2000) and Maddala (1983) use 10% of the population size to calculate a
statistically acceptable working sample size for a given population. The formula is as
follows:
Working/intended Sample size = 10% * Population. 10% X 1001 = 101. This resulted in
a working sample size of 101 farmers for the study.
According to Saunders, Lewis, and Thonhill(2003), aworking sample size is the sample
size the researcher expects to use to achieve the objectives of the study.In this study the
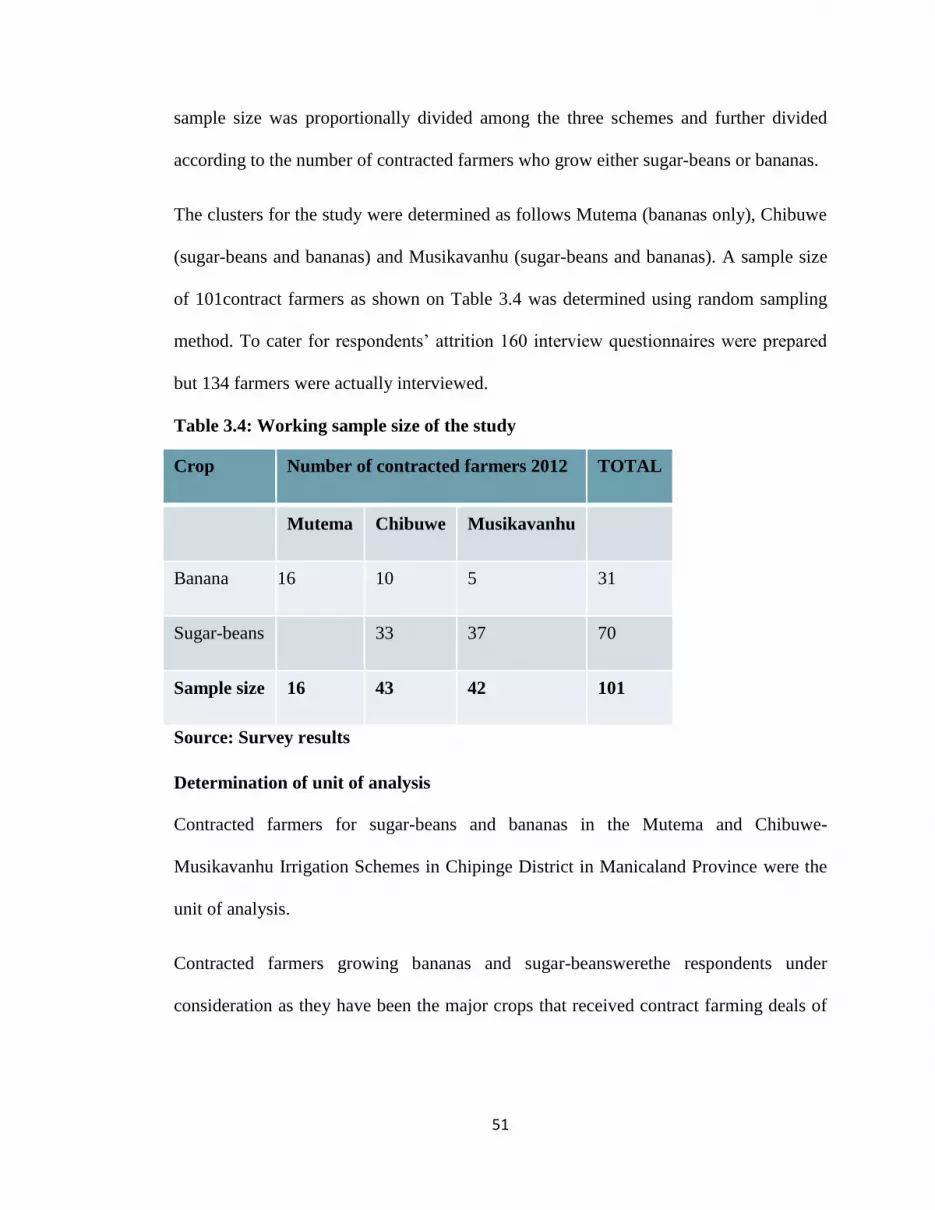
51
sample size was proportionally divided among the three schemes and further divided
according to the number of contracted farmers who grow either sugar-beans or bananas.
The clusters for the study were determined as follows Mutema (bananas only), Chibuwe
(sugar-beans and bananas) and Musikavanhu (sugar-beans and bananas). A sample size
of 101contract farmers as shown on Table 3.4 was determined using random sampling
method. To cater for respondents’ attrition 160 interview questionnaires were prepared
but 134 farmers were actually interviewed.
Table 3.4: Working sample size of the study
Crop Number of contracted farmers 2012 TOTAL
Mutema Chibuwe Musikavanhu
Banana 16 10 5 31
Sugar-beans 33 37 70
Sample size 16 43 42 101
Source: Survey results
Determination of unit of analysis
Contracted farmers for sugar-beans and bananas in the Mutema and Chibuwe-
Musikavanhu Irrigation Schemes in Chipinge District in Manicaland Province were the
unit of analysis.
Contracted farmers growing bananas and sugar-beanswerethe respondents under
consideration as they have been the major crops that received contract farming deals of

52
significance in the irrigation schemes. The two crops have been chosen to make
comparisons on the loan repayment performance of contracted farmers. This was
intended to give a broader perspective on the benchmarks of success or failure to repay
loans by contracted farmers who planted either of the two crops.
3.4 Data collection
Data collection exercise entails that the researcher has access to key resources of
information either the human subjects or other sources of information relevant to the
study. The data collection is hinged in accessing primary and secondary data. Primary
data constitutes data that has been specifically collected to answer the research questions
through various instruments (Gill and Johnson 2002; Isaac and Michael, 1981). Primary
data collection constitutes the fieldwork element of the research. Secondary data is study
written by someone else other than the researcher and it is information that already
exists. Secondary data can be found in various forms such as abstracts, indexes of
periodicals, local and international journals and other publicationsand dissertations (Gill
and Johnson 2002).
The data in this study was collected for a three year period from 2012 to 2014 to allow
for trend analysis of the contract farming performance over the three years. The year
2012 was chosen because it was the year with the highest number of farmers who have
been contracted for sugar-beans production in terms of value and quantity. It was also
the same year that the first seedlings for banana production where transplanted from the
nursery,set up in 2011,to the field under contract farming for the first time in the two
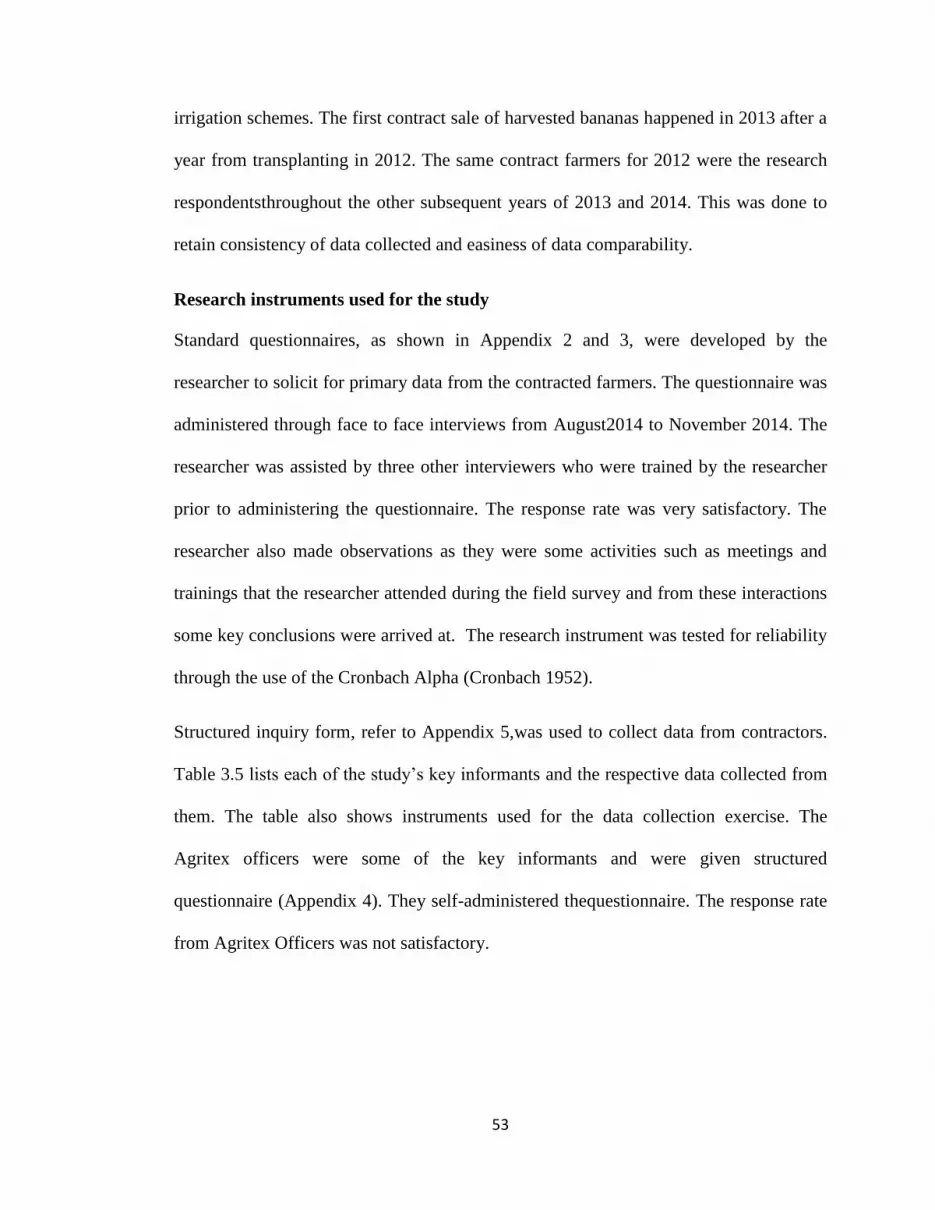
53
irrigation schemes. The first contract sale of harvested bananas happened in 2013 after a
year from transplanting in 2012. The same contract farmers for 2012 were the research
respondentsthroughout the other subsequent years of 2013 and 2014. This was done to
retain consistency of data collected and easiness of data comparability.
Research instruments used for the study
Standard questionnaires, as shown in Appendix 2 and 3, were developed by the
researcher to solicit for primary data from the contracted farmers. The questionnaire was
administered through face to face interviews from August2014 to November 2014. The
researcher was assisted by three other interviewers who were trained by the researcher
prior to administering the questionnaire. The response rate was very satisfactory. The
researcher also made observations as they were some activities such as meetings and
trainings that the researcher attended during the field survey and from these interactions
some key conclusions were arrived at. The research instrument was tested for reliability
through the use of the Cronbach Alpha (Cronbach 1952).
Structured inquiry form, refer to Appendix 5,was used to collect data from contractors.
Table 3.5 lists each of the study’s key informants and the respective data collected from
them. The table also shows instruments used for the data collection exercise. The
Agritex officers were some of the key informants and were given structured
questionnaire (Appendix 4). They self-administered thequestionnaire. The response rate
from Agritex Officers was not satisfactory.
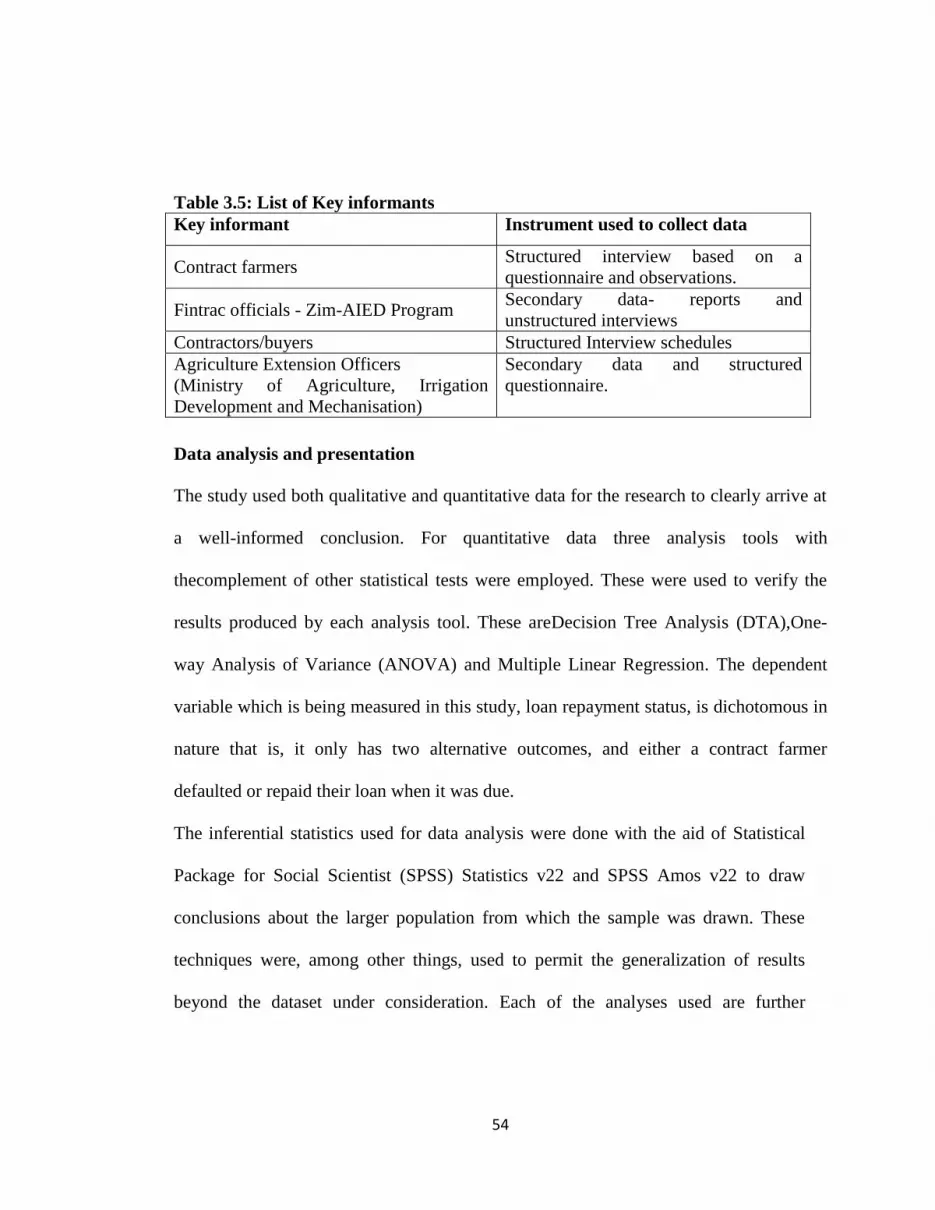
54
Table 3.5: List of Key informants
Key informant Instrument used to collect data
Contract farmers Structured interview based on a
questionnaire and observations.
Fintrac officials - Zim-AIED Program Secondary data- reports and
unstructured interviews
Contractors/buyers Structured Interview schedules
Agriculture Extension Officers
(Ministry of Agriculture, Irrigation
Development and Mechanisation)
Secondary data and structured
questionnaire.
Data analysis and presentation
The study used both qualitative and quantitative data for the research to clearly arrive at
a well-informed conclusion. For quantitative data three analysis tools with
thecomplement of other statistical tests were employed. These were used to verify the
results produced by each analysis tool. These areDecision Tree Analysis (DTA),One-
way Analysis of Variance (ANOVA) and Multiple Linear Regression. The dependent
variable which is being measured in this study, loan repayment status, is dichotomous in
nature that is, it only has two alternative outcomes, and either a contract farmer
defaulted or repaid their loan when it was due.
The inferential statistics used for data analysis were done with the aid of Statistical
Package for Social Scientist (SPSS) Statistics v22 and SPSS Amos v22 to draw
conclusions about the larger population from which the sample was drawn. These
techniques were, among other things, used to permit the generalization of results
beyond the dataset under consideration. Each of the analyses used are further

55
explained below:
Independent Sample t test was used to determine whether any two given
means from two unrelated samples coming from populations with the same
mean are significant.
One-Way ANOVA was used to test whether several independent groups
come from populations with the same mean, and in other words whether two
given variables are dependent on each other.
Binomial Test wasalsoused to test the hypothesis that a variable comes from
a binomial population with a specified probability of an event occurring. The
variable can only have two alternative outcomes or values.
Factor Analysis was used to identify factors that explain the correlations
among a set of variables. Factor analysis therefore helps in summarizing a
large number of variables with a smaller number of derived variables, called
factors.
Bivariate Analysis calculates matrices of Pearson product-moment
correlations, and of Kendall and Spearman non-parametric correlations, with
significance levels and optional univariate statistics. The correlation
coefficient was used to quantify the strength of the linear relationship
between two variables. The Pearson correlation coefficient was used only
for data measured at the interval or ratio level. Spearman and Kendall
correlation coefficients are non-parametric measures which are useful when
the data contain outliers or when the distribution of the variables is
56
markedly non-normal.
Linear Regression was usedto examine the relationship between a
dependent variable and a set of preliminary independent variables which are
listed in Table 3.6. The linearmodelsresultin linear plots, and hasthe
following statisticalframework:
Yi01Xii,
where:
Yi(Loan repayment status) -Outcome of Dependent Variable (default or
success) for ith
Xi- Level of the Independent (predictor) variable for i
01Xi- Linear (systematic) relation between Yi and Xi
0 - Mean of Y when X=0 (Y-intercept)
1 - Change in mean of Y when X increases by 1 (slope)
i- Random error term
Table 3.6: Independent variables investigated for the study
Symbol Variable Measure
X1 Gender of farmer Male or Female
X2 Marital status Married, Single, Widowed, Divorced,
X3 Age of farmer Age of farmer
X4 Household size Number of people under the care of farmer
X5 Number of school going
children
Family members of the farmer still going to
school.
X6 Output Kilograms - sugar-beans and bananas
X7 Source of labour Family/Hired/Both
X8 Trainingsattended
conducted under Zim-
AIED Program
Number of trainings attended by farmer of
five chosen courses trained by Zim-AIED
Officials.
X9 Revenue Amount received by farmer in USD
X10 Number of Agritex Frequency of Agritex Officer’s visit on
57
Officer’s visit per week contract farmers’ field
Decision Tree Analysis (DTA) – In this study, the researcher also used decision trees as
predictive models to help predict the values of the dependent variable (loan
repaymentstatus) based on values of independent (predictor) variables. This was
achieved by constructing trees, where each (non-terminal) node identifies a split
condition, to yield optimum prediction (of response variables) or classification (for
categorical dependent or response variables). The DTA is shown as a diagram presenting
outcomes in a tree-like form and showing the alternatives to reaching a decision. The
DTA allowed for the analysis of multiple variables to predict, explain and describe an
outcome. Lakshmi et al (2013) further argue that DTA has the advantage of producing
sequences (branches) of rules that can easily be followed to recognize the relationship
between dependent and independent variables as noted and shown in this study.
Normally, decision trees can be generated using four different algorithms as tree
growing methods, and these are:
o CHAID (Chi Square Automatic Interaction Detector)
o Exhaustive CHAID
o CRT (Classification and Regression Tree)
o QUEST (Quick Unbiased Efficient Statistical Tree)
However, with the categorical nature of the data, the CHAID approach was availed, in
lieu of the other approaches.
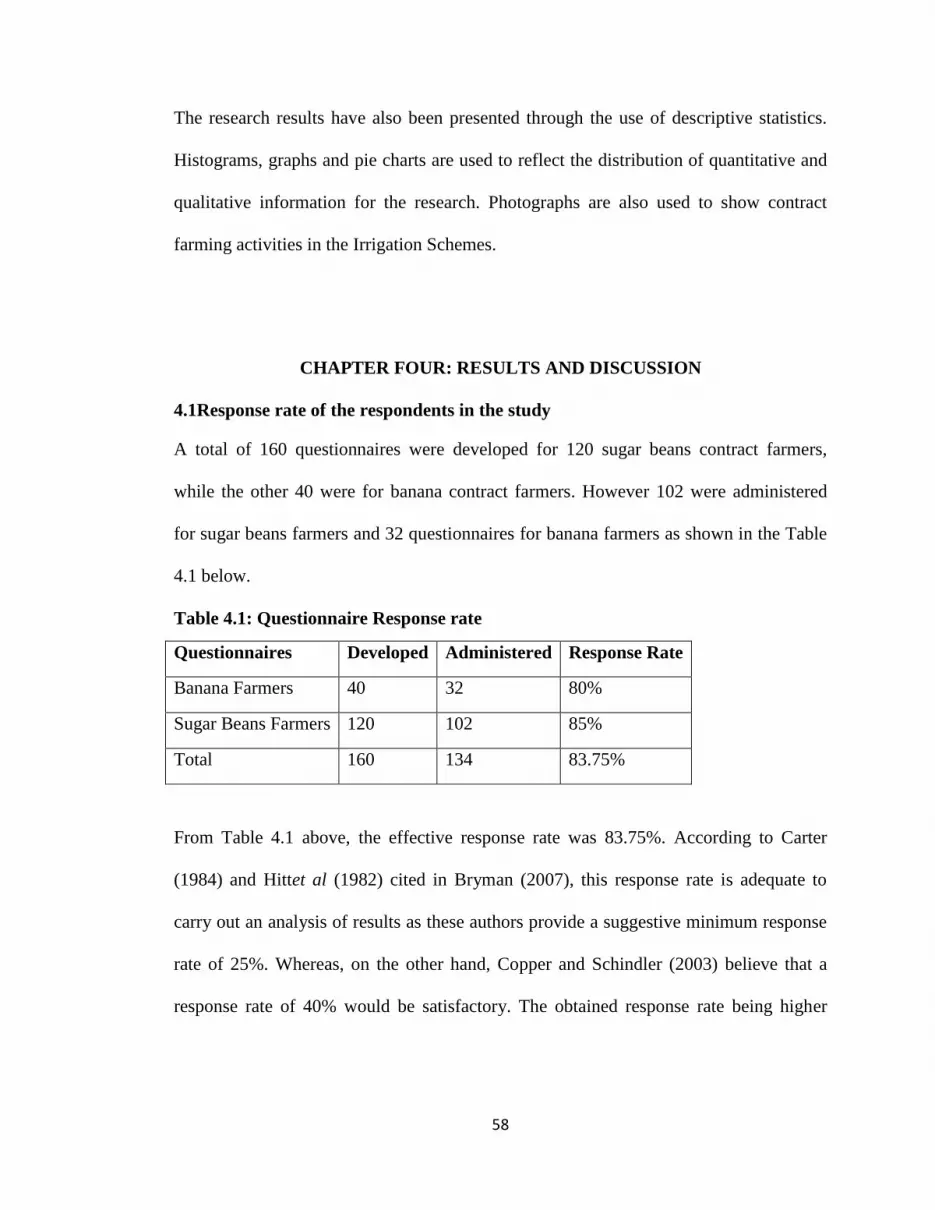
58
The research results have also been presented through the use of descriptive statistics.
Histograms, graphs and pie charts are used to reflect the distribution of quantitative and
qualitative information for the research. Photographs are also used to show contract
farming activities in the Irrigation Schemes.
CHAPTER FOUR: RESULTS AND DISCUSSION
4.1Response rate of the respondents in the study
A total of 160 questionnaires were developed for 120 sugar beans contract farmers,
while the other 40 were for banana contract farmers. However 102 were administered
for sugar beans farmers and 32 questionnaires for banana farmers as shown in the Table
4.1 below.
Table 4.1: Questionnaire Response rate
Questionnaires Developed Administered Response Rate
Banana Farmers 40 32 80%
Sugar Beans Farmers 120 102 85%
Total 160 134 83.75%
From Table 4.1 above, the effective response rate was 83.75%. According to Carter
(1984) and Hittet al (1982) cited in Bryman (2007), this response rate is adequate to
carry out an analysis of results as these authors provide a suggestive minimum response
rate of 25%. Whereas, on the other hand, Copper and Schindler (2003) believe that a
response rate of 40% would be satisfactory. The obtained response rate being higher

59
than these prescribed normative minimums, the researcher therefore went on to analyze
the results.
4.3 Reliability analysisresults
To test the reliability of the research instrument that was used in this research, the
researcher analyzed the Cronbach’s Alpha and the results are shown in the Table 4.2
below.
Table 4.2 Reliability Analysis of research questionnaire
Reliability Statistics
Cronbach's Alpha N of Items
0.88 50
According to Cronbach (1952), the lower threshold for an acceptable reliability statistic
is 0.70. From the research results, a substantially high Cronbach’s Alpha statistic of 0.88
was computed. This being higher than 0.7, it therefore suggests that the research
instrument used for this research was reliable enough, implying also the reliability of the
research findings thereof.
4.4 Demographicresults of the study
In this study, age, gender, marital status, household size and number of school-going
children were considered and analyzed, as demographic factors, for their influence on
loan repayment. The summary statistics for these variables are presented below.
Gender distribution of contract farmers
The distribution of the responses by gender is shown in the Figure 6 below. From the
figure, the largest proportion was comprised of males (59%), while females constituted
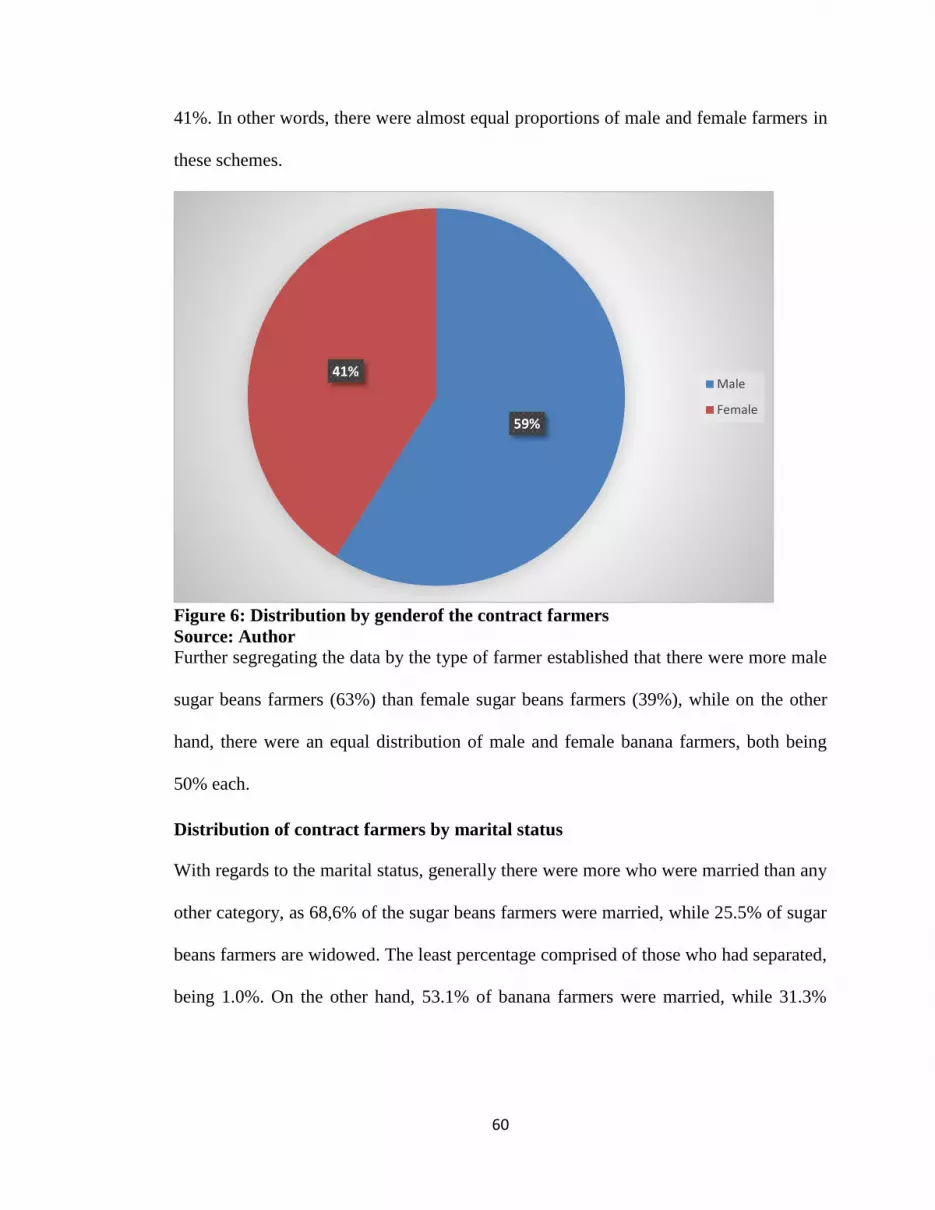
60
41%. In other words, there were almost equal proportions of male and female farmers in
these schemes.
Figure 6: Distribution by genderof the contract farmers
Source: Author
Further segregating the data by the type of farmer established that there were more male
sugar beans farmers (63%) than female sugar beans farmers (39%), while on the other
hand, there were an equal distribution of male and female banana farmers, both being
50% each.
Distribution of contract farmers by marital status
With regards to the marital status, generally there were more who were married than any
other category, as 68,6% of the sugar beans farmers were married, while 25.5% of sugar
beans farmers are widowed. The least percentage comprised of those who had separated,
being 1.0%. On the other hand, 53.1% of banana farmers were married, while 31.3%
59%
41%Male
Female
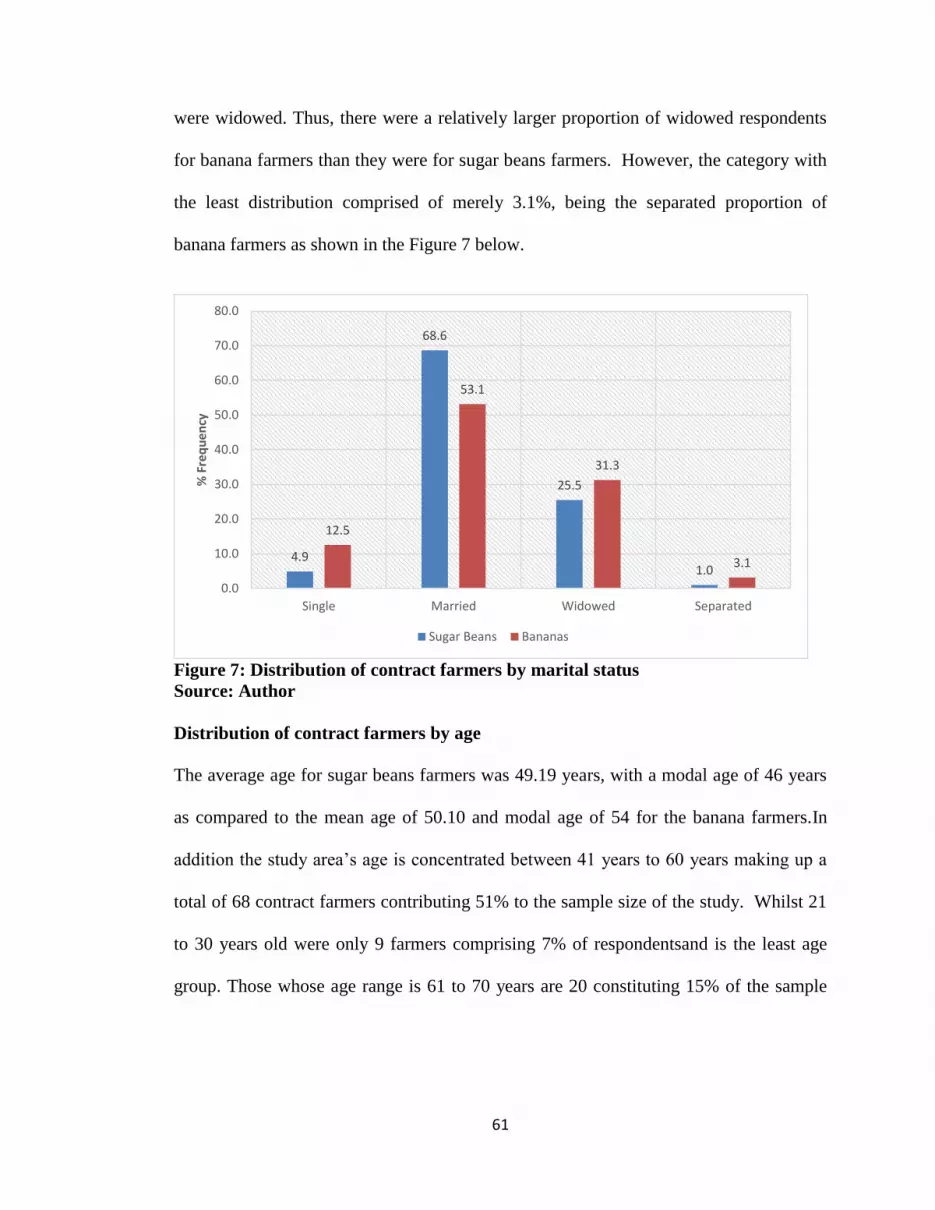
61
were widowed. Thus, there were a relatively larger proportion of widowed respondents
for banana farmers than they were for sugar beans farmers. However, the category with
the least distribution comprised of merely 3.1%, being the separated proportion of
banana farmers as shown in the Figure 7 below.
Figure 7: Distribution of contract farmers by marital status
Source: Author
Distribution of contract farmers by age
The average age for sugar beans farmers was 49.19 years, with a modal age of 46 years
as compared to the mean age of 50.10 and modal age of 54 for the banana farmers.In
addition the study area’s age is concentrated between 41 years to 60 years making up a
total of 68 contract farmers contributing 51% to the sample size of the study. Whilst 21
to 30 years old were only 9 farmers comprising 7% of respondentsand is the least age
group. Those whose age range is 61 to 70 years are 20 constituting 15% of the sample
4.9
68.6
25.5
1.0
12.5
53.1
31.3
3.1
0.0
10.0
20.0
30.0
40.0
50.0
60.0
70.0
80.0
Single Married Widowed Separated
% F
req
ue
ncy
Sugar Beans Bananas

62
size and those who are 71 years and over are 12 in number and their percentage
distribution is 9% as shown in Figure 8 below.
Figure 8: Age distribution of contract farmers for sugar-beans and bananas
Source: Author
Distribution of contract farmers by household size
The distribution of the responses by household size for both sugar beans and banana
farmers is presented in the Figure 9below. From the illustration, the largest proportion of
household size was 5, comprising of 17.9% of the responses, with a size of 7, seconding
with a respective frequency of 14.9%, while a size of 6 was third rated, with a frequency
of 13.4%. In a nutshell, the distribution of the household size was rather normally
distributed as shown in the Figure 9 below.
9
14
39 39
20
12
0%
5%
10%
15%
20%
25%
30%
35%
0
5
10
15
20
25
30
35
40
45
21-30 31-40 41-50 51-60 61-70 71 +
% d
istr
ibu
tio
n o
f fa
rmer
s
Nu
mb
er o
f co
ntr
act
farm
ers
Age of contact farmer in years
Number of contract farmers % Distribution
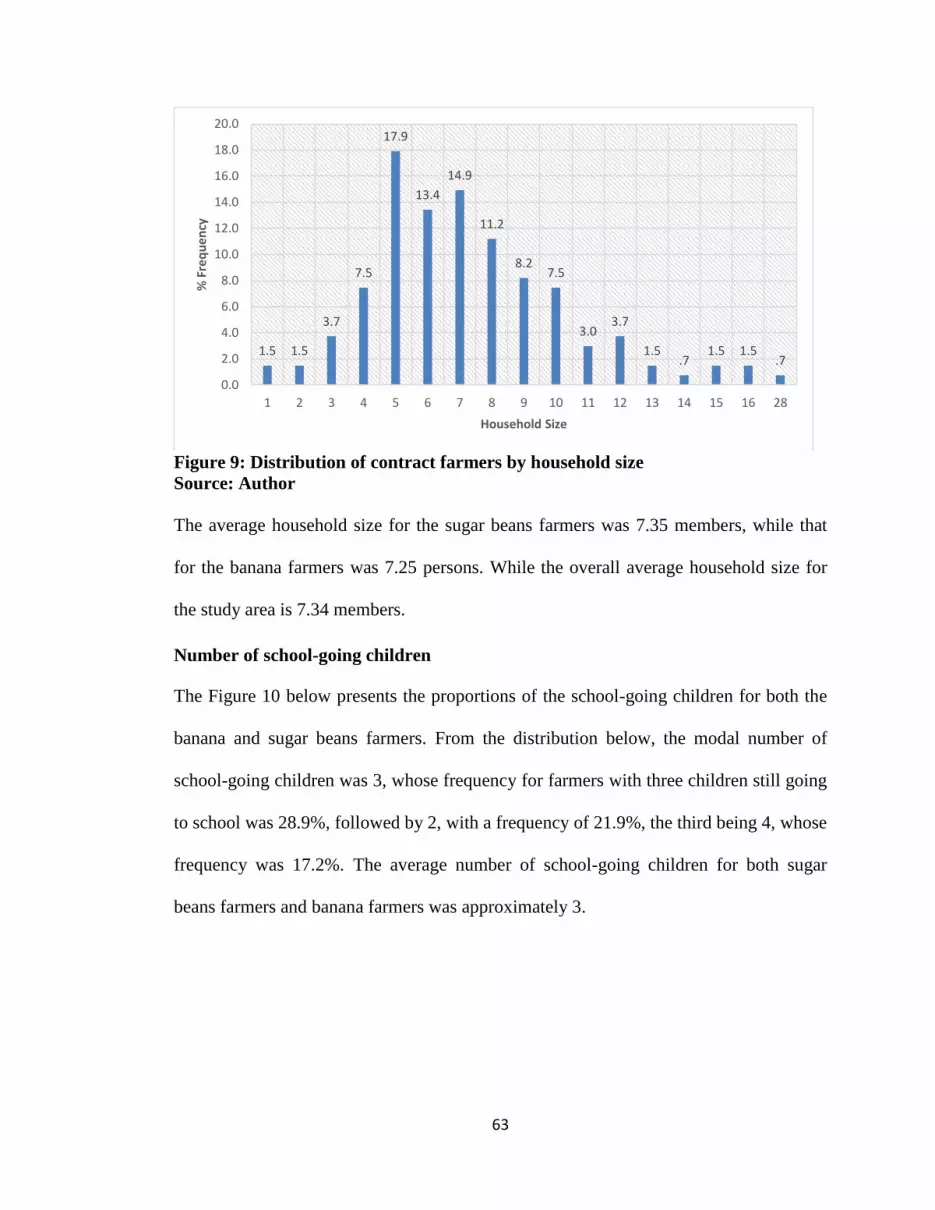
63
Figure 9: Distribution of contract farmers by household size
Source: Author
The average household size for the sugar beans farmers was 7.35 members, while that
for the banana farmers was 7.25 persons. While the overall average household size for
the study area is 7.34 members.
Number of school-going children
The Figure 10 below presents the proportions of the school-going children for both the
banana and sugar beans farmers. From the distribution below, the modal number of
school-going children was 3, whose frequency for farmers with three children still going
to school was 28.9%, followed by 2, with a frequency of 21.9%, the third being 4, whose
frequency was 17.2%. The average number of school-going children for both sugar
beans farmers and banana farmers was approximately 3.
1.5 1.5
3.7
7.5
17.9
13.4
14.9
11.2
8.27.5
3.03.7
1.5.7
1.5 1.5.7
0.0
2.0
4.0
6.0
8.0
10.0
12.0
14.0
16.0
18.0
20.0
1 2 3 4 5 6 7 8 9 10 11 12 13 14 15 16 28
% F
req
ue
ncy
Household Size
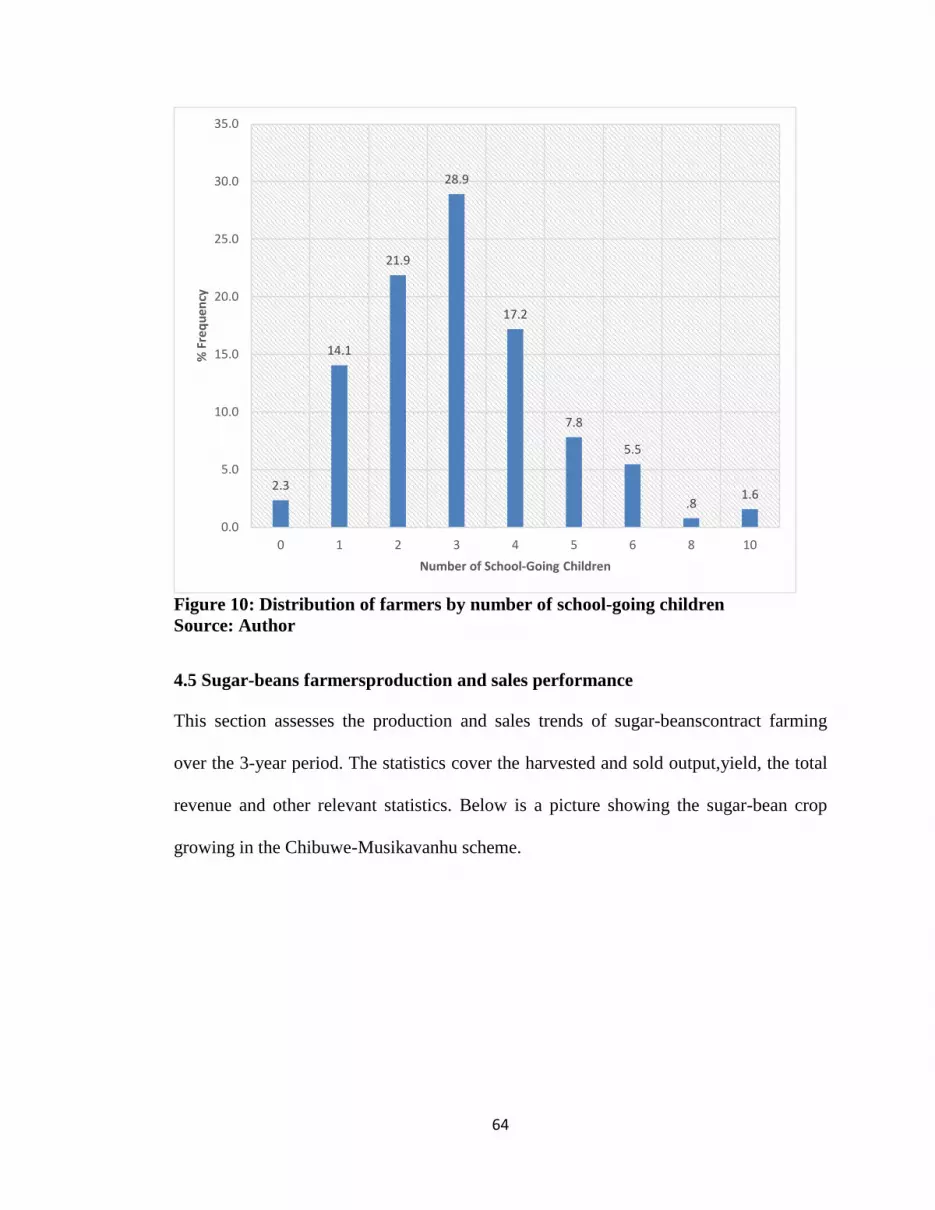
64
Figure 10: Distribution of farmers by number of school-going children
Source: Author
4.5 Sugar-beans farmersproduction and sales performance
This section assesses the production and sales trends of sugar-beanscontract farming
over the 3-year period. The statistics cover the harvested and sold output,yield, the total
revenue and other relevant statistics. Below is a picture showing the sugar-bean crop
growing in the Chibuwe-Musikavanhu scheme.
2.3
14.1
21.9
28.9
17.2
7.8
5.5
.81.6
0.0
5.0
10.0
15.0
20.0
25.0
30.0
35.0
0 1 2 3 4 5 6 8 10
% F
req
ue
ncy
Number of School-Going Children

65
Figure 11: Sugar-beans plot in Chibuwe-Musikavanhuunder flood irrigation
system
Source: Author
Sugar-beans harvested, sold and retained output in kilograms (kgs)
From the computed statistics, the total harvested output in tons (t) was significantly high
in 2012, being 111.50t, while in 2013 it was 98.45t, with 2014 recording a total of
97.90t. The output figures correspond with the contract farming funding activity of each
given year. In 2012 the total loaned amount to all contract farmers for sugar-beans was
US$241,222. For 2013 contractors injected a total of US$141,645 and US$86,213 for
2014 towards sugar-beans contract farming as shown in Figure 27 in section 4.12. The
high output in 2012 did not convert into a higher loan repayment but consequently
resultedin a default rate of 44% for all contract farmers. For the year 2013 the defaultrate
was 32% and 27% for 2014 (refer to Figure 27).
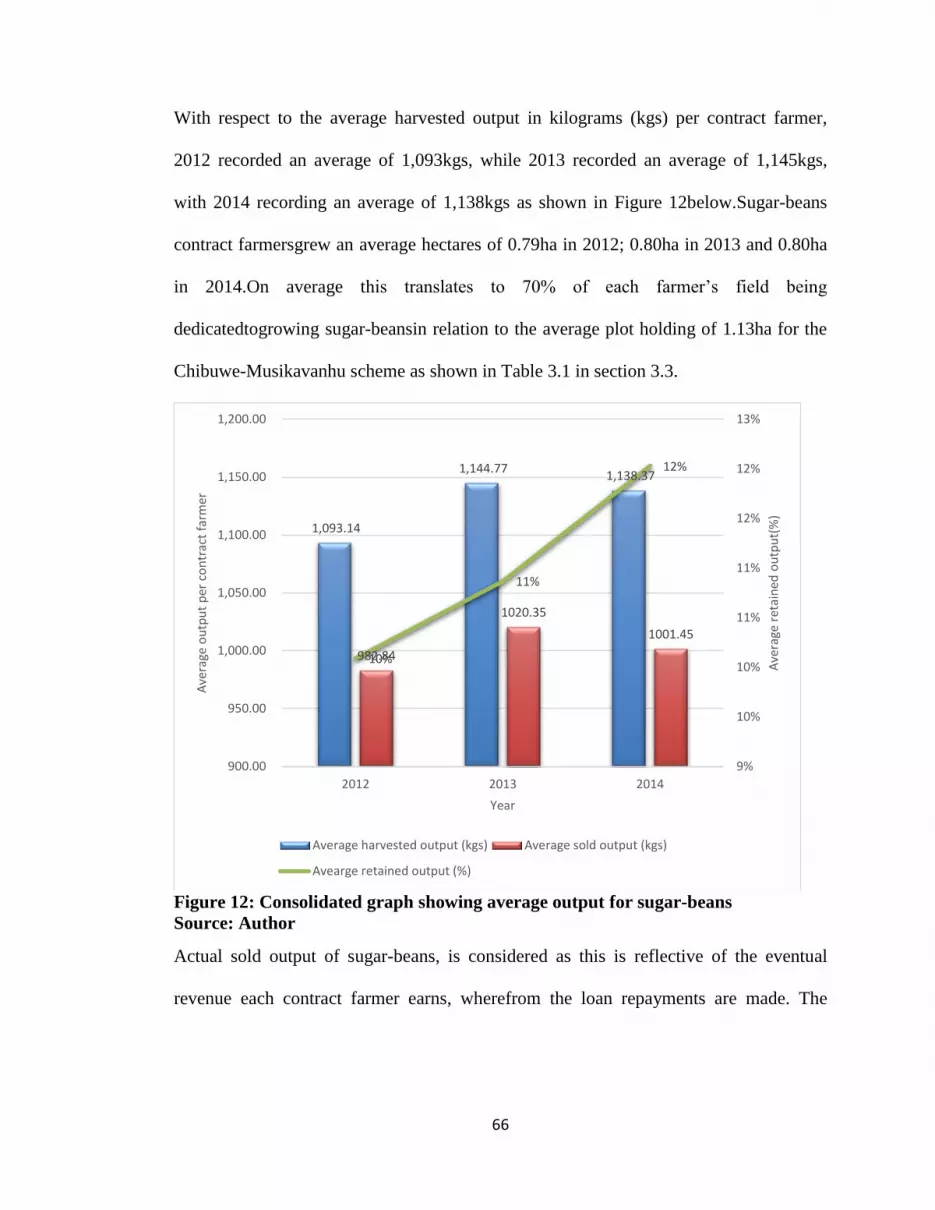
66
With respect to the average harvested output in kilograms (kgs) per contract farmer,
2012 recorded an average of 1,093kgs, while 2013 recorded an average of 1,145kgs,
with 2014 recording an average of 1,138kgs as shown in Figure 12below.Sugar-beans
contract farmersgrew an average hectares of 0.79ha in 2012; 0.80ha in 2013 and 0.80ha
in 2014.On average this translates to 70% of each farmer’s field being
dedicatedtogrowing sugar-beansin relation to the average plot holding of 1.13ha for the
Chibuwe-Musikavanhu scheme as shown in Table 3.1 in section 3.3.
Figure 12: Consolidated graph showing average output for sugar-beans
Source: Author
Actual sold output of sugar-beans, is considered as this is reflective of the eventual
revenue each contract farmer earns, wherefrom the loan repayments are made. The
1,093.14
1,144.77 1,138.37
982.84
1020.35
1001.45
10%
11%
12%
9%
10%
10%
11%
11%
12%
12%
13%
900.00
950.00
1,000.00
1,050.00
1,100.00
1,150.00
1,200.00
2012 2013 2014A
vera
ge r
etai
ned
ou
tpu
t(%
)
Ave
rage
ou
tpu
t p
er c
on
trac
t fa
rmer
Year
Average harvested output (kgs) Average sold output (kgs)
Avearge retained output (%)
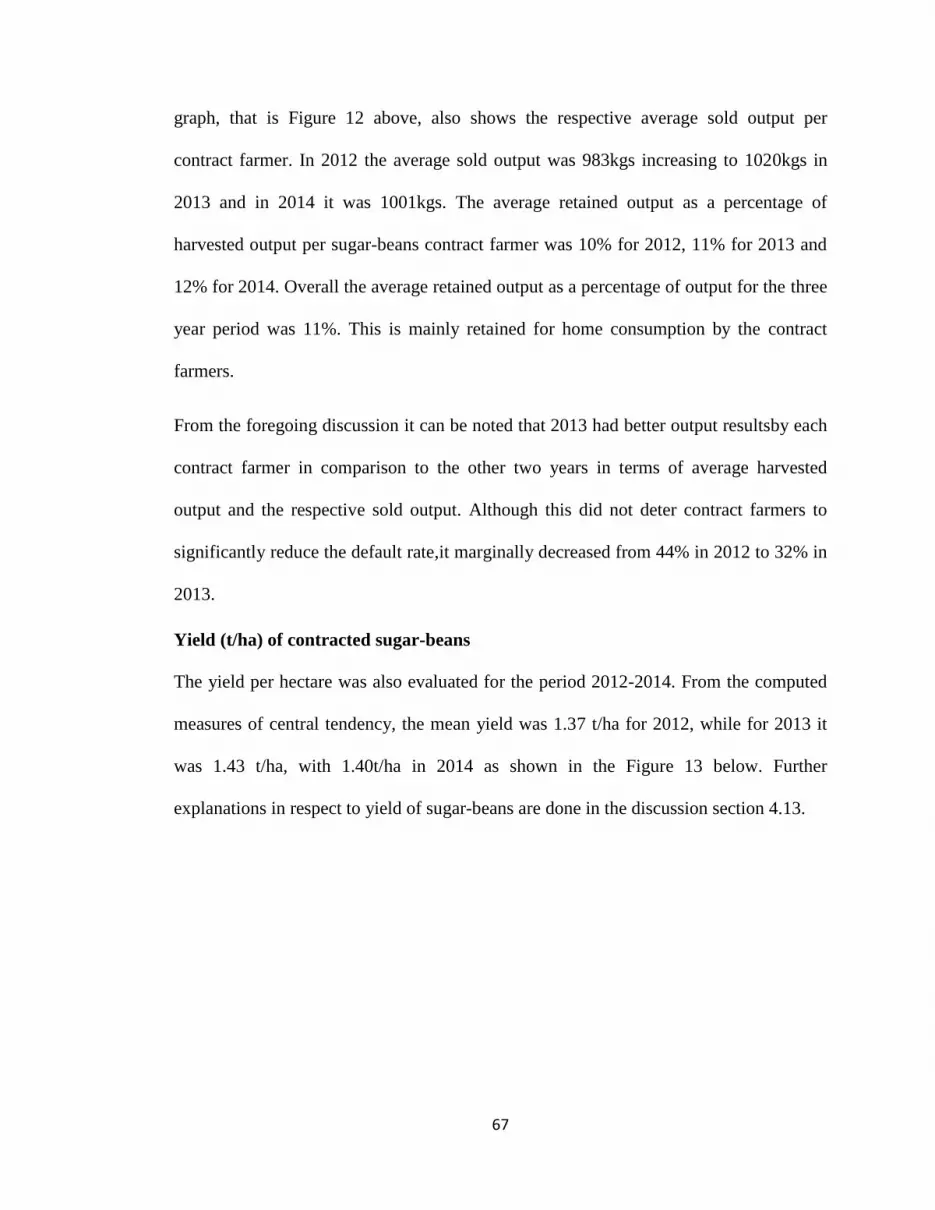
67
graph, that is Figure 12 above, also shows the respective average sold output per
contract farmer. In 2012 the average sold output was 983kgs increasing to 1020kgs in
2013 and in 2014 it was 1001kgs. The average retained output as a percentage of
harvested output per sugar-beans contract farmer was 10% for 2012, 11% for 2013 and
12% for 2014. Overall the average retained output as a percentage of output for the three
year period was 11%. This is mainly retained for home consumption by the contract
farmers.
From the foregoing discussion it can be noted that 2013 had better output resultsby each
contract farmer in comparison to the other two years in terms of average harvested
output and the respective sold output. Although this did not deter contract farmers to
significantly reduce the default rate,it marginally decreased from 44% in 2012 to 32% in
2013.
Yield (t/ha) of contracted sugar-beans
The yield per hectare was also evaluated for the period 2012-2014. From the computed
measures of central tendency, the mean yield was 1.37 t/ha for 2012, while for 2013 it
was 1.43 t/ha, with 1.40t/ha in 2014 as shown in the Figure 13 below. Further
explanations in respect to yield of sugar-beans are done in the discussion section 4.13.
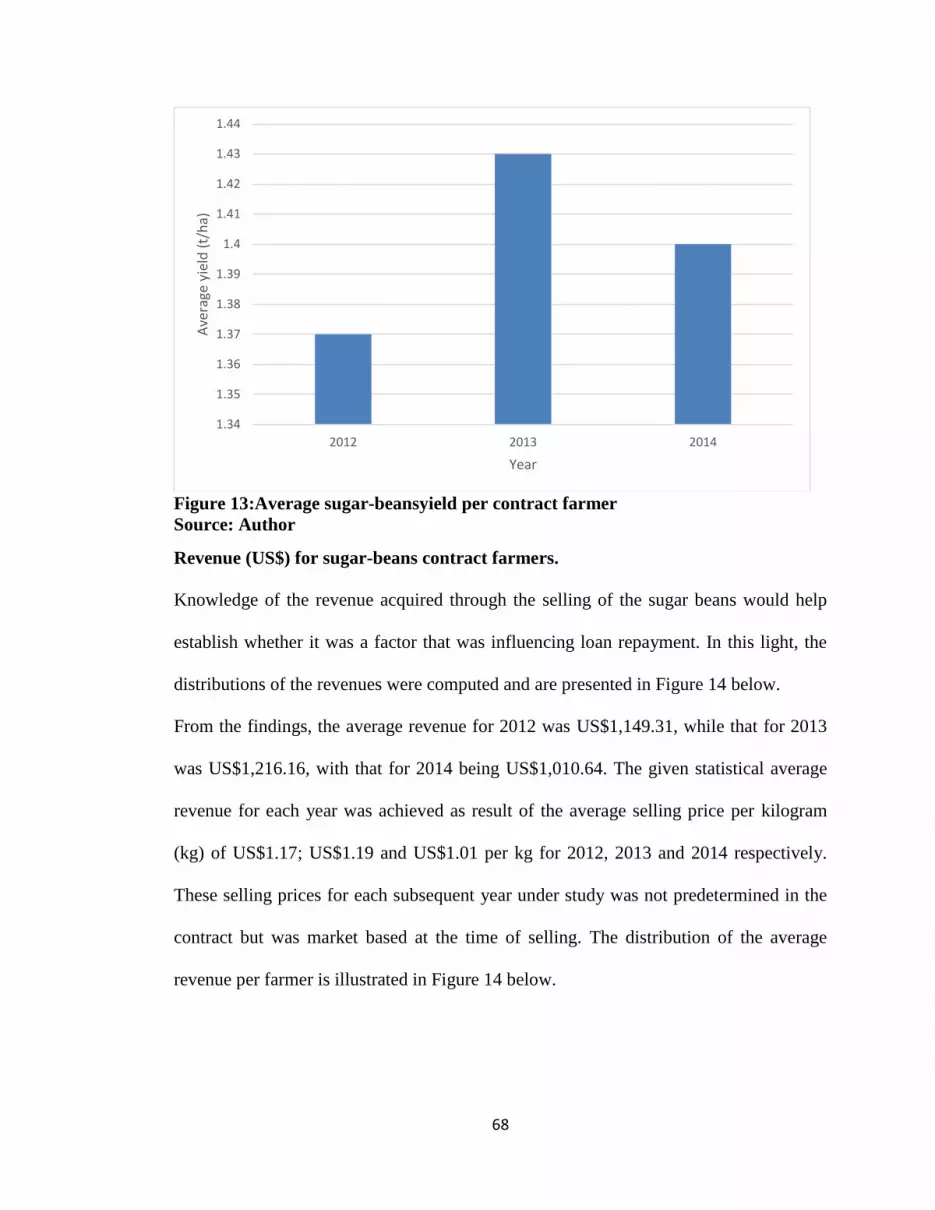
68
Figure 13:Average sugar-beansyield per contract farmer
Source: Author
Revenue (US$) for sugar-beans contract farmers.
Knowledge of the revenue acquired through the selling of the sugar beans would help
establish whether it was a factor that was influencing loan repayment. In this light, the
distributions of the revenues were computed and are presented in Figure 14 below.
From the findings, the average revenue for 2012 was US$1,149.31, while that for 2013
was US$1,216.16, with that for 2014 being US$1,010.64. The given statistical average
revenue for each year was achieved as result of the average selling price per kilogram
(kg) of US$1.17; US$1.19 and US$1.01 per kg for 2012, 2013 and 2014 respectively.
These selling prices for each subsequent year under study was not predetermined in the
contract but was market based at the time of selling. The distribution of the average
revenue per farmer is illustrated in Figure 14 below.
1.34
1.35
1.36
1.37
1.38
1.39
1.4
1.41
1.42
1.43
1.44
2012 2013 2014
Ave
rage
yie
ld (
t/h
a)
Year

69
Figure 14: Average sugar-beansrevenue (US$) per contract farmer
Source: Author
From the Figure 14 above, 2014 recorded a slight decline in the average revenue, from
2013 and 2012 due to a decrease in the selling price by 15% from US$1.19/kg in 2013 to
US$1.01/kg in 2014.
4.6 Banana farmers production and sales performance
The banana contract, though it has not experienced defaults, the variables for production
and sales are also considered as they were collected from the survey. The average
hectarage which banana farmers practice their contract farming is 0.22ha per farmer with
the maximum pegged plot being 0.25ha for Mutema Irrigation Schemes. For
Musikavanhu-Chibuwe Irrigation Schemes the banana plots are pegged at 0.20ha which
is the minimum pegged hectarage under banana contract for the two schemes.
1,149.31 1,216.16
1,010.64
-
200.00
400.00
600.00
800.00
1,000.00
1,200.00
1,400.00
2 0 1 2 2 0 1 3 2 0 1 4
Ave
rage
re
ven
ue
(U
S$)
Year

70
The average banana sales in kilograms for 2013 was 10,300kgs the figure dropped to
8,608kgsin 2014 as shown in Figure 15 below. The drop in output sales in 2014 of
16%was due to water pumping challenges experienced by some of the banana farmers in
Chibuwe-Musikavanhu Irrigation Scheme. The problem has since been rectified as of
November 2014.This information was given through an unstructured interview withone
of the employees of the banana contractor and verified by an Agritex Officer.
Figure 15: Average banana sales (kgs) per contract farmer
Source: Author
The average yield as shown in Figure 16 below for 2013 was 45.18 tons per hectare
(t/ha) this was the first round of harvest for the banana contract which commenced in
2011. Whilst for 2014 the average yield stood at 38.25t/ha a 15.34% drop from 2013.
This banana average yield compares favorably to other regions’ levels such as Guangxi
Province in China which has average yields of between 18 to 20 t/ha which is only about
a third of the optimum potential in other tropical regions (Hongweiet al2004). Farmers
7,500.00
8,000.00
8,500.00
9,000.00
9,500.00
10,000.00
10,500.00
2013 2014
Ave
rage
sal
es
in k
ilogr
ams
Year

71
in Honde Valley in the Manicaland Province of Zimbabwe is another area known for
growing bananas by smallholder farmerswhere theaverage yield is 40tons/ha (USAID
and Fintrac 2014). This yield rate is similar to thatbeing achieved in the Mutema and
Chibuwe-Musikavanhu Irrigation Schemes as shown in Figure 16 below.
The banana production in the two schemes is being irrigated under two different
irrigation systems. In Mutema the contract farmers use the micro jet irrigation system as
shown in Figure 18 below and had a higher banana yield than bananas grown under the
flood irrigation system in Chibuwe-Musikavanhu Schemes as reported in a 2014
Evaluation Report by Fintrac Zimbabwe. This study also confirmed the same results as
Mutema Irrigation Scheme’s average yield for 2013 and 2014 was 47.40t/ha. This is
higher by a 22.6% margin, during the same period, inwhichChibuwe-Musikavanhu had
an overall average yield of 36.70t/ha for the two years.
Figure 16: Average banana yield (t/ha) achieved by contract farmer
Source: Author
34.00
36.00
38.00
40.00
42.00
44.00
46.00
Ave
rage
yie
ld (
t/h
a)
Year
2013 2014
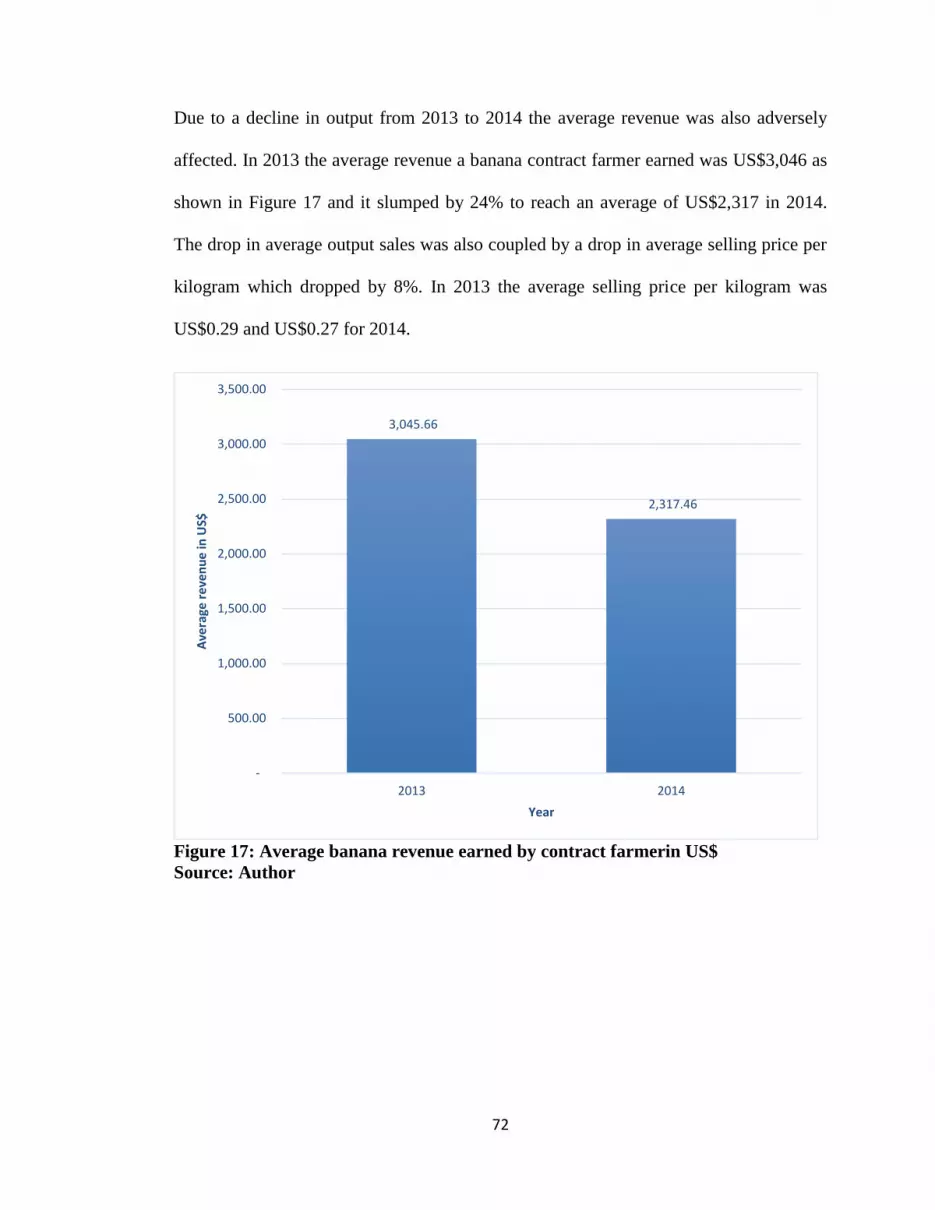
72
Due to a decline in output from 2013 to 2014 the average revenue was also adversely
affected. In 2013 the average revenue a banana contract farmer earned was US$3,046 as
shown in Figure 17 and it slumped by 24% to reach an average of US$2,317 in 2014.
The drop in average output sales was also coupled by a drop in average selling price per
kilogram which dropped by 8%. In 2013 the average selling price per kilogram was
US$0.29 and US$0.27 for 2014.
Figure 17: Average banana revenue earned by contract farmerin US$
Source: Author
3,045.66
2,317.46
-
500.00
1,000.00
1,500.00
2,000.00
2,500.00
3,000.00
3,500.00
2013 2014
Ave
rage
re
ven
ue
in U
S$
Year
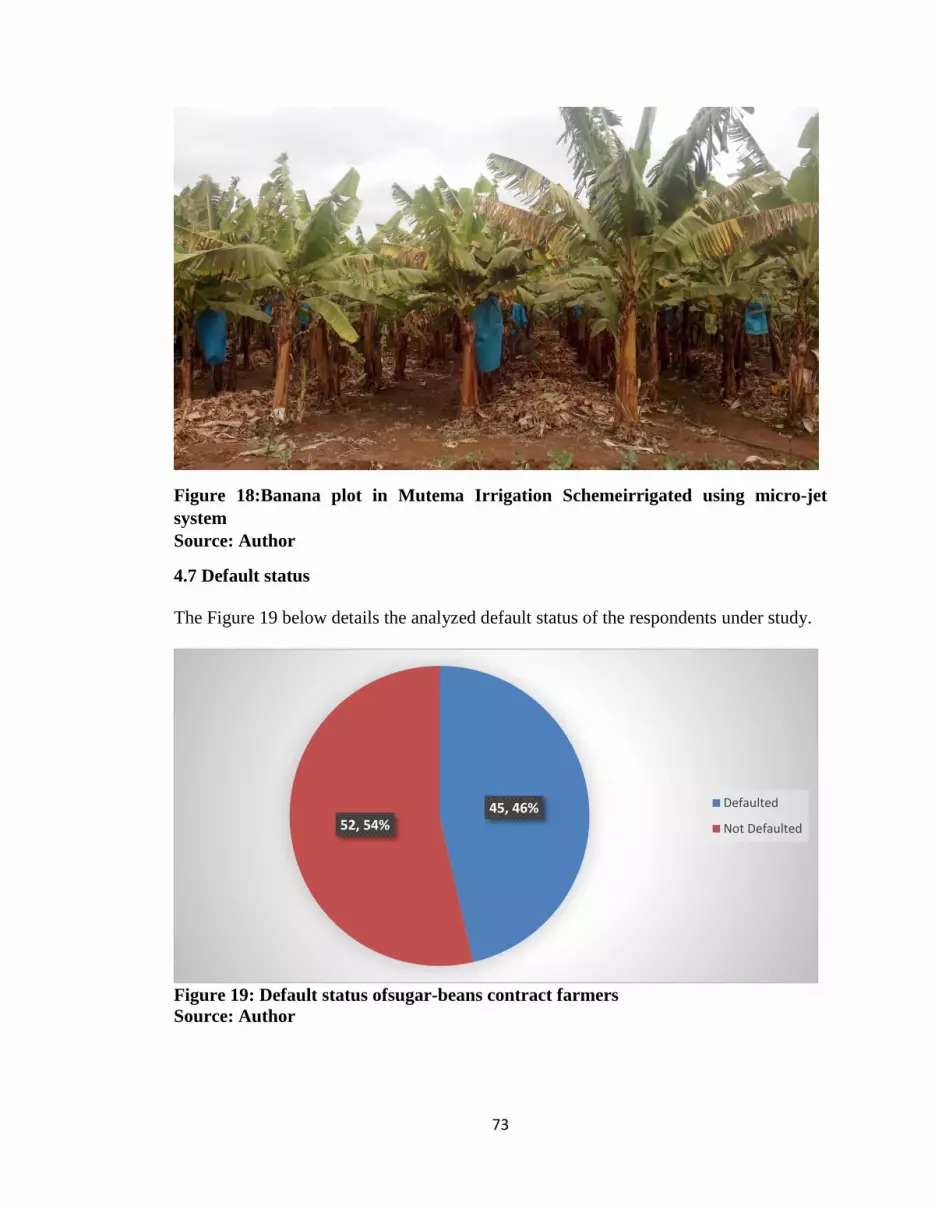
73
Figure 18:Banana plot in Mutema Irrigation Schemeirrigated using micro-jet
system
Source: Author
4.7 Default status
The Figure 19 below details the analyzed default status of the respondents under study.
Figure 19: Default status ofsugar-beans contract farmers
Source: Author
45, 46%52, 54%
Defaulted
Not Defaulted

74
From the above figure, 46% of the respondents had defaulted, while 54% had not
defaulted at all. These figures mainly relate to sugar-beans contract farmers. The sugar-
beans farmers comprised 102 of the 134 contract farmers who were interviewed for the
study. Of these 28 males were non-defaulters making up 54% of non-defaulters and 30
sugar-beans contract farmers defaulted. 46% of females did not default which convertsto
24 sugar-beans farmers whilst 15 female farmers defaulted for the three year period.
For the banana contract there was no default from 2012 to 2014.This means all the
variables under consideration have no significant influence on loan repayment for the32
contract farmers who wereconsidered for the study growing bananas.
4.8 Farming characteristics
Having shed light on both the principal factors that directly influenced the default status,
it was also imperative that other predictor variables be taken into consideration. In the
context of this study, these included, source of labor, the number of trainings attended,
and the number of Agritexofficer’svisits per week. The appropriate statistical analyses
were done, and the results are presented below.
Source of labor for all contract farmers
From the findings, the major source of labor was cited to being the family for both
crops, and this was mentioned in 71% of the cases. On the other hand, 16% of the
respondents outsourced their labor, through hiring. However, 13% of the respondents
both availed themselves of familial support and hired as shown in the Figure 20 below.

75
Figure 20: Source of labor for all contract farmers
Source: Author
This means that the large household size,as discussed in section 4.4and with reference to
Figure 8, of over 7 members is helping farmers with the provision of labor hence cutting
down their labor costs. The fact that 97.7% of the contract farmers have either 1 or 10
ten childrenstill going to school as shown in Figure 10 means that only a small part of
the children’s time is spent doing farming activities. This is when they are not at school
or on holiday. This could be the reason why some of the farmers 13 % of them in Figure
20, hire some help to fill the gap left by their children when they go to school and are
unavailable at the farm.
Number of trainings attended by contract farmer
The respondents were also asked to indicate the number of trainings that they had
previously attended for five courses selected from a list of courses which were offered
71%
16%
13%
Family
Hired
Both
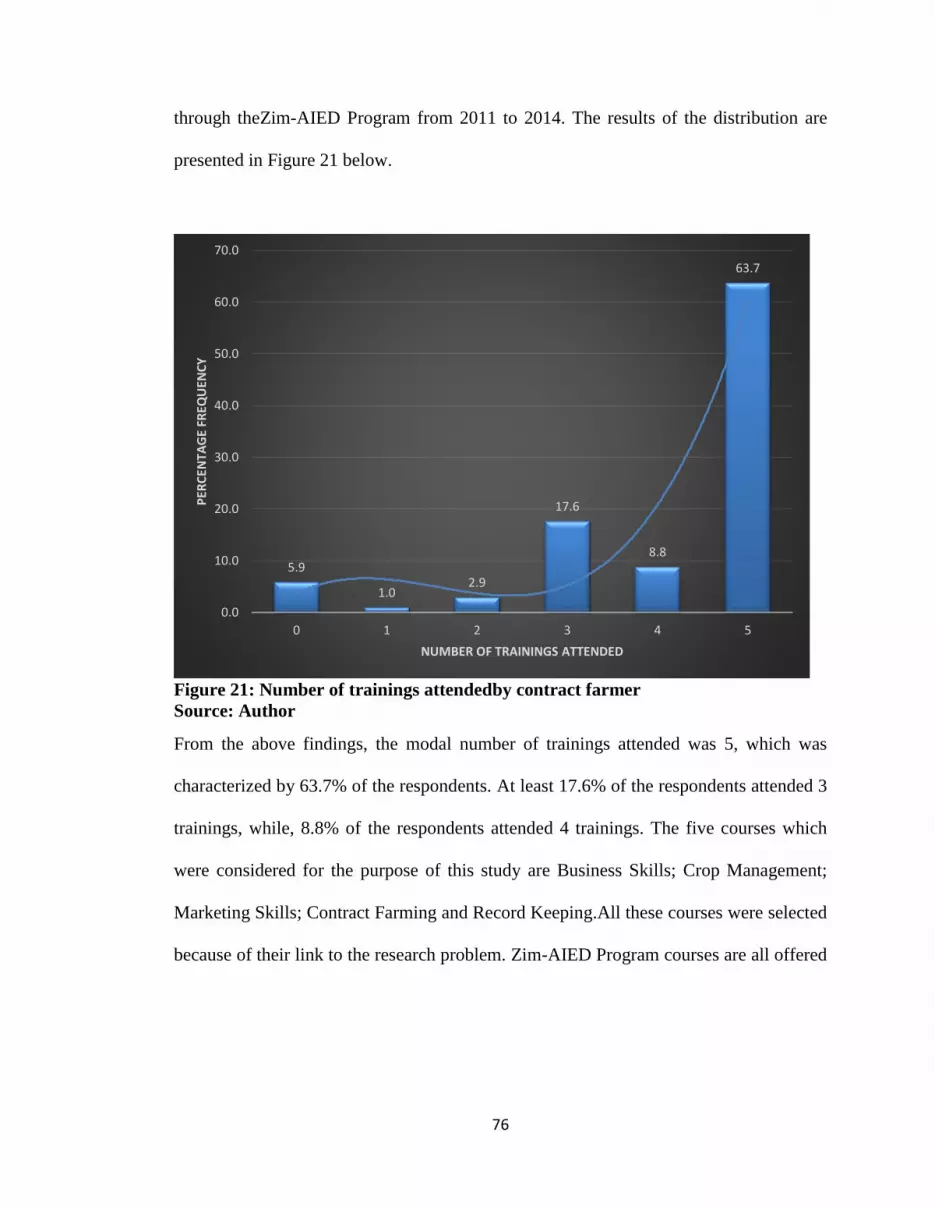
76
through theZim-AIED Program from 2011 to 2014. The results of the distribution are
presented in Figure 21 below.
Figure 21: Number of trainings attendedby contract farmer
Source: Author
From the above findings, the modal number of trainings attended was 5, which was
characterized by 63.7% of the respondents. At least 17.6% of the respondents attended 3
trainings, while, 8.8% of the respondents attended 4 trainings. The five courses which
were considered for the purpose of this study are Business Skills; Crop Management;
Marketing Skills; Contract Farming and Record Keeping.All these courses were selected
because of their link to the research problem. Zim-AIED Program courses are all offered
5.9
1.02.9
17.6
8.8
63.7
0.0
10.0
20.0
30.0
40.0
50.0
60.0
70.0
0 1 2 3 4 5
PER
CEN
TAG
E FR
EQU
ENC
Y
NUMBER OF TRAININGS ATTENDED

77
for free and thus the high frequency of farmers who attended more than 4 trainings at
72.5%.
In essence the attending of trainings led to better loan repayment performance especially
by older farmers. This was validated in t-test Group statistics shown in Table 4.7 where
the average age of respondents who never defaulted was 56 years. On the contrary, in
the same Table 4.7 shows that the average age of defaulterswas found to be 48 years age
and are part of the 27.5% who probably attended less than 4 trainings.
Number of AgritexOfficer’s visit per week
The other factor to be explored was the number of Agritex officer’s visits per week. The
results from the analysis are presented in Figure 22 below.
Figure 22: Number of AgritexOfficer’svisits/week
Source: Author
39.6
17.7
33.3
8.3
1.0
0.0
5.0
10.0
15.0
20.0
25.0
30.0
35.0
40.0
45.0
1 2 3 4 5
Pe
rce
nta
ge F
req
ue
ncy
Number of Agritex officer's visits per week

78
The greatest frequency of visits per week was noted to be 1, accounted of by 39.6% of
the respondents, followed by 33.3% who mentioned 3 visits per week by the Agritex
Officer. The third dominant were two visits per week, mentioned by 17.7% of the
respondents. The average number of Agritex visits per week was 2. The study failed to
establish if there was a set benchmark from Ministry of Agriculture, Mechanization and
Irrigation Development of the number of visits per week that an Agriculture Extension
Officer (Agritex) is supposed to monitor each farmer’s field performance.
4.9Factors influencing loan repayment for sugar-beans contract
Having explored all facets of contract farming, from the inputs to the outputs, it was the
main purpose of this study to help identify the principal factors that lead farmers to
successfully repay their loans or otherwise, to default repayment under contract farming.
To achieve this end, the variables were classified into two main variables:
1. The Independent Variables: All other Variables
2. The Dependent Variable: Loan Default Status
As a primary exploratory assessment, the method used to ascertain the significant factor
variables, the One-way ANOVA (Analysis of Variance) analysis was considered to
assess the relationship between these factors with default status. The procedure was run
with the following hypotheses:
Test: One-Way ANOVA Analysis
Hypothesis: H0: Default status is independent of the demographic factors
H1: Default status is dependent of the demographic factors
Significance Level: 95% (2-tailed); 85 degrees of freedom

79
Rejection Criteria: Reject H0if 𝑝 ≤ 0.05; Accept H0 if 𝑝 > 0.05
The analysis was dual pronged, that is the evaluation of demographic/background data
as the predictor variables, and also the evaluation of the farming characteristics as the
predictor variables. The results of the computation above are presented in the Table 4.3
below.
Table 4.3: ANOVA Analysis – Eight independent variables
Independent Variables Sum of
Squares df
Mean
Square F
Sig.
𝑝 ≤ 0.05
Gender
Between Groups 0.02 1 0.02 0.08 0.78ns
Within Groups 24.62 95 0.26
Total 24.64 96
Marital status
Between Groups 0.56 1 0.56 1.61 0.21ns
Within Groups 32.99 95 0.35
Total 33.55 96
Age
Between Groups 1352.48 1 1352.48 9.44 0.003**
Within Groups 13616.64 95 143.33
Total 14969.11 96
Household size
Between Groups 59.60 1 59.60 7.38 0.01**
Within Groups 767.12 95 8.08
Total 826.72 96
Number of school-going
children
Between Groups 0.74 1 0.74 0.38 0.54ns
Within Groups 173.22 89 1.95
Total 173.96 90
Source of labor
Between Groups 0.27 1 0.27 0.55 0.46ns
Within Groups 47.23 95 0.50
Total 47.51 96
Number of trainings
attended
Between Groups 13.63 1 13.63 9.93 0.002**
Within Groups 130.43 95 1.37
Total 144.06 96
Number of Agritex
Officer’svisits per week
Between Groups 2.87 1 2.87 2.31 0.13ns
Within Groups 117.87 95 1.24
Total 120.74 96
All asterisk** show the significant values at less than or equal to 5% level and ns is
for non-significant values
Source: Author

80
From the results above, three primary factors were identified from eight independent
variables as being the significant determinants of the default status, and these were: age,
household sizeand number of trainings attendedas their p-values where less than 5%.
This only relates to demographic and farming characteristics that influence loan
repayment for sugar-beans farmers from 2012 to 2014. These primary factors are further
explored using the decision tree analysis.
Age as a factor influencing loan repayment
To further explore age as an influencing variable, decision tree analysis was considered
the confirmatory method of analysis. To achieve this end, with the categorical nature of
the predictor variable, the CHAID tree growing method was used. The results from the
analysis are presented in Figure 23 below.
Figure 23: Decision Tree Analysis – age and default status
Source: Author

81
From the analysis above, it was established that age is indeed a determinant of the
default status of the respondents with Node 0 showing the category of defaulted and
never defaulted farmers and the total number of analysis is 97 sugar-beans contract
farmers. This is further broken down to form two distinct nodes that is Node 1 showing
how 38 farmers aged less than 48 years performed in loan repayment and Node 2
analyzing 59 farmers aged over 48 years at an adjusted p value which is equal to 0.001.
To this effect, the normative cut-off point would be 48 years. In other words, there was a
greater probability that beneficiaries less than 48 years of age would default than those
above 48 years. From the analysis, 71.1% of the respondents below 48 years defaulted,
while 69.5% of those above 48 years never defaulted.
The relative accuracy of the above model is validated in the Table 4.4 below.
Table 4.4: Classification Accuracy (Risk Estimate) – Age and Default Status
Risk
Estimate Std. Error
0.299 0.05
Growing Method: CHAID
Dependent Variable: Default Status
A risk estimate of 0.299 is a marginal risk, which validates the model accuracy.
Household size as a Factor influencing loan repayment for sugar-beans
Again, household size was noted to be a factor that influenced the default status of the
respondents. To further explore this factor, decision tree analysis was again availed, with
the CHAID algorithm as the tree growing method. The results from the analysis are
presented in Figure 24.

82
From the analysis, 56.7% of households with members of less than or equal to 8
members defaulted as denoted by Node 1 on Figure 24, whereas 76.7% of household
sizes greater than 8 members had never defaulted; only 23.3% had defaulted. This means
that the higher the household size with more than 8 members the higher the probability
that the farmer will repay their loan holding other things constant. This result also
implies that farmers with a high household size rely on their family members as a source
of labor for their farming activities. Thus source of labor is positively correlated to
household size in the context of undertaking farming activities. The respective risk
estimate for this model is presented in Table 4.5 below.
Table 4.5: Classification Accuracy (Risk Estimate) – household size
Estimate Std. Error
0.371 0.05
Growing Method: CHAID
Dependent Variable: Default Status
A risk estimate of 0.371 is again, a marginal risk, which validates the model accuracy.

83
Figure 24: Decision Tree Analysis – household size
Source: Author
Number of trainings attended by farmer as a factor influencing loan repayment
The third factor identified to be directly influencing the default status of the beneficiaries
of contract farming was noted to be the number of trainings attended by contract farmer.
To help clarify the relationship that exists, decision tree analysis was adopted, with the
CHAID as the tree-growing method. The results are presented in Figure 25 below.

84
Figure 25: Decision Tree Analysis – Number of trainings attended by contract
farmer
Source: Author
From the above analysis, 80% of the respondents who attended 3 trainings or less
defaulted, as compared to 65.3% of the respondents who attended more than 3 trainings,
and never defaulted. The decision tree analysis clearly indicates in Node 2 the number of
farmers who attended more than 3 trainings were 72 and out of these respondents 34.7%
defaulted. This was much higher than those who attended less or equal to 3 trainings
who were only 25. This shows that the farmers in the study area are interested in
acquiring knowledge that benefits them in their farming activities. This dispels the
conventional thinking that those who are old are resistant to acquiring new knowledge
as the study showsthat more than 80% of the farmers are 41 years and above in reference
to Figure 8 in section 4.4.
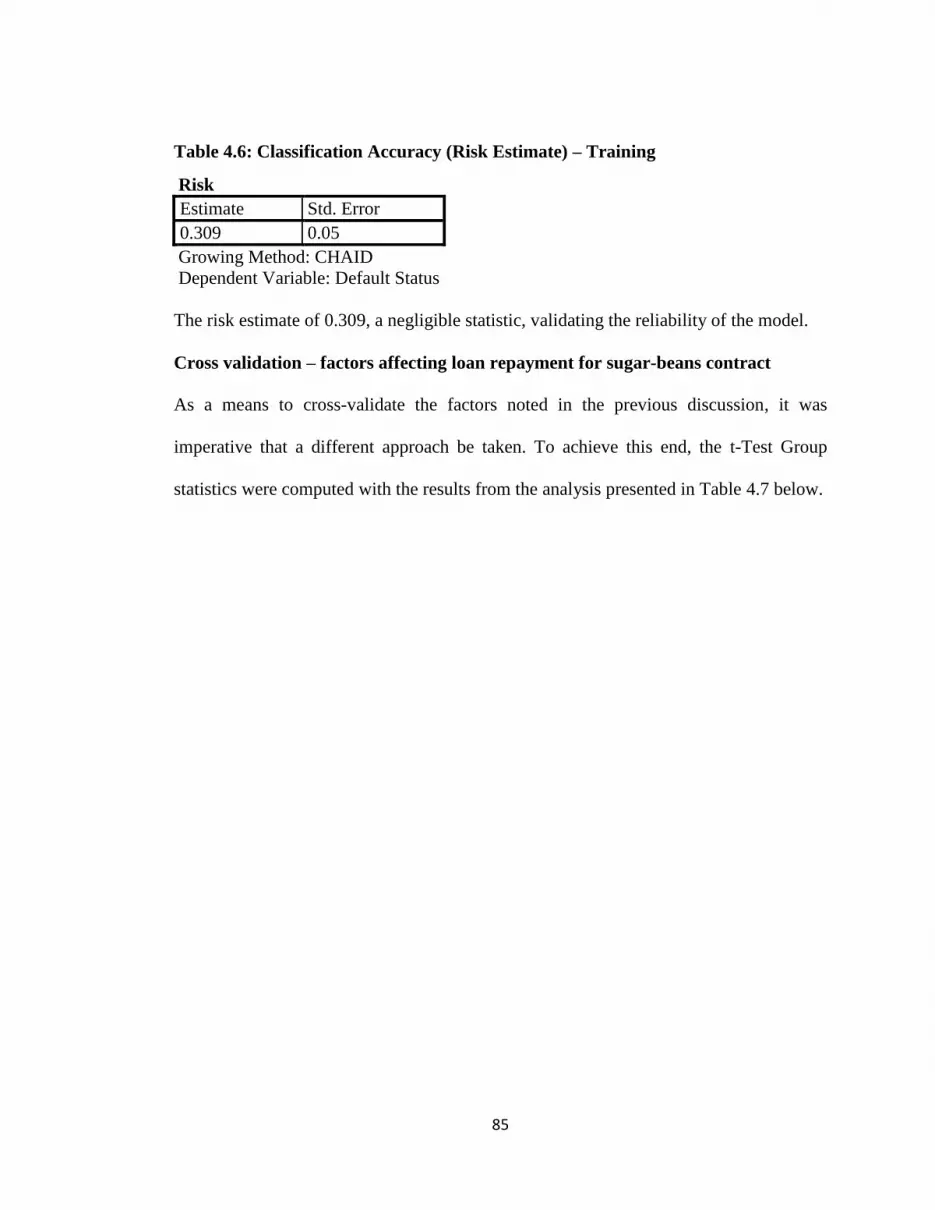
85
Table 4.6: Classification Accuracy (Risk Estimate) – Training
Risk
Estimate Std. Error
0.309 0.05
Growing Method: CHAID
Dependent Variable: Default Status
The risk estimate of 0.309, a negligible statistic, validating the reliability of the model.
Cross validation – factors affecting loan repayment for sugar-beans contract
As a means to cross-validate the factors noted in the previous discussion, it was
imperative that a different approach be taken. To achieve this end, the t-Test Group
statistics were computed with the results from the analysis presented in Table 4.7 below.

86
Table 4.7: t-Test Group Statistics for independent variables
Default Status N Mean
Std.
Deviation
Std. Error
Mean
Gender
Defaulted 45 1.36 0.53 0.08
Never
Defaulted 52 1.38 0.49 0.07
Marital status
Defaulted 45 2.16 0.64 0.10
Never
Defaulted 52 2.31 0.54 0.08
Age
Defaulted 45 48.38 12.20 1.82
Never
Defaulted 52 55.87 11.77 1.63
Household size
Defaulted 45 6.47 2.61 0.39
Never
Defaulted 52 8.04 3.03 0.42
Number of school-going
children
Defaulted 42 2.88 1.19 0.18
Never
Defaulted 49 3.06 1.55 0.22
Source of labor
Defaulted 45 1.36 0.71 0.11
Never
Defaulted 52 1.46 0.70 0.10
Never
Defaulted 52 1.92 0.27 0.04
Number of trainings
attended
Defaulted 45 3.84 1.28 0.19
Never
Defaulted 52 4.60 1.07 0.15
Number of Agritexvisits
per week
Defaulted 45 1.87 1.14 0.17
Never
Defaulted 52 2.21 1.09 0.15
From the above analysis, the three factors, that is, age, household size and number of
trainings attended were cross-validated as the determinant factors. However, with
respect to age, the average age of those who did not default was 56 years, while the
average age of those who defaulted was 48 years. On the other hand, the average
household size of those who did not default was 8, as compared to the average
household size of 6 for those who defaulted. With regards to the number of trainings, the

87
average was 5 for those who did not default whereas those who defaulted had an average
of 4 trainings.
4.10 Determinants of loan default – Output
Having reviewed the demographic determinants of loan defaults, it was imperative that
the farming factors, such as yield, outputand revenue be tested for their influence on
loan repayment. To this effect One-way ANOVA Analysis was used with the following
hypothesis:
Test: One-Way ANOVA Analysis
Hypothesis: H0: Default status is independent of farming factors
H1: Default status is dependent of farming factors
Significance Level: 95% (2-tailed); 85 degrees of freedom
Rejection Criteria: Reject H0 if 𝑝 ≤ 0.05; Accept H0 if 𝑝 > 0.05
The results from the analysis are presented in the Table 4.8. From the analysis, it can be
seen that there were three primary factors that were significant and these include:
Output (2012-2014)
Quantity Sold (2012-2013)
Revenue (2012-2013)
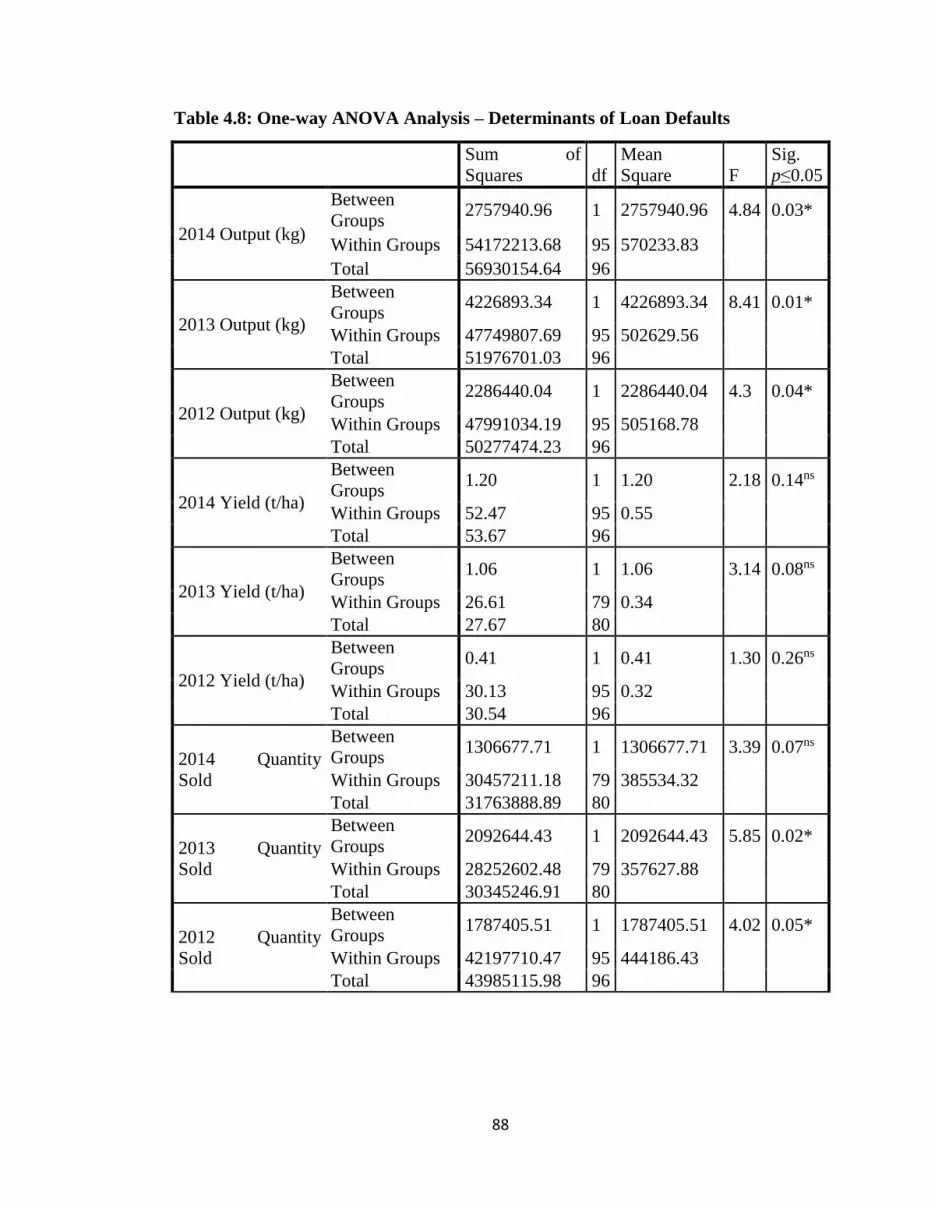
88
Table 4.8: One-way ANOVA Analysis – Determinants of Loan Defaults
Sum of
Squares df
Mean
Square F
Sig.
p≤0.05
2014 Output (kg)
Between
Groups 2757940.96 1 2757940.96 4.84 0.03*
Within Groups 54172213.68 95 570233.83
Total 56930154.64 96
2013 Output (kg)
Between
Groups 4226893.34 1 4226893.34 8.41 0.01*
Within Groups 47749807.69 95 502629.56
Total 51976701.03 96
2012 Output (kg)
Between
Groups 2286440.04 1 2286440.04 4.3 0.04*
Within Groups 47991034.19 95 505168.78
Total 50277474.23 96
2014 Yield (t/ha)
Between
Groups 1.20 1 1.20 2.18 0.14ns
Within Groups 52.47 95 0.55
Total 53.67 96
2013 Yield (t/ha)
Between
Groups 1.06 1 1.06 3.14 0.08ns
Within Groups 26.61 79 0.34
Total 27.67 80
2012 Yield (t/ha)
Between
Groups 0.41 1 0.41 1.30 0.26ns
Within Groups 30.13 95 0.32
Total 30.54 96
2014 Quantity
Sold
Between
Groups 1306677.71 1 1306677.71 3.39 0.07ns
Within Groups 30457211.18 79 385534.32
Total 31763888.89 80
2013 Quantity
Sold
Between
Groups 2092644.43 1 2092644.43 5.85 0.02*
Within Groups 28252602.48 79 357627.88
Total 30345246.91 80
2012 Quantity
Sold
Between
Groups 1787405.51 1 1787405.51 4.02 0.05*
Within Groups 42197710.47 95 444186.43
Total 43985115.98 96
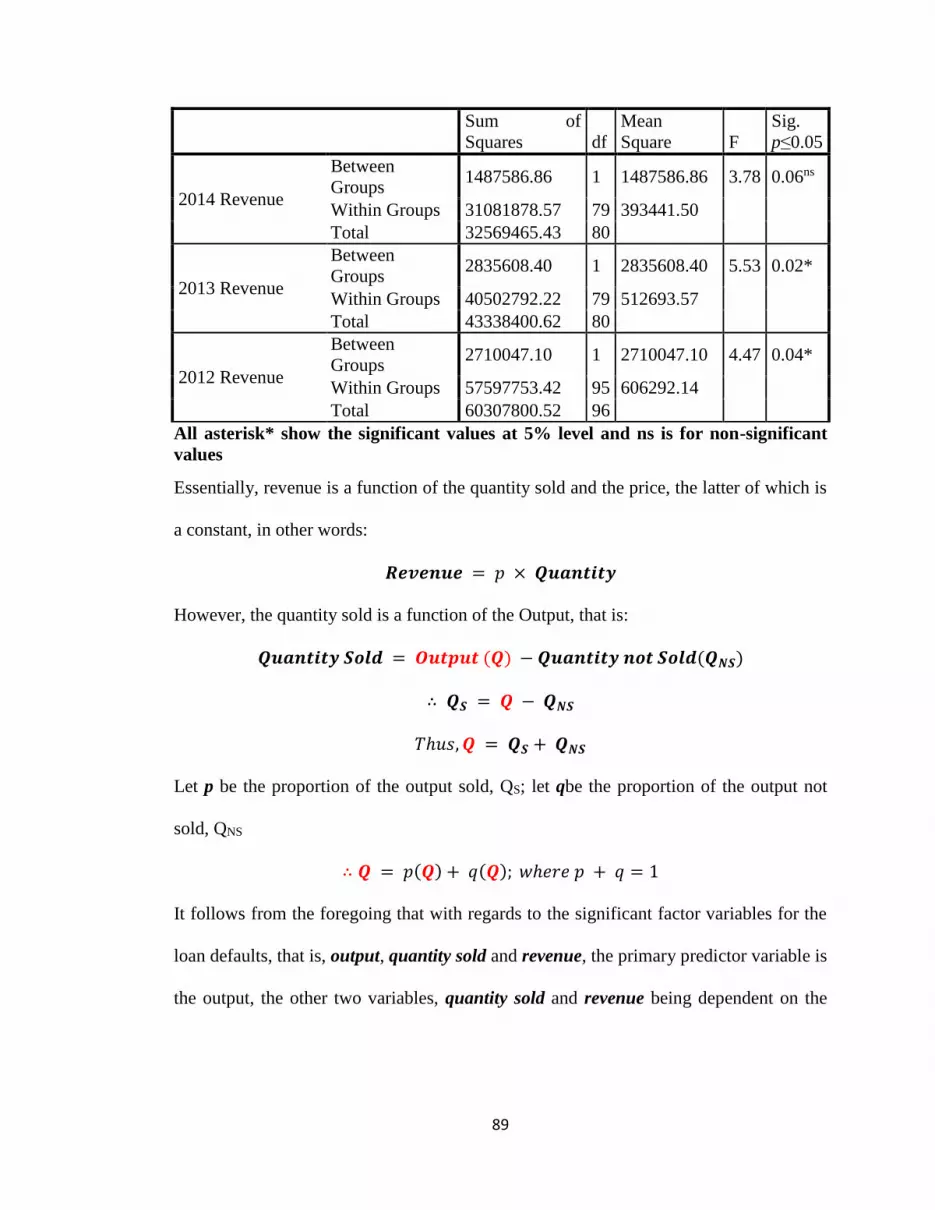
89
Sum of
Squares df
Mean
Square F
Sig.
p≤0.05
2014 Revenue
Between
Groups 1487586.86 1 1487586.86 3.78 0.06ns
Within Groups 31081878.57 79 393441.50
Total 32569465.43 80
2013 Revenue
Between
Groups 2835608.40 1 2835608.40 5.53 0.02*
Within Groups 40502792.22 79 512693.57
Total 43338400.62 80
2012 Revenue
Between
Groups 2710047.10 1 2710047.10 4.47 0.04*
Within Groups 57597753.42 95 606292.14
Total 60307800.52 96
All asterisk* show the significant values at 5% level and ns is for non-significant
values
Essentially, revenue is a function of the quantity sold and the price, the latter of which is
a constant, in other words:
𝑹𝒆𝒗𝒆𝒏𝒖𝒆 = 𝑝 × 𝑸𝒖𝒂𝒏𝒕𝒊𝒕𝒚
However, the quantity sold is a function of the Output, that is:
𝑸𝒖𝒂𝒏𝒕𝒊𝒕𝒚 𝑺𝒐𝒍𝒅 = 𝑶𝒖𝒕𝒑𝒖𝒕 (𝑸) − 𝑸𝒖𝒂𝒏𝒕𝒊𝒕𝒚 𝒏𝒐𝒕 𝑺𝒐𝒍𝒅(𝑸𝑵𝑺)
∴ 𝑸𝑺 = 𝑸 − 𝑸𝑵𝑺
𝑇ℎ𝑢𝑠, 𝑸 = 𝑸𝑺 + 𝑸𝑵𝑺
Let p be the proportion of the output sold, QS; let qbe the proportion of the output not
sold, QNS
∴ 𝑸 = 𝑝(𝑸) + 𝑞(𝑸); 𝑤ℎ𝑒𝑟𝑒 𝑝 + 𝑞 = 1
It follows from the foregoing that with regards to the significant factor variables for the
loan defaults, that is, output, quantity sold and revenue, the primary predictor variable is
the output, the other two variables, quantity sold and revenue being dependent on the

90
output. In summary, the only root determinant of loan default was found to be the output
for the three year period.
With respect to the 2012-2014 harvest periods, the output characteristics that
differentiated defaulters from non-defaulters could be determined following an
independent samples t-test analysis. The analysis was performed, and the results are
presented in Appendix 1(Group Statistics – Output Levels) in the Appendices section.
For the three year period harvested Output in kilograms consistently appeared as a factor
influencing loan repayment as indicated by the p-values which were all less than 5%.
Quantity Sold (Qs) for 2012 is one other variable that was equal to the p-value of 0.05.
These results are consistent with the ones established using ANOVA analysis in Table
4.8.The results are further broken down to show the sugar-beans output levels of
respondents who defaulted and never defaulted in Table 4.9.
Table 4.9: Group Statistics – Output levels of sugar-beans in kilograms
Default Status N
Mean
(kgs) Std. Deviation Std. Error Mean
2012 Output (kg) Defaulted 45 934.44 541.34 80.70
Never Defaulted 52 1242.31 829.56 115.04
2013 Output (kg) Defaulted 45 733.33 652.09 97.21
Never Defaulted 52 1151.92 754.59 104.64
2014 Output (kg) Defaulted 45 781.11 716.39 106.79
Never Defaulted 52 1119.23 787.04 109.14
Average Output Defaulted 45 816.30 526.57 78.50
Never Defaulted 52 1171.15 695.25 96.41
From Table 4.9 above it can be noted that defaulters in 2014 had an average output of
781kg of sugar-beans, whilst the average for 2013 was 733kg, with that for 2012 being
934kg. The average for the three-year period for sugar-beans contract farmers who
91
defaulted was 816kg. On the other hand, the average output by farmers who never
defaulted in2012was1242kg, while in 2013 it was 1152kg, and in 2014 being1119kg.
This translates to an average output of 1171kg for the three-year period.
In summary, any sugar beans farmer whose output averages 816kg, or less, most likely
defaulted. On the other hand, any farmer whose output averaged or was above 1171kg,
most likelyrepaid their loan.
4.11 Linear regression model for the study
After establishing that they are mainly four variables that have an impact on the default
status out of ten variables which were being considered, a multivariate approach was
considered to further analyze these predictor variables. To this effect, multivariate
regression analysis was done as part of the structural equation modelling in SPSS Amos
and the results are presented in Figure 26. The model comprises of 4 observed,
endogenous variables, that is, age, household size, 2014 yield (t/ha)(output)and training,
and one latent unobserved, exogenous variable, e, with the dependent variable being the
default status.
From Figure 26 below, the greatest correlations between the predictor variables was
noted to exist between age and household size with the highest covariance of 11.50,
followed by age and training, with a covariance of 3.55. In other words, the higher the
age, the higher the household size is expected. On the other hand, the higher the age, the
more likely that the farmer would have received more trainings. The co-variances are
summarized in the Table 4.10 below
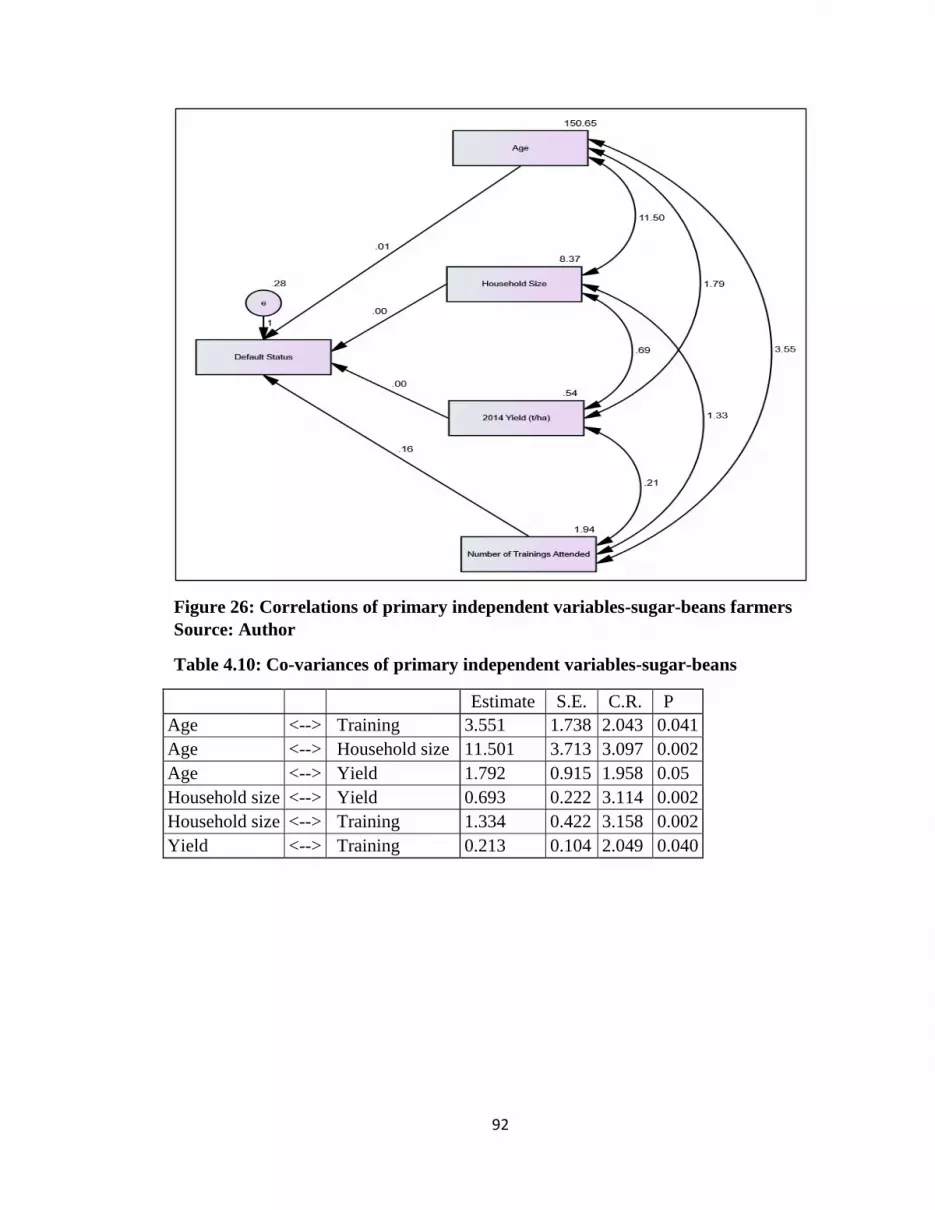
92
Figure 26: Correlations of primary independent variables-sugar-beans farmers
Source: Author
Table 4.10: Co-variances of primary independent variables-sugar-beans
Estimate S.E. C.R. P
Age <--> Training 3.551 1.738 2.043 0.041
Age <--> Household size 11.501 3.713 3.097 0.002
Age <--> Yield 1.792 0.915 1.958 0.05
Household size <--> Yield 0.693 0.222 3.114 0.002
Household size <--> Training 1.334 0.422 3.158 0.002
Yield <--> Training 0.213 0.104 2.049 0.040

93
Table 4.11 Regression model summary for sugar-beans contract farmers
Model Summary
Model R RSquare
Adjusted R
Square
Std. Error of the
Estimate
1 0.854a 0.729 0.736 0.425
Independent Predictors: (Constant), Number of Trainings, Age, Household Size,
Yield (t/ha)
From the model summary above, the multinomial correlation between the predictor
variables, that is, the number of trainings attended, age, householdsizeandyield, had very
high regression coefficient of 0.854 which shows a positive linear relationship to the
dependent variable. With respect to the R-square statistic, the computed value was
0.729. It follows, therefore, that the model can only account for72.9% of the variation in
the default status with respect to thenumber of trainings attended, age,
householdsizeandyield only. This finding also suggest that the regression model was
72.9% accurate in predicting the default likelihood. In other words, 27.1% of the
variation in the default status could not be explained by the above four predictor
variables, but other latent variables – which could best be addressed qualitatively, or
rather which further studies may seek to establish.
With regards to the regression model, the greatest regression coefficient was noted for
the number of trainings received, being 0.158, as shown in the Table 4.12. The second
highest regression coefficient was observed for the age variable, being 0.009.

94
Table 4.12: Regression weights for independent variables
Estimate S.E. C.R. p≤0.05
Default status <--- Age 0.009 0.005 2.032 0.042
Default status <--- Size -0.001 0.021 -0.066 0.948
Default status <--- Yield 0.003 0.076 0.040 0.968
Default status <--- Training 0.158 0.040 3.937 0.000
The highlight indicates variables with p-values of less than or equal to 0.05 level
The number of trainings variable had the highest standardized coefficient of 0.374, and
age being 0.192. However, other variables had standardized variables approximating
0.00 – Table 4.13.
Table 4.13: Regression coefficients of four primary independent variables
Model
Unstandardized
Coefficients
Standardiz
ed
Coefficient
s
t Sig. p≤0.05 B Std. Error Beta
(Constant) 0.330 0.262 1.261 0.210
Number of Trainings
Attended 0.158 0.041 0.374 3.859 0.000*
Age 0.009 0.005 0.192 1.991 0.049*
Household Size -0.001 0.021 -0.007 -0.064 0.949ns
2014 Yield (t/ha) 0.003 0.077 0.004 0.039 0.969ns
a. Dependent Variable: Default status
* indicate the significant values less than or equal to 5% level or less and ns is for
non-significant values
From the above analysis, it follows then that the most significant predictor variables for
the default status were number of trainings and age, having significant p-values of less
than 0.05. In other words, of the 4 primary predictor variables, only two were identified
from the multivariate regression analysis to be the only significant variables. Thus, the
eventual regression model becomes:
𝒀 = 0.330 + 0.009(𝑨𝒈𝒆) + 0.158(𝑵𝒖𝒎𝒃𝒆𝒓 𝒐𝒇 𝑻𝒓𝒂𝒊𝒏𝒊𝒏𝒈𝒔)
𝐑: 1 ≤ 𝐷 ≤ 2

95
In other words the solution set, to determine whichfarmer either receives or does not
receive a loan,from the regression model ranges between 1 and 2, with computed values
tending towards 1 representing rejectfarmer’s loan requirementwhile those that tend
towards 2 representing acceptloan application by contract farmer. The constant of 0.33
implies that, holding all independent variables constant, there is a 33% probability of
defaulting for every dollar loaned to a farmer. While a one year increase of farmer’s age
probably results with a reduction in loan repayment default by 0.9% for every dollar
loaned to the farmer, holding all variables constant. Assuming that all variables are held
constant, a farmer’s attendance to one training relating to farming practices will likely
reduce the farmer’s default rate by 15.2%.
4.12Types and conditions of loans issued under contract farming in study area
The researcher also assessed the types of loans that were disbursed to the respondents.
From the analysis, the respondents were graced with inputs for both banana and sugar-
beans contracts. For sugar-beans the inputs offered ranged from seeds only to seeds,
fertilizers and chemicals. Figure 27 below shows the loaned amount for each respective
year for the sugar-beans contract by five sponsors of contract farmers, although the
contract sponsors varied from two to three for each given year from 2012 to 2014.
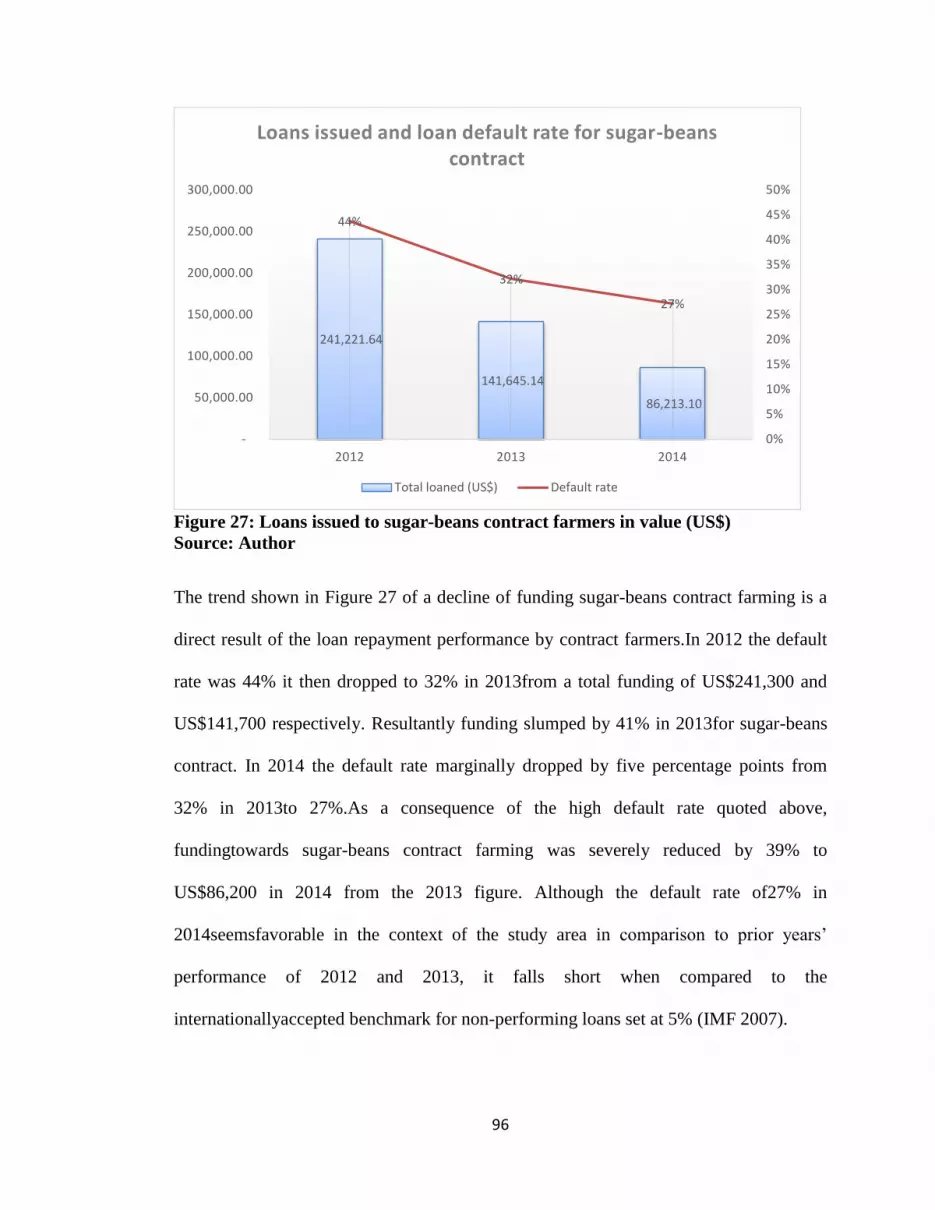
96
Figure 27: Loans issued to sugar-beans contract farmers in value (US$)
Source: Author
The trend shown in Figure 27 of a decline of funding sugar-beans contract farming is a
direct result of the loan repayment performance by contract farmers.In 2012 the default
rate was 44% it then dropped to 32% in 2013from a total funding of US$241,300 and
US$141,700 respectively. Resultantly funding slumped by 41% in 2013for sugar-beans
contract. In 2014 the default rate marginally dropped by five percentage points from
32% in 2013to 27%.As a consequence of the high default rate quoted above,
fundingtowards sugar-beans contract farming was severely reduced by 39% to
US$86,200 in 2014 from the 2013 figure. Although the default rate of27% in
2014seemsfavorable in the context of the study area in comparison to prior years’
performance of 2012 and 2013, it falls short when compared to the
internationallyaccepted benchmark for non-performing loans set at 5% (IMF 2007).
241,221.64
141,645.14
86,213.10
44%
32%
27%
0%
5%
10%
15%
20%
25%
30%
35%
40%
45%
50%
-
50,000.00
100,000.00
150,000.00
200,000.00
250,000.00
300,000.00
2012 2013 2014
Loans issued and loan default rate for sugar-beans contract
Total loaned (US$) Default rate

97
The average loan amount, in the form of inputs as previously noted, issued to sugar-
beans farmers for 2014 was US$250.14, while that for 2013 was US$130.47, with 2012
recording an average loan amount of US$365.86. The latter could be attributed to
several outliers, with the highest loan amount being US$1533. The loan size issued to
contract farmers was not standardized in terms of amount for 2012 but for the
subsequent years of 2013 and 2014 the inputs issued as loans were standardized. With
respect to the outstanding balances, the average loan balance for 2012 was US$211.03,
with that for 2013 being US$56.80, and the 2014 outstanding average balance being
US$50.51.Whilst the average capital loan issued in 2011 to each banana contract farmer
was US$2,079.26 andUS$970.73 was the average loan towards working capital
financing in between the year 2013 and 2014. The loan size was not considered as a
variable influencing loan repayment because many researchers (Duy 2013; Ahangaret al
2013;Kohansaland Mansoori 2008; Oni et al 2005) have done a great deal in
determining its effect on loan repayment.
The loan tenor has been consistently maintained at five months from April to August for
the sugar-beans contract. The principal loan amount and interest were issued as terminal
loans meaning sugar-beans farmers were expected to fully settle their dues after five
months.Interest charged to sugar-beans contract farmers ranged from 3% per month to
20% per month.These rates varied by contractor.
For the banana contract the loan tenor was 36 months at an interest rate of 11% per
annum for working capital and repaid in installments. The initial capital loans issued
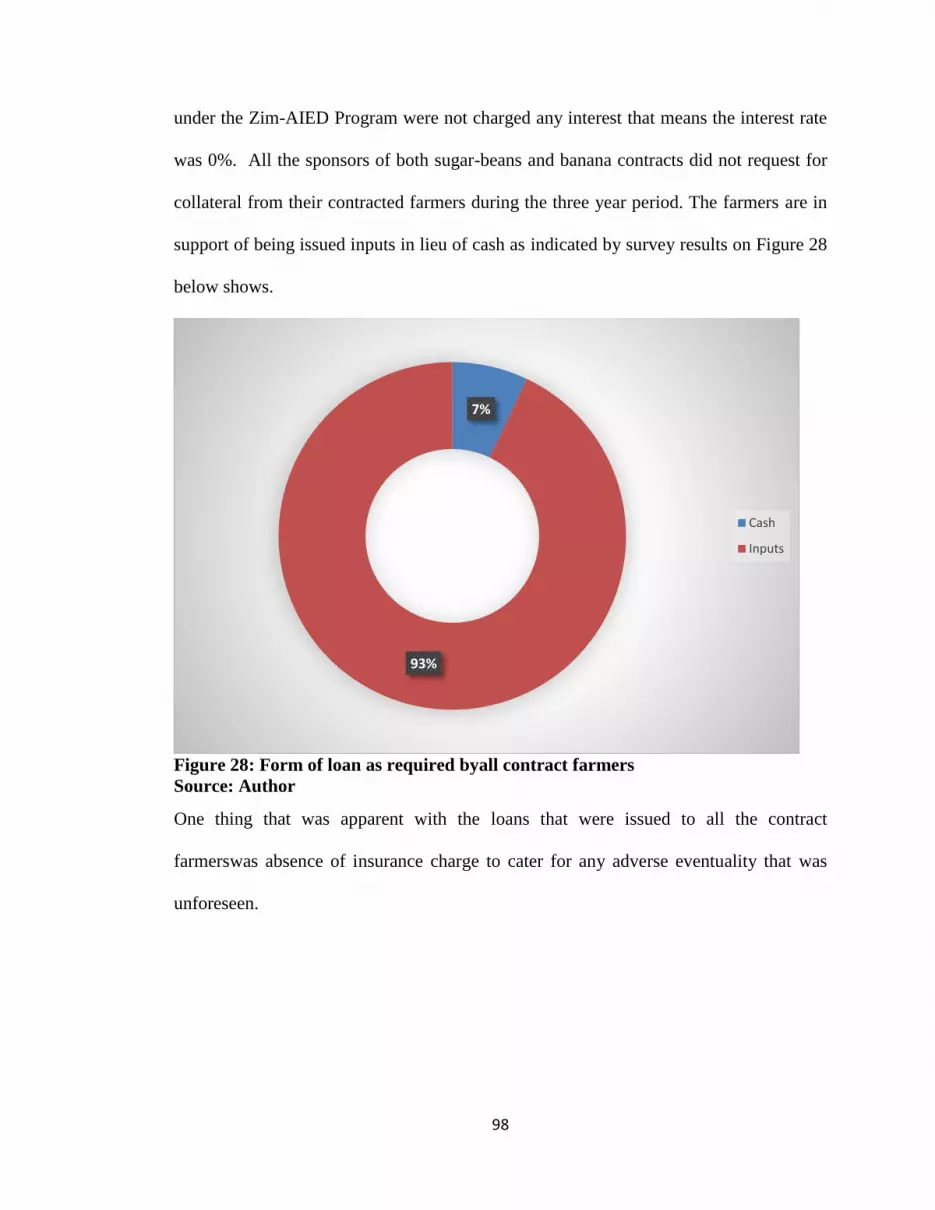
98
under the Zim-AIED Program were not charged any interest that means the interest rate
was 0%. All the sponsors of both sugar-beans and banana contracts did not request for
collateral from their contracted farmers during the three year period. The farmers are in
support of being issued inputs in lieu of cash as indicated by survey results on Figure 28
below shows.
Figure 28: Form of loan as required byall contract farmers
Source: Author
One thing that was apparent with the loans that were issued to all the contract
farmerswas absence of insurance charge to cater for any adverse eventuality that was
unforeseen.
7%
93%
Cash
Inputs

99
4.13 Mitigation measures to reduce default risk by farmers
Through discussions with Agritex Officers and Zim-AIED officials one way that came
out of the discussions to mitigate loan default was to implement a two tier vetting system
of farmers prior to approval by loan providers or contract sponsors. The two tier vetting
approach is when all farmers in need of loans are first screened by their respective block
Irrigation Management Committees (IMCs). This process is then followed by
Agritexofficers vetting the farmers who qualified on the first stage and those who
qualify at this second stage will finally be send to be approved by the financier. These
two key local strata have thorough knowledge of farmers in terms of loan performance
history and farm productivity that is essential for sponsors tomake an informed decision
prior to issuing loan to a farmer. Figure 29 below shows farmers receiving their inputs
after having been screened by their IMC and Agritexofficers for loans issued by a
microfinance house.
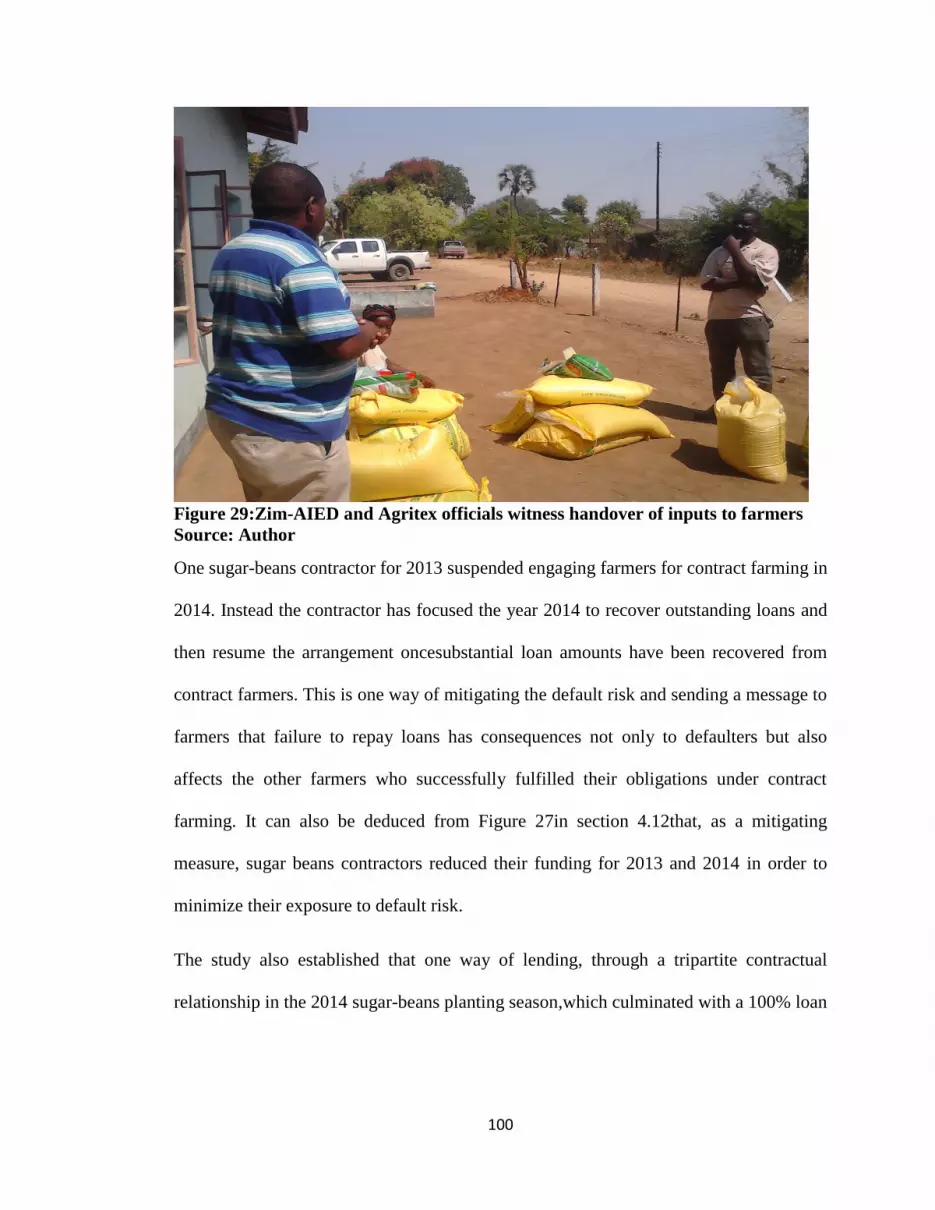
100
Figure 29:Zim-AIED and Agritex officials witness handover of inputs to farmers
Source: Author
One sugar-beans contractor for 2013 suspended engaging farmers for contract farming in
2014. Instead the contractor has focused the year 2014 to recover outstanding loans and
then resume the arrangement oncesubstantial loan amounts have been recovered from
contract farmers. This is one way of mitigating the default risk and sending a message to
farmers that failure to repay loans has consequences not only to defaulters but also
affects the other farmers who successfully fulfilled their obligations under contract
farming. It can also be deduced from Figure 27in section 4.12that, as a mitigating
measure, sugar beans contractors reduced their funding for 2013 and 2014 in order to
minimize their exposure to default risk.
The study also established that one way of lending, through a tripartite contractual
relationship in the 2014 sugar-beans planting season,which culminated with a 100% loan

101
recovery rate was achieved through group lending. This lending mechanism had not
been put to practice in the study area neither in the year 2012 nor 2013. The tripartite
relationship involved the sugar-beans farmers who formed two groups, a government
owned agriculture finance house and a contracted agriculture commodity buyer based in
Harare.One farmer-group had 18 farmers and the other farmer-group comprised 56
sugar-beans farmers. This therefore makes group lending a mitigation measure against
default risk as articulated by Khandker (2012) and Wenner (2010) in their studies on
loan repayment performance.
4.14Discussion of the research findings
In this study the researcher employed,One-way ANOVA as shown in Table 4.3 and 4.8
in section 4.9 and 4.10 respectively; Decision Tree Analysis in section 4.9 and
Multivariate regression model techniques in section 4.11, to identify the factors
influencing loan repayment performance by contract farmers. The analysis techniques
estimated the independent predictors that influenced the dependent variable of either
success or default by contract farmers to repay their loans. The research was confinedto
focusing on sugar-beans and banana contracts data for a three year period covering the
year 2012 to 2014.
The study has managed to reveal the factors influencing loan repayment under contract
farming for sugar-beans and bananas. This section discusses in detail all the
factors,including those which were non-significant to influence loan repayment,which
have been collected to answer the research questions and marry them to prior research
findings.

102
Gender
The representation of male and female in the study constituted 59% and 41%
respectively as shown in Figure 6 in section 4.4. This is in contrast to Zimbabwe
National Statistical Agency (Zimstat) census results of 2012 were males constitute 46%
and females were 54% in Chipinge Rural (Zimstat 2013) implying that females have a
higher proportion in the study area. This means that though females have a higher
population it did not automatically give them the economic leverage in accessing income
generating opportunities in the study area. This seemingly higher proportion of females
in the contract for banana and sugar-beans is a direct result of the Zim-AIED Program
which emphasizes gender mainstreaming in their program implementation and it is a key
deliverable as espoused in the Feed the Future performance indicators (Fintrac Inc.
2014).
It has to be noted that gender was found to have no effect on loan repayment in this
study. But other empirical studies arrived at different results. In relation to gender,Udoh
(2008) notes that male beneficiaries had higher tendencies to default than females. A
study in Vietnam by Duy (2013) also confirmed the same results. This study made an
observation that women are generally good borrowers in terms of repaying their loans.
Marital status
The marital status variable of contract farmers was categorized in the following groups
married, widowed, single and separated. Contract farmers who are married composed
65%, widowed farmers constitute 27%, 6% were single and 2% comprised the separated
categoryas shown in Figure 7 in section 4.4. This independent variable did not have

103
significant influence on loan repayment for both sugar-beans and banana contract
farmers. Empirical evidence from a study in Malaysia by Mothtaret al (2012) had the
same result were marital status was found to be statistically insignificant on loan
repayment performance.
Age of contract farmer
The independent predictor, age, has been consistently identified by previous studies as a
factor influencing loan repayment either positively (Wognaaand Awunyo-Vitor,
2013;Mokhtar, Nortea and Gan 2012; and Awunyo-Vitor 2012) or negatively
(Kohansaland Mansoori 2008). Oni et al (2005) concurs that age was a dominant factor
in their research affecting loan repayment. This has been confirmed by this study as
shown by results in Table 4.3 and Figure 23 in section 4.9 that age is a primary factor
influencing loan repayment and of importance is that those aged below 48 years were
defaulters constituting 71% in a sample comprised of 38 sugar-beans farmers below this
age. Whilst sugar-beans contract farmers over the age of 48 years fared well in repaying
their loans. Pasha and Negese (2014) concur with these results in their study in Ethiopia.
The evidence from their study revealed that those between the ages of 24-34 comprised
a higher percentage of defaulters.
The reasons attributable to good loan repayment performance by older farmers is that
they have a social reputation to protect because they are permanent dwellers in the
schemes. Secondly at an age over 56 years,older farmers do have few productive
opportunities to pursue and so they decide to settle for farming as their major source of
livelihood.This incentivisesthe farmers to be honest borrowers as they rely on loans as

104
source of finance. Whereas for farmers who are still young, they can decide to quit their
farming venture if a seemingly lucrative opportunity arises, especially from a major bio-
fuel producer which has vast sugar-cane plantations within the proximity of the study
area.This compromises this age groups’ commitment to fully settle for the farming
profession in the irrigation schemes. Last but not least experience is another attribute
that explains the better loan repayment performance by contract farmers older than 48
years of age in comparison to those below this age who lack proper experience in
farming as noted by Mokhtaret al (2012). This has also been validated by the high
covariance between age and trainings attended by farmer in Figure 26 where the older
the person the better they are exposed and attend more trainings adding to their farming
experience which ultimately leads the farmer to repay their loans taken for farming
activities.
Household size of contract farmer and source of labor
Other research findings agree that household size is a factor that has a significant effect
on loan repayment.Udoh (2008) in AkwaIbom State in Nigeria came to a conclusion that
household size was statistically significant to loan repayment performance and noted
that those farmers with a large household size are likely to default than those with
smaller household sizes. Though this contrasts with this study’s finding that those
contract farmers for sugar-beans with a household size of over 8 members responsibly
paid their loans. Whilst a study by Wongnaaand Awunyo-Vitor (2013) concluded that
household size was not clear.

105
The average household size for the study was found to be 7.3 as shown in Figure 9 in
section 4.4. It is slightly higher than the Chipinge Rural average of 4.6 (Zimstats 2013).
But the study’s mean compares favorably to Zim-AIED’s average of between 6 and 7
members (Fintrac 2014) for the Mutema and Musikavanhu-Chibuwe irrigation scheme
plot holders.
The findings showed that the variable for source of labor and household size of sugar-
beans contract farmers are correlated as shown Figure 26. Although source of labor was
not significant in influencing loan repayment it had a positive correlation with household
size as most of the farmers in the study area rely on their family members for their labor.
This implies that those with a larger household size of over 8 members put to good use
this factor of production resultantly leading these farmers to repay their loans
successfully. A higher covariance of 11.50 (see Fig. 26) also exists between farmers
advanced in years and a large household size of over 8 members as found in this study in
Figure 24. Contract farmers’ relying on their families as source of labor comprised 71%
and other categories of outsourcing labor was 16% and a combination of both was 13%
in reference to Figure 20.
Number of school-going children
The highest frequency of children still going to school for contract farmers was 3 with a
frequency of 28.9% and the lowest was 8 children at 0.8%. This was considered as a
variable to investigate, if contract farmers with a financial commitment to pay for their
children’s school related expenses have an effect on loan repayment. Through various
statistical tests in SPSS using one-Way ANOVA analysis as shown in Table 4.3 in
106
section 4.9 and Decision Tree analysis both of these analysis failed to determine the
statistical significance of this variable to influence loan repayment.
Output,yieldand revenue for sugar-beans contract
For the three year period the sugar-beans yield has performed below the expected
national yield rate of 1.5 tones/ha (Jimat 2000). This is indicative of a room for
improvement for sugar-beans farmers whose average yield range from 1.37t/ha to
1.43t/ha for the three year period. This compares favorably to a 2010 national average
of 0.56t/ha in a FAO and World Food Programme (WFP) special report in 2010 on
Zimbabwe (Gunjal, Poundand Delbaere 2010).The yield can possibly be increased
through continued trainings that reinforce good agriculture practices that lead to higher
yields eventually leading to higher income for the farmer and most likely motivate the
farmer to fully repay their loans holding all things constant.
Related to yield is the output factor which has direct impact on other variables such as
revenue. Similarly previous studies have unequivocally suggested that output (Dawes et
al 2007) impacts on the overall revenue and income earned by farmer. The higher the
output the better the revenue and this resulted with contract farmers being able to
liquidate their agricultural loans as it was clearly found in this study. The average output
of those who never defaulted under the sugar-beans contract was 1171.15 kilograms and
816.30 kilograms was the average output of those who defaulted in Table 4.9.
Concurrently the average revenue average was US$1,229.71 for non-defaulting farmers
whilst for defaulters it averaged US$857.12. Revenue is a function of the selling price
and output. The selling price varied from year to year mainly being affected by market
107
conditions of sugar-beans in each particular year and presence of other non-contracting
buyers in the irrigation schemes. The average selling price per kilogram for 2012 was
US$1.17 increasing by 1.71% in 2013 to an average of US$1.19 per kilogram and
plunged by 15.13% in 2014 to an average of US$1.01.
On the overall the buffer zone of what farmers have to achieve for them not to default is
1171.15kgs, this can even be set as the break-even output, taking cognizance that this is
the only variable that farmers have outright control of. Sugar-beans contract farmers
retained an average of 11% of harvested output for the three year period for home
consumption.
Number of trainings attended by contract farmer
A number of researchers (Miller and Jones 2010, Roslanand Karim2009 and Heney
2000) have pointed that training of farmers is a key determinant factor affecting loan
repayment.In this study the same results were confirmed that a statistically significant
relationship exists between training and loan repayment performance as indicated in
Table 4.3; Figure 25 and 26.Roslanand Karim (2009) concurs that training in credit
management and good agricultural practices reduced loan repayment default among
microcredit beneficiaries in Malaysia. On the contrary the same study showed that
farmers who did not undergo any form of training defaulted in repaying their loans. But
Nyamwanzaet al (2014) refuted, in their findings, the assertion that training contract
farmers growing cotton would incentivize them to repay loans to their contractors.
Out of a myriad of training courses offered by the Zim-AIED Program to farmers only
five critical courses were chosen. All these trainings were offered free of charge through

108
the Zim-AIED Program. Attendance to either all or some of the trainings by a contract
farmer was the measure to determine the relationship between training and loan
repayment. Those sugar-beans farmers who attended more than 3 trainings performed
better in repaying their loans as shown by a higher rate of 65.3% who never defaulted
out of a number of 72 contract farmers as shown in Figure 25. Among the sugar-beans
contract farmers who attended less than 3 trainings 80% defaulted from a total of 25
contract farmers.
Number of Agritex Officer’svisits per week
Another variable which was assessed by this research was number of Agritex Officer’s
visits per week to monitor crop assessment and give relevant advice accordingly to the
farmer. The importance of Agriculture Extension Officer’s work cannot be
overemphasized as it is a critical component in the success of agricultural production
and improve incomes in the rural economy (Okwuokenye and Okoedo-Okojie 2014;
Dawes et al 2007). Regular contact between farmers and Extension Officers will ensure
constant flow of critical information to farmers and respectively enhance the farmers’
personal knowledge and experience in agriculture production (Geihler and Olofsson
2004). In the study area each Scheme is resourced with a capable extension officer but
what differentiates the extension officers’ work is the frequency of visits that they
routinely carry outto assist farmers. In the research results frequency of visit per week by
Agritex Officers did not have significant influence on contract farmers’ loan repayment
performance. It is interesting to note that generally the Agritex Officers regularly visit
farmers once a week as shown in Figure 22.
109
Banana contract farming loan repayment performance
The loan repayment performance for banana contract has performed well with no
defaults having been experienced over the current life-span of the contract. This means
that all the factors that werestatistically tested to influence loan repayment have been
rejected to significantly lead farmers to defaulting as shown by the results in Table 4.3;
4.8 and Appendix 1. These include number of school going children in each household,
marital status and gender of farmer. In addition to these, there is loan size, hectares
planted and Agritex Officer’s visits per week, have no significant effect on loan default.
The banana contract farming arrangement has only one contractor who has a dominant
presence in the banana value chain in Zimbabwe. The contractor owns vast tracts of
banana plantations and subsequently markets the tropical fruit in and outside Zimbabwe.
This has seen contracted smallholder farmers benefiting directly from the expertise of
the contractor and the contract farming model exemplifies a typical out grower scheme
as characterized by Eaton and Shepherd (2001). The banana contract has a long tenor of
eight years but it is regularly reviewed on a yearly basis by the farmers, government’s
Agritex officers, the contractor and other interested stakeholders. To ensure post Zim-
AIED Program sustainability for the banana contract arrangement Zim-AIED officials
have already linked the contract farmers with a local financial institution. The local bank
fills in the gap to be left by theZim-AIED Program when it ceases, by continuing with
the provision of financial intermediary role of offering working capital loans at
concessionary conditions to banana contract farmers. Apart from issuing loans to
110
contract farmers the bank is offering other financial services products which the farmers
previously did not have access to.
On the contrary the sugar-beans contract has seen five contractors being active for the
three year period. In addition to these contractors they are other multiple non-contracting
buyers of sugar-beans. All the sugar-beans contractors act on behalf of larger buyers and
seed houses whose operations are in Harare the capital city of Zimbabwe. Therefore the
contract farming model being practiced under sugar-beans contract is the intermediary
model (Will 2013). Although this observation, that they are differences in the number of
contractors for sugar-beans and bananas, has not been statistically measured and tested
as part of the variables influencing loan repayment,it has to be noted and acknowledged
as having a bearing on the loan repayment performance of the two crops grown under
contractual obligations in the study area.
CHAPTER 5: SUMMARY, CONCLUSION AND RECOMMENDATIONS
5.1Summary of the study
This study sought to find the factors influencing loan repayment under contract farming
for two crops being grown in Mutema and Chibuwe-Musikavanhu Irrigation Schemes in
Chipinge District. This is one of the three objectives of the study and it is also the main
objective.Two of the other objectives are types of loans and conditions under which the
loans are issued and investigating the mitigation measures to avert the recurrence of loan
defaults in the study area.
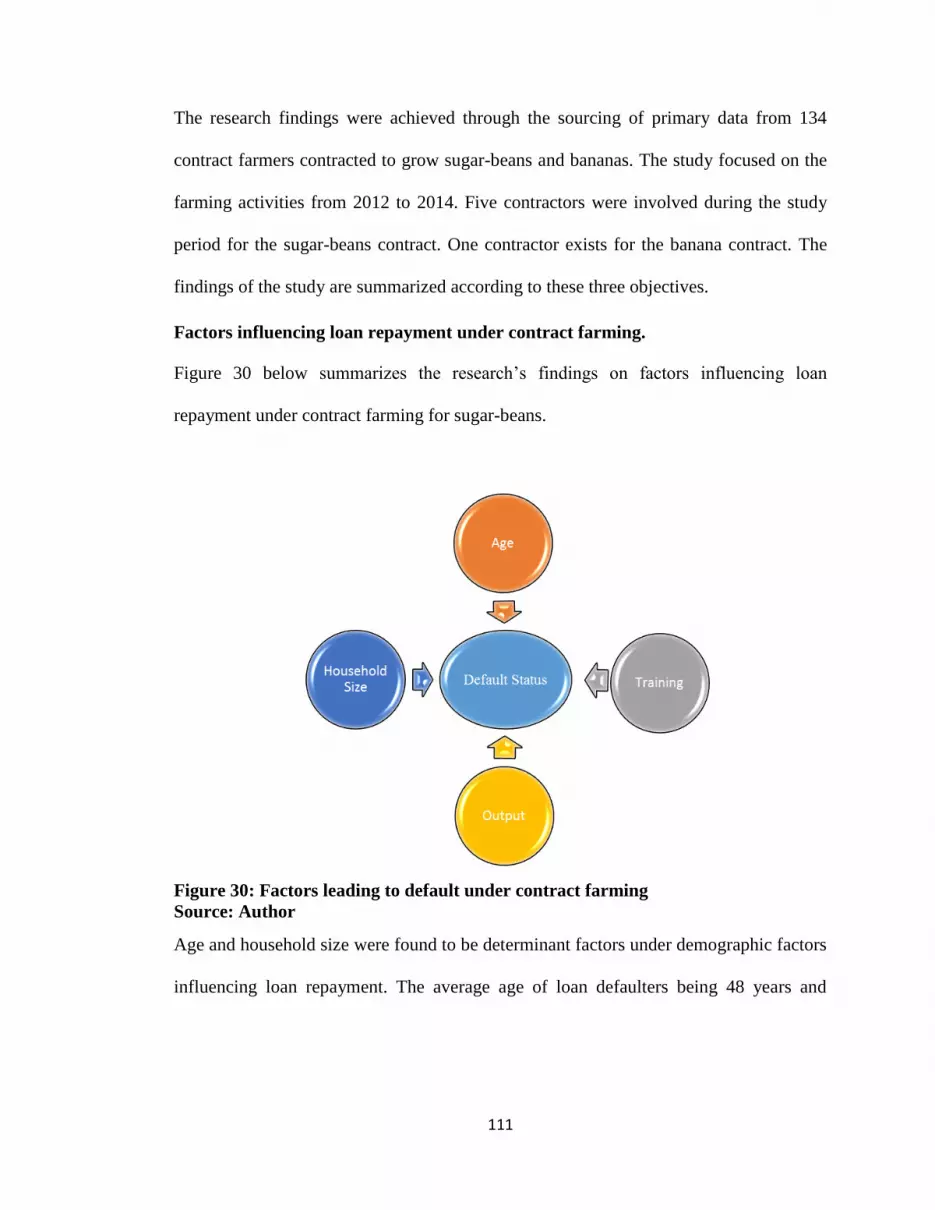
111
The research findings were achieved through the sourcing of primary data from 134
contract farmers contracted to grow sugar-beans and bananas. The study focused on the
farming activities from 2012 to 2014. Five contractors were involved during the study
period for the sugar-beans contract. One contractor exists for the banana contract. The
findings of the study are summarized according to these three objectives.
Factors influencing loan repayment under contract farming.
Figure 30 below summarizes the research’s findings on factors influencing loan
repayment under contract farming for sugar-beans.
Figure 30: Factors leading to default under contract farming
Source: Author
Age and household size were found to be determinant factors under demographic factors
influencing loan repayment. The average age of loan defaulters being 48 years and
112
below. The capacity for a contract farmer to repay is mainly correlated to age.The older
the farmer the higher the probability that they will repay their loan as confirmed by the
positive coefficient in the multivariate regression model as shown on Figure 26. The
average age of non-defaulters was found to be 56 years (refer to Table 4.21). For the
independent predictor, household size, the average is 8 members for the contract farmers
who managed to repay their loans and on the contrary those who defaulted had an
average household size of 6 members. Household size predictor is correlated to the
source of labor variable though not having a significant influence on loan repayment it
was established that the family is the source of labor for most farmers.
Attendance of farmer to trainings offered by Zim-AIED Program was a critical factor in
determining the loan repayment status of a contract farmer. Sugar-beans contract
farmers who attended an average of three trainings and above performed better in
repaying their loans than those who attended less than 3 trainings.
The other independent variable influencing loan repayment was output of sugar-beans.
Farmers with a lower output averaging 816kgs showed a greater propensity to default
whereas those who repaid their loans the average output was 1171kgs.
Whilst for the banana contract farming arrangement the contract farmers were all non-
defaulters for the period of the study from 2012 to 2014.
Type and the conditions of loans offered to farmers under contract farming.
The type of loans issued by contractors was mixed with those farmers growing sugar-
beans accessing short-term loans mainly comprising inputs.The inputs loaned to contract

113
farmers varied from contractor to contractor and farmer’s own needs for that particular
season. The sugar-beans farmers’ loans were terminal in nature. This meant that they
were required by their contractors to repay the principal loan amount and interest charge
after 5 months when farmers sold their sugar-beans. Interest charged by contractors
varied from 3% to 20% per month.
Farmers growing bananas accessed capital and working capital loans with a 36 months
loan tenor. The farmers repaid their loans in instalments over the 36 month period. The
interest charge ranged from 0% for capital loans to 11% per annum for working capital.
One thing that was common among contractors of both crops, sugar-beans and bananas,
is that they did not request collateral from contract farmers but this did not incentivize
some sugar-beans to fully repay their loans.
Mitigation measures to avert defaultsamong contract farmers.
The direct consequence of defaulting in servicing loans by farmers is the withdrawal of
funding by contractors. One contractor for sugar-beans resorted to complete withdrawal
of funding as a mitigation measure in the 2014 planting season and concentrated on
recovering outstanding loans. The other contractors reduced the amount accessed by
each farmer.
The two tier loan screening method is being implemented by contractors. Farmers are
first vetted by their Irrigation Management Committees (IMCs). Those who would have
qualified at this stage will later be vetted by Agritex Officers. This ultimately leads

114
farmers to have a clean record and incentivize them to be honest for them to access
funds.
Group lending which was introduced in the study area in 2014 for the sugar-beans
contract resulted with a 100% loan recovery rate. This implies that group lending is a
possible solution to the challenge of loan default risk.
5.2Conclusion
The research study was undertaken with the fundamental focus to identify the factors
influencing farmers in loan repayment performance under contract farming in Irrigation
Schemes in Chipinge District in Zimbabwe. The research studied the factors under
demographic, agronomic and socio-economic facets.
The study noted that on gender parity male are dominant actors in the contract farming
activities engaged in the Irrigation Schemes. Whilst the rate of female engagement in
contract farming activities is considerably high at 41% bearing in mind that the societal
context they reside is still patriarchal when it comes to making economic decisions.
Male constituted 59% of the research study.
Farming in the irrigation schemes is practiced mostly by married people who rely on
their family members as a source of labor. In addition to a large household size, which is
greater than or equal to seven comprise more than 54% of respondents, 71% of the
respondents rely on this huge family size as a source of their labor. The average age of
farmers is 50 years. This entails that most farmers are still economically active to
dispense their time and strength towards farming.

115
Based on the research results, the research concludes that demographic factors that
significantly influence loan repayment for sugar-beans contract farmers are age and
household size. One fundamental result that was established by this study is that the
older the age of the farmer the larger the household size the farmer probably has the
higher the probability the contract farmer will repay their loan.
For the agronomic factors comprising yield, hectarage, output, Agritex visits per week
and training in agriculture related courses were considered. The yield has a direct effect
on output resulting with the farmers’ capacity to generate income which leads to contract
farmer either repaying their loan or default. Although income or revenue has been
considered under the financial factors it was necessary to also consider it under
agronomic factors. What has been outstanding with factors related to output from the
findings is that the year 2013 was much favorable for sugar-beans production. If farmers
can manage to pursue the year 2013’s production continuum their capacity to repay their
loans will be better. The average yield for that respective year was at 1.4 t/ha and
farmers grossed average revenue of US$1,216 whilst US$1,149 and US$1,010 were
averages for 2012 and 2014 respectively. Ultimately output and number of trainings
attended by farmer were the other factors that impacted significantly on loan repayment.
It has beenestablished through this study that not all the output harvested by sugar-beans
contract farmers is sold to their respective contractors. Approximately 11% of total
output of sugar-beans is retained for household consumption. Contractors should
116
therefore make an 11% provision in their estimates as retained at household level for
food security reasons.
The study found out that outside of the formal financial sector which is supervised by
the Reserve Bank of Zimbabwe there exist an organized network of finance through
contract farming which is prone to the scourge of non-performing loans. The loans
offered have peculiar conditions.The stakeholders involved in the interlinked credit
arrangements are the government’s Agritex Officers, contractors, banks, not-for-profit
organizations such as Fintrac Inc. Zimbabwe through Zim-AIED Program and farmers
themselves.
On the overall the study findings makes it imperative that sponsors and financiers of
smallholder farmers should pay attention to the abovementioned demographic and
agronomic factors prior to issuing farmers with loans.
5.3 Recommendations
A number of recommendations are suggested to improve the capacity of smallholder
farmers to be better parties in a contractual relationship and be good borrowers based on
the findings of the study.
Farmers
Farmers should attend trainings as they give them the opportunity to learn and gain skills
that improve their farm productivity and avoid the trap of relying on old agricultural
practices.

117
Farmers should know the optimum yield which automatically leads to high output that
will be derived from their farming practices and that enables them to repay their loans
fully and maintain good relationships with financiers and sponsors of contract farming.
This entails that farmers should take farming as a business and have good record-
keeping practices that are easily accessible for those who want to check for both farm
production performance and related financial information. Farmers should know the
break-even output and strive to achieve it to avoid the embarrassment of a being a loan
defaulter and being blacklisted by issuers of loans.
Sponsors and financiers of contract farming
Sponsors of finance and contract farming should ensure that smallholder farmers are
thoroughly trained prior to loans or inputs being issued. Focus should be on financial
literacy, Business skills, contract farming management and engagement, marketing and
crop production techniques. This is not an exhaustive list but it is a guide. As noted in
the research findings it is not so much about just training farmers but that the farmers
should attend the trainings and show that they are willing to implement what has been
learned. The trainings can be done in collaboration with government’s Agriculture
Extension officers who are well versed with farmers’ training needs. Furthermore
training of farmers should be done on good agricultural practices in order to increase
yields and as previously noted has anoverall effect on output and income to be gained
from farming. On crop production demonstration plots should be setupas part of the
practical training needs of farmers.

118
Secondly sponsors and financiers of contract farming should issue a full package in
terms of their financing packages not just partial funding. This means that loans issued
should include financing for labor for those who outsource labor. As empirical evidence
from this study shows that households with less than eight members are likely to default
as a result of lack of labor resources. The households are forced to outsource labor and
have to source for funds to pay for the labor. With the view that most smallholder
farmers are resource-poor they might opt to forego hiring the labor and just scantly
perform the farming activities leading to poor harvest. Thus the loans issued should
incorporate the financing for labor tailored to meet each household’s labor strengths and
needs.
Loan providers should offer a mixture of both group and individual lending to cater for
the diversity of farmers who either perform better as individuals or as part of a group. To
cover for the financial weakness of defaulting by some farmers group lending has
proved to be a good lending practice to assist defaulters.
Systems of proper screening should be in place including the use of local knowledge
experts such as Agritex Officers and other communal leadership to assist with farming
performance of individual farmers especially the younger borrowers whose credit rating
is not pleasing. Follow ups should also be done to this age group so that they are
continually reminded of their need to repay their loans.
Policymakers
Policymakers should continue to encourage the mainstreaming of gender in agriculture
financing mechanisms as females are not by any means bad borrowers as empirical

119
studies show, including this study. Studies have consistently shown that females are
committed to uphold good business practices including repaying their loans.
Secondly there is need for policy intervention that should build a robust system that
takes into cognizance the various financial needs of farmers and the particular factors
that affect their farming operations which among them is default risk. Proper insurance
mechanisms should be developed that cushions both farmers and providers of finance
from unforeseen adverse conditions beyond the control of either of the parties.
Areas for further study
There still exists gaps in this broad study of contract farming that integrates both
agriculture finance and market linkages. These include the comparison of factors
influencing contract farming performance during the Zimbabwe dollar era to the current
multi-currency dispensation.
As this study has focused on certain variables influencing loan repayment under contract
farming by contract farmers it will also be prudent to consider the determinants of loan
repayment from the perspective of the funders or sponsors of contract farming.This has
to consider factors influencing to loan repayment performance from the perspective of
other providers of credit, outside of contract farming, that farmers have accessed.
120
REFERENCES
Adebayo O.O. and Adeola R.G. (2008). Sources and uses of agricultural credit by small
scale farmers in Surulere Local Government Area of Oyo State, Nigeria. .
Anthropologist vol 10(4), 313-314.
Agriculture Marketing Authority (AMA). (2013). Statutory Instrument 140 of 2013.
Harare: Government of Zimbabwe.
Agritex. (2012). Chibuwe-Musikavanhu 2012 Agritex Report. Musikavanhu: Agritex
Office.
Ahangar G.B.; Ganie A.H. and Jan Padder M. (2013). A study on institutional credit to
agriculture sector in India. International Journal of Current Research and
Academic Review vol. 1 no. 4, 72-80.

121
Awunyo-Vitor D. (2012). Determinants of loan repayment default among farmers in
Ghana. Journal of Development and Agricultural Economics Vol. 4(13), 339-
345.
Ayanda I.F.; and Ogunsekan O. (2012). Farmers’ Perception of Repayment of Loans
Obtained from Bank of Agriculture, Ogun State, Nigeria. Journal of Agriculture
Sciences, vol. 3(1), 21-27.
Babbie E.R. (1990). Survey Research Methods. Belmont CA: Wadsworth.
Bekele H.; Kassa B. and Demeke M. (2004). Factors influencing repayment of
agricultural loans in Ethiopia. African Review of Money, Finance and Banking ,
117-144.
Bryman A.S. and Becker. (2007). Quality Criteria for Quantitative, Qualitative and
Mixed Methods Research: A View from Social Policy . International Journal for
Social Research Methodology, 1-16.
Central Bureau of Statistics. (2015, February 13). CBS. Retrieved from CBS:
http://www.cbs.gov.il/census
Copper B. (2012). Challenging the Qualitative-Quantitative Divide. London:
Continuum.
Copper C.R. and Schindler P.S. . (2014). Business Research Methods 12th ed. Boston :
McGraw-Hill.
Cox P. (2014, February-March). Lessons from CAADP 10 years of Africa's big push.
Spore Magazine volume 168, pp. 4-5.
Cronbach L.A. (1952). Generalized Pyschometric Theory Based on Information
Measure: A preliminary report. Urbana: College of Education, University of
Illinois .
Dawes M.A.; Murota R.; Jera R.;Masara C. and Sola P. . (2007). Inventory of
smallholder contract farming practices in Zimbabwe. Harare: SNV Netherlands
Development Organisation.
de Soto H. (2000). The Mystery of Capital: Why capitalism triumphs in the West and
fails everwhere else. New York: Basic Books.
De Vaus D.A. (2001). Research Design in Social Research. London: SAGE.
Deininger K. and Liu Y. (2010). Innovations in Rural and Agriculture Finance:
Determinants of microcredit repayment in federations of Indian self-help groups

122
. Washington DC: International Food Policy Research Institute (IFPRI) and The
World Bank (WB).
Dhliwayo C.L. (2014). Monetary Policy Statement for 2013. Harare: Reserve Bank of
Zimbabwe (RBZ).
Domnez D. (2012). Social science methods for empirical data collection and analysis.
Zurich.
Dube L. (2013, February). Research Methods Lecture Notes. Mutare, Manicaland,
Zimbabwe.
Duy V.Q. (2013). Is the repayment performance of farmers better than that of non-
farmers? A case study of borrowers of formal bank credit in the Mekong Delta in
Vietnam . Centre for ASEAN Studies.
Eaton C. and Shepherd A. W. (2001). Contract farming: Partnerships for growth .
Rome: Food and Agriculture Organisation of the United Nations (FAO).
Fan S.; Voegele J. and Pandya-Lorch R. (2010). 2020 Vision: Innovations in Rural and
Agriculture Finance. Washington DC: International Food Policy Research
Institute (IFPRI) and The World Bank (WB) .
FAO. (2015, February 13). Food and Agriculture Organisation of the United Nations
(FAO). Retrieved from FAO Website: http://www.faostat.fao.org
Fintrac Inc. Zimbabwe. (2014). Zim-AIED Program: Mutema and Chibuwe Evaluation
Report 2014. Harare: Fintrac Inc. Zimbabwe.
Fintrac Inc. Zimbabwe. (2014). ZIMBABWE AGRICULTURAL INCOME AND
EMPLOYMENT DEVELOPMENT (Zim-AIED) QUARTERLY REPORT #3 –
FY2014. Harare: Fintrac Inc.
Gates B. and Gates M. (2015). 2015 Gates Annual Letter: Our big bet for the future.
Seattle: Bill & Melinda Gates Foundation.
Geihler T. and Olofsson A. (2004). Agricultural Production Lending: A Toolkit for Loan
Officers and Loan Portfolio Managers. Rome: Eschborn.
Giehler T. (1999). Agricultural Finance Revisited: Source of funds for agricultural
lending. Rome: FAO and GTZ.
Gill J. and Johnson P. (2002). Research Methods for Managers 3rd ed. London: Sage
Publications.
Gono G. (2010). December 2009 Monetary Policy Statement: Consolidating the gains of
macro-economic stability . Harare: Reserve Bank of Zimbabwe (RBZ).

123
Gono G. (2013). Monetary Policy Statement for 2012. Harare: Reserve Bank of
Zimbabwe (RBZ).
Greene W.H. (2000). Econometric Analyses. New York: Macmillan Publishers.
Guest R. (2004). The Shackled Continent: Africa's Past, Present and Future. London:
Pan Macmillan Books.
Gunjal K., Pound J. and Delbaere J. . (2010). SPECIAL REPORT: FAO/WFP CROP
AND FOOD SECURITY ASSESSMENT MISSION TO ZIMBABWE. Rome: FAO
AND WFP (WORLD FOOD PROGRAMME).
Hamza R. (2007). Non-agricultural rural activities preliminary results from selected
areas in Syria. Ministry of Agriculture and Agrarian Reform, National
Agricultural Policy Center, Working Paper No. 28.
Heney J. (2000). Agriculture Finance Revisited: Enhancing Farmer's Financial
Management Skills. Rome: FAO and GTZ.
Hongwei T., Liuqiang Z., Rulin X. and Meifu H. (2004). Attaining high yield and high
quality banana production in Guangxi . Better Crops vol. 88(4), 22-24.
IMF (International Monetary Fund). (2007). Financial soundness indicators: Experience
with the coordinated compilation exercise and next steps - background paper .
Washington D.C.: Statistical Department IMF.
International Finance Corporation (IFC). (2015). Financial loan products. Washington
D.C.: World Bank's IFC.
International Fund for Agricultural Development (IFAD). (2012). IFAD’s financial
products, lending terms and conditions. Rome: IFAD.
Isaac S. and Michael W.B. (1981). Handbook in Research and Evaluation. San Diego:
Edits Publishers.
Jimat Consult. (2000). Agro-Economic Study: Musikavanhu and Nyanyadzi South
Irrigation Schemes. Harare: Jimat Consult.
Khandker S. R. (2012). Grameen Bank Lending Does Group Liability Matter? Policy
Research Working Paper 6204, 1-44.
Kindness H. and Gordon A. (2001). Agricultural Marketing in Developing Countries:
The role of NGOs and CBOs. Natural Research Institute Journal, 15.
Klein B.; Meyer R.; Hannig A.; Burnett J. and Fiebig M. . (1999). Agriculture Finance
Revisited: Better practices in agricultural lending. Rome: FAO and GTZ.

124
Kohansal M. and Mansoori H. (2008). Factors affecting on loan repayment performance
of farmers in Khorasan-Rasavi Province Iran. Conference on International
Research on Food Security Natural Resource Manangement and Rural
Development.
Kothari. (2004). Research Methodology-Methods and Techniques. New Dehli: New Age
International.
Kramarenko V.; Engstrom L.; Verdier G.; Fernadez G.; Erik Oppers S.; Hughes R.;
McHugh J.; Coats W. (2010). Zimbabwe: Challenges and Policy Options after
Hyperinflation. Washington D.C>: International Monetary Fund.
Kumar A., Singh K.M.and Sinha S. (2010). Institutional Credit to Agriculture Sector in
India: Status,Performance and Determinants. Agricultural Economics Research
Review. vol. 23, 253-264.
Lakshmi T.M.; Martin A.; Mumtaj Begum R. and Prasanna Venkatesan V. (2013). An
analysis on performance of Decision Tree Algorithms using student's qualitative
data. . I.J. Modern Education and Computer Science.
Maddala G.S. (1983). Limited-dependent and qualitative variables in econometrics.
London: Cambridge University Press.
Merriam-Webster. (2015, February 02). The Merriam-Webster Unabridged Dictionary .
Retrieved from Merriam-Webster: www://www.merriam-webster.com
Miller C. and Jones L. (2010). Agricultural Value Chain Finance: Tools and Lessons.
Warwickshire: FAO and Practical Action.
Mokhtar S.H., Nartea G. and Gan C. (2012). Determinants of microcredit loans
repayment problem among microfinance borrowers in Malaysia . International
Journal of Business and Social Research vol. 2(7), 33-45.
Muchati J. (2015, February 4). Ruzivo Trust. Retrieved from www.ruzivo.co.zw:
http://www.ruzivo.co.zw
Mugandani R., Wuta M., Makarau A. and Chipindu B. (2012). Re-classification of agro-
ecological regons of Zimbabwe in conformity with climatic variability and
change. African Crop Science Journal, vol. 20(2), 361-369.
Muza O. (2013). Zimbabwe contract farming at a crossroads. Harare: Newsday.
Nyamwanza T.; Mapetere D.; Mavhiki S.; Nyamwanza L. and Tumai K. (2014). Cotton
industry's strategic responses to side marketing of cotton by contract farmers in
Zimbabwe. European Journal of Business, Economics and Accountancy vol. 2 ,
40-52.
125
Office of National Statistics. (2001). Module 1: Research Methods, Data Collection
Methods and Questionnaire Design . London: Office of National Statistics
United Kingdom (UK) .
Okwuokenye G.F. and Okoedo-Okojie D.U. (2014). Evaluation of Extension Agents
Commitment to the Agricultural Loans and Inputs Supply Programme on Special
Rice Production in Delta State, Nigeria. Journal of Applied Science and
Environment Management vol. 18(2), 327-335.
Olofsson A. (2009). Risk in Agriculture. AFRACA/FAO/World Bank (pp. 1-12).
Johannesburg: FAO.
Oni O.A.; Oladele O.I. and Oyewole I.K. (2005). Analysis of factors influencing loan
default amoung poultry farmers in Ogun State Nigeria. Journal of Agriculture of
Central European Agriculture vol 6, 619-624.
Pasha S.A.M and Negese T. (2014). Performance of loan repayment determinants in
Ethiopian micro-finance: An Analysis. Eurasian Journal of Business and
Economics , 26-49.
Pultrone C.; da Silva C. A. and Shepherd A. (2012). Guiding principles for responsible
contract farming operations. Rome: Food and Agricultural Organisation of the
United Nations (FAO) .
Reserve Bank of Zimbabwe (RBZ). (2006). $16 BILLION SMALL TO MEDIUM
ENTERPRISES (SMEs) REVOLVING FUND. Harare: RBZ.
Roslan A.H. and Karim M.Z.A. (2009). Determinants of microcredit repayment in
Malaysia: The case of Agrobank. Human Social Sciences Journal vol 4(1), 45-
52.
Saunders M.; Lewis P. and Thonhill A. . (2003). Research Methods for Business
Students 3rd ed. Harlow: Pearson Education.
Schutte F.M. (2008). Sampling. London: Sage Publications.
Schwab K. and Sala-i-Martin X. (2013). The Global Competitiveness Report 2013-2014.
Geneva: World Economic Forum.
Shepherd, A. (2012). Contract farming session report - making the connection value
chains for transforming smallholder agriculture. Addis Ababa: Making the
Connection Conference.
Synge R. and Van Valen M. (2013, December 2013-January 2014). Sao Tome Principe:
The boom that never was. The Africa Report No. 56, p. 167.
126
Udoh E.J. (2008). Estimation of loan default among beneficiaries of a state government
owned agricultural loan scheme in Nigeria. Journal of Central European
Agriculture, 343-352.
United Nations Zimbabwe Office. (2010). Country Analysis Report for Zimbabwe.
Harare: UN Zimbabwe.
United Nations. (2013). Country Report Zimbabwe. Harare: United Nations Zimbabwe
Office.
USAID. (2014). Feed the Future Progress Report 2014 . Washington D.C.: USAID.
USAID and Fintrac Zimbabwe. (2014). Case Study: Banana production - enhancing
smallholder banana farming productivity in Zimbabwe. Harare: USAID &
Fintrac Zimbabwe.
Versi A. and Verghese S. (2013, August-September). African Business: Olam's
blueprint for success. London: IC Publications.
Wenner M.D. (2010). Innovations in Rural and Agriculture Finance: Credit Risk
Management in Financing Agriculture. Washington DC: International Food
Policy Research Institute (IFPRI) and the World Bank.
Wikipedia. (2015, March 24). Wikipedia. Retrieved from Wikipedia Website:
http://en.wikipedia.org/wiki/Manicaland Province
Will, M. (2013). Contract farming handbook: A practical guide for linking small-scale
producers and buyers through business model innovation. Bonn: Deutsche
Gesellschaftfur Internationale Zusammenarbeit (GIZ).
Wongnaa C.A. and Awunyo-Vitor D. (2013 volume V(2)). Factors affecting loan
repayment performance among yam farmers in the Sene District, Ghana. Agris
on-line papers in Economics and Informatics, 111-122.
World Bank. (2008). World Development Report 2008: Agriculture for Development .
Washington D.C.: The World Bank.
Yeong A. (2011). Introduction to Business Research Methods. New Jersey: Princeton
University.
Zhangazha W. (2014, June 13). Youth Fund: Tale of unbridled looting . Zimbabwe
Independent.
Zimstats (Zimbabwe National Statistics Agency). (2013). Zimbabwe Population Census
2012. Harare: Population Census Office.

127
APPENDICES
Appendix 1: ANOVA Analysis – Determinants of Loan Defaults
Sum of Squares df Mean Square F
Sig.
p≤0.05
2014 Output (kg) Between Groups 2757940.96 1 2757940.96 4.84 0.03*
Within Groups 54172213.68 95 570233.83
Total 56930154.64 96
2013 Output (kg) Between Groups 4226893.34 1 4226893.34 8.41 0.01*
Within Groups 47749807.69 95 502629.56
Total 51976701.03 96
2012 Output (kg) Between Groups 2286440.04 1 2286440.04 4.3 0.04*
Within Groups 47991034.19 95 505168.78

128
Sum of Squares df Mean Square F
Sig.
p≤0.05
Total 50277474.23 96
2014 Yield (t/ha) Between Groups 1.20 1 1.20 2.18 0.14ns
Within Groups 52.47 95 0.55
Total 53.67 96
2013 Yield (t/ha) Between Groups 1.06 1 1.06 3.14 0.08ns
Within Groups 26.61 79 0.34
Total 27.67 80
2012 Yield (t/ha) Between Groups 0.41 1 0.41 1.30 0.26ns
Within Groups 30.13 95 0.32
Total 30.54 96
2014 Quantity Sold Between Groups 1306677.71 1 1306677.71 3.39 0.07ns
Within Groups 30457211.18 79 385534.32
Total 31763888.89 80
2013 Quantity Sold Between Groups 2092644.43 1 2092644.43 5.85 0.02*
Within Groups 28252602.48 79 357627.88
Total 30345246.91 80
2012 Quantity Sold Between Groups 1787405.51 1 1787405.51 4.02 0.05
Within Groups 42197710.47 95 444186.43
Total 43985115.98 96
2014 Revenue Between Groups 1487586.86 1 1487586.86 3.78 0.06ns
Within Groups 31081878.57 79 393441.50
Total 32569465.43 80
2013 Revenue Between Groups 2835608.40 1 2835608.40 5.53 0.02*
Within Groups 40502792.22 79 512693.57
Total 43338400.62 80
2012 Revenue Between Groups 2710047.10 1 2710047.10 4.47 0.04*
Within Groups 57597753.42 95 606292.14
Total 60307800.52 96
* shows the significant values at less than 5% level and ns is for non-significant
values

127
Appendix 2: Banana contract farmers’ questionnaire Questionnaire number: _______________ Date of Interview:__________________ Province:ManicalandDistrict:ChipingeWard:__________________ Village:__________________
Irrigation scheme: ______________________ Block:_____________ Crop:BananaContractor/buyer: Matanuska
Guidance for introducing yourself and purpose of the interview: Good morning/afternoon. My name is _______________________ _________and I am conducting the interview for a research study for an Msc Agribusiness student at Africa University. You have been chosen randomly from a list of farmers contracted by ___________________________for this interview. The purpose of this interview is to gather information about your loan repayment towards contract farming engagements from 2012. The information that you will give is confidential and it will only be used for this research and no names will be used in reporting the findings of the research.Could you please spare some time for the interview?
Section 1: Contract Farmer’s Household Assessment
Name Sex Marital Status Date of Birth (Age) Household size Number of children still going to school
Q1: Contract farmer’s
Sex: 1. Male 2. FemaleMarital Status: 1. Single 2. Married 3. Widowed 4. Divorced 5. Separated; Household size:Current number of people that are under the care of the contract farmer.
Q2: What is your highest level of education? Tick the appropriate box. Primary Secondary Tertiary
Q3: What occupation have you undertaken prior to farming?
Section 2: Farm Activity
Q4: How many hectares/acres did you plant bananas? 2013 2012
Q5:Crop output and sales:
2013/14 2012/13
Kilograms Price/kg Kilograms Price/kg Value (USD)
Gross output
Sales
Q6: What irrigation system do you use? Tick appropriate box Surface/flood Micro jet
Q7: Irrigation maintenance cost (USD) for each year
2014 2013 2012 2011
Charge for each year
Current outstanding amount
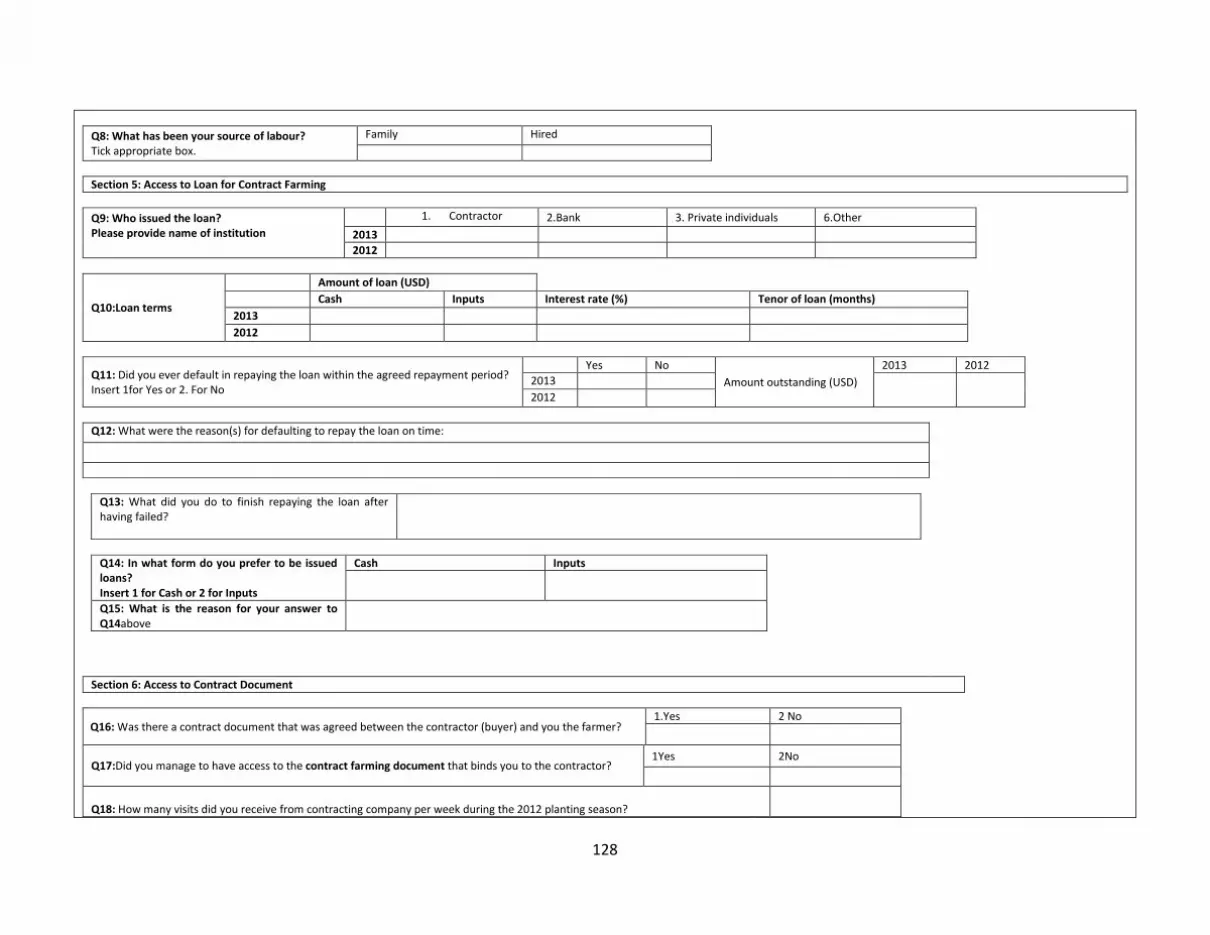
128
Q8: What has been your source of labour? Tick appropriate box.
Family Hired
Section 5: Access to Loan for Contract Farming
Q9: Who issued the loan? Please provide name of institution
1. Contractor 2.Bank 3. Private individuals 6.Other
2013
2012
Q10:Loan terms
Amount of loan (USD)
Cash Inputs Interest rate (%) Tenor of loan (months)
2013
2012
Q11: Did you ever default in repaying the loan within the agreed repayment period? Insert 1for Yes or 2. For No
Yes No
Amount outstanding (USD)
2013 2012
2013
2012
Q12: What were the reason(s) for defaulting to repay the loan on time:
Q13: What did you do to finish repaying the loan after having failed?
Q14: In what form do you prefer to be issued loans? Insert 1 for Cash or 2 for Inputs
Cash Inputs
Q15: What is the reason for your answer to Q14above
Section 6: Access to Contract Document
Q16: Was there a contract document that was agreed between the contractor (buyer) and you the farmer? 1.Yes 2 No
Q17:Did you manage to have access to the contract farming document that binds you to the contractor? 1Yes 2No
Q18: How many visits did you receive from contracting company per week during the 2012 planting season?
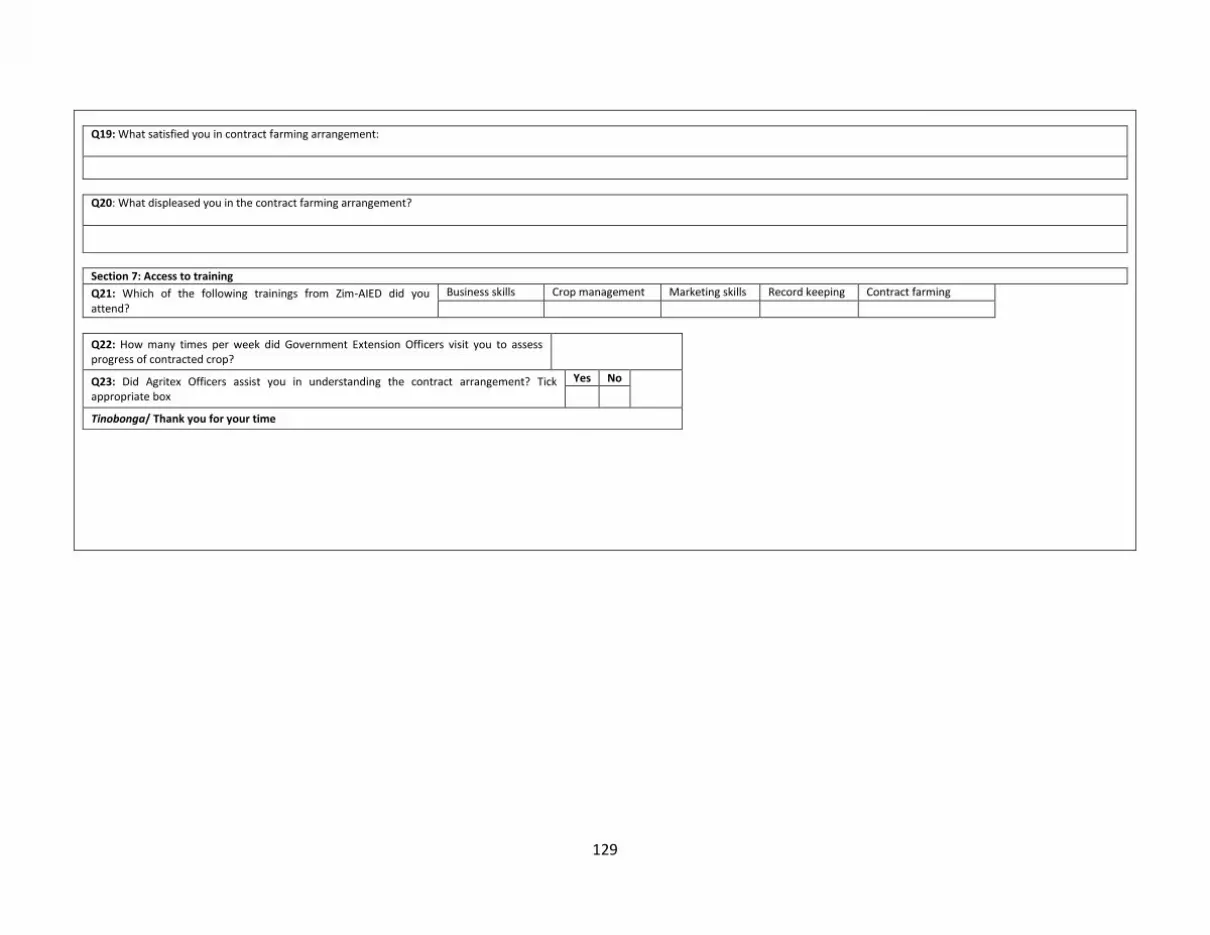
129
Q19: What satisfied you in contract farming arrangement:
Q20: What displeased you in the contract farming arrangement?
Section 7: Access to training
Q21: Which of the following trainings from Zim-AIED did you attend?
Business skills Crop management Marketing skills Record keeping Contract farming
Q22: How many times per week did Government Extension Officers visit you to assess progress of contracted crop?
Q23: Did Agritex Officers assist you in understanding the contract arrangement? Tick appropriate box
Yes No
Tinobonga/ Thank you for your time

130
Appendix 3: Sugar-beans contract farmers’ questionnaire Questionnaire number: _______________ Date of Interview:__________________ Province:ManicalandDistrict:ChipingeWard:__________________ Village:__________________
Irrigation scheme: ______________________ Block:_____________ Crop:Sugar-beans
Guidance for introducing yourself and purpose of the interview: Good morning/afternoon. My name is _______________________ _________and I am conducting the interview for a research study for an Msc Agribusiness student at Africa University. You have been chosen randomly from a list of farmers contracted by ___________________________for this interview. The purpose of this interview is to gather information about your loan repayment towards contract farming engagements from 2012. The information that you will give is confidential and it will only be used for this research and no names will be used in reporting the findings of the research.Could you please spare some time for the interview?
Section 1: Contract Farmer’s Household Assessment
Name Sex Marital Status Date of Birth (Age) Household size
Number of children still going to school
Q1: Contract farmer’s
Sex: 1. Male 2. FemaleMarital Status: 1. Single 2. Married 3. Widowed 4. Divorced 5. Separated; Household size:Current number of people that are under the care of the contract farmer.
Q2: What is your highest level of education? Tick the appropriate box. Primary Secondary Tertiary
Q3: What occupation have you undertaken prior to farming?
Section 2: Farm Activity
Q4: How many hectares/acres did you plant sugar-beans? 2014 2013 2012
Q5:Crop output and sales:
2014 2013 2012
Number of 50kg bags Price/kg Number of 50kg bags
Price/kg Number of 50kg bags
Price/kg Value (USD)
Gross output
Sales
Buyer/Contractor
Q6: Irrigation maintenance cost (USD) for each year
2014 2013 2012
Charge for the year
Current Outstanding amount

131
Q7: What was your source of labour? Tick appropriate box.
Family Hired
Section 5: Access to Loan for Contract Farming
Q8: Who issued the loan? Please provide name of institution
1. Contractor 2.Bank
3. Private individuals
4. Lending sharks
5.Fellow farmers
6.Other
2014
2013
2012
Loan amount(USD)
Q9: Who was the contracting firm if it was different from loan issuer? Please tick appropriate contractor under each crop.
Contractor 2014 2013 2012 2014 2013 2012
1.MA2
2.CHB1
3. KRI2
4. KG(AB1)
5. RP1
Q10:Loan terms
Interest rate (%) Tenor of loan (months)
2014
2013
2012
Q11: Did you ever default in repaying the loan within the agreed repayment period? Insert 1for Yes or 2. For No
Yes No
Amount outstanding (USD)
2014 2013 2012
2014
2013
2012
Q12: What were the reason(s) for defaulting to repay the loan on time:
Q13: What did you do to finish repaying the loan after having failed?
Q14: In what form do you prefer to be issued loans? Insert 1 for Cash or 2 for Inputs
Cash Inputs
Q15: What is the reason for your answer to Q14above
Section 6: Access to Contract Document

132
Q16: Was there a contract document that was agreed between the contractor (buyer) and you the farmer? 1.Yes 2 No
Q17:Did you manage to have access to the contract farming document that binds you to the contractor? 1Yes 2No
Q18: How many visits did you receive from contracting company per week during the 2012 planting season?
Q19: What satisfied you in the contract farming arrangement:
Q20: What displeased you in the contract farming arrangement?
Section 7: Access to training
Q21: Which of the following trainings from Zim-AIED did you attend?
Business skills
Crop management
Marketing skills
Record keeping
Contract farming
Q22: How many times per week did Government Extension Officers visit you to assess progress of contracted crop?
Q23: Did Agritex Officers assist you in understanding the contract arrangement? Tick appropriate box Yes No
Tinobonga/ Thank you for your time

133
Appendix 4: Assessment of Sugar-beans Contract Performance for 2012-2014 by Agritex Officers
Irrigation scheme_____________________ Block________________________ AgritexOfficer: ________________________
Issues Contractors
KRI2 CHB1 MA2 KG(AB1) RP1
2013 2012 2013 2014 2012 2013 2014 2014
Demonstration plots
(number)
How was farmer
selection done?
With
Agritex
Without
Agritex
No
When were the inputs
distributed?
Date
Appendix 5: Sugar-beans Loan performance schedule by contractor from 2012 to 2014 Year 2012
SCHEME CHB1 MA2
# of farmers Total Loaned Outstanding bal at due date
# of farmers
Total Loaned Outstanding bal at due date
CHIBUWE A
CHIBUWE B
CHIBUWE C
CHIBUWE D
CHIBUWE E
MUSIKAVANHU
A1
A2
A3

134
A4
A5
B1
B2
B3
B4
B5
YEAR 2013
SCHEME CHB1 KRI2 MA2
# of farmers
Total Loaned
Outstanding bal at due date
# of farmers Total Loaned
Outstanding bal at due date
# of farmers
Total Loaned
Outstanding bal at due date
CHIBUWE A
CHIBUWE B
CHIBUWE C
CHIBUWE D
CHIBUWE E
MUSIKAVANHU
A1
A2
A3
A4
A5
B1
B2
B3
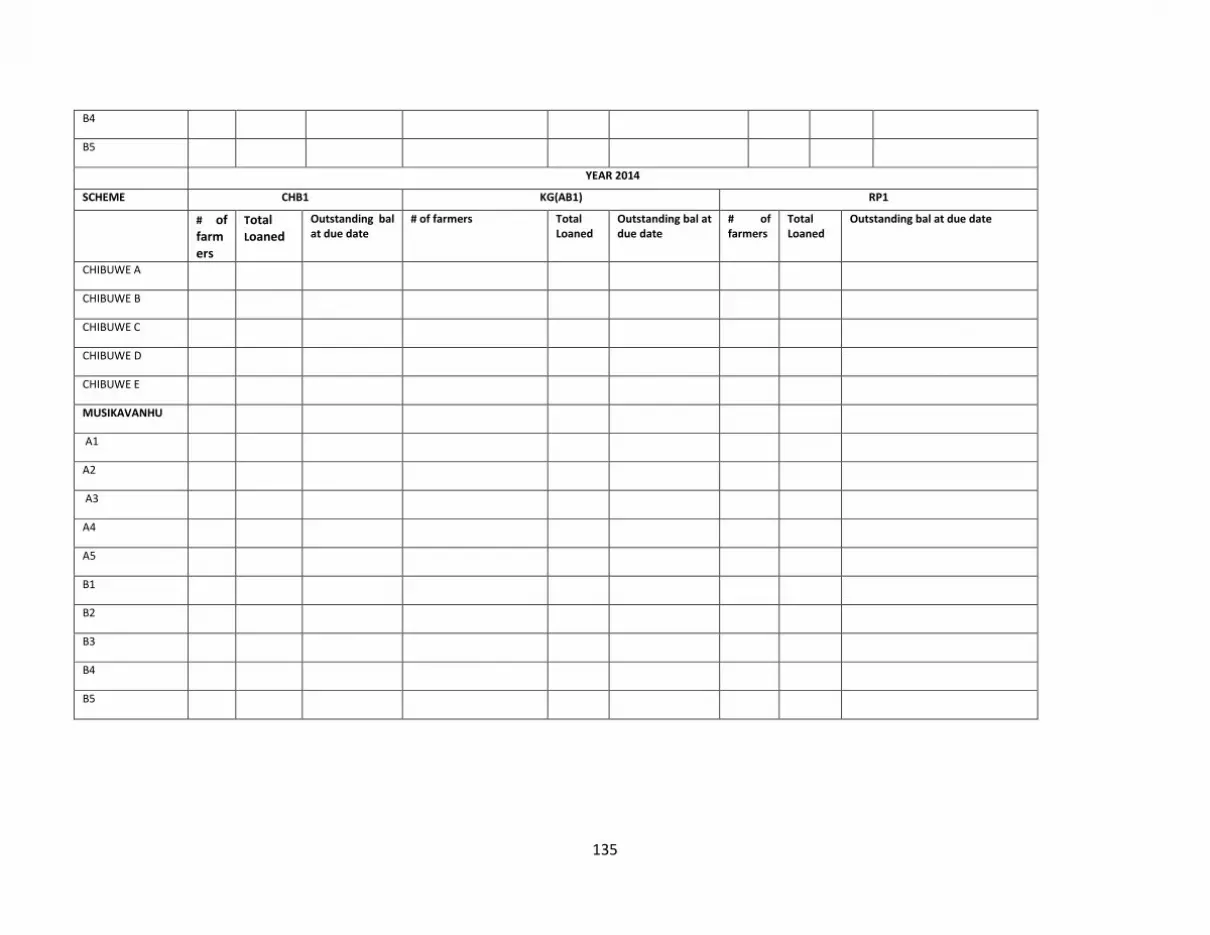
135
B4
B5
YEAR 2014
SCHEME CHB1 KG(AB1) RP1
# of farmers
Total Loaned
Outstanding bal at due date
# of farmers Total Loaned
Outstanding bal at due date
# of farmers
Total Loaned
Outstanding bal at due date
CHIBUWE A
CHIBUWE B
CHIBUWE C
CHIBUWE D
CHIBUWE E
MUSIKAVANHU
A1
A2
A3
A4
A5
B1
B2
B3
B4
B5