liv_{2}o_{4}: a heavy fermion transition metal oxide
TRANSCRIPT

Iowa State UniversityDigital Repository @ Iowa State University
Retrospective Theses and Dissertations
1998
LiV2O4: a heavy fermion transition metal oxideShinichiro KondoIowa State University
Follow this and additional works at: http://lib.dr.iastate.edu/rtd
Part of the Condensed Matter Physics Commons
This Dissertation is brought to you for free and open access by Digital Repository @ Iowa State University. It has been accepted for inclusion inRetrospective Theses and Dissertations by an authorized administrator of Digital Repository @ Iowa State University. For more information, pleasecontact [email protected].
Recommended CitationKondo, Shinichiro, "LiV2O4: a heavy fermion transition metal oxide " (1998). Retrospective Theses and Dissertations. Paper 11866.

INFORMATION TO USERS
This manuscript has been reproduced from the microfibn master. UMI
films the text directly from the original or copy submitted. Thus, some
thesis and dissertation copies are in typewriter face, while others may be
from any type of computer printer.
The quality of this reproduction is dependent upon the quality of the
copy submitted. Broken or indistinct print, colored or poor quality
illustrations and photographs, print bleedthrough, substandard margins,
and improper aligtuncnt can adversely affect reproduction.
In the unlikely event that the author did not send UME a complete
manuscript and there are missing pages, these will be noted. Also, if
unauthorized copyright material had to be removed, a note will indicate
the deletion.
Oversize materials (e.g., maps, drawings, charts) are reproduced by
sectioning the original, beginning at the upper left-hand comer and
continuing from left to right in equal sections with small overlaps. Each
original is also photographed in one exposure and is included in reduced
form at the back of the book.
Photographs included in the original manuscript have been reproduced
xerographically in this copy. Higher quality 6" x 9" black and white
photographic prints are available for any photographs or illustrations
appearing in this copy for an additional charge. Contact UMI directly to
order.
UMI A Bell & Howell Information Company
300 Noith Zeeb Road, Ann Aii)or MI 48106-1346 USA 313/761-4700 800/521-0600


LiV204: a heavy fermion transition met£il oxide
by
Shinichiro Kondo
A dissertation submitted to the graduate faculty
in partial fulfillment of the requirements for the degree of
DOCTOR OF PHILOSOPITt'
Major; Condensed Matter Physics
Major Professor: David C. Johnston
Iowa State University
Ames. Iowa
1998
Copyright © Shinichiro Kondo, 1998. All rights reserved.

DM1 Number: 9841061
UMI Microform 9841061 Copyright 1998, by UMI Company. All rights reserved.
This microform edition is protected against unauthorized copying under Title 17, United States Code.
UMI 300 North Zeeb Road Ann Arbor, MI 48103

ii
Graduate College Iowa State University
This is to certify that the Doctoral dissertation of
Shinichiro Kondo
has met the dissertation requirements of Iowa State University
Committee Menxber (^ommittee ;vi
Committee Membj
Committee MemtJer
Committee Member
Major Rrofessor
Signature was redacted for privacy.
Signature was redacted for privacy.
Signature was redacted for privacy.
Signature was redacted for privacy.
Signature was redacted for privacy.
Signature was redacted for privacy.
Signature was redacted for privacy.

Ill
To my wife and son

IV
TABLE OF CONTENTS
1 INTRODUCTION
Motivation of tiie study and introduction of LiV204
Scope of this study and dissertation organization
Reviews of important concepts
Reviews of frustration
Reviews of heavy fermion systems
Reviews of spinels
2 Overview of LiV204: A HEAVY FERMION TRANSITION METAL OXIDE . .
Abstract
Introduction
Sample preparations
X-ray and neutron diffraction measurements
Magnetic susceptibility measurements
' Li nuclear magnetic resonance measurements
Heat capacity measurements
Muon spin relaxation measurements
Conclusion
3 SYNTHESIS AND CHARACTERIZATION
Synthesis of LiV204 and Lii+rTi2_r04 (r = 0 and 1/3)
LiV204 preparations
LiTi204 and Li4/3Ti5/304 preparations
Characterization
X-ray diffraction measurement results
Introduction of Rietveld analyses
Structure analyses by Rietveld method and thermogravi metric analysis results
1
1
•5
7
7
10
18
30
30
30
3'2
32
32
34
34
36
38
40
40
40
41
41
41
44
56

V
4 MAGNETIZATION 58
Magnetization measurements 58
Overview of observed magnetic susceptibility 58
Isothermal magnetization versus magnetic field 60
Magnetization versus temperature measurements 68
Modeling of the intrinsic magnetic susceptibility 70
The Van Vleck susceptibility 70
High-temperature series expansion analysis of the susceptibility 74
Crystal field model 82
Spin-1/2 Kondo model and Coqblin-Schrieffer model 8:?
5 RESISTIVITY 90
Resistivity measurements using powder sajnples 90
Analysis of single crystal resistivity measurements 90
6 HEAT CAPACITY 95
Heat capacity measurement results 95
Overview 95
Lii+j.Ti2_r04 (x = 0 and 1/3) 97
Li\'204 103
Theoretical modeling of electronic heat capacity of LiV'iO^ 108
Single-band spin 5 = 1/2 Fermi liquid 108
Quantum-disordered antiferromagnetically coupled metal IIO
Spin-1/2 Kondo model 113
Local moment high-temperature description 117
7 THERMAL EXPANSION 121
Neutron diffraction 121
Capacitance dilatometry 122
8 NUCLEAR MAGNETIC RESONANCE 131
Linewidths 131
'Lilinewidth 131
linewidth 133
Knight shifts 135

VI
'Li Knight shift 1:55
Knight shift 140
Nuclear spin-lattice relaxation rates 142
' Li nuclear spin-lattice relaxation rate 142
nuclear spin-lattice relaxation rate 150
9 SUMMARY AND DISCUSSIONS 153
APPENDIX. RIETAN-97d INPUT FILE EXAMPLE 160
BIBLIOGRAPHY 169
ACKNOWLEDGMENTS 181

1
1 INTRODUCTION
Motivation of the study and introduction of LiV204
The cubic spinel compound LiV204 (see Fig. 1.1) is unusual since among a great deal of existing
spinels [1] it is one of the two oxide spinel compounds [2] which sustain a metallic transport behavior
[3] to low temperatures (Fig. 1.2), aside from the isostructural superconducting LiTi204 (Tc < 13.7 K)
[4]. The formal oxidation number of vanadium and titanium in the respective spinels are both 4-3.5.
assuming that Li has +1 and 0 -2. These correspond to l.o d electrons per V ion and 0.5 d electron per
Ti ion available, respectively. In the normal spinel structure there is only one crystallographic site that
\' and Ti occupy in the respective compounds. From this and the half-integer valences, the observed
metallic behaviors are readily anticipated.
LiV204 is unusual in its magnetic susceptibility. LiTi204 in the normal state shows a comparatively
temperature 7"-independent susceptibility up to 300 K [4], whereas the observed susceptibility \°^^[T)
of LiV204 is strongly T-dependent [2. 5. 6. 7, 8. 9]. The observed susceptibilities of both LiTi204 and
Li\'204 are given in Fig. 1.3 [9]. It is reasonable to consider that the 0.5 tf-valence electron per Ti site
in LiTi204 is responsible for both of the metallic and paramagnetic behaviors. By the same token, by
assuming that 0.5 rf-electron/V plays the role of metallic conduction electrons in LiV204 and that the
remaining 1 d-electron/V is localized, would this be feasible for the observed transport and magnetic
measurement results? Is there something more taking place to make this V spinel more exotic? Having
1.5 c/-valence electrons per \' ion. LiV204 can also be considered to be a (dynamic) equal mixture of
(d-) and (d^) states. This may be regarded as an electron-anologue of the high temperature
cuprate superconductors which formally contain one to two holes per Cu.
LiV204 is unusual since it has built-in geometric frustration in the antiferromagnetic coupling be
tween V local spins. As the name suggests, due to the frustration a system cannot achieve long-range
magnetic order [10]. In fact, no long-range magnetic ordering is observed in frustrated compounds,
including LiV204 down to 20 mK [11]. unless something else {e.g. a structural distortion) takes place.
Frustration by itself has already drawn much attention from both theoretical and experimental physi-

r i g i i r f ' 1 . 1 N o r i n . - i l s p i n e l . s t n i e t t i r e L i l A - j O . ! I . i . • • i i i ' i O a t o m s i r e r ' - ' [ - > r ' -
.sented in blue, red and green, respei.-tivtdy.

3
r3
CRYSTAL 1 (IRREGULAR SHAPE)
CRYSTAL 2 (RECTANGULAR BAR)
CRYSTAL 3 (IRREGULAR SHAPE)
>5
100 200 T (®K)
300 400
Figure 1.2 Resistivity p versus temperature T of hydrothermally-grown single
crystals of LiV204. Note the use of a logarithmic scale for the
ordinate (from [3]).

4
XlO"
• • • V «
**x' i 'O.-* • •
LiTi2-xVx04
X = 2 . 0 X = i . 8 X = 1 . 6 X = 1 . i X = l . 2 X = 0 . 6 X = 0 . i X = 0 . 2 X = 0
* 5 1 I ' • • ; . .
•I I •
500 1000 T / K
Figure 1.3 Temperature T variations of the magnetic susceptibility x in
LiTi2-iVx04 (from [9]). The core diamagnetic susceptibility contributions were already subracted in the shown data.

5
cisls for over a decade. In particular, the frustration effect due to doped holes in a CuOn plane in high
temperature superconducting compounds is probably one of the most well-known and recent topics
[12]. Another intriguing group of compounds in which frustration plays a major role is a spin glass [13].
What interesting feature would frustration bring to LiV204?
Last not but least. LiV204 is extremely unusual since it shows the largest electronic heat capacity
coefficient -jiT) at low T as a transition metal compound, to our knowledge [11. 14]. The low T part
of 7(7") is plotted in Fig. 1.4. This large 7 corresponds to a large quasiparticle effective mass m' of
approximately 180 times cis heavy as the bare electron mass [14]. In other words. LiV'204 is a
heavy fermion (HF) 3d compound. Although the quasiparticle effective mass is relatively smaller than
those seen in the heaviest-mass /-electron HF compounds (for example, for CeAla 7 = I.62J/molK-
corresponding to m'/m^ w 860 [15]), the value of 7(1 K) = 0.42J/molK" for LiV204 is still more
than a factor of two larger than that of the "heaviest" previously known transition metal compound
Vo prSco oaMno (~ 0.2 J/molK") [16].
The first three unique characters of LiV'oO^ motivated this work and led us to the discovery of the
last important feature [11].
Scope of this study and dissertation organization
The format of this dissertation is as follows. In the remainder of Chapter 1. brief introductions and
reviews are given to the topics of frustration, heavy fermions and spinels including the precedent work of
Li'v'oO^. In Chapter 2. as a general overview of this work the important publication in Physical Review
Letters by the author of this dissertation and collaborators [11] regarding the discovery of the heavy
fermion behavjor in LiV204 is introduced. The preparation methods employed by the author for nine
Li\'204 and two Lin.j.Ti2_r04 (r = 0 and 1/3) polycrystalline samples are introduced in Chapter 3.
The subsequent structural characterization of the LiV204 and Lin.j.Ti2-r04 samples was done by the
author using thermogravimetric analysis (TGA). x-ray diffraction measurements and their structural
refinements by the Rietveld analysis. The results of the characterization are detailed in Chapter 3. In
Chapter 4 magnetization measurements carried out by the author are detailed [17].
In Chapter .5, after briefly discussing the resistivity measurement results including the single-crystal
work by Rogers et a/.[3], for the purpose of clear characterization of LiV204 it is of great importance to
introduce in the following chapters the experiments and subsequent data analyses done by our collabo
rators. Heat capacity measurements (Chapter 6) were carried out and analyzed by Dr. C. A. Swenson.
and modeled theoretically by Dr. D. C. Johnston [11, 14]. In Chapter 7 a thermal expansion study

6
o
E
t: 0 o
440^^-7
420
400
380
360
340
320
300
280 0
LiV.O, 2 4
Sample #2 (Run #1) Sample #2 (Run #2) Sample #3 Sample #6 #6 Fit 1-11 K #3 Fit 1-1 IK
' * « » t « * * * «
8
T ( K )
Figure 1.4 Electronic heat capacity coefficient "^(T) = Ce/T versus tempera
ture T below 9K for LiV204 samples 2, 3 and 6 (from [14]).

using neutron diffraction by Dr. 0. Chmaissem et al. [11. 18] and capacitance dilatometry measure
ments by Dr. C. k. Swenson [14] are introduced. The data analyses for the thermal expansion study
were mainly done by Dr. O. Chmaissem (for neutron diffraction) and Dr. C. A. Swenson (for dilatom
etry). with assistances by Dr. J. D. Jorgensen. Dr. D. C. Johnston, and S. Kondo the author of this
dissertation. Chapter 8 describes nuclear magnetic resonance (NMR) measurements and analyses by
Dr. A. V. Mahajan. R. Sala. E. Lee and Dr. F. Borsa [11, 19].
Detailed reports of the neutron diffraction and NMR work were already published as [18] and [19].
respectively. Detailed reports of magnetization [17], heat capacity and dilatometry thermal expansion
measurements [14] are currently being prepared by the author of this dissertation and Dr. D. C. John
ston. respectively. The other important measurements reported in the above Physical Review Letters
paper, but not detailed in a separate chapter in this dissertation, are muon spin rotation measurements
at TRIUMF by J. Merrin et al. and low-2" (as 0.45 to « 5.5 K) heat capacity measurements under finite
external magnetic fields (up to 6T) by Dr. M. B. Maple et al. Without their collaboration work, this
important discovery of the Zd heavy fermion compound would have never been realized. In the final
chapter, a summary and discussion are given.
Reviews of important concepts
Reviews of frustration
The concept of frustration is not new. The various anomalous phenomena of frustration have
fascinated many physicists, and still provide us with important unsolved problems. The term frustration
accounts for a situation of a spin system in which a single ground state with a certain spin configuration
cannot be determined definitively because of the presence of frustrated spin-spin interaction bonds.
The causes of frustration can essentially be placed into two categories: by the geometry of an ordered
lattice and by randomness. The simplest example which explains the first one is shown in Fig. 1.5(a)
[13], a plaquette of a triangular lattice with the nearest-neighbor (NN) antiferromagnetic (AF) coupling
in all the three bonds. For the sake of convenience, the Ising model is considered here, in which the spins
on the triangle can point only up or down. It is evident that in this model it is impossible to satisfy
all three bonds in the AF fashion simultaneously. At most, two bonds may be antiferromagnetically
coupled, but the spins on the remaining bond are coupled ferromagnetically. In this single triangular
plaquette, six different configurations, i.e. six-fold degenerate ground states, exist. This is frustration;
in particular, frustration in an ordered magnetic lattice is called geometric frustration. A triangle with

8
AF bonds is the key to this type of frustration. In real materials, there are several lattice structures
which contain triangles. The triangular and Kagome lattices are two-dimensional examples. Triangular
plaquettes are also inherent in the fee lattice; this can be easily recognized if the nearest-neighbor (XN)
pairs are connected. Other three-dimensional examples of frustrating lattices are the garnet, and the
transition metal sublattice of the pyrochlore structure which is identical to the B sublattice of a normal
spinel AfBoJO^. In Table l.I some specific compounds are given for each frustrated structure type.
Table 1.1 Some examples of geometrically frustrated compounds. The ion in
bold face represents a magnetic species that causes frustration in
the compound. 0 is the Weiss temperature (where the Curie-Weiss
law is defined as \ = C/(T -0)), and Tc the ordering temperature
(Neel and spin freezing temperatures for AF and SG. respectively).
AF. SG and HF respectively stand for antiferromagnet. spin-glass
and heavy fermion low temperature states.
Magnetic -0 Tc Low T
Compound lattice (K) (K) state Ref.
VCU triangular 437 36 AF [21]
.\aTiO2 triangular 1000 < 2 — [22]
LiCrOo triangular 490 15 AF [23]
SrCrgGcuOiQ kagome 515 3.5 SG [24]
KCr3(OH)6(S04)2 kagome 70 1.8 AF [25]
KsIrClfi fee 321 3.1 AF [26]
GdsGasOi; garnet 2.3 < 0.03 — [27]
ZnCr204 pyrochlore 390 16 AF [28]
LiV204 pyrochlore 40 < 0.02 HF [11]
The other cause of frustration is randomness. Randomness in magnetism may originate from bond
disorder or site disorder. First, in a magnetic ordered lattice with bond disorder, NN couplings are
randomly varied between +J and —J. This mixed-interaction case is illustrated in Fig. 1.5(b) where
the presence of frustration is obvious. Second, site disorder comes from varied spatial distances be
tween spin pairs due to, for instance, structural defects. Also, by diluting a non-magnetic metal with a
small amount of magnetic elements (~ 0.05 to ~ lOat.% [29]), one may have an alloy with a random
spatial distribution of moments. The Ruderman-Kittel-Kasuya-Yosida (RKKY) interaction couples the
magnetic moments via conduction electrons. However, the coupling constant JRKKY between the local
moments via the ElKKY interaction is oscillatory in space with a power-law damping amplitude. There
fore. the spatial random distribution of spins results in a corresponding random mixture of coupling

9
V
/
ft
Figure 1.5 Two simple examples typifying the two different categories of frus
tration [13]. The geometric frustration is shown in the triangular
plaquette in (a), whereas the frustration via randomness (mixed
Interactions) in (b).

10
constants which vary not only in size, but also in sign.
This second type of frustration, frustration induced by randomness, leads to a unique ordered state,
called a spin glass state [29. 30] under favorable circumstances. A typical example is Mn-doped Cu
(Fig. 1.6) [31]. As temperature T decreases from above a transition temperature, namely, a spin glass
temperature (or spin freezing temperature) T^. widely and randomly spread spins begin to form clusters
in each of which spins are aligned along a direction of some magnetic moment anisotropy (e.g.. arising
from Ising anisotropy. single-ion anisotropy. or Dzyaloshinskii-Moriya interactions). Clusters correlate
with each other via the RKKY interactions, rotating themselves as a whole. As the system is further
cooled toward Tg. thermal disorder becomes less, ajid the spins begin to freeze over a larger range.
However, frustration via randomness hinders the system from finding one single spin configuration as
7" —»• 0. Therefore, the spins have to settle down to one of many nearly degenerate ground states. Since
these states have nearly, but not exactly, the same energy, the system may be only metastable (like
ordinary glass). Spin glass behaviors in specific experiments such as dc/ac-susceptibility. heat capacity,
resistivity, neutron scattering, etc. are detailed in Mydosh's book [29]. .\mong the most noticeable spin
glass features is the temperature dependence of the uniform susceptibility \(T) for low T < T"g. which
is different depending on whether a sample is cooled in an applied magnetic field (field-cooled = "'FC")
or in zero field (zero-field-cooled = "ZFC"). This is shown in Fig. 1.6. ZFC \(T) presents a cusp at 7"g.
w h i l e F C \ [ T ) b e c o m e s f l a t f o r T < T g .
Reviews of heavy fermion systems
One usually imagines that heavy fermion (HF) materials are /-electron intermetallic compounds,
more specifically those containing Ce or U (and Yb for some). In fact, almost all reported HF compounds
are /-electron systems since the first reported HF CeAla by Andres et al. [15] in 1975. In Table 1.2
several known /-electron HF materials are listed with characteristic quantities. At low temperatures T.
some HF compounds become superconducting, some antiferromagnetic. and others remain nonmagnetic.
In Fig. 1.7 are sketched temperature dependences of the electrical resistivity p. magnetic susceptibility
V and electronic heat capacity coefficient C/T (at the low T shown, the lattice contribution C'"(T') is
negligible, so this C/T represents the electronic part essentially) for the HF compound CeCu6. This
compound is a good representative to show the general behaviors of these quantities for HF materials
in the normal state. There are several extensive reviews of the topic available [32, 33, 34, 35]. HF
compounds have the following general peculiarities [32] (see Table 1.2).

11
M o
X
20 25
T ( K )
Figure 1.6 Field-cooled [(a) and (c)] and zero-field-cooled [(b) and (d)) suscep
tibility X versus temperature T for Cu alloys containing 1.08 and 2.02 at. % ofMn (from [31]).

12
100 5.0
I—
4.0 o E
o
50 X
2.0
C / T
0.1 T ( K )
Figure 1.7 Temperature variations of the electrical resistivity p { T ) , uniform
magnetic susceptibility x^X) and linear heat capacity coefficient
CjT of a heavy fermion compound CeCue (from [36, 37]).

13
Table 1.2 Comparisons of low temperature T electronic heat capacity coeffe-
cient 7. magnetic susceptibility \ and T--coeffecient of resistivity p
for some /-electron heavy fermion compounds and elemental met
als. These quantities are inferred from the lowest T measurements
for the normal states. The symbol "mol" refers to a mole of a given
formula unit.
7(0) Y l O ) .4
Material [mJ/(molK)] (IQ-^cm^/mol) (/if2cm/K")
Paramagnet CeCufi 1530 [38] 27 [39] 111 [38]
CeAla 1362 [40] 36 [15] 35 [15]
Superconducting CeCuoSi^ 728 [40] 82 [41] % 10 [41]
UBeia 1100 [42] 15 [42] —
UPt3 450 [43] 103 [44] 1.2 [45]
Magnetic L^Znir 1070 [46] 23 [47] —
Elemental metal Pd 9.9 [48] 0.6 [49] 3.3 X 10⁻⁵ [48]
.N'a 1.4 [50] 0.03 [51] 1.0 X 10-" [52]
• An extraordinarily large coefficient of electronic heat capacity. ~i(T) = C^jT. •) is proportional to
the density of states T>'{Ep) at the Fermi level fp. and then V'iEp) to the quasiparticle effective
mass m' in the Fermi liquid picture (see Chapter 6). Therefore, a large 7 implies a large m'. This
is the origin of the term "heavy" fermions. The real electron mass does not actually increase, but
it is a way of stating in the Fermi liquid the unique character caused by many-body effects. .-Vs
in Fig. 1.7. 7(7") is strongly T dependent at low T (~ 10K) unlike the constant 7 observed in a
conventional metal. This suggests a T-dependent V'iEp). 7(0) values inferred from the lowest
temperature measurements are listed in Table 1.2.
• The magnetic susceptibility \ ( T ) shows a large value at low T on the order of IQ-'cm^/mol
which is two or more orders of magnitude larger than that of a conventional metal, as illustrated
in Table 1.2. A HF compound displays Curie-Weiss-like localized moment behavior in x(T) at
high T with a negative Weiss temperature 6. while the T dependence becomes much less at low
T (see Fig. 1.7).
• The low-T resistivity p ( T ) follows a T ' dependence, thus obeying the Fermi liquid prediction
(see Fig. 1.8(a)). A notable feature in p(T) in this relation is that the T* coefficient of a HF
compound is much larger than that of a conventional metal. The T" coefficients are given for
some HF compounds in Table 1.2. Except for UPta [see Fig. 1.8(c)] and UAI2, p(T) exhibits a
peak and then decreases as T increases, as shown in Fig. 1.8(b), in sharp contrast to conventional

14
melals.
• It seems necessary that the inter-/-atom distance be larger than the so-called "Hill limit" of
3.25-3.5 A [53] for a compound to be a HF [32. 33]. When the /-/ atom spacing is above the
Hill limit, the material is expected to display local moment magnetism due to the absence of
f-f orbital overlaps, unless the hybridization of / electrons with conduction electrons prevents
that from occurring. Therefore, the presence of nonmagnetic (at low T) HF compounds suggests
the importance of the hybridization. Furthermore. Fisk [32] remarks that i) HF materials with
very large 7 do not have an / atom as a nearest neighbors of an /-atom, ii) uranium tends to
form HF compounds with an element from "the end of «f-block and the beginning of the sp-
blocks where few states are available for hybridization with the /-electrons." This last point
implies that the hybridization tends to suppress the heavy fermion formation, which is opposite
to the above notion. However, this superficial contradiction is not problematic. It is known that
in the (periodic) Anderson model the hybridization V is necessary to establish a virtual-bound
state around a local / energy level, and with the interelectronic on-site Coulomb interaction I'
a local moment appears in the metal. In addition, the many-body scattering resonance of the
conduction electrons by the local moments yields a large electronic density of states at the Fermi
level, called the Kondo (or Abrikosov-Suhl) resonance, which in turn causes a large effective
mass. In other words, for a large effective electron mass, the presence of hybridization is essential
(without hybridization. / electrons will be uncoupled and show magnetism at low T. which is
contrary to the observed nonmagnetic ground state: see below). However, it is known that charge
configurations become unstable and fluctuate (resulting in an "intermediate valence" system) if
the degree of hybridization (strictly speaking the size of V/U] becomes large.
The nearly T"-independent \ ( T ) and rapidly varying 7(T) at low T of HF compounds are often
analyzed by and found to follow the predictions of the single spin S = 1/2-impurity Kondo model (or
the Coqblin-Schrieffer model, an extended model of the Kondo model to angular momentum J > 1/2).
HF compounds are lattices formed by /-electron ions and therefore are often called "Kondo lattices"
or "dense Kondo systems" for their Kondo-like behaviors. On the other hand, the resistivity p(T) of
HF compounds which decreases with decreasing T at low T (<?: the Kondo temperature Tk) cannot
be explained by the dilute impurity model. This decrease is normally considered as the development
of a "coherent state" at the Fermi level (i.e. Kondo peak) which corresponds to a Fermi-liquid [i.e.
metallic) quasiparticle state made from coupled local spins and conduction electrons (as detailed in the
next paragraph). As a Fermi liquid, p is proportional to T- in this coherent region.

15
TEMPERATURE (K)
Figure 1.8 Temperature T dependences of the electrical resistivity p of some
heavy fermion materials. The low-T dependence of CeAb is
given in (a) (from [15]), and the overall p behavior in (b) (from
[46]). In (c), the anomalous T dependence of UPta is shown along
with two HF superconducting compunds (from [33]).

16
The 5 = 1/2 Kondo model was invented in 1964 [54] in order to solve the long-standing (since 1930si
theoretical mystery of the origin of the resistivity minimum in nonmagnetic alloy systems (such as Cu.
Ag. Pt) with small amounts of magnetic impurities (like Cr. Fe. Co). Starting with the s-d Hamiltonian
7i = Js-d Yl, ^ where s, is a conduction electron spin. Kondo extended the previous perturbative
calculation of p(T) to the second-order Born approximation term which includes up to the third order
i n t h e e x c h a n g e c o u p l i n g c o n s t a n t J s - d - T h i s n e w t e r m g i v e s r i s e t o a l o g a r i t h m i c a l l y i n c r e a s i n g p { T )
with decreasing T. which when combined with the lattice T® contribution then causes the resistivity
minimum to occur. However, although this Kondo model succeeded in accounting for the resistivity
minima, the logarithmically diverging low-7" p became another theoretical challenge (Kondo problem).
.\brikosov [55] computed even higher-order terms, but found again that the resulting p diverged as
r —V 0. The susceptibility derived by Yosida and Okiji [56] in the same way was found to be diverging
again, but to the negative direction, in the zero T limit. All these results suggested that the perturbative
calculation could not work even qualitatively for the description of low-T" properties of Kondo alloys.
The ultimate theoretical solution to this problem had to wait until Wilson [57] devised the numerical
renormalization group theory and the exact solution based upon the Bethe ansatz [58, 59. 60] became
available.
Starting with the s-d model. Yosida [61. 62] successfully accounted for the observed T-independent
low-T susceptibility. He postulated a singlet ground-state wavefunction from which he found that a
local moment is coupled by a pair of one half of a conduction electron and one half of a hole. For
instance, around one "up" local spin S = 1/2. one half of a "down" conduction electron spin and one
half of an "up" conduction hole spin gather, forming a spin singlet. In other words, the local spin
is screened locally by a conduction electron-hole pair, while the charge is conserved. Hence, the spin
d o u b l e t ( 5 = 1 / 2 ) u n c o u p l e d w i t h c o n d u c t i o n e l e c t r o n s a t h i g h T ( w h i c h g i v e s t h e C u r i e - W e i s s \ { T ) )
is. upon cooling, transformed to the spin singlet formed by local spins and conduction electron/hole
spins which leads to the saturating x(T) at low T. In addition, by using the Friedel sum rule [63].
\osida"s theory [62] yields a finite residual resistivity, called the unitarity limit; thus, the divergence
p r o b l e m i s r e m o v e d . T h e r e s i s t i v i t y p ( T ) i s f o u n d t o d e c r e a s e l i k e T - f r o m t h i s m a x i m u m v a l u e a s T
increases.
The general temperature dependences of the resistivity p { T ) , inverse susceptibility \ ~ ^ { T ) , electronic
heat capacity Ce and thermoelectric power 5 of a typical dilute Kondo alloy system are presented in
Fig. 1.9 [64].

17
~ ( 1 - A-P) Kondo alloy
T ordinary metal
(a) T.
(b)
Kondo alloy
-(1 - flP
~{r + 0)
ordinary metal/
• rindependentY^
Kondo alloy
/. ! ordinary metal i • r "
(0 T,
T ' • J * " " •
t •
Sw Kondo alloy
1 00
ordinary metal
simple power law region crossover
logarithmic region
region
(d) temperature 7" •
Figure 1.9 Temperature variations of a typical Kondo alloy and a normal metal
for (a) electrical resistivity p, (b) inverse magnetic susceptibility
(c) electronic heat capacity and (d) thermoelectric power
S (from [641).

18
The periodic Anderson model [65] is usually employed to describe HF materials since it may incor
porate the strong electronic correlation via the intra-atomic Coulomb repulsion f' between /-electrons
in a lattice. Both the electronic heat capacity coefBcient - and magnetic susceptibility \ are enhanced
via many-body effects (i.e. U). The normalized ratio of \ to 7 is called the Wilson ratio Rw. and may
signify the degree of many-body effects. For quasiparticles with 5 = 1/2. Rw is defined as
' — c n \ / / • 1 ' > u ' ' \ ' ( l - U
where g is the 5-factor of the quasiparticles. and H B is the Bohr magneton. This Wilson ratio can be
considered as the ratio of the two densities of states at the Fermi level probed by susceptibility and
heat capacitv measurements. That is. V H E f )
~ V ^ ( E r ) '
In almost all HF metals. Rw is roughly unity, so \ and Ce are probing the same low-7" quasiparticle
excitations.
The T - coefficient A of the electrical resistivity p ( T ) = p o + A T - at low T in HF compounds is found
to be proportional to 7"(0) with a universal proportionality constant. The plot of .4 versus 7 showing
this proportionality is called the Kadowaki-Woods plot [66]. See Chapter 5 for p(T) of Li\'204.
Reviews of spinels
Spinel crystal structure
The conventional unit cell of an oxide spinel AB2O4 shown in Fig. I.l is a face-centered-cubic (fee)
structure. Both .4 and B are cations. In addition to oxide spinels, chalcogenide spinels with S~". Se'"
and Te~- anions exist. The cations occupying the octahedral sites (called IQd sites) are customarily
enclosed in a pair of square brackets. .4[52]04 is called a normal spinel. Meanwhile. 5[.4B]04 is called
an inverse spinel because the two types of atoms occupy the octahedral site with an equal probability.
There are also intermediate spinels which are between the normal and inverse spinels. Excellent reviews
of spinel structures are [1, 67]. The spinel compound studied in this work is normal, i.e. Li[V2]04.
The space group of a normal spinel is FdZm (O^). The oxygen ions constitute a nearly close-packed
fee array. Lithium occupies the 8a sites, which correspond to one-eighth of the 64 tetrahedral holes
formed by the closed-packed oxygen sublattice in the Bravais unit cell that contains eight formula units.
Vanadium occupies the I6tf sites which correspond to one half of the 32 octahedral holes in the oxygen
sublattice per unit cell. All the V ions are crystallographically equivalent, as are the Li ions and the O
ions.


20
Figure 1.10 is an alternative picture of a cubic spinel in terms of Li04 tetrahedra and VO,^ octahedra
[18]. It is evident that the edge-sharing VOe octahedra constitute linear chains parallel to each other
along one of the (110) directions within the plane. In the layers immediately above and below, the \'0,;
chains alter the direction by 90°. These octahedron chains are separated from one another by Li04
tetrahedra. Interestingly, these tetrahedra are arranged in such a way that they are not touching each
other.
Out of the six possible (110) axes, each octahedron is edge-shared with neighboring octahedra along
only three of these axes, one from the two axes in each {110} plane. Discarding all the oxygens from
the V'Oe octahedron chains in Fig. 1.10. we now see V chains. These V chains form a three-dimensional
network of corner-shared tetrahedra. as shown in Fig. 1.11.
The positions of Li, V and O ions in terms of fractional coordinates with respect to the cubic lattice
parameter OQ are given in Table 1.3. The positions of the oxygen atoms can be varied depending on
Table 1.3 Lattice positions of the normal oxide spinel LiV'204 [68]. Note the use of the second choice
of the origin.
Space Group No.227. Fd%m (O'^). Origin choice 2
For equivalent coordinates
( 0 . 0 . 0 ) + • ( 0 . i i ) + . ( ^ . 0 . ^ ) + . ( i i O ) +
L i 8 a ( i . i , i ) i l l D
V 16<f (ff^) (i.f.O) (|.0.i) (0.i.|)
O 3 2 e ( u . u.u) (u4-|.u-|-^,u-l-^) {u+^.u+^.u+^) (i(-f-^.u-i-|.u+;|-)
( » - r | . u - i - u + ? ) ( " • " • u ) ( l i - t - u - h u - t - | ) ( u + k - u + u + )
the oxygen parameter u. For an ideal cubic-close-packed oxygen array, u becomes equal to 1/4. If the
first choice of the origin was used, the oxygen parameter in the ideal case becomes 3/8 due to the shift of
the origin. In a real spinel, usually u ^ 1/4. and in the hard-sphere model u increases linearly with the
reduced difference (ta — r^)/aQ of ionic radii ta and rg [1], as illustrated in Fig. 1.12. From Shannon's
radius table [69]. we have r{V+ ) = 0.640.4 (CN = 6). r(V+ ) = 0.58 A (CN = 6). r(Li+M = 0.59.4
(CN = 4). r(0~") = 1.38 A (CN = 4). where CN stands for the coordination number of a given ion.
Since the V in LiV204 has the effective valence of +3.5. the average of r(V''^) and r(V'"''). which is
0.61.4. is used. Then the above reduced difference can be calculated
r(Li"''') — r(V'''^ ^ = -0.0024 . (1.3)
ao
where ao = 8.24039 A (at T = 295 K) from Chmaissem et al. [18] is used. With the obtained oxygen
parameter u = 0.26127 [18]. the location of LiV204 in Fig. 1.12 calculated from the above ionic radii is

2 i
Figure l.ll Vanadium atom sublattice of the LiV204 spinel structure.

22
found to be in good agreement with other spinel compounds.
As introduced below in Chapter 3. the oxygen parameter u for all of our samples was found larger
than the ideal close-packed oxygen value of 1/4. Compared to the "ideal" structure with this u v^alue.
the volumes of an oxygen tetrahedron and an octahedron become larger and smaller, respectively. The
increase of the tetrahedron volume takes place in such a way that each of the four Li-0 bonds are
lengthened along one of the <111> axes, so that the tetrahedron remains undistorted. Each of the
oxygen atoms in a tetrahedron is also bonded to three V atoms. This elongation of a Li-O bond is
illustrated in Fig. 1.13. As a result of this elongation, the tetrahedral and octahedral holes in the o.xygen
sublattice become respectively larger and smaller [67]. Since the fractional coordinates of both Li and
\' are fixed in terms of the unit cell edge, an octahedron centered by a \' atom is accordingly distorted.
The point symmetry of the Li 8a sites remains cubic, no matter how large the distortion is. However,
for u 5^ 1/4 the point symmetry of V I6d sites becomes trigonal. In Figs. 1.14 the ideal undistorted
and real distorted V octahedra are compared.
The interatomic distances d between nearest-neighbor pairs can be calculated readily. Since it is
only oxygen that slightly alters position depending on the value of u. the cation-cation distances (Li-Li.
and Li-V) do not depend on the distortion, but only on the lattice parameter OQ. Defining the
deviation of u from its ideal closed-packed oxygen array value of 1/4 as A = u — 1/4. one obtains
x/3 = —ao . (1-4)
4
d\-\- = • {1-5^
yn c^Li-v = —^"0 . (1.6)
dLt~o = ~^(l + 8A)ao (1-7)
c/v-o = 7v/l -8A-i-48A-ao • (1.8)
These equations are used to derive the interatomic distances. The cation-anion distances (C/LI-O and
t/v_o) are parameters which may be used to quantify the influences of the distortion in the oxygen
array on various properties.
Reviews of oxide spinels
The spinel structure hcis its origin in the mineral spinel MgAUO^. Numerous compounds exist
which have this spinel AB2O4 structure. Among the existing spinels, the ferrites MO • FesOa (M =
a divalent cation = Fe, Co, Ni. Cu, Zn, Mg, Cd.etc. [70]) are probably the most intensively investigated.

23
0 . 2 6 5
0 . 2 5 5
0 . 2 4 5
I ( I I I i -I r
2-3 type 4 - 2 t y p e
• Ga^' • Ge*'
* Al^' o Sn*'
m V ^ ' ^ Ti<'
• Cr^'
Fe^'
0 P
o No^VI/Q,
0 Ag^MoO^
0 . 2 3 5
4 4- •
•
•
" T 1 LiVzOA
V
•0.06 -0.04 -0.02 ' 'A-'a
Figure 1.12 Linear dependence of the oxygen parameter u versus the reduced
difference of radii of A and B ions in various oxide spinels [Ij. Listed are so-called 2-3 type spinels (A-^^B+SQ^ B=Ga, Al,
V, Cr and Fe) and 4-2 type spinels with A=Ge, Sn, and Ti).

24
(u - 1/4
Figure 1.13 Illustration of how an elongation of a Li-0 bond takes place [l].
Lithium is the shaded circle, vanadium the filled circles and oxygen
the open circle. The elongation is achieved without displacements
of lithium and vanadium ions.

(a)
A l l M M - i l
M' -11 III

26
In particular. Zn ferrites have an engineering application as a high-frequency magnetic core material [70].
and Cr-doped LiMn204 as a secondary battery [71]. Spinel compounds possess a variety of magnetic
behaviors: especially prominent is the ferrimagnetism in the ferrites (for a review see [72]).
The large electronegativity of oxygen has a tendency to make spinels have ionic-type bonds. In
general, this tends to yield high resistivity in oxide spinels [1]. When the A cation is non-magnetic and
B is integral-valent, this high resistivity can be expected from the viewpoint of the nearest-neighbor
B-B distance. The 3-fold orbital degenerate Ng orbitals are partially filled by valence d electrons for
a spinel with a non-magnetic .4 and a magnetic transition metal element B. These isg orbitals of a fl
ion are extending their lobes toward the nearest-neighboring B ions, as shown in Fig. 1.15. .\ssuming
no conduction electrons, the transport properties are then dependent upon the direct overlaps of these
occupied d orbitals. Over the years Goodenough and his coworkers prepared a series of spinel
compounds (A/V204 where M = Mn. Fe. Mg. Zn. and Co) [73] and studied how the V'-V distance
influences their electronic transport properties. In the order of the metal elements A/ listed in the
Table 1.4. the activation energy decreased as the V'-V distance decreased in these semiconducting com
pounds. suggesting that V iog wavefunctions overlap more. By observing this decreasing activation
energy, they established an estimate of a critical V-V distance Rc below which the transport is trans
formed from semiconductive to metallic. The most recent estimate of this distance is = 2.90(1).A.
for V"*"^ [74]. The value of the nearest neighbor V-V distance in LiV204. calculated from the lattice
parameters at T = 295 K and 4K [18]. are 2.913 and 2.909 A. respectively, which is on the verge of
the transition, and. in fact. LiV204 is a metal [3] (also see Fig. 1.2). However, it is not clear if this
approach of the critical V-V distance is appropriate for LiV204 since it is not a purely V"""^ system. In
this mi.xed-valence system it appears trivial that LiV204 is a metal by the reasons of the non-integral
valence at crystallographically equivalent V sites, as already mentioned. The question is why LiV204
does not distort to a lower symmetry structure containing a static distribution of V"'"^ and V"'"'.
Reviews of the past work on LiV204
In spite of being a metal (see Fig. 1.2). LiV204 exhibits strong temperature dependence in its
magnetic susceptibility, indicating strong electron correlations. In all work reported before 1997, xi^)
was found to increase monotonically with decreasing T down to 4 K and to approximately follow
the Curie-Weiss law. as shown in Fig. 1.3 [2. 5, 6, 7. 8, 9]. Kessler and Sienko [5] interpreted their
susceptibility data as the sum of a Curie-Weiss term 2C/(T — 0) and temperature-independent term
\o = 0.4 X lO'^'crnVmol. Their Curie constant C was 0.468cm^ K/(moIV), corresponding to a V"*"^ g-

27
A—site # B—site (3 Oxygen
Figure 1.15 Spatial directions of the d orbitals of a 5 cation in a spinel AB20^
(from [20]).

28
Table 1.4 Physical properties of vanadium spinels, ao is
the lattice parameter, and "V-V" is the distance
between a nearest vanadium pair (both at room
temperature), q is the activation energy from
resistivity measurements for 113-473 K. A num
ber in parentheses is the error in the last digit
of a quantity (reproduced from [73]).
Formula ao (A) V-V (A) q (eV)
.\InV'2 0.i 8.522(2) 3.013 0.37(1)
FeV'204 8.454(2) 2.990 0.25(1)
MgV204 8.418(2) 2.976 0.18(1)
ZnV204 8.410(2) 2.973 0.16(1)
CoV'204 8.407(2) 2.972 0.07(1)
factor of 2.23 with spin S = 1/2. The negative Weiss temperature 6 = —63 K suggests antiferromagnetic
(.•\F) interactions between the V spins. However, no magnetic ordering was found above 4.2 K. This may
be understood in terms of the possible suppression of long-range magnetic ordering due to the geometric
frustration among the AF-coupled V spins in their tetrahedra network. Similar values of C and 6 have
also been obtained by subsequent workers [2. 6. 7. 8. 9]. as shown in Table 1.5. This local magnetic
moment behavior of LiV'204 is in marked contrast to the magnetic properties of isostructural LiTi204
which manifests a comparatively temperature independent Pauli paramagnetism and superconductivity
[Tr < 13.7 K) [4].
Strong electron correlations in LiX'oO^ were inferred by Fujimori et al. [75. 76] from their ultraviolet
(UPS) and x-ray (XPS) photoemission spectroscopy mecisurements. .\n anomalously small density of
slates at the Fermi level was observed at room temperature which they attributed to the effect of
long-range Coulomb interactions. They interpreted the observed spectra assuming charge fluctuations
between (V"'"'") and d' (V^""") configurations on a time scale longer than that of photoemission
(~ 10~^^sec). Moreover, the intra-atomic Coulomb interaction energy. U. was found to be ~ 2eV.
This value is close to the calculated width of the <2g conduction band for LiTi204. W ~ 2eV [77].
From these observations, one might infer that i' ~ for LiV204, suggesting possible proximity to a
metal-insulator transition.

29
Table 1.5 Lattice parameter ao- oxygen parameter u. and magnetic parameters
\o. C and 6 reported in the literature for LiV204. The u values are
shown using the second setting for the space group FdSm from the
International Tables for Crystallography. Vol. .4. [68] The "T range"
is the temperature range over which the fits to the susceptibility data
were done. \o is the temperature-independent contribution. C is the
Curie constant and 6 is the Weiss temperature. The error in the last
digit of a quantity is given in parentheses. Unless otherwise noted,
all measurements were done on polycrystalline samples.
ao u T range \o C e Ref.
(A) (K) / i n - 6 c m ^ \ V moi LiV-,04 '
j cm^ K \ ' mot V ' (K)
8.22 [78]
8.2403(12) 0.260(1) [79]
8.240(2) [80!
8.22 4.2-308 37 0.468 -63 [o!
8.240(2) 0.253(1) [81]
8.25'^ [82]
8.255(6) 0.260 50-380" 37 0.460 -34 [-] 50-380° 37 0.471 -42 [-]' 80-300 43 0.441" -31" [«]
8.241(3)" 80-300 43 0.434"
0.473
-39" [9]
[6]
8.235 10-300 0 0.535 —35.4 [2]
8.2408(9) 100-300 230 0.35 -33 [83]
"This value was digitized from the published figure. 'Single crystal susceptibility data, corrected for the contribution of 10% V^Ot.

30
2 Overview of LiV204: A HEAVY FERMION TRANSITION METAL
OXIDE
The text of a paper published in Physical Review Letters^
S. Kondo." D. C. Johnston.- C. A. Swenson." F. Borsa." A. V. Mahajan.--^ L. L. Miller.- T. Gu.-
.A.. I. Goldman." M. B. Maple.D. A. Gajewski,'' E. J. Freeman.'' N. R. Dilley."' R. P. Dickey.'^
J. Merrin.^ K. Ivojima.^ G. M. Luke.^ Y. J. Uemura.^ 0. Chmaissem.^-' and J. D. Jorgensen'
Abstract
A crossover with decreasing temperature T from localized moment magnetism to heavy Fermi liquid
behavior is reported for the metallic compound LiV204 with the fee normal-spinel structure. .At T =
IK. the electronic heat capacity coefficient 7 TH 0.42J/molK- is exceptionally large for a transition
metal compound, the Wilson ratio ss 1.7 and the Korringa ratio K 0.7. Our sample with the lo%vest
level of paramagnetic defects sho%ved no static magnetic order above 0.02 K. Superconductivity was not
observed above 0.01 K.
Introduction
The current interest in highly correlated electron systems has been sparked by several discoveries:
These include /-electron intermetallics with heavy Fermi liquid (FL) ground states [heavy fermion
(HF) compounds] [33, 35] or non-FL ground states [84], and high Tc cuprate superconductors. The
above HF /-electron compounds (e.g.. CeAla, UPta) have enormous electronic heat capacity coefficients
7{r) = C(T)/T ~ IJ/molK", where C(T) is the electronic heat capacity, from which quasiparticle
'Reprinted with permission of Phys. Rev. Lett. 78, 3729 (1997). ^Ames Laboratory and Department of Physics and Astronomy. Iowa State University, Ames. Iowa 50011 ^Permanent address: Department of Physics, Indian Institute of Technology, Powai, Bombay 400076, India Department of Physics and Institute for Pure and Applied Physical Sciences, University of California at San Diego,
La Jolla. California 92093 ^Physics Department. Columbia University, New York, New Yorit 10027 ® Science and Technology Center for Superconductivity, Argonne National Laboratory, Argonne, Illinois 60439 ' Materials Science Division. Argonne National Laboratory, Argonne, Illinois 60439

31
effective masses of several hundred times the free electron mass have been inferred. In this Letter, we
report the discovery of HF behavior in the transition metal oxide Li\'204. To our knowledge, this is
the first report of a (f-electron material e.xhibiting HF behavior characteristic of those of the heaviest-
mass /-electron systems. In such systems a high and narrow (~ lOmeV) peak occurs at low T in the
quasiparticle density of states V near the Fermi energy EF- a many-body effect [33. 35]. The large ViEr *
is reflected in a large nearly T-independent magnetic spin susceptibility Y®*"" and - compared with the
respective predictions of conventional band structure calculations [33. 35]. The normalized ratio of these
two quantities, the Wilson ratio Rw. is on the order of unity as in conventional metals (FLs). where
R\v = is Boltzmann's constant and pe is the Bohr magneton. However, at higher
T the !'(£') peak height decreases strongly [33. 35]. on the scale of a low characteristic temperature
~ I-IOOK. This results in a corresponding strong decrease in 7 with T. as we observe for LiV204
above ~ 4K. but which is not observed for conventional metals or. to our knowledge, reported for any
metallic oxide in which 7 is enhanced by proximity to a metal-insulator phase boundary.
LiV204 is metallic [3] with the fee normal-spinel structure [78, 79]. containing equivalent \' ions in
slightly distorted octahedral coordination by O. LiVn04 mzmifestly exhibits strong electron correlations
(local moment magnetism). The magnetic susceptibility \(T) (4.2-308K) was found to be the sum of
a T-independent term \o = 0.4 x IO~''cm^/mol and a Curie-Weiss term C/(T — 9) due to local
magnetic moments [2. 5. 6]. The Curie constant C is consistent with a spin S = 1/2 with ^-factor
2.23. The negative Weiss temperature 6 = —63 K indicates antiferromagnetic (AF) \' spin interactions.
However, no evidence for magnetic ordering above 4.2 K was found. The local moment behavior strongly
contrasts with the relatively ^-independent Pauli paramagnetism and superconductivity (Tc < 13.7 K)
of isostructural LiTi204 [4]. Band structure calculations for LiTi204 yield a t2g conduction band width
~ 2e\' [77]. Photoemission measurements on LiV204 revealed strongly correlated electron behavior
with a V intra-atomic Coulomb repulsion parameter U ~ 2eV ~ W [75]. The nature of the ground
state is unknown up to now.
We carried out crystallography, electrical resistivity p, magnetization .V/. heat capacity Cp, 'Li nu
clear magnetic resonance NMR and positive-muon spin relaxation (/iSR) measurements on LiV'204.
We report a crossover with decreasing T from the local moment behavior to heavy FL behavior. We
find an enormous 7(1 K) « 0.42J/molK-. much larger than those of other metallic transition metal
compounds, e.g.. Yi_rScrMn2 (~ 0.2 J/molK* [16]) and V^-yOa (~ 0.07J/molK- [85]). The magni
tudes and T-dependences of 7 and \ and the T-dependence of p [3] for LiV204 are remarkably similar
to those of the HF /-electron superconductor UPta (Tc = 0.54 K) [33, 35, 39, 86, 87]. We infer that

32
paramagnetic defects seen in \ ( T ) can strongly influence tiie C p { T ) and spin dynamics of Li\'oO^ below
1 K .
Sample preparations
Polycrystalline LiV^O^ samples were made using techniques in [4] and were single-phase or very
nearly so by x-ray and neutron diffraction. Neutron diffraction measurements were carried out at the
Intense Pulsed Neutron Source at Argonne National Laboratory. M(H.T) data (H = applied magnetic
f i e l d ) w e r e o b t a i n e d w i t h S Q U I D a n d F a r a d a y m a g n e t o m e t e r s a t A m e s a n d L a J o l l a . a n d C p ( H . T )
data using heat-pulse calorimeters at Ames and La Jolla. 'Li NMR measurements were done at 17
and 135 MHz with a pulse Fourier transform spectrometer; the recovery of the nuclear magnetization,
measured by the echo signal after a saturating radio frequency pulse sequence, was exponential. /iSR
time spectra in zero and longitudinal H were obtained at TRIUMF.
X-ray and neutron diffraction measurements
X-ray and neutron diffraction data on three LiV204 samples revealed no distortion from the spinel
structure (space group Fdim) between 295 and 9K. Rietveld refinements of the neutron data for
sample 5 yielded the lat t ice and oxygen parameters OQ = 8.23932(3) A. x = 0.26125(2) at 295 K and AN
= 8.22694(3) A. x = 0.26109(2) at 12 K. p(T) measurements down to 0.01 K showed no evidence for
superconductivity.
Magnetic susceptibility measurements
\(7') data from 2 to 400 K are shown for LiVoO^ sample 1 in Fig. 2.1. Above ~ 50 K. Curie-Weiss-
like behavior is seen as previously reported. We assumed that \(T) = where \^o'"{T)
was the high-T series expansion to sixth order in l / T of the 5=1/2 nearest-neighbor AF Heisenberg
model for the V sublattice of the spinel structure [88]. The fit parameters depended on the T region
of the fits as previously found assuming X^oc'^lT) = Cf(T — 0) [7, 89]. Our fit for the range 50-400K
(solid curve in Fig. 2.1) yielded \o = 0.57 x 10~''cm^/mol, g = 2.19 and 6 = —40K. similar to values
cited above.
Contrary to previous reports [2. 5. 6], we find that x ( T ) becomes nearly independent of T below
~ 30 K. with a shallow broad maximum at « 16K (Fig. 2.1 inset). Field-cooled and zero-field-cooled
M(H = 10 G. T) data above 2 K showed no evidence for spin-glass ordering. A Curie-like Cmp/T upturn

33
16
1 4
9 i
v
. \
1 0 2 0 3 0 4 0
T(K)
LiV,0, 2 4
- 0 . 2 5
0.20
0 . 1 5
0.10
0.05
0 50 100 150 200 250 300 350 400
T(K)
Figure 2.1 \ = M / H ( H = 10 kG) vs. T for LiV204 sample 1 (•) and ^Li K ( T )
for sample 2 (open squares, right-hand scale). The solid curve is a
theoretical fit to x{T) for T > 50K. The dashed curve and filled
squares (inset) denote the intrinsic x(T) of LiV204 inferred from
M{H.T) data for samples 1 and 4, respectively (see text).

34
in \(T) is seen in Fig. 2.1 below ~ 5 K. found to be sample-dependent. M ( H < 55 kG) isotherms above
15 K were linear, but at 2K exhibited negative curvature which increased with increasing Cimp in various
samples, indicating that this curvature and the Curie term arise from paramagnetic impurities/defects.
The M(H.T) data yielded the impurity 5,mp 2 and 5,nip % 2. with concentrations 0.03. 0.35. 0.15.
0.08. and 0.70 mol% in samples 1-5, respectively. The intrinsic \{T) for LiV204 inferred by subtracting
the impurity contributions in samples 1 and 4 is shown in the inset of Fig. 2.1. where \(0.4-2K) =
0.0100(2) cm^/mol.
'Li nuclear magnetic resonance measurements
The 'Li K { T ) (Fig. 2.1) approximately scales linearly with \(T) as found above 30 K in [2. 90].
l/Ti{T) (Fig. 2.2) shows an unusual maximum (at 30-50K). also seen in -'Al l/Ti(T) for the HF
compound CeAla [91] with 7 ~ 1.6 J/molK" [33. 35]. evidently reflecting the crossover from FL (low T)
to local moment (high T) behaviors. From Fig. 2.2 inset. l/T\ m (2.4sec~'I\~')^- From Fig. 2.1. A'(T)
is nearly constant (% 0.17%) below 30K. Thus, the Korringa ratio K'TiT/Su- where 5LI = 1-74 x
10'" sec K. is constant (ss 0.7) below 4 K. These low-T observations are consistent with expectations for
a FL. Our 1.6-4.2K value of ' Li IfTiT in LiV204 is a factor of ~ 6000 greater than that in LiTi204
[92. 93]. implying an enhancement of the dressed density of states P(£"f) by a factor \/6000 ~ 80.
However, comparison of this ratio of 80 with the ratio ~ 20 of the 7( 1 K) values for the two compounds
(below) suggests a difference in the 'Li hyperfine coupling constants.
Heat capacity measurements
Cp(T) data up to 80 K for LiV204 are shown in Fig. 2.3(a). Also shown are data for the isostructural
nonmagnetic insulator Li4/3Ti5/304 obtained to estimate the lattice contribution. After multiplying
the T scale of Cp{T} for Li4/3Ti5/304 by 0.941 to take into account the different masses of Li4/3Ti5/304
and LiV204 and subtracting this corrected lattice contribution from the data for LiV204, the inferred
electronic heat capacity ACp(T) for LiV"204 was obtained (inset). ACp(7") shows a broad peak near
16 K. and a distinct additional contribution above ~ 25K also seen in LiTi204 [94]. Figure 2.3(b)
shows 7(7") = \Cp(T)/T below 30 K. where a strong increase with decreasing T is observed. We
obtain 7(1 K) % 0.42 J/molK". about twenty times larger than in LiTi204 [94]. Using ,y®'""(1K) =
O.Olcm^/mol, the Wilson ratio Rw{l K) ss 1.7. These low-T results indicate heavy FL behavior [33. 35].
In this interpretation, the nearly T-independent x{T) and K(T) for T ~ 30K in Fig. 2.1 "is a reflection

35
I o (D CO
I—I—rj-T—I—I—I—I—I—I—I—I—I—I—I—I—I—I—I—I—I—I—I—I—I—I—I—I—I
uv,o, i 2 4
L NMR
J / T T = 2 . 5 4 s - ' K
1/T T = 2.25 s' K
0 50 100 150 200 250 300
T(K)
Figure 2.2 ^Li l / T i vs. T for LiV204 samples 1 (filled triangles), 2 (•) and 4
(o). The lowest-r data are shown in the inset, along with proportional fits.

36
of the disappearance of the V local moments.
"(T = 1.2-5 K) for LiV'204 was fitted by the prediction for the 5 = 1/2 Kondo model ( R w =
2) [33. 35]. yielding a Kondo temperature TK = 27.5K [solid curves in Figs. 2.3(a) inset and 2.3(b)].
This single-parameter fit extrapolated to higher T also describes well the ACp(r) data up to ~ 30 K.
including the magnitude and temperature of the broad maximum near 16 K [Fig. 2.3(a) inset]. .A. I-
10 K fit of-'(T) by the FL prediction liT) = 7(0) +ST' ln(T'/ro) [33. 35] is shown by the short-dashed
curve in Fig. 2.3(b). for which 7(0) = 428mJ/molK-. S = l.SmJ/molK"^ and To = 25K. parameters
remarkably similar to those of UPta [39. 86]. •f(T) is also consistent with theory [95] for a three-
dimensional AF-coupled quantum-disordered FL. A 1-10 K fit by the theory [long-dashed curve in
Fig. 2.3(b)] gave parameters [95] A' = 3. 70 = 810mJ/molK-. r = 0.78 and T' = 9.7 K.
Low-F 7(T) data and the above theoretical fits for LiV204 sample 3 are shown in Fig. 2.3(c). The
data e.xhibit a plateau with 7 % 0.42J/molK" from ~ 1.3-0.8 K and an upturn at lower T. The
-;{T) data in Fig. 2.3(c) for sample 5. which contains a higher level of magnetic defects (above), increase
monotonically down to % 0.5 K where the data appear to exhibit a maximum with value » 0.6 J/mol K".
Below ~ 2K. 7(1". H = 20 kG) for sample 5 in Fig. 2.3(c) is suppressed relative to •)(T. H = 0). The
H = 0 r e s u l t s i n d i c a t e t h a t t h e p r e s e n c e o f m a g n e t i c d e f e c t s i n c r e a s e s C p ( T ) . e s p e c i a l l y a t l o w T .
Muon spin relaxation measurements
Zero-field (ZF) /iSR spectra for sample 1 exhibit a single-exponential decay exp(—</7"i) (after cor
rection for effects due to nuclear dipolar fields). 1/Ti at 20mK in ZF and in longitudinal field LF =
50 G show little difference (see Fig. 2.4 inset), indicating that the depolarization is mostly due to fluctu
ating dynamic local fields. The average fluctuation rate at 20 mK, obtained from the LF dependence, is
f ~ ^ X 150 G ~ 12 where 7^ is the positive muon gyromagnetic ratio. The instantaneous
random local field inferred from 1/Ti ~ is then Hr ~ 30G. This Hr is about 50 times
smaller than Hr ~ 1.5 kG which we observed in the AF state of isostructural ZnV'oO^. suggesting that
Hr in LiV204 sample 1 is due to dilute (% level) paramagnetic impurities. The l/Ti(T) in Fig. 2.4
indicates slowing down of impurity spin fluctuations with decreasing T. yet we found no signature of
static spin freezing in sample 1 down to 20mK. In contrast, the ZF-/1SR spectra in sample 3 (with a
larger Curie term in \) showed two-component relaxation below T ~ 0.8 K, with a fast 2/3 component
and slow 1/3 component, characteristic of static spin freezing. This behavior correlates with the Cp
anomaly at T ~ 0.8K observed for sample 3 in Fig. 2.3(c). Unfortunately, l/Ti for due to itinerant
HF quasiparticles. as inferred from NMR in Fig. 2.2. is not clearly visible in Fig. 2.4, overshadowed by

37
60
o E
T, . 27.5 K
a. O
20
100 40 80 T(K)
400
1 300 —5
E. H-
O°"200 <
5 10 15 20 25 30 T(K)
650
600
550 o E
500
^^0.450 O
400
^®S.O 0.5 1.0 1.5 2.0 2.5 T(K)
Figure 2.3 (a) Heat capacity C p vs. temperature T for LiV204 sample 2 (•)
and Li4/3Ti5/304 (o). Inset; electronic contribution ACp{T) for
sample 2 (•). The solid curve is a 1-5 K fit by Koado theory.
(b) A C p { T ) / T = 7(T) for sample 3 below 30K (o) (the data for
samples 2 and 3 are nearly identical), (c) ^{T < 2.5K) data for
sample 3 from Ames [o from (b)] and La Jolla (•), and for sample 5
it H = 0 and 20kG from La Jolla (squares). The curves in (b) and
(c) are fits to the Ames data for sample 3 above 1.2 K by theories
for Fermi liquids (see te.xt).
L1V,0,#3 .
H = 0
20 kG
UV,0, #5
H = 0
UV,0. #3
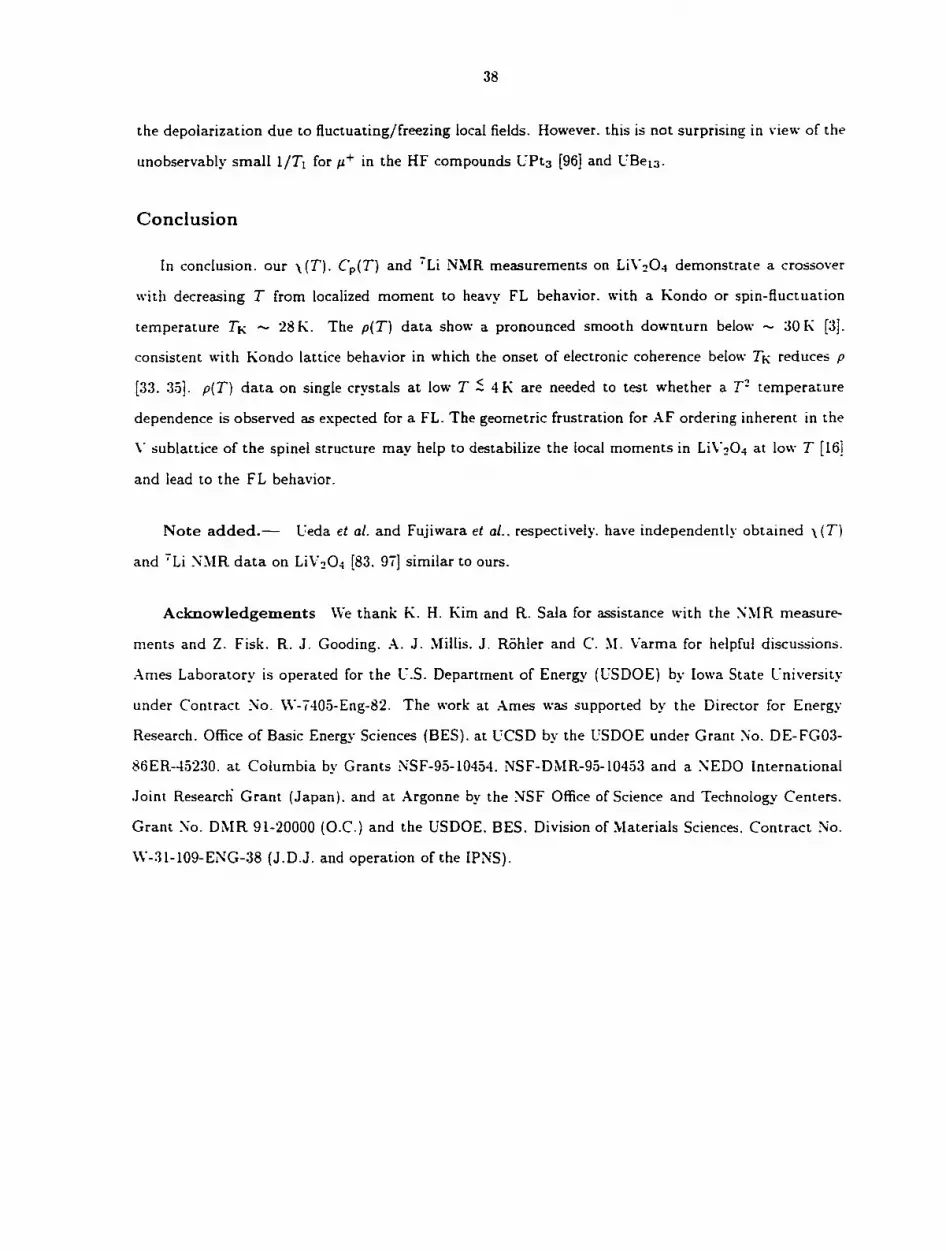
38
the depolarization due to fluctuating/freezing local fields. However, this is not surprising in view of the
unobservably small 1/Ti for in the HF compounds L'Pta [96] and UBeia-
Conclusion
In conclusion, our \ ( T ) . C p { T ) and 'Li NMR measurements on LiV204 demonstrate a crossover
with decreasing T from localized moment to heavy FL behavior, with a Kondo or spin-fluctuation
temperature Fk ~ 28 K. The p(T) data show a pronounced smooth downturn below ~ 301\ [3j.
consistent with Kondo lattice behavior in which the onset of electronic coherence below TK reduces p
[33. 35]. p{T) data on single crystals at low T ~ 4K are needed to test whether a T- temperature
dependence is observed as expected for a FL. The geometric frustration for .•VF ordering inherent in the
\' sublattice of the spinel structure may help to destabilize the local moments in LiV'204 at low T [16]
and lead to the FL behavior.
Note added.— Ueda et al. and Fujiwara et al.. respectively, have independently obtained \(T")
and ' Li NMR data on LiV'204 [83. 97] similar to ours.
Acknowledgements We thank K. H. Kim and R. Sala for assistance with the .\MR measure
ments and Z. Fisk. R. J. Gooding. .•\. J. Millis. J. Rohler and C. M. Varma for helpful discussions.
.\mes Laboratory is operated for the U.S. Department of Energy (USDOE) by Iowa State L'niversity
under Contract No. \V-7405-Eng-82. The work at Ames was supported by the Director for Energy
Research. Office of Basic Energy Sciences (EES), at UCSD by the USDOE under Grant No. DE-FG03-
86ER-45230. at Columbia by Grants NSF-95-I0454. NSF-DMR-95-10453 and a NEDO International
Joint Research Grant (Japan), and at Argonne by the NSF Office of Science and Technology Centers.
Grant No. DMR 91-20000 (O.C.) and the USDOE. EES. Division of Materials Sciences. Contract No.
W-3I-109-ENG-38 (J.D.J, and operation of the IPNS).

39
LiV^O^ ^SR
CO
B "cS QC
CO X i5
CD QC
Sample 1 T = 20 mK
LF
B 0.6
0.2
0.0 0.5 1.0 1.5 2.0 2.5
Magnetic Field (kG)
H = 0
Figure 2.4 Muon spin relaxation (/iSR) rate in LiV204 obtained in /f = 0
vs. temperature T (main figure) and vs. longitudinal field (LF)
at T = 20mK (inset). Rates for sample 1 at all T and LF
(•) and sample 3 for T ~ 0.8 K (o) represent l/Ti in fits of
the /iSR time t spectra by exp(—t/Ti), while two rates for sam
ple 3 for T ~ 0.8K represent l/Tj (A) and 1/Ti (o) in fits by
0.67 exp(-</T2) + 0.33 exp(-</ri).

40
3 SYNTHESIS AND CHARACTERIZATION
Synthesis of LiV204 and Lii+xTi2_r04 (2" = 0 and 1/3)
LiV204 preparations
Polycrystalline samples of LiV204 were prepared using conventional solid-state reaction techniques
with two slightly different paths to the products. The five samples used in the paper b\- Kondo et al.
(samples I through 5) (see Chapter 2) [11] were prepared by the method in [4]. Two additional samples
(samples 6 and 7) were synthesized by the method of Ueda et al [83]. Different precursors are used
in the two methods: "Li^VOa 5" (see below) and Li3V04, respectively. Both methods successfully
yielded high-quality LiV204 samples which showed a broad peak in the observed susceptibility
at % 16 K. Here only the first synthesis method is explained in detail, and the reader is referred to [83]
for details of the second method.
The starting materials were Li2C03 (99.999%. Johnson Matthey). V2O3. and V'oOs (99.9959t.
Johnson .Matthey). Oxygen vacancies tend to be present in commercially obtained V'203 [98]. Therefore,
the \'205 was heated in an oxygen stream at 500-550°C in order to fully oxidize and also dry it. \'203
was made by reduction of either \'205 or .\'H4V03 (99.995%. Johnson Matthey) in a tube furnace
under 5 % H2/95 % He gas flow. The heating was done in two steps: at 635 "C for % 1 day and then at
900-1000 "C for up to 3 days. The oxygen content of the nominal Vo-yOs obtained was then determined
by thermogravimetric analysis (TGA. see below). The precursor "Li2V03 5" (found to be a mixture
of Li3V04 and LiVOs from an x-ray diffraction measurement) was prepared by heating a mixture of
Li2C03 and V'205 in a tube furnace under an oxygen stream at % 525 °C until the expected weight
decrease due to the loss of carbon dioxide was obtained. Ideally the molar ratio of LioCOs to V2O5
for the nominal composition Li2V'03 5 is 2 to 1. A slight adjustment was, however, made to this ratio
according to the actual measured oxygen content of the V2_y03 {y ~ 0.005 to 0.017) so that the final
product is stoichiometric LiV204. This precursor and V2_y03 were ground thoroughly inside a helium-
filled glovebox. The mixture was then pelletized. wrapped in a piece of gold foil, sealed into a quartz

41
tube under vacuum, and heated between 570 "C and 700°C for ~ 2 weeks. The as-prepared samples
were all removed from the oven at the final furnace temperature and air-cooled to room temperature.
For samples 2 and 3 additional heating at a higher T = 750"C was given (with a repeated sequence of
grinding, repelietizing and reheating for sample 2). From % 725 °C different methods of cooling, liquid-
nitrogen or ice-water quenching or slow-oven cooling, were applied to pieces from sample 2. yielding
samples 4. 4A and 4B. respectively.
LiTioO^ and Li4/3Ti5/304 preparations
Polycrystalline LiTi204 and Li4/3Ti5/304 samples were synthesized in essentially the same way
cis for LiV204. using solid-state reaction techniques [4]. TiOo (Johnson .Vlatthey. 99.99%) was dried
under a pure oxygen stream at 900"C before use. This was mixed with Li2C03 (.Alfa. 99.9999^) in an
appropriate ratio to produce either Li4/3Ti5/304 or a precursor "LiTiOo.a" for LiTi204. The mixture
was then pressed into pellets, and heated at 670 "C in a pure oxygen atomosphere for 1 day. The
weight loss due to release of COo was within 0.04 wt.% of the theoretical value for LiTi02 3. However,
for Li4/3Ti5/304 additional firings at higher temperatures (up to 800°C). after being reground and
repelletized. were necessary. LiTi204 was prepared by heating pressed pellets of a ground mixture of
the LiTi02,5 precursor and TiiOs in an evacuated and sealed quartz tube at 700 °C for one week and
then air-cooling. The Ti203 was prepared by heating a mixture of Ti02 and titanium metal powder
(.Johnson .Matthey) at 1000 "C for one week in an evacuated and sealed quartz tube.
Characterization
Using a Rigaku Geigerflex difFractometer with a curved graphite crystal monochrometer. .\-ray
diffraction patterns were obtained at room temperature with Cu KQ radiation. Rietveld analyses of the
diffraction patterns were carried out using the angle-dispersive x-ray diffraction version of the RIETAN-
973 program [99].
TGA measurements were done using a Perkin-EImer TGA 7 Thermogravimetric Analyzer. Oxygen
contents of the samples were calculated from weight gains after heating in an oxygen fiow to 540-600 ®C
for LiV'204 and 620"C for V2_y03, assuming that the oxidized products contained vanadium as V"^°.
X-ray diffraction measurement results
X-ray diffraction patterns of our LiV204 samples revealed that the samples were single-phzise or very
nearly so. Figure 3.1 shows the diffraction pattern of sample 7 which has no detectable impurities. The

42
I I I
5
4
3
2
1
o o
m
o CM CNJ CVI
CNJ C\J
UL
CD CO
CO o m ^
in
cvj CM
CO m
LiV O 2 4
Sample 7 -
CO CM CO CM in (o
in in
•tr R~ ^ r^
\ il
m LO
S !£. N. . CM CO ,—. m CO in o r>- <o in o
' « '
20 40 60 2 0 ( ° )
80 100
Figure 3.1 X-ray diffraction pattern of LiV204 sample 7. The spinel-phase peaks are indexed as shown.

43
20 30 40 50 60 70 100
50
^ 0
75
50
25
1 1 1 1 1 Sample 1 c c
• £
1 1 T-3" Vi
' I '
1 yu^LijiJi
1 1
» 1 1 1 1
1 '
Tfwfn'^
Sample 2
• t 1 1 1 1 t 1
1 '
•
1 1 1 1
1 '
wl(^
Sample 7
_i I 1 1 1
/ o ^ CM
1 1 1
' 1 '
'mluir
1
Wyy
1 1 1 1 1 1 ' 1 t
20 30 40 50
2 0 ( ° )
60 70
Figure 3.2 Expanded plots of the X-ray patterns of samples 1 (top), 2 (middle)
and 7 (bottom). Indexed peaks are those of LiV204 spinel phase.
Sample 1 has V3O5 impurity (filled circles), whereas sample 2 h£is
V2O3 impurity (filled squares). Sample 7 has no impurity peaks
except possibly the very weak unidentified one marked with a star.

44
nine samples described in detail in this dissertation are categorized into three groups in terms of purity;
essentially impurity-free (samples 3 and 7). V'aOs impurity (samples 1. 4 and 6) and \'203 impurity
(samples 2. 4A. 4B and 5). The presence of these impurity phases is detected in magnified views of
the diffraction patterns as shown in Fig. 3.2. The powerful structural refinement method "Rietveld
analysis" is introduced to some extent in the next section. The refinements were carried out for all nine
LiVoO^ samples and two Ti spinel samples, and the results for the different samples are discussed and
compared.
Introduction of Rietveld analyses
Introduction
The so-called Rietveld method was introduced by Dr. Rietveld in the 1960s [100. 101]. The real,
potential power of the method was not realized until years after his invention. The history of the
method and its versatility are detailed in an excellent review entitled The Rietveld Method [102]. The
discovery and the subsequent intense investigation of high-temperature superconductors helped the
method to prevail as the necessary tool for structure analysis studies among solid-state physicists all
over the world. It had been thought that powder-sample diffraction data could not give as much
information as single-crystal data. However, in combination with the Rietveld method, powder-sample
data were able to show its superiority for some cases. For e.xample. in the early stage of studying the
high-temperature superconductor YBaoCuaOr-^. the sample quality was not very good, because it had
two phases (superconducting orthorhombic and non-superconducting tetragonal phases). It was the
powder neutron diffraction data analyzed by the Rietveld method that revealed for the first time that
the distribution of oxygen and its occupancy at the copper-oxygen plane cause the creation of the two
different phases in the compound [103]. Meanwhile, a single-crystal X-ray diffraction study on the same
compound failed to identify the important role of oxygen in the one-dimensional copper-oxygen chain,
mainly because of the presence of twin structure in the crystal [104]. The appreciation of the Rietveld
method and the development of one of the Rietveld method programs. RIETAN [99]. are reviewed by
Izumi [105].
Some basics of the RJetveld method
In a typical angle-dispersive, fixed-wavelength X-ray powder diffraction measurement, thousands of
data points are collected in steps of 26 (Bragg) angle, normally 0.01° to 0.05°. For many simple analysis
methods, only the peak angles are utilized to identify the structure of a sample. The strong advantage

45
of the Rietveld method was due to its capability of distinguishing structure parameters in greater detail.
Moreover, it makes use of an entire diffraction pattern: in other words, it uses all data points including
background signals for analyses. For instance, in this work with LiV'204 it was important to have
some knowledge of the oxygen parameter u. A few. rather simple computer programs for structure
refinements that were tried required the parameter u as an input. Hence, it would be tedious to iterate
the whole process by trial-and-error to narrow down possible values of u in such programs.
In the follotving section, some basics of the Rietveld method are introduced, which essentially follow
the discussions by Young [102] and Izumi [106].
The principle of the method is to minimize the weighted sum of squared residuals
5R,et(-r) = ^ - /.(f)]- . (3.1) t
by altering variable parameters (ri. xt. • • •) in x. where i is a data point number, u', the weight equal
to l/yi. Ui the observed intensity, and /, the calculated intensity for the /-th point. The calculated
intensity is then defined as the sum of Bragg reflection and background terms like the following model
function
/. = <i[2Bi)A(29i)sY,mK\FK\-PKL{2eK]0(26i - IOK) + !/b(2e.) . (3.2) K
where $(20,) is the incident intensity. .4(20,) the absorption factor, s the scale factor. K the Miller
indices for a Bragg reflection, mi^ the multiplicity. FK the structure factor. the preferred orientation
function. L{'26K] the Lorentz and polarization factors, and o(20, — 20^') the profile function. The
structure factor for a reflection with Miller indices K = hkl is defined by
F K = g j f j T j exp[2ffi(/iij + k y j + I z j )] . (3.3) J
where j is the site number, gj the occupancy, fj the atomic scattering factor, Tj the temperature
factor, and xj. t/j and Cj the fractional coordinates. The temperature factor for the isotropic thermal
displacement case is
' s i n 0 K TJ = exp - B j
X (3.4)
where Bj is the isotropic thermal-displacement parameter. The absorption factor .4(20, ) is constant for
a typical X-ray diffractometer with a flat sample (so-called Bragg-Brentano type), so it is irrelevant for
the refinement processes. The Lorentz-polarization factor L(26k] is
nna ^ \ + COS'2Q COS'26K T- , 3.0)
sm 2 6 f c sm 26k
when a monochrometer is employed and Q is the diffraction angle of the monochrometer.

46
Most of the Rietveld method programs adopt either the pseudo-Voigt function [107. 108] or the
Pearson VII function [109] for the profile function o- The Rietveld-method computer program utilized
in this work is RJETAN-97J by Dr. Izumi at the .National Institute for Research in Inorganic Materials
(.NIRIM) in Japan [99. 110]. His RIETAN-97i program utilizes the pseudo-V'oigt function of Thompson.
Cox and Hastings [107] which is a combination of the Lorenlz (OL) and Gaussian functions {oc) with
the fraction ij of the former.
o{620) = r{OL{d20) + (l —
2 = n - ~
.. , 2\/ur2 - H f c
where t] is given by Thompson et al. [107
(3.6)
1.36603(^) -0^4--19(^)" + 0^UU6(^)' . (XT)
where 626 = 20, — 26n • Hk is the full-width-at-half-maximum (FVVHM) of the profile function, and
HKL (HKG) 'S the FWHM of the Lorentz (Gaussian) function. They numerically obtained the following
relat ion among HK- H^CL and HKG
HK = (H]iG + 2.69269 HI-cHkl + 2.42843//|.C^A-L + 4.47163/^^-^//^-^
+ 0 m S A 2 H K G H ' i ^ i ^ + . ( : i . 8 )
Therefore, once HKG and HKL are determined, both 77 and can be calculated by Eqs. (3.7 and
3.8). These two FWHMs can be represented in terms of physically meaningful parameters
Z/a'c = [8 ln2(t'tan" ^ tan + H'+ Psec" 0A')]" • (3-9)
and
HKL = (A' + A'e coso^-)sec0/1 + (V + V't cosoa') tan0/v- . (3.10)
C. i' and are parameters for microstrain broadening, which is proportional to tano/;- (OK is the
angle between the scattering vector and the broadening ajcis). The crystalline size broadening is also
taken into consideration in terms of A". A'e and P. Both A' and Y are isotropic broadening parameters,
whereas the corresponding symbols with the subscript e are anisotropic. \' and W are diffractometer-
dependent.
These profile functions are all symmetric with respect to 626. But due to several unavoidable
reasons [106], the profile shape is normally asymmetric. This is particularity noticeable for low 26 in
which a lower-20 tail of a peak tends to be spread longer. This asymmetry is approximately corrected in

47
the program RIETAN-97J by using the multi-term Simpson's rule integration [111]. This adjustment
involves four refinable parameters (.4,. Z. D, and T,). each of which has a physical meaning. The
details of this adjustment are not described here, but are referred to in the original paper.
For preferred orientation functions. PR-- there are two types of functions available: Sasa-Uda [112.
113]. and March-Dollase [114. 115] functions. The latter has superiority in overall performance for
structural refinement [110].
The background function. yh{'2di). in RIETAN-97J is a finite sum of Legendre polynomials with
a refinable parameter 6„ for each term [110]. Up to 12 background parameters (n = 1-12) can be
employed.
All the refinable parameters in the angle-dispersive version of RIETAN-97J are tabulated in Ta
ble 3.1.
Table 3.1 Parameters that can be refined in the Rietveld analysis
using RIETAN-97J.
Parameters common to all phases
1 Zero-point shift. Z
2 Specimen-displacement parameter. D,
3 Specimen-transparency parameter. T,
4 Background parameters. 6i. 61 612
Parameters assigned to each phase
5 Scale factor, s
6 Profile parameters, f. V. H". P. X. A'^. V. Y^. .A,
7 Preferred orientation parameter, r
8 Lattice parameters, a. 6. c. Q. 3.
9 Fractional coordinates, x j . y j . Z j
10 Thermal-displacement parameter.
"In case of anisotropic thermal displacement cases, the si.x 3,j.
The criteria used to judge the agreement between the observed and calculated intensities for the
entire pattern are various R-factors listed in Table 3.2. R is very similar to the /?-factor which is used
in smgle-crystal structure analysis (R = - l^cl]/|^o|. where FQ and Fc are observed and
calculated structure factors, respectively). Both /?-Bragg and /i-structure factors are model-dependent
since these two use the observed intensities deduced by the model, not the actual observed intensities.
In the Rietveld analysis, it is R„p among the ii-factors that is influenced most significantly by the
fitting agreement. This is because R^p has 5R,et itself (see Eq. 3.1) in the numerator inside the squared

48
bracket. As a direct guide to determine the effectiveness of a given refinement, this R^p is compared
to R^. the statistically estimated minimum Rwp. which can be written
R,= A" - P (3.11)
5 is defined as An S value of 1.3 or less indicates a satisfactory refinement. (5 = 1.0
corresponds to perfect agreement.) Nonetheless, if an 5 value too close to 1.0 is obtained during the
relatively early stages of a refinement, it might suggest either that the diffraction data have poor counting
statistics, or that the background is too high, which may cause R„p to be smaller than necessary. For
further details including the meaning of the Durbin-Watson rf-statistic. see references [102. 116. 117].
Practical know-how on the Rietveld refinements
The Rietveld refinement might appear to be too difficult for inexperienced graduate students. This
fear could be even larger if Rietveld refinement computer programs were not easy to use. or without
helpful and practical manuals. What follows is some practical know-how that was learned through
doing the Rietveld refinements and studying them from related papers and books.
It is quite natural to think that one can get a better quality in the measurement by increasing
the count time and/or the number of measurement steps. However, this improvement cannot go on
indefinitely. When the counting error becomes as small as other kinds of errors, no further improvement
can be made. At this point, further measurements would just be a waste of machine time. This is %-ery
well presented by R. J. Hill in the book The Rietveld Method [117]. If one either increases the count time
or uses a smaller step size. Hill suggests that there is greater benefit to choose the latter. Moreover, as a
rule of thumb, one should aim to have 5000-10000 counts at the maximum intensity, and approximately
1/5-1/3 of the minimum full-width-at-half-maximum (FWHM) of the peaks as the measurement step.
In addition, due caution has to be taken for the width of the slits in the diffractometer. For
instance, when a divergence slit (DS) with a slit width of 1 degree is used in the Bragg-Brentano X-
ray diffractometer with a goniometer radius of 185 mm (as in our Rtgaku machine), for 20 < 20° the
effective area with which incoming X-rays impinge on a fiat sample surface becomes wider than the
usual sample width of 20 mm. In this case, unnecessary reflections from the sample holder material are
recorded, giving uncertainty to the measured intensities. As a reference. Fig. 3.3 explicitly shows the
relation of the DS width to the apparent X-ray width on a sample plate. Therefore, in this work, all
the X-ray diffraction measurements done with DS = 1 ° were analyzed by the Rietveld method without

49
Table 3.2 Numerical citeria of the fitting results (reproduced from Ta
ble 7-1 of Izumi [106]): o", is the standard deviation of the
observed intensity for the ith data point: IK("O") and /A:(C)
are the estimated observed ("o") and calculated integrated
intensities for reflection K. respectively: A' is the number of
data points: P is the number of refinable parameters.
1
/^-weighted pattern
/?-pattern
/?-Bragg factor
/?-structure factor
o — \ o Goodness-of-fit indicator
d = 2-1=2 CTI
Durbin-Watson rf-statistic
^I=L CTI

50
using the data below 26 = 20 °.
Before starting the Rietveld anaysis. one has to have a reasonable starting model for the crystal
structure to be determined. If the structure has been well studied in the past, the available literature
should be used. The Rietveld method will not yield convergent parameters without a good starting
model. In this sense, the method cannot be a versatile, omnipotent structure solver: rather, its maximum
potential power is to pursue and obtain details that cannot be obtained with simpler analysis methods.
Hence, the Rietveld method is a structure refinement program, not a solution program. Initial values of
the diffractometer-dependent values such as V and VV may be pre-determined from a well-characterized
standard material such as silicon powder from NIST. Other parameters such as D,. T, (usually these
two are set to zero). U. X and }' may be started with values determined from a standard, too.
Normally C > 0. V < 0 and VV > 0. but among these three a strong correlation always exists.
Various combinations of the three parameters can give the same Gaussian FWHM. Hence, it is advisable
not to refine all three at the same time in the early stages of refinement. Instead, it is best to fix \ '
to the value determined from a standard sample. Nevertheless, one must start with a combination of
these three parameters so that they give a positive, hence physically meaningful value of HKG for the
entire 26 range. In a similar manner, it can be readily seen that both A' and V must be positive to
make Hm physically meaningful, assuming that the corresponding anisotropic parameters A", and )'e
are set to zero, which is not an uncommon way to begin. Later, if an anisotropic profile is seen on
plotted calculated intensities, set A'? and/or to nonzero values for the first time. Moreover, since
the crystalline-size effect is usually Lorentizan [119]. set P = 0 unless the profile is obviously Gaussian.
It is not desirable to use more background parameters than necessary; an e.xcess of parameters would
simply increase the value of 5 as can be seen from its definition in the table above.
For .\-ray dififraction. the lighter the atom is. the weaker the diffracted intensity. This obviously
makes the Rietveld analysis more difficult. Sometimes for such a light element a value of thermal-
displacement parameter B would become very large, or negative which is unphysical. This can also
happen if an occupancy at a site is very small. Thermal-displacement parameters can readily be a sink
for all other incorrect fitting results, making the value unreasonable. In such a case there is no other
choice than to give up the refinement on B and very often other parameters, too. and to fix them to
literature values if available. In the latter case, if the same element exists at a different site with a larger
occupancy, set both B values to one value with a linear constraint between them. Dr. Izumi's RJETAN-
973 is capable of applying linear and nonlinear constraints between parameters [110]. This fragile state of
thermal-displacement parameters B comes partly from a strong correlation with occupancy parameters.

51
40.0
DS Width l/«dcg. 3S.0
E 30.0
25.0
•o Sample Width 20.0
15.0
10.0
5.0
0.0 60 120 140 160 40 80 100 20 0
26 (degree)
Figure 3.3 X-ray beam width on the sample plate versus the diffraction an
gle 29 using a divergence slit (DS) with different angular widths
for an X-ray diffractometer with a goniometer radius of 185 mm. (excerpted from [118])

52
In general, conventional .\-ray diffractometers are not as capable of determining values of fl as well (the
case of anisotropic thermal-displacement parameters is even worse) as. e.g.. neutron diffraction.
In the Rietveld method, one "switches on" only some of all the refinable parameters at one time.
Until the later stage of refinement, it is never a good idea to turn on all the parameters for refinement.
An important question, therefore, is in what order parameters are supposed to be switched on. \'oung
discusses this issue and makes a suggestion of the order, which is reproduced in Table 3.3 [102]. The
Rietveld method program RIETAN-975 has its unique and fairly reliable function that automatically
selects an order of parameters to be turned on during repetitive refinement cycles. This is very useful
and can save much time.
Table 3.3 .A. suggested parameter turn-on sequence. (Context:
constant wavelength x-ray or neutron powder diffrac-
tometer data.) (reproduced from Table 1.5 of Young
[102])
Parameters Linear Stable Comment Sequence
s Yes \'es Note 1 I
D, No \es Note 2 I
Flat background Yes Yes 2
a. b. c . Q . J. 7 No Yes Note 3 2
More background No Yes(?) Note 4 2 or 3
H" No Poorly Note 5 3 or 4
x.y.; No Fairly Note 6 3
g's and B's No r> Correlated 4 U. 1". etc. No No .Note h Last
No .\o? Last
Z No V'es Note 2 1. 4 or not
Note 1: if the scale factor is very far off or the structural model is very bad. the scale factor may get worse, e.g. smaller, during refinement because the difference between a pattern and nothing is less than the difference between two badly mismatched patterns. Note 2: for properly aligned and mechanically stable diffractometers, the zero point error should be and remain inconsequential. In any event, it cannot change from sample to sample whereas the effective specimen displacement can and does. The displacement parameter will also take up some of the effect of specimen transparency which occurs in non-infinitely absorbing specimens. Note 3; beware lest one or more incorrect lattice parameters cause one or more calculated peaks to "lock on" to the wrong observed peaks. The result can be a very solid false minimum. Artificially broadening the calculated profiles (temporarily) may help. A parameter for wavelength may be turned on instead of one of the lattice parameters if the wavelength is not as well known as are the lattice parameters. Note 4: if more background parameters are turned on than needed to model the angular dependence of the background, the result will be high correlations and. often, large shifts that are mostly mutually compensating but may lead to erratic behaviour and failure of the refinement. The higher order ones should be turned off sequentially until the problem is corrected. Note 5: £,', V, VV tend to be highly correlated. Various combinations of quite different values can lead to essentially the same profile breadth. In Chapter 3, Prince points out that the problem can be greatly ameliorated by offsetting the origin of the Caglioti et al. [120] polynomial expression for the angular dependence of U, V, VV as he shows in Eq. (3.12). Note 6: graphics and the reflection indices should be used now to assess whether preferred orientation should be modelled at this point.

53
It is important to remember that when a value of 5 is not going below 1.3. then plotting the fitting
result often helps to identify a possible reason for the poor 5 value. Even if a value of 5 becomes small
enough, there is always the potential danger that a refinement is not actually converging to the global
minimum in the entire parameter space, but to a so-called false minimum. One of methods to confirm
convergence to the global minimum is to repeat the refinement process using a different least-square
algorithm. In the program RIETAN-97i?. three different algorithms are available for use: the Gauss-
N'ewton. modified Marquardt. and conjugate direction methods. The modified .Vlarquardt method is
used for most refinement steps because of its overall performance quality and its speed. However, a
choice can be made in an input file to RJETAN-97i? so that the program automatically alters one
algorithm to another subsequently. It is a good custom to execute this choice at the last stage of a
refinement to double check its convergence to the global minimum. .A. caution is given when too small a
value of 5 (< 1) is obtained even after confirming the global minimum of the solution. Rietveld analysis
computer programs cannot give a perfect estimate of 5: therefore. 5 could become less than 1 for a
correct solution.
Example of the Rietveld refinement
In this section, an example of the Rietveld refinement is given for sample 4A of LiV'204. piece
of sample 2 was an given additional heating at 725"C for approximately one day before quenching
the sample tube into ice water, which was labeled as sample 4A. The x-ray diffraction measurement
revealed that this sample had V2O3 as an impurity phase. The Rietveld analysis computer program
RIETA.\'-97J is not a menu-driven software, but uses an input file as a batch file that e.xecutes the
application. Compared to the GUI-based (Graphical User Interface) input method seen in many recent
applications, this CUI-based (Character User Interface) input method might appear less sophisticated.
However, a GUI-bctsed input system often has a hierachial menu which has many layers below. \ user
usually has to respond at each layer to go further below in the menu, or to execute a subprogram. The
result is that the user tends to get lost while moving up and down between different levels of the menu.
However, the CUI-based input method is more direct and probably requires less time if one uses one's
favorite editor. The creator of RIETAN97;3 calls this input system F^IS (Flat, Flexible and Friendly
Input System) [105].
An input file of Dr. Izumi's F^IS consists of equation-like assignment lines
variable = value : commeni . (3.12)
in which a user can write any comment after a colon as long as the number of characters in the line

54
does not exceed 80. If such a colon is replaced with an exclamation point, the whole assignment line
becomes void and will be ignored on execution. In this way one can leave choices in the input file lines
for future use. In addition, the "If then..command is available, as seen in an example input file
for LiV'204 scmiple 4A given in the Appendix. Also one can put a # sign at the beginning of a line to
make the rest of a line a comment. Multiple lines can be grouped in a pair of braces, and a comment
can be added outside the braces. A template file which is available as a sample of the program is.
therefore, very useful. A beginner can start a refinement, without studying the details before use. by
simply validating and nullifying given selections.
Refinable parameters have flags to identify whether they are to be fixed (set to 0) or refined (1).
Furthermore. linear and nonlinear constraints can be given between refinable parameters by setting
a flag to 2. For instance, on the line beginning with ASYM2 a flag of 2 is attached to the value
(= 0.110906). A constraint of such a parameter is given in the next section. For ASYM2. it is set
.A(ASYM2.1)=A(ASYM1.1). where ".A" itself means nothing, but the first argument in the parentheses
tells which variables are to be constraints, and the second argument specifies a variable number for the
given parameter. In this example of sample 4A, all the profile parameters of the impurity phase are set
equal to the corresponding values in the main phase. All structure parameters except lattice parameters
are fixed to literature values. Refinements usually cannot be done for a very minor second phase.
By making a choice of NEXC = I. the data points in the '29 = 15-19.98" range were not used for the
refinement. The normal setting in our Rigaku x-ray difTractometer has a divergence slit with a width
of 1 degree, so the measured intensity values for '26 < 20° include reflections from the sample holder.
Often such low angle data are discarded simply because a peak shape exhibits more asymmetry at low
angle, which makes the refinement process more difficult.
The best way to know the preferred-orientation vector is to view the crystalline shape under an
electron microscope. When this is unavailable, various choices of this vector and also anisotropic-
broadening axis ought to be tested.
The results of the Rietveld analyses for all nine LiV204 samples are listed in Table 3.4 below (the
information for the two Ti spinel samples are in Table 6.2). and are discussed in the next section. The
fit curve to thousands of data points between 20 = 20 and 80° for this example of LiV'204 sample 4A
is shown in Fig. 3.4.

55
LiV204 SampU 4A Samplt4A.ps
LI 1 ' 1 1 ' 1 1
•' ''' f L>L
4 I< 1 1' 1
1 ^ , ,
T 7 :s 30 3S 40 45 so S5 60 6S 70
2 8 n
Figure 3.4 Rietveld refinement fit to the x-ray diffraction pattern of LiV204
sample 4A for diffraction angles 26 = 20-80°. Diffraction data
points are indicated by crosses, while the calculated intensity is
the solid curve. Right below the diffraction pattern, there axe two
sets of ticks, overlapping somewhat in the vertical direction. The
upper ticks represents expected 29 angles for LiV204 diffraction
peaks, and the lower ticks are those for V2O3 impurity phase. The
difference between the observed and calculated intensity is shown
at the bottom.

56
Structure analyses by Rietveld method and thermogravimetric analysis results
The results from Rietveld analyses of the x-ray diffraction patterns for the nine Li\'204 samples
are given in Table 3.4. The refinements of the spinel phase were based on the assumption of exact
LiV204 stoichiometry. The peaks of this main phase can be indexed on the space group Fdim. The
values of the isotropic thermal-displacement parameters B of lithium and oxygen were taken from the
Rietveld analysis of neutron diffraction measurements on our LiV204 sample 5 by Chmaissem et al.
[18], and fixed throughout to Bu = 11A and BQ = 0.48 A. respectively. These atoms do not scatter
x-rays strongly enough to allow accurate determinations of the B values from Rietveld refinements of
our x-ray diffraction data.
Table 3.4 Results of Rietveld refinements of x-ray diffraction measurements for nine
LiViO^ samples. The oxygen parameter (u) is shown using the second
setting for the space group FdZm from the International Tables for Crys
tallography. Vol. .4 [68]. /str imp is the impurity concentration. The error
in the last digit of a quantity is given in parentheses. The .x-ray detec
tion limit for the impurity concentration is assumed to be iVc [121]. For
samples 3 and 7 in which no discernable impurities were seen, this de
tection limit is listed. Also, the Rietveld refinement for sample 5 yielded
a concentration less than 1 %. which is replaced with the detection limit
below.
Sample Alt. Sample Cooling Impurity flQ u /str imp
No. .\o. (A) (mol^r)
1 4-0-1 air VaOs 8.24062(11) 0.26115(17) 2.01
2 3-3 air V 2O3 8.23997(4) 0.2612(20) 1.83
3 4-E-2 air pure 8.24100(15) 0.26032(99) < 1
4 • 3-3-ql L\2 V3O5 8.24622(23) 0.26179(36) 3.83
4A 3-3-q2 ice H2O V 2O3 8.24705(29) 0.26198(39) 1.71
4B 3-3-a2 slow cool V 2O3 8.24734(20) 0.26106(32) 1.46
5 6-1 air V 2O3 8.24347(25) 0.26149(39) < 1
6 12-1 air ^ 305 8.23854(11) 0.26087(23) 2.20
7 13-1 air pure 8.24114(9) 0.26182(19) < 1
The nine LiViO^ samples were given three different heat treatm.ents after heating to 700 to 750"C:
air-cooling (samples 1. 2, 3. 5. 6 and 7). liquid-nitrogen quenching (sample 4), ice-water quenching
(sample 4A) or oven-slow cooling at fs 20°C/hr (sample 4B). Possible loss of Li at the high synthesis
temperature, perhaps in the form of a lithium oxide, was a concern. This lithium loss would cause a
deficiency of lithium (or lithium and oxygen) relative to the composition LiV204. In a detailed neutron

0(
diffraction study. Daiton et al. [93] determined the lithium contents in their samples of Lii+rTij_j-04
(0 < J: < 0.33). and found lithium deficiency in the 8a site of the spinel phase of all four samples studied.
If the spinel phase in the Li-V'-O system is similarly Li-deficient, then samples of exact stoichiometry
LiV'oO^ would contain V-0 impurity phase(s). which might then explain the presence of small amounts
of V oOa or V3O5 impurity phases in most of our samples.
Sample3 was intentionally made slightly off-stoichiometric. with the nominal composition Li\'i Q2O3 ss"
A TGA measurement in oxygen showed a weight gain of 12.804 to the fully o.xidized state. If one
assumes an actual initial composition Li\'i g^Oa ss+o- this weight gain corresponds to 6 = 0.08 and an
actual initial composition of LiV'i 92O3 97. which can be rewritten as Lii oiV'i 93O4 assummg no oxygen
vacancies on the oxygen sublattice. On the other hand, if one assumes an actual initial composition
of Lii-rV'i 9203.89- then the weight gain yields r = 0.19. and an initial composition Lio si^ 1 gsOa.sQ-
which can be similarly rewritten as Lio 83Vi.9704. Our Rietveld refinements could not distinguish these
possibilities from an assumed stoichiometric composition of Li[V'2]04 for the spinel phase.
Sample 4. which was given a liquid-nitrogen quench from the final heating temperature of ~ 725 °C
(labelled "LN '2" in Table 3.4). is one of the structurally least pure samples (see Table 3.4). Our Rietveld
refinement of the x-ray diffraction pattern for this sample did not reveal any discernabie deviation of
the cation occupancy from that of ideal Li[V'2]04. There is a strong similarity among samples 4. 4A
(ice-water quenched) and 4B (oven-slow cooled), despite their different heat treatments. These samples
all have much larger lattice parameters (ao ~ 8.246.4) than the other samples. The as-prepared sample
2. from which all three samples 4. 4A and 4B were obtained by the above quenching heat treatments,
has a much smaller lattice parameter. On the other hand, the oxygen parameters u of these four samples
are similar to each other and to those of the other samples in Table 3.4.
The weight gains upon the oxidization of our samples in pure oxygen in the TGA can be converted
to values of the average oxidation state per vanadium atom, assuming the ideal stoichiometry LIV'TO^
for the initial composition. The values, to an accuracy of ±0.01. are 3.57. 3.55. 3.60. 3.56. 3.56. 3.57.
3.57. 3.55 for samples 1-7 and 4B, respectively. This measurement was not done for sample 4A. We do
not currently understand why these values are systematically higher than the expected value of 3.50.

58
4 MAGNETIZATION
Magnetization measurements
Overview of observed magnetic susceptibility
An overview of the observed zero-field-cooled (ZFC) magnetic susceptibilities H
a.1 H = LOT from 1.8-2K to 400K of the nine LiV^O^ samples is shown in Figs. 4.1(a). (b) and (c).
The data for the various samples are very similar for T ~ 50 K. Differences in between
the samples appear at lower T. where variable Curie-like Cimp/T upturns occur.
Samples 1 and 6 clearly exhibit shallow broad peaks in at T % 16 K. The of sample 6
is systematically slightly larger than that of sample 1; the reason for this shift is not known. Samples
3 and 4 also show the broad peak with a relatively small Curie-like upturn. Samples 2 and 7 show
some evidence of the broad peak but the peak is partially masked by the upturn. For the other three
samples, the broad peak is evidently masked by larger Curie impurity contributions. From Fig. 4.1
and Table 3.4. the samples 1. 4 and 6 with the smallest Curie-like impurity contributions contain V3O5
impurities, whereas the other samples. %vith larger paramagnetic impurity contributions, contain V'oOs
impurities. The reason for this correlation is not clear. The presence of the vanadium oxide impurities
by itself should not be a direct cause of the Curie-like upturns. The susceptibility of pure V'TOS
follows the Curie-Weiss law in the metallic T region above ~ 170 K. but for T ~ 170 K it becomes an
antiferromagnetic insulator, showing a decrease in \(T) [122]. Vo-yOa (y 0.03). on the other hand,
sustains its high-7" metallic state down to low temperatures, and at its Neel temperature TN ~ 10 K it undergoes a transition to an antiferromagnetic phase with a cusp in \;(T) [122]. V'aOa also orders
antiferromagnetically at = 75.5 K. but \{T) shows a broad maximum at a higher T = 125 K [123].
Though not detected in our x-ray diffraction measurements, V4O7. which has the same V oxidation
state as in LiV204, also displays a cusp in \°'^{R) at RS 33 K and x°^^(T) follows the Curie-Weiss law
for r ~ 50K [31]. The susceptibilities of these V-0 phases are all on the order of lO""* to lO'^cm^mol
at low T [31, 122]. Moreover, the T variations of in these vanadium oxides for T ~ lOK are,

59
30
25
20
15
10
5
0
UV o 2 4 Sample 1
Sample 6
400
UV o 2 4 Sample 2 Sample 4 Sample 4A Sample 4B
(b)
• • • • • •
50 100 150 200 250 300 350 400 T(K)
LIV O 2 4 ° Sample 3
» Sample 5
• Sample 7
fiaa (C) a •
50 100 150 200 250 300 350 400 T(K)
Figure 4.1 Observed magnetic susceptibility X°^{T) (= M°^/H) of all the
nine samples studied, measured with = 1 T after being zero-field
cooled to the lowest T: (a) Samples 1 and 6; (b) samples 2, 4, 4A
and 4B: (c) samples 3. 5 and 7.

60
upon decreasing T. decreasing (Vo-yOa) or nearly T independent (V'aOs and \'407). in contrast to
the increasing behavior of the observed Curie-like magnetic impurity contribution. From the above
discussion and the very small amounts of V'-O impurity phases found from the Rietveld refinements
of our x-ray diffraction measurements, we conclude that the V-O impurity phases cannot give rise to
the observed Curie-like upturns in our data at low T. These Curie-like terms therefore most
likely arise from paramagnetic defects in the spinel phase and/or from a very small concentration of an
unidentified impurity phase.
Figure 4.1(b) shows how the additional heat treatments of the as-prepared sample '1. to produce
samples 4. 4A and 4B. yielded different behaviors of \°^(T) at low T. Only liquid-nitrogen quenching
(sample 4) caused a decrease in the Curie-like upturn of sample 2. On the contrary, ice water quenching
(sample 4A) and oven-slow cooling (sample 4B) caused \°''®(T) to have an even larger upturn. However,
the size of the Curie-like upturn in \°^^[T) of sample 4 was found to be irreproducible when the same
liquid-nitrogen quenching procedure was applied to another piece from sample 2: in this case the Curie
like upturn was larger, not smaller, than in sample 2. The observed susceptibility (not shown) of this
latter liquid nitrogen-quenched sample is very similar to those of samples 4A and 4B. The of
samples 4A and 4B resemble those reported previously [2. 5. 6. 7. 8. 9].
Isothermal magnetization versus magnetic field
Larger Curie-like upturns were found in samples with larger curvatures in the isothermal
data at low T. \ few representative 2 K) data for samples showing various extents of curvatures
in are shown in Fig. 4.2. which may be compared with the corresponding \°^^{T) data at low
T in Figs. 4.1. This correlation suggests that the Curie-like upturns in arise from paramagnetic
(field-saturable) impurities/defects in the samples. On the other hand, there is no obvious correlation
between the magnetic impurity concentration and the structural V2O3 or V3O5 impurity concentration,
as noted above.
The isothermal data for H < 5.5T displayed negative curvature for T ~ 10-20 K and
linear behavior for higher T. as illustrated for sample 1 in Fig. 4.3. The concentrations of magnetic
impurities in the various samples were obtained from analyses of isotherms, as follows. From
high-field measurements, the intrinsic magnetization M { H . O . o K ) of LiV204 is proportional to H up
to H " 16T [124]. Therefore, the observed molar magnetization ,T) isotherm data for each
sample were fitted by the equation
T ) = T ) + M [ H , T )

61
700 - LiV^O, ' 1 ' 1 ' 1 ' 1
• ~ (
600
CM II 1-1
1
•
• o _
J
o 500
-
• o
» LJ
E 500 — o • 8
- o
£ o 400 -
•
o 09
-
CD "
• 0 •
300 -•
-
t/3 X3 O -
• ° s • Sample 5
IE 200 - • ° a o •
Sample 7 -0 •
• Sample 3 ' 100 • 8
o a • Sample 1
n • 1 1 . 1 , t 1 1
0 1 2 3 4 5
H(T)
Figure 4.2 Comparison of the negative curvatures of observed magnetization
isotherms M°^ at T = 2 K versus applied magnetic field H for samples 1, 3, 5 and 7.

62
700
600
500
400
300
200
100
- LiV^O^ Sample 1
• 2K
° 10K
• 300 K
0
•
a
•
H(T)
n
Figure 4.3 Observed magnetization Af"*" versus applied magnetic field H isotherms at temperatures T = 2, 10 and 300 K for LiV204 sam
ple 1. Negative curvature in is not present for T" > lOK
for this sample.

63
— /impA5imp^B'S'imp^S,o,p (•2^) + • ("ll)
where /,mp is the magnetic impurity concentration. A'A Avogadro s number. ,mp the impurity ^-factor.
the Bohr magneton. 5,mp the impurity spin. the Brillouin function. \ the intrinsic susceptibihty
of the LiV'204 spinel phase and H the applied magnetic field. The argument of the Brillouin function is
^ l[k^{T — ^tmp)]- ^tmp represents the Weiss temperature of the Curie-Weiss law when
the susceptibility is obtained by e.xpanding the Brillouin function in the limit of small H / { T — ^,mp)-
Incorporating the parameter dmp ?= 0 takes account of possible interactions between magnetic impurities
in a mean-field way. To improve the precision of the obtained fitting parameters, we fitted
isotherm data measured at more than one low temperature simultaneously by Eq. (4.1). Since the
negative curvature of the isothermal data diminishes rapidly with increasing T. only low
T (1.8-6 K) data were used. Furthermore, a linear T dependence of \ { T ) in this T range was assumed
[see Fig. 4.1(a)] in order to reduce the number of free parameters. However. ^(7" = 2 K) and the linear
slope d\/dT still have to be determined. Hence up to six free parameters were to be determined by
fitting Eq. (4.1) to the datar fimp• ^\mp^ ^impT \(^ — ^K) and d\/dT".
With all six parameters varied as free parameters, fits of M°^^[H.T) by Eq. (4.1) produced un
satisfactory results, yielding parameters with large estimated standard deviations. Therefore, we fixed
•5imp to various half-integer values starting from 1/2. thereby reducing the number of free parameters
of each fit to five. With regard to the G,^p values. 5-factors of slightly less than 2 are observed in V'*"'
compounds: VO2 (1.964) [125]. (NH4)rV205 (1.962) [126] and Li^V^Os (1.96) [127]. Having ff.mp
a-s a guide, we selected a few values of 5imp which resulted in ^,mip ~ 2 in the five-parameter fit.
Then using the obtained parameter values we calculated and plotted the impurity magnetization .V/,n,p
(= — \ff) versus H/(T — ^imp) for all the low T data utilized in the fit by Eq. (4.1). If a fit is
valid, then all the .V/imp[^/(7'— ^imp)] data points obtained at the various isothermal temperatures for
each sample should collapse onto a universal curve described by Mmp = flmp^'^'A3lmp^lBS^mpBs,„p(x).
The fixed value of 5imp which gave the best universal behavior for a given sample was chosen. Then,
using this Sj^p. we fixed the value of GI^p to 2 to see if the resultant /{T — 0jmp)] data yielded
a similar universal behavior. For the purpose of reducing the number of free parameters as much as
possible, if this fixed-y fit did yield a comparable result, the parameters obtained were taken as the
final fitting parameters and are reported in this paper. For sample 1 only, the fit parameters obtained
by further fixing fl,mp = 0 are reported here. To estimate the goodness of a fit, the per degree of
freedom (DOF) was obtained, which is defined as (Ap - P)~^ /cr"^. where iVp is the
number of data points, P is the number of free parameters, and <r,- is the standard deviation of the

G4
observed value . A fir i.- rea:arded a.s satisfactory if \-/DOF ~ I. and this criterion was aciiieved i"or
eacli of the tune saniples.
The niasnetir parameters for each sample, obtained as described above, are listed in Table 4.1.
Plots of Mmp versus H/(T - 0,mp j for the nine samples are given in Figs. 4.4. 4.5 and 4.G. whcrf- an
e.xcellent universal behavior for each sample at different temperatures is seen. The two magnetically
purest samples I and (i have the largest relative deviations of the data from the respective fit curves,
especially at the larger values of H/{T Since these two samples contain extremely small
amounts of paramagnetic saturable impurities, the magnetic parameters of the impurities could not
br deterniined to high precision. The impurity spins 5"imp obtained for the nine samples vary from
'.\/"2 to 4. Ill general, the magnetic impurity Weiss temperaure |0,tnpl increased with magnetic mipunty
conrentratioii /,mp From the chemical analyses of the starting materials and LinC'O.))
supplied by the manufacturer, magnetic impurity concentrations of 0.00'24 mol 9? Cr and U.UU;?;{ niol'-'^ Fe
are inferred with respect to a mole of Li\'204. which are too small to account for the paramagnetic
impurity concentrations we derived for our samples.
lable 4.1 Results of magnetization T) isotherm analyses, where the T values used are listed
m the second column. /ma« imp magnetic impurity concentrations. The error in the
last digit of a quantity is given in parentheses. A number without an error listed was fi.\ed
ill the data fit
•Sample .\o. T K.\ed 5,n,p iVinip ^imp ymag tmp \ ( 2 K ) c i x / d T
( K ) ( K ) (mol9i) (10~- cm^/niol) (cnr^/mol K )
I •j.;j.4.o ;5/2 *2 0 0.049(2) 1.026(1) 7.:{( n ') •_'.4.() 2.00(0) -0.6(2) 0.22(1) 1.0;54(5) 6.7(4)
•l.Ty h 1 '1 •J. 10(2) —(J.ol(o) 0.118(2) 0.9979(6) 7.46(7) 1 4..') ')/*J •J -0.2(1) 0.066(2) 0.9909(9) 6.7( 1)
4 A 2.0 ;i 2 -O.o(I) 0.77(2) 1.145(9) 6.5(9)
4B 2.;5.4.5 •J -1.2(1) 0.74(2) 1.13(1) 4.4(7) •') 2.0 5/'J 2.:u(;i) -0.59(4) 0.472(8) 1.091(2) 5(3) ti 2.0 •1 •> -0.9(14) 0.011:5(6) 1.067 5.6(2)
t 2..5 •J -0.2(2) 0.194(7) 1.094(4) 5.4(4)

65
Sample 4 *-'^2^4
Sample 1
Sample 6
-I—I—r I I r ' ' ' I ' ' ' ' I • •
0.5 1 1.5 2
H/(T-0) (T/K)
' * ' ' 0 2.5
Figure 4.4 Calculated impurity magnetizations — xH versus
H/{T —9\JAP) for LiV204 samples 1, 4 and 6. For each sample, the
solid curve is the best-fit Brillouin function Eq. (4.1).

66
O 50
0 30
Sample? Sample2 _
Sample 3
I
• 2K - 4K « 5K
•>—I—I—i—I—I I I I I I • ' I • •
0.5 1.5 2.5
H/(T-0) (T/K)
Figure 4.5 Calculated impurity magnetizations Mj^p = — xH versus
if/(T — flimp) for LiV204 samples 2, 3 and 7. For each sample, the
solid curve is the best-fit Brillouin function Eki. (4.1).

67
300
- LiV.0
250
Sample 4A Sample 4B 200
150
100 3K Sample 5
4K 50
5K
0 0 0.5 1.5 1 2 2.5 3
H/(T-0) (T/K)
Figure 4.6 Calculated impurity magnetizations A/jmp = M°'*' — xfl versus
H/{T — Simp) for LiV204 samples 4A, 4B and 5. For each sample,
the solid curve is the best-fit Brillouin function Eq. (4.1).

68
Magnetization versus temperature measurements
Low magnetic field ZFC jmd FC measurements
The zero-field-cooled (ZFC) data in Fig. 4.1(a) for our highest magnetic purity samples I
and 6 show a broad maximum at 7^®^ % 16 K. One interpretation might be that static short-range
(spin-glass) ordering sets in below this temperature. To check for spin-glass ordering, we carried out
low-field (10-100 G) ZFC and field-cooled (FC) magnetization measurements from 1.8-2 K to 50 K on
all samples except samples 2 and 4B. For each sample, there was no hysteresis between the ZFC and
FC measurements, as illustrated for sample 4 in Fig. 4.7. and thus no evidence for spin-glass ordering
above 1.8-2 K [29].
L'eda et al. [83] reported that spin-glass ordering occurs in the zinc-doped lithium vanadium oxide
spinel Lii_j.ZnrV'204 for 0.1 < j < 0.9. However, spin-glass ordering was not seen in the pure com
pound LiV'o04. consistent with our results. Further, positive-muon spin relaxation /iSR measurements
for sample 1 did not detect static magnetic ordering down to 20 mK [11]. However, the fiSR measure
ments did indicate the presence of static spin-glass ordering in the off-stoichiometric sample 3 below
0.8 K [11]. .-^s mentioned in Chapter 3. the stoichiometry of sample 3 was intentionally made slightly
cation-deficient, and may contain cation vacancies. Such a defective structure could facilitate the oc
currence of the spin-glass behavior, relieving the geometric frustration among the spins. Whether
the nature of the spin-glass ordering in sample 3 is similar to or different from that in Lii_^Znr\'204
noted above is at present unclear.
Intrinsic susceptibility
The intrinsic susceptibility \ { T ) was derived from the observed .\[°^^(T) data at fi.xed H = IT
using
H
where M m p i H . T ) is given by Eq. (4.1) with // = 1 T and by the parameters for each sample given in
Table 4.1. and T is the only variable. The \(T') for each of the nine samples is shown in Figs. 4.8(a)
and (b). along with for samples 1 and 6. shallow broad peak in \{T) is seen at a temperature
rpeak = 18.16.18,18.15.17.17.5.14K for samples 1-7. 4A and 4B. respectively. The peak profiles seen
in \(T) for the two magnetically purest samples 1 and 6 are regarded as most closely reflecting the
intrinsic susceptibility of LiV204. This peak shape is obtained in the derived xiT) of all the samples
except for sample 4A. as seen in Fig. 4.8(b). The physical nature of the magnetic impurities in sample

69
11.5 -
1 1 - 0 h 8 ®
10.5 -
V ^ 8 ® ® 6
0
10.0 -
9.5 -
• ZFC ^ FC
LiV^O^ Sample 4
H = 50G
Q Q I I I I I I I I I I I I ' • I ' ' T 1 [ T I T .
0 10 20 30 40 50
T(K)
Figure 4.7 Observed magnetic susceptibility X°*"{T) = M°^' ' (T) /H versus
temperature T in a low magnetic field /f = 50 G of LiV204 sample
4 cooled in zero field (ZFC) and in the low field (FC).

70
4A is evidently different from that in the other samples. Except for the anomalous samples 4A and 4B.
the v(7~ = 0) values were estimated from Figs. 4.8(a) and (b). neglecting the small residual increases
at lowest T for samples 2. 6. 7 and 4B to be
V(0) = 9.8. 10.8. 9.6. 9.7. 10.0. 10.2. 10.2. 9.8 x 10~^cm^/mol (samples 1-7. 4B) i4.3)
Modeling of the intrinsic magnetic susceptibility
The Van Vleck susceptibility
The Van Vleck paramagnetic orbital susceptibility may be obtained in favorable cases from the
so-called I\-\ analysis, i.e.. if the transition metal N'MR frequency shift K depends linearly on with
T an implicit parameter. One decomposes \{T) per mole of transition metal atoms according to
v(r) = + + . (4.4)
We neglect the diamagnetic orbital Landau susceptibility, which should be small for rf-electron bands
[128]. The NMR shift is written in an analogous fcishion as
K { T ) = + A'®P'"(r) ; (4.5)
a term A'-°''" does not appear on the right-hand side of Eq. (4.5) because the absolute shift due to
is e.\pected to be about the same as in the Knight shift reference compound and hence does not appear
in the shift measured with respect to the reference compound. Each component of A' is written as a
product of the corresponding component of \ and of the hyperfine coupling constant A as
. (4^6)
jspm A^P'" = .1, Y"'"" • (4.71
-VA/iB
Combining Eqs. (4.5). (4.6) and (4.7) yields
(VV JSPM X'"'" • (4.8) • VAA'B
If h { T ) varies linearly with \ { T ) . then the slope is A®P'"/A'A^B since (and \'^°''®) is normally
independent of T. We write the observed linear relation as
Jospin

71
11.5
11.0
10.5
10.0
9.5
9.0
• - • J • 1 I T
^ . . J o o o o o o g g
• 0 • o
O
o° • g 8 B B
— (OO° g a
- 1
• »
LiV O 2 4
e , (a) -8
8 1 8 •
• •
• •
1
e 8 e 1
e e
• x""" [Sample 6] • Ota
X 1
[Sample 1]
° X [Sample 6] 1 1 1 1
° X 1
[Sample 1] 1 1
LiV O 2 4
T(K)
Figure 4.8 Observed susceptibilities x°^ and derived intrinsic susceptibilities
jc versus temperature T of (a) samples 1 and 6 and (b)samples 2,
3, 4. 5, 7, 4A and 4B. The solid lines are guides to the eye.

72
Setting the right-hcind-sides of Eqs. (4.8) and (4.9) equal to each other gives
vv ^ ^VV _ ^spin '
From NMR and \ ( T ) measurements, the K vs. \ relationship for LiV204 was determined by
.\mako et al. [90] and was found to be linear from 100-300K. as shown in Fig. 4.9. Our fit to their
data gave
K = 0.0117(4) - 1-08(21) •
shown as the straight line in Fig. 4.9. Comparison of Eqs. (4.9) and (4.11) yields
A'o = 0.0117(4) . (4.12)
.4'P'n =-95.4(12) kG . (4.13)
The orbital Van Vleck hyperfine coupling constants for and V"'"'' are similar. For atomic
one has .4^ ^ = 403 kG [129]. We will assume that .4^^ in LiV^O^ is given [130] by that for atomic
V+-'.
.4^^' = 455kG . (4.14)
The core susceptibility is estimated here from Selwood's table [131]. using the contributions [in units of
— I0~'"'cm^/(mol ion)] 1 for Li"*"'. 7 for V"'"^ and 12 for 0~". to be
3 = - 6 3 X 1 0 - " . ( 4 . 1 5 )
mol
Inserting Eqs. (4.12). (4.13). (4.14) and (4.15) into (4.10) yields
= 2.48(9) X lO--' ^ . (4.16) mol
Mahajan et al. [19] have measured the K(T} for our LiV204 sample 2 from 78 to 575 K. Their
data are plotted versus our measurement of \''''®(T) for sample 2 from 74 to 400 K in Fig. 4.9. Applying
the same A'-\ analysis as above, we obtain
A'o = 0.0101(3) . (4.17)
.4"P'" =-76.9(8) kG , (4.18)
3 = 2.22(6) X 10-^ ^ . (4.19)
mol
where the linear fit of K vs. is shown by the dashed line in Fig. 4.9.

73
Data by Amako et al.
— Fit to Amako et al.
° Data by Mahajan et al.
Fit to Mahajan et al.
Sample 2
%
^-5.
0
% (10 ^ cnn7mol V)
Figure 4.9 NMR Knight shift K versus observed magnetic susceptibility
for LiV204 by Amako et al. [8, 90] and by Mahajan et al. [19]
for LiV204 sample 2. The solid and dashed lines aje linear fits to
the respective data according to Eq. (4.11).

74
We may compare our similar values of for LiV'204 in Eqs. (4.16) and (4.19) with those obtained
from A'-\ analyses of other oxides containing and V"'. For stoichiometric \'203 above its metal-
insulator transition temperature of ~ 160 K. Jones [132] and Takigawa et al. [129] respectively obtained
= 2.10 and 2.01 x 10~'^cm^/(mol V). Kikuchi et al. [133] obtained = 0.92 x 10""^ cm^/(mol V)
for LaV'03. whereas for VOo. Pouget et al. [130] obtained = 0.65 x lO""*cm^/(mol \').
High-temperature series expansion analysis of the susceptibility
Above ~ 50 K the monotonically decreasing susceptibility of LiV204 with increasing T has been
interpreted by previous workers in terms of the Curie-Weiss law for a system of spins 5 = 1/2 and
<7 % 2 [2. 5. 6. 7. 8. 9]. To e.xtend this line of analysis, we have fitted \(T) by the high-temperature
series expansion (HTSE) prediction [88, 134] up to sixth order in l/T. The assumed nearest-neighbor
(N'N) Heisenberg Hamiltonian between localized moments reads
' H = J ^ S i S j . ( 4 . 2 0 ) ( i J )
where the sum is over all nearest-neighbor pairs. J is the NN exchange coupling constant and J > 0
denotes AF interactions. A HTSE of Xffr"sE(^) arising from this Hamiltonian up to the Ti'"^-th order
of J/fcaT for general lattices and spin S was determined by Rushbrooke and Wood [88], given per mole
of spins by
_ 3A-Br / J y
VHTSE(^)-/ 5(5+l)J„^„ "U-BrJ
where 60 = 1. The bn coefficients for S = 1/2 up to sixth order (n = 6) are
6 1 = 7 . ^ 2 = T . ^ 3 = : 7 7 ( 1 — - 6 4 = z ; ^ ( 1 3 — 5 r - 1 5 p i - r 5 p 2 ) . 4 8 24 o (DO
l>5 = - n(90r - 122 -I- 245pi - QO:pi - 45p? - 90p2 -i- 25p3) . loJbU
66 = " -(134.-- - 783c -(- 713 -f- 908;pi - 2697pi - 106cpi -1- 1284pj - 234--p2 lo4oJu
-t-849p2 — 291p3 75p4 — 288pip2 — 51? — 8r) . (4.22)
Here c is the nearest-neighbor coordination number, and p„, q and r are so-called lattice parameters
which depend upon the geometry of the magnetic lattice. The Curie Law corresponds to maximum
order = 0, and the Curie-Weiss Law to maximum order n"*" = 1. For the B sublattice of a
normal-spinel structure compound A[B2]04, which is geometrically frustrated for AF interactions, the
parameters are r = 6, p: = 2, po = 2, ps = 0, P4 = 2, g = 0, r = 2. For 5 = 1/2, Eq. (4.22) then yields
A _ 3 . 3 , 1 . 37 , 43 . 1361 ^1 — ^ . 63 — — —• 64 — —— ^ ~ • I (4.23)
2 - 4 ^ 16 ^ 128 ® 640 " 6144 * '

75
0.09
0.08 _max o n =3
0.07
_max -n =6
0.05
0.04 0 0.5 1 1.5 3.5 2 2.5 3 4
kj/j
Figure 4.10 High-temperature series expajision predictions of \;HT"SE versus
temperature T [Eq. (4.21)] for the antiferromagnetically cou
pled spins S = 1/2 in the vanadium sublattice of LiV204 with „max _ 1_6

76
Figure 4.10 illustrates the HTSE predictions of Eq. (4.21) for 5 = 1/2 using these bn coefficients for
nmax — 1 to 6. The theoretical predictions with = 2. 3 and 6 exhibit broad ma.xima
as seen in our experimental xiT) data. The prediction with = 6 is evidently accurate at least for
ksT/J ~ 1.6: at lower T. the theoretical curves with = 5 and 6 diverge noticably from each other
on the scale of Fig. 4.23. Our fits given below of the experimental data by the theoretical \'P'"(7")
predic t ion were carr ied out over temperature ranges for which K^T/J ~ 1.6 . The Weiss temperature 0
in the Curie-Weiss law is given for coordinatioin number r = 6 and 5=1/2 by
. = _£Z£(£±il = . (4.24) 3A:b 2KB ^
To fit the HTSE calculations of to experimental data, we assume that the experimentally
determined intrinsic susceptibility \(T) is the sum of a T-independent term YQ and
\M = XO + \HTSE(^) • ('T-25)
with \^XSE(^) by Eq. (4.21) and the 6„ coefficients for S = 1/2 in Eq. (4.23). The three
parameters to be determined are \ o , g and J /k^ . The fitting parameters for samples 1-7. 4A and 4B
using Tj""" = 6. and for sample 1 also using n"*" = 2 and 3. are given in Table 4.2 for the 50-400 K
and 100-400 K fitting ranges. The fits for these two fitting ranges for sample 1 and = 6 are shown
in Fig. 4.11. Both g and J/A'B tend to decrease as the lower limit of the fitting range increases. The
HTSE fits for all the samples yielded the ranges C = S\g-^i\/(Ak^) = 0.36-0.48cm^K/(mol V) and
0 = —20 to —42K. These ranges are in agreement with those reported previously (see Table 1.5). \o
was found to be sensitive to the choice of fitting temperature range. For the 50-400 K range. \o was
negative for some samples. Recalling the small negative value of the core diamagnetic contribution in
Eq. (4.15) and the larger positive value of the Van Vleck susceptibility in Eqs. (4.16) and (4.19). it is
unlikely that \o [defined in Eq. (4.29)] would be negative. Negative values of \o occur when the low-T
limit of the fitting range is below 100 K. and may therefore be a spurious consequence of the crossover
be tween the loca l moment behav io r a t h igh T and the HF behav io r a t low T.
To eliminate \o as a fitting parameter, we fitted dx /dT by the HTSE prediction for that quantity.
In order to generate the experimental d\/dT. we first employed the following function to obtain an
ana ly t i c expres s ion fo r \ (T ) ,
_ a i + a2T-r a^T-+ + a^T ' ^ r. —^3 ^4 • (4.26 06 -I- au + asT- agi-* -i-
The x (T) of samples 1 and 6 for the entire T ranges 2-400 K and 1.8-400 K, respectively, can be fitted
well by Eq. (4.26) and the a„ coefficients are listed in Table 4.3. The rms deviation of the fit from the

77
o E
E 0
CO 1 O
14
12
10
8
6
4
2
0
> 1 1 1 1 1 1 1 1 1 1 1 1 1 >
LiV^O^ Sample 1
- ; HTSE fit (n"" = 6)
• X data
—
50-400K fit
--100-400Kfit
1 1 . 1 . 1 . 1 . 1 , 1 . 1 .
0 50 100 150 200 250 300 350 400
T(K)
Figure 4.11 Intrinsic susceptibility X versus temperature T for LiV204 sam
ple 1 (filled circles) and fits (curves) by the high-T series expan
sion (HTSE) prediction to 6th order in L/T for the 50-400 and
100-400 K temperature ranges.

78
Table 4.2 Results of high-temperature series expansion calculation fits to
the experimental intrinsic magnetic susceptibility data for LiV'204.
The temperature independent susceptibility. \o. is in units of
lO""* cm^/mol. and J/k^ is in K. The error in the last digit of a
quantity is given in parentheses.
Sample
No.
„max 50-400K 100-400K Sample
No.
„max
\o 9 J / k s .\o 9 J / kB
1 2 0.8(4) 2.17(1) 25.8(5) 2.7(3) 2.07(2) 20(1)
1 3 0.7(4) 2.18(2) 26.2(6) 2.6(3) 2.07(2) 20(1)
1 6 0.5(4) 2.19(2) 26.9(7) 2.6(3) 2.07(2) 20(1)
2 6 -0.2(5) 2.26(2) 26.7(8) 2.6(3) 2.11(2) 19(1)
3 6 -1.3(5) 2.23(2) 27.8(7) 1.4(3) 2.08(2) 20.5(8)
4 6 1.1(6) 2.16(3) 26.4(9) 4.1(5) 1.99(3) 17(2)
4A 6 -0.6(8) 2.20(3) 26.(1) 2.3(2) 2.05(1) 18.1(6)
4B 6 -0.7(5) 2.12(2) 26.2(8) 1.8(5) 1.97(3) 18(2)
5 6 1.2(7) 2.17(3) 25.(1) 4.9(7) 1.95(4) 13(2)
6 6 0.8(1) 2.251(6) 26.5(2) 3.3(7) 2.108(4) 18.4(2)
7 6 0.5(3) 2.20(1) 25.8(5) 3.0(1) 2.051(8) 17.5(4)
data for sample 1 (sample 6) is 0.29% (0.21%). while the maximum deviation is 1.3% (0.48%). Using
Eq. (4.26). dx/dT was computed and is plotted in Fig. 4.12 for sample 1. These data were fitted by
obtained from the HTSE prediction Eq. (4.21) with = 6. where the fitting parameters
are now g and J/ks- The fits were carried out over the same two T ranges as in Fig. 4.11: Table 4.4
displays the fitting parameters and the fits are plotted in Fig. 4.12. Of the two fitting ranges, the 100-
400 K fit is the best fit inside the respective range, though it shows a large deviation from the data below
this range. Using the fitting parameters, the HTSE \^p'"(T') is obtained from Eq. (4.21). .According to
Eq. (4.25). the difference between the experimental \(T) and — \i^) ~
should represent the T-independent contribution \o- ^ \ {T ) is plotted for sample 1 versus T in Fig. 4.13
for the 50-400 K and 100-400 K fit ranges. .A.gain. the superiority of the 100-400 K fitting range to the
other is evident, i.e.. \o is more nearly constant for this fitting range. \o for the 50-400 K fit range
is negative within the range. This sign is opposite to that obtained in the first HTSE fitting results
in Table 4.2. This inconsistency found in the fit using a low T limit below 100 K may again be due to
changing physics in the crossover regime, which would invalidate the parameters. By averaging the \o
values for sample 1 in the range 100-400 K, we conclude that the ^-independent contribution to the

79
susceptibility is
\o = 2.00(4) X 10~'*cm^/mol (sample 1) . (4.27)
Similarly, for sample 6 we obtain
\Q = 2.11(1) X 10~"'cm^/mol (sample 6) . (4.28)
Table 4.3 Coefficients an in Eq. (4.26) in the fit to the intrinsic
susceptibility of LiV'204 semiple 1 for the temperature
range 2-400 K and of sample 6 for 1.8-400 K.
sample 1 sample 6
6582.265 16550.251
-249.28006 -915.01623
<13 32.222161 33.136264
A-A 0.66645683 0.62427567
AS 0.00047520063 0.00063083797
ae 672225.75 1606070.2
0-7 -29971.386 -102780.73
as 3467.6212 4270.2043
AA 30.324884 6.8469583
Table 4.4 Parameters g and J /k^ obtained by fitting the tempera
ture derivative of the experimental intrinsic susceptibility
data by the temperature derivative of the HTSE spin sus
ceptibility [Eq. (4.21)] with n'"" = 6 for LiV204 samples
I and 6. The error in the last digit of a quantity is given
in parentheses.
50-400 K 100-400K
Sample no. 9 J / kB (K) 9 J / k% (K)
1 2.275(3) 29.61(7) 2.103(2) 22.27(8)
6 2.402(4) 31.61(9) 2.174(3) 22.1(1)
In the itinerant plus localized moment model implicitly assumed in this section. \o can be decom
posed as
xo = x"'" + , (4.29)

80
-2 h
-4
-6
-8
•10
•12
LiV O 2 4
Sample 1 d%/dT data
50-400K fit
100-400K fit
50 100 150 200 250 300 350 400
T(K)
Figure 4.12 Temperature derivative of the experimental intrinsic susceptibility,
dx/dT, for LiV204 sample 1 (heavy solid curve), generated using
Eq. (4.26) with the coefBcients a„ from Table 4.3. Fits by the
T derivative of the HTSE prediction dx'^^^'/dT in Ekj. (4.21) are
also shown for T ranges of 50-400 K (dashed curve) and 100-400 K (light solid curve).

81
o E
CO
E 0
CO 1 o
CO
1 -
0.5 -
0 -
-0.5 -
•1 -
• •
laaffl ° ° ° O •
LiV O 2 4
Sample 1
° 50-400K fit
100-400Kfit -
0 50 100 150 200 250 300 350 400
T(K)
Figure 4.13 The differences between the experimental intrinsic susceptibility
x{T) of LiV204 sample 1 and the HTSE prediction obtained
from the T derivative analysis, 6x{T) = x{T) — X®'''", versus tem
perature T for the fitting T ranges of 50-400 K (open squares) and
100-400K (filled circles). For a valid fit, these differences should
be the T-independent susceptibility xo-

82
where is the temperature-independent Pauli spin susceptibility of the conduction electrons. L'sing
the results in Eqs. (4.15). (4.19) and (4.27), for sample 1 we find
= 0.41(10) X lO""* cm3/mol (sample 1) . (4.30)
For sample 6. we similarly obtained
^Pauii _ Q 52(7) X lO""* cm^/mol (sample 6) . (4.31)
These values are approximately four times smaller than that obtained for LiV'^O^ by .Mahajan e t
a l . [19]. They used in the T range 100-800K. combining our x°^^{T) data to 400 K and those of
Hayakawa e t a l . [9] to 800 K. By fitting these combined data by the expression \ ° ^^{T) = \ o +2Cl {T—9) .
they obtained ,\o = 5.45 x lO""* cm^/mol. As shown above, the value of \o is sensitive to the fitting
temperature range. For LiTioO^, ~ 2 x 10~'*cm3/moi [4. 135] between 20 and 300 K. which is a
few times larger than we find for LiV204 in Eqs. (4.30) and (4.31).
Crystal field model
The ground state of a free ion with one 3d electron is "D3/2 and has five-fold orbital degeneracy.
The point symmetry of a V atom in LiVoO^ is trigonal. If we consider the crystalline electric field
(CEF) seen by a \' atom arising from only the six nearest-neighbor oxygen ions, the CEF due to a
perfect oxygen octahedron is cubic {Oh symmetry), assuming here point charges for the oxygen ions.
In this CEF the degeneracy of the five d orbitals of the vanadium atom is lifted and the orbitals are
split by an energy "lODg" into a lower orbital tng triplet and a higher orbital Cg doublet. However, in
Li\'204 each V-centered oxygen octahedron is slightly distorted along one of the <111> directions [see
Fig. 1.14(b)]. as discussed in Chapter 1. This distortion lowers the local symmetry of the V atom to
Dzd (trigonal) and causes a splitting of the tng triplet into an .-lij singlet and an Eg doublet. It is not
clear to us which of the Eg or .4ij levels become the ground state, and how large the splitting between
the two levels is. These questions cannot be answered readily without a knowledge of the magnitudes of
certain radial integrals [136]. and are not further discussed here [137]. However, this trigonal splitting
is normally about an order of magnitude smaller than IQDq [1]. In the following, we will examine the
predictions for x(T) of a tf' or d- ion in a cubic CEF and compare with our experimental data for
LiV 2O4.
Kotani [138] calculated the effective magnetic moment = Pefr/iB pcr <i-atom for a cubic CEF
using the Van Vleck formula [139]. The spin-orbit interaction is included, where the coupling constant

83
is A. For an isolated atom n^f^(T) is defined by
\ [T ) = . (4.32)
where n^ff is in general temperature-dependent and N is the number of magnetic atoms. With spin
included, one uses the double group for proper representations of the atomic wavefunctions. Then in
this cubic double group with one (/-electron the six-fold (with spin) degenerate t2g level splits into a
quartet and a doublet rr(<23) [138. 140. 141]. The four-fold degenerate eg level does not split
and its representation is Tgi^g ) - For a positive A as appropriate to a 3d atom with a less than half-filled
c/-shell. F8(<2s) is the ground state, and the first-order Zeeman effect does not split it: this ground state
is non-magnetic. Kotani does not include in his calculations of the possible coupling of Fgl^^g) and
FsCCff). which have the same symmetry, and assumes that the cubic CEF splitting lODq is large enough
to prevent significant mixing. On the other hand, the cubic double group with two rf-electrons gives
an orbitally nondegenerate. five-fold spin-degenerate, ground state with angular momentum quantum
number J = 2 which splits into five non-degenerate levels under a magnetic field. The spin-orbit
coupling constant is A = +250cm~' for and +105cm~' for d- [142]. The effective
moment is defined from the observed molar susceptibility of LiV'204 as
= + . ,4.33, •SKBI
where \o is given by Eq. (4.27). Kotani's results from the Van Vleck equations are
1 / 2
PIFF = 8 - K 3 x - 8 ) f - T ^
x ( 2 - h e - ? ' )
for the d ' - ion. and
J- '^ — PefT — 3(|x -h l5-l-(f-h9)e-'-24e- t ' )
(4.34)
(4.35) r(5 -I- 3e~-^ + e 2^)
for the d- ion. where x = X/k^T . Figure 4.14 shows p°^®, p^y and as a function of T. For comparison
also shown is Pe^^"' obtained by assuming that p°^'(T) arises from an equal mixture of and V"'""'
localized moments. None of the three calculated curves agrees with the experimental data over the full
temperature range. However, in all three calculations peff increases with T. in qualitative agreement with
the data, perhaps implying the importance of orbital degeneracy in LiV204 and/or antiferromagnetic
coupling between vanadium spins. The nearly T-independent p°^® ss 1.8 for T ~ 100 K is close to the
spin-only value pefr = gy /S (S 4- 1) with S = 1/2 and g K 2 , as expected in the absence of orbital
degeneracy.

84
3.5 LiV 0 Sample 1
3.0
2.5
2.0 <D
Q.
obs
eff eff 0.5
eff eff
0.0 50 100 150 200 250 300 350 400 0
T(K)
Figure 4.14 Observed effective magnetic moment in (MB , p°^, versus tempera
ture T of LiV204 sample 1 (filled diamonds). Also shown as the
cxirves are the predictions for ions and for ions by
Kotani [138], and for an equal mixture of and d^ ions.

85
Spin-1/2 Kondo model and Coqblin-Schrieffer model
\Obs(T) data for /-electron HF compounds are often found similar to the predictions of the single-
ion Kondo model [57. 143, 144. 145. 58] for spin 5 =1/2 or its extension to 5 > 1/2 in the Coqblin-
Schrieffer model [146. 147]. The zero-field impurity susceptibility xcsiT) of the Coqblin-Shrieffer model
was calculated exactly as a function of temperature by Rajan [147]. His numerical results \cs{T] for
impurity spin J' = 112 7/2 show a Curie-Weiss-like 1/T dependence (with logarithmic corrections)
for T T n . where TK is the Kondo temperature. As T decreases, \ c s { T ) starts to deviate from the
1/r dependence, shows a peak at 7" ss 0.27^: only for J > 3/2. and levels off for T ~ 0.2TK for all J/.
In the zero temperature limit the molar susceptibility ior J = S = Xjl (which corresponds to the
5 = 1/2 Kondo model) is [147]
0.10268A*A5-^i, X c s ( T ^ Q ) = , . (4.36)
KBTK
Setting g = 2. and using the intrinsic x { T —v 0) = 0.0049cm^/(molV) for LiV'204 sample 1 from
Eq. (4.3). Eq. (4.36) yields the Kondo temperature
rK=32.1K . (4.37)
On the other hand, if the 5-value of 2.103 from Table 4.4 (100-400K range) is employed instead, the
Kondo temperature is
TK = 35.5 K . (4.38)
The temperature dependence of the impurity susceptibility of the 5 = 1/2 Kondo model was obtained
using accurate Bethe ansatz calculations by Jerez and .A.ndrei [148]. We fitted these results by the
following ratic- of polynomials
Xcs^'B^k _ ai + a2X + asx-+ a4X^ on^ o '' """""""""""" 1 J • (T.tiy)
^A5-A'B 05-t-aex-f-071--I-agx-^-I-r-*
where x = T / TK . This analytic form converges to a finite value for T —>• 0. and approaches a Curie law
(oc 1/r) in the high-T limit, as required by the Kondo model. The coefficients for the fitting range
0.012849 < X < 102.53 are listed in Table 4.5. The numerical data of Jerez and Andrei and our fit to
their data are plotted in Fig. 4.15. The rms deviation of the fit values from the Bethe ansatz calculation
values is 0.13%. and the maximum deviation is found to be 1.0% at the upper limit T/TK = 102.53.
For the low-x range of 0.012849-9.5982 (relevant to a fit of the theory to our experimental data), the
rms deviation is 0.01 %, whereas the maximum deviation is 0.04% at T/TK = 8.8867. Using the above-
stated 5-values and Tk from Eqs. (4.37) and (4.38), the xcs(.T) calculations are compared with our

86
\ { T ) data in Fig. 4.16. Note that in Fig. 4.16. both the T-independent \o [Eq. (4.27)] and impurity
susceptibilities are already subtracted from Although the TK values in Eqs. (4.37) and (4.38) are
comparable to those obtained from heat capacity analyses [11. 14]. the 5 = 1/2 Kondo model predictions
for \(T) with these TK values do not agree with our observed temperature dependence. This failure
is partly due to the fact that our \(T) exhibits a weeik maximum whereas the S = 1/2 Kondo model
calculation does not.
Table 4.-5 CoefBcients a„ in Eq. (4.39) in the fits to the theoretical data for the susceptibility
vs. temperature of the J = S = l/'2 Kondo model by Jerez and Andrei [148]
and the Coqblin-Schrieffer model (for J > 1/2) by Rajan [147]. Temperature
ranges of the fits are in units of TK, where TK is the Kondo temperature.
T Range
J = 1/2
0.01-100
J= 1
0.01-.50
J = ZI2 0.01-30
J = 2
0.01-30
J = 5/2
0.01-20
J = Z
0.01-20
J = 7/2
0.01-20
a i 0.73154 0.25221 0.35665 0.60875 3.207 1.0982 1.6387
AN 2.2266 0.618 1.3195 1.8565 3.8544 -0.9116 -2.0406
<13 2.9967 3.2186 7.051 18.001 96.277 43.219 86.929
(14 0.1992 0.51585 1.1 1.7213 2.3977 3.1439 4.1247
AS 7.1161 0.61359 0.34579 0.29505 0.88917 0.1899 0.18853
AE 21.571 1.5457 1.3861 1.0586 1.5409 -0.025662 -0.027465
0.7 38.441 6.8847 4.5961 4.8049 11.558 3.0354 3.2449
as 20.245 6.5961 7.3312 10.359 36.633 11.234 17.468
-As noted above, the Coqblin-Schrieffer model for J > 3/2 does give a peak in \cs(T). W'e fitted
the digitized theoretical \(T) curves for this model calculated by Rajan [147], for various T ranges of
fits, by Eq. (4.39). The fitting coefficients a„ for 1 < < ~/2 are listed in Table 4.5. We used the
fitted curves to calculate the ratio
r(%) = \cs{0)
where is the value of \cs at the peak. The calculations give r = 2. 7. 11. 17 and 22% for
J = 3/2. 2, 5/2, 3 and 7/2, respectively. The observed value is r = 8.2% in sample 1, which is between
the theoretical values for J — I and 5/2. Using the an coefficients for JT" = 2 and 5/2 from Table 4.5.
we have fitted \cs to our x(T) data of sample 1 for T = 2-400 K with three free parameters. \o. g and
TK. The fits are shown in Fig. 4.17 and the parameters are
Xo = 2.3(3) X 10-''cm^/mol , 5 = 0.790(3) , TK = 97.8(6) K {J = 2) , (4.41)
Xo = 6.9(9) X 10-''cmVmol , 5 = 0.591(7) , TK = 103(2) K (J = 5/2) . (4.42)

87
0.10
0.08 C\J
CD
C\J 0.06
<
0.04
0.02 -
0.00 20 40 60 80 100
Figure 4.15 Belhe ansatz calculation of the magnetic susceptibility x for the
spin S = 1/2 Kondo model by Jerez and Andrei [148], exhibited in
terms of the dimensionless reduced susceptibility
as a function of T/Tk, where TR is the Kondo temperature. The
inset shows an expanded plot at low temperatures.

88
12
10
8
6
4
2
0
' 1 ' 1 1 1 1 1 1 1 1 1 . , . LiV 0 Sample 1
• 3C-X„
_ • •
-
•
•
\" • *
•
1
1 , 1 .
* -
•
- •
1 . 1 , 1 . 1 , 1 ,
0 50 100 150 200 250 300 350 400
T(K)
Figure 4.16 Temperature T-dependent part of the intrinsic magnetic suscep
tibility, X — Xoi versus T for LiV204 sample 1 (filled circles).
Also shown as solid and dashed curves are the predictions of
the spin S = 1/2 Kondo model for (<?, Tk) = (2,32.1 K) and
(2.103.35.5K), respectively, where g is the ^-factor eind Tk is the
Kondo temperature.

89
The J = ' 2 curve fits our \ { T ) data fairly well. However, the 1.5 d-electrons per \' ion could not give
rise to a J value this large; the very small value of g is also considered highly unlikely.
On the basis of the above analysis we conclude that the Coqblin-Schrieffer model for J > 1/2 and
the 5=1/2 Kondo model cannot explain the intrinsic susceptibility of LiV'oO^ over any appreciable
temperature range.

90
12
10
8
10 15 20 25 30 35 40
LiV^O^ Sample 1 J = 2 fit
J = 5/2 fit
50 100 150 200 250 300 350 400
T(K)
Figure 4.17 Intrinsic magnetic susceptibility x of sample 1 versus temperature
T and fits by the Coqblin-Schrieffer model prediction in Eq. (4.39)
for spin J = 2, and 5/2, using the corresponding a„ coefficients
in Table 4.5. The inset shows an expanded plot of the data and fits below 40 K.

91
5 RESISTIVITY
Resistivity measurements using powder samples
Resistivity p ( T ) measurements of polycrystailine oxide samples are often misleading. They of
ten display not only qualitatively incorrect temperature dependences but also quantitatively incorrect
magnitudes. This uncertainty is usually caused by extra resistance coming from grain boundaries of
powder samples. Therefore, the intrinsic electronic transport properties cannot be evidenced from such
measurements on polycrystailine samples. Nevertheless, when a polycrystailine sample undergoes a
transition to a superconducting state, a sharp drop in p(T) at the transition temperature T.^ may be
usually observed.
For LiV'204 the resistivity measurements on polycrystailine samples in the past showed semicon
ducting behaviors [9. 149]. We also observed a semiconducting behavior, partly due to bad contacts
of platinum %vires to powdery sample pellet surface. Superconductivity was not observed above 0.01 K
from p{T) measurements on a polycrystailine pellet (sample 3) [11].
Analysis of single crystal resistivity measurements
Despite the" failure to show the metallic conductivity definitively from powder samples, single crystals
of LiV204 showed metallic T dependences in the resistivity p{T) as noted in Chapter 1. We digitized
the published p{T) data of Rogers et al. [3]. which were plotted as log(p) vs. T. and replot here
the data on linear scales in Fig. 5.1. Although p(T) increases monotonically with T as expected for
a metal, the magnitude of p is not as small as for typical metals (0(p)=l/iflcm) [150]: 58(1) and
638(18)/iQcm at T = 4 and 299 K. respectively, for "Crystal 2". The resistance ratio for this crystal is
p(299 /\')/p(4 K) = 11. In Fig. 5.1. a strong but smooth downturn in p[T) occurs at T w 30 K. evidently
s i g n i f y i n g t h e c r o s s o v e r t o t h e h e a v y F e r m i l i q u i d r e g i m e w i t h d e c r e a s i n g T .
In strongly correlated electron systems such as /-electron HF compounds, the low-T resistivity
e.xhibits a T- dependence arising from Umklapp scattering processes between conduction electrons.

92
1.2
1.0
0.8
E o a 0.6
£
0.4
0.2
0.0 0 100 200 300 400
T(K)
Figure 5.1 Electrical resistivity p of LiV204 single crystals versus temperature
r, digitized from Fig. 1 of Flogers et al. [3]. Open squares, closed
circles and closed triangles correspond to Crystals 1, 2 and 3, re
spectively. Crystal 2 had a rectangular shape, whereas the other
two had irregular shapes. Only three data points are given in [3) for Crystal 3.
I I 1 1 I 1 1 1 I I I r 1 1 1 1 1 r
LiV O 2 4
• Crystal 2 (Rectangular shape)
° Crystal 1 (irregular shape)
^ Crystal 3 (Irregular shape)
Rogers et al. (1967) O ^ *
•
° • •
• • • CD • A
• A ° •
O A • #
-
' ' ' ' ^ ' • • ' ^ ' ' ' ' ^ ' ' ' ' ^ '

93
Combined with a residual resistivity pQ. the resistivity at low T is wTitten as
p ( T ) = p o + A T - . (5.1)
In 1986. a universal linear relation between A and 7". the square of the electronic heat capacity coefficient
at 7" = 0. was postulated for /-electron HF compounds via the so-called Kadowaki-Woods plot [66].
The p ropor t iona l i t y cons t an t t hey found was ( .4 /7 - )HF = l -O x 10~°^ f i cm (molK/mJ)* . Miyake e t a t .
[151] subsequently deduced this proportionality constant theoretically, along with a corresponding value
for common transition metals (.4/7-)t.\i — 0.4x 10~®/incm (molK/mJ)-. They concluded that the
origin of the factor of 25 ratio between the A/-/- values for the two classes of compounds arises from
different degrees of frequency dependences of the conduction-electron self-energy. Many-body effects
yield the large proportionality constant for HF compounds. Yamada et al. [65] derived this proportional
relationship in Fermi liquid theory using the periodic Anderson Hamiltonian.
•Although there are not many low-J p { T ) data points available in Fig. 5.1 (the lowest T datum is at
4K). we have fitted the lowest two data points for each of Crystals 1 and 2 by Eq. (5.1) to obtain very
rough estimates of the T" coefficient .4. For Crystal 1. we obtain po = 81/if2cmand .4 = 0.45/iQcm/K-.
whereas for Crystal 2 we get po = oO/iQcm and .4 = 0.49^Qcm/K". The fit for Crystal 2 is plotted as
the solid curve in Fig. 5.2. If the value of .4 is estimated from the (.4/7* )XM proportionality constant
for transition metals using po = SO/xficm and -/{T = IK) = 210mJ/[(molV') K"]. it is seen from the
plot of Eq. (5.1) in Fig. 5.2 (dotted line) that the value of (.4/7-)TM for transition metals evidently
does not fit the experimental data. Using the average of the two values of .4 obtained above for LiV'204.
.4 = 0.47^Qcm/K-. this (.4.7) data point for LiV204 is on the straight line in a plot of .4 versus ->
which many HF compounds cluster around as shown in Fig. 5.3.

94
0.8
0.6
0.4 LiVO Crystal 2 -CL
Data
A=0.49 |in cm/K^
A=0.018 cm/K
0.2
0.0 100 200 300 0 400
T(K)
Figure 5.2 Electrical resistivity p of LiV204 "Crystal 2" versis temperature
T, from Rogers et al. [3|, and a fit (solid curve) to the lowest two
data points by p{T) = po + AT"^. The dotted line is a plot of the
same expression for p{T) but with a smaller value of A which was
estimated assuming the proportionality constant A/7^ appropriate
to ordinary transition metals.

95
100
1
E o
G 0.01
<
0.0001
10'®
1 10 100 1000 lO'^
Y (mJ/mol K^)
CeCu
CeCu_Si CeAl
USn CeB 3 -i.
UAI UPt
UPt LiV O 2 - 4 V O Uln,
Nb Sn UGa
CeSn Pd
e,Co
Figure 5.3 Kadowaki-Woods plot of the electrical resistivity T"^ coefficient .4
in Eq. (5.1) versus electronic heat capacity coefficient 7 for LiV204
and various other transition metals and /-electron HF compounds.
The solid straight line satisfies (A/7-)hf = 1.0 x 10"®;incm
(molK/mJ)", the empirical relation found by Kadowaki and Woods
[66] for strongly correlated electron systems. The dashed line rep>-
resent the proportionality constant (J4/7-)TM = 0.4 x 10~®/iQcm
(moIK/mJ)- for common transition metals [151].

96
6 HEAT CAPACITY
It is no exaggeration to say tiiat heat capacity plays the most important role in the study of heavy
fermion (HF) compounds. .A. large linear (i.e.. electronic) in T heat capacity at low temperature T is
the first requirement for a material to be called a heavy fermion compound, because the large slope
implies a large effective mciss in the Fermi liquid picture.
The measurements were carried out under ambient pressure and no applied magnetic field using a
conventional semiadiabatic pulse calorimeter from 1.2 to 108 K [152] by Dr. C. .K. Swenson on samples
provided by the author. Six LiV204 samples with vatied but small amounts of magnetic and structural
impurities were measured. In addition, in order to estimate the lattice contribution to the total observed
heat capacity, isostructural nonmagnetic insulator spinel Li4/3Ti5/304 and isostructural superconduct
ing LiTi204 samples were measured. The absolute and relative accuracies of the measurements are.
approximately. 3% and 19^. respectively. For LiV'204. the measurement accuracy was improved to
~ 0.1% at low T where the measured heat capacity is enhanced strongly due to the HF behavior.
Some structural and magnetic properties of these samples from Rietveld refinements of powder x-ray
diffraction patterns and magnetization verus applied magnetic field isotherm (T = 2-6 K) analyses are
already tabulated in Tables 3.4 and 4.1. respectively. Theoretical modeling of the heat capacity data
was done by Dr. D. C. Johnston and Dr. C. Swenson. and is described below. This chapter closely
follows the draft of a paper in preparation [14].
Heat capacity measurement results
Overview
An overview of our isobaric heat capacity Cp measurements are given in Fig. 6.1 (a) for LiV204
sample 2 (run 2; 1.26-78 K) and sample 6 (1.16-108 K), along with the two titanium spinel Lii+i;Ti2_r04
compounds (x = 0 and 1/3; both up to 108K). Shown in terms of CpjT in Fig. 6.1(b). the peculiar
strong upturn below ~ 25 K is readily seen for LiV204, while the LiV204 data above ~ 30 K appear to be
shifted by a constant from those of the Ti spinels. The data for both Ti spinels are in good agreement

97
LiV,0^ #6 2 4
LiV #2
Q. 20
LiTi^O,
20 40 60 80 100
500
400 CVJ
I 300
E
O
200
100
0
—,—1 • 1 ' <—1—1—'—i—' —I—'—'—1—f—' ' 1 '
0
; \ LiV^O^ #2, 6 /
^'4/3"^'5/3^4 •
— t JF
( b ) :
1 . . . 1 . . . . 1 . •
20 40 60 T ( K )
80 100
Figure 6.1 Overview of the molar isobaric heat capacity Cp (a) and C^/T
versus temperature T for LiV204 samples 2 and 6, as well as those
of LiTi204 and Li4/3Ti5/304. The solid curves are polynomial fits
to the data for LiV204 and LiTi204 (in normal state), whereas
the dashed cvirve in (b) is the inferred normal-state Cp/T for the
superconducting LiTi204 below Tq.

98
with those of McCallum e t a l . [94]. In the following sections, the detailed theoretical modeling by
Johnston et al. [14] on these measurements is reviewed.
Lii+rTi2-r04 (i = 0 £ind 1/3)
It should be noted that the C p ( T ) data of the two Ti spinels are slightly different. From Fig. 6.1(b).
in the range between ~ 25 K and ~ 45 K. Li^/sTis/aO^ shows larger Cp values than LiTi204 which is in
the normal state in this T range (note = 11.8 K: see below). Outside this T range, the relationship
becomes opposite. The measured Cp of Li4/3Ti5/304 is equal to the lattice heat capacity of this
compound since the compound is an insulator (i.e. no electronic contribution Ce). On the other hand.
LiTi204 has both C'" and Ce contributions. Since Ce cannot be negative, one must conclude that
these two Ti spinels have different lattice dynamics.
Superconducting Ti spinel LiTi204
The molar heat capacity Cp data of LiTi204 were fitted by the following power series for several
temperature T segments:
n
where the obtained coefficients .4r, are given in Table 6.1. The fits to LiTi204 C p ( T ) are shown as solid
curves in Fig. 6.1. Cp/T data and fits to them (solid curves) for LiTi204 are shown in Figs. 6.2 up
to T = 20 K with respect to T (a) and T" (b) in which the sharp superconducting transition is clearly
seen.
The normal-state heat capacity parameters 7 and 3 are determined as follows. The heat capacity
Cp(7') of a conventional metal in its normal state at low T 6x3 is normally represented in terms
of a linear electronic and cubic lattice (Debye) terms, where 6q is the Debye temperature at 7" = 0.
Cp{T) = tT + /3T^. From Fig 6.2(b) one can easily see the invalidity of the linear relationship of Cp/T
with respect to T' as long as the coefficient of the linear term. 7, is assumed T-independent. This is
probably due to the insufficient approximation of C'^'(r) by the Debye term at Tc- To remedy the
problem, a term is added to Cp(T). while 7 is still assumed T-independent. Under these ctssumptions.
the normal-state parameters 7 and 3 were determined from the fit to the normal-state Cp(T) from 14
to 19 K by
Cp(T) = A^T + AzT"" + , (6.2)
where 7 = .4i and /? = .43. When inferring the normal-state Cp(r) behavior of a superconducting
compound, one has to preserve the entropy 5 in a given T range. In this case, the Cp(T) for 14-19 K

99
LiTi O
o E
E
T ( K )
50 "o E 40
>§. 30
?n
Figure 6.2 Expanded plots below 20 K of the molar heat capacity divided by
temperature Cp/T versus temperature T for LiTi204 from Fig. 6.1.
The solid curves are fits to the data [Eq. (6.1) and Table 6.1], wrhile
the dashed curve is the estimated normal-state Cp/T [Eq. (6.1) and
the last column in Table 6.1] from 0 to 19 K.

100
Table 6.1 Coefficients .4„ in the power-series fitting function C p ( T ) = for the
measured Cp data [in units of mJ/(molK)] of LiTi204 in the given T ranges
for fitting. The values of .-l„ given in the last column were obtained under a
constraint of the entropy S = 283.41 mJ/(molK) at 13 K.
n 0-4 K 4-11.8K 11.8-13K 14-108K 14-19K
0 0 91.14920 21.2823 -835.1008 0
1 0 -68.14413 0.6003 267.5082 18.345
2 0 16.15982 0 -27.72682 0
3 0.4449394 —0.9316757 0 1.472060 0.053476
4 0 0.03530610 0 -0.03288067 0
5 -0.04713193 0 0 3.885628x10-^ 7.7680x10-^
6 0 0 0 -2.351512x10-® 0
7 5.417518x 10"^ 0 0 5.732396x10-^ 0
8 0 0 0 0 0
9 -2.017705x10--' 0 0 0 0
10 0 0 0 0 0
11 2.492636x10-" 0 0 0 0
was determined by the fit using Eq. (6.2) in such a way that the value of S calculated from this fit
matches at 13 K the measured entropy S = 283.41 mJ/(molK) which was derived using the fitting
parameters in Table 6.1. The fit results are given in Figs. 6.2(a) and (b) and Table 6.1 (last column).
The Debye temperature may be derived by using the relation = (12-"'.VAr/J)^^^ [153]. where
.\'A is the .A.vogadro number and r is the number of atoms per formula unit (in this case r = 7). The
normal-state parameters for LiTi204 determined in this way are
7 = 18.4(1) mJ/(molK") . (6.3)
3 = 0.054(1) mJ/(mol K"') . (6.4)
6o = 632(4) K . (6.5)
This -• value is slightly smaller than those 20-22mJ/(molK-) reported previously [94. 135]. Including
an additional T~ term in Eq. (6.2), the fits for the T fitting range 14-17K to 14-21 K yielded 7 =
18.97(12)mJ/(molK") and/? = 0.0321(18)mJ/(molK''). This 7 value is close to that in Eq. (6.5). but
3 is very different. This smaller 3 value gives a larger Debye temperature = 751(15)K, and the
difference is discussed below in connection with values of the other Ti spinel Li4/3Ti5/302-

101
Nonmagnetic insulating Ti spinel Li4/3Ti5^304
In Fig. 6.3(a). C ^ j T for Li4/3Ti5/304 is plotted versus T - for T < 20 K. The small anomalous
bump seen at ss 7K is most likely an experimental artifact since it was present in all samples with
small low-T heat capacity. The addenda contribution was recently remeasured. and the subsequent
corrections are in progress at the present time. The electronic term = ->T does not exist in the
insulating Li4/3Ti5/304. and 7 indeed appears to be zero for the data above T % 7.8 K where the
anomalous bump occurs. Again, it is clear from the noniinearity of C^jT in Fig. 6.3(a) that the low-T
approximation of C'®^(T) by the Debye term is not sufficient. Therefore, the following fits were
carried out to the data above the anomaly.
The first fit was to C p f T versus T in Fig. 6.3(a) by
^ = .43r-+ .457^ . (6.6)
The upper limit of the fitting range was taken from 12 to 16 K. and the fitting results were found to be
insensitive to the exact range. The parameters obtained from the 7.8-14 K fit range are
.43 = J = 0.039(3) mJ/(mol K'') . .45 = 2.3524 x 10""'mJ/(mol K'') . (6.7)
where = 704(19) K can be derived from 3 . The fit is shown as the solid curve in Fig. 6.3(a).
The second fit was to Cp/T^ versus T in Fig. 6.3(b) in the 7.8-24.5K fitting range by
= -43 + -457'" + .47! , (6.8)
with parameters
.43 = J = 0.03309(1 l)mJ/(molK-^) ..45 = 3.274x lO""'mJ/(mol K*^) . .47 =-2.935x lO"" mJ/(mol K®) .
(6.9)
This value of -43 corresponds to 0D = 744(1) K. The fit is given in a solid curve in Fig. 6.3(b).
Furthermore, do = 747(2) K was obtained from a fit including a term in Eq. (6.8). Including one
additional higher order T® term, 0D became 716 (28) K.
Including rather conservative error bars from all these fits, the 7" = 0 Debye temperature 60 is
inferred to be
So = 718 (30) K . (6.10)
Debye temperature
We anticipate that the Debye temperature 6u for LiTi204 is smaller than that for Li4/3Ti5/304
for the following reasons. First of all, the larger molecular weight of LiTi204 may be responsible for

102
CNJ
O E
E
O
40
35
30
25
20
15
10
5
0
—1—r- • I • 1 • 1 • 1 ' ' y k '
" '-'4/3''''5/3^4 /•
. Fit: p = 0.039 mJ/mol > F
: (0^ = 704 K) / -
t . ! . 1 ! . 1
(a) ; I . I .
0 50 100 150 200 250 300 350 400
T2 (K2)
0.14
0.12
0.10 "5 E 0.08
0.06
^Q. 0.04 o
0.04
0.02
0.00,1-0
r-i 1 1 • 1 • 1 —1—'—
, 1
• X
4 P = 0.0331 mJ/mol -
(0p = 744 K)
1 . 1 . 1 1
(b) ; 1
100 200 300 400 500 600 -2 fu'2\ T- (K^)
Figure 6.3 Molar heat capacity of Li4/3Ti5/304 divided by temperature T .
C p / T (a), and C p / T ^ (b), versus 7"^. The fits by Eqs. (6.6) and
(6.8) are shown in a solid curve in (a) and (b), respectively.

103
the smaller 0D since the Debye temperature is inversely proportional to the square root of the formula
weight. Second the screening of interatomic electric forces by conduction electrons in LiTi204 would
relax the lattice motion, in a sense, decreasing the "spring constant." This then yields a smaller ^D-
However, the Debye temperatures for LiTi204 obtained in the two ways from the analyses of Cp
differed by more than 100 K. The higher value of = "51K for LiTi204 e.xceeds = 718(30) K
[Eq. (6.10)] for Li5/3Ti5/304. This is opposite to what one expects from the reasons mentioned above.
Uncertainty exists for Li4/3Ti5/304 because of its structural disorder at the octahedral (16d) sites. This
can be more easily seen if one realizes this insulating spinel is an intermediate spinel Li[Lii/3Ti3/3]04
in which one third of the 16<^ sites are occupied by Li. presumably at random. It is not clear how
this influences the comparison of the values of the two Ti spinels. Therefore, since the two fits for
LiTi204 were found to have similar quality, taking the two values into equal consideration, not being
biased by the of Li4/2Ti5/304. one obtains with conservative error bars
6»d = 700 (70) K . (6.11)
This uncertainty in Cp of LiTi204 does not have a significant effect when the lattice contribution of
LiV204 to Cp is estimated since the Cp of LiV204 is much larger at low T than the inferred normal-state
Cp of LiTi204 below Tc-
.\long with this Debye temperature, some characteristic values of the two Ti spinels are summarized
in Table 6.2.
Table 6.2 Characteristics of Lii+rTi2_r04 samples.
an u TC AJc ACp/-,rc Ref.
( A ) (mJ/moIK") (K) ( K ) ( K ) (mJ/molK")
LiTi204
8.4033(4) 0.2628(8) 18.7(4) 700(70) 11.8 :So.2 1.62 [14]
8.4033(1) 0.26275(5) [154]
8.41134(1) 0.26260(4) [93]
8.407 21.4 685 11.7 1.2 1.59 [94]
22.0 535 12.4 0.32 1.57 [135]
0.26290(6) (300 K) [155]
0.26261(5) (6K) [155]
Li4/3Ti5/304
8.3589(3) 0.2625(3) 0 718(30) [14]
8.35685(2) 0.26263(3) [93]
8.359 0
0.05
610
518
[94]
[135]

104
LiV.O^
Despite the above uncertainty in estimating for LiTi204. we expect tiiat the lattice dynamics
and C'"(r) of LiTi204 may reproduce those of Li\'204 much better than Li4/3Ti5/304. This is partly
because LiTi204 with a normal spinel structure is structurally closer to the normal spinel Li\'2 04.
compared to the intermediate spinel Li4/3Ti5/304. Also, the Ti normal spinel has a formula weight
closer to that of the V spinel. Hence, the lattice heat capacity of LiV204 is assumed to be identical with
that of LiTi204. and the small difference between the formula weights (3.5%) is neglected. The second
assumption is reasonable since this 3.5% difference results in an even smaller difference in the Debye
temperature (~ 1.8%), which is now close to the accuracy of measurements at high T. The electronic
heat capacity C^{T) of LiV'204 was determined by subtracting of LiTi204 from CpiT) of the
former.
The Ce(r) of LiV204 (samples 1 and 6) derived in this way is plotted a£ Ce versus T in Fig. 6.4(a)
and C^jT versus T in (b). An expanded C^jT versus T plot below 9K for LiV'204 samples 1. 3
and 6 is displayed in Fig. 6.4(c). Sample 2 shows a small positive curvature in C^jT below ~ 3K.
opposite to the behavior of samples 3 and 6. From Table 4.1. sample 2 has a larger magnetic impurity
concentration (0.2%) than samples 3 (0.1%) and 6 (0.01%). Therefore, this positive curvature for
sample 2 is a reflection of the larger magnetic impurity amount in the sample, and the other purer
samples are believed to reflect intrinsic behaviors. Sample 6 shows a positive deviation from the other
samples below 4K. showing the similar sample dependency in the susceptibility (see Figs. 4.8). The
cause of these quantitative differences is not known.
In order to estimate the T" = 0 value of-/(T) = C^jT. fits to the Ce/T data for 1-9 K by the following
polynomial were done for samples 3 and 6:
C ^ = 7(0) + 5]] ConT-" . (6.12)
n = l
where the obtained Cin coefficients are listed in Table 6.3. The determined electronic heat capacity
coefficients 7(0) are
7 (0) = 426.7(6) mJ/(moI K") (sample 3) , (6.13)
7(0) = 438.3(5) mJ/(mol K") (sample 6) . (6-14)
In Fig. 6.4(c) the fit curves for samples 3 and 6 are respectively given as the solid and dashed curves.
These 7(0) values are an order or more larger than values for conventional transition metal compounds.

105
10
8
o 6 E
o
440
420
c^' 400
"o 380 E -3 360 E
340
O 320
300
280
LiVO . J
ii i!i'
.H"
• Sample #2 (Run #2) » Sample #6
(a)
20 40 60 80 100 T{K)
E 200
O 100
LiVA
Sample #2 (Run #1) " Sample #2 (Run #2) Sample #3 Sample #6
— #6 R 1-11 K #3 Fit 1-1 IK
Figure 6.4 Inferred electronic heat capacity Cc{T) of LiV204 samples 2 (runs
1 and 2) and 6 is plotted as C® versus temperature T in (a) and
Ce/r versus T in (b). Expanded plot of (b) below 9K of LiV204
samples 2. 3 and 6 are given in (c). Polynomial fits to the 1.1-10 K
data for samples 3 (solid curve) and 6 (dashed curve) are shown in
(c).

106
Table 6.3 CoefBcients Cn in the expression
for the electronic heat capacity
Ce(r)/T = (in units
of mJ/molK") for LiV'oO^ sam
ples 3 and 6 between 1.1 and 10 K.
C2„ Sample 3 Sample 6
Co 426.70(64) 438.33(48)
Co -4.15920 -5.32731
C4 0.0922899 0.131312
C6 -1.53307x10"^ -2.17162 X10"^
Cs 1.28312 x10⁻⁵ 1.76920 X10⁻⁵
Clo —4.05676 X10"® -5.43349 X10-®
In Fig. 6.5 the T-dependent electronic entropy with respect to that of the lowest T = 1.16K.
S^(T) — 5e(1.16K) for LiVoO^ sample 6 is plotted. The observed large high-T" values above ~ 65 K
surpass the local moment prediction of the maximum spin entropy 2i21n(2) (per mole of LiV'oO^) for
one spin 5 = 1/2 at each V site. R is the molar gas constant. For comparison, this value is given as
a horizontal line in Fig. 6.5. An additional entropy from 0 to 1.16K is 0.505J/(molK). which is found
from extrapolating the C^fT data from 1.16 K to 0 in Fig. 6.4(c).
The magnetically impure sample 4A shows an anomalous peak in C p / T at about 29 K. as plotted in
Fig. 6-6 along with the sample 2 data. Sample 4A also shows a larger upturn below 5 K. From Table 3.4
and Table 4.1. we have already shown some anomalous properties that sample 4 A displayed. First of all.
this sample contains the largest amount of impurity phase (5,mp = 2: 0.8mol%). and the unsuccessful
derivation of the intrinsic susceptibility \{T) shape at low T may suggest some other complex magnetic
mechanism. Next, the lattice constant of this sample is above 8.247 A which is one of the largest (next to
sample 4B for which heat capacity measurements were not done). Recalling that this sample received an
ice-water quenching from 725°C (see Chapter 3), there is a possibility to have some structural disorder,
in particular. Li-V anti-site disorder which could cause this anomaly. Above the "background" a large
amount of entropy AS ~ 0.9 J/(molK) ~ 0.16/?ln(2) is associated. There exist vanadium oxides V'407
and V5O9 which have Neel temperatures of 33.3 and 28.8 K. respectively. However, these oxides cannot
contribute to the extent of the observed anomalous peak, provided the concentration of such vanadium
"impurity" phase is at or below the few percent level [156]. Therefore, it is likely that this behavior is
inherent in this structurally and magnetically anomalous sample. Further study is needed to clarify the
origin of this heat capacity anomaly at 29 K.

107
16
1 4 -
12 -= 2R !n(2)
10
8
6
4
2
0 20
LiV.O, 2 4
Sample #6
40 60
T ( K )
80 100
Figure 6.5 Electronic entropy with respect to that at the lowest temperature
T = 1.16 K. Sc(T) — Se(1.16K), for LiV204 sample 6 versus temperature r.

108
600
LiV O 500
400 Sample #4A
300
Sample 2 100
0 5 10 15 20 25 30 35 40
Temperature (K)
Figure 6.6 Observed molar heat capacity divided by temperature Cp/T versus
temperature T for LiV204 sample 4A. The data of sample 2 are
given for comparison. The solid lines are guides for the eye.

109
Theoretical modeling of electronic heat capacity of LiV204
Single-band spin 5=1/2 Fermi liquid
By introducing an interaction between electrons in ttie Fermi gas adiabatically. one can continuously
transform to a Fermi liquid of quasiparticies. The forms of spin susceptibility \ and electronic heat
capacity coefficient •) = C^/T are not changed qualitatively. In the noninteracting Fermi gas. both
quantities are independent of temperature T. On the other hand, the electron-electron interaction
occurring in the Fermi liquid may alter the distribution function. Therefore. \ and - are no longer
T independent. Some important equations for the Fermi gas and liquid models are summarized in
Table 6.4 Summary of equations of the density of states at the Fermi energy X>(£"F)- of the
spin susceptibility x. of the electronic heat capacity coefficient 7 and of the Wilson
ratio R\\ for the Fermi gas (with superscripts "0"') and Fermi liquid (without super
scripts) models. The definitions of symbols are: (^n') = bare (effective) mass.
= (37r-Ae/V')^/^ = Fermi wavevector, A'e = number of conduction electrons in
volume V. V^lEp) [I'^(£"F)] = density of states at the Fermi energy £"F probed by
susceptibility (heat capacity) measurements. A = electron-phonon coupling constant
(ignored for the Wilson ratios). FQ = Landau parameter, and .4Q = Fermi liquid scat
tering amplitude.
Fermi gas Fermi liquid
\°(0) = = ^^X'0(£F) \(0) =
In most of the literature about heavy fermion materials, the electron-phonon interaction is not taken
into account. Therefore, we also neglect it here, so V^{E^) = P"(£'F).
For LiV204, using
Table 6.4.
. _ V77J*fcF _
"Jmoi = formula weight = 172.82 g/mol . (6.15)

110
Z = number of formula units in a unit cell = 8 . ((3.16)
ao(12K) = lattice parameter = 8.2269 A [11]. (6.17)
^caic(i2j^) _ calculated mass density = 4.123g/cm^ . (6.18)
n = number of conduction electrons per V atom = 1.5 . (6.19)
the following quantities are derived
Yr- = 4.310 X 10""cm~^ . (6.20)
i-F = 1.0847A-^ . (6.21)
Then, using the value of-/(O) for LiV204 sample 3 from Eq. (6.13) and \(0) = 0.0100(2)cm3/mol [11].
the equations in Table 6.4 yield
states P^(£F)=f(^F) = 0.5019
eV (V atom)
m \ stales , ) - 9 Q - 6 — • . ( 6 . 2 2 )
me/ eV (\ atom)
— = 180.5 . (6.23) 771^
EF = ) = 24.83 meV . (6.24) 2r72e \ T n ' J
Tf = ^ = 288.2 K . (6.25) KB
R w = 1.71 . (6.26)
fo^ = -0.42 . (6.27)
= -0.71 . (6.28)
In the Fermi liquid theory, a term proportional to TlnT is often included in addition to the linear
term 7(0)7" in order to account for the T dependent t{T) [157. 158. 159]. That is.
C^(T) = -f{0)T + ST^\n(^^^+0(T^) , (6.29)
where To is the scaling temperature.
•A. Fermi liquid model of Engelbrecht and Bedell [160] formulates 6 as
<Jeb = • (6.30)
and requires that |.4o| < 1 and -^ < F q < oc. The values of F q from Eq. (6.27) and AQ from Eq. (6.28)
for LiV204 both satisfy the requirements. From Eqs. (6.13), (6.25), (6.28). and (6.29), one obtains

I l l
The formulation by Auerbach and Levin [161. 162] and Millis e t a l . [163. 164] for a heavy Fermi
liquid is based upon a Kondo lattice model and yields
which for LiV'204 gives
20Tf V 12
Jm = 0.00135—^ . (6.33) molK^
Fits to the C«/T data for LiV204 sample 3 were carried out using
C A T ) . , ^ 2 , J T \ , , ^ 3 ^ =^(0)+<fr=ln(^-j+£r^ . (6.34)
The fitting was done with or without e . It was found that the fitting parameters 7(0). S and T o depended
upon the fitting T ranges (1.5-5. 10. 15 30 K). The fits for the 1-5. 10. and 15 K T ranges with
« = 0 and the 1-30 K range with e ^ 0 are plotted in Fig. 6.7. From these reasonably good fits, one
obtains
7(0) = 428 (2)^^^^ . J = 1 .9 (3)-^ . (6.35)
which are similar to those found in the heavy fermion compound UPta (Tp = 289 K and m ' j m ^ — 178
[158]): 7(0) = 429-450mJ/(molK=) and J = 1.99mJ/(molK^) [39].
•A large discrepancy is found between the experimental S in Eq. (6.35) and the predicted S in
Eqs. (6.31) and (6.33). Millis [163] found a similar discripancy for UPta and gave some possible reasons.
•Also using Millis" [163] theoretical model, one estimates a much smaller Li Knight shift for Li\'204 than
the observed value (~ 0.04% at room T). which is as small as that in a normal metal (0.00024% at
room T [93]).
Quantum-disordered smtiferromagnetically coupled metal
LiV^O^ shows a negative Weiss temperature from the susceptibility analysis done in Chapter 4.
which indicates antiferromagnetic (AF) coupling between S = 1/2 vanadium spins. However, no mag
netic long-range AF order has been found in pure LiV^O^ from heat capacity [14]. NMR (Chapter 8;
[19]) and muon-spin relaxation [11] measurements above 0.02K. Quantum fluctuations may disorder
a magnetic system in some circumstances. Ziilicke and Millis [95] solved scaling equations and ob
tained the temperature dependence of C^T) due to quantum fluctuations for a three-dimensional AF
coupled metal which is not ordered. Their theory assumes that the magnetic system is close to the
zero-temperature critical point which is defined as a transition point of an AF to quantum-disordered

112
500
400
o 300
200
100
/
/ "
LiV^O, ! / /
/
/
2 4 , /
/ •
- / !
/ •' -
/ #
/
/ /
/
^ / eCr* ^ /'
— Sv /
/
* *
Taj ^ ^
° Sample #2 (Run #2)^^^®^
-
o Sample #3 ^ 3' : 1-5 KCeA"Fit • 1-10 KCe/T Fit -
1-15 KCe^ Fit -
: 1-30 K Ce/T Fit2
10 15 20
T ( K )
25 30
Figure 6.7 Electronic heat capacity divided by temperature, Ce/T, versus T
for LiV204 sample 3. The CdT data are from Fig 6.4(c). The
dashed curves are fits by Eq. (6.34) with e = 0 for 1-5, 10, and
15 K fitting T ranges. The solid curve is a 1-30 K fit with c ^ 0.

113
phase transition at T = 0. A single parameter called the control parameter r governs the zero-I" tran
sition for a given system. This r may depend on T, but also on other parameters such as pressure
and stoichiometry of the material. The possible T dependence of r cannot be found unless another
parameter called u is evaluated experimentally. Therefore, r is assumed to be a constant. LiVo04 has
the structural dimensionality d = 3. dynamical exponent r = 2 (for .A.F) and AQ = 3 (for Heisenberg
spin system) in their theory. The electronic heat capacity they predicted is
Cc oRNoy/r T
where r^c
. (6.36)
F(x)=^^ f dy , Vl + \/r+4j-!;- . (6.37) T- Jo smh" y
In Eq. (6.36) 70 is the electronic heat capacity coefficient at T = 0 from the Fermi liquid theory [ 7 (0)
above], and the second term is the correction due to quantum fluctuations. T' is a characteristic
temperature and R is the molar gas constant. The number a is a constant but cannot be determined
from the theory. It is expected, however, to be on the order of the number of conduction electrons per
formula unit. Therefore, Q ~ 3 is expected for LiV204. The function F(x) is defined in such a way
that f (0) = 1.
In the disordered region in the parameter space, one can separate the quantum regime with T rT'
from the classical regime with T 2> rT'. and the crossover between the two regimes is expressed
as T/T' ~ r"/-. .N'on-integrai, appro.vimate equations of F{x) in the low-T (quantum) and high-T
(classical) limits are available in the original paper [95], Here, the numerically generated F(x) data for
X = 0-100 were fitted by the following equation which is in agreement with both the low-T and high-7"
limiting forms
F ( \ - + 6 2 x ^ 4 - 6 3 X ^ + 6 4 X ^ - ! - 6 5 X ^ 1 -I- -F-67x3 5 ^ g_J.4.5 ^ ^J.5.5
The fits yielded an rms deviation of 0.0019% and a maximum deviation of 0.017%, and the determined
6„ coefficients are listed in Table 6.5.
Using this expression for F { x ) . combined with Eq. (6.36), the fits to our C ^ j T versus T data of
LiV204 sample 3 (see Fig. 6.4(b)) were carried out for several fitting temperature ranges. Table 6.6
shows the determined fitting parameters 70. a. r. T' and the derived 7(0) (see below). The goodness
of fits are indicated in terms of \"/DOF. and are normally considered good when .\"/DOF <?C I.
The fits with 1-20 K or higher ranges were found unacceptable. From Table 6.6 the following are
the inferred parameters for LiV204 based upon the theory of Zulicke and Millis
70 = 800(50)-^^, Q = 2.65(9), r = 0.40(6), T* = 18.9(4) K . (6.39) mol K-

114
Table 6.5 Coefficients b„ determined by a
fit using Eq. (6.38) for the func
tion F(j;) in Eq. (6.36) for the
electronic heat capacity Ce(T) of
a three-dimensional antiferromag-
netically coupled Fermi liquid [95].
n bn
1 -0.21375209
2 -52.743910
3 82.963105
4 381.62915
5 0.10383570
6 -13.440766
7 —68.625506
8 398.22865
9 0.10830681
The fits are given in Fig. 6.8 for 1-5. 1-10 and 1-15K fitting ranges.
When r = 0. Eq. (6.36) becomes
a R N o ^ 7 (0) = -)o — . (O--10)
since F { 0 ) = 1. as defined. This equation states that quantum fluctuations decrease the observed 7(0).
Using the parameters in Eq. (6.39). Eq. (6.40) gives
7(0) = 430(1) mJ/molK- . (6.41)
which is approximately a factor of two smaller than 70 in Eq. (6.39).
The Q = 2.65 is found to be close to the above expectation for LiV204. q ~ 3. However, the value of
r suggests that LiV204 is not very close to the quantum critical point, and would not have long-range
.A.F order induced by a small change of r via pressure or stoichiometry of the material. In fact, the
zinc-doped system Lii_xZnxV204 [83] for 0.2 ~ r ~ 0.9 has shown spin-glass (».e.. short-range) order,
but does not show long-range order until the Zn concentration is as high as 0.95 . In addition, one of our
LiV'204 sample (sample 3) showed spin-glass behavior detected by muon-spin relaxation measurements
[11]. which is believed to be caused by structural defects/disorder existing in the sample (see Chapter 3).
Spin-1/2 Kondo model
The single-impurity spin S = 1/2 Kondo model was solved by the numerical renormalization theory
by Wilson [57] and by the other methods [143, 144, 145, 147, 58. 148, 165. 166]. These solutions are

115
450
400-
350-
300
250
200
150
100
LiV.O, 2 4
Sample #3 Sample #2 (Run #2) 1-5 K Ce/T Fit 1-10 KCe/r Fit
-1-15 K Ce/T Fit
0 10 15 20 25
Temperature (K) 30
Figure 6.8 Electronic heat capacity divided by temperature C e / T v s . T for
LiV204 samples 2 and 3 from Fig. 6.4(b). Fits to the data for
sample 3 by the theory of Ziilicke and Millis [95] are also given for
the fitting ranges 1-5 K (long-dashed curve), 1-10 K (solid curve)
and 1—15 K (short-dashed curve). The fitting parameters are listed in Table 6.6.

116
Table 6.6 Fitting parameters in Eqs. (6.36) and (6.37) for the elec
tronic heat capacity coefficient 7(T) = C^{T)IT of Li\'204
sample 3 by the theory of Ziilicke and Millis [95] for several
temperature ranges of the fit. The goodness of fit \-/DOF
and the derived 7(0) are also given. From the large values of
\-/DOF. the 1-20 K and 1-25 K fits are unacceptable.
T range 70 Q r T ' VVDOF 7(0) (K) (mJ/molK'*) (K) (mJ/molK'^)
1-5 770 2.57 0.374 19.1 0.014 429.6
1-10 862 2.78 0.473 18.3 0.059 428.5
1-15 760 2.61 0.343 19.3 0.027 431.5
1-20 642 2.41 0.178 20.9 1.97 440.0
1-25 541 2.35 0.033 23.9 9.95 467.3
very often represented in complex integral equations which cannot be easily fitted to experimental data.
However. Rajan [147] obtained the zero-temperature-Iimit value of the electronic heat capacity
coefficient for 5 = 1/2 impurity spins. 7(0) per mole of impurities is given by
'W\\kB 5.61714 J/molK 7(0) = —— = = . (6.42)
DiK T k
where .\\ is .\vogadro's number and TK is the Kondo temperature (Wilson's definition [57]). The
number W is called the Wilson number [57] and is given [167. 168] by
W = 7e''''^ff-"'= % 1.290268998 . (6.43)
where In 7 % 0.577 215 664 902 is Eulers constant.
To make use of Eq. (6.42) for 7(0). an accurate Bethe ansatz calculation of Ce(T) by Jerez and
-Andrei [148] was used. Their numerically calculated C^{T) and C^JT versus logioC^/Tii) are plotted
respectively in Figs. 6.9(a) and (b) for 0.001 < T/Ta < 1000. These data were parameterized by the
equations
= . (6.44)
^e(T') _ /(<) = g ( t ) = . (6.4o)
N k ^ T / T K t
/«) = 0-675583268, _ (6.46) 1 + Q5' + o-ei' + d ^ t + a % t +
where t = T / T k - The form of /(<) in Eq. (6.46) was chosen as shown so that the zero-T limit of
Eq. (6.42) is satisfied. Table 6.7 lists the derived a„ coefficients for both fits.

S = 1/2 Kondo Model 0.20
0.15
2 0.10
0.05
0.00 10-10
K
0.7
0.6
0.5
0.4
0.3 e
O 0.2
0.1
0.0 ' ' I I 10-^ 10-2 10"^ 10° 10^
T/TK
Figure 6.9 Accurate Bethe ansatz calculation of electronic heat capacity
(a) and C ^ / T (b) of the S = 1/2 Kondo model, plotted versus
Iogio(^/^K), where T is the temperature and Tk is the Kondo
temperature [145, 148]. The fits to these data by Eqs. (6.44) and
(6.45) are shown as solid curves in (a) and (b), respectively. The
fitting parameters determined are listed in Table 6.7.

118
Table 6.7 Coefficients a „ in Eq. (6.46) in the fits
to the Bethe ansatz prediction for the
electronic heat capacity and C^/T
versus temperature T of the S = 1/2
Kondo model by Jerez and Andrei
[148].
Qn Ce(r) Fit Ce(r)/r Fit
ai 9.1103933 6.8135534
02 30.541094 21.718636
03 2.1041608 2.3491812
04 0.0090613513 0.017533911
05 9.1164094 6.8158433
06 36.143206 27.663307
07 67.91795 48.229552
og 53.509135 40.216156
09 1.7964377 2.4863342
Fitting the theory to the experimental C^jT data [Fig. 6.4(b)]. Eqs. (6.45) and (6.46) yield
r^ = 26.4(1) K . (6.47)
and from Eq. (6.42).
7(0) = 426(2) mJ/mol K" . (6.48)
Figures 6.10(a) and (b) present the fit as a solid curve, along with two dashed curves with slightly dif
ferent values of TK = 25 K and 28 K for comparison. It is clear that the low-7" predicted O/T values are
sensitive to the choice of TK- The derived 7(0) = 426mJ/molK- in Eq. (6.48) is in e.vcellent agreement
with those obtained in the previous two theories: 428mJ/molK" in Eq. (6.35) and 430mJ/molK' in
Eq. (6.41). However, the high T (~ lOK) data are not fitted well, as seen in Fig. 6.10(b).
Local moment high-temperature description
The high-temperature series expansion (HTSE) analysis done in Chapter 4 for the intrinsic suscepti
bility data presents the formulation of magnetic heat capacity CmCT) based upon the same Hamiltonian
[Eq. (4.20)]. The HTSE prediction of Cm(T) given by Rushbrooke and Wood [88] is
C„(T) 2.-lS(S+ I)f / c„(5)\

119
4bU
400
350 "o E 300 -D
250 t: o o 200
150
IUU(L
Fits: S = 1/2 Kondo Model
o .® 3
LiV^O,
o Sample #3 • Sample #2 (Run #2)
T = 26.4 K = 25.0 K
T = 28.0 K
S o Sample #3 • Sample #2 (Run #2)
1 T. = 26.4 K
I 1 I I ' I 1_ '0 10 20 30 40 50 60 70 80
T (K )
Figure 6.10 (a) Electronic heat capacity divided by temperature CciT)/T data
versus T (up to 30 K) for LiV204 sample 3 (open symbols) and a fit
(solid curve) by the S = 1/2 Kondo model, Eqs. (6.46) and (6.47)
w i t h T k = 2 6 . 4 K . A l s o f o r c o m p a r i s o n t h e p r e d i c t i o n s f o r T k
= 25.0 I< (long-dashed curve) and 28.0 K (short-dashed curve) are
s h o w n , ( b ) T h e s a m e f i t w i t h T k = 2 6 . 4 K i s p l o t t e d i n a w i d e r T
range to 80 K with the same data.

120
where t = k e T f J . and r = 6 is the coordination number of V by in Li\'204. The coefficients for
5 = 1/2 with n™" = o are
1 23 65 1183 18971 Cl = • C3 = — . C4 = -z— . C5 = ——— . f6.o0)
2 lb 48 *68 /b80
With these c „ coefficients the HTSE prediction Cm( T ) curve with J / k ^ = 20K (a typical value
found in Chapter 4) is plotted in Fig. 6.11 with our experimental C^{T) for Li\'204 sample 2 and 6. It
is evident that the HTSE prediction Cm(T) displays much lower values than the experimental data, and
that the overall T dependence is much different. The Ce(T) cannot be explained by the local-moment
prediction over the T range of our measurements.

121
10
o E
O
8
CD 4
LiV.O,
Sample #2 \ jri f I i
f ? $•
Sample #6
i t -ei
S®
High-T Series S = 1/2, J/kg = 20 K
0 0 20 40 60 80 100
T(K)
Figure 6.11 Comparison between the experimental Ce(T) dataof LiV204 sam
ples 2 (run 2) and 6 [from Fig. 6.4(a)] and the high-temperature
series expansion (HTSE) prediction of the magnetic heat capac
ity Cm{T) (n"*^ = 5) for the B sublattice of the normal spinel
structure with S = 1/2 and Cn coefficients in Eq. (6.50). A typical
value of y/i'B = 20 K was assumed.

122
7 THERMAL EXPANSION
The thermal expansion of our LiV'204 polycrystalline samples was measured by the use of neutron
diffraction and high-resolution capacitance dilatometry. The neutron diffraction study from 4 to 295 K
was done by Dr. Jorgensen's group at Argonne National Laboratory and reported in [18]. The dilatom
etry measurements from 4.4 to 297 K were carried out by Dr. C. A. Swenson. the present discussion and
modeling of these results closely follow that given by Dr. D. C. Johnston and Dr. C. .A.. Swenson in a
paper in preparation [14]. In this chapter, the results of these two measurements are briefly introduced
and a discussion in terms of the Griineisen parameter T follows.
Neutron diffraction
Chmaissem et al. [18] measured the thermal expansion of our Li\'n04 sample 5 at the Argonne
.National Laboratory. No structural phase transition to a lower symmetry was observed down to 4K.
.A.lso. no impurity phase was detected. This is contrary to our x-ray diffraction measurement result, as
discussed in Chapter 3. The .\-ray diffraction measurement on the same sample 5 showed the V'^Oa
impurity phase. The small negative neutron scattering length of vanadium might have been the cause
of this difference. .Nonetheless, we infer that the difference comes from sample dependence. This is
because using the powder sample 0 on which the neutron diffraction was done we found no V'oOs peaks
in a separate .x-ray diffraction measurement. Although this "neutron" sample and the original "x-ray"
sample are both sample 5. they are from different pieces of the same batch. This is believed to be
the reason that causes these samples to have slightly different lattice parameter ao values, as discussed
below.
Rietveld analyses of the neutron diffraction data at temperatures T from 4 to 295 K were done using
the "GSAS" (General Structure Analysis System) [169]. The refinement results are given in Table 7.1.
The temperature variation of the lattice parameter ao is plotted in Fig. 7.1. The lattice parameter
ao shows a continuous decrease from 295 K on cooling. The T dependence of qq becomes very weak
from ~ 65 to ~ 20K. then another decrease below ~ 20 K follows (see the inset of Fig. 7.1). This low-T

Tablo 7.1 Hesiill.s of (JSAS code Hict veld rcfiiiciiiciils of tlif IKMII roll diffraction
data for 7' = 'I '2i)r)K (ri'siilts for only soloilod 7' data arc sliowii
hero). I'or llic oxygen paraiiiolpr «, llic second choice of tlie origin
for tlie space group is used, as in (lie IVeil V(>1(1 analysis results
of the x-ray diffraction data (see ('hajiter so that, ii = 0.25 for an
ideal closed-|)acked oxygen array. 'I'lie iinit of the lattice i)arnineter
H(j is A, and that for tlie tlieriiial displacciiieni parameters /i is A".
T 295 K 250 K 200 K 150K 100 K 50 K 15 K 4K
"n 8.2'l()Hfl(;}) 8.23(505 (•!) 8,23177(4) 8.22889('l) 8.22737(3) 8.22(588(3) 8.22(587(3) 8.22672(3)
«(Li) 1.10(5) 1.08(6) 1.0(5(()) 0.85 ((5) 0.81 ((5) 0.79(6) 0.73(3) 0,72(3)
/?(V) -0.29(C) -0.32(8) -0.2'1(8) -0.24(8) -0.45(7) -0.50(5) -0.46(5) -0.50(5)
»(()) 0.-18(1) O.H(2) 0.38(2) 0.33(2) 0.27(1) 0.27(1) 0.26(1) 0.24(1)
II ().2() 127(2) 0.2(5128(3) 0.2(5118(3) 0.2(51 M(3) 0.2(5110(3) 0.2(5112(3) 0.26114(2) 0,26111(2) o
\" 1.550 1.300 1.2(58 1.25(5 1,314 1.298 1.523 1.297

124
decrease was found to be reproducible from repetitive measurements.
The slope of ao with respect to T is proportional to the thermal expansion coefficient. The linear
thermal expansion coefficient a is defined
From the neutron diffraction analysis results, we have a decreasing Q(T ) from high T to ~ 65 K. The
A(r) becomes nearly zero from ~ 65 to ~ 20K where there is a very weak T variation of OQ. Below
~ 20 K. q(T) rises again. These behaviors of A{T) were confirmed from the capacitance dilatometer
measurements which are described below.
Capacitance dilatometry
The linear thermal expansion coefficient a { T ) defined in Eq. (7.1) for LiV204 sample 6 was obtained
f r o m c a p a c i t a n c e d i l a t o m e t e r m e a s u r e m e n t s f r o m 4 . 4 t o 2 9 7 K [ 1 4 ] . F i g u r e 7 . 2 s h o w s a { T ) a n d a { T ) / T
for the entire T range. LiV204 and the isostructural LiTi204 [170] have similar room-T values of
Q; 12.4 X 10"*^ and % 15.6 x 10"''K~', respectively. These values are comparable to a at room-
t e m p e r a t u r e o f e l e m e n t a r y m e t a l s , a s s h o w n i n T a b l e 7 . 2 . I n a d d i t i o n . L i V ' 2 0 4 s h o w s a d e c r e a s i n g q ( T )
with decreasing T like conventional metals. However, unlike such metals which show a monotonically
decreasing a(T) as Q(T) = .417" + .437"^ at low T [171], Q(T) of LiV204 shows an upturn below ~ 20 K
after being nearly zero at about 23 K. This strong T dependence can be more readily seen when plotted
as q(T)/T versus T (Fig. 7.2). The curve fitting by the following polynomial equation [Eq. (7.2)] was
done for three T regions, and the An coefficients are listed in Table 7.3.
The zero-temperature limit of a / T is identical to the coefficient .4i determined from the lowest 0-14 K
fitting range, and is found to be 2.002 x 10~~K~-.
From the Q(T) data set, the lattice parameter aQ{ T ) may be generated by the integral a o { T ) =
''q(0)[1 + JQ o:{T')dT']. Usin the above fit Eq. (7.2) for q(T) with the .4„ coefficients in Table 7.3.
aa{T) was calculated assuming ao(0) = 8.226709.4.. This zero-T lattice parameter value was chosen so
that the calculated ao(4K) becomes equal to that from the neutron diffraction measurements. These
calculated ao(T} values based on the dilatometer measurements reproduces well the overall T variation
of ao(T) from the neutron diffraction measurements, as shown in Figs. 7.3(a) and (b). The downturn
of ao{T) for 7" ~ 20K found in the neutron diffraction study is also seen in the derived ao{T) from
(7 .1)
(7 .2) n

125
8.242
8.240
8.238
8.236
'< 8.234 o
^ 8.232
8.230
8.228 h
8.226
8.2274
8.2272
8.2270
8.2268
8.2266
t •
0 20 40 60 80 100
i« • • • • ** * ' ' ' I I I I I t ' ' ' ' I I I I I
50 100 150 200 250 300
T(K)
Figure 7.1 Lattice paramter a o versus temperature T for LiVoO^ sample 5 as
determined from neutron diffraction measurements [18].

126
LiV O Sample 6
300
Figure 7.2 Linear thermal coefficient a(T) (left-hand scale) and a(T)/T
(right-hand scale) versus temperature T for LiV204 sample 6. ob
tained from capacitance dilatometer measurements [14].

127
Table 7.2 Room-temperature values of linear ther
mal expansion coefficients of LiV204 [14].
LiTi204 [170], and some elemental met
als [171].
12.4
Rs 15.6
23.1
22.3
16.5
14.2
24.8
18.9
Li V 2O4
LiTi204
.A.1
Ca
Cu
.A.U
Mg
Ag
the dilatometeter measurements. The difference in sizes of the downturns from the two measurements
differ by more than the accuracies of both measurements: hence, this difference may indicate a sample
dependence. Sample 6 has shown its tendency to yield slightly larger values of the susceptibility and
electronic heat capacity, as already mentioned in Chapters 4 and 6. respectively.
This enhanced behavior in a ( T ) I T below ~ 20K may be seen in relation to that in C p { T ) / T . both
indicating the crossover to the heavy fermion regime. Figure 7.4 illustrates this similarity clearly. To
compare these similarly behaving quantities, one normally calculates the Griineisen parameter F. which
is the dimensionless. normalized ratio of the thermal expansion coefficient to the heat capacity. Using
the volume thermal expansion J (J = 3Q for a cubic material), the Griineisen parameter is defined in
the following Griineisen relation (page 5a in [171])
where is the adiabatic bulk modulus and is the molar volume. The heat capacity at constant
volume C\-(T) may be replaced with the observed, isobaric heat capacity Cp(T) since these two heat
capacity values differ from each other by less than 0.1 % [14]. The volume thermal expansion coefficient
3(T) is usually considered to be the sum of electronic and lattice contributions as in the heat capacity:
that is. J = Je + and Cp = Ce -I- C'". The Griineisen relation is then given as
/?e + nT) = SsV.^^ •
from which we can readily see that we cannot simply assume F as a sum of F^ and F'®'; the temperature

128
8.242 UV o
capacitive dilatometry Sample 6 —
•< . neutron ditfraction . Sample 5 . (Chmaissem et al.. PRL)
o (0
300 150 250 200 50 100 0 T(K)
8.2276 LIV O
8.2274
8.2268 100 40 0
Figure 7.3 Comparison of the lattice parameter ao(T) for the entire temper
ature range (a) and up to 100 K (b) from the neutron diffraction
measurements [18] and that derived from the linear thermal ex
pansion coefBcient a(T) by the integration given in the text. The
neutron study used sample 5, while the dilatometry measurements
used sample 6.

129
CJ
oo^ I O
25
20
15
10
5 -
L i V O s a m p l e s
500
400
- 300
200
- 100
20 40 60 80 100
T(K)
Figure 7.4 Linear thermal expansion coefficient divided by temperature a / T
(left-hand scale) and observed heat capacity divided by temperature
Cp/T (right-hand scale), versus T. The solid curves are fits to the respective data.

130
Table 7.3 Coefficients .4n of the power series Eq. (7.2) used to fit
the observed linear thermal expansion coefficient Q(r)
(in units of K~') for LiV'204 sample 6 in the three
temperature ranges shown. The actual fitting range
of the "0-14 K" range is 4.4-14 K. but the determined
.An coefficients in this range were used to extrapolate to 7" = 0.
n 0-14 K 14-24.5 K 24.5-297K
0 0 8.18273 x 10-" -3.85093 X10-"
1 2.00162 X 10-• " -4.14713 X 10-® 6.03956 X 10-®
2 0 -8.00360 X 10-'° -3.55211 xlO-®
3 -4.44102 X10" 9 4.75726 X10-'' 9.94538 X 10-"
4 0 0 -1.36244 X 10-'-
0 5.40327 X 10" 11 0 1.11678 X 10-'^
6 0 0 —5.68546 X 10~''
7 -3.76734 X 10" 13 0 1.75092 X 10-'®
8 0 0 -2.97738 X 10-"
9 1.38751 xlO" 13 0 2.14217 X 10--5
10 0 0 0
11 -2.08005 x10"'® 0 0
dependences of components of 3 and Cp mix. White [172] showed that
r= rrrrr • (< .0 Ce + C"
Then from Eqs. (7.4) and (7.5) we have
TeCe + r'^'C" = Bslm(^^e + i'"') • (7.6)
so this indicates the need of ^'''•(7') from experiments to a corresponding insulating compound ( e . g . .
LiTioO^ for LiV204) in order to separate out the two Griineisen parameter contributions. Theoretically,
for a metal, Fe = 1 + [<ilnP'(£'F)/(iIn V] (page 10a in [171]), and = —dIn ^D(0)/(iln l". Therefore.
Fe is the direct measure of the volume dependence of the mass-enhanced quasiparticle density of states
at the Fermi level V'(E^). For the Fermi gas, Fe = 2/3, and for elemental nonmagnetic metals one has
Fe = 1.8 (Al), 0.7 (Cu), 2.1 (Fe). 1.7 (Pb) and 2.4 (Pt) [173].
The Griineisen parameter r(T) was computed from the observed a { T ) data in Fig. 7.2 and the fit
to the observed Cp(T) [14] (fitting coefficients not given in this dissertation). The bulk modulus was
assumed to be = [2 ± 0.4) x 10^' N/m", which is the range shown by various similar compounds
[14] including the mineral spinel MgAl204 [174]. Figure 7.5 shows the Griineisen parameter r{T) of

131
Li\'204 sample 6. For the value extrapolated to T = 0. the fit to Q(T) in Eq. (7.2) with the determmed
coefficients from Table 7.3 was used in combination with the fit to the Cp(T). The estimated r(0) is 11.5.
In the limit of T = 0. the lattice contributions J'" and become negligible, so r(0) = feCO) = 11.5.
This value is intermediate between normal metals and /-electron heavy fermion compounds [e.g.. 57
(CeCufl). 150 (CeRu2Si2). 25 (URu2Si2). 34 (UBeia). and 71 (UPta) [175]].

132
LiV O 2 4
Sample 6
I
Figure 7.5 Gruneisen parameter F versus temperature T for LiV204 sample 6.
The solid curve is an interpolation and extrapolation of the data (see text).

133
8 NUCLEAR MAGNETIC RESONANCE
In this chapter, the results analyses of 'Li and nuclear magnetic resonance (\MR) studies of
Li\'204 done by Dr. F. Borsa s group are reviewed, based upon the recent publication by .\Iahajan
et al. [19]. NMR plays an important role in describing how a magnetic system behaves microscopically
in terms of several coupling mechanisms with nuclei. With respect to LiV'204. the ' Li Knight shift I\
approximately varies linearly with the intrinsic susceptibility \ over the whole temperature T range
measured. More specifically. Mahajan et al. obtained the hyperfine coupling constants from the slope
of the shift versus the T dependent spin susceptibility in the high temperature regmie. The ' Li
nuclear spin-lattice relajcation rate 1/Ti manifests the Korringa law (1/Ti a T) below .5K. indicative
of the Fermi liquid state, and shows a crossover to high-T" localized moment behavior above ~ .50 K.
From the presence of only one observed line in the NMR spectrum, it is inferred that there is only
one kind of \' moment, eliminating the possibility of having two different magnetic moments on
and X"'""' on a time scale longer than that of .^IMR. :.e. 10"''sec. In the following, major results from
the published paper by .Mahajan et al. are reviewed. This NMR work was done using five samples 1.
'2. 4.A.. 4B and o of Li\'204.
Linewidthi,
' Li linewidth
.\ nucleus with a nuclear spin larger than / = 1/2 has an electric quadrupole moment, and may
interact with the electric field gradients that the surrounding charges create at the nuclear site only if
the point symmetry of the nucleus site is non-cubic. The Li site in LiV204 is called the 8a position,
and its point symmetry is cubic. Therefore, there is no quadrupole effect in 'Li NMR measurements.
The 'Li NMR linewidth A was obtained from the full width at half maximum (FWHM) of the free
induction decay. The temperature T variation of A was found to be qualitatively similar to that of
the susceptibility, as seen in Fig. 8.1. The width increases as T decreases from high T, and appears to
be very weakly temperature dependent below ~ 30 K. This behavior is similar to that of the magnetic

134
1 0 0
80
60
40
20
li a
I
h -I ^ •I- A-r -il T
I A i
'1 -
'^T - • T
!•!
i i
^ . "I* 2> -U
$ • i i i
I I • ' ' I—'—I—'—' I ' '
o sample 6 (1 T)
° sample 1 echo (1 T)
o sample 4 echo (1 T)
sample 4B fid (1T)
sample 4B echo (1 T)
^ sample 2 fid (1 T)
• sample 2 echo (1 T)
• sample 2 fid (8.2 T)
• sample 2 echo (8.2 T)
A sample 2 echo (4.7 T)
3 3 =
I I t t
100 200 300 400 500 600
T(K)
Figure 8.1 Temperature T dependences of ^Li NMRlinewidth A (FWHM) for
five LiV204 samples. A was found to be larger as the applied field
became larger, and A determined from the Fourier transform (FT)
of the free induction decay (FID) shows a tendency to be larger
than that from FT of the spin echo.

135
susceptibility. Also the linewidth A was found to be sample-dependent. The linewidth tends to be
smaller for a sample with less magnetic impurities. In addition, for sample 2 the measurements were
done under more than one value of applied field H. and the linewidth was found field-dependent. This
suggests that the linewidth is due to inhomogeneities of local fields that the Li nucleus sees. These
results agree well with previous work [97. 149].
linewidth
The linewidth A was determined from the FWHM of the FT of the spin echo signal. Only one
\' site exists crystallographically in LiV204. and is called the 16<f site. The point symmetry of the site
is trigonal Since the nucleus has nuclear spin / = 7/2. quadrupole effects are therefore possible.
However, the •k/2 pulse length on the nuclei was found to be the same as that on the A1 nuclei in
a reference solution under the same coil and power conditions (both nuclei has nearly the same nuclear
gyromagnetic ratio 7). Hence, not only the central transition line (which corresponds to / = ^ —i)
but all the six satellite lines (±^ <->• ±| <->• ±^) were irradiated. In other words, all these lines
are found to be so close to each other that the given pulse could not distinguish them but just saw only
one line due to the overlap. Therefore, quadrupole effects can be neglected.
.\s in the ' Li NMR. the temperature and field-dependent linewidth A was obtained from NMR.
shown in Fig. 8.2. Only one V line was observed. This implies that NMR did not distinguish between
the two possible vanadium valence configurations and V"'""' on the time scale longer than that of
NMR fIO~'^sec). so only one kind of V moment exists. The nuclear dipole-dipole interactions in pairs
^'V-'Li contribute to the observed linewidth a T and H independent term [176].
On the other hand, a T and H dependent contribution to the width comes from macroscopic field
inhomogeneities due to the demagnetization effect of powder samples [177]. By assuming a Gaussian
approximation, the linewidth can be written
where B is the fractional rms deviation of the local field generated by the applied field H . and t/'lTi =
1119.3Hz/G. \v is the observed volume susceptibility, and \v = x°^^d/M. where is the molar
susceptibility, d = 4.105g/cm^ is the density, and M = 173g/mol is the molar mass of LiV^O^. With
the lattice paramter a = 8.24 A. the Van Vleck formula [176] gives
AFWHM (8.1)
(At/")dip = (At'")v-v + {A:/")v-Li
= 4.6 X 10" Hz--1-0.41 X 10" Hz-
(8.2)

136
100
< 40
100 200 300 400 500 600
T(K)
Figure 8.2 NMR linewidth A versus temperature T for LiV204 sample 2.
The linewidth was determined from the Fourier transform of the
spin echo signal under magnetic fields of 1.5 T (open circles) and
4.7T (filled circles). The inset shows the latter data set plotted
a s a f u n c t i o n o f t h e d i m e n s i o n l e s s v o l u m e s p i n s u s c e p t i b i l i t y X v •
The solid curve is Eq. (8.1) with B = 3.6.

137
5.0 X 10' Hz" .
.A. fit of Eq. (8.1) to the observed linewidth yielded B = 3.6. and the fit is drawn as the solid curve
in the inset of Fig. 8.2. The demagnetization effect can give rise to i3 = 4~ • 0.114 = 1.43. assuming
closeiy-packed spheroids. It is suggested that, since the symmetry of the V" site is not cubic, the dipolar
sum inside the Lorentz sphere can give an additional contribution to B to yield this difference. From
this analysis, one finds that the above mean-square width from dipolar interactions in Eq. (8.1) is much
smaller at low T and high H than the other contribution from macroscopic field inhomogeneities due
to the demagnetization effects of powder samples [the second term in the square root in Eq. (8.1)]. For
instance, a rough calculation using B = 3.6, = O.Olcm^/mol at low T and H = A7kG (data points
were actually taken under this field) gives
This value is 44 times larger than the above dipolar contribution. Having this dominating magnetization
term, one can conclude that no more useful information can be drawn from the linewidth analysis than
those already obtained from the susceptibility analyses, since A(T) should behave the same way as the
susceptibility. This conclusion holds for the ' Li linewidth. too. Further analysis of linewidths is not
given.
Knight shifts
' Li Knight shift
The Knight shift K obtained from ' Li NMR is shown versus T in Fig. 8.3. It is quite clear that the T
variation of the shift appears very similar to that of the intrinsic susceptibility \(7"). A Curie-Weiss-like
behavior at high T ~ 50K is observed, and K(T) shows a weak T dependence at low T with a broad
maximum at T ss 25-30 K. Figure 8.4 indicates the approximately linear relationship of the shift with
the T"-dependent. local moment susceptibility \;'°'^(T) above 100 K (see below). From the analyses of
intrinsic susceptibilities \(T), the Curie constants C expected for 5 = 1/2 and ^ % 2 were obtained
in Chapter 4. As mentioned before, this suggests that % Id-electron per V atom is localized and the
remaining 0.5 d-electrons/V are itinerant. This view is taken here for the analyses of Knight shifts.
There are five different possible magnetic contributions to Knight shifts [178, 179]. The first one
is a direct magnetic dipole-dipole coupling of the 'Li nuclear spin to the V local electron spin. The
(8.3)

138
0.20
0.15
^ 0.10
0.05
0.00 0 200 400 600 800 1000
T(K)
Figure 8.3 ^Li Knight shift K versus temperature T of LiV204. In the inset
the data below 100 K is shown.
1—1—1—r 1
0.20
' 1 —1—1—r - . 1
0.20
0.18 - -
\ •• •
: \ • T
^0.16
^ 0.14
0.12
-, y
• r-
I \
-H 1
0.10 1
, " 0.10 1 10 100 •
: 'Li
1 L_ X_
• —
. 1 . , • A
f • •
T(K) :
." . * 1 *: . .

139
0.20
K = -0.0094 + 38.6x'°® 0.15
0.10
^ 0.05
0.00
-0.05 0.002 0.004 0 0.006
(cm^/mol V)
Figure 8.4 'Li Knight shift K versus the local magnetic susceptibility for
sample 6 of LiV204.

140
Hamiltonian in this case is
^dip — 7e'7n^"^
Various symbols used in this and following equations are defined as follows: electron spin magnetic
moment = —gfisS = —-lefiS. where g is the 5-value of the electron. fiQ is the Bohr magneton. 5
is the electron spin angular momentum in units of h. is the electron gyromagnetic ratio, and h is
the Planck constant divided by 2^-; the nuclear spin magnetic moment ffn = where
gn- I and are the nuclear equivalents of the above defined electron quantities: r is the position
vector of an electron with respect to the origin where a nucleus is situated, and r = Ir]: £ (used below)
is the electron orbital angular momentum in units of k. This dipole-dipole coupling yields a zero net
contribution to the Knight shift for an isotropic ^-value. If there exists an anisotropy in the ^-value. the
dipolar contribution to the shift is proportional to [180]. For this cubic system, there can be no
anisotropy in the ^-value for the ' Li in cubic point symmetry and hence this dipole-dipole interaction
cannot give rise to the observed Knight shift.
The second interaction that can contribute to the Knight shift is the so-called Fermi contact inter
action. This is due to the Zeeman-like interaction of the nuclear spin I with the effective magnetic field
that an electron at the nucleus site may create. Therefore, only unpaired s-electrons can give rise to
this Fermi contact interaction. The Hamiltonian is
f ipc = • S6{f) . (8.5)
where d(r) is the Dirac delta function.
The (f-electrons have a zero probability of existing at the site of a nucleus (origin), so the Fermi
contact interaction in the above, direct sense is not possible. However, the (i-electrons can indirectlv
produce a same Fermi contact effect. The (f-electrons can polarize the core electrons in a closed shell
and the paired outer conduction electrons, which then interact with the nuclear spin by the ordinary
Fermi contact term.
The third contribution to the shift is due to the orbital motion of conduction electrons induced by
an applied external field. This orbital motion creates an effective magnetic field at the nuclear site, and
the nuclear spin / interacts with the effective field. In this way. the orbital moment of electrons can
couple with the nuclear spin I by ^ c
^orb — 7e^ (8.6)
The fourth contribution is due to the Laudau diamagnetic susceptibility ^^-Landau conduction
electrons. The Knight shift due to this is proportional to But is negligibly small for
({1.4)

141
(/-electron systems [128]. Therefore, this term is neglected in the following analyses.
Finally, a contribution to the Knight shift can arise from the exchange coupling of the Li nuclear
spin I to the V spins. Each Li has 4 oxygens as nearest neighbors, and each of these oxygens is bonded
to .3 vanadium atoms. Hence, there are 12 V atoms whose spins can couple with one Li nuclear spm by
exchange interactions.
The observed magnetic susceptibility x°^^{T) is written for high T (~ 50 K) as
^OBS(J-) ^ VV ^ CORE ^
where is the orbital Van V'leck susceptibility and is the core diamagnetic susceptibility.
Both of these are temperature T independent. V®P'"(T) is the spin susceptibility which can be further
decomposed in a picture of local moments in metals according to
X»P'"(T) = . (8.8)
where is the Pauli paramagnetic susceptibility of conduction electrons, and \'°*^(T) is T-dependent
susceptibility of local moments. Dropping the dipolar and Landau diamagnetic contributions, the ' Li
Knight shift K can be given as
K{T) = + A " + A ' ' ° ' ^ ( r ) ( 8 . 9 ) J VV (Pauh _) loc
= 2 - + . -VA/^B AA/^B
where the .4"s are the respective hyperfine coupling constants. .A.11 of these susceptibilities are in units
of cm^ per mole of vanadium atoms. The factors of 2 in Eq. (8.10) are to take into account for the fact
that there are two \' atoms per formula unit of LiV204. .4^^ is neglected because of the orbital singlet
Li ion.
The A'-\ analysis was done in Ref. [19] using the local moment susceptibility \'°'^(T). not the total,
observed susceptibility \°''®(T). Combining the three T-independent susceptibility terms into one term
as \Q. and assuming the validity of the Curie-Weiss law for the local moment contribution v'°'^(7'), the
measured susceptibility was fitted by Mahajan et al. [19] to the following equation
= xo + s XO + . (8.10)
in the T range of 100-800 K, using the combined data set of x°''® of our own data [17] and that (high
T part) of Hayakawa et al. [9], yielding (see [181])
,\o = 2.72 X 10~''cm^/(mol V) , (8.11)

142
C = 0.329cm^K/(molV) .
^ =-12.86 K .
These fit results enabled Mahajan et a i to plot K{T) versus \'°'^(7"). T being an implicit variable, in
Fig. 8.4. A straight line fit was done and the fit curve is shown in Fig. 8.4. From the slope, they found
.4'°'^ = 0.18(1) k-G . (8.14)
and from the y (here I\ ) intercept.
A'o =-0.0094% . (8.15)
It is necessary to know the Pauli susceptibility in order to determine the hyperfine coupling
constant .4^®"'' from the intercept. From the A'-\ analysis by Kondo et al . [17] using the Knight
shift and the observed susceptibility for LiV204 sample 2. the orbital Van Vleck susceptibility was
found in Eq. (4.19)
= 1.11(3) X 10-'cm^/(molV) . (8.16)
Using the core diamagnetic contribution x"""® = —31.5 x 10~'^cm^/(mol V). from the equation \o =
and Eq. (8.11) we obtained
^PAUH ^ J ^ 10-'CMV(MOL V) . (8.17)
This value is close to that of an isostructural superconducting LiTi^O^ ~ 1 x 10"'' cm^/(molTi)]
[4. 135]. From this estimate, we determine the hyperfine coupling constant of ' Li nuclei with conduction
elctrons
.4^^"'" =-1.60kG . (8.18)
This value is roughly 1 9c of the atomic hyperfine coupling constant for 2s conduction electrons of Li
metal (122kG) [179]. Having mostly (/-character in a conduction band, this small size is not unex
pected. The negative sign in Eq. (8.18) implies antiferromagnetic exchange interaction between the V
d conduction electrons and the Is core electrons of Li on the polarization. The small size of .4'°"^ can be
explained by the fact that the lithium is located far from the vanadium site where the local moments
reside, so there is very little overlap of the V wavefunctions to the lithium s orbitals.
Knight shift
Knight shift K versus temperature T is shown in Fig. 8.5. The observed shift is negative
throughout, and its T dependence appears to be very similar to that of the susceptibility. This is again

143
0.004 0.002
X (cm /mol V)
0 100 200 300 400 500 600
T(K)
Figure 8.5 V Knight shift K versus temperature T of LiV204 sample 2 (3-3).
In the inset K is plotted as a function of the local moment suscep
tibility using the data of sample 6 (12-1).

144
proved by plotting, in the inset of Fig. 8.5. the shift K as a function of the local moment susceptibility
\iac^T)_ displaying the linear relationship above 74K. Therefore, the linear fit was carried out again as
shown in the inset. Like the case of 'Li. the dipolar contribution is neglected and the equation for A'
in terms of the on-site hyperfine coupling terms is
pVV pPauli ploc
K{T) = -—+ + . (t<.19) ^AMB
where the B's are the on-site hyperfine coupling constants. Unlike the ' Li K case, the orbital Van
Vleck contribution could not be neglected. Therefore, it is not evident how to determme separately
the hyperfine coupling constants ^ and from the A'-intercept A'o in a linear fit. The \' core
polarization by unpaired V d electrons is negative and expected to dominate . But A'o was found
to be positive. A'o = 0.74 kG from the fit. Thus. Mahajan et al . inferred that the positive orbital \'an
Vleck term in Eq. (8.19) should be larger in magnitude than the second term. It is still possible to
determine the other hyperfine coupling constant 5'°*^ from the slope of the fit. They found
5'°<' = -79kG . (8.20)
which agrees well with = —74kG determined by Onoda et al . [149]. In addition, the hyperfine
coupling constant of vanadium metal. = —112kG. is also close and has the same sign [179].
Nuclear spin-lattice relaxation rates
' Li nuclear spin-lattice relaxation rate
The recovery of the nuclear magnetization after a ~ / 2 pulse was found to follow single-exponential
behavior over the whole temperature region (1.5-800K). from which the determination of the "Li
nuclear spin-lattice relaxation rate 1/Ti was made. Figure 8.6(a) shows the T dependence of \/T\ for
sample 2. The nuclear spin-lattice relaxation rate has a maximum at T % 50 K which separates the
T regions into two distinguishable parts. In the low T region (T ~ 10K), the relaxation rate shows
a linear decrease with decreasing T. as can be seen more clearly in the expanded plot in Fig. 8.6(b).
In this T region, it should be noted that both the Knight shift and the intrinsic susceptibility become
nearly independent of T. On the other hand, in the higher T region, as T increases, V/Ti decreases
monotonically. As opposed to the rich temperature variation of LiV204. the isostructural (i.e. cubic
spinel), superconducting LiTi204 follows only a linear T dependence (Korringa relation) from 20 to
300 K which is typical of metals in the normal (metallic and paramagnetic) phase [92]. The room
temperature value of 1/Ti of LiV204 is enhanced strongly, by a factor of about 100, compared with

145
thai of LiTi204. In the following sections, the results in the low-F and high-7" regions are discussed
separately.
Low temperature ' Li relaxation rate
For all five LiV'^O^ samples measured, the linear T dependence in the ' Li nuclear spin-lattice
relaxation rate l/Ti was observed below 4K. as shown in Fig. 8.6(b). It is remarkable to see this
phenomena in samples 2 and 4B. both of which are not as magnetically pure as the other three and show a
Curie-like upturn at low T in the observed susceptibilities. (Note that magnetic impurity concentrations
are listed for all five samples in Table 8.1.) Therefore, small amounts of magnetic impurities/defects are
not capable of suppressing this robust Fermi liquid behavior. The slope \/TiT = 2.25sec~- I\~'' of the
vanadium spinel (samples 1 and 6) is much larger than the corresponding value of 5.6 x I0~''sec~' K~'
for LiTi204 [92].
In a simple metal in which the Fermi contact coupling is the only source for Knight shifts and
relaxation rates, the so-called Korringa relation holds well [179]. The relation is written
K-TiT = S . (8.21)
where for ' Li. »> *
5 = f —) —:— = 1.74 X 10"" secK . (8.22) V-.n/ 47rA:B
From this relation and due to the nearly constant A", one may anticipate that the Korringa ratio
K'TiT/S will be constant for T ~ lOK for LiVo04. This was indeed observed, as shown in Fig. 8.7.
which indicates characteristics of the Fermi liquid state of LiVoO^ in the low T region. The nearly
constant ratio for T ~ lOK is about 0.5. close to the values for normal metals [179], The ratio for
all the five LiV204 samples measured, as well as the Korringa product (TiT)~^. are summarized in
Table 8.1. The Korringa ratios are normally (with a few exceptions) greater than unity for d band metals
[178. 179]. For /-electron heavy fermion compounds such as CeAla [91] YbNioBoC [182], CePdoIn [183],
and CeCuGeo [184], the linear T dependence of the relaxation rate 1/Ti was observed. But it was only
for CeAb that the Korringa ratio could be determined [91]. The temperature dependence of the ratio
from A1 NMR on this compound appears to be qualitatively the same as that of LiV'204. but the size
of the ratio for CeAla. % 2-3. is a few times larger.

146
O (D W
40
30
20
10
. ' ' ' 1 1 ' ' ' ' 1 1 ' 1 ' 1 1 1 i i • • .
LiV 0 : 2 4 -
Sample 2 : • S
» 1
•
'Li • •1 *'
1 ! : -ft - • : i ! . :
- ? i ! i • ! : ; • j
( a ) ^ 1 1 1 1 1 1 1 1 1 1 1 1 1 1 1 1 1 1 1 1 1 '
o (U CO
14
12
10
8
4
2
0
200 400
T(K)
600 800
— — 1 1 1 — !—•.—1—1—r—'
° sample 6
' ' ' I ' ' ' ' 1 ' ' ' '
• ; 3 sample 4B
• sample 1 • * y/'-
sample 4 . - sample 2
•
3 ' •
•
\i i
.X _l , 1 . . . —.— 1 . . (b) :
_ i _ . . . . 2 3
T(K)
Figure 8.6 (a) ^Li nuclear spin-lattice relaxation rate l/Ti versus tempera
ture T for sample 2 for T = 1.5-800K. (b) An expanded plot
for low T (< 4.2 K) for all five samples. The Korringa law with
l/TiT = 2.25sec"' K~' is shown as a straight line.

147
3.0
2.5
CO 2.0
I— 1.5 VJ
1.0
0.5
0.0 ;i 10 100 1000
T(K)
Figure 8.7 Korringa ratio K'TiT/S versus temperature T for LiV204 sample
2. determined from 'Li NMR, where S = 1.74 x 10~®sec K.

148
Table 8.1 Summary of the \ fT\T values and the Kor
r inga rat ios K'TiT/S. obtained from the low T
(1.5-4.2K) ~Li NMR data. Magnetic impurity
concentrations, found under the assumptions of
impurity spin 5,mp = 2 and impurity ^-value
Oimp = 2. are also listed. The error in the last
digit of a quantity is given in parentheses.
Sample Alternative /imp inT)- ' K-TxT/S Name -Name (moI%) (sec~^ K~M
1 4-0-1 0.03 2.25(5) 0.55( 1)
2 3-3 0.35 2.5(1) 0.50(1)
4 3-3-ql 0.08 2.20(5) 0.57(1)
4B 3-3-a2 1.2 3.0(1) 0.42(1)
6 12-1 0.02 2.25(5) 0.55(1)
High temperature 'Li relaxation rate
.-V metallic compound with local magnetic moments may have two contributions to the nuclear spin-
lattice relaxation rate l/Ti. First of all. being metallic. LiVoO^ has a relaxation process proportional
to T (i.e.. Korringa type) by conduction electrons. Second, the relaxation occurs due to the local field
fluctuations which are induced by \' spin fluctuations. A rough estimate of the Korringa term can be
made using the temperature independent A'o obtained in Eq. (8.15). which is the Knight shift in the
high r limit from the linear I\-\ fit. Given A'o = -0.0094% from Eq. (8.15) and 5 = 1.74 x 10"" sec K
from Eq. (8.22). the Korringa product l/TiT is estimated
1 T ' 2
— = -^ = 5(1) X IQ-^sec-'K-' . (8.23) i 1 i o
The isostructural compound LiTi204 has no local moments, and its Korringa product for 20 < 7" <
300 K is 5.6 X lO'^'sec"' K~^ [92], roughly ten times smaller than that of Li\'204. This indicates that
the above estimate in Eq. (8.23) is too large. Therefore, we neglect the Korringa contribution to the
relaxation rate up to 800 K. and the following analysis is done with the spin fluctuation term only.
Moriya [185] derived the following equation for the nuclear spin-lattice relaxation rate due to spin
fluctuations ^
1 _2kBTf-,n\ I , |2 Ax .
where here the total hyperfine coupling constant .4 = .4^ is assumed to be wave-vector q independent,
\ is the imaginary part of the dynamic susceptibility, and wl is the Larmor frequency. To make a
comparison to our uniform susceptibility (both WL and q = Q). the summation in Eq. (8.24) can be

149
written in the limit oftJL —>• 0 as A'A V^'^~/2:r. where is the uniform local moment susceptibility per
mole, and r is the relcixation time of the local moment. The total hyperfine coupling constant should
contain contributions from both exchange hyperfine coupling of Li nuclei to the local moments and
direct dipole-dipole coupling to them. .Assuming that these two coupling mechanisms are not correlated
with each other, the square of the total hyperfine coupling constant is
.4= = 12(.4'°'^)= + . (8.25)
The first term on the right-hand side of Eq. (8.25) describes the transferred hyperfine contributions
from the 12 nearest-neighbor V moments around one Li nucleus, whereas the second term is the "total"
electromagnetic dipolar hyperfine coupling constant due to all the surrounding V spins. .4'°'^ = 180 G
has already been obtained in Eq. (8.14). .4'''p was obtained by Mahajan et al. to be 2.58kG [19].
Substituting these coupling constants and the other fundamental constants into Eq. (8.24) and
rearranging the equation, we now have
i = 1.73 X 10'\'°<^rir . (8.26)
.A. calculation of l/r as a function of T from Ti data was made possible by utilizing the Curie-Weiss
susceptibility from Eq. (8.10). The results are given in Fig. 8.8. A 7^ ^ dependence of l/r has been
obtained theoretically by Cox et al. [186] for the relaxation rates of 4/ local moments in ordinary
/-electron heavy fermion compounds. Experimentally YbCu.Al [186]. CeCu2Ge2 [184]. and Yb.ViTBTC
[187] / -e lectron heavy fermion compounds sat isfy the ^ predict ion for l / r . . \ f i t of the der ived l /r
values for LiV'^O^ was carried out. and the T°^ dependence agrees well with data for T = 200-800 K.
as Fig. 8.8 shows. X T° " dependence was found to fit better when lower T data were included in the
fit.
.•\n analysis of this local spin fluctuation rate l /r may give ideas about the sizes of (e.vchange)
coupling constants of a V local moments. For this analysis, a phenomenological model was employed
for room temperature and above. The fluctuation rate l/r can be written
I 1 1 - = --f— . (8.27) ' ' d 'ex
The first term 1 / T J respresents the fluctuation rate of a local (impurity) spin due to conduction electrons,
given by the following Korringa-like expression [188]
^ = (y)/.-BT(Jp(eF))' = ror . (8.28)
where J indicates the coupling constant of the spin to the conduction band, and /'(fp) is the density
of states per spin direction at the Fermi level. The second term I/TV-X represents the spin fluctuation

150
T i T •5 S 5555 5%
200 400 600 800
T(K)
Figure 8.8 Local electronic V moment fluctuation rate I/r as a function of tem
perature T, calculated from the observed ^Li (dots) and (open
squares) nuclear spin-lattice relaxation rates 1/Ti using Eqs. (8.26)
and (8.40), respectively. A fit by a T® ® dependence based upon
Cox et al. [186] is shown by a solid curve.

151
rate arising from the local moment spin-spin exchange interaction. The high temperature limit for this
term is given by Moriya [185] as
' ex
where is defined via
^ = T: . (8.29)
SJ:-,zS{S + 1)
3h-(S.30)
is the exchange coupling constant from a Heisenberg Hamiltonian in the form 2Jex5, • Sj for a pair
of nearest-neighboring spins, and r is the number of nearest neighbor spins. A linear fit of l/r versus
T by Eqs. (8.27), (8.28) and (8.29) for the 300-700K data points yields
To =4.4(10) X 10®sec"^ K"' . (8.31)
Fi = 1.9(3) X 10^-sec"^ . (8.32)
Equation (8.28) then yields |J|p(fF) = 0.05. Recalling that the Pauli paramagnetic susceptibility
is expressed as
\P^"" = ^^^p(eF) . (8.33)
the value of in Eq. (8.17) yields with g ='2
states P{( F )=2.O4—— . .. . . (8.34)
e\ — V — spm direction
Then the coupling constant | J| can be determined to be
IJl = 19.7(2) meV . (8.35)
or iJexl/^'B = 229K. From Eqs. (8.29). (8.30) and (8.32). we find for 5 = 1/2 and r = 6 (6 nearest
neighbor \' atoms to a given atom)
IJexl = 2.3(4) meV . (8.36)
or |Jexl/^"B = 27K. It is worthwhile to note a few things about the coupling constants. First, one can
express the Weiss temperature 9 in terms of |Jexl- In the mean field approximation, we have
|g|= 2-5(5 +1)1 Jexl OKB
this value is not very close to the Weiss temperature of 12.86K (in magnitude) in Eq. (8.13). Second,
this model suggests that the coupling of the V moment to the conduction electron band is more than
one order of magnitude stronger than that between the local moments.

152
The above method was employed to reanalyze the -°®Bi relaxation rate for the heavy fermion
compound YbBiPt [182]. The obtained coupling constants are
Once again. |J| is one order of magnitude larger than l^exi- In addition, from the work on CeAla
[91]. |Jex| = lOmeV may be inferred. These results indicate that the exchange coupling between
local moments in LiV204 is ~ 4 times smaller than corresponding values for /-electron heavy fermion
compounds.
nuclear spin-lattice relaxation rate
The nuclear spin-lattice relaxation rate 1/Ti was obtained by successfully fitting the recovery
of the spin echo signal by a single exponential. This single exponential fit was possible for the whole
temperature T range. 74-575 K. A lower T measurement than 74K was not possible due to the loss
of signal which was caused by the very short spin-spin relaxation time Tn. The measurement results
are given in Fig. 8.9. along with the data of Fujiwara et el. [97] and Onoda et al. [149]. Throughout
the measurement T range, the relaxation time Ti was found to be very short (20-50 sec). The room
temperature data from the three groups are in good agreement, while at the lower tempearature some
disagreement is seen. Mahajan et al. did not observe a signal at low T (< 74 K). On the other hand,
the successful detection of the signal in this T region by continuous wave techniques (at low fields.
H < 1.5 T) [149] implies that the T\ and/or are so short that the dead time of the receiver hides
the free induct ion decay completely. From this , both relaxat ion rates are inferred to be Ti 2 < 0 fj tsec
at low T.
In the same way as in the previous section, an attempt was made to extract information about the
V electronic spin fluctuation rate from the 1/Ti. It is reasonable to assume that the hyperfine
coupling of the nuclei with their own local moment electrons is the major contribution to Ty.
Then using = 79 IcG from Eq. (8.20) for the hyperfine coupling .4 in Eq. (8.24). the following
equation was derived for generating the values of V local spin fluctuation rate 1/r in Fig. 8.8
I « 80 me\' .
assuming p(eF) = lstates/(eV-V'-spin direction), and
|Jexl=9-5meV . (8.39)
i = 7.47 X 10^®,x'°^Tir , (8.40)

153
50
40
30
20
10
51 V T I T
I 1 r < ? 1 -T' A •
±
T
X
T T • • -L X • •
J I • • • '
100 200 300 400 T(K)
500 600
Figure 8.9 V nuclear spin-lattice relaxation rate l/Ti versus temperature T.
The data of Mahajan et al . for sample 6 [19] are shown as filled
circles, along with those of Fujiwara et al. [97] (open triangles) and
of Onoda et al. [149] (open diamonds).

154
in which the Curie-Weiss susceptibility in Eq. (8.10) was used again. In Fig. 8.8 the two data sets of
1/r should ideally be the same, since both are the same fluctuation of the \' local moment. .Although
the overall temperature dependences appear to be similar, the quantitative disagreement is obvious.
This may be caused by the simple model itself, and/or the neglected contributions to T-. such as the
Korringa term.

155
9 SUMMARY AND DISCUSSIONS
Throughout this dissertation, intriguing properties of LiV204 have been presented and analyzed.
This strongly correlated electron compound exhibits a crossover with decreasing temperature T from
localized magnetic moment behavior to heavy Fermi liquid behavior. This crossover has been observed
through magnetic susceptibility, nuclear magnetic resonajice. heat capacity, and thermal e.xpansion mea
surements on high-purity polycrystailine LiV204 samples. In this final chapter, while brief summaries
from preceding chapters are given, our current understanding and outlook for appropriate mterpreta-
lions of the observed crossover in LiVo04 are stated.
In Chapter 3. the preparative method and characterization of our LiV204 and Lii+j:Ti2_r04 (x = 0
and 1/3) samples were described. The LiV204 samples were found to be single-phase or to have only
on the order of a percent of V'oOa or V'aOs impurity phase from the x-ray diffraction measurements
(Figs. 3.1 and 3.2). From the Rietveld refinements of the x-ray diffraction data, the lattice ao and oxygen
II parameters were determined for each sample (Tables 3.4 for LiV'204 and 6.2 for Lii+xTi2_r04). Due
to the weak scattering of .\-ray from lithium, it was impossible to determine whether vacancies occur in
the Li and/or \' sites. Introductions of the Rietveld refinement method and of the computer program
RIETAN'-97J were also given. From the low-7" .x-ray [II] and neutron [II. 18] diffraction measurements,
it was found that LiV'204 retains the cubic normal spinel structure down to 4K. with no evidence for
any structural transition (see Chapters 2 and 7).
Our magnetically purest samples 1 and 6 clearly showed a broad shallow maximum in the observed
magnetic susceptibility \°''®(T) at T % 16 K. with small Curie-like upturns below ~ 5K. Field-cooled
and zero-field-cooled magnetization measurements with H = 10-100 G did not reveal any evidence
for static spin-glass ordering from 2 to 50K in any of the seven samples measured. .\t T ~ 50 K.
\0''s(7") showed local magnetic moment behavior for all samples. Low-r isothermal magnetization
versus applied magnetic field M°^^(H) data were analyzed, and the parameters of the paramagnetic
impurities giving rise to the Curie-like upturn in x°^^(T) were determined, assuming that a single type
of impurity is present. Using these parameters, the intrinsic susceptibility x{T) was obtained and

156
found to be essentially the same in all samples but two (4A and 4B). Surprisingly, the spin 5,n,p of the
paramagnetic impurities was found to be large. 5tmp = 3/2 to 4 depending on the sample, suggesting the
presence of variable amounts of ferromagnetically coupled vanadium spin defect clusters in the samples.
The high-r (above ~ 50 K) localized magnetic moment picture was tested using the high-temperature
series expansion (HTSE) prediction for the spin susceptibility of the S = 1/2 vanadium sublattice of
the spinel structure. The Curie constant C and Weiss temperature 6 determined from the HTSE fits
were found to be similar to those obtained in the past using the Curie-Weiss law to fit the high-T
susceptibility data for LiV204. Using the values of the Van V'leck susceptibility obtained from the
I\-\ analyses, the Pauli susceptibility contribution to the temperature-independent susceptibility \o
was derived and found to be small, comparable to that of LiTi204. The Van Vleck formulas for the
paramagnetic susceptibility of V'"' and an equal mi.xture. assuming that each \' ion is in a cubic
crystalline electric field, failed to describe the T dependence of the observed effective magnetic moment.
However, for the high-T" "localized moment" region, the effective moment is in agreement with the
spin-only value.
At low T. muon spin relaxation [11] (not detailed here) and nuclear magnetic resonance (\MR)
measurements did not detect static magnetic ordering in our purest sample of LiV204 to 0.02 K. and in
any of seven samples to 1 5 K. respectively. The low-T behaviors observed in the intrinsic susceptibility
\{T). electronic heat capacity coefficient -/(T). and 'Li NMR measurements are similar to those of the
heaviest mass /-electron heavy fermion (HF) compounds. The nearly T-independent and relatively
large (~ 10~-cm^/mol) \(7") below ^ 30K with a broad peak at ss 16 K may be viewed as reflecting
the disappearance of the \' magnetic moment via Kondo screening by conduction electrons, and the
formation of a Fermi liquid with an enhanced mass. The value of 7(1 K) = 0.42J/molK- for LiV204
[11. 14] is. to our knowledge, the largest among existing transition metal compounds, surpassing those of
predecessors such as (Yo.grSco oalMno (RJ 0.2 J/molK* [16. 189]) and V'o-rOa (O.OTJ/molK- [85]). Not
only do we infer a large quasiparticle effective mass (m'/m^ ss 180) from this large 7. but the rapidly
decreasing i{T) is also indicative of a similarity to /-electron HF compounds. The "Li Knight shift
I\ becomes nearly T independent below about 4.2K [19], and simultaneously the nuclear spin-lattice
relaxation rate I/Ti has a linear T dependence in this low-T range. These two observations from 'Li
-NMR demonstrate that the Korringa law holds, another indication that LiV204 is a Fermi liquid at
low T.
•Although our neutron difTraction study did not show any structural transition to 4K, structural
evidence for the crossover to the HF regime with decreasing T < 20 K was found from the remarkable T

157
dependence of the thermal expansion at low T [18]. This was confirmed through capacitance dilatometer
measurements [14]. The linear thermal expansion coefficient divided by T. a/T. indicated a strong
upturn below w 25K which was correlated with the strong increase of -• in the same T region. The
derived, normalized ratio of Q to Ce (which is identical to (a/T)/t). called the Griineisen parameter
FfT). showed a strong enhancement below ss 25K. and reaches r(0) = 11.5. At 7" = 0. the observed
r(0) becomes equal to the electronic Griineisen parameter re(0). Compared with a typical value of ~ 2
for a normal elemental metal and that of /-electron HF compounds, this re(0) is intermediate, but still
indicates that the crossover to the HF regime a stronger influence on the thermal expansion than on
the heat capacity.
The electrical resistivity p{T) shows a metallic behavior, monotonically decreasing upon cooling,
shown by Rogers et al. [3] in 1967. We were lately informed that for the first time in more than 30
years Urano et al. [190] qualitatively reproduced the metallic p(T) of Rogers et al. by measurements
on a smgle crystal of LiV204. The observed downturn of p{T) below w 30 K in the data of Rogers et al .
may be an indication that LiV204 transforms to the coherent state at lower T. The T- dependence
of p{T) is characteristic of the coherent, i.e. Fermi liquid state. Though not low enough T data are
available, our rough estimate of the T- coefficient A satisfies the proportional relationship of A to 7 -
(see the Kadowaki-Woods plot in Fig. 5.3) that /-electron HF compounds follow.
The Wilson ratio Rw ~ 1 of HF compounds may be v^isually seen in a plot of \(0) versus 7(0)
since Rw is the normalized ratio of these two quantities. Figure 9.1 shows this plot, which includes
data for LiV204. many /-electron HF materials, some elemental metals and other superconducting or
metallic oxide compounds [14]. It is seen that LiV204 is situated in the middle of the /-electron HF
and intermediate-valent compound cluster.
From all these observations we conclude that the HF behaviors of LiV204 are like those of /-electron
HF systems. However, we have found difficulties to self-consistently describe both \[T) and CeiT) in
terms of the dilute-impurity S = 1/2 Kondo and S > 1 Coqblin-SchriefFer models. This suggests that
there might be a completely different mechanism responsible for these HF behaviors in LiV204 and
in the /-electron systems, or there might be some additional mechanism(s) that makes this d-electron
system more complex than conventional /-electron HF systems.
In conventional /-electron heavy fermion compounds, local /-electron orbitals and conduction elec
tron states in non-/ bands hybridize only weakly, resulting in a many-body scattering resonance of the
conduction electrons by the local moments near the Fermi energy Ep. a large density of quasiparticle
state P"(£'F), and hence a large quasiparticle effective mass, electronic specific heat coefficient and

158
10 -1
o E
S;
10 -2 .
10 -3 _
10 •4 _
. N a o
CeAlj, CeCUsO
YbCu^Ag
YbCUjS i20 ° UBe,3^
UjZn^^o UPt
3 o CeCUjS ij UAIjO
CeBe,30,
LiV^O,
P d o v , S i
a-Uo °
(^0.95"^'0.05)2^3
SfgRuO^
LiTi^O^
Free Electrons
0*5 ' • 11. t. • I . . . 11.. .1 I
10- 10 -2 10- 10°
Y(0) (J/mol K2)
I » «
10^
Figure 9.1 Magnetic susceptibility \(0) versus electronic heat capacity coeffi
cient 7(0) at zero temperature for several /-electron heavy fermion
(HF) compounds, (i-electron metallic oxides emd some elemental
metals [14], after [191]. "mol" stands for a mole of d or / atoms in
the respective compounds.

159
magnetic spin susceptibility at low T. Screening of 5 = 1/2 local moments by surrounding conduction
electrons leads to a nonmagnetic ground state and a saturating spin susceptibility as 7" —>• 0. We tested
several models for \{T) which assume the presence of local magnetic moments in Li\'204 (5 = 1/2
per V) interacting weakly with the conduction electrons. In these models, the itinerant and localized
electrons must both occupy tng orbitals (or bands derived from these orbitals). rather than orbitals of
more distinct character. One can still imagine a scenario [192] in which the HF behaviors of Li\'204
at low T arise in a way similar to that of the /-electron HF compounds, if the following conditions are
fulfilled: (i) the trigonal component of the CEF causes the .-lij orbital singlet to lie below the Eg orbital
doublet; (ii) one of the 1.5 d-eiectrons/V is localized in the ground .4ig orbital due to electron-electron
correlations: (iii) the remaining 0.5 rf-electron/V occupies the Eg doublet and is responsible for the
metallic character; and (iv) the band(s) formed from the Eg orbitals hybridize only weakly with the
.4ig orbital on each V ion. This scenario involves a kind of orbital ordering; a more general discussion
of orbital ordering effects is given below.
In the rest of this chapter, two important concepts, geometrical frustration and orbital ordering
which may be important in relation to the similar "heavy-electron" compound (^'o 97SC0 03)Mn2 are
discussed.
The geometric frustration for antiferromagnetic ordering inherent in the V sublattice of LiV'^O^
may be important to the mechanism for HF behaviors of this compound at low T. Such frustration
inhibits long-range magnetic ordering and enhances quantum spin fluctuations and (short-range) dy
namic spin ordering [10. 193. 194]. These effects have been verified to occur in the C15 fee Laves phase
intermetallic compound (Yq 97SCQ oajMno. in which the Y and Sc atoms are nonmagnetic and the .VIn
atom substructure is identical with that of V in LiV204. In (Y0.97SC0 03)Mn2 Shiga et al. discovered
quantum magnetic moment fluctuations with a large amplitude (firms = 1.3/iB/Mn at 8 K) in their
polarized neutron scattering study [195]. They also observed a thermally-induced contribution, with
^rms = 1.6/iB/Mn at 330 K. Further. Ballou et al. [16] inferred from their inelastic neutron scattering
experiments the presence of "short-lived 4-site collective spin singlets'", thereby suggesting the possibil
ity of a quantum spin-liquid ground state. recent theoretical study by Canals and Lacroi.x [194] by
perturbative expansions and exact diagonalization of small clusters of a 5 = 1/2 frustrated pyrochlore
antiferromagnet [196] found a spin-liquid ground state and an AF spin correlation length of less than
one interatomic distance at T = 0.
(YQ 97Sco.o3)Mn2 has some similarities in properties to those of LiV204. No magnetic long-range
ordering was observed above 1.4K [16, 195]. Similar to LiV204, it shows a large electronic specific heal

160
coefficient 7(0) »; 160-200 mJ/moIK" [16. 189]. However, the T dependences of the susceptibility [197]
and [189] are very different from those seen in LiV'204 and in the heaviest /-electron heavy fermion
compounds. does not show the Curie-Weiss-like behavior at high T. but rather increases with
increasing T [197]. "yfT) is nearly independent of T up to ~ 6.5K [189]. Replacing a small amount of
.Mn with Al. Shiga et al. [198] found spin-glass behavior in (Yo.95Sco,o5)(Mni_rAlj.)2 with x > 0.05.
The susceptibility for jr = 0.15 shows a Curie-Weiss-like behavior above ~ 50 K. The partial removal of
the geometric frustration upon substitution of Al for Mn leads to spin-glass ordering below ~ 50 K (for
X = 0.1) [198]. This might be analogous to that in our sample 3 in which structural defects evidently
ameliorated the frustrated V'-V interactions, leading to spin-glass ordering below ~ 0.8K. Hence, it is
of great interest to carry out similar neutron scattering measurements on LiV'204 to test for similarities
and differences in the spin excitation properties.
The magnetic properties of materials can be greatly influenced when the ground state has orbital
degeneracy in a high-symmetry structure. Such degenerate ground state orbitals can become energet
ically unstable upon cooling. The crystal structure is then deformed to a lower-symmetry to achieve
a lower-energy, non-orbitally-degenerate ground state (Jahn-Teller theorem) [199]. Energetically some
occupied orbitals are split from the originally degenerate levels to have lower energy. This kind of orbital
ordering accompanied with a structural distortion is called the cooperative Jahn-Teller effect [199]. The
driving force for this effect is the competition between CEF and the lattice energies. Orbital ordering
may also be caused by spin exchange interactions in a magnetic system with orbital-degenerate ground
state [199. 200]. The orbital (and charge) degrees of freedom may couple with those of spins in such a
way that certain occupied orbitals become energetically favorable, and consequently the degeneracy is
lifted. .A.S a result, the e.xchange interaction becomes spatially inhomogeneous [200. 201]. For example.
Pen €t al. [200] showed that the degenerate ground slates in the geometric frustrated. V triangular
lattice Heisenberg antiferromagnet LiVOo can be lifted by a certain static orbital ordering. However,
the presence of orbital degeneracy or near-degeneracy suggest that dynamical orbital-charge-spin cor
relations may be important to the physical properties of LiV204. It is not yet known theoretically
whether such dynamical correlations can lead to a HF ground state and this scenario deserves further
study.
In conclusion, thus far we and collaborators have experimentally demonstrated heavy fermion be
haviors of LiV204 characteristic of the heaviest mass /-electron HF systems from magnetization [11],
heat capacity [11, 14], nuclear magnetic resonance [11, 19], thermal expansion [14, 18], and muon spin
relaxation [11] measurements. Our higher-purity samples made this discovery of the HF behaviors in

161
LiV'oO^ possible. High-quality single crystals without structural defects or magnetic impurities are in
great demand. While the observed heavy fermion behaviors should be checked using such crystals, in
elastic neutron scattering experiments are vital for profound understanding of the magnetic excitations
in this tf-electron heavy fermion compound. This strongly correlated metal provides a challenge to
theorists to provide an applicable theory which may elucidate the nature of the observed heavy electron
mass in LiV204. and the reason(s) that the properties of this compound are so radically different from
those of the isostructural superconductor LiTi204.

162
APPENDIX. RIETAN-975 INPUT FILE EXAMPLE
#*******fBeginning of the input file for LiV'204 sample
# Title (CHARACTER'80)
LiV204 sample 6 (3-3-q2){sk4164) (LiV204. V203 impurity) 'Sample4A.ins"
N'BEAM = 0! Neutron powder diffraction.
N'BEAM = 1: Conventional X-ray powder diffraction (characteristic X rays).
XBEAM = 2! Synchrotron X-ray powder diffraction.
NMODE = 0: Rietveld analysis of powder diffraction data.
N'MODE = 1! Calculation of powder diffraction intensities (plus simulation).
. \ PRINT = 0!
NPRINT = 1!
N PRINT = 2!
NPRINT = 0
Minimal output.
Standard output
Detailed output.
If NBEAM = 1 then
TNAME = "Cu": Radiation ('Cr'. Fe". "Co". 'Cu'. 'Mo", or "Ag").
R12 = 0.497; I(K-alpha2)/I(K-alphal).
CTHM = 0.8009: (cos(2*alpha))**2 for the monochromator (alpha: Bragg angle).
NTRAN = 0: Reflection (Bragg-Brentano) geometry.
NTR.A.N = 1! Transmission geometry.
end if

163
If NBEAM > 0 then
# Real chemical species plus ' /
•Li" -V '07
end if
Information about phases {
# Phase No. I; LiV204
PHNAMEl = 'Li\ '204": Phase name (CHAfL\CTER*25)
VNSl = "I-227-2':(V'ol. \o.)-{Space group No.)-(Setting No.) in Int. Tables.
LSPSYMl = 0: Information on the space group is read from the data base.
INDIVI = 0! The overall isotropic thermal parameter (Q) is input.
INDIVl = 1: Isotropic and/or anisotropic thermal parameters are input.
NPRORl = 0! Preferred orientation is not corrected.
NPRORl = 1! Plate crystals (Sasa-Uda function).
.VPRORl = 2! .N'eedle-Iike crystals (Sasa-Uda function).
.\PRORl = 3; March-Dollase function.
IHl = 1:
IKl = 0: —> Preferred-orientation vector, hp. kp. Ip.
ILl = 0:
LSUMl = 0! No summation when calculating the March-Dollase function.
LSUMl = 1; Summation when calculating the March-Dollase function.
IHAl = 1:
IKAl = 1: —>• Anisotropic-broadening axis, ha, ka. la.

164
ILAl = 1:
# Phase No. 2: V203
PHNAME2 = •V203': Phase name (CHAR.A.CTER»25)
VNS2 = •I-167-2":(Vol. .\o.)-(Space group N'o.)-(Setting No.) in Int. Tables.
LSPSYM2 = 0: Information on the space group is read from the data base.
INDIV2 = 0! The overall isotropic thermal parameter (Q) is input.
INDI\'2 = 1: Isotropic and/or anisotropic thermal parameters are input.
.NPROR2 = 0! Preferred orientation is not corrected.
.\PROR2 = 1! Plate crystals (Sasa-Uda function).
NPR0R2 = 2! Needle-like crystals (Sasa-Uda function).
NPROR2 = 3: .Vlarch-Doliase function.
IK2 = 0: —y Preferred-orientation vector, hp. kp. Ip.
IL2 = I:
LSUM2 = 0: No summation when calculating the March-Dollase function.
LSUM2 = 1! Summation when calculating the March-Dollase function.
IHA2 = 0:
IKA2 = 0: —»• Anisotropic-broadening axis. ha. ka, la.
ILA2 = 1:
} Information about phases
Labels. A(I)'s. and ID(I)'s {

165
# Global parameters
# Pealc-shift parameters. Z. Ds. and Ts
SHIFT 3.58927E-2 0.0 0.0 100
# Background parameters, bj (j = 0-iI)
BKGD 3.80044 -3.61998 3.06328 -2.22331 0.990238 -2.09748E-1
0.0 0.0 0.0 0.0 0.0 0.0 111111000000
# Parameters for phase No. 1 (LiV204)
# Scale factor, s
SC.\LE1 2.60639E-5 1
# Gaussian profile parameters. L". V. VV. and P
GAUSSl 2.86d61E-3 -4.35888E-3 2.78049E-3 0.0 1110
# Lorentzian profile parameters. X. Xe, Y. and Ye
LORENTZl 1.00194E-4 0.0 8.47082E-2 0.0 1010
# .\symmetry parameter. As
.\SYM1 0.110906 1
# Unused parameters (dummy)
V'.A.CA.\T1 0.0 0.0 00
# Preferred-orientation parameters, r or (pi and p2)
PREFl 0.9 0.0 10
Lattice parameters and overall isotropic thermal parameter. Q
CELQl 8.24704 8.24704 8.24704 90.0 90.0 90.0 0.0 1000000
# Label/species, g. .^c. y. z. B. and refinement identifiers (ID)
Li/Li 1.0 0.125 0.125 0.125 1.1 00000
Vl/V 1.0 0.5 0.5 0.5 0.420345 00001
Ol/O 1.0 0.262044 0.262044 0.262044 0.48 01220
# Parameters for phase No. 2 (V203)
# The inputs of lattice parameters, fractional coordinates ajid betas are
# taken from \V. Robinson, Acta Cryst. (1975). B31, 1153.

166
SCALE2 8.55836E-7 1
# Gaussian profile parameters. U. V. VV. and P
GAUSS2 2.8686lE-3 -4.35888E-3 2.78049E-3 0.0 2220
# Lorentzian profile parameters. X. Xe. Y. and Ye
L0RENTZ2 I.00194E-4 0.0 8.47082E-2 0.0 2020
# .\symmetry parameter. As
.\SYM2 0.110906 2
rr L'nused parameters (dummy)
VACAN'T2 0.0 0.0 00
^ Preferred-orientation parameters, r or (pi and p2)
PREF2 1.13267 0.0 10
# Lattice parameters and overall isotropic thermal parameter, Q
CELQ2 4.94066 4.94066 13.8957 90.0 90.0 120.0 0.0 1010000
# Label/species, g. .v, y. z. B. and refinement identifiers (ID)
V2/V 1.0 0.0 0.0 0.34634 5.67E-3 5.67E-3 1.9E-4 2.835E-3 0.0
0.0 0000000000
02/0 1.0 0.3122 0.0 0.25 4.9E-3 7.6E-3 5.0E-4 3.8E-3 4.0E-4 8.0E-4 GOOOOOOOOO
} end of labels. A(I)s. and ID(I)"s
Linear constraints for parameters with ID(I) = 2 {
A(0l.y)=A(01..x)
A(01.z)=A(0l..\)
A(G AUSS2,1 )=A(G AUSS1.1)
A(GAUSS2.2)=A(GAUSS1.2)
A(GAUSS2.3)=A(GAUSS1.3)
A(LORENTZ2.1)=A(LORENTZl,i)
A(LORENTZ2,3)=A(LORENTZl,3)
A (AS YM2,1)=A (AS YM 1,1)
}end of linear constrains

167
N'EXC = 0! Use all the intensity data.
XEXC = 1: Skip some intensity data.
If .\EXC = 1 then
E.xcluded 2-theta regions {
15.00 19.98
}
end if
If NMODE = 0 then
.\RANGE = 0: Refine the background.
NRANGE = 1! Fix the background.
NP.A.T = 0!
.\PAT = 1!
SPAT = 2!
SPAT = 3!
.\P.\T = 4!
.\P.\T = 5!
N'P.\T = .5
end if
Do not create any file storing diffraction intensities.
Create a PostScript file for Rietveld-refinement patterns.
Create a Macplot/RietPlot file for Rietveld-refinement patterns.
Create a DMPLOT file for Rietveld-refinement patterns.
Create a SigmaPlot file for Rietveld-refinement patterns.
Create an Igor Pro file for Rietveld-refinement patterns.
If NMODE = 0 or .N'PAT > 0 then
PC = 9.0: Profile cut-off.
end if
If NMODE = 0 then
.\LESQ = 0: Marquardt method (recommended in most cases).
-VLESQ = 1! Gauss-Newton method.
NLESQ = 2! Conjugate-direction method.
NESD = 0: Standard deviations are estimated by the conventional method.

168
NESD = 1! Standard deviations are estimated by Scott 's method.
end if
If \LESQ <= 1 then
N'AUTO = 0! Refine all the variable parameters simultaneously.
\.A.UTO = 1! Refine incrementally (specify variable parameters).
XAUTO = 2! Refine incrementally (automatic: recommended in most cases).
.N'AUTO = 3! In addition to NAUTO = 2. check convergence to the global min.
-XAUTO = 3
N'CYCL = 20: Maximum number of cycles.
COW = 0.0001: Small positive number used for convergence judgement.
XCONV = 3: Number of cycles used for convergence judgement.
NC = 0: No nonlinear constraints are imposed.
NC = I! Nonlinear constraints are imposed.
TK = 5000.0: Penalty parameter.
FINC = 20.0: Factor by which TK is multiplied when TK is increased.
MITER = 6: Maximum number of iterations.
STEP = 0.04: Coefficient to calculate the initial step interval.
•ACC = l.OE—6: Small positive number used for convergence judgement.
end if
If NLESQ <= 1 and NAUTO = 1 then
Parameters to be refined in each cycle plus ' / ' {
BKGD.l BKGD.2 BKGD.3 BKGD.4 BKGD.5 BKGD.G. BKGD.T BKGD.S /
CELLQ.l /
}
end if

169
[f .N'LESQ = 2 then
MITER = 6; Maximum number of iterations.
STEP = 0.04: Coefficient to calculate the initial step interval.
ACC = I.OE—6: Small positive number used for convergence judgement.
N'C = 0; No nonlinear constraints are imposed.
N'C = 1! .N'oniinear constraints are imposed.
TK = 5000.0: Penalty parameter.
end if
If NC = 1 then
# .Nonlinear constraints imposed on interatomic distances and bond angles
# For Series numbers of distances/angles, refer to outputs of ORFFE.
Nonlinear constraints {
# Ser.No. E.xpctd.val. Deviation
}
end if
NUPDT = 0: Variable parameters in the input file remain unchanged.
NUPDT = I! Variable parameters are updated in the packing mode.
NUPDT = 2! Variable parameters are updated in the overwriting mode.
NFR = 0; No file is created which stores FOURIER data.
NFR = 1! File #21 is created which stores FOURIER data for phase #1.
.NFR = 2! File #21 is created which stores FOURIER data for phase #2.
NDA = 0: No file is created which store ORFFE data.
NDA = 1! File #9 is created which store ORFFE data for phase #1.
NDA = 2! File #9 is created which store ORFFE data for phase #2.

170
If NDA > 0 then
ORFFE instructions {
201 2 28 }
end if
If NMODE = 0 and NPAT = 1 then
XO = 6.5: X coordinate of the origin.
VO = 7.0: Y coordinate of the origin.
F.A.CFIG = 0.35: Magnification factor for graphic output (0.35 for ND).
INC = 0: Increase per scale division of the ordinate (0 for default),
end if
#*"'*****(End of the input file)**"***

171
BIBLIOGRAPHY
[1] S. Krupicka and P. Novak. Ferromagnetic Matenals. edited by E. P. Wohlfarth (North-Holland.
New York. 1982). Vol. 3. Ch. 4.
[2] D. C. Johnston. T. .-Vmi. F. Borsa. M. K. Crawford. J. A. Fernandez-Baca. K. H. Kim. R. L.
Harlow. A. V. Mahajan. L. L. Miller. M. A. Subramanian, D. R. Torgeson. and Z. R. Wang, in
Spnnger Series in Solid-State Sciences. Vol. 119. "Spectroscopy of Mott Insulators and Correlated
.Metals", edited by .A.. Fujimori and Y. Tokura (Springer-Verlag. Berlin and Heidelberg. 1995).
pp. 241-254.
[3] D. B. Rogers. J. L. Gillson. and T. E. Gier. Solid State Commun. 5. 263 (1967).
[4] D. C. Johnston. J. Low Temp. Phys. 255. 145 (1976).
[5] H. Kessler and M. J. Sienko. J. Chem. Phys. 55. 5414 (1971).
[6] .\akajima. Y. .A.mamiya. K. Ohnishi. I. Terasaki. .A.. Maeda. and K. Uchinokura. Physica C
185-189. 719 (1991).
[7] B. L. Chamberland and T. A. Hewston. Solid State Commun. 58. 693 (1986).
[8] F. Takagi. K. Kawakami. 1. Maekawa. Y. Sakai. and N. Tsuda. J. Phys. Soc. Jpn. 56. 444 (1987).
[9] T. Hayakawa. D. Shimada. and N. Tsuda. J. Phys. Soc. Jpn. 58. 2867 (1989).
[10] P. \V. Anderson, Phys. Rev. 102. 1008 (1956).
[11] S. Kondo. D. C. Johnston. C. A. Swenson. F. Borsa, A. V. Mahajan, L. L. Miller. T. Gu. A. I. Gold
man. M. B. Maple. D. A. Gajewski, E. J. Freeman. N. R. Dilley, R. P. Dickey, J. Merrin. K. Kojima.
G. M. Luke. Y. J. Uemura, O. Chmaissem, and J. D. Jorgensen. Phys. Rev. Lett. 78. 3729 (1997).
[12] A. Aharony, R. J. Birgeneau, A. Coniglio. M. A. Kastner, and H. E. Stanley, Phy. Rev. Lett. 60,
1330(1988).

172
[13] A. P. Ramirez. Annu. Rev. Mater. Sci. 24. 453 (1994).
[14] D. C. Johnston. C. A. Swenson. and S. Kendo (unpublished).
[15] K. Andres. J. E. Graebner. and H. R. Ott. Phys. Rev. Lett. 35. 1779 (1975).
[16] R. Ballou. E. Lelievre-Berna. and B. Fak. Phys. Rev. Lett. 76. 2125 (1996).
[17] S. Kendo. D. C. Johnston, and L. L. Miller, (unpublished).
[18] O. Chmaissem. J. D. Jorgensen. S. Kondo. and D. C. Johnston. Phys. Rev. Lett. 79. 4886 (1997).
[19] A. v. .Mahajan. R. Sala. E. Lee. F. Borsa. S. Kondo. and D. C. Johnston. Phys. Rev. B 57. 8890
(1998).
[20] A. Wold and K. Dwight. Solid State Chemistry: Synthesis. Strucutre. and Properties of Selected
Oxides and Sulfides (Chapman k. Hall. New York. 1993).
[21] K. Hirakawa. H. Ikeda. H. Kadowaki. and K. Ubukoshi. J. Phys. Soc. Jpn. 52. 2882 (1983).
[22] K. Hirakawa. H. Kadowaki. and K. Ubukoshi. J. Phys. Soc. Jpn. 54. 3526 (1985).
[23] .A.. Tauber. W. .VI. .VIoller. and E. Banks. J. Solid State Chem. 4. 138 (1972).
[24] .A.. P. Ramirez. G. P. Espinosa. and A. S. Cooper. Phys. Rev. Lett. 64. 2070 (1990).
[25] S.-H. Lee. C. Broholm. M. F. Collins. L. Heller. A. P. Ramirez. Ch. Kloc. E. Bucher. R. W. Erwin.
and .\. Lacevic. Phys. Rev. B 56. 8091 (1997).
[26] .\ . H. Cooke. R. Lazenby. F. R. McKim. J. Owen, and W. P. VVblf. Proc. R. Soc. London A 250.
97 (1959).
[27] S. Hov. H. Bratsberg, and A. T. Skjeltorp. J. Magn. .Magn. Mater. 15-18. 455 (1980).
[28] P. K. Baltzer. P. J. Wojtowicz. M. Robbins. and E. Lopatin. Phys. Rev. 151. 367 (1966).
[29] J. Mydosh. Spin Glasses, .4n Experimental Introduction (Taylor and Francis. London. 1993).
[30] Physics of Random Systems, edited by Y. Haseda (Physical Society of Japan. Tokyo. 1981). Ch. 7.
[31] S. Nagata. P. H. Keesom. and H. R. Harrison. Phys. Rev. B 19. 1633 (1979).
[32] Z. Fisk. D. W. Hess, C. J. Pethick, D. Pines, J. L. Smith, J. D. Thompson, and J. O. Willis. Science
239. 33 (1988).

173
[33] G. R. Stewart. Rev. Mod. Phys. 56. 755 (1984).
[34] For reviews, see. e.g.. J. M. Lawrence. P. S. Riseborough. and R. D. Parks. Rep. Prog. Phys. 44.
1 (1981); N. B. Brandt and V. V. Moshchalkov, Adv. Phys. 33. 373 (1984): P. Schioitmann. Phys.
Rep. 181. 1 (1989): N. Grewe and F. Steglich. Ch. 97 in Handbook on the Physics and Chemistry
of Rare Earths. Vol. 14. eds. K. A. Gschneidner. Jr. and L. Eyring (Elsevier. Amsterdam. 1991).
pp. 343-474: G. Aeppli and Z. Fisk. Comments Cond. Mat. Phys. 16. 155 (1992): M Loewenhaupt
and K. H. Fischer. Ch. 105 in Handbook on the Physics and Chemistry of Rare Earths. Vol. 16. eds.
K. .A.. Gschneidner. Jr. and L. Eyring (Elsevier. Amsterdam. 1993). pp. 1-105: A. .A.mato. Rev.
Mod. Phys. 69. 1119 (1997).
[35] A. C. Hewson. The Kondo Problem to Heavy Fermions (Cambridge University Press. Cambridge.
1993).
[36] Y. Onuki and T. Komar.subara. J. Magn. Magn. Mater. 63 & 64. 281 (1987).
[37] .A.. Ishihara, Electron Liquids (Springer-Verlag, Berlin. 1993). p. 145.
[38] H. R. Ott. H. Rudigier. Z. Fisk. J. 0. Willis, and G. R. Stewart. Solid State Commun. 53. 235
(1985).
[39] G. R. Stewart. Z. Fisk, J. O. Willis, and J. L. Smith. Phys. Rev. Lett. 52. 679 (1984).
[40] C. D. Bredle. S. Horn. F. Steglich. B. Luthi. and R. M. .Martin. Phys. Rev. Lett. 52. 1982 (1984).
[41] W. Lieke. U. Rauchschwalbe. C. B. Bredle. F. Steglich. J. .A.arts. and F. R. de Boer. J. Appl. Phys.
53. 2111 (1982).
[42] H. R. Ott. H. Rudigier, Z. Fisk. and J. L. Smith. Phys. Rev. Lett. 50, 1595 (1983).
[43] G. R. Stewart. Z. Fisk, and M. S. Wire, Phys. Rev. B 30. 482 (1984).
[44] J. J. M. Franse, P. H. Frings. A. de Visser, and A. Menovsky, Physica B 126. 116 (1984).
[45] A. de Visser, J. J. M. Franse. and A. Menovsky. J. Magn. Magn. Mater. 43—47. 43 (1984).
[46] H. R. Ott, H. Rudigier, P. Delsing, and Z. Fisk, Phys. Rev. Lett. 52. 1551 (1984).
[47] J. O. Willis, Z. Fisk, R. M. Aikin, M. W. McElfresh, J. D. Thompson, E. Zirngiebl, J. A. O'Rourke,
and J. L. Smith, J. Appl. Phys. 61, 4373 (1987).

174
[48] G. K. White and S. B. VVoode. Philo. Trans. R. Soc. London A 251. 273 (1959).
[49] F. E. Hoare and J. C. Matthews. Proc. R. Soc. London A 212. 137 (1952).
[50] D. Martin. Phys. Rev. 124. 438 (1961).
[51] R. T. Schumacher eind W. E. Vehse. J. Phys. Chem. Solids 24. 297 (1963).
[52] VV. E. Lawrence and J. W. Wilkins, Phys. Rev. B 7. 2317 (1973). [This value of A was theoretically
obtained in this paper.]
[53] H. H. Hill, in Plutonium 1970 and Other Acttmdes. edited by W. N. .Miner (American Institute of
Mining. New York. 1970), p. 2.
[54] J. Kondo. Prog. Theor. Phys. 32. 37 (1964).
[55] A. A. .-VbrikosGv. Physics 2. 5 (1965).
[56] K. Yosida and A. Okiji, Prog. Theor. Phys. 34. 505 (1965).
[57] K. Wilson, Rev. Mod. Phys. 47. 773 (1975)-
[58] A. M. Tsvelick and P. B. Wiegmann. .A.dv. Phys. 32. 453 (1983).
[59] \ . Kawakami and A. Okiji. Phys. Lett. 86A. 483 (1981).
[60] .A. Okiji and \ . Kawakami. J. Appl. Phys. 55. 1931 (1984).
[61] K. Yosida and .A.. Yoshimori. in Magnetism, edited by H. Suhl (Academic Press. New York. 1973).
\ 'ol. 5.
[62] K. Yamada, Electronic Correlations (Iwanami, Tokyo, 1993).
[63] J. Friedel, Nuevo Cimento Suppl. 2. 287 (1958).
[64] W. P. Kirk, in McGraw-Hill Encyclopedia of Physics (McGraw-Hill, New York, 1993), second
edition, p. 650.
[65] K. Yamada, K. Hanzawa, and K. Yosida, Prog. Theor. Phys. 76, 621 (1986).
[66] K. Kadowaki and S. B. Woods, Solid State Commun. 58, 507 (1986).
[67] G. Blasse, Philip Res. Rep. Suppl. 3 (1964).

175
68] International Tables for Crystallography (Kluwer Academic. Dordrecht. 1987). Vol.
69] R. D. Shannon. Acta Cryst. A. 32. 751 (1976).
70] Science Dictionary. 4th Edition, edited by R. Kubo. S. Nagakura. H. Iguchi. and H. Esawa
(Iwanami Shoten. Tokyo. 1987).
71] Y. Gao. K. Myrtle. M. Zhang, J. N. Reimers. and J. R. Dahn. Phys. Rev. B 54. 16670 (1996).
72] \V. P. Wolf. Rep. Prog. Phys. 24. 212 (1961).
73] D. B. Rogers. R. J. Arnott. .A.. Wold, and J. B. Goodenough. J. Phys. Chem. Solids 24. 347 (1963).
74] J. B. Goodenough, G. Dutta. and A. Manthiram. Phys. Rev. B 43. 10 170 (1991).
75] A. Fujimori. K. Kawakami. and N. Tsuda. Phys. Rev. B 38. 7889 (1988).
76] M. .\bbate. F. M. de Groot. J. C. Fuggle. A. Fujimori. Y. Tokura. Y. Fujishima. O. Strebel.
-M. Domke. G. Kaindl. J. van Elp. B. T. Thole. G. A. Sawatzky. M. Sacchi. and N. Tsuda. Phys.
Rev. B 44. 5419 (1991).
77] S. Satpathy and R. M. Martin. Phys. Rev. B 36. 7269 (1987); S. .Vlassidda. J. Yu. and .A.. J.
Freeman, tbtd. 38. 11352 (1988).
78] B. Reuter and J. Jaskowsky. .Angew. Chem. 72. 209 (1960).
79] B. Reuter and J. Jaskowsky. Ber. Bunsenges. Phys. Chem. 70. 189 (1966).
80] D. B. Rogers. J. B. Goodenough. and A. Wold. J. Appl. Phys. 35. 1069 (1964).
81] E. Pollen. Czech. J. Phys. B 23. 468 (1973): Krist. Tech. 8. 859 (1973).
12] D. Arndt, K. Miiller. B. Reuter, and E. Riedel. J. Solid State Chem. 10. 270 (1974).
13] Y. Ueda, N. Fujiwara. and H. Yasuoka, J. Phys. Soc. Jpn. 66. 778 (1997).
84] M. B. Maple. C. L. Seaman. D. A. Gajewski. Y. Dalichaouch, V. B. Barbetta, M. C. de Andrade,
H. A. Mook. H. G. Lukefahr. 0. O. Bernal, and D. E. MacLaughlin. J. Low Temp. Phys. 95, 225
(1994).
85] S. A. Carter. T. F. Rosenbaum, P. Metcalf, J. .VI. Honig, and J. Spalek, Phys. Rev. B 48, 16 841
(1993).

176
[86] W. Trinkl. U. VVeilnhammer. S. Corsepius. T. Schreiner. E.-VV. Scheidt. and G. R. Stewart. Phys.
Rev. B 54. 1163 (1996).
[87] P. H. Frings, J. J. M. Franse. F. R- de Boer, and A. Menovsky. J. Magn. Magn. Mater. 31-34. 240
(1983).
[88] G. S. Rushbrooke and P. J. Wood. Mol. Phys. 1. 257 (1958).
[89] Muhtar. F. Takagi. K. Kawakami. and N. Tsuda. J. Phys. Soc. Jpn. 57. 3119 (1988).
[90] Y. Amako. T. N'aka. M. Onoda. H. Nagasawa. and T. Erata. J. Phys. Soc. Jpn. 59. 2241 (1990).
[91] M. J. Lysak and D. E. MacLaughlin. Phys. Rev. B 31. 6963 (1985).
[92] M. Itoh. Y. Hasegawa. H. Yasuoka. Y. Ueda. and K. Kosuge. Physica C 157. 65 (1989).
[93] M. Dalton. D. P. Tunstall. J. Todd. S. Arumugam. and P. P. Edwards. J. Phys.: Condens. Matter
6. 8859 (1994).
[94] R. \V. McCallum. D. C. Johnston. C. A. Luengo. and M. B. Maple. J. Low Temp. Phys. 25. 177
(1976): (unpublished).
[95] U. Ziilicke and A. J. Millis. Phys. Rev. B 51. 8996 (1995).
[96] G. M. Luke. A. Keren. L. P. Le. D. Wu. Y. J. Uemura. D. A. Bonn. L. Taillefer. and J. D. Garrett.
Phys. Rev. Lett. 71. 1466 (1993).
[97] N. Fujiwara. Y. Ueda. and H. Yasuoka. Physica B. 239. 237 (1997).
[98] Y. Ueda (private communication).
[99] F. Izumi, in The Rietveld Method, edited by R. .A.. Young (Oxford University Press. Oxford, 1993),
Ch. 13.
[100] H. M. Rietveld, Acta Crystallogr. 22, 151 (1967).
[101] H. M. Rietveld, J. Appl. Crystallogr. 2. 65 (1969).
[102] R. A. Young, in The Rietveld Method, edited by R. A. Young (Oxford Unviersity Press, Oxford,
1993). Chs. 1 and 2 (the latter by the inventor, Dr. Rietveld).
[103] F. Izumi. H. Asano. T. Ishigaki, E. Takayama-Muromachi, Y. Uchida, N. VVatanabe, and
T. Nishikawa, Jpn. J. Appl. Phys. 26, L649 (1987).

177
[104] G. Calestani and C. Rizzoli. Nature (London). 328. 606 (1987).
[105] F. Izumi. Rigaku-Denki Journal 27. 18 (1996).
[106] F. Izumi. in Applications of Synchrotron Radiation to Materials Analysis, edited by H. Saisho and
Gohshi (Elsevier, .\nisterdam. 1996). Ch. 7.
[107] P. Thompson. D. E. Cox. and J. B. Hastings. J. Appl. Crystallogr. 20. 79 (1987).
[108] G. K. Wertheim. M. A. Butler. K. W. West, and D. E. Buchanan. Rev. Sci. Instrum. 45. 1369
(1974).
[109] -M. M. Hall. Jr.. \ ' . G. Veeraraghavan. H. Rubin, and P. G. W'inchell. J. .A.ppl. Crystallogr. 10.
66 (1977).
[110] F. Izumi. .4 Rietveld-Refinement Program RlETAS-94 for Angular-Dispersive X-
Ray and Xeutron Powder Diffractioin (RJETAN manual). (1996) (available at
http;//www.nirim.go.jp/ izumi/rietan/angleJispersive/manual.pdf).
[111] C. J. Howard. J. .Appl. Crystallogr. 15. 615 (1982).
[112] V. Sasa and M. Uda. J. Solid State Chem. 18. 63 (1976).
[113] H. Toraya and F. Marumo. .Mineral. J. 10. 211 (1981).
[114] -A. March. Z. Kristallogr. 81. 285 (1932).
[115] VV. Dollase. J. .Appl. Crystallogr. 19. 267 (1986).
[116] E. Prince, in The Rietveld Method, edited by R. .A. Young (Oxford Unviersity Press. Oxford.
1993). Ch. 3.
[117] R. J. Hill, in The Rietveld Method, edited by R. A. Young (Oxford Unviersity Press. Oxford.
1993). Ch. 5.
[118] G. Fujinawa, in Fifth Short Course on X-Ray Analysts. "X-Ray Rietveld .Analysis". (The Japan
Society of Analytical Chemistry. Tokyo. 1996). Ch. 3.
[119] F. Izumi, in Fifth Short Course on X-Ray Analysts, "X-Ray Rietveld Analysts", (The Japan
Society of Analytical Chemistry, Tokyo, 1996), Ch. 2.
[120] G. Caglioti. A. Paoletti. and F. P. Ricci, Nucl. Instrum. Methods 35, 223 (1958).

178
[121] F. Izurai (private communication).
[122] Y. Ueda. J. Kikuchi. and H. Yasuoka. J. Magn. Magn. Mater. 147. 195 (1995).
[123] S. N'agata. P. H. Keesom. and S. P. Faile. Phys. Rev. B 20. 2886 (1979).
[124] A. H. Lacerda. et al. (unpublished).
[125] Yu. M. Belyakov. V. A. Perelyaev. A. K. Chirkov. and G. P. Shveikin. Russ. J. Inorg. Chem. 18.
1789 (1973).
[126] T. Palanisamy. J. Gopaiakrishnan. and M. C. Sastri. J. Solid State Chem. 9. 273 (1974).
[127] J. Gendell. R. M. Cotts. and M. J. Sienko. J. Chem. Phys. 37. 220 (1962).
[128] R. M. White. Quantum Theory of Solids, 2nd Edition (Springer Verlag, Berlin. 1983) [From
Eq. (3.97) on p. 96. ,\L = —('n/JTIB)"\^^"' '/3. where MB is the band mass. So \L is e.xpected to be
negligibly small for cf-electron system whose band width is normally narrow (z.e. rrib is large).]
[129] M. Takigawa. E. T. .Ahrens. and Y. Ueda, Phys. Rev. Lett. 76. 283 (1996).
[130] J. P. Pouget. P. Lederer. D. S. Schreiber, H. Launois, D. VVohlleben, A. Casalot, and G. \ 'illeneuve.
.1. Phys. Chem. Solids 33. 1961 (1972).
[131] P. VV. Selwood. Magnetochemistry. 2nd Edition (Interscience. New York, 1956). p. 78.
[132] E. D. Jones. Phys. Rev. 137. .A978 (1965).
[133] J. Kikuchi. H. Ycisuoka. Y. Kokubo, Y. Ueda. and T. Ohtani. J. Phys. Soc. Jpn. 65, 2655 (1996).
[134] For a review, see G. S. Rushbrooke. G. A. Baker, and P. J. Wood, in Phase Transitions and
Critical Phenomena, edited by C. Domb and M. S. Green (Academic Press. London, 1974), Vol. 3,
Ch. 5.
[135] J. M. Heintz, M, Drillon. R. Kuentzier, Y. Dossmann, J. P. Kappler, 0. Durmeyer. and F. Gautier,
Z. Phys. B 76, 303 (1989).
[136] M. Gerloch. J. Lewis, G. G. Phillips, and P. N. Quested, J. Chem. Soc. (A). 1941 (1970).
[137] S. Kondo (unpublished).
[138] M. Kotani, J, Phys. Soc. Jpn. 4, 293 (1949).

179
[139] J. H. Van V'leck. Theory of Electric and Magnetic Susceptibilities (Oxford University Press. Lon
don. 1932).
[140] C. J. Ballbausen. Introduction to Ltgand Field Theory (McGraw-Hill. New York. 1962). p. 68.
[141] T. M. Dunn. Some Aspects of Crystal Field Theory (Harper i: Row, N'ew York. 1965). Cli. ."5.
[142] T. M. Dunn. Trans. Faraday Soc. 57. 1441 (1961).
[143] H. R. Krishna-murthy. J. \V. Wilkins. and K. G. Wilson. Phys. Rev. B 21. 1003 (1980).
[144] H. R. Krishna-murthy. J. W. Wilkins. cind K. G. Wilson. Phys. Rev. B 21. 1044 (1980).
[145] T. Rajan. J. H. Lowenstein. and N. Andrei. Phys. Rev. Lett. 49. 497 (1982).
[146] B. Coqblin and J. R. SchriefFer. Phys. Rev. 185. 847 (1969).
[147] V. T. Rajan. Phys. Rev. Lett. 51. 308 (1983).
[148] -A.. Jerez and N. Andrei (1997. unpublished).
[149] M. Onoda. H. Imai. Y. Amako. and H. Nagasawa. Phys. Rev. B 56. 3760 (1997).
[150] N. W. .\shcroft and N. D. Mermin. Solid State Physics (Saunders College. Philadelphia. 1976).
[151] K. Miyake. T. .Vlatsuura. and C. .VI. Varma. Solid State Commun. 71. 1149 (1989).
[152] C. A. Swenson. Phys. Rev. B 53. 3669 (1996).
[153] E. S. R. Gopal. Specific Heats at Low Temperatures (Plenum. New York. 1966).
[154] R. J. Cava. D. W. Murphy. S. Zahurak. Santoro. and R. S. Roth. J. Solid State Chem. 53. 64
(1984).
[155] D. P. Tunstall. J. R. M. Todd. S. .\rumugam. G. Dai. M. Dalton. and P. P. Edwards. Phys. Rev.
B 50. 16541 (1994).
[156] G. D. Khattak, P. H. Keesom. and S. P. Faile. Phys. Rev. B 18, 6181 (1978).
[157] C. J. Pethick and G. M. Carneiro. Phys. Rev. A 7, 304 (1973).
[158] C. J. Pethick. D. Pines, K. F. Quader, K. S. Bedell, and G. E. Brown. Phys. Rev. Lett. 57. 1955
(1986).

180
[159] G. Baym and C. Pethick, Landau Fermi Liquid Theory (John Wiley iz Sons. New \'ork. 19911.
[160] J. R. Engelbrecht and K. S. Bedell. Phys. Rev. Lett. 74. 4265 (1995).
[161] A. Auerbacfa and K. Levin. Phys. Rev. Lett. 57. 877 (1986).
[162] A. Auerbach and K. Levin. Phys. Rev. B 34. 3524 (1986).
[163] A. J. Millis. Phys. Rev. B 36. 5420 (1987).
[164] A. J. Millis and P. A. Lee. Phys. Rev. B 35. 3394 (1987).
[165] L. N. Oliveira and J. VV. Wilkins. Phys. Rev. Lett. 47, 1553 (1981).
[166] H.-U. Desgranges and K. D. Schotte. Phys. Lett. 91A. 240 (1992).
[167] X. Andrei and J. H. Lowenstein. Phys. Rev. Lett. 46. 356 (1981).
[168] J. VV. Rasul and C. Hewson. J. Phys. C: Solid State Phys. 17. 3337 (1984).
[169] A. C. Larson and R. B. VonDreele. General Structure .\nalysis System. University of California
(1985-1990).
[170] U. Roy. K. Petrov. I. Tsolovski. and P. Peshev. Phys. Stat. SoL (a) 44. K25 (1977).
[171] Thermophysical Properties of Matter. Vol. 12. "Thermal E.xpansion". edited by S. Touloukian.
R. K. Kirby. R. E. Taylor, and P. D. Desai (IFI/Plenum. New York. 1975).
[172] G. K. White. Nature (London) 187. 927 (1960).
[173] J. G. Collins and G. K. White, in Progress in Low Temperature Physcs. edited by C. J. Gorter
(.North Holland. Amsterdam. 1964). Ch. 9.
[174] M. B. Kruger. J. H. Nguyen. W. Caldwell, and R. Jeanloz. Phys. Rev. B 56. 1 (1997).
[175] A. de Visser, J. J. M. Frcmse. and J. Flouquet, Physica B 161. 324 (1989).
[176] A. Abragam, Principles of Nuclear Magnetism (Oxford University Press. New York. 1961).
[177] L. E. Drain, Proc. Phys. Soc. (London) 80. 138 (1962).
[178] Y. Masuda. Fundamentals of Nuclear Magnetic Resonance (in Japanese) (Maruzen, Tokyo. 1985).

181
[179] G. C. Carter. L. H. Bennett, and D. J. Kahan. in Metallic Shifts in .\'MR. Progress in Materials
Science. Vol. 20. edited by B. Chalmers. J. W. Christian, and T. B. Massalski (Pergamon Press.
O.xford. 1977).
[180] H. M. McConnell and R. E. Robertson. J. Chem. Phys. 29. 1361 (1958).
[181] This temperature-independent susceptibility \o cannot be easily determined with precision be
cause of its small size. There also is a question about the validity of the Curie-Weiss law when
using it to a fit to the susceptibility including very high T data points (T > 400 K). In fact. .Muhtar
et al. interpreted their data assigning two different values of the Curie constant C to describe the
lower (T < 500 K) and higher (T > 500K) temperature susceptibility. Our \o was determined,
presumably more precisely, by making use of the temperature derivative of the high temperature
series expansion susceptibility for S = 1/2. as shown in the preceding chapter. \o was found to be
smaller than that Mahajan et al. [19]. This result would consequently alter the subsequent results
such as
[182] A. P. Reyes. L. P. Le. R. H. Heffner. E. T. Ahrens. Z. Fisk. and P. C. Canfield. Physica B
206-207. 332 (1995).
[183] P. Vonlanthen. J. L. Gavilano. B. Ambosini. D. Heisenberg, F. Hullinger. and H. R. Ott. Z. Phys.
B 102. 347 (1997).
[184] N". Buttgen. R. Bohmer. .A.. Krimmel. and A. Loide. Phys. Rev. B 53. 5557 (1996).
[185] T. Moriya. Prog. Theor. Phys. 16. 23 (1956).
[186] D. L. Cox. N. E. Bickers, and J. W. Wilkins. J. Appl. Phys. 57. 3166 (1985).
[187] R. Sala. E. Lee. F. Borsa. and P. C. Canfield, Phys. Rev. B 56. 6195 (1997).
[188] R. E. Walstedt and A. Narath. Phys. Rev. B 6. 4118 (1972).
[189] H. VVada, M. Shiga, and Y. Nakamura. Physica B 161. 197 (1989).
[190] C. Urano. et al. (unpublished).
[191] B. A. Jones et al.. Fig. 1 in P. A. Lee, T. M. Rice, J. W. Serene, L. J. Sham, and J. W. Wilkins,
Comments Cond. Mat. Phys. 12, 99 (1986).
[192] J. B. Goodenough (1997, private communication).

182
[193] J. Villain. R. Bidaux. J. P. Carton, and R. Conte. J. Phys. (Paris) 41. 1263 (1980).
[194] B. Canals and C. Lacroix. Phys. Rev. Lett. 80, 2933 (1998).
[195] M. Shiga. H. Wada, Y. Nakamura. J. Deportes. B. Ouladdiaf. and K. R. A. Ziebeck. J. Phys. See.
Jpn. 57. 3141 (1988). and references therein.
[196] B. D. Gaulin. J. N. Reimers. T. E. Mason. J. E. Greedan. and Z. Tun. Phys. Rev. Lett. 69. 3244
(1992).
[197] H. Nakamura. H. Wada. K. Yoshimura. M. Shiga. Y. Nakamura. J. Sakurai. and Y. Komura. J.
Phys. F 18. 981 (1988).
[198] M. Shiga. K. Fujisawa. and H. Wada. J. Phys. Soc. Jpn. 62, 1329 (1993).
[199] K. I. Kugel' and D. I. Khomskii. Sov. Phys. JETP 37. 725 (1973).
[200] H. F. Pen. J. van den Brink. D. I. Khomskii. and G. .A.. Sawatzky. Phys. Rev. Lett. 78. 1323
(1997).
[201] S. Marini and D. L Khomskii. Report cond-mat/9703130.

183
ACKNOWLEDGMENTS
I am greatfui to my adviser Dr. David C. Johnston for his guidance and patience during the course
of my Ph. D. study. Being his student has been such a precious experience to me. I have learned much
from his deep insight to physics.
I would like to extend my appreciation to Dr. L. L. Milter. Dr. C. A. Swenson. Dr. F. Borsa.
Dr. I. Goldman. Dr. M. B. Maple. Dr. Y. J. Uemura. Dr. O. Chmaissem. and Dr. J. D. Jorgensen.
I am indebted to them for their collaborations about this work on LiV^O^.
I would also like to thank my physics friends and colleagues Dr. A. \ ' . Mahajan. Dr. F. C. Chou.
Dr. Z. R. Wang. Dr. B. K. Cho. Dr. D. V'aknin. Dr. S. J. Lee. Dr. C. Detlefs. Dr. S. Kycia. Dr. T. Gu.
•A.. H. M. Z. Islam. Dr. P. C. Canfield. Z. Jang. Dr. A. Abd El-Hady. J. E. Chang. Dr. T. Pe.
Dr. J. L. Stanford. Dr. D. Allen. Dr. H. Eisaki. Dr. I. Inoue, Dr. F. Izumi. Dr. H. Takagi. Dr. V. Ueda.
Dr. N. Fujiwara. Dr. Yasuoka. and \ . Ichikawa.
My thanks are also extended to non-physics friends, but too many to name them all here. Their
support and encouragement deserve my deep appreciation.
Last but not least, my deepest appreciation to my wife Mihoko and son Kazuho for their continuous
support and patience cannot be expressed well in words. I am also thankful to my parents, parents-in-
law and my sister.
The work at Ames Laboratory was performed under Contract No. \V-7405-Eng-82 with the U.S.
Department of Energy. This work was supported by the Director of Energy Research. Office of Basic
Energy Sciences.