little ecological divergence associated with speciation in two african rain forest tree genera
TRANSCRIPT
RESEARCH ARTICLE Open Access
Little ecological divergence associated withspeciation in two African rain forest tree generaThomas LP Couvreur1*, Holly Porter-Morgan2,3, Jan J Wieringa4 and Lars W Chatrou5
Abstract
Background: The tropical rain forests (TRF) of Africa are the second largest block of this biome after the Amazonand exhibit high levels of plant endemism and diversity. Two main hypotheses have been advanced to explainspeciation processes that have led to this high level of biodiversity: allopatric speciation linked to geographicisolation and ecological speciation linked to ecological gradients. Both these hypotheses rely on ecology: in theformer conservation of ecological niches through time is implied, while in the latter adaptation via selection toalternative ecological niches would be a prerequisite. Here, we investigate the role of ecology in explaining presentday species diversity in African TRF using a species level phylogeny and ecological niche modeling of twopredominantly restricted TRF tree genera, Isolona and Monodora (Annonaceae). Both these genera, with 20 and 14species, respectively, are widely distributed in African TRFs, with a few species occurring in slightly less humidregions such as in East Africa.
Results: A total of 11 sister species pairs were identified most of them occurring in allopatry or with littlegeographical overlap. Our results provide a mixed answer on the role of ecology in speciation. Although no sisterspecies have identical niches, just under half of the tests suggest that sister species do have more similar nichesthan expected by chance. PCA analyses also support little ecological differences between sister species. Mostspeciation events within both genera predate the Pleistocene, occurring during the Late Miocene and Plioceneperiods.
Conclusions: Ecology is almost always involved in speciation, however, it would seem to have had a little role inspecies generation within Isolona and Monodora at the scale analyzed here. This is consistent with thegeographical speciation model for TRF diversification. These results contrast to other studies for non-TRF plantspecies where ecological speciation was found to be an important factor of diversification. The Pliocene periodappears to be a vital time in the generation of African TRF diversity, whereas Pleistocene climatic fluctuations havehad a smaller role on speciation than previously thought.Ecological niche modeling, species level phylogeny, ecological speciation, African tropics, Isolona, Monodora,Annonaceae
BackgroundThe tropical rain forest (TRF) biome covers just ~7% ofland but harbors over half of the planet’s terrestrial bio-diversity. The TRF of Africa represents the second lar-gest extent of this biome after the Amazon basin, andcontains high levels of species diversity and especiallyendemicity [1]. Two main African rain forest blocks
exist. The most widespread one corresponds to the Gui-neo-Congolian floristic region [2], which extends almostcontinuously (expect for a break at the Dahomey gap inTogo and Benin) from West Africa into the Congobasin and east of the Democratic Republic of Congoand Uganda. The East African rain forests are concen-trated on a smaller and patchier surface extending fromKenya to southern Mozambique along the coast and theEastern Arcs [3,4]. This latter block contains one of thehighest concentrations of endemic species on Earth [5].Understanding the evolutionary processes responsible
for high species richness of TRF has been a major focus
* Correspondence: [email protected] de Recherche pour le Développement (IRD), UMR DIA-DE, DYNADIVresearche group, 911, avenue Agropolis, BP 64501, F-34394 Montpelliercedex 5, FranceFull list of author information is available at the end of the article
Couvreur et al. BMC Evolutionary Biology 2011, 11:296http://www.biomedcentral.com/1471-2148/11/296
© 2011 Couvreur et al; licensee BioMed Central Ltd. This is an Open Access article distributed under the terms of the CreativeCommons Attribution License (http://creativecommons.org/licenses/by/2.0), which permits unrestricted use, distribution, andreproduction in any medium, provided the original work is properly cited.
of evolutionary biology [6], although most studies havefocused on the Amazon and Australian rain forests.Two main hypotheses have been advanced to explainspeciation processes that have led to high levels of bio-diversity in African TRF [7,8]: 1) geographic isolationbetween populations restricted to rain forest patchesresulting in allopatric speciation (e.g. the refuge model,mountain speciation model, riverine barrier model[9-13]); 2) divergent selection related to ecological gradi-ents where genetic and/or geographic isolation is minor[7,14]. Ecology is central to the processes of divergenceand speciation [15,16] but in the two speciation modelsabove (geographic isolation vs. divergent selection) ecol-ogy plays contrasting roles [17]. In the former, it wouldbe expected that the variables that make up a nichehave low rates of change over a phylogeny (niche con-servatism [18,19] or niche stasis [20]). This patternwould be predicted when taxa that are restricted to rainforest patches have been tracking the geographical dis-tribution of this biome, being unable to adapt to chan-ging conditions. In contrast, in the case of divergentselection, ecological divergence and adaptation to newniches would be a fundamental prerequisite [7], and thevariables comprising species’ niches would be expectedto deviate less from a random distribution over a phylo-geny than in the case of geographic isolation. For exam-ple, adaptation to more arid environments since theMiocene has been suggested to be a driver of diversifica-tion in some African plant genera [21]. Thus, a possiblefirst step in unraveling TRF diversification in Africa isto understand the role of ecology in explaining presentday diversity.New developments in ecological niche modeling
(ENM) or species distribution modeling have providedimportant advances in the understanding of species dis-tribution [22], as well as in the study of ecological spe-ciation [e.g. for plants [23], [24], [25]]. These methodscombine data about the known distribution of a specieswith climatic and other relevant variables to identifythose environmental conditions that are suitable for thatspecies and predict its potential distribution. Such meth-ods allow for a precise quantification of ecological para-meters specific to each species, which in turn enablesthe use of statistical tests to answer questions aboutniche differentiation or similarity [26,27].Here, we used an integrative approach including a
dated molecular phylogeny [28,29] and ENM to investi-gate the evolutionary ecology of two African TRF generaIsolona and Monodora (Annonaceae). Both genera con-tain small to large trees largely distributed across theAfrican rain forests from West/Central Africa to EastAfrica. A recent monograph of both genera providesinformation about species delimitation as well as theirdistribution [28]. Isolona contains 20 species, 5 of them
endemic to Madagascar, while Monodora contains 14species and is absent from Madagascar [28]. A largenumber of species grow in lowland rain forests, but afew occur in montane areas (above 1200 m), as well asin less humid regions growing in thicket or woodlandsuch as in Malawi and northern South Africa. Both gen-era have been recovered as sister with maximum sup-port nested within a large clade of African genera [30].Moreover, the presence of phylogenetic signal of certainclimatic variables identified within Monodora has beenpreviously suggested but not explicitly tested [31].Finally, Hutchinson underlined [32] that the ecologicalniche of species is multi dimensional. For this study weshall use climatic data for Africa as this is available forall species used in this study, in contrast to other ecolo-gical data for which we have very spars records (pollina-tion biology, biological interactions, etc.). Moreover,bioclimatic models appear suitable to generate predic-tions of species ecological requirements at the macro-scale studied here (continental distribution of species)[33].The goal of this study was to understand the role of
ecology in the speciation and distribution of both gen-era. We identified sister species and tested for nichesimilarity and for phylogenetic signal of different cli-matic variables within the clade. Specifically weaddressed the following questions: Do sister specieshave similar ecological niches? Can we detect a phyloge-netic signal of environmental variables?
ResultsPhylogenyUsing the molecular phylogenies published by [28,29]we identified a total of 11 species pairs (Figure 1) gener-ally based on strong support values. No comparisonswere undertaken within the monophyletic Malagasyclade because the focus of this study was directedtowards mainland Africa. In the cases where supportvalues were low comparisons were undertaken on spe-cies that were grouped together in the different priorphylogenetic analyses (e.g. BEAST, MrBayes). Morphol-ogy and palynology provide little information on speciesrelationships when compared to molecular phylogenies,especially in Monodora [28,34]. Monodora crispata andM. tenuifolia were considered as sister albeit with lowsupport because these two species were also recoveredas sister (with low support) in other analyses [see [28]].In one case, relationships between three species (M.myristica, M. undulata and M. laurentii) were unre-solved and thus comparisons were undertaken betweenall possible pairs (four pairwise comparisons). WithinIsolona, four species of mainland Africa were notsampled and their exact placement remains unknown.Even though strong support for some sister species
Couvreur et al. BMC Evolutionary Biology 2011, 11:296http://www.biomedcentral.com/1471-2148/11/296
Page 2 of 19
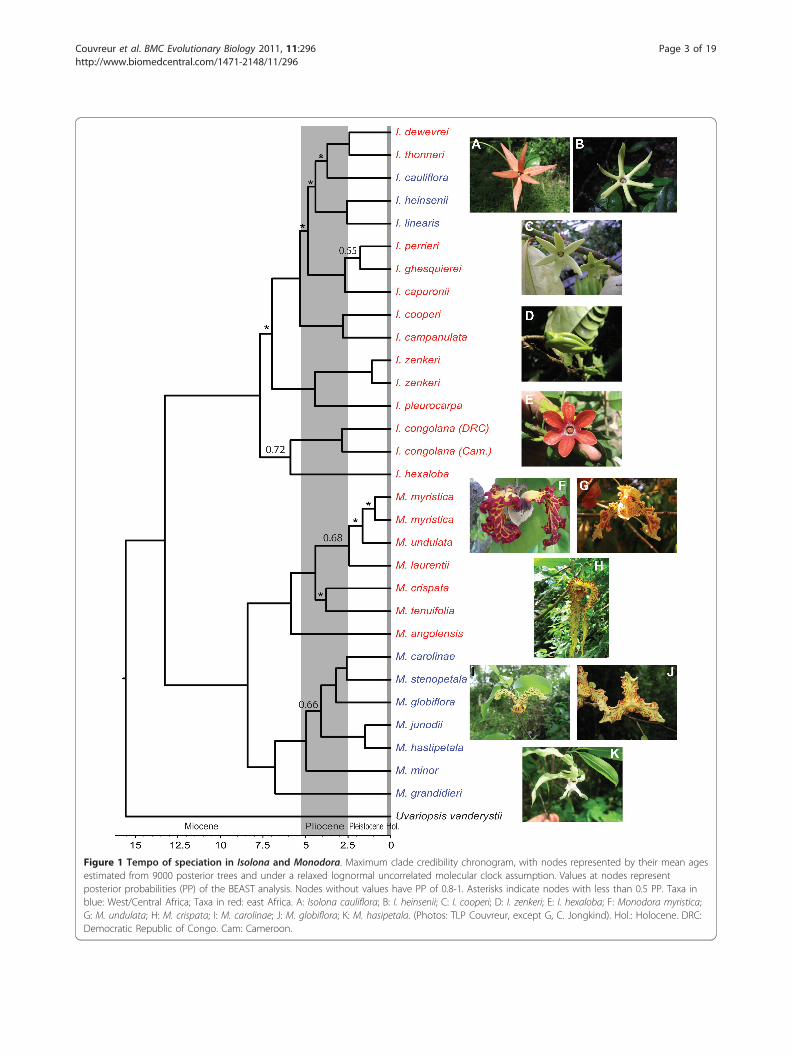
Figure 1 Tempo of speciation in Isolona and Monodora. Maximum clade credibility chronogram, with nodes represented by their mean agesestimated from 9000 posterior trees and under a relaxed lognormal uncorrelated molecular clock assumption. Values at nodes representposterior probabilities (PP) of the BEAST analysis. Nodes without values have PP of 0.8-1. Asterisks indicate nodes with less than 0.5 PP. Taxa inblue: West/Central Africa; Taxa in red: east Africa. A: Isolona cauliflora; B: I. heinsenii; C: I. cooperi; D: I. zenkeri; E: I. hexaloba; F: Monodora myristica;G: M. undulata; H: M. crispata; I: M. carolinae; J: M. globiflora; K: M. hasipetala. (Photos: TLP Couvreur, except G, C. Jongkind). Hol.: Holocene. DRC:Democratic Republic of Congo. Cam: Cameroon.
Couvreur et al. BMC Evolutionary Biology 2011, 11:296http://www.biomedcentral.com/1471-2148/11/296
Page 3 of 19
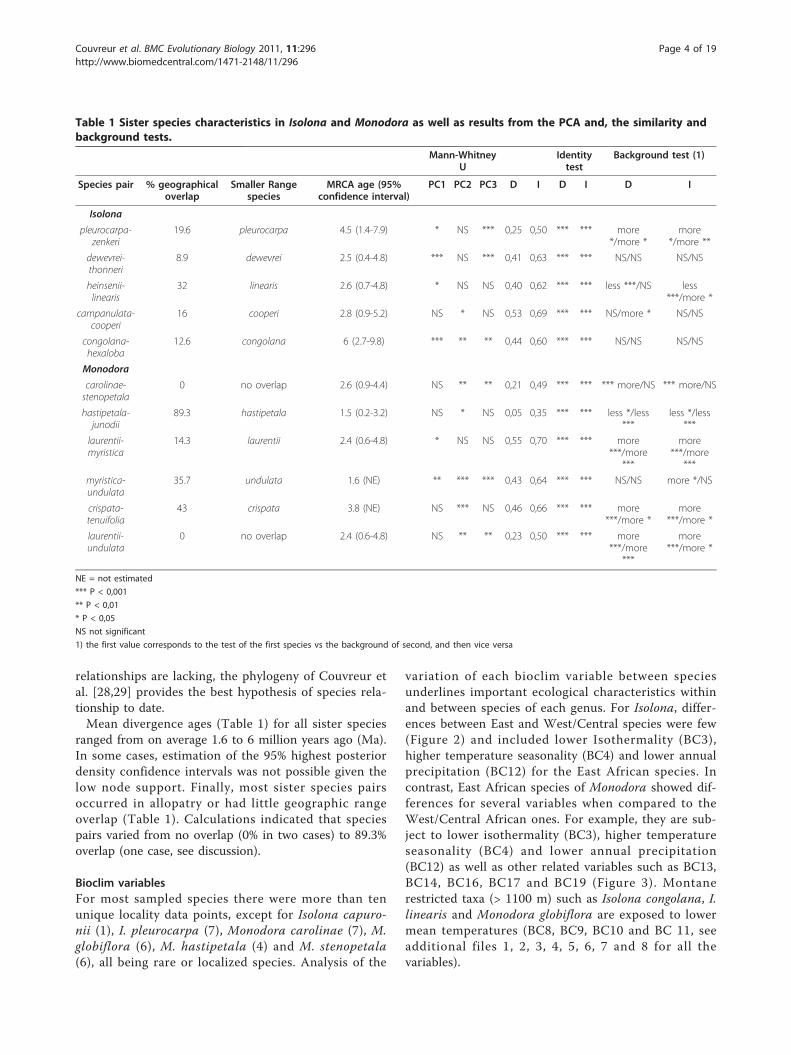
relationships are lacking, the phylogeny of Couvreur etal. [28,29] provides the best hypothesis of species rela-tionship to date.Mean divergence ages (Table 1) for all sister species
ranged from on average 1.6 to 6 million years ago (Ma).In some cases, estimation of the 95% highest posteriordensity confidence intervals was not possible given thelow node support. Finally, most sister species pairsoccurred in allopatry or had little geographic rangeoverlap (Table 1). Calculations indicated that speciespairs varied from no overlap (0% in two cases) to 89.3%overlap (one case, see discussion).
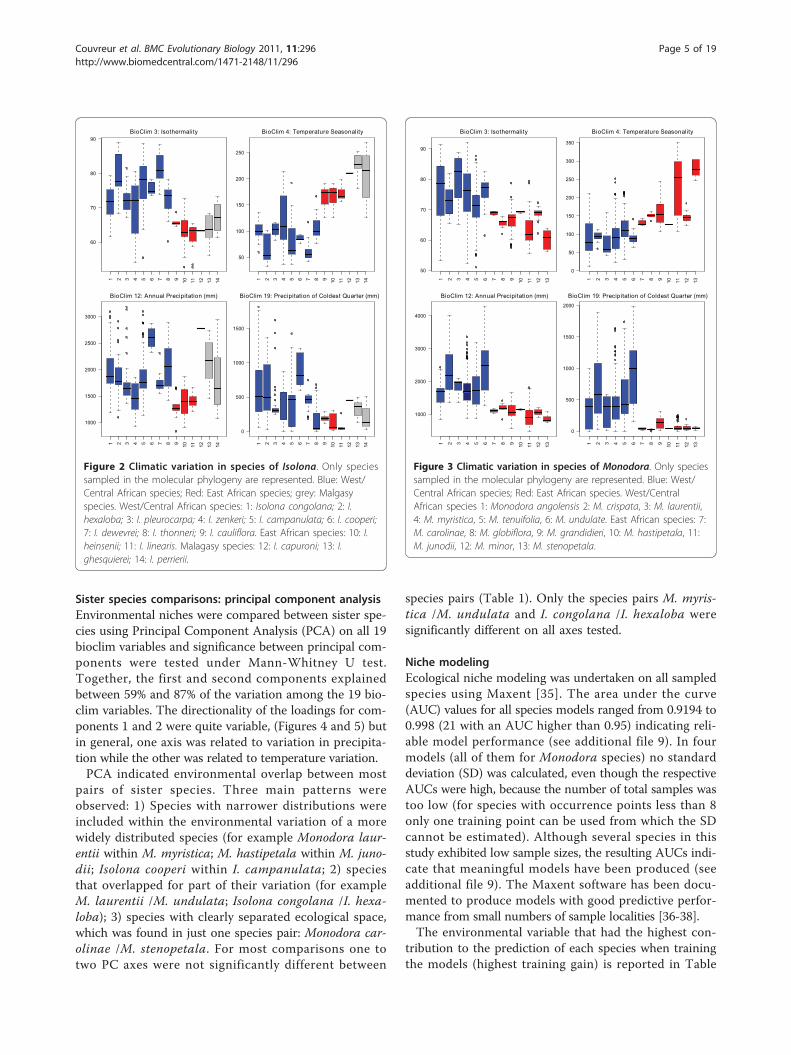
Bioclim variablesFor most sampled species there were more than tenunique locality data points, except for Isolona capuro-nii (1), I. pleurocarpa (7), Monodora carolinae (7), M.globiflora (6), M. hastipetala (4) and M. stenopetala(6), all being rare or localized species. Analysis of the
variation of each bioclim variable between speciesunderlines important ecological characteristics withinand between species of each genus. For Isolona, differ-ences between East and West/Central species were few(Figure 2) and included lower Isothermality (BC3),higher temperature seasonality (BC4) and lower annualprecipitation (BC12) for the East African species. Incontrast, East African species of Monodora showed dif-ferences for several variables when compared to theWest/Central African ones. For example, they are sub-ject to lower isothermality (BC3), higher temperatureseasonality (BC4) and lower annual precipitation(BC12) as well as other related variables such as BC13,BC14, BC16, BC17 and BC19 (Figure 3). Montanerestricted taxa (> 1100 m) such as Isolona congolana, I.linearis and Monodora globiflora are exposed to lowermean temperatures (BC8, BC9, BC10 and BC 11, seeadditional files 1, 2, 3, 4, 5, 6, 7 and 8 for all thevariables).
Table 1 Sister species characteristics in Isolona and Monodora as well as results from the PCA and, the similarity andbackground tests.
Mann-WhitneyU
Identitytest
Background test (1)
Species pair % geographicaloverlap
Smaller Rangespecies
MRCA age (95%confidence interval)
PC1 PC2 PC3 D I D I D I
Isolona
pleurocarpa-zenkeri
19.6 pleurocarpa 4.5 (1.4-7.9) * NS *** 0,25 0,50 *** *** more*/more *
more*/more **
dewevrei-thonneri
8.9 dewevrei 2.5 (0.4-4.8) *** NS *** 0,41 0,63 *** *** NS/NS NS/NS
heinsenii-linearis
32 linearis 2.6 (0.7-4.8) * NS NS 0,40 0,62 *** *** less ***/NS less***/more *
campanulata-cooperi
16 cooperi 2.8 (0.9-5.2) NS * NS 0,53 0,69 *** *** NS/more * NS/NS
congolana-hexaloba
12.6 congolana 6 (2.7-9.8) *** ** ** 0,44 0,60 *** *** NS/NS NS/NS
Monodora
carolinae-stenopetala
0 no overlap 2.6 (0.9-4.4) NS ** ** 0,21 0,49 *** *** *** more/NS *** more/NS
hastipetala-junodii
89.3 hastipetala 1.5 (0.2-3.2) NS * NS 0,05 0,35 *** *** less */less***
less */less***
laurentii-myristica
14.3 laurentii 2.4 (0.6-4.8) * NS NS 0,55 0,70 *** *** more***/more
***
more***/more
***
myristica-undulata
35.7 undulata 1.6 (NE) ** *** *** 0,43 0,64 *** *** NS/NS more */NS
crispata-tenuifolia
43 crispata 3.8 (NE) NS *** NS 0,46 0,66 *** *** more***/more *
more***/more *
laurentii-undulata
0 no overlap 2.4 (0.6-4.8) NS ** ** 0,23 0,50 *** *** more***/more
***
more***/more *
NE = not estimated
*** P < 0,001
** P < 0,01
* P < 0,05
NS not significant
1) the first value corresponds to the test of the first species vs the background of second, and then vice versa
Couvreur et al. BMC Evolutionary Biology 2011, 11:296http://www.biomedcentral.com/1471-2148/11/296
Page 4 of 19
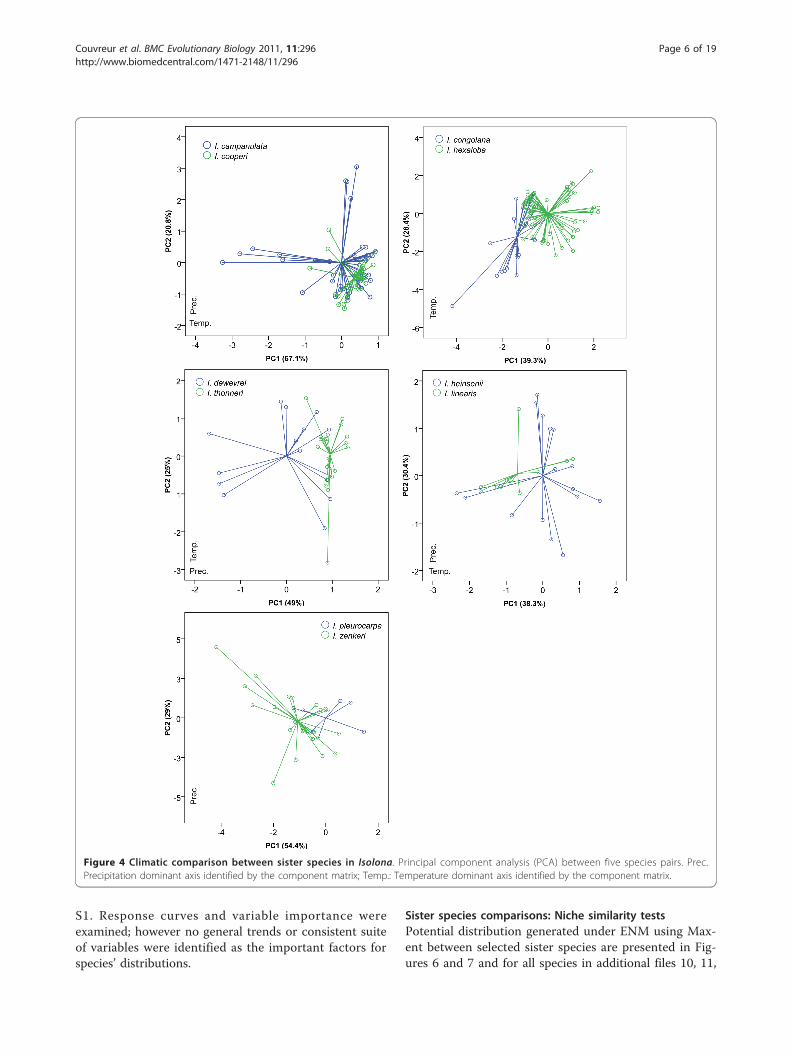
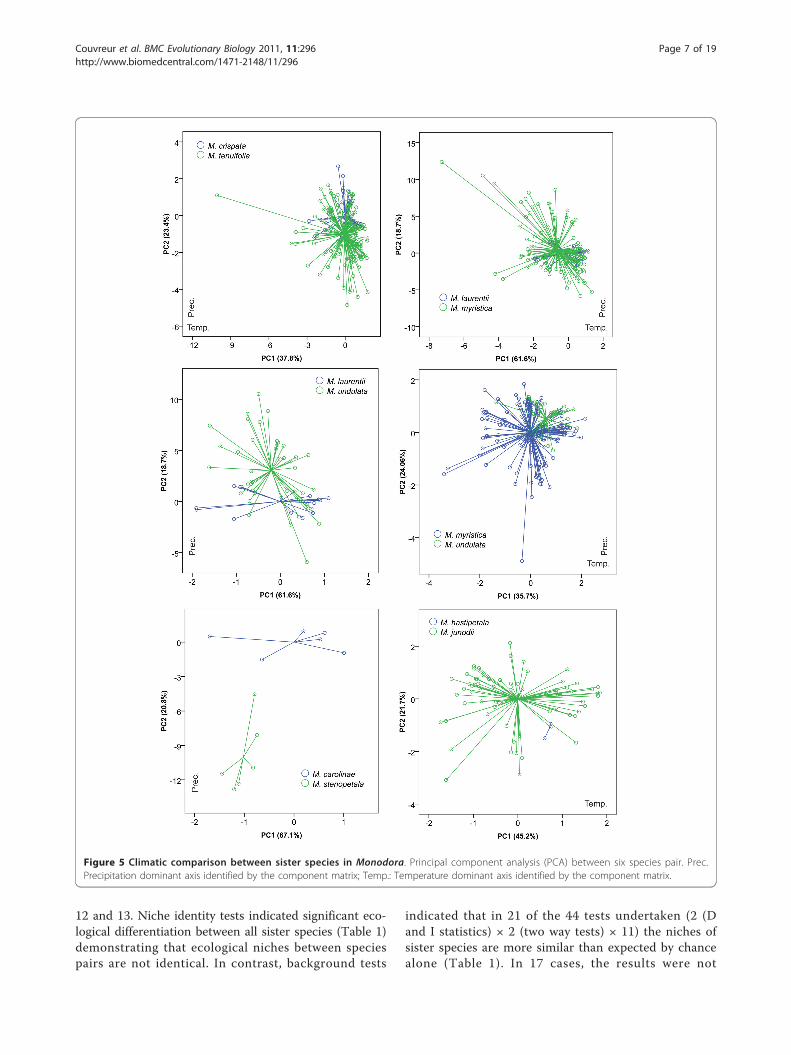
Sister species comparisons: principal component analysisEnvironmental niches were compared between sister spe-cies using Principal Component Analysis (PCA) on all 19bioclim variables and significance between principal com-ponents were tested under Mann-Whitney U test.Together, the first and second components explainedbetween 59% and 87% of the variation among the 19 bio-clim variables. The directionality of the loadings for com-ponents 1 and 2 were quite variable, (Figures 4 and 5) butin general, one axis was related to variation in precipita-tion while the other was related to temperature variation.PCA indicated environmental overlap between most
pairs of sister species. Three main patterns wereobserved: 1) Species with narrower distributions wereincluded within the environmental variation of a morewidely distributed species (for example Monodora laur-entii within M. myristica; M. hastipetala within M. juno-dii; Isolona cooperi within I. campanulata; 2) speciesthat overlapped for part of their variation (for exampleM. laurentii /M. undulata; Isolona congolana /I. hexa-loba); 3) species with clearly separated ecological space,which was found in just one species pair: Monodora car-olinae /M. stenopetala. For most comparisons one totwo PC axes were not significantly different between
species pairs (Table 1). Only the species pairs M. myris-tica /M. undulata and I. congolana /I. hexaloba weresignificantly different on all axes tested.
Niche modelingEcological niche modeling was undertaken on all sampledspecies using Maxent [35]. The area under the curve(AUC) values for all species models ranged from 0.9194 to0.998 (21 with an AUC higher than 0.95) indicating reli-able model performance (see additional file 9). In fourmodels (all of them for Monodora species) no standarddeviation (SD) was calculated, even though the respectiveAUCs were high, because the number of total samples wastoo low (for species with occurrence points less than 8only one training point can be used from which the SDcannot be estimated). Although several species in thisstudy exhibited low sample sizes, the resulting AUCs indi-cate that meaningful models have been produced (seeadditional file 9). The Maxent software has been docu-mented to produce models with good predictive perfor-mance from small numbers of sample localities [36-38].The environmental variable that had the highest con-
tribution to the prediction of each species when trainingthe models (highest training gain) is reported in Table
Figure 2 Climatic variation in species of Isolona. Only speciessampled in the molecular phylogeny are represented. Blue: West/Central African species; Red: East African species; grey: Malgasyspecies. West/Central African species: 1: Isolona congolana; 2: I.hexaloba; 3: I. pleurocarpa; 4: I. zenkeri; 5: I. campanulata; 6: I. cooperi;7: I. dewevrei; 8: I. thonneri; 9: I. cauliflora. East African species: 10: I.heinsenii; 11: I. linearis. Malagasy species: 12: I. capuroni; 13: I.ghesquierei; 14: I. perrierii.
Figure 3 Climatic variation in species of Monodora. Only speciessampled in the molecular phylogeny are represented. Blue: West/Central African species; Red: East African species. West/CentralAfrican species 1: Monodora angolensis 2: M. crispata, 3: M. laurentii,4: M. myristica, 5: M. tenuifolia, 6: M. undulate. East African species: 7:M. carolinae, 8: M. globiflora, 9: M. grandidieri, 10: M. hastipetala, 11:M. junodii, 12: M. minor, 13: M. stenopetala.
Couvreur et al. BMC Evolutionary Biology 2011, 11:296http://www.biomedcentral.com/1471-2148/11/296
Page 5 of 19
S1. Response curves and variable importance wereexamined; however no general trends or consistent suiteof variables were identified as the important factors forspecies’ distributions.
Sister species comparisons: Niche similarity testsPotential distribution generated under ENM using Max-ent between selected sister species are presented in Fig-ures 6 and 7 and for all species in additional files 10, 11,
Figure 4 Climatic comparison between sister species in Isolona. Principal component analysis (PCA) between five species pairs. Prec.Precipitation dominant axis identified by the component matrix; Temp.: Temperature dominant axis identified by the component matrix.
Couvreur et al. BMC Evolutionary Biology 2011, 11:296http://www.biomedcentral.com/1471-2148/11/296
Page 6 of 19
12 and 13. Niche identity tests indicated significant eco-logical differentiation between all sister species (Table 1)demonstrating that ecological niches between speciespairs are not identical. In contrast, background tests
indicated that in 21 of the 44 tests undertaken (2 (Dand I statistics) × 2 (two way tests) × 11) the niches ofsister species are more similar than expected by chancealone (Table 1). In 17 cases, the results were not
Figure 5 Climatic comparison between sister species in Monodora. Principal component analysis (PCA) between six species pair. Prec.Precipitation dominant axis identified by the component matrix; Temp.: Temperature dominant axis identified by the component matrix.
Couvreur et al. BMC Evolutionary Biology 2011, 11:296http://www.biomedcentral.com/1471-2148/11/296
Page 7 of 19
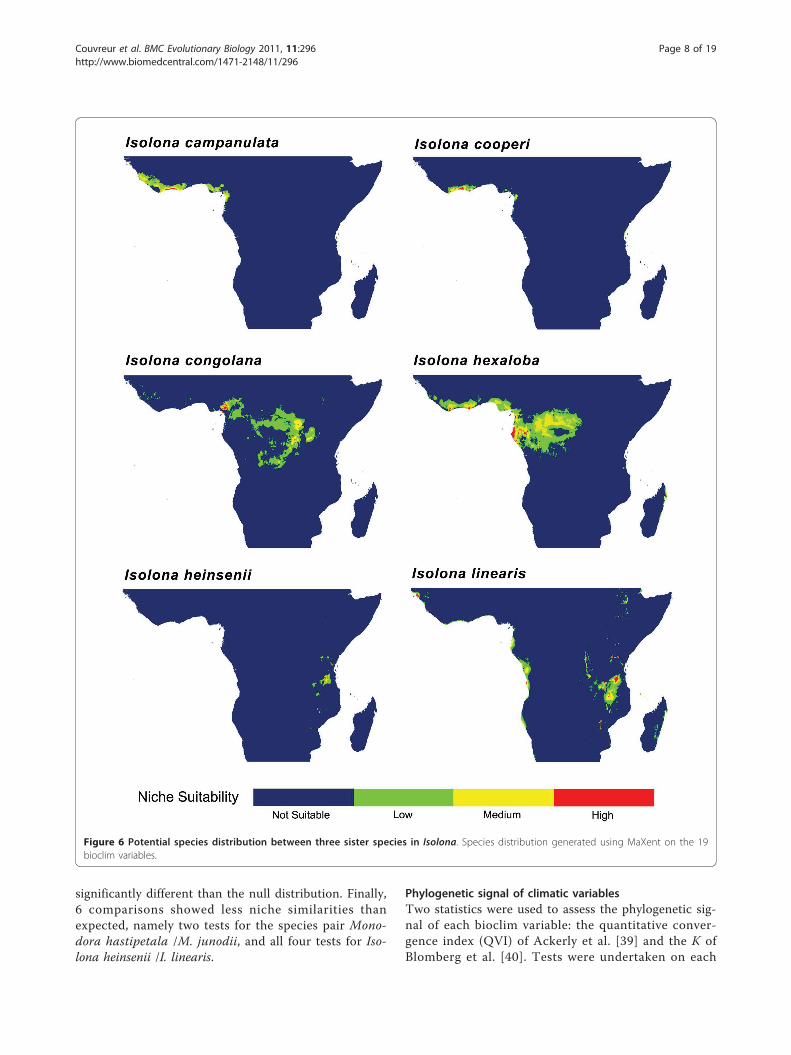
significantly different than the null distribution. Finally,6 comparisons showed less niche similarities thanexpected, namely two tests for the species pair Mono-dora hastipetala /M. junodii, and all four tests for Iso-lona heinsenii /I. linearis.
Phylogenetic signal of climatic variablesTwo statistics were used to assess the phylogenetic sig-nal of each bioclim variable: the quantitative conver-gence index (QVI) of Ackerly et al. [39] and the K ofBlomberg et al. [40]. Tests were undertaken on each
Figure 6 Potential species distribution between three sister species in Isolona. Species distribution generated using MaXent on the 19bioclim variables.
Couvreur et al. BMC Evolutionary Biology 2011, 11:296http://www.biomedcentral.com/1471-2148/11/296
Page 8 of 19
genus independently and then on the clade as a whole(Table 2). The QVI varied from 0.34 to 0.79 in Isolona,0.23 to 0.99 in Monodora and 0.46 to 0.85 in the wholeclade (Table 2). The randomization tests on 1000
posterior trees indicated that 9/19 variables in Isolona,10/19 variables in Monodora and 14/19 variables in thewhole clade were significantly smaller than expected bychance (mean QVI in less than the 99th percentile)
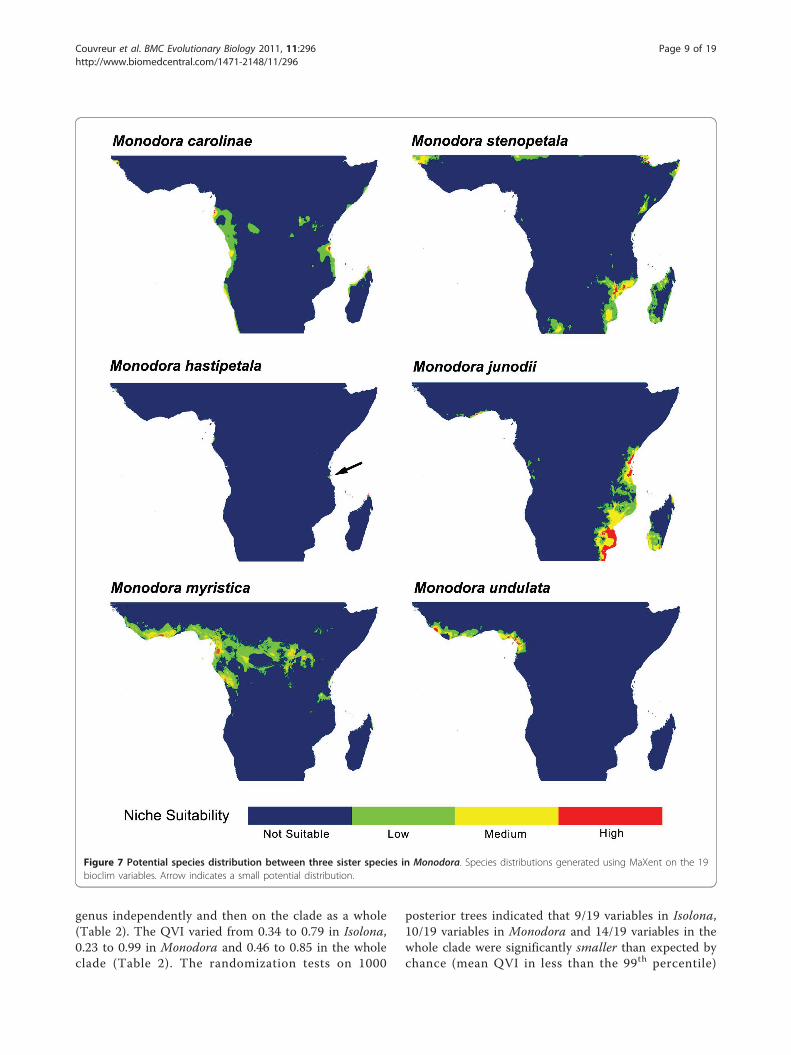
Figure 7 Potential species distribution between three sister species in Monodora. Species distributions generated using MaXent on the 19bioclim variables. Arrow indicates a small potential distribution.
Couvreur et al. BMC Evolutionary Biology 2011, 11:296http://www.biomedcentral.com/1471-2148/11/296
Page 9 of 19
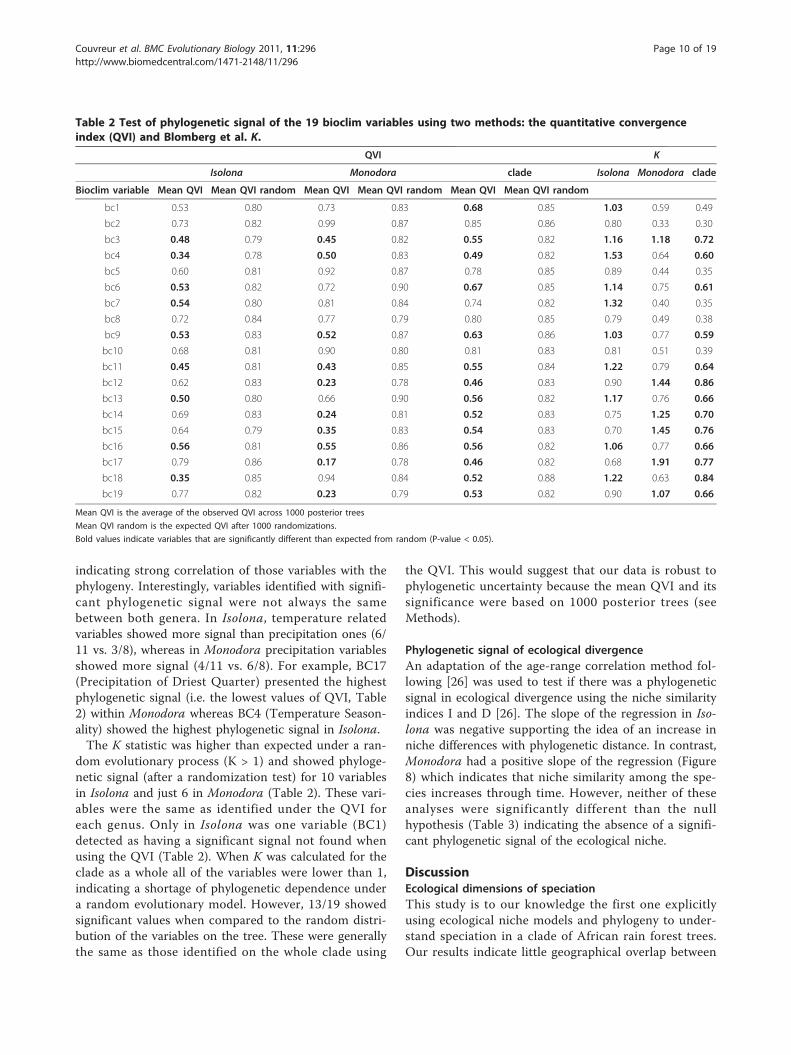
indicating strong correlation of those variables with thephylogeny. Interestingly, variables identified with signifi-cant phylogenetic signal were not always the samebetween both genera. In Isolona, temperature relatedvariables showed more signal than precipitation ones (6/11 vs. 3/8), whereas in Monodora precipitation variablesshowed more signal (4/11 vs. 6/8). For example, BC17(Precipitation of Driest Quarter) presented the highestphylogenetic signal (i.e. the lowest values of QVI, Table2) within Monodora whereas BC4 (Temperature Season-ality) showed the highest phylogenetic signal in Isolona.The K statistic was higher than expected under a ran-
dom evolutionary process (K > 1) and showed phyloge-netic signal (after a randomization test) for 10 variablesin Isolona and just 6 in Monodora (Table 2). These vari-ables were the same as identified under the QVI foreach genus. Only in Isolona was one variable (BC1)detected as having a significant signal not found whenusing the QVI (Table 2). When K was calculated for theclade as a whole all of the variables were lower than 1,indicating a shortage of phylogenetic dependence undera random evolutionary model. However, 13/19 showedsignificant values when compared to the random distri-bution of the variables on the tree. These were generallythe same as those identified on the whole clade using
the QVI. This would suggest that our data is robust tophylogenetic uncertainty because the mean QVI and itssignificance were based on 1000 posterior trees (seeMethods).
Phylogenetic signal of ecological divergenceAn adaptation of the age-range correlation method fol-lowing [26] was used to test if there was a phylogeneticsignal in ecological divergence using the niche similarityindices I and D [26]. The slope of the regression in Iso-lona was negative supporting the idea of an increase inniche differences with phylogenetic distance. In contrast,Monodora had a positive slope of the regression (Figure8) which indicates that niche similarity among the spe-cies increases through time. However, neither of theseanalyses were significantly different than the nullhypothesis (Table 3) indicating the absence of a signifi-cant phylogenetic signal of the ecological niche.
DiscussionEcological dimensions of speciationThis study is to our knowledge the first one explicitlyusing ecological niche models and phylogeny to under-stand speciation in a clade of African rain forest trees.Our results indicate little geographical overlap between
Table 2 Test of phylogenetic signal of the 19 bioclim variables using two methods: the quantitative convergenceindex (QVI) and Blomberg et al. K.
QVI K
Isolona Monodora clade Isolona Monodora clade
Bioclim variable Mean QVI Mean QVI random Mean QVI Mean QVI random Mean QVI Mean QVI random
bc1 0.53 0.80 0.73 0.83 0.68 0.85 1.03 0.59 0.49
bc2 0.73 0.82 0.99 0.87 0.85 0.86 0.80 0.33 0.30
bc3 0.48 0.79 0.45 0.82 0.55 0.82 1.16 1.18 0.72
bc4 0.34 0.78 0.50 0.83 0.49 0.82 1.53 0.64 0.60
bc5 0.60 0.81 0.92 0.87 0.78 0.85 0.89 0.44 0.35
bc6 0.53 0.82 0.72 0.90 0.67 0.85 1.14 0.75 0.61
bc7 0.54 0.80 0.81 0.84 0.74 0.82 1.32 0.40 0.35
bc8 0.72 0.84 0.77 0.79 0.80 0.85 0.79 0.49 0.38
bc9 0.53 0.83 0.52 0.87 0.63 0.86 1.03 0.77 0.59
bc10 0.68 0.81 0.90 0.80 0.81 0.83 0.81 0.51 0.39
bc11 0.45 0.81 0.43 0.85 0.55 0.84 1.22 0.79 0.64
bc12 0.62 0.83 0.23 0.78 0.46 0.83 0.90 1.44 0.86
bc13 0.50 0.80 0.66 0.90 0.56 0.82 1.17 0.76 0.66
bc14 0.69 0.83 0.24 0.81 0.52 0.83 0.75 1.25 0.70
bc15 0.64 0.79 0.35 0.83 0.54 0.83 0.70 1.45 0.76
bc16 0.56 0.81 0.55 0.86 0.56 0.82 1.06 0.77 0.66
bc17 0.79 0.86 0.17 0.78 0.46 0.82 0.68 1.91 0.77
bc18 0.35 0.85 0.94 0.84 0.52 0.88 1.22 0.63 0.84
bc19 0.77 0.82 0.23 0.79 0.53 0.82 0.90 1.07 0.66
Mean QVI is the average of the observed QVI across 1000 posterior trees
Mean QVI random is the expected QVI after 1000 randomizations.
Bold values indicate variables that are significantly different than expected from random (P-value < 0.05).
Couvreur et al. BMC Evolutionary Biology 2011, 11:296http://www.biomedcentral.com/1471-2148/11/296
Page 10 of 19
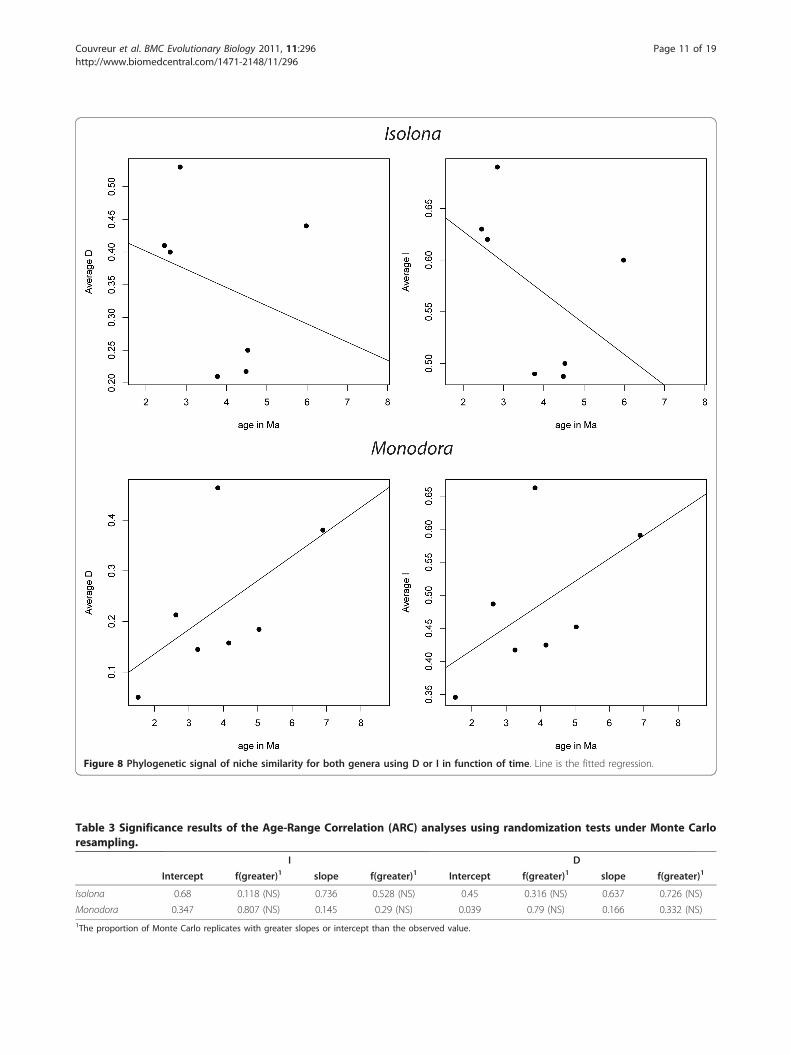
Figure 8 Phylogenetic signal of niche similarity for both genera using D or I in function of time. Line is the fitted regression.
Table 3 Significance results of the Age-Range Correlation (ARC) analyses using randomization tests under Monte Carloresampling.
I D
Intercept f(greater)1 slope f(greater)1 Intercept f(greater)1 slope f(greater)1
Isolona 0.68 0.118 (NS) 0.736 0.528 (NS) 0.45 0.316 (NS) 0.637 0.726 (NS)
Monodora 0.347 0.807 (NS) 0.145 0.29 (NS) 0.039 0.79 (NS) 0.166 0.332 (NS)1The proportion of Monte Carlo replicates with greater slopes or intercept than the observed value.
Couvreur et al. BMC Evolutionary Biology 2011, 11:296http://www.biomedcentral.com/1471-2148/11/296
Page 11 of 19
sister species (7/11 comparison with less than 30% over-lap, Table 1). Thus, most species pairs occur in allopa-try, a result consistent with the geographical isolationhypothesis, although this would also be expected underthe ecological gradient hypothesis. In one case the over-lap was relatively large, for example between M. junodiiand M. hastipelata (~ 90%). However, this might be anartifact in the way the overlap statistic was calculated(see Methods) as both these species never grow in com-plete sympatry (i.e. next to each other, pers. obs.).Monodora hastipelata is a local endemic to a small areain the Matumbi Hills in Tanzania [41] while M. junodiihas an extensive distribution across East Africa [28].Most species pairs show visual overlap in ecological
space (Figures 4 and 5) and are never completely sepa-rated by PCA analysis (expect for the M. carolinae andM. stenopetala pair, see below). In contrast, the nichesimilarity tests [26] based on the ecological niche mod-els demonstrated that all species pair had highly signifi-cantly different niches (Table 1). This test, however, isknown to be very strict, and rejection of similarity canoccur based on very small niche differences, especiallyfor allopatric species [42]. At the scale studied here (dis-tribution of species at the continental level) the prob-ability of two species having completely identical nichesis very low [18] and these tests might be too stringent,something already noted in other studies (e.g. [43]). Thebackground tests appear better suited for this type ofanalyses and is generally used when species occur inallopatry [42]. Just under half of the tests undertaken(48%, Table 1) supported the hypothesis of niche simi-larity between sister species whereas 13% (6/44) of thetests supported a significant difference. However, four ofthese latter tests were found for the species pair Mono-dora junodii/M. hastipetala, and could be linked to thefew data points associated with M. hastipetala (seeMethods). In several cases (17/44) a non-significant(NS) result was found, which is suggestive of a lack ofpower to detect niche differentiation/similarity, eitherlinked to a low sample size or to the distribution of thehabitat [26]. NS results were found either betweenwidely distributed species with a fair number of collec-tions (e.g. I. hexaloba and M. myristica), suggestinghabitat heterogeneity as a source of lack of power, orbetween species with a small number of collections (M.stenopetala /M. carolinae; I. thonneri /I. dewevrei).Finally, we also tested each bioclim variable for phylo-
genetic signal, i.e. the statistical nonindependenceamong species of the variables given their phylogeneticrelationships. Direct interpretation in terms of evolutionof significant phylogenetic signal of traits is difficult andshould be done with caution [44,45]. These tests yieldeddifferent results depending on the level of the analysis(genus versus clade). Nevertheless, both statistics
identified several bioclim variables within each genusand for the clade as containing significant phylogeneticinformation (Table 2). Such a result was already sug-gested for Monodora [31] but not for Isolona or theclade as a whole. However, it should be noted that forthe genus tests the power of the randomizationapproach to detect significance of the K statistic mightbe slightly low for 14-16 tip phylogenies [40]. Here, wedo not attempt to draw strong conclusions about therate of evolutionary change or the pattern of the evolu-tionary process linked to these variables. We simplyunderline that many variables are not randomly placedon the phylogeny and that they deviate from a randomevolutionary process as generated under the Brownianmotion model (as interpreted by the K statistic). This iswhat would be expected under niche conservatism andthe geographical speciation model, although exactly howthey have influenced its diversification would requiremore in depth model fitting analyses [44,46]. In addi-tion, we failed to identify any phylogenetic signal of eco-logical niche overlap (Figure 7) [26]. Absence ofphylogenetic signal can be the result of a mixture in thespeciation pattern [47], or it may be directly related tothe quality of the data. In Monodora, the latter wouldappear to be the case as phylogenetic resolution withinthe West species is low, and specimen locality data fromtwo sister species pair in East Africa are few, both beingsources of error.The analyses at several levels using different
approaches provide a mixed signal on the role of ecol-ogy in speciation. Although sister species within thisclade do not have identical niches, which is to beexpected [18], they are in several cases significantlymore similar between each other than by chance alone(Table 1). Overall however, based on PCA, ecologicalniche modeling and phylogenetic signal analyses, ourresults do provide some support to the idea that interms of diversification, ecological speciation as viewedthrough climate has not played a major role in the evo-lution of Isolona and Monodora species. This contrastswith several recent publications where significant ecolo-gical divergence was generally demonstrated for north-ern hemisphere plant sister species such as in Lonicera[48], Cyclamen [24], five Andean Solanum species [25]and in most clades of the South American genus Hor-deum [43]. They all concluded that ecological speciationwas an important factor of diversification within thesegenera. Moreover, in the mainly African distributedcucurbit genus Coccinia, frequent biome shifts wereinferred during a period of 6 Ma between forest, wood-land and semi arid habitats, implying an important roleof ecological diversification [49]. Finally, the spread ofarid environments in Africa during the Neogene wassuggested to be an important driver of diversification of
Couvreur et al. BMC Evolutionary Biology 2011, 11:296http://www.biomedcentral.com/1471-2148/11/296
Page 12 of 19
some partially TRF genera such as Acridocarpus [21].Adaptation to alternative (more arid) environmentsappears extremely limited within Isolona and Monodoramainly because of the strong evolutionary constraintapplied by the precipitation variables (Table 2). A strongcorrelation between rainfall and species distribution wasalso found within Neotropical Annonaceae in general[50].The only species pair for which speciation might have
relied on ecology is found in the East African species M.carolinae et M. stenopetala (Figure 5), the former occur-ring in moist semi-deciduous coastal forests of southernTanzania and Mozambique while the latter is found indense thickets and woodlands of Malawi (Figure 7).However, the background test indicated that M. stenope-tala had a significantly more similar niche when com-pared to the environmental background of M. carolinae(in the other direction, i.e. the similarity of M. carolinaeusing the background of M. stenopetala, was non-signif-icant, and thus inconclusive). This result is quite intri-guing given the important ecological differencesidentified using PCA between these two species, andcould be an artifact due to the low sample size of bothspecies (7 for M. carolinae; 6 for M. stenopetala). Itremains unclear exactly how many samples are neces-sary to produce a robust ecological niche model,although some authors have suggested more than 10[23,27] or even over 100 [see [51]]. Also, these resultscould be due to the established background that wasused for the tests, here defined as all grid cells within 20km of known occurrence localities. The backgroundtests are known to be sensitive to the definition of spe-cies ‘background’ and therefore a finer or coarser back-ground region could yield different results [25].
Temporal dimensions of speciationThe estimated mean ages of the origin of species in bothgenera inferred by Couvreur et al. [29] (Figure 1, Table1) are dated to before or at the beginning of the Pleisto-cene (9/11 speciation events are older than 2.4 Ma,Table 1). This would suggest that the Pleistocene cli-matic fluctuations had little effect on species diversitywithin these genera. This result is intriguing because thegeographical isolation hypothesis was thought to beespecially important during the Pleistocene because ofthe numerous successive rain forest expansion and frag-mentation [52-54]. Thus, although ecology plays a littlerole in the speciation processes of these genera inAfrica, the timing of these events pre dates a period ofintensive climatic variation and hence potential isolationevents. Rather, most speciation events occurred in theLate Miocene and during the Pliocene (between 6-2.4Ma). It is important to note that these conclusions arebased on the mean age for each node and that the 95%
confidence intervals largely overlap with the Pleistocene(see Table 1), and thus should be treated with caution.However, these estimates are in line with numerousother studies that have identified pre-Pleistocene diversi-fication in African TRFs, such as in Afromomum [55],an estimated 60% of Begonia species [56] as well as inseveral animal clades such as African birds [57] andAfrican clawed frogs species [58]. This was alsorecorded for the genus Coccinia [49], although thisgenus is not restricted to TRF. The Late Pliocene corre-sponds to a period of renewed rain forest re-expansionwhich was preceded by a fairly long period of aridifica-tion and savanna expansion during the Late Miocene[52]. In contrast, a recent temporal analysis of the her-baceous and mainly montane genus Impatiens suggestedan important role of Pleistocene refuges on the diversifi-cation of the genus [59]. Most of the studies that havedetected (some) Pleistocene diversification focused onherbaceous plant clades (e.g. Impatiens and Begonia[9,56,59]) which are known to have faster rates of mole-cular evolution when compared to woody taxa (e.g.trees) [60] and or dispersal abilities. Intraspecific ana-lyses of genetic diversity (phylogeography) of widespreadAfrican tree (woody) species (including an AfricanAnnonaceae species Greenwayodendron suaveolens [61])suggest that Pleistocene refuges did have some effectbut mainly at the infra specific genetic structure levelonly [61,62]. The small role of the Pleistocene in gener-ating species was also suggested to be the case in Afro-momum [55]. Even though Afromomum species areherbs, individuals can live up to 10 years which couldimply lower molecular evolution [55] when compared toother herbaceous taxa. The climatic variations of thepast 2.5 Ma might have been too quick to allow allopa-tric speciation with little ecological divergence to oper-ate, especially on organisms with lower rates ofmolecular evolution such as trees, something that issupported by our data as well as in other studies [49].Thus, the late Miocene and Pliocene epochs appear tohave played a significant role in diversification of Afri-can TRF trees possibly related to the longer phases ofunfavorable climatic conditions and isolation of popula-tions allowing proper genetic isolation between them.
ConclusionAlthough it is generally argued that ecology is nevertruly absent from speciation [63], it is important tounderstand to what extent it can influence species pro-duction over time. Our results imply that adaptation toclimatic differences between sister species have not beena major driver of speciation in trees of African TRFs,which is consistent with the geographical speciationmodel of TRF diversification. Such a result would seemto contrast with other patterns detected in non-TRF
Couvreur et al. BMC Evolutionary Biology 2011, 11:296http://www.biomedcentral.com/1471-2148/11/296
Page 13 of 19
plants. In the absence of other evidence, speciation inthe studied genera could possibly be the result of intri-cate pollination mechanisms. Indeed, both genera pre-sent strikingly different flower morphologies (Figure 1),and intra generic variation is also important [28]. Unfor-tunately, to date, little information is available on Afri-can Annonaceae pollination biology [28,64], somethingthat should be further explored.
MethodsDivergence datesFor this analysis we used the chronogram of Couvreuret al. [29] which included 14 out of 20 species of Isolonaand 13 out of 14 species of Monodora. The analysis wasbased on five chloroplast markers and the tree wasdated under a relaxed clock model with uncorrelatedrates across lineages [see 29 for details]. A secondarycalibration point was used, with the crown node of Iso-lona and Monodora set to 14.9 Ma (95% highest poster-ior density (HPD) 9.4-21). A similar age (14.4 (95%HPD 10.2-18.7) for this node was also found with a lar-ger sampling of Annonaceae genera and with anupdated fossil calibration hypothesis [65].
Locality data and geographical distributionLocality data were compiled from Couvreur [28] andrepresented over 1500 georeferenced herbarium speci-mens (see additional files 14, 15, 16, 17 and 18 for dis-tribution maps of all species included in this study). Alllocalities were imported into ArcGIS v. 9.3 [66] and pro-jected to an Albers projection with a World GeodeticSystem 1984 datum. Uncertain georeferenced specimensas well as specimens from identical localities for eachspecies were deleted from the database prior to analyses,leaving a total of 335 unique occurrence localities forIsolona and 737 for Monodora (Table S1).An estimate of the known geographic range for each
species was produced in ArcGIS v 9.3 using a “buffer”approach. This method creates a buffer radius aroundeach collection point for each species. Overlapping buf-fers for each species pair are then fused and the rangeoverlap is calculated. Several other approaches can beused such as the “quadrat” [e.g. [67]]: the distribution ofspecies are broken down into “pixels” (for example one-degree grid cells) and overlap is calculated based onhow many pixels each species have in common; or via a“minimum convex polygon” [68]: the distribution of thespecies is represented by a polygon which contains alldata points with no angle larger than 180 degrees. How-ever, both these approaches will be biased in a certainway: in the former case two data points of two differentspecies could be very close together but be consideredas not overlapping as the points are in two opposingcorners of different pixels; in the later it has been
shown to overestimate distribution ranges as large areasare included even though there are no collections [68].The buffer approach is suitable because the method isbased on the data point itself, however, the size of thebuffer can produce a bias. Different buffer sizes werehere investigated (2, 10 and 20 km), and we chose theresults of the 20 km buffer size as it best captures thepatchy nature of these species’ distributions at the spa-tial scale used in this study. All buffers were thenmerged and the area within buffers was calculated foreach individual species. Basic overlay functions wereused to estimate the percentage of known geographicrange overlap for each sister species pair, where theamount of buffered area overlapping between two spe-cies was divided by the total buffered area for the spe-cies with the smaller range following [25].Using the 19 bioclim variables (Table 4) from http://
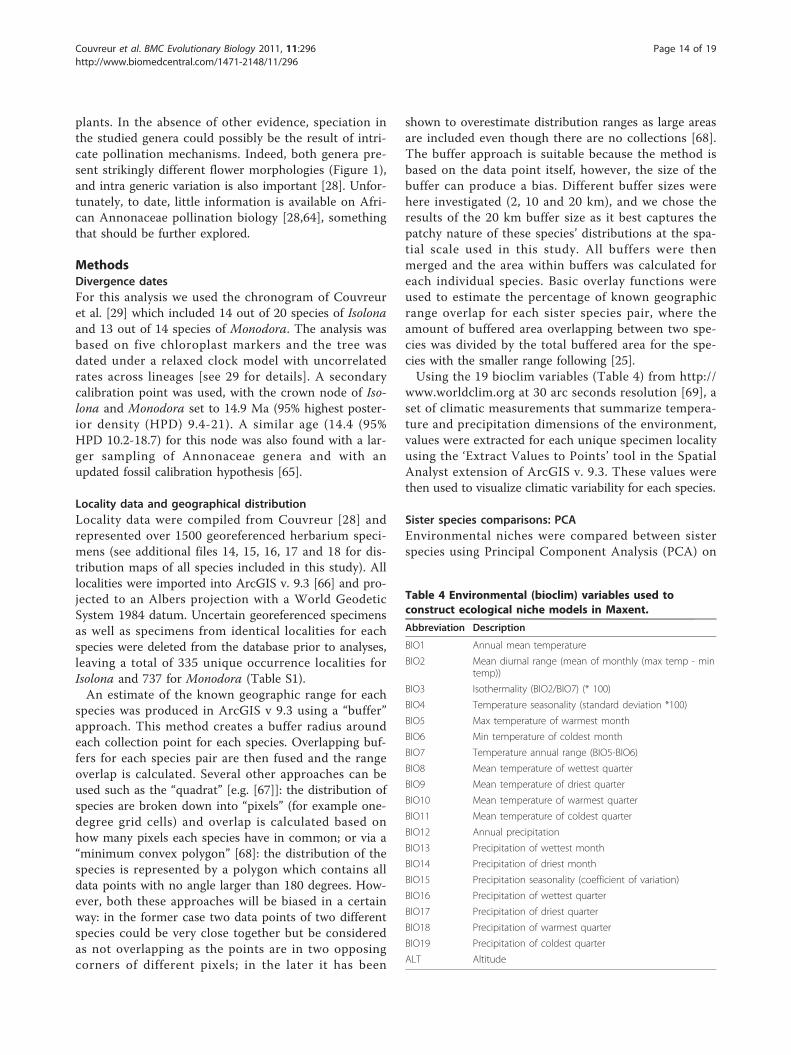
www.worldclim.org at 30 arc seconds resolution [69], aset of climatic measurements that summarize tempera-ture and precipitation dimensions of the environment,values were extracted for each unique specimen localityusing the ‘Extract Values to Points’ tool in the SpatialAnalyst extension of ArcGIS v. 9.3. These values werethen used to visualize climatic variability for each species.
Sister species comparisons: PCAEnvironmental niches were compared between sisterspecies using Principal Component Analysis (PCA) on
Table 4 Environmental (bioclim) variables used toconstruct ecological niche models in Maxent.
Abbreviation Description
BIO1 Annual mean temperature
BIO2 Mean diurnal range (mean of monthly (max temp - mintemp))
BIO3 Isothermality (BIO2/BIO7) (* 100)
BIO4 Temperature seasonality (standard deviation *100)
BIO5 Max temperature of warmest month
BIO6 Min temperature of coldest month
BIO7 Temperature annual range (BIO5-BIO6)
BIO8 Mean temperature of wettest quarter
BIO9 Mean temperature of driest quarter
BIO10 Mean temperature of warmest quarter
BIO11 Mean temperature of coldest quarter
BIO12 Annual precipitation
BIO13 Precipitation of wettest month
BIO14 Precipitation of driest month
BIO15 Precipitation seasonality (coefficient of variation)
BIO16 Precipitation of wettest quarter
BIO17 Precipitation of driest quarter
BIO18 Precipitation of warmest quarter
BIO19 Precipitation of coldest quarter
ALT Altitude
Couvreur et al. BMC Evolutionary Biology 2011, 11:296http://www.biomedcentral.com/1471-2148/11/296
Page 14 of 19
all 19 bioclim variables. Statistical tests between groupshave generally relied on AMOVA or MANOVA meth-ods either between the principal components of thePCA [27,48] or on the climatic variables directly [25].However, these tests can only be undertaken if theunderlining assumptions of ANOVA are met: normaldistribution of the data and homogeneity of the var-iance. In our case, both the bioclim variables and thePCA components violated those assumptions (One-Sam-ple Kolmogorov-Smirnov test rejected the normality ofthe data in all cases and Levene’s test rejected the equal-ity of error variances in all cases (data not shown)).Thus, statistical differences between sister species wereassessed using the non parametric Mann-Whitney Utest by comparing the principal components (PC1, PC2,PC3) [27,48].
Niche modelingEcological niche modeling was used in order to sum-marize the climatic tolerances of the sampled species,except for M. hastipetala (see below). Ecological nichemodels were generated using the maximum entropymethod, Maxent version 3.3 [35]. This is a presence-only method demonstrated to perform well when com-pared to similar approaches [37,70,71]. Maxent gener-ates a continuous probability distribution of habitatsuitability for each input species. The software finds thedistribution that is closest to uniform, or of maximumentropy, within the study area, and it does so subject tothe constraints imposed by variations in the environ-mental variables at the species’ occurrence localities[35].The study area used for niche analyses included Africa
and Madagascar and was confined to the known north-ern and southern extent of Isolona and Monodora(below 12°51’N and above 28°7’S); latitudinal boundarieswhich roughly coincide with limits of the suitable landcover types for these species. The 19 bioclim layers andan elevation layer (Table 3), downloaded from theWorldclim data set, were used as environmental vari-ables in the models [69]. For each species, a total of 100replicates were run with random seed, which creates adifferent random data partition (25% test, 75% training)for each run. To choose presence data for each replicate,bootstrapping allowing sampling with replacement wasused. For further analyses, the averaged Maxent outputfrom these 100 models was used. All models were rununder auto-features in logistic format [35], using a max-imum of 500 interactions and regularization multiplierof 1.0. The importance of individual environmental vari-ables in explaining the distribution of each species mod-eled was determined by running jackknife tests withinthe Maxent interface [35]. The area under the curve(AUC) of the receiver operating characteristic (ROC)
plot was employed to evaluate model performance [72].AUC is a threshold-independent measure that quantifiesthe ability of a model to distinguish presence data frombackground data as compared to a random prediction.AUC values range from 0 to 1, with 0.5 denoting amodel that is performing no better than random. HigherAUC values indicate better performing models andmodels with an AUC value over 0.7 are considered use-ful [73] but see [74].
Sister species comparisons: niche similarity testsFor all sister species pairs, we compared the Maxentoutputs using the software ENMtools [42] following themethods described in [26,42]. For one species (Mono-dora hasitpetala), niche models we unable to be gener-ated in Maxent due to the low number of uniqueoccurrence localities (4). Therefore, the known geo-graphic range was used for niche similarity tests, ratherthan the Maxent output. The software quantifies nichesimilarity using two metrics: D [75], and I, a measurederived from Hellinger distance. These metrics are cal-culated by comparing the estimated niche suitabilityvalues from individual pixels in Maxent model outputs,where those outputs have first been normalized suchthat all predicted suitability values in the geographicspace sum to 1 [26]. Although both similarity measuresare calculated in a similar manner, they differ in howthe interpretation of the niche suitability values. Theresults for both measures range from 0 (no niche over-lap) to 1 (identical niches). In ENMtools, niche overlapwas calculated for each of the sister species pairs. Addi-tionally, two randomization tests were run in ENMtoolsto evaluate niche similarity and conservatism betweensister species only: niche identity and background simi-larity tests [26].The niche identity test compares niche models gener-
ated with actual occurrence localities to pseudoreplicatemodels generated with points randomly selected from apool of actual occurrence localities to determine if spe-cies pairs have equivalent niches. For the identity tests,100 pseudoreplicates were created from the pooledlocalities for each pair of sister species and D and Ivalues were calculated for each of the pseudoreplicatemodels. The distribution of these similarity values wasthen compared to the D and I values calculated fromthe actual niche models for that species pair in theniche overlap test. This method tests the null hypothesisthat the two species have equivalent ecological nichesand is expected to be met only if both species tolerateexactly the same environmental conditions and have anequivalent set of environmental condition available tothem [26].The background similarity test compares differences in
the environmental background of species pairs (as
Couvreur et al. BMC Evolutionary Biology 2011, 11:296http://www.biomedcentral.com/1471-2148/11/296
Page 15 of 19
opposed to the actual occurrence localities) to deter-mine if the two species are more or less similar thanexpected by chance. For each species pair, the nichemodel for the focal species is compared to a series ofpseudoreplicate models generated by randomly samplingthe ‘background’ (geographic range) of its sister species[26]. In the context of the similarity test, the knowngeographic range previously calculated for each of thestudy species was defined as its background, and 100pseudoreplicates were created for each species pairtested. D and I values were calculated for each pseudor-eplicate model and the distribution of these values wascompared to the niche overlap values calculated for theactual data. This method tests the null hypothesis thatcalculated niche overlap between two species isexplained by differences in their environmental back-ground. The null hypothesis is rejected if the calculatedniche overlap falls outside the 95% confidence intervalfor the distribution of pseudoreplicate model values.
Phylogenetic signal of bioclim variablesThe phylogenetic signal (we prefer the term “phyloge-netic signal” over “phylogenetic conservatism” as sug-gested by [20]) for each bioclim variable was tested onboth genera independently using two methods specifi-cally designed for continuous characters: the quantita-tive convergence index (QVI) of Ackerly and Donoghue[39] and the K of Blomberg et al. [40]. The QVI repre-sents the inverse of the retention index for continuouscharacters. When QVI = 0 similar species for a trait aresister taxa, and when QVI = 1 similar species for thattrait are not closely related. The calculation of the QVIwas undertaken on 1000 randomly chosen posteriortrees and with 1000 randomizations of the tree tipsusing the software program CACTUS 1.13 [76]. Thisapproach allows to take phylogenetic uncertainty intoaccount when calculating the QVI.K is used to quantify the “amount of phylogenetic sig-
nal relative to the amount expected for a characterundergoing Brownian motion evolution along the speci-fied topology and branch lengths” [[40], page 730]. Thisstatistic differs from the previous one as it tests thedegree of resemblance of the (continuous) variablesbetween sister species under an explicit null evolution-ary model: the Brownian motion model [40]. The statis-tic varies from 0 to infinity, with K < 1 indicating lowphylogenetic dependence of the variable and K > 1 indi-cating high phylogenetic signal of the variable. When K= 1, the variable exhibits the phylogenetic signalexpected under the Brownian motion model (e.g. thenull model). K was estimated for each of the 19 bioclimvariables using the multiPhylosignal command in thepicante (ver. 1.3) [77] R package and its significance wasassessed by 999 randomizations.
Phylogenetic signal of niche differentiationWe also tested for phylogenetic signal of niche differen-tiation by using an adaptation of the age-range correla-tion method of [47] in which niche similarity indices Iand D are viewed in function of time following [26]. Iand D values were estimated between all species pairsfor each genus. We used the R package phyloclim ver.0.8.1 [78] to generate the correlation graphs. Phyloge-netic signal was tested by Monte Carlo simulations torandomize the I and D indices of each species in orderto estimate of the slope and intercept of the plots underthe null hypothesis of no phylogenetic signal [47] asimplemented in phyloclim. For each genus, a total of1000 simulations were undertaken.
Additional material
Additional file 1: Variation of bioclim variables BC1-6 for Isolona.Indicates the variation of bioclim variables BC1 to 6 for all sampledspecies in Isolona. West/Central African species: 1: Isolona congolana; 2: I.hexaloba; 3: I. pleurocarpa; 4: I. zenkeri; 5: I. campanulata; 6: I. cooperi; 7: I.dewevrei; 8: I. thonneri; 9: I. cauliflora. East African species: 10: I. heinsenii;11: I. linearis. Malagasy species: 12: I. capuroni; 13: I. ghesquierei; 14: I.perrierii.
Additional file 2: Variation of bioclim variables BC7-12 for Isolona.Indicates the variation of bioclim variables BC7 to 12 for all sampledspecies in Isolona. West/Central African species: 1: Isolona congolana; 2: I.hexaloba; 3: I. pleurocarpa; 4: I. zenkeri; 5: I. campanulata; 6: I. cooperi; 7: I.dewevrei; 8: I. thonneri; 9: I. cauliflora. East African species: 10: I. heinsenii;11: I. linearis. Malagasy species: 12: I. capuroni; 13: I. ghesquierei; 14: I.perrierii.
Additional file 3: Variation of bioclim variables BC13-18 for Isolona.Indicates the variation of bioclim variables BC7 to 12 for all sampledspecies in Isolona. West/Central African species: 1: Isolona congolana; 2: I.hexaloba; 3: I. pleurocarpa; 4: I. zenkeri; 5: I. campanulata; 6: I. cooperi; 7: I.dewevrei; 8: I. thonneri; 9: I. cauliflora. East African species: 10: I. heinsenii;11: I. linearis. Malagasy species: 12: I. capuroni; 13: I. ghesquierei; 14: I.perrierii.
Additional file 4: Variation of bioclim variable BC19 for Isolona.Indicates the variation of bioclim variable BC19 for all sampled species inIsolona. West/Central African species: 1: Isolona congolana; 2: I. hexaloba;3: I. pleurocarpa; 4: I. zenkeri; 5: I. campanulata; 6: I. cooperi; 7: I. dewevrei;8: I. thonneri; 9: I. cauliflora. East African species: 10: I. heinsenii; 11: I.linearis. Malagasy species: 12: I. capuroni; 13: I. ghesquierei; 14: I. perrierii.
Additional file 5: Variation of bioclim variables BC1-6 for Monodora.Indicates the variation of bioclim variables BC1 to 6 for all sampledspecies in Monodora. West/Central African species 1: Monodoraangolensis 2: M. crispata, 3: M. laurentii, 4: M. myristica, 5: M. tenuifolia, 6:M. undulata. East African species: 7: M. carolinae, 8: M. globiflora, 9: M.grandidieri, 10: M. hastipetala, 11: M. junodii, 12: M. minor, 13: M.stenopetala.
Additional file 6: Variation of bioclim variables BC7-12 forMonodora. Indicates the variation of bioclim variables BC7 to 12 for allsampled species in Monodora. West/Central African species 1: Monodoraangolensis 2: M. crispata, 3: M. laurentii, 4: M. myristica, 5: M. tenuifolia, 6:M. undulata. East African species: 7: M. carolinae, 8: M. globiflora, 9: M.grandidieri, 10: M. hastipetala, 11: M. junodii, 12: M. minor, 13: M.stenopetala.
Additional file 7: Variation of bioclim variables BC13-18 forMonodora. Indicates the variation of bioclim variables BC7 to 12 for allsampled species in Monodora. West/Central African species 1: Monodoraangolensis 2: M. crispata, 3: M. laurentii, 4: M. myristica, 5: M. tenuifolia, 6:M. undulata. East African species: 7: M. carolinae, 8: M. globiflora, 9: M.
Couvreur et al. BMC Evolutionary Biology 2011, 11:296http://www.biomedcentral.com/1471-2148/11/296
Page 16 of 19
grandidieri, 10: M. hastipetala, 11: M. junodii, 12: M. minor, 13: M.stenopetala.
Additional file 8: Variation of bioclim variable BC19 for Monodora.Indicates the variation of bioclim variable BC19 for all sampled species inMonodora. West/Central African species 1: Monodora angolensis 2: M.crispata, 3: M. laurentii, 4: M. myristica, 5: M. tenuifolia, 6: M. undulata. EastAfrican species: 7: M. carolinae, 8: M. globiflora, 9: M. grandidieri, 10: M.hastipetala, 11: M. junodii, 12: M. minor, 13: M. stenopetala.
Additional file 9: Species values. Indicates the number of unique datapoints as well as several ENM parameters for each species sampled inthe molecular phylogeny used to generate the ENM. Bold values indicatespecies for which there were fewer than 8 unique data points.
Additional file 10: Potential distribution of Isolona species. Showsthe rest of the models generated for Isolona species.
Additional file 11: Potential distribution of Monodora species. Showsthe rest of the models generated for Monodora species.
Additional file 12: Potential distribution of the two last Monodoraand Isolona species. Shows the rest of the models generated forMonodora and Isolona species.
Additional file 13: Distribution of species in Isolona. Shows thegeographical location of all data points for each species used in thisstudy.
Additional file 14: Distribution of species in Isolona. Shows thegeographical location of all data points for each species used in thisstudy.
Additional file 15: Distribution of species in Isolona (continue fromsup file 1) and Monodora. Shows the geographical location of all datapoints for each species used in this study.
Additional file 16: Distribution of species in Monodora (continuefrom sup file 2). Shows the geographical location of all data points foreach species used in this study.
Additional file 17: Distribution of species in Monodora (continuefrom sup file 3). Shows the geographical location of all data points foreach species used in this study.
Additional file 18: Distribution of species in Monodora (continuefrom sup file 4). Shows the geographical location of all data points foreach species used in this study.
AcknowledgementsThe authors wish to thank Dan Warren and Steven Phillips for advice andhelp concerning methodological issues. We are also grateful to threeanonymous reviewers for their useful comments and corrections. Onereviewer was especially thorough and helped significantly improve thequality of this article.
Author details1Institut de Recherche pour le Développement (IRD), UMR DIA-DE, DYNADIVresearche group, 911, avenue Agropolis, BP 64501, F-34394 Montpelliercedex 5, France. 2The New York Botanical Garden, 200th St. and KazimiroffBlvd, Bronx, NY 10458-5126, USA. 3LaGuardia Community College, CityUniversity of New York, 3110 Thomson Avenue, Long Island City, NY, USA.4Netherlands Centre for Biodiversity Naturalis (section NHN), Wageningenbranch, and Wageningen University, Biosystematics group, GeneraalFoulkesweg 37, 6703 BL Wageningen, The Netherlands. 5WageningenUniversity, Biosystematics group, Droevendaalsesteeg 1, 6708 PBWageningen, The Netherlands.
Authors’ contributionsTLPC conceived and coordinated the study, participated in its design,undertook part of the statistical analyses and drafted the manuscript. HPMparticipated in the design of the study, performed part of the statistical andall GIS analyses and helped draft the manuscript. JJW participatedsignificantly in the production of the data. LWC participated in theconception of the study. All authors read and approved the final manuscript.
Received: 29 April 2011 Accepted: 11 October 2011Published: 11 October 2011
References1. Linder HP: Plant diversity and endemism in sub-Saharan tropical Africa. J
Biogeogr 2001, 28(2):169-182.2. White F: The Guineo-Congolian region and its relationships to other
phytochoria. Bull Jard Bot Nat Belg 1979, 49:11-55.3. Burgess ND, Clarke GP, Rodgers WA: Coastal forests of eastern Africa:
status, endemism patterns and their potential causes. Biol J Linn Soc1998, 64(3):337-367.
4. Burgess ND, Butynski TM, Cordeiro NJ, Doggart NH, Fjeldså J, Howell KM,Kilahama FB, Loader SP, Lovett JC, Mbilinyi B: The biological importance ofthe Eastern Arc Mountains of Tanzania and Kenya. Biol Conserv 2007,134(2):209-231.
5. Myers N, Mittermeier RA, Mittermeier CG, da Fonseca GAB, Kent J:Biodiversity hotspots for conservation priorities. Nature 2000, 403:853-858.
6. Pennington RT, Richardson JE, Lavin M: Insights into the historicalconstruction of species-rich biomes from dated plant phylogenies,neutral ecological theory and phylogenetic community structure. NewPhytol 2006, 172(4):605-616.
7. Smith TB, Schneider CJ, Holder K: Refugial isolation versus ecologicalgradients. Genetica 2001, 112-113(1):383-398.
8. Plana V: Mechanisms and tempo of evolution in the African Guineo-Congolian rainforest. Philos Trans R Soc Lond, B 2004, 359(1450):1585-1594.
9. Sosef MSM: Refuge Begonias–Taxonomy, phylogeny and historicalbiogeography of Begonia sect. Loasibegonia and sect. Scutobegonia inrelation to glacial rain forest refuges in Africa. Studies in Begonia V 1994,94:1-306.
10. Nicolas V, Missoup AD, Denys C, Kerbis Peterhans J, Katuala P, Couloux A,Colyn M: The roles of rivers and Pleistocene refugia in shaping geneticdiversity in Praomys misonnei in tropical Africa. J Biogeogr 2011,38(1):191-207.
11. Prance GT: Forest refuges: Evidence from woody angiosperms. InBiological diversification in the Tropics. Edited by: Prance GT. New-York, USA:Columbia University Press; 1982:137-158.
12. Fjeldså J, Lovett JC: Geographical patterns of old and young species inAfrican forest biota: the significance of specific montane areas asevolutionary centers. Biodivers Conserv 1997, 6:325 346.
13. Roy MS: Recent diversification in African greenbuls (Pycnonotidae:Andropadus) supports a montane speciation model. Proc R Soc Lond B1997, 264:1337-1344.
14. Schneider CJ, Smith TB, Larison B, Moritz C: A test of alternative models ofdiversification in tropical rainforests: Ecological gradients vs. rainforestrefugia. Proc Natl Acad Sci USA 1999, 96(24):13869-13873.
15. Givnish TJ: Ecology of plant speciation. Taxon 2010, 59:1326-1366.16. Orr MR, Smith TB: Ecology and speciation. Trends Ecol Evol 1998,
13(12):502-506.17. Wiens JJ: Speciation and ecology revisited: Phylogenetic niche
conservatism and the origin of species. Evolution 2004, 58(1):193-197.18. Wiens JJ, Graham CH: Niche conservatism: Integrating evolution, ecology,
and conservation biology. Ann Rev Ecol Evol Sys 2005, 36:519-539.19. Wiens JJ, Ackerly DD, Allen AP, Anacker BL, Buckley LB, Cornell HV,
Damschen EI, Jonathan Davies T, Grytnes J-A, Harrison SP: Nicheconservatism as an emerging principle in ecology and conservationbiology. Ecol Lett 2010, 13(10):1310-1324.
20. Pearman PB, Guisan A, Broennimann O, Randin CF: Niche dynamics inspace and time. Trends Ecol Evol 2008, 23(3):149-158.
21. Davis CC, Bell CD, Fritsch PW, Mathews S: Phylogeny of Acridocarpus-Brachylophon (Malpighiaceae): implications for tertiary tropical floras andAfroasian biogeography. Evolution 2002, 56(11):2395-2405.
22. Elith J, Leathwick JR: Species distribution models: ecological explanationand prediction across space and time. Ann Rev Ecol Evol Sys 2009,40(1):677-697.
23. Yesson C, Culham A: Phyloclimatic modeling: Combining phylogeneticsand bioclimatic modeling. Syst Biol 2006, 55(5):785-802.
24. Yesson C, Culham A: A phyloclimatic study of Cyclamen. BMC Evol Biol2006, 6:72.
25. Nakazato T, Warren DL, Moyle LC: Ecological and geographic modes ofspecies divergence in wild tomatoes. Am J Bot 2010, 97(4):680-693.
Couvreur et al. BMC Evolutionary Biology 2011, 11:296http://www.biomedcentral.com/1471-2148/11/296
Page 17 of 19

26. Warren DL, Glor RE, Turelli M: Environmental niche equivalency versusconservatism: quantitative approches to niche evolution. Evolution 2008,62(11):2868-2883.
27. Graham CH, Ron SR, Santos JC, Schneider CJ, Moritz C: Integratingphylogenetics and environmental niche models to explore speciationmechanisms in dendrobatid frogs. Evolution 2004, 58(8):1781-1793.
28. Couvreur TLP: Monograph of the syncarpous African genera Isolona andMonodora (Annonaceae). Syst Bot Monogr 2009, 87:1-150.
29. Couvreur TLP, Chatrou LW, Sosef MSM, Richardson JE: Molecularphylogenetics reveal multiple tertiary vicariance origins of the Africanrain forest trees. BMC Biology 2008, 6:54.
30. Couvreur TLP, Richardson JE, Sosef MSM, Erkens RHJ, Chatrou LW: Evolutionof syncarpy and other morphological characters in African Annonaceae:a posterior mapping approach. Mol Phylogenet Evol 2008, 47(1):302-318.
31. Chatrou LW, Wieringa JJ, Couvreur TLP: The impact of climate change onthe origin and future of East African rain forest trees. In Climate changeand systematics. Edited by: Hodkinson T, Jones M, Parnell J, Sheoin SN,Waldren S. Dublin: Cambridge University Press; 2011:304-319.
32. Hutchinson GE: Concluding remarks. Cold Spring Harbor Symp Quant Biol1957, 22:415-427.
33. Pearson RG, Dawson TP: Predicting the impacts of climate change on thedistribution of species: are bioclimate envelope models useful? Glob EcolBiogeogr 2003, 12(5):361-371.
34. Couvreur TLP, Botermans M, van Heuven BJ, Van der Ham RWJM: Pollenmorphology within the Monodora clade, a diverse group of five AfricanAnnonaceae genera. Grana 2008, 47(3):185-210.
35. Phillips SJ, Anderson RP, Schapire RE: Maximum entropy modeling ofspecies geographic distributions. Ecol Model 2006, 190(3-4):231-259.
36. Mateo RG, Croat TB, Felicisimo AM, Munoz J: Profile or groupdiscriminative techniques? Generating reliable species distributionmodels using pseudo-absences and target-group absences from naturalhistory collections. Divers Distrib 2010, 16(1):84-94.
37. Hernandez PA, Graham CH, Master LL, Albert DL: The effect of sample sizeand species characteristics on performance of different speciesdistribution modeling methods. Ecography 2006, 29(5):773-785.
38. Wisz MS, Hijmans RJ, Li J, Peterson AT, Graham CH, Guisan A, Distribut NPS:Effects of sample size on the performance of species distributionmodels. Divers Distrib 2008, 14(5):763-773.
39. Ackerly DD, Donoghue MJ: Leaf size, sapling allometry, and Corner’srules: Phylogeny and correlated evolution in maples (Acer). Am Nat 1998,152(6):767-791.
40. Blomberg SP, Garland T, Ives AR: Testing for phylogenetic signal incomparative data: Behavioral traits are more labile. Evolution 2003,57(4):717-745.
41. Couvreur TLP, Gereau RE, Wieringa JJ, Richardson JE: Description of fournew species of Monodora and Isolona (Annonaceae) from Tanzania andan overview of Tanzanian Annonaceae diversity. Adansonia (Paris) 2006,28(2):243-266.
42. Warren DL, Glor RE, Turelli M: ENMTools: a toolbox for comparativestudies of environmental niche models. Ecography 2010, 33(3):607-611.
43. Jakob SS, Heibl C, RÖDder D, Blattner FR: Population demographyinfluences climatic niche evolution: evidence from diploid AmericanHordeum species (Poaceae). Mol Ecol 2010, 19(7):1423-1438.
44. Revell LJ, Harmon LJ, Collar DC: Phylogenetic signal, evolutionary process,and rate. Syst Biol 2008, 57(4):591-601.
45. Losos JB: Phylogenetic niche conservatism, phylogenetic signal and therelationship between phylogenetic relatedness and ecological similarityamong species. Ecol Lett 2008, 11(10):995-1003.
46. Butler Marguerite A, King Aaron A: Phylogenetic comparative analysis: Amodeling approach for adaptive evolution. The American Naturalist 2004,164(6):683-695.
47. Fitzpatrick BM, Turelli M: The geography of mammalian speciation: Mixedsignals from phylogenies and range maps. Evolution 2006, 60(3):601-615.
48. Smith SA, Donoghue MJ: Combining historical biogeography with nichemodeling in the Caprifolium clade of Lonicera (Caprifoliaceae,Dipsacales). Syst Biol 2010, 59(3):322-341.
49. Holstein N, Renner S: A dated phylogeny and collection records revealrepeated biome shifts in the African genus Coccinia (Cucurbitaceae).BMC Evol Biol 2011, 11(1):28.
50. Punyasena SW, Eshel G, McElwain JC: The influence of climate on thespatial patterning of Neotropical plant families. J Biogeogr 2008,35(1):117-130.
51. Heikkinen RK, Luoto M, Araujo MB, Virkkala R, Thuiller W, Sykes MT:Methods and uncertainties in bioclimatic envelope modelling underclimate change. Prog Phys Geog 2006, 30(6):751-777.
52. Morley RJ: Origin and evolution of tropical rain forests. New York: JohnWiley & Sons; 2000.
53. Bonnefille R: Rainforest responses to past climatic changes in tropicalAfrica. In Tropical rainforest responses to climatic changes. Edited by: BushMB, Flenley J. Chichester: Praxis Publishing; 2007:117-170.
54. Maley J: The African Rain forest main characteristics of changes invegetation and climate from the upper Cretaceous to the Quaternary. InEssays on the ecology of the Guinea - Congo rain forest, Royal society ofEdinburgh Proceedings Edited by: Alexander I, Swaine MD, Watling R 1996,31-37, vol. B 104. Edinburgh.
55. Auvrey G, Harris DJ, Richardson JE, Newman MF, Sarkinen TE: Phylogeneyand dating of Afromomum (Zingiberarceae). In Diversity, phylogeny, andevolution in the Monocotyledons. Edited by: Seberg O, Peterson G, Barfod A,Davis JI. Aarhus: Aarhus University Press; 2010:287-305.
56. Plana V, Gascoigne A, Forrest LL, Harris D, Pennington RT: Pleistocene andpre-Pleistocene Begonia speciation in Africa. Mol Phylogenet Evol 2004,31(2):449-461.
57. Voelker G, Outlaw RK, Bowie RCK: Pliocene forest dynamics as a primarydriver of African bird speciation. Glob Ecol Biogeogr 2010, 19(1):111-121.
58. Evans BJ, Kelley DB, Tinsley RC, Melnick DJ, Cannatella DC: A mitochondrialDNA phylogeny of African clawed frogs: phylogeography andimplications for polyploid evolution. Mol Phylogenet Evol 2004,33(1):197-213.
59. Janssens SB, Knox EB, Huysmans S, Smets EF, Merckx V: Rapid radiation ofImpatiens (Balsaminaceae) during Pliocene and Pleistocene: Result of aglobal climate change. Mol Phylogenet Evol 2009, 52(3):806-824.
60. Smith SA, Donoghue MJ: Rates of molecular evolution are linked to lifehistory in flowering plants. Science 2008, 322(5898):86-89.
61. Dauby G, Duminil J, Heuertz M, Hardy O: Chloroplast DNA polymorphismand phylogeography of a Central African tree species widespread inmature rainforests: Greenwayodendron suaveolens (Annonaceae). TropicalPlant Biology 2010, 3(1):4-13.
62. Dainou K, Bizoux J-P, Doucet J-L, Mahy G, Hardy OJ, Heuertz M: Forestrefugia revisited: nSSRs and cpDNA sequences support historicalisolation in a wide-spread African tree with high colonization capacity,Milicia excelsa (Moraceae). Mol Ecol 2010, 19(20):4462-4477.
63. Sobel JM, Chen GF, Watt LR, Schemske DW: The biology of speciation.Evolution 2010, 64(2):295-315.
64. Gottsberger G, Meinke S, Porembski S: First records of flower biology andpollination in African Annonaceae: Isolona, Piptostigma, Uvariodendron,Monodora and Uvariopsis. Flora 2011, 206(5):498-510.
65. Couvreur TLP, Pirie MD, Chatrou LW, Saunders RMK, Su YCF, Richardson JE,Erkens RHJ: Early evolutionary history of the flowering plant familyAnnonaceae: steady diversification and boreotropical geodispersal. JBiogeogr 2011, 38(4):664-680.
66. ESRI: ArcGIS Version 9.3. Environmental Systems Research Institute (ESRI).Redlands, CA, USA; 2009.
67. Perret M, Chautems A, Spichiger R, Barraclough TG, Savolainen V: Thegeographical pattern of speciation and floral diversification in theNeotropics: the tribe Sinningieae (Gesneriaceae) as a case study.Evolution 2007, 61(7):1641-1660.
68. Burgman MA, Fox JC: Bias in species range estimates from minimumconvex polygons: implications for conservation and options forimproved planning. Anim Conserv 2003, 6:19-28.
69. Hijmans RJ, Cameron SE, Parra JL, Jones PG, Jarvis A: Very high resolutioninterpolated climate surfaces for global land areas. International Journalof Climatology 2005, 25:1965-1978.
70. Elith J, Graham CH, P. Anderson R, Dudík M, Ferrier S, Guisan A, J.Hijmans R, Huettmann F, R. Leathwick J, Lehmann A: Novel methodsimprove prediction of species’ distributions from occurrence data.Ecography 2006, 29(2):129-151.
71. Pearson RG, Raxworthy CJ, Nakamura M, Townsend Peterson A: Predictingspecies distributions from small numbers of occurrence records: a testcase using cryptic geckos in Madagascar. J Biogeogr 2007, 34(1):102-117.
Couvreur et al. BMC Evolutionary Biology 2011, 11:296http://www.biomedcentral.com/1471-2148/11/296
Page 18 of 19

72. Fielging AH, Bell JF: A review of methods for the assessment ofprediction errors in conservation presence/absence models. EnvironConserv 1997, 24(01):38-49.
73. Swets J: Measuring the accuracy of diagnostic systems. Science 1988,240(4857):1285-1293.
74. Lobo JM, Jiménez-Valverde A, Real R: AUC: a misleading measure of theperformance of predictive distribution models. Glob Ecol Biogeogr 2008,17(2):145-151.
75. Schoener TW: The Anolis Lizards of Bimini: Resource Partitioning in aComplex Fauna. Ecology 1968, 49(4):704-726.
76. Schwilk DW, Ackerly DD: Flammability and serotiny as strategies:correlated evolution in pines. Oikos 2001, 94:326-336.
77. Kembel SW, Cowan PD, Helmus MR, Cornwell WK, Morlon H, Ackerly DD,Blomberg SP, Webb CO: Picante: R tools for integrating phylogenies andecology. Bioinformatics 2010, 26(11):1463-1464.
78. Heibl C: phyloclim: Integrating phylogenetics and climatic niche modelling;2011 [http://cran.r-project.org/web/packages/phyloclim/index.html].
doi:10.1186/1471-2148-11-296Cite this article as: Couvreur et al.: Little ecological divergenceassociated with speciation in two African rain forest tree genera. BMCEvolutionary Biology 2011 11:296.
Submit your next manuscript to BioMed Centraland take full advantage of:
• Convenient online submission
• Thorough peer review
• No space constraints or color figure charges
• Immediate publication on acceptance
• Inclusion in PubMed, CAS, Scopus and Google Scholar
• Research which is freely available for redistribution
Submit your manuscript at www.biomedcentral.com/submit
Couvreur et al. BMC Evolutionary Biology 2011, 11:296http://www.biomedcentral.com/1471-2148/11/296
Page 19 of 19