list of contents the year 2002 in review major ... - hkex group
TRANSCRIPT
List of Contents The year 2002 in review Major events of Hong Kong securities market 2002 Market highlights Cash market - Main board Cash market - Growth enterprise market (GEM) Derivatives market Clearing statistics Exchange participants The investing community Hong Kong stock market historical events Appendices
1 HKEx Fact Book 2002
The Year 2002 in Review
The Year 2002 in Review
The Hong Kong economy remained weak in 2002 but trade figures began to turn around in the second half of the year. Benefiting
from the weakening US dollar and strong demand in the Mainland of China, Hong Kong’s total exports regained double-digit
growth over a year earlier in the third quarter of 2002. The seasonally adjusted unemployment rate also fell from its historical peak
of 7.8% in July 2002 to 7.2% in December 2002. However, the domestic sector remained sluggish in both investment and
consumer spending. The latest economic forecast suggests a 2% growth in real terms of GDP and a 3% decline in the Composite
Consumer Price Index for 2002.
The trading performance of the Hong Kong securities and futures markets further weakened during the year. Hang Seng Index fell
18.2% from the previous year to end at 9,321.29. The average daily turnover of the Main Board also declined to HK$6,474 million,
19.3% less than that in 2001. The GEM Index ended at 110.4 at end of December 2002, representing a decrease of 44.6% from
the previous year. The average daily turnover of the GEM improved slightly to HK$178 million in 2002, an increase of 9.9% from
2001. The Hong Kong derivatives market achieved a 3% growth during 2002, with an average turnover of 45,018 contracts per
trading day.
The year 2002 was however a good year for the Hong Kong stock market in new listings. There were 60 and 57 newly listed
companies for the Main Board and GEM markets respectively, with total funds raised amounted to HK$52 billion. With a market
capitalisation of HK$3,611 billion or US$463 billion (Main Board and GEM), Hong Kong was the 10th largest territorial stock market
in the world and the second in Asia.
STOCK MARKET
Market development
HKEx further strengthened the AMS/3 trading system. In March, Stock Exchange Participants were allowed to increase the order
throughput or throttle rate of their Open Gateway to AMS/3 on a user-pay basis. They could also install additional Open Gateways
at their own cost.
On 25 March, HKEx introduced a 30-minute pre-opening session, which starts at 9:30 am every trading day. An index basket order
trading mechanism was provided during the continuous trading session.
The first and second phases of a new generation of the central clearing system, CCASS/3, were successfully rolled out in May and
December 2002 respectively. The enhanced system supports multiple market clearing and different settlement cycles. The last
phase involving the introduction of a Participant Gateway will be launched in the first quarter of 2003.
In July, HKEx consulted the market on the concept of Third Party Clearing. The proposed market model would give an option to
stockbrokers to outsource their stock clearing and settlement operations to a designated General Clearing Participant.
In December 2002, the Steering Committee on the Enhancement of Financial Infrastructure II (SCEFI II) released its report, outlining
recommendations for the improvement of Hong Kong’s financial infrastructure. A high-level forum was established with
participation of the Government, the SFC, the Hong Kong Monetary Authority and HKEx to coordinate the implementation of these
recommendations.
2 HKEx Fact Book 2002
The Year 2002 in Review
Main Board – Equities
Sixty companies were newly listed on the Main Board during 2002, the highest since 1997. Among them, 4 were China-
incorporated enterprises. In aggregate, they raised HK$45 billion of capital. At the end of 2002, there were 812 companies listed on
the Main Board, including 54 China-incorporated companies and 10 foreign companies. The Main Board companies had a total
market capitalisation of HK$3,559 billion.
To provide a simpler administrative framework with effective checks and balances, HKEx proposed new structures for disciplinary
and non-disciplinary listing matters during 2002. New rules were also proposed to strengthen corporate governance in the area of
shareholders’ rights, practices of listed company directors, corporate reporting and information disclosure. HKEx also introduced
rules changes during the year to allow distribution of corporate communications to shareholders via electronic means and the
listing of a wider range of structured products including equity linked instruments.
A consultation exercise on listing eligibility and cancellation during the year led to market turbulence and subsequent controversy
over the roles and responsibilities of market institutions and the Government. An independent panel of inquiry, after a review of the
incident, recommended a review of the operations of the three-tier market structure and improvements on market consultation and
investor education.
The Hong Kong stock market had another year of decline in 2002. The market moved downward for most of the time during the
year, except for a short rise during April/May. The disappointing market performance was the result of a sluggish local economy
and a weak global investment market troubled by anti-terrorism acts and corporate scandals in the US. The weakening US dollar
and the increasing likelihood of a Gulf war also damaged investor confidence.
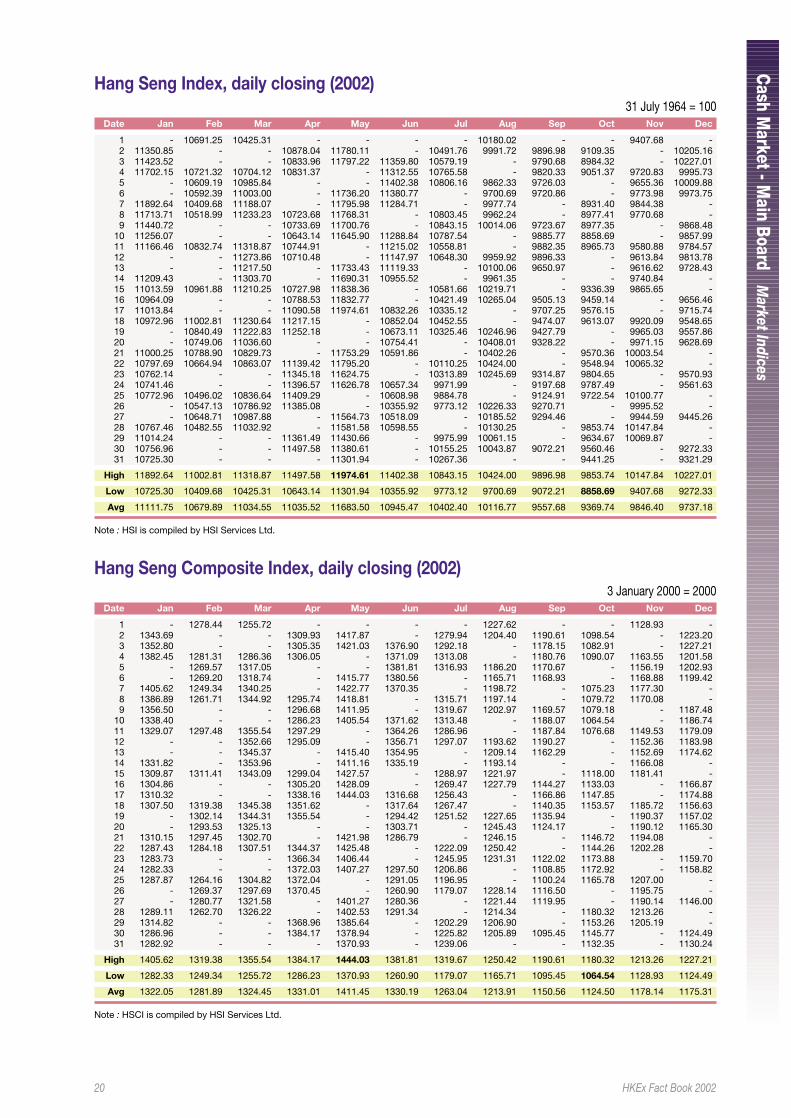
The Hang Seng Index and All Ordinaries Index closed at 9,321.29 and 4,113.06, representing a decrease of 18.2% and 15.8% from
the end of 2001. It was the third consecutive year of decline, also the longest downside period since 1960. The Hang Seng China-
Affiliated Corporations Index, which tracks red-chip performance, fell 24.6% during the year. However, the H-share index (Hang
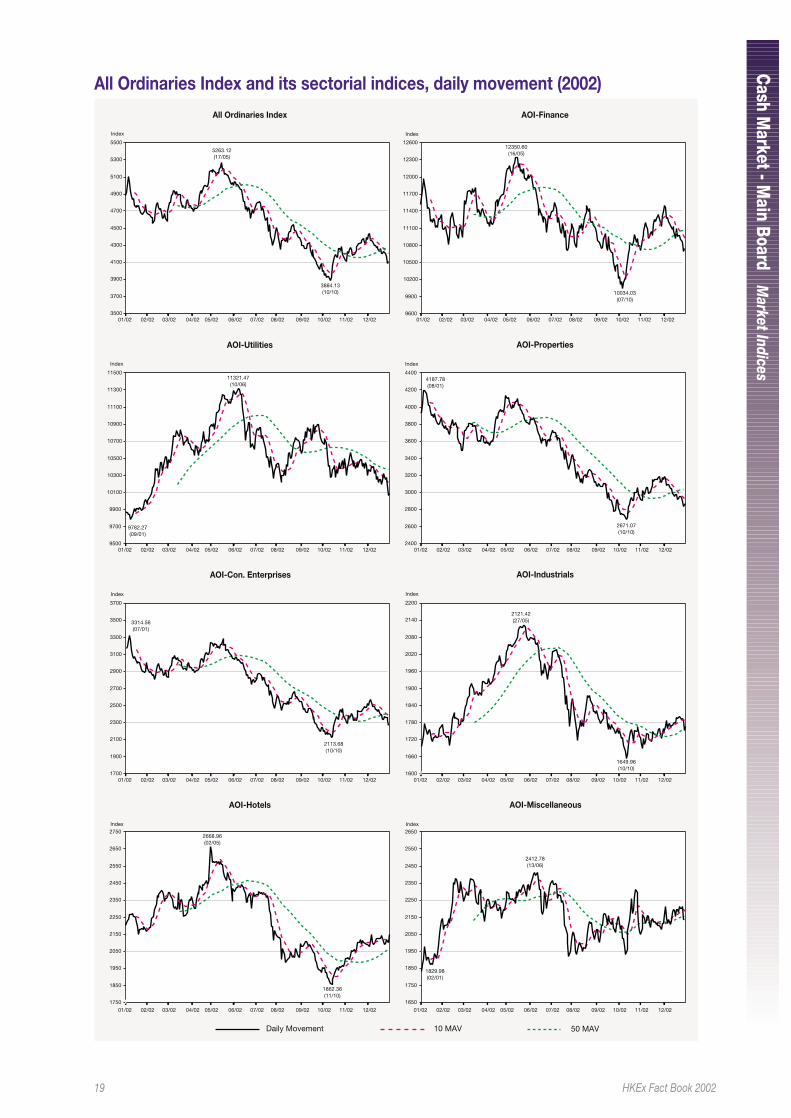
Seng China Enterprises Index) recorded an increase of 13.2% in 2002. Only three sectors of All Ordinaries Index recorded rises in
2002, namely Miscellaneous (+18.6%), Industrials (+4.89%) and Utilities (+1.83%). The biggest decliner was Consolidated
Enterprises (-28.42%), followed by Properties (-27.1%), Finance (-7%), and Hotels (-4.52%).
A shrinking trading volume accompanied the index decline in 2002, with the average daily turnover dropping to HK$6,474 million, a
decrease of 19.3% from 2001.
Main Board – Warrants
The warrant market sharply expanded in 2002, due to the introduction of liquidity providers in January and the reduction of
derivative warrant listing fees in April. There were 27 equity warrants and 644 derivative warrants newly listed during the period.
The total number of warrants at the end of the year reached 414 (67 equity warrants and 347 derivative warrants), representing an
increase of 331% from 96 in 2001 but still below the peak of 533 in 1997. The turnover of warrants for 2002 was HK$114.5 billion,
an increase of 6% from HK$108.2 billion in 2001.
Main Board – Debt Securities
The debt securities market further contracted during 2002. Despite the 18 new listings, the number of debt securities listed on the
exchange decreased from 2001’s 195 to 165 at the end of 2002. Trading remained minimal with a year total of HK$25.5 million.
3 HKEx Fact Book 2002
The Year 2002 in Review
Main Board – Unit Trusts and Mutual Funds
At the end of 2002, there were 9 unit trusts/mutual funds listed on the exchange compared to 22 in 2001. The turnover of unit
trusts (almost entirely the Tracker Fund) amounted to HK$12.8 billion in 2002 compared to HK$20.7 billion in 2001 and HK$20
billion in 2000.
Growth Enterprises Market (GEM)
Fifty-seven companies were newly listed on the GEM in 2002, of which 12 were China-incorporated enterprises, bringing the total
number of listed companies to 166. The newly listed companies raised total capital of HK$7 billion. Average daily turnover of the
GEM for 2002 was HK$178 million, compared to HK$162 million for the previous year. As at end of 2002, the total market
capitalisation of the GEM was HK$52.2 billion, a decrease of 14.3% of the 2001 figure. Other than the 166 ordinary shares, there
were four warrants listed on GEM at the end of 2002. The Growth Enterprise Index fell 44.6% in 2002 and closed the year at 110.4.
Equity Linked Instruments (ELI)
In 2002, HKEx amended its Listing Rules to facilitate the listing of more structured products, including equity linked instruments
(ELI). ELI combine the features of a fixed income instrument and a stock option. Its performance is linked to the market
performance of an underlying equity security. As at the end of 2002, there were 11 ELI listed on the exchange. The total turnover
value of ELI for 2002 was HK$334 million.
Trading-only market
As at the end of 2002, there were two iShares and 7 Nasdaq stocks traded on the Trading-only Market. The turnover of iShares
and the 7 Nasdaq stocks in 2002 were HK$80.3 million and HK$40.9 million respectively, compared to HK$102.7 million and
HK$118 million in 2001.
DERIVATIVES MARKET
Market development
HKEx introduced two key derivatives products in 2002 - Dow Jones Industrial Average (DJIA) Futures (6 May) and Mini-Hang Seng
Index (Mini-HSI) Options (18 November). The DJIA is a widely recognised benchmark for the performance of the US stock market.
The introduction of DJIA Futures in Hong Kong enabled investors to respond quickly to corporate announcements and other
market events before and after the regular US trading hours. It also further expanded the range of international benchmark
products offered by HKEx. Up to the end of 2002, this product recorded a total turnover of 6,773 contracts. The Mini-HSI Options
was introduced to complement the successful mini-HSI Futures contract, enabling more retail investors to participate in the stock
index options market. Its contract multiplier was HK$10 per index point, only one-fifth of that for Hang Seng Index Options. The
mini contract and the HSI Options are fungible, thus allowing market participants to offset positions at the ratio of five to one for
the corresponding series. In 2002, the total turnover of the Mini HSI Options was 6,176 contracts.
The SFC levy and compensation levy for options on stock futures contracts were reduced in March 2002, so as to bring the levies
in line with those payable on stock futures contracts. During the year, the Rolling Forex contracts for Euro, Yen, British Pound and
Deutschemark were delisted following a review of product portfolio. HKEx also increased the size of the HIBOR (Hong Kong
Interbank Offered Rate) Futures Contracts to five times their original size and increased the Exchange and settlement fees for that
contract to 2.5 times their original level, resulting in an effective fee reduction of 50%.
4 HKEx Fact Book 2002
The Year 2002 in Review
Since the migration to the electronic trading platform in 2000, HKEx has been seeking the expansion of direct access from
investors outside Hong Kong via the Remote Trading Access (RTA) Programme. This Programme allows Futures Exchange
Participants who are also participants of HKFE Clearing Corporation Ltd to offer their qualified clients direct access to the HKEx
derivatives market. In 2002, Hong Kong Futures Exchange (HKFE) was granted exempt futures market status in Australia. As a
result, the RTA Programme can be made available in Australia, in addition to the United Kingdom and the US.
Given the good response to the 6-month pilot programme, HKEx made the Block Trading Facility (BTF) for derivatives a standing
facility on 29 May 2002. Block trades comprise large buy and sell orders privately negotiated apart from the public auction market.
To add to market transparency and facilitate investors in their analysis and decision making, HKEx introduced a service that offers
price depth information on its derivatives market. The information, previously only available to traders through HKATS, is now
accessible by all investors through information vendors. The price depth information comprises aggregated best five bid and ask
prices with full volume for every instrument traded on the HKEx derivatives market.
Trading activities
The Hong Kong derivatives market recorded a total turnover of 11,029,404 contracts in 2002, representing an increase of 4.5%
from 2001. The average daily volume for 2002 was 45,018 contracts. Turnover volumes of Hang Seng Index Futures and Hang
Seng Index Options in 2002 were 4,802,422 contracts and 1,070,431 contracts, recording a growth of 9.1% and 49.5%
respectively from 2001. Mini-HSI Futures recorded a year total of 1,107,964 contracts, an increase of 43.9% from 2001. Turnover
volume of stock futures for 2002 also increased 202% to 21,006 contracts. The Three-month HIBOR Futures and the One-month
HIBOR Futures have a respective year total of 280,257 contracts and 970 contracts.
The total number of stock options classes traded in Hong Kong increased to 33 as at the end of 2002. Turnover volume of stock
options further decreased during the year, with an average daily turnover of 15,203 contracts, a decline of 8.2% from the 2001
figure (16,567 contracts). The total premium for 2002 was HK$HK$4.6 billion, compared to HK$7.9 billion in 2001 and HK$13.9
billion in 2000. The total open interest at the end of 2002 was 370,891 contracts. Agency trading and principal trading contributed
22% and 11% respectively of the total contract volume in 2002, the balance representing trading by market makers.
5 HKEx Fact Book 2002
Major Events of the H
ong Kong Securities M
arket 2002
MAJOR EVENTS OF THE HONG KONG SECURITIES MARKET 2002
Event Month Event
January On 28 January, the SFC published a set of disclosure provisions for index funds under the Code on
Unit Trusts and Mutual Funds.
February On 1 February, revisions to the Codes on Takeovers and Mergers and Share Repurchases became
effective. The revisions include rationalising the voting requirements for company privatisation
proposals and for delistings, and strengthening the requirements for asset valuations.
On 5 February, the Exchange amended the Main Board and GEM Listing Rules to reduce the volume of
printed documents generated by issuers. The amendments allow using electronic means as a
distribution channel for corporate communications to holders of securities in either English or Chinese,
or both. A Main Board new applicant may, and a GEM new applicant must, provide listing document on
its own website, if any.
On 5 February, the SFC released Guidelines for the Regulation of Automated Trading Services (ATS),
which would take effect upon commencement of the related regulations in the Securities and Futures
Bill.
On 17 February, the Exchange amended the Main Board and GEM Listing Rules to permit issuers, on
certain conditions, to distribute summary financial reports in place of full annual reports to
shareholders. The rule amendments became effective for annual reports in respect of accounting
periods ending on or after 31 October 2001.
On 20 February, the Board of Directors of HKEx announced a deferral of the abolition of minimum
brokerage for one year until 1 April 2003.
On 28 February, FTSE and HSI Services Ltd jointly launched a series of Asian indexes - the FTSE/Hang
Seng Asiatop Index and 11 FTSE/Hang Seng Asian Sector Indexes.
March On 8 March, the SFC levy on trading of options on stock futures was reduced from $1.0 to $0.2 per
contract per side. The compensation fund levy on trading of options on stock futures was reduced
from $0.5 to $0.1 per contract per side.
On 10 March, the Exchange amended the Main Board Listing Rules to change the basis for measuring
the extent to which the derivative warrant issuance quota on a listed company has been used. The
quota is the lower of 20% of a company’s issued shares or 30% of the public float. The new basis will
make reference to the number of shares represented by warrants held by the public.
On 13 March, HKEx announced that HKFE was granted exempt futures market status in Australia,
which enables HKFE’s Remote Trading Access (RTA) programme to be extended to that country. The
RTA programme allows Futures Exchange Participants who are also HKFE Clearing Corporation
Limited Participants to offer their qualified clients direct access to HKATS for trading on HKFE.
On 13 March, the Legislative Council enacted the Securities and Futures Bill.
6 HKEx Fact Book 2002
Major Events of the H
ong Kong Securities M
arket 2002
Starting from 20 March, Stock Exchange Participants (EPs) are allowed to increase the order
throughput or throttle rate of their Open Gateways (OGs) to AMS/3 on a user-pays basis. EPs would
also be able to install additional OGs at their own cost. Previously, EPs were limited to one OG per
trading right, and an OG throttle rate of one order per second.
On 21 March, the SFC revised the provisions for guaranteed funds under the Code on Unit Trusts and
Mutual Funds with immediate effect. Under the revised provisions, the guarantor of a guaranteed fund
must normally be either a licensed banking institution authorised under the Banking Ordinance or an
authorised insurer authorised under the Insurance Companies Ordinance.
On 25 March, HKEx introduced a pre-opening session and an index basket order trading mechanism in
the securities market. The 30-minute pre-opening session starts at 9:30 am. The index basket order
trading mechanism is only applicable in the continuous trading session.
April On 2 April, the Exchange’s listing fees and the Securities (Disclosure of interests) Ordinance Waiver
Fees for derivative warrants were reduced by 25% for the first issue, to HK$60,000 and HK$18,000
respectively, and 50% for each subsequent issue, to HK$40,000 and HK$12,000 respectively, on the
same underlying asset in the same calendar year. The listing fee for basket warrants was fixed at
HK$60,000 for each issue and each subsequent issue.
On 26 April, HKEx and Computershare Limited announced their agreement to merge their Hong Kong
share registration (transfer agency) businesses - Central Registration Hong Kong Limited and Hong
Kong Registrars Limited - to be grouped under an entity called Computershare Hong Kong Investor
Services Limited (CHIS).
On 29 April, the Block Trading Facility for futures and options became a standing facility after a 6-
month pilot programme introduced in October 2001.
May On 2 May, the SFC released the Hedge Funds Guidelines under the Code on Unit Trusts and Mutual
Funds. The guidelines set out the regulatory requirements for the authorisation of hedge funds that are
offered to Hong Kong public.
On 6 May, HKEx introduced Dow Jones Industrial Average (DJIA) Futures for trading on HKFE.
On 6 May, the Bulletin Board function on HKATS, the Hong Kong Futures Automated Trading System,
became available for the trading of Hong Kong stock options.
On 6 May, HKEx announced the proposed new structure for handling listing matters. Under the
proposal, listing matters would be handled by HKEx’s listing division and a new HKEx adjudication
division would be established to handle disciplinary matters.
On 16 May, HKEx introduced the first phase of CCASS/3, the new generation of the Central Clearing
and Settlement System.
On 16 May, the Hong Kong Government reached an agreement with the Australian Securities
Investment Commission (ASIC) on the mutual recognition of mutual fund managers.
On 21 May, HKFE delisted One-Day Rolling Currency Futures contracts for Euro, Yen, British Pound
and Deutschemark.
7 HKEx Fact Book 2002
Major Events of the H
ong Kong Securities M
arket 2002
On 27 May, HKFE increased the size of the HIBOR (Hong Kong Interbank Offered Rate) Futures
Contracts to five times their original size and increased the Exchange and settlement fees for HIBOR
Futures Contracts to 2.5 times their original level, resulting in an effective reduction of 50% in the fees
per contract.
On 28 May, futures and options trading was interrupted at 3:12 pm due to a power failure. The
derivatives market was closed for the remaining trading session.
On 28 May, Clearstream Banking Luxembourg and HKMA announced their agreement to develop a
direct link between the HKMA’s Central Moneymarkets Unit (CMU) and the settlement system of
Clearstream Banking Luxembourg. The new link would provide Asian investors with a window to clear,
settle and hold Clearstream-eligible debt securities via their CMU account.
June On 18 June, HKEx Information Services Ltd (HKEx-IS) and Shenzhen Securities Information Co., Ltd
(SSIC) signed an agreement appointing HKEx-IS as a non-exclusive agent of SSIC for providing real-
time market information of Shenzhen Stock Exchange (SSE) outside the Mainland.
On 24 June, the SAR Government appointed Mr. Frederick Ma Si-hang as Secretary for Financial
Services and the Treasury.
On 28 June, the SFC amended the Code of Conduct for Registered Persons to introduce an additional
alternative client identification procedure to help registered persons to verify the identity of new clients
who wish to open accounts in non-face-to-face situations.
July On 1 July, the SEHK amended the Main Board Listing Rules to allow a wider range of derivative
products, including Equity Linked Instruments (ELI) to be listed on the Exchange.
On 1 July, the SEHK reduced the fees for listing debt securities by 30% to HK$15,000 for securities
listed under a listed debt issuance programme.
On 24 July, HKEx announced a modification of the new structure for handling listing matters proposed
on 6 May 2002. Under the modified proposal, a new integrated Listing Committee would be
established to decide on the Listing Division’s recommendations on listing applications and delistings.
On 25 July, HKEx published a consultation paper on proposed amendments to the Listing Rules
relating to initial listing and continuing listing eligibility and cancellation of listing procedures. The
proposal on the continuing listing eligibility criteria led to market turbulence (the so-called “penny
stocks incident”). HKEx subsequently modified the consultation process to hold separate discussions
with the market on the subject.
August On 1 August, HKEx introduced new contingency procedures concerning trading hours arrangements
for the Hang Seng Index Futures and the Mini-HSI Futures markets in the event of a market
interruption. The move followed the trading halt incident on 28 May 2002 and an independent
consultant’s report released on 26 June 2002.
On 5 August, the first six Equity Linked Instruments (ELI) were listed on SEHK.
8 HKEx Fact Book 2002
Major Events of the H
ong Kong Securities M
arket 2002
On 26 August, SEHK amended the Main Board and GEM Listing Rules in respect of the treatment of
revalued assets in an issuer’s first annual accounts published after listing; and the content
requirements for financial statements relating to changes in equity, changes in accounting estimates
and, for the Main Board Rules only, segment disclosures. The amendments would become effective for
accounting periods ending on or after 1 September 2002.
September On 3 September, HKEx introduced a new service to provide price depth information of its derivatives
market through information vendors. The price depth information comprises the aggregated best five
bid and ask prices with full volume for every HKEx derivative product. Previously, the information was
only available to Futures Exchange Participants through HKATS.
On 10 September, the Report of the Independent Inquiry Panel on the Penny Stocks Incident was
released. The report outlined the room for improvement and recommendations for HKEx to follow.
On 16 September, HKMA announced the termination of the Tap Facility of the Tracker Fund of Hong
Kong (TraHK) on exhaustion of the Tap Issue Limit in the fourth quarter of 2002, thus concluding the
Government’s stock market operation in 1998.
On 18 September, the SFC and the Hong Kong Securities Institute (HKSI) announced the approval of
the HKSI’s new Licensing Examinations, scheduled for launch in March 2003. The new Examinations
would replace the existing ones for meeting competence requirements in respect of the various types
of regulated activities under the Securities and Futures Ordinance.
On 23 September, HSI Services Limited launched the Hang Seng Freefloat Indices, which comprised
the Hang Seng Freefloat Composite Index (HSFCI), Hang Seng HK Freefloat Index (HSHKFI) and Hang
Seng Mainland Freefloat Index (HSMLFI). The indices adopt a freefloat adjusted market capitalisation
weighted methodology.
On 26 September, the Financial Secretary appointed an expert group with three members to review the
regulatory structure of the Hong Kong securities and futures market.
November On 15 November, the Securities (Miscellaneous) (Amendment) Rules 2002, which introduce new
exemptions for provisions regarding short selling in the Securities Ordinance, became effective. The
Rules extend exemptions to allow uncovered short selling by all categories of market makers
registered with SEHK and HKFE in the performance of market making obligations and hedging of
market making positions; and introduce alternative means of reporting and record keeping
requirements for covered short selling transactions to enable timely execution of the transactions.
On 15 November, HKEx published a revised consultation paper on continuing listing criteria and related
issues for a review of the Main Board Listing Rules relating to listing of equity securities, following the
release of the Report of the Independent Inquiry Panel on the Penny Stock Incident.
On 18 November, Mini-Hang Seng Index Options commenced trading on HKFE.
On 28 November, the SFC released the guidelines on hedge fund reporting requirements and
announced the authorisation of three hedge funds for sale to the public. The guidelines came into
effect on 20 December 2002.
9 HKEx Fact Book 2002
Major Events of the H
ong Kong Securities M
arket 2002
On 29 November, the SFC announced the gazetting of the first batch of subsidiary legislation under the
Securities and Futures Ordinance (SFO). The subsidiary legislation comprises: Securities and Futures
(S&F) (Unsolicited Calls-Exclusion) Rules, S&F (Recognised Counterparty) Rules, S&F (Registration of
Commission Disciplinary Orders) Rules, S&F (Professional Investor) Rules, S&F (Leveraged Foreign
Exchange Trading - Exemption) Rules, S&F (Leverage Foreign Exchange Trading (Arbitration)) Rules
and S&F (Exempted Instruments - Information) Rules.
December On 6 December, the SFC announced the gazetting of the second batch of subsidiary legislation under
the SFO. The subsidiary legislation comprises: Securities and Futures (S&F) (Client Securities) Rules,
S&F (Client Money) Rules, S&F (Associated Entities - Notice) Rules and Companies Ordinance
(Exemption of Companies and Prospectuses from Compliance with Provisions) (Amendment) Notice
2002.
On 9 December, HKEx introduced the second phase of CCASS/3.
On 9 December, the Report of the Steering Committee on the Enhancement of Financial Infrastructure
II (SCEFI II) was released. The Report identified three strategic objectives of the Hong Kong financial
market: the development of an efficient and robust market infrastructure, the improvement of
connectivity and interoperability of market infrastructure, and the capture of superior liquidity.
On 13 December, the SFC and the Hong Kong Monetary Authority (HKMA) signed a new Memorandum
of Understanding (MOU) to prepare for the new regulatory regime under the Securities and Futures
Ordinance (SFO).
On 13 December, the SFC announced the gazetting of the third batch of subsidiary legislation under
the SFO. The subsidiary legislation comprises: Securities and Futures (S&F) (Short Selling and
Securities Borrowing and Lending (Miscellaneous)) Rules, S&F (Contracts Limits and Reportable
Positions) Rules, S&F (Price Stabilising) Rules, S&F (Disclosure of Interests - Securities Borrowing and
Lending) Rules, S&F (Financial Resources) Rules, S&F (Keeping of Records) Rules, S&F (Accounts and
Audit) Rules, S&F (Contract Notes, Statements of Account and Receipts) Rules, S&F (Investor
Compensation - Claims) Rules, S&F (Stock Market Listing) Rules, S&F (Licensing and Registration)
(Information) Rules and S&F (Miscellaneous) Rules.
10 HKEx Fact Book 2002
Market H
ighlights
Stock market (Main Board) highlights
Year
2000 2001 2002
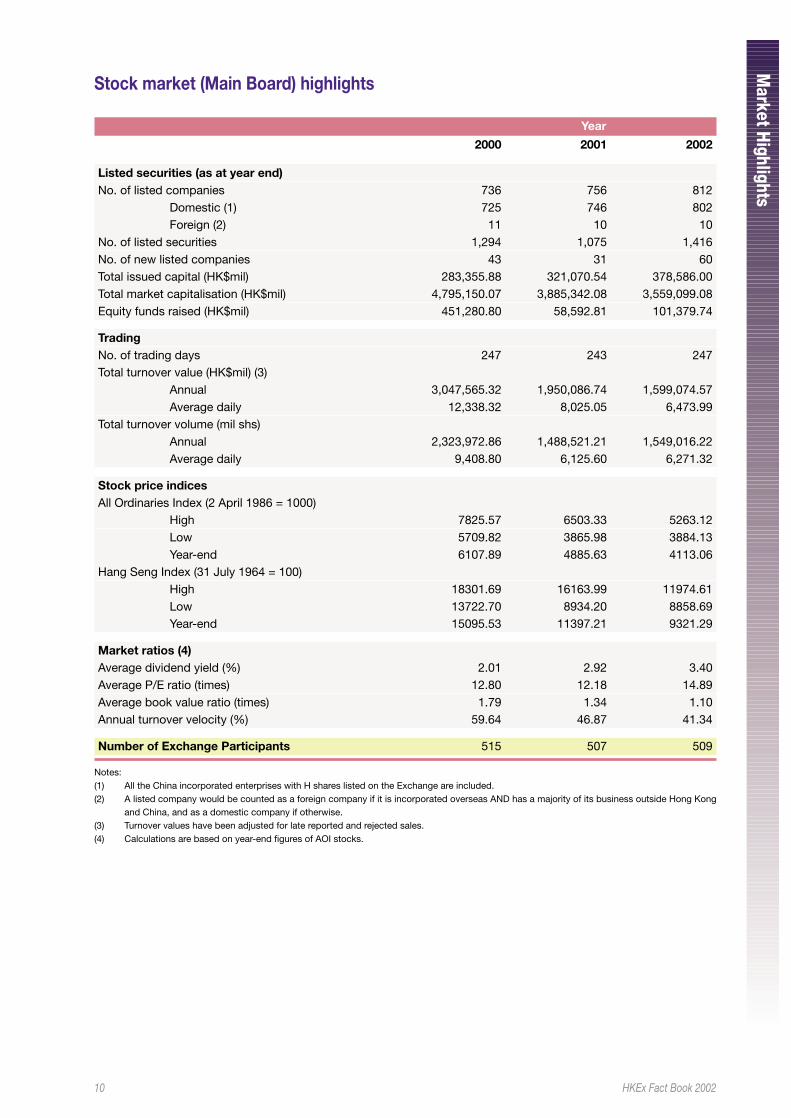
Listed securities (as at year end)No. of listed companies 736 756 812
Domestic (1) 725 746 802Foreign (2) 11 10 10
No. of listed securities 1,294 1,075 1,416No. of new listed companies 43 31 60Total issued capital (HK$mil) 283,355.88 321,070.54 378,586.00Total market capitalisation (HK$mil) 4,795,150.07 3,885,342.08 3,559,099.08Equity funds raised (HK$mil) 451,280.80 58,592.81 101,379.74
TradingNo. of trading days 247 243 247Total turnover value (HK$mil) (3)
Annual 3,047,565.32 1,950,086.74 1,599,074.57Average daily 12,338.32 8,025.05 6,473.99
Total turnover volume (mil shs)Annual 2,323,972.86 1,488,521.21 1,549,016.22Average daily 9,408.80 6,125.60 6,271.32
Stock price indicesAll Ordinaries Index (2 April 1986 = 1000)
High 7825.57 6503.33 5263.12Low 5709.82 3865.98 3884.13Year-end 6107.89 4885.63 4113.06
Hang Seng Index (31 July 1964 = 100)High 18301.69 16163.99 11974.61Low 13722.70 8934.20 8858.69Year-end 15095.53 11397.21 9321.29
Market ratios (4)Average dividend yield (%) 2.01 2.92 3.40Average P/E ratio (times) 12.80 12.18 14.89Average book value ratio (times) 1.79 1.34 1.10Annual turnover velocity (%) 59.64 46.87 41.34
Number of Exchange Participants 515 507 509
Notes:(1) All the China incorporated enterprises with H shares listed on the Exchange are included.(2) A listed company would be counted as a foreign company if it is incorporated overseas AND has a majority of its business outside Hong Kong
and China, and as a domestic company if otherwise.(3) Turnover values have been adjusted for late reported and rejected sales.(4) Calculations are based on year-end figures of AOI stocks.
11 HKEx Fact Book 2002
Market H
ighlights
Growth Enterprise Market (GEM) highlights
Year
2000 2001 2002
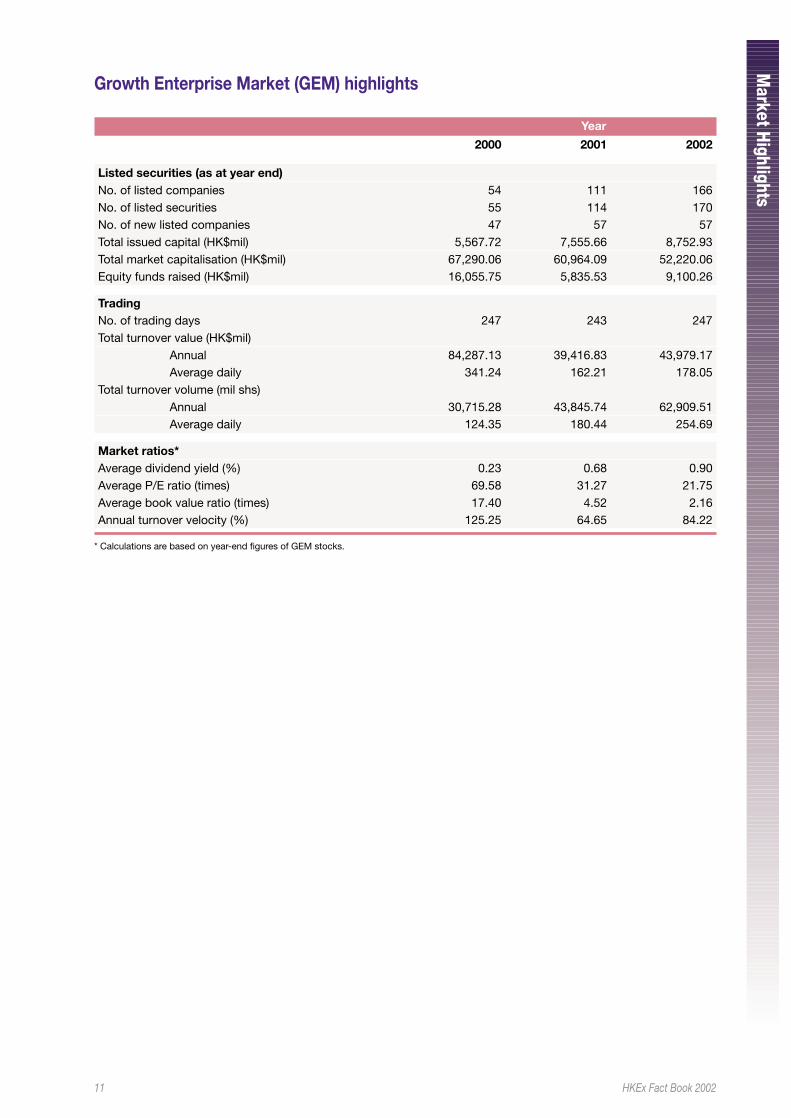
Listed securities (as at year end)No. of listed companies 54 111 166No. of listed securities 55 114 170No. of new listed companies 47 57 57Total issued capital (HK$mil) 5,567.72 7,555.66 8,752.93Total market capitalisation (HK$mil) 67,290.06 60,964.09 52,220.06Equity funds raised (HK$mil) 16,055.75 5,835.53 9,100.26
TradingNo. of trading days 247 243 247Total turnover value (HK$mil)
Annual 84,287.13 39,416.83 43,979.17Average daily 341.24 162.21 178.05
Total turnover volume (mil shs)Annual 30,715.28 43,845.74 62,909.51Average daily 124.35 180.44 254.69
Market ratios*Average dividend yield (%) 0.23 0.68 0.90Average P/E ratio (times) 69.58 31.27 21.75Average book value ratio (times) 17.40 4.52 2.16Annual turnover velocity (%) 125.25 64.65 84.22
* Calculations are based on year-end figures of GEM stocks.
12 HKEx Fact Book 2002
Market H
ighlights
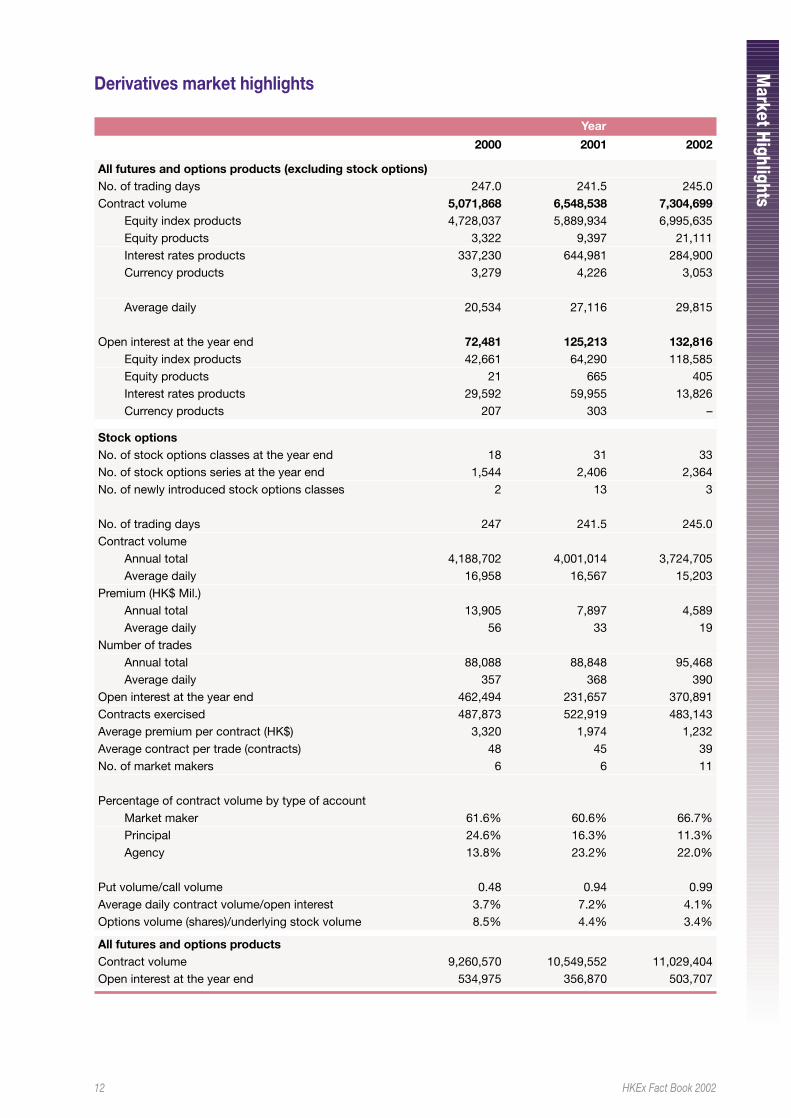
Derivatives market highlights
Year
2000 2001 2002
All futures and options products (excluding stock options)No. of trading days 247.0 241.5 245.0Contract volume 5,071,868 6,548,538 7,304,699
Equity index products 4,728,037 5,889,934 6,995,635Equity products 3,322 9,397 21,111Interest rates products 337,230 644,981 284,900Currency products 3,279 4,226 3,053
Average daily 20,534 27,116 29,815
Open interest at the year end 72,481 125,213 132,816Equity index products 42,661 64,290 118,585Equity products 21 665 405Interest rates products 29,592 59,955 13,826Currency products 207 303 –
Stock optionsNo. of stock options classes at the year end 18 31 33No. of stock options series at the year end 1,544 2,406 2,364No. of newly introduced stock options classes 2 13 3
No. of trading days 247 241.5 245.0Contract volume
Annual total 4,188,702 4,001,014 3,724,705Average daily 16,958 16,567 15,203
Premium (HK$ Mil.)Annual total 13,905 7,897 4,589Average daily 56 33 19
Number of tradesAnnual total 88,088 88,848 95,468Average daily 357 368 390
Open interest at the year end 462,494 231,657 370,891Contracts exercised 487,873 522,919 483,143Average premium per contract (HK$) 3,320 1,974 1,232Average contract per trade (contracts) 48 45 39No. of market makers 6 6 11
Percentage of contract volume by type of accountMarket maker 61.6% 60.6% 66.7%Principal 24.6% 16.3% 11.3%Agency 13.8% 23.2% 22.0%
Put volume/call volume 0.48 0.94 0.99Average daily contract volume/open interest 3.7% 7.2% 4.1%Options volume (shares)/underlying stock volume 8.5% 4.4% 3.4%
All futures and options productsContract volume 9,260,570 10,549,552 11,029,404Open interest at the year end 534,975 356,870 503,707
13 HKEx Fact Book 2002
Cash M
arket - Main Boar d
Market Indices
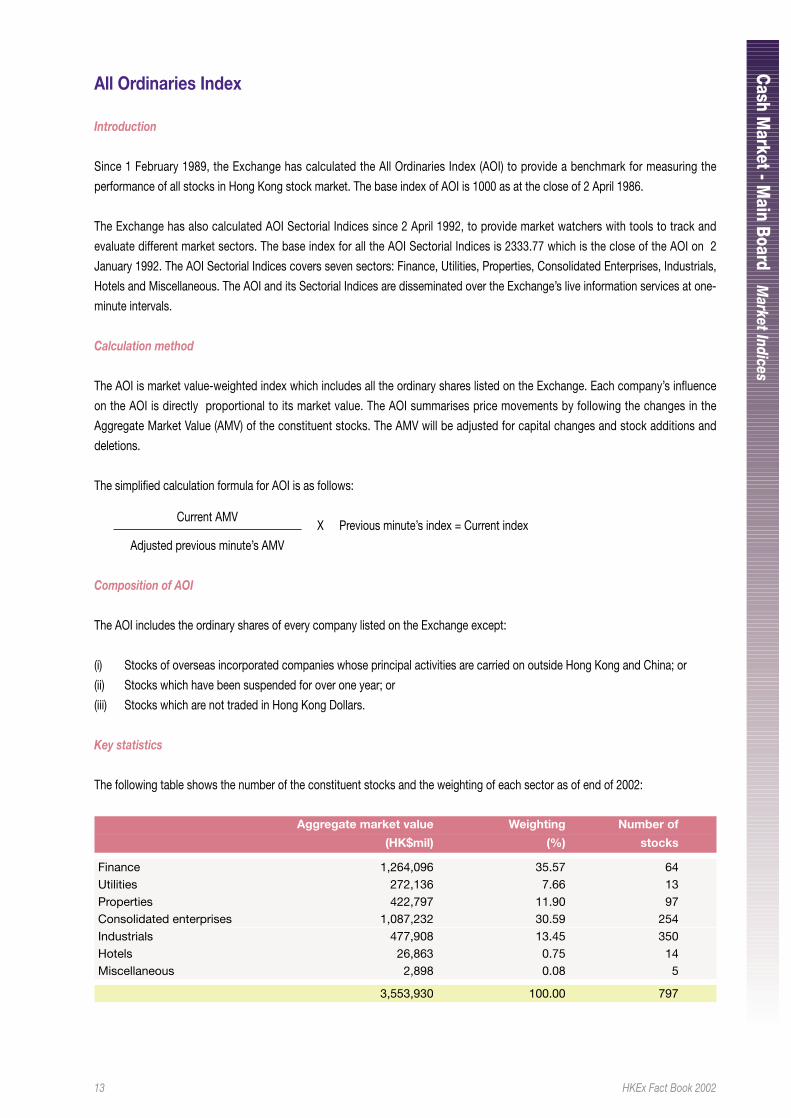
All Ordinaries Index
Introduction
Since 1 February 1989, the Exchange has calculated the All Ordinaries Index (AOI) to provide a benchmark for measuring the
performance of all stocks in Hong Kong stock market. The base index of AOI is 1000 as at the close of 2 April 1986.
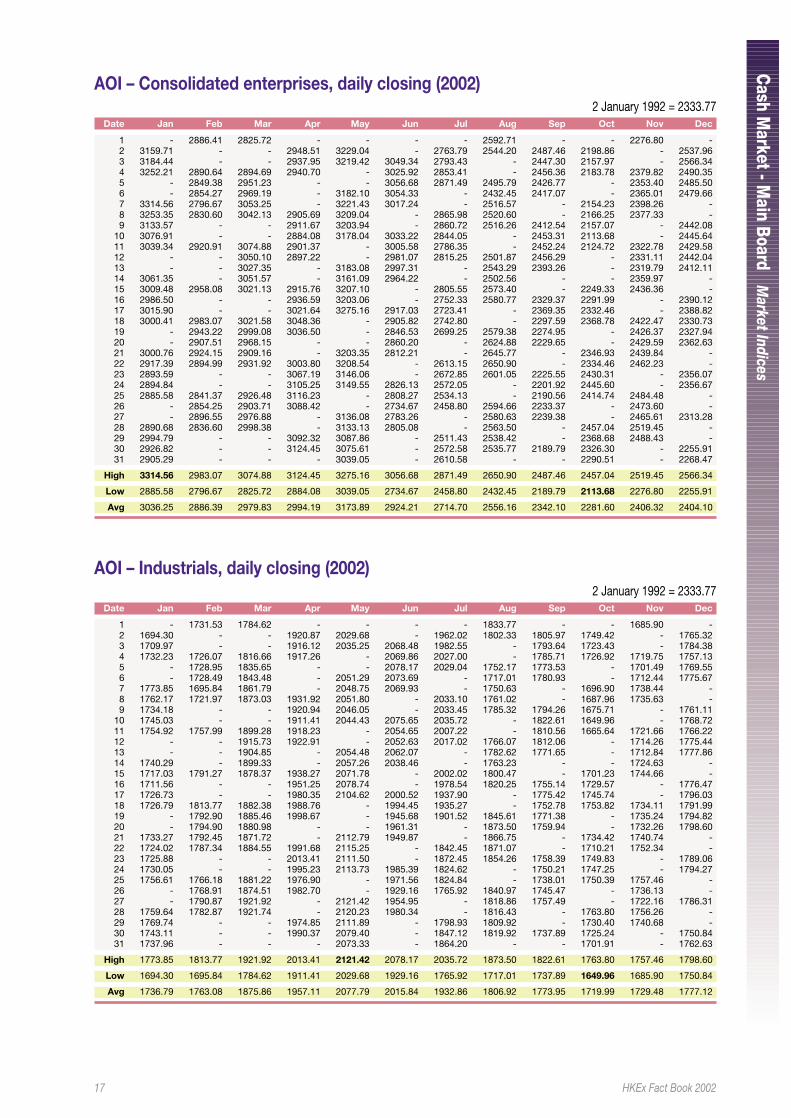
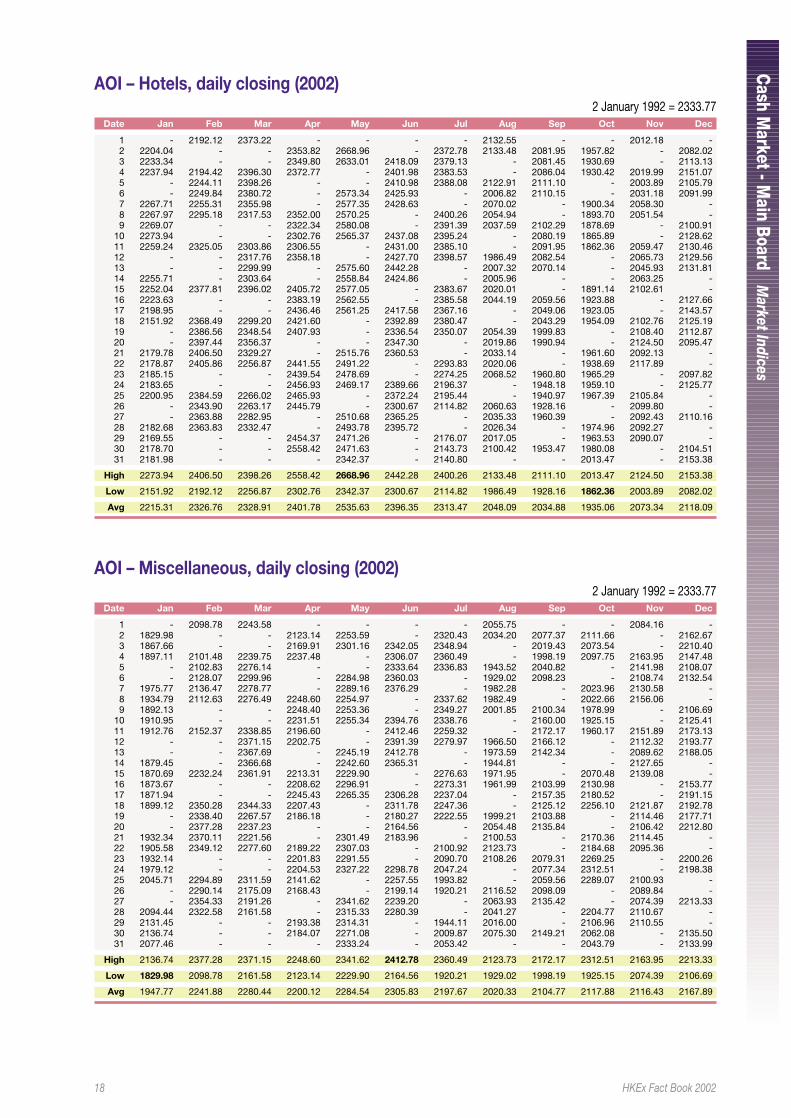
The Exchange has also calculated AOI Sectorial Indices since 2 April 1992, to provide market watchers with tools to track and
evaluate different market sectors. The base index for all the AOI Sectorial Indices is 2333.77 which is the close of the AOI on 2
January 1992. The AOI Sectorial Indices covers seven sectors: Finance, Utilities, Properties, Consolidated Enterprises, Industrials,
Hotels and Miscellaneous. The AOI and its Sectorial Indices are disseminated over the Exchange’s live information services at one-
minute intervals.
Calculation method
The AOI is market value-weighted index which includes all the ordinary shares listed on the Exchange. Each company’s influence
on the AOI is directly proportional to its market value. The AOI summarises price movements by following the changes in the
Aggregate Market Value (AMV) of the constituent stocks. The AMV will be adjusted for capital changes and stock additions and
deletions.
The simplified calculation formula for AOI is as follows:
Current AMVX Previous minute’s index = Current index
Adjusted previous minute’s AMV
Composition of AOI
The AOI includes the ordinary shares of every company listed on the Exchange except:
(i) Stocks of overseas incorporated companies whose principal activities are carried on outside Hong Kong and China; or
(ii) Stocks which have been suspended for over one year; or
(iii) Stocks which are not traded in Hong Kong Dollars.
Key statistics
The following table shows the number of the constituent stocks and the weighting of each sector as of end of 2002:
Aggregate market value Weighting Number of
(HK$mil) (%) stocks
Finance 1,264,096 35.57 64Utilities 272,136 7.66 13Properties 422,797 11.90 97Consolidated enterprises 1,087,232 30.59 254Industrials 477,908 13.45 350Hotels 26,863 0.75 14Miscellaneous 2,898 0.08 5
3,553,930 100.00 797
14 HKEx Fact Book 2002
Cash M
arket - Main Boar d
Market Indices
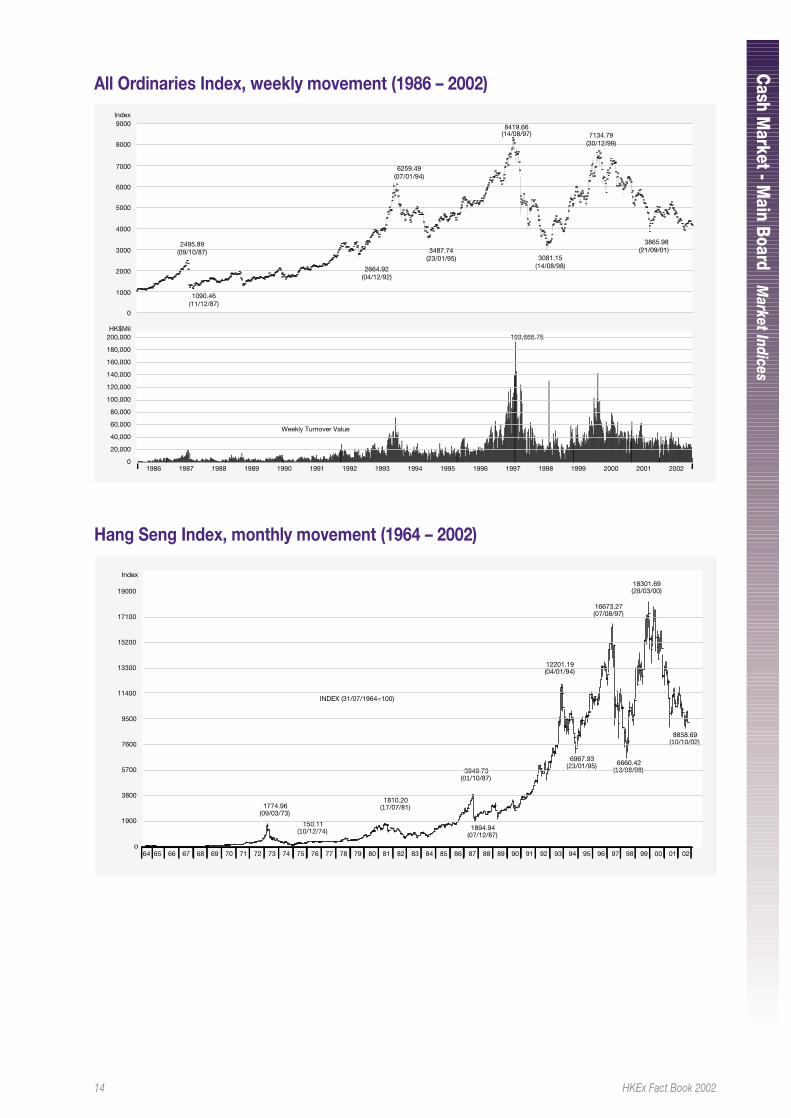
All Ordinaries Index, weekly movement (1986 – 2002)
HK$Mil200,000
Index9000
8000
7000
6000
5000
4000
3000
2000
1000
0
180,000
160,000
140,000
120,000
100,000
80,000
60,000
40,000
1986 1987 1988 1989 1990 1991 1992 1993 1994 1995 1996
193,666.75
Weekly Turnover Value
2495.89(09/10/87)
1090.46(11/12/87)
2664.92(04/12/92)
1997 1998 1999 2000 2001 2002
20,000
0
6259.49(07/01/94)
3487.74(23/01/95)
8419.66(14/08/97)
3081.15(14/08/98)
7134.79(30/12/99)
3865.98(21/09/01)
Hang Seng Index, monthly movement (1964 – 2002)
0
1900
3800
5700
7600
9500
11400
13300
15200
17100
19000
Index
INDEX (31/07/1964=100)
1774.96(09/03/73)
150.11(10/12/74)
1810.20(17/07/81)
1894.94(07/12/87)
3949.73(01/10/87)
12201.19(04/01/94)
16673.27(07/08/97)
6967.93(23/01/95) 6660.42
(13/08/98)
18301.69(28/03/00)
8858.69(10/10/02)
64 65 66 67 68 69 70 71 72 73 74 75 76 77 78 79 80 81 82 83 84 85 86 87 88 89 90 91 92 93 94 95 96 97 98 99 00 01 02
15 HKEx Fact Book 2002
Cash M
arket - Main Boar d
Market Indices
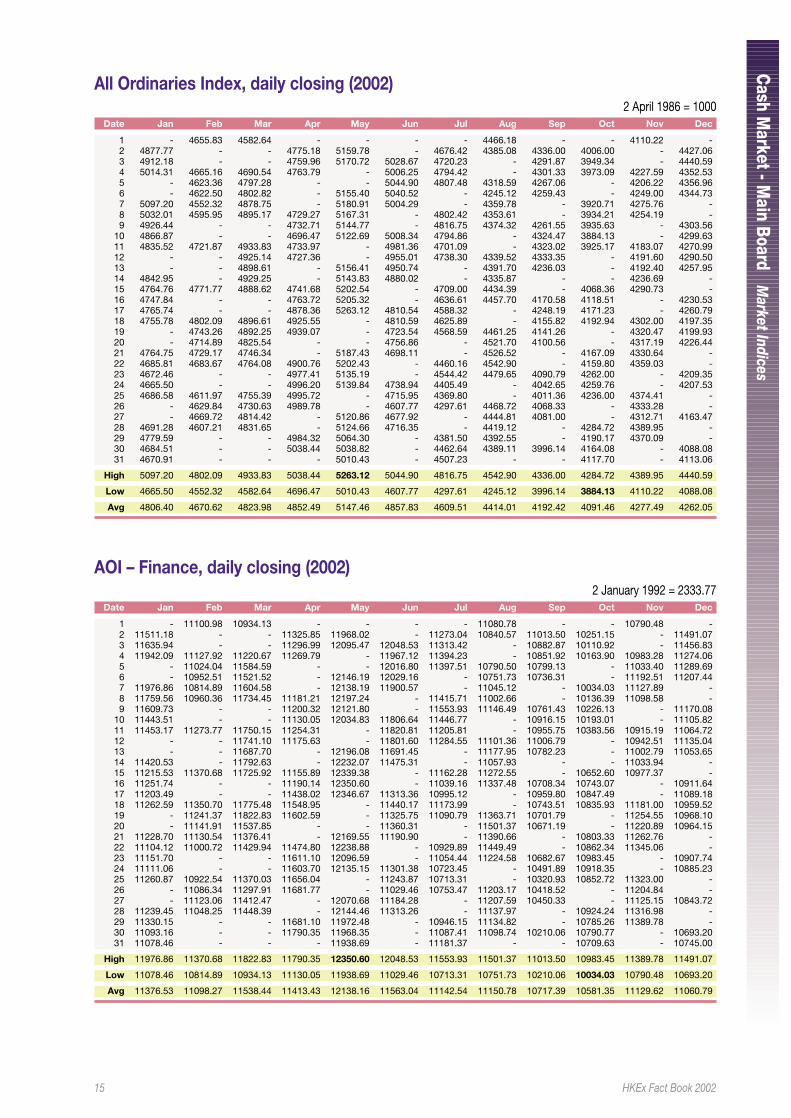
AOI – Finance, daily closing (2002)2 January 1992 = 2333.77
Date Jan Feb Mar Apr May Jun Jul Aug Sep Oct Nov Dec
1 - 11100.98 10934.13 - - - - 11080.78 - - 10790.48 -2 11511.18 - - 11325.85 11968.02 - 11273.04 10840.57 11013.50 10251.15 - 11491.073 11635.94 - - 11296.99 12095.47 12048.53 11313.42 - 10882.87 10110.92 - 11456.834 11942.09 11127.92 11220.67 11269.79 - 11967.12 11394.23 - 10851.92 10163.90 10983.28 11274.065 - 11024.04 11584.59 - - 12016.80 11397.51 10790.50 10799.13 - 11033.40 11289.696 - 10952.51 11521.52 - 12146.19 12029.16 - 10751.73 10736.31 - 11192.51 11207.447 11976.86 10814.89 11604.58 - 12138.19 11900.57 - 11045.12 - 10034.03 11127.89 -8 11759.56 10960.36 11734.45 11181.21 12197.24 - 11415.71 11002.66 - 10136.39 11098.58 -9 11609.73 - - 11200.32 12121.80 - 11553.93 11146.49 10761.43 10226.13 - 11170.08
10 11443.51 - - 11130.05 12034.83 11806.64 11446.77 - 10916.15 10193.01 - 11105.8211 11453.17 11273.77 11750.15 11254.31 - 11820.81 11205.81 - 10955.75 10383.56 10915.19 11064.7212 - - 11741.10 11175.63 - 11801.60 11284.55 11101.36 11006.79 - 10942.51 11135.0413 - - 11687.70 - 12196.08 11691.45 - 11177.95 10782.23 - 11002.79 11053.6514 11420.53 - 11792.63 - 12232.07 11475.31 - 11057.93 - - 11033.94 -15 11215.53 11370.68 11725.92 11155.89 12339.38 - 11162.28 11272.55 - 10652.60 10977.37 -16 11251.74 - - 11190.14 12350.60 - 11039.16 11337.48 10708.34 10743.07 - 10911.6417 11203.49 - - 11438.02 12346.67 11313.36 10995.12 - 10959.80 10847.49 - 11089.1818 11262.59 11350.70 11775.48 11548.95 - 11440.17 11173.99 - 10743.51 10835.93 11181.00 10959.5219 - 11241.37 11822.83 11602.59 - 11325.75 11090.79 11363.71 10701.79 - 11254.55 10968.1020 - 11141.91 11537.85 - - 11360.31 - 11501.37 10671.19 - 11220.89 10964.1521 11228.70 11130.54 11376.41 - 12169.55 11190.90 - 11390.66 - 10803.33 11262.76 -22 11104.12 11000.72 11429.94 11474.80 12238.88 - 10929.89 11449.49 - 10862.34 11345.06 -23 11151.70 - - 11611.10 12096.59 - 11054.44 11224.58 10682.67 10983.45 - 10907.7424 11111.06 - - 11603.70 12135.15 11301.38 10723.45 - 10491.89 10918.35 - 10885.2325 11260.87 10922.54 11370.03 11656.04 - 11243.87 10713.31 - 10320.93 10852.72 11323.00 -26 - 11086.34 11297.91 11681.77 - 11029.46 10753.47 11203.17 10418.52 - 11204.84 -27 - 11123.06 11412.47 - 12070.68 11184.28 - 11207.59 10450.33 - 11125.15 10843.7228 11239.45 11048.25 11448.39 - 12144.46 11313.26 - 11137.97 - 10924.24 11316.98 -29 11330.15 - - 11681.10 11972.48 - 10946.15 11134.82 - 10785.26 11389.78 -30 11093.16 - - 11790.35 11968.35 - 11087.41 11098.74 10210.06 10790.77 - 10693.2031 11078.46 - - - 11938.69 - 11181.37 - - 10709.63 - 10745.00
High 11976.86 11370.68 11822.83 11790.35 12350.60 12048.53 11553.93 11501.37 11013.50 10983.45 11389.78 11491.07
Low 11078.46 10814.89 10934.13 11130.05 11938.69 11029.46 10713.31 10751.73 10210.06 10034.03 10790.48 10693.20
Avg 11376.53 11098.27 11538.44 11413.43 12138.16 11563.04 11142.54 11150.78 10717.39 10581.35 11129.62 11060.79
All Ordinaries Index, daily closing (2002)2 April 1986 = 1000
Date Jan Feb Mar Apr May Jun Jul Aug Sep Oct Nov Dec
1 - 4655.83 4582.64 - - - - 4466.18 - - 4110.22 -2 4877.77 - - 4775.18 5159.78 - 4676.42 4385.08 4336.00 4006.00 - 4427.063 4912.18 - - 4759.96 5170.72 5028.67 4720.23 - 4291.87 3949.34 - 4440.594 5014.31 4665.16 4690.54 4763.79 - 5006.25 4794.42 - 4301.33 3973.09 4227.59 4352.535 - 4623.36 4797.28 - - 5044.90 4807.48 4318.59 4267.06 - 4206.22 4356.966 - 4622.50 4802.82 - 5155.40 5040.52 - 4245.12 4259.43 - 4249.00 4344.737 5097.20 4552.32 4878.75 - 5180.91 5004.29 - 4359.78 - 3920.71 4275.76 -8 5032.01 4595.95 4895.17 4729.27 5167.31 - 4802.42 4353.61 - 3934.21 4254.19 -9 4926.44 - - 4732.71 5144.77 - 4816.75 4374.32 4261.55 3935.63 - 4303.56
10 4866.87 - - 4696.47 5122.69 5008.34 4794.86 - 4324.47 3884.13 - 4299.6311 4835.52 4721.87 4933.83 4733.97 - 4981.36 4701.09 - 4323.02 3925.17 4183.07 4270.9912 - - 4925.14 4727.36 - 4955.01 4738.30 4339.52 4333.35 - 4191.60 4290.5013 - - 4898.61 - 5156.41 4950.74 - 4391.70 4236.03 - 4192.40 4257.9514 4842.95 - 4929.25 - 5143.83 4880.02 - 4335.87 - - 4236.69 -15 4764.76 4771.77 4888.62 4741.68 5202.54 - 4709.00 4434.39 - 4068.36 4290.73 -16 4747.84 - - 4763.72 5205.32 - 4636.61 4457.70 4170.58 4118.51 - 4230.5317 4765.74 - - 4878.36 5263.12 4810.54 4588.32 - 4248.19 4171.23 - 4260.7918 4755.78 4802.09 4896.61 4925.55 - 4810.59 4625.89 - 4155.82 4192.94 4302.00 4197.3519 - 4743.26 4892.25 4939.07 - 4723.54 4568.59 4461.25 4141.26 - 4320.47 4199.9320 - 4714.89 4825.54 - - 4756.86 - 4521.70 4100.56 - 4317.19 4226.4421 4764.75 4729.17 4746.34 - 5187.43 4698.11 - 4526.52 - 4167.09 4330.64 -22 4685.81 4683.67 4764.08 4900.76 5202.43 - 4460.16 4542.90 - 4159.80 4359.03 -23 4672.46 - - 4977.41 5135.19 - 4544.42 4479.65 4090.79 4262.00 - 4209.3524 4665.50 - - 4996.20 5139.84 4738.94 4405.49 - 4042.65 4259.76 - 4207.5325 4686.58 4611.97 4755.39 4995.72 - 4715.95 4369.80 - 4011.36 4236.00 4374.41 -26 - 4629.84 4730.63 4989.78 - 4607.77 4297.61 4468.72 4068.33 - 4333.28 -27 - 4669.72 4814.42 - 5120.86 4677.92 - 4444.81 4081.00 - 4312.71 4163.4728 4691.28 4607.21 4831.65 - 5124.66 4716.35 - 4419.12 - 4284.72 4389.95 -29 4779.59 - - 4984.32 5064.30 - 4381.50 4392.55 - 4190.17 4370.09 -30 4684.51 - - 5038.44 5038.82 - 4462.64 4389.11 3996.14 4164.08 - 4088.0831 4670.91 - - - 5010.43 - 4507.23 - - 4117.70 - 4113.06
High 5097.20 4802.09 4933.83 5038.44 5263.12 5044.90 4816.75 4542.90 4336.00 4284.72 4389.95 4440.59
Low 4665.50 4552.32 4582.64 4696.47 5010.43 4607.77 4297.61 4245.12 3996.14 3884.13 4110.22 4088.08
Avg 4806.40 4670.62 4823.98 4852.49 5147.46 4857.83 4609.51 4414.01 4192.42 4091.46 4277.49 4262.05

16 HKEx Fact Book 2002
Cash M
arket - Main Boar d
Market Indices
AOI – Properties, daily closing (2002)2 January 1992 = 2333.77
Date Jan Feb Mar Apr May Jun Jul Aug Sep Oct Nov Dec
1 - 3749.73 3480.93 - - - - 3385.63 - - 2897.57 -2 3927.59 - - 3591.00 4121.74 - 3591.75 3315.96 3070.34 2785.09 - 3181.713 3926.21 - - 3568.85 4111.90 3798.27 3647.43 - 3062.05 2735.51 - 3161.104 4024.11 3774.42 3581.92 3600.31 - 3790.28 3715.47 - 3099.53 2751.55 3015.33 3074.465 - 3733.10 3713.85 - - 3859.58 3719.94 3243.07 3060.14 - 2963.31 3087.576 - 3748.28 3711.12 - 4091.21 3845.88 - 3151.11 3063.34 - 3012.28 3088.987 4184.29 3692.86 3766.26 - 4109.19 3847.29 - 3234.76 - 2730.46 3052.37 -8 4187.78 3669.32 3765.60 3563.08 4043.07 - 3693.19 3200.13 - 2732.09 3042.18 -9 4148.69 - - 3575.54 3982.19 - 3689.62 3170.98 3060.45 2724.55 - 3039.72
10 4083.49 - - 3540.60 3984.85 3868.50 3689.54 - 3100.90 2671.07 - 3033.9511 4009.08 3765.04 3796.99 3573.99 - 3837.89 3598.79 - 3096.69 2696.97 2985.04 2975.3612 - - 3804.33 3593.02 - 3799.86 3631.39 3105.05 3094.32 - 2987.32 2970.1413 - - 3786.59 - 4024.83 3781.58 - 3157.45 3012.10 - 3000.74 2948.3914 4013.15 - 3804.32 - 3989.90 3719.27 - 3101.41 - - 3075.28 -15 3935.88 3796.53 3763.66 3602.54 4059.17 - 3623.67 3175.35 - 2825.12 3143.86 -16 3896.05 - - 3625.74 4053.77 - 3537.99 3197.21 2921.15 2849.78 - 2969.5217 3911.30 - - 3747.90 4091.07 3680.73 3486.03 - 2988.03 2904.56 - 2971.9018 3870.51 3852.56 3776.49 3837.80 - 3659.89 3512.36 - 2914.52 2927.35 3123.03 2911.6919 - 3783.95 3765.72 3875.46 - 3569.69 3462.53 3167.58 2893.14 - 3143.50 2916.7920 - 3792.59 3701.18 - - 3638.56 - 3213.21 2850.33 - 3142.16 2941.9221 3921.73 3809.45 3597.83 - 4012.42 3598.33 - 3249.25 - 2892.93 3141.58 -22 3854.24 3749.17 3586.30 3861.18 4029.04 - 3375.45 3261.93 - 2902.47 3160.69 -23 3824.56 - - 3931.10 3968.10 - 3488.65 3250.83 2802.59 2985.72 - 2938.3024 3801.20 - - 3967.40 3954.62 3619.75 3379.23 - 2763.63 2989.56 - 2928.1225 3786.46 3637.20 3594.91 3936.13 - 3613.81 3323.25 - 2784.97 2996.83 3181.60 -26 - 3569.84 3591.69 3955.26 - 3534.27 3256.70 3241.00 2897.27 - 3119.35 -27 - 3569.98 3654.87 - 3918.89 3599.64 - 3193.76 2908.43 - 3102.28 2879.3928 3796.62 3484.43 3646.22 - 3911.21 3607.66 - 3162.22 - 3042.67 3169.13 -29 3870.46 - - 3931.84 3852.93 - 3340.58 3111.92 - 2971.11 3146.46 -30 3781.69 - - 3998.03 3816.40 - 3408.76 3117.57 2804.43 2943.81 - 2829.8231 3786.07 - - - 3809.80 - 3433.47 - - 2911.54 - 2863.85
High 4187.78 3852.56 3804.33 3998.03 4121.74 3868.50 3719.94 3385.63 3100.90 3042.67 3181.60 3181.71
Low 3781.69 3484.43 3480.93 3540.60 3809.80 3534.27 3256.70 3101.41 2763.63 2671.07 2897.57 2829.82
Avg 3933.69 3716.38 3694.54 3743.84 3996.97 3713.54 3527.54 3200.34 2964.21 2855.75 3076.43 2985.63
AOI – Utilities, daily closing (2002)2 January 1992 = 2333.77
Date Jan Feb Mar Apr May Jun Jul Aug Sep Oct Nov Dec
1 - 10048.38 10384.41 - - - - 10439.51 - - 10296.25 -2 9881.58 - - 10672.22 10860.80 - 10607.21 10438.71 10558.85 10660.42 - 10366.413 9864.87 - - 10671.98 10893.83 11225.84 10749.69 - 10593.45 10730.97 - 10350.674 9864.93 10070.54 10490.21 10641.57 - 11296.44 10830.48 - 10721.11 10675.71 10396.96 10410.675 - 10087.60 10450.89 - - 11274.92 10852.04 10331.15 10715.18 - 10436.77 10397.026 - 10160.99 10489.20 - 10870.78 11249.45 - 10225.52 10809.03 - 10514.05 10404.257 9847.36 10176.22 10546.44 - 10915.02 11303.06 - 10299.88 - 10523.81 10573.03 -8 9847.80 10219.10 10657.18 10607.02 10839.48 - 10830.15 10307.16 - 10401.12 10466.42 -9 9782.27 - - 10589.19 10918.91 - 10856.97 10372.12 10742.55 10416.82 - 10329.08
10 9838.02 - - 10532.98 11032.50 11321.47 10864.46 - 10858.37 10274.63 - 10362.1311 9827.25 10384.37 10769.56 10648.18 - 11311.16 10729.33 - 10808.66 10289.41 10407.80 10251.9012 - - 10757.71 10638.32 - 11244.66 10771.43 10307.63 10855.11 - 10474.10 10283.8213 - - 10763.59 - 11034.64 11246.70 - 10428.96 10708.80 - 10386.44 10221.9214 9917.36 - 10831.08 - 11073.87 11082.02 - 10399.45 - - 10421.16 -15 9880.47 10355.09 10769.37 10597.76 11114.44 - 10709.28 10561.15 - 10376.21 10455.31 -16 9917.50 - - 10529.90 11190.22 - 10613.90 10568.10 10772.06 10383.15 - 10255.5317 9910.65 - - 10601.76 11243.54 11001.20 10518.45 - 10896.71 10421.88 - 10254.5018 9902.18 10379.25 10753.03 10577.36 - 10910.73 10519.78 - 10798.97 10278.61 10393.29 10198.1819 - 10279.76 10842.25 10689.50 - 10713.43 10479.67 10505.38 10870.36 - 10468.21 10242.9920 - 10336.46 10830.55 - - 10812.06 - 10512.54 10880.32 - 10483.08 10323.8621 9930.25 10448.75 10741.82 - 11236.01 10829.05 - 10597.95 - 10373.91 10481.01 -22 9919.84 10451.49 10653.42 10707.86 11234.69 - 10397.19 10671.31 - 10325.71 10401.79 -23 9890.85 - - 10814.55 11197.91 - 10525.93 10697.46 10898.19 10453.29 - 10254.2624 9898.65 - - 10722.60 11189.09 10916.16 10434.50 - 10890.41 10381.34 - 10274.0625 9941.59 10348.78 10687.79 10677.08 - 10925.93 10365.72 - 10814.88 10379.19 10435.09 -26 - 10418.14 10696.61 10725.45 - 10631.94 10267.74 10744.78 10746.91 - 10384.92 -27 - 10523.86 10706.46 - 11191.44 10681.75 - 10724.52 10709.93 - 10453.18 10168.2328 9994.68 10506.71 10749.16 - 11144.93 10668.89 - 10712.60 - 10472.48 10424.26 -29 10020.16 - - 10697.91 11164.12 - 10351.44 10690.40 - 10389.12 10302.47 -30 9961.31 - - 10798.71 11148.51 - 10389.84 10605.64 10686.80 10499.65 - 10063.3231 10004.52 - - - 11187.77 - 10425.96 - - 10412.16 - 10087.17
High 10020.16 10523.86 10842.25 10814.55 11243.54 11321.47 10864.46 10744.78 10898.19 10730.97 10573.03 10410.67
Low 9782.27 10048.38 10384.41 10529.90 10839.48 10631.94 10267.74 10225.52 10558.85 10274.63 10296.25 10063.32
Avg 9902.00 10305.62 10678.54 10657.10 11080.12 11032.34 10595.05 10506.45 10777.94 10434.27 10431.22 10275.00
17 HKEx Fact Book 2002
Cash M
arket - Main Boar d
Market Indices
AOI – Consolidated enterprises, daily closing (2002)2 January 1992 = 2333.77
Date Jan Feb Mar Apr May Jun Jul Aug Sep Oct Nov Dec
1 - 2886.41 2825.72 - - - - 2592.71 - - 2276.80 -2 3159.71 - - 2948.51 3229.04 - 2763.79 2544.20 2487.46 2198.86 - 2537.963 3184.44 - - 2937.95 3219.42 3049.34 2793.43 - 2447.30 2157.97 - 2566.344 3252.21 2890.64 2894.69 2940.70 - 3025.92 2853.41 - 2456.36 2183.78 2379.82 2490.355 - 2849.38 2951.23 - - 3056.68 2871.49 2495.79 2426.77 - 2353.40 2485.506 - 2854.27 2969.19 - 3182.10 3054.33 - 2432.45 2417.07 - 2365.01 2479.667 3314.56 2796.67 3053.25 - 3221.43 3017.24 - 2516.57 - 2154.23 2398.26 -8 3253.35 2830.60 3042.13 2905.69 3209.04 - 2865.98 2520.60 - 2166.25 2377.33 -9 3133.57 - - 2911.67 3203.94 - 2860.72 2516.26 2412.54 2157.07 - 2442.08
10 3076.91 - - 2884.08 3178.04 3033.22 2844.05 - 2453.31 2113.68 - 2445.6411 3039.34 2920.91 3074.88 2901.37 - 3005.58 2786.35 - 2452.24 2124.72 2322.78 2429.5812 - - 3050.10 2897.22 - 2981.07 2815.25 2501.87 2456.29 - 2331.11 2442.0413 - - 3027.35 - 3183.08 2997.31 - 2543.29 2393.26 - 2319.79 2412.1114 3061.35 - 3051.57 - 3161.09 2964.22 - 2502.56 - - 2359.97 -15 3009.48 2958.08 3021.13 2915.76 3207.10 - 2805.55 2573.40 - 2249.33 2436.36 -16 2986.50 - - 2936.59 3203.06 - 2752.33 2580.77 2329.37 2291.99 - 2390.1217 3015.90 - - 3021.64 3275.16 2917.03 2723.41 - 2369.35 2332.46 - 2388.8218 3000.41 2983.07 3021.58 3048.36 - 2905.82 2742.80 - 2297.59 2368.78 2422.47 2330.7319 - 2943.22 2999.08 3036.50 - 2846.53 2699.25 2579.38 2274.95 - 2426.37 2327.9420 - 2907.51 2968.15 - - 2860.20 - 2624.88 2229.65 - 2429.59 2362.6321 3000.76 2924.15 2909.16 - 3203.35 2812.21 - 2645.77 - 2346.93 2439.84 -22 2917.39 2894.99 2931.92 3003.80 3208.54 - 2613.15 2650.90 - 2334.46 2462.23 -23 2893.59 - - 3067.19 3146.06 - 2672.85 2601.05 2225.55 2430.31 - 2356.0724 2894.84 - - 3105.25 3149.55 2826.13 2572.05 - 2201.92 2445.60 - 2356.6725 2885.58 2841.37 2926.48 3116.23 - 2808.27 2534.13 - 2190.56 2414.74 2484.48 -26 - 2854.25 2903.71 3088.42 - 2734.67 2458.80 2594.66 2233.37 - 2473.60 -27 - 2896.55 2976.88 - 3136.08 2783.26 - 2580.63 2239.38 - 2465.61 2313.2828 2890.68 2836.60 2998.38 - 3133.13 2805.08 - 2563.50 - 2457.04 2519.45 -29 2994.79 - - 3092.32 3087.86 - 2511.43 2538.42 - 2368.68 2488.43 -30 2926.82 - - 3124.45 3075.61 - 2572.58 2535.77 2189.79 2326.30 - 2255.9131 2905.29 - - - 3039.05 - 2610.58 - - 2290.51 - 2268.47
High 3314.56 2983.07 3074.88 3124.45 3275.16 3056.68 2871.49 2650.90 2487.46 2457.04 2519.45 2566.34
Low 2885.58 2796.67 2825.72 2884.08 3039.05 2734.67 2458.80 2432.45 2189.79 2113.68 2276.80 2255.91
Avg 3036.25 2886.39 2979.83 2994.19 3173.89 2924.21 2714.70 2556.16 2342.10 2281.60 2406.32 2404.10
AOI – Industrials, daily closing (2002)2 January 1992 = 2333.77
Date Jan Feb Mar Apr May Jun Jul Aug Sep Oct Nov Dec
1 - 1731.53 1784.62 - - - - 1833.77 - - 1685.90 -2 1694.30 - - 1920.87 2029.68 - 1962.02 1802.33 1805.97 1749.42 - 1765.323 1709.97 - - 1916.12 2035.25 2068.48 1982.55 - 1793.64 1723.43 - 1784.384 1732.23 1726.07 1816.66 1917.26 - 2069.86 2027.00 - 1785.71 1726.92 1719.75 1757.135 - 1728.95 1835.65 - - 2078.17 2029.04 1752.17 1773.53 - 1701.49 1769.556 - 1728.49 1843.48 - 2051.29 2073.69 - 1717.01 1780.93 - 1712.44 1775.677 1773.85 1695.84 1861.79 - 2048.75 2069.93 - 1750.63 - 1696.90 1738.44 -8 1762.17 1721.97 1873.03 1931.92 2051.80 - 2033.10 1761.02 - 1687.96 1735.63 -9 1734.18 - - 1920.94 2046.05 - 2033.45 1785.32 1794.26 1675.71 - 1761.11
10 1745.03 - - 1911.41 2044.43 2075.65 2035.72 - 1822.61 1649.96 - 1768.7211 1754.92 1757.99 1899.28 1918.23 - 2054.65 2007.22 - 1810.56 1665.64 1721.66 1766.2212 - - 1915.73 1922.91 - 2052.63 2017.02 1766.07 1812.06 - 1714.26 1775.4413 - - 1904.85 - 2054.48 2062.07 - 1782.62 1771.65 - 1712.84 1777.8614 1740.29 - 1899.33 - 2057.26 2038.46 - 1763.23 - - 1724.63 -15 1717.03 1791.27 1878.37 1938.27 2071.78 - 2002.02 1800.47 - 1701.23 1744.66 -16 1711.56 - - 1951.25 2078.74 - 1978.54 1820.25 1755.14 1729.57 - 1776.4717 1726.73 - - 1980.35 2104.62 2000.52 1937.90 - 1775.42 1745.74 - 1796.0318 1726.79 1813.77 1882.38 1988.76 - 1994.45 1935.27 - 1752.78 1753.82 1734.11 1791.9919 - 1792.90 1885.46 1998.67 - 1945.68 1901.52 1845.61 1771.38 - 1735.24 1794.8220 - 1794.90 1880.98 - - 1961.31 - 1873.50 1759.94 - 1732.26 1798.6021 1733.27 1792.45 1871.72 - 2112.79 1949.87 - 1866.75 - 1734.42 1740.74 -22 1724.02 1787.34 1884.55 1991.68 2115.25 - 1842.45 1871.07 - 1710.21 1752.34 -23 1725.88 - - 2013.41 2111.50 - 1872.45 1854.26 1758.39 1749.83 - 1789.0624 1730.05 - - 1995.23 2113.73 1985.39 1824.62 - 1750.21 1747.25 - 1794.2725 1756.61 1766.18 1881.22 1976.90 - 1971.56 1824.84 - 1738.01 1750.39 1757.46 -26 - 1768.91 1874.51 1982.70 - 1929.16 1765.92 1840.97 1745.47 - 1736.13 -27 - 1790.87 1921.92 - 2121.42 1954.95 - 1818.86 1757.49 - 1722.16 1786.3128 1759.64 1782.87 1921.74 - 2120.23 1980.34 - 1816.43 - 1763.80 1756.26 -29 1769.74 - - 1974.85 2111.89 - 1798.93 1809.92 - 1730.40 1740.68 -30 1743.11 - - 1990.37 2079.40 - 1847.12 1819.92 1737.89 1725.24 - 1750.8431 1737.96 - - - 2073.33 - 1864.20 - - 1701.91 - 1762.63
High 1773.85 1813.77 1921.92 2013.41 2121.42 2078.17 2035.72 1873.50 1822.61 1763.80 1757.46 1798.60
Low 1694.30 1695.84 1784.62 1911.41 2029.68 1929.16 1765.92 1717.01 1737.89 1649.96 1685.90 1750.84
Avg 1736.79 1763.08 1875.86 1957.11 2077.79 2015.84 1932.86 1806.92 1773.95 1719.99 1729.48 1777.12
18 HKEx Fact Book 2002
Cash M
arket - Main Boar d
Market Indices
AOI – Hotels, daily closing (2002)2 January 1992 = 2333.77
Date Jan Feb Mar Apr May Jun Jul Aug Sep Oct Nov Dec
1 - 2192.12 2373.22 - - - - 2132.55 - - 2012.18 -2 2204.04 - - 2353.82 2668.96 - 2372.78 2133.48 2081.95 1957.82 - 2082.023 2233.34 - - 2349.80 2633.01 2418.09 2379.13 - 2081.45 1930.69 - 2113.134 2237.94 2194.42 2396.30 2372.77 - 2401.98 2383.53 - 2086.04 1930.42 2019.99 2151.075 - 2244.11 2398.26 - - 2410.98 2388.08 2122.91 2111.10 - 2003.89 2105.796 - 2249.84 2380.72 - 2573.34 2425.93 - 2006.82 2110.15 - 2031.18 2091.997 2267.71 2255.31 2355.98 - 2577.35 2428.63 - 2070.02 - 1900.34 2058.30 -8 2267.97 2295.18 2317.53 2352.00 2570.25 - 2400.26 2054.94 - 1893.70 2051.54 -9 2269.07 - - 2322.34 2580.08 - 2391.39 2037.59 2102.29 1878.69 - 2100.91
10 2273.94 - - 2302.76 2565.37 2437.08 2395.24 - 2080.19 1865.89 - 2128.6211 2259.24 2325.05 2303.86 2306.55 - 2431.00 2385.10 - 2091.95 1862.36 2059.47 2130.4612 - - 2317.76 2358.18 - 2427.70 2398.57 1986.49 2082.54 - 2065.73 2129.5613 - - 2299.99 - 2575.60 2442.28 - 2007.32 2070.14 - 2045.93 2131.8114 2255.71 - 2303.64 - 2558.84 2424.86 - 2005.96 - - 2063.25 -15 2252.04 2377.81 2396.02 2405.72 2577.05 - 2383.67 2020.01 - 1891.14 2102.61 -16 2223.63 - - 2383.19 2562.55 - 2385.58 2044.19 2059.56 1923.88 - 2127.6617 2198.95 - - 2436.46 2561.25 2417.58 2367.16 - 2049.06 1923.05 - 2143.5718 2151.92 2368.49 2299.20 2421.60 - 2392.89 2380.47 - 2043.29 1954.09 2102.76 2125.1919 - 2386.56 2348.54 2407.93 - 2336.54 2350.07 2054.39 1999.83 - 2108.40 2112.8720 - 2397.44 2356.37 - - 2347.30 - 2019.86 1990.94 - 2124.50 2095.4721 2179.78 2406.50 2329.27 - 2515.76 2360.53 - 2033.14 - 1961.60 2092.13 -22 2178.87 2405.86 2256.87 2441.55 2491.22 - 2293.83 2020.06 - 1938.69 2117.89 -23 2185.15 - - 2439.54 2478.69 - 2274.25 2068.52 1960.80 1965.29 - 2097.8224 2183.65 - - 2456.93 2469.17 2389.66 2196.37 - 1948.18 1959.10 - 2125.7725 2200.95 2384.59 2266.02 2465.93 - 2372.24 2195.44 - 1940.97 1967.39 2105.84 -26 - 2343.90 2263.17 2445.79 - 2300.67 2114.82 2060.63 1928.16 - 2099.80 -27 - 2363.88 2282.95 - 2510.68 2365.25 - 2035.33 1960.39 - 2092.43 2110.1628 2182.68 2363.83 2332.47 - 2493.78 2395.72 - 2026.34 - 1974.96 2092.27 -29 2169.55 - - 2454.37 2471.26 - 2176.07 2017.05 - 1963.53 2090.07 -30 2178.70 - - 2558.42 2471.63 - 2143.73 2100.42 1953.47 1980.08 - 2104.5131 2181.98 - - - 2342.37 - 2140.80 - - 2013.47 - 2153.38
High 2273.94 2406.50 2398.26 2558.42 2668.96 2442.28 2400.26 2133.48 2111.10 2013.47 2124.50 2153.38
Low 2151.92 2192.12 2256.87 2302.76 2342.37 2300.67 2114.82 1986.49 1928.16 1862.36 2003.89 2082.02
Avg 2215.31 2326.76 2328.91 2401.78 2535.63 2396.35 2313.47 2048.09 2034.88 1935.06 2073.34 2118.09
AOI – Miscellaneous, daily closing (2002)2 January 1992 = 2333.77
Date Jan Feb Mar Apr May Jun Jul Aug Sep Oct Nov Dec
1 - 2098.78 2243.58 - - - - 2055.75 - - 2084.16 -2 1829.98 - - 2123.14 2253.59 - 2320.43 2034.20 2077.37 2111.66 - 2162.673 1867.66 - - 2169.91 2301.16 2342.05 2348.94 - 2019.43 2073.54 - 2210.404 1897.11 2101.48 2239.75 2237.48 - 2306.07 2360.49 - 1998.19 2097.75 2163.95 2147.485 - 2102.83 2276.14 - - 2333.64 2336.83 1943.52 2040.82 - 2141.98 2108.076 - 2128.07 2299.96 - 2284.98 2360.03 - 1929.02 2098.23 - 2108.74 2132.547 1975.77 2136.47 2278.77 - 2289.16 2376.29 - 1982.28 - 2023.96 2130.58 -8 1934.79 2112.63 2276.49 2248.60 2254.97 - 2337.62 1982.49 - 2022.66 2156.06 -9 1892.13 - - 2248.40 2253.36 - 2349.27 2001.85 2100.34 1978.99 - 2106.69
10 1910.95 - - 2231.51 2255.34 2394.76 2338.76 - 2160.00 1925.15 - 2125.4111 1912.76 2152.37 2338.85 2196.60 - 2412.46 2259.32 - 2172.17 1960.17 2151.89 2173.1312 - - 2371.15 2202.75 - 2391.39 2279.97 1966.50 2166.12 - 2112.32 2193.7713 - - 2367.69 - 2245.19 2412.78 - 1973.59 2142.34 - 2089.62 2188.0514 1879.45 - 2366.68 - 2242.60 2365.31 - 1944.81 - - 2127.65 -15 1870.69 2232.24 2361.91 2213.31 2229.90 - 2276.63 1971.95 - 2070.48 2139.08 -16 1873.67 - - 2208.62 2296.91 - 2273.31 1961.99 2103.99 2130.98 - 2153.7717 1871.94 - - 2245.43 2265.35 2306.28 2237.04 - 2157.35 2180.52 - 2191.1518 1899.12 2350.28 2344.33 2207.43 - 2311.78 2247.36 - 2125.12 2256.10 2121.87 2192.7819 - 2338.40 2267.57 2186.18 - 2180.27 2222.55 1999.21 2103.88 - 2114.46 2177.7120 - 2377.28 2237.23 - - 2164.56 - 2054.48 2135.84 - 2106.42 2212.8021 1932.34 2370.11 2221.56 - 2301.49 2183.96 - 2100.53 - 2170.36 2114.45 -22 1905.58 2349.12 2277.60 2189.22 2307.03 - 2100.92 2123.73 - 2184.68 2095.36 -23 1932.14 - - 2201.83 2291.55 - 2090.70 2108.26 2079.31 2269.25 - 2200.2624 1979.12 - - 2204.53 2327.22 2298.78 2047.24 - 2077.34 2312.51 - 2198.3825 2045.71 2294.89 2311.59 2141.62 - 2257.55 1993.82 - 2059.56 2289.07 2100.93 -26 - 2290.14 2175.09 2168.43 - 2199.14 1920.21 2116.52 2098.09 - 2089.84 -27 - 2354.33 2191.26 - 2341.62 2239.20 - 2063.93 2135.42 - 2074.39 2213.3328 2094.44 2322.58 2161.58 - 2315.33 2280.39 - 2041.27 - 2204.77 2110.67 -29 2131.45 - - 2193.38 2314.31 - 1944.11 2016.00 - 2106.96 2110.55 -30 2136.74 - - 2184.07 2271.08 - 2009.87 2075.30 2149.21 2062.08 - 2135.5031 2077.46 - - - 2333.24 - 2053.42 - - 2043.79 - 2133.99
High 2136.74 2377.28 2371.15 2248.60 2341.62 2412.78 2360.49 2123.73 2172.17 2312.51 2163.95 2213.33
Low 1829.98 2098.78 2161.58 2123.14 2229.90 2164.56 1920.21 1929.02 1998.19 1925.15 2074.39 2106.69
Avg 1947.77 2241.88 2280.44 2200.12 2284.54 2305.83 2197.67 2020.33 2104.77 2117.88 2116.43 2167.89
19 HKEx Fact Book 2002
Cash M
arket - Main Boar d
Market Indices
All Ordinaries Index and its sectorial indices, daily movement (2002)
AOI-Utilities AOI-Properties
AOI-Con. Enterprises AOI-Industrials
AOI-Hotels AOI-Miscellaneous
All Ordinaries Index
10 MAV 50 MAVDaily Movement
AOI-Finance
3500
3700
3900
4100
4300
4500
4700
4900
5100
5300
5500
5263.12(17/05)
3884.13(10/10)
01/02 02/02 03/02 04/02 05/02 06/02 07/02 08/02 09/02 10/02 11/02 12/02 01/02 02/02 03/02 04/02 05/02 06/02 07/02 08/02 09/02 10/02 11/02 12/02
12350.60(16/05)
10034.03(07/10)
11321.47(10/06)
9782.27(09/01)
01/02 02/02 03/02 04/02 05/02 06/02 07/02 08/02 09/02 10/02 11/02 12/02 01/02 02/02 03/02 04/02 05/02 06/02 07/02 08/02 09/02 10/02 11/02 12/02
4187.78(08/01)
2671.07(10/10)
3314.56(07/01)
2113.68(10/10)
01/02 02/02 03/02 04/02 05/02 06/02 07/02 08/02 09/02 10/02 11/02 12/02 01/02 02/02 03/02 04/02 05/02 06/02 07/02 08/02 09/02 10/02 11/02 12/02
01/02 02/02 03/02 04/02 05/02 06/02 07/02 08/02 09/02 10/02 11/02 12/02 01/02 02/02 03/02 04/02 05/02 06/02 07/02 08/02 09/02 10/02 11/02 12/02
2121.42(27/05)
1649.96(10/10)
2668.96(02/05)
1862.36(11/10)
2412.78(13/06)
1829.98(02/01)
9600
9900
10200
10500
10800
11100
11400
11700
12000
12300
12600
9500
9700
9900
10100
10300
10500
10700
10900
11100
11300
11500
1600
1660
1720
1780
1840
1900
1960
2020
2080
2140
2200
1700
1900
2100
2300
2500
2700
2900
3100
3300
3500
3700
2400
2600
2800
3000
3200
3400
3600
3800
4000
4200
4400
1750
1850
1950
2050
2150
2250
2350
2450
2550
2650
2750
1650
1750
1850
1950
2050
2150
2250
2350
2450
2550
2650
Index Index
Index Index
Index Index
Index Index
20 HKEx Fact Book 2002
Cash M
arket - Main Boar d
Market Indices
Hang Seng Index, daily closing (2002)31 July 1964 = 100
Date Jan Feb Mar Apr May Jun Jul Aug Sep Oct Nov Dec
1 - 10691.25 10425.31 - - - - 10180.02 - - 9407.68 -2 11350.85 - - 10878.04 11780.11 - 10491.76 9991.72 9896.98 9109.35 - 10205.163 11423.52 - - 10833.96 11797.22 11359.80 10579.19 - 9790.68 8984.32 - 10227.014 11702.15 10721.32 10704.12 10831.37 - 11312.55 10765.58 - 9820.33 9051.37 9720.83 9995.735 - 10609.19 10985.84 - - 11402.38 10806.16 9862.33 9726.03 - 9655.36 10009.886 - 10592.39 11003.00 - 11736.20 11380.77 - 9700.69 9720.86 - 9773.98 9973.757 11892.64 10409.68 11188.07 - 11795.98 11284.71 - 9977.74 - 8931.40 9844.38 -8 11713.71 10518.99 11233.23 10723.68 11768.31 - 10803.45 9962.24 - 8977.41 9770.68 -9 11440.72 - - 10733.69 11700.76 - 10843.15 10014.06 9723.67 8977.35 - 9868.48
10 11256.07 - - 10643.14 11645.90 11288.84 10787.54 - 9885.77 8858.69 - 9857.9911 11166.46 10832.74 11318.87 10744.91 - 11215.02 10558.81 - 9882.35 8965.73 9580.88 9784.5712 - - 11273.86 10710.48 - 11147.97 10648.30 9959.92 9896.33 - 9613.84 9813.7813 - - 11217.50 - 11733.43 11119.33 - 10100.06 9650.97 - 9616.62 9728.4314 11209.43 - 11303.70 - 11690.31 10955.52 - 9961.35 - - 9740.84 -15 11013.59 10961.88 11210.25 10727.98 11838.36 - 10581.66 10219.71 - 9336.39 9865.65 -16 10964.09 - - 10788.53 11832.77 - 10421.49 10265.04 9505.13 9459.14 - 9656.4617 11013.84 - - 11090.58 11974.61 10832.26 10335.12 - 9707.25 9576.15 - 9715.7418 10972.96 11002.81 11230.64 11217.15 - 10852.04 10452.55 - 9474.07 9613.07 9920.09 9548.6519 - 10840.49 11222.83 11252.18 - 10673.11 10325.46 10246.96 9427.79 - 9965.03 9557.8620 - 10749.06 11036.60 - - 10754.41 - 10408.01 9328.22 - 9971.15 9628.6921 11000.25 10788.90 10829.73 - 11753.29 10591.86 - 10402.26 - 9570.36 10003.54 -22 10797.69 10664.94 10863.07 11139.42 11795.20 - 10110.25 10424.00 - 9548.94 10065.32 -23 10762.14 - - 11345.18 11624.75 - 10313.89 10245.69 9314.87 9804.65 - 9570.9324 10741.46 - - 11396.57 11626.78 10657.34 9971.99 - 9197.68 9787.49 - 9561.6325 10772.96 10496.02 10836.64 11409.29 - 10608.98 9884.78 - 9124.91 9722.54 10100.77 -26 - 10547.13 10786.92 11385.08 - 10355.92 9773.12 10226.33 9270.71 - 9995.52 -27 - 10648.71 10987.88 - 11564.73 10518.09 - 10185.52 9294.46 - 9944.59 9445.2628 10767.46 10482.55 11032.92 - 11581.58 10598.55 - 10130.25 - 9853.74 10147.84 -29 11014.24 - - 11361.49 11430.66 - 9975.99 10061.15 - 9634.67 10069.87 -30 10756.96 - - 11497.58 11380.61 - 10155.25 10043.87 9072.21 9560.46 - 9272.3331 10725.30 - - - 11301.94 - 10267.36 - - 9441.25 - 9321.29
High 11892.64 11002.81 11318.87 11497.58 11974.61 11402.38 10843.15 10424.00 9896.98 9853.74 10147.84 10227.01
Low 10725.30 10409.68 10425.31 10643.14 11301.94 10355.92 9773.12 9700.69 9072.21 8858.69 9407.68 9272.33
Avg 11111.75 10679.89 11034.55 11035.52 11683.50 10945.47 10402.40 10116.77 9557.68 9369.74 9846.40 9737.18
Note : HSI is compiled by HSI Services Ltd.
Hang Seng Composite Index, daily closing (2002)3 January 2000 = 2000
Date Jan Feb Mar Apr May Jun Jul Aug Sep Oct Nov Dec
1 - 1278.44 1255.72 - - - - 1227.62 - - 1128.93 -2 1343.69 - - 1309.93 1417.87 - 1279.94 1204.40 1190.61 1098.54 - 1223.203 1352.80 - - 1305.35 1421.03 1376.90 1292.18 - 1178.15 1082.91 - 1227.214 1382.45 1281.31 1286.36 1306.05 - 1371.09 1313.08 - 1180.76 1090.07 1163.55 1201.585 - 1269.57 1317.05 - - 1381.81 1316.93 1186.20 1170.67 - 1156.19 1202.936 - 1269.20 1318.74 - 1415.77 1380.56 - 1165.71 1168.93 - 1168.88 1199.427 1405.62 1249.34 1340.25 - 1422.77 1370.35 - 1198.72 - 1075.23 1177.30 -8 1386.89 1261.71 1344.92 1295.74 1418.81 - 1315.71 1197.14 - 1079.72 1170.08 -9 1356.50 - - 1296.68 1411.95 - 1319.67 1202.97 1169.57 1079.18 - 1187.48
10 1338.40 - - 1286.23 1405.54 1371.62 1313.48 - 1188.07 1064.54 - 1186.7411 1329.07 1297.48 1355.54 1297.29 - 1364.26 1286.96 - 1187.84 1076.68 1149.53 1179.0912 - - 1352.66 1295.09 - 1356.71 1297.07 1193.62 1190.27 - 1152.36 1183.9813 - - 1345.37 - 1415.40 1354.95 - 1209.14 1162.29 - 1152.69 1174.6214 1331.82 - 1353.96 - 1411.16 1335.19 - 1193.14 - - 1166.08 -15 1309.87 1311.41 1343.09 1299.04 1427.57 - 1288.97 1221.97 - 1118.00 1181.41 -16 1304.86 - - 1305.20 1428.09 - 1269.47 1227.79 1144.27 1133.03 - 1166.8717 1310.32 - - 1338.16 1444.03 1316.68 1256.43 - 1166.86 1147.85 - 1174.8818 1307.50 1319.38 1345.38 1351.62 - 1317.64 1267.47 - 1140.35 1153.57 1185.72 1156.6319 - 1302.14 1344.31 1355.54 - 1294.42 1251.52 1227.65 1135.94 - 1190.37 1157.0220 - 1293.53 1325.13 - - 1303.71 - 1245.43 1124.17 - 1190.12 1165.3021 1310.15 1297.45 1302.70 - 1421.98 1286.79 - 1246.15 - 1146.72 1194.08 -22 1287.43 1284.18 1307.51 1344.37 1425.48 - 1222.09 1250.42 - 1144.26 1202.28 -23 1283.73 - - 1366.34 1406.44 - 1245.95 1231.31 1122.02 1173.88 - 1159.7024 1282.33 - - 1372.03 1407.27 1297.50 1206.86 - 1108.85 1172.92 - 1158.8225 1287.87 1264.16 1304.82 1372.04 - 1291.05 1196.95 - 1100.24 1165.78 1207.00 -26 - 1269.37 1297.69 1370.45 - 1260.90 1179.07 1228.14 1116.50 - 1195.75 -27 - 1280.77 1321.58 - 1401.27 1280.36 - 1221.44 1119.95 - 1190.14 1146.0028 1289.11 1262.70 1326.22 - 1402.53 1291.34 - 1214.34 - 1180.32 1213.26 -29 1314.82 - - 1368.96 1385.64 - 1202.29 1206.90 - 1153.26 1205.19 -30 1286.96 - - 1384.17 1378.94 - 1225.82 1205.89 1095.45 1145.77 - 1124.4931 1282.92 - - - 1370.93 - 1239.06 - - 1132.35 - 1130.24
High 1405.62 1319.38 1355.54 1384.17 1444.03 1381.81 1319.67 1250.42 1190.61 1180.32 1213.26 1227.21
Low 1282.33 1249.34 1255.72 1286.23 1370.93 1260.90 1179.07 1165.71 1095.45 1064.54 1128.93 1124.49
Avg 1322.05 1281.89 1324.45 1331.01 1411.45 1330.19 1263.04 1213.91 1150.56 1124.50 1178.14 1175.31
Note : HSCI is compiled by HSI Services Ltd.
21 HKEx Fact Book 2002
Cash M
arket - Main Boar d
Market Indices
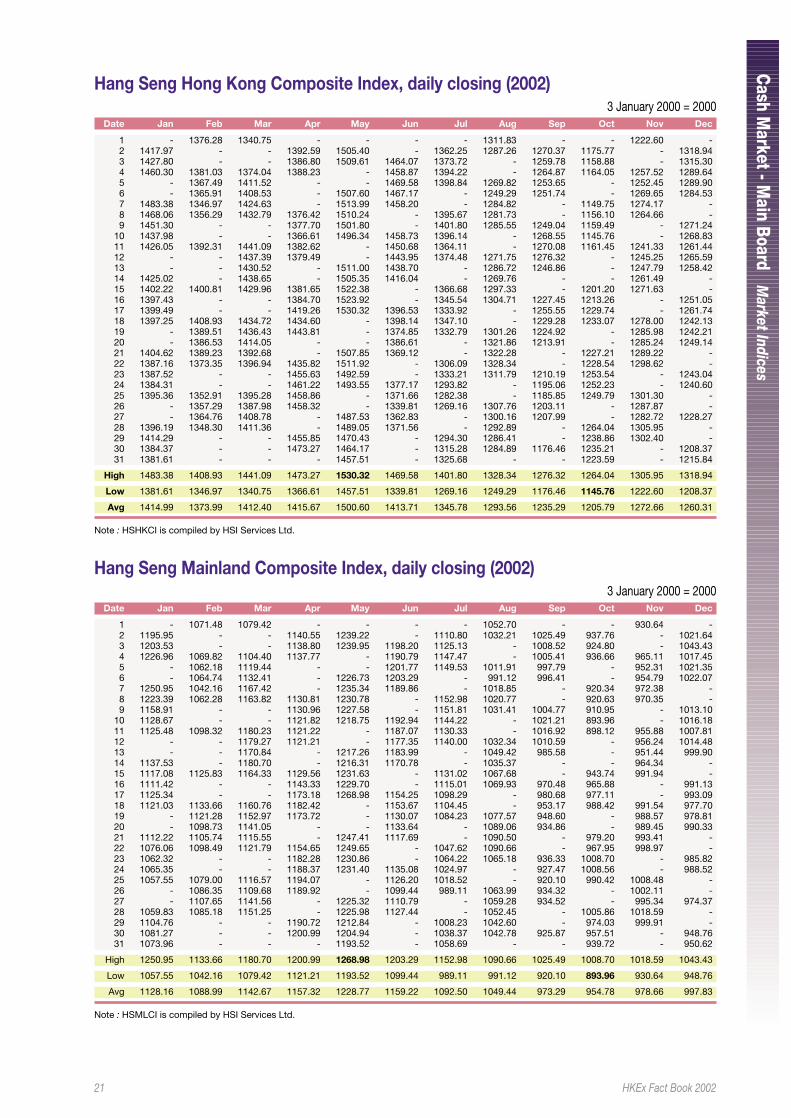
Hang Seng Hong Kong Composite Index, daily closing (2002)3 January 2000 = 2000
Date Jan Feb Mar Apr May Jun Jul Aug Sep Oct Nov Dec
1 - 1376.28 1340.75 - - - - 1311.83 - - 1222.60 -2 1417.97 - - 1392.59 1505.40 - 1362.25 1287.26 1270.37 1175.77 - 1318.943 1427.80 - - 1386.80 1509.61 1464.07 1373.72 - 1259.78 1158.88 - 1315.304 1460.30 1381.03 1374.04 1388.23 - 1458.87 1394.22 - 1264.87 1164.05 1257.52 1289.645 - 1367.49 1411.52 - - 1469.58 1398.84 1269.82 1253.65 - 1252.45 1289.906 - 1365.91 1408.53 - 1507.60 1467.17 - 1249.29 1251.74 - 1269.65 1284.537 1483.38 1346.97 1424.63 - 1513.99 1458.20 - 1284.82 - 1149.75 1274.17 -8 1468.06 1356.29 1432.79 1376.42 1510.24 - 1395.67 1281.73 - 1156.10 1264.66 -9 1451.30 - - 1377.70 1501.80 - 1401.80 1285.55 1249.04 1159.49 - 1271.24
10 1437.98 - - 1366.61 1496.34 1458.73 1396.14 - 1268.55 1145.76 - 1268.8311 1426.05 1392.31 1441.09 1382.62 - 1450.68 1364.11 - 1270.08 1161.45 1241.33 1261.4412 - - 1437.39 1379.49 - 1443.95 1374.48 1271.75 1276.32 - 1245.25 1265.5913 - - 1430.52 - 1511.00 1438.70 - 1286.72 1246.86 - 1247.79 1258.4214 1425.02 - 1438.65 - 1505.35 1416.04 - 1269.76 - - 1261.49 -15 1402.22 1400.81 1429.96 1381.65 1522.38 - 1366.68 1297.33 - 1201.20 1271.63 -16 1397.43 - - 1384.70 1523.92 - 1345.54 1304.71 1227.45 1213.26 - 1251.0517 1399.49 - - 1419.26 1530.32 1396.53 1333.92 - 1255.55 1229.74 - 1261.7418 1397.25 1408.93 1434.72 1434.60 - 1398.14 1347.10 - 1229.28 1233.07 1278.00 1242.1319 - 1389.51 1436.43 1443.81 - 1374.85 1332.79 1301.26 1224.92 - 1285.98 1242.2120 - 1386.53 1414.05 - - 1386.61 - 1321.86 1213.91 - 1285.24 1249.1421 1404.62 1389.23 1392.68 - 1507.85 1369.12 - 1322.28 - 1227.21 1289.22 -22 1387.16 1373.35 1396.94 1435.82 1511.92 - 1306.09 1328.34 - 1228.54 1298.62 -23 1387.52 - - 1455.63 1492.59 - 1333.21 1311.79 1210.19 1253.54 - 1243.0424 1384.31 - - 1461.22 1493.55 1377.17 1293.82 - 1195.06 1252.23 - 1240.6025 1395.36 1352.91 1395.28 1458.86 - 1371.66 1282.38 - 1185.85 1249.79 1301.30 -26 - 1357.29 1387.98 1458.32 - 1339.81 1269.16 1307.76 1203.11 - 1287.87 -27 - 1364.76 1408.78 - 1487.53 1362.83 - 1300.16 1207.99 - 1282.72 1228.2728 1396.19 1348.30 1411.36 - 1489.05 1371.56 - 1292.89 - 1264.04 1305.95 -29 1414.29 - - 1455.85 1470.43 - 1294.30 1286.41 - 1238.86 1302.40 -30 1384.37 - - 1473.27 1464.17 - 1315.28 1284.89 1176.46 1235.21 - 1208.3731 1381.61 - - - 1457.51 - 1325.68 - - 1223.59 - 1215.84
High 1483.38 1408.93 1441.09 1473.27 1530.32 1469.58 1401.80 1328.34 1276.32 1264.04 1305.95 1318.94
Low 1381.61 1346.97 1340.75 1366.61 1457.51 1339.81 1269.16 1249.29 1176.46 1145.76 1222.60 1208.37
Avg 1414.99 1373.99 1412.40 1415.67 1500.60 1413.71 1345.78 1293.56 1235.29 1205.79 1272.66 1260.31
Note : HSHKCI is compiled by HSI Services Ltd.
Hang Seng Mainland Composite Index, daily closing (2002)3 January 2000 = 2000
Date Jan Feb Mar Apr May Jun Jul Aug Sep Oct Nov Dec
1 - 1071.48 1079.42 - - - - 1052.70 - - 930.64 -2 1195.95 - - 1140.55 1239.22 - 1110.80 1032.21 1025.49 937.76 - 1021.643 1203.53 - - 1138.80 1239.95 1198.20 1125.13 - 1008.52 924.80 - 1043.434 1226.96 1069.82 1104.40 1137.77 - 1190.79 1147.47 - 1005.41 936.66 965.11 1017.455 - 1062.18 1119.44 - - 1201.77 1149.53 1011.91 997.79 - 952.31 1021.356 - 1064.74 1132.41 - 1226.73 1203.29 - 991.12 996.41 - 954.79 1022.077 1250.95 1042.16 1167.42 - 1235.34 1189.86 - 1018.85 - 920.34 972.38 -8 1223.39 1062.28 1163.82 1130.81 1230.78 - 1152.98 1020.77 - 920.63 970.35 -9 1158.91 - - 1130.96 1227.58 - 1151.81 1031.41 1004.77 910.95 - 1013.10
10 1128.67 - - 1121.82 1218.75 1192.94 1144.22 - 1021.21 893.96 - 1016.1811 1125.48 1098.32 1180.23 1121.22 - 1187.07 1130.33 - 1016.92 898.12 955.88 1007.8112 - - 1179.27 1121.21 - 1177.35 1140.00 1032.34 1010.59 - 956.24 1014.4813 - - 1170.84 - 1217.26 1183.99 - 1049.42 985.58 - 951.44 999.9014 1137.53 - 1180.70 - 1216.31 1170.78 - 1035.37 - - 964.34 -15 1117.08 1125.83 1164.33 1129.56 1231.63 - 1131.02 1067.68 - 943.74 991.94 -16 1111.42 - - 1143.33 1229.70 - 1115.01 1069.93 970.48 965.88 - 991.1317 1125.34 - - 1173.18 1268.98 1154.25 1098.29 - 980.68 977.11 - 993.0918 1121.03 1133.66 1160.76 1182.42 - 1153.67 1104.45 - 953.17 988.42 991.54 977.7019 - 1121.28 1152.97 1173.72 - 1130.07 1084.23 1077.57 948.60 - 988.57 978.8120 - 1098.73 1141.05 - - 1133.64 - 1089.06 934.86 - 989.45 990.3321 1112.22 1105.74 1115.55 - 1247.41 1117.69 - 1090.50 - 979.20 993.41 -22 1076.06 1098.49 1121.79 1154.65 1249.65 - 1047.62 1090.66 - 967.95 998.97 -23 1062.32 - - 1182.28 1230.86 - 1064.22 1065.18 936.33 1008.70 - 985.8224 1065.35 - - 1188.37 1231.40 1135.08 1024.97 - 927.47 1008.56 - 988.5225 1057.55 1079.00 1116.57 1194.07 - 1126.20 1018.52 - 920.10 990.42 1008.48 -26 - 1086.35 1109.68 1189.92 - 1099.44 989.11 1063.99 934.32 - 1002.11 -27 - 1107.65 1141.56 - 1225.32 1110.79 - 1059.28 934.52 - 995.34 974.3728 1059.83 1085.18 1151.25 - 1225.98 1127.44 - 1052.45 - 1005.86 1018.59 -29 1104.76 - - 1190.72 1212.84 - 1008.23 1042.60 - 974.03 999.91 -30 1081.27 - - 1200.99 1204.94 - 1038.37 1042.78 925.87 957.51 - 948.7631 1073.96 - - - 1193.52 - 1058.69 - - 939.72 - 950.62
High 1250.95 1133.66 1180.70 1200.99 1268.98 1203.29 1152.98 1090.66 1025.49 1008.70 1018.59 1043.43
Low 1057.55 1042.16 1079.42 1121.21 1193.52 1099.44 989.11 991.12 920.10 893.96 930.64 948.76
Avg 1128.16 1088.99 1142.67 1157.32 1228.77 1159.22 1092.50 1049.44 973.29 954.78 978.66 997.83
Note : HSMLCI is compiled by HSI Services Ltd.
22 HKEx Fact Book 2002
Cash M
arket - Main Boar d
Market Indices
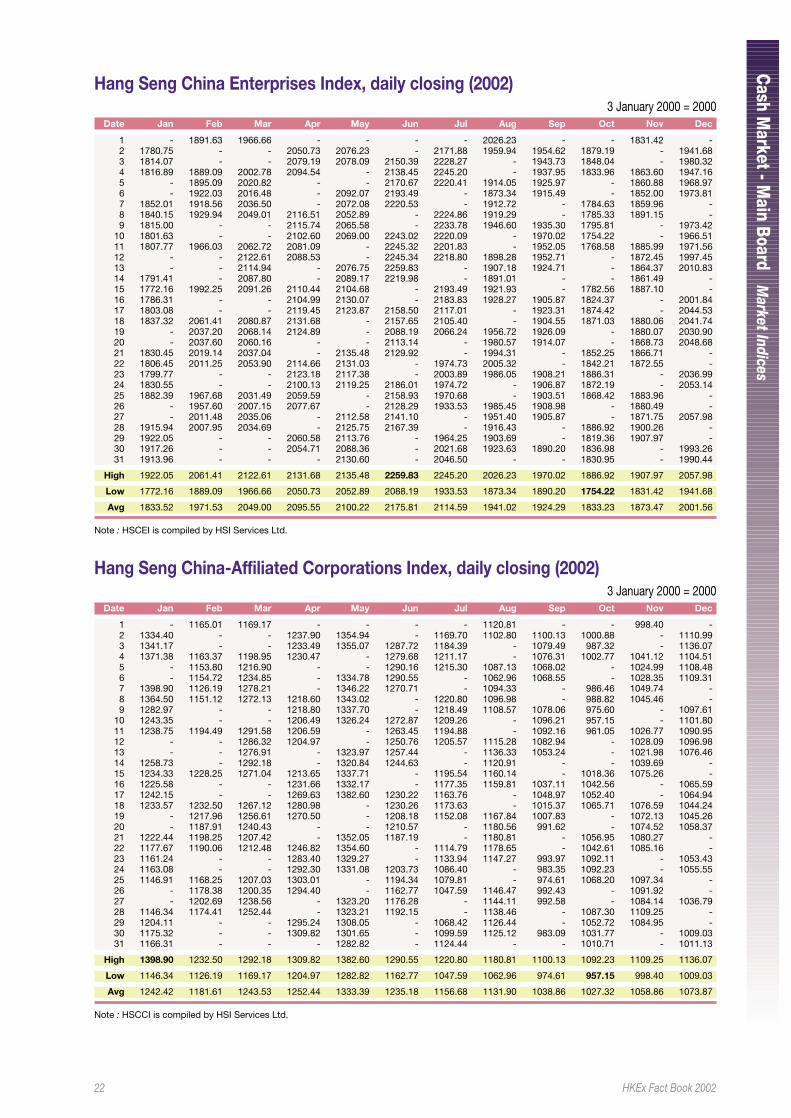
Hang Seng China Enterprises Index, daily closing (2002)3 January 2000 = 2000
Date Jan Feb Mar Apr May Jun Jul Aug Sep Oct Nov Dec
1 - 1891.63 1966.66 - - - - 2026.23 - - 1831.42 -2 1780.75 - - 2050.73 2076.23 - 2171.88 1959.94 1954.62 1879.19 - 1941.683 1814.07 - - 2079.19 2078.09 2150.39 2228.27 - 1943.73 1848.04 - 1980.324 1816.89 1889.09 2002.78 2094.54 - 2138.45 2245.20 - 1937.95 1833.96 1863.60 1947.165 - 1895.09 2020.82 - - 2170.67 2220.41 1914.05 1925.97 - 1860.88 1968.976 - 1922.03 2016.48 - 2092.07 2193.49 - 1873.34 1915.49 - 1852.00 1973.817 1852.01 1918.56 2036.50 - 2072.08 2220.53 - 1912.72 - 1784.63 1859.96 -8 1840.15 1929.94 2049.01 2116.51 2052.89 - 2224.86 1919.29 - 1785.33 1891.15 -9 1815.00 - - 2115.74 2065.58 - 2233.78 1946.60 1935.30 1795.81 - 1973.42
10 1801.63 - - 2102.60 2069.00 2243.02 2220.09 - 1970.02 1754.22 - 1966.5111 1807.77 1966.03 2062.72 2081.09 - 2245.32 2201.83 - 1952.05 1768.58 1885.99 1971.5612 - - 2122.61 2088.53 - 2245.34 2218.80 1898.28 1952.71 - 1872.45 1997.4513 - - 2114.94 - 2076.75 2259.83 - 1907.18 1924.71 - 1864.37 2010.8314 1791.41 - 2087.80 - 2089.17 2219.98 - 1891.01 - - 1861.49 -15 1772.16 1992.25 2091.26 2110.44 2104.68 - 2193.49 1921.93 - 1782.56 1887.10 -16 1786.31 - - 2104.99 2130.07 - 2183.83 1928.27 1905.87 1824.37 - 2001.8417 1803.08 - - 2119.45 2123.87 2158.50 2117.01 - 1923.31 1874.42 - 2044.5318 1837.32 2061.41 2080.87 2131.68 - 2157.65 2105.40 - 1904.55 1871.03 1880.06 2041.7419 - 2037.20 2068.14 2124.89 - 2088.19 2066.24 1956.72 1926.09 - 1880.07 2030.9020 - 2037.60 2060.16 - - 2113.14 - 1980.57 1914.07 - 1868.73 2048.6821 1830.45 2019.14 2037.04 - 2135.48 2129.92 - 1994.31 - 1852.25 1866.71 -22 1806.45 2011.25 2053.90 2114.66 2131.03 - 1974.73 2005.32 - 1842.21 1872.55 -23 1799.77 - - 2123.18 2117.38 - 2003.89 1986.05 1908.21 1886.31 - 2036.9924 1830.55 - - 2100.13 2119.25 2186.01 1974.72 - 1906.87 1872.19 - 2053.1425 1882.39 1967.68 2031.49 2059.59 - 2158.93 1970.68 - 1903.51 1868.42 1883.96 -26 - 1957.60 2007.15 2077.67 - 2128.29 1933.53 1985.45 1908.98 - 1880.49 -27 - 2011.48 2035.06 - 2112.58 2141.10 - 1951.40 1905.87 - 1871.75 2057.9828 1915.94 2007.95 2034.69 - 2125.75 2167.39 - 1916.43 - 1886.92 1900.26 -29 1922.05 - - 2060.58 2113.76 - 1964.25 1903.69 - 1819.36 1907.97 -30 1917.26 - - 2054.71 2088.36 - 2021.68 1923.63 1890.20 1836.98 - 1993.2631 1913.96 - - - 2130.60 - 2046.50 - - 1830.95 - 1990.44
High 1922.05 2061.41 2122.61 2131.68 2135.48 2259.83 2245.20 2026.23 1970.02 1886.92 1907.97 2057.98
Low 1772.16 1889.09 1966.66 2050.73 2052.89 2088.19 1933.53 1873.34 1890.20 1754.22 1831.42 1941.68
Avg 1833.52 1971.53 2049.00 2095.55 2100.22 2175.81 2114.59 1941.02 1924.29 1833.23 1873.47 2001.56
Note : HSCEI is compiled by HSI Services Ltd.
Hang Seng China-Affiliated Corporations Index, daily closing (2002)3 January 2000 = 2000
Date Jan Feb Mar Apr May Jun Jul Aug Sep Oct Nov Dec
1 - 1165.01 1169.17 - - - - 1120.81 - - 998.40 -2 1334.40 - - 1237.90 1354.94 - 1169.70 1102.80 1100.13 1000.88 - 1110.993 1341.17 - - 1233.49 1355.07 1287.72 1184.39 - 1079.49 987.32 - 1136.074 1371.38 1163.37 1198.95 1230.47 - 1279.68 1211.17 - 1076.31 1002.77 1041.12 1104.515 - 1153.80 1216.90 - - 1290.16 1215.30 1087.13 1068.02 - 1024.99 1108.486 - 1154.72 1234.85 - 1334.78 1290.55 - 1062.96 1068.55 - 1028.35 1109.317 1398.90 1126.19 1278.21 - 1346.22 1270.71 - 1094.33 - 986.46 1049.74 -8 1364.50 1151.12 1272.13 1218.60 1343.02 - 1220.80 1096.98 - 988.82 1045.46 -9 1282.97 - - 1218.80 1337.70 - 1218.49 1108.57 1078.06 975.60 - 1097.61
10 1243.35 - - 1206.49 1326.24 1272.87 1209.26 - 1096.21 957.15 - 1101.8011 1238.75 1194.49 1291.58 1206.59 - 1263.45 1194.88 - 1092.16 961.05 1026.77 1090.9512 - - 1286.32 1204.97 - 1250.76 1205.57 1115.28 1082.94 - 1028.09 1096.9813 - - 1276.91 - 1323.97 1257.44 - 1136.33 1053.24 - 1021.98 1076.4614 1258.73 - 1292.18 - 1320.84 1244.63 - 1120.91 - - 1039.69 -15 1234.33 1228.25 1271.04 1213.65 1337.71 - 1195.54 1160.14 - 1018.36 1075.26 -16 1225.58 - - 1231.66 1332.17 - 1177.35 1159.81 1037.11 1042.56 - 1065.5917 1242.15 - - 1269.63 1382.60 1230.22 1163.76 - 1048.97 1052.40 - 1064.9418 1233.57 1232.50 1267.12 1280.98 - 1230.26 1173.63 - 1015.37 1065.71 1076.59 1044.2419 - 1217.96 1256.61 1270.50 - 1208.18 1152.08 1167.84 1007.83 - 1072.13 1045.2620 - 1187.91 1240.43 - - 1210.57 - 1180.56 991.62 - 1074.52 1058.3721 1222.44 1198.25 1207.42 - 1352.05 1187.19 - 1180.81 - 1056.95 1080.27 -22 1177.67 1190.06 1212.48 1246.82 1354.60 - 1114.79 1178.65 - 1042.61 1085.16 -23 1161.24 - - 1283.40 1329.27 - 1133.94 1147.27 993.97 1092.11 - 1053.4324 1163.08 - - 1292.30 1331.08 1203.73 1086.40 - 983.35 1092.23 - 1055.5525 1146.91 1168.25 1207.03 1303.01 - 1194.34 1079.81 - 974.61 1068.20 1097.34 -26 - 1178.38 1200.35 1294.40 - 1162.77 1047.59 1146.47 992.43 - 1091.92 -27 - 1202.69 1238.56 - 1323.20 1176.28 - 1144.11 992.58 - 1084.14 1036.7928 1146.34 1174.41 1252.44 - 1323.21 1192.15 - 1138.46 - 1087.30 1109.25 -29 1204.11 - - 1295.24 1308.05 - 1068.42 1126.44 - 1052.72 1084.95 -30 1175.32 - - 1309.82 1301.65 - 1099.59 1125.12 983.09 1031.77 - 1009.0331 1166.31 - - - 1282.82 - 1124.44 - - 1010.71 - 1011.13
High 1398.90 1232.50 1292.18 1309.82 1382.60 1290.55 1220.80 1180.81 1100.13 1092.23 1109.25 1136.07
Low 1146.34 1126.19 1169.17 1204.97 1282.82 1162.77 1047.59 1062.96 974.61 957.15 998.40 1009.03
Avg 1242.42 1181.61 1243.53 1252.44 1333.39 1235.18 1156.68 1131.90 1038.86 1027.32 1058.86 1073.87
Note : HSCCI is compiled by HSI Services Ltd.
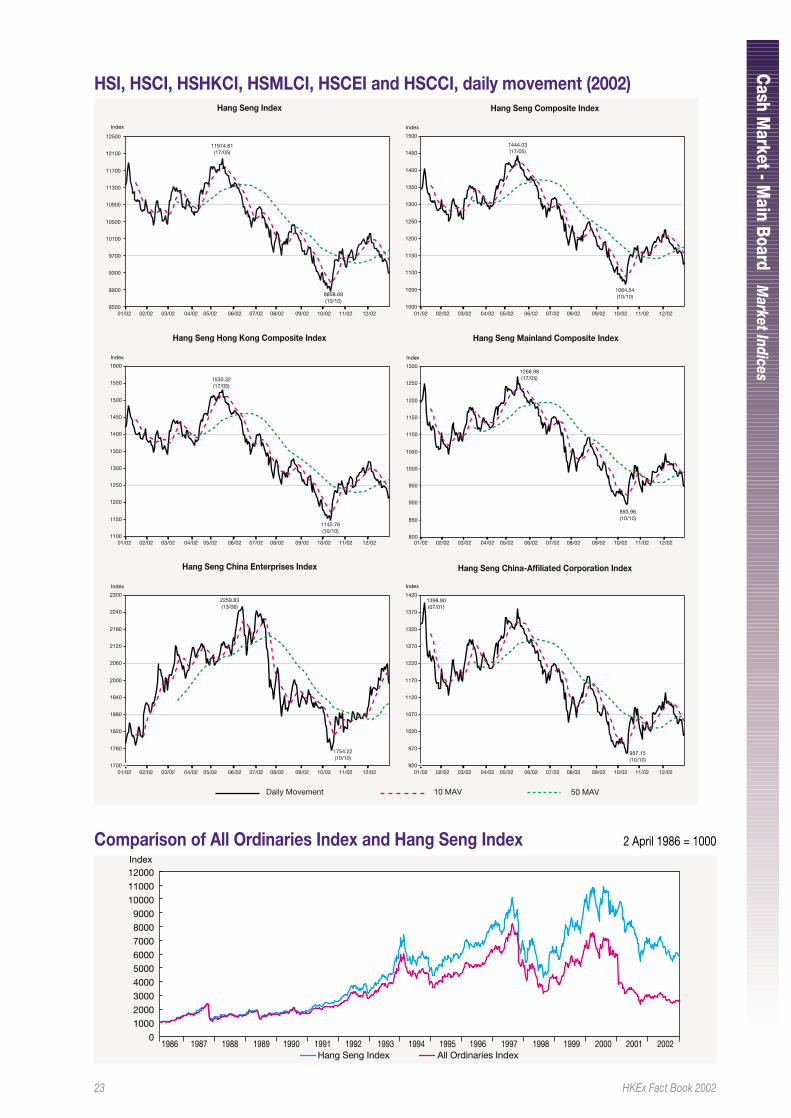
23 HKEx Fact Book 2002
Cash M
arket - Main Boar d
Market Indices
HSI, HSCI, HSHKCI, HSMLCI, HSCEI and HSCCI, daily movement (2002)Hang Seng Composite Index
Hang Seng Hong Kong Composite Index
Hang Seng Index
Hang Seng Mainland Composite Index
Hang Seng China Enterprises Index Hang Seng China-Affiliated Corporation Index
Index
Index
Index
Index
Index
Index
1444.03(17/05)
1064.54(10/10)
1530.32(17/05)
1145.76(10/10)
1268.98(17/05)
893.96(10/10)
2259.83(13/06)
1754.22(10/10)
1398.90(07/01)
957.15(10/10)
920
970
1020
1070
1120
1170
1220
1270
1320
1370
1420
1000
1050
1100
1150
1200
1250
1300
1350
1400
1450
1500
1100
1150
1200
1250
1300
1350
1400
1450
1500
1550
1600
1700
1760
1820
1880
1940
2000
2060
2120
2180
2240
2300
800
850
900
950
1000
1050
1100
1150
1200
1250
1300
10 MAV 50 MAVDaily Movement
8500
8900
9300
9700
10100
10500
10900
11300
11700
12100
12500
11974.61(17/05)
8858.69(10/10)
01/02 02/02 03/02 04/02 05/02 06/02 07/02 08/02 09/02 10/02 11/02 12/02 01/02 02/02 03/02 04/02 05/02 06/02 07/02 08/02 09/02 10/02 11/02 12/02
01/02 02/02 03/02 04/02 05/02 06/02 07/02 08/02 09/02 10/02 11/02 12/02 01/02 02/02 03/02 04/02 05/02 06/02 07/02 08/02 09/02 10/02 11/02 12/02
01/02 02/02 03/02 04/02 05/02 06/02 07/02 08/02 09/02 10/02 11/02 12/02 01/02 02/02 03/02 04/02 05/02 06/02 07/02 08/02 09/02 10/02 11/02 12/02
Comparison of All Ordinaries Index and Hang Seng Index 2 April 1986 = 1000
0
1000
2000
3000
4000
5000
6000
7000
8000
9000
10000
11000
12000
Hang Seng Index All Ordinaries Index
Index
1986 1987 1988 1989 1990 1991 1992 1993 1994 1995 1996 1997 1998 1999 2000 2001 2002
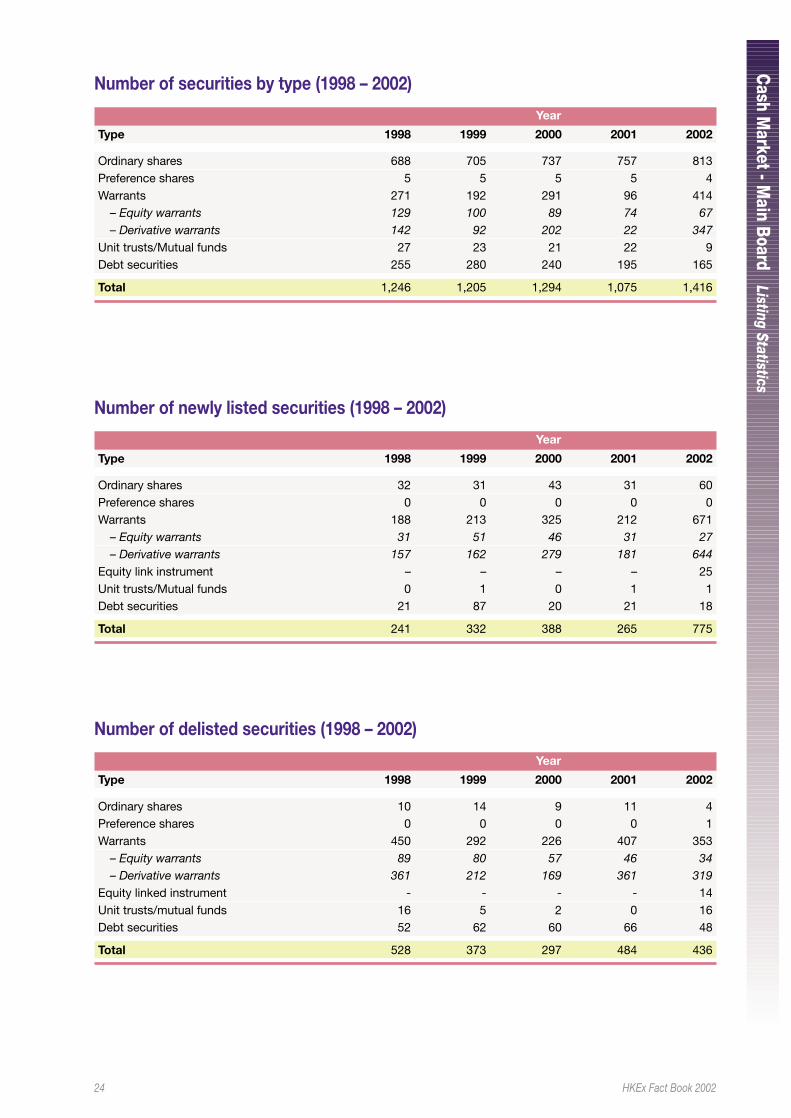
24 HKEx Fact Book 2002
Cash M
arket - Main Boar d
Listing Statistics
Number of securities by type (1998 – 2002)
Year
Type 1998 1999 2000 2001 2002
Ordinary shares 688 705 737 757 813Preference shares 5 5 5 5 4Warrants 271 192 291 96 414
– Equity warrants 129 100 89 74 67– Derivative warrants 142 92 202 22 347
Unit trusts/Mutual funds 27 23 21 22 9Debt securities 255 280 240 195 165
Total 1,246 1,205 1,294 1,075 1,416
Number of newly listed securities (1998 – 2002)
Year
Type 1998 1999 2000 2001 2002
Ordinary shares 32 31 43 31 60Preference shares 0 0 0 0 0Warrants 188 213 325 212 671
– Equity warrants 31 51 46 31 27– Derivative warrants 157 162 279 181 644
Equity link instrument – – – – 25Unit trusts/Mutual funds 0 1 0 1 1Debt securities 21 87 20 21 18
Total 241 332 388 265 775
Number of delisted securities (1998 – 2002)
Year
Type 1998 1999 2000 2001 2002
Ordinary shares 10 14 9 11 4Preference shares 0 0 0 0 1Warrants 450 292 226 407 353
– Equity warrants 89 80 57 46 34– Derivative warrants 361 212 169 361 319
Equity linked instrument - - - - 14Unit trusts/mutual funds 16 5 2 0 16Debt securities 52 62 60 66 48
Total 528 373 297 484 436
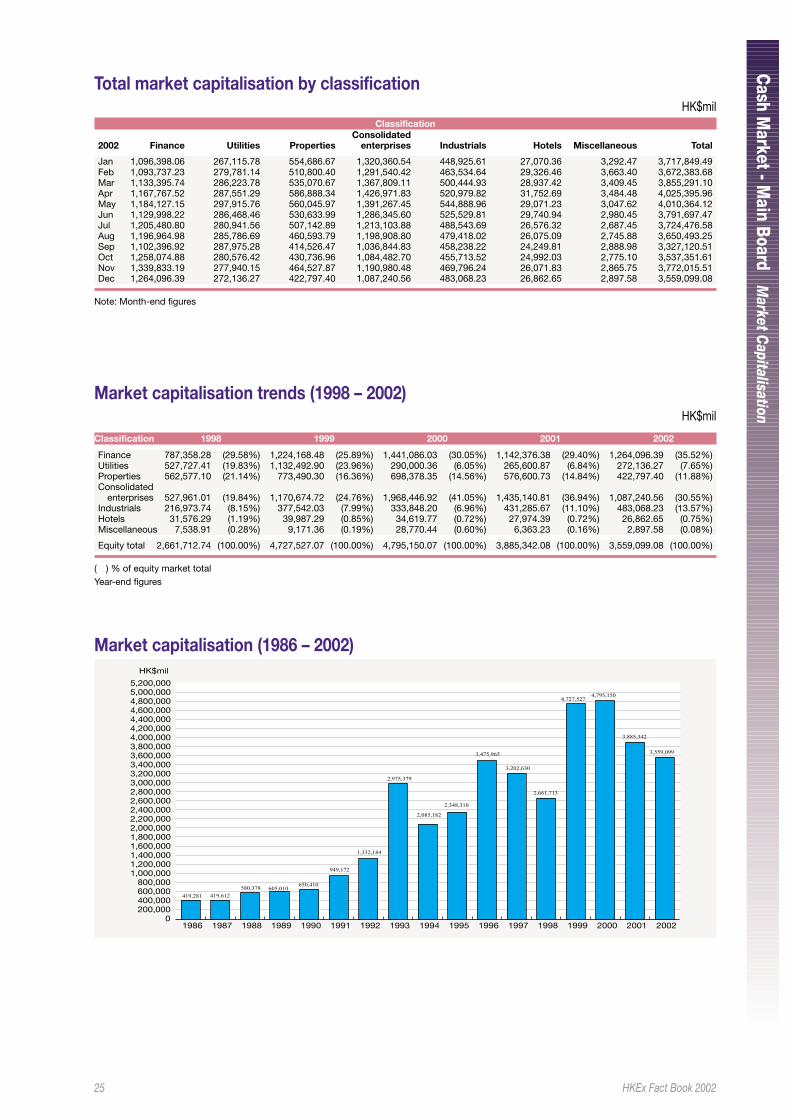
25 HKEx Fact Book 2002
Cash M
arket - Main Boar d
Market C
apitalisation
Market capitalisation (1986 – 2002)
0200,000400,000600,000800,000
1,000,0001,200,0001,400,0001,600,0001,800,0002,000,0002,200,0002,400,0002,600,0002,800,0003,000,0003,200,0003,400,0003,600,0003,800,0004,000,0004,200,0004,400,0004,600,0004,800,0005,000,0005,200,000
HK$mil
3,559,099
3,885,342
3,202,630
4,795,150
2,085,182
1,332,184
949,172
650,410605,010580,378
419,612419,281
3,475,965
4,727,527
2,661,713
2,975,379
2,348,310
1986 1987 1988 1989 1990 1991 1992 1993 1994 1995 1996 1997 1998 1999 2000 2001 2002
Total market capitalisation by classificationHK$mil
ClassificationConsolidated
2002 Finance Utilities Properties enterprises Industrials Hotels Miscellaneous Total
Jan 1,096,398.06 267,115.78 554,686.67 1,320,360.54 448,925.61 27,070.36 3,292.47 3,717,849.49Feb 1,093,737.23 279,781.14 510,800.40 1,291,540.42 463,534.64 29,326.46 3,663.40 3,672,383.68Mar 1,133,395.74 286,223.78 535,070.67 1,367,809.11 500,444.93 28,937.42 3,409.45 3,855,291.10Apr 1,167,767.52 287,551.29 586,888.34 1,426,971.83 520,979.82 31,752.69 3,484.48 4,025,395.96May 1,184,127.15 297,915.76 560,045.97 1,391,267.45 544,888.96 29,071.23 3,047.62 4,010,364.12Jun 1,129,998.22 286,468.46 530,633.99 1,286,345.60 525,529.81 29,740.94 2,980.45 3,791,697.47Jul 1,205,480.80 280,941.56 507,142.89 1,213,103.88 488,543.69 26,576.32 2,687.45 3,724,476.58Aug 1,196,964.98 285,786.69 460,593.79 1,198,908.80 479,418.02 26,075.09 2,745.88 3,650,493.25Sep 1,102,396.92 287,975.28 414,526.47 1,036,844.83 458,238.22 24,249.81 2,888.98 3,327,120.51Oct 1,258,074.88 280,576.42 430,736.96 1,084,482.70 455,713.52 24,992.03 2,775.10 3,537,351.61Nov 1,339,833.19 277,940.15 464,527.87 1,190,980.48 469,796.24 26,071.83 2,865.75 3,772,015.51Dec 1,264,096.39 272,136.27 422,797.40 1,087,240.56 483,068.23 26,862.65 2,897.58 3,559,099.08
Note: Month-end figures
Market capitalisation trends (1998 – 2002)HK$mil
Classification 1998 1999 2000 2001 2002
Finance 787,358.28 (29.58%) 1,224,168.48 (25.89%) 1,441,086.03 (30.05%) 1,142,376.38 (29.40%) 1,264,096.39 (35.52%)Utilities 527,727.41 (19.83%) 1,132,492.90 (23.96%) 290,000.36 (6.05%) 265,600.87 (6.84%) 272,136.27 (7.65%)Properties 562,577.10 (21.14%) 773,490.30 (16.36%) 698,378.35 (14.56%) 576,600.73 (14.84%) 422,797.40 (11.88%)Consolidated
enterprises 527,961.01 (19.84%) 1,170,674.72 (24.76%) 1,968,446.92 (41.05%) 1,435,140.81 (36.94%) 1,087,240.56 (30.55%)Industrials 216,973.74 (8.15%) 377,542.03 (7.99%) 333,848.20 (6.96%) 431,285.67 (11.10%) 483,068.23 (13.57%)Hotels 31,576.29 (1.19%) 39,987.29 (0.85%) 34,619.77 (0.72%) 27,974.39 (0.72%) 26,862.65 (0.75%)Miscellaneous 7,538.91 (0.28%) 9,171.36 (0.19%) 28,770.44 (0.60%) 6,363.23 (0.16%) 2,897.58 (0.08%)
Equity total 2,661,712.74 (100.00%) 4,727,527.07 (100.00%) 4,795,150.07 (100.00%) 3,885,342.08 (100.00%) 3,559,099.08 (100.00%)
( ) % of equity market totalYear-end figures
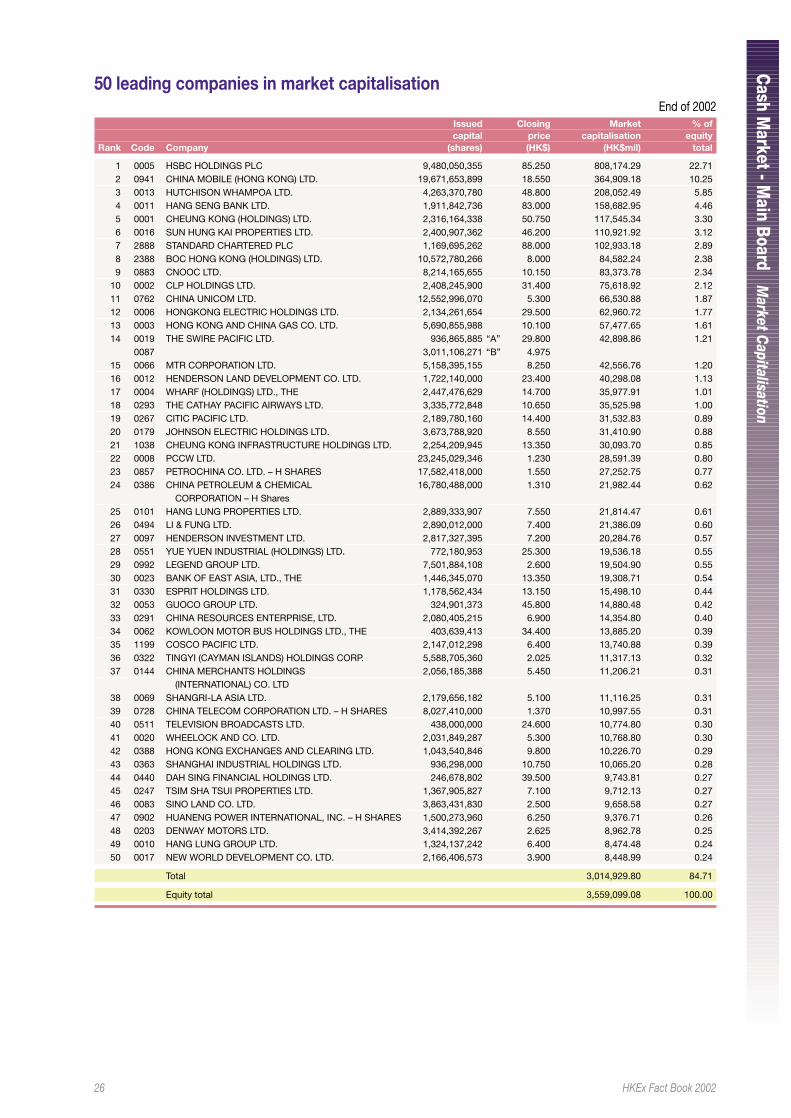
26 HKEx Fact Book 2002
Cash M
arket - Main Boar d
Market C
apitalisation
50 leading companies in market capitalisationEnd of 2002
Issued Closing Market % ofcapital price capitalisation equity
Rank Code Company (shares) (HK$) (HK$mil) total
1 0005 HSBC HOLDINGS PLC 9,480,050,355 85.250 808,174.29 22.712 0941 CHINA MOBILE (HONG KONG) LTD. 19,671,653,899 18.550 364,909.18 10.253 0013 HUTCHISON WHAMPOA LTD. 4,263,370,780 48.800 208,052.49 5.854 0011 HANG SENG BANK LTD. 1,911,842,736 83.000 158,682.95 4.465 0001 CHEUNG KONG (HOLDINGS) LTD. 2,316,164,338 50.750 117,545.34 3.306 0016 SUN HUNG KAI PROPERTIES LTD. 2,400,907,362 46.200 110,921.92 3.127 2888 STANDARD CHARTERED PLC 1,169,695,262 88.000 102,933.18 2.898 2388 BOC HONG KONG (HOLDINGS) LTD. 10,572,780,266 8.000 84,582.24 2.389 0883 CNOOC LTD. 8,214,165,655 10.150 83,373.78 2.34
10 0002 CLP HOLDINGS LTD. 2,408,245,900 31.400 75,618.92 2.1211 0762 CHINA UNICOM LTD. 12,552,996,070 5.300 66,530.88 1.8712 0006 HONGKONG ELECTRIC HOLDINGS LTD. 2,134,261,654 29.500 62,960.72 1.7713 0003 HONG KONG AND CHINA GAS CO. LTD. 5,690,855,988 10.100 57,477.65 1.6114 0019 THE SWIRE PACIFIC LTD. 936,865,885 “A” 29.800 42,898.86 1.21
0087 3,011,106,271 “B” 4.97515 0066 MTR CORPORATION LTD. 5,158,395,155 8.250 42,556.76 1.2016 0012 HENDERSON LAND DEVELOPMENT CO. LTD. 1,722,140,000 23.400 40,298.08 1.1317 0004 WHARF (HOLDINGS) LTD., THE 2,447,476,629 14.700 35,977.91 1.0118 0293 THE CATHAY PACIFIC AIRWAYS LTD. 3,335,772,848 10.650 35,525.98 1.0019 0267 CITIC PACIFIC LTD. 2,189,780,160 14.400 31,532.83 0.8920 0179 JOHNSON ELECTRIC HOLDINGS LTD. 3,673,788,920 8.550 31,410.90 0.8821 1038 CHEUNG KONG INFRASTRUCTURE HOLDINGS LTD. 2,254,209,945 13.350 30,093.70 0.8522 0008 PCCW LTD. 23,245,029,346 1.230 28,591.39 0.8023 0857 PETROCHINA CO. LTD. – H SHARES 17,582,418,000 1.550 27,252.75 0.7724 0386 CHINA PETROLEUM & CHEMICAL 16,780,488,000 1.310 21,982.44 0.62
CORPORATION – H Shares25 0101 HANG LUNG PROPERTIES LTD. 2,889,333,907 7.550 21,814.47 0.6126 0494 LI & FUNG LTD. 2,890,012,000 7.400 21,386.09 0.6027 0097 HENDERSON INVESTMENT LTD. 2,817,327,395 7.200 20,284.76 0.5728 0551 YUE YUEN INDUSTRIAL (HOLDINGS) LTD. 772,180,953 25.300 19,536.18 0.5529 0992 LEGEND GROUP LTD. 7,501,884,108 2.600 19,504.90 0.5530 0023 BANK OF EAST ASIA, LTD., THE 1,446,345,070 13.350 19,308.71 0.5431 0330 ESPRIT HOLDINGS LTD. 1,178,562,434 13.150 15,498.10 0.4432 0053 GUOCO GROUP LTD. 324,901,373 45.800 14,880.48 0.4233 0291 CHINA RESOURCES ENTERPRISE, LTD. 2,080,405,215 6.900 14,354.80 0.4034 0062 KOWLOON MOTOR BUS HOLDINGS LTD., THE 403,639,413 34.400 13,885.20 0.3935 1199 COSCO PACIFIC LTD. 2,147,012,298 6.400 13,740.88 0.3936 0322 TINGYI (CAYMAN ISLANDS) HOLDINGS CORP. 5,588,705,360 2.025 11,317.13 0.3237 0144 CHINA MERCHANTS HOLDINGS 2,056,185,388 5.450 11,206.21 0.31
(INTERNATIONAL) CO. LTD38 0069 SHANGRI-LA ASIA LTD. 2,179,656,182 5.100 11,116.25 0.3139 0728 CHINA TELECOM CORPORATION LTD. – H SHARES 8,027,410,000 1.370 10,997.55 0.3140 0511 TELEVISION BROADCASTS LTD. 438,000,000 24.600 10,774.80 0.3041 0020 WHEELOCK AND CO. LTD. 2,031,849,287 5.300 10,768.80 0.3042 0388 HONG KONG EXCHANGES AND CLEARING LTD. 1,043,540,846 9.800 10,226.70 0.2943 0363 SHANGHAI INDUSTRIAL HOLDINGS LTD. 936,298,000 10.750 10,065.20 0.2844 0440 DAH SING FINANCIAL HOLDINGS LTD. 246,678,802 39.500 9,743.81 0.2745 0247 TSIM SHA TSUI PROPERTIES LTD. 1,367,905,827 7.100 9,712.13 0.2746 0083 SINO LAND CO. LTD. 3,863,431,830 2.500 9,658.58 0.2747 0902 HUANENG POWER INTERNATIONAL, INC. – H SHARES 1,500,273,960 6.250 9,376.71 0.2648 0203 DENWAY MOTORS LTD. 3,414,392,267 2.625 8,962.78 0.2549 0010 HANG LUNG GROUP LTD. 1,324,137,242 6.400 8,474.48 0.2450 0017 NEW WORLD DEVELOPMENT CO. LTD. 2,166,406,573 3.900 8,448.99 0.24
Total 3,014,929.80 84.71
Equity total 3,559,099.08 100.00
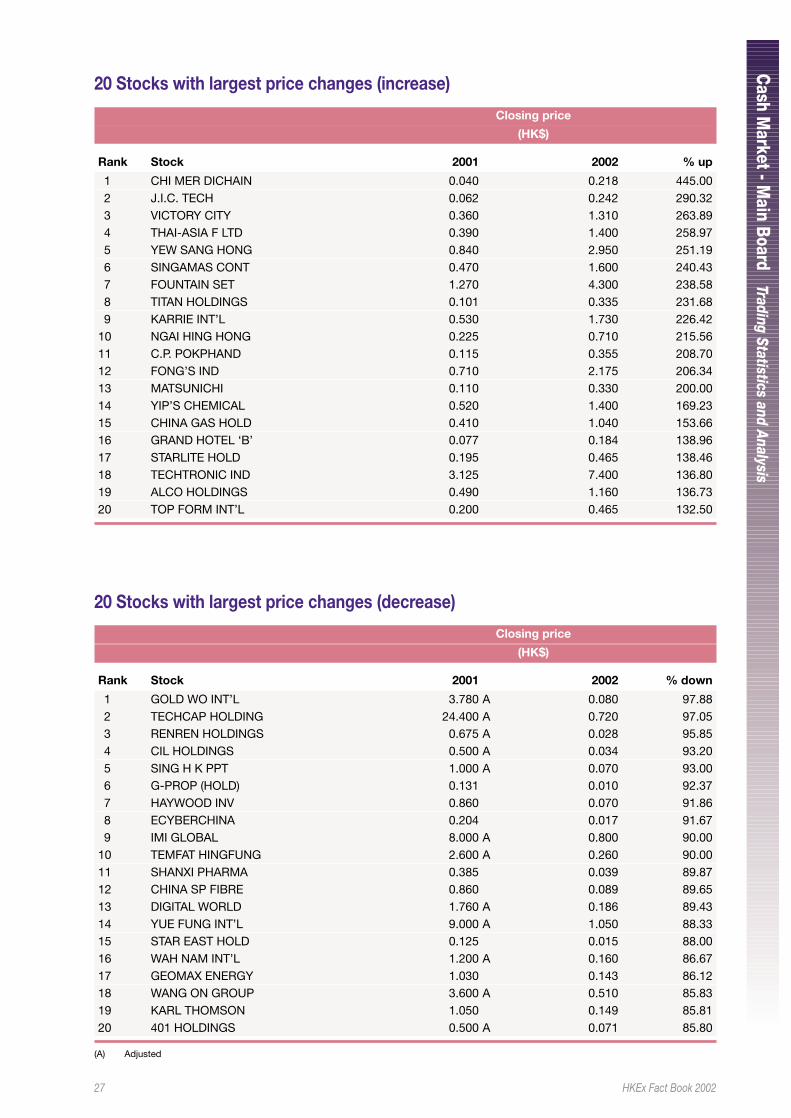
27 HKEx Fact Book 2002
Cash M
arket - Main Boar d
Trading Statistics and Analysis
20 Stocks with largest price changes (increase)
Closing price
(HK$)
Rank Stock 2001 2002 % up
1 CHI MER DICHAIN 0.040 0.218 445.002 J.I.C. TECH 0.062 0.242 290.323 VICTORY CITY 0.360 1.310 263.894 THAI-ASIA F LTD 0.390 1.400 258.975 YEW SANG HONG 0.840 2.950 251.196 SINGAMAS CONT 0.470 1.600 240.437 FOUNTAIN SET 1.270 4.300 238.588 TITAN HOLDINGS 0.101 0.335 231.689 KARRIE INT’L 0.530 1.730 226.42
10 NGAI HING HONG 0.225 0.710 215.5611 C.P. POKPHAND 0.115 0.355 208.7012 FONG’S IND 0.710 2.175 206.3413 MATSUNICHI 0.110 0.330 200.0014 YIP’S CHEMICAL 0.520 1.400 169.2315 CHINA GAS HOLD 0.410 1.040 153.6616 GRAND HOTEL ‘B’ 0.077 0.184 138.9617 STARLITE HOLD 0.195 0.465 138.4618 TECHTRONIC IND 3.125 7.400 136.8019 ALCO HOLDINGS 0.490 1.160 136.7320 TOP FORM INT’L 0.200 0.465 132.50
20 Stocks with largest price changes (decrease)
Closing price
(HK$)
Rank Stock 2001 2002 % down
1 GOLD WO INT’L 3.780 A 0.080 97.882 TECHCAP HOLDING 24.400 A 0.720 97.053 RENREN HOLDINGS 0.675 A 0.028 95.854 CIL HOLDINGS 0.500 A 0.034 93.205 SING H K PPT 1.000 A 0.070 93.006 G-PROP (HOLD) 0.131 0.010 92.377 HAYWOOD INV 0.860 0.070 91.868 ECYBERCHINA 0.204 0.017 91.679 IMI GLOBAL 8.000 A 0.800 90.00
10 TEMFAT HINGFUNG 2.600 A 0.260 90.0011 SHANXI PHARMA 0.385 0.039 89.8712 CHINA SP FIBRE 0.860 0.089 89.6513 DIGITAL WORLD 1.760 A 0.186 89.4314 YUE FUNG INT’L 9.000 A 1.050 88.3315 STAR EAST HOLD 0.125 0.015 88.0016 WAH NAM INT’L 1.200 A 0.160 86.6717 GEOMAX ENERGY 1.030 0.143 86.1218 WANG ON GROUP 3.600 A 0.510 85.8319 KARL THOMSON 1.050 0.149 85.8120 401 HOLDINGS 0.500 A 0.071 85.80
(A) Adjusted
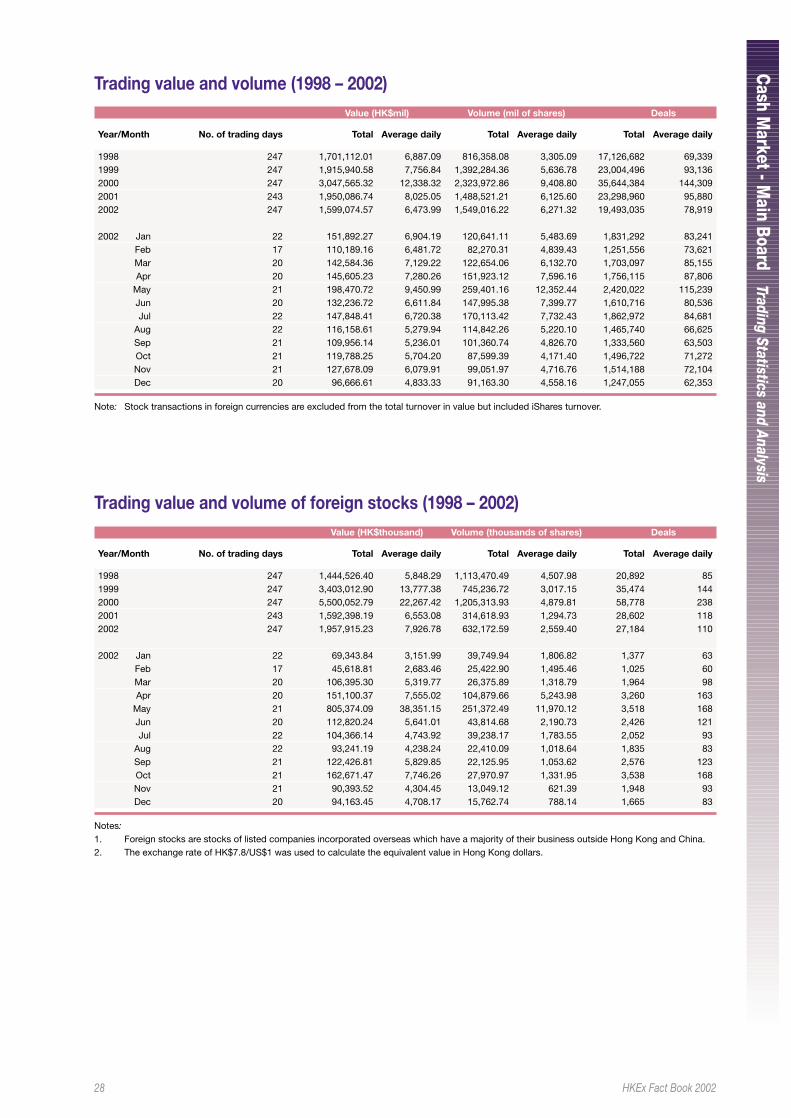
28 HKEx Fact Book 2002
Cash M
arket - Main Boar d
Trading Statistics and Analysis
Trading value and volume (1998 – 2002)Value (HK$mil) Volume (mil of shares) Deals
Year/Month No. of trading days Total Average daily Total Average daily Total Average daily
1998 247 1,701,112.01 6,887.09 816,358.08 3,305.09 17,126,682 69,3391999 247 1,915,940.58 7,756.84 1,392,284.36 5,636.78 23,004,496 93,1362000 247 3,047,565.32 12,338.32 2,323,972.86 9,408.80 35,644,384 144,3092001 243 1,950,086.74 8,025.05 1,488,521.21 6,125.60 23,298,960 95,8802002 247 1,599,074.57 6,473.99 1,549,016.22 6,271.32 19,493,035 78,919
2002 Jan 22 151,892.27 6,904.19 120,641.11 5,483.69 1,831,292 83,241Feb 17 110,189.16 6,481.72 82,270.31 4,839.43 1,251,556 73,621Mar 20 142,584.36 7,129.22 122,654.06 6,132.70 1,703,097 85,155Apr 20 145,605.23 7,280.26 151,923.12 7,596.16 1,756,115 87,806
May 21 198,470.72 9,450.99 259,401.16 12,352.44 2,420,022 115,239Jun 20 132,236.72 6,611.84 147,995.38 7,399.77 1,610,716 80,536Jul 22 147,848.41 6,720.38 170,113.42 7,732.43 1,862,972 84,681
Aug 22 116,158.61 5,279.94 114,842.26 5,220.10 1,465,740 66,625Sep 21 109,956.14 5,236.01 101,360.74 4,826.70 1,333,560 63,503Oct 21 119,788.25 5,704.20 87,599.39 4,171.40 1,496,722 71,272Nov 21 127,678.09 6,079.91 99,051.97 4,716.76 1,514,188 72,104Dec 20 96,666.61 4,833.33 91,163.30 4,558.16 1,247,055 62,353
Note: Stock transactions in foreign currencies are excluded from the total turnover in value but included iShares turnover.
Trading value and volume of foreign stocks (1998 – 2002)Value (HK$thousand) Volume (thousands of shares) Deals
Year/Month No. of trading days Total Average daily Total Average daily Total Average daily
1998 247 1,444,526.40 5,848.29 1,113,470.49 4,507.98 20,892 851999 247 3,403,012.90 13,777.38 745,236.72 3,017.15 35,474 1442000 247 5,500,052.79 22,267.42 1,205,313.93 4,879.81 58,778 2382001 243 1,592,398.19 6,553.08 314,618.93 1,294.73 28,602 1182002 247 1,957,915.23 7,926.78 632,172.59 2,559.40 27,184 110
2002 Jan 22 69,343.84 3,151.99 39,749.94 1,806.82 1,377 63Feb 17 45,618.81 2,683.46 25,422.90 1,495.46 1,025 60Mar 20 106,395.30 5,319.77 26,375.89 1,318.79 1,964 98Apr 20 151,100.37 7,555.02 104,879.66 5,243.98 3,260 163
May 21 805,374.09 38,351.15 251,372.49 11,970.12 3,518 168Jun 20 112,820.24 5,641.01 43,814.68 2,190.73 2,426 121Jul 22 104,366.14 4,743.92 39,238.17 1,783.55 2,052 93
Aug 22 93,241.19 4,238.24 22,410.09 1,018.64 1,835 83Sep 21 122,426.81 5,829.85 22,125.95 1,053.62 2,576 123Oct 21 162,671.47 7,746.26 27,970.97 1,331.95 3,538 168Nov 21 90,393.52 4,304.45 13,049.12 621.39 1,948 93Dec 20 94,163.45 4,708.17 15,762.74 788.14 1,665 83
Notes:1. Foreign stocks are stocks of listed companies incorporated overseas which have a majority of their business outside Hong Kong and China.2. The exchange rate of HK$7.8/US$1 was used to calculate the equivalent value in Hong Kong dollars.
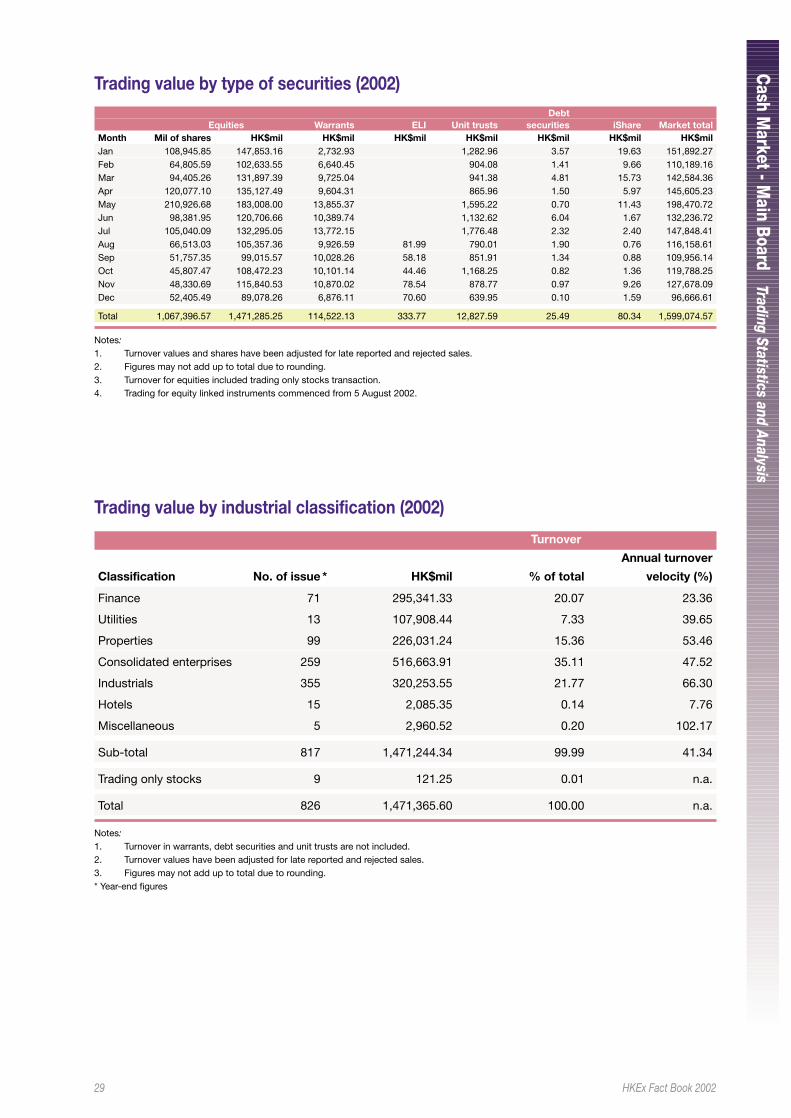
29 HKEx Fact Book 2002
Cash M
arket - Main Boar d
Trading Statistics and Analysis
Trading value by type of securities (2002)Debt
Equities Warrants ELI Unit trusts securities iShare Market totalMonth Mil of shares HK$mil HK$mil HK$mil HK$mil HK$mil HK$mil HK$milJan 108,945.85 147,853.16 2,732.93 1,282.96 3.57 19.63 151,892.27Feb 64,805.59 102,633.55 6,640.45 904.08 1.41 9.66 110,189.16Mar 94,405.26 131,897.39 9,725.04 941.38 4.81 15.73 142,584.36Apr 120,077.10 135,127.49 9,604.31 865.96 1.50 5.97 145,605.23May 210,926.68 183,008.00 13,855.37 1,595.22 0.70 11.43 198,470.72Jun 98,381.95 120,706.66 10,389.74 1,132.62 6.04 1.67 132,236.72Jul 105,040.09 132,295.05 13,772.15 1,776.48 2.32 2.40 147,848.41Aug 66,513.03 105,357.36 9,926.59 81.99 790.01 1.90 0.76 116,158.61Sep 51,757.35 99,015.57 10,028.26 58.18 851.91 1.34 0.88 109,956.14Oct 45,807.47 108,472.23 10,101.14 44.46 1,168.25 0.82 1.36 119,788.25Nov 48,330.69 115,840.53 10,870.02 78.54 878.77 0.97 9.26 127,678.09Dec 52,405.49 89,078.26 6,876.11 70.60 639.95 0.10 1.59 96,666.61
Total 1,067,396.57 1,471,285.25 114,522.13 333.77 12,827.59 25.49 80.34 1,599,074.57
Notes:1. Turnover values and shares have been adjusted for late reported and rejected sales.2. Figures may not add up to total due to rounding.3. Turnover for equities included trading only stocks transaction.4. Trading for equity linked instruments commenced from 5 August 2002.
Trading value by industrial classification (2002)
Turnover
Annual turnover
Classification No. of issue * HK$mil % of total velocity (%)
Finance 71 295,341.33 20.07 23.36
Utilities 13 107,908.44 7.33 39.65
Properties 99 226,031.24 15.36 53.46
Consolidated enterprises 259 516,663.91 35.11 47.52
Industrials 355 320,253.55 21.77 66.30
Hotels 15 2,085.35 0.14 7.76
Miscellaneous 5 2,960.52 0.20 102.17
Sub-total 817 1,471,244.34 99.99 41.34
Trading only stocks 9 121.25 0.01 n.a.
Total 826 1,471,365.60 100.00 n.a.
Notes:1. Turnover in warrants, debt securities and unit trusts are not included.2. Turnover values have been adjusted for late reported and rejected sales.3. Figures may not add up to total due to rounding.* Year-end figures
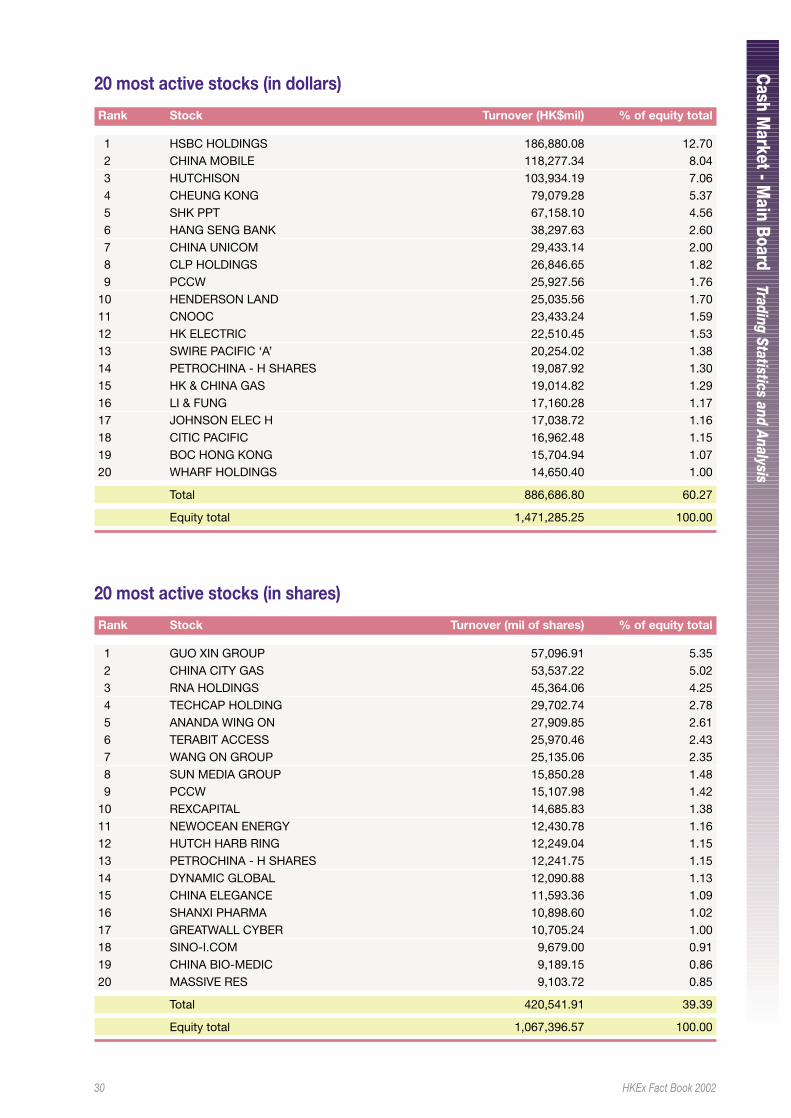
30 HKEx Fact Book 2002
Cash M
arket - Main Boar d
Trading Statistics and Analysis
20 most active stocks (in dollars)
Rank Stock Turnover (HK$mil) % of equity total
1 HSBC HOLDINGS 186,880.08 12.702 CHINA MOBILE 118,277.34 8.043 HUTCHISON 103,934.19 7.064 CHEUNG KONG 79,079.28 5.375 SHK PPT 67,158.10 4.566 HANG SENG BANK 38,297.63 2.607 CHINA UNICOM 29,433.14 2.008 CLP HOLDINGS 26,846.65 1.829 PCCW 25,927.56 1.76
10 HENDERSON LAND 25,035.56 1.7011 CNOOC 23,433.24 1.5912 HK ELECTRIC 22,510.45 1.5313 SWIRE PACIFIC ‘A’ 20,254.02 1.3814 PETROCHINA - H SHARES 19,087.92 1.3015 HK & CHINA GAS 19,014.82 1.2916 LI & FUNG 17,160.28 1.1717 JOHNSON ELEC H 17,038.72 1.1618 CITIC PACIFIC 16,962.48 1.1519 BOC HONG KONG 15,704.94 1.0720 WHARF HOLDINGS 14,650.40 1.00
Total 886,686.80 60.27
Equity total 1,471,285.25 100.00
20 most active stocks (in shares)
Rank Stock Turnover (mil of shares) % of equity total
1 GUO XIN GROUP 57,096.91 5.352 CHINA CITY GAS 53,537.22 5.023 RNA HOLDINGS 45,364.06 4.254 TECHCAP HOLDING 29,702.74 2.785 ANANDA WING ON 27,909.85 2.616 TERABIT ACCESS 25,970.46 2.437 WANG ON GROUP 25,135.06 2.358 SUN MEDIA GROUP 15,850.28 1.489 PCCW 15,107.98 1.42
10 REXCAPITAL 14,685.83 1.3811 NEWOCEAN ENERGY 12,430.78 1.1612 HUTCH HARB RING 12,249.04 1.1513 PETROCHINA - H SHARES 12,241.75 1.1514 DYNAMIC GLOBAL 12,090.88 1.1315 CHINA ELEGANCE 11,593.36 1.0916 SHANXI PHARMA 10,898.60 1.0217 GREATWALL CYBER 10,705.24 1.0018 SINO-I.COM 9,679.00 0.9119 CHINA BIO-MEDIC 9,189.15 0.8620 MASSIVE RES 9,103.72 0.85
Total 420,541.91 39.39
Equity total 1,067,396.57 100.00
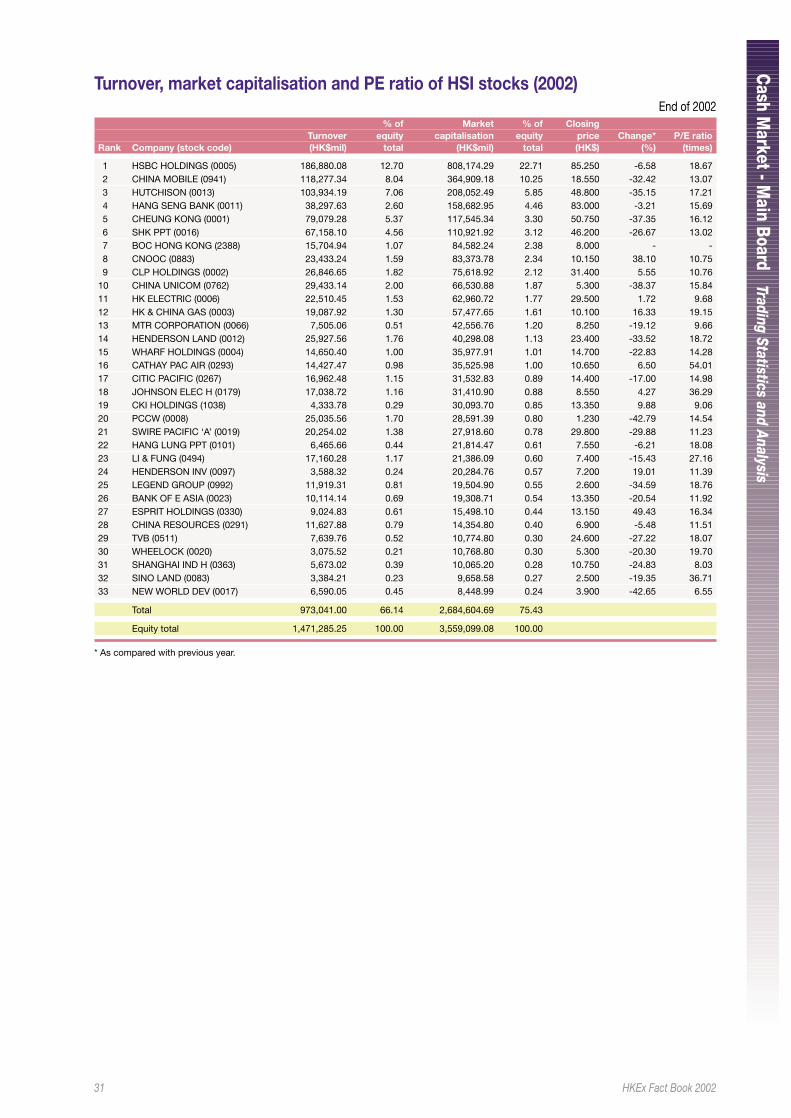
31 HKEx Fact Book 2002
Cash M
arket - Main Boar d
Trading Statistics and Analysis
Turnover, market capitalisation and PE ratio of HSI stocks (2002)End of 2002
% of Market % of ClosingTurnover equity capitalisation equity price Change* P/E ratio
Rank Company (stock code) (HK$mil) total (HK$mil) total (HK$) (%) (times)
1 HSBC HOLDINGS (0005) 186,880.08 12.70 808,174.29 22.71 85.250 -6.58 18.672 CHINA MOBILE (0941) 118,277.34 8.04 364,909.18 10.25 18.550 -32.42 13.073 HUTCHISON (0013) 103,934.19 7.06 208,052.49 5.85 48.800 -35.15 17.214 HANG SENG BANK (0011) 38,297.63 2.60 158,682.95 4.46 83.000 -3.21 15.695 CHEUNG KONG (0001) 79,079.28 5.37 117,545.34 3.30 50.750 -37.35 16.126 SHK PPT (0016) 67,158.10 4.56 110,921.92 3.12 46.200 -26.67 13.027 BOC HONG KONG (2388) 15,704.94 1.07 84,582.24 2.38 8.000 - -8 CNOOC (0883) 23,433.24 1.59 83,373.78 2.34 10.150 38.10 10.759 CLP HOLDINGS (0002) 26,846.65 1.82 75,618.92 2.12 31.400 5.55 10.76
10 CHINA UNICOM (0762) 29,433.14 2.00 66,530.88 1.87 5.300 -38.37 15.8411 HK ELECTRIC (0006) 22,510.45 1.53 62,960.72 1.77 29.500 1.72 9.6812 HK & CHINA GAS (0003) 19,087.92 1.30 57,477.65 1.61 10.100 16.33 19.1513 MTR CORPORATION (0066) 7,505.06 0.51 42,556.76 1.20 8.250 -19.12 9.6614 HENDERSON LAND (0012) 25,927.56 1.76 40,298.08 1.13 23.400 -33.52 18.7215 WHARF HOLDINGS (0004) 14,650.40 1.00 35,977.91 1.01 14.700 -22.83 14.2816 CATHAY PAC AIR (0293) 14,427.47 0.98 35,525.98 1.00 10.650 6.50 54.0117 CITIC PACIFIC (0267) 16,962.48 1.15 31,532.83 0.89 14.400 -17.00 14.9818 JOHNSON ELEC H (0179) 17,038.72 1.16 31,410.90 0.88 8.550 4.27 36.2919 CKI HOLDINGS (1038) 4,333.78 0.29 30,093.70 0.85 13.350 9.88 9.0620 PCCW (0008) 25,035.56 1.70 28,591.39 0.80 1.230 -42.79 14.5421 SWIRE PACIFIC ‘A’ (0019) 20,254.02 1.38 27,918.60 0.78 29.800 -29.88 11.2322 HANG LUNG PPT (0101) 6,465.66 0.44 21,814.47 0.61 7.550 -6.21 18.0823 LI & FUNG (0494) 17,160.28 1.17 21,386.09 0.60 7.400 -15.43 27.1624 HENDERSON INV (0097) 3,588.32 0.24 20,284.76 0.57 7.200 19.01 11.3925 LEGEND GROUP (0992) 11,919.31 0.81 19,504.90 0.55 2.600 -34.59 18.7626 BANK OF E ASIA (0023) 10,114.14 0.69 19,308.71 0.54 13.350 -20.54 11.9227 ESPRIT HOLDINGS (0330) 9,024.83 0.61 15,498.10 0.44 13.150 49.43 16.3428 CHINA RESOURCES (0291) 11,627.88 0.79 14,354.80 0.40 6.900 -5.48 11.5129 TVB (0511) 7,639.76 0.52 10,774.80 0.30 24.600 -27.22 18.0730 WHEELOCK (0020) 3,075.52 0.21 10,768.80 0.30 5.300 -20.30 19.7031 SHANGHAI IND H (0363) 5,673.02 0.39 10,065.20 0.28 10.750 -24.83 8.0332 SINO LAND (0083) 3,384.21 0.23 9,658.58 0.27 2.500 -19.35 36.7133 NEW WORLD DEV (0017) 6,590.05 0.45 8,448.99 0.24 3.900 -42.65 6.55
Total 973,041.00 66.14 2,684,604.69 75.43
Equity total 1,471,285.25 100.00 3,559,099.08 100.00
* As compared with previous year.
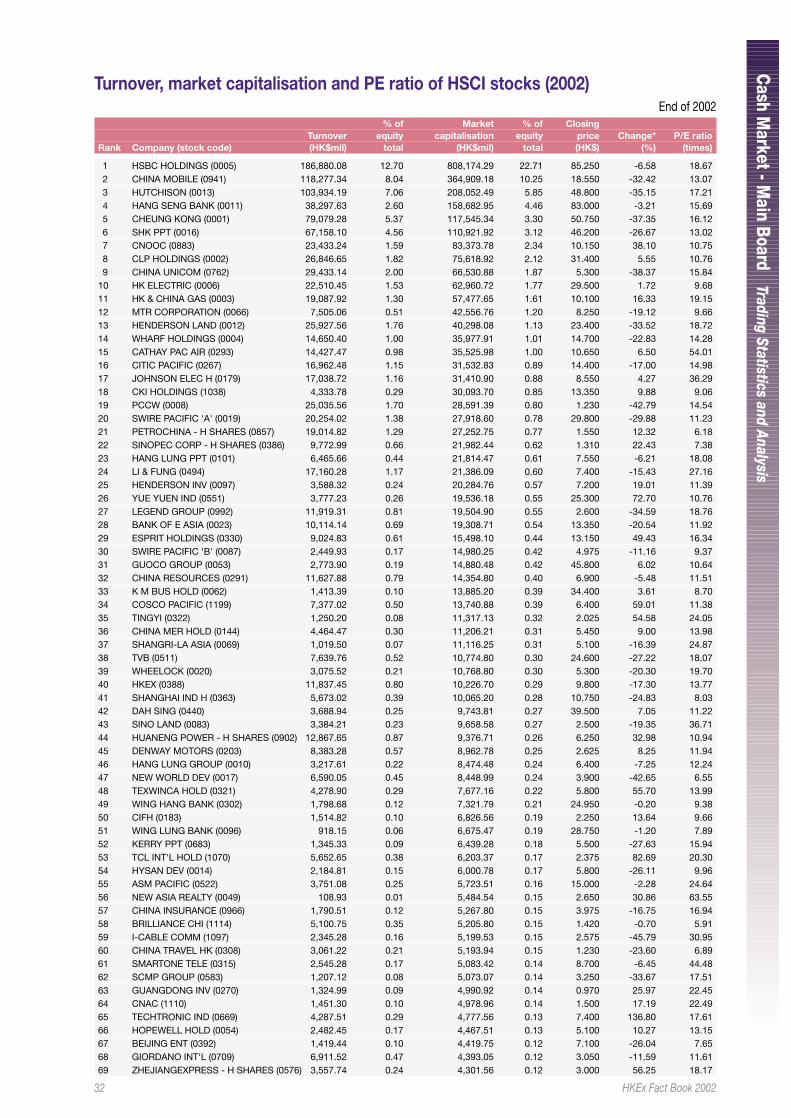
32 HKEx Fact Book 2002
Cash M
arket - Main Boar d
Trading Statistics and Analysis
Turnover, market capitalisation and PE ratio of HSCI stocks (2002)End of 2002
% of Market % of ClosingTurnover equity capitalisation equity price Change* P/E ratio
Rank Company (stock code) (HK$mil) total (HK$mil) total (HK$) (%) (times)
1 HSBC HOLDINGS (0005) 186,880.08 12.70 808,174.29 22.71 85.250 -6.58 18.672 CHINA MOBILE (0941) 118,277.34 8.04 364,909.18 10.25 18.550 -32.42 13.073 HUTCHISON (0013) 103,934.19 7.06 208,052.49 5.85 48.800 -35.15 17.214 HANG SENG BANK (0011) 38,297.63 2.60 158,682.95 4.46 83.000 -3.21 15.695 CHEUNG KONG (0001) 79,079.28 5.37 117,545.34 3.30 50.750 -37.35 16.126 SHK PPT (0016) 67,158.10 4.56 110,921.92 3.12 46.200 -26.67 13.027 CNOOC (0883) 23,433.24 1.59 83,373.78 2.34 10.150 38.10 10.758 CLP HOLDINGS (0002) 26,846.65 1.82 75,618.92 2.12 31.400 5.55 10.769 CHINA UNICOM (0762) 29,433.14 2.00 66,530.88 1.87 5.300 -38.37 15.84
10 HK ELECTRIC (0006) 22,510.45 1.53 62,960.72 1.77 29.500 1.72 9.6811 HK & CHINA GAS (0003) 19,087.92 1.30 57,477.65 1.61 10.100 16.33 19.1512 MTR CORPORATION (0066) 7,505.06 0.51 42,556.76 1.20 8.250 -19.12 9.6613 HENDERSON LAND (0012) 25,927.56 1.76 40,298.08 1.13 23.400 -33.52 18.7214 WHARF HOLDINGS (0004) 14,650.40 1.00 35,977.91 1.01 14.700 -22.83 14.2815 CATHAY PAC AIR (0293) 14,427.47 0.98 35,525.98 1.00 10.650 6.50 54.0116 CITIC PACIFIC (0267) 16,962.48 1.15 31,532.83 0.89 14.400 -17.00 14.9817 JOHNSON ELEC H (0179) 17,038.72 1.16 31,410.90 0.88 8.550 4.27 36.2918 CKI HOLDINGS (1038) 4,333.78 0.29 30,093.70 0.85 13.350 9.88 9.0619 PCCW (0008) 25,035.56 1.70 28,591.39 0.80 1.230 -42.79 14.5420 SWIRE PACIFIC 'A' (0019) 20,254.02 1.38 27,918.60 0.78 29.800 -29.88 11.2321 PETROCHINA - H SHARES (0857) 19,014.82 1.29 27,252.75 0.77 1.550 12.32 6.1822 SINOPEC CORP - H SHARES (0386) 9,772.99 0.66 21,982.44 0.62 1.310 22.43 7.3823 HANG LUNG PPT (0101) 6,465.66 0.44 21,814.47 0.61 7.550 -6.21 18.0824 LI & FUNG (0494) 17,160.28 1.17 21,386.09 0.60 7.400 -15.43 27.1625 HENDERSON INV (0097) 3,588.32 0.24 20,284.76 0.57 7.200 19.01 11.3926 YUE YUEN IND (0551) 3,777.23 0.26 19,536.18 0.55 25.300 72.70 10.7627 LEGEND GROUP (0992) 11,919.31 0.81 19,504.90 0.55 2.600 -34.59 18.7628 BANK OF E ASIA (0023) 10,114.14 0.69 19,308.71 0.54 13.350 -20.54 11.9229 ESPRIT HOLDINGS (0330) 9,024.83 0.61 15,498.10 0.44 13.150 49.43 16.3430 SWIRE PACIFIC 'B' (0087) 2,449.93 0.17 14,980.25 0.42 4.975 -11.16 9.3731 GUOCO GROUP (0053) 2,773.90 0.19 14,880.48 0.42 45.800 6.02 10.6432 CHINA RESOURCES (0291) 11,627.88 0.79 14,354.80 0.40 6.900 -5.48 11.5133 K M BUS HOLD (0062) 1,413.39 0.10 13,885.20 0.39 34.400 3.61 8.7034 COSCO PACIFIC (1199) 7,377.02 0.50 13,740.88 0.39 6.400 59.01 11.3835 TINGYI (0322) 1,250.20 0.08 11,317.13 0.32 2.025 54.58 24.0536 CHINA MER HOLD (0144) 4,464.47 0.30 11,206.21 0.31 5.450 9.00 13.9837 SHANGRI-LA ASIA (0069) 1,019.50 0.07 11,116.25 0.31 5.100 -16.39 24.8738 TVB (0511) 7,639.76 0.52 10,774.80 0.30 24.600 -27.22 18.0739 WHEELOCK (0020) 3,075.52 0.21 10,768.80 0.30 5.300 -20.30 19.7040 HKEX (0388) 11,837.45 0.80 10,226.70 0.29 9.800 -17.30 13.7741 SHANGHAI IND H (0363) 5,673.02 0.39 10,065.20 0.28 10.750 -24.83 8.0342 DAH SING (0440) 3,688.94 0.25 9,743.81 0.27 39.500 7.05 11.2243 SINO LAND (0083) 3,384.21 0.23 9,658.58 0.27 2.500 -19.35 36.7144 HUANENG POWER - H SHARES (0902) 12,867.65 0.87 9,376.71 0.26 6.250 32.98 10.9445 DENWAY MOTORS (0203) 8,383.28 0.57 8,962.78 0.25 2.625 8.25 11.9446 HANG LUNG GROUP (0010) 3,217.61 0.22 8,474.48 0.24 6.400 -7.25 12.2447 NEW WORLD DEV (0017) 6,590.05 0.45 8,448.99 0.24 3.900 -42.65 6.5548 TEXWINCA HOLD (0321) 4,278.90 0.29 7,677.16 0.22 5.800 55.70 13.9949 WING HANG BANK (0302) 1,798.68 0.12 7,321.79 0.21 24.950 -0.20 9.3850 CIFH (0183) 1,514.82 0.10 6,826.56 0.19 2.250 13.64 9.6651 WING LUNG BANK (0096) 918.15 0.06 6,675.47 0.19 28.750 -1.20 7.8952 KERRY PPT (0683) 1,345.33 0.09 6,439.28 0.18 5.500 -27.63 15.9453 TCL INT'L HOLD (1070) 5,652.65 0.38 6,203.37 0.17 2.375 82.69 20.3054 HYSAN DEV (0014) 2,184.81 0.15 6,000.78 0.17 5.800 -26.11 9.9655 ASM PACIFIC (0522) 3,751.08 0.25 5,723.51 0.16 15.000 -2.28 24.6456 NEW ASIA REALTY (0049) 108.93 0.01 5,484.54 0.15 2.650 30.86 63.5557 CHINA INSURANCE (0966) 1,790.51 0.12 5,267.80 0.15 3.975 -16.75 16.9458 BRILLIANCE CHI (1114) 5,100.75 0.35 5,205.80 0.15 1.420 -0.70 5.9159 I-CABLE COMM (1097) 2,345.28 0.16 5,199.53 0.15 2.575 -45.79 30.9560 CHINA TRAVEL HK (0308) 3,061.22 0.21 5,193.94 0.15 1.230 -23.60 6.8961 SMARTONE TELE (0315) 2,545.28 0.17 5,083.42 0.14 8.700 -6.45 44.4862 SCMP GROUP (0583) 1,207.12 0.08 5,073.07 0.14 3.250 -33.67 17.5163 GUANGDONG INV (0270) 1,324.99 0.09 4,990.92 0.14 0.970 25.97 22.4564 CNAC (1110) 1,451.30 0.10 4,978.96 0.14 1.500 17.19 22.4965 TECHTRONIC IND (0669) 4,287.51 0.29 4,777.56 0.13 7.400 136.80 17.6166 HOPEWELL HOLD (0054) 2,482.45 0.17 4,467.51 0.13 5.100 10.27 13.1567 BEIJING ENT (0392) 1,419.44 0.10 4,419.75 0.12 7.100 -26.04 7.6568 GIORDANO INT'L (0709) 6,911.52 0.47 4,393.05 0.12 3.050 -11.59 11.6169 ZHEJIANGEXPRESS - H SHARES (0576) 3,557.74 0.24 4,301.56 0.12 3.000 56.25 18.17
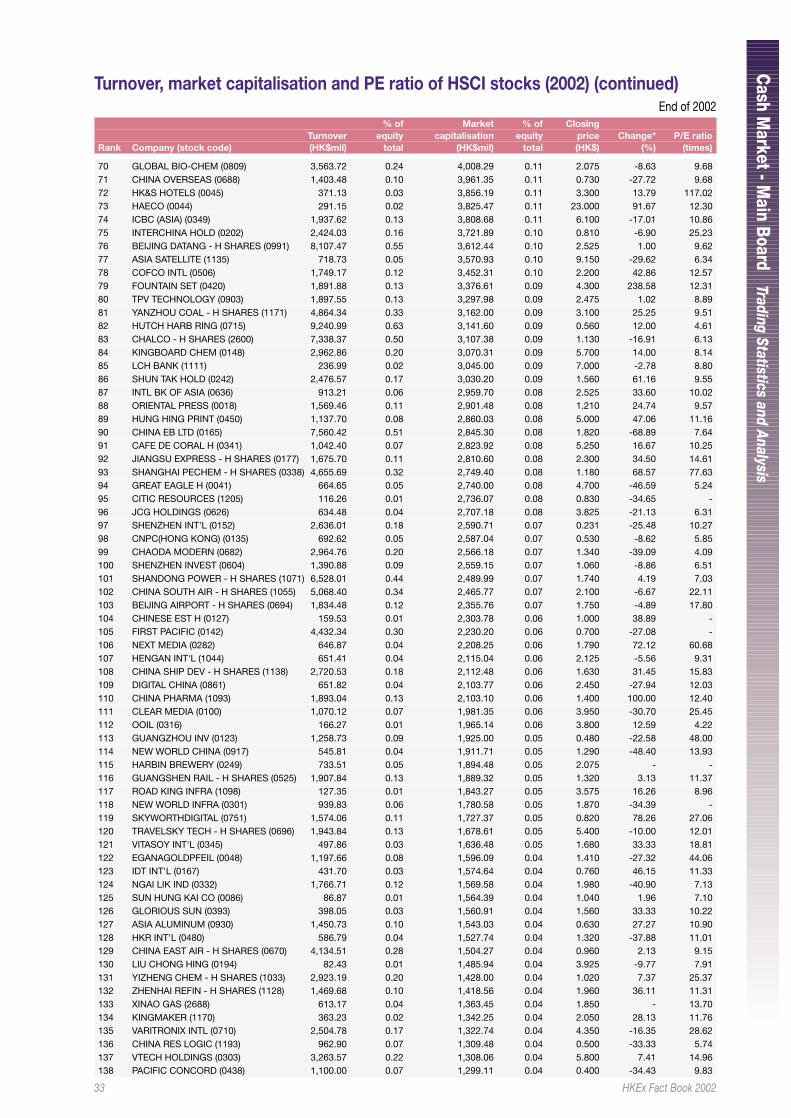
33 HKEx Fact Book 2002
Cash M
arket - Main Boar d
Trading Statistics and Analysis
Turnover, market capitalisation and PE ratio of HSCI stocks (2002) (continued)End of 2002
% of Market % of ClosingTurnover equity capitalisation equity price Change* P/E ratio
Rank Company (stock code) (HK$mil) total (HK$mil) total (HK$) (%) (times)
70 GLOBAL BIO-CHEM (0809) 3,563.72 0.24 4,008.29 0.11 2.075 -8.63 9.6871 CHINA OVERSEAS (0688) 1,403.48 0.10 3,961.35 0.11 0.730 -27.72 9.6872 HK&S HOTELS (0045) 371.13 0.03 3,856.19 0.11 3.300 13.79 117.0273 HAECO (0044) 291.15 0.02 3,825.47 0.11 23.000 91.67 12.3074 ICBC (ASIA) (0349) 1,937.62 0.13 3,808.68 0.11 6.100 -17.01 10.8675 INTERCHINA HOLD (0202) 2,424.03 0.16 3,721.89 0.10 0.810 -6.90 25.2376 BEIJING DATANG - H SHARES (0991) 8,107.47 0.55 3,612.44 0.10 2.525 1.00 9.6277 ASIA SATELLITE (1135) 718.73 0.05 3,570.93 0.10 9.150 -29.62 6.3478 COFCO INTL (0506) 1,749.17 0.12 3,452.31 0.10 2.200 42.86 12.5779 FOUNTAIN SET (0420) 1,891.88 0.13 3,376.61 0.09 4.300 238.58 12.3180 TPV TECHNOLOGY (0903) 1,897.55 0.13 3,297.98 0.09 2.475 1.02 8.8981 YANZHOU COAL - H SHARES (1171) 4,864.34 0.33 3,162.00 0.09 3.100 25.25 9.5182 HUTCH HARB RING (0715) 9,240.99 0.63 3,141.60 0.09 0.560 12.00 4.6183 CHALCO - H SHARES (2600) 7,338.37 0.50 3,107.38 0.09 1.130 -16.91 6.1384 KINGBOARD CHEM (0148) 2,962.86 0.20 3,070.31 0.09 5.700 14.00 8.1485 LCH BANK (1111) 236.99 0.02 3,045.00 0.09 7.000 -2.78 8.8086 SHUN TAK HOLD (0242) 2,476.57 0.17 3,030.20 0.09 1.560 61.16 9.5587 INTL BK OF ASIA (0636) 913.21 0.06 2,959.70 0.08 2.525 33.60 10.0288 ORIENTAL PRESS (0018) 1,569.46 0.11 2,901.48 0.08 1.210 24.74 9.5789 HUNG HING PRINT (0450) 1,137.70 0.08 2,860.03 0.08 5.000 47.06 11.1690 CHINA EB LTD (0165) 7,560.42 0.51 2,845.30 0.08 1.820 -68.89 7.6491 CAFE DE CORAL H (0341) 1,042.40 0.07 2,823.92 0.08 5.250 16.67 10.2592 JIANGSU EXPRESS - H SHARES (0177) 1,675.70 0.11 2,810.60 0.08 2.300 34.50 14.6193 SHANGHAI PECHEM - H SHARES (0338) 4,655.69 0.32 2,749.40 0.08 1.180 68.57 77.6394 GREAT EAGLE H (0041) 664.65 0.05 2,740.00 0.08 4.700 -46.59 5.2495 CITIC RESOURCES (1205) 116.26 0.01 2,736.07 0.08 0.830 -34.65 -96 JCG HOLDINGS (0626) 634.48 0.04 2,707.18 0.08 3.825 -21.13 6.3197 SHENZHEN INT'L (0152) 2,636.01 0.18 2,590.71 0.07 0.231 -25.48 10.2798 CNPC(HONG KONG) (0135) 692.62 0.05 2,587.04 0.07 0.530 -8.62 5.8599 CHAODA MODERN (0682) 2,964.76 0.20 2,566.18 0.07 1.340 -39.09 4.09100 SHENZHEN INVEST (0604) 1,390.88 0.09 2,559.15 0.07 1.060 -8.86 6.51101 SHANDONG POWER - H SHARES (1071) 6,528.01 0.44 2,489.99 0.07 1.740 4.19 7.03102 CHINA SOUTH AIR - H SHARES (1055) 5,068.40 0.34 2,465.77 0.07 2.100 -6.67 22.11103 BEIJING AIRPORT - H SHARES (0694) 1,834.48 0.12 2,355.76 0.07 1.750 -4.89 17.80104 CHINESE EST H (0127) 159.53 0.01 2,303.78 0.06 1.000 38.89 -105 FIRST PACIFIC (0142) 4,432.34 0.30 2,230.20 0.06 0.700 -27.08 -106 NEXT MEDIA (0282) 646.87 0.04 2,208.25 0.06 1.790 72.12 60.68107 HENGAN INT'L (1044) 651.41 0.04 2,115.04 0.06 2.125 -5.56 9.31108 CHINA SHIP DEV - H SHARES (1138) 2,720.53 0.18 2,112.48 0.06 1.630 31.45 15.83109 DIGITAL CHINA (0861) 651.82 0.04 2,103.77 0.06 2.450 -27.94 12.03110 CHINA PHARMA (1093) 1,893.04 0.13 2,103.10 0.06 1.400 100.00 12.40111 CLEAR MEDIA (0100) 1,070.12 0.07 1,981.35 0.06 3.950 -30.70 25.45112 OOIL (0316) 166.27 0.01 1,965.14 0.06 3.800 12.59 4.22113 GUANGZHOU INV (0123) 1,258.73 0.09 1,925.00 0.05 0.480 -22.58 48.00114 NEW WORLD CHINA (0917) 545.81 0.04 1,911.71 0.05 1.290 -48.40 13.93115 HARBIN BREWERY (0249) 733.51 0.05 1,894.48 0.05 2.075 - -116 GUANGSHEN RAIL - H SHARES (0525) 1,907.84 0.13 1,889.32 0.05 1.320 3.13 11.37117 ROAD KING INFRA (1098) 127.35 0.01 1,843.27 0.05 3.575 16.26 8.96118 NEW WORLD INFRA (0301) 939.83 0.06 1,780.58 0.05 1.870 -34.39 -119 SKYWORTHDIGITAL (0751) 1,574.06 0.11 1,727.37 0.05 0.820 78.26 27.06120 TRAVELSKY TECH - H SHARES (0696) 1,943.84 0.13 1,678.61 0.05 5.400 -10.00 12.01121 VITASOY INT'L (0345) 497.86 0.03 1,636.48 0.05 1.680 33.33 18.81122 EGANAGOLDPFEIL (0048) 1,197.66 0.08 1,596.09 0.04 1.410 -27.32 44.06123 IDT INT'L (0167) 431.70 0.03 1,574.64 0.04 0.760 46.15 11.33124 NGAI LIK IND (0332) 1,766.71 0.12 1,569.58 0.04 1.980 -40.90 7.13125 SUN HUNG KAI CO (0086) 86.87 0.01 1,564.39 0.04 1.040 1.96 7.10126 GLORIOUS SUN (0393) 398.05 0.03 1,560.91 0.04 1.560 33.33 10.22127 ASIA ALUMINUM (0930) 1,450.73 0.10 1,543.03 0.04 0.630 27.27 10.90128 HKR INT'L (0480) 586.79 0.04 1,527.74 0.04 1.320 -37.88 11.01129 CHINA EAST AIR - H SHARES (0670) 4,134.51 0.28 1,504.27 0.04 0.960 2.13 9.15130 LIU CHONG HING (0194) 82.43 0.01 1,485.94 0.04 3.925 -9.77 7.91131 YIZHENG CHEM - H SHARES (1033) 2,923.19 0.20 1,428.00 0.04 1.020 7.37 25.37132 ZHENHAI REFIN - H SHARES (1128) 1,469.68 0.10 1,418.56 0.04 1.960 36.11 11.31133 XINAO GAS (2688) 613.17 0.04 1,363.45 0.04 1.850 - 13.70134 KINGMAKER (1170) 363.23 0.02 1,342.25 0.04 2.050 28.13 11.76135 VARITRONIX INTL (0710) 2,504.78 0.17 1,322.74 0.04 4.350 -16.35 28.62136 CHINA RES LOGIC (1193) 962.90 0.07 1,309.48 0.04 0.500 -33.33 5.74137 VTECH HOLDINGS (0303) 3,263.57 0.22 1,308.06 0.04 5.800 7.41 14.96138 PACIFIC CONCORD (0438) 1,100.00 0.07 1,299.11 0.04 0.400 -34.43 9.83
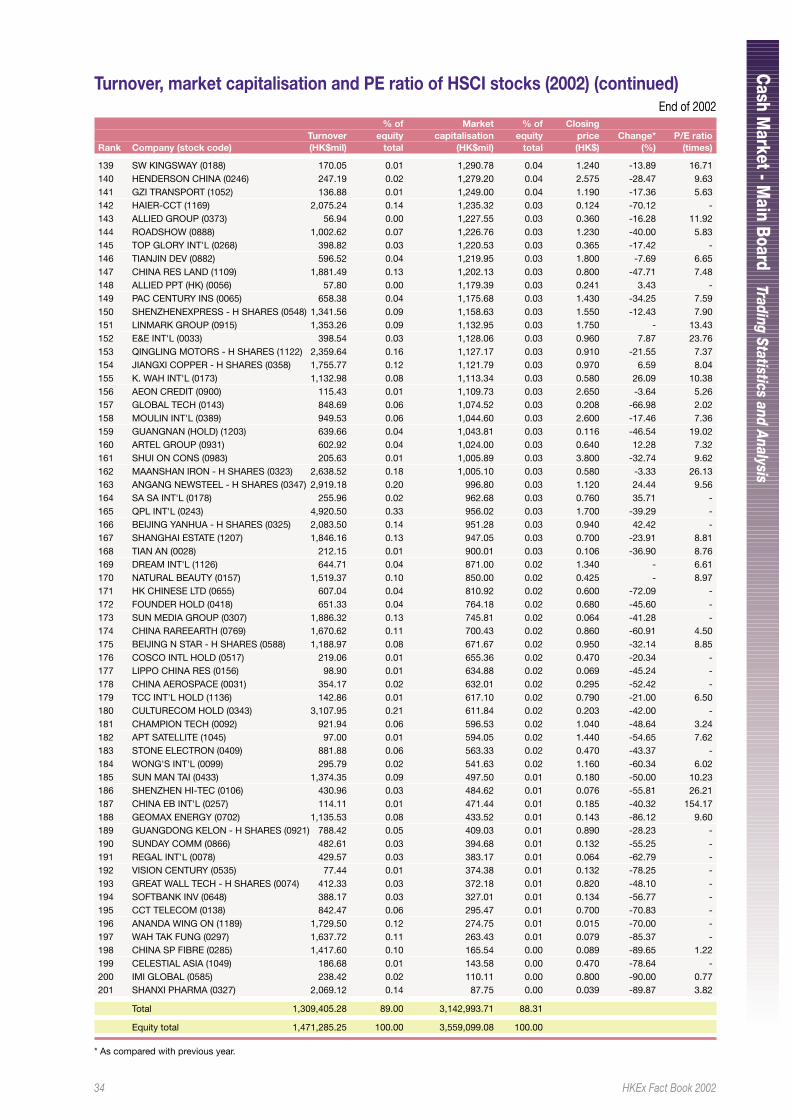
34 HKEx Fact Book 2002
Cash M
arket - Main Boar d
Trading Statistics and Analysis
Turnover, market capitalisation and PE ratio of HSCI stocks (2002) (continued)End of 2002
% of Market % of ClosingTurnover equity capitalisation equity price Change* P/E ratio
Rank Company (stock code) (HK$mil) total (HK$mil) total (HK$) (%) (times)
139 SW KINGSWAY (0188) 170.05 0.01 1,290.78 0.04 1.240 -13.89 16.71140 HENDERSON CHINA (0246) 247.19 0.02 1,279.20 0.04 2.575 -28.47 9.63141 GZI TRANSPORT (1052) 136.88 0.01 1,249.00 0.04 1.190 -17.36 5.63142 HAIER-CCT (1169) 2,075.24 0.14 1,235.32 0.03 0.124 -70.12 -143 ALLIED GROUP (0373) 56.94 0.00 1,227.55 0.03 0.360 -16.28 11.92144 ROADSHOW (0888) 1,002.62 0.07 1,226.76 0.03 1.230 -40.00 5.83145 TOP GLORY INT'L (0268) 398.82 0.03 1,220.53 0.03 0.365 -17.42 -146 TIANJIN DEV (0882) 596.52 0.04 1,219.95 0.03 1.800 -7.69 6.65147 CHINA RES LAND (1109) 1,881.49 0.13 1,202.13 0.03 0.800 -47.71 7.48148 ALLIED PPT (HK) (0056) 57.80 0.00 1,179.39 0.03 0.241 3.43 -149 PAC CENTURY INS (0065) 658.38 0.04 1,175.68 0.03 1.430 -34.25 7.59150 SHENZHENEXPRESS - H SHARES (0548) 1,341.56 0.09 1,158.63 0.03 1.550 -12.43 7.90151 LINMARK GROUP (0915) 1,353.26 0.09 1,132.95 0.03 1.750 - 13.43152 E&E INT'L (0033) 398.54 0.03 1,128.06 0.03 0.960 7.87 23.76153 QINGLING MOTORS - H SHARES (1122) 2,359.64 0.16 1,127.17 0.03 0.910 -21.55 7.37154 JIANGXI COPPER - H SHARES (0358) 1,755.77 0.12 1,121.79 0.03 0.970 6.59 8.04155 K. WAH INT'L (0173) 1,132.98 0.08 1,113.34 0.03 0.580 26.09 10.38156 AEON CREDIT (0900) 115.43 0.01 1,109.73 0.03 2.650 -3.64 5.26157 GLOBAL TECH (0143) 848.69 0.06 1,074.52 0.03 0.208 -66.98 2.02158 MOULIN INT'L (0389) 949.53 0.06 1,044.60 0.03 2.600 -17.46 7.36159 GUANGNAN (HOLD) (1203) 639.66 0.04 1,043.81 0.03 0.116 -46.54 19.02160 ARTEL GROUP (0931) 602.92 0.04 1,024.00 0.03 0.640 12.28 7.32161 SHUI ON CONS (0983) 205.63 0.01 1,005.89 0.03 3.800 -32.74 9.62162 MAANSHAN IRON - H SHARES (0323) 2,638.52 0.18 1,005.10 0.03 0.580 -3.33 26.13163 ANGANG NEWSTEEL - H SHARES (0347) 2,919.18 0.20 996.80 0.03 1.120 24.44 9.56164 SA SA INT'L (0178) 255.96 0.02 962.68 0.03 0.760 35.71 -165 QPL INT'L (0243) 4,920.50 0.33 956.02 0.03 1.700 -39.29 -166 BEIJING YANHUA - H SHARES (0325) 2,083.50 0.14 951.28 0.03 0.940 42.42 -167 SHANGHAI ESTATE (1207) 1,846.16 0.13 947.05 0.03 0.700 -23.91 8.81168 TIAN AN (0028) 212.15 0.01 900.01 0.03 0.106 -36.90 8.76169 DREAM INT'L (1126) 644.71 0.04 871.00 0.02 1.340 - 6.61170 NATURAL BEAUTY (0157) 1,519.37 0.10 850.00 0.02 0.425 - 8.97171 HK CHINESE LTD (0655) 607.04 0.04 810.92 0.02 0.600 -72.09 -172 FOUNDER HOLD (0418) 651.33 0.04 764.18 0.02 0.680 -45.60 -173 SUN MEDIA GROUP (0307) 1,886.32 0.13 745.81 0.02 0.064 -41.28 -174 CHINA RAREEARTH (0769) 1,670.62 0.11 700.43 0.02 0.860 -60.91 4.50175 BEIJING N STAR - H SHARES (0588) 1,188.97 0.08 671.67 0.02 0.950 -32.14 8.85176 COSCO INTL HOLD (0517) 219.06 0.01 655.36 0.02 0.470 -20.34 -177 LIPPO CHINA RES (0156) 98.90 0.01 634.88 0.02 0.069 -45.24 -178 CHINA AEROSPACE (0031) 354.17 0.02 632.01 0.02 0.295 -52.42 -179 TCC INT'L HOLD (1136) 142.86 0.01 617.10 0.02 0.790 -21.00 6.50180 CULTURECOM HOLD (0343) 3,107.95 0.21 611.84 0.02 0.203 -42.00 -181 CHAMPION TECH (0092) 921.94 0.06 596.53 0.02 1.040 -48.64 3.24182 APT SATELLITE (1045) 97.00 0.01 594.05 0.02 1.440 -54.65 7.62183 STONE ELECTRON (0409) 881.88 0.06 563.33 0.02 0.470 -43.37 -184 WONG'S INT'L (0099) 295.79 0.02 541.63 0.02 1.160 -60.34 6.02185 SUN MAN TAI (0433) 1,374.35 0.09 497.50 0.01 0.180 -50.00 10.23186 SHENZHEN HI-TEC (0106) 430.96 0.03 484.62 0.01 0.076 -55.81 26.21187 CHINA EB INT'L (0257) 114.11 0.01 471.44 0.01 0.185 -40.32 154.17188 GEOMAX ENERGY (0702) 1,135.53 0.08 433.52 0.01 0.143 -86.12 9.60189 GUANGDONG KELON - H SHARES (0921) 788.42 0.05 409.03 0.01 0.890 -28.23 -190 SUNDAY COMM (0866) 482.61 0.03 394.68 0.01 0.132 -55.25 -191 REGAL INT'L (0078) 429.57 0.03 383.17 0.01 0.064 -62.79 -192 VISION CENTURY (0535) 77.44 0.01 374.38 0.01 0.132 -78.25 -193 GREAT WALL TECH - H SHARES (0074) 412.33 0.03 372.18 0.01 0.820 -48.10 -194 SOFTBANK INV (0648) 388.17 0.03 327.01 0.01 0.134 -56.77 -195 CCT TELECOM (0138) 842.47 0.06 295.47 0.01 0.700 -70.83 -196 ANANDA WING ON (1189) 1,729.50 0.12 274.75 0.01 0.015 -70.00 -197 WAH TAK FUNG (0297) 1,637.72 0.11 263.43 0.01 0.079 -85.37 -198 CHINA SP FIBRE (0285) 1,417.60 0.10 165.54 0.00 0.089 -89.65 1.22199 CELESTIAL ASIA (1049) 186.68 0.01 143.58 0.00 0.470 -78.64 -200 IMI GLOBAL (0585) 238.42 0.02 110.11 0.00 0.800 -90.00 0.77201 SHANXI PHARMA (0327) 2,069.12 0.14 87.75 0.00 0.039 -89.87 3.82
Total 1,309,405.28 89.00 3,142,993.71 88.31
Equity total 1,471,285.25 100.00 3,559,099.08 100.00
* As compared with previous year.
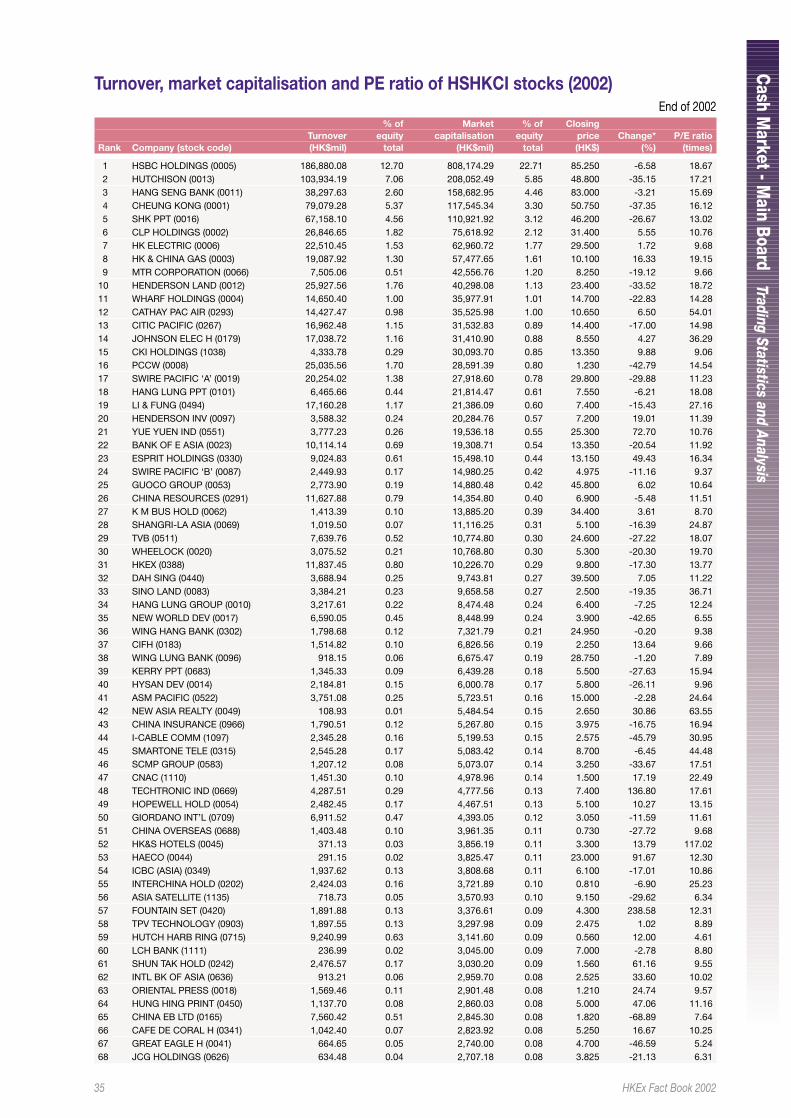
35 HKEx Fact Book 2002
Cash M
arket - Main Boar d
Trading Statistics and Analysis
Turnover, market capitalisation and PE ratio of HSHKCI stocks (2002)End of 2002
% of Market % of ClosingTurnover equity capitalisation equity price Change* P/E ratio
Rank Company (stock code) (HK$mil) total (HK$mil) total (HK$) (%) (times)
1 HSBC HOLDINGS (0005) 186,880.08 12.70 808,174.29 22.71 85.250 -6.58 18.672 HUTCHISON (0013) 103,934.19 7.06 208,052.49 5.85 48.800 -35.15 17.213 HANG SENG BANK (0011) 38,297.63 2.60 158,682.95 4.46 83.000 -3.21 15.694 CHEUNG KONG (0001) 79,079.28 5.37 117,545.34 3.30 50.750 -37.35 16.125 SHK PPT (0016) 67,158.10 4.56 110,921.92 3.12 46.200 -26.67 13.026 CLP HOLDINGS (0002) 26,846.65 1.82 75,618.92 2.12 31.400 5.55 10.767 HK ELECTRIC (0006) 22,510.45 1.53 62,960.72 1.77 29.500 1.72 9.688 HK & CHINA GAS (0003) 19,087.92 1.30 57,477.65 1.61 10.100 16.33 19.159 MTR CORPORATION (0066) 7,505.06 0.51 42,556.76 1.20 8.250 -19.12 9.66
10 HENDERSON LAND (0012) 25,927.56 1.76 40,298.08 1.13 23.400 -33.52 18.7211 WHARF HOLDINGS (0004) 14,650.40 1.00 35,977.91 1.01 14.700 -22.83 14.2812 CATHAY PAC AIR (0293) 14,427.47 0.98 35,525.98 1.00 10.650 6.50 54.0113 CITIC PACIFIC (0267) 16,962.48 1.15 31,532.83 0.89 14.400 -17.00 14.9814 JOHNSON ELEC H (0179) 17,038.72 1.16 31,410.90 0.88 8.550 4.27 36.2915 CKI HOLDINGS (1038) 4,333.78 0.29 30,093.70 0.85 13.350 9.88 9.0616 PCCW (0008) 25,035.56 1.70 28,591.39 0.80 1.230 -42.79 14.5417 SWIRE PACIFIC ‘A’ (0019) 20,254.02 1.38 27,918.60 0.78 29.800 -29.88 11.2318 HANG LUNG PPT (0101) 6,465.66 0.44 21,814.47 0.61 7.550 -6.21 18.0819 LI & FUNG (0494) 17,160.28 1.17 21,386.09 0.60 7.400 -15.43 27.1620 HENDERSON INV (0097) 3,588.32 0.24 20,284.76 0.57 7.200 19.01 11.3921 YUE YUEN IND (0551) 3,777.23 0.26 19,536.18 0.55 25.300 72.70 10.7622 BANK OF E ASIA (0023) 10,114.14 0.69 19,308.71 0.54 13.350 -20.54 11.9223 ESPRIT HOLDINGS (0330) 9,024.83 0.61 15,498.10 0.44 13.150 49.43 16.3424 SWIRE PACIFIC ‘B’ (0087) 2,449.93 0.17 14,980.25 0.42 4.975 -11.16 9.3725 GUOCO GROUP (0053) 2,773.90 0.19 14,880.48 0.42 45.800 6.02 10.6426 CHINA RESOURCES (0291) 11,627.88 0.79 14,354.80 0.40 6.900 -5.48 11.5127 K M BUS HOLD (0062) 1,413.39 0.10 13,885.20 0.39 34.400 3.61 8.7028 SHANGRI-LA ASIA (0069) 1,019.50 0.07 11,116.25 0.31 5.100 -16.39 24.8729 TVB (0511) 7,639.76 0.52 10,774.80 0.30 24.600 -27.22 18.0730 WHEELOCK (0020) 3,075.52 0.21 10,768.80 0.30 5.300 -20.30 19.7031 HKEX (0388) 11,837.45 0.80 10,226.70 0.29 9.800 -17.30 13.7732 DAH SING (0440) 3,688.94 0.25 9,743.81 0.27 39.500 7.05 11.2233 SINO LAND (0083) 3,384.21 0.23 9,658.58 0.27 2.500 -19.35 36.7134 HANG LUNG GROUP (0010) 3,217.61 0.22 8,474.48 0.24 6.400 -7.25 12.2435 NEW WORLD DEV (0017) 6,590.05 0.45 8,448.99 0.24 3.900 -42.65 6.5536 WING HANG BANK (0302) 1,798.68 0.12 7,321.79 0.21 24.950 -0.20 9.3837 CIFH (0183) 1,514.82 0.10 6,826.56 0.19 2.250 13.64 9.6638 WING LUNG BANK (0096) 918.15 0.06 6,675.47 0.19 28.750 -1.20 7.8939 KERRY PPT (0683) 1,345.33 0.09 6,439.28 0.18 5.500 -27.63 15.9440 HYSAN DEV (0014) 2,184.81 0.15 6,000.78 0.17 5.800 -26.11 9.9641 ASM PACIFIC (0522) 3,751.08 0.25 5,723.51 0.16 15.000 -2.28 24.6442 NEW ASIA REALTY (0049) 108.93 0.01 5,484.54 0.15 2.650 30.86 63.5543 CHINA INSURANCE (0966) 1,790.51 0.12 5,267.80 0.15 3.975 -16.75 16.9444 I-CABLE COMM (1097) 2,345.28 0.16 5,199.53 0.15 2.575 -45.79 30.9545 SMARTONE TELE (0315) 2,545.28 0.17 5,083.42 0.14 8.700 -6.45 44.4846 SCMP GROUP (0583) 1,207.12 0.08 5,073.07 0.14 3.250 -33.67 17.5147 CNAC (1110) 1,451.30 0.10 4,978.96 0.14 1.500 17.19 22.4948 TECHTRONIC IND (0669) 4,287.51 0.29 4,777.56 0.13 7.400 136.80 17.6149 HOPEWELL HOLD (0054) 2,482.45 0.17 4,467.51 0.13 5.100 10.27 13.1550 GIORDANO INT’L (0709) 6,911.52 0.47 4,393.05 0.12 3.050 -11.59 11.6151 CHINA OVERSEAS (0688) 1,403.48 0.10 3,961.35 0.11 0.730 -27.72 9.6852 HK&S HOTELS (0045) 371.13 0.03 3,856.19 0.11 3.300 13.79 117.0253 HAECO (0044) 291.15 0.02 3,825.47 0.11 23.000 91.67 12.3054 ICBC (ASIA) (0349) 1,937.62 0.13 3,808.68 0.11 6.100 -17.01 10.8655 INTERCHINA HOLD (0202) 2,424.03 0.16 3,721.89 0.10 0.810 -6.90 25.2356 ASIA SATELLITE (1135) 718.73 0.05 3,570.93 0.10 9.150 -29.62 6.3457 FOUNTAIN SET (0420) 1,891.88 0.13 3,376.61 0.09 4.300 238.58 12.3158 TPV TECHNOLOGY (0903) 1,897.55 0.13 3,297.98 0.09 2.475 1.02 8.8959 HUTCH HARB RING (0715) 9,240.99 0.63 3,141.60 0.09 0.560 12.00 4.6160 LCH BANK (1111) 236.99 0.02 3,045.00 0.09 7.000 -2.78 8.8061 SHUN TAK HOLD (0242) 2,476.57 0.17 3,030.20 0.09 1.560 61.16 9.5562 INTL BK OF ASIA (0636) 913.21 0.06 2,959.70 0.08 2.525 33.60 10.0263 ORIENTAL PRESS (0018) 1,569.46 0.11 2,901.48 0.08 1.210 24.74 9.5764 HUNG HING PRINT (0450) 1,137.70 0.08 2,860.03 0.08 5.000 47.06 11.1665 CHINA EB LTD (0165) 7,560.42 0.51 2,845.30 0.08 1.820 -68.89 7.6466 CAFE DE CORAL H (0341) 1,042.40 0.07 2,823.92 0.08 5.250 16.67 10.2567 GREAT EAGLE H (0041) 664.65 0.05 2,740.00 0.08 4.700 -46.59 5.2468 JCG HOLDINGS (0626) 634.48 0.04 2,707.18 0.08 3.825 -21.13 6.31
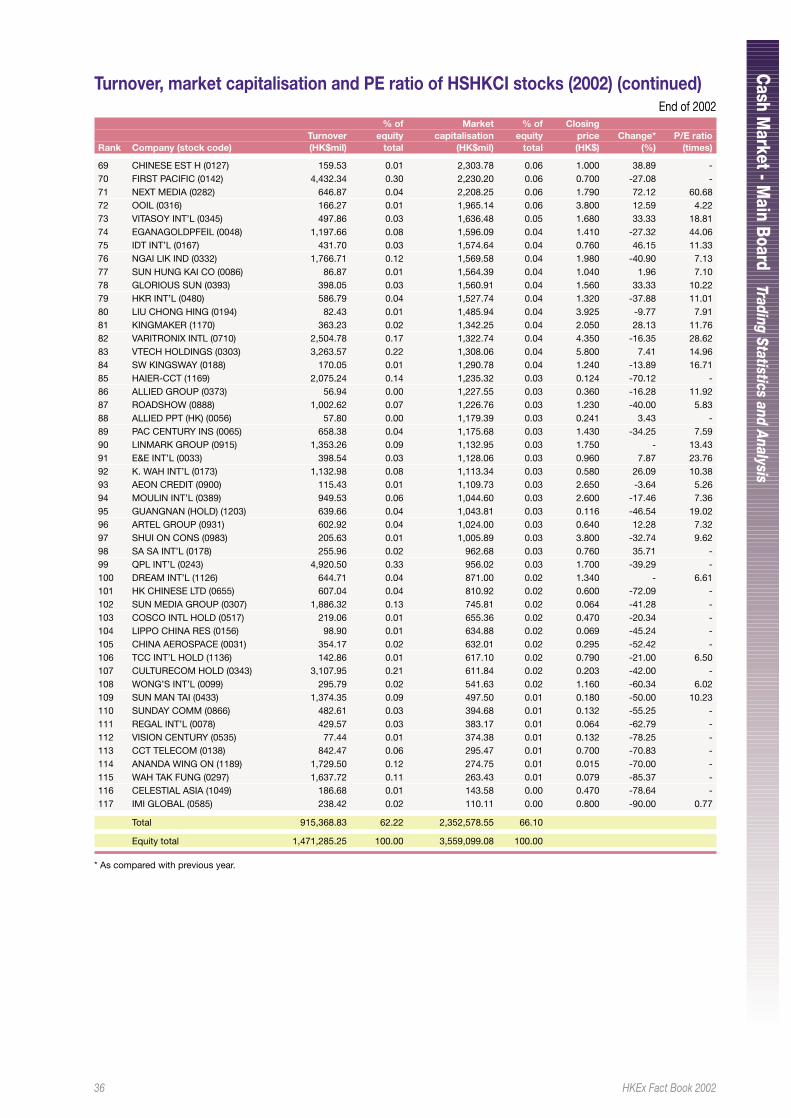
36 HKEx Fact Book 2002
Cash M
arket - Main Boar d
Trading Statistics and Analysis
Turnover, market capitalisation and PE ratio of HSHKCI stocks (2002) (continued)End of 2002
% of Market % of ClosingTurnover equity capitalisation equity price Change* P/E ratio
Rank Company (stock code) (HK$mil) total (HK$mil) total (HK$) (%) (times)
69 CHINESE EST H (0127) 159.53 0.01 2,303.78 0.06 1.000 38.89 -70 FIRST PACIFIC (0142) 4,432.34 0.30 2,230.20 0.06 0.700 -27.08 -71 NEXT MEDIA (0282) 646.87 0.04 2,208.25 0.06 1.790 72.12 60.6872 OOIL (0316) 166.27 0.01 1,965.14 0.06 3.800 12.59 4.2273 VITASOY INT’L (0345) 497.86 0.03 1,636.48 0.05 1.680 33.33 18.8174 EGANAGOLDPFEIL (0048) 1,197.66 0.08 1,596.09 0.04 1.410 -27.32 44.0675 IDT INT’L (0167) 431.70 0.03 1,574.64 0.04 0.760 46.15 11.3376 NGAI LIK IND (0332) 1,766.71 0.12 1,569.58 0.04 1.980 -40.90 7.1377 SUN HUNG KAI CO (0086) 86.87 0.01 1,564.39 0.04 1.040 1.96 7.1078 GLORIOUS SUN (0393) 398.05 0.03 1,560.91 0.04 1.560 33.33 10.2279 HKR INT’L (0480) 586.79 0.04 1,527.74 0.04 1.320 -37.88 11.0180 LIU CHONG HING (0194) 82.43 0.01 1,485.94 0.04 3.925 -9.77 7.9181 KINGMAKER (1170) 363.23 0.02 1,342.25 0.04 2.050 28.13 11.7682 VARITRONIX INTL (0710) 2,504.78 0.17 1,322.74 0.04 4.350 -16.35 28.6283 VTECH HOLDINGS (0303) 3,263.57 0.22 1,308.06 0.04 5.800 7.41 14.9684 SW KINGSWAY (0188) 170.05 0.01 1,290.78 0.04 1.240 -13.89 16.7185 HAIER-CCT (1169) 2,075.24 0.14 1,235.32 0.03 0.124 -70.12 -86 ALLIED GROUP (0373) 56.94 0.00 1,227.55 0.03 0.360 -16.28 11.9287 ROADSHOW (0888) 1,002.62 0.07 1,226.76 0.03 1.230 -40.00 5.8388 ALLIED PPT (HK) (0056) 57.80 0.00 1,179.39 0.03 0.241 3.43 -89 PAC CENTURY INS (0065) 658.38 0.04 1,175.68 0.03 1.430 -34.25 7.5990 LINMARK GROUP (0915) 1,353.26 0.09 1,132.95 0.03 1.750 - 13.4391 E&E INT’L (0033) 398.54 0.03 1,128.06 0.03 0.960 7.87 23.7692 K. WAH INT’L (0173) 1,132.98 0.08 1,113.34 0.03 0.580 26.09 10.3893 AEON CREDIT (0900) 115.43 0.01 1,109.73 0.03 2.650 -3.64 5.2694 MOULIN INT’L (0389) 949.53 0.06 1,044.60 0.03 2.600 -17.46 7.3695 GUANGNAN (HOLD) (1203) 639.66 0.04 1,043.81 0.03 0.116 -46.54 19.0296 ARTEL GROUP (0931) 602.92 0.04 1,024.00 0.03 0.640 12.28 7.3297 SHUI ON CONS (0983) 205.63 0.01 1,005.89 0.03 3.800 -32.74 9.6298 SA SA INT’L (0178) 255.96 0.02 962.68 0.03 0.760 35.71 -99 QPL INT’L (0243) 4,920.50 0.33 956.02 0.03 1.700 -39.29 -100 DREAM INT’L (1126) 644.71 0.04 871.00 0.02 1.340 - 6.61101 HK CHINESE LTD (0655) 607.04 0.04 810.92 0.02 0.600 -72.09 -102 SUN MEDIA GROUP (0307) 1,886.32 0.13 745.81 0.02 0.064 -41.28 -103 COSCO INTL HOLD (0517) 219.06 0.01 655.36 0.02 0.470 -20.34 -104 LIPPO CHINA RES (0156) 98.90 0.01 634.88 0.02 0.069 -45.24 -105 CHINA AEROSPACE (0031) 354.17 0.02 632.01 0.02 0.295 -52.42 -106 TCC INT’L HOLD (1136) 142.86 0.01 617.10 0.02 0.790 -21.00 6.50107 CULTURECOM HOLD (0343) 3,107.95 0.21 611.84 0.02 0.203 -42.00 -108 WONG’S INT’L (0099) 295.79 0.02 541.63 0.02 1.160 -60.34 6.02109 SUN MAN TAI (0433) 1,374.35 0.09 497.50 0.01 0.180 -50.00 10.23110 SUNDAY COMM (0866) 482.61 0.03 394.68 0.01 0.132 -55.25 -111 REGAL INT’L (0078) 429.57 0.03 383.17 0.01 0.064 -62.79 -112 VISION CENTURY (0535) 77.44 0.01 374.38 0.01 0.132 -78.25 -113 CCT TELECOM (0138) 842.47 0.06 295.47 0.01 0.700 -70.83 -114 ANANDA WING ON (1189) 1,729.50 0.12 274.75 0.01 0.015 -70.00 -115 WAH TAK FUNG (0297) 1,637.72 0.11 263.43 0.01 0.079 -85.37 -116 CELESTIAL ASIA (1049) 186.68 0.01 143.58 0.00 0.470 -78.64 -117 IMI GLOBAL (0585) 238.42 0.02 110.11 0.00 0.800 -90.00 0.77
Total 915,368.83 62.22 2,352,578.55 66.10
Equity total 1,471,285.25 100.00 3,559,099.08 100.00
* As compared with previous year.
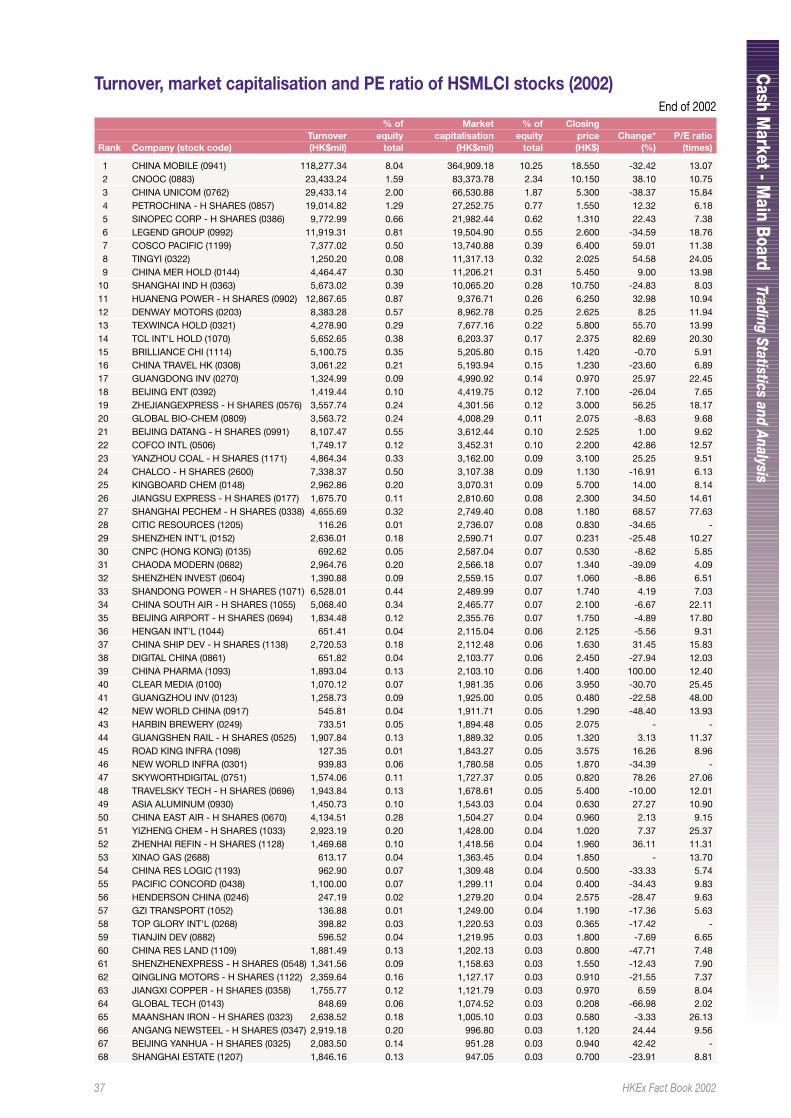
37 HKEx Fact Book 2002
Cash M
arket - Main Boar d
Trading Statistics and Analysis
Turnover, market capitalisation and PE ratio of HSMLCI stocks (2002)End of 2002
% of Market % of ClosingTurnover equity capitalisation equity price Change* P/E ratio
Rank Company (stock code) (HK$mil) total (HK$mil) total (HK$) (%) (times)
1 CHINA MOBILE (0941) 118,277.34 8.04 364,909.18 10.25 18.550 -32.42 13.072 CNOOC (0883) 23,433.24 1.59 83,373.78 2.34 10.150 38.10 10.753 CHINA UNICOM (0762) 29,433.14 2.00 66,530.88 1.87 5.300 -38.37 15.844 PETROCHINA - H SHARES (0857) 19,014.82 1.29 27,252.75 0.77 1.550 12.32 6.185 SINOPEC CORP - H SHARES (0386) 9,772.99 0.66 21,982.44 0.62 1.310 22.43 7.386 LEGEND GROUP (0992) 11,919.31 0.81 19,504.90 0.55 2.600 -34.59 18.767 COSCO PACIFIC (1199) 7,377.02 0.50 13,740.88 0.39 6.400 59.01 11.388 TINGYI (0322) 1,250.20 0.08 11,317.13 0.32 2.025 54.58 24.059 CHINA MER HOLD (0144) 4,464.47 0.30 11,206.21 0.31 5.450 9.00 13.98
10 SHANGHAI IND H (0363) 5,673.02 0.39 10,065.20 0.28 10.750 -24.83 8.0311 HUANENG POWER - H SHARES (0902) 12,867.65 0.87 9,376.71 0.26 6.250 32.98 10.9412 DENWAY MOTORS (0203) 8,383.28 0.57 8,962.78 0.25 2.625 8.25 11.9413 TEXWINCA HOLD (0321) 4,278.90 0.29 7,677.16 0.22 5.800 55.70 13.9914 TCL INT'L HOLD (1070) 5,652.65 0.38 6,203.37 0.17 2.375 82.69 20.3015 BRILLIANCE CHI (1114) 5,100.75 0.35 5,205.80 0.15 1.420 -0.70 5.9116 CHINA TRAVEL HK (0308) 3,061.22 0.21 5,193.94 0.15 1.230 -23.60 6.8917 GUANGDONG INV (0270) 1,324.99 0.09 4,990.92 0.14 0.970 25.97 22.4518 BEIJING ENT (0392) 1,419.44 0.10 4,419.75 0.12 7.100 -26.04 7.6519 ZHEJIANGEXPRESS - H SHARES (0576) 3,557.74 0.24 4,301.56 0.12 3.000 56.25 18.1720 GLOBAL BIO-CHEM (0809) 3,563.72 0.24 4,008.29 0.11 2.075 -8.63 9.6821 BEIJING DATANG - H SHARES (0991) 8,107.47 0.55 3,612.44 0.10 2.525 1.00 9.6222 COFCO INTL (0506) 1,749.17 0.12 3,452.31 0.10 2.200 42.86 12.5723 YANZHOU COAL - H SHARES (1171) 4,864.34 0.33 3,162.00 0.09 3.100 25.25 9.5124 CHALCO - H SHARES (2600) 7,338.37 0.50 3,107.38 0.09 1.130 -16.91 6.1325 KINGBOARD CHEM (0148) 2,962.86 0.20 3,070.31 0.09 5.700 14.00 8.1426 JIANGSU EXPRESS - H SHARES (0177) 1,675.70 0.11 2,810.60 0.08 2.300 34.50 14.6127 SHANGHAI PECHEM - H SHARES (0338) 4,655.69 0.32 2,749.40 0.08 1.180 68.57 77.6328 CITIC RESOURCES (1205) 116.26 0.01 2,736.07 0.08 0.830 -34.65 -29 SHENZHEN INT'L (0152) 2,636.01 0.18 2,590.71 0.07 0.231 -25.48 10.2730 CNPC (HONG KONG) (0135) 692.62 0.05 2,587.04 0.07 0.530 -8.62 5.8531 CHAODA MODERN (0682) 2,964.76 0.20 2,566.18 0.07 1.340 -39.09 4.0932 SHENZHEN INVEST (0604) 1,390.88 0.09 2,559.15 0.07 1.060 -8.86 6.5133 SHANDONG POWER - H SHARES (1071) 6,528.01 0.44 2,489.99 0.07 1.740 4.19 7.0334 CHINA SOUTH AIR - H SHARES (1055) 5,068.40 0.34 2,465.77 0.07 2.100 -6.67 22.1135 BEIJING AIRPORT - H SHARES (0694) 1,834.48 0.12 2,355.76 0.07 1.750 -4.89 17.8036 HENGAN INT'L (1044) 651.41 0.04 2,115.04 0.06 2.125 -5.56 9.3137 CHINA SHIP DEV - H SHARES (1138) 2,720.53 0.18 2,112.48 0.06 1.630 31.45 15.8338 DIGITAL CHINA (0861) 651.82 0.04 2,103.77 0.06 2.450 -27.94 12.0339 CHINA PHARMA (1093) 1,893.04 0.13 2,103.10 0.06 1.400 100.00 12.4040 CLEAR MEDIA (0100) 1,070.12 0.07 1,981.35 0.06 3.950 -30.70 25.4541 GUANGZHOU INV (0123) 1,258.73 0.09 1,925.00 0.05 0.480 -22.58 48.0042 NEW WORLD CHINA (0917) 545.81 0.04 1,911.71 0.05 1.290 -48.40 13.9343 HARBIN BREWERY (0249) 733.51 0.05 1,894.48 0.05 2.075 - -44 GUANGSHEN RAIL - H SHARES (0525) 1,907.84 0.13 1,889.32 0.05 1.320 3.13 11.3745 ROAD KING INFRA (1098) 127.35 0.01 1,843.27 0.05 3.575 16.26 8.9646 NEW WORLD INFRA (0301) 939.83 0.06 1,780.58 0.05 1.870 -34.39 -47 SKYWORTHDIGITAL (0751) 1,574.06 0.11 1,727.37 0.05 0.820 78.26 27.0648 TRAVELSKY TECH - H SHARES (0696) 1,943.84 0.13 1,678.61 0.05 5.400 -10.00 12.0149 ASIA ALUMINUM (0930) 1,450.73 0.10 1,543.03 0.04 0.630 27.27 10.9050 CHINA EAST AIR - H SHARES (0670) 4,134.51 0.28 1,504.27 0.04 0.960 2.13 9.1551 YIZHENG CHEM - H SHARES (1033) 2,923.19 0.20 1,428.00 0.04 1.020 7.37 25.3752 ZHENHAI REFIN - H SHARES (1128) 1,469.68 0.10 1,418.56 0.04 1.960 36.11 11.3153 XINAO GAS (2688) 613.17 0.04 1,363.45 0.04 1.850 - 13.7054 CHINA RES LOGIC (1193) 962.90 0.07 1,309.48 0.04 0.500 -33.33 5.7455 PACIFIC CONCORD (0438) 1,100.00 0.07 1,299.11 0.04 0.400 -34.43 9.8356 HENDERSON CHINA (0246) 247.19 0.02 1,279.20 0.04 2.575 -28.47 9.6357 GZI TRANSPORT (1052) 136.88 0.01 1,249.00 0.04 1.190 -17.36 5.6358 TOP GLORY INT'L (0268) 398.82 0.03 1,220.53 0.03 0.365 -17.42 -59 TIANJIN DEV (0882) 596.52 0.04 1,219.95 0.03 1.800 -7.69 6.6560 CHINA RES LAND (1109) 1,881.49 0.13 1,202.13 0.03 0.800 -47.71 7.4861 SHENZHENEXPRESS - H SHARES (0548) 1,341.56 0.09 1,158.63 0.03 1.550 -12.43 7.9062 QINGLING MOTORS - H SHARES (1122) 2,359.64 0.16 1,127.17 0.03 0.910 -21.55 7.3763 JIANGXI COPPER - H SHARES (0358) 1,755.77 0.12 1,121.79 0.03 0.970 6.59 8.0464 GLOBAL TECH (0143) 848.69 0.06 1,074.52 0.03 0.208 -66.98 2.0265 MAANSHAN IRON - H SHARES (0323) 2,638.52 0.18 1,005.10 0.03 0.580 -3.33 26.1366 ANGANG NEWSTEEL - H SHARES (0347) 2,919.18 0.20 996.80 0.03 1.120 24.44 9.5667 BEIJING YANHUA - H SHARES (0325) 2,083.50 0.14 951.28 0.03 0.940 42.42 -68 SHANGHAI ESTATE (1207) 1,846.16 0.13 947.05 0.03 0.700 -23.91 8.81
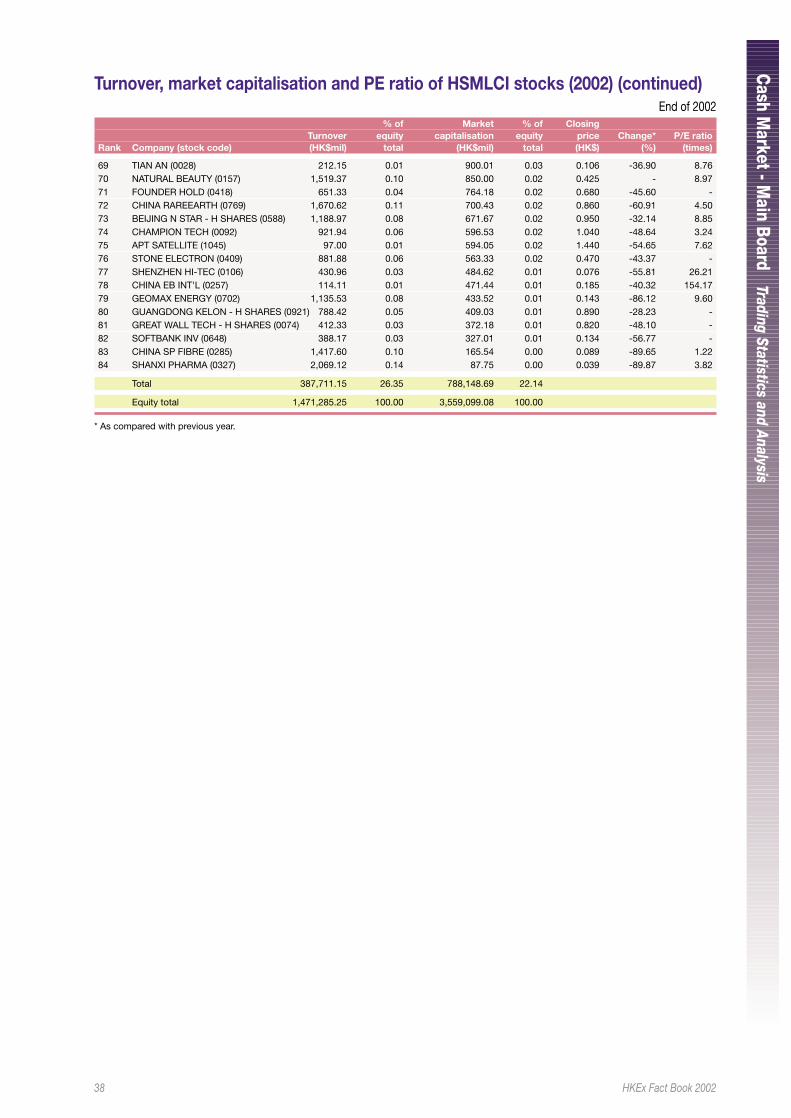
38 HKEx Fact Book 2002
Cash M
arket - Main Boar d
Trading Statistics and Analysis
Turnover, market capitalisation and PE ratio of HSMLCI stocks (2002) (continued)End of 2002
% of Market % of ClosingTurnover equity capitalisation equity price Change* P/E ratio
Rank Company (stock code) (HK$mil) total (HK$mil) total (HK$) (%) (times)
69 TIAN AN (0028) 212.15 0.01 900.01 0.03 0.106 -36.90 8.7670 NATURAL BEAUTY (0157) 1,519.37 0.10 850.00 0.02 0.425 - 8.9771 FOUNDER HOLD (0418) 651.33 0.04 764.18 0.02 0.680 -45.60 -72 CHINA RAREEARTH (0769) 1,670.62 0.11 700.43 0.02 0.860 -60.91 4.5073 BEIJING N STAR - H SHARES (0588) 1,188.97 0.08 671.67 0.02 0.950 -32.14 8.8574 CHAMPION TECH (0092) 921.94 0.06 596.53 0.02 1.040 -48.64 3.2475 APT SATELLITE (1045) 97.00 0.01 594.05 0.02 1.440 -54.65 7.6276 STONE ELECTRON (0409) 881.88 0.06 563.33 0.02 0.470 -43.37 -77 SHENZHEN HI-TEC (0106) 430.96 0.03 484.62 0.01 0.076 -55.81 26.2178 CHINA EB INT'L (0257) 114.11 0.01 471.44 0.01 0.185 -40.32 154.1779 GEOMAX ENERGY (0702) 1,135.53 0.08 433.52 0.01 0.143 -86.12 9.6080 GUANGDONG KELON - H SHARES (0921) 788.42 0.05 409.03 0.01 0.890 -28.23 -81 GREAT WALL TECH - H SHARES (0074) 412.33 0.03 372.18 0.01 0.820 -48.10 -82 SOFTBANK INV (0648) 388.17 0.03 327.01 0.01 0.134 -56.77 -83 CHINA SP FIBRE (0285) 1,417.60 0.10 165.54 0.00 0.089 -89.65 1.2284 SHANXI PHARMA (0327) 2,069.12 0.14 87.75 0.00 0.039 -89.87 3.82
Total 387,711.15 26.35 788,148.69 22.14
Equity total 1,471,285.25 100.00 3,559,099.08 100.00
* As compared with previous year.
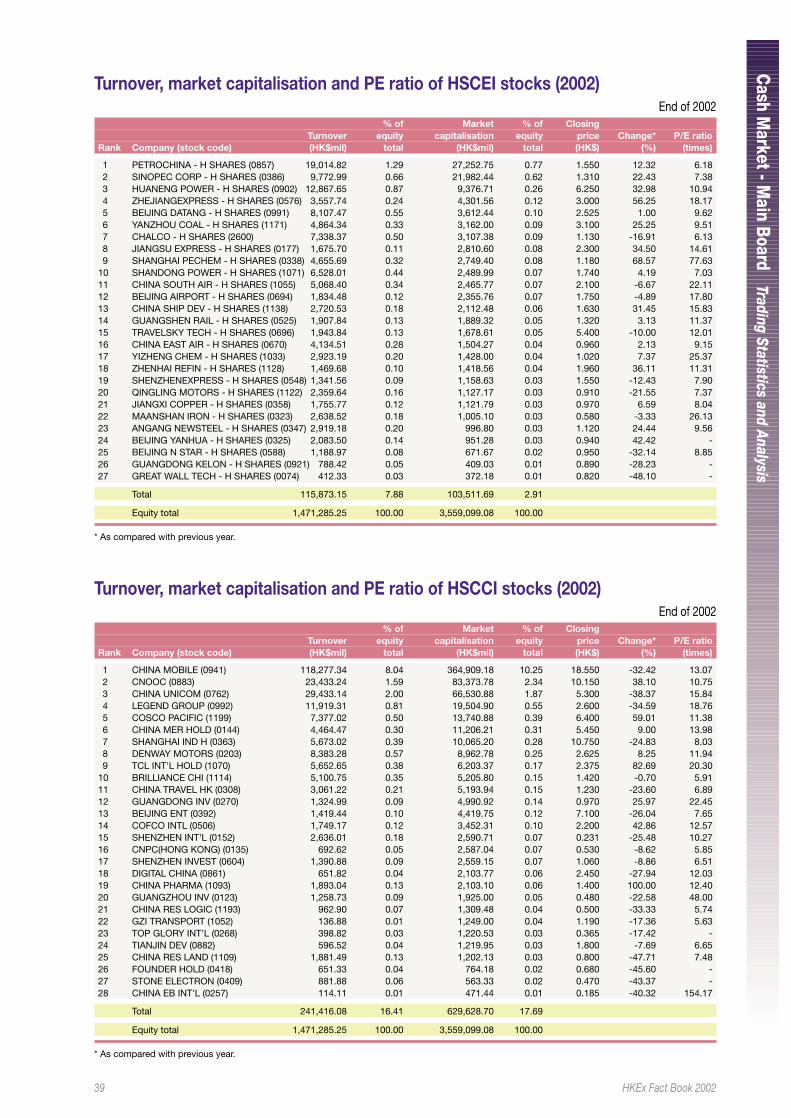
39 HKEx Fact Book 2002
Cash M
arket - Main Boar d
Trading Statistics and Analysis
Turnover, market capitalisation and PE ratio of HSCEI stocks (2002)End of 2002
% of Market % of ClosingTurnover equity capitalisation equity price Change* P/E ratio
Rank Company (stock code) (HK$mil) total (HK$mil) total (HK$) (%) (times)
1 PETROCHINA - H SHARES (0857) 19,014.82 1.29 27,252.75 0.77 1.550 12.32 6.182 SINOPEC CORP - H SHARES (0386) 9,772.99 0.66 21,982.44 0.62 1.310 22.43 7.383 HUANENG POWER - H SHARES (0902) 12,867.65 0.87 9,376.71 0.26 6.250 32.98 10.944 ZHEJIANGEXPRESS - H SHARES (0576) 3,557.74 0.24 4,301.56 0.12 3.000 56.25 18.175 BEIJING DATANG - H SHARES (0991) 8,107.47 0.55 3,612.44 0.10 2.525 1.00 9.626 YANZHOU COAL - H SHARES (1171) 4,864.34 0.33 3,162.00 0.09 3.100 25.25 9.517 CHALCO - H SHARES (2600) 7,338.37 0.50 3,107.38 0.09 1.130 -16.91 6.138 JIANGSU EXPRESS - H SHARES (0177) 1,675.70 0.11 2,810.60 0.08 2.300 34.50 14.619 SHANGHAI PECHEM - H SHARES (0338) 4,655.69 0.32 2,749.40 0.08 1.180 68.57 77.63
10 SHANDONG POWER - H SHARES (1071) 6,528.01 0.44 2,489.99 0.07 1.740 4.19 7.0311 CHINA SOUTH AIR - H SHARES (1055) 5,068.40 0.34 2,465.77 0.07 2.100 -6.67 22.1112 BEIJING AIRPORT - H SHARES (0694) 1,834.48 0.12 2,355.76 0.07 1.750 -4.89 17.8013 CHINA SHIP DEV - H SHARES (1138) 2,720.53 0.18 2,112.48 0.06 1.630 31.45 15.8314 GUANGSHEN RAIL - H SHARES (0525) 1,907.84 0.13 1,889.32 0.05 1.320 3.13 11.3715 TRAVELSKY TECH - H SHARES (0696) 1,943.84 0.13 1,678.61 0.05 5.400 -10.00 12.0116 CHINA EAST AIR - H SHARES (0670) 4,134.51 0.28 1,504.27 0.04 0.960 2.13 9.1517 YIZHENG CHEM - H SHARES (1033) 2,923.19 0.20 1,428.00 0.04 1.020 7.37 25.3718 ZHENHAI REFIN - H SHARES (1128) 1,469.68 0.10 1,418.56 0.04 1.960 36.11 11.3119 SHENZHENEXPRESS - H SHARES (0548) 1,341.56 0.09 1,158.63 0.03 1.550 -12.43 7.9020 QINGLING MOTORS - H SHARES (1122) 2,359.64 0.16 1,127.17 0.03 0.910 -21.55 7.3721 JIANGXI COPPER - H SHARES (0358) 1,755.77 0.12 1,121.79 0.03 0.970 6.59 8.0422 MAANSHAN IRON - H SHARES (0323) 2,638.52 0.18 1,005.10 0.03 0.580 -3.33 26.1323 ANGANG NEWSTEEL - H SHARES (0347) 2,919.18 0.20 996.80 0.03 1.120 24.44 9.5624 BEIJING YANHUA - H SHARES (0325) 2,083.50 0.14 951.28 0.03 0.940 42.42 -25 BEIJING N STAR - H SHARES (0588) 1,188.97 0.08 671.67 0.02 0.950 -32.14 8.8526 GUANGDONG KELON - H SHARES (0921) 788.42 0.05 409.03 0.01 0.890 -28.23 -27 GREAT WALL TECH - H SHARES (0074) 412.33 0.03 372.18 0.01 0.820 -48.10 -
Total 115,873.15 7.88 103,511.69 2.91
Equity total 1,471,285.25 100.00 3,559,099.08 100.00
* As compared with previous year.
Turnover, market capitalisation and PE ratio of HSCCI stocks (2002)End of 2002
% of Market % of ClosingTurnover equity capitalisation equity price Change* P/E ratio
Rank Company (stock code) (HK$mil) total (HK$mil) total (HK$) (%) (times)
1 CHINA MOBILE (0941) 118,277.34 8.04 364,909.18 10.25 18.550 -32.42 13.072 CNOOC (0883) 23,433.24 1.59 83,373.78 2.34 10.150 38.10 10.753 CHINA UNICOM (0762) 29,433.14 2.00 66,530.88 1.87 5.300 -38.37 15.844 LEGEND GROUP (0992) 11,919.31 0.81 19,504.90 0.55 2.600 -34.59 18.765 COSCO PACIFIC (1199) 7,377.02 0.50 13,740.88 0.39 6.400 59.01 11.386 CHINA MER HOLD (0144) 4,464.47 0.30 11,206.21 0.31 5.450 9.00 13.987 SHANGHAI IND H (0363) 5,673.02 0.39 10,065.20 0.28 10.750 -24.83 8.038 DENWAY MOTORS (0203) 8,383.28 0.57 8,962.78 0.25 2.625 8.25 11.949 TCL INT'L HOLD (1070) 5,652.65 0.38 6,203.37 0.17 2.375 82.69 20.30
10 BRILLIANCE CHI (1114) 5,100.75 0.35 5,205.80 0.15 1.420 -0.70 5.9111 CHINA TRAVEL HK (0308) 3,061.22 0.21 5,193.94 0.15 1.230 -23.60 6.8912 GUANGDONG INV (0270) 1,324.99 0.09 4,990.92 0.14 0.970 25.97 22.4513 BEIJING ENT (0392) 1,419.44 0.10 4,419.75 0.12 7.100 -26.04 7.6514 COFCO INTL (0506) 1,749.17 0.12 3,452.31 0.10 2.200 42.86 12.5715 SHENZHEN INT'L (0152) 2,636.01 0.18 2,590.71 0.07 0.231 -25.48 10.2716 CNPC(HONG KONG) (0135) 692.62 0.05 2,587.04 0.07 0.530 -8.62 5.8517 SHENZHEN INVEST (0604) 1,390.88 0.09 2,559.15 0.07 1.060 -8.86 6.5118 DIGITAL CHINA (0861) 651.82 0.04 2,103.77 0.06 2.450 -27.94 12.0319 CHINA PHARMA (1093) 1,893.04 0.13 2,103.10 0.06 1.400 100.00 12.4020 GUANGZHOU INV (0123) 1,258.73 0.09 1,925.00 0.05 0.480 -22.58 48.0021 CHINA RES LOGIC (1193) 962.90 0.07 1,309.48 0.04 0.500 -33.33 5.7422 GZI TRANSPORT (1052) 136.88 0.01 1,249.00 0.04 1.190 -17.36 5.6323 TOP GLORY INT'L (0268) 398.82 0.03 1,220.53 0.03 0.365 -17.42 -24 TIANJIN DEV (0882) 596.52 0.04 1,219.95 0.03 1.800 -7.69 6.6525 CHINA RES LAND (1109) 1,881.49 0.13 1,202.13 0.03 0.800 -47.71 7.4826 FOUNDER HOLD (0418) 651.33 0.04 764.18 0.02 0.680 -45.60 -27 STONE ELECTRON (0409) 881.88 0.06 563.33 0.02 0.470 -43.37 -28 CHINA EB INT'L (0257) 114.11 0.01 471.44 0.01 0.185 -40.32 154.17
Total 241,416.08 16.41 629,628.70 17.69
Equity total 1,471,285.25 100.00 3,559,099.08 100.00
* As compared with previous year.
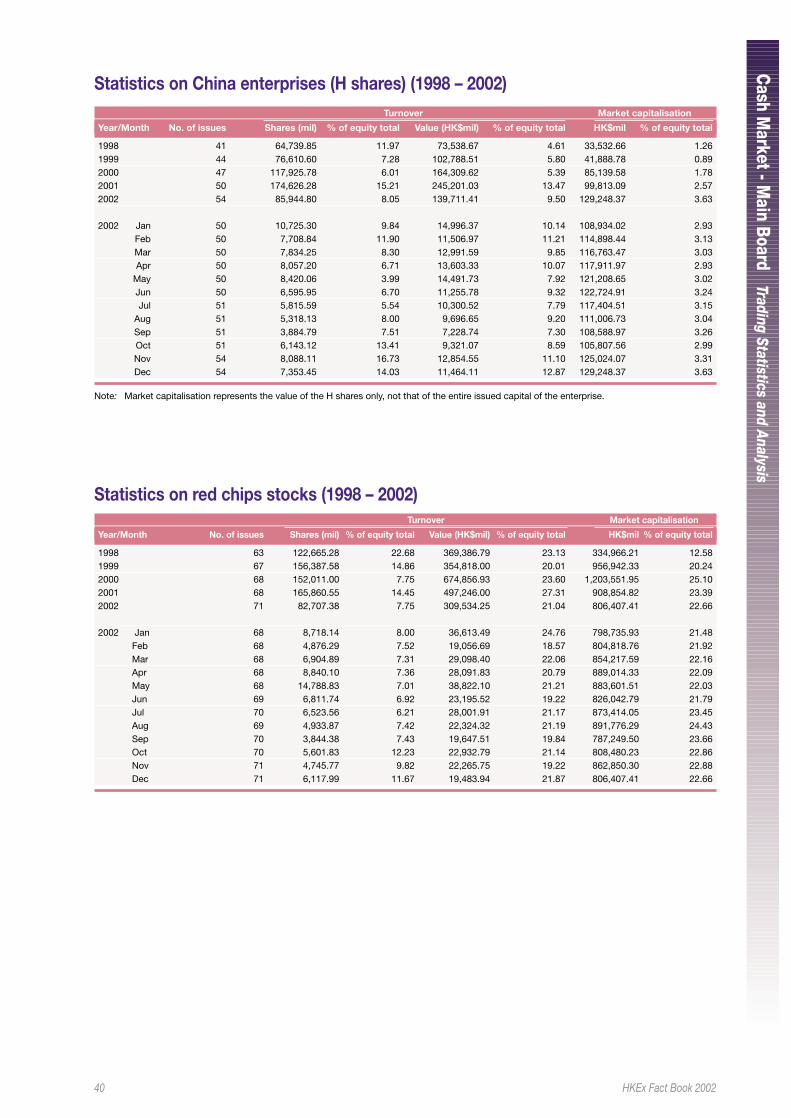
40 HKEx Fact Book 2002
Cash M
arket - Main Boar d
Trading Statistics and Analysis
Statistics on China enterprises (H shares) (1998 – 2002)Turnover Market capitalisation
Year/Month No. of issues Shares (mil) % of equity total Value (HK$mil) % of equity total HK$mil % of equity total
1998 41 64,739.85 11.97 73,538.67 4.61 33,532.66 1.261999 44 76,610.60 7.28 102,788.51 5.80 41,888.78 0.892000 47 117,925.78 6.01 164,309.62 5.39 85,139.58 1.782001 50 174,626.28 15.21 245,201.03 13.47 99,813.09 2.572002 54 85,944.80 8.05 139,711.41 9.50 129,248.37 3.63
2002 Jan 50 10,725.30 9.84 14,996.37 10.14 108,934.02 2.93Feb 50 7,708.84 11.90 11,506.97 11.21 114,898.44 3.13Mar 50 7,834.25 8.30 12,991.59 9.85 116,763.47 3.03Apr 50 8,057.20 6.71 13,603.33 10.07 117,911.97 2.93
May 50 8,420.06 3.99 14,491.73 7.92 121,208.65 3.02Jun 50 6,595.95 6.70 11,255.78 9.32 122,724.91 3.24Jul 51 5,815.59 5.54 10,300.52 7.79 117,404.51 3.15
Aug 51 5,318.13 8.00 9,696.65 9.20 111,006.73 3.04Sep 51 3,884.79 7.51 7,228.74 7.30 108,588.97 3.26Oct 51 6,143.12 13.41 9,321.07 8.59 105,807.56 2.99Nov 54 8,088.11 16.73 12,854.55 11.10 125,024.07 3.31Dec 54 7,353.45 14.03 11,464.11 12.87 129,248.37 3.63
Note: Market capitalisation represents the value of the H shares only, not that of the entire issued capital of the enterprise.
Statistics on red chips stocks (1998 – 2002)Turnover Market capitalisation
Year/Month No. of issues Shares (mil) % of equity total Value (HK$mil) % of equity total HK$mil % of equity total
1998 63 122,665.28 22.68 369,386.79 23.13 334,966.21 12.581999 67 156,387.58 14.86 354,818.00 20.01 956,942.33 20.242000 68 152,011.00 7.75 674,856.93 23.60 1,203,551.95 25.102001 68 165,860.55 14.45 497,246.00 27.31 908,854.82 23.392002 71 82,707.38 7.75 309,534.25 21.04 806,407.41 22.66
2002 Jan 68 8,718.14 8.00 36,613.49 24.76 798,735.93 21.48Feb 68 4,876.29 7.52 19,056.69 18.57 804,818.76 21.92Mar 68 6,904.89 7.31 29,098.40 22.06 854,217.59 22.16Apr 68 8,840.10 7.36 28,091.83 20.79 889,014.33 22.09May 68 14,788.83 7.01 38,822.10 21.21 883,601.51 22.03Jun 69 6,811.74 6.92 23,195.52 19.22 826,042.79 21.79Jul 70 6,523.56 6.21 28,001.91 21.17 873,414.05 23.45Aug 69 4,933.87 7.42 22,324.32 21.19 891,776.29 24.43Sep 70 3,844.38 7.43 19,647.51 19.84 787,249.50 23.66Oct 70 5,601.83 12.23 22,932.79 21.14 808,480.23 22.86Nov 71 4,745.77 9.82 22,265.75 19.22 862,850.30 22.88Dec 71 6,117.99 11.67 19,483.94 21.87 806,407.41 22.66
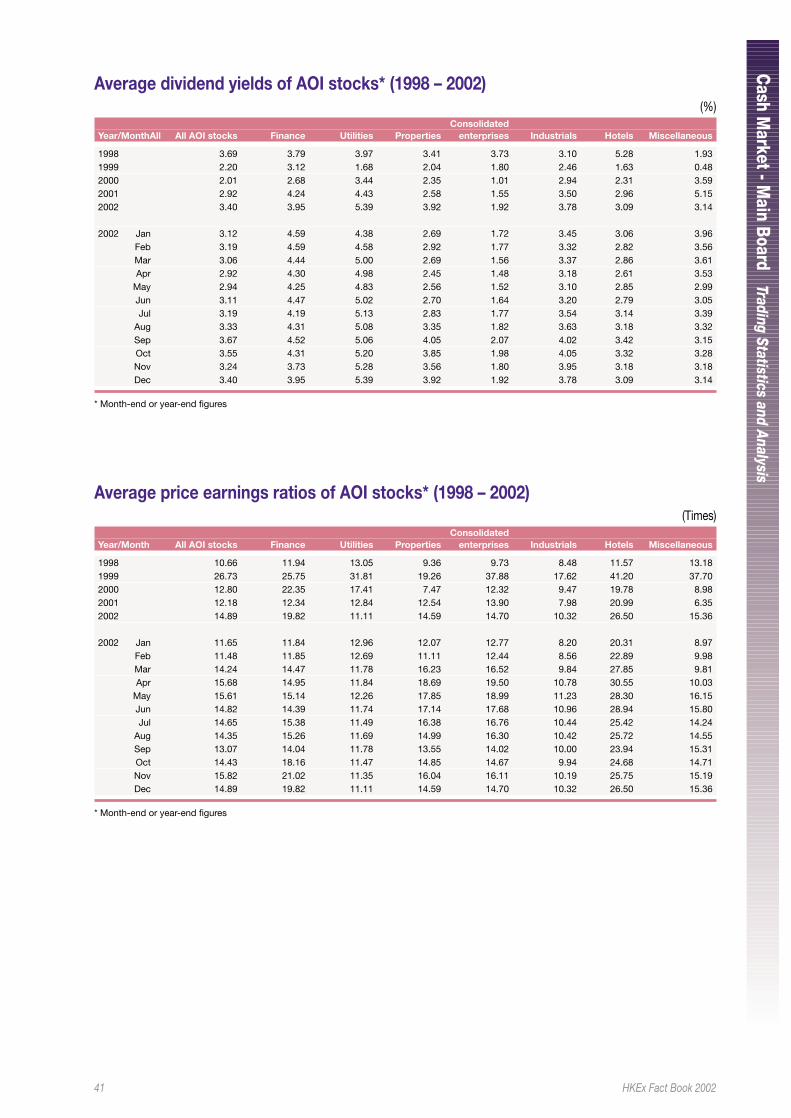
41 HKEx Fact Book 2002
Cash M
arket - Main Boar d
Trading Statistics and Analysis
Average dividend yields of AOI stocks* (1998 – 2002)(%)
ConsolidatedYear/MonthAll All AOI stocks Finance Utilities Properties enterprises Industrials Hotels Miscellaneous
1998 3.69 3.79 3.97 3.41 3.73 3.10 5.28 1.931999 2.20 3.12 1.68 2.04 1.80 2.46 1.63 0.482000 2.01 2.68 3.44 2.35 1.01 2.94 2.31 3.592001 2.92 4.24 4.43 2.58 1.55 3.50 2.96 5.152002 3.40 3.95 5.39 3.92 1.92 3.78 3.09 3.14
2002 Jan 3.12 4.59 4.38 2.69 1.72 3.45 3.06 3.96Feb 3.19 4.59 4.58 2.92 1.77 3.32 2.82 3.56Mar 3.06 4.44 5.00 2.69 1.56 3.37 2.86 3.61Apr 2.92 4.30 4.98 2.45 1.48 3.18 2.61 3.53
May 2.94 4.25 4.83 2.56 1.52 3.10 2.85 2.99Jun 3.11 4.47 5.02 2.70 1.64 3.20 2.79 3.05Jul 3.19 4.19 5.13 2.83 1.77 3.54 3.14 3.39
Aug 3.33 4.31 5.08 3.35 1.82 3.63 3.18 3.32Sep 3.67 4.52 5.06 4.05 2.07 4.02 3.42 3.15Oct 3.55 4.31 5.20 3.85 1.98 4.05 3.32 3.28Nov 3.24 3.73 5.28 3.56 1.80 3.95 3.18 3.18Dec 3.40 3.95 5.39 3.92 1.92 3.78 3.09 3.14
* Month-end or year-end figures
Average price earnings ratios of AOI stocks* (1998 – 2002)(Times)
ConsolidatedYear/Month All AOI stocks Finance Utilities Properties enterprises Industrials Hotels Miscellaneous
1998 10.66 11.94 13.05 9.36 9.73 8.48 11.57 13.181999 26.73 25.75 31.81 19.26 37.88 17.62 41.20 37.702000 12.80 22.35 17.41 7.47 12.32 9.47 19.78 8.982001 12.18 12.34 12.84 12.54 13.90 7.98 20.99 6.352002 14.89 19.82 11.11 14.59 14.70 10.32 26.50 15.36
2002 Jan 11.65 11.84 12.96 12.07 12.77 8.20 20.31 8.97Feb 11.48 11.85 12.69 11.11 12.44 8.56 22.89 9.98Mar 14.24 14.47 11.78 16.23 16.52 9.84 27.85 9.81Apr 15.68 14.95 11.84 18.69 19.50 10.78 30.55 10.03
May 15.61 15.14 12.26 17.85 18.99 11.23 28.30 16.15Jun 14.82 14.39 11.74 17.14 17.68 10.96 28.94 15.80Jul 14.65 15.38 11.49 16.38 16.76 10.44 25.42 14.24
Aug 14.35 15.26 11.69 14.99 16.30 10.42 25.72 14.55Sep 13.07 14.04 11.78 13.55 14.02 10.00 23.94 15.31Oct 14.43 18.16 11.47 14.85 14.67 9.94 24.68 14.71Nov 15.82 21.02 11.35 16.04 16.11 10.19 25.75 15.19Dec 14.89 19.82 11.11 14.59 14.70 10.32 26.50 15.36
* Month-end or year-end figures
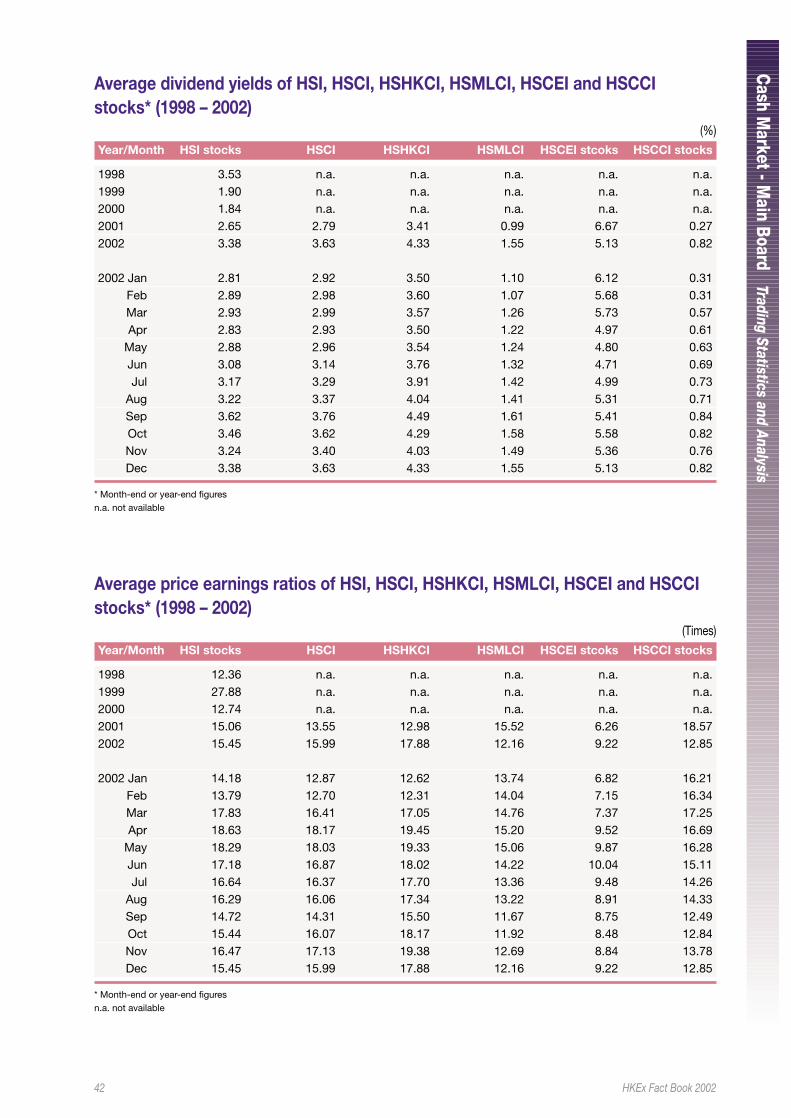
42 HKEx Fact Book 2002
Cash M
arket - Main Boar d
Trading Statistics and Analysis
Average dividend yields of HSI, HSCI, HSHKCI, HSMLCI, HSCEI and HSCCIstocks* (1998 – 2002)
(%)Year/Month HSI stocks HSCI HSHKCI HSMLCI HSCEI stcoks HSCCI stocks
1998 3.53 n.a. n.a. n.a. n.a. n.a.1999 1.90 n.a. n.a. n.a. n.a. n.a.2000 1.84 n.a. n.a. n.a. n.a. n.a.2001 2.65 2.79 3.41 0.99 6.67 0.272002 3.38 3.63 4.33 1.55 5.13 0.82
2002 Jan 2.81 2.92 3.50 1.10 6.12 0.31Feb 2.89 2.98 3.60 1.07 5.68 0.31Mar 2.93 2.99 3.57 1.26 5.73 0.57Apr 2.83 2.93 3.50 1.22 4.97 0.61
May 2.88 2.96 3.54 1.24 4.80 0.63Jun 3.08 3.14 3.76 1.32 4.71 0.69Jul 3.17 3.29 3.91 1.42 4.99 0.73
Aug 3.22 3.37 4.04 1.41 5.31 0.71Sep 3.62 3.76 4.49 1.61 5.41 0.84Oct 3.46 3.62 4.29 1.58 5.58 0.82Nov 3.24 3.40 4.03 1.49 5.36 0.76Dec 3.38 3.63 4.33 1.55 5.13 0.82
* Month-end or year-end figuresn.a. not available
Average price earnings ratios of HSI, HSCI, HSHKCI, HSMLCI, HSCEI and HSCCIstocks* (1998 – 2002)
(Times)Year/Month HSI stocks HSCI HSHKCI HSMLCI HSCEI stcoks HSCCI stocks
1998 12.36 n.a. n.a. n.a. n.a. n.a.1999 27.88 n.a. n.a. n.a. n.a. n.a.2000 12.74 n.a. n.a. n.a. n.a. n.a.2001 15.06 13.55 12.98 15.52 6.26 18.572002 15.45 15.99 17.88 12.16 9.22 12.85
2002 Jan 14.18 12.87 12.62 13.74 6.82 16.21Feb 13.79 12.70 12.31 14.04 7.15 16.34Mar 17.83 16.41 17.05 14.76 7.37 17.25Apr 18.63 18.17 19.45 15.20 9.52 16.69
May 18.29 18.03 19.33 15.06 9.87 16.28Jun 17.18 16.87 18.02 14.22 10.04 15.11Jul 16.64 16.37 17.70 13.36 9.48 14.26
Aug 16.29 16.06 17.34 13.22 8.91 14.33Sep 14.72 14.31 15.50 11.67 8.75 12.49Oct 15.44 16.07 18.17 11.92 8.48 12.84Nov 16.47 17.13 19.38 12.69 8.84 13.78Dec 15.45 15.99 17.88 12.16 9.22 12.85
* Month-end or year-end figuresn.a. not available
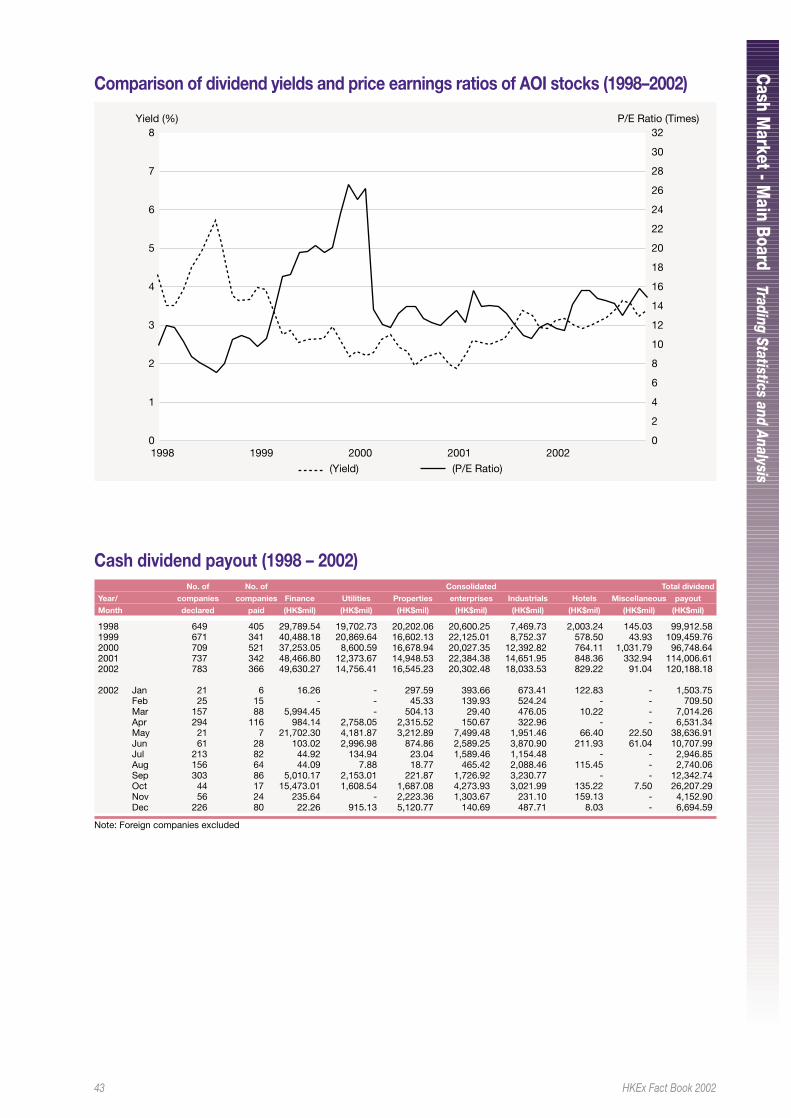
43 HKEx Fact Book 2002
Cash M
arket - Main Boar d
Trading Statistics and Analysis
Cash dividend payout (1998 – 2002)No. of No. of Consolidated Total dividend
Year/ companies companies Finance Utilities Properties enterprises Industrials Hotels Miscellaneous payout
Month declared paid (HK$mil) (HK$mil) (HK$mil) (HK$mil) (HK$mil) (HK$mil) (HK$mil) (HK$mil)
1998 649 405 29,789.54 19,702.73 20,202.06 20,600.25 7,469.73 2,003.24 145.03 99,912.581999 671 341 40,488.18 20,869.64 16,602.13 22,125.01 8,752.37 578.50 43.93 109,459.762000 709 521 37,253.05 8,600.59 16,678.94 20,027.35 12,392.82 764.11 1,031.79 96,748.642001 737 342 48,466.80 12,373.67 14,948.53 22,384.38 14,651.95 848.36 332.94 114,006.612002 783 366 49,630.27 14,756.41 16,545.23 20,302.48 18,033.53 829.22 91.04 120,188.18
2002 Jan 21 6 16.26 - 297.59 393.66 673.41 122.83 - 1,503.75Feb 25 15 - - 45.33 139.93 524.24 - - 709.50Mar 157 88 5,994.45 - 504.13 29.40 476.05 10.22 - 7,014.26Apr 294 116 984.14 2,758.05 2,315.52 150.67 322.96 - - 6,531.34May 21 7 21,702.30 4,181.87 3,212.89 7,499.48 1,951.46 66.40 22.50 38,636.91Jun 61 28 103.02 2,996.98 874.86 2,589.25 3,870.90 211.93 61.04 10,707.99Jul 213 82 44.92 134.94 23.04 1,589.46 1,154.48 - - 2,946.85Aug 156 64 44.09 7.88 18.77 465.42 2,088.46 115.45 - 2,740.06Sep 303 86 5,010.17 2,153.01 221.87 1,726.92 3,230.77 - - 12,342.74Oct 44 17 15,473.01 1,608.54 1,687.08 4,273.93 3,021.99 135.22 7.50 26,207.29Nov 56 24 235.64 - 2,223.36 1,303.67 231.10 159.13 - 4,152.90Dec 226 80 22.26 915.13 5,120.77 140.69 487.71 8.03 - 6,694.59
Note: Foreign companies excluded
Comparison of dividend yields and price earnings ratios of AOI stocks (1998–2002)
0
1
2
3
4
5
6
7
8
1998 1999 2000 2001 2002
P/E Ratio (Times)Yield (%)
0
2
4
6
8
10
12
14
16
18
20
22
24
26
28
30
32
(Yield) (P/E Ratio)
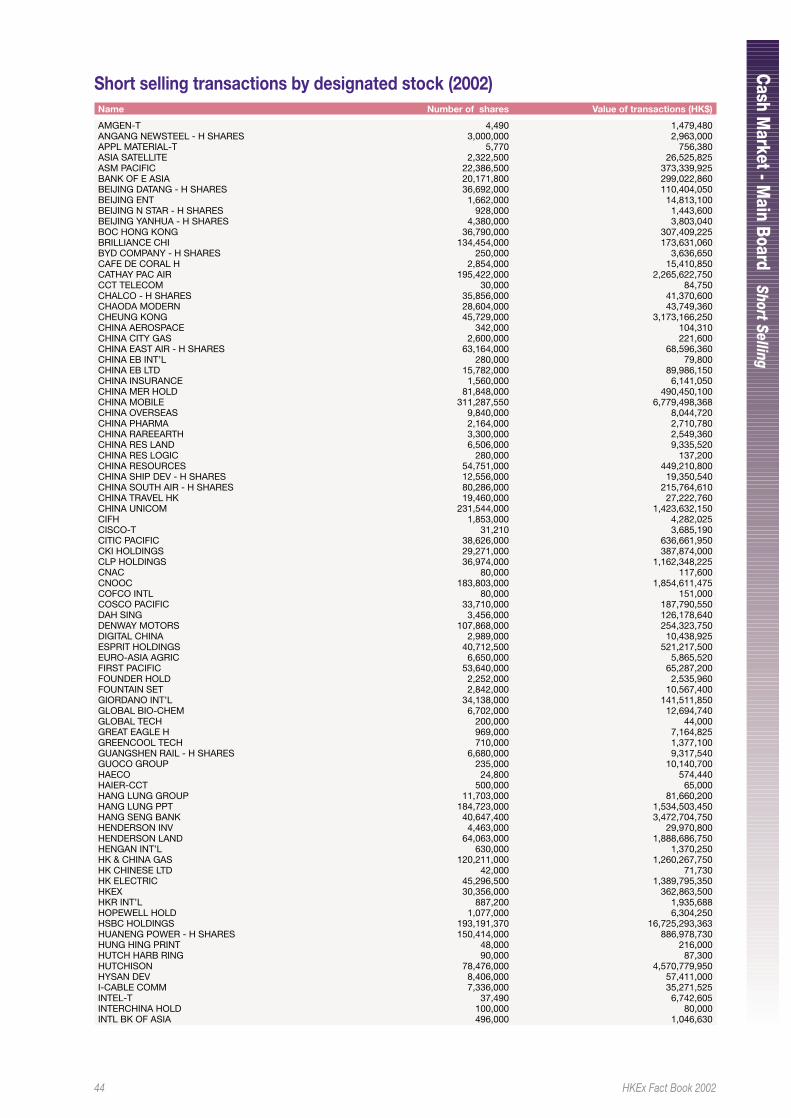
44 HKEx Fact Book 2002
Cash M
arket - Main Boar d
Short Selling
Short selling transactions by designated stock (2002)Name Number of shares Value of transactions (HK$)
AMGEN-T 4,490 1,479,480ANGANG NEWSTEEL - H SHARES 3,000,000 2,963,000APPL MATERIAL-T 5,770 756,380ASIA SATELLITE 2,322,500 26,525,825ASM PACIFIC 22,386,500 373,339,925BANK OF E ASIA 20,171,800 299,022,860BEIJING DATANG - H SHARES 36,692,000 110,404,050BEIJING ENT 1,662,000 14,813,100BEIJING N STAR - H SHARES 928,000 1,443,600BEIJING YANHUA - H SHARES 4,380,000 3,803,040BOC HONG KONG 36,790,000 307,409,225BRILLIANCE CHI 134,454,000 173,631,060BYD COMPANY - H SHARES 250,000 3,636,650CAFE DE CORAL H 2,854,000 15,410,850CATHAY PAC AIR 195,422,000 2,265,622,750CCT TELECOM 30,000 84,750CHALCO - H SHARES 35,856,000 41,370,600CHAODA MODERN 28,604,000 43,749,360CHEUNG KONG 45,729,000 3,173,166,250CHINA AEROSPACE 342,000 104,310CHINA CITY GAS 2,600,000 221,600CHINA EAST AIR - H SHARES 63,164,000 68,596,360CHINA EB INT’L 280,000 79,800CHINA EB LTD 15,782,000 89,986,150CHINA INSURANCE 1,560,000 6,141,050CHINA MER HOLD 81,848,000 490,450,100CHINA MOBILE 311,287,550 6,779,498,368CHINA OVERSEAS 9,840,000 8,044,720CHINA PHARMA 2,164,000 2,710,780CHINA RAREEARTH 3,300,000 2,549,360CHINA RES LAND 6,506,000 9,335,520CHINA RES LOGIC 280,000 137,200CHINA RESOURCES 54,751,000 449,210,800CHINA SHIP DEV - H SHARES 12,556,000 19,350,540CHINA SOUTH AIR - H SHARES 80,286,000 215,764,610CHINA TRAVEL HK 19,460,000 27,222,760CHINA UNICOM 231,544,000 1,423,632,150CIFH 1,853,000 4,282,025CISCO-T 31,210 3,685,190CITIC PACIFIC 38,626,000 636,661,950CKI HOLDINGS 29,271,000 387,874,000CLP HOLDINGS 36,974,000 1,162,348,225CNAC 80,000 117,600CNOOC 183,803,000 1,854,611,475COFCO INTL 80,000 151,000COSCO PACIFIC 33,710,000 187,790,550DAH SING 3,456,000 126,178,640DENWAY MOTORS 107,868,000 254,323,750DIGITAL CHINA 2,989,000 10,438,925ESPRIT HOLDINGS 40,712,500 521,217,500EURO-ASIA AGRIC 6,650,000 5,865,520FIRST PACIFIC 53,640,000 65,287,200FOUNDER HOLD 2,252,000 2,535,960FOUNTAIN SET 2,842,000 10,567,400GIORDANO INT’L 34,138,000 141,511,850GLOBAL BIO-CHEM 6,702,000 12,694,740GLOBAL TECH 200,000 44,000GREAT EAGLE H 969,000 7,164,825GREENCOOL TECH 710,000 1,377,100GUANGSHEN RAIL - H SHARES 6,680,000 9,317,540GUOCO GROUP 235,000 10,140,700HAECO 24,800 574,440HAIER-CCT 500,000 65,000HANG LUNG GROUP 11,703,000 81,660,200HANG LUNG PPT 184,723,000 1,534,503,450HANG SENG BANK 40,647,400 3,472,704,750HENDERSON INV 4,463,000 29,970,800HENDERSON LAND 64,063,000 1,888,686,750HENGAN INT’L 630,000 1,370,250HK & CHINA GAS 120,211,000 1,260,267,750HK CHINESE LTD 42,000 71,730HK ELECTRIC 45,296,500 1,389,795,350HKEX 30,356,000 362,863,500HKR INT’L 887,200 1,935,688HOPEWELL HOLD 1,077,000 6,304,250HSBC HOLDINGS 193,191,370 16,725,293,363HUANENG POWER - H SHARES 150,414,000 886,978,730HUNG HING PRINT 48,000 216,000HUTCH HARB RING 90,000 87,300HUTCHISON 78,476,000 4,570,779,950HYSAN DEV 8,406,000 57,411,000I-CABLE COMM 7,336,000 35,271,525INTEL-T 37,490 6,742,605INTERCHINA HOLD 100,000 80,000INTL BK OF ASIA 496,000 1,046,630
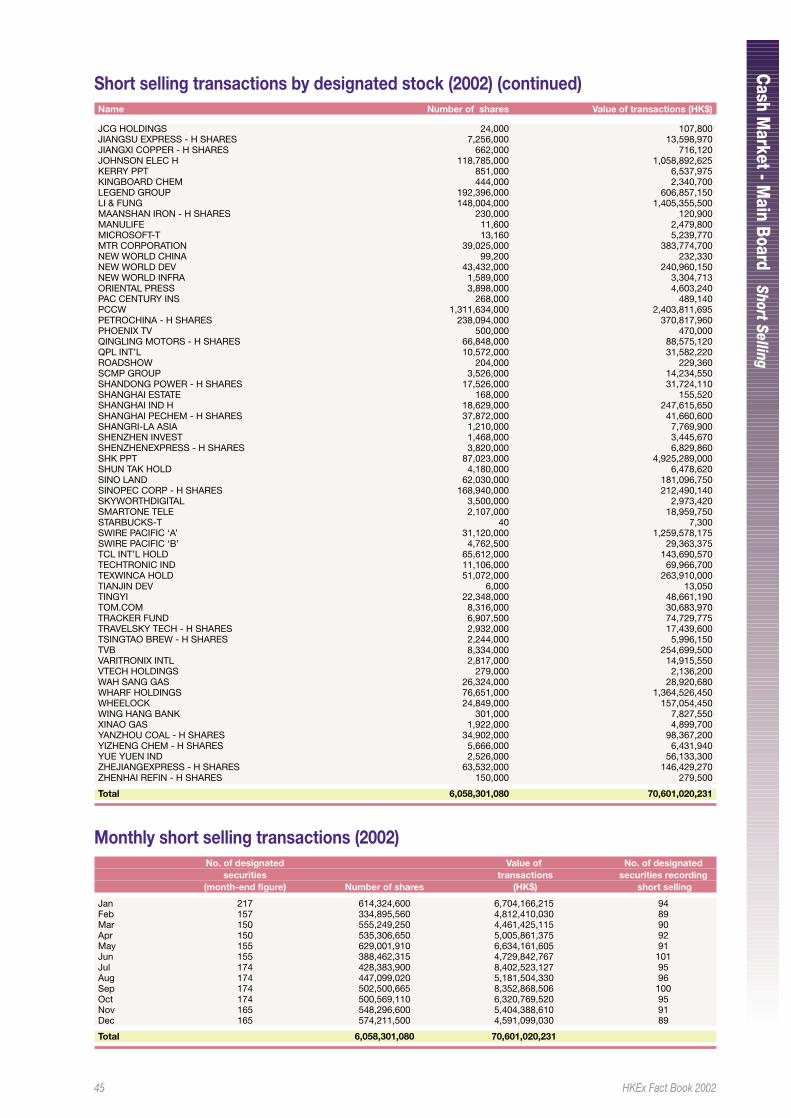
45 HKEx Fact Book 2002
Cash M
arket - Main Boar d
Short Selling
Short selling transactions by designated stock (2002) (continued)Name Number of shares Value of transactions (HK$)
JCG HOLDINGS 24,000 107,800JIANGSU EXPRESS - H SHARES 7,256,000 13,598,970JIANGXI COPPER - H SHARES 662,000 716,120JOHNSON ELEC H 118,785,000 1,058,892,625KERRY PPT 851,000 6,537,975KINGBOARD CHEM 444,000 2,340,700LEGEND GROUP 192,396,000 606,857,150LI & FUNG 148,004,000 1,405,355,500MAANSHAN IRON - H SHARES 230,000 120,900MANULIFE 11,600 2,479,800MICROSOFT-T 13,160 5,239,770MTR CORPORATION 39,025,000 383,774,700NEW WORLD CHINA 99,200 232,330NEW WORLD DEV 43,432,000 240,960,150NEW WORLD INFRA 1,589,000 3,304,713ORIENTAL PRESS 3,898,000 4,603,240PAC CENTURY INS 268,000 489,140PCCW 1,311,634,000 2,403,811,695PETROCHINA - H SHARES 238,094,000 370,817,960PHOENIX TV 500,000 470,000QINGLING MOTORS - H SHARES 66,848,000 88,575,120QPL INT’L 10,572,000 31,582,220ROADSHOW 204,000 229,360SCMP GROUP 3,526,000 14,234,550SHANDONG POWER - H SHARES 17,526,000 31,724,110SHANGHAI ESTATE 168,000 155,520SHANGHAI IND H 18,629,000 247,615,650SHANGHAI PECHEM - H SHARES 37,872,000 41,660,600SHANGRI-LA ASIA 1,210,000 7,769,900SHENZHEN INVEST 1,468,000 3,445,670SHENZHENEXPRESS - H SHARES 3,820,000 6,829,860SHK PPT 87,023,000 4,925,289,000SHUN TAK HOLD 4,180,000 6,478,620SINO LAND 62,030,000 181,096,750SINOPEC CORP - H SHARES 168,940,000 212,490,140SKYWORTHDIGITAL 3,500,000 2,973,420SMARTONE TELE 2,107,000 18,959,750STARBUCKS-T 40 7,300SWIRE PACIFIC ‘A’ 31,120,000 1,259,578,175SWIRE PACIFIC ‘B’ 4,762,500 29,363,375TCL INT’L HOLD 65,612,000 143,690,570TECHTRONIC IND 11,106,000 69,966,700TEXWINCA HOLD 51,072,000 263,910,000TIANJIN DEV 6,000 13,050TINGYI 22,348,000 48,661,190TOM.COM 8,316,000 30,683,970TRACKER FUND 6,907,500 74,729,775TRAVELSKY TECH - H SHARES 2,932,000 17,439,600TSINGTAO BREW - H SHARES 2,244,000 5,996,150TVB 8,334,000 254,699,500VARITRONIX INTL 2,817,000 14,915,550VTECH HOLDINGS 279,000 2,136,200WAH SANG GAS 26,324,000 28,920,680WHARF HOLDINGS 76,651,000 1,364,526,450WHEELOCK 24,849,000 157,054,450WING HANG BANK 301,000 7,827,550XINAO GAS 1,922,000 4,899,700YANZHOU COAL - H SHARES 34,902,000 98,367,200YIZHENG CHEM - H SHARES 5,666,000 6,431,940YUE YUEN IND 2,526,000 56,133,300ZHEJIANGEXPRESS - H SHARES 63,532,000 146,429,270ZHENHAI REFIN - H SHARES 150,000 279,500
Total 6,058,301,080 70,601,020,231
Monthly short selling transactions (2002)No. of designated Value of No. of designated
securities transactions securities recording(month-end figure) Number of shares (HK$) short selling
Jan 217 614,324,600 6,704,166,215 94Feb 157 334,895,560 4,812,410,030 89Mar 150 555,249,250 4,461,425,115 90Apr 150 535,306,650 5,005,861,375 92May 155 629,001,910 6,634,161,605 91Jun 155 388,462,315 4,729,842,767 101Jul 174 428,383,900 8,402,523,127 95Aug 174 447,099,020 5,181,504,330 96Sep 174 502,500,665 8,352,868,506 100Oct 174 500,569,110 6,320,769,520 95Nov 165 548,296,600 5,404,388,610 91Dec 165 574,211,500 4,591,099,030 89
Total 6,058,301,080 70,601,020,231
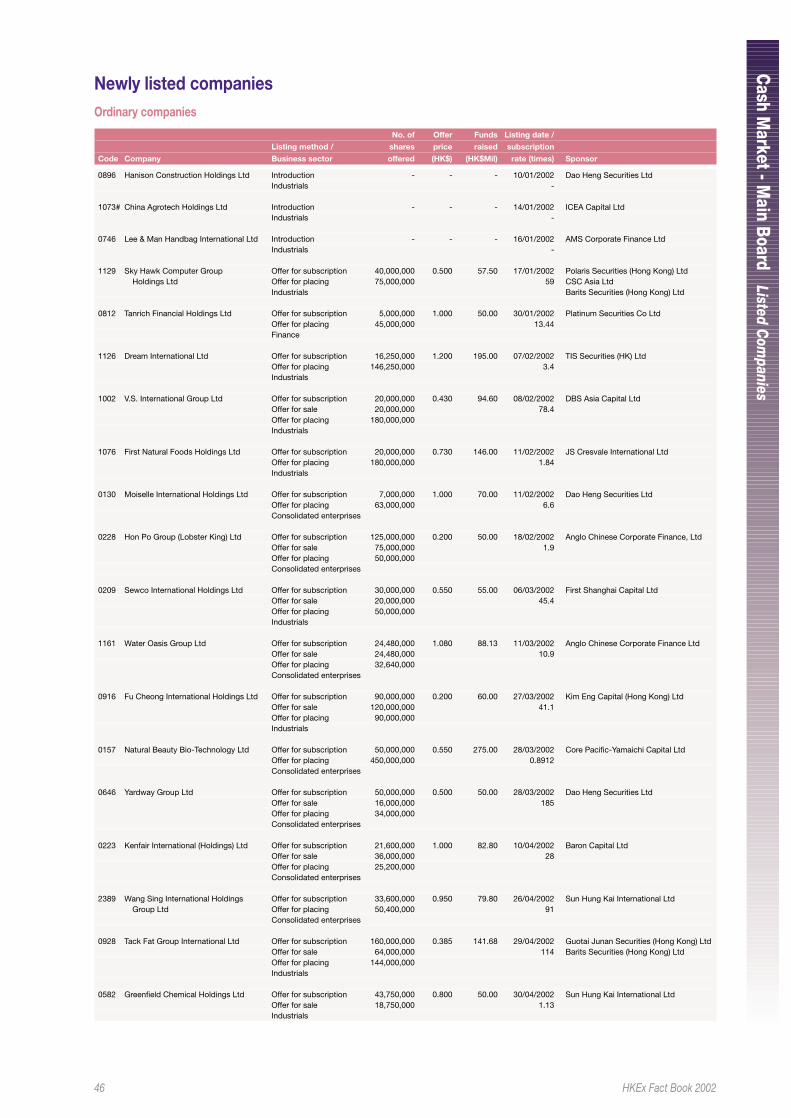
46 HKEx Fact Book 2002
Cash M
arket - Main Boar d
Listed Com
panies
Newly listed companiesOrdinary companies
No. of Offer Funds Listing date /
Listing method / shares price raised subscription
Code Company Business sector offered (HK$) (HK$Mil) rate (times) Sponsor
0896 Hanison Construction Holdings Ltd Introduction - - - 10/01/2002 Dao Heng Securities LtdIndustrials -
1073# China Agrotech Holdings Ltd Introduction - - - 14/01/2002 ICEA Capital LtdIndustrials -
0746 Lee & Man Handbag International Ltd Introduction - - - 16/01/2002 AMS Corporate Finance LtdIndustrials -
1129 Sky Hawk Computer Group Offer for subscription 40,000,000 0.500 57.50 17/01/2002 Polaris Securities (Hong Kong) LtdHoldings Ltd Offer for placing 75,000,000 59 CSC Asia Ltd
Industrials Barits Securities (Hong Kong) Ltd
0812 Tanrich Financial Holdings Ltd Offer for subscription 5,000,000 1.000 50.00 30/01/2002 Platinum Securities Co LtdOffer for placing 45,000,000 13.44Finance
1126 Dream International Ltd Offer for subscription 16,250,000 1.200 195.00 07/02/2002 TIS Securities (HK) LtdOffer for placing 146,250,000 3.4Industrials
1002 V.S. International Group Ltd Offer for subscription 20,000,000 0.430 94.60 08/02/2002 DBS Asia Capital LtdOffer for sale 20,000,000 78.4Offer for placing 180,000,000Industrials
1076 First Natural Foods Holdings Ltd Offer for subscription 20,000,000 0.730 146.00 11/02/2002 JS Cresvale International LtdOffer for placing 180,000,000 1.84Industrials
0130 Moiselle International Holdings Ltd Offer for subscription 7,000,000 1.000 70.00 11/02/2002 Dao Heng Securities LtdOffer for placing 63,000,000 6.6Consolidated enterprises
0228 Hon Po Group (Lobster King) Ltd Offer for subscription 125,000,000 0.200 50.00 18/02/2002 Anglo Chinese Corporate Finance, LtdOffer for sale 75,000,000 1.9Offer for placing 50,000,000Consolidated enterprises
0209 Sewco International Holdings Ltd Offer for subscription 30,000,000 0.550 55.00 06/03/2002 First Shanghai Capital LtdOffer for sale 20,000,000 45.4Offer for placing 50,000,000Industrials
1161 Water Oasis Group Ltd Offer for subscription 24,480,000 1.080 88.13 11/03/2002 Anglo Chinese Corporate Finance LtdOffer for sale 24,480,000 10.9Offer for placing 32,640,000Consolidated enterprises
0916 Fu Cheong International Holdings Ltd Offer for subscription 90,000,000 0.200 60.00 27/03/2002 Kim Eng Capital (Hong Kong) LtdOffer for sale 120,000,000 41.1Offer for placing 90,000,000Industrials
0157 Natural Beauty Bio-Technology Ltd Offer for subscription 50,000,000 0.550 275.00 28/03/2002 Core Pacific-Yamaichi Capital LtdOffer for placing 450,000,000 0.8912Consolidated enterprises
0646 Yardway Group Ltd Offer for subscription 50,000,000 0.500 50.00 28/03/2002 Dao Heng Securities LtdOffer for sale 16,000,000 185Offer for placing 34,000,000Consolidated enterprises
0223 Kenfair International (Holdings) Ltd Offer for subscription 21,600,000 1.000 82.80 10/04/2002 Baron Capital LtdOffer for sale 36,000,000 28Offer for placing 25,200,000Consolidated enterprises
2389 Wang Sing International Holdings Offer for subscription 33,600,000 0.950 79.80 26/04/2002 Sun Hung Kai International LtdGroup Ltd Offer for placing 50,400,000 91
Consolidated enterprises
0928 Tack Fat Group International Ltd Offer for subscription 160,000,000 0.385 141.68 29/04/2002 Guotai Junan Securities (Hong Kong) LtdOffer for sale 64,000,000 114 Barits Securities (Hong Kong) LtdOffer for placing 144,000,000Industrials
0582 Greenfield Chemical Holdings Ltd Offer for subscription 43,750,000 0.800 50.00 30/04/2002 Sun Hung Kai International LtdOffer for sale 18,750,000 1.13Industrials
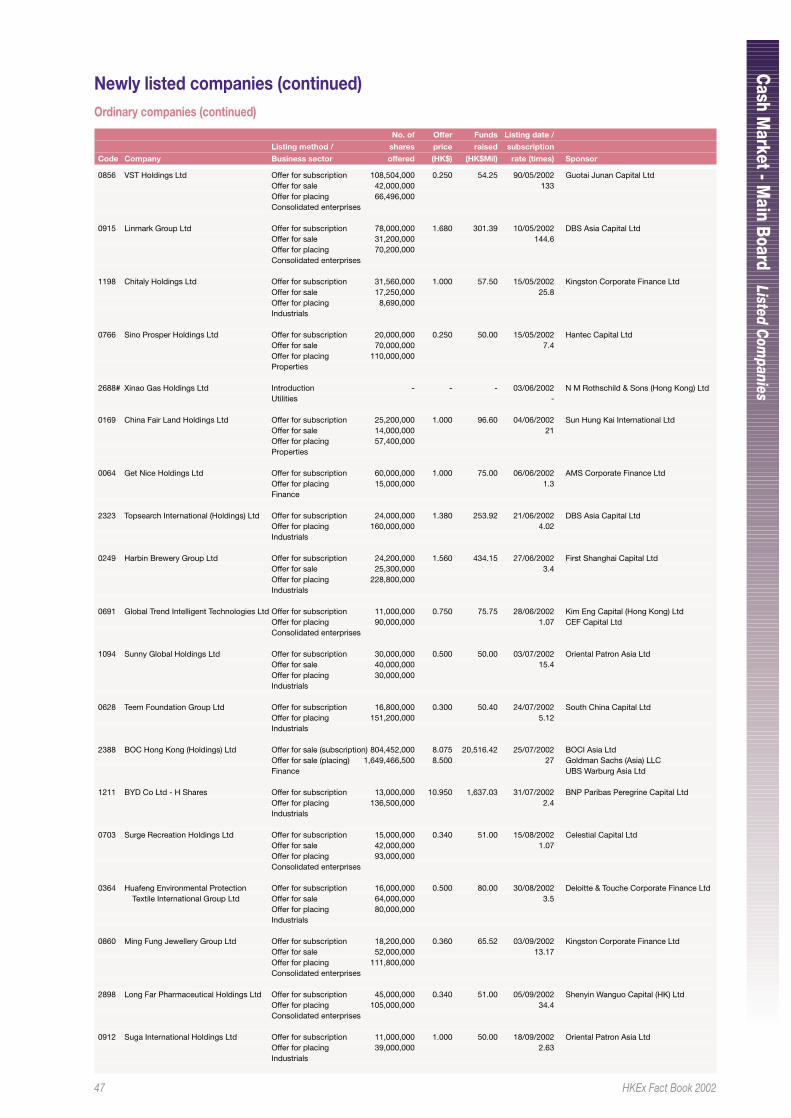
47 HKEx Fact Book 2002
Cash M
arket - Main Boar d
Listed Com
panies
Newly listed companies (continued)Ordinary companies (continued)
No. of Offer Funds Listing date /
Listing method / shares price raised subscription
Code Company Business sector offered (HK$) (HK$Mil) rate (times) Sponsor
0856 VST Holdings Ltd Offer for subscription 108,504,000 0.250 54.25 90/05/2002 Guotai Junan Capital LtdOffer for sale 42,000,000 133Offer for placing 66,496,000Consolidated enterprises
0915 Linmark Group Ltd Offer for subscription 78,000,000 1.680 301.39 10/05/2002 DBS Asia Capital LtdOffer for sale 31,200,000 144.6Offer for placing 70,200,000Consolidated enterprises
1198 Chitaly Holdings Ltd Offer for subscription 31,560,000 1.000 57.50 15/05/2002 Kingston Corporate Finance LtdOffer for sale 17,250,000 25.8Offer for placing 8,690,000Industrials
0766 Sino Prosper Holdings Ltd Offer for subscription 20,000,000 0.250 50.00 15/05/2002 Hantec Capital LtdOffer for sale 70,000,000 7.4Offer for placing 110,000,000Properties
2688# Xinao Gas Holdings Ltd Introduction - - - 03/06/2002 N M Rothschild & Sons (Hong Kong) LtdUtilities -
0169 China Fair Land Holdings Ltd Offer for subscription 25,200,000 1.000 96.60 04/06/2002 Sun Hung Kai International LtdOffer for sale 14,000,000 21Offer for placing 57,400,000Properties
0064 Get Nice Holdings Ltd Offer for subscription 60,000,000 1.000 75.00 06/06/2002 AMS Corporate Finance LtdOffer for placing 15,000,000 1.3Finance
2323 Topsearch International (Holdings) Ltd Offer for subscription 24,000,000 1.380 253.92 21/06/2002 DBS Asia Capital LtdOffer for placing 160,000,000 4.02Industrials
0249 Harbin Brewery Group Ltd Offer for subscription 24,200,000 1.560 434.15 27/06/2002 First Shanghai Capital LtdOffer for sale 25,300,000 3.4Offer for placing 228,800,000Industrials
0691 Global Trend Intelligent Technologies Ltd Offer for subscription 11,000,000 0.750 75.75 28/06/2002 Kim Eng Capital (Hong Kong) LtdOffer for placing 90,000,000 1.07 CEF Capital LtdConsolidated enterprises
1094 Sunny Global Holdings Ltd Offer for subscription 30,000,000 0.500 50.00 03/07/2002 Oriental Patron Asia LtdOffer for sale 40,000,000 15.4Offer for placing 30,000,000Industrials
0628 Teem Foundation Group Ltd Offer for subscription 16,800,000 0.300 50.40 24/07/2002 South China Capital LtdOffer for placing 151,200,000 5.12Industrials
2388 BOC Hong Kong (Holdings) Ltd Offer for sale (subscription) 804,452,000 8.075 20,516.42 25/07/2002 BOCI Asia LtdOffer for sale (placing) 1,649,466,500 8.500 27 Goldman Sachs (Asia) LLCFinance UBS Warburg Asia Ltd
1211 BYD Co Ltd - H Shares Offer for subscription 13,000,000 10.950 1,637.03 31/07/2002 BNP Paribas Peregrine Capital LtdOffer for placing 136,500,000 2.4Industrials
0703 Surge Recreation Holdings Ltd Offer for subscription 15,000,000 0.340 51.00 15/08/2002 Celestial Capital LtdOffer for sale 42,000,000 1.07Offer for placing 93,000,000Consolidated enterprises
0364 Huafeng Environmental Protection Offer for subscription 16,000,000 0.500 80.00 30/08/2002 Deloitte & Touche Corporate Finance LtdTextile International Group Ltd Offer for sale 64,000,000 3.5
Offer for placing 80,000,000Industrials
0860 Ming Fung Jewellery Group Ltd Offer for subscription 18,200,000 0.360 65.52 03/09/2002 Kingston Corporate Finance LtdOffer for sale 52,000,000 13.17Offer for placing 111,800,000Consolidated enterprises
2898 Long Far Pharmaceutical Holdings Ltd Offer for subscription 45,000,000 0.340 51.00 05/09/2002 Shenyin Wanguo Capital (HK) LtdOffer for placing 105,000,000 34.4Consolidated enterprises
0912 Suga International Holdings Ltd Offer for subscription 11,000,000 1.000 50.00 18/09/2002 Oriental Patron Asia LtdOffer for placing 39,000,000 2.63Industrials
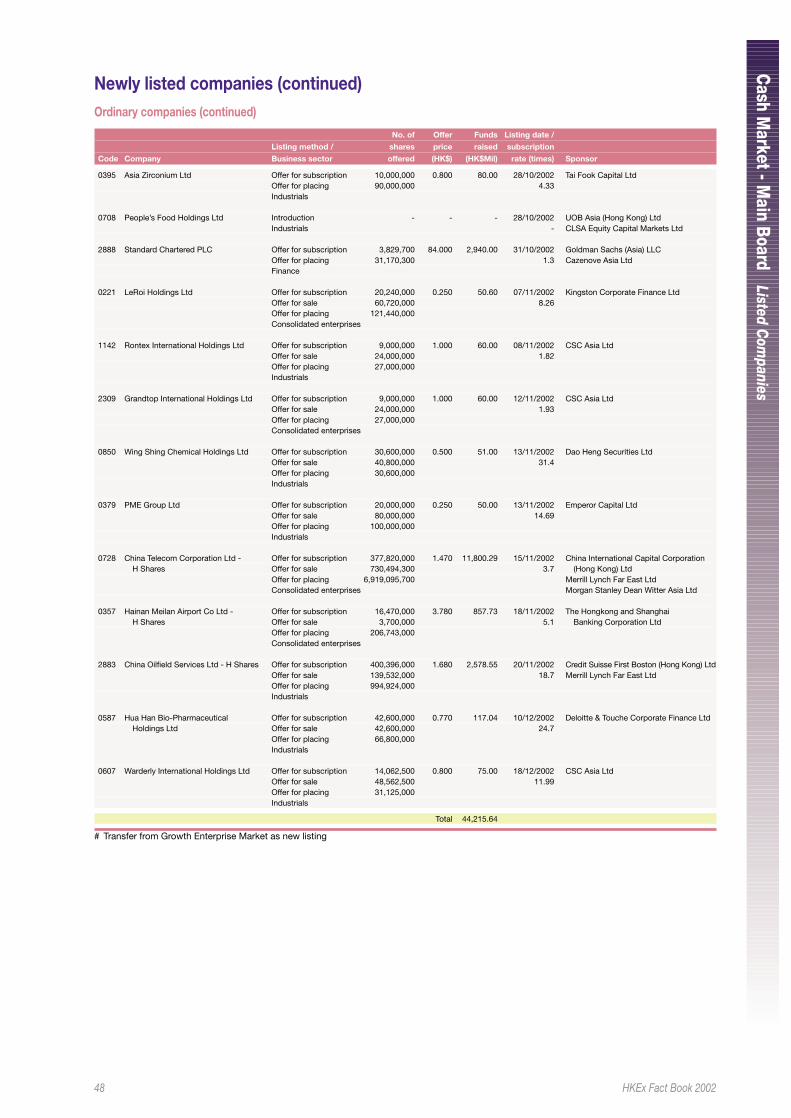
48 HKEx Fact Book 2002
Cash M
arket - Main Boar d
Listed Com
panies
Newly listed companies (continued)Ordinary companies (continued)
No. of Offer Funds Listing date /
Listing method / shares price raised subscription
Code Company Business sector offered (HK$) (HK$Mil) rate (times) Sponsor
0395 Asia Zirconium Ltd Offer for subscription 10,000,000 0.800 80.00 28/10/2002 Tai Fook Capital LtdOffer for placing 90,000,000 4.33Industrials
0708 People’s Food Holdings Ltd Introduction - - - 28/10/2002 UOB Asia (Hong Kong) LtdIndustrials - CLSA Equity Capital Markets Ltd
2888 Standard Chartered PLC Offer for subscription 3,829,700 84.000 2,940.00 31/10/2002 Goldman Sachs (Asia) LLCOffer for placing 31,170,300 1.3 Cazenove Asia LtdFinance
0221 LeRoi Holdings Ltd Offer for subscription 20,240,000 0.250 50.60 07/11/2002 Kingston Corporate Finance LtdOffer for sale 60,720,000 8.26Offer for placing 121,440,000Consolidated enterprises
1142 Rontex International Holdings Ltd Offer for subscription 9,000,000 1.000 60.00 08/11/2002 CSC Asia LtdOffer for sale 24,000,000 1.82Offer for placing 27,000,000Industrials
2309 Grandtop International Holdings Ltd Offer for subscription 9,000,000 1.000 60.00 12/11/2002 CSC Asia LtdOffer for sale 24,000,000 1.93Offer for placing 27,000,000Consolidated enterprises
0850 Wing Shing Chemical Holdings Ltd Offer for subscription 30,600,000 0.500 51.00 13/11/2002 Dao Heng Securities LtdOffer for sale 40,800,000 31.4Offer for placing 30,600,000Industrials
0379 PME Group Ltd Offer for subscription 20,000,000 0.250 50.00 13/11/2002 Emperor Capital LtdOffer for sale 80,000,000 14.69Offer for placing 100,000,000Industrials
0728 China Telecom Corporation Ltd - Offer for subscription 377,820,000 1.470 11,800.29 15/11/2002 China International Capital CorporationH Shares Offer for sale 730,494,300 3.7 (Hong Kong) Ltd
Offer for placing 6,919,095,700 Merrill Lynch Far East LtdConsolidated enterprises Morgan Stanley Dean Witter Asia Ltd
0357 Hainan Meilan Airport Co Ltd - Offer for subscription 16,470,000 3.780 857.73 18/11/2002 The Hongkong and ShanghaiH Shares Offer for sale 3,700,000 5.1 Banking Corporation Ltd
Offer for placing 206,743,000Consolidated enterprises
2883 China Oilfield Services Ltd - H Shares Offer for subscription 400,396,000 1.680 2,578.55 20/11/2002 Credit Suisse First Boston (Hong Kong) LtdOffer for sale 139,532,000 18.7 Merrill Lynch Far East LtdOffer for placing 994,924,000Industrials
0587 Hua Han Bio-Pharmaceutical Offer for subscription 42,600,000 0.770 117.04 10/12/2002 Deloitte & Touche Corporate Finance LtdHoldings Ltd Offer for sale 42,600,000 24.7
Offer for placing 66,800,000Industrials
0607 Warderly International Holdings Ltd Offer for subscription 14,062,500 0.800 75.00 18/12/2002 CSC Asia LtdOffer for sale 48,562,500 11.99Offer for placing 31,125,000Industrials
Total 44,215.64
# Transfer from Growth Enterprise Market as new listing
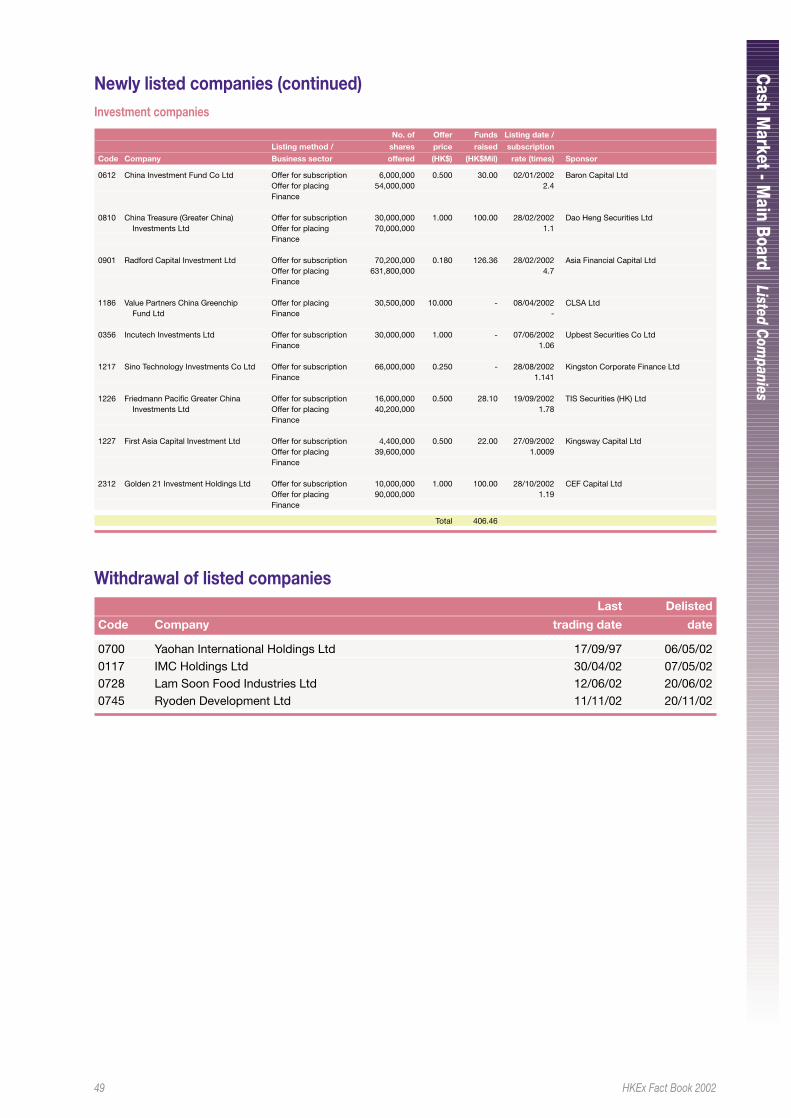
49 HKEx Fact Book 2002
Cash M
arket - Main Boar d
Listed Com
panies
Newly listed companies (continued)Investment companies
No. of Offer Funds Listing date /
Listing method / shares price raised subscription
Code Company Business sector offered (HK$) (HK$Mil) rate (times) Sponsor
0612 China Investment Fund Co Ltd Offer for subscription 6,000,000 0.500 30.00 02/01/2002 Baron Capital LtdOffer for placing 54,000,000 2.4Finance
0810 China Treasure (Greater China) Offer for subscription 30,000,000 1.000 100.00 28/02/2002 Dao Heng Securities LtdInvestments Ltd Offer for placing 70,000,000 1.1
Finance
0901 Radford Capital Investment Ltd Offer for subscription 70,200,000 0.180 126.36 28/02/2002 Asia Financial Capital LtdOffer for placing 631,800,000 4.7Finance
1186 Value Partners China Greenchip Offer for placing 30,500,000 10.000 - 08/04/2002 CLSA LtdFund Ltd Finance -
0356 Incutech Investments Ltd Offer for subscription 30,000,000 1.000 - 07/06/2002 Upbest Securities Co LtdFinance 1.06
1217 Sino Technology Investments Co Ltd Offer for subscription 66,000,000 0.250 - 28/08/2002 Kingston Corporate Finance LtdFinance 1.141
1226 Friedmann Pacific Greater China Offer for subscription 16,000,000 0.500 28.10 19/09/2002 TIS Securities (HK) LtdInvestments Ltd Offer for placing 40,200,000 1.78
Finance
1227 First Asia Capital Investment Ltd Offer for subscription 4,400,000 0.500 22.00 27/09/2002 Kingsway Capital LtdOffer for placing 39,600,000 1.0009Finance
2312 Golden 21 Investment Holdings Ltd Offer for subscription 10,000,000 1.000 100.00 28/10/2002 CEF Capital LtdOffer for placing 90,000,000 1.19Finance
Total 406.46
Withdrawal of listed companiesLast Delisted
Code Company trading date date
0700 Yaohan International Holdings Ltd 17/09/97 06/05/020117 IMC Holdings Ltd 30/04/02 07/05/020728 Lam Soon Food Industries Ltd 12/06/02 20/06/020745 Ryoden Development Ltd 11/11/02 20/11/02
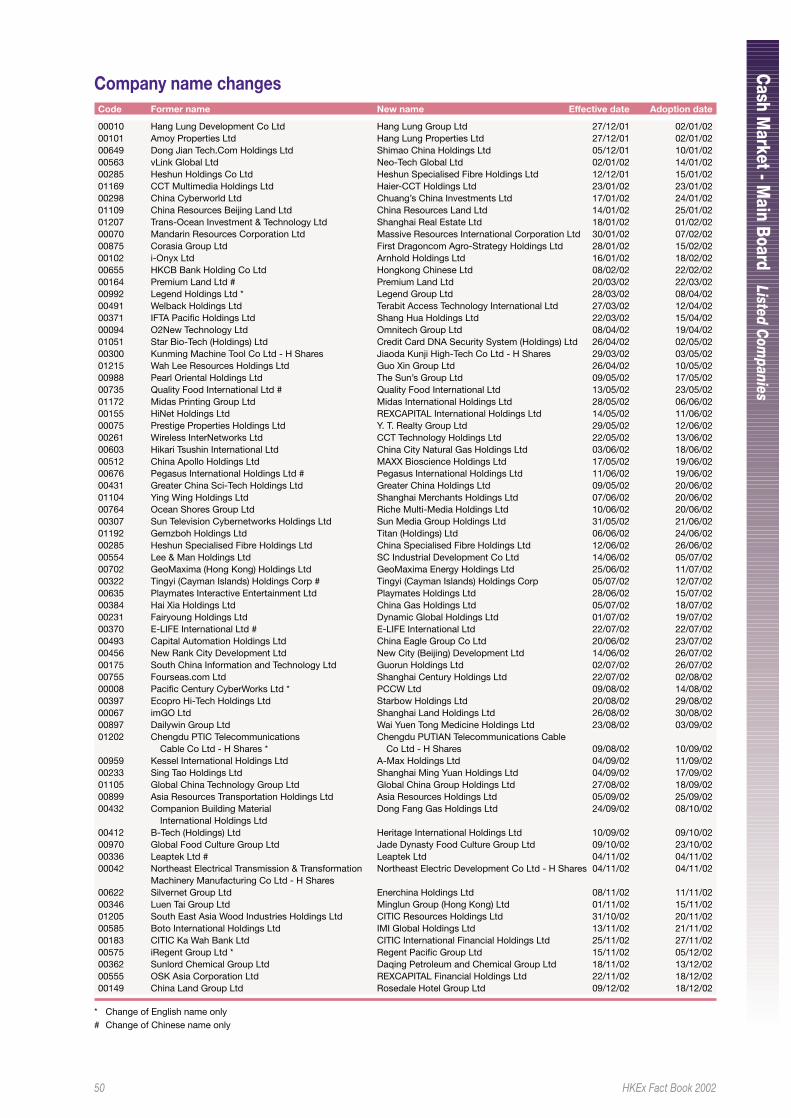
50 HKEx Fact Book 2002
Cash M
arket - Main Boar d
Listed Com
panies
Company name changesCode Former name New name Effective date Adoption date
00010 Hang Lung Development Co Ltd Hang Lung Group Ltd 27/12/01 02/01/0200101 Amoy Properties Ltd Hang Lung Properties Ltd 27/12/01 02/01/0200649 Dong Jian Tech.Com Holdings Ltd Shimao China Holdings Ltd 05/12/01 10/01/0200563 vLink Global Ltd Neo-Tech Global Ltd 02/01/02 14/01/0200285 Heshun Holdings Co Ltd Heshun Specialised Fibre Holdings Ltd 12/12/01 15/01/0201169 CCT Multimedia Holdings Ltd Haier-CCT Holdings Ltd 23/01/02 23/01/0200298 China Cyberworld Ltd Chuang’s China Investments Ltd 17/01/02 24/01/0201109 China Resources Beijing Land Ltd China Resources Land Ltd 14/01/02 25/01/0201207 Trans-Ocean Investment & Technology Ltd Shanghai Real Estate Ltd 18/01/02 01/02/0200070 Mandarin Resources Corporation Ltd Massive Resources International Corporation Ltd 30/01/02 07/02/0200875 Corasia Group Ltd First Dragoncom Agro-Strategy Holdings Ltd 28/01/02 15/02/0200102 i-Onyx Ltd Arnhold Holdings Ltd 16/01/02 18/02/0200655 HKCB Bank Holding Co Ltd Hongkong Chinese Ltd 08/02/02 22/02/0200164 Premium Land Ltd # Premium Land Ltd 20/03/02 22/03/0200992 Legend Holdings Ltd * Legend Group Ltd 28/03/02 08/04/0200491 Welback Holdings Ltd Terabit Access Technology International Ltd 27/03/02 12/04/0200371 IFTA Pacific Holdings Ltd Shang Hua Holdings Ltd 22/03/02 15/04/0200094 O2New Technology Ltd Omnitech Group Ltd 08/04/02 19/04/0201051 Star Bio-Tech (Holdings) Ltd Credit Card DNA Security System (Holdings) Ltd 26/04/02 02/05/0200300 Kunming Machine Tool Co Ltd - H Shares Jiaoda Kunji High-Tech Co Ltd - H Shares 29/03/02 03/05/0201215 Wah Lee Resources Holdings Ltd Guo Xin Group Ltd 26/04/02 10/05/0200988 Pearl Oriental Holdings Ltd The Sun’s Group Ltd 09/05/02 17/05/0200735 Quality Food International Ltd # Quality Food International Ltd 13/05/02 23/05/0201172 Midas Printing Group Ltd Midas International Holdings Ltd 28/05/02 06/06/0200155 HiNet Holdings Ltd REXCAPITAL International Holdings Ltd 14/05/02 11/06/0200075 Prestige Properties Holdings Ltd Y. T. Realty Group Ltd 29/05/02 12/06/0200261 Wireless InterNetworks Ltd CCT Technology Holdings Ltd 22/05/02 13/06/0200603 Hikari Tsushin International Ltd China City Natural Gas Holdings Ltd 03/06/02 18/06/0200512 China Apollo Holdings Ltd MAXX Bioscience Holdings Ltd 17/05/02 19/06/0200676 Pegasus International Holdings Ltd # Pegasus International Holdings Ltd 11/06/02 19/06/0200431 Greater China Sci-Tech Holdings Ltd Greater China Holdings Ltd 09/05/02 20/06/0201104 Ying Wing Holdings Ltd Shanghai Merchants Holdings Ltd 07/06/02 20/06/0200764 Ocean Shores Group Ltd Riche Multi-Media Holdings Ltd 10/06/02 20/06/0200307 Sun Television Cybernetworks Holdings Ltd Sun Media Group Holdings Ltd 31/05/02 21/06/0201192 Gemzboh Holdings Ltd Titan (Holdings) Ltd 06/06/02 24/06/0200285 Heshun Specialised Fibre Holdings Ltd China Specialised Fibre Holdings Ltd 12/06/02 26/06/0200554 Lee & Man Holdings Ltd SC Industrial Development Co Ltd 14/06/02 05/07/0200702 GeoMaxima (Hong Kong) Holdings Ltd GeoMaxima Energy Holdings Ltd 25/06/02 11/07/0200322 Tingyi (Cayman Islands) Holdings Corp # Tingyi (Cayman Islands) Holdings Corp 05/07/02 12/07/0200635 Playmates Interactive Entertainment Ltd Playmates Holdings Ltd 28/06/02 15/07/0200384 Hai Xia Holdings Ltd China Gas Holdings Ltd 05/07/02 18/07/0200231 Fairyoung Holdings Ltd Dynamic Global Holdings Ltd 01/07/02 19/07/0200370 E-LIFE International Ltd # E-LIFE International Ltd 22/07/02 22/07/0200493 Capital Automation Holdings Ltd China Eagle Group Co Ltd 20/06/02 23/07/0200456 New Rank City Development Ltd New City (Beijing) Development Ltd 14/06/02 26/07/0200175 South China Information and Technology Ltd Guorun Holdings Ltd 02/07/02 26/07/0200755 Fourseas.com Ltd Shanghai Century Holdings Ltd 22/07/02 02/08/0200008 Pacific Century CyberWorks Ltd * PCCW Ltd 09/08/02 14/08/0200397 Ecopro Hi-Tech Holdings Ltd Starbow Holdings Ltd 20/08/02 29/08/0200067 imGO Ltd Shanghai Land Holdings Ltd 26/08/02 30/08/0200897 Dailywin Group Ltd Wai Yuen Tong Medicine Holdings Ltd 23/08/02 03/09/0201202 Chengdu PTIC Telecommunications Chengdu PUTIAN Telecommunications Cable
Cable Co Ltd - H Shares * Co Ltd - H Shares 09/08/02 10/09/0200959 Kessel International Holdings Ltd A-Max Holdings Ltd 04/09/02 11/09/0200233 Sing Tao Holdings Ltd Shanghai Ming Yuan Holdings Ltd 04/09/02 17/09/0201105 Global China Technology Group Ltd Global China Group Holdings Ltd 27/08/02 18/09/0200899 Asia Resources Transportation Holdings Ltd Asia Resources Holdings Ltd 05/09/02 25/09/0200432 Companion Building Material Dong Fang Gas Holdings Ltd 24/09/02 08/10/02
International Holdings Ltd00412 B-Tech (Holdings) Ltd Heritage International Holdings Ltd 10/09/02 09/10/0200970 Global Food Culture Group Ltd Jade Dynasty Food Culture Group Ltd 09/10/02 23/10/0200336 Leaptek Ltd # Leaptek Ltd 04/11/02 04/11/0200042 Northeast Electrical Transmission & Transformation Northeast Electric Development Co Ltd - H Shares 04/11/02 04/11/02
Machinery Manufacturing Co Ltd - H Shares00622 Silvernet Group Ltd Enerchina Holdings Ltd 08/11/02 11/11/0200346 Luen Tai Group Ltd Minglun Group (Hong Kong) Ltd 01/11/02 15/11/0201205 South East Asia Wood Industries Holdings Ltd CITIC Resources Holdings Ltd 31/10/02 20/11/0200585 Boto International Holdings Ltd IMI Global Holdings Ltd 13/11/02 21/11/0200183 CITIC Ka Wah Bank Ltd CITIC International Financial Holdings Ltd 25/11/02 27/11/0200575 iRegent Group Ltd * Regent Pacific Group Ltd 15/11/02 05/12/0200362 Sunlord Chemical Group Ltd Daqing Petroleum and Chemical Group Ltd 18/11/02 13/12/0200555 OSK Asia Corporation Ltd REXCAPITAL Financial Holdings Ltd 22/11/02 18/12/0200149 China Land Group Ltd Rosedale Hotel Group Ltd 09/12/02 18/12/02
* Change of English name only# Change of Chinese name only
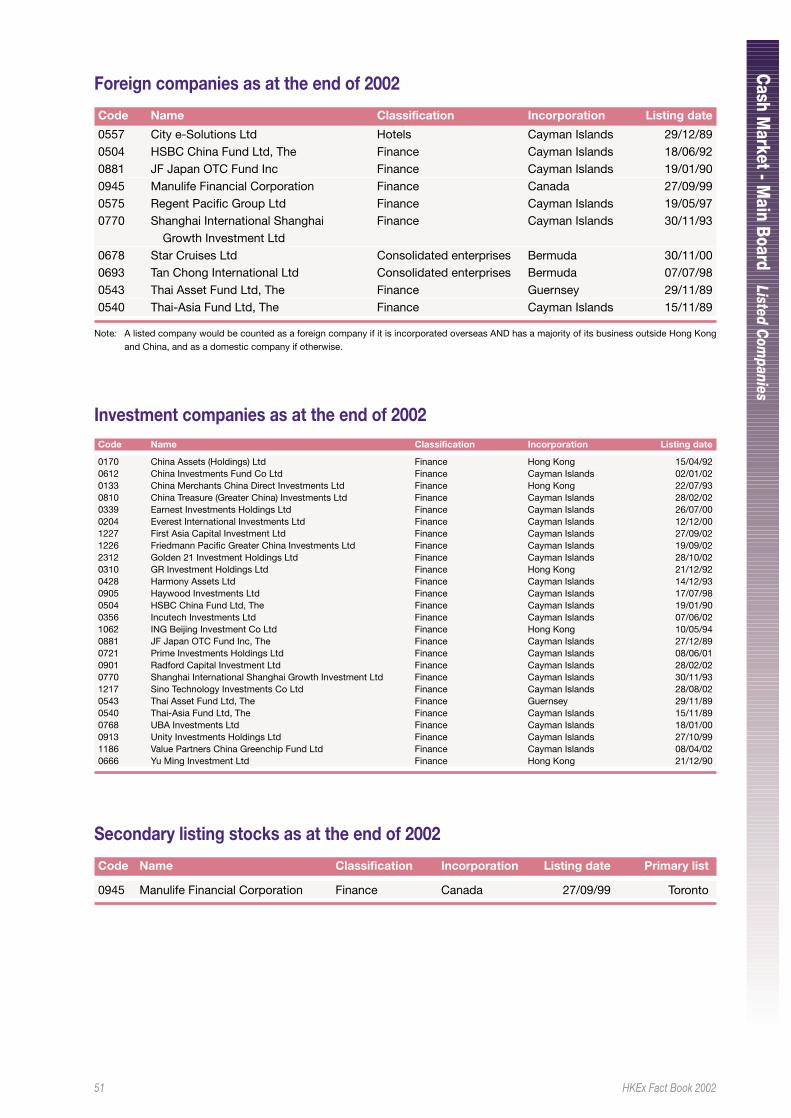
51 HKEx Fact Book 2002
Cash M
arket - Main Boar d
Listed Com
panies
Investment companies as at the end of 2002Code Name Classification Incorporation Listing date
0170 China Assets (Holdings) Ltd Finance Hong Kong 15/04/920612 China Investments Fund Co Ltd Finance Cayman Islands 02/01/020133 China Merchants China Direct Investments Ltd Finance Hong Kong 22/07/930810 China Treasure (Greater China) Investments Ltd Finance Cayman Islands 28/02/020339 Earnest Investments Holdings Ltd Finance Cayman Islands 26/07/000204 Everest International Investments Ltd Finance Cayman Islands 12/12/001227 First Asia Capital Investment Ltd Finance Cayman Islands 27/09/021226 Friedmann Pacific Greater China Investments Ltd Finance Cayman Islands 19/09/022312 Golden 21 Investment Holdings Ltd Finance Cayman Islands 28/10/020310 GR Investment Holdings Ltd Finance Hong Kong 21/12/920428 Harmony Assets Ltd Finance Cayman Islands 14/12/930905 Haywood Investments Ltd Finance Cayman Islands 17/07/980504 HSBC China Fund Ltd, The Finance Cayman Islands 19/01/900356 Incutech Investments Ltd Finance Cayman Islands 07/06/021062 ING Beijing Investment Co Ltd Finance Hong Kong 10/05/940881 JF Japan OTC Fund Inc, The Finance Cayman Islands 27/12/890721 Prime Investments Holdings Ltd Finance Cayman Islands 08/06/010901 Radford Capital Investment Ltd Finance Cayman Islands 28/02/020770 Shanghai International Shanghai Growth Investment Ltd Finance Cayman Islands 30/11/931217 Sino Technology Investments Co Ltd Finance Cayman Islands 28/08/020543 Thai Asset Fund Ltd, The Finance Guernsey 29/11/890540 Thai-Asia Fund Ltd, The Finance Cayman Islands 15/11/890768 UBA Investments Ltd Finance Cayman Islands 18/01/000913 Unity Investments Holdings Ltd Finance Cayman Islands 27/10/991186 Value Partners China Greenchip Fund Ltd Finance Cayman Islands 08/04/020666 Yu Ming Investment Ltd Finance Hong Kong 21/12/90
Secondary listing stocks as at the end of 2002
Code Name Classification Incorporation Listing date Primary list
0945 Manulife Financial Corporation Finance Canada 27/09/99 Toronto
Foreign companies as at the end of 2002
Code Name Classification Incorporation Listing date
0557 City e-Solutions Ltd Hotels Cayman Islands 29/12/890504 HSBC China Fund Ltd, The Finance Cayman Islands 18/06/920881 JF Japan OTC Fund Inc Finance Cayman Islands 19/01/900945 Manulife Financial Corporation Finance Canada 27/09/990575 Regent Pacific Group Ltd Finance Cayman Islands 19/05/970770 Shanghai International Shanghai Finance Cayman Islands 30/11/93
Growth Investment Ltd0678 Star Cruises Ltd Consolidated enterprises Bermuda 30/11/000693 Tan Chong International Ltd Consolidated enterprises Bermuda 07/07/980543 Thai Asset Fund Ltd, The Finance Guernsey 29/11/890540 Thai-Asia Fund Ltd, The Finance Cayman Islands 15/11/89
Note: A listed company would be counted as a foreign company if it is incorporated overseas AND has a majority of its business outside Hong Kongand China, and as a domestic company if otherwise.
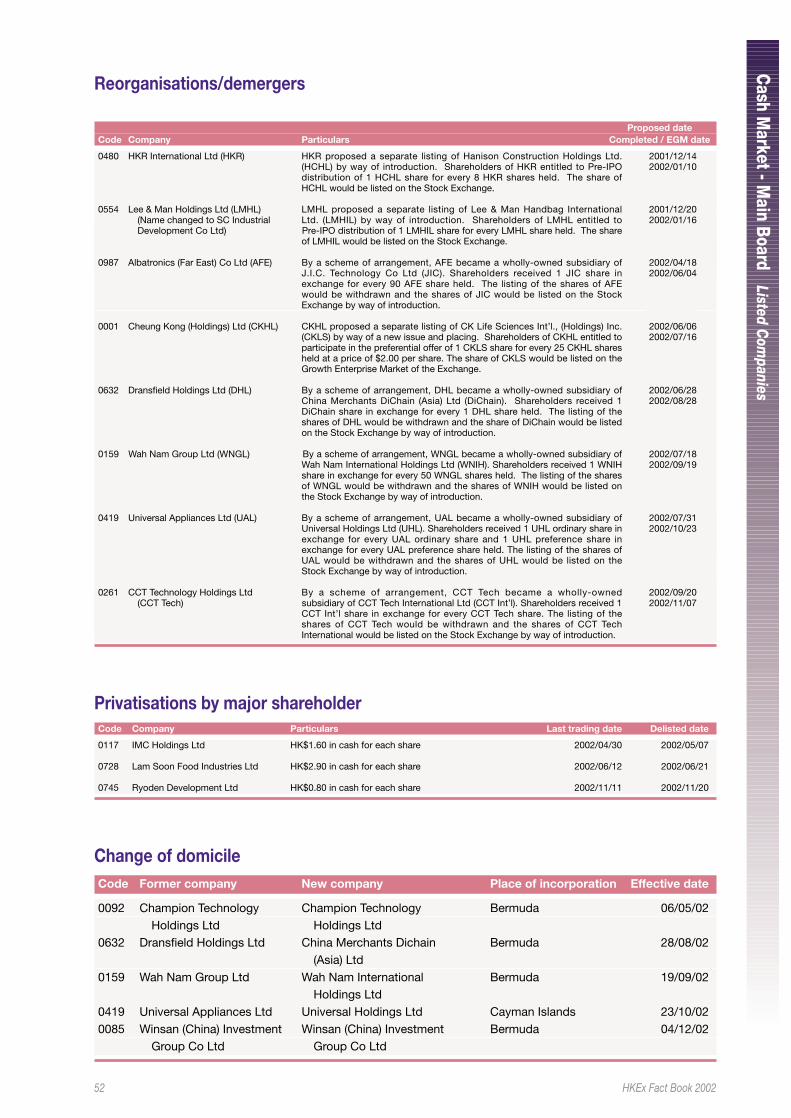
52 HKEx Fact Book 2002
Cash M
arket - Main Boar d
Listed Com
panies
Privatisations by major shareholderCode Company Particulars Last trading date Delisted date
0117 IMC Holdings Ltd HK$1.60 in cash for each share 2002/04/30 2002/05/07
0728 Lam Soon Food Industries Ltd HK$2.90 in cash for each share 2002/06/12 2002/06/21
0745 Ryoden Development Ltd HK$0.80 in cash for each share 2002/11/11 2002/11/20
Change of domicileCode Former company New company Place of incorporation Effective date
0092 Champion Technology Champion Technology Bermuda 06/05/02Holdings Ltd Holdings Ltd
0632 Dransfield Holdings Ltd China Merchants Dichain Bermuda 28/08/02(Asia) Ltd
0159 Wah Nam Group Ltd Wah Nam International Bermuda 19/09/02Holdings Ltd
0419 Universal Appliances Ltd Universal Holdings Ltd Cayman Islands 23/10/020085 Winsan (China) Investment Winsan (China) Investment Bermuda 04/12/02
Group Co Ltd Group Co Ltd
Reorganisations/demergers
Proposed dateCode Company Particulars Completed / EGM date
0480 HKR International Ltd (HKR) HKR proposed a separate listing of Hanison Construction Holdings Ltd.(HCHL) by way of introduction. Shareholders of HKR entitled to Pre-IPOdistribution of 1 HCHL share for every 8 HKR shares held. The share ofHCHL would be listed on the Stock Exchange.
0554 Lee & Man Holdings Ltd (LMHL) LMHL proposed a separate listing of Lee & Man Handbag International(Name changed to SC Industrial Ltd. (LMHIL) by way of introduction. Shareholders of LMHL entitled toDevelopment Co Ltd) Pre-IPO distribution of 1 LMHIL share for every LMHL share held. The share
of LMHIL would be listed on the Stock Exchange.
0987 Albatronics (Far East) Co Ltd (AFE) By a scheme of arrangement, AFE became a wholly-owned subsidiary ofJ.I.C. Technology Co Ltd (JIC). Shareholders received 1 JIC share inexchange for every 90 AFE share held. The listing of the shares of AFEwould be withdrawn and the shares of JIC would be listed on the StockExchange by way of introduction.
0001 Cheung Kong (Holdings) Ltd (CKHL) CKHL proposed a separate listing of CK Life Sciences Int’l., (Holdings) Inc.(CKLS) by way of a new issue and placing. Shareholders of CKHL entitled toparticipate in the preferential offer of 1 CKLS share for every 25 CKHL sharesheld at a price of $2.00 per share. The share of CKLS would be listed on theGrowth Enterprise Market of the Exchange.
0632 Dransfield Holdings Ltd (DHL) By a scheme of arrangement, DHL became a wholly-owned subsidiary ofChina Merchants DiChain (Asia) Ltd (DiChain). Shareholders received 1DiChain share in exchange for every 1 DHL share held. The listing of theshares of DHL would be withdrawn and the share of DiChain would be listedon the Stock Exchange by way of introduction.
0159 Wah Nam Group Ltd (WNGL) By a scheme of arrangement, WNGL became a wholly-owned subsidiary ofWah Nam International Holdings Ltd (WNIH). Shareholders received 1 WNIHshare in exchange for every 50 WNGL shares held. The listing of the sharesof WNGL would be withdrawn and the shares of WNIH would be listed onthe Stock Exchange by way of introduction.
0419 Universal Appliances Ltd (UAL) By a scheme of arrangement, UAL became a wholly-owned subsidiary ofUniversal Holdings Ltd (UHL). Shareholders received 1 UHL ordinary share inexchange for every UAL ordinary share and 1 UHL preference share inexchange for every UAL preference share held. The listing of the shares ofUAL would be withdrawn and the shares of UHL would be listed on theStock Exchange by way of introduction.
0261 CCT Technology Holdings Ltd By a scheme of arrangement, CCT Tech became a wholly-owned(CCT Tech) subsidiary of CCT Tech International Ltd (CCT Int’l). Shareholders received 1
CCT Int’l share in exchange for every CCT Tech share. The listing of theshares of CCT Tech would be withdrawn and the shares of CCT TechInternational would be listed on the Stock Exchange by way of introduction.
2001/12/142002/01/10
2001/12/202002/01/16
2002/04/182002/06/04
2002/06/062002/07/16
2002/06/282002/08/28
2002/07/182002/09/19
2002/07/312002/10/23
2002/09/202002/11/07
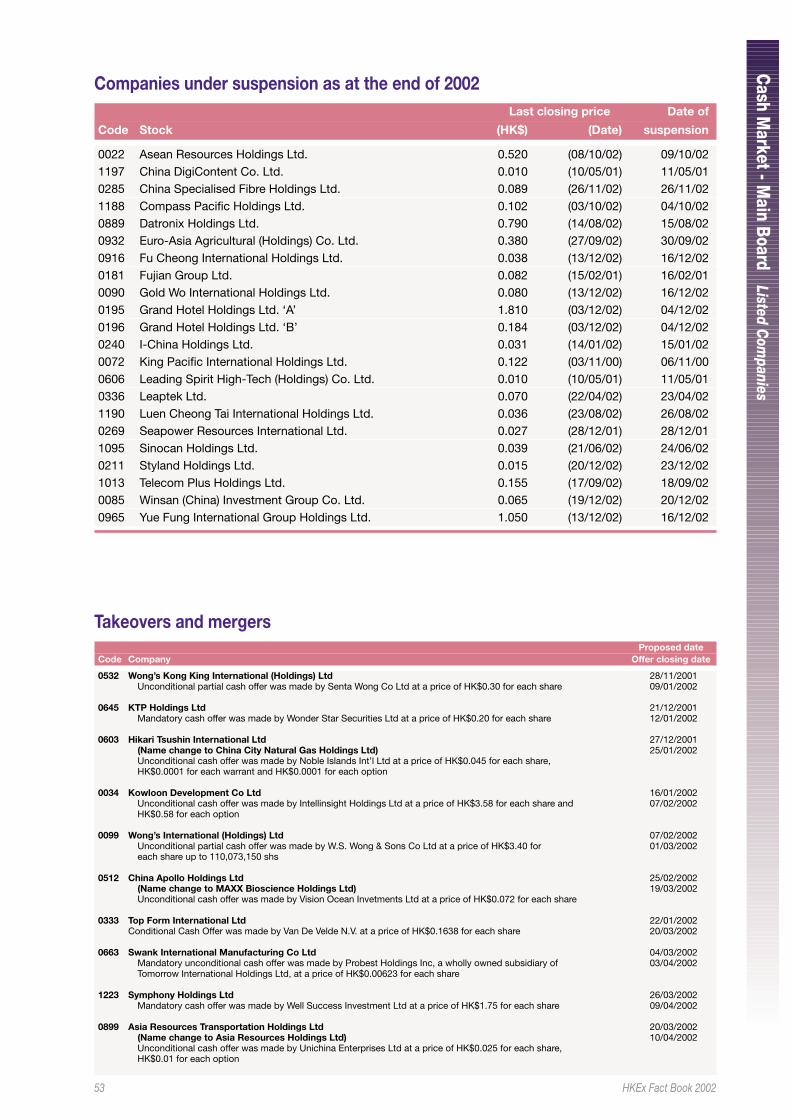
53 HKEx Fact Book 2002
Cash M
arket - Main Boar d
Listed Com
panies
Companies under suspension as at the end of 2002 Last closing price Date of
Code Stock (HK$) (Date) suspension
0022 Asean Resources Holdings Ltd. 0.520 (08/10/02) 09/10/021197 China DigiContent Co. Ltd. 0.010 (10/05/01) 11/05/010285 China Specialised Fibre Holdings Ltd. 0.089 (26/11/02) 26/11/021188 Compass Pacific Holdings Ltd. 0.102 (03/10/02) 04/10/020889 Datronix Holdings Ltd. 0.790 (14/08/02) 15/08/020932 Euro-Asia Agricultural (Holdings) Co. Ltd. 0.380 (27/09/02) 30/09/020916 Fu Cheong International Holdings Ltd. 0.038 (13/12/02) 16/12/020181 Fujian Group Ltd. 0.082 (15/02/01) 16/02/010090 Gold Wo International Holdings Ltd. 0.080 (13/12/02) 16/12/020195 Grand Hotel Holdings Ltd. ‘A’ 1.810 (03/12/02) 04/12/020196 Grand Hotel Holdings Ltd. ‘B’ 0.184 (03/12/02) 04/12/020240 I-China Holdings Ltd. 0.031 (14/01/02) 15/01/020072 King Pacific International Holdings Ltd. 0.122 (03/11/00) 06/11/000606 Leading Spirit High-Tech (Holdings) Co. Ltd. 0.010 (10/05/01) 11/05/010336 Leaptek Ltd. 0.070 (22/04/02) 23/04/021190 Luen Cheong Tai International Holdings Ltd. 0.036 (23/08/02) 26/08/020269 Seapower Resources International Ltd. 0.027 (28/12/01) 28/12/011095 Sinocan Holdings Ltd. 0.039 (21/06/02) 24/06/020211 Styland Holdings Ltd. 0.015 (20/12/02) 23/12/021013 Telecom Plus Holdings Ltd. 0.155 (17/09/02) 18/09/020085 Winsan (China) Investment Group Co. Ltd. 0.065 (19/12/02) 20/12/020965 Yue Fung International Group Holdings Ltd. 1.050 (13/12/02) 16/12/02
Takeovers and mergersProposed date
Code Company Offer closing date
0532 Wong’s Kong King International (Holdings) Ltd 28/11/2001Unconditional partial cash offer was made by Senta Wong Co Ltd at a price of HK$0.30 for each share 09/01/2002
0645 KTP Holdings Ltd 21/12/2001Mandatory cash offer was made by Wonder Star Securities Ltd at a price of HK$0.20 for each share 12/01/2002
0603 Hikari Tsushin International Ltd 27/12/2001(Name change to China City Natural Gas Holdings Ltd) 25/01/2002Unconditional cash offer was made by Noble Islands Int’l Ltd at a price of HK$0.045 for each share,HK$0.0001 for each warrant and HK$0.0001 for each option
0034 Kowloon Development Co Ltd 16/01/2002Unconditional cash offer was made by Intellinsight Holdings Ltd at a price of HK$3.58 for each share and 07/02/2002HK$0.58 for each option
0099 Wong’s International (Holdings) Ltd 07/02/2002Unconditional partial cash offer was made by W.S. Wong & Sons Co Ltd at a price of HK$3.40 for 01/03/2002each share up to 110,073,150 shs
0512 China Apollo Holdings Ltd 25/02/2002(Name change to MAXX Bioscience Holdings Ltd) 19/03/2002Unconditional cash offer was made by Vision Ocean Invetments Ltd at a price of HK$0.072 for each share
0333 Top Form International Ltd 22/01/2002Conditional Cash Offer was made by Van De Velde N.V. at a price of HK$0.1638 for each share 20/03/2002
0663 Swank International Manufacturing Co Ltd 04/03/2002Mandatory unconditional cash offer was made by Probest Holdings Inc, a wholly owned subsidiary of 03/04/2002Tomorrow International Holdings Ltd, at a price of HK$0.00623 for each share
1223 Symphony Holdings Ltd 26/03/2002Mandatory cash offer was made by Well Success Investment Ltd at a price of HK$1.75 for each share 09/04/2002
0899 Asia Resources Transportation Holdings Ltd 20/03/2002(Name change to Asia Resources Holdings Ltd) 10/04/2002Unconditional cash offer was made by Unichina Enterprises Ltd at a price of HK$0.025 for each share,HK$0.01 for each option
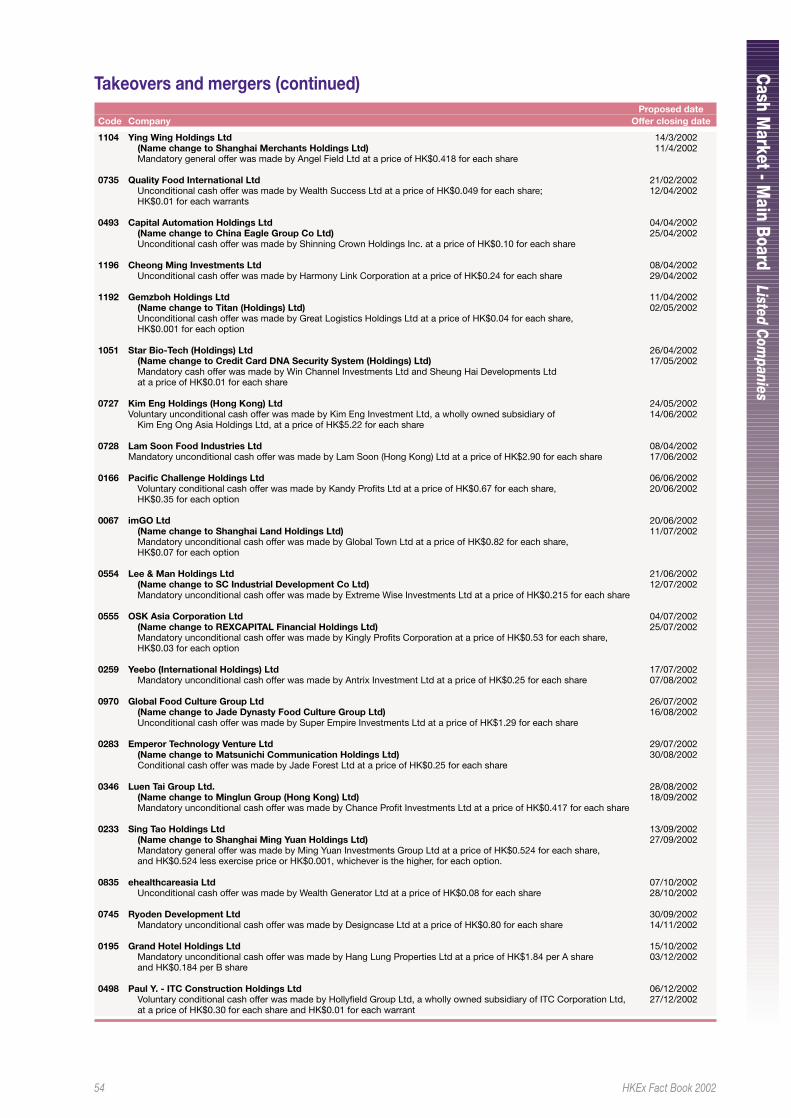
54 HKEx Fact Book 2002
Cash M
arket - Main Boar d
Listed Com
panies
Takeovers and mergers (continued)Proposed date
Code Company Offer closing date
1104 Ying Wing Holdings Ltd 14/3/2002(Name change to Shanghai Merchants Holdings Ltd) 11/4/2002Mandatory general offer was made by Angel Field Ltd at a price of HK$0.418 for each share
0735 Quality Food International Ltd 21/02/2002Unconditional cash offer was made by Wealth Success Ltd at a price of HK$0.049 for each share; 12/04/2002HK$0.01 for each warrants
0493 Capital Automation Holdings Ltd 04/04/2002(Name change to China Eagle Group Co Ltd) 25/04/2002Unconditional cash offer was made by Shinning Crown Holdings Inc. at a price of HK$0.10 for each share
1196 Cheong Ming Investments Ltd 08/04/2002Unconditional cash offer was made by Harmony Link Corporation at a price of HK$0.24 for each share 29/04/2002
1192 Gemzboh Holdings Ltd 11/04/2002(Name change to Titan (Holdings) Ltd) 02/05/2002Unconditional cash offer was made by Great Logistics Holdings Ltd at a price of HK$0.04 for each share,HK$0.001 for each option
1051 Star Bio-Tech (Holdings) Ltd 26/04/2002(Name change to Credit Card DNA Security System (Holdings) Ltd) 17/05/2002Mandatory cash offer was made by Win Channel Investments Ltd and Sheung Hai Developments Ltdat a price of HK$0.01 for each share
0727 Kim Eng Holdings (Hong Kong) Ltd 24/05/2002Voluntary unconditional cash offer was made by Kim Eng Investment Ltd, a wholly owned subsidiary of 14/06/2002
Kim Eng Ong Asia Holdings Ltd, at a price of HK$5.22 for each share
0728 Lam Soon Food Industries Ltd 08/04/2002Mandatory unconditional cash offer was made by Lam Soon (Hong Kong) Ltd at a price of HK$2.90 for each share 17/06/2002
0166 Pacific Challenge Holdings Ltd 06/06/2002Voluntary conditional cash offer was made by Kandy Profits Ltd at a price of HK$0.67 for each share, 20/06/2002HK$0.35 for each option
0067 imGO Ltd 20/06/2002(Name change to Shanghai Land Holdings Ltd) 11/07/2002Mandatory unconditional cash offer was made by Global Town Ltd at a price of HK$0.82 for each share,HK$0.07 for each option
0554 Lee & Man Holdings Ltd 21/06/2002(Name change to SC Industrial Development Co Ltd) 12/07/2002Mandatory unconditional cash offer was made by Extreme Wise Investments Ltd at a price of HK$0.215 for each share
0555 OSK Asia Corporation Ltd 04/07/2002(Name change to REXCAPITAL Financial Holdings Ltd) 25/07/2002Mandatory unconditional cash offer was made by Kingly Profits Corporation at a price of HK$0.53 for each share,HK$0.03 for each option
0259 Yeebo (International Holdings) Ltd 17/07/2002Mandatory unconditional cash offer was made by Antrix Investment Ltd at a price of HK$0.25 for each share 07/08/2002
0970 Global Food Culture Group Ltd 26/07/2002(Name change to Jade Dynasty Food Culture Group Ltd) 16/08/2002Unconditional cash offer was made by Super Empire Investments Ltd at a price of HK$1.29 for each share
0283 Emperor Technology Venture Ltd 29/07/2002(Name change to Matsunichi Communication Holdings Ltd) 30/08/2002Conditional cash offer was made by Jade Forest Ltd at a price of HK$0.25 for each share
0346 Luen Tai Group Ltd. 28/08/2002(Name change to Minglun Group (Hong Kong) Ltd) 18/09/2002Mandatory unconditional cash offer was made by Chance Profit Investments Ltd at a price of HK$0.417 for each share
0233 Sing Tao Holdings Ltd 13/09/2002(Name change to Shanghai Ming Yuan Holdings Ltd) 27/09/2002Mandatory general offer was made by Ming Yuan Investments Group Ltd at a price of HK$0.524 for each share,and HK$0.524 less exercise price or HK$0.001, whichever is the higher, for each option.
0835 ehealthcareasia Ltd 07/10/2002Unconditional cash offer was made by Wealth Generator Ltd at a price of HK$0.08 for each share 28/10/2002
0745 Ryoden Development Ltd 30/09/2002Mandatory unconditional cash offer was made by Designcase Ltd at a price of HK$0.80 for each share 14/11/2002
0195 Grand Hotel Holdings Ltd 15/10/2002Mandatory unconditional cash offer was made by Hang Lung Properties Ltd at a price of HK$1.84 per A share 03/12/2002and HK$0.184 per B share
0498 Paul Y. - ITC Construction Holdings Ltd 06/12/2002Voluntary conditional cash offer was made by Hollyfield Group Ltd, a wholly owned subsidiary of ITC Corporation Ltd, 27/12/2002at a price of HK$0.30 for each share and HK$0.01 for each warrant
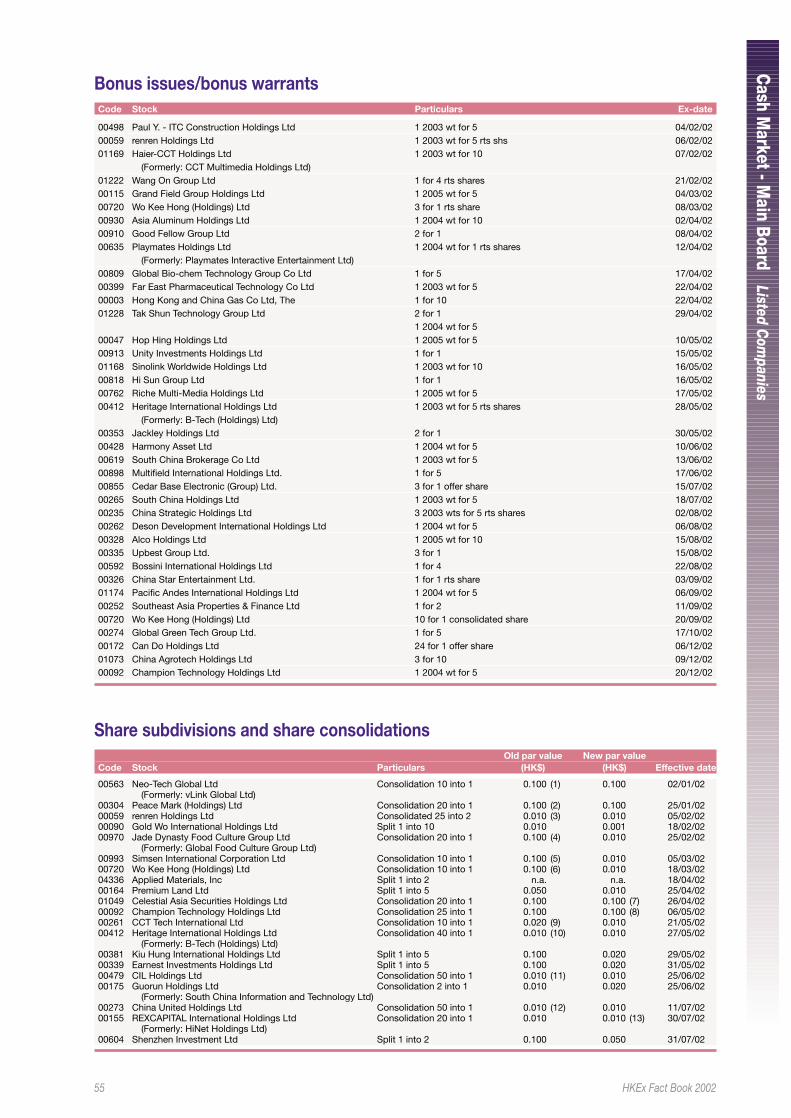
55 HKEx Fact Book 2002
Cash M
arket - Main Boar d
Listed Com
panies
Share subdivisions and share consolidationsOld par value New par value
Code Stock Particulars (HK$) (HK$) Effective date
00563 Neo-Tech Global Ltd Consolidation 10 into 1 0.100 (1) 0.100 02/01/02(Formerly: vLink Global Ltd)
00304 Peace Mark (Holdings) Ltd Consolidation 20 into 1 0.100 (2) 0.100 25/01/0200059 renren Holdings Ltd Consolidated 25 into 2 0.010 (3) 0.010 05/02/0200090 Gold Wo International Holdings Ltd Split 1 into 10 0.010 0.001 18/02/0200970 Jade Dynasty Food Culture Group Ltd Consolidation 20 into 1 0.100 (4) 0.010 25/02/02
(Formerly: Global Food Culture Group Ltd)00993 Simsen International Corporation Ltd Consolidation 10 into 1 0.100 (5) 0.010 05/03/0200720 Wo Kee Hong (Holdings) Ltd Consolidation 10 into 1 0.100 (6) 0.010 18/03/0204336 Applied Materials, Inc Split 1 into 2 n.a. n.a. 18/04/0200164 Premium Land Ltd Split 1 into 5 0.050 0.010 25/04/0201049 Celestial Asia Securities Holdings Ltd Consolidation 20 into 1 0.100 0.100 (7) 26/04/0200092 Champion Technology Holdings Ltd Consolidation 25 into 1 0.100 0.100 (8) 06/05/0200261 CCT Tech International Ltd Consolidation 10 into 1 0.020 (9) 0.010 21/05/0200412 Heritage International Holdings Ltd Consolidation 40 into 1 0.010 (10) 0.010 27/05/02
(Formerly: B-Tech (Holdings) Ltd)00381 Kiu Hung International Holdings Ltd Split 1 into 5 0.100 0.020 29/05/0200339 Earnest Investments Holdings Ltd Split 1 into 5 0.100 0.020 31/05/0200479 CIL Holdings Ltd Consolidation 50 into 1 0.010 (11) 0.010 25/06/0200175 Guorun Holdings Ltd Consolidation 2 into 1 0.010 0.020 25/06/02
(Formerly: South China Information and Technology Ltd)00273 China United Holdings Ltd Consolidation 50 into 1 0.010 (12) 0.010 11/07/0200155 REXCAPITAL International Holdings Ltd Consolidation 20 into 1 0.010 0.010 (13) 30/07/02
(Formerly: HiNet Holdings Ltd)00604 Shenzhen Investment Ltd Split 1 into 2 0.100 0.050 31/07/02
Bonus issues/bonus warrantsCode Stock Particulars Ex-date
00498 Paul Y. - ITC Construction Holdings Ltd 1 2003 wt for 5 04/02/0200059 renren Holdings Ltd 1 2003 wt for 5 rts shs 06/02/0201169 Haier-CCT Holdings Ltd 1 2003 wt for 10 07/02/02
(Formerly: CCT Multimedia Holdings Ltd)01222 Wang On Group Ltd 1 for 4 rts shares 21/02/0200115 Grand Field Group Holdings Ltd 1 2005 wt for 5 04/03/0200720 Wo Kee Hong (Holdings) Ltd 3 for 1 rts share 08/03/0200930 Asia Aluminum Holdings Ltd 1 2004 wt for 10 02/04/0200910 Good Fellow Group Ltd 2 for 1 08/04/0200635 Playmates Holdings Ltd 1 2004 wt for 1 rts shares 12/04/02
(Formerly: Playmates Interactive Entertainment Ltd)00809 Global Bio-chem Technology Group Co Ltd 1 for 5 17/04/0200399 Far East Pharmaceutical Technology Co Ltd 1 2003 wt for 5 22/04/0200003 Hong Kong and China Gas Co Ltd, The 1 for 10 22/04/0201228 Tak Shun Technology Group Ltd 2 for 1 29/04/02
1 2004 wt for 500047 Hop Hing Holdings Ltd 1 2005 wt for 5 10/05/0200913 Unity Investments Holdings Ltd 1 for 1 15/05/0201168 Sinolink Worldwide Holdings Ltd 1 2003 wt for 10 16/05/0200818 Hi Sun Group Ltd 1 for 1 16/05/0200762 Riche Multi-Media Holdings Ltd 1 2005 wt for 5 17/05/0200412 Heritage International Holdings Ltd 1 2003 wt for 5 rts shares 28/05/02
(Formerly: B-Tech (Holdings) Ltd)00353 Jackley Holdings Ltd 2 for 1 30/05/0200428 Harmony Asset Ltd 1 2004 wt for 5 10/06/0200619 South China Brokerage Co Ltd 1 2003 wt for 5 13/06/0200898 Multifield International Holdings Ltd. 1 for 5 17/06/0200855 Cedar Base Electronic (Group) Ltd. 3 for 1 offer share 15/07/0200265 South China Holdings Ltd 1 2003 wt for 5 18/07/0200235 China Strategic Holdings Ltd 3 2003 wts for 5 rts shares 02/08/0200262 Deson Development International Holdings Ltd 1 2004 wt for 5 06/08/0200328 Alco Holdings Ltd 1 2005 wt for 10 15/08/0200335 Upbest Group Ltd. 3 for 1 15/08/0200592 Bossini International Holdings Ltd 1 for 4 22/08/0200326 China Star Entertainment Ltd. 1 for 1 rts share 03/09/0201174 Pacific Andes International Holdings Ltd 1 2004 wt for 5 06/09/0200252 Southeast Asia Properties & Finance Ltd 1 for 2 11/09/0200720 Wo Kee Hong (Holdings) Ltd 10 for 1 consolidated share 20/09/0200274 Global Green Tech Group Ltd. 1 for 5 17/10/0200172 Can Do Holdings Ltd 24 for 1 offer share 06/12/0201073 China Agrotech Holdings Ltd 3 for 10 09/12/0200092 Champion Technology Holdings Ltd 1 2004 wt for 5 20/12/02
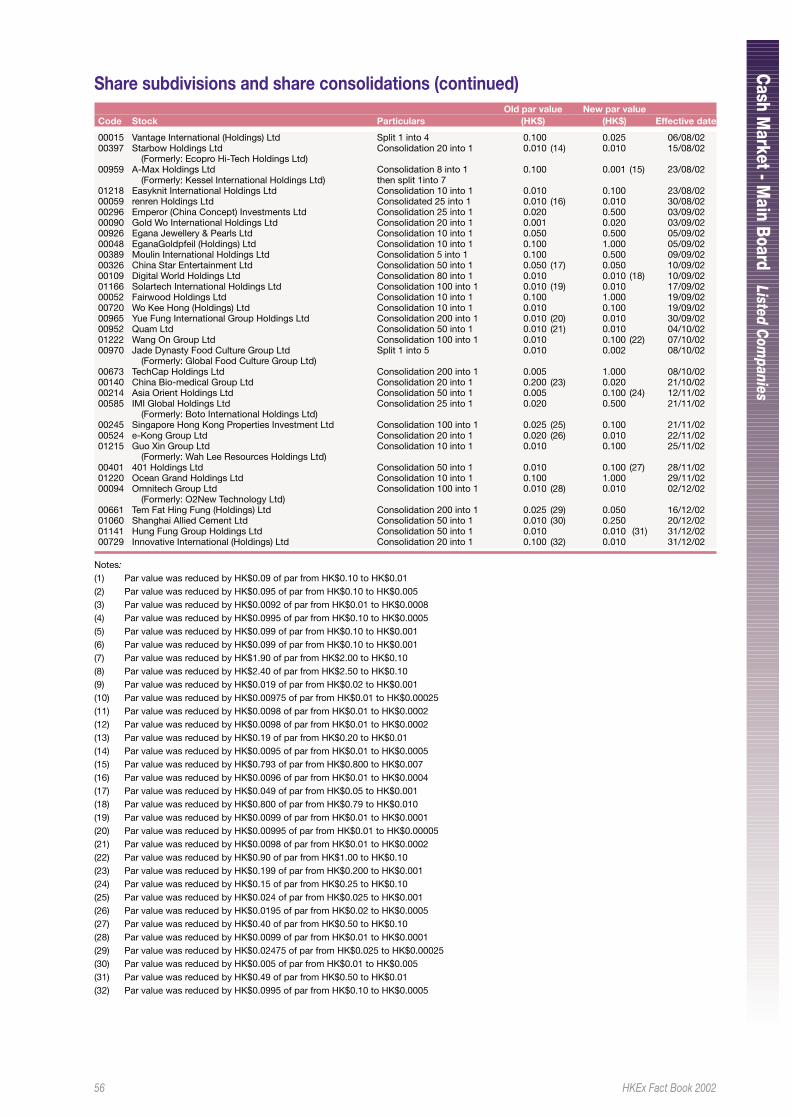
56 HKEx Fact Book 2002
Cash M
arket - Main Boar d
Listed Com
panies
Share subdivisions and share consolidations (continued)Old par value New par value
Code Stock Particulars (HK$) (HK$) Effective date
00015 Vantage International (Holdings) Ltd Split 1 into 4 0.100 0.025 06/08/0200397 Starbow Holdings Ltd Consolidation 20 into 1 0.010 (14) 0.010 15/08/02
(Formerly: Ecopro Hi-Tech Holdings Ltd)00959 A-Max Holdings Ltd Consolidation 8 into 1 0.100 0.001 (15) 23/08/02
(Formerly: Kessel International Holdings Ltd) then split 1into 701218 Easyknit International Holdings Ltd Consolidation 10 into 1 0.010 0.100 23/08/0200059 renren Holdings Ltd Consolidated 25 into 1 0.010 (16) 0.010 30/08/0200296 Emperor (China Concept) Investments Ltd Consolidation 25 into 1 0.020 0.500 03/09/0200090 Gold Wo International Holdings Ltd Consolidation 20 into 1 0.001 0.020 03/09/0200926 Egana Jewellery & Pearls Ltd Consolidation 10 into 1 0.050 0.500 05/09/0200048 EganaGoldpfeil (Holdings) Ltd Consolidation 10 into 1 0.100 1.000 05/09/0200389 Moulin International Holdings Ltd Consolidation 5 into 1 0.100 0.500 09/09/0200326 China Star Entertainment Ltd Consolidation 50 into 1 0.050 (17) 0.050 10/09/0200109 Digital World Holdings Ltd Consolidation 80 into 1 0.010 0.010 (18) 10/09/0201166 Solartech International Holdings Ltd Consolidation 100 into 1 0.010 (19) 0.010 17/09/0200052 Fairwood Holdings Ltd Consolidation 10 into 1 0.100 1.000 19/09/0200720 Wo Kee Hong (Holdings) Ltd Consolidation 10 into 1 0.010 0.100 19/09/0200965 Yue Fung International Group Holdings Ltd Consolidation 200 into 1 0.010 (20) 0.010 30/09/0200952 Quam Ltd Consolidation 50 into 1 0.010 (21) 0.010 04/10/0201222 Wang On Group Ltd Consolidation 100 into 1 0.010 0.100 (22) 07/10/0200970 Jade Dynasty Food Culture Group Ltd Split 1 into 5 0.010 0.002 08/10/02
(Formerly: Global Food Culture Group Ltd)00673 TechCap Holdings Ltd Consolidation 200 into 1 0.005 1.000 08/10/0200140 China Bio-medical Group Ltd Consolidation 20 into 1 0.200 (23) 0.020 21/10/0200214 Asia Orient Holdings Ltd Consolidation 50 into 1 0.005 0.100 (24) 12/11/0200585 IMI Global Holdings Ltd Consolidation 25 into 1 0.020 0.500 21/11/02
(Formerly: Boto International Holdings Ltd)00245 Singapore Hong Kong Properties Investment Ltd Consolidation 100 into 1 0.025 (25) 0.100 21/11/0200524 e-Kong Group Ltd Consolidation 20 into 1 0.020 (26) 0.010 22/11/0201215 Guo Xin Group Ltd Consolidation 10 into 1 0.010 0.100 25/11/02
(Formerly: Wah Lee Resources Holdings Ltd)00401 401 Holdings Ltd Consolidation 50 into 1 0.010 0.100 (27) 28/11/0201220 Ocean Grand Holdings Ltd Consolidation 10 into 1 0.100 1.000 29/11/0200094 Omnitech Group Ltd Consolidation 100 into 1 0.010 (28) 0.010 02/12/02
(Formerly: O2New Technology Ltd)00661 Tem Fat Hing Fung (Holdings) Ltd Consolidation 200 into 1 0.025 (29) 0.050 16/12/0201060 Shanghai Allied Cement Ltd Consolidation 50 into 1 0.010 (30) 0.250 20/12/0201141 Hung Fung Group Holdings Ltd Consolidation 50 into 1 0.010 0.010 (31) 31/12/0200729 Innovative International (Holdings) Ltd Consolidation 20 into 1 0.100 (32) 0.010 31/12/02
Notes:(1) Par value was reduced by HK$0.09 of par from HK$0.10 to HK$0.01(2) Par value was reduced by HK$0.095 of par from HK$0.10 to HK$0.005(3) Par value was reduced by HK$0.0092 of par from HK$0.01 to HK$0.0008(4) Par value was reduced by HK$0.0995 of par from HK$0.10 to HK$0.0005(5) Par value was reduced by HK$0.099 of par from HK$0.10 to HK$0.001(6) Par value was reduced by HK$0.099 of par from HK$0.10 to HK$0.001(7) Par value was reduced by HK$1.90 of par from HK$2.00 to HK$0.10(8) Par value was reduced by HK$2.40 of par from HK$2.50 to HK$0.10(9) Par value was reduced by HK$0.019 of par from HK$0.02 to HK$0.001(10) Par value was reduced by HK$0.00975 of par from HK$0.01 to HK$0.00025(11) Par value was reduced by HK$0.0098 of par from HK$0.01 to HK$0.0002(12) Par value was reduced by HK$0.0098 of par from HK$0.01 to HK$0.0002(13) Par value was reduced by HK$0.19 of par from HK$0.20 to HK$0.01(14) Par value was reduced by HK$0.0095 of par from HK$0.01 to HK$0.0005(15) Par value was reduced by HK$0.793 of par from HK$0.800 to HK$0.007(16) Par value was reduced by HK$0.0096 of par from HK$0.01 to HK$0.0004(17) Par value was reduced by HK$0.049 of par from HK$0.05 to HK$0.001(18) Par value was reduced by HK$0.800 of par from HK$0.79 to HK$0.010(19) Par value was reduced by HK$0.0099 of par from HK$0.01 to HK$0.0001(20) Par value was reduced by HK$0.00995 of par from HK$0.01 to HK$0.00005(21) Par value was reduced by HK$0.0098 of par from HK$0.01 to HK$0.0002(22) Par value was reduced by HK$0.90 of par from HK$1.00 to HK$0.10(23) Par value was reduced by HK$0.199 of par from HK$0.200 to HK$0.001(24) Par value was reduced by HK$0.15 of par from HK$0.25 to HK$0.10(25) Par value was reduced by HK$0.024 of par from HK$0.025 to HK$0.001(26) Par value was reduced by HK$0.0195 of par from HK$0.02 to HK$0.0005(27) Par value was reduced by HK$0.40 of par from HK$0.50 to HK$0.10(28) Par value was reduced by HK$0.0099 of par from HK$0.01 to HK$0.0001(29) Par value was reduced by HK$0.02475 of par from HK$0.025 to HK$0.00025(30) Par value was reduced by HK$0.005 of par from HK$0.01 to HK$0.005(31) Par value was reduced by HK$0.49 of par from HK$0.50 to HK$0.01(32) Par value was reduced by HK$0.0995 of par from HK$0.10 to HK$0.0005
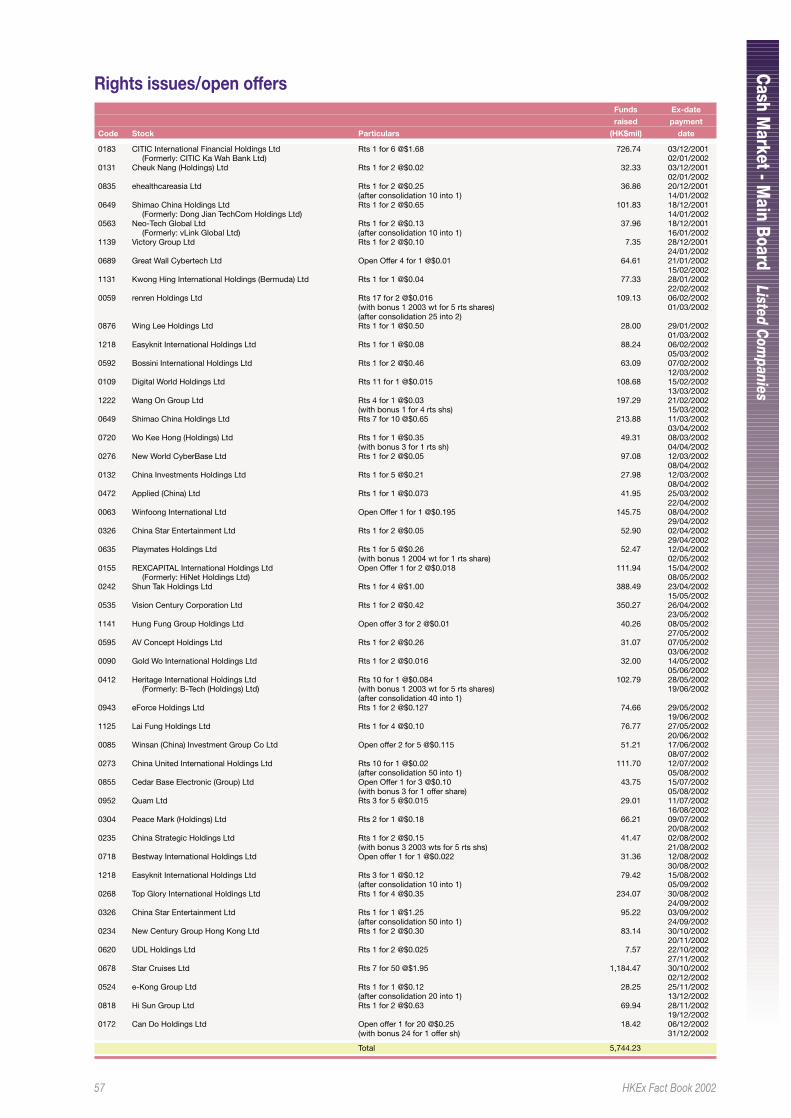
57 HKEx Fact Book 2002
Cash M
arket - Main Boar d
Listed Com
panies
Rights issues/open offersFunds Ex-date
raised payment
Code Stock Particulars (HK$mil) date
0183 CITIC International Financial Holdings Ltd Rts 1 for 6 @$1.68 726.74 03/12/2001 (Formerly: CITIC Ka Wah Bank Ltd) 02/01/2002
0131 Cheuk Nang (Holdings) Ltd Rts 1 for 2 @$0.02 32.33 03/12/200102/01/2002
0835 ehealthcareasia Ltd Rts 1 for 2 @$0.25 36.86 20/12/2001(after consolidation 10 into 1) 14/01/2002
0649 Shimao China Holdings Ltd Rts 1 for 2 @$0.65 101.83 18/12/2001 (Formerly: Dong Jian TechCom Holdings Ltd) 14/01/2002
0563 Neo-Tech Global Ltd Rts 1 for 2 @$0.13 37.96 18/12/2001 (Formerly: vLink Global Ltd) (after consolidation 10 into 1) 16/01/2002
1139 Victory Group Ltd Rts 1 for 2 @$0.10 7.35 28/12/200124/01/2002
0689 Great Wall Cybertech Ltd Open Offer 4 for 1 @$0.01 64.61 21/01/200215/02/2002
1131 Kwong Hing International Holdings (Bermuda) Ltd Rts 1 for 1 @$0.04 77.33 28/01/200222/02/2002
0059 renren Holdings Ltd Rts 17 for 2 @$0.016 109.13 06/02/2002(with bonus 1 2003 wt for 5 rts shares) 01/03/2002(after consolidation 25 into 2)
0876 Wing Lee Holdings Ltd Rts 1 for 1 @$0.50 28.00 29/01/200201/03/2002
1218 Easyknit International Holdings Ltd Rts 1 for 1 @$0.08 88.24 06/02/200205/03/2002
0592 Bossini International Holdings Ltd Rts 1 for 2 @$0.46 63.09 07/02/200212/03/2002
0109 Digital World Holdings Ltd Rts 11 for 1 @$0.015 108.68 15/02/200213/03/2002
1222 Wang On Group Ltd Rts 4 for 1 @$0.03 197.29 21/02/2002(with bonus 1 for 4 rts shs) 15/03/2002
0649 Shimao China Holdings Ltd Rts 7 for 10 @$0.65 213.88 11/03/200203/04/2002
0720 Wo Kee Hong (Holdings) Ltd Rts 1 for 1 @$0.35 49.31 08/03/2002(with bonus 3 for 1 rts sh) 04/04/2002
0276 New World CyberBase Ltd Rts 1 for 2 @$0.05 97.08 12/03/200208/04/2002
0132 China Investments Holdings Ltd Rts 1 for 5 @$0.21 27.98 12/03/200208/04/2002
0472 Applied (China) Ltd Rts 1 for 1 @$0.073 41.95 25/03/200222/04/2002
0063 Winfoong International Ltd Open Offer 1 for 1 @$0.195 145.75 08/04/200229/04/2002
0326 China Star Entertainment Ltd Rts 1 for 2 @$0.05 52.90 02/04/200229/04/2002
0635 Playmates Holdings Ltd Rts 1 for 5 @$0.26 52.47 12/04/2002(with bonus 1 2004 wt for 1 rts share) 02/05/2002
0155 REXCAPITAL International Holdings Ltd Open Offer 1 for 2 @$0.018 111.94 15/04/2002 (Formerly: HiNet Holdings Ltd) 08/05/2002
0242 Shun Tak Holdings Ltd Rts 1 for 4 @$1.00 388.49 23/04/200215/05/2002
0535 Vision Century Corporation Ltd Rts 1 for 2 @$0.42 350.27 26/04/200223/05/2002
1141 Hung Fung Group Holdings Ltd Open offer 3 for 2 @$0.01 40.26 08/05/200227/05/2002
0595 AV Concept Holdings Ltd Rts 1 for 2 @$0.26 31.07 07/05/200203/06/2002
0090 Gold Wo International Holdings Ltd Rts 1 for 2 @$0.016 32.00 14/05/200205/06/2002
0412 Heritage International Holdings Ltd Rts 10 for 1 @$0.084 102.79 28/05/2002 (Formerly: B-Tech (Holdings) Ltd) (with bonus 1 2003 wt for 5 rts shares) 19/06/2002
(after consolidation 40 into 1)0943 eForce Holdings Ltd Rts 1 for 2 @$0.127 74.66 29/05/2002
19/06/20021125 Lai Fung Holdings Ltd Rts 1 for 4 @$0.10 76.77 27/05/2002
20/06/20020085 Winsan (China) Investment Group Co Ltd Open offer 2 for 5 @$0.115 51.21 17/06/2002
08/07/20020273 China United International Holdings Ltd Rts 10 for 1 @$0.02 111.70 12/07/2002
(after consolidation 50 into 1) 05/08/20020855 Cedar Base Electronic (Group) Ltd Open Offer 1 for 3 @$0.10 43.75 15/07/2002
(with bonus 3 for 1 offer share) 05/08/20020952 Quam Ltd Rts 3 for 5 @$0.015 29.01 11/07/2002
16/08/20020304 Peace Mark (Holdings) Ltd Rts 2 for 1 @$0.18 66.21 09/07/2002
20/08/20020235 China Strategic Holdings Ltd Rts 1 for 2 @$0.15 41.47 02/08/2002
(with bonus 3 2003 wts for 5 rts shs) 21/08/20020718 Bestway International Holdings Ltd Open offer 1 for 1 @$0.022 31.36 12/08/2002
30/08/20021218 Easyknit International Holdings Ltd Rts 3 for 1 @$0.12 79.42 15/08/2002
(after consolidation 10 into 1) 05/09/20020268 Top Glory International Holdings Ltd Rts 1 for 4 @$0.35 234.07 30/08/2002
24/09/20020326 China Star Entertainment Ltd Rts 1 for 1 @$1.25 95.22 03/09/2002
(after consolidation 50 into 1) 24/09/20020234 New Century Group Hong Kong Ltd Rts 1 for 2 @$0.30 83.14 30/10/2002
20/11/20020620 UDL Holdings Ltd Rts 1 for 2 @$0.025 7.57 22/10/2002
27/11/20020678 Star Cruises Ltd Rts 7 for 50 @$1.95 1,184.47 30/10/2002
02/12/20020524 e-Kong Group Ltd Rts 1 for 1 @$0.12 28.25 25/11/2002
(after consolidation 20 into 1) 13/12/20020818 Hi Sun Group Ltd Rts 1 for 2 @$0.63 69.94 28/11/2002
19/12/20020172 Can Do Holdings Ltd Open offer 1 for 20 @$0.25 18.42 06/12/2002
(with bonus 24 for 1 offer sh) 31/12/2002
Total 5,744.23
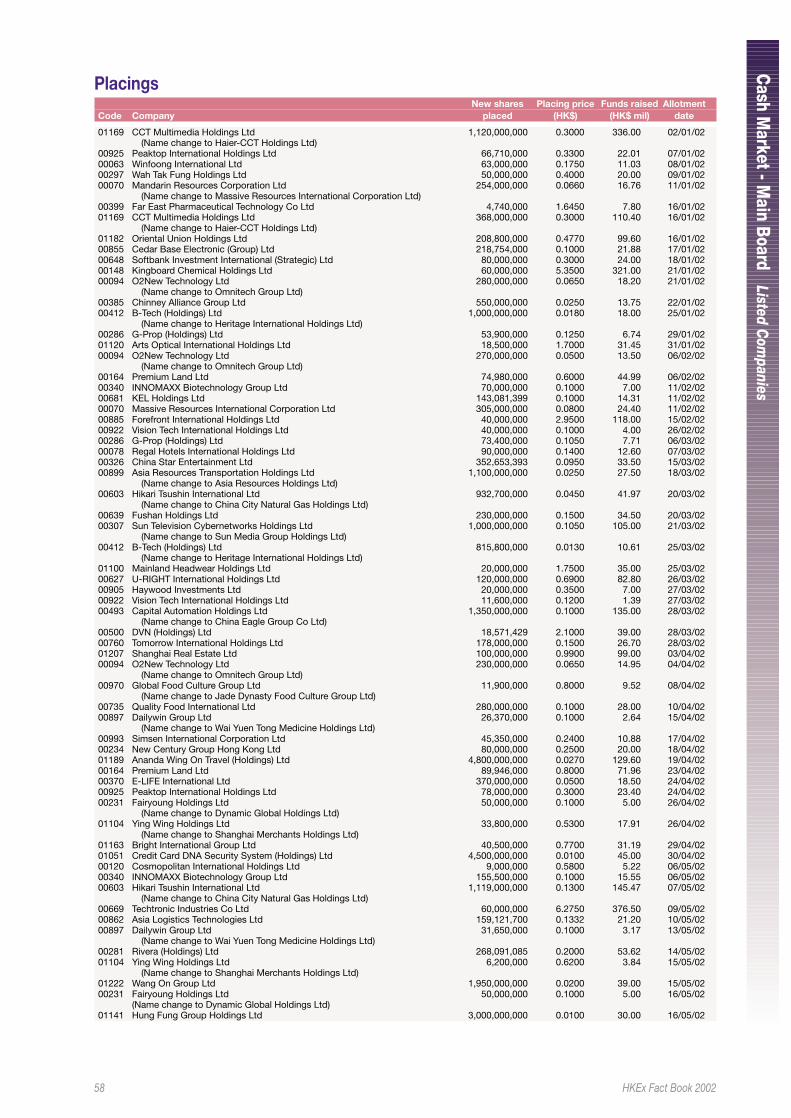
58 HKEx Fact Book 2002
Cash M
arket - Main Boar d
Listed Com
panies
PlacingsNew shares Placing price Funds raised Allotment
Code Company placed (HK$) (HK$ mil) date
01169 CCT Multimedia Holdings Ltd 1,120,000,000 0.3000 336.00 02/01/02(Name change to Haier-CCT Holdings Ltd)
00925 Peaktop International Holdings Ltd 66,710,000 0.3300 22.01 07/01/0200063 Winfoong International Ltd 63,000,000 0.1750 11.03 08/01/0200297 Wah Tak Fung Holdings Ltd 50,000,000 0.4000 20.00 09/01/0200070 Mandarin Resources Corporation Ltd 254,000,000 0.0660 16.76 11/01/02
(Name change to Massive Resources International Corporation Ltd)00399 Far East Pharmaceutical Technology Co Ltd 4,740,000 1.6450 7.80 16/01/0201169 CCT Multimedia Holdings Ltd 368,000,000 0.3000 110.40 16/01/02
(Name change to Haier-CCT Holdings Ltd)01182 Oriental Union Holdings Ltd 208,800,000 0.4770 99.60 16/01/0200855 Cedar Base Electronic (Group) Ltd 218,754,000 0.1000 21.88 17/01/0200648 Softbank Investment International (Strategic) Ltd 80,000,000 0.3000 24.00 18/01/0200148 Kingboard Chemical Holdings Ltd 60,000,000 5.3500 321.00 21/01/0200094 O2New Technology Ltd 280,000,000 0.0650 18.20 21/01/02
(Name change to Omnitech Group Ltd)00385 Chinney Alliance Group Ltd 550,000,000 0.0250 13.75 22/01/0200412 B-Tech (Holdings) Ltd 1,000,000,000 0.0180 18.00 25/01/02
(Name change to Heritage International Holdings Ltd)00286 G-Prop (Holdings) Ltd 53,900,000 0.1250 6.74 29/01/0201120 Arts Optical International Holdings Ltd 18,500,000 1.7000 31.45 31/01/0200094 O2New Technology Ltd 270,000,000 0.0500 13.50 06/02/02
(Name change to Omnitech Group Ltd)00164 Premium Land Ltd 74,980,000 0.6000 44.99 06/02/0200340 INNOMAXX Biotechnology Group Ltd 70,000,000 0.1000 7.00 11/02/0200681 KEL Holdings Ltd 143,081,399 0.1000 14.31 11/02/0200070 Massive Resources International Corporation Ltd 305,000,000 0.0800 24.40 11/02/0200885 Forefront International Holdings Ltd 40,000,000 2.9500 118.00 15/02/0200922 Vision Tech International Holdings Ltd 40,000,000 0.1000 4.00 26/02/0200286 G-Prop (Holdings) Ltd 73,400,000 0.1050 7.71 06/03/0200078 Regal Hotels International Holdings Ltd 90,000,000 0.1400 12.60 07/03/0200326 China Star Entertainment Ltd 352,653,393 0.0950 33.50 15/03/0200899 Asia Resources Transportation Holdings Ltd 1,100,000,000 0.0250 27.50 18/03/02
(Name change to Asia Resources Holdings Ltd)00603 Hikari Tsushin International Ltd 932,700,000 0.0450 41.97 20/03/02
(Name change to China City Natural Gas Holdings Ltd)00639 Fushan Holdings Ltd 230,000,000 0.1500 34.50 20/03/0200307 Sun Television Cybernetworks Holdings Ltd 1,000,000,000 0.1050 105.00 21/03/02
(Name change to Sun Media Group Holdings Ltd)00412 B-Tech (Holdings) Ltd 815,800,000 0.0130 10.61 25/03/02
(Name change to Heritage International Holdings Ltd)01100 Mainland Headwear Holdings Ltd 20,000,000 1.7500 35.00 25/03/0200627 U-RIGHT International Holdings Ltd 120,000,000 0.6900 82.80 26/03/0200905 Haywood Investments Ltd 20,000,000 0.3500 7.00 27/03/0200922 Vision Tech International Holdings Ltd 11,600,000 0.1200 1.39 27/03/0200493 Capital Automation Holdings Ltd 1,350,000,000 0.1000 135.00 28/03/02
(Name change to China Eagle Group Co Ltd)00500 DVN (Holdings) Ltd 18,571,429 2.1000 39.00 28/03/0200760 Tomorrow International Holdings Ltd 178,000,000 0.1500 26.70 28/03/0201207 Shanghai Real Estate Ltd 100,000,000 0.9900 99.00 03/04/0200094 O2New Technology Ltd 230,000,000 0.0650 14.95 04/04/02
(Name change to Omnitech Group Ltd)00970 Global Food Culture Group Ltd 11,900,000 0.8000 9.52 08/04/02
(Name change to Jade Dynasty Food Culture Group Ltd)00735 Quality Food International Ltd 280,000,000 0.1000 28.00 10/04/0200897 Dailywin Group Ltd 26,370,000 0.1000 2.64 15/04/02
(Name change to Wai Yuen Tong Medicine Holdings Ltd)00993 Simsen International Corporation Ltd 45,350,000 0.2400 10.88 17/04/0200234 New Century Group Hong Kong Ltd 80,000,000 0.2500 20.00 18/04/0201189 Ananda Wing On Travel (Holdings) Ltd 4,800,000,000 0.0270 129.60 19/04/0200164 Premium Land Ltd 89,946,000 0.8000 71.96 23/04/0200370 E-LIFE International Ltd 370,000,000 0.0500 18.50 24/04/0200925 Peaktop International Holdings Ltd 78,000,000 0.3000 23.40 24/04/0200231 Fairyoung Holdings Ltd 50,000,000 0.1000 5.00 26/04/02
(Name change to Dynamic Global Holdings Ltd)01104 Ying Wing Holdings Ltd 33,800,000 0.5300 17.91 26/04/02
(Name change to Shanghai Merchants Holdings Ltd)01163 Bright International Group Ltd 40,500,000 0.7700 31.19 29/04/0201051 Credit Card DNA Security System (Holdings) Ltd 4,500,000,000 0.0100 45.00 30/04/0200120 Cosmopolitan International Holdings Ltd 9,000,000 0.5800 5.22 06/05/0200340 INNOMAXX Biotechnology Group Ltd 155,500,000 0.1000 15.55 06/05/0200603 Hikari Tsushin International Ltd 1,119,000,000 0.1300 145.47 07/05/02
(Name change to China City Natural Gas Holdings Ltd)00669 Techtronic Industries Co Ltd 60,000,000 6.2750 376.50 09/05/0200862 Asia Logistics Technologies Ltd 159,121,700 0.1332 21.20 10/05/0200897 Dailywin Group Ltd 31,650,000 0.1000 3.17 13/05/02
(Name change to Wai Yuen Tong Medicine Holdings Ltd)00281 Rivera (Holdings) Ltd 268,091,085 0.2000 53.62 14/05/0201104 Ying Wing Holdings Ltd 6,200,000 0.6200 3.84 15/05/02
(Name change to Shanghai Merchants Holdings Ltd)01222 Wang On Group Ltd 1,950,000,000 0.0200 39.00 15/05/0200231 Fairyoung Holdings Ltd 50,000,000 0.1000 5.00 16/05/02
(Name change to Dynamic Global Holdings Ltd)01141 Hung Fung Group Holdings Ltd 3,000,000,000 0.0100 30.00 16/05/02
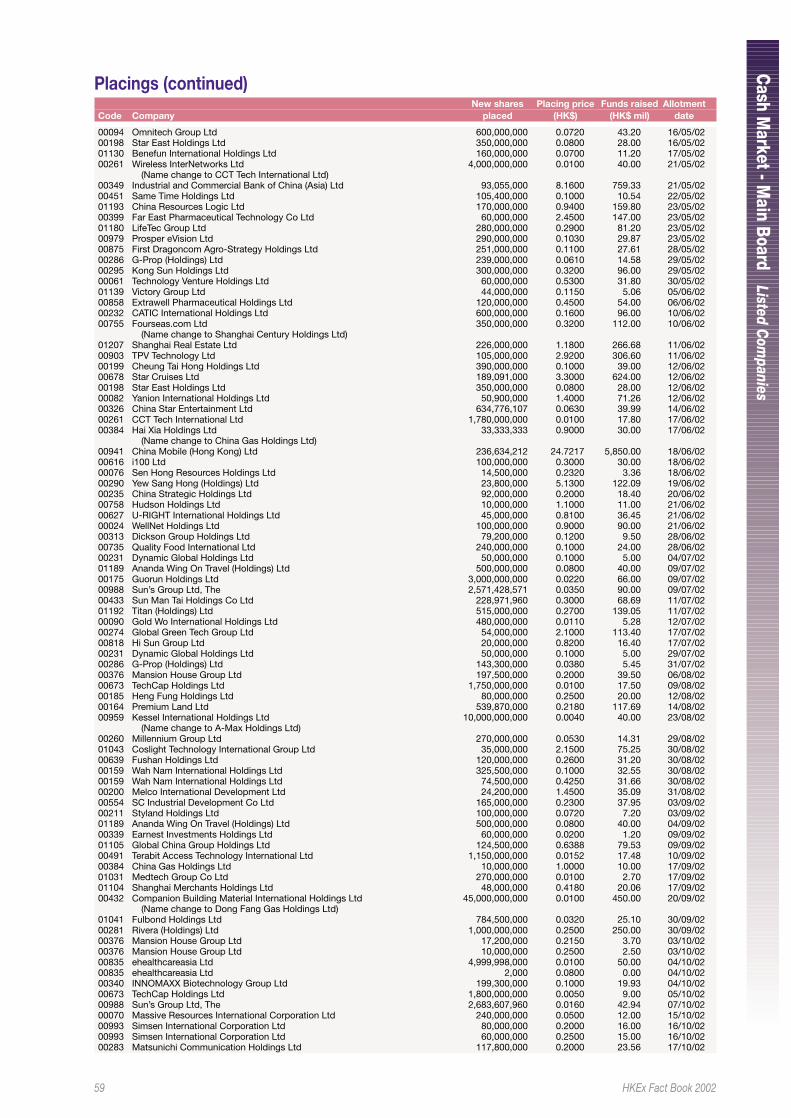
59 HKEx Fact Book 2002
Cash M
arket - Main Boar d
Listed Com
panies
Placings (continued)New shares Placing price Funds raised Allotment
Code Company placed (HK$) (HK$ mil) date
00094 Omnitech Group Ltd 600,000,000 0.0720 43.20 16/05/0200198 Star East Holdings Ltd 350,000,000 0.0800 28.00 16/05/0201130 Benefun International Holdings Ltd 160,000,000 0.0700 11.20 17/05/0200261 Wireless InterNetworks Ltd 4,000,000,000 0.0100 40.00 21/05/02
(Name change to CCT Tech International Ltd)00349 Industrial and Commercial Bank of China (Asia) Ltd 93,055,000 8.1600 759.33 21/05/0200451 Same Time Holdings Ltd 105,400,000 0.1000 10.54 22/05/0201193 China Resources Logic Ltd 170,000,000 0.9400 159.80 23/05/0200399 Far East Pharmaceutical Technology Co Ltd 60,000,000 2.4500 147.00 23/05/0201180 LifeTec Group Ltd 280,000,000 0.2900 81.20 23/05/0200979 Prosper eVision Ltd 290,000,000 0.1030 29.87 23/05/0200875 First Dragoncom Agro-Strategy Holdings Ltd 251,000,000 0.1100 27.61 28/05/0200286 G-Prop (Holdings) Ltd 239,000,000 0.0610 14.58 29/05/0200295 Kong Sun Holdings Ltd 300,000,000 0.3200 96.00 29/05/0200061 Technology Venture Holdings Ltd 60,000,000 0.5300 31.80 30/05/0201139 Victory Group Ltd 44,000,000 0.1150 5.06 05/06/0200858 Extrawell Pharmaceutical Holdings Ltd 120,000,000 0.4500 54.00 06/06/0200232 CATIC International Holdings Ltd 600,000,000 0.1600 96.00 10/06/0200755 Fourseas.com Ltd 350,000,000 0.3200 112.00 10/06/02
(Name change to Shanghai Century Holdings Ltd)01207 Shanghai Real Estate Ltd 226,000,000 1.1800 266.68 11/06/0200903 TPV Technology Ltd 105,000,000 2.9200 306.60 11/06/0200199 Cheung Tai Hong Holdings Ltd 390,000,000 0.1000 39.00 12/06/0200678 Star Cruises Ltd 189,091,000 3.3000 624.00 12/06/0200198 Star East Holdings Ltd 350,000,000 0.0800 28.00 12/06/0200082 Yanion International Holdings Ltd 50,900,000 1.4000 71.26 12/06/0200326 China Star Entertainment Ltd 634,776,107 0.0630 39.99 14/06/0200261 CCT Tech International Ltd 1,780,000,000 0.0100 17.80 17/06/0200384 Hai Xia Holdings Ltd 33,333,333 0.9000 30.00 17/06/02
(Name change to China Gas Holdings Ltd)00941 China Mobile (Hong Kong) Ltd 236,634,212 24.7217 5,850.00 18/06/0200616 i100 Ltd 100,000,000 0.3000 30.00 18/06/0200076 Sen Hong Resources Holdings Ltd 14,500,000 0.2320 3.36 18/06/0200290 Yew Sang Hong (Holdings) Ltd 23,800,000 5.1300 122.09 19/06/0200235 China Strategic Holdings Ltd 92,000,000 0.2000 18.40 20/06/0200758 Hudson Holdings Ltd 10,000,000 1.1000 11.00 21/06/0200627 U-RIGHT International Holdings Ltd 45,000,000 0.8100 36.45 21/06/0200024 WellNet Holdings Ltd 100,000,000 0.9000 90.00 21/06/0200313 Dickson Group Holdings Ltd 79,200,000 0.1200 9.50 28/06/0200735 Quality Food International Ltd 240,000,000 0.1000 24.00 28/06/0200231 Dynamic Global Holdings Ltd 50,000,000 0.1000 5.00 04/07/0201189 Ananda Wing On Travel (Holdings) Ltd 500,000,000 0.0800 40.00 09/07/0200175 Guorun Holdings Ltd 3,000,000,000 0.0220 66.00 09/07/0200988 Sun’s Group Ltd, The 2,571,428,571 0.0350 90.00 09/07/0200433 Sun Man Tai Holdings Co Ltd 228,971,960 0.3000 68.69 11/07/0201192 Titan (Holdings) Ltd 515,000,000 0.2700 139.05 11/07/0200090 Gold Wo International Holdings Ltd 480,000,000 0.0110 5.28 12/07/0200274 Global Green Tech Group Ltd 54,000,000 2.1000 113.40 17/07/0200818 Hi Sun Group Ltd 20,000,000 0.8200 16.40 17/07/0200231 Dynamic Global Holdings Ltd 50,000,000 0.1000 5.00 29/07/0200286 G-Prop (Holdings) Ltd 143,300,000 0.0380 5.45 31/07/0200376 Mansion House Group Ltd 197,500,000 0.2000 39.50 06/08/0200673 TechCap Holdings Ltd 1,750,000,000 0.0100 17.50 09/08/0200185 Heng Fung Holdings Ltd 80,000,000 0.2500 20.00 12/08/0200164 Premium Land Ltd 539,870,000 0.2180 117.69 14/08/0200959 Kessel International Holdings Ltd 10,000,000,000 0.0040 40.00 23/08/02
(Name change to A-Max Holdings Ltd)00260 Millennium Group Ltd 270,000,000 0.0530 14.31 29/08/0201043 Coslight Technology International Group Ltd 35,000,000 2.1500 75.25 30/08/0200639 Fushan Holdings Ltd 120,000,000 0.2600 31.20 30/08/0200159 Wah Nam International Holdings Ltd 325,500,000 0.1000 32.55 30/08/0200159 Wah Nam International Holdings Ltd 74,500,000 0.4250 31.66 30/08/0200200 Melco International Development Ltd 24,200,000 1.4500 35.09 31/08/0200554 SC Industrial Development Co Ltd 165,000,000 0.2300 37.95 03/09/0200211 Styland Holdings Ltd 100,000,000 0.0720 7.20 03/09/0201189 Ananda Wing On Travel (Holdings) Ltd 500,000,000 0.0800 40.00 04/09/0200339 Earnest Investments Holdings Ltd 60,000,000 0.0200 1.20 09/09/0201105 Global China Group Holdings Ltd 124,500,000 0.6388 79.53 09/09/0200491 Terabit Access Technology International Ltd 1,150,000,000 0.0152 17.48 10/09/0200384 China Gas Holdings Ltd 10,000,000 1.0000 10.00 17/09/0201031 Medtech Group Co Ltd 270,000,000 0.0100 2.70 17/09/0201104 Shanghai Merchants Holdings Ltd 48,000,000 0.4180 20.06 17/09/0200432 Companion Building Material International Holdings Ltd 45,000,000,000 0.0100 450.00 20/09/02
(Name change to Dong Fang Gas Holdings Ltd)01041 Fulbond Holdings Ltd 784,500,000 0.0320 25.10 30/09/0200281 Rivera (Holdings) Ltd 1,000,000,000 0.2500 250.00 30/09/0200376 Mansion House Group Ltd 17,200,000 0.2150 3.70 03/10/0200376 Mansion House Group Ltd 10,000,000 0.2500 2.50 03/10/0200835 ehealthcareasia Ltd 4,999,998,000 0.0100 50.00 04/10/0200835 ehealthcareasia Ltd 2,000 0.0800 0.00 04/10/0200340 INNOMAXX Biotechnology Group Ltd 199,300,000 0.1000 19.93 04/10/0200673 TechCap Holdings Ltd 1,800,000,000 0.0050 9.00 05/10/0200988 Sun’s Group Ltd, The 2,683,607,960 0.0160 42.94 07/10/0200070 Massive Resources International Corporation Ltd 240,000,000 0.0500 12.00 15/10/0200993 Simsen International Corporation Ltd 80,000,000 0.2000 16.00 16/10/0200993 Simsen International Corporation Ltd 60,000,000 0.2500 15.00 16/10/0200283 Matsunichi Communication Holdings Ltd 117,800,000 0.2000 23.56 17/10/02
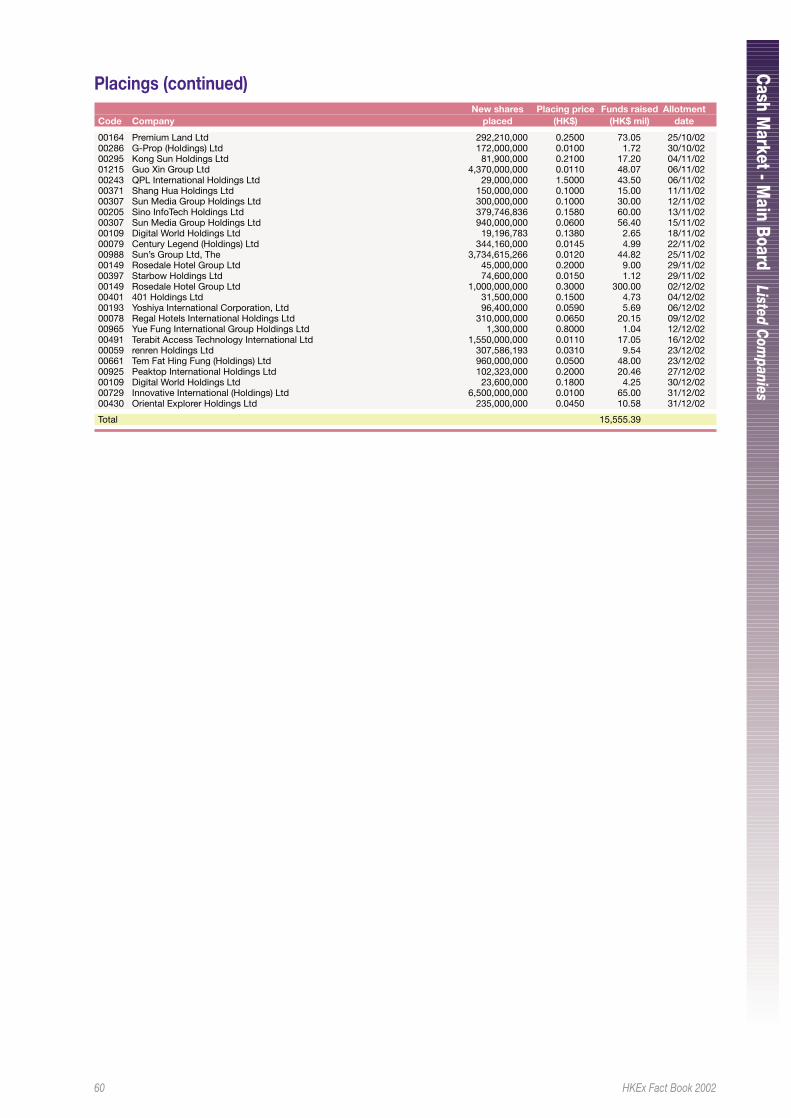
60 HKEx Fact Book 2002
Cash M
arket - Main Boar d
Listed Com
panies
Placings (continued)New shares Placing price Funds raised Allotment
Code Company placed (HK$) (HK$ mil) date
00164 Premium Land Ltd 292,210,000 0.2500 73.05 25/10/0200286 G-Prop (Holdings) Ltd 172,000,000 0.0100 1.72 30/10/0200295 Kong Sun Holdings Ltd 81,900,000 0.2100 17.20 04/11/0201215 Guo Xin Group Ltd 4,370,000,000 0.0110 48.07 06/11/0200243 QPL International Holdings Ltd 29,000,000 1.5000 43.50 06/11/0200371 Shang Hua Holdings Ltd 150,000,000 0.1000 15.00 11/11/0200307 Sun Media Group Holdings Ltd 300,000,000 0.1000 30.00 12/11/0200205 Sino InfoTech Holdings Ltd 379,746,836 0.1580 60.00 13/11/0200307 Sun Media Group Holdings Ltd 940,000,000 0.0600 56.40 15/11/0200109 Digital World Holdings Ltd 19,196,783 0.1380 2.65 18/11/0200079 Century Legend (Holdings) Ltd 344,160,000 0.0145 4.99 22/11/0200988 Sun’s Group Ltd, The 3,734,615,266 0.0120 44.82 25/11/0200149 Rosedale Hotel Group Ltd 45,000,000 0.2000 9.00 29/11/0200397 Starbow Holdings Ltd 74,600,000 0.0150 1.12 29/11/0200149 Rosedale Hotel Group Ltd 1,000,000,000 0.3000 300.00 02/12/0200401 401 Holdings Ltd 31,500,000 0.1500 4.73 04/12/0200193 Yoshiya International Corporation, Ltd 96,400,000 0.0590 5.69 06/12/0200078 Regal Hotels International Holdings Ltd 310,000,000 0.0650 20.15 09/12/0200965 Yue Fung International Group Holdings Ltd 1,300,000 0.8000 1.04 12/12/0200491 Terabit Access Technology International Ltd 1,550,000,000 0.0110 17.05 16/12/0200059 renren Holdings Ltd 307,586,193 0.0310 9.54 23/12/0200661 Tem Fat Hing Fung (Holdings) Ltd 960,000,000 0.0500 48.00 23/12/0200925 Peaktop International Holdings Ltd 102,323,000 0.2000 20.46 27/12/0200109 Digital World Holdings Ltd 23,600,000 0.1800 4.25 30/12/0200729 Innovative International (Holdings) Ltd 6,500,000,000 0.0100 65.00 31/12/0200430 Oriental Explorer Holdings Ltd 235,000,000 0.0450 10.58 31/12/02
Total 15,555.39
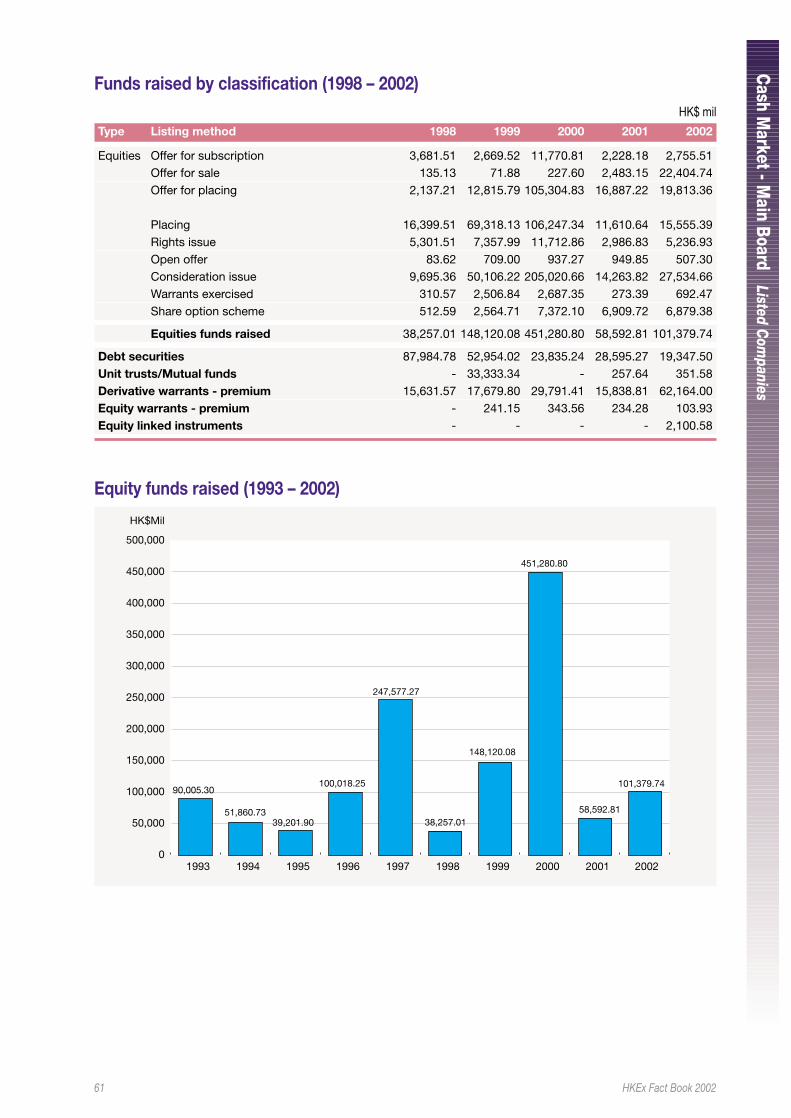
61 HKEx Fact Book 2002
Cash M
arket - Main Boar d
Listed Com
panies
Equity funds raised (1993 – 2002)
1993 1994 1995 1996 1997 1998 1999 2000 2001 20020
50,000
100,000
150,000
200,000
250,000
300,000
350,000
400,000
450,000
500,000
HK$Mil
451,280.80
58,592.8138,257.01
148,120.08
101,379.74
247,577.27
90,005.30
51,860.7339,201.90
100,018.25
Funds raised by classification (1998 – 2002)HK$ mil
Type Listing method 1998 1999 2000 2001 2002
Equities Offer for subscription 3,681.51 2,669.52 11,770.81 2,228.18 2,755.51Offer for sale 135.13 71.88 227.60 2,483.15 22,404.74Offer for placing 2,137.21 12,815.79 105,304.83 16,887.22 19,813.36
Placing 16,399.51 69,318.13 106,247.34 11,610.64 15,555.39Rights issue 5,301.51 7,357.99 11,712.86 2,986.83 5,236.93Open offer 83.62 709.00 937.27 949.85 507.30Consideration issue 9,695.36 50,106.22 205,020.66 14,263.82 27,534.66Warrants exercised 310.57 2,506.84 2,687.35 273.39 692.47Share option scheme 512.59 2,564.71 7,372.10 6,909.72 6,879.38
Equities funds raised 38,257.01 148,120.08 451,280.80 58,592.81 101,379.74
Debt securities 87,984.78 52,954.02 23,835.24 28,595.27 19,347.50Unit trusts/Mutual funds - 33,333.34 - 257.64 351.58Derivative warrants - premium 15,631.57 17,679.80 29,791.41 15,838.81 62,164.00Equity warrants - premium - 241.15 343.56 234.28 103.93Equity linked instruments - - - - 2,100.58
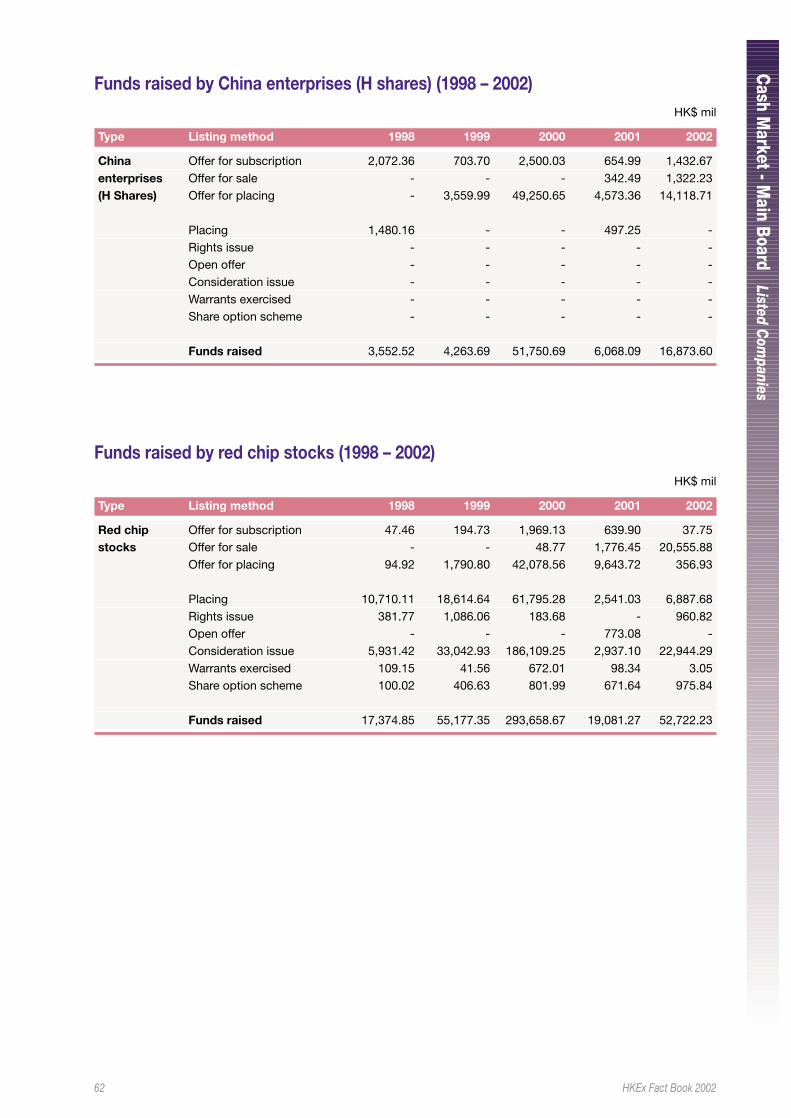
62 HKEx Fact Book 2002
Cash M
arket - Main Boar d
Listed Com
panies
Funds raised by China enterprises (H shares) (1998 – 2002)HK$ mil
Type Listing method 1998 1999 2000 2001 2002
China Offer for subscription 2,072.36 703.70 2,500.03 654.99 1,432.67enterprises Offer for sale - - - 342.49 1,322.23(H Shares) Offer for placing - 3,559.99 49,250.65 4,573.36 14,118.71
Placing 1,480.16 - - 497.25 -Rights issue - - - - -Open offer - - - - -Consideration issue - - - - -Warrants exercised - - - - -Share option scheme - - - - -
Funds raised 3,552.52 4,263.69 51,750.69 6,068.09 16,873.60
Funds raised by red chip stocks (1998 – 2002)HK$ mil
Type Listing method 1998 1999 2000 2001 2002
Red chip Offer for subscription 47.46 194.73 1,969.13 639.90 37.75stocks Offer for sale - - 48.77 1,776.45 20,555.88
Offer for placing 94.92 1,790.80 42,078.56 9,643.72 356.93
Placing 10,710.11 18,614.64 61,795.28 2,541.03 6,887.68Rights issue 381.77 1,086.06 183.68 - 960.82Open offer - - - 773.08 -Consideration issue 5,931.42 33,042.93 186,109.25 2,937.10 22,944.29Warrants exercised 109.15 41.56 672.01 98.34 3.05Share option scheme 100.02 406.63 801.99 671.64 975.84
Funds raised 17,374.85 55,177.35 293,658.67 19,081.27 52,722.23
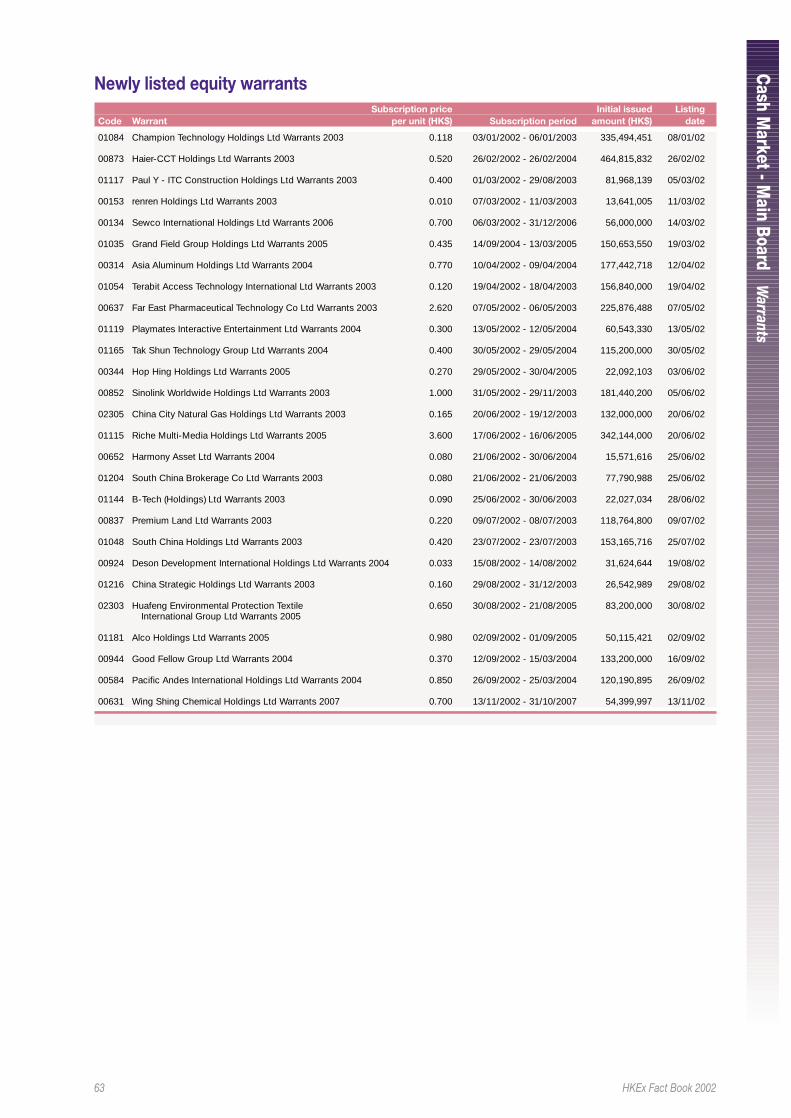
63 HKEx Fact Book 2002
Cash M
arket - Main Boar d
Warrants
Newly listed equity warrantsSubscription price Initial issued Listing
Code Warrant per unit (HK$) Subscription period amount (HK$) date
01084 Champion Technology Holdings Ltd Warrants 2003 0.118 03/01/2002 - 06/01/2003 335,494,451 08/01/02
00873 Haier-CCT Holdings Ltd Warrants 2003 0.520 26/02/2002 - 26/02/2004 464,815,832 26/02/02
01117 Paul Y - ITC Construction Holdings Ltd Warrants 2003 0.400 01/03/2002 - 29/08/2003 81,968,139 05/03/02
00153 renren Holdings Ltd Warrants 2003 0.010 07/03/2002 - 11/03/2003 13,641,005 11/03/02
00134 Sewco International Holdings Ltd Warrants 2006 0.700 06/03/2002 - 31/12/2006 56,000,000 14/03/02
01035 Grand Field Group Holdings Ltd Warrants 2005 0.435 14/09/2004 - 13/03/2005 150,653,550 19/03/02
00314 Asia Aluminum Holdings Ltd Warrants 2004 0.770 10/04/2002 - 09/04/2004 177,442,718 12/04/02
01054 Terabit Access Technology International Ltd Warrants 2003 0.120 19/04/2002 - 18/04/2003 156,840,000 19/04/02
00637 Far East Pharmaceutical Technology Co Ltd Warrants 2003 2.620 07/05/2002 - 06/05/2003 225,876,488 07/05/02
01119 Playmates Interactive Entertainment Ltd Warrants 2004 0.300 13/05/2002 - 12/05/2004 60,543,330 13/05/02
01165 Tak Shun Technology Group Ltd Warrants 2004 0.400 30/05/2002 - 29/05/2004 115,200,000 30/05/02
00344 Hop Hing Holdings Ltd Warrants 2005 0.270 29/05/2002 - 30/04/2005 22,092,103 03/06/02
00852 Sinolink Worldwide Holdings Ltd Warrants 2003 1.000 31/05/2002 - 29/11/2003 181,440,200 05/06/02
02305 China City Natural Gas Holdings Ltd Warrants 2003 0.165 20/06/2002 - 19/12/2003 132,000,000 20/06/02
01115 Riche Multi-Media Holdings Ltd Warrants 2005 3.600 17/06/2002 - 16/06/2005 342,144,000 20/06/02
00652 Harmony Asset Ltd Warrants 2004 0.080 21/06/2002 - 30/06/2004 15,571,616 25/06/02
01204 South China Brokerage Co Ltd Warrants 2003 0.080 21/06/2002 - 21/06/2003 77,790,988 25/06/02
01144 B-Tech (Holdings) Ltd Warrants 2003 0.090 25/06/2002 - 30/06/2003 22,027,034 28/06/02
00837 Premium Land Ltd Warrants 2003 0.220 09/07/2002 - 08/07/2003 118,764,800 09/07/02
01048 South China Holdings Ltd Warrants 2003 0.420 23/07/2002 - 23/07/2003 153,165,716 25/07/02
00924 Deson Development International Holdings Ltd Warrants 2004 0.033 15/08/2002 - 14/08/2002 31,624,644 19/08/02
01216 China Strategic Holdings Ltd Warrants 2003 0.160 29/08/2002 - 31/12/2003 26,542,989 29/08/02
02303 Huafeng Environmental Protection Textile 0.650 30/08/2002 - 21/08/2005 83,200,000 30/08/02International Group Ltd Warrants 2005
01181 Alco Holdings Ltd Warrants 2005 0.980 02/09/2002 - 01/09/2005 50,115,421 02/09/02
00944 Good Fellow Group Ltd Warrants 2004 0.370 12/09/2002 - 15/03/2004 133,200,000 16/09/02
00584 Pacific Andes International Holdings Ltd Warrants 2004 0.850 26/09/2002 - 25/03/2004 120,190,895 26/09/02
00631 Wing Shing Chemical Holdings Ltd Warrants 2007 0.700 13/11/2002 - 31/10/2007 54,399,997 13/11/02
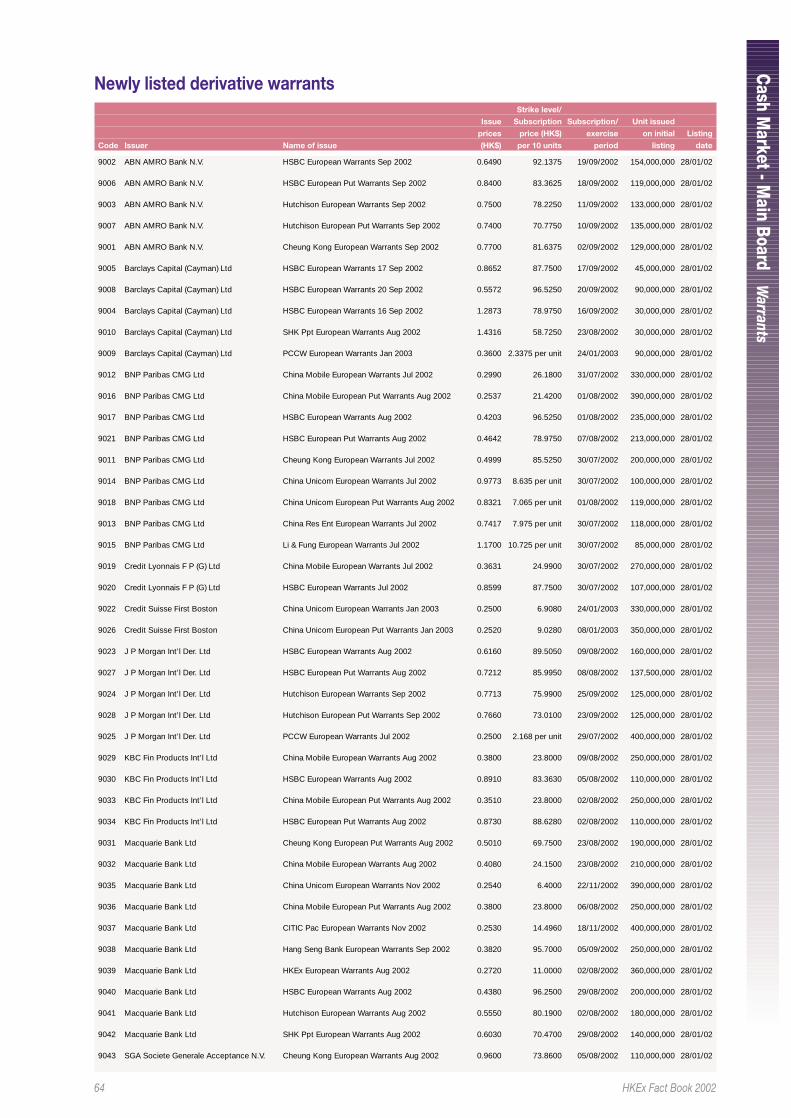
64 HKEx Fact Book 2002
Cash M
arket - Main Boar d
Warrants
Newly listed derivative warrantsStrike level/
Issue Subscription Subscription/ Unit issued
prices price (HK$) exercise on initial Listing
Code Issuer Name of issue (HK$) per 10 units period listing date
9002 ABN AMRO Bank N.V. HSBC European Warrants Sep 2002 0.6490 92.1375 19/09/2002 154,000,000 28/01/02
9006 ABN AMRO Bank N.V. HSBC European Put Warrants Sep 2002 0.8400 83.3625 18/09/2002 119,000,000 28/01/02
9003 ABN AMRO Bank N.V. Hutchison European Warrants Sep 2002 0.7500 78.2250 11/09/2002 133,000,000 28/01/02
9007 ABN AMRO Bank N.V. Hutchison European Put Warrants Sep 2002 0.7400 70.7750 10/09/2002 135,000,000 28/01/02
9001 ABN AMRO Bank N.V. Cheung Kong European Warrants Sep 2002 0.7700 81.6375 02/09/2002 129,000,000 28/01/02
9005 Barclays Capital (Cayman) Ltd HSBC European Warrants 17 Sep 2002 0.8652 87.7500 17/09/2002 45,000,000 28/01/02
9008 Barclays Capital (Cayman) Ltd HSBC European Warrants 20 Sep 2002 0.5572 96.5250 20/09/2002 90,000,000 28/01/02
9004 Barclays Capital (Cayman) Ltd HSBC European Warrants 16 Sep 2002 1.2873 78.9750 16/09/2002 30,000,000 28/01/02
9010 Barclays Capital (Cayman) Ltd SHK Ppt European Warrants Aug 2002 1.4316 58.7250 23/08/2002 30,000,000 28/01/02
9009 Barclays Capital (Cayman) Ltd PCCW European Warrants Jan 2003 0.3600 2.3375 per unit 24/01/2003 90,000,000 28/01/02
9012 BNP Paribas CMG Ltd China Mobile European Warrants Jul 2002 0.2990 26.1800 31/07/2002 330,000,000 28/01/02
9016 BNP Paribas CMG Ltd China Mobile European Put Warrants Aug 2002 0.2537 21.4200 01/08/2002 390,000,000 28/01/02
9017 BNP Paribas CMG Ltd HSBC European Warrants Aug 2002 0.4203 96.5250 01/08/2002 235,000,000 28/01/02
9021 BNP Paribas CMG Ltd HSBC European Put Warrants Aug 2002 0.4642 78.9750 07/08/2002 213,000,000 28/01/02
9011 BNP Paribas CMG Ltd Cheung Kong European Warrants Jul 2002 0.4999 85.5250 30/07/2002 200,000,000 28/01/02
9014 BNP Paribas CMG Ltd China Unicom European Warrants Jul 2002 0.9773 8.635 per unit 30/07/2002 100,000,000 28/01/02
9018 BNP Paribas CMG Ltd China Unicom European Put Warrants Aug 2002 0.8321 7.065 per unit 01/08/2002 119,000,000 28/01/02
9013 BNP Paribas CMG Ltd China Res Ent European Warrants Jul 2002 0.7417 7.975 per unit 30/07/2002 118,000,000 28/01/02
9015 BNP Paribas CMG Ltd Li & Fung European Warrants Jul 2002 1.1700 10.725 per unit 30/07/2002 85,000,000 28/01/02
9019 Credit Lyonnais F P (G) Ltd China Mobile European Warrants Jul 2002 0.3631 24.9900 30/07/2002 270,000,000 28/01/02
9020 Credit Lyonnais F P (G) Ltd HSBC European Warrants Jul 2002 0.8599 87.7500 30/07/2002 107,000,000 28/01/02
9022 Credit Suisse First Boston China Unicom European Warrants Jan 2003 0.2500 6.9080 24/01/2003 330,000,000 28/01/02
9026 Credit Suisse First Boston China Unicom European Put Warrants Jan 2003 0.2520 9.0280 08/01/2003 350,000,000 28/01/02
9023 J P Morgan Int’l Der. Ltd HSBC European Warrants Aug 2002 0.6160 89.5050 09/08/2002 160,000,000 28/01/02
9027 J P Morgan Int’l Der. Ltd HSBC European Put Warrants Aug 2002 0.7212 85.9950 08/08/2002 137,500,000 28/01/02
9024 J P Morgan Int’l Der. Ltd Hutchison European Warrants Sep 2002 0.7713 75.9900 25/09/2002 125,000,000 28/01/02
9028 J P Morgan Int’l Der. Ltd Hutchison European Put Warrants Sep 2002 0.7660 73.0100 23/09/2002 125,000,000 28/01/02
9025 J P Morgan Int’l Der. Ltd PCCW European Warrants Jul 2002 0.2500 2.168 per unit 29/07/2002 400,000,000 28/01/02
9029 KBC Fin Products Int’l Ltd China Mobile European Warrants Aug 2002 0.3800 23.8000 09/08/2002 250,000,000 28/01/02
9030 KBC Fin Products Int’l Ltd HSBC European Warrants Aug 2002 0.8910 83.3630 05/08/2002 110,000,000 28/01/02
9033 KBC Fin Products Int’l Ltd China Mobile European Put Warrants Aug 2002 0.3510 23.8000 02/08/2002 250,000,000 28/01/02
9034 KBC Fin Products Int’l Ltd HSBC European Put Warrants Aug 2002 0.8730 88.6280 02/08/2002 110,000,000 28/01/02
9031 Macquarie Bank Ltd Cheung Kong European Put Warrants Aug 2002 0.5010 69.7500 23/08/2002 190,000,000 28/01/02
9032 Macquarie Bank Ltd China Mobile European Warrants Aug 2002 0.4080 24.1500 23/08/2002 210,000,000 28/01/02
9035 Macquarie Bank Ltd China Unicom European Warrants Nov 2002 0.2540 6.4000 22/11/2002 390,000,000 28/01/02
9036 Macquarie Bank Ltd China Mobile European Put Warrants Aug 2002 0.3800 23.8000 06/08/2002 250,000,000 28/01/02
9037 Macquarie Bank Ltd CITIC Pac European Warrants Nov 2002 0.2530 14.4960 18/11/2002 400,000,000 28/01/02
9038 Macquarie Bank Ltd Hang Seng Bank European Warrants Sep 2002 0.3820 95.7000 05/09/2002 250,000,000 28/01/02
9039 Macquarie Bank Ltd HKEx European Warrants Aug 2002 0.2720 11.0000 02/08/2002 360,000,000 28/01/02
9040 Macquarie Bank Ltd HSBC European Warrants Aug 2002 0.4380 96.2500 29/08/2002 200,000,000 28/01/02
9041 Macquarie Bank Ltd Hutchison European Warrants Aug 2002 0.5550 80.1900 02/08/2002 180,000,000 28/01/02
9042 Macquarie Bank Ltd SHK Ppt European Warrants Aug 2002 0.6030 70.4700 29/08/2002 140,000,000 28/01/02
9043 SGA Societe Generale Acceptance N.V. Cheung Kong European Warrants Aug 2002 0.9600 73.8600 05/08/2002 110,000,000 28/01/02
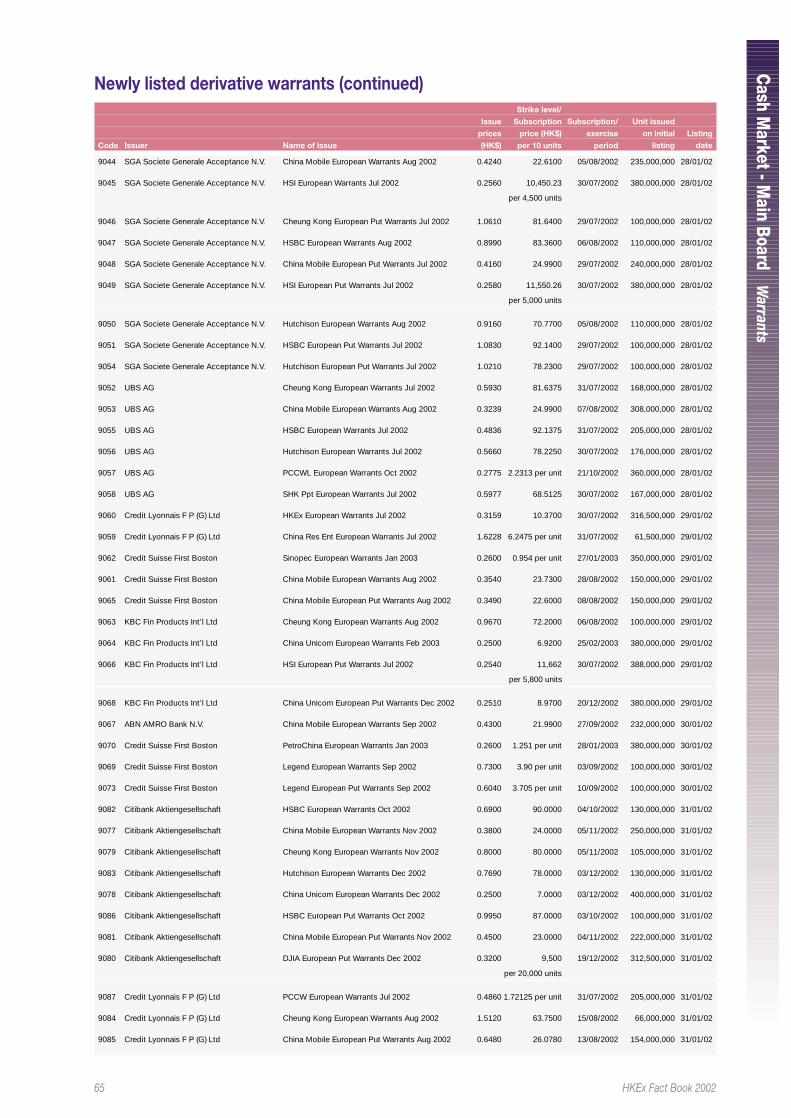
65 HKEx Fact Book 2002
Cash M
arket - Main Boar d
Warrants
9044 SGA Societe Generale Acceptance N.V. China Mobile European Warrants Aug 2002 0.4240 22.6100 05/08/2002 235,000,000 28/01/02
9045 SGA Societe Generale Acceptance N.V. HSI European Warrants Jul 2002 0.2560 10,450.23 30/07/2002 380,000,000 28/01/02
per 4,500 units
9046 SGA Societe Generale Acceptance N.V. Cheung Kong European Put Warrants Jul 2002 1.0610 81.6400 29/07/2002 100,000,000 28/01/02
9047 SGA Societe Generale Acceptance N.V. HSBC European Warrants Aug 2002 0.8990 83.3600 06/08/2002 110,000,000 28/01/02
9048 SGA Societe Generale Acceptance N.V. China Mobile European Put Warrants Jul 2002 0.4160 24.9900 29/07/2002 240,000,000 28/01/02
9049 SGA Societe Generale Acceptance N.V. HSI European Put Warrants Jul 2002 0.2580 11,550.26 30/07/2002 380,000,000 28/01/02
per 5,000 units
9050 SGA Societe Generale Acceptance N.V. Hutchison European Warrants Aug 2002 0.9160 70.7700 05/08/2002 110,000,000 28/01/02
9051 SGA Societe Generale Acceptance N.V. HSBC European Put Warrants Jul 2002 1.0830 92.1400 29/07/2002 100,000,000 28/01/02
9054 SGA Societe Generale Acceptance N.V. Hutchison European Put Warrants Jul 2002 1.0210 78.2300 29/07/2002 100,000,000 28/01/02
9052 UBS AG Cheung Kong European Warrants Jul 2002 0.5930 81.6375 31/07/2002 168,000,000 28/01/02
9053 UBS AG China Mobile European Warrants Aug 2002 0.3239 24.9900 07/08/2002 308,000,000 28/01/02
9055 UBS AG HSBC European Warrants Jul 2002 0.4836 92.1375 31/07/2002 205,000,000 28/01/02
9056 UBS AG Hutchison European Warrants Jul 2002 0.5660 78.2250 30/07/2002 176,000,000 28/01/02
9057 UBS AG PCCWL European Warrants Oct 2002 0.2775 2.2313 per unit 21/10/2002 360,000,000 28/01/02
9058 UBS AG SHK Ppt European Warrants Jul 2002 0.5977 68.5125 30/07/2002 167,000,000 28/01/02
9060 Credit Lyonnais F P (G) Ltd HKEx European Warrants Jul 2002 0.3159 10.3700 30/07/2002 316,500,000 29/01/02
9059 Credit Lyonnais F P (G) Ltd China Res Ent European Warrants Jul 2002 1.6228 6.2475 per unit 31/07/2002 61,500,000 29/01/02
9062 Credit Suisse First Boston Sinopec European Warrants Jan 2003 0.2600 0.954 per unit 27/01/2003 350,000,000 29/01/02
9061 Credit Suisse First Boston China Mobile European Warrants Aug 2002 0.3540 23.7300 28/08/2002 150,000,000 29/01/02
9065 Credit Suisse First Boston China Mobile European Put Warrants Aug 2002 0.3490 22.6000 08/08/2002 150,000,000 29/01/02
9063 KBC Fin Products Int’l Ltd Cheung Kong European Warrants Aug 2002 0.9670 72.2000 06/08/2002 100,000,000 29/01/02
9064 KBC Fin Products Int’l Ltd China Unicom European Warrants Feb 2003 0.2500 6.9200 25/02/2003 380,000,000 29/01/02
9066 KBC Fin Products Int’l Ltd HSI European Put Warrants Jul 2002 0.2540 11,662 30/07/2002 388,000,000 29/01/02
per 5,800 units
9068 KBC Fin Products Int’l Ltd China Unicom European Put Warrants Dec 2002 0.2510 8.9700 20/12/2002 380,000,000 29/01/02
9067 ABN AMRO Bank N.V. China Mobile European Warrants Sep 2002 0.4300 21.9900 27/09/2002 232,000,000 30/01/02
9070 Credit Suisse First Boston PetroChina European Warrants Jan 2003 0.2600 1.251 per unit 28/01/2003 380,000,000 30/01/02
9069 Credit Suisse First Boston Legend European Warrants Sep 2002 0.7300 3.90 per unit 03/09/2002 100,000,000 30/01/02
9073 Credit Suisse First Boston Legend European Put Warrants Sep 2002 0.6040 3.705 per unit 10/09/2002 100,000,000 30/01/02
9082 Citibank Aktiengesellschaft HSBC European Warrants Oct 2002 0.6900 90.0000 04/10/2002 130,000,000 31/01/02
9077 Citibank Aktiengesellschaft China Mobile European Warrants Nov 2002 0.3800 24.0000 05/11/2002 250,000,000 31/01/02
9079 Citibank Aktiengesellschaft Cheung Kong European Warrants Nov 2002 0.8000 80.0000 05/11/2002 105,000,000 31/01/02
9083 Citibank Aktiengesellschaft Hutchison European Warrants Dec 2002 0.7690 78.0000 03/12/2002 130,000,000 31/01/02
9078 Citibank Aktiengesellschaft China Unicom European Warrants Dec 2002 0.2500 7.0000 03/12/2002 400,000,000 31/01/02
9086 Citibank Aktiengesellschaft HSBC European Put Warrants Oct 2002 0.9950 87.0000 03/10/2002 100,000,000 31/01/02
9081 Citibank Aktiengesellschaft China Mobile European Put Warrants Nov 2002 0.4500 23.0000 04/11/2002 222,000,000 31/01/02
9080 Citibank Aktiengesellschaft DJIA European Put Warrants Dec 2002 0.3200 9,500 19/12/2002 312,500,000 31/01/02
per 20,000 units
9087 Credit Lyonnais F P (G) Ltd PCCW European Warrants Jul 2002 0.4860 1.72125 per unit 31/07/2002 205,000,000 31/01/02
9084 Credit Lyonnais F P (G) Ltd Cheung Kong European Warrants Aug 2002 1.5120 63.7500 15/08/2002 66,000,000 31/01/02
9085 Credit Lyonnais F P (G) Ltd China Mobile European Put Warrants Aug 2002 0.6480 26.0780 13/08/2002 154,000,000 31/01/02
Newly listed derivative warrants (continued)Strike level/
Issue Subscription Subscription/ Unit issued
prices price (HK$) exercise on initial Listing
Code Issuer Name of issue (HK$) per 10 units period listing date
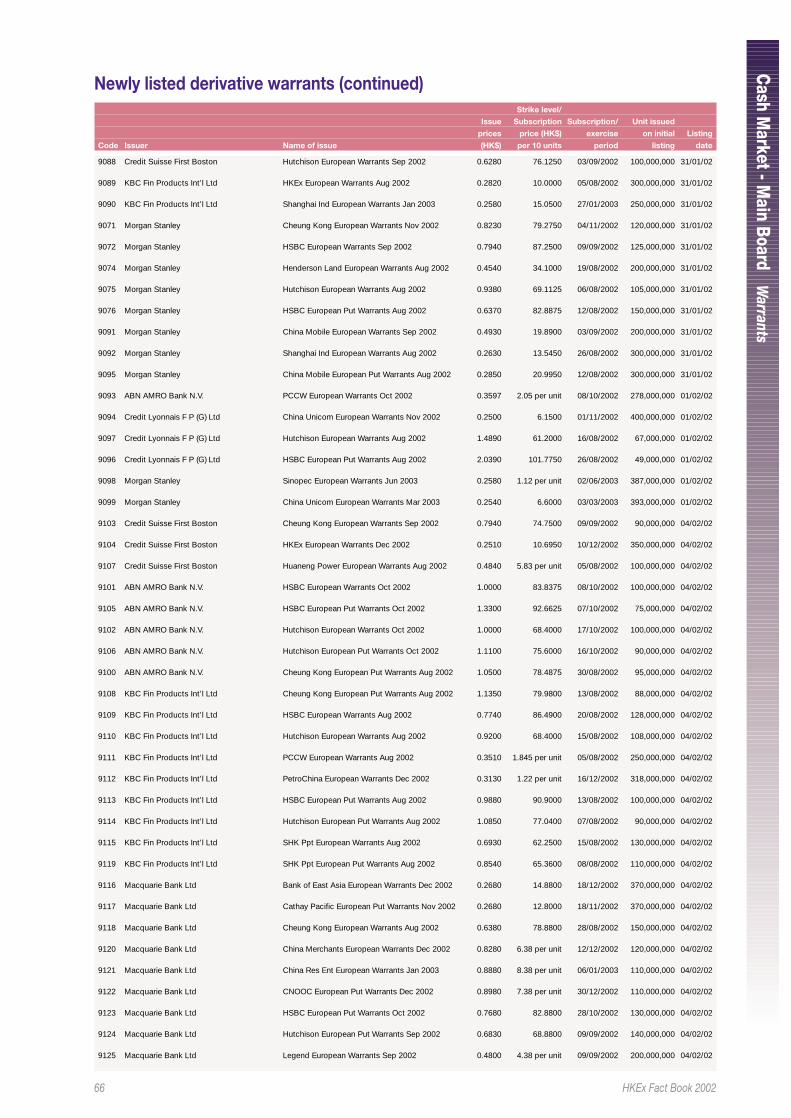
66 HKEx Fact Book 2002
Cash M
arket - Main Boar d
Warrants
9088 Credit Suisse First Boston Hutchison European Warrants Sep 2002 0.6280 76.1250 03/09/2002 100,000,000 31/01/02
9089 KBC Fin Products Int’l Ltd HKEx European Warrants Aug 2002 0.2820 10.0000 05/08/2002 300,000,000 31/01/02
9090 KBC Fin Products Int’l Ltd Shanghai Ind European Warrants Jan 2003 0.2580 15.0500 27/01/2003 250,000,000 31/01/02
9071 Morgan Stanley Cheung Kong European Warrants Nov 2002 0.8230 79.2750 04/11/2002 120,000,000 31/01/02
9072 Morgan Stanley HSBC European Warrants Sep 2002 0.7940 87.2500 09/09/2002 125,000,000 31/01/02
9074 Morgan Stanley Henderson Land European Warrants Aug 2002 0.4540 34.1000 19/08/2002 200,000,000 31/01/02
9075 Morgan Stanley Hutchison European Warrants Aug 2002 0.9380 69.1125 06/08/2002 105,000,000 31/01/02
9076 Morgan Stanley HSBC European Put Warrants Aug 2002 0.6370 82.8875 12/08/2002 150,000,000 31/01/02
9091 Morgan Stanley China Mobile European Warrants Sep 2002 0.4930 19.8900 03/09/2002 200,000,000 31/01/02
9092 Morgan Stanley Shanghai Ind European Warrants Aug 2002 0.2630 13.5450 26/08/2002 300,000,000 31/01/02
9095 Morgan Stanley China Mobile European Put Warrants Aug 2002 0.2850 20.9950 12/08/2002 300,000,000 31/01/02
9093 ABN AMRO Bank N.V. PCCW European Warrants Oct 2002 0.3597 2.05 per unit 08/10/2002 278,000,000 01/02/02
9094 Credit Lyonnais F P (G) Ltd China Unicom European Warrants Nov 2002 0.2500 6.1500 01/11/2002 400,000,000 01/02/02
9097 Credit Lyonnais F P (G) Ltd Hutchison European Warrants Aug 2002 1.4890 61.2000 16/08/2002 67,000,000 01/02/02
9096 Credit Lyonnais F P (G) Ltd HSBC European Put Warrants Aug 2002 2.0390 101.7750 26/08/2002 49,000,000 01/02/02
9098 Morgan Stanley Sinopec European Warrants Jun 2003 0.2580 1.12 per unit 02/06/2003 387,000,000 01/02/02
9099 Morgan Stanley China Unicom European Warrants Mar 2003 0.2540 6.6000 03/03/2003 393,000,000 01/02/02
9103 Credit Suisse First Boston Cheung Kong European Warrants Sep 2002 0.7940 74.7500 09/09/2002 90,000,000 04/02/02
9104 Credit Suisse First Boston HKEx European Warrants Dec 2002 0.2510 10.6950 10/12/2002 350,000,000 04/02/02
9107 Credit Suisse First Boston Huaneng Power European Warrants Aug 2002 0.4840 5.83 per unit 05/08/2002 100,000,000 04/02/02
9101 ABN AMRO Bank N.V. HSBC European Warrants Oct 2002 1.0000 83.8375 08/10/2002 100,000,000 04/02/02
9105 ABN AMRO Bank N.V. HSBC European Put Warrants Oct 2002 1.3300 92.6625 07/10/2002 75,000,000 04/02/02
9102 ABN AMRO Bank N.V. Hutchison European Warrants Oct 2002 1.0000 68.4000 17/10/2002 100,000,000 04/02/02
9106 ABN AMRO Bank N.V. Hutchison European Put Warrants Oct 2002 1.1100 75.6000 16/10/2002 90,000,000 04/02/02
9100 ABN AMRO Bank N.V. Cheung Kong European Put Warrants Aug 2002 1.0500 78.4875 30/08/2002 95,000,000 04/02/02
9108 KBC Fin Products Int’l Ltd Cheung Kong European Put Warrants Aug 2002 1.1350 79.9800 13/08/2002 88,000,000 04/02/02
9109 KBC Fin Products Int’l Ltd HSBC European Warrants Aug 2002 0.7740 86.4900 20/08/2002 128,000,000 04/02/02
9110 KBC Fin Products Int’l Ltd Hutchison European Warrants Aug 2002 0.9200 68.4000 15/08/2002 108,000,000 04/02/02
9111 KBC Fin Products Int’l Ltd PCCW European Warrants Aug 2002 0.3510 1.845 per unit 05/08/2002 250,000,000 04/02/02
9112 KBC Fin Products Int’l Ltd PetroChina European Warrants Dec 2002 0.3130 1.22 per unit 16/12/2002 318,000,000 04/02/02
9113 KBC Fin Products Int’l Ltd HSBC European Put Warrants Aug 2002 0.9880 90.9000 13/08/2002 100,000,000 04/02/02
9114 KBC Fin Products Int’l Ltd Hutchison European Put Warrants Aug 2002 1.0850 77.0400 07/08/2002 90,000,000 04/02/02
9115 KBC Fin Products Int’l Ltd SHK Ppt European Warrants Aug 2002 0.6930 62.2500 15/08/2002 130,000,000 04/02/02
9119 KBC Fin Products Int’l Ltd SHK Ppt European Put Warrants Aug 2002 0.8540 65.3600 08/08/2002 110,000,000 04/02/02
9116 Macquarie Bank Ltd Bank of East Asia European Warrants Dec 2002 0.2680 14.8800 18/12/2002 370,000,000 04/02/02
9117 Macquarie Bank Ltd Cathay Pacific European Put Warrants Nov 2002 0.2680 12.8000 18/11/2002 370,000,000 04/02/02
9118 Macquarie Bank Ltd Cheung Kong European Warrants Aug 2002 0.6380 78.8800 28/08/2002 150,000,000 04/02/02
9120 Macquarie Bank Ltd China Merchants European Warrants Dec 2002 0.8280 6.38 per unit 12/12/2002 120,000,000 04/02/02
9121 Macquarie Bank Ltd China Res Ent European Warrants Jan 2003 0.8880 8.38 per unit 06/01/2003 110,000,000 04/02/02
9122 Macquarie Bank Ltd CNOOC European Put Warrants Dec 2002 0.8980 7.38 per unit 30/12/2002 110,000,000 04/02/02
9123 Macquarie Bank Ltd HSBC European Put Warrants Oct 2002 0.7680 82.8800 28/10/2002 130,000,000 04/02/02
9124 Macquarie Bank Ltd Hutchison European Put Warrants Sep 2002 0.6830 68.8800 09/09/2002 140,000,000 04/02/02
9125 Macquarie Bank Ltd Legend European Warrants Sep 2002 0.4800 4.38 per unit 09/09/2002 200,000,000 04/02/02
Newly listed derivative warrants (continued)Strike level/
Issue Subscription Subscription/ Unit issued
prices price (HK$) exercise on initial Listing
Code Issuer Name of issue (HK$) per 10 units period listing date
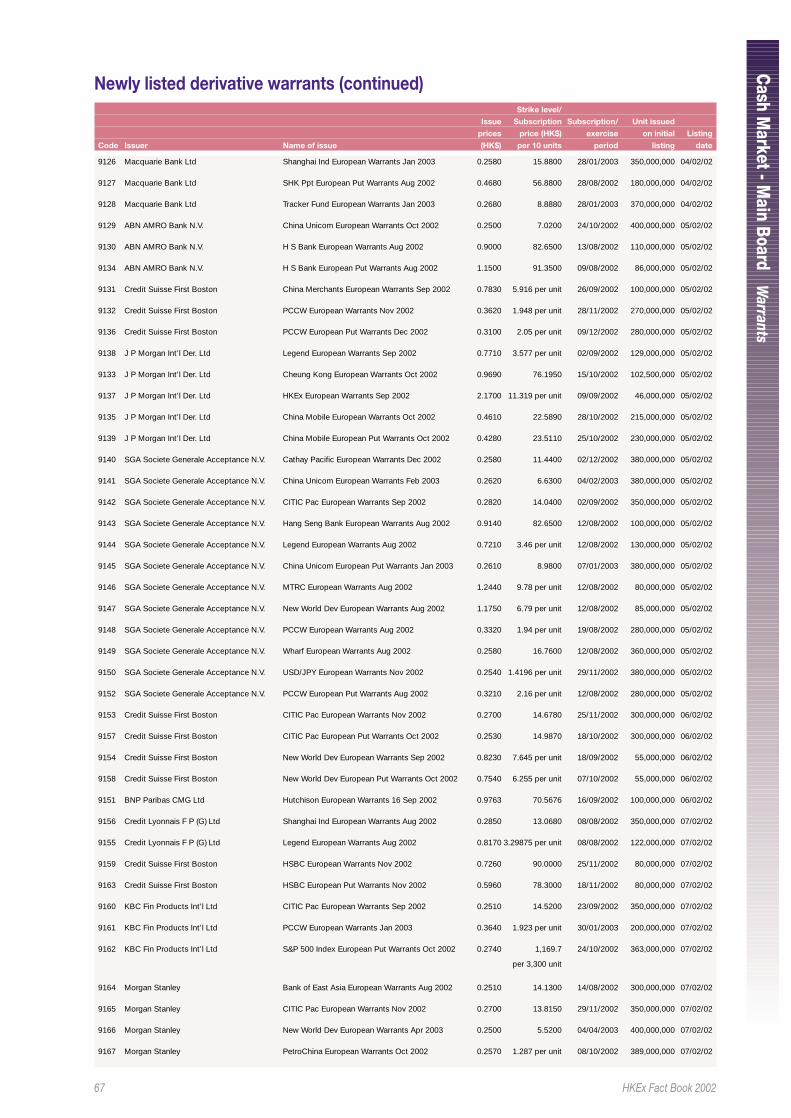
67 HKEx Fact Book 2002
Cash M
arket - Main Boar d
Warrants
9126 Macquarie Bank Ltd Shanghai Ind European Warrants Jan 2003 0.2580 15.8800 28/01/2003 350,000,000 04/02/02
9127 Macquarie Bank Ltd SHK Ppt European Put Warrants Aug 2002 0.4680 56.8800 28/08/2002 180,000,000 04/02/02
9128 Macquarie Bank Ltd Tracker Fund European Warrants Jan 2003 0.2680 8.8880 28/01/2003 370,000,000 04/02/02
9129 ABN AMRO Bank N.V. China Unicom European Warrants Oct 2002 0.2500 7.0200 24/10/2002 400,000,000 05/02/02
9130 ABN AMRO Bank N.V. H S Bank European Warrants Aug 2002 0.9000 82.6500 13/08/2002 110,000,000 05/02/02
9134 ABN AMRO Bank N.V. H S Bank European Put Warrants Aug 2002 1.1500 91.3500 09/08/2002 86,000,000 05/02/02
9131 Credit Suisse First Boston China Merchants European Warrants Sep 2002 0.7830 5.916 per unit 26/09/2002 100,000,000 05/02/02
9132 Credit Suisse First Boston PCCW European Warrants Nov 2002 0.3620 1.948 per unit 28/11/2002 270,000,000 05/02/02
9136 Credit Suisse First Boston PCCW European Put Warrants Dec 2002 0.3100 2.05 per unit 09/12/2002 280,000,000 05/02/02
9138 J P Morgan Int’l Der. Ltd Legend European Warrants Sep 2002 0.7710 3.577 per unit 02/09/2002 129,000,000 05/02/02
9133 J P Morgan Int’l Der. Ltd Cheung Kong European Warrants Oct 2002 0.9690 76.1950 15/10/2002 102,500,000 05/02/02
9137 J P Morgan Int’l Der. Ltd HKEx European Warrants Sep 2002 2.1700 11.319 per unit 09/09/2002 46,000,000 05/02/02
9135 J P Morgan Int’l Der. Ltd China Mobile European Warrants Oct 2002 0.4610 22.5890 28/10/2002 215,000,000 05/02/02
9139 J P Morgan Int’l Der. Ltd China Mobile European Put Warrants Oct 2002 0.4280 23.5110 25/10/2002 230,000,000 05/02/02
9140 SGA Societe Generale Acceptance N.V. Cathay Pacific European Warrants Dec 2002 0.2580 11.4400 02/12/2002 380,000,000 05/02/02
9141 SGA Societe Generale Acceptance N.V. China Unicom European Warrants Feb 2003 0.2620 6.6300 04/02/2003 380,000,000 05/02/02
9142 SGA Societe Generale Acceptance N.V. CITIC Pac European Warrants Sep 2002 0.2820 14.0400 02/09/2002 350,000,000 05/02/02
9143 SGA Societe Generale Acceptance N.V. Hang Seng Bank European Warrants Aug 2002 0.9140 82.6500 12/08/2002 100,000,000 05/02/02
9144 SGA Societe Generale Acceptance N.V. Legend European Warrants Aug 2002 0.7210 3.46 per unit 12/08/2002 130,000,000 05/02/02
9145 SGA Societe Generale Acceptance N.V. China Unicom European Put Warrants Jan 2003 0.2610 8.9800 07/01/2003 380,000,000 05/02/02
9146 SGA Societe Generale Acceptance N.V. MTRC European Warrants Aug 2002 1.2440 9.78 per unit 12/08/2002 80,000,000 05/02/02
9147 SGA Societe Generale Acceptance N.V. New World Dev European Warrants Aug 2002 1.1750 6.79 per unit 12/08/2002 85,000,000 05/02/02
9148 SGA Societe Generale Acceptance N.V. PCCW European Warrants Aug 2002 0.3320 1.94 per unit 19/08/2002 280,000,000 05/02/02
9149 SGA Societe Generale Acceptance N.V. Wharf European Warrants Aug 2002 0.2580 16.7600 12/08/2002 360,000,000 05/02/02
9150 SGA Societe Generale Acceptance N.V. USD/JPY European Warrants Nov 2002 0.2540 1.4196 per unit 29/11/2002 380,000,000 05/02/02
9152 SGA Societe Generale Acceptance N.V. PCCW European Put Warrants Aug 2002 0.3210 2.16 per unit 12/08/2002 280,000,000 05/02/02
9153 Credit Suisse First Boston CITIC Pac European Warrants Nov 2002 0.2700 14.6780 25/11/2002 300,000,000 06/02/02
9157 Credit Suisse First Boston CITIC Pac European Put Warrants Oct 2002 0.2530 14.9870 18/10/2002 300,000,000 06/02/02
9154 Credit Suisse First Boston New World Dev European Warrants Sep 2002 0.8230 7.645 per unit 18/09/2002 55,000,000 06/02/02
9158 Credit Suisse First Boston New World Dev European Put Warrants Oct 2002 0.7540 6.255 per unit 07/10/2002 55,000,000 06/02/02
9151 BNP Paribas CMG Ltd Hutchison European Warrants 16 Sep 2002 0.9763 70.5676 16/09/2002 100,000,000 06/02/02
9156 Credit Lyonnais F P (G) Ltd Shanghai Ind European Warrants Aug 2002 0.2850 13.0680 08/08/2002 350,000,000 07/02/02
9155 Credit Lyonnais F P (G) Ltd Legend European Warrants Aug 2002 0.8170 3.29875 per unit 08/08/2002 122,000,000 07/02/02
9159 Credit Suisse First Boston HSBC European Warrants Nov 2002 0.7260 90.0000 25/11/2002 80,000,000 07/02/02
9163 Credit Suisse First Boston HSBC European Put Warrants Nov 2002 0.5960 78.3000 18/11/2002 80,000,000 07/02/02
9160 KBC Fin Products Int’l Ltd CITIC Pac European Warrants Sep 2002 0.2510 14.5200 23/09/2002 350,000,000 07/02/02
9161 KBC Fin Products Int’l Ltd PCCW European Warrants Jan 2003 0.3640 1.923 per unit 30/01/2003 200,000,000 07/02/02
9162 KBC Fin Products Int’l Ltd S&P 500 Index European Put Warrants Oct 2002 0.2740 1,169.7 24/10/2002 363,000,000 07/02/02
per 3,300 unit
9164 Morgan Stanley Bank of East Asia European Warrants Aug 2002 0.2510 14.1300 14/08/2002 300,000,000 07/02/02
9165 Morgan Stanley CITIC Pac European Warrants Nov 2002 0.2700 13.8150 29/11/2002 350,000,000 07/02/02
9166 Morgan Stanley New World Dev European Warrants Apr 2003 0.2500 5.5200 04/04/2003 400,000,000 07/02/02
9167 Morgan Stanley PetroChina European Warrants Oct 2002 0.2570 1.287 per unit 08/10/2002 389,000,000 07/02/02
Newly listed derivative warrants (continued)Strike level/
Issue Subscription Subscription/ Unit issued
prices price (HK$) exercise on initial Listing
Code Issuer Name of issue (HK$) per 10 units period listing date
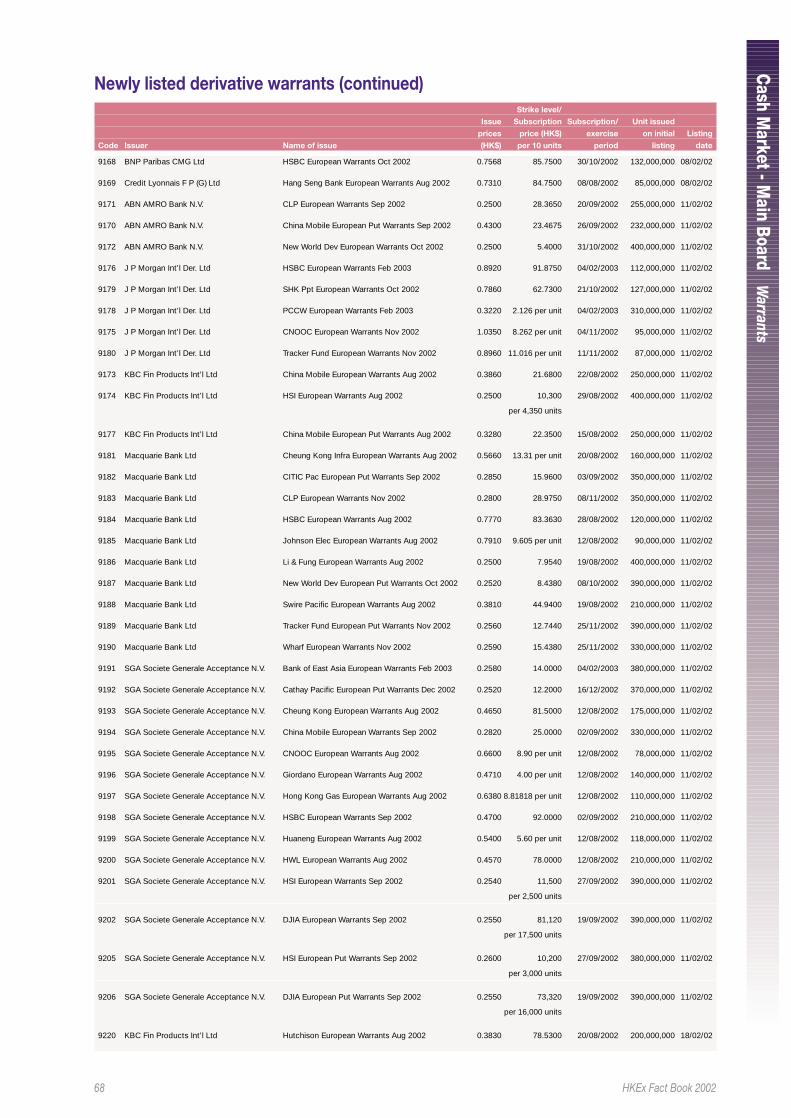
68 HKEx Fact Book 2002
Cash M
arket - Main Boar d
Warrants
9168 BNP Paribas CMG Ltd HSBC European Warrants Oct 2002 0.7568 85.7500 30/10/2002 132,000,000 08/02/02
9169 Credit Lyonnais F P (G) Ltd Hang Seng Bank European Warrants Aug 2002 0.7310 84.7500 08/08/2002 85,000,000 08/02/02
9171 ABN AMRO Bank N.V. CLP European Warrants Sep 2002 0.2500 28.3650 20/09/2002 255,000,000 11/02/02
9170 ABN AMRO Bank N.V. China Mobile European Put Warrants Sep 2002 0.4300 23.4675 26/09/2002 232,000,000 11/02/02
9172 ABN AMRO Bank N.V. New World Dev European Warrants Oct 2002 0.2500 5.4000 31/10/2002 400,000,000 11/02/02
9176 J P Morgan Int’l Der. Ltd HSBC European Warrants Feb 2003 0.8920 91.8750 04/02/2003 112,000,000 11/02/02
9179 J P Morgan Int’l Der. Ltd SHK Ppt European Warrants Oct 2002 0.7860 62.7300 21/10/2002 127,000,000 11/02/02
9178 J P Morgan Int’l Der. Ltd PCCW European Warrants Feb 2003 0.3220 2.126 per unit 04/02/2003 310,000,000 11/02/02
9175 J P Morgan Int’l Der. Ltd CNOOC European Warrants Nov 2002 1.0350 8.262 per unit 04/11/2002 95,000,000 11/02/02
9180 J P Morgan Int’l Der. Ltd Tracker Fund European Warrants Nov 2002 0.8960 11.016 per unit 11/11/2002 87,000,000 11/02/02
9173 KBC Fin Products Int’l Ltd China Mobile European Warrants Aug 2002 0.3860 21.6800 22/08/2002 250,000,000 11/02/02
9174 KBC Fin Products Int’l Ltd HSI European Warrants Aug 2002 0.2500 10,300 29/08/2002 400,000,000 11/02/02
per 4,350 units
9177 KBC Fin Products Int’l Ltd China Mobile European Put Warrants Aug 2002 0.3280 22.3500 15/08/2002 250,000,000 11/02/02
9181 Macquarie Bank Ltd Cheung Kong Infra European Warrants Aug 2002 0.5660 13.31 per unit 20/08/2002 160,000,000 11/02/02
9182 Macquarie Bank Ltd CITIC Pac European Put Warrants Sep 2002 0.2850 15.9600 03/09/2002 350,000,000 11/02/02
9183 Macquarie Bank Ltd CLP European Warrants Nov 2002 0.2800 28.9750 08/11/2002 350,000,000 11/02/02
9184 Macquarie Bank Ltd HSBC European Warrants Aug 2002 0.7770 83.3630 28/08/2002 120,000,000 11/02/02
9185 Macquarie Bank Ltd Johnson Elec European Warrants Aug 2002 0.7910 9.605 per unit 12/08/2002 90,000,000 11/02/02
9186 Macquarie Bank Ltd Li & Fung European Warrants Aug 2002 0.2500 7.9540 19/08/2002 400,000,000 11/02/02
9187 Macquarie Bank Ltd New World Dev European Put Warrants Oct 2002 0.2520 8.4380 08/10/2002 390,000,000 11/02/02
9188 Macquarie Bank Ltd Swire Pacific European Warrants Aug 2002 0.3810 44.9400 19/08/2002 210,000,000 11/02/02
9189 Macquarie Bank Ltd Tracker Fund European Put Warrants Nov 2002 0.2560 12.7440 25/11/2002 390,000,000 11/02/02
9190 Macquarie Bank Ltd Wharf European Warrants Nov 2002 0.2590 15.4380 25/11/2002 330,000,000 11/02/02
9191 SGA Societe Generale Acceptance N.V. Bank of East Asia European Warrants Feb 2003 0.2580 14.0000 04/02/2003 380,000,000 11/02/02
9192 SGA Societe Generale Acceptance N.V. Cathay Pacific European Put Warrants Dec 2002 0.2520 12.2000 16/12/2002 370,000,000 11/02/02
9193 SGA Societe Generale Acceptance N.V. Cheung Kong European Warrants Aug 2002 0.4650 81.5000 12/08/2002 175,000,000 11/02/02
9194 SGA Societe Generale Acceptance N.V. China Mobile European Warrants Sep 2002 0.2820 25.0000 02/09/2002 330,000,000 11/02/02
9195 SGA Societe Generale Acceptance N.V. CNOOC European Warrants Aug 2002 0.6600 8.90 per unit 12/08/2002 78,000,000 11/02/02
9196 SGA Societe Generale Acceptance N.V. Giordano European Warrants Aug 2002 0.4710 4.00 per unit 12/08/2002 140,000,000 11/02/02
9197 SGA Societe Generale Acceptance N.V. Hong Kong Gas European Warrants Aug 2002 0.6380 8.81818 per unit 12/08/2002 110,000,000 11/02/02
9198 SGA Societe Generale Acceptance N.V. HSBC European Warrants Sep 2002 0.4700 92.0000 02/09/2002 210,000,000 11/02/02
9199 SGA Societe Generale Acceptance N.V. Huaneng European Warrants Aug 2002 0.5400 5.60 per unit 12/08/2002 118,000,000 11/02/02
9200 SGA Societe Generale Acceptance N.V. HWL European Warrants Aug 2002 0.4570 78.0000 12/08/2002 210,000,000 11/02/02
9201 SGA Societe Generale Acceptance N.V. HSI European Warrants Sep 2002 0.2540 11,500 27/09/2002 390,000,000 11/02/02
per 2,500 units
9202 SGA Societe Generale Acceptance N.V. DJIA European Warrants Sep 2002 0.2550 81,120 19/09/2002 390,000,000 11/02/02
per 17,500 units
9205 SGA Societe Generale Acceptance N.V. HSI European Put Warrants Sep 2002 0.2600 10,200 27/09/2002 380,000,000 11/02/02
per 3,000 units
9206 SGA Societe Generale Acceptance N.V. DJIA European Put Warrants Sep 2002 0.2550 73,320 19/09/2002 390,000,000 11/02/02
per 16,000 units
9220 KBC Fin Products Int’l Ltd Hutchison European Warrants Aug 2002 0.3830 78.5300 20/08/2002 200,000,000 18/02/02
Newly listed derivative warrants (continued)Strike level/
Issue Subscription Subscription/ Unit issued
prices price (HK$) exercise on initial Listing
Code Issuer Name of issue (HK$) per 10 units period listing date
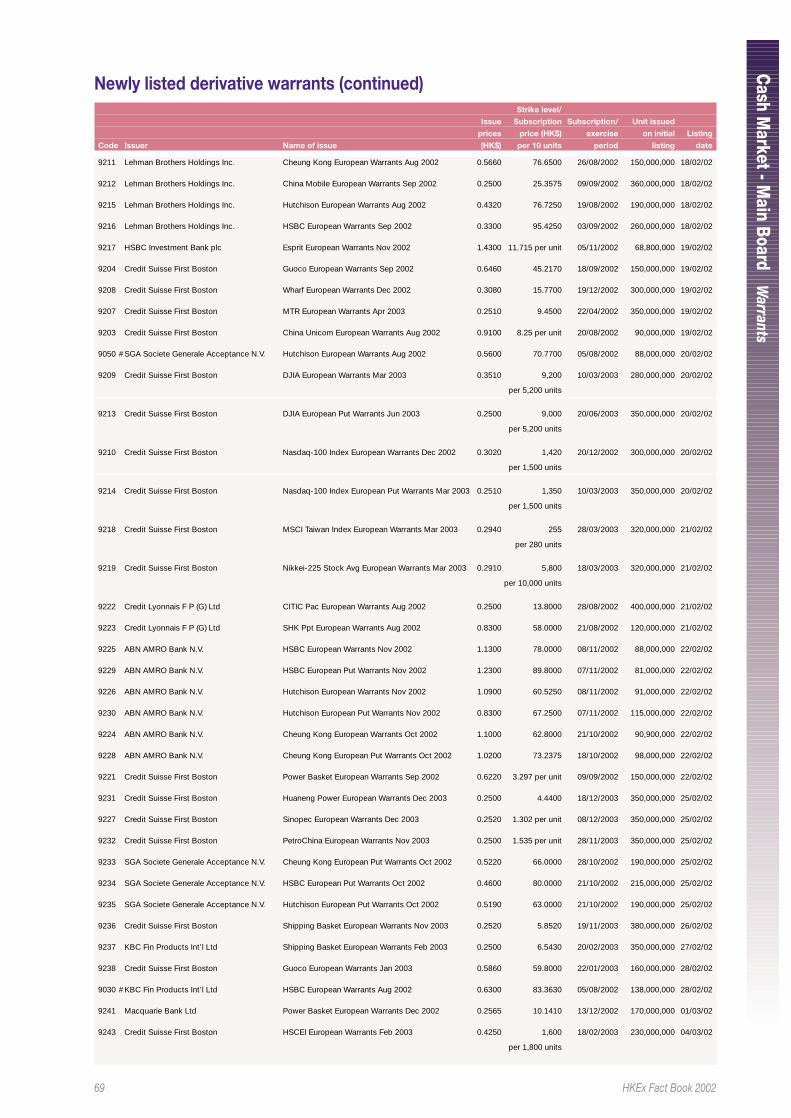
69 HKEx Fact Book 2002
Cash M
arket - Main Boar d
Warrants
Newly listed derivative warrants (continued)Strike level/
Issue Subscription Subscription/ Unit issued
prices price (HK$) exercise on initial Listing
Code Issuer Name of issue (HK$) per 10 units period listing date
9211 Lehman Brothers Holdings Inc. Cheung Kong European Warrants Aug 2002 0.5660 76.6500 26/08/2002 150,000,000 18/02/02
9212 Lehman Brothers Holdings Inc. China Mobile European Warrants Sep 2002 0.2500 25.3575 09/09/2002 360,000,000 18/02/02
9215 Lehman Brothers Holdings Inc. Hutchison European Warrants Aug 2002 0.4320 76.7250 19/08/2002 190,000,000 18/02/02
9216 Lehman Brothers Holdings Inc. HSBC European Warrants Sep 2002 0.3300 95.4250 03/09/2002 260,000,000 18/02/02
9217 HSBC Investment Bank plc Esprit European Warrants Nov 2002 1.4300 11.715 per unit 05/11/2002 68,800,000 19/02/02
9204 Credit Suisse First Boston Guoco European Warrants Sep 2002 0.6460 45.2170 18/09/2002 150,000,000 19/02/02
9208 Credit Suisse First Boston Wharf European Warrants Dec 2002 0.3080 15.7700 19/12/2002 300,000,000 19/02/02
9207 Credit Suisse First Boston MTR European Warrants Apr 2003 0.2510 9.4500 22/04/2002 350,000,000 19/02/02
9203 Credit Suisse First Boston China Unicom European Warrants Aug 2002 0.9100 8.25 per unit 20/08/2002 90,000,000 19/02/02
9050 # SGA Societe Generale Acceptance N.V. Hutchison European Warrants Aug 2002 0.5600 70.7700 05/08/2002 88,000,000 20/02/02
9209 Credit Suisse First Boston DJIA European Warrants Mar 2003 0.3510 9,200 10/03/2003 280,000,000 20/02/02
per 5,200 units
9213 Credit Suisse First Boston DJIA European Put Warrants Jun 2003 0.2500 9,000 20/06/2003 350,000,000 20/02/02
per 5,200 units
9210 Credit Suisse First Boston Nasdaq-100 Index European Warrants Dec 2002 0.3020 1,420 20/12/2002 300,000,000 20/02/02
per 1,500 units
9214 Credit Suisse First Boston Nasdaq-100 Index European Put Warrants Mar 2003 0.2510 1,350 10/03/2003 350,000,000 20/02/02
per 1,500 units
9218 Credit Suisse First Boston MSCI Taiwan Index European Warrants Mar 2003 0.2940 255 28/03/2003 320,000,000 21/02/02
per 280 units
9219 Credit Suisse First Boston Nikkei-225 Stock Avg European Warrants Mar 2003 0.2910 5,800 18/03/2003 320,000,000 21/02/02
per 10,000 units
9222 Credit Lyonnais F P (G) Ltd CITIC Pac European Warrants Aug 2002 0.2500 13.8000 28/08/2002 400,000,000 21/02/02
9223 Credit Lyonnais F P (G) Ltd SHK Ppt European Warrants Aug 2002 0.8300 58.0000 21/08/2002 120,000,000 21/02/02
9225 ABN AMRO Bank N.V. HSBC European Warrants Nov 2002 1.1300 78.0000 08/11/2002 88,000,000 22/02/02
9229 ABN AMRO Bank N.V. HSBC European Put Warrants Nov 2002 1.2300 89.8000 07/11/2002 81,000,000 22/02/02
9226 ABN AMRO Bank N.V. Hutchison European Warrants Nov 2002 1.0900 60.5250 08/11/2002 91,000,000 22/02/02
9230 ABN AMRO Bank N.V. Hutchison European Put Warrants Nov 2002 0.8300 67.2500 07/11/2002 115,000,000 22/02/02
9224 ABN AMRO Bank N.V. Cheung Kong European Warrants Oct 2002 1.1000 62.8000 21/10/2002 90,900,000 22/02/02
9228 ABN AMRO Bank N.V. Cheung Kong European Put Warrants Oct 2002 1.0200 73.2375 18/10/2002 98,000,000 22/02/02
9221 Credit Suisse First Boston Power Basket European Warrants Sep 2002 0.6220 3.297 per unit 09/09/2002 150,000,000 22/02/02
9231 Credit Suisse First Boston Huaneng Power European Warrants Dec 2003 0.2500 4.4400 18/12/2003 350,000,000 25/02/02
9227 Credit Suisse First Boston Sinopec European Warrants Dec 2003 0.2520 1.302 per unit 08/12/2003 350,000,000 25/02/02
9232 Credit Suisse First Boston PetroChina European Warrants Nov 2003 0.2500 1.535 per unit 28/11/2003 350,000,000 25/02/02
9233 SGA Societe Generale Acceptance N.V. Cheung Kong European Put Warrants Oct 2002 0.5220 66.0000 28/10/2002 190,000,000 25/02/02
9234 SGA Societe Generale Acceptance N.V. HSBC European Put Warrants Oct 2002 0.4600 80.0000 21/10/2002 215,000,000 25/02/02
9235 SGA Societe Generale Acceptance N.V. Hutchison European Put Warrants Oct 2002 0.5190 63.0000 21/10/2002 190,000,000 25/02/02
9236 Credit Suisse First Boston Shipping Basket European Warrants Nov 2003 0.2520 5.8520 19/11/2003 380,000,000 26/02/02
9237 KBC Fin Products Int’l Ltd Shipping Basket European Warrants Feb 2003 0.2500 6.5430 20/02/2003 350,000,000 27/02/02
9238 Credit Suisse First Boston Guoco European Warrants Jan 2003 0.5860 59.8000 22/01/2003 160,000,000 28/02/02
9030 # KBC Fin Products Int’l Ltd HSBC European Warrants Aug 2002 0.6300 83.3630 05/08/2002 138,000,000 28/02/02
9241 Macquarie Bank Ltd Power Basket European Warrants Dec 2002 0.2565 10.1410 13/12/2002 170,000,000 01/03/02
9243 Credit Suisse First Boston HSCEI European Warrants Feb 2003 0.4250 1,600 18/02/2003 230,000,000 04/03/02
per 1,800 units
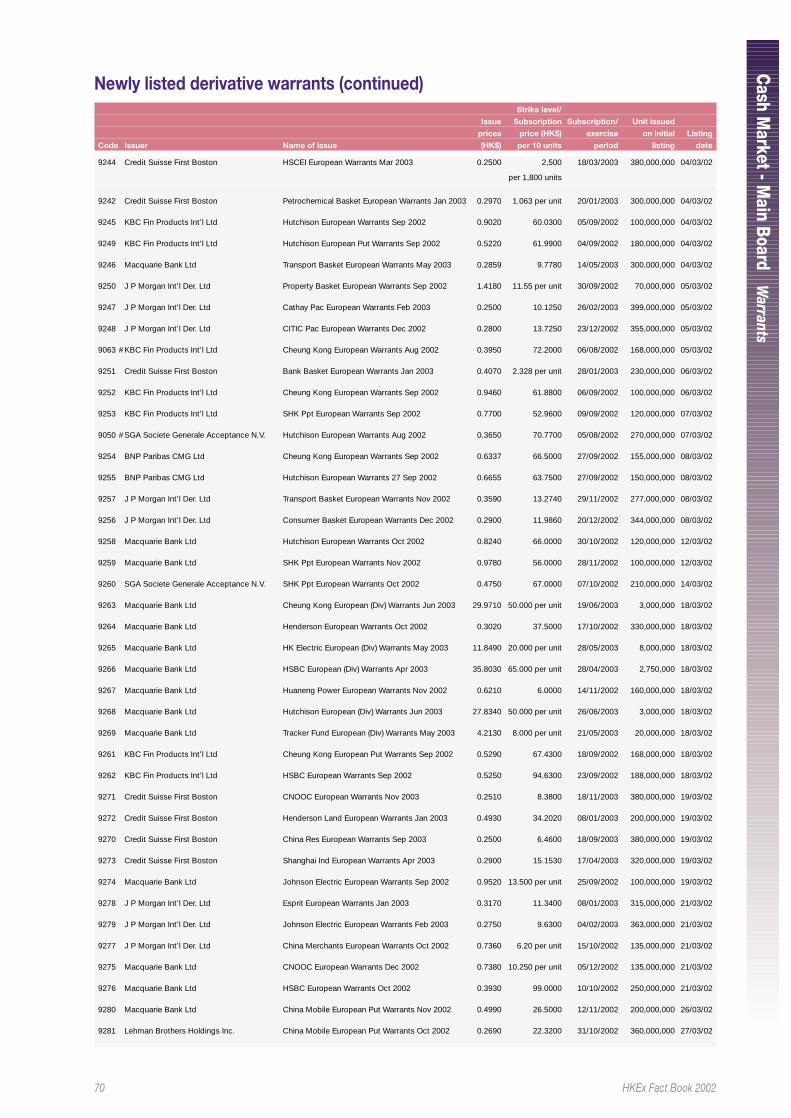
70 HKEx Fact Book 2002
Cash M
arket - Main Boar d
Warrants
Newly listed derivative warrants (continued)Strike level/
Issue Subscription Subscription/ Unit issued
prices price (HK$) exercise on initial Listing
Code Issuer Name of issue (HK$) per 10 units period listing date
9244 Credit Suisse First Boston HSCEI European Warrants Mar 2003 0.2500 2,500 18/03/2003 380,000,000 04/03/02
per 1,800 units
9242 Credit Suisse First Boston Petrochemical Basket European Warrants Jan 2003 0.2970 1.063 per unit 20/01/2003 300,000,000 04/03/02
9245 KBC Fin Products Int’l Ltd Hutchison European Warrants Sep 2002 0.9020 60.0300 05/09/2002 100,000,000 04/03/02
9249 KBC Fin Products Int’l Ltd Hutchison European Put Warrants Sep 2002 0.5220 61.9900 04/09/2002 180,000,000 04/03/02
9246 Macquarie Bank Ltd Transport Basket European Warrants May 2003 0.2859 9.7780 14/05/2003 300,000,000 04/03/02
9250 J P Morgan Int’l Der. Ltd Property Basket European Warrants Sep 2002 1.4180 11.55 per unit 30/09/2002 70,000,000 05/03/02
9247 J P Morgan Int’l Der. Ltd Cathay Pac European Warrants Feb 2003 0.2500 10.1250 26/02/2003 399,000,000 05/03/02
9248 J P Morgan Int’l Der. Ltd CITIC Pac European Warrants Dec 2002 0.2800 13.7250 23/12/2002 355,000,000 05/03/02
9063 # KBC Fin Products Int’l Ltd Cheung Kong European Warrants Aug 2002 0.3950 72.2000 06/08/2002 168,000,000 05/03/02
9251 Credit Suisse First Boston Bank Basket European Warrants Jan 2003 0.4070 2.328 per unit 28/01/2003 230,000,000 06/03/02
9252 KBC Fin Products Int’l Ltd Cheung Kong European Warrants Sep 2002 0.9460 61.8800 06/09/2002 100,000,000 06/03/02
9253 KBC Fin Products Int’l Ltd SHK Ppt European Warrants Sep 2002 0.7700 52.9600 09/09/2002 120,000,000 07/03/02
9050 # SGA Societe Generale Acceptance N.V. Hutchison European Warrants Aug 2002 0.3650 70.7700 05/08/2002 270,000,000 07/03/02
9254 BNP Paribas CMG Ltd Cheung Kong European Warrants Sep 2002 0.6337 66.5000 27/09/2002 155,000,000 08/03/02
9255 BNP Paribas CMG Ltd Hutchison European Warrants 27 Sep 2002 0.6655 63.7500 27/09/2002 150,000,000 08/03/02
9257 J P Morgan Int’l Der. Ltd Transport Basket European Warrants Nov 2002 0.3590 13.2740 29/11/2002 277,000,000 08/03/02
9256 J P Morgan Int’l Der. Ltd Consumer Basket European Warrants Dec 2002 0.2900 11.9860 20/12/2002 344,000,000 08/03/02
9258 Macquarie Bank Ltd Hutchison European Warrants Oct 2002 0.8240 66.0000 30/10/2002 120,000,000 12/03/02
9259 Macquarie Bank Ltd SHK Ppt European Warrants Nov 2002 0.9780 56.0000 28/11/2002 100,000,000 12/03/02
9260 SGA Societe Generale Acceptance N.V. SHK Ppt European Warrants Oct 2002 0.4750 67.0000 07/10/2002 210,000,000 14/03/02
9263 Macquarie Bank Ltd Cheung Kong European (Div) Warrants Jun 2003 29.9710 50.000 per unit 19/06/2003 3,000,000 18/03/02
9264 Macquarie Bank Ltd Henderson European Warrants Oct 2002 0.3020 37.5000 17/10/2002 330,000,000 18/03/02
9265 Macquarie Bank Ltd HK Electric European (Div) Warrants May 2003 11.8490 20.000 per unit 28/05/2003 8,000,000 18/03/02
9266 Macquarie Bank Ltd HSBC European (Div) Warrants Apr 2003 35.8030 65.000 per unit 28/04/2003 2,750,000 18/03/02
9267 Macquarie Bank Ltd Huaneng Power European Warrants Nov 2002 0.6210 6.0000 14/11/2002 160,000,000 18/03/02
9268 Macquarie Bank Ltd Hutchison European (Div) Warrants Jun 2003 27.8340 50.000 per unit 26/06/2003 3,000,000 18/03/02
9269 Macquarie Bank Ltd Tracker Fund European (Div) Warrants May 2003 4.2130 8.000 per unit 21/05/2003 20,000,000 18/03/02
9261 KBC Fin Products Int’l Ltd Cheung Kong European Put Warrants Sep 2002 0.5290 67.4300 18/09/2002 168,000,000 18/03/02
9262 KBC Fin Products Int’l Ltd HSBC European Warrants Sep 2002 0.5250 94.6300 23/09/2002 188,000,000 18/03/02
9271 Credit Suisse First Boston CNOOC European Warrants Nov 2003 0.2510 8.3800 18/11/2003 380,000,000 19/03/02
9272 Credit Suisse First Boston Henderson Land European Warrants Jan 2003 0.4930 34.2020 08/01/2003 200,000,000 19/03/02
9270 Credit Suisse First Boston China Res European Warrants Sep 2003 0.2500 6.4600 18/09/2003 380,000,000 19/03/02
9273 Credit Suisse First Boston Shanghai Ind European Warrants Apr 2003 0.2900 15.1530 17/04/2003 320,000,000 19/03/02
9274 Macquarie Bank Ltd Johnson Electric European Warrants Sep 2002 0.9520 13.500 per unit 25/09/2002 100,000,000 19/03/02
9278 J P Morgan Int’l Der. Ltd Esprit European Warrants Jan 2003 0.3170 11.3400 08/01/2003 315,000,000 21/03/02
9279 J P Morgan Int’l Der. Ltd Johnson Electric European Warrants Feb 2003 0.2750 9.6300 04/02/2003 363,000,000 21/03/02
9277 J P Morgan Int’l Der. Ltd China Merchants European Warrants Oct 2002 0.7360 6.20 per unit 15/10/2002 135,000,000 21/03/02
9275 Macquarie Bank Ltd CNOOC European Warrants Dec 2002 0.7380 10.250 per unit 05/12/2002 135,000,000 21/03/02
9276 Macquarie Bank Ltd HSBC European Warrants Oct 2002 0.3930 99.0000 10/10/2002 250,000,000 21/03/02
9280 Macquarie Bank Ltd China Mobile European Put Warrants Nov 2002 0.4990 26.5000 12/11/2002 200,000,000 26/03/02
9281 Lehman Brothers Holdings Inc. China Mobile European Put Warrants Oct 2002 0.2690 22.3200 31/10/2002 360,000,000 27/03/02
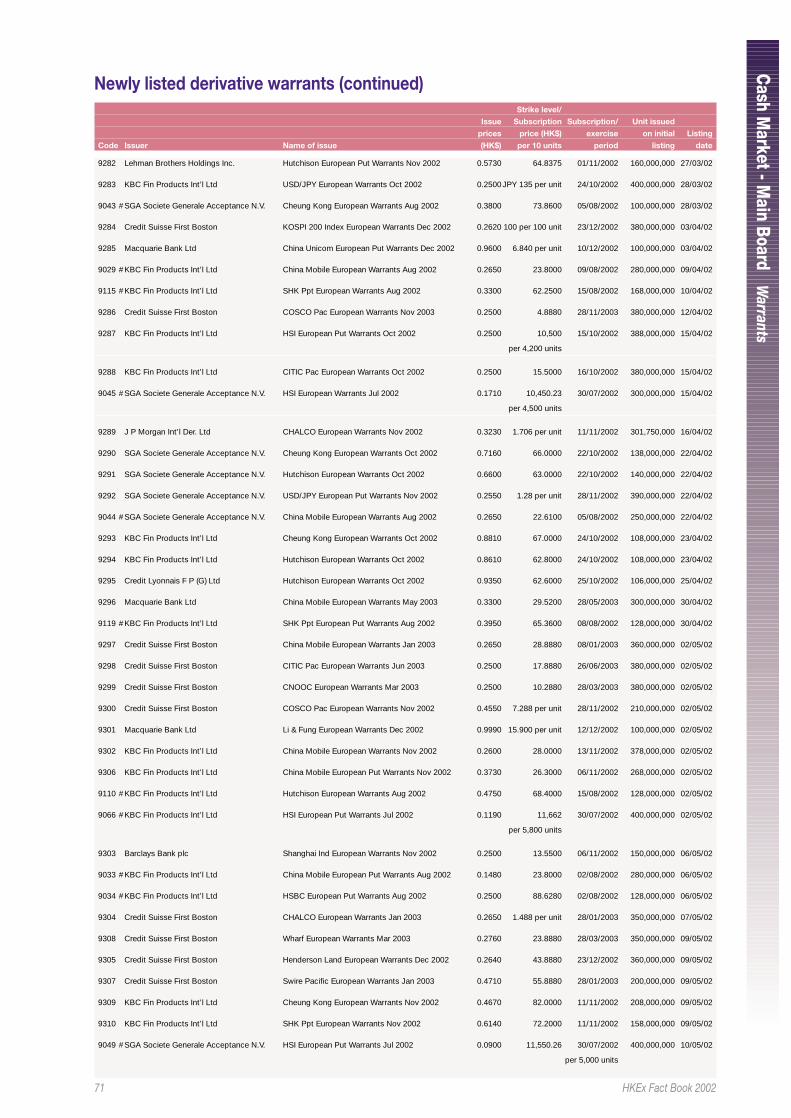
71 HKEx Fact Book 2002
Cash M
arket - Main Boar d
Warrants
Newly listed derivative warrants (continued)Strike level/
Issue Subscription Subscription/ Unit issued
prices price (HK$) exercise on initial Listing
Code Issuer Name of issue (HK$) per 10 units period listing date
9282 Lehman Brothers Holdings Inc. Hutchison European Put Warrants Nov 2002 0.5730 64.8375 01/11/2002 160,000,000 27/03/02
9283 KBC Fin Products Int’l Ltd USD/JPY European Warrants Oct 2002 0.2500JPY 135 per unit 24/10/2002 400,000,000 28/03/02
9043 # SGA Societe Generale Acceptance N.V. Cheung Kong European Warrants Aug 2002 0.3800 73.8600 05/08/2002 100,000,000 28/03/02
9284 Credit Suisse First Boston KOSPI 200 Index European Warrants Dec 2002 0.2620 100 per 100 unit 23/12/2002 380,000,000 03/04/02
9285 Macquarie Bank Ltd China Unicom European Put Warrants Dec 2002 0.9600 6.840 per unit 10/12/2002 100,000,000 03/04/02
9029 # KBC Fin Products Int’l Ltd China Mobile European Warrants Aug 2002 0.2650 23.8000 09/08/2002 280,000,000 09/04/02
9115 # KBC Fin Products Int’l Ltd SHK Ppt European Warrants Aug 2002 0.3300 62.2500 15/08/2002 168,000,000 10/04/02
9286 Credit Suisse First Boston COSCO Pac European Warrants Nov 2003 0.2500 4.8880 28/11/2003 380,000,000 12/04/02
9287 KBC Fin Products Int’l Ltd HSI European Put Warrants Oct 2002 0.2500 10,500 15/10/2002 388,000,000 15/04/02
per 4,200 units
9288 KBC Fin Products Int’l Ltd CITIC Pac European Warrants Oct 2002 0.2500 15.5000 16/10/2002 380,000,000 15/04/02
9045 # SGA Societe Generale Acceptance N.V. HSI European Warrants Jul 2002 0.1710 10,450.23 30/07/2002 300,000,000 15/04/02
per 4,500 units
9289 J P Morgan Int’l Der. Ltd CHALCO European Warrants Nov 2002 0.3230 1.706 per unit 11/11/2002 301,750,000 16/04/02
9290 SGA Societe Generale Acceptance N.V. Cheung Kong European Warrants Oct 2002 0.7160 66.0000 22/10/2002 138,000,000 22/04/02
9291 SGA Societe Generale Acceptance N.V. Hutchison European Warrants Oct 2002 0.6600 63.0000 22/10/2002 140,000,000 22/04/02
9292 SGA Societe Generale Acceptance N.V. USD/JPY European Put Warrants Nov 2002 0.2550 1.28 per unit 28/11/2002 390,000,000 22/04/02
9044 # SGA Societe Generale Acceptance N.V. China Mobile European Warrants Aug 2002 0.2650 22.6100 05/08/2002 250,000,000 22/04/02
9293 KBC Fin Products Int’l Ltd Cheung Kong European Warrants Oct 2002 0.8810 67.0000 24/10/2002 108,000,000 23/04/02
9294 KBC Fin Products Int’l Ltd Hutchison European Warrants Oct 2002 0.8610 62.8000 24/10/2002 108,000,000 23/04/02
9295 Credit Lyonnais F P (G) Ltd Hutchison European Warrants Oct 2002 0.9350 62.6000 25/10/2002 106,000,000 25/04/02
9296 Macquarie Bank Ltd China Mobile European Warrants May 2003 0.3300 29.5200 28/05/2003 300,000,000 30/04/02
9119 # KBC Fin Products Int’l Ltd SHK Ppt European Put Warrants Aug 2002 0.3950 65.3600 08/08/2002 128,000,000 30/04/02
9297 Credit Suisse First Boston China Mobile European Warrants Jan 2003 0.2650 28.8880 08/01/2003 360,000,000 02/05/02
9298 Credit Suisse First Boston CITIC Pac European Warrants Jun 2003 0.2500 17.8880 26/06/2003 380,000,000 02/05/02
9299 Credit Suisse First Boston CNOOC European Warrants Mar 2003 0.2500 10.2880 28/03/2003 380,000,000 02/05/02
9300 Credit Suisse First Boston COSCO Pac European Warrants Nov 2002 0.4550 7.288 per unit 28/11/2002 210,000,000 02/05/02
9301 Macquarie Bank Ltd Li & Fung European Warrants Dec 2002 0.9990 15.900 per unit 12/12/2002 100,000,000 02/05/02
9302 KBC Fin Products Int’l Ltd China Mobile European Warrants Nov 2002 0.2600 28.0000 13/11/2002 378,000,000 02/05/02
9306 KBC Fin Products Int’l Ltd China Mobile European Put Warrants Nov 2002 0.3730 26.3000 06/11/2002 268,000,000 02/05/02
9110 # KBC Fin Products Int’l Ltd Hutchison European Warrants Aug 2002 0.4750 68.4000 15/08/2002 128,000,000 02/05/02
9066 # KBC Fin Products Int’l Ltd HSI European Put Warrants Jul 2002 0.1190 11,662 30/07/2002 400,000,000 02/05/02
per 5,800 units
9303 Barclays Bank plc Shanghai Ind European Warrants Nov 2002 0.2500 13.5500 06/11/2002 150,000,000 06/05/02
9033 # KBC Fin Products Int’l Ltd China Mobile European Put Warrants Aug 2002 0.1480 23.8000 02/08/2002 280,000,000 06/05/02
9034 # KBC Fin Products Int’l Ltd HSBC European Put Warrants Aug 2002 0.2500 88.6280 02/08/2002 128,000,000 06/05/02
9304 Credit Suisse First Boston CHALCO European Warrants Jan 2003 0.2650 1.488 per unit 28/01/2003 350,000,000 07/05/02
9308 Credit Suisse First Boston Wharf European Warrants Mar 2003 0.2760 23.8880 28/03/2003 350,000,000 09/05/02
9305 Credit Suisse First Boston Henderson Land European Warrants Dec 2002 0.2640 43.8880 23/12/2002 360,000,000 09/05/02
9307 Credit Suisse First Boston Swire Pacific European Warrants Jan 2003 0.4710 55.8880 28/01/2003 200,000,000 09/05/02
9309 KBC Fin Products Int’l Ltd Cheung Kong European Warrants Nov 2002 0.4670 82.0000 11/11/2002 208,000,000 09/05/02
9310 KBC Fin Products Int’l Ltd SHK Ppt European Warrants Nov 2002 0.6140 72.2000 11/11/2002 158,000,000 09/05/02
9049 # SGA Societe Generale Acceptance N.V. HSI European Put Warrants Jul 2002 0.0900 11,550.26 30/07/2002 400,000,000 10/05/02
per 5,000 units
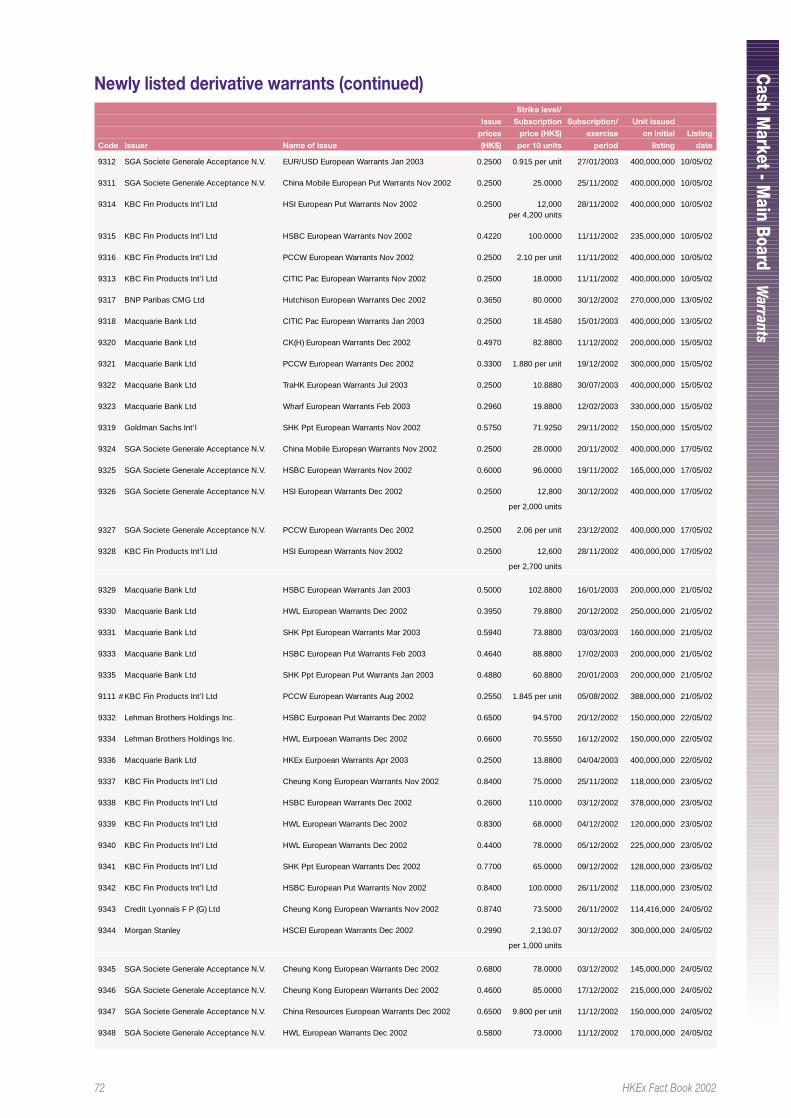
72 HKEx Fact Book 2002
Cash M
arket - Main Boar d
Warrants
Newly listed derivative warrants (continued)Strike level/
Issue Subscription Subscription/ Unit issued
prices price (HK$) exercise on initial Listing
Code Issuer Name of issue (HK$) per 10 units period listing date
9312 SGA Societe Generale Acceptance N.V. EUR/USD European Warrants Jan 2003 0.2500 0.915 per unit 27/01/2003 400,000,000 10/05/02
9311 SGA Societe Generale Acceptance N.V. China Mobile European Put Warrants Nov 2002 0.2500 25.0000 25/11/2002 400,000,000 10/05/02
9314 KBC Fin Products Int’l Ltd HSI European Put Warrants Nov 2002 0.2500 12,000 28/11/2002 400,000,000 10/05/02per 4,200 units
9315 KBC Fin Products Int’l Ltd HSBC European Warrants Nov 2002 0.4220 100.0000 11/11/2002 235,000,000 10/05/02
9316 KBC Fin Products Int’l Ltd PCCW European Warrants Nov 2002 0.2500 2.10 per unit 11/11/2002 400,000,000 10/05/02
9313 KBC Fin Products Int’l Ltd CITIC Pac European Warrants Nov 2002 0.2500 18.0000 11/11/2002 400,000,000 10/05/02
9317 BNP Paribas CMG Ltd Hutchison European Warrants Dec 2002 0.3650 80.0000 30/12/2002 270,000,000 13/05/02
9318 Macquarie Bank Ltd CITIC Pac European Warrants Jan 2003 0.2500 18.4580 15/01/2003 400,000,000 13/05/02
9320 Macquarie Bank Ltd CK(H) European Warrants Dec 2002 0.4970 82.8800 11/12/2002 200,000,000 15/05/02
9321 Macquarie Bank Ltd PCCW European Warrants Dec 2002 0.3300 1.880 per unit 19/12/2002 300,000,000 15/05/02
9322 Macquarie Bank Ltd TraHK European Warrants Jul 2003 0.2500 10.8880 30/07/2003 400,000,000 15/05/02
9323 Macquarie Bank Ltd Wharf European Warrants Feb 2003 0.2960 19.8800 12/02/2003 330,000,000 15/05/02
9319 Goldman Sachs Int’l SHK Ppt European Warrants Nov 2002 0.5750 71.9250 29/11/2002 150,000,000 15/05/02
9324 SGA Societe Generale Acceptance N.V. China Mobile European Warrants Nov 2002 0.2500 28.0000 20/11/2002 400,000,000 17/05/02
9325 SGA Societe Generale Acceptance N.V. HSBC European Warrants Nov 2002 0.6000 96.0000 19/11/2002 165,000,000 17/05/02
9326 SGA Societe Generale Acceptance N.V. HSI European Warrants Dec 2002 0.2500 12,800 30/12/2002 400,000,000 17/05/02
per 2,000 units
9327 SGA Societe Generale Acceptance N.V. PCCW European Warrants Dec 2002 0.2500 2.06 per unit 23/12/2002 400,000,000 17/05/02
9328 KBC Fin Products Int’l Ltd HSI European Warrants Nov 2002 0.2500 12,600 28/11/2002 400,000,000 17/05/02
per 2,700 units
9329 Macquarie Bank Ltd HSBC European Warrants Jan 2003 0.5000 102.8800 16/01/2003 200,000,000 21/05/02
9330 Macquarie Bank Ltd HWL European Warrants Dec 2002 0.3950 79.8800 20/12/2002 250,000,000 21/05/02
9331 Macquarie Bank Ltd SHK Ppt European Warrants Mar 2003 0.5940 73.8800 03/03/2003 160,000,000 21/05/02
9333 Macquarie Bank Ltd HSBC European Put Warrants Feb 2003 0.4640 88.8800 17/02/2003 200,000,000 21/05/02
9335 Macquarie Bank Ltd SHK Ppt European Put Warrants Jan 2003 0.4880 60.8800 20/01/2003 200,000,000 21/05/02
9111 # KBC Fin Products Int’l Ltd PCCW European Warrants Aug 2002 0.2550 1.845 per unit 05/08/2002 388,000,000 21/05/02
9332 Lehman Brothers Holdings Inc. HSBC Eurpoean Put Warrants Dec 2002 0.6500 94.5700 20/12/2002 150,000,000 22/05/02
9334 Lehman Brothers Holdings Inc. HWL Eurpoean Warrants Dec 2002 0.6600 70.5550 16/12/2002 150,000,000 22/05/02
9336 Macquarie Bank Ltd HKEx Eurpoean Warrants Apr 2003 0.2500 13.8800 04/04/2003 400,000,000 22/05/02
9337 KBC Fin Products Int’l Ltd Cheung Kong European Warrants Nov 2002 0.8400 75.0000 25/11/2002 118,000,000 23/05/02
9338 KBC Fin Products Int’l Ltd HSBC European Warrants Dec 2002 0.2600 110.0000 03/12/2002 378,000,000 23/05/02
9339 KBC Fin Products Int’l Ltd HWL European Warrants Dec 2002 0.8300 68.0000 04/12/2002 120,000,000 23/05/02
9340 KBC Fin Products Int’l Ltd HWL European Warrants Dec 2002 0.4400 78.0000 05/12/2002 225,000,000 23/05/02
9341 KBC Fin Products Int’l Ltd SHK Ppt European Warrants Dec 2002 0.7700 65.0000 09/12/2002 128,000,000 23/05/02
9342 KBC Fin Products Int’l Ltd HSBC European Put Warrants Nov 2002 0.8400 100.0000 26/11/2002 118,000,000 23/05/02
9343 Credit Lyonnais F P (G) Ltd Cheung Kong European Warrants Nov 2002 0.8740 73.5000 26/11/2002 114,416,000 24/05/02
9344 Morgan Stanley HSCEI European Warrants Dec 2002 0.2990 2,130.07 30/12/2002 300,000,000 24/05/02
per 1,000 units
9345 SGA Societe Generale Acceptance N.V. Cheung Kong European Warrants Dec 2002 0.6800 78.0000 03/12/2002 145,000,000 24/05/02
9346 SGA Societe Generale Acceptance N.V. Cheung Kong European Warrants Dec 2002 0.4600 85.0000 17/12/2002 215,000,000 24/05/02
9347 SGA Societe Generale Acceptance N.V. China Resources European Warrants Dec 2002 0.6500 9.800 per unit 11/12/2002 150,000,000 24/05/02
9348 SGA Societe Generale Acceptance N.V. HWL European Warrants Dec 2002 0.5800 73.0000 11/12/2002 170,000,000 24/05/02
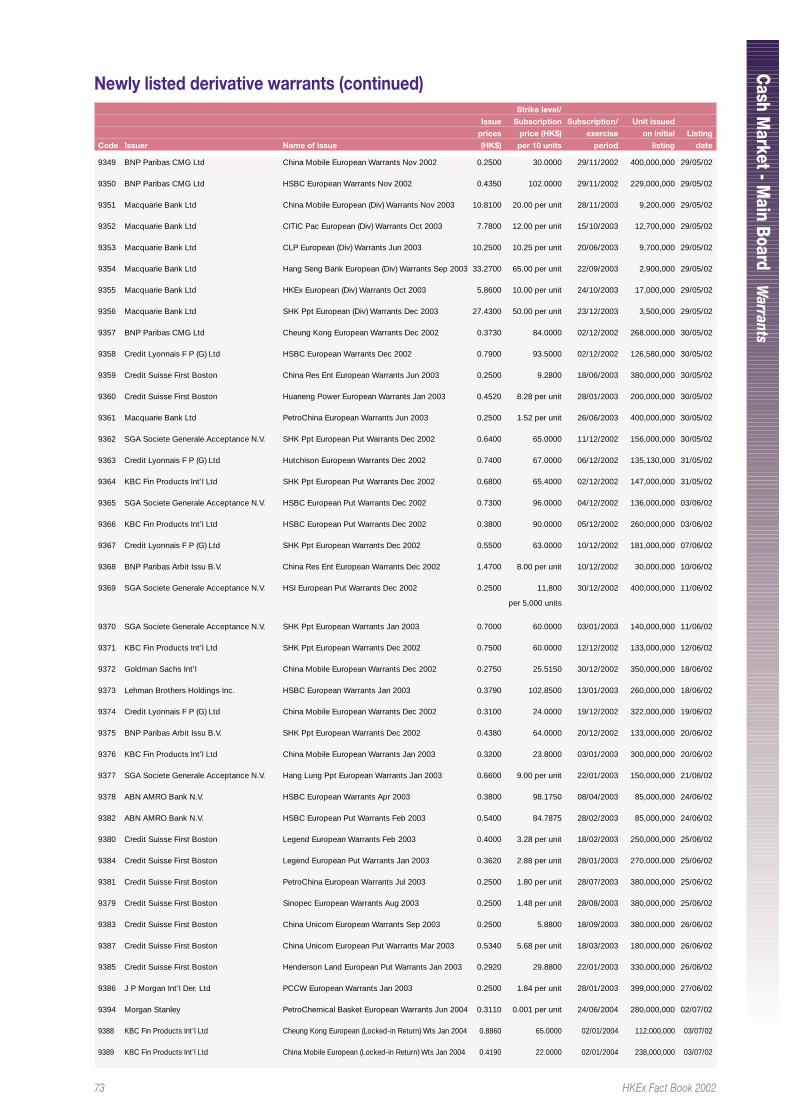
73 HKEx Fact Book 2002
Cash M
arket - Main Boar d
Warrants
Newly listed derivative warrants (continued)Strike level/
Issue Subscription Subscription/ Unit issued
prices price (HK$) exercise on initial Listing
Code Issuer Name of issue (HK$) per 10 units period listing date
9349 BNP Paribas CMG Ltd China Mobile European Warrants Nov 2002 0.2500 30.0000 29/11/2002 400,000,000 29/05/02
9350 BNP Paribas CMG Ltd HSBC European Warrants Nov 2002 0.4350 102.0000 29/11/2002 229,000,000 29/05/02
9351 Macquarie Bank Ltd China Mobile European (Div) Warrants Nov 2003 10.8100 20.00 per unit 28/11/2003 9,200,000 29/05/02
9352 Macquarie Bank Ltd CITIC Pac European (Div) Warrants Oct 2003 7.7800 12.00 per unit 15/10/2003 12,700,000 29/05/02
9353 Macquarie Bank Ltd CLP European (Div) Warrants Jun 2003 10.2500 10.25 per unit 20/06/2003 9,700,000 29/05/02
9354 Macquarie Bank Ltd Hang Seng Bank European (Div) Warrants Sep 2003 33.2700 65.00 per unit 22/09/2003 2,900,000 29/05/02
9355 Macquarie Bank Ltd HKEx European (Div) Warrants Oct 2003 5.8600 10.00 per unit 24/10/2003 17,000,000 29/05/02
9356 Macquarie Bank Ltd SHK Ppt European (Div) Warrants Dec 2003 27.4300 50.00 per unit 23/12/2003 3,500,000 29/05/02
9357 BNP Paribas CMG Ltd Cheung Kong European Warrants Dec 2002 0.3730 84.0000 02/12/2002 268,000,000 30/05/02
9358 Credit Lyonnais F P (G) Ltd HSBC European Warrants Dec 2002 0.7900 93.5000 02/12/2002 126,580,000 30/05/02
9359 Credit Suisse First Boston China Res Ent European Warrants Jun 2003 0.2500 9.2800 18/06/2003 380,000,000 30/05/02
9360 Credit Suisse First Boston Huaneng Power European Warrants Jan 2003 0.4520 8.28 per unit 28/01/2003 200,000,000 30/05/02
9361 Macquarie Bank Ltd PetroChina European Warrants Jun 2003 0.2500 1.52 per unit 26/06/2003 400,000,000 30/05/02
9362 SGA Societe Generale Acceptance N.V. SHK Ppt European Put Warrants Dec 2002 0.6400 65.0000 11/12/2002 156,000,000 30/05/02
9363 Credit Lyonnais F P (G) Ltd Hutchison European Warrants Dec 2002 0.7400 67.0000 06/12/2002 135,130,000 31/05/02
9364 KBC Fin Products Int’l Ltd SHK Ppt European Put Warrants Dec 2002 0.6800 65.4000 02/12/2002 147,000,000 31/05/02
9365 SGA Societe Generale Acceptance N.V. HSBC European Put Warrants Dec 2002 0.7300 96.0000 04/12/2002 136,000,000 03/06/02
9366 KBC Fin Products Int’l Ltd HSBC European Put Warrants Dec 2002 0.3800 90.0000 05/12/2002 260,000,000 03/06/02
9367 Credit Lyonnais F P (G) Ltd SHK Ppt European Warrants Dec 2002 0.5500 63.0000 10/12/2002 181,000,000 07/06/02
9368 BNP Paribas Arbit Issu B.V. China Res Ent European Warrants Dec 2002 1.4700 8.00 per unit 10/12/2002 30,000,000 10/06/02
9369 SGA Societe Generale Acceptance N.V. HSI European Put Warrants Dec 2002 0.2500 11,800 30/12/2002 400,000,000 11/06/02
per 5,000 units
9370 SGA Societe Generale Acceptance N.V. SHK Ppt European Warrants Jan 2003 0.7000 60.0000 03/01/2003 140,000,000 11/06/02
9371 KBC Fin Products Int’l Ltd SHK Ppt European Warrants Dec 2002 0.7500 60.0000 12/12/2002 133,000,000 12/06/02
9372 Goldman Sachs Int’l China Mobile European Warrants Dec 2002 0.2750 25.5150 30/12/2002 350,000,000 18/06/02
9373 Lehman Brothers Holdings Inc. HSBC European Warrants Jan 2003 0.3790 102.8500 13/01/2003 260,000,000 18/06/02
9374 Credit Lyonnais F P (G) Ltd China Mobile European Warrants Dec 2002 0.3100 24.0000 19/12/2002 322,000,000 19/06/02
9375 BNP Paribas Arbit Issu B.V. SHK Ppt European Warrants Dec 2002 0.4380 64.0000 20/12/2002 133,000,000 20/06/02
9376 KBC Fin Products Int’l Ltd China Mobile European Warrants Jan 2003 0.3200 23.8000 03/01/2003 300,000,000 20/06/02
9377 SGA Societe Generale Acceptance N.V. Hang Lung Ppt European Warrants Jan 2003 0.6600 9.00 per unit 22/01/2003 150,000,000 21/06/02
9378 ABN AMRO Bank N.V. HSBC European Warrants Apr 2003 0.3800 98.1750 08/04/2003 85,000,000 24/06/02
9382 ABN AMRO Bank N.V. HSBC European Put Warrants Feb 2003 0.5400 84.7875 28/02/2003 85,000,000 24/06/02
9380 Credit Suisse First Boston Legend European Warrants Feb 2003 0.4000 3.28 per unit 18/02/2003 250,000,000 25/06/02
9384 Credit Suisse First Boston Legend European Put Warrants Jan 2003 0.3620 2.88 per unit 28/01/2003 270,000,000 25/06/02
9381 Credit Suisse First Boston PetroChina European Warrants Jul 2003 0.2500 1.80 per unit 28/07/2003 380,000,000 25/06/02
9379 Credit Suisse First Boston Sinopec European Warrants Aug 2003 0.2500 1.48 per unit 28/08/2003 380,000,000 25/06/02
9383 Credit Suisse First Boston China Unicom European Warrants Sep 2003 0.2500 5.8800 18/09/2003 380,000,000 26/06/02
9387 Credit Suisse First Boston China Unicom European Put Warrants Mar 2003 0.5340 5.68 per unit 18/03/2003 180,000,000 26/06/02
9385 Credit Suisse First Boston Henderson Land European Put Warrants Jan 2003 0.2920 29.8800 22/01/2003 330,000,000 26/06/02
9386 J P Morgan Int’l Der. Ltd PCCW European Warrants Jan 2003 0.2500 1.84 per unit 28/01/2003 399,000,000 27/06/02
9394 Morgan Stanley PetroChemical Basket European Warrants Jun 2004 0.3110 0.001 per unit 24/06/2004 280,000,000 02/07/02
9388 KBC Fin Products Int’l Ltd Cheung Kong European (Locked-in Return) Wts Jan 2004 0.8860 65.0000 02/01/2004 112,000,000 03/07/02
9389 KBC Fin Products Int’l Ltd China Mobile European (Locked-in Return) Wts Jan 2004 0.4190 22.0000 02/01/2004 238,000,000 03/07/02
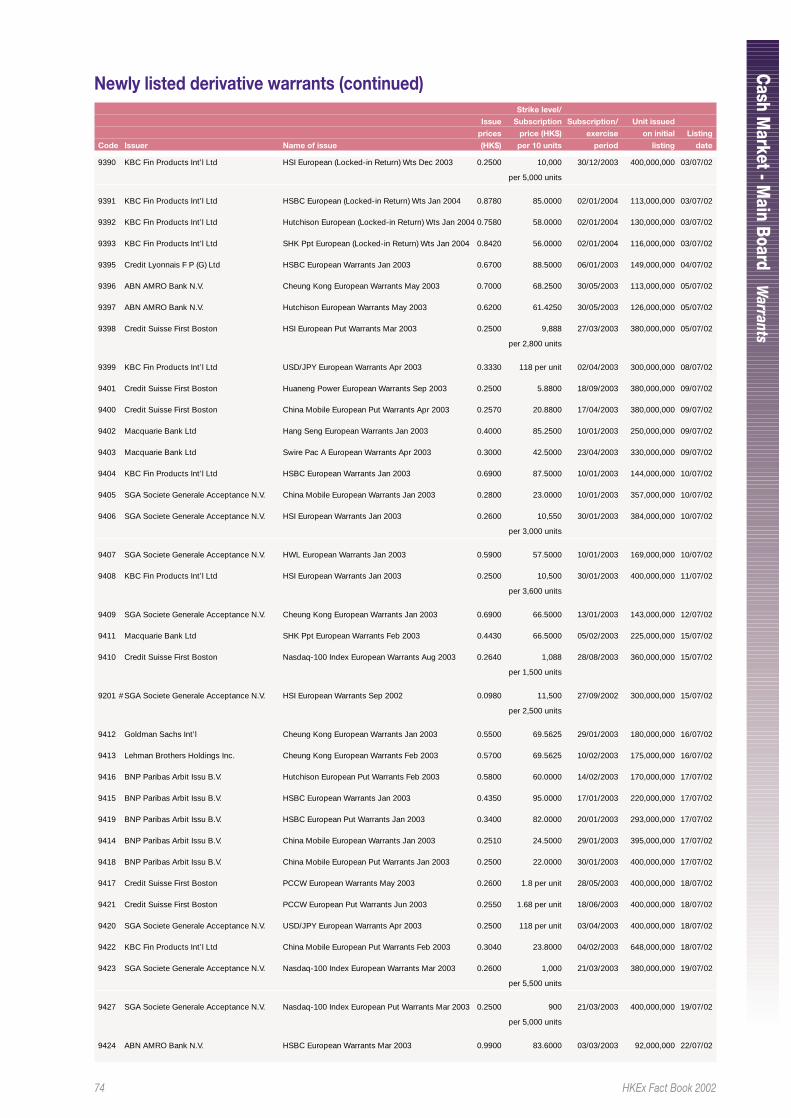
74 HKEx Fact Book 2002
Cash M
arket - Main Boar d
Warrants
9390 KBC Fin Products Int’l Ltd HSI European (Locked-in Return) Wts Dec 2003 0.2500 10,000 30/12/2003 400,000,000 03/07/02
per 5,000 units
9391 KBC Fin Products Int’l Ltd HSBC European (Locked-in Return) Wts Jan 2004 0.8780 85.0000 02/01/2004 113,000,000 03/07/02
9392 KBC Fin Products Int’l Ltd Hutchison European (Locked-in Return) Wts Jan 2004 0.7580 58.0000 02/01/2004 130,000,000 03/07/02
9393 KBC Fin Products Int’l Ltd SHK Ppt European (Locked-in Return) Wts Jan 2004 0.8420 56.0000 02/01/2004 116,000,000 03/07/02
9395 Credit Lyonnais F P (G) Ltd HSBC European Warrants Jan 2003 0.6700 88.5000 06/01/2003 149,000,000 04/07/02
9396 ABN AMRO Bank N.V. Cheung Kong European Warrants May 2003 0.7000 68.2500 30/05/2003 113,000,000 05/07/02
9397 ABN AMRO Bank N.V. Hutchison European Warrants May 2003 0.6200 61.4250 30/05/2003 126,000,000 05/07/02
9398 Credit Suisse First Boston HSI European Put Warrants Mar 2003 0.2500 9,888 27/03/2003 380,000,000 05/07/02
per 2,800 units
9399 KBC Fin Products Int’l Ltd USD/JPY European Warrants Apr 2003 0.3330 118 per unit 02/04/2003 300,000,000 08/07/02
9401 Credit Suisse First Boston Huaneng Power European Warrants Sep 2003 0.2500 5.8800 18/09/2003 380,000,000 09/07/02
9400 Credit Suisse First Boston China Mobile European Put Warrants Apr 2003 0.2570 20.8800 17/04/2003 380,000,000 09/07/02
9402 Macquarie Bank Ltd Hang Seng European Warrants Jan 2003 0.4000 85.2500 10/01/2003 250,000,000 09/07/02
9403 Macquarie Bank Ltd Swire Pac A European Warrants Apr 2003 0.3000 42.5000 23/04/2003 330,000,000 09/07/02
9404 KBC Fin Products Int’l Ltd HSBC European Warrants Jan 2003 0.6900 87.5000 10/01/2003 144,000,000 10/07/02
9405 SGA Societe Generale Acceptance N.V. China Mobile European Warrants Jan 2003 0.2800 23.0000 10/01/2003 357,000,000 10/07/02
9406 SGA Societe Generale Acceptance N.V. HSI European Warrants Jan 2003 0.2600 10,550 30/01/2003 384,000,000 10/07/02
per 3,000 units
9407 SGA Societe Generale Acceptance N.V. HWL European Warrants Jan 2003 0.5900 57.5000 10/01/2003 169,000,000 10/07/02
9408 KBC Fin Products Int’l Ltd HSI European Warrants Jan 2003 0.2500 10,500 30/01/2003 400,000,000 11/07/02
per 3,600 units
9409 SGA Societe Generale Acceptance N.V. Cheung Kong European Warrants Jan 2003 0.6900 66.5000 13/01/2003 143,000,000 12/07/02
9411 Macquarie Bank Ltd SHK Ppt European Warrants Feb 2003 0.4430 66.5000 05/02/2003 225,000,000 15/07/02
9410 Credit Suisse First Boston Nasdaq-100 Index European Warrants Aug 2003 0.2640 1,088 28/08/2003 360,000,000 15/07/02
per 1,500 units
9201 # SGA Societe Generale Acceptance N.V. HSI European Warrants Sep 2002 0.0980 11,500 27/09/2002 300,000,000 15/07/02
per 2,500 units
9412 Goldman Sachs Int’l Cheung Kong European Warrants Jan 2003 0.5500 69.5625 29/01/2003 180,000,000 16/07/02
9413 Lehman Brothers Holdings Inc. Cheung Kong European Warrants Feb 2003 0.5700 69.5625 10/02/2003 175,000,000 16/07/02
9416 BNP Paribas Arbit Issu B.V. Hutchison European Put Warrants Feb 2003 0.5800 60.0000 14/02/2003 170,000,000 17/07/02
9415 BNP Paribas Arbit Issu B.V. HSBC European Warrants Jan 2003 0.4350 95.0000 17/01/2003 220,000,000 17/07/02
9419 BNP Paribas Arbit Issu B.V. HSBC European Put Warrants Jan 2003 0.3400 82.0000 20/01/2003 293,000,000 17/07/02
9414 BNP Paribas Arbit Issu B.V. China Mobile European Warrants Jan 2003 0.2510 24.5000 29/01/2003 395,000,000 17/07/02
9418 BNP Paribas Arbit Issu B.V. China Mobile European Put Warrants Jan 2003 0.2500 22.0000 30/01/2003 400,000,000 17/07/02
9417 Credit Suisse First Boston PCCW European Warrants May 2003 0.2600 1.8 per unit 28/05/2003 400,000,000 18/07/02
9421 Credit Suisse First Boston PCCW European Put Warrants Jun 2003 0.2550 1.68 per unit 18/06/2003 400,000,000 18/07/02
9420 SGA Societe Generale Acceptance N.V. USD/JPY European Warrants Apr 2003 0.2500 118 per unit 03/04/2003 400,000,000 18/07/02
9422 KBC Fin Products Int’l Ltd China Mobile European Put Warrants Feb 2003 0.3040 23.8000 04/02/2003 648,000,000 18/07/02
9423 SGA Societe Generale Acceptance N.V. Nasdaq-100 Index European Warrants Mar 2003 0.2600 1,000 21/03/2003 380,000,000 19/07/02
per 5,500 units
9427 SGA Societe Generale Acceptance N.V. Nasdaq-100 Index European Put Warrants Mar 2003 0.2500 900 21/03/2003 400,000,000 19/07/02
per 5,000 units
9424 ABN AMRO Bank N.V. HSBC European Warrants Mar 2003 0.9900 83.6000 03/03/2003 92,000,000 22/07/02
Newly listed derivative warrants (continued)Strike level/
Issue Subscription Subscription/ Unit issued
prices price (HK$) exercise on initial Listing
Code Issuer Name of issue (HK$) per 10 units period listing date
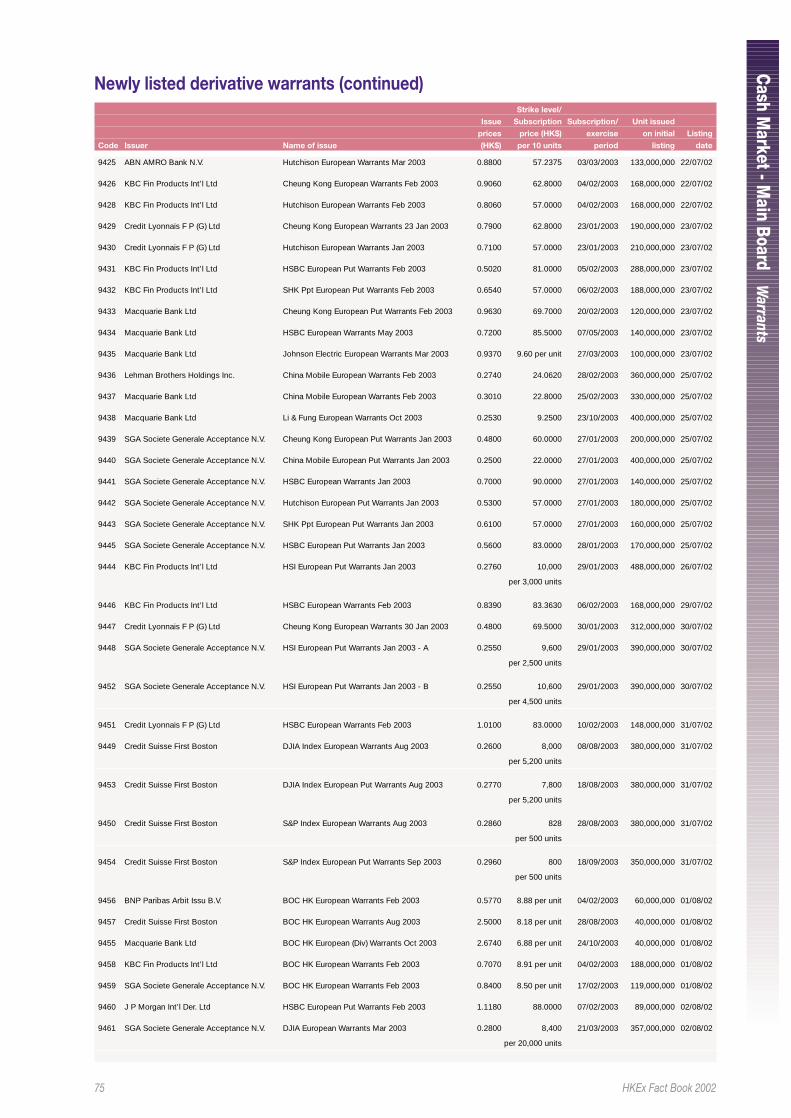
75 HKEx Fact Book 2002
Cash M
arket - Main Boar d
Warrants
9425 ABN AMRO Bank N.V. Hutchison European Warrants Mar 2003 0.8800 57.2375 03/03/2003 133,000,000 22/07/02
9426 KBC Fin Products Int’l Ltd Cheung Kong European Warrants Feb 2003 0.9060 62.8000 04/02/2003 168,000,000 22/07/02
9428 KBC Fin Products Int’l Ltd Hutchison European Warrants Feb 2003 0.8060 57.0000 04/02/2003 168,000,000 22/07/02
9429 Credit Lyonnais F P (G) Ltd Cheung Kong European Warrants 23 Jan 2003 0.7900 62.8000 23/01/2003 190,000,000 23/07/02
9430 Credit Lyonnais F P (G) Ltd Hutchison European Warrants Jan 2003 0.7100 57.0000 23/01/2003 210,000,000 23/07/02
9431 KBC Fin Products Int’l Ltd HSBC European Put Warrants Feb 2003 0.5020 81.0000 05/02/2003 288,000,000 23/07/02
9432 KBC Fin Products Int’l Ltd SHK Ppt European Put Warrants Feb 2003 0.6540 57.0000 06/02/2003 188,000,000 23/07/02
9433 Macquarie Bank Ltd Cheung Kong European Put Warrants Feb 2003 0.9630 69.7000 20/02/2003 120,000,000 23/07/02
9434 Macquarie Bank Ltd HSBC European Warrants May 2003 0.7200 85.5000 07/05/2003 140,000,000 23/07/02
9435 Macquarie Bank Ltd Johnson Electric European Warrants Mar 2003 0.9370 9.60 per unit 27/03/2003 100,000,000 23/07/02
9436 Lehman Brothers Holdings Inc. China Mobile European Warrants Feb 2003 0.2740 24.0620 28/02/2003 360,000,000 25/07/02
9437 Macquarie Bank Ltd China Mobile European Warrants Feb 2003 0.3010 22.8000 25/02/2003 330,000,000 25/07/02
9438 Macquarie Bank Ltd Li & Fung European Warrants Oct 2003 0.2530 9.2500 23/10/2003 400,000,000 25/07/02
9439 SGA Societe Generale Acceptance N.V. Cheung Kong European Put Warrants Jan 2003 0.4800 60.0000 27/01/2003 200,000,000 25/07/02
9440 SGA Societe Generale Acceptance N.V. China Mobile European Put Warrants Jan 2003 0.2500 22.0000 27/01/2003 400,000,000 25/07/02
9441 SGA Societe Generale Acceptance N.V. HSBC European Warrants Jan 2003 0.7000 90.0000 27/01/2003 140,000,000 25/07/02
9442 SGA Societe Generale Acceptance N.V. Hutchison European Put Warrants Jan 2003 0.5300 57.0000 27/01/2003 180,000,000 25/07/02
9443 SGA Societe Generale Acceptance N.V. SHK Ppt European Put Warrants Jan 2003 0.6100 57.0000 27/01/2003 160,000,000 25/07/02
9445 SGA Societe Generale Acceptance N.V. HSBC European Put Warrants Jan 2003 0.5600 83.0000 28/01/2003 170,000,000 25/07/02
9444 KBC Fin Products Int’l Ltd HSI European Put Warrants Jan 2003 0.2760 10,000 29/01/2003 488,000,000 26/07/02
per 3,000 units
9446 KBC Fin Products Int’l Ltd HSBC European Warrants Feb 2003 0.8390 83.3630 06/02/2003 168,000,000 29/07/02
9447 Credit Lyonnais F P (G) Ltd Cheung Kong European Warrants 30 Jan 2003 0.4800 69.5000 30/01/2003 312,000,000 30/07/02
9448 SGA Societe Generale Acceptance N.V. HSI European Put Warrants Jan 2003 - A 0.2550 9,600 29/01/2003 390,000,000 30/07/02
per 2,500 units
9452 SGA Societe Generale Acceptance N.V. HSI European Put Warrants Jan 2003 - B 0.2550 10,600 29/01/2003 390,000,000 30/07/02
per 4,500 units
9451 Credit Lyonnais F P (G) Ltd HSBC European Warrants Feb 2003 1.0100 83.0000 10/02/2003 148,000,000 31/07/02
9449 Credit Suisse First Boston DJIA Index European Warrants Aug 2003 0.2600 8,000 08/08/2003 380,000,000 31/07/02
per 5,200 units
9453 Credit Suisse First Boston DJIA Index European Put Warrants Aug 2003 0.2770 7,800 18/08/2003 380,000,000 31/07/02
per 5,200 units
9450 Credit Suisse First Boston S&P Index European Warrants Aug 2003 0.2860 828 28/08/2003 380,000,000 31/07/02
per 500 units
9454 Credit Suisse First Boston S&P Index European Put Warrants Sep 2003 0.2960 800 18/09/2003 350,000,000 31/07/02
per 500 units
9456 BNP Paribas Arbit Issu B.V. BOC HK European Warrants Feb 2003 0.5770 8.88 per unit 04/02/2003 60,000,000 01/08/02
9457 Credit Suisse First Boston BOC HK European Warrants Aug 2003 2.5000 8.18 per unit 28/08/2003 40,000,000 01/08/02
9455 Macquarie Bank Ltd BOC HK European (Div) Warrants Oct 2003 2.6740 6.88 per unit 24/10/2003 40,000,000 01/08/02
9458 KBC Fin Products Int’l Ltd BOC HK European Warrants Feb 2003 0.7070 8.91 per unit 04/02/2003 188,000,000 01/08/02
9459 SGA Societe Generale Acceptance N.V. BOC HK European Warrants Feb 2003 0.8400 8.50 per unit 17/02/2003 119,000,000 01/08/02
9460 J P Morgan Int’l Der. Ltd HSBC European Put Warrants Feb 2003 1.1180 88.0000 07/02/2003 89,000,000 02/08/02
9461 SGA Societe Generale Acceptance N.V. DJIA European Warrants Mar 2003 0.2800 8,400 21/03/2003 357,000,000 02/08/02
per 20,000 units
Newly listed derivative warrants (continued)Strike level/
Issue Subscription Subscription/ Unit issued
prices price (HK$) exercise on initial Listing
Code Issuer Name of issue (HK$) per 10 units period listing date
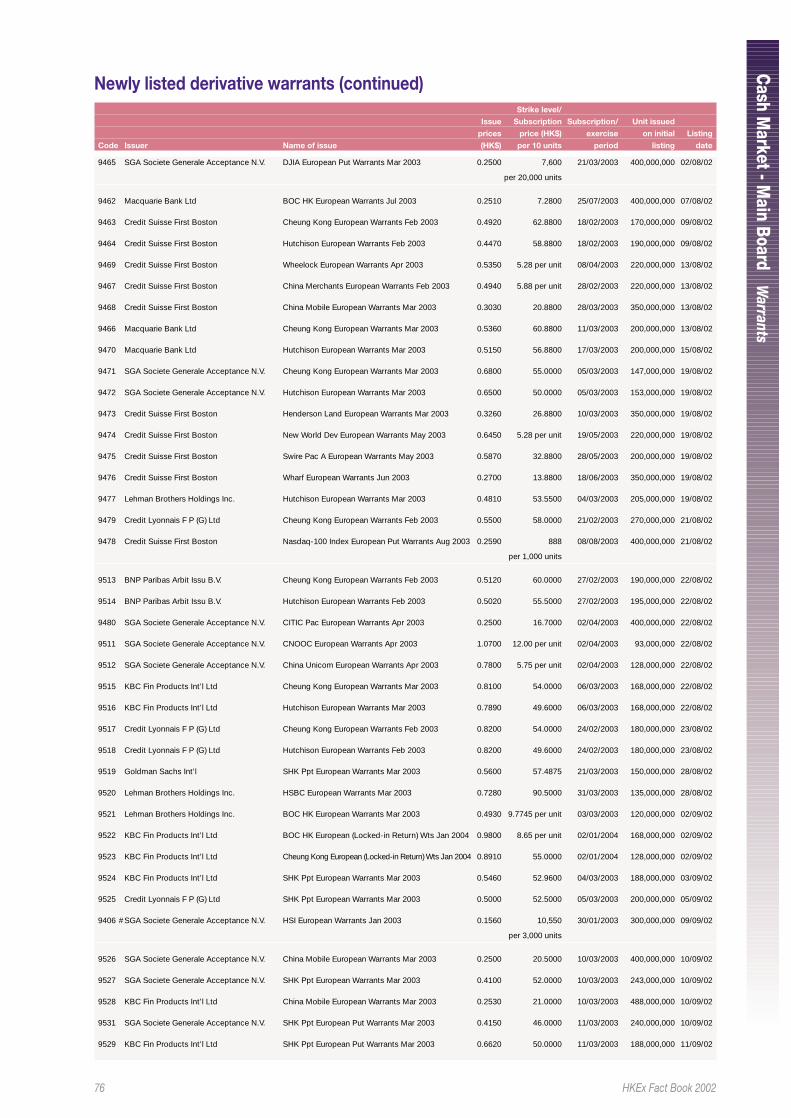
76 HKEx Fact Book 2002
Cash M
arket - Main Boar d
Warrants
9465 SGA Societe Generale Acceptance N.V. DJIA European Put Warrants Mar 2003 0.2500 7,600 21/03/2003 400,000,000 02/08/02
per 20,000 units
9462 Macquarie Bank Ltd BOC HK European Warrants Jul 2003 0.2510 7.2800 25/07/2003 400,000,000 07/08/02
9463 Credit Suisse First Boston Cheung Kong European Warrants Feb 2003 0.4920 62.8800 18/02/2003 170,000,000 09/08/02
9464 Credit Suisse First Boston Hutchison European Warrants Feb 2003 0.4470 58.8800 18/02/2003 190,000,000 09/08/02
9469 Credit Suisse First Boston Wheelock European Warrants Apr 2003 0.5350 5.28 per unit 08/04/2003 220,000,000 13/08/02
9467 Credit Suisse First Boston China Merchants European Warrants Feb 2003 0.4940 5.88 per unit 28/02/2003 220,000,000 13/08/02
9468 Credit Suisse First Boston China Mobile European Warrants Mar 2003 0.3030 20.8800 28/03/2003 350,000,000 13/08/02
9466 Macquarie Bank Ltd Cheung Kong European Warrants Mar 2003 0.5360 60.8800 11/03/2003 200,000,000 13/08/02
9470 Macquarie Bank Ltd Hutchison European Warrants Mar 2003 0.5150 56.8800 17/03/2003 200,000,000 15/08/02
9471 SGA Societe Generale Acceptance N.V. Cheung Kong European Warrants Mar 2003 0.6800 55.0000 05/03/2003 147,000,000 19/08/02
9472 SGA Societe Generale Acceptance N.V. Hutchison European Warrants Mar 2003 0.6500 50.0000 05/03/2003 153,000,000 19/08/02
9473 Credit Suisse First Boston Henderson Land European Warrants Mar 2003 0.3260 26.8800 10/03/2003 350,000,000 19/08/02
9474 Credit Suisse First Boston New World Dev European Warrants May 2003 0.6450 5.28 per unit 19/05/2003 220,000,000 19/08/02
9475 Credit Suisse First Boston Swire Pac A European Warrants May 2003 0.5870 32.8800 28/05/2003 200,000,000 19/08/02
9476 Credit Suisse First Boston Wharf European Warrants Jun 2003 0.2700 13.8800 18/06/2003 350,000,000 19/08/02
9477 Lehman Brothers Holdings Inc. Hutchison European Warrants Mar 2003 0.4810 53.5500 04/03/2003 205,000,000 19/08/02
9479 Credit Lyonnais F P (G) Ltd Cheung Kong European Warrants Feb 2003 0.5500 58.0000 21/02/2003 270,000,000 21/08/02
9478 Credit Suisse First Boston Nasdaq-100 Index European Put Warrants Aug 2003 0.2590 888 08/08/2003 400,000,000 21/08/02
per 1,000 units
9513 BNP Paribas Arbit Issu B.V. Cheung Kong European Warrants Feb 2003 0.5120 60.0000 27/02/2003 190,000,000 22/08/02
9514 BNP Paribas Arbit Issu B.V. Hutchison European Warrants Feb 2003 0.5020 55.5000 27/02/2003 195,000,000 22/08/02
9480 SGA Societe Generale Acceptance N.V. CITIC Pac European Warrants Apr 2003 0.2500 16.7000 02/04/2003 400,000,000 22/08/02
9511 SGA Societe Generale Acceptance N.V. CNOOC European Warrants Apr 2003 1.0700 12.00 per unit 02/04/2003 93,000,000 22/08/02
9512 SGA Societe Generale Acceptance N.V. China Unicom European Warrants Apr 2003 0.7800 5.75 per unit 02/04/2003 128,000,000 22/08/02
9515 KBC Fin Products Int’l Ltd Cheung Kong European Warrants Mar 2003 0.8100 54.0000 06/03/2003 168,000,000 22/08/02
9516 KBC Fin Products Int’l Ltd Hutchison European Warrants Mar 2003 0.7890 49.6000 06/03/2003 168,000,000 22/08/02
9517 Credit Lyonnais F P (G) Ltd Cheung Kong European Warrants Feb 2003 0.8200 54.0000 24/02/2003 180,000,000 23/08/02
9518 Credit Lyonnais F P (G) Ltd Hutchison European Warrants Feb 2003 0.8200 49.6000 24/02/2003 180,000,000 23/08/02
9519 Goldman Sachs Int’l SHK Ppt European Warrants Mar 2003 0.5600 57.4875 21/03/2003 150,000,000 28/08/02
9520 Lehman Brothers Holdings Inc. HSBC European Warrants Mar 2003 0.7280 90.5000 31/03/2003 135,000,000 28/08/02
9521 Lehman Brothers Holdings Inc. BOC HK European Warrants Mar 2003 0.4930 9.7745 per unit 03/03/2003 120,000,000 02/09/02
9522 KBC Fin Products Int’l Ltd BOC HK European (Locked-in Return) Wts Jan 2004 0.9800 8.65 per unit 02/01/2004 168,000,000 02/09/02
9523 KBC Fin Products Int’l Ltd Cheung Kong European (Locked-in Return) Wts Jan 2004 0.8910 55.0000 02/01/2004 128,000,000 02/09/02
9524 KBC Fin Products Int’l Ltd SHK Ppt European Warrants Mar 2003 0.5460 52.9600 04/03/2003 188,000,000 03/09/02
9525 Credit Lyonnais F P (G) Ltd SHK Ppt European Warrants Mar 2003 0.5000 52.5000 05/03/2003 200,000,000 05/09/02
9406 # SGA Societe Generale Acceptance N.V. HSI European Warrants Jan 2003 0.1560 10,550 30/01/2003 300,000,000 09/09/02
per 3,000 units
9526 SGA Societe Generale Acceptance N.V. China Mobile European Warrants Mar 2003 0.2500 20.5000 10/03/2003 400,000,000 10/09/02
9527 SGA Societe Generale Acceptance N.V. SHK Ppt European Warrants Mar 2003 0.4100 52.0000 10/03/2003 243,000,000 10/09/02
9528 KBC Fin Products Int’l Ltd China Mobile European Warrants Mar 2003 0.2530 21.0000 10/03/2003 488,000,000 10/09/02
9531 SGA Societe Generale Acceptance N.V. SHK Ppt European Put Warrants Mar 2003 0.4150 46.0000 11/03/2003 240,000,000 10/09/02
9529 KBC Fin Products Int’l Ltd SHK Ppt European Put Warrants Mar 2003 0.6620 50.0000 11/03/2003 188,000,000 11/09/02
Newly listed derivative warrants (continued)Strike level/
Issue Subscription Subscription/ Unit issued
prices price (HK$) exercise on initial Listing
Code Issuer Name of issue (HK$) per 10 units period listing date
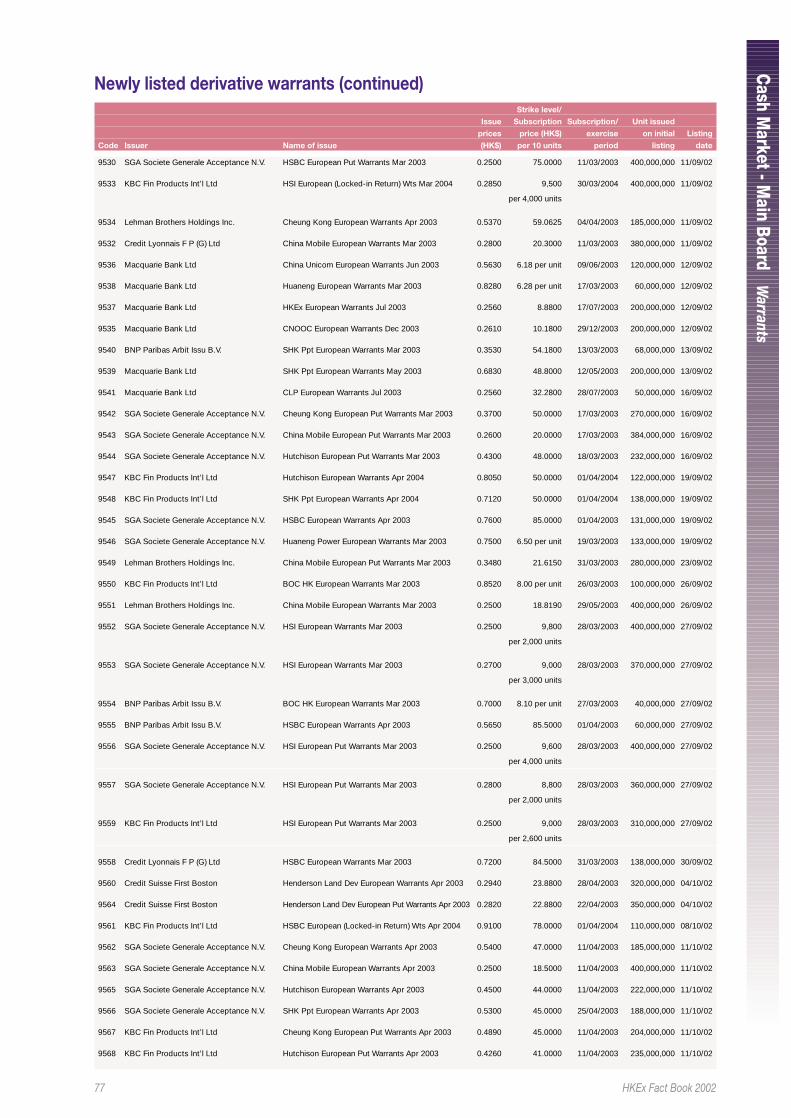
77 HKEx Fact Book 2002
Cash M
arket - Main Boar d
Warrants
9530 SGA Societe Generale Acceptance N.V. HSBC European Put Warrants Mar 2003 0.2500 75.0000 11/03/2003 400,000,000 11/09/02
9533 KBC Fin Products Int’l Ltd HSI European (Locked-in Return) Wts Mar 2004 0.2850 9,500 30/03/2004 400,000,000 11/09/02
per 4,000 units
9534 Lehman Brothers Holdings Inc. Cheung Kong European Warrants Apr 2003 0.5370 59.0625 04/04/2003 185,000,000 11/09/02
9532 Credit Lyonnais F P (G) Ltd China Mobile European Warrants Mar 2003 0.2800 20.3000 11/03/2003 380,000,000 11/09/02
9536 Macquarie Bank Ltd China Unicom European Warrants Jun 2003 0.5630 6.18 per unit 09/06/2003 120,000,000 12/09/02
9538 Macquarie Bank Ltd Huaneng European Warrants Mar 2003 0.8280 6.28 per unit 17/03/2003 60,000,000 12/09/02
9537 Macquarie Bank Ltd HKEx European Warrants Jul 2003 0.2560 8.8800 17/07/2003 200,000,000 12/09/02
9535 Macquarie Bank Ltd CNOOC European Warrants Dec 2003 0.2610 10.1800 29/12/2003 200,000,000 12/09/02
9540 BNP Paribas Arbit Issu B.V. SHK Ppt European Warrants Mar 2003 0.3530 54.1800 13/03/2003 68,000,000 13/09/02
9539 Macquarie Bank Ltd SHK Ppt European Warrants May 2003 0.6830 48.8000 12/05/2003 200,000,000 13/09/02
9541 Macquarie Bank Ltd CLP European Warrants Jul 2003 0.2560 32.2800 28/07/2003 50,000,000 16/09/02
9542 SGA Societe Generale Acceptance N.V. Cheung Kong European Put Warrants Mar 2003 0.3700 50.0000 17/03/2003 270,000,000 16/09/02
9543 SGA Societe Generale Acceptance N.V. China Mobile European Put Warrants Mar 2003 0.2600 20.0000 17/03/2003 384,000,000 16/09/02
9544 SGA Societe Generale Acceptance N.V. Hutchison European Put Warrants Mar 2003 0.4300 48.0000 18/03/2003 232,000,000 16/09/02
9547 KBC Fin Products Int’l Ltd Hutchison European Warrants Apr 2004 0.8050 50.0000 01/04/2004 122,000,000 19/09/02
9548 KBC Fin Products Int’l Ltd SHK Ppt European Warrants Apr 2004 0.7120 50.0000 01/04/2004 138,000,000 19/09/02
9545 SGA Societe Generale Acceptance N.V. HSBC European Warrants Apr 2003 0.7600 85.0000 01/04/2003 131,000,000 19/09/02
9546 SGA Societe Generale Acceptance N.V. Huaneng Power European Warrants Mar 2003 0.7500 6.50 per unit 19/03/2003 133,000,000 19/09/02
9549 Lehman Brothers Holdings Inc. China Mobile European Put Warrants Mar 2003 0.3480 21.6150 31/03/2003 280,000,000 23/09/02
9550 KBC Fin Products Int’l Ltd BOC HK European Warrants Mar 2003 0.8520 8.00 per unit 26/03/2003 100,000,000 26/09/02
9551 Lehman Brothers Holdings Inc. China Mobile European Warrants Mar 2003 0.2500 18.8190 29/05/2003 400,000,000 26/09/02
9552 SGA Societe Generale Acceptance N.V. HSI European Warrants Mar 2003 0.2500 9,800 28/03/2003 400,000,000 27/09/02
per 2,000 units
9553 SGA Societe Generale Acceptance N.V. HSI European Warrants Mar 2003 0.2700 9,000 28/03/2003 370,000,000 27/09/02
per 3,000 units
9554 BNP Paribas Arbit Issu B.V. BOC HK European Warrants Mar 2003 0.7000 8.10 per unit 27/03/2003 40,000,000 27/09/02
9555 BNP Paribas Arbit Issu B.V. HSBC European Warrants Apr 2003 0.5650 85.5000 01/04/2003 60,000,000 27/09/02
9556 SGA Societe Generale Acceptance N.V. HSI European Put Warrants Mar 2003 0.2500 9,600 28/03/2003 400,000,000 27/09/02
per 4,000 units
9557 SGA Societe Generale Acceptance N.V. HSI European Put Warrants Mar 2003 0.2800 8,800 28/03/2003 360,000,000 27/09/02
per 2,000 units
9559 KBC Fin Products Int’l Ltd HSI European Put Warrants Mar 2003 0.2500 9,000 28/03/2003 310,000,000 27/09/02
per 2,600 units
9558 Credit Lyonnais F P (G) Ltd HSBC European Warrants Mar 2003 0.7200 84.5000 31/03/2003 138,000,000 30/09/02
9560 Credit Suisse First Boston Henderson Land Dev European Warrants Apr 2003 0.2940 23.8800 28/04/2003 320,000,000 04/10/02
9564 Credit Suisse First Boston Henderson Land Dev European Put Warrants Apr 2003 0.2820 22.8800 22/04/2003 350,000,000 04/10/02
9561 KBC Fin Products Int’l Ltd HSBC European (Locked-in Return) Wts Apr 2004 0.9100 78.0000 01/04/2004 110,000,000 08/10/02
9562 SGA Societe Generale Acceptance N.V. Cheung Kong European Warrants Apr 2003 0.5400 47.0000 11/04/2003 185,000,000 11/10/02
9563 SGA Societe Generale Acceptance N.V. China Mobile European Warrants Apr 2003 0.2500 18.5000 11/04/2003 400,000,000 11/10/02
9565 SGA Societe Generale Acceptance N.V. Hutchison European Warrants Apr 2003 0.4500 44.0000 11/04/2003 222,000,000 11/10/02
9566 SGA Societe Generale Acceptance N.V. SHK Ppt European Warrants Apr 2003 0.5300 45.0000 25/04/2003 188,000,000 11/10/02
9567 KBC Fin Products Int’l Ltd Cheung Kong European Put Warrants Apr 2003 0.4890 45.0000 11/04/2003 204,000,000 11/10/02
9568 KBC Fin Products Int’l Ltd Hutchison European Put Warrants Apr 2003 0.4260 41.0000 11/04/2003 235,000,000 11/10/02
Newly listed derivative warrants (continued)Strike level/
Issue Subscription Subscription/ Unit issued
prices price (HK$) exercise on initial Listing
Code Issuer Name of issue (HK$) per 10 units period listing date
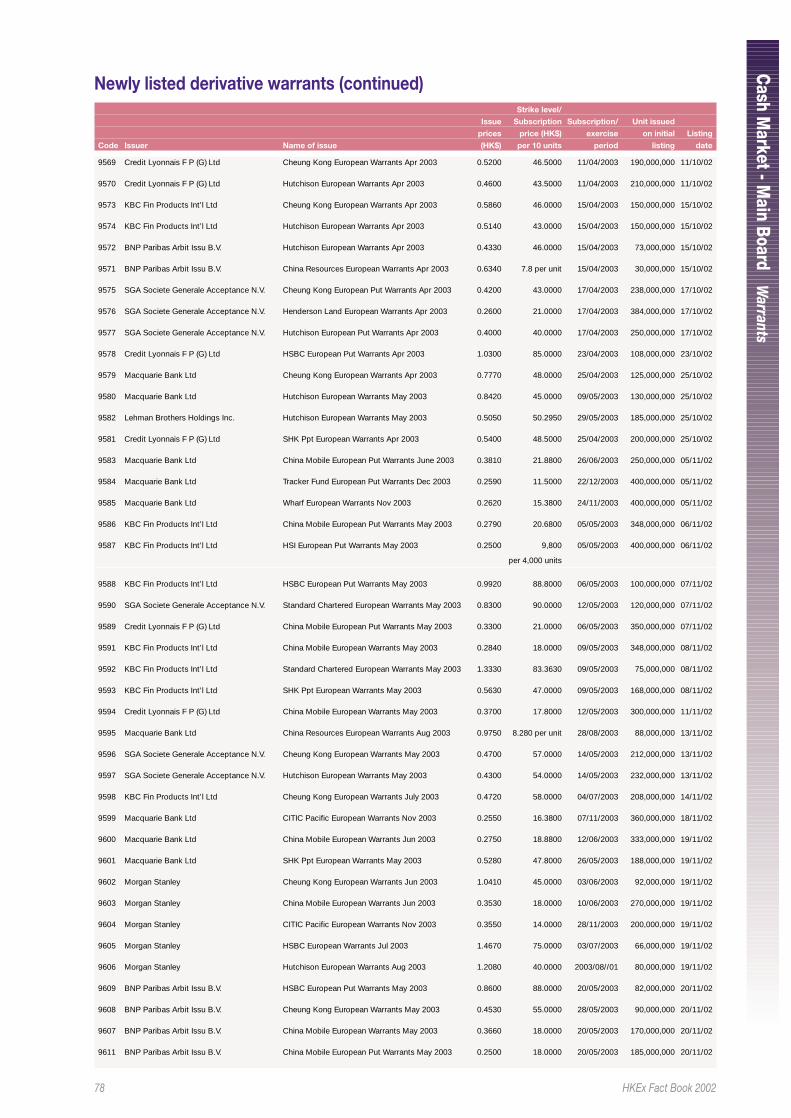
78 HKEx Fact Book 2002
Cash M
arket - Main Boar d
Warrants
9569 Credit Lyonnais F P (G) Ltd Cheung Kong European Warrants Apr 2003 0.5200 46.5000 11/04/2003 190,000,000 11/10/02
9570 Credit Lyonnais F P (G) Ltd Hutchison European Warrants Apr 2003 0.4600 43.5000 11/04/2003 210,000,000 11/10/02
9573 KBC Fin Products Int’l Ltd Cheung Kong European Warrants Apr 2003 0.5860 46.0000 15/04/2003 150,000,000 15/10/02
9574 KBC Fin Products Int’l Ltd Hutchison European Warrants Apr 2003 0.5140 43.0000 15/04/2003 150,000,000 15/10/02
9572 BNP Paribas Arbit Issu B.V. Hutchison European Warrants Apr 2003 0.4330 46.0000 15/04/2003 73,000,000 15/10/02
9571 BNP Paribas Arbit Issu B.V. China Resources European Warrants Apr 2003 0.6340 7.8 per unit 15/04/2003 30,000,000 15/10/02
9575 SGA Societe Generale Acceptance N.V. Cheung Kong European Put Warrants Apr 2003 0.4200 43.0000 17/04/2003 238,000,000 17/10/02
9576 SGA Societe Generale Acceptance N.V. Henderson Land European Warrants Apr 2003 0.2600 21.0000 17/04/2003 384,000,000 17/10/02
9577 SGA Societe Generale Acceptance N.V. Hutchison European Put Warrants Apr 2003 0.4000 40.0000 17/04/2003 250,000,000 17/10/02
9578 Credit Lyonnais F P (G) Ltd HSBC European Put Warrants Apr 2003 1.0300 85.0000 23/04/2003 108,000,000 23/10/02
9579 Macquarie Bank Ltd Cheung Kong European Warrants Apr 2003 0.7770 48.0000 25/04/2003 125,000,000 25/10/02
9580 Macquarie Bank Ltd Hutchison European Warrants May 2003 0.8420 45.0000 09/05/2003 130,000,000 25/10/02
9582 Lehman Brothers Holdings Inc. Hutchison European Warrants May 2003 0.5050 50.2950 29/05/2003 185,000,000 25/10/02
9581 Credit Lyonnais F P (G) Ltd SHK Ppt European Warrants Apr 2003 0.5400 48.5000 25/04/2003 200,000,000 25/10/02
9583 Macquarie Bank Ltd China Mobile European Put Warrants June 2003 0.3810 21.8800 26/06/2003 250,000,000 05/11/02
9584 Macquarie Bank Ltd Tracker Fund European Put Warrants Dec 2003 0.2590 11.5000 22/12/2003 400,000,000 05/11/02
9585 Macquarie Bank Ltd Wharf European Warrants Nov 2003 0.2620 15.3800 24/11/2003 400,000,000 05/11/02
9586 KBC Fin Products Int’l Ltd China Mobile European Put Warrants May 2003 0.2790 20.6800 05/05/2003 348,000,000 06/11/02
9587 KBC Fin Products Int’l Ltd HSI European Put Warrants May 2003 0.2500 9,800 05/05/2003 400,000,000 06/11/02
per 4,000 units
9588 KBC Fin Products Int’l Ltd HSBC European Put Warrants May 2003 0.9920 88.8000 06/05/2003 100,000,000 07/11/02
9590 SGA Societe Generale Acceptance N.V. Standard Chartered European Warrants May 2003 0.8300 90.0000 12/05/2003 120,000,000 07/11/02
9589 Credit Lyonnais F P (G) Ltd China Mobile European Put Warrants May 2003 0.3300 21.0000 06/05/2003 350,000,000 07/11/02
9591 KBC Fin Products Int’l Ltd China Mobile European Warrants May 2003 0.2840 18.0000 09/05/2003 348,000,000 08/11/02
9592 KBC Fin Products Int’l Ltd Standard Chartered European Warrants May 2003 1.3330 83.3630 09/05/2003 75,000,000 08/11/02
9593 KBC Fin Products Int’l Ltd SHK Ppt European Warrants May 2003 0.5630 47.0000 09/05/2003 168,000,000 08/11/02
9594 Credit Lyonnais F P (G) Ltd China Mobile European Warrants May 2003 0.3700 17.8000 12/05/2003 300,000,000 11/11/02
9595 Macquarie Bank Ltd China Resources European Warrants Aug 2003 0.9750 8.280 per unit 28/08/2003 88,000,000 13/11/02
9596 SGA Societe Generale Acceptance N.V. Cheung Kong European Warrants May 2003 0.4700 57.0000 14/05/2003 212,000,000 13/11/02
9597 SGA Societe Generale Acceptance N.V. Hutchison European Warrants May 2003 0.4300 54.0000 14/05/2003 232,000,000 13/11/02
9598 KBC Fin Products Int’l Ltd Cheung Kong European Warrants July 2003 0.4720 58.0000 04/07/2003 208,000,000 14/11/02
9599 Macquarie Bank Ltd CITIC Pacific European Warrants Nov 2003 0.2550 16.3800 07/11/2003 360,000,000 18/11/02
9600 Macquarie Bank Ltd China Mobile European Warrants Jun 2003 0.2750 18.8800 12/06/2003 333,000,000 19/11/02
9601 Macquarie Bank Ltd SHK Ppt European Warrants May 2003 0.5280 47.8000 26/05/2003 188,000,000 19/11/02
9602 Morgan Stanley Cheung Kong European Warrants Jun 2003 1.0410 45.0000 03/06/2003 92,000,000 19/11/02
9603 Morgan Stanley China Mobile European Warrants Jun 2003 0.3530 18.0000 10/06/2003 270,000,000 19/11/02
9604 Morgan Stanley CITIC Pacific European Warrants Nov 2003 0.3550 14.0000 28/11/2003 200,000,000 19/11/02
9605 Morgan Stanley HSBC European Warrants Jul 2003 1.4670 75.0000 03/07/2003 66,000,000 19/11/02
9606 Morgan Stanley Hutchison European Warrants Aug 2003 1.2080 40.0000 2003/08//01 80,000,000 19/11/02
9609 BNP Paribas Arbit Issu B.V. HSBC European Put Warrants May 2003 0.8600 88.0000 20/05/2003 82,000,000 20/11/02
9608 BNP Paribas Arbit Issu B.V. Cheung Kong European Warrants May 2003 0.4530 55.0000 28/05/2003 90,000,000 20/11/02
9607 BNP Paribas Arbit Issu B.V. China Mobile European Warrants May 2003 0.3660 18.0000 20/05/2003 170,000,000 20/11/02
9611 BNP Paribas Arbit Issu B.V. China Mobile European Put Warrants May 2003 0.2500 18.0000 20/05/2003 185,000,000 20/11/02
Newly listed derivative warrants (continued)Strike level/
Issue Subscription Subscription/ Unit issued
prices price (HK$) exercise on initial Listing
Code Issuer Name of issue (HK$) per 10 units period listing date
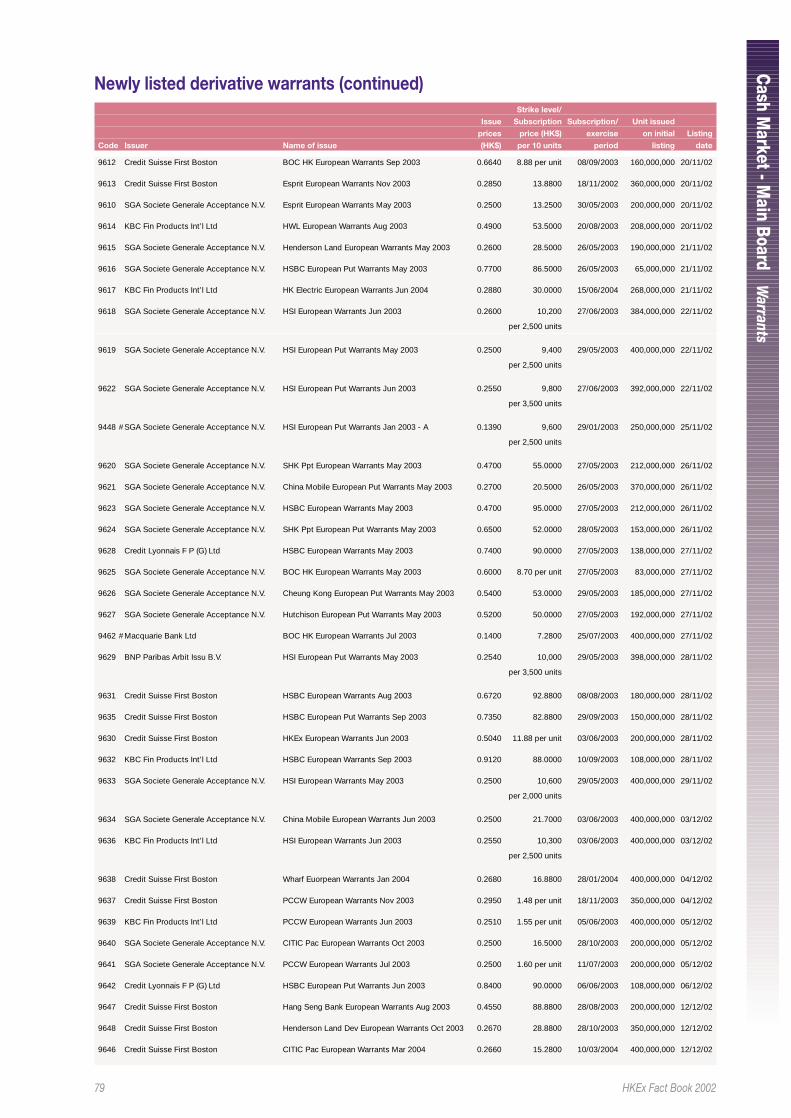
79 HKEx Fact Book 2002
Cash M
arket - Main Boar d
Warrants
9612 Credit Suisse First Boston BOC HK European Warrants Sep 2003 0.6640 8.88 per unit 08/09/2003 160,000,000 20/11/02
9613 Credit Suisse First Boston Esprit European Warrants Nov 2003 0.2850 13.8800 18/11/2002 360,000,000 20/11/02
9610 SGA Societe Generale Acceptance N.V. Esprit European Warrants May 2003 0.2500 13.2500 30/05/2003 200,000,000 20/11/02
9614 KBC Fin Products Int’l Ltd HWL European Warrants Aug 2003 0.4900 53.5000 20/08/2003 208,000,000 20/11/02
9615 SGA Societe Generale Acceptance N.V. Henderson Land European Warrants May 2003 0.2600 28.5000 26/05/2003 190,000,000 21/11/02
9616 SGA Societe Generale Acceptance N.V. HSBC European Put Warrants May 2003 0.7700 86.5000 26/05/2003 65,000,000 21/11/02
9617 KBC Fin Products Int’l Ltd HK Electric European Warrants Jun 2004 0.2880 30.0000 15/06/2004 268,000,000 21/11/02
9618 SGA Societe Generale Acceptance N.V. HSI European Warrants Jun 2003 0.2600 10,200 27/06/2003 384,000,000 22/11/02
per 2,500 units
9619 SGA Societe Generale Acceptance N.V. HSI European Put Warrants May 2003 0.2500 9,400 29/05/2003 400,000,000 22/11/02
per 2,500 units
9622 SGA Societe Generale Acceptance N.V. HSI European Put Warrants Jun 2003 0.2550 9,800 27/06/2003 392,000,000 22/11/02
per 3,500 units
9448 # SGA Societe Generale Acceptance N.V. HSI European Put Warrants Jan 2003 - A 0.1390 9,600 29/01/2003 250,000,000 25/11/02
per 2,500 units
9620 SGA Societe Generale Acceptance N.V. SHK Ppt European Warrants May 2003 0.4700 55.0000 27/05/2003 212,000,000 26/11/02
9621 SGA Societe Generale Acceptance N.V. China Mobile European Put Warrants May 2003 0.2700 20.5000 26/05/2003 370,000,000 26/11/02
9623 SGA Societe Generale Acceptance N.V. HSBC European Warrants May 2003 0.4700 95.0000 27/05/2003 212,000,000 26/11/02
9624 SGA Societe Generale Acceptance N.V. SHK Ppt European Put Warrants May 2003 0.6500 52.0000 28/05/2003 153,000,000 26/11/02
9628 Credit Lyonnais F P (G) Ltd HSBC European Warrants May 2003 0.7400 90.0000 27/05/2003 138,000,000 27/11/02
9625 SGA Societe Generale Acceptance N.V. BOC HK European Warrants May 2003 0.6000 8.70 per unit 27/05/2003 83,000,000 27/11/02
9626 SGA Societe Generale Acceptance N.V. Cheung Kong European Put Warrants May 2003 0.5400 53.0000 29/05/2003 185,000,000 27/11/02
9627 SGA Societe Generale Acceptance N.V. Hutchison European Put Warrants May 2003 0.5200 50.0000 27/05/2003 192,000,000 27/11/02
9462 # Macquarie Bank Ltd BOC HK European Warrants Jul 2003 0.1400 7.2800 25/07/2003 400,000,000 27/11/02
9629 BNP Paribas Arbit Issu B.V. HSI European Put Warrants May 2003 0.2540 10,000 29/05/2003 398,000,000 28/11/02
per 3,500 units
9631 Credit Suisse First Boston HSBC European Warrants Aug 2003 0.6720 92.8800 08/08/2003 180,000,000 28/11/02
9635 Credit Suisse First Boston HSBC European Put Warrants Sep 2003 0.7350 82.8800 29/09/2003 150,000,000 28/11/02
9630 Credit Suisse First Boston HKEx European Warrants Jun 2003 0.5040 11.88 per unit 03/06/2003 200,000,000 28/11/02
9632 KBC Fin Products Int’l Ltd HSBC European Warrants Sep 2003 0.9120 88.0000 10/09/2003 108,000,000 28/11/02
9633 SGA Societe Generale Acceptance N.V. HSI European Warrants May 2003 0.2500 10,600 29/05/2003 400,000,000 29/11/02
per 2,000 units
9634 SGA Societe Generale Acceptance N.V. China Mobile European Warrants Jun 2003 0.2500 21.7000 03/06/2003 400,000,000 03/12/02
9636 KBC Fin Products Int’l Ltd HSI European Warrants Jun 2003 0.2550 10,300 03/06/2003 400,000,000 03/12/02
per 2,500 units
9638 Credit Suisse First Boston Wharf Euorpean Warrants Jan 2004 0.2680 16.8800 28/01/2004 400,000,000 04/12/02
9637 Credit Suisse First Boston PCCW European Warrants Nov 2003 0.2950 1.48 per unit 18/11/2003 350,000,000 04/12/02
9639 KBC Fin Products Int’l Ltd PCCW European Warrants Jun 2003 0.2510 1.55 per unit 05/06/2003 400,000,000 05/12/02
9640 SGA Societe Generale Acceptance N.V. CITIC Pac European Warrants Oct 2003 0.2500 16.5000 28/10/2003 200,000,000 05/12/02
9641 SGA Societe Generale Acceptance N.V. PCCW European Warrants Jul 2003 0.2500 1.60 per unit 11/07/2003 200,000,000 05/12/02
9642 Credit Lyonnais F P (G) Ltd HSBC European Put Warrants Jun 2003 0.8400 90.0000 06/06/2003 108,000,000 06/12/02
9647 Credit Suisse First Boston Hang Seng Bank European Warrants Aug 2003 0.4550 88.8800 28/08/2003 200,000,000 12/12/02
9648 Credit Suisse First Boston Henderson Land Dev European Warrants Oct 2003 0.2670 28.8800 28/10/2003 350,000,000 12/12/02
9646 Credit Suisse First Boston CITIC Pac European Warrants Mar 2004 0.2660 15.2800 10/03/2004 400,000,000 12/12/02
Newly listed derivative warrants (continued)Strike level/
Issue Subscription Subscription/ Unit issued
prices price (HK$) exercise on initial Listing
Code Issuer Name of issue (HK$) per 10 units period listing date
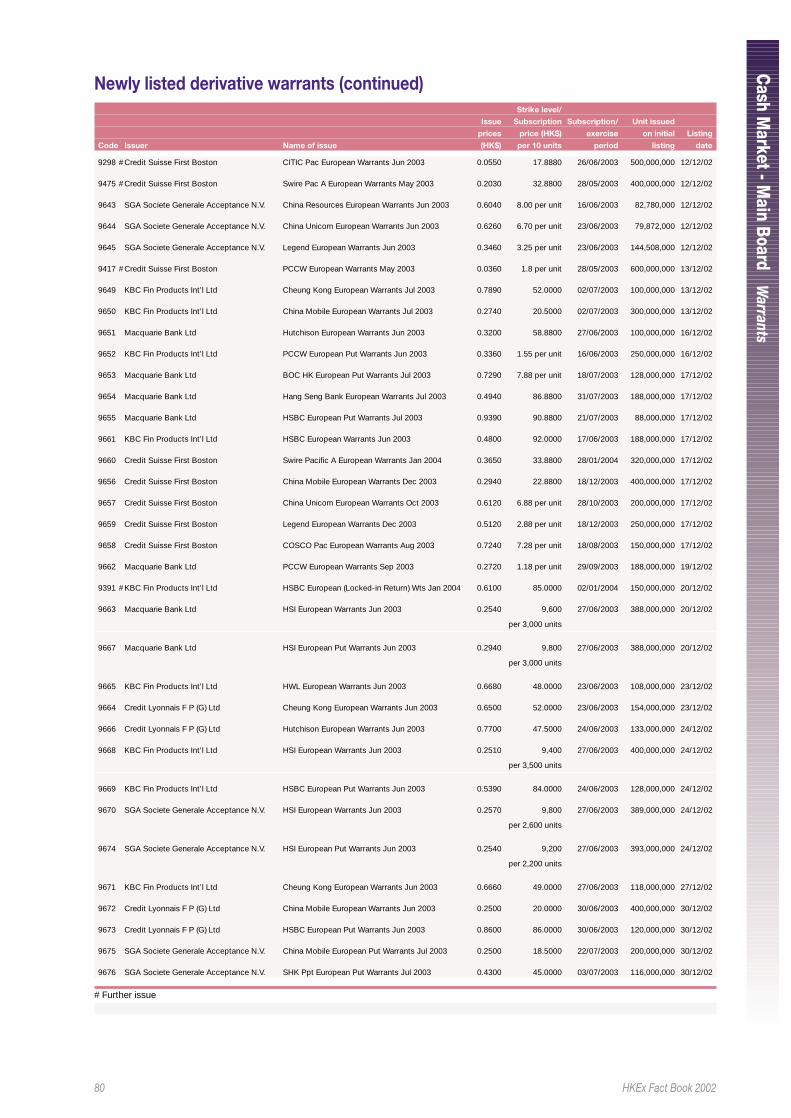
80 HKEx Fact Book 2002
Cash M
arket - Main Boar d
Warrants
Newly listed derivative warrants (continued)Strike level/
Issue Subscription Subscription/ Unit issued
prices price (HK$) exercise on initial Listing
Code Issuer Name of issue (HK$) per 10 units period listing date
9298 # Credit Suisse First Boston CITIC Pac European Warrants Jun 2003 0.0550 17.8880 26/06/2003 500,000,000 12/12/02
9475 # Credit Suisse First Boston Swire Pac A European Warrants May 2003 0.2030 32.8800 28/05/2003 400,000,000 12/12/02
9643 SGA Societe Generale Acceptance N.V. China Resources European Warrants Jun 2003 0.6040 8.00 per unit 16/06/2003 82,780,000 12/12/02
9644 SGA Societe Generale Acceptance N.V. China Unicom European Warrants Jun 2003 0.6260 6.70 per unit 23/06/2003 79,872,000 12/12/02
9645 SGA Societe Generale Acceptance N.V. Legend European Warrants Jun 2003 0.3460 3.25 per unit 23/06/2003 144,508,000 12/12/02
9417 # Credit Suisse First Boston PCCW European Warrants May 2003 0.0360 1.8 per unit 28/05/2003 600,000,000 13/12/02
9649 KBC Fin Products Int’l Ltd Cheung Kong European Warrants Jul 2003 0.7890 52.0000 02/07/2003 100,000,000 13/12/02
9650 KBC Fin Products Int’l Ltd China Mobile European Warrants Jul 2003 0.2740 20.5000 02/07/2003 300,000,000 13/12/02
9651 Macquarie Bank Ltd Hutchison European Warrants Jun 2003 0.3200 58.8800 27/06/2003 100,000,000 16/12/02
9652 KBC Fin Products Int’l Ltd PCCW European Put Warrants Jun 2003 0.3360 1.55 per unit 16/06/2003 250,000,000 16/12/02
9653 Macquarie Bank Ltd BOC HK European Put Warrants Jul 2003 0.7290 7.88 per unit 18/07/2003 128,000,000 17/12/02
9654 Macquarie Bank Ltd Hang Seng Bank European Warrants Jul 2003 0.4940 86.8800 31/07/2003 188,000,000 17/12/02
9655 Macquarie Bank Ltd HSBC European Put Warrants Jul 2003 0.9390 90.8800 21/07/2003 88,000,000 17/12/02
9661 KBC Fin Products Int’l Ltd HSBC European Warrants Jun 2003 0.4800 92.0000 17/06/2003 188,000,000 17/12/02
9660 Credit Suisse First Boston Swire Pacific A European Warrants Jan 2004 0.3650 33.8800 28/01/2004 320,000,000 17/12/02
9656 Credit Suisse First Boston China Mobile European Warrants Dec 2003 0.2940 22.8800 18/12/2003 400,000,000 17/12/02
9657 Credit Suisse First Boston China Unicom European Warrants Oct 2003 0.6120 6.88 per unit 28/10/2003 200,000,000 17/12/02
9659 Credit Suisse First Boston Legend European Warrants Dec 2003 0.5120 2.88 per unit 18/12/2003 250,000,000 17/12/02
9658 Credit Suisse First Boston COSCO Pac European Warrants Aug 2003 0.7240 7.28 per unit 18/08/2003 150,000,000 17/12/02
9662 Macquarie Bank Ltd PCCW European Warrants Sep 2003 0.2720 1.18 per unit 29/09/2003 188,000,000 19/12/02
9391 # KBC Fin Products Int’l Ltd HSBC European (Locked-in Return) Wts Jan 2004 0.6100 85.0000 02/01/2004 150,000,000 20/12/02
9663 Macquarie Bank Ltd HSI European Warrants Jun 2003 0.2540 9,600 27/06/2003 388,000,000 20/12/02
per 3,000 units
9667 Macquarie Bank Ltd HSI European Put Warrants Jun 2003 0.2940 9,800 27/06/2003 388,000,000 20/12/02
per 3,000 units
9665 KBC Fin Products Int’l Ltd HWL European Warrants Jun 2003 0.6680 48.0000 23/06/2003 108,000,000 23/12/02
9664 Credit Lyonnais F P (G) Ltd Cheung Kong European Warrants Jun 2003 0.6500 52.0000 23/06/2003 154,000,000 23/12/02
9666 Credit Lyonnais F P (G) Ltd Hutchison European Warrants Jun 2003 0.7700 47.5000 24/06/2003 133,000,000 24/12/02
9668 KBC Fin Products Int’l Ltd HSI European Warrants Jun 2003 0.2510 9,400 27/06/2003 400,000,000 24/12/02
per 3,500 units
9669 KBC Fin Products Int’l Ltd HSBC European Put Warrants Jun 2003 0.5390 84.0000 24/06/2003 128,000,000 24/12/02
9670 SGA Societe Generale Acceptance N.V. HSI European Warrants Jun 2003 0.2570 9,800 27/06/2003 389,000,000 24/12/02
per 2,600 units
9674 SGA Societe Generale Acceptance N.V. HSI European Put Warrants Jun 2003 0.2540 9,200 27/06/2003 393,000,000 24/12/02
per 2,200 units
9671 KBC Fin Products Int’l Ltd Cheung Kong European Warrants Jun 2003 0.6660 49.0000 27/06/2003 118,000,000 27/12/02
9672 Credit Lyonnais F P (G) Ltd China Mobile European Warrants Jun 2003 0.2500 20.0000 30/06/2003 400,000,000 30/12/02
9673 Credit Lyonnais F P (G) Ltd HSBC European Put Warrants Jun 2003 0.8600 86.0000 30/06/2003 120,000,000 30/12/02
9675 SGA Societe Generale Acceptance N.V. China Mobile European Put Warrants Jul 2003 0.2500 18.5000 22/07/2003 200,000,000 30/12/02
9676 SGA Societe Generale Acceptance N.V. SHK Ppt European Put Warrants Jul 2003 0.4300 45.0000 03/07/2003 116,000,000 30/12/02
# Further issue
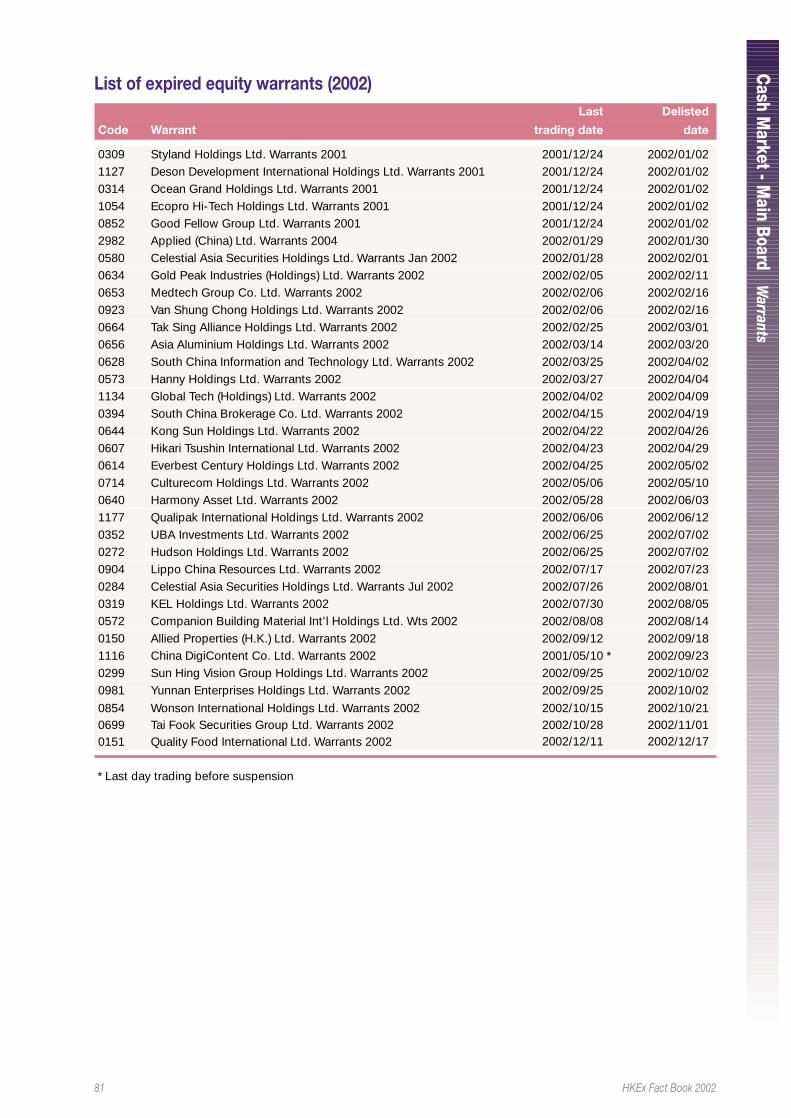
81 HKEx Fact Book 2002
Cash M
arket - Main Boar d
Warrants
List of expired equity warrants (2002)Last Delisted
Code Warrant trading date date
0309 Styland Holdings Ltd. Warrants 2001 2001/12/24 2002/01/021127 Deson Development International Holdings Ltd. Warrants 2001 2001/12/24 2002/01/020314 Ocean Grand Holdings Ltd. Warrants 2001 2001/12/24 2002/01/021054 Ecopro Hi-Tech Holdings Ltd. Warrants 2001 2001/12/24 2002/01/020852 Good Fellow Group Ltd. Warrants 2001 2001/12/24 2002/01/022982 Applied (China) Ltd. Warrants 2004 2002/01/29 2002/01/300580 Celestial Asia Securities Holdings Ltd. Warrants Jan 2002 2002/01/28 2002/02/010634 Gold Peak Industries (Holdings) Ltd. Warrants 2002 2002/02/05 2002/02/110653 Medtech Group Co. Ltd. Warrants 2002 2002/02/06 2002/02/160923 Van Shung Chong Holdings Ltd. Warrants 2002 2002/02/06 2002/02/160664 Tak Sing Alliance Holdings Ltd. Warrants 2002 2002/02/25 2002/03/010656 Asia Aluminium Holdings Ltd. Warrants 2002 2002/03/14 2002/03/200628 South China Information and Technology Ltd. Warrants 2002 2002/03/25 2002/04/020573 Hanny Holdings Ltd. Warrants 2002 2002/03/27 2002/04/041134 Global Tech (Holdings) Ltd. Warrants 2002 2002/04/02 2002/04/090394 South China Brokerage Co. Ltd. Warrants 2002 2002/04/15 2002/04/190644 Kong Sun Holdings Ltd. Warrants 2002 2002/04/22 2002/04/260607 Hikari Tsushin International Ltd. Warrants 2002 2002/04/23 2002/04/290614 Everbest Century Holdings Ltd. Warrants 2002 2002/04/25 2002/05/020714 Culturecom Holdings Ltd. Warrants 2002 2002/05/06 2002/05/100640 Harmony Asset Ltd. Warrants 2002 2002/05/28 2002/06/031177 Qualipak International Holdings Ltd. Warrants 2002 2002/06/06 2002/06/120352 UBA Investments Ltd. Warrants 2002 2002/06/25 2002/07/020272 Hudson Holdings Ltd. Warrants 2002 2002/06/25 2002/07/020904 Lippo China Resources Ltd. Warrants 2002 2002/07/17 2002/07/230284 Celestial Asia Securities Holdings Ltd. Warrants Jul 2002 2002/07/26 2002/08/010319 KEL Holdings Ltd. Warrants 2002 2002/07/30 2002/08/050572 Companion Building Material Int’l Holdings Ltd. Wts 2002 2002/08/08 2002/08/140150 Allied Properties (H.K.) Ltd. Warrants 2002 2002/09/12 2002/09/181116 China DigiContent Co. Ltd. Warrants 2002 2001/05/10 * 2002/09/230299 Sun Hing Vision Group Holdings Ltd. Warrants 2002 2002/09/25 2002/10/020981 Yunnan Enterprises Holdings Ltd. Warrants 2002 2002/09/25 2002/10/02
0854 Wonson International Holdings Ltd. Warrants 2002 2002/10/15 2002/10/210699 Tai Fook Securities Group Ltd. Warrants 2002 2002/10/28 2002/11/010151 Q uality Food International Ltd. Warrants 2002 2002/12/11 2002/12/17
* Last day trading before suspension
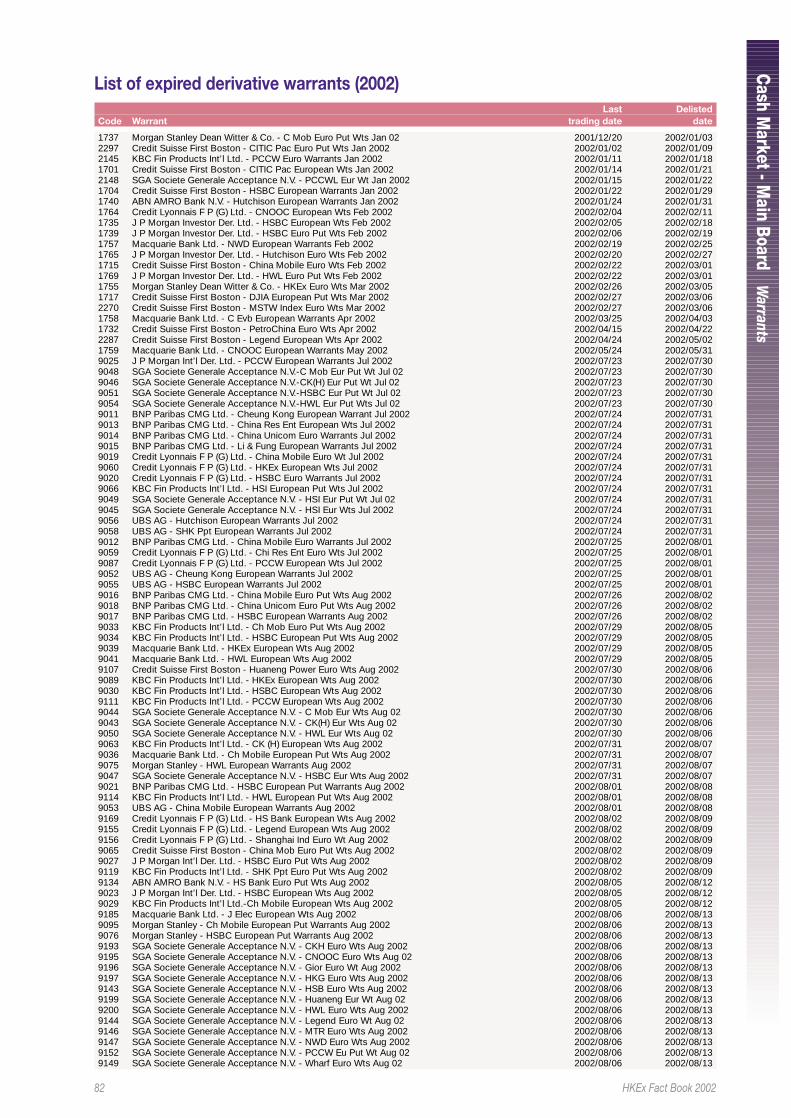
82 HKEx Fact Book 2002
Cash M
arket - Main Boar d
Warrants
List of expired derivative warrants (2002)Last Delisted
Code Warrant trading date date
1737 Morgan Stanley Dean Witter & Co. - C Mob Euro Put Wts Jan 02 2001/12/20 2002/01/032297 Credit Suisse First Boston - CITIC Pac Euro Put Wts Jan 2002 2002/01/02 2002/01/092145 KBC Fin Products Int’l Ltd. - PCCW Euro Warrants Jan 2002 2002/01/11 2002/01/181701 Credit Suisse First Boston - CITIC Pac European Wts Jan 2002 2002/01/14 2002/01/212148 SGA Societe Generale Acceptance N.V. - PCCWL Eur Wt Jan 2002 2002/01/15 2002/01/221704 Credit Suisse First Boston - HSBC European Warrants Jan 2002 2002/01/22 2002/01/291740 ABN AMRO Bank N.V. - Hutchison European Warrants Jan 2002 2002/01/24 2002/01/311764 Credit Lyonnais F P (G) Ltd. - CNOOC European Wts Feb 2002 2002/02/04 2002/02/111735 J P Morgan Investor Der. Ltd. - HSBC European Wts Feb 2002 2002/02/05 2002/02/181739 J P Morgan Investor Der. Ltd. - HSBC Euro Put Wts Feb 2002 2002/02/06 2002/02/191757 Macquarie Bank Ltd. - NWD European Warrants Feb 2002 2002/02/19 2002/02/251765 J P Morgan Investor Der. Ltd. - Hutchison Euro Wts Feb 2002 2002/02/20 2002/02/271715 Credit Suisse First Boston - China Mobile Euro Wts Feb 2002 2002/02/22 2002/03/011769 J P Morgan Investor Der. Ltd. - HWL Euro Put Wts Feb 2002 2002/02/22 2002/03/011755 Morgan Stanley Dean Witter & Co. - HKEx Euro Wts Mar 2002 2002/02/26 2002/03/051717 Credit Suisse First Boston - DJIA European Put Wts Mar 2002 2002/02/27 2002/03/062270 Credit Suisse First Boston - MSTW Index Euro Wts Mar 2002 2002/02/27 2002/03/061758 Macquarie Bank Ltd. - C Evb European Warrants Apr 2002 2002/03/25 2002/04/031732 Credit Suisse First Boston - PetroChina Euro Wts Apr 2002 2002/04/15 2002/04/222287 Credit Suisse First Boston - Legend European Wts Apr 2002 2002/04/24 2002/05/021759 Macquarie Bank Ltd. - CNOOC European Warrants May 2002 2002/05/24 2002/05/319025 J P Morgan Int’l Der. Ltd. - PCCW European Warrants Jul 2002 2002/07/23 2002/07/309048 SGA Societe Generale Acceptance N.V.-C Mob Eur Put Wt Jul 02 2002/07/23 2002/07/309046 SGA Societe Generale Acceptance N.V.-CK(H) Eur Put Wt Jul 02 2002/07/23 2002/07/309051 SGA Societe Generale Acceptance N.V.-HSBC Eur Put Wt Jul 02 2002/07/23 2002/07/309054 SGA Societe Generale Acceptance N.V.-HWL Eur Put Wts Jul 02 2002/07/23 2002/07/309011 BNP Paribas CMG Ltd. - Cheung Kong European Warrant Jul 2002 2002/07/24 2002/07/319013 BNP Paribas CMG Ltd. - China Res Ent European Wts Jul 2002 2002/07/24 2002/07/319014 BNP Paribas CMG Ltd. - China Unicom Euro Warrants Jul 2002 2002/07/24 2002/07/319015 BNP Paribas CMG Ltd. - Li & Fung European Warrants Jul 2002 2002/07/24 2002/07/319019 Credit Lyonnais F P (G) Ltd. - China Mobile Euro Wt Jul 2002 2002/07/24 2002/07/319060 Credit Lyonnais F P (G) Ltd. - HKEx European Wts Jul 2002 2002/07/24 2002/07/319020 Credit Lyonnais F P (G) Ltd. - HSBC Euro Warrants Jul 2002 2002/07/24 2002/07/319066 KBC Fin Products Int’l Ltd. - HSI European Put Wts Jul 2002 2002/07/24 2002/07/319049 SGA Societe Generale Acceptance N.V. - HSI Eur Put Wt Jul 02 2002/07/24 2002/07/319045 SGA Societe Generale Acceptance N.V. - HSI Eur Wts Jul 2002 2002/07/24 2002/07/319056 UBS AG - Hutchison European Warrants Jul 2002 2002/07/24 2002/07/319058 UBS AG - SHK Ppt European Warrants Jul 2002 2002/07/24 2002/07/319012 BNP Paribas CMG Ltd. - China Mobile Euro Warrants Jul 2002 2002/07/25 2002/08/019059 Credit Lyonnais F P (G) Ltd. - Chi Res Ent Euro Wts Jul 2002 2002/07/25 2002/08/019087 Credit Lyonnais F P (G) Ltd. - PCCW European Wts Jul 2002 2002/07/25 2002/08/019052 UBS AG - Cheung Kong European Warrants Jul 2002 2002/07/25 2002/08/019055 UBS AG - HSBC European Warrants Jul 2002 2002/07/25 2002/08/019016 BNP Paribas CMG Ltd. - China Mobile Euro Put Wts Aug 2002 2002/07/26 2002/08/029018 BNP Paribas CMG Ltd. - China Unicom Euro Put Wts Aug 2002 2002/07/26 2002/08/029017 BNP Paribas CMG Ltd. - HSBC European Warrants Aug 2002 2002/07/26 2002/08/029033 KBC Fin Products Int’l Ltd. - Ch Mob Euro Put Wts Aug 2002 2002/07/29 2002/08/059034 KBC Fin Products Int’l Ltd. - HSBC European Put Wts Aug 2002 2002/07/29 2002/08/059039 Macquarie Bank Ltd. - HKEx European Wts Aug 2002 2002/07/29 2002/08/059041 Macquarie Bank Ltd. - HWL European Wts Aug 2002 2002/07/29 2002/08/059107 Credit Suisse First Boston - Huaneng Power Euro Wts Aug 2002 2002/07/30 2002/08/069089 KBC Fin Products Int’l Ltd. - HKEx European Wts Aug 2002 2002/07/30 2002/08/069030 KBC Fin Products Int’l Ltd. - HSBC European Wts Aug 2002 2002/07/30 2002/08/069111 KBC Fin Products Int’l Ltd. - PCCW European Wts Aug 2002 2002/07/30 2002/08/069044 SGA Societe Generale Acceptance N.V. - C Mob Eur Wts Aug 02 2002/07/30 2002/08/069043 SGA Societe Generale Acceptance N.V. - CK(H) Eur Wts Aug 02 2002/07/30 2002/08/069050 SGA Societe Generale Acceptance N.V. - HWL Eur Wts Aug 02 2002/07/30 2002/08/069063 KBC Fin Products Int’l Ltd. - CK (H) European Wts Aug 2002 2002/07/31 2002/08/079036 Macquarie Bank Ltd. - Ch Mobile European Put Wts Aug 2002 2002/07/31 2002/08/079075 Morgan Stanley - HWL European Warrants Aug 2002 2002/07/31 2002/08/079047 SGA Societe Generale Acceptance N.V. - HSBC Eur Wts Aug 2002 2002/07/31 2002/08/079021 BNP Paribas CMG Ltd. - HSBC European Put Warrants Aug 2002 2002/08/01 2002/08/089114 KBC Fin Products Int’l Ltd. - HWL European Put Wts Aug 2002 2002/08/01 2002/08/089053 UBS AG - China Mobile European Warrants Aug 2002 2002/08/01 2002/08/089169 Credit Lyonnais F P (G) Ltd. - HS Bank European Wts Aug 2002 2002/08/02 2002/08/099155 Credit Lyonnais F P (G) Ltd. - Legend European Wts Aug 2002 2002/08/02 2002/08/099156 Credit Lyonnais F P (G) Ltd. - Shanghai Ind Euro Wt Aug 2002 2002/08/02 2002/08/099065 Credit Suisse First Boston - China Mob Euro Put Wts Aug 2002 2002/08/02 2002/08/099027 J P Morgan Int’l Der. Ltd. - HSBC Euro Put Wts Aug 2002 2002/08/02 2002/08/099119 KBC Fin Products Int’l Ltd. - SHK Ppt Euro Put Wts Aug 2002 2002/08/02 2002/08/099134 ABN AMRO Bank N.V. - HS Bank Euro Put Wts Aug 2002 2002/08/05 2002/08/129023 J P Morgan Int’l Der. Ltd. - HSBC European Wts Aug 2002 2002/08/05 2002/08/129029 KBC Fin Products Int’l Ltd.-Ch Mobile European Wts Aug 2002 2002/08/05 2002/08/129185 Macquarie Bank Ltd. - J Elec European Wts Aug 2002 2002/08/06 2002/08/139095 Morgan Stanley - Ch Mobile European Put Warrants Aug 2002 2002/08/06 2002/08/139076 Morgan Stanley - HSBC European Put Warrants Aug 2002 2002/08/06 2002/08/139193 SGA Societe Generale Acceptance N.V. - CKH Euro Wts Aug 2002 2002/08/06 2002/08/139195 SGA Societe Generale Acceptance N.V. - CNOOC Euro Wts Aug 02 2002/08/06 2002/08/139196 SGA Societe Generale Acceptance N.V. - Gior Euro Wt Aug 2002 2002/08/06 2002/08/139197 SGA Societe Generale Acceptance N.V. - HKG Euro Wts Aug 2002 2002/08/06 2002/08/139143 SGA Societe Generale Acceptance N.V. - HSB Euro Wts Aug 2002 2002/08/06 2002/08/139199 SGA Societe Generale Acceptance N.V. - Huaneng Eur Wt Aug 02 2002/08/06 2002/08/139200 SGA Societe Generale Acceptance N.V. - HWL Euro Wts Aug 2002 2002/08/06 2002/08/139144 SGA Societe Generale Acceptance N.V. - Legend Euro Wt Aug 02 2002/08/06 2002/08/139146 SGA Societe Generale Acceptance N.V. - MTR Euro Wts Aug 2002 2002/08/06 2002/08/139147 SGA Societe Generale Acceptance N.V. - NWD Euro Wts Aug 2002 2002/08/06 2002/08/139152 SGA Societe Generale Acceptance N.V. - PCCW Eu Put Wt Aug 02 2002/08/06 2002/08/139149 SGA Societe Generale Acceptance N.V. - Wharf Euro Wts Aug 02 2002/08/06 2002/08/13
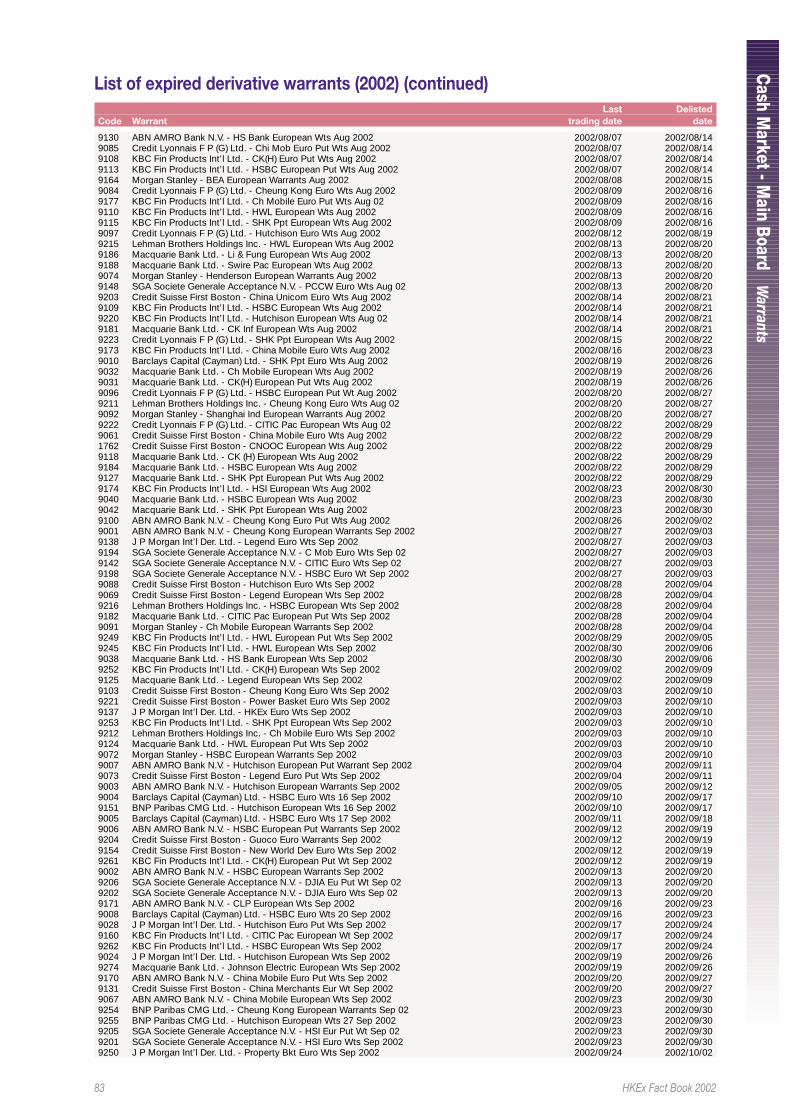
83 HKEx Fact Book 2002
Cash M
arket - Main Boar d
Warrants
9130 ABN AMRO Bank N.V. - HS Bank European Wts Aug 2002 2002/08/07 2002/08/149085 Credit Lyonnais F P (G) Ltd. - Chi Mob Euro Put Wts Aug 2002 2002/08/07 2002/08/149108 KBC Fin Products Int’l Ltd. - CK(H) Euro Put Wts Aug 2002 2002/08/07 2002/08/149113 KBC Fin Products Int’l Ltd. - HSBC European Put Wts Aug 2002 2002/08/07 2002/08/149164 Morgan Stanley - BEA European Warrants Aug 2002 2002/08/08 2002/08/159084 Credit Lyonnais F P (G) Ltd. - Cheung Kong Euro Wts Aug 2002 2002/08/09 2002/08/169177 KBC Fin Products Int’l Ltd. - Ch Mobile Euro Put Wts Aug 02 2002/08/09 2002/08/169110 KBC Fin Products Int’l Ltd. - HWL European Wts Aug 2002 2002/08/09 2002/08/169115 KBC Fin Products Int’l Ltd. - SHK Ppt European Wts Aug 2002 2002/08/09 2002/08/169097 Credit Lyonnais F P (G) Ltd. - Hutchison Euro Wts Aug 2002 2002/08/12 2002/08/199215 Lehman Brothers Holdings Inc. - HWL European Wts Aug 2002 2002/08/13 2002/08/209186 Macquarie Bank Ltd. - Li & Fung European Wts Aug 2002 2002/08/13 2002/08/209188 Macquarie Bank Ltd. - Swire Pac European Wts Aug 2002 2002/08/13 2002/08/209074 Morgan Stanley - Henderson European Warrants Aug 2002 2002/08/13 2002/08/209148 SGA Societe Generale Acceptance N.V. - PCCW Euro Wts Aug 02 2002/08/13 2002/08/209203 Credit Suisse First Boston - China Unicom Euro Wts Aug 2002 2002/08/14 2002/08/219109 KBC Fin Products Int’l Ltd. - HSBC European Wts Aug 2002 2002/08/14 2002/08/219220 KBC Fin Products Int’l Ltd. - Hutchison European Wts Aug 02 2002/08/14 2002/08/219181 Macquarie Bank Ltd. - CK Inf European Wts Aug 2002 2002/08/14 2002/08/219223 Credit Lyonnais F P (G) Ltd. - SHK Ppt European Wts Aug 2002 2002/08/15 2002/08/229173 KBC Fin Products Int’l Ltd. - China Mobile Euro Wts Aug 2002 2002/08/16 2002/08/239010 Barclays Capital (Cayman) Ltd. - SHK Ppt Euro Wts Aug 2002 2002/08/19 2002/08/269032 Macquarie Bank Ltd. - Ch Mobile European Wts Aug 2002 2002/08/19 2002/08/269031 Macquarie Bank Ltd. - CK(H) European Put Wts Aug 2002 2002/08/19 2002/08/269096 Credit Lyonnais F P (G) Ltd. - HSBC European Put Wt Aug 2002 2002/08/20 2002/08/279211 Lehman Brothers Holdings Inc. - Cheung Kong Euro Wts Aug 02 2002/08/20 2002/08/279092 Morgan Stanley - Shanghai Ind European Warrants Aug 2002 2002/08/20 2002/08/279222 Credit Lyonnais F P (G) Ltd. - CITIC Pac European Wts Aug 02 2002/08/22 2002/08/299061 Credit Suisse First Boston - China Mobile Euro Wts Aug 2002 2002/08/22 2002/08/291762 Credit Suisse First Boston - CNOOC European Wts Aug 2002 2002/08/22 2002/08/299118 Macquarie Bank Ltd. - CK (H) European Wts Aug 2002 2002/08/22 2002/08/299184 Macquarie Bank Ltd. - HSBC European Wts Aug 2002 2002/08/22 2002/08/299127 Macquarie Bank Ltd. - SHK Ppt European Put Wts Aug 2002 2002/08/22 2002/08/299174 KBC Fin Products Int’l Ltd. - HSI European Wts Aug 2002 2002/08/23 2002/08/309040 Macquarie Bank Ltd. - HSBC European Wts Aug 2002 2002/08/23 2002/08/309042 Macquarie Bank Ltd. - SHK Ppt European Wts Aug 2002 2002/08/23 2002/08/309100 ABN AMRO Bank N.V. - Cheung Kong Euro Put Wts Aug 2002 2002/08/26 2002/09/029001 ABN AMRO Bank N.V. - Cheung Kong European Warrants Sep 2002 2002/08/27 2002/09/039138 J P Morgan Int’l Der. Ltd. - Legend Euro Wts Sep 2002 2002/08/27 2002/09/039194 SGA Societe Generale Acceptance N.V. - C Mob Euro Wts Sep 02 2002/08/27 2002/09/039142 SGA Societe Generale Acceptance N.V. - CITIC Euro Wts Sep 02 2002/08/27 2002/09/039198 SGA Societe Generale Acceptance N.V. - HSBC Euro Wt Sep 2002 2002/08/27 2002/09/039088 Credit Suisse First Boston - Hutchison Euro Wts Sep 2002 2002/08/28 2002/09/049069 Credit Suisse First Boston - Legend European Wts Sep 2002 2002/08/28 2002/09/049216 Lehman Brothers Holdings Inc. - HSBC European Wts Sep 2002 2002/08/28 2002/09/049182 Macquarie Bank Ltd. - CITIC Pac European Put Wts Sep 2002 2002/08/28 2002/09/049091 Morgan Stanley - Ch Mobile European Warrants Sep 2002 2002/08/28 2002/09/049249 KBC Fin Products Int’l Ltd. - HWL European Put Wts Sep 2002 2002/08/29 2002/09/059245 KBC Fin Products Int’l Ltd. - HWL European Wts Sep 2002 2002/08/30 2002/09/069038 Macquarie Bank Ltd. - HS Bank European Wts Sep 2002 2002/08/30 2002/09/069252 KBC Fin Products Int’l Ltd. - CK(H) European Wts Sep 2002 2002/09/02 2002/09/099125 Macquarie Bank Ltd. - Legend European Wts Sep 2002 2002/09/02 2002/09/099103 Credit Suisse First Boston - Cheung Kong Euro Wts Sep 2002 2002/09/03 2002/09/109221 Credit Suisse First Boston - Power Basket Euro Wts Sep 2002 2002/09/03 2002/09/109137 J P Morgan Int’l Der. Ltd. - HKEx Euro Wts Sep 2002 2002/09/03 2002/09/109253 KBC Fin Products Int’l Ltd. - SHK Ppt European Wts Sep 2002 2002/09/03 2002/09/109212 Lehman Brothers Holdings Inc. - Ch Mobile Euro Wts Sep 2002 2002/09/03 2002/09/109124 Macquarie Bank Ltd. - HWL European Put Wts Sep 2002 2002/09/03 2002/09/109072 Morgan Stanley - HSBC European Warrants Sep 2002 2002/09/03 2002/09/109007 ABN AMRO Bank N.V. - Hutchison European Put Warrant Sep 2002 2002/09/04 2002/09/119073 Credit Suisse First Boston - Legend Euro Put Wts Sep 2002 2002/09/04 2002/09/119003 ABN AMRO Bank N.V. - Hutchison European Warrants Sep 2002 2002/09/05 2002/09/129004 Barclays Capital (Cayman) Ltd. - HSBC Euro Wts 16 Sep 2002 2002/09/10 2002/09/179151 BNP Paribas CMG Ltd. - Hutchison European Wts 16 Sep 2002 2002/09/10 2002/09/179005 Barclays Capital (Cayman) Ltd. - HSBC Euro Wts 17 Sep 2002 2002/09/11 2002/09/189006 ABN AMRO Bank N.V. - HSBC European Put Warrants Sep 2002 2002/09/12 2002/09/199204 Credit Suisse First Boston - Guoco Euro Warrants Sep 2002 2002/09/12 2002/09/199154 Credit Suisse First Boston - New World Dev Euro Wts Sep 2002 2002/09/12 2002/09/199261 KBC Fin Products Int’l Ltd. - CK(H) European Put Wt Sep 2002 2002/09/12 2002/09/199002 ABN AMRO Bank N.V. - HSBC European Warrants Sep 2002 2002/09/13 2002/09/209206 SGA Societe Generale Acceptance N.V. - DJIA Eu Put Wt Sep 02 2002/09/13 2002/09/209202 SGA Societe Generale Acceptance N.V. - DJIA Euro Wts Sep 02 2002/09/13 2002/09/209171 ABN AMRO Bank N.V. - CLP European Wts Sep 2002 2002/09/16 2002/09/239008 Barclays Capital (Cayman) Ltd. - HSBC Euro Wts 20 Sep 2002 2002/09/16 2002/09/239028 J P Morgan Int’l Der. Ltd. - Hutchison Euro Put Wts Sep 2002 2002/09/17 2002/09/249160 KBC Fin Products Int’l Ltd. - CITIC Pac European Wt Sep 2002 2002/09/17 2002/09/249262 KBC Fin Products Int’l Ltd. - HSBC European Wts Sep 2002 2002/09/17 2002/09/249024 J P Morgan Int’l Der. Ltd. - Hutchison European Wts Sep 2002 2002/09/19 2002/09/269274 Macquarie Bank Ltd. - Johnson Electric European Wts Sep 2002 2002/09/19 2002/09/269170 ABN AMRO Bank N.V. - China Mobile Euro Put Wts Sep 2002 2002/09/20 2002/09/279131 Credit Suisse First Boston - China Merchants Eur Wt Sep 2002 2002/09/20 2002/09/279067 ABN AMRO Bank N.V. - China Mobile European Wts Sep 2002 2002/09/23 2002/09/309254 BNP Paribas CMG Ltd. - Cheung Kong European Warrants Sep 02 2002/09/23 2002/09/309255 BNP Paribas CMG Ltd. - Hutchison European Wts 27 Sep 2002 2002/09/23 2002/09/309205 SGA Societe Generale Acceptance N.V. - HSI Eur Put Wt Sep 02 2002/09/23 2002/09/309201 SGA Societe Generale Acceptance N.V. - HSI Euro Wts Sep 2002 2002/09/23 2002/09/309250 J P Morgan Int’l Der. Ltd. - Property Bkt Euro Wts Sep 2002 2002/09/24 2002/10/02
List of expired derivative warrants (2002) (continued)Last Delisted
Code Warrant trading date date
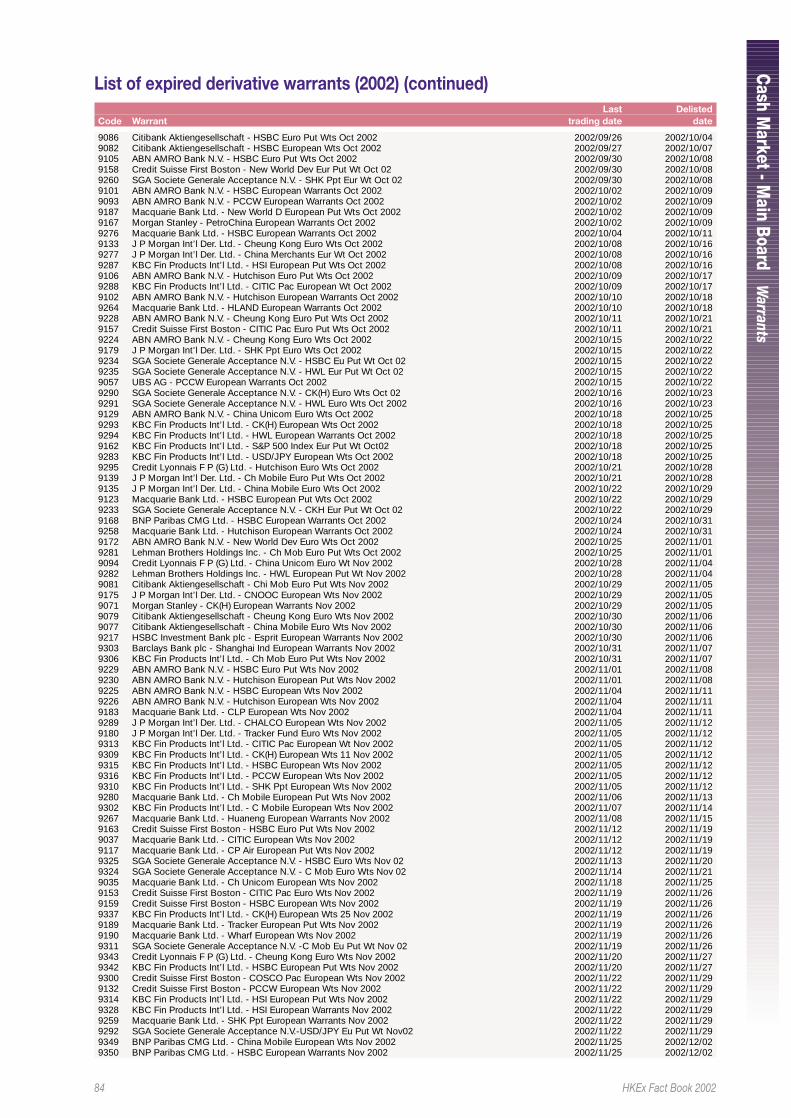
84 HKEx Fact Book 2002
Cash M
arket - Main Boar d
Warrants
9086 Citibank Aktiengesellschaft - HSBC Euro Put Wts Oct 2002 2002/09/26 2002/10/049082 Citibank Aktiengesellschaft - HSBC European Wts Oct 2002 2002/09/27 2002/10/079105 ABN AMRO Bank N.V. - HSBC Euro Put Wts Oct 2002 2002/09/30 2002/10/089158 Credit Suisse First Boston - New World Dev Eur Put Wt Oct 02 2002/09/30 2002/10/089260 SGA Societe Generale Acceptance N.V. - SHK Ppt Eur Wt Oct 02 2002/09/30 2002/10/089101 ABN AMRO Bank N.V. - HSBC European Warrants Oct 2002 2002/10/02 2002/10/099093 ABN AMRO Bank N.V. - PCCW European Warrants Oct 2002 2002/10/02 2002/10/099187 Macquarie Bank Ltd. - New World D European Put Wts Oct 2002 2002/10/02 2002/10/099167 Morgan Stanley - PetroChina European Warrants Oct 2002 2002/10/02 2002/10/099276 Macquarie Bank Ltd. - HSBC European Warrants Oct 2002 2002/10/04 2002/10/119133 J P Morgan Int’l Der. Ltd. - Cheung Kong Euro Wts Oct 2002 2002/10/08 2002/10/169277 J P Morgan Int’l Der. Ltd. - China Merchants Eur Wt Oct 2002 2002/10/08 2002/10/169287 KBC Fin Products Int’l Ltd. - HSI European Put Wts Oct 2002 2002/10/08 2002/10/169106 ABN AMRO Bank N.V. - Hutchison Euro Put Wts Oct 2002 2002/10/09 2002/10/179288 KBC Fin Products Int’l Ltd. - CITIC Pac European Wt Oct 2002 2002/10/09 2002/10/179102 ABN AMRO Bank N.V. - Hutchison European Warrants Oct 2002 2002/10/10 2002/10/189264 Macquarie Bank Ltd. - HLAND European Warrants Oct 2002 2002/10/10 2002/10/189228 ABN AMRO Bank N.V. - Cheung Kong Euro Put Wts Oct 2002 2002/10/11 2002/10/219157 Credit Suisse First Boston - CITIC Pac Euro Put Wts Oct 2002 2002/10/11 2002/10/219224 ABN AMRO Bank N.V. - Cheung Kong Euro Wts Oct 2002 2002/10/15 2002/10/229179 J P Morgan Int’l Der. Ltd. - SHK Ppt Euro Wts Oct 2002 2002/10/15 2002/10/229234 SGA Societe Generale Acceptance N.V. - HSBC Eu Put Wt Oct 02 2002/10/15 2002/10/229235 SGA Societe Generale Acceptance N.V. - HWL Eur Put Wt Oct 02 2002/10/15 2002/10/229057 UBS AG - PCCW European Warrants Oct 2002 2002/10/15 2002/10/229290 SGA Societe Generale Acceptance N.V. - CK(H) Euro Wts Oct 02 2002/10/16 2002/10/239291 SGA Societe Generale Acceptance N.V. - HWL Euro Wts Oct 2002 2002/10/16 2002/10/239129 ABN AMRO Bank N.V. - China Unicom Euro Wts Oct 2002 2002/10/18 2002/10/259293 KBC Fin Products Int’l Ltd. - CK(H) European Wts Oct 2002 2002/10/18 2002/10/259294 KBC Fin Products Int’l Ltd. - HWL European Warrants Oct 2002 2002/10/18 2002/10/259162 KBC Fin Products Int’l Ltd. - S&P 500 Index Eur Put Wt Oct02 2002/10/18 2002/10/259283 KBC Fin Products Int’l Ltd. - USD/JPY European Wts Oct 2002 2002/10/18 2002/10/259295 Credit Lyonnais F P (G) Ltd. - Hutchison Euro Wts Oct 2002 2002/10/21 2002/10/289139 J P Morgan Int’l Der. Ltd. - Ch Mobile Euro Put Wts Oct 2002 2002/10/21 2002/10/289135 J P Morgan Int’l Der. Ltd. - China Mobile Euro Wts Oct 2002 2002/10/22 2002/10/299123 Macquarie Bank Ltd. - HSBC European Put Wts Oct 2002 2002/10/22 2002/10/299233 SGA Societe Generale Acceptance N.V. - CKH Eur Put Wt Oct 02 2002/10/22 2002/10/299168 BNP Paribas CMG Ltd. - HSBC European Warrants Oct 2002 2002/10/24 2002/10/319258 Macquarie Bank Ltd. - Hutchison European Warrants Oct 2002 2002/10/24 2002/10/319172 ABN AMRO Bank N.V. - New World Dev Euro Wts Oct 2002 2002/10/25 2002/11/019281 Lehman Brothers Holdings Inc. - Ch Mob Euro Put Wts Oct 2002 2002/10/25 2002/11/019094 Credit Lyonnais F P (G) Ltd. - China Unicom Euro Wt Nov 2002 2002/10/28 2002/11/049282 Lehman Brothers Holdings Inc. - HWL European Put Wt Nov 2002 2002/10/28 2002/11/049081 Citibank Aktiengesellschaft - Chi Mob Euro Put Wts Nov 2002 2002/10/29 2002/11/059175 J P Morgan Int’l Der. Ltd. - CNOOC European Wts Nov 2002 2002/10/29 2002/11/059071 Morgan Stanley - CK(H) European Warrants Nov 2002 2002/10/29 2002/11/059079 Citibank Aktiengesellschaft - Cheung Kong Euro Wts Nov 2002 2002/10/30 2002/11/069077 Citibank Aktiengesellschaft - China Mobile Euro Wts Nov 2002 2002/10/30 2002/11/069217 HSBC Investment Bank plc - Esprit European Warrants Nov 2002 2002/10/30 2002/11/069303 Barclays Bank plc - Shanghai Ind European Warrants Nov 2002 2002/10/31 2002/11/079306 KBC Fin Products Int’l Ltd. - Ch Mob Euro Put Wts Nov 2002 2002/10/31 2002/11/079229 ABN AMRO Bank N.V. - HSBC Euro Put Wts Nov 2002 2002/11/01 2002/11/089230 ABN AMRO Bank N.V. - Hutchison European Put Wts Nov 2002 2002/11/01 2002/11/089225 ABN AMRO Bank N.V. - HSBC European Wts Nov 2002 2002/11/04 2002/11/119226 ABN AMRO Bank N.V. - Hutchison European Wts Nov 2002 2002/11/04 2002/11/119183 Macquarie Bank Ltd. - CLP European Wts Nov 2002 2002/11/04 2002/11/119289 J P Morgan Int’l Der. Ltd. - CHALCO European Wts Nov 2002 2002/11/05 2002/11/129180 J P Morgan Int’l Der. Ltd. - Tracker Fund Euro Wts Nov 2002 2002/11/05 2002/11/129313 KBC Fin Products Int’l Ltd. - CITIC Pac European Wt Nov 2002 2002/11/05 2002/11/129309 KBC Fin Products Int’l Ltd. - CK(H) European Wts 11 Nov 2002 2002/11/05 2002/11/129315 KBC Fin Products Int’l Ltd. - HSBC European Wts Nov 2002 2002/11/05 2002/11/129316 KBC Fin Products Int’l Ltd. - PCCW European Wts Nov 2002 2002/11/05 2002/11/129310 KBC Fin Products Int’l Ltd. - SHK Ppt European Wts Nov 2002 2002/11/05 2002/11/129280 Macquarie Bank Ltd. - Ch Mobile European Put Wts Nov 2002 2002/11/06 2002/11/139302 KBC Fin Products Int’l Ltd. - C Mobile European Wts Nov 2002 2002/11/07 2002/11/149267 Macquarie Bank Ltd. - Huaneng European Warrants Nov 2002 2002/11/08 2002/11/159163 Credit Suisse First Boston - HSBC Euro Put Wts Nov 2002 2002/11/12 2002/11/199037 Macquarie Bank Ltd. - CITIC European Wts Nov 2002 2002/11/12 2002/11/199117 Macquarie Bank Ltd. - CP Air European Put Wts Nov 2002 2002/11/12 2002/11/199325 SGA Societe Generale Acceptance N.V. - HSBC Euro Wts Nov 02 2002/11/13 2002/11/209324 SGA Societe Generale Acceptance N.V. - C Mob Euro Wts Nov 02 2002/11/14 2002/11/219035 Macquarie Bank Ltd. - Ch Unicom European Wts Nov 2002 2002/11/18 2002/11/259153 Credit Suisse First Boston - CITIC Pac Euro Wts Nov 2002 2002/11/19 2002/11/269159 Credit Suisse First Boston - HSBC European Wts Nov 2002 2002/11/19 2002/11/269337 KBC Fin Products Int’l Ltd. - CK(H) European Wts 25 Nov 2002 2002/11/19 2002/11/269189 Macquarie Bank Ltd. - Tracker European Put Wts Nov 2002 2002/11/19 2002/11/269190 Macquarie Bank Ltd. - Wharf European Wts Nov 2002 2002/11/19 2002/11/269311 SGA Societe Generale Acceptance N.V. -C Mob Eu Put Wt Nov 02 2002/11/19 2002/11/269343 Credit Lyonnais F P (G) Ltd. - Cheung Kong Euro Wts Nov 2002 2002/11/20 2002/11/279342 KBC Fin Products Int’l Ltd. - HSBC European Put Wts Nov 2002 2002/11/20 2002/11/279300 Credit Suisse First Boston - COSCO Pac European Wts Nov 2002 2002/11/22 2002/11/299132 Credit Suisse First Boston - PCCW European Wts Nov 2002 2002/11/22 2002/11/299314 KBC Fin Products Int’l Ltd. - HSI European Put Wts Nov 2002 2002/11/22 2002/11/299328 KBC Fin Products Int’l Ltd. - HSI European Warrants Nov 2002 2002/11/22 2002/11/299259 Macquarie Bank Ltd. - SHK Ppt European Warrants Nov 2002 2002/11/22 2002/11/299292 SGA Societe Generale Acceptance N.V.-USD/JPY Eu Put Wt Nov02 2002/11/22 2002/11/299349 BNP Paribas CMG Ltd. - China Mobile European Wts Nov 2002 2002/11/25 2002/12/029350 BNP Paribas CMG Ltd. - HSBC European Warrants Nov 2002 2002/11/25 2002/12/02
List of expired derivative warrants (2002) (continued)Last Delisted
Code Warrant trading date date
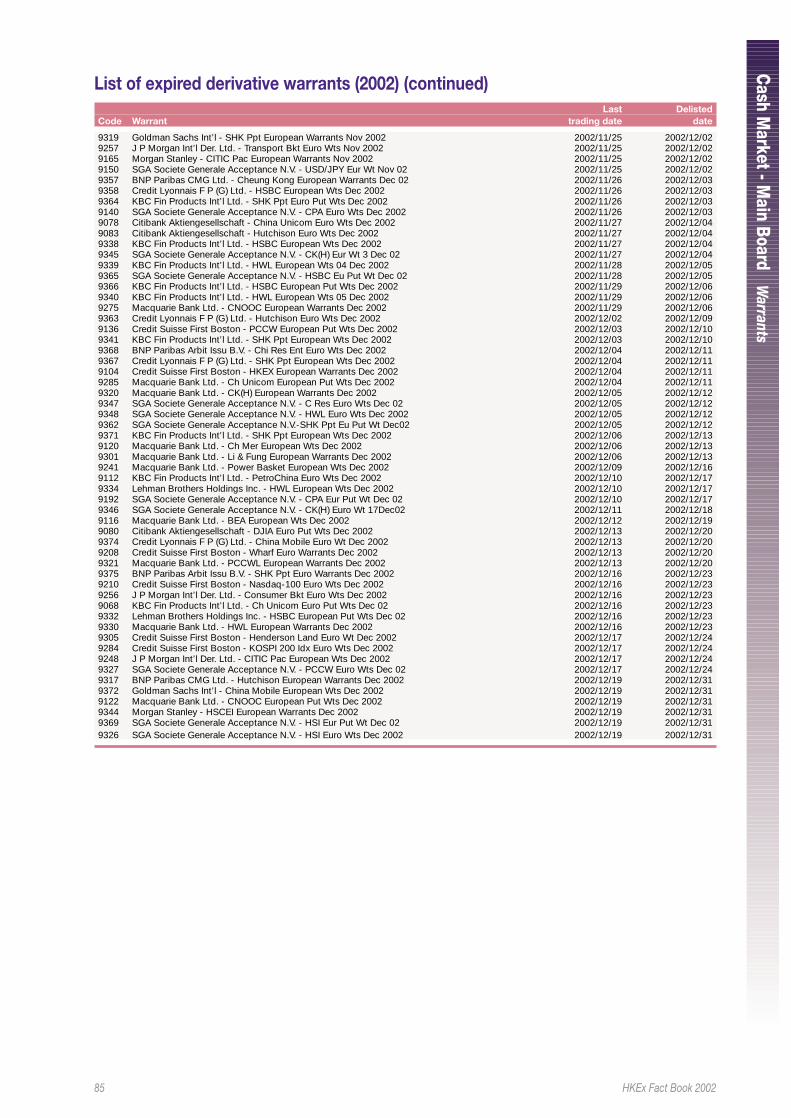
85 HKEx Fact Book 2002
Cash M
arket - Main Boar d
Warrants
9319 Goldman Sachs Int’l - SHK Ppt European Warrants Nov 2002 2002/11/25 2002/12/029257 J P Morgan Int’l Der. Ltd. - Transport Bkt Euro Wts Nov 2002 2002/11/25 2002/12/029165 Morgan Stanley - CITIC Pac European Warrants Nov 2002 2002/11/25 2002/12/029150 SGA Societe Generale Acceptance N.V. - USD/JPY Eur Wt Nov 02 2002/11/25 2002/12/029357 BNP Paribas CMG Ltd. - Cheung Kong European Warrants Dec 02 2002/11/26 2002/12/039358 Credit Lyonnais F P (G) Ltd. - HSBC European Wts Dec 2002 2002/11/26 2002/12/039364 KBC Fin Products Int’l Ltd. - SHK Ppt Euro Put Wts Dec 2002 2002/11/26 2002/12/039140 SGA Societe Generale Acceptance N.V. - CPA Euro Wts Dec 2002 2002/11/26 2002/12/039078 Citibank Aktiengesellschaft - China Unicom Euro Wts Dec 2002 2002/11/27 2002/12/049083 Citibank Aktiengesellschaft - Hutchison Euro Wts Dec 2002 2002/11/27 2002/12/049338 KBC Fin Products Int’l Ltd. - HSBC European Wts Dec 2002 2002/11/27 2002/12/049345 SGA Societe Generale Acceptance N.V. - CK(H) Eur Wt 3 Dec 02 2002/11/27 2002/12/049339 KBC Fin Products Int’l Ltd. - HWL European Wts 04 Dec 2002 2002/11/28 2002/12/059365 SGA Societe Generale Acceptance N.V. - HSBC Eu Put Wt Dec 02 2002/11/28 2002/12/059366 KBC Fin Products Int’l Ltd. - HSBC European Put Wts Dec 2002 2002/11/29 2002/12/069340 KBC Fin Products Int’l Ltd. - HWL European Wts 05 Dec 2002 2002/11/29 2002/12/069275 Macquarie Bank Ltd. - CNOOC European Warrants Dec 2002 2002/11/29 2002/12/069363 Credit Lyonnais F P (G) Ltd. - Hutchison Euro Wts Dec 2002 2002/12/02 2002/12/099136 Credit Suisse First Boston - PCCW European Put Wts Dec 2002 2002/12/03 2002/12/109341 KBC Fin Products Int’l Ltd. - SHK Ppt European Wts Dec 2002 2002/12/03 2002/12/109368 BNP Paribas Arbit Issu B.V. - Chi Res Ent Euro Wts Dec 2002 2002/12/04 2002/12/119367 Credit Lyonnais F P (G) Ltd. - SHK Ppt European Wts Dec 2002 2002/12/04 2002/12/119104 Credit Suisse First Boston - HKEX European Warrants Dec 2002 2002/12/04 2002/12/119285 Macquarie Bank Ltd. - Ch Unicom European Put Wts Dec 2002 2002/12/04 2002/12/119320 Macquarie Bank Ltd. - CK(H) European Warrants Dec 2002 2002/12/05 2002/12/129347 SGA Societe Generale Acceptance N.V. - C Res Euro Wts Dec 02 2002/12/05 2002/12/129348 SGA Societe Generale Acceptance N.V. - HWL Euro Wts Dec 2002 2002/12/05 2002/12/129362 SGA Societe Generale Acceptance N.V.-SHK Ppt Eu Put Wt Dec02 2002/12/05 2002/12/129371 KBC Fin Products Int’l Ltd. - SHK Ppt European Wts Dec 2002 2002/12/06 2002/12/139120 Macquarie Bank Ltd. - Ch Mer European Wts Dec 2002 2002/12/06 2002/12/139301 Macquarie Bank Ltd. - Li & Fung European Warrants Dec 2002 2002/12/06 2002/12/139241 Macquarie Bank Ltd. - Power Basket European Wts Dec 2002 2002/12/09 2002/12/169112 KBC Fin Products Int’l Ltd. - PetroChina Euro Wts Dec 2002 2002/12/10 2002/12/179334 Lehman Brothers Holdings Inc. - HWL European Wts Dec 2002 2002/12/10 2002/12/179192 SGA Societe Generale Acceptance N.V. - CPA Eur Put Wt Dec 02 2002/12/10 2002/12/179346 SGA Societe Generale Acceptance N.V. - CK(H) Euro Wt 17Dec02 2002/12/11 2002/12/189116 Macquarie Bank Ltd. - BEA European Wts Dec 2002 2002/12/12 2002/12/199080 Citibank Aktiengesellschaft - DJIA Euro Put Wts Dec 2002 2002/12/13 2002/12/209374 Credit Lyonnais F P (G) Ltd. - China Mobile Euro Wt Dec 2002 2002/12/13 2002/12/209208 Credit Suisse First Boston - Wharf Euro Warrants Dec 2002 2002/12/13 2002/12/209321 Macquarie Bank Ltd. - PCCWL European Warrants Dec 2002 2002/12/13 2002/12/209375 BNP Paribas Arbit Issu B.V. - SHK Ppt Euro Warrants Dec 2002 2002/12/16 2002/12/239210 Credit Suisse First Boston - Nasdaq-100 Euro Wts Dec 2002 2002/12/16 2002/12/239256 J P Morgan Int’l Der. Ltd. - Consumer Bkt Euro Wts Dec 2002 2002/12/16 2002/12/239068 KBC Fin Products Int’l Ltd. - Ch Unicom Euro Put Wts Dec 02 2002/12/16 2002/12/239332 Lehman Brothers Holdings Inc. - HSBC European Put Wts Dec 02 2002/12/16 2002/12/239330 Macquarie Bank Ltd. - HWL European Warrants Dec 2002 2002/12/16 2002/12/239305 Credit Suisse First Boston - Henderson Land Euro Wt Dec 2002 2002/12/17 2002/12/249284 Credit Suisse First Boston - KOSPI 200 Idx Euro Wts Dec 2002 2002/12/17 2002/12/249248 J P Morgan Int’l Der. Ltd. - CITIC Pac European Wts Dec 2002 2002/12/17 2002/12/249327 SGA Societe Generale Acceptance N.V. - PCCW Euro Wts Dec 02 2002/12/17 2002/12/249317 BNP Paribas CMG Ltd. - Hutchison European Warrants Dec 2002 2002/12/19 2002/12/319372 Goldman Sachs Int’l - China Mobile European Wts Dec 2002 2002/12/19 2002/12/319122 Macquarie Bank Ltd. - CNOOC European Put Wts Dec 2002 2002/12/19 2002/12/319344 Morgan Stanley - HSCEI European Warrants Dec 2002 2002/12/19 2002/12/319369 SGA Societe Generale Acceptance N.V. - HSI Eur Put Wt Dec 02 2002/12/19 2002/12/319326 SGA Societe Generale Acceptance N.V. - HSI Euro Wts Dec 2002 2002/12/19 2002/12/31
List of expired derivative warrants (2002) (continued)Last Delisted
Code Warrant trading date date
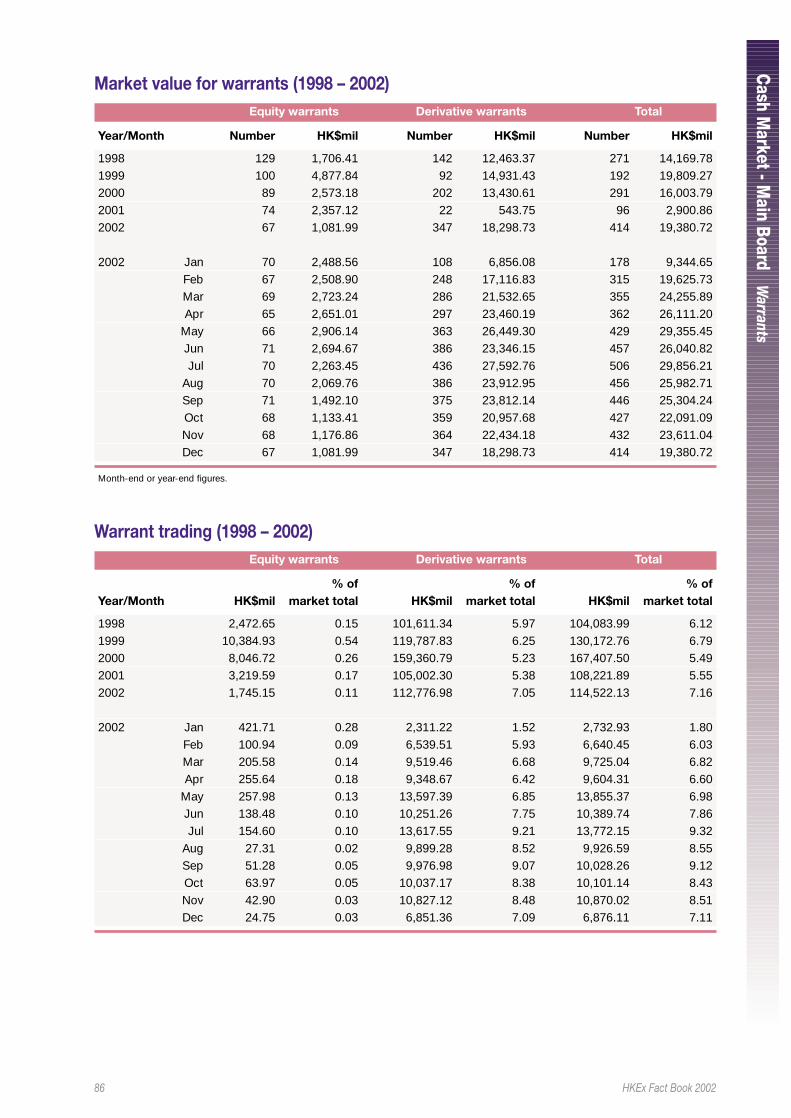
86 HKEx Fact Book 2002
Cash M
arket - Main Boar d
Warrants
Market value for warrants (1998 – 2002)Equity warrants Derivative warrants Total
Year/Month Number HK$mil Number HK$mil Number HK$mil
1998 129 1,706.41 142 12,463.37 271 14,169.781999 100 4,877.84 92 14,931.43 192 19,809.272000 89 2,573.18 202 13,430.61 291 16,003.792001 74 2,357.12 22 543.75 96 2,900.862002 67 1,081.99 347 18,298.73 414 19,380.72
2002 Jan 70 2,488.56 108 6,856.08 178 9,344.65Feb 67 2,508.90 248 17,116.83 315 19,625.73Mar 69 2,723.24 286 21,532.65 355 24,255.89Apr 65 2,651.01 297 23,460.19 362 26,111.20
May 66 2,906.14 363 26,449.30 429 29,355.45Jun 71 2,694.67 386 23,346.15 457 26,040.82Jul 70 2,263.45 436 27,592.76 506 29,856.21
Aug 70 2,069.76 386 23,912.95 456 25,982.71Sep 71 1,492.10 375 23,812.14 446 25,304.24Oct 68 1,133.41 359 20,957.68 427 22,091.09Nov 68 1,176.86 364 22,434.18 432 23,611.04Dec 67 1,081.99 347 18,298.73 414 19,380.72
Month-end or year-end figures.
Warrant trading (1998 – 2002)Equity warrants Derivative warrants Total
% of % of % ofYear/Month HK$mil market total HK$mil market total HK$mil market total
1998 2,472.65 0.15 101,611.34 5.97 104,083.99 6.121999 10,384.93 0.54 119,787.83 6.25 130,172.76 6.792000 8,046.72 0.26 159,360.79 5.23 167,407.50 5.492001 3,219.59 0.17 105,002.30 5.38 108,221.89 5.552002 1,745.15 0.11 112,776.98 7.05 114,522.13 7.16
2002 Jan 421.71 0.28 2,311.22 1.52 2,732.93 1.80Feb 100.94 0.09 6,539.51 5.93 6,640.45 6.03Mar 205.58 0.14 9,519.46 6.68 9,725.04 6.82Apr 255.64 0.18 9,348.67 6.42 9,604.31 6.60
May 257.98 0.13 13,597.39 6.85 13,855.37 6.98Jun 138.48 0.10 10,251.26 7.75 10,389.74 7.86Jul 154.60 0.10 13,617.55 9.21 13,772.15 9.32
Aug 27.31 0.02 9,899.28 8.52 9,926.59 8.55Sep 51.28 0.05 9,976.98 9.07 10,028.26 9.12Oct 63.97 0.05 10,037.17 8.38 10,101.14 8.43Nov 42.90 0.03 10,827.12 8.48 10,870.02 8.51Dec 24.75 0.03 6,851.36 7.09 6,876.11 7.11
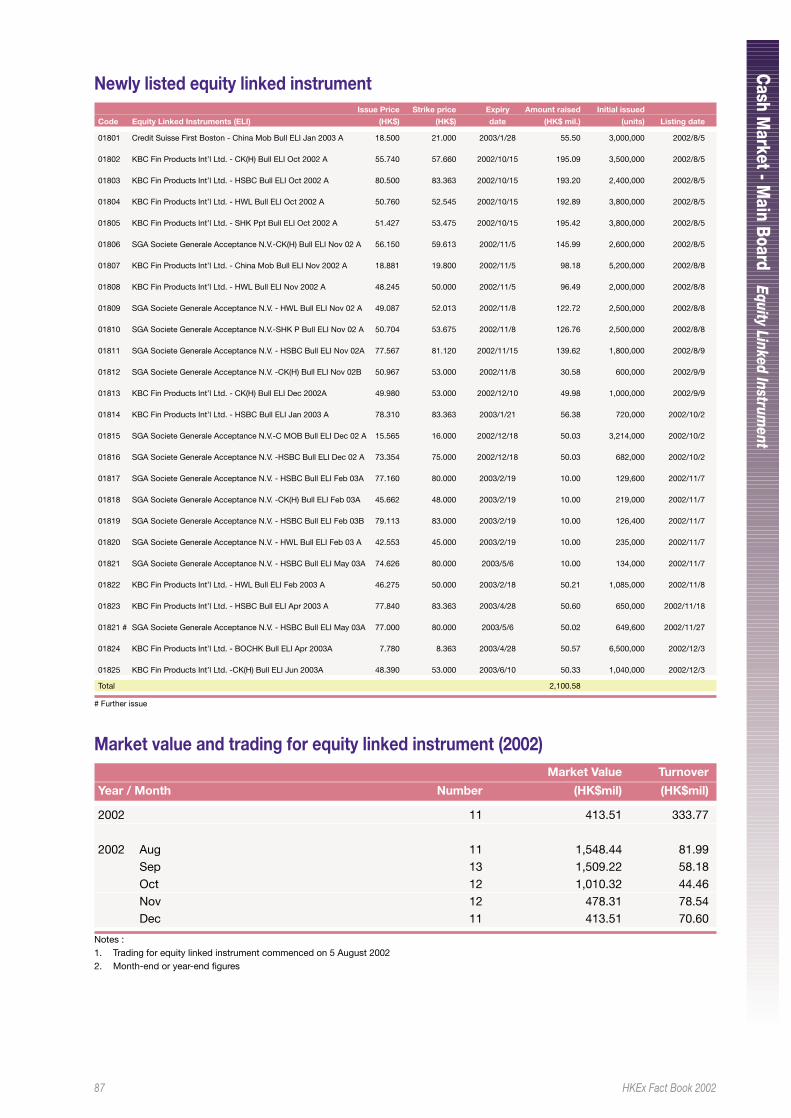
87 HKEx Fact Book 2002
Cash M
arket - Main Boar d
Equity Linked Instrument
Newly listed equity linked instrumentIssue Price Strike price Expiry Amount raised Initial issued
Code Equity Linked Instruments (ELI) (HK$) (HK$) date (HK$ mil.) (units) Listing date
01801 Credit Suisse First Boston - China Mob Bull ELI Jan 2003 A 18.500 21.000 2003/1/28 55.50 3,000,000 2002/8/5
01802 KBC Fin Products Int’l Ltd. - CK(H) Bull ELI Oct 2002 A 55.740 57.660 2002/10/15 195.09 3,500,000 2002/8/5
01803 KBC Fin Products Int’l Ltd. - HSBC Bull ELI Oct 2002 A 80.500 83.363 2002/10/15 193.20 2,400,000 2002/8/5
01804 KBC Fin Products Int’l Ltd. - HWL Bull ELI Oct 2002 A 50.760 52.545 2002/10/15 192.89 3,800,000 2002/8/5
01805 KBC Fin Products Int’l Ltd. - SHK Ppt Bull ELI Oct 2002 A 51.427 53.475 2002/10/15 195.42 3,800,000 2002/8/5
01806 SGA Societe Generale Acceptance N.V.-CK(H) Bull ELI Nov 02 A 56.150 59.613 2002/11/5 145.99 2,600,000 2002/8/5
01807 KBC Fin Products Int’l Ltd. - China Mob Bull ELI Nov 2002 A 18.881 19.800 2002/11/5 98.18 5,200,000 2002/8/8
01808 KBC Fin Products Int’l Ltd. - HWL Bull ELI Nov 2002 A 48.245 50.000 2002/11/5 96.49 2,000,000 2002/8/8
01809 SGA Societe Generale Acceptance N.V. - HWL Bull ELI Nov 02 A 49.087 52.013 2002/11/8 122.72 2,500,000 2002/8/8
01810 SGA Societe Generale Acceptance N.V.-SHK P Bull ELI Nov 02 A 50.704 53.675 2002/11/8 126.76 2,500,000 2002/8/8
01811 SGA Societe Generale Acceptance N.V. - HSBC Bull ELI Nov 02A 77.567 81.120 2002/11/15 139.62 1,800,000 2002/8/9
01812 SGA Societe Generale Acceptance N.V. -CK(H) Bull ELI Nov 02B 50.967 53.000 2002/11/8 30.58 600,000 2002/9/9
01813 KBC Fin Products Int’l Ltd. - CK(H) Bull ELI Dec 2002A 49.980 53.000 2002/12/10 49.98 1,000,000 2002/9/9
01814 KBC Fin Products Int’l Ltd. - HSBC Bull ELI Jan 2003 A 78.310 83.363 2003/1/21 56.38 720,000 2002/10/2
01815 SGA Societe Generale Acceptance N.V.-C MOB Bull ELI Dec 02 A 15.565 16.000 2002/12/18 50.03 3,214,000 2002/10/2
01816 SGA Societe Generale Acceptance N.V. -HSBC Bull ELI Dec 02 A 73.354 75.000 2002/12/18 50.03 682,000 2002/10/2
01817 SGA Societe Generale Acceptance N.V. - HSBC Bull ELI Feb 03A 77.160 80.000 2003/2/19 10.00 129,600 2002/11/7
01818 SGA Societe Generale Acceptance N.V. -CK(H) Bull ELI Feb 03A 45.662 48.000 2003/2/19 10.00 219,000 2002/11/7
01819 SGA Societe Generale Acceptance N.V. - HSBC Bull ELI Feb 03B 79.113 83.000 2003/2/19 10.00 126,400 2002/11/7
01820 SGA Societe Generale Acceptance N.V. - HWL Bull ELI Feb 03 A 42.553 45.000 2003/2/19 10.00 235,000 2002/11/7
01821 SGA Societe Generale Acceptance N.V. - HSBC Bull ELI May 03A 74.626 80.000 2003/5/6 10.00 134,000 2002/11/7
01822 KBC Fin Products Int’l Ltd. - HWL Bull ELI Feb 2003 A 46.275 50.000 2003/2/18 50.21 1,085,000 2002/11/8
01823 KBC Fin Products Int’l Ltd. - HSBC Bull ELI Apr 2003 A 77.840 83.363 2003/4/28 50.60 650,000 2002/11/18
01821 # SGA Societe Generale Acceptance N.V. - HSBC Bull ELI May 03A 77.000 80.000 2003/5/6 50.02 649,600 2002/11/27
01824 KBC Fin Products Int’l Ltd. - BOCHK Bull ELI Apr 2003A 7.780 8.363 2003/4/28 50.57 6,500,000 2002/12/3
01825 KBC Fin Products Int’l Ltd. -CK(H) Bull ELI Jun 2003A 48.390 53.000 2003/6/10 50.33 1,040,000 2002/12/3
Total 2,100.58
# Further issue
Market value and trading for equity linked instrument (2002)Market Value Turnover
Year / Month Number (HK$mil) (HK$mil)
2002 11 413.51 333.77
2002 Aug 11 1,548.44 81.99Sep 13 1,509.22 58.18Oct 12 1,010.32 44.46Nov 12 478.31 78.54Dec 11 413.51 70.60
Notes :1. Trading for equity linked instrument commenced on 5 August 20022. Month-end or year-end figures
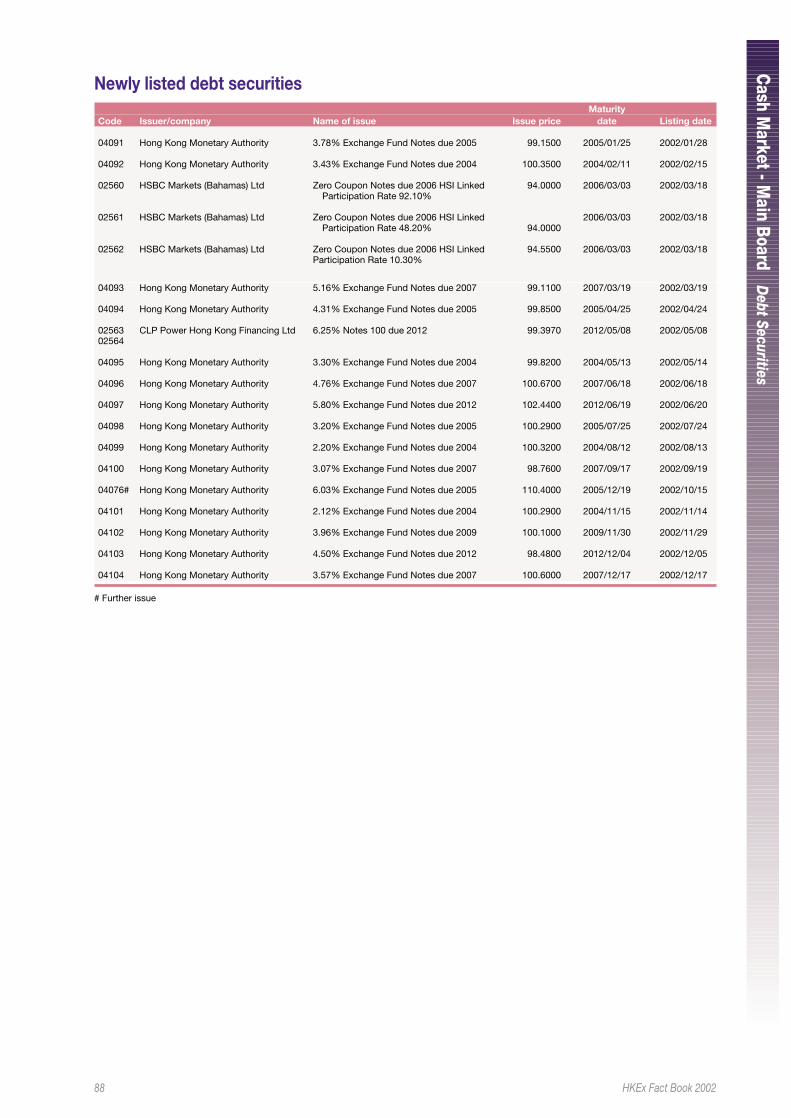
88 HKEx Fact Book 2002
Cash M
arket - Main Boar d
Debt Securities
Newly listed debt securitiesMaturity
Code Issuer/company Name of issue Issue price date Listing date
04091 Hong Kong Monetary Authority 3.78% Exchange Fund Notes due 2005 99.1500 2005/01/25 2002/01/28
04092 Hong Kong Monetary Authority 3.43% Exchange Fund Notes due 2004 100.3500 2004/02/11 2002/02/15
02560 HSBC Markets (Bahamas) Ltd Zero Coupon Notes due 2006 HSI Linked 94.0000 2006/03/03 2002/03/18Participation Rate 92.10%
02561 HSBC Markets (Bahamas) Ltd Zero Coupon Notes due 2006 HSI Linked 2006/03/03 2002/03/18Participation Rate 48.20% 94.0000
02562 HSBC Markets (Bahamas) Ltd Zero Coupon Notes due 2006 HSI Linked 94.5500 2006/03/03 2002/03/18Participation Rate 10.30%
04093 Hong Kong Monetary Authority 5.16% Exchange Fund Notes due 2007 99.1100 2007/03/19 2002/03/19
04094 Hong Kong Monetary Authority 4.31% Exchange Fund Notes due 2005 99.8500 2005/04/25 2002/04/24
02563 CLP Power Hong Kong Financing Ltd 6.25% Notes 100 due 2012 99.3970 2012/05/08 2002/05/0802564
04095 Hong Kong Monetary Authority 3.30% Exchange Fund Notes due 2004 99.8200 2004/05/13 2002/05/14
04096 Hong Kong Monetary Authority 4.76% Exchange Fund Notes due 2007 100.6700 2007/06/18 2002/06/18
04097 Hong Kong Monetary Authority 5.80% Exchange Fund Notes due 2012 102.4400 2012/06/19 2002/06/20
04098 Hong Kong Monetary Authority 3.20% Exchange Fund Notes due 2005 100.2900 2005/07/25 2002/07/24
04099 Hong Kong Monetary Authority 2.20% Exchange Fund Notes due 2004 100.3200 2004/08/12 2002/08/13
04100 Hong Kong Monetary Authority 3.07% Exchange Fund Notes due 2007 98.7600 2007/09/17 2002/09/19
04076# Hong Kong Monetary Authority 6.03% Exchange Fund Notes due 2005 110.4000 2005/12/19 2002/10/15
04101 Hong Kong Monetary Authority 2.12% Exchange Fund Notes due 2004 100.2900 2004/11/15 2002/11/14
04102 Hong Kong Monetary Authority 3.96% Exchange Fund Notes due 2009 100.1000 2009/11/30 2002/11/29
04103 Hong Kong Monetary Authority 4.50% Exchange Fund Notes due 2012 98.4800 2012/12/04 2002/12/05
04104 Hong Kong Monetary Authority 3.57% Exchange Fund Notes due 2007 100.6000 2007/12/17 2002/12/17
# Further issue
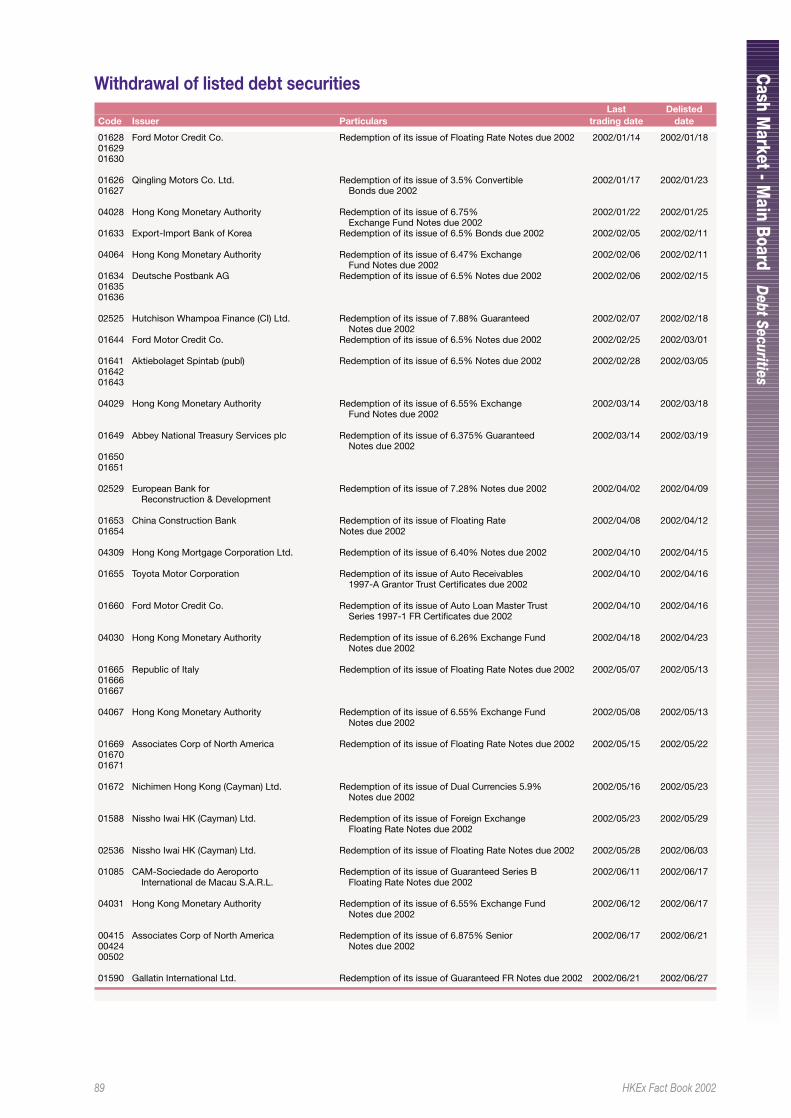
89 HKEx Fact Book 2002
Cash M
arket - Main Boar d
Debt Securities
Withdrawal of listed debt securitiesLast Delisted
Code Issuer Particulars trading date date
01628 Ford Motor Credit Co. Redemption of its issue of Floating Rate Notes due 2002 2002/01/14 2002/01/180162901630
01626 Qingling Motors Co. Ltd. Redemption of its issue of 3.5% Convertible 2002/01/17 2002/01/2301627 Bonds due 2002
04028 Hong Kong Monetary Authority Redemption of its issue of 6.75% 2002/01/22 2002/01/25Exchange Fund Notes due 2002
01633 Export-Import Bank of Korea Redemption of its issue of 6.5% Bonds due 2002 2002/02/05 2002/02/11
04064 Hong Kong Monetary Authority Redemption of its issue of 6.47% Exchange 2002/02/06 2002/02/11Fund Notes due 2002
01634 Deutsche Postbank AG Redemption of its issue of 6.5% Notes due 2002 2002/02/06 2002/02/150163501636
02525 Hutchison Whampoa Finance (CI) Ltd. Redemption of its issue of 7.88% Guaranteed 2002/02/07 2002/02/18Notes due 2002
01644 Ford Motor Credit Co. Redemption of its issue of 6.5% Notes due 2002 2002/02/25 2002/03/01
01641 Aktiebolaget Spintab (publ) Redemption of its issue of 6.5% Notes due 2002 2002/02/28 2002/03/050164201643
04029 Hong Kong Monetary Authority Redemption of its issue of 6.55% Exchange 2002/03/14 2002/03/18Fund Notes due 2002
01649 Abbey National Treasury Services plc Redemption of its issue of 6.375% Guaranteed 2002/03/14 2002/03/19Notes due 2002
0165001651
02529 European Bank for Redemption of its issue of 7.28% Notes due 2002 2002/04/02 2002/04/09Reconstruction & Development
01653 China Construction Bank Redemption of its issue of Floating Rate 2002/04/08 2002/04/1201654 Notes due 2002
04309 Hong Kong Mortgage Corporation Ltd. Redemption of its issue of 6.40% Notes due 2002 2002/04/10 2002/04/15
01655 Toyota Motor Corporation Redemption of its issue of Auto Receivables 2002/04/10 2002/04/161997-A Grantor Trust Certificates due 2002
01660 Ford Motor Credit Co. Redemption of its issue of Auto Loan Master Trust 2002/04/10 2002/04/16Series 1997-1 FR Certificates due 2002
04030 Hong Kong Monetary Authority Redemption of its issue of 6.26% Exchange Fund 2002/04/18 2002/04/23Notes due 2002
01665 Republic of Italy Redemption of its issue of Floating Rate Notes due 2002 2002/05/07 2002/05/130166601667
04067 Hong Kong Monetary Authority Redemption of its issue of 6.55% Exchange Fund 2002/05/08 2002/05/13Notes due 2002
01669 Associates Corp of North America Redemption of its issue of Floating Rate Notes due 2002 2002/05/15 2002/05/220167001671
01672 Nichimen Hong Kong (Cayman) Ltd. Redemption of its issue of Dual Currencies 5.9% 2002/05/16 2002/05/23Notes due 2002
01588 Nissho Iwai HK (Cayman) Ltd. Redemption of its issue of Foreign Exchange 2002/05/23 2002/05/29Floating Rate Notes due 2002
02536 Nissho Iwai HK (Cayman) Ltd. Redemption of its issue of Floating Rate Notes due 2002 2002/05/28 2002/06/03
01085 CAM-Sociedade do Aeroporto Redemption of its issue of Guaranteed Series B 2002/06/11 2002/06/17International de Macau S.A.R.L. Floating Rate Notes due 2002
04031 Hong Kong Monetary Authority Redemption of its issue of 6.55% Exchange Fund 2002/06/12 2002/06/17Notes due 2002
00415 Associates Corp of North America Redemption of its issue of 6.875% Senior 2002/06/17 2002/06/2100424 Notes due 200200502
01590 Gallatin International Ltd. Redemption of its issue of Guaranteed FR Notes due 2002 2002/06/21 2002/06/27
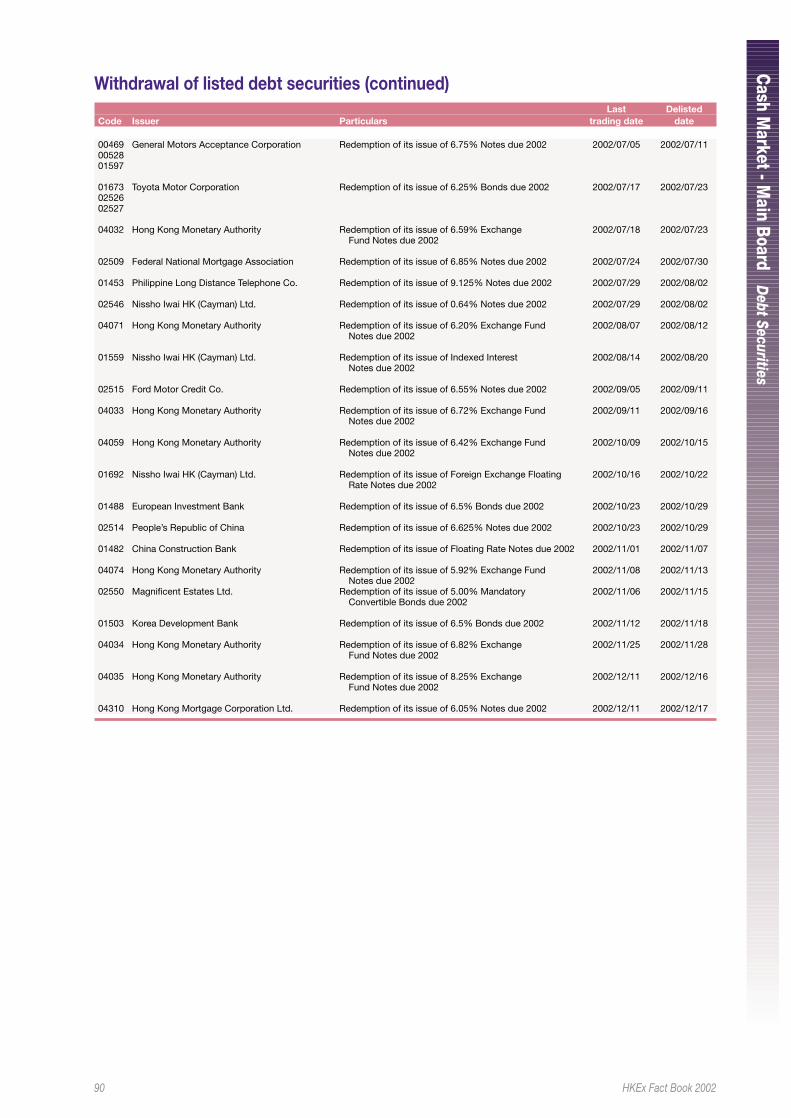
90 HKEx Fact Book 2002
Cash M
arket - Main Boar d
Debt Securities
Withdrawal of listed debt securities (continued)Last Delisted
Code Issuer Particulars trading date date
00469 General Motors Acceptance Corporation Redemption of its issue of 6.75% Notes due 2002 2002/07/05 2002/07/110052801597
01673 Toyota Motor Corporation Redemption of its issue of 6.25% Bonds due 2002 2002/07/17 2002/07/230252602527
04032 Hong Kong Monetary Authority Redemption of its issue of 6.59% Exchange 2002/07/18 2002/07/23Fund Notes due 2002
02509 Federal National Mortgage Association Redemption of its issue of 6.85% Notes due 2002 2002/07/24 2002/07/30
01453 Philippine Long Distance Telephone Co. Redemption of its issue of 9.125% Notes due 2002 2002/07/29 2002/08/02
02546 Nissho Iwai HK (Cayman) Ltd. Redemption of its issue of 0.64% Notes due 2002 2002/07/29 2002/08/02
04071 Hong Kong Monetary Authority Redemption of its issue of 6.20% Exchange Fund 2002/08/07 2002/08/12Notes due 2002
01559 Nissho Iwai HK (Cayman) Ltd. Redemption of its issue of Indexed Interest 2002/08/14 2002/08/20Notes due 2002
02515 Ford Motor Credit Co. Redemption of its issue of 6.55% Notes due 2002 2002/09/05 2002/09/11
04033 Hong Kong Monetary Authority Redemption of its issue of 6.72% Exchange Fund 2002/09/11 2002/09/16Notes due 2002
04059 Hong Kong Monetary Authority Redemption of its issue of 6.42% Exchange Fund 2002/10/09 2002/10/15Notes due 2002
01692 Nissho Iwai HK (Cayman) Ltd. Redemption of its issue of Foreign Exchange Floating 2002/10/16 2002/10/22Rate Notes due 2002
01488 European Investment Bank Redemption of its issue of 6.5% Bonds due 2002 2002/10/23 2002/10/29
02514 People’s Republic of China Redemption of its issue of 6.625% Notes due 2002 2002/10/23 2002/10/29
01482 China Construction Bank Redemption of its issue of Floating Rate Notes due 2002 2002/11/01 2002/11/07
04074 Hong Kong Monetary Authority Redemption of its issue of 5.92% Exchange Fund 2002/11/08 2002/11/13Notes due 2002
02550 Magnificent Estates Ltd. Redemption of its issue of 5.00% Mandatory 2002/11/06 2002/11/15Convertible Bonds due 2002
01503 Korea Development Bank Redemption of its issue of 6.5% Bonds due 2002 2002/11/12 2002/11/18
04034 Hong Kong Monetary Authority Redemption of its issue of 6.82% Exchange 2002/11/25 2002/11/28Fund Notes due 2002
04035 Hong Kong Monetary Authority Redemption of its issue of 8.25% Exchange 2002/12/11 2002/12/16Fund Notes due 2002
04310 Hong Kong Mortgage Corporation Ltd. Redemption of its issue of 6.05% Notes due 2002 2002/12/11 2002/12/17
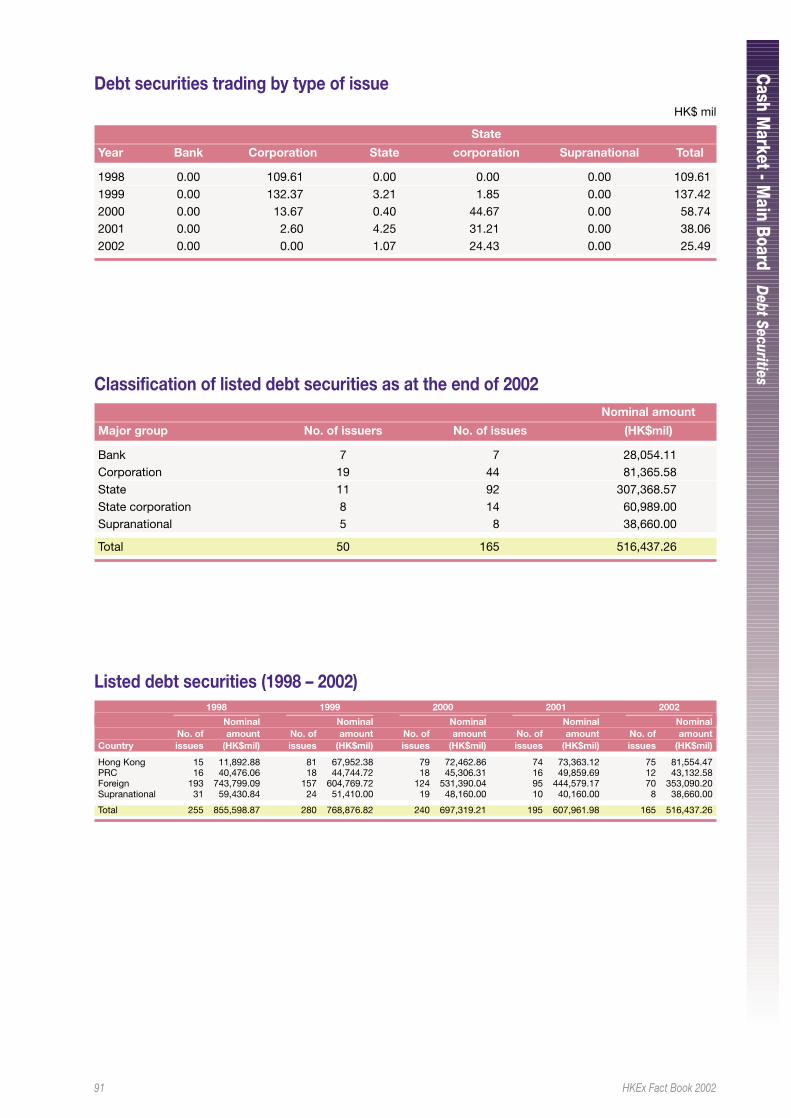
91 HKEx Fact Book 2002
Cash M
arket - Main Boar d
Debt Securities
Debt securities trading by type of issueHK$ mil
State
Year Bank Corporation State corporation Supranational Total
1998 0.00 109.61 0.00 0.00 0.00 109.611999 0.00 132.37 3.21 1.85 0.00 137.422000 0.00 13.67 0.40 44.67 0.00 58.742001 0.00 2.60 4.25 31.21 0.00 38.062002 0.00 0.00 1.07 24.43 0.00 25.49
Classification of listed debt securities as at the end of 2002Nominal amount
Major group No. of issuers No. of issues (HK$mil)
Bank 7 7 28,054.11Corporation 19 44 81,365.58State 11 92 307,368.57State corporation 8 14 60,989.00Supranational 5 8 38,660.00
Total 50 165 516,437.26
Listed debt securities (1998 – 2002)1998 1999 2000 2001 2002
Nominal Nominal Nominal Nominal NominalNo. of amount No. of amount No. of amount No. of amount No. of amount
Country issues (HK$mil) issues (HK$mil) issues (HK$mil) issues (HK$mil) issues (HK$mil)
Hong Kong 15 11,892.88 81 67,952.38 79 72,462.86 74 73,363.12 75 81,554.47PRC 16 40,476.06 18 44,744.72 18 45,306.31 16 49,859.69 12 43,132.58Foreign 193 743,799.09 157 604,769.72 124 531,390.04 95 444,579.17 70 353,090.20Supranational 31 59,430.84 24 51,410.00 19 48,160.00 10 40,160.00 8 38,660.00
Total 255 855,598.87 280 768,876.82 240 697,319.21 195 607,961.98 165 516,437.26
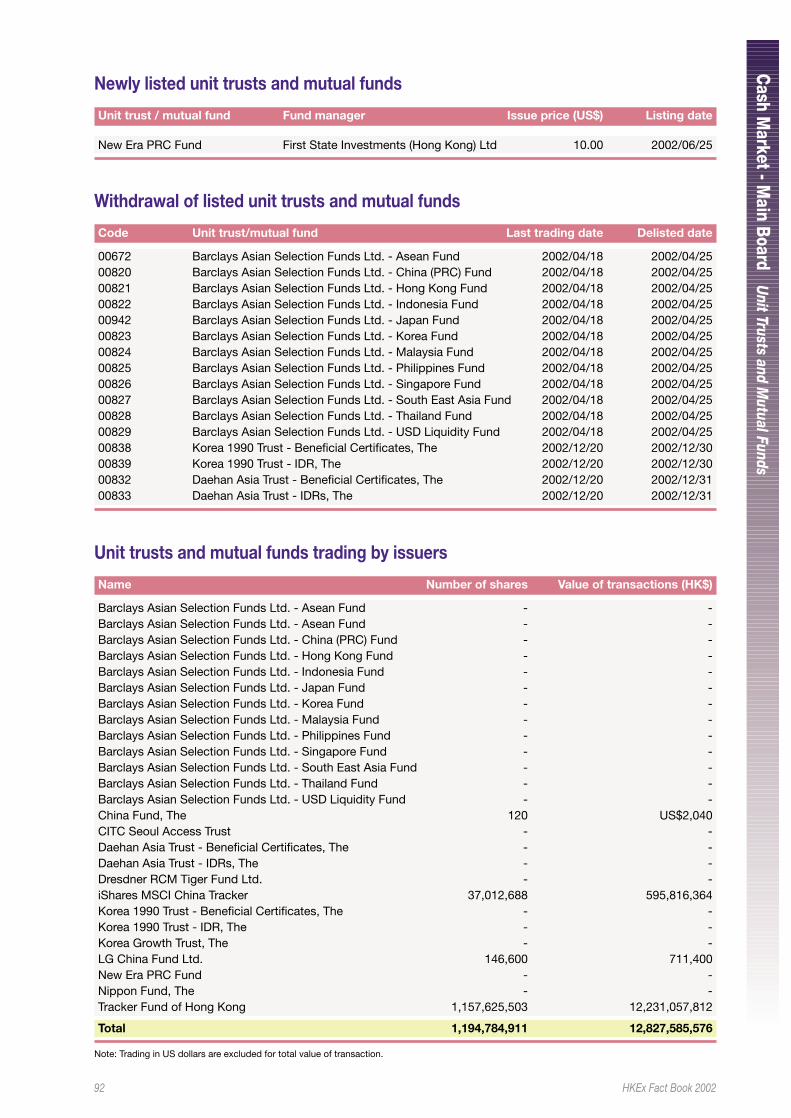
92 HKEx Fact Book 2002
Cash M
arket - Main Boar d
Unit Trusts and M
utual Funds
Newly listed unit trusts and mutual funds
Unit trust / mutual fund Fund manager Issue price (US$) Listing date
New Era PRC Fund First State Investments (Hong Kong) Ltd 10.00 2002/06/25
Withdrawal of listed unit trusts and mutual funds
Code Unit trust/mutual fund Last trading date Delisted date
00672 Barclays Asian Selection Funds Ltd. - Asean Fund 2002/04/18 2002/04/2500820 Barclays Asian Selection Funds Ltd. - China (PRC) Fund 2002/04/18 2002/04/2500821 Barclays Asian Selection Funds Ltd. - Hong Kong Fund 2002/04/18 2002/04/2500822 Barclays Asian Selection Funds Ltd. - Indonesia Fund 2002/04/18 2002/04/2500942 Barclays Asian Selection Funds Ltd. - Japan Fund 2002/04/18 2002/04/2500823 Barclays Asian Selection Funds Ltd. - Korea Fund 2002/04/18 2002/04/2500824 Barclays Asian Selection Funds Ltd. - Malaysia Fund 2002/04/18 2002/04/2500825 Barclays Asian Selection Funds Ltd. - Philippines Fund 2002/04/18 2002/04/2500826 Barclays Asian Selection Funds Ltd. - Singapore Fund 2002/04/18 2002/04/2500827 Barclays Asian Selection Funds Ltd. - South East Asia Fund 2002/04/18 2002/04/2500828 Barclays Asian Selection Funds Ltd. - Thailand Fund 2002/04/18 2002/04/2500829 Barclays Asian Selection Funds Ltd. - USD Liquidity Fund 2002/04/18 2002/04/2500838 Korea 1990 Trust - Beneficial Certificates, The 2002/12/20 2002/12/3000839 Korea 1990 Trust - IDR, The 2002/12/20 2002/12/3000832 Daehan Asia Trust - Beneficial Certificates, The 2002/12/20 2002/12/3100833 Daehan Asia Trust - IDRs, The 2002/12/20 2002/12/31
Unit trusts and mutual funds trading by issuers
Name Number of shares Value of transactions (HK$)
Barclays Asian Selection Funds Ltd. - Asean Fund - -Barclays Asian Selection Funds Ltd. - Asean Fund - -Barclays Asian Selection Funds Ltd. - China (PRC) Fund - -Barclays Asian Selection Funds Ltd. - Hong Kong Fund - -Barclays Asian Selection Funds Ltd. - Indonesia Fund - -Barclays Asian Selection Funds Ltd. - Japan Fund - -Barclays Asian Selection Funds Ltd. - Korea Fund - -Barclays Asian Selection Funds Ltd. - Malaysia Fund - -Barclays Asian Selection Funds Ltd. - Philippines Fund - -Barclays Asian Selection Funds Ltd. - Singapore Fund - -Barclays Asian Selection Funds Ltd. - South East Asia Fund - -Barclays Asian Selection Funds Ltd. - Thailand Fund - -Barclays Asian Selection Funds Ltd. - USD Liquidity Fund - -China Fund, The 120 US$2,040CITC Seoul Access Trust - -Daehan Asia Trust - Beneficial Certificates, The - -Daehan Asia Trust - IDRs, The - -Dresdner RCM Tiger Fund Ltd. - -iShares MSCI China Tracker 37,012,688 595,816,364Korea 1990 Trust - Beneficial Certificates, The - -Korea 1990 Trust - IDR, The - -Korea Growth Trust, The - -LG China Fund Ltd. 146,600 711,400New Era PRC Fund - -Nippon Fund, The - -Tracker Fund of Hong Kong 1,157,625,503 12,231,057,812
Total 1,194,784,911 12,827,585,576
Note: Trading in US dollars are excluded for total value of transaction.
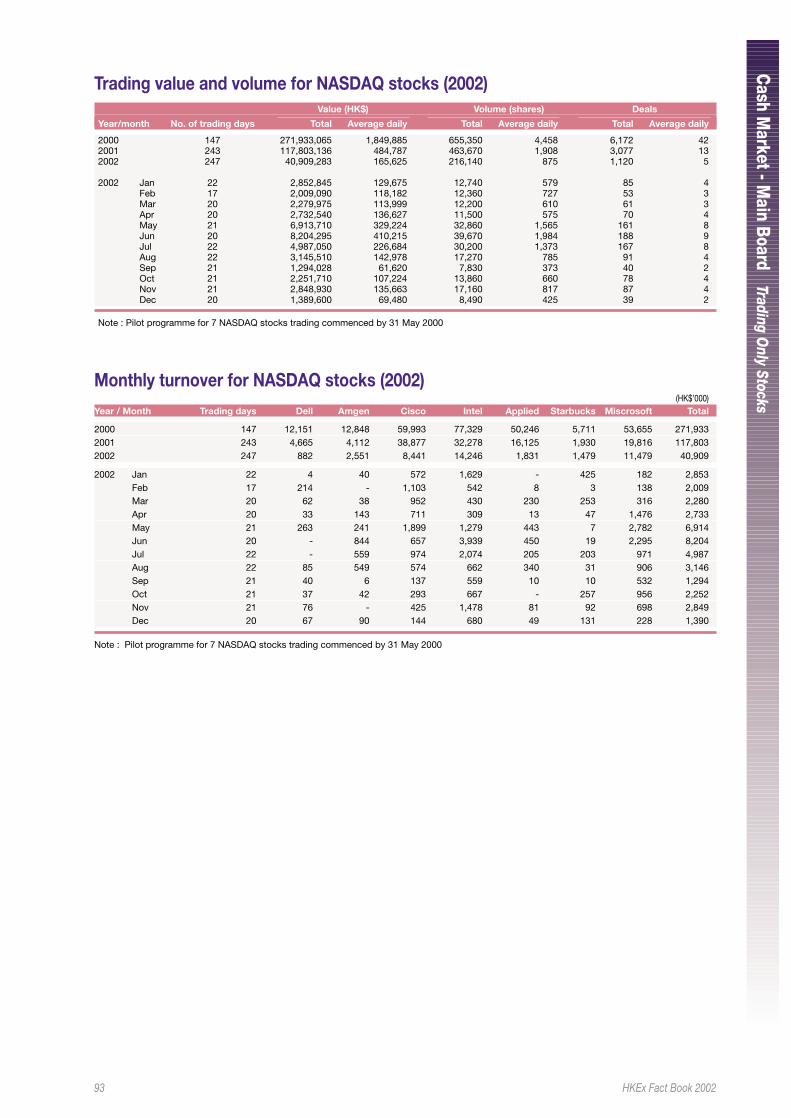
93 HKEx Fact Book 2002
Cash M
arket - Main Boar d
Trading Only Stocks
Trading value and volume for NASDAQ stocks (2002)Value (HK$) Volume (shares) Deals
Year/month No. of trading days Total Average daily Total Average daily Total Average daily
2000 147 271,933,065 1,849,885 655,350 4,458 6,172 422001 243 117,803,136 484,787 463,670 1,908 3,077 132002 247 40,909,283 165,625 216,140 875 1,120 5
2002 Jan 22 2,852,845 129,675 12,740 579 85 4Feb 17 2,009,090 118,182 12,360 727 53 3Mar 20 2,279,975 113,999 12,200 610 61 3Apr 20 2,732,540 136,627 11,500 575 70 4May 21 6,913,710 329,224 32,860 1,565 161 8Jun 20 8,204,295 410,215 39,670 1,984 188 9Jul 22 4,987,050 226,684 30,200 1,373 167 8Aug 22 3,145,510 142,978 17,270 785 91 4Sep 21 1,294,028 61,620 7,830 373 40 2Oct 21 2,251,710 107,224 13,860 660 78 4Nov 21 2,848,930 135,663 17,160 817 87 4Dec 20 1,389,600 69,480 8,490 425 39 2
Note : Pilot programme for 7 NASDAQ stocks trading commenced by 31 May 2000
Monthly turnover for NASDAQ stocks (2002)(HK$’000)
Year / Month Trading days Dell Amgen Cisco Intel Applied Starbucks Miscrosoft Total
2000 147 12,151 12,848 59,993 77,329 50,246 5,711 53,655 271,9332001 243 4,665 4,112 38,877 32,278 16,125 1,930 19,816 117,8032002 247 882 2,551 8,441 14,246 1,831 1,479 11,479 40,909
2002 Jan 22 4 40 572 1,629 - 425 182 2,853Feb 17 214 - 1,103 542 8 3 138 2,009Mar 20 62 38 952 430 230 253 316 2,280Apr 20 33 143 711 309 13 47 1,476 2,733May 21 263 241 1,899 1,279 443 7 2,782 6,914Jun 20 - 844 657 3,939 450 19 2,295 8,204Jul 22 - 559 974 2,074 205 203 971 4,987Aug 22 85 549 574 662 340 31 906 3,146Sep 21 40 6 137 559 10 10 532 1,294Oct 21 37 42 293 667 - 257 956 2,252Nov 21 76 - 425 1,478 81 92 698 2,849Dec 20 67 90 144 680 49 131 228 1,390
Note : Pilot programme for 7 NASDAQ stocks trading commenced by 31 May 2000
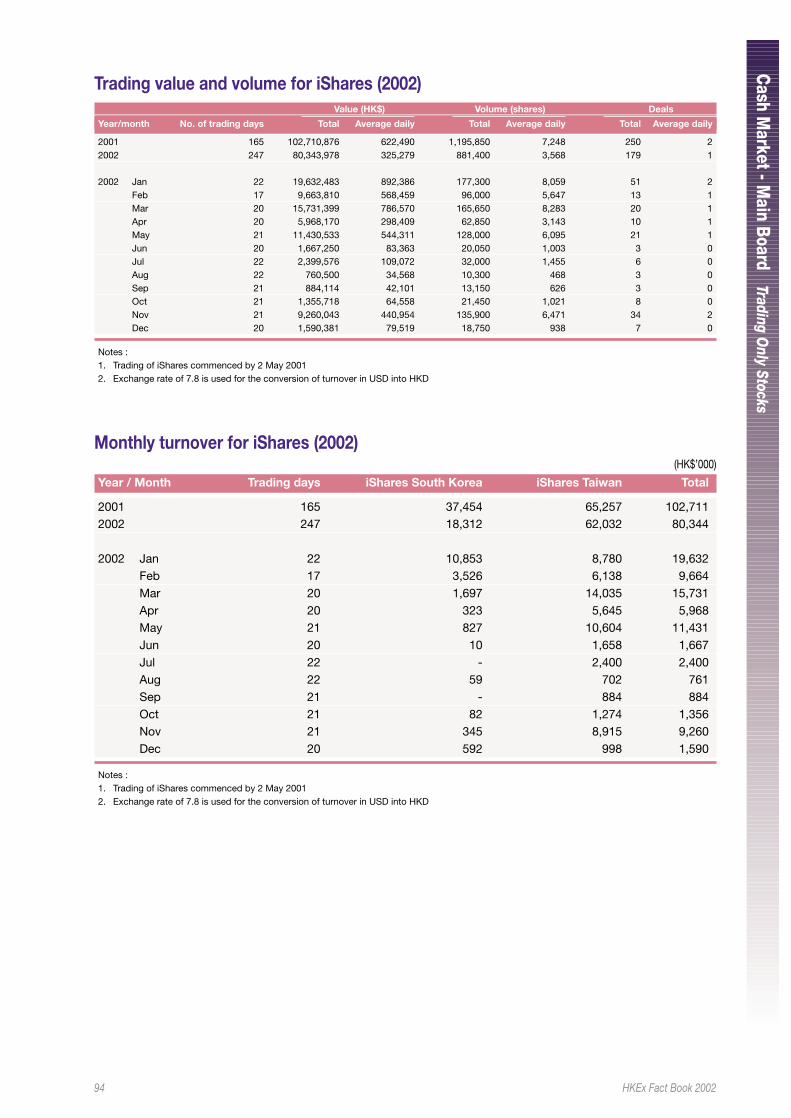
94 HKEx Fact Book 2002
Cash M
arket - Main Boar d
Trading Only Stocks
Monthly turnover for iShares (2002)(HK$’000)
Year / Month Trading days iShares South Korea iShares Taiwan Total
2001 165 37,454 65,257 102,7112002 247 18,312 62,032 80,344
2002 Jan 22 10,853 8,780 19,632Feb 17 3,526 6,138 9,664Mar 20 1,697 14,035 15,731Apr 20 323 5,645 5,968May 21 827 10,604 11,431Jun 20 10 1,658 1,667Jul 22 - 2,400 2,400Aug 22 59 702 761Sep 21 - 884 884Oct 21 82 1,274 1,356Nov 21 345 8,915 9,260Dec 20 592 998 1,590
Notes :1. Trading of iShares commenced by 2 May 20012. Exchange rate of 7.8 is used for the conversion of turnover in USD into HKD
Trading value and volume for iShares (2002) Value (HK$) Volume (shares) Deals
Year/month No. of trading days Total Average daily Total Average daily Total Average daily
2001 165 102,710,876 622,490 1,195,850 7,248 250 22002 247 80,343,978 325,279 881,400 3,568 179 1
2002 Jan 22 19,632,483 892,386 177,300 8,059 51 2Feb 17 9,663,810 568,459 96,000 5,647 13 1Mar 20 15,731,399 786,570 165,650 8,283 20 1Apr 20 5,968,170 298,409 62,850 3,143 10 1May 21 11,430,533 544,311 128,000 6,095 21 1Jun 20 1,667,250 83,363 20,050 1,003 3 0Jul 22 2,399,576 109,072 32,000 1,455 6 0Aug 22 760,500 34,568 10,300 468 3 0Sep 21 884,114 42,101 13,150 626 3 0Oct 21 1,355,718 64,558 21,450 1,021 8 0Nov 21 9,260,043 440,954 135,900 6,471 34 2Dec 20 1,590,381 79,519 18,750 938 7 0
Notes :1. Trading of iShares commenced by 2 May 20012. Exchange rate of 7.8 is used for the conversion of turnover in USD into HKD
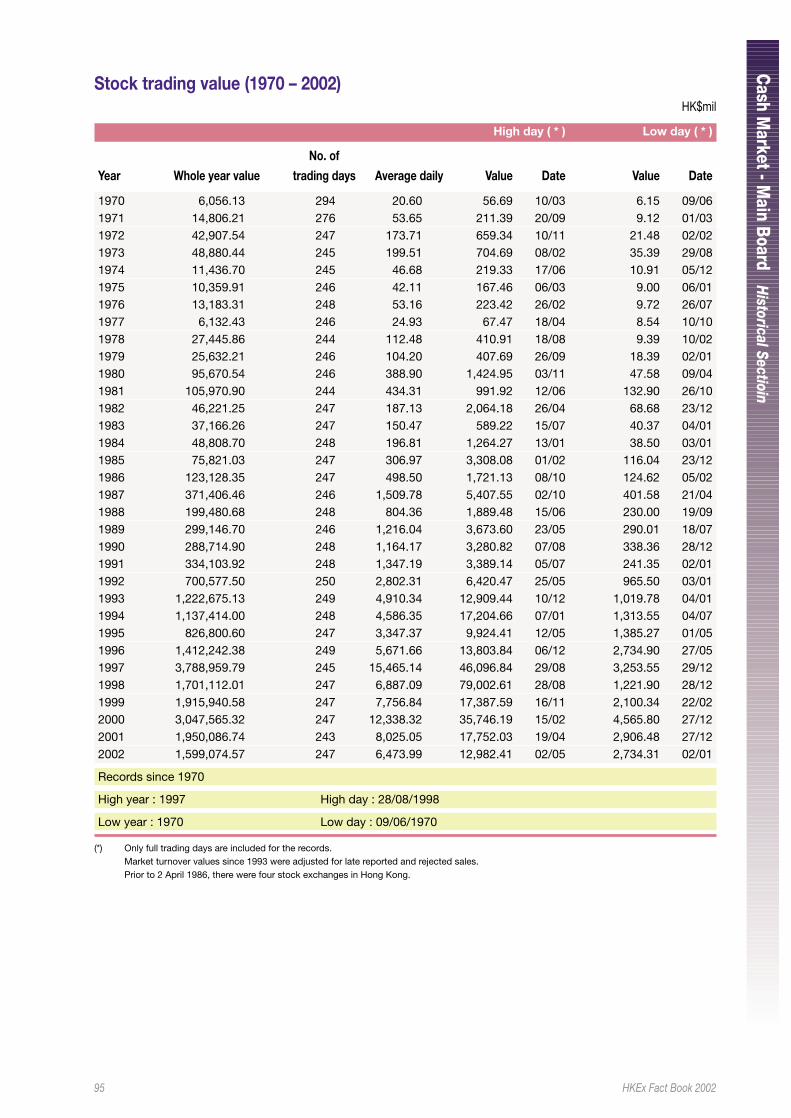
95 HKEx Fact Book 2002
Cash M
arket - Main Boar d
Historical Sectioin
Stock trading value (1970 – 2002)HK$mil
High day ( * ) Low day ( * )
No. of
Year Whole year value trading days Average daily Value Date Value Date
1970 6,056.13 294 20.60 56.69 10/03 6.15 09/061971 14,806.21 276 53.65 211.39 20/09 9.12 01/031972 42,907.54 247 173.71 659.34 10/11 21.48 02/021973 48,880.44 245 199.51 704.69 08/02 35.39 29/081974 11,436.70 245 46.68 219.33 17/06 10.91 05/121975 10,359.91 246 42.11 167.46 06/03 9.00 06/011976 13,183.31 248 53.16 223.42 26/02 9.72 26/071977 6,132.43 246 24.93 67.47 18/04 8.54 10/101978 27,445.86 244 112.48 410.91 18/08 9.39 10/021979 25,632.21 246 104.20 407.69 26/09 18.39 02/011980 95,670.54 246 388.90 1,424.95 03/11 47.58 09/041981 105,970.90 244 434.31 991.92 12/06 132.90 26/101982 46,221.25 247 187.13 2,064.18 26/04 68.68 23/121983 37,166.26 247 150.47 589.22 15/07 40.37 04/011984 48,808.70 248 196.81 1,264.27 13/01 38.50 03/011985 75,821.03 247 306.97 3,308.08 01/02 116.04 23/121986 123,128.35 247 498.50 1,721.13 08/10 124.62 05/021987 371,406.46 246 1,509.78 5,407.55 02/10 401.58 21/041988 199,480.68 248 804.36 1,889.48 15/06 230.00 19/091989 299,146.70 246 1,216.04 3,673.60 23/05 290.01 18/071990 288,714.90 248 1,164.17 3,280.82 07/08 338.36 28/121991 334,103.92 248 1,347.19 3,389.14 05/07 241.35 02/011992 700,577.50 250 2,802.31 6,420.47 25/05 965.50 03/011993 1,222,675.13 249 4,910.34 12,909.44 10/12 1,019.78 04/011994 1,137,414.00 248 4,586.35 17,204.66 07/01 1,313.55 04/071995 826,800.60 247 3,347.37 9,924.41 12/05 1,385.27 01/051996 1,412,242.38 249 5,671.66 13,803.84 06/12 2,734.90 27/051997 3,788,959.79 245 15,465.14 46,096.84 29/08 3,253.55 29/121998 1,701,112.01 247 6,887.09 79,002.61 28/08 1,221.90 28/121999 1,915,940.58 247 7,756.84 17,387.59 16/11 2,100.34 22/022000 3,047,565.32 247 12,338.32 35,746.19 15/02 4,565.80 27/122001 1,950,086.74 243 8,025.05 17,752.03 19/04 2,906.48 27/122002 1,599,074.57 247 6,473.99 12,982.41 02/05 2,734.31 02/01
Records since 1970
High year : 1997 High day : 28/08/1998
Low year : 1970 Low day : 09/06/1970
(*) Only full trading days are included for the records.Market turnover values since 1993 were adjusted for late reported and rejected sales.Prior to 2 April 1986, there were four stock exchanges in Hong Kong.
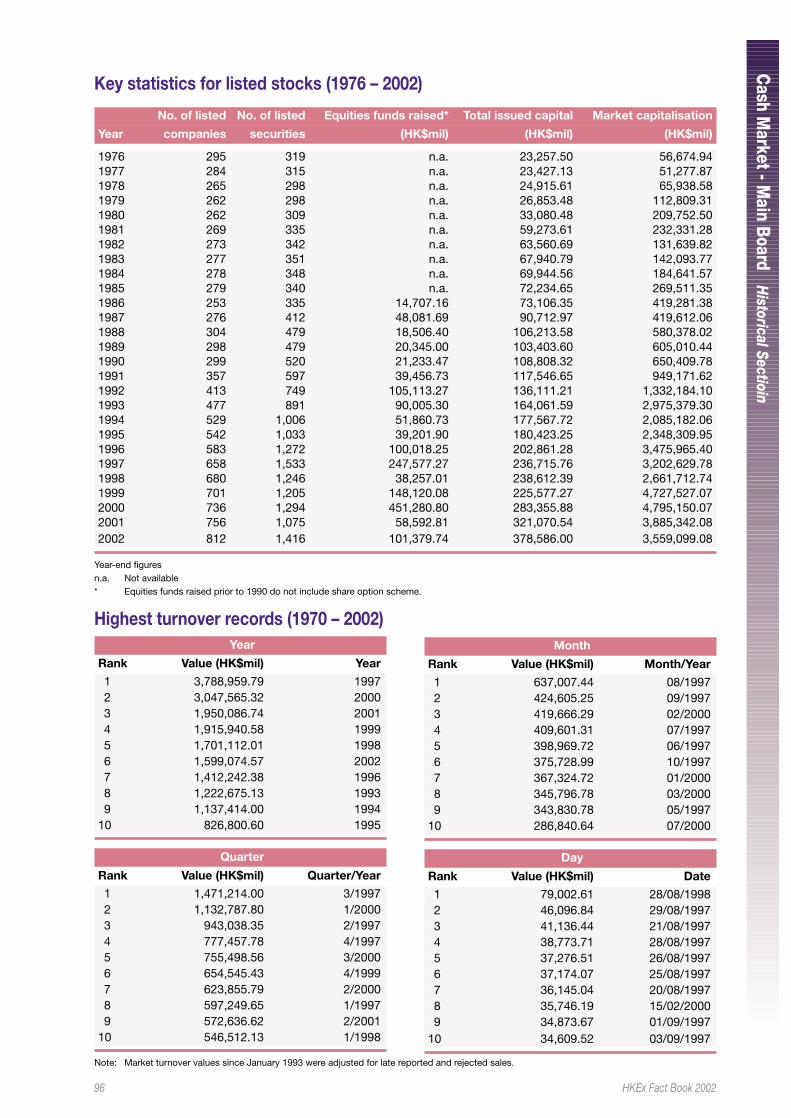
96 HKEx Fact Book 2002
Cash M
arket - Main Boar d
Historical Sectioin
Key statistics for listed stocks (1976 – 2002)
No. of listed No. of listed Equities funds raised* Total issued capital Market capitalisation
Year companies securities (HK$mil) (HK$mil) (HK$mil)
1976 295 319 n.a. 23,257.50 56,674.941977 284 315 n.a. 23,427.13 51,277.871978 265 298 n.a. 24,915.61 65,938.581979 262 298 n.a. 26,853.48 112,809.311980 262 309 n.a. 33,080.48 209,752.501981 269 335 n.a. 59,273.61 232,331.281982 273 342 n.a. 63,560.69 131,639.821983 277 351 n.a. 67,940.79 142,093.771984 278 348 n.a. 69,944.56 184,641.571985 279 340 n.a. 72,234.65 269,511.351986 253 335 14,707.16 73,106.35 419,281.381987 276 412 48,081.69 90,712.97 419,612.061988 304 479 18,506.40 106,213.58 580,378.021989 298 479 20,345.00 103,403.60 605,010.441990 299 520 21,233.47 108,808.32 650,409.781991 357 597 39,456.73 117,546.65 949,171.621992 413 749 105,113.27 136,111.21 1,332,184.101993 477 891 90,005.30 164,061.59 2,975,379.301994 529 1,006 51,860.73 177,567.72 2,085,182.061995 542 1,033 39,201.90 180,423.25 2,348,309.951996 583 1,272 100,018.25 202,861.28 3,475,965.401997 658 1,533 247,577.27 236,715.76 3,202,629.781998 680 1,246 38,257.01 238,612.39 2,661,712.741999 701 1,205 148,120.08 225,577.27 4,727,527.072000 736 1,294 451,280.80 283,355.88 4,795,150.072001 756 1,075 58,592.81 321,070.54 3,885,342.082002 812 1,416 101,379.74 378,586.00 3,559,099.08
Year-end figuresn.a. Not available* Equities funds raised prior to 1990 do not include share option scheme.
Highest turnover records (1970 – 2002)Year
Rank Value (HK$mil) Year
1 3,788,959.79 19972 3,047,565.32 20003 1,950,086.74 20014 1,915,940.58 19995 1,701,112.01 19986 1,599,074.57 20027 1,412,242.38 19968 1,222,675.13 19939 1,137,414.00 1994
10 826,800.60 1995
Month
Rank Value (HK$mil) Month/Year
1 637,007.44 08/19972 424,605.25 09/19973 419,666.29 02/20004 409,601.31 07/19975 398,969.72 06/19976 375,728.99 10/19977 367,324.72 01/20008 345,796.78 03/20009 343,830.78 05/1997
10 286,840.64 07/2000
Quarter
Rank Value (HK$mil) Quarter/Year
1 1,471,214.00 3/19972 1,132,787.80 1/20003 943,038.35 2/19974 777,457.78 4/19975 755,498.56 3/20006 654,545.43 4/19997 623,855.79 2/20008 597,249.65 1/19979 572,636.62 2/2001
10 546,512.13 1/1998
Day
Rank Value (HK$mil) Date
1 79,002.61 28/08/19982 46,096.84 29/08/19973 41,136.44 21/08/19974 38,773.71 28/08/19975 37,276.51 26/08/19976 37,174.07 25/08/19977 36,145.04 20/08/19978 35,746.19 15/02/20009 34,873.67 01/09/1997
10 34,609.52 03/09/1997
Note: Market turnover values since January 1993 were adjusted for late reported and rejected sales.
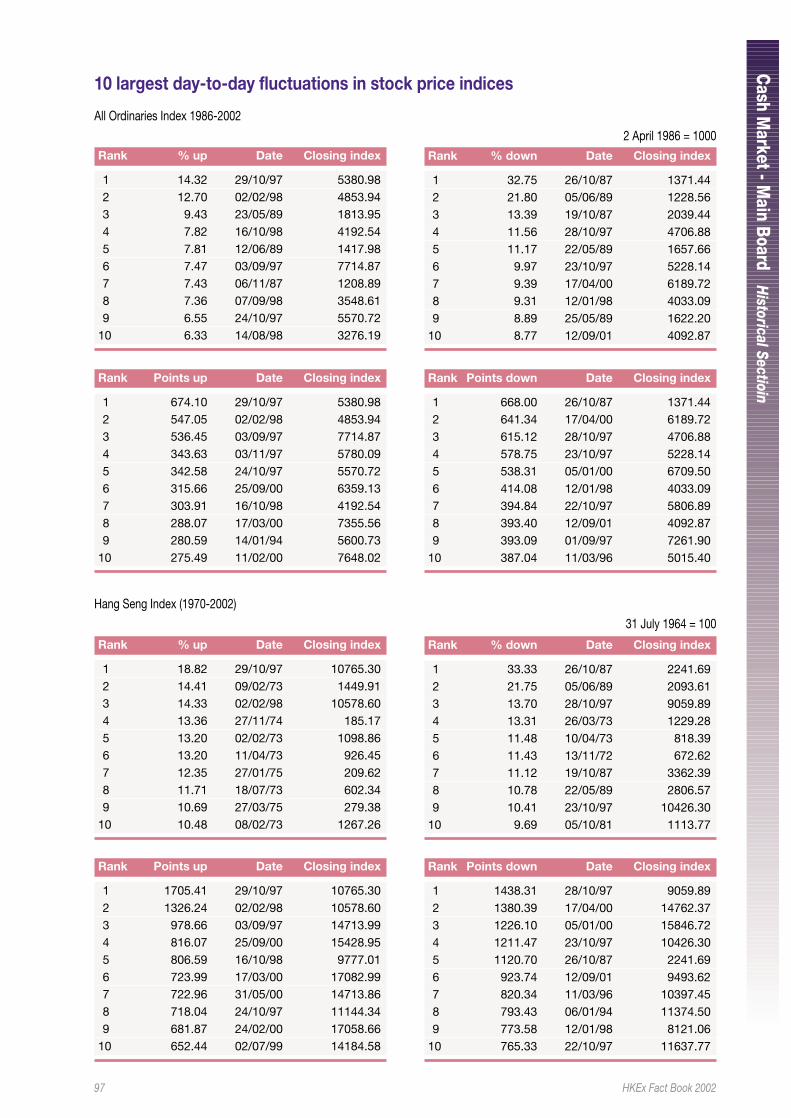
97 HKEx Fact Book 2002
Cash M
arket - Main Boar d
Historical Sectioin
10 largest day-to-day fluctuations in stock price indices
All Ordinaries Index 1986-2002
2 April 1986 = 1000Rank % up Date Closing index
1 14.32 29/10/97 5380.982 12.70 02/02/98 4853.943 9.43 23/05/89 1813.954 7.82 16/10/98 4192.545 7.81 12/06/89 1417.986 7.47 03/09/97 7714.877 7.43 06/11/87 1208.898 7.36 07/09/98 3548.619 6.55 24/10/97 5570.72
10 6.33 14/08/98 3276.19
Rank % down Date Closing index
1 32.75 26/10/87 1371.442 21.80 05/06/89 1228.563 13.39 19/10/87 2039.444 11.56 28/10/97 4706.885 11.17 22/05/89 1657.666 9.97 23/10/97 5228.147 9.39 17/04/00 6189.728 9.31 12/01/98 4033.099 8.89 25/05/89 1622.20
10 8.77 12/09/01 4092.87
Rank Points up Date Closing index
1 674.10 29/10/97 5380.982 547.05 02/02/98 4853.943 536.45 03/09/97 7714.874 343.63 03/11/97 5780.095 342.58 24/10/97 5570.726 315.66 25/09/00 6359.137 303.91 16/10/98 4192.548 288.07 17/03/00 7355.569 280.59 14/01/94 5600.73
10 275.49 11/02/00 7648.02
Rank Points down Date Closing index
1 668.00 26/10/87 1371.442 641.34 17/04/00 6189.723 615.12 28/10/97 4706.884 578.75 23/10/97 5228.145 538.31 05/01/00 6709.506 414.08 12/01/98 4033.097 394.84 22/10/97 5806.898 393.40 12/09/01 4092.879 393.09 01/09/97 7261.90
10 387.04 11/03/96 5015.40
Hang Seng Index (1970-2002)
31 July 1964 = 100
Rank % up Date Closing index
1 18.82 29/10/97 10765.302 14.41 09/02/73 1449.913 14.33 02/02/98 10578.604 13.36 27/11/74 185.175 13.20 02/02/73 1098.866 13.20 11/04/73 926.457 12.35 27/01/75 209.628 11.71 18/07/73 602.349 10.69 27/03/75 279.38
10 10.48 08/02/73 1267.26
Rank % down Date Closing index
1 33.33 26/10/87 2241.692 21.75 05/06/89 2093.613 13.70 28/10/97 9059.894 13.31 26/03/73 1229.285 11.48 10/04/73 818.396 11.43 13/11/72 672.627 11.12 19/10/87 3362.398 10.78 22/05/89 2806.579 10.41 23/10/97 10426.30
10 9.69 05/10/81 1113.77
Rank Points up Date Closing index
1 1705.41 29/10/97 10765.302 1326.24 02/02/98 10578.603 978.66 03/09/97 14713.994 816.07 25/09/00 15428.955 806.59 16/10/98 9777.016 723.99 17/03/00 17082.997 722.96 31/05/00 14713.868 718.04 24/10/97 11144.349 681.87 24/02/00 17058.66
10 652.44 02/07/99 14184.58
Rank Points down Date Closing index
1 1438.31 28/10/97 9059.892 1380.39 17/04/00 14762.373 1226.10 05/01/00 15846.724 1211.47 23/10/97 10426.305 1120.70 26/10/87 2241.696 923.74 12/09/01 9493.627 820.34 11/03/96 10397.458 793.43 06/01/94 11374.509 773.58 12/01/98 8121.06
10 765.33 22/10/97 11637.77
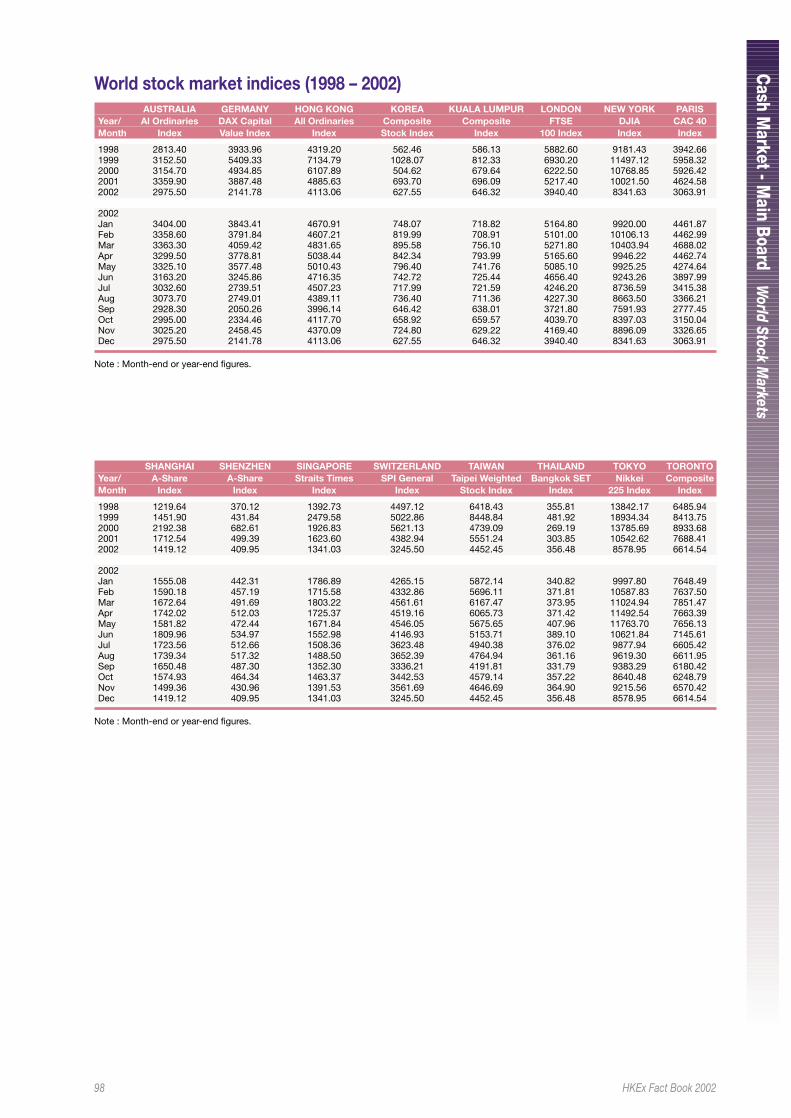
98 HKEx Fact Book 2002
Cash M
arket - Main Boar d
World Stock M
arkets
World stock market indices (1998 – 2002)AUSTRALIA GERMANY HONG KONG KOREA KUALA LUMPUR LONDON NEW YORK PARIS
Year/ Al Ordinaries DAX Capital All Ordinaries Composite Composite FTSE DJIA CAC 40Month Index Value Index Index Stock Index Index 100 Index Index Index
1998 2813.40 3933.96 4319.20 562.46 586.13 5882.60 9181.43 3942.661999 3152.50 5409.33 7134.79 1028.07 812.33 6930.20 11497.12 5958.322000 3154.70 4934.85 6107.89 504.62 679.64 6222.50 10768.85 5926.422001 3359.90 3887.48 4885.63 693.70 696.09 5217.40 10021.50 4624.582002 2975.50 2141.78 4113.06 627.55 646.32 3940.40 8341.63 3063.91
2002Jan 3404.00 3843.41 4670.91 748.07 718.82 5164.80 9920.00 4461.87Feb 3358.60 3791.84 4607.21 819.99 708.91 5101.00 10106.13 4462.99Mar 3363.30 4059.42 4831.65 895.58 756.10 5271.80 10403.94 4688.02Apr 3299.50 3778.81 5038.44 842.34 793.99 5165.60 9946.22 4462.74May 3325.10 3577.48 5010.43 796.40 741.76 5085.10 9925.25 4274.64Jun 3163.20 3245.86 4716.35 742.72 725.44 4656.40 9243.26 3897.99Jul 3032.60 2739.51 4507.23 717.99 721.59 4246.20 8736.59 3415.38Aug 3073.70 2749.01 4389.11 736.40 711.36 4227.30 8663.50 3366.21Sep 2928.30 2050.26 3996.14 646.42 638.01 3721.80 7591.93 2777.45Oct 2995.00 2334.46 4117.70 658.92 659.57 4039.70 8397.03 3150.04Nov 3025.20 2458.45 4370.09 724.80 629.22 4169.40 8896.09 3326.65Dec 2975.50 2141.78 4113.06 627.55 646.32 3940.40 8341.63 3063.91
Note : Month-end or year-end figures.
SHANGHAI SHENZHEN SINGAPORE SWITZERLAND TAIWAN THAILAND TOKYO TORONTOYear/ A-Share A-Share Straits Times SPI General Taipei Weighted Bangkok SET Nikkei CompositeMonth Index Index Index Index Stock Index Index 225 Index Index
1998 1219.64 370.12 1392.73 4497.12 6418.43 355.81 13842.17 6485.941999 1451.90 431.84 2479.58 5022.86 8448.84 481.92 18934.34 8413.752000 2192.38 682.61 1926.83 5621.13 4739.09 269.19 13785.69 8933.682001 1712.54 499.39 1623.60 4382.94 5551.24 303.85 10542.62 7688.412002 1419.12 409.95 1341.03 3245.50 4452.45 356.48 8578.95 6614.54
2002Jan 1555.08 442.31 1786.89 4265.15 5872.14 340.82 9997.80 7648.49Feb 1590.18 457.19 1715.58 4332.86 5696.11 371.81 10587.83 7637.50Mar 1672.64 491.69 1803.22 4561.61 6167.47 373.95 11024.94 7851.47Apr 1742.02 512.03 1725.37 4519.16 6065.73 371.42 11492.54 7663.39May 1581.82 472.44 1671.84 4546.05 5675.65 407.96 11763.70 7656.13Jun 1809.96 534.97 1552.98 4146.93 5153.71 389.10 10621.84 7145.61Jul 1723.56 512.66 1508.36 3623.48 4940.38 376.02 9877.94 6605.42Aug 1739.34 517.32 1488.50 3652.39 4764.94 361.16 9619.30 6611.95Sep 1650.48 487.30 1352.30 3336.21 4191.81 331.79 9383.29 6180.42Oct 1574.93 464.34 1463.37 3442.53 4579.14 357.22 8640.48 6248.79Nov 1499.36 430.96 1391.53 3561.69 4646.69 364.90 9215.56 6570.42Dec 1419.12 409.95 1341.03 3245.50 4452.45 356.48 8578.95 6614.54
Note : Month-end or year-end figures.
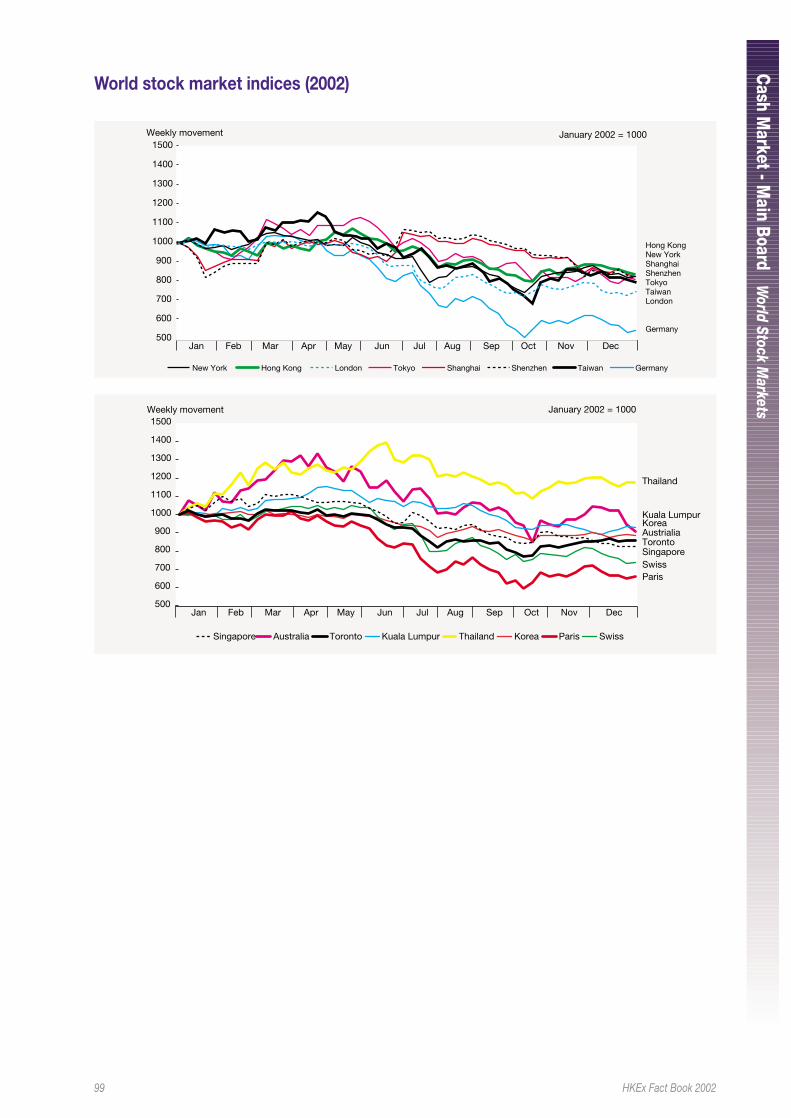
99 HKEx Fact Book 2002
Cash M
arket - Main Boar d
World Stock M
arkets
World stock market indices (2002)
500
600
700
800
900
1000
1100
1200
1300
1400
1500Weekly movement January 2002 = 1000
Jan Feb Mar Apr May Jun Jul Aug Sep Oct Nov Dec
Hong KongNew YorkShanghaiShenzhenTokyoTaiwanLondon
Germany
ShanghaiNew York Hong Kong London Shenzhen Taiwan GermanyTokyo
500
600
700
800
900
1000
1100
1200
1300
1400
1500Weekly movement
Jan Feb Mar Apr May Jun Jul Aug Sep Oct Nov Dec
January 2002 = 1000
Swiss
Swiss
Paris
Paris
Korea
KoreaThailand
Thailand
Kuala Lumpur
Kuala LumpurToronto
TorontoAustrialia
AustraliaSingapore
Singapore
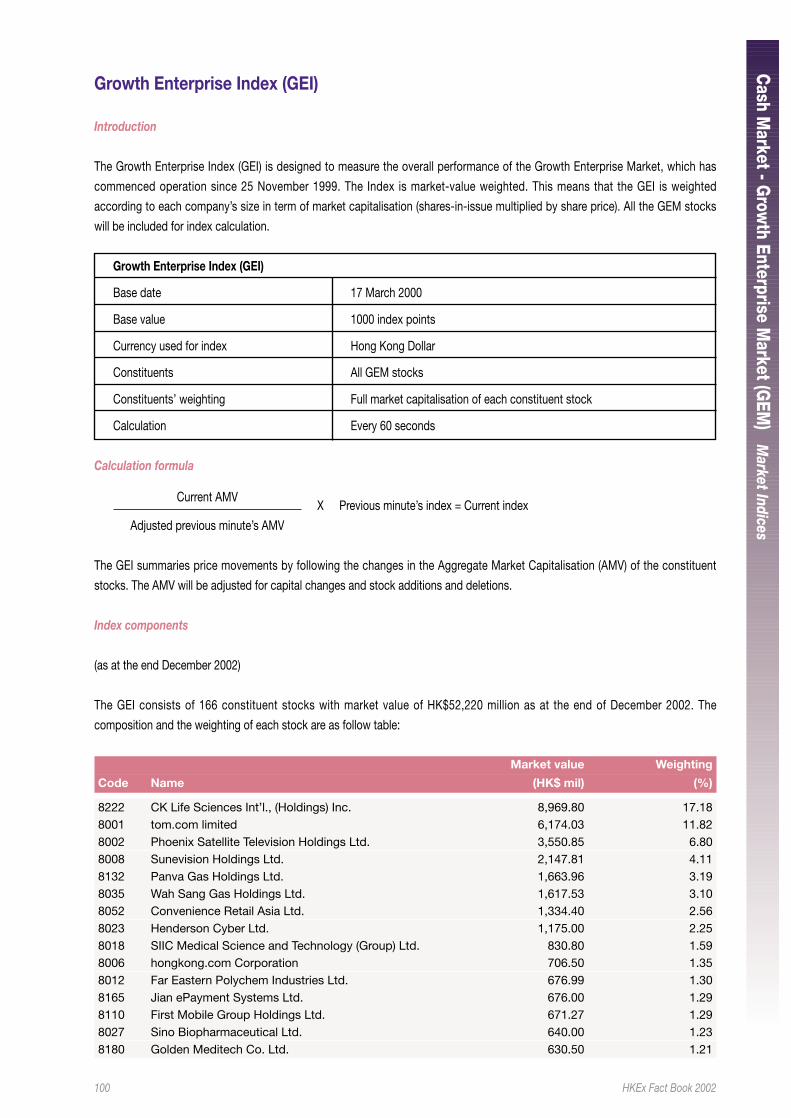
100 HKEx Fact Book 2002
Cash M
arket - Grow
th Enterprise Market (G
EM)
Market Indices
Growth Enterprise Index (GEI)
Introduction
The Growth Enterprise Index (GEI) is designed to measure the overall performance of the Growth Enterprise Market, which has
commenced operation since 25 November 1999. The Index is market-value weighted. This means that the GEI is weighted
according to each company’s size in term of market capitalisation (shares-in-issue multiplied by share price). All the GEM stocks
will be included for index calculation.
Growth Enterprise Index (GEI)
Base date 17 March 2000
Base value 1000 index points
Currency used for index Hong Kong Dollar
Constituents All GEM stocks
Constituents’ weighting Full market capitalisation of each constituent stock
Calculation Every 60 seconds
Calculation formula
Current AMVX Previous minute’s index = Current index
Adjusted previous minute’s AMV
The GEI summaries price movements by following the changes in the Aggregate Market Capitalisation (AMV) of the constituent
stocks. The AMV will be adjusted for capital changes and stock additions and deletions.
Index components
(as at the end December 2002)
The GEI consists of 166 constituent stocks with market value of HK$52,220 million as at the end of December 2002. The
composition and the weighting of each stock are as follow table:
Market value Weighting
Code Name (HK$ mil) (%)
8222 CK Life Sciences Int’l., (Holdings) Inc. 8,969.80 17.188001 tom.com limited 6,174.03 11.828002 Phoenix Satellite Television Holdings Ltd. 3,550.85 6.808008 Sunevision Holdings Ltd. 2,147.81 4.118132 Panva Gas Holdings Ltd. 1,663.96 3.198035 Wah Sang Gas Holdings Ltd. 1,617.53 3.108052 Convenience Retail Asia Ltd. 1,334.40 2.568023 Henderson Cyber Ltd. 1,175.00 2.258018 SIIC Medical Science and Technology (Group) Ltd. 830.80 1.598006 hongkong.com Corporation 706.50 1.358012 Far Eastern Polychem Industries Ltd. 676.99 1.308165 Jian ePayment Systems Ltd. 676.00 1.298110 First Mobile Group Holdings Ltd. 671.27 1.298027 Sino Biopharmaceutical Ltd. 640.00 1.238180 Golden Meditech Co. Ltd. 630.50 1.21
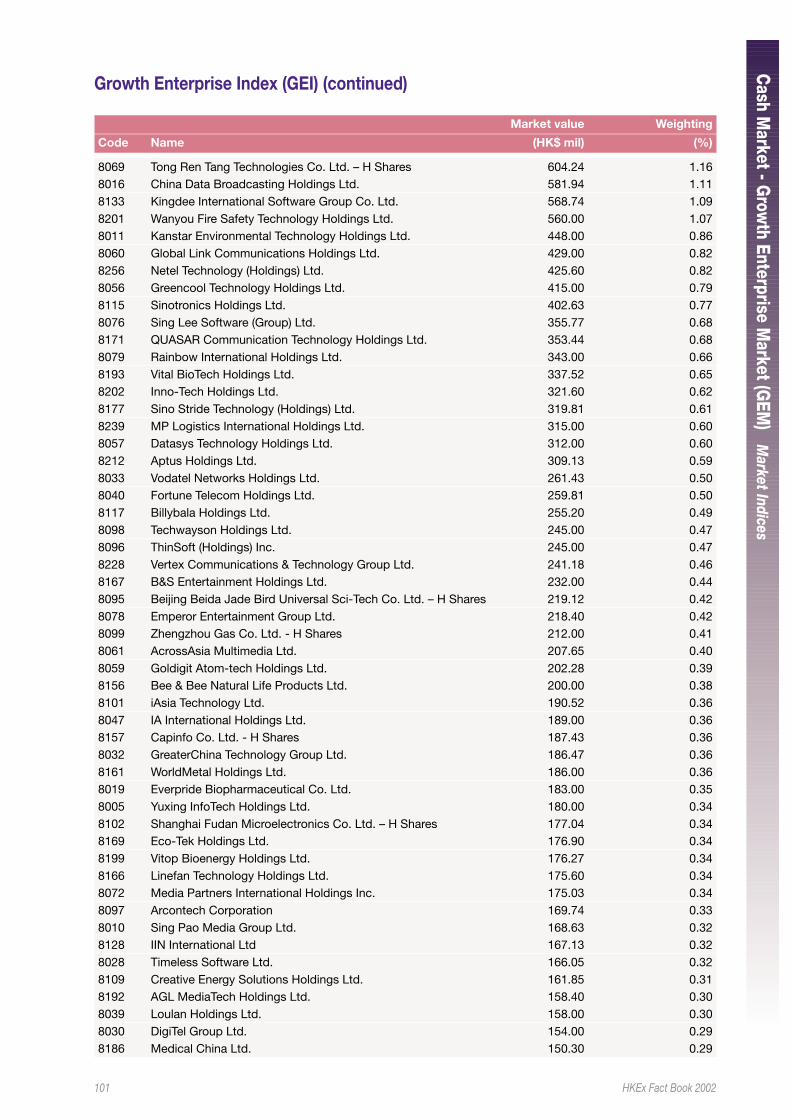
101 HKEx Fact Book 2002
Cash M
arket - Grow
th Enterprise Market (G
EM)
Market Indices
Market value Weighting
Code Name (HK$ mil) (%)
8069 Tong Ren Tang Technologies Co. Ltd. – H Shares 604.24 1.168016 China Data Broadcasting Holdings Ltd. 581.94 1.118133 Kingdee International Software Group Co. Ltd. 568.74 1.098201 Wanyou Fire Safety Technology Holdings Ltd. 560.00 1.078011 Kanstar Environmental Technology Holdings Ltd. 448.00 0.868060 Global Link Communications Holdings Ltd. 429.00 0.828256 Netel Technology (Holdings) Ltd. 425.60 0.828056 Greencool Technology Holdings Ltd. 415.00 0.798115 Sinotronics Holdings Ltd. 402.63 0.778076 Sing Lee Software (Group) Ltd. 355.77 0.688171 QUASAR Communication Technology Holdings Ltd. 353.44 0.688079 Rainbow International Holdings Ltd. 343.00 0.668193 Vital BioTech Holdings Ltd. 337.52 0.658202 Inno-Tech Holdings Ltd. 321.60 0.628177 Sino Stride Technology (Holdings) Ltd. 319.81 0.618239 MP Logistics International Holdings Ltd. 315.00 0.608057 Datasys Technology Holdings Ltd. 312.00 0.608212 Aptus Holdings Ltd. 309.13 0.598033 Vodatel Networks Holdings Ltd. 261.43 0.508040 Fortune Telecom Holdings Ltd. 259.81 0.508117 Billybala Holdings Ltd. 255.20 0.498098 Techwayson Holdings Ltd. 245.00 0.478096 ThinSoft (Holdings) Inc. 245.00 0.478228 Vertex Communications & Technology Group Ltd. 241.18 0.468167 B&S Entertainment Holdings Ltd. 232.00 0.448095 Beijing Beida Jade Bird Universal Sci-Tech Co. Ltd. – H Shares 219.12 0.428078 Emperor Entertainment Group Ltd. 218.40 0.428099 Zhengzhou Gas Co. Ltd. - H Shares 212.00 0.418061 AcrossAsia Multimedia Ltd. 207.65 0.408059 Goldigit Atom-tech Holdings Ltd. 202.28 0.398156 Bee & Bee Natural Life Products Ltd. 200.00 0.388101 iAsia Technology Ltd. 190.52 0.368047 IA International Holdings Ltd. 189.00 0.368157 Capinfo Co. Ltd. - H Shares 187.43 0.368032 GreaterChina Technology Group Ltd. 186.47 0.368161 WorldMetal Holdings Ltd. 186.00 0.368019 Everpride Biopharmaceutical Co. Ltd. 183.00 0.358005 Yuxing InfoTech Holdings Ltd. 180.00 0.348102 Shanghai Fudan Microelectronics Co. Ltd. – H Shares 177.04 0.348169 Eco-Tek Holdings Ltd. 176.90 0.348199 Vitop Bioenergy Holdings Ltd. 176.27 0.348166 Linefan Technology Holdings Ltd. 175.60 0.348072 Media Partners International Holdings Inc. 175.03 0.348097 Arcontech Corporation 169.74 0.338010 Sing Pao Media Group Ltd. 168.63 0.328128 IIN International Ltd 167.13 0.328028 Timeless Software Ltd. 166.05 0.328109 Creative Energy Solutions Holdings Ltd. 161.85 0.318192 AGL MediaTech Holdings Ltd. 158.40 0.308039 Loulan Holdings Ltd. 158.00 0.308030 DigiTel Group Ltd. 154.00 0.298186 Medical China Ltd. 150.30 0.29
Growth Enterprise Index (GEI) (continued)
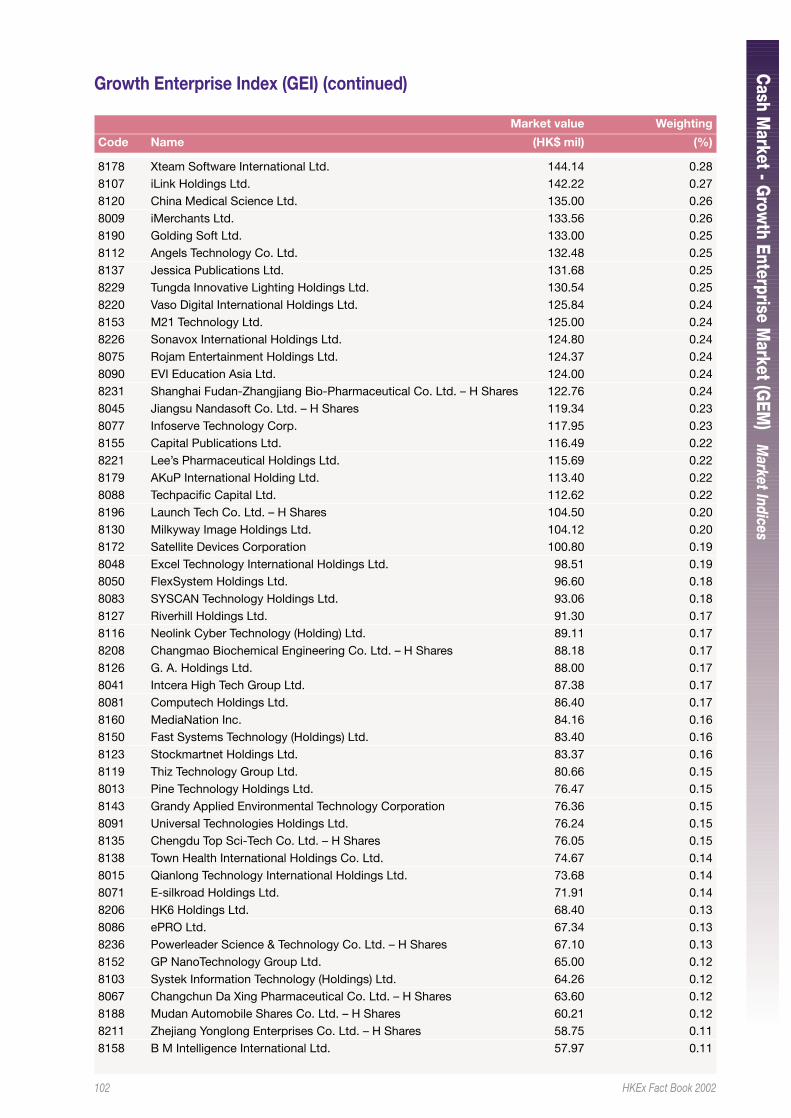
102 HKEx Fact Book 2002
Cash M
arket - Grow
th Enterprise Market (G
EM)
Market Indices
Market value Weighting
Code Name (HK$ mil) (%)
8178 Xteam Software International Ltd. 144.14 0.288107 iLink Holdings Ltd. 142.22 0.278120 China Medical Science Ltd. 135.00 0.268009 iMerchants Ltd. 133.56 0.268190 Golding Soft Ltd. 133.00 0.258112 Angels Technology Co. Ltd. 132.48 0.258137 Jessica Publications Ltd. 131.68 0.258229 Tungda Innovative Lighting Holdings Ltd. 130.54 0.258220 Vaso Digital International Holdings Ltd. 125.84 0.248153 M21 Technology Ltd. 125.00 0.248226 Sonavox International Holdings Ltd. 124.80 0.248075 Rojam Entertainment Holdings Ltd. 124.37 0.248090 EVI Education Asia Ltd. 124.00 0.248231 Shanghai Fudan-Zhangjiang Bio-Pharmaceutical Co. Ltd. – H Shares 122.76 0.248045 Jiangsu Nandasoft Co. Ltd. – H Shares 119.34 0.238077 Infoserve Technology Corp. 117.95 0.238155 Capital Publications Ltd. 116.49 0.228221 Lee’s Pharmaceutical Holdings Ltd. 115.69 0.228179 AKuP International Holding Ltd. 113.40 0.228088 Techpacific Capital Ltd. 112.62 0.228196 Launch Tech Co. Ltd. – H Shares 104.50 0.208130 Milkyway Image Holdings Ltd. 104.12 0.208172 Satellite Devices Corporation 100.80 0.198048 Excel Technology International Holdings Ltd. 98.51 0.198050 FlexSystem Holdings Ltd. 96.60 0.188083 SYSCAN Technology Holdings Ltd. 93.06 0.188127 Riverhill Holdings Ltd. 91.30 0.178116 Neolink Cyber Technology (Holding) Ltd. 89.11 0.178208 Changmao Biochemical Engineering Co. Ltd. – H Shares 88.18 0.178126 G. A. Holdings Ltd. 88.00 0.178041 Intcera High Tech Group Ltd. 87.38 0.178081 Computech Holdings Ltd. 86.40 0.178160 MediaNation Inc. 84.16 0.168150 Fast Systems Technology (Holdings) Ltd. 83.40 0.168123 Stockmartnet Holdings Ltd. 83.37 0.168119 Thiz Technology Group Ltd. 80.66 0.158013 Pine Technology Holdings Ltd. 76.47 0.158143 Grandy Applied Environmental Technology Corporation 76.36 0.158091 Universal Technologies Holdings Ltd. 76.24 0.158135 Chengdu Top Sci-Tech Co. Ltd. – H Shares 76.05 0.158138 Town Health International Holdings Co. Ltd. 74.67 0.148015 Qianlong Technology International Holdings Ltd. 73.68 0.148071 E-silkroad Holdings Ltd. 71.91 0.148206 HK6 Holdings Ltd. 68.40 0.138086 ePRO Ltd. 67.34 0.138236 Powerleader Science & Technology Co. Ltd. – H Shares 67.10 0.138152 GP NanoTechnology Group Ltd. 65.00 0.128103 Systek Information Technology (Holdings) Ltd. 64.26 0.128067 Changchun Da Xing Pharmaceutical Co. Ltd. – H Shares 63.60 0.128188 Mudan Automobile Shares Co. Ltd. – H Shares 60.21 0.128211 Zhejiang Yonglong Enterprises Co. Ltd. – H Shares 58.75 0.118158 B M Intelligence International Ltd. 57.97 0.11
Growth Enterprise Index (GEI) (continued)
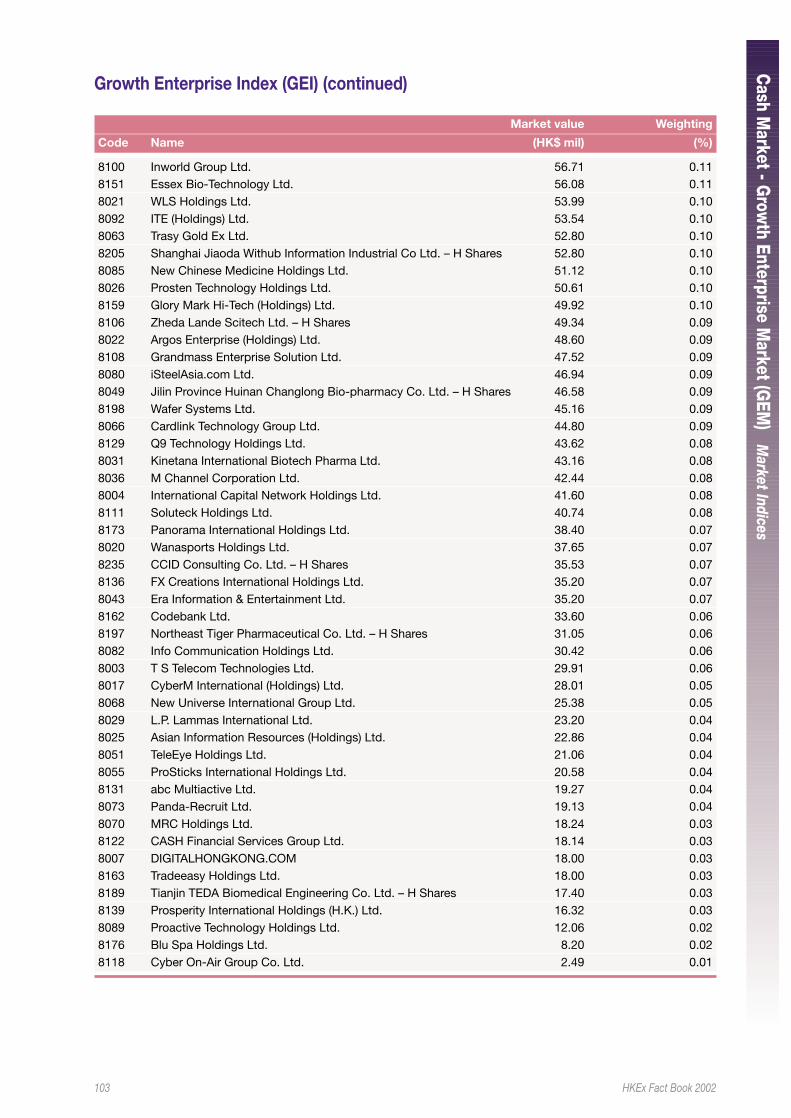
103 HKEx Fact Book 2002
Cash M
arket - Grow
th Enterprise Market (G
EM)
Market Indices
Market value Weighting
Code Name (HK$ mil) (%)
8100 Inworld Group Ltd. 56.71 0.118151 Essex Bio-Technology Ltd. 56.08 0.118021 WLS Holdings Ltd. 53.99 0.108092 ITE (Holdings) Ltd. 53.54 0.108063 Trasy Gold Ex Ltd. 52.80 0.108205 Shanghai Jiaoda Withub Information Industrial Co Ltd. – H Shares 52.80 0.108085 New Chinese Medicine Holdings Ltd. 51.12 0.108026 Prosten Technology Holdings Ltd. 50.61 0.108159 Glory Mark Hi-Tech (Holdings) Ltd. 49.92 0.108106 Zheda Lande Scitech Ltd. – H Shares 49.34 0.098022 Argos Enterprise (Holdings) Ltd. 48.60 0.098108 Grandmass Enterprise Solution Ltd. 47.52 0.098080 iSteelAsia.com Ltd. 46.94 0.098049 Jilin Province Huinan Changlong Bio-pharmacy Co. Ltd. – H Shares 46.58 0.098198 Wafer Systems Ltd. 45.16 0.098066 Cardlink Technology Group Ltd. 44.80 0.098129 Q9 Technology Holdings Ltd. 43.62 0.088031 Kinetana International Biotech Pharma Ltd. 43.16 0.088036 M Channel Corporation Ltd. 42.44 0.088004 International Capital Network Holdings Ltd. 41.60 0.088111 Soluteck Holdings Ltd. 40.74 0.088173 Panorama International Holdings Ltd. 38.40 0.078020 Wanasports Holdings Ltd. 37.65 0.078235 CCID Consulting Co. Ltd. – H Shares 35.53 0.078136 FX Creations International Holdings Ltd. 35.20 0.078043 Era Information & Entertainment Ltd. 35.20 0.078162 Codebank Ltd. 33.60 0.068197 Northeast Tiger Pharmaceutical Co. Ltd. – H Shares 31.05 0.068082 Info Communication Holdings Ltd. 30.42 0.068003 T S Telecom Technologies Ltd. 29.91 0.068017 CyberM International (Holdings) Ltd. 28.01 0.058068 New Universe International Group Ltd. 25.38 0.058029 L.P. Lammas International Ltd. 23.20 0.048025 Asian Information Resources (Holdings) Ltd. 22.86 0.048051 TeleEye Holdings Ltd. 21.06 0.048055 ProSticks International Holdings Ltd. 20.58 0.048131 abc Multiactive Ltd. 19.27 0.048073 Panda-Recruit Ltd. 19.13 0.048070 MRC Holdings Ltd. 18.24 0.038122 CASH Financial Services Group Ltd. 18.14 0.038007 DIGITALHONGKONG.COM 18.00 0.038163 Tradeeasy Holdings Ltd. 18.00 0.038189 Tianjin TEDA Biomedical Engineering Co. Ltd. – H Shares 17.40 0.038139 Prosperity International Holdings (H.K.) Ltd. 16.32 0.038089 Proactive Technology Holdings Ltd. 12.06 0.028176 Blu Spa Holdings Ltd. 8.20 0.028118 Cyber On-Air Group Co. Ltd. 2.49 0.01
Growth Enterprise Index (GEI) (continued)
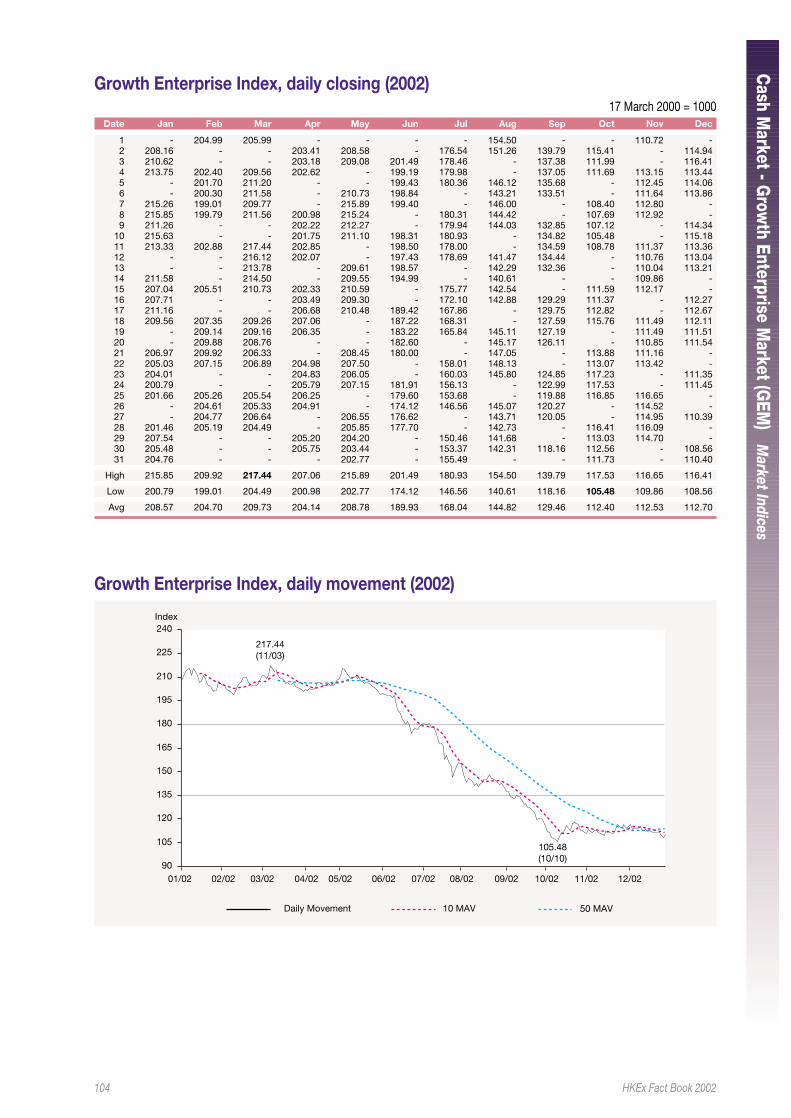
104 HKEx Fact Book 2002
Cash M
arket - Grow
th Enterprise Market (G
EM)
Market Indices
Growth Enterprise Index, daily closing (2002)17 March 2000 = 1000
Date Jan Feb Mar Apr May Jun Jul Aug Sep Oct Nov Dec
1 - 204.99 205.99 - - - - 154.50 - - 110.72 -2 208.16 - - 203.41 208.58 - 176.54 151.26 139.79 115.41 - 114.943 210.62 - - 203.18 209.08 201.49 178.46 - 137.38 111.99 - 116.414 213.75 202.40 209.56 202.62 - 199.19 179.98 - 137.05 111.69 113.15 113.445 - 201.70 211.20 - - 199.43 180.36 146.12 135.68 - 112.45 114.066 - 200.30 211.58 - 210.73 198.84 - 143.21 133.51 - 111.64 113.867 215.26 199.01 209.77 - 215.89 199.40 - 146.00 - 108.40 112.80 -8 215.85 199.79 211.56 200.98 215.24 - 180.31 144.42 - 107.69 112.92 -9 211.26 - - 202.22 212.27 - 179.94 144.03 132.85 107.12 - 114.34
10 215.63 - - 201.75 211.10 198.31 180.93 - 134.82 105.48 - 115.1811 213.33 202.88 217.44 202.85 - 198.50 178.00 - 134.59 108.78 111.37 113.3612 - - 216.12 202.07 - 197.43 178.69 141.47 134.44 - 110.76 113.0413 - - 213.78 - 209.61 198.57 - 142.29 132.36 - 110.04 113.2114 211.58 - 214.50 - 209.55 194.99 - 140.61 - - 109.86 -15 207.04 205.51 210.73 202.33 210.59 - 175.77 142.54 - 111.59 112.17 -16 207.71 - - 203.49 209.30 - 172.10 142.88 129.29 111.37 - 112.2717 211.16 - - 206.68 210.48 189.42 167.86 - 129.75 112.82 - 112.6718 209.56 207.35 209.26 207.06 - 187.22 168.31 - 127.59 115.76 111.49 112.1119 - 209.14 209.16 206.35 - 183.22 165.84 145.11 127.19 - 111.49 111.5120 - 209.88 208.76 - - 182.60 - 145.17 126.11 - 110.85 111.5421 206.97 209.92 206.33 - 208.45 180.00 - 147.05 - 113.88 111.16 -22 205.03 207.15 206.89 204.98 207.50 - 158.01 148.13 - 113.07 113.42 -23 204.01 - - 204.83 206.05 - 160.03 145.80 124.85 117.23 - 111.3524 200.79 - - 205.79 207.15 181.91 156.13 - 122.99 117.53 - 111.4525 201.66 205.26 205.54 206.25 - 179.60 153.68 - 119.88 116.85 116.65 -26 - 204.61 205.33 204.91 - 174.12 146.56 145.07 120.27 - 114.52 -27 - 204.77 206.64 - 206.55 176.62 - 143.71 120.05 - 114.95 110.3928 201.46 205.19 204.49 - 205.85 177.70 - 142.73 - 116.41 116.09 -29 207.54 - - 205.20 204.20 - 150.46 141.68 - 113.03 114.70 -30 205.48 - - 205.75 203.44 - 153.37 142.31 118.16 112.56 - 108.5631 204.76 - - - 202.77 - 155.49 - - 111.73 - 110.40
High 215.85 209.92 217.44 207.06 215.89 201.49 180.93 154.50 139.79 117.53 116.65 116.41
Low 200.79 199.01 204.49 200.98 202.77 174.12 146.56 140.61 118.16 105.48 109.86 108.56
Avg 208.57 204.70 209.73 204.14 208.78 189.93 168.04 144.82 129.46 112.40 112.53 112.70
Growth Enterprise Index, daily movement (2002)
10 MAV 50 MAVDaily Movement
90
105
120
135
150
165
180
195
210
225
240
217.44(11/03)
105.48(10/10)
01/02 02/02 03/02 04/02 05/02 06/02 07/02 08/02 09/02 10/02 11/02 12/02
Index
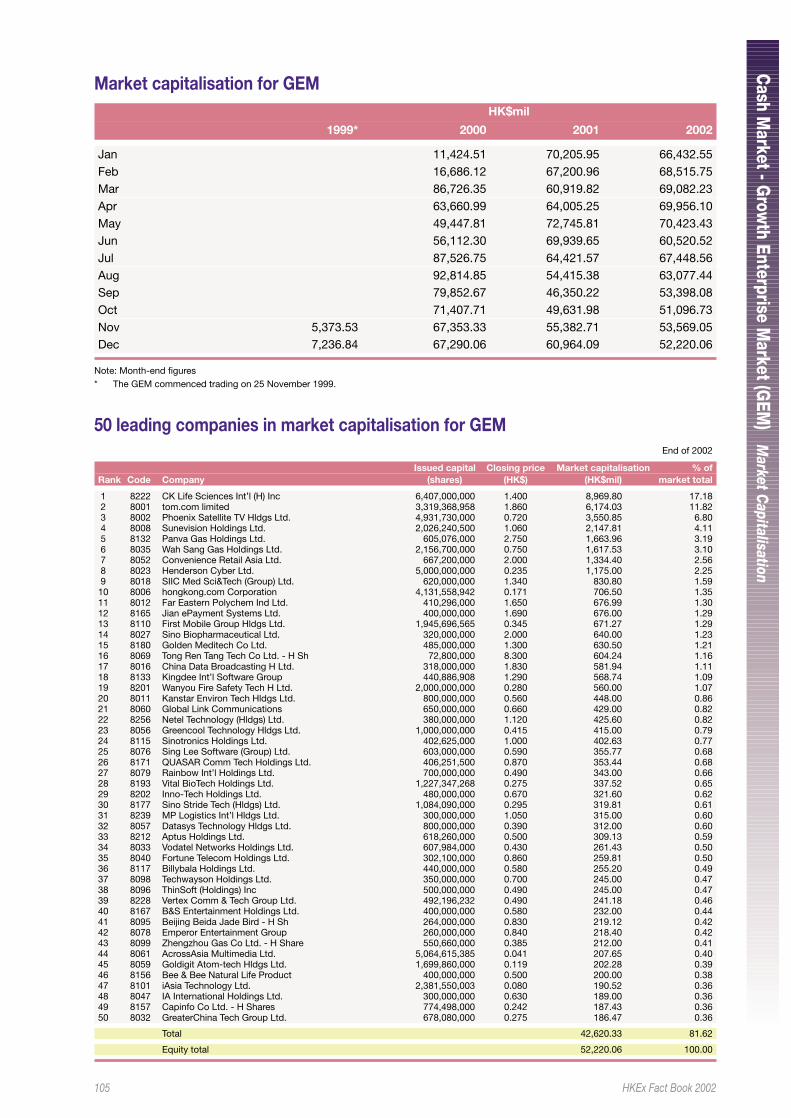
105 HKEx Fact Book 2002
Cash M
arket - Grow
th Enterprise Market (G
EM)
Market C
apitalisation
50 leading companies in market capitalisation for GEM End of 2002
Issued capital Closing price Market capitalisation % ofRank Code Company (shares) (HK$) (HK$mil) market total
1 8222 CK Life Sciences Int’l (H) Inc 6,407,000,000 1.400 8,969.80 17.18 2 8001 tom.com limited 3,319,368,958 1.860 6,174.03 11.82 3 8002 Phoenix Satellite TV Hldgs Ltd. 4,931,730,000 0.720 3,550.85 6.80 4 8008 Sunevision Holdings Ltd. 2,026,240,500 1.060 2,147.81 4.11 5 8132 Panva Gas Holdings Ltd. 605,076,000 2.750 1,663.96 3.19 6 8035 Wah Sang Gas Holdings Ltd. 2,156,700,000 0.750 1,617.53 3.10 7 8052 Convenience Retail Asia Ltd. 667,200,000 2.000 1,334.40 2.56 8 8023 Henderson Cyber Ltd. 5,000,000,000 0.235 1,175.00 2.25 9 8018 SIIC Med Sci&Tech (Group) Ltd. 620,000,000 1.340 830.80 1.5910 8006 hongkong.com Corporation 4,131,558,942 0.171 706.50 1.3511 8012 Far Eastern Polychem Ind Ltd. 410,296,000 1.650 676.99 1.3012 8165 Jian ePayment Systems Ltd. 400,000,000 1.690 676.00 1.2913 8110 First Mobile Group Hldgs Ltd. 1,945,696,565 0.345 671.27 1.2914 8027 Sino Biopharmaceutical Ltd. 320,000,000 2.000 640.00 1.2315 8180 Golden Meditech Co Ltd. 485,000,000 1.300 630.50 1.2116 8069 Tong Ren Tang Tech Co Ltd. - H Sh 72,800,000 8.300 604.24 1.1617 8016 China Data Broadcasting H Ltd. 318,000,000 1.830 581.94 1.1118 8133 Kingdee Int’l Software Group 440,886,908 1.290 568.74 1.0919 8201 Wanyou Fire Safety Tech H Ltd. 2,000,000,000 0.280 560.00 1.0720 8011 Kanstar Environ Tech Hldgs Ltd. 800,000,000 0.560 448.00 0.8621 8060 Global Link Communications 650,000,000 0.660 429.00 0.8222 8256 Netel Technology (Hldgs) Ltd. 380,000,000 1.120 425.60 0.8223 8056 Greencool Technology Hldgs Ltd. 1,000,000,000 0.415 415.00 0.7924 8115 Sinotronics Holdings Ltd. 402,625,000 1.000 402.63 0.7725 8076 Sing Lee Software (Group) Ltd. 603,000,000 0.590 355.77 0.6826 8171 QUASAR Comm Tech Holdings Ltd. 406,251,500 0.870 353.44 0.6827 8079 Rainbow Int’l Holdings Ltd. 700,000,000 0.490 343.00 0.6628 8193 Vital BioTech Holdings Ltd. 1,227,347,268 0.275 337.52 0.6529 8202 Inno-Tech Holdings Ltd. 480,000,000 0.670 321.60 0.6230 8177 Sino Stride Tech (Hldgs) Ltd. 1,084,090,000 0.295 319.81 0.6131 8239 MP Logistics Int’l Hldgs Ltd. 300,000,000 1.050 315.00 0.6032 8057 Datasys Technology Hldgs Ltd. 800,000,000 0.390 312.00 0.6033 8212 Aptus Holdings Ltd. 618,260,000 0.500 309.13 0.5934 8033 Vodatel Networks Holdings Ltd. 607,984,000 0.430 261.43 0.5035 8040 Fortune Telecom Holdings Ltd. 302,100,000 0.860 259.81 0.5036 8117 Billybala Holdings Ltd. 440,000,000 0.580 255.20 0.4937 8098 Techwayson Holdings Ltd. 350,000,000 0.700 245.00 0.4738 8096 ThinSoft (Holdings) Inc 500,000,000 0.490 245.00 0.4739 8228 Vertex Comm & Tech Group Ltd. 492,196,232 0.490 241.18 0.4640 8167 B&S Entertainment Holdings Ltd. 400,000,000 0.580 232.00 0.4441 8095 Beijing Beida Jade Bird - H Sh 264,000,000 0.830 219.12 0.4242 8078 Emperor Entertainment Group 260,000,000 0.840 218.40 0.4243 8099 Zhengzhou Gas Co Ltd. - H Share 550,660,000 0.385 212.00 0.4144 8061 AcrossAsia Multimedia Ltd. 5,064,615,385 0.041 207.65 0.4045 8059 Goldigit Atom-tech Hldgs Ltd. 1,699,860,000 0.119 202.28 0.3946 8156 Bee & Bee Natural Life Product 400,000,000 0.500 200.00 0.3847 8101 iAsia Technology Ltd. 2,381,550,003 0.080 190.52 0.3648 8047 IA International Holdings Ltd. 300,000,000 0.630 189.00 0.3649 8157 Capinfo Co Ltd. - H Shares 774,498,000 0.242 187.43 0.3650 8032 GreaterChina Tech Group Ltd. 678,080,000 0.275 186.47 0.36
Total 42,620.33 81.62
Equity total 52,220.06 100.00
Market capitalisation for GEMHK$mil
1999* 2000 2001 2002
Jan 11,424.51 70,205.95 66,432.55Feb 16,686.12 67,200.96 68,515.75Mar 86,726.35 60,919.82 69,082.23Apr 63,660.99 64,005.25 69,956.10May 49,447.81 72,745.81 70,423.43Jun 56,112.30 69,939.65 60,520.52Jul 87,526.75 64,421.57 67,448.56Aug 92,814.85 54,415.38 63,077.44Sep 79,852.67 46,350.22 53,398.08Oct 71,407.71 49,631.98 51,096.73Nov 5,373.53 67,353.33 55,382.71 53,569.05Dec 7,236.84 67,290.06 60,964.09 52,220.06
Note: Month-end figures* The GEM commenced trading on 25 November 1999.
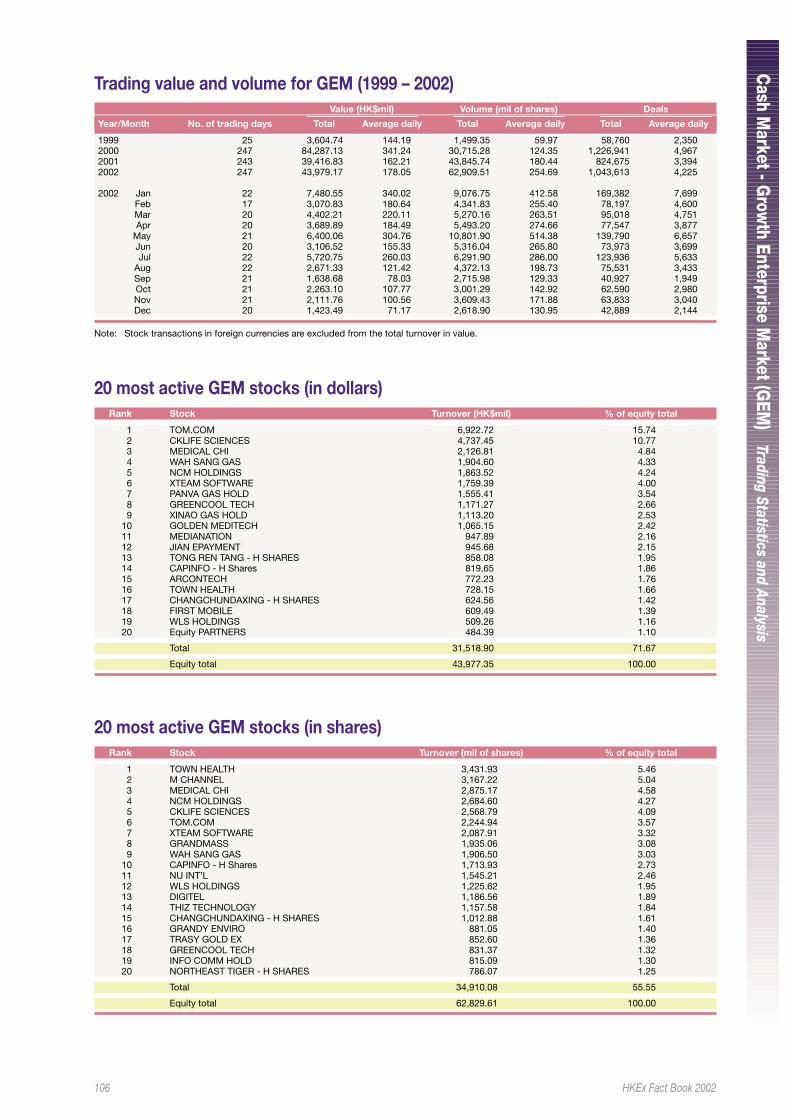
106 HKEx Fact Book 2002
Cash M
arket - Grow
th Enterprise Market (G
EM)
Trading Statistics and Analysis
20 most active GEM stocks (in dollars)Rank Stock Turnover (HK$mil) % of equity total
1 TOM.COM 6,922.72 15.742 CKLIFE SCIENCES 4,737.45 10.773 MEDICAL CHI 2,126.81 4.844 WAH SANG GAS 1,904.60 4.335 NCM HOLDINGS 1,863.52 4.246 XTEAM SOFTWARE 1,759.39 4.007 PANVA GAS HOLD 1,555.41 3.548 GREENCOOL TECH 1,171.27 2.669 XINAO GAS HOLD 1,113.20 2.53
10 GOLDEN MEDITECH 1,065.15 2.4211 MEDIANATION 947.89 2.1612 JIAN EPAYMENT 945.68 2.1513 TONG REN TANG - H SHARES 858.08 1.9514 CAPINFO - H Shares 819.65 1.8615 ARCONTECH 772.23 1.7616 TOWN HEALTH 728.15 1.6617 CHANGCHUNDAXING - H SHARES 624.56 1.4218 FIRST MOBILE 609.49 1.3919 WLS HOLDINGS 509.26 1.1620 Equity PARTNERS 484.39 1.10
Total 31,518.90 71.67
Equity total 43,977.35 100.00
20 most active GEM stocks (in shares)Rank Stock Turnover (mil of shares) % of equity total
1 TOWN HEALTH 3,431.93 5.462 M CHANNEL 3,167.22 5.043 MEDICAL CHI 2,875.17 4.584 NCM HOLDINGS 2,684.60 4.275 CKLIFE SCIENCES 2,568.79 4.096 TOM.COM 2,244.94 3.577 XTEAM SOFTWARE 2,087.91 3.328 GRANDMASS 1,935.06 3.089 WAH SANG GAS 1,906.50 3.03
10 CAPINFO - H Shares 1,713.93 2.7311 NU INT’L 1,545.21 2.4612 WLS HOLDINGS 1,225.62 1.9513 DIGITEL 1,186.56 1.8914 THIZ TECHNOLOGY 1,157.58 1.8415 CHANGCHUNDAXING - H SHARES 1,012.88 1.6116 GRANDY ENVIRO 881.05 1.4017 TRASY GOLD EX 852.60 1.3618 GREENCOOL TECH 831.37 1.3219 INFO COMM HOLD 815.09 1.3020 NORTHEAST TIGER - H SHARES 786.07 1.25
Total 34,910.08 55.55
Equity total 62,829.61 100.00
Trading value and volume for GEM (1999 – 2002)Value (HK$mil) Volume (mil of shares) Deals
Year/Month No. of trading days Total Average daily Total Average daily Total Average daily
1999 25 3,604.74 144.19 1,499.35 59.97 58,760 2,3502000 247 84,287.13 341.24 30,715.28 124.35 1,226,941 4,9672001 243 39,416.83 162.21 43,845.74 180.44 824,675 3,3942002 247 43,979.17 178.05 62,909.51 254.69 1,043,613 4,225
2002 Jan 22 7,480.55 340.02 9,076.75 412.58 169,382 7,699Feb 17 3,070.83 180.64 4,341.83 255.40 78,197 4,600Mar 20 4,402.21 220.11 5,270.16 263.51 95,018 4,751Apr 20 3,689.89 184.49 5,493.20 274.66 77,547 3,877
May 21 6,400.06 304.76 10,801.90 514.38 139,790 6,657Jun 20 3,106.52 155.33 5,316.04 265.80 73,973 3,699Jul 22 5,720.75 260.03 6,291.90 286.00 123,936 5,633
Aug 22 2,671.33 121.42 4,372.13 198.73 75,531 3,433Sep 21 1,638.68 78.03 2,715.98 129.33 40,927 1,949Oct 21 2,263.10 107.77 3,001.29 142.92 62,590 2,980Nov 21 2,111.76 100.56 3,609.43 171.88 63,833 3,040Dec 20 1,423.49 71.17 2,618.90 130.95 42,889 2,144
Note: Stock transactions in foreign currencies are excluded from the total turnover in value.
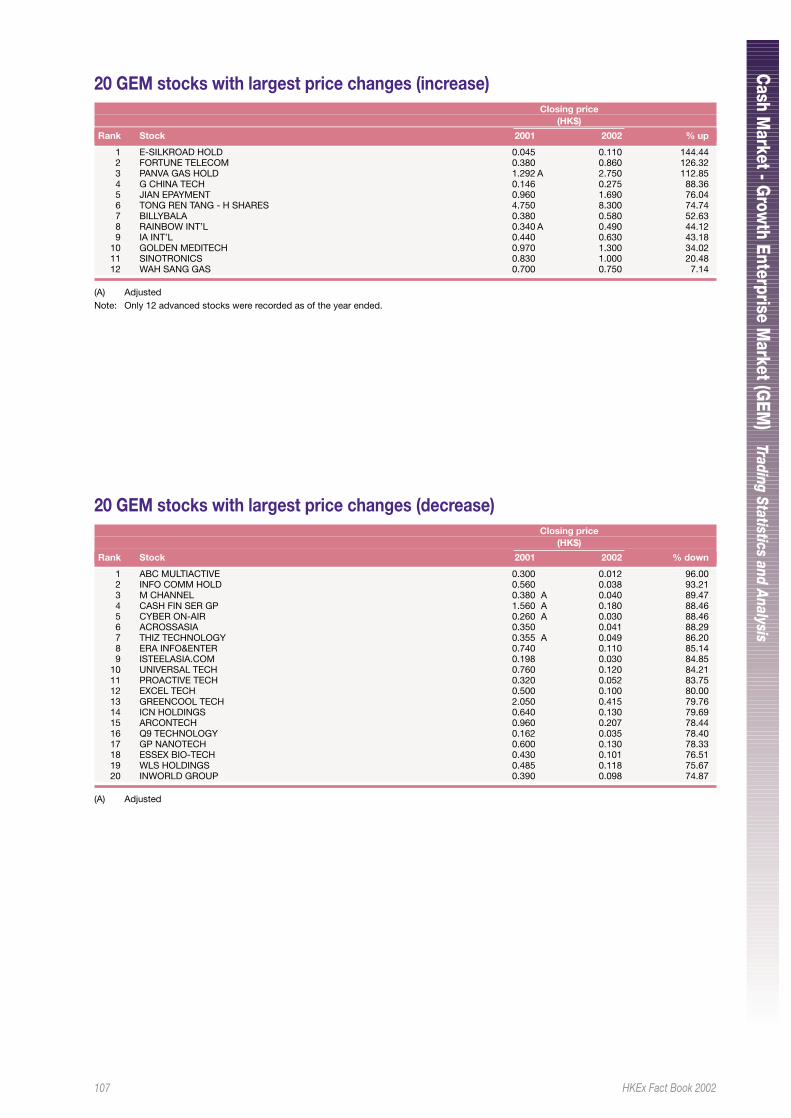
107 HKEx Fact Book 2002
Cash M
arket - Grow
th Enterprise Market (G
EM)
Trading Statistics and Analysis
20 GEM stocks with largest price changes (increase)Closing price
(HK$)
Rank Stock 2001 2002 % up
1 E-SILKROAD HOLD 0.045 0.110 144.442 FORTUNE TELECOM 0.380 0.860 126.323 PANVA GAS HOLD 1.292 A 2.750 112.854 G CHINA TECH 0.146 0.275 88.365 JIAN EPAYMENT 0.960 1.690 76.046 TONG REN TANG - H SHARES 4.750 8.300 74.747 BILLYBALA 0.380 0.580 52.638 RAINBOW INT’L 0.340 A 0.490 44.129 IA INT’L 0.440 0.630 43.18
10 GOLDEN MEDITECH 0.970 1.300 34.0211 SINOTRONICS 0.830 1.000 20.4812 WAH SANG GAS 0.700 0.750 7.14
(A) AdjustedNote: Only 12 advanced stocks were recorded as of the year ended.
20 GEM stocks with largest price changes (decrease)Closing price
(HK$)
Rank Stock 2001 2002 % down
1 ABC MULTIACTIVE 0.300 0.012 96.002 INFO COMM HOLD 0.560 0.038 93.213 M CHANNEL 0.380 A 0.040 89.474 CASH FIN SER GP 1.560 A 0.180 88.465 CYBER ON-AIR 0.260 A 0.030 88.466 ACROSSASIA 0.350 0.041 88.297 THIZ TECHNOLOGY 0.355 A 0.049 86.208 ERA INFO&ENTER 0.740 0.110 85.149 ISTEELASIA.COM 0.198 0.030 84.85
10 UNIVERSAL TECH 0.760 0.120 84.2111 PROACTIVE TECH 0.320 0.052 83.7512 EXCEL TECH 0.500 0.100 80.0013 GREENCOOL TECH 2.050 0.415 79.7614 ICN HOLDINGS 0.640 0.130 79.6915 ARCONTECH 0.960 0.207 78.4416 Q9 TECHNOLOGY 0.162 0.035 78.4017 GP NANOTECH 0.600 0.130 78.3318 ESSEX BIO-TECH 0.430 0.101 76.5119 WLS HOLDINGS 0.485 0.118 75.6720 INWORLD GROUP 0.390 0.098 74.87
(A) Adjusted
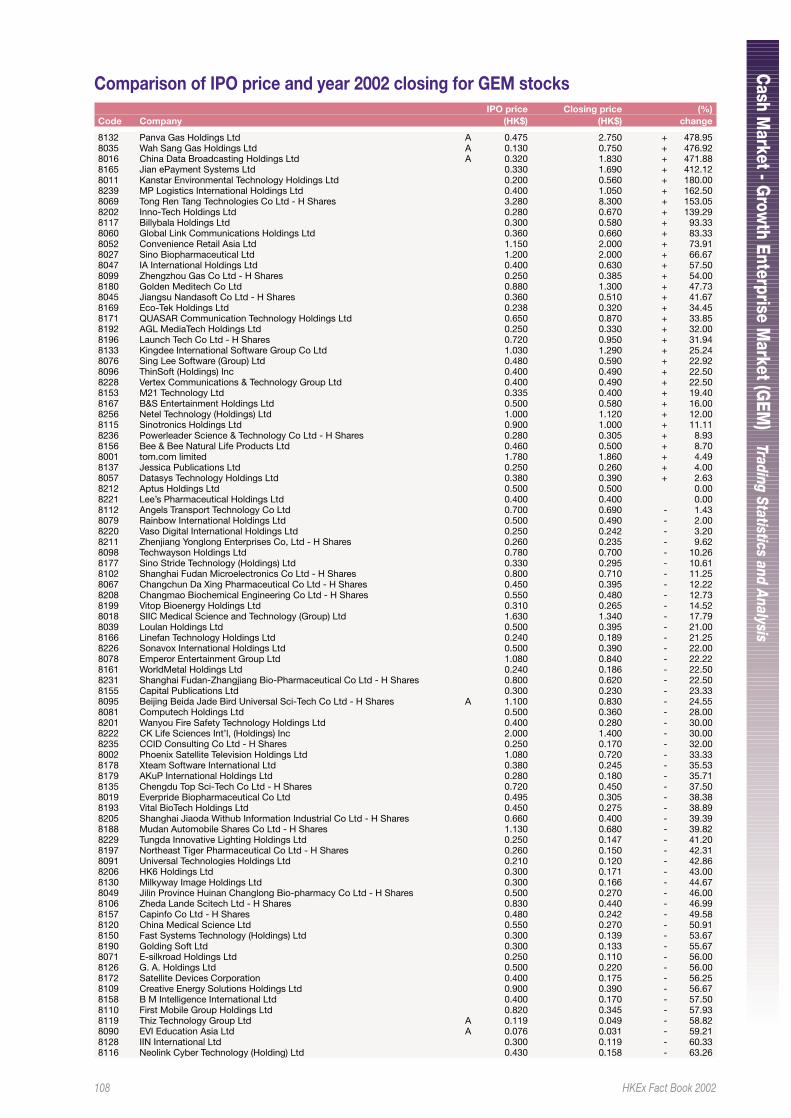
108 HKEx Fact Book 2002
Cash M
arket - Grow
th Enterprise Market (G
EM)
Trading Statistics and Analysis
Comparison of IPO price and year 2002 closing for GEM stocksIPO price Closing price (%)
Code Company (HK$) (HK$) change
8132 Panva Gas Holdings Ltd A 0.475 2.750 + 478.958035 Wah Sang Gas Holdings Ltd A 0.130 0.750 + 476.928016 China Data Broadcasting Holdings Ltd A 0.320 1.830 + 471.888165 Jian ePayment Systems Ltd 0.330 1.690 + 412.128011 Kanstar Environmental Technology Holdings Ltd 0.200 0.560 + 180.008239 MP Logistics International Holdings Ltd 0.400 1.050 + 162.508069 Tong Ren Tang Technologies Co Ltd - H Shares 3.280 8.300 + 153.058202 Inno-Tech Holdings Ltd 0.280 0.670 + 139.298117 Billybala Holdings Ltd 0.300 0.580 + 93.338060 Global Link Communications Holdings Ltd 0.360 0.660 + 83.338052 Convenience Retail Asia Ltd 1.150 2.000 + 73.918027 Sino Biopharmaceutical Ltd 1.200 2.000 + 66.678047 IA International Holdings Ltd 0.400 0.630 + 57.508099 Zhengzhou Gas Co Ltd - H Shares 0.250 0.385 + 54.008180 Golden Meditech Co Ltd 0.880 1.300 + 47.738045 Jiangsu Nandasoft Co Ltd - H Shares 0.360 0.510 + 41.678169 Eco-Tek Holdings Ltd 0.238 0.320 + 34.458171 QUASAR Communication Technology Holdings Ltd 0.650 0.870 + 33.858192 AGL MediaTech Holdings Ltd 0.250 0.330 + 32.008196 Launch Tech Co Ltd - H Shares 0.720 0.950 + 31.948133 Kingdee International Software Group Co Ltd 1.030 1.290 + 25.248076 Sing Lee Software (Group) Ltd 0.480 0.590 + 22.928096 ThinSoft (Holdings) Inc 0.400 0.490 + 22.508228 Vertex Communications & Technology Group Ltd 0.400 0.490 + 22.508153 M21 Technology Ltd 0.335 0.400 + 19.408167 B&S Entertainment Holdings Ltd 0.500 0.580 + 16.008256 Netel Technology (Holdings) Ltd 1.000 1.120 + 12.008115 Sinotronics Holdings Ltd 0.900 1.000 + 11.118236 Powerleader Science & Technology Co Ltd - H Shares 0.280 0.305 + 8.938156 Bee & Bee Natural Life Products Ltd 0.460 0.500 + 8.708001 tom.com limited 1.780 1.860 + 4.498137 Jessica Publications Ltd 0.250 0.260 + 4.008057 Datasys Technology Holdings Ltd 0.380 0.390 + 2.638212 Aptus Holdings Ltd 0.500 0.500 0.008221 Lee’s Pharmaceutical Holdings Ltd 0.400 0.400 0.008112 Angels Transport Technology Co Ltd 0.700 0.690 - 1.438079 Rainbow International Holdings Ltd 0.500 0.490 - 2.008220 Vaso Digital International Holdings Ltd 0.250 0.242 - 3.208211 Zhenjiang Yonglong Enterprises Co, Ltd - H Shares 0.260 0.235 - 9.628098 Techwayson Holdings Ltd 0.780 0.700 - 10.268177 Sino Stride Technology (Holdings) Ltd 0.330 0.295 - 10.618102 Shanghai Fudan Microelectronics Co Ltd - H Shares 0.800 0.710 - 11.258067 Changchun Da Xing Pharmaceutical Co Ltd - H Shares 0.450 0.395 - 12.228208 Changmao Biochemical Engineering Co Ltd - H Shares 0.550 0.480 - 12.738199 Vitop Bioenergy Holdings Ltd 0.310 0.265 - 14.528018 SIIC Medical Science and Technology (Group) Ltd 1.630 1.340 - 17.798039 Loulan Holdings Ltd 0.500 0.395 - 21.008166 Linefan Technology Holdings Ltd 0.240 0.189 - 21.258226 Sonavox International Holdings Ltd 0.500 0.390 - 22.008078 Emperor Entertainment Group Ltd 1.080 0.840 - 22.228161 WorldMetal Holdings Ltd 0.240 0.186 - 22.508231 Shanghai Fudan-Zhangjiang Bio-Pharmaceutical Co Ltd - H Shares 0.800 0.620 - 22.508155 Capital Publications Ltd 0.300 0.230 - 23.338095 Beijing Beida Jade Bird Universal Sci-Tech Co Ltd - H Shares A 1.100 0.830 - 24.558081 Computech Holdings Ltd 0.500 0.360 - 28.008201 Wanyou Fire Safety Technology Holdings Ltd 0.400 0.280 - 30.008222 CK Life Sciences Int’l, (Holdings) Inc 2.000 1.400 - 30.008235 CCID Consulting Co Ltd - H Shares 0.250 0.170 - 32.008002 Phoenix Satellite Television Holdings Ltd 1.080 0.720 - 33.338178 Xteam Software International Ltd 0.380 0.245 - 35.538179 AKuP International Holdings Ltd 0.280 0.180 - 35.718135 Chengdu Top Sci-Tech Co Ltd - H Shares 0.720 0.450 - 37.508019 Everpride Biopharmaceutical Co Ltd 0.495 0.305 - 38.388193 Vital BioTech Holdings Ltd 0.450 0.275 - 38.898205 Shanghai Jiaoda Withub Information Industrial Co Ltd - H Shares 0.660 0.400 - 39.398188 Mudan Automobile Shares Co Ltd - H Shares 1.130 0.680 - 39.828229 Tungda Innovative Lighting Holdings Ltd 0.250 0.147 - 41.208197 Northeast Tiger Pharmaceutical Co Ltd - H Shares 0.260 0.150 - 42.318091 Universal Technologies Holdings Ltd 0.210 0.120 - 42.868206 HK6 Holdings Ltd 0.300 0.171 - 43.008130 Milkyway Image Holdings Ltd 0.300 0.166 - 44.678049 Jilin Province Huinan Changlong Bio-pharmacy Co Ltd - H Shares 0.500 0.270 - 46.008106 Zheda Lande Scitech Ltd - H Shares 0.830 0.440 - 46.998157 Capinfo Co Ltd - H Shares 0.480 0.242 - 49.588120 China Medical Science Ltd 0.550 0.270 - 50.918150 Fast Systems Technology (Holdings) Ltd 0.300 0.139 - 53.678190 Golding Soft Ltd 0.300 0.133 - 55.678071 E-silkroad Holdings Ltd 0.250 0.110 - 56.008126 G. A. Holdings Ltd 0.500 0.220 - 56.008172 Satellite Devices Corporation 0.400 0.175 - 56.258109 Creative Energy Solutions Holdings Ltd 0.900 0.390 - 56.678158 B M Intelligence International Ltd 0.400 0.170 - 57.508110 First Mobile Group Holdings Ltd 0.820 0.345 - 57.938119 Thiz Technology Group Ltd A 0.119 0.049 - 58.828090 EVI Education Asia Ltd A 0.076 0.031 - 59.218128 IIN International Ltd 0.300 0.119 - 60.338116 Neolink Cyber Technology (Holding) Ltd 0.430 0.158 - 63.26
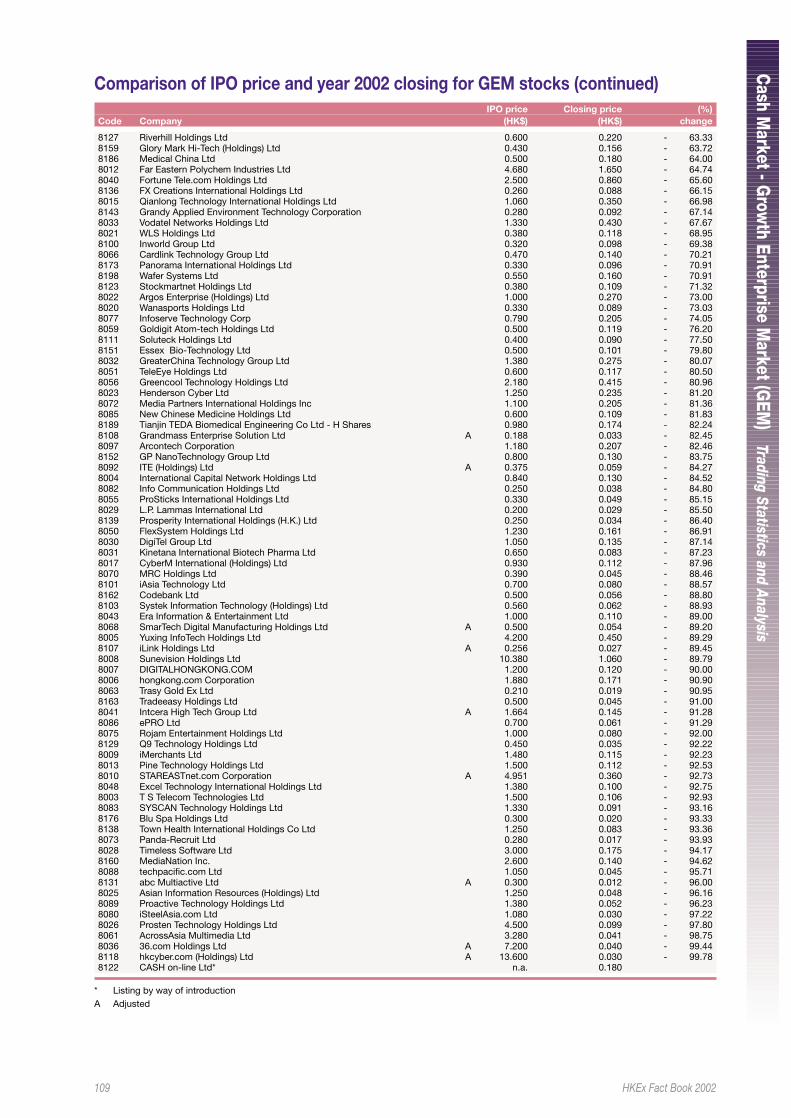
109 HKEx Fact Book 2002
Cash M
arket - Grow
th Enterprise Market (G
EM)
Trading Statistics and Analysis
Comparison of IPO price and year 2002 closing for GEM stocks (continued)IPO price Closing price (%)
Code Company (HK$) (HK$) change
8127 Riverhill Holdings Ltd 0.600 0.220 - 63.338159 Glory Mark Hi-Tech (Holdings) Ltd 0.430 0.156 - 63.728186 Medical China Ltd 0.500 0.180 - 64.008012 Far Eastern Polychem Industries Ltd 4.680 1.650 - 64.748040 Fortune Tele.com Holdings Ltd 2.500 0.860 - 65.608136 FX Creations International Holdings Ltd 0.260 0.088 - 66.158015 Qianlong Technology International Holdings Ltd 1.060 0.350 - 66.988143 Grandy Applied Environment Technology Corporation 0.280 0.092 - 67.148033 Vodatel Networks Holdings Ltd 1.330 0.430 - 67.678021 WLS Holdings Ltd 0.380 0.118 - 68.958100 Inworld Group Ltd 0.320 0.098 - 69.388066 Cardlink Technology Group Ltd 0.470 0.140 - 70.218173 Panorama International Holdings Ltd 0.330 0.096 - 70.918198 Wafer Systems Ltd 0.550 0.160 - 70.918123 Stockmartnet Holdings Ltd 0.380 0.109 - 71.328022 Argos Enterprise (Holdings) Ltd 1.000 0.270 - 73.008020 Wanasports Holdings Ltd 0.330 0.089 - 73.038077 Infoserve Technology Corp 0.790 0.205 - 74.058059 Goldigit Atom-tech Holdings Ltd 0.500 0.119 - 76.208111 Soluteck Holdings Ltd 0.400 0.090 - 77.508151 Essex Bio-Technology Ltd 0.500 0.101 - 79.808032 GreaterChina Technology Group Ltd 1.380 0.275 - 80.078051 TeleEye Holdings Ltd 0.600 0.117 - 80.508056 Greencool Technology Holdings Ltd 2.180 0.415 - 80.968023 Henderson Cyber Ltd 1.250 0.235 - 81.208072 Media Partners International Holdings Inc 1.100 0.205 - 81.368085 New Chinese Medicine Holdings Ltd 0.600 0.109 - 81.838189 Tianjin TEDA Biomedical Engineering Co Ltd - H Shares 0.980 0.174 - 82.248108 Grandmass Enterprise Solution Ltd A 0.188 0.033 - 82.458097 Arcontech Corporation 1.180 0.207 - 82.468152 GP NanoTechnology Group Ltd 0.800 0.130 - 83.758092 ITE (Holdings) Ltd A 0.375 0.059 - 84.278004 International Capital Network Holdings Ltd 0.840 0.130 - 84.528082 Info Communication Holdings Ltd 0.250 0.038 - 84.808055 ProSticks International Holdings Ltd 0.330 0.049 - 85.158029 L.P. Lammas International Ltd 0.200 0.029 - 85.508139 Prosperity International Holdings (H.K.) Ltd 0.250 0.034 - 86.408050 FlexSystem Holdings Ltd 1.230 0.161 - 86.918030 DigiTel Group Ltd 1.050 0.135 - 87.148031 Kinetana International Biotech Pharma Ltd 0.650 0.083 - 87.238017 CyberM International (Holdings) Ltd 0.930 0.112 - 87.968070 MRC Holdings Ltd 0.390 0.045 - 88.468101 iAsia Technology Ltd 0.700 0.080 - 88.578162 Codebank Ltd 0.500 0.056 - 88.808103 Systek Information Technology (Holdings) Ltd 0.560 0.062 - 88.938043 Era Information & Entertainment Ltd 1.000 0.110 - 89.008068 SmarTech Digital Manufacturing Holdings Ltd A 0.500 0.054 - 89.208005 Yuxing InfoTech Holdings Ltd 4.200 0.450 - 89.298107 iLink Holdings Ltd A 0.256 0.027 - 89.458008 Sunevision Holdings Ltd 10.380 1.060 - 89.798007 DIGITALHONGKONG.COM 1.200 0.120 - 90.008006 hongkong.com Corporation 1.880 0.171 - 90.908063 Trasy Gold Ex Ltd 0.210 0.019 - 90.958163 Tradeeasy Holdings Ltd 0.500 0.045 - 91.008041 Intcera High Tech Group Ltd A 1.664 0.145 - 91.288086 ePRO Ltd 0.700 0.061 - 91.298075 Rojam Entertainment Holdings Ltd 1.000 0.080 - 92.008129 Q9 Technology Holdings Ltd 0.450 0.035 - 92.228009 iMerchants Ltd 1.480 0.115 - 92.238013 Pine Technology Holdings Ltd 1.500 0.112 - 92.538010 STAREASTnet.com Corporation A 4.951 0.360 - 92.738048 Excel Technology International Holdings Ltd 1.380 0.100 - 92.758003 T S Telecom Technologies Ltd 1.500 0.106 - 92.938083 SYSCAN Technology Holdings Ltd 1.330 0.091 - 93.168176 Blu Spa Holdings Ltd 0.300 0.020 - 93.338138 Town Health International Holdings Co Ltd 1.250 0.083 - 93.368073 Panda-Recruit Ltd 0.280 0.017 - 93.938028 Timeless Software Ltd 3.000 0.175 - 94.178160 MediaNation Inc. 2.600 0.140 - 94.628088 techpacific.com Ltd 1.050 0.045 - 95.718131 abc Multiactive Ltd A 0.300 0.012 - 96.008025 Asian Information Resources (Holdings) Ltd 1.250 0.048 - 96.168089 Proactive Technology Holdings Ltd 1.380 0.052 - 96.238080 iSteelAsia.com Ltd 1.080 0.030 - 97.228026 Prosten Technology Holdings Ltd 4.500 0.099 - 97.808061 AcrossAsia Multimedia Ltd 3.280 0.041 - 98.758036 36.com Holdings Ltd A 7.200 0.040 - 99.448118 hkcyber.com (Holdings) Ltd A 13.600 0.030 - 99.788122 CASH on-line Ltd* n.a. 0.180
* Listing by way of introductionA Adjusted
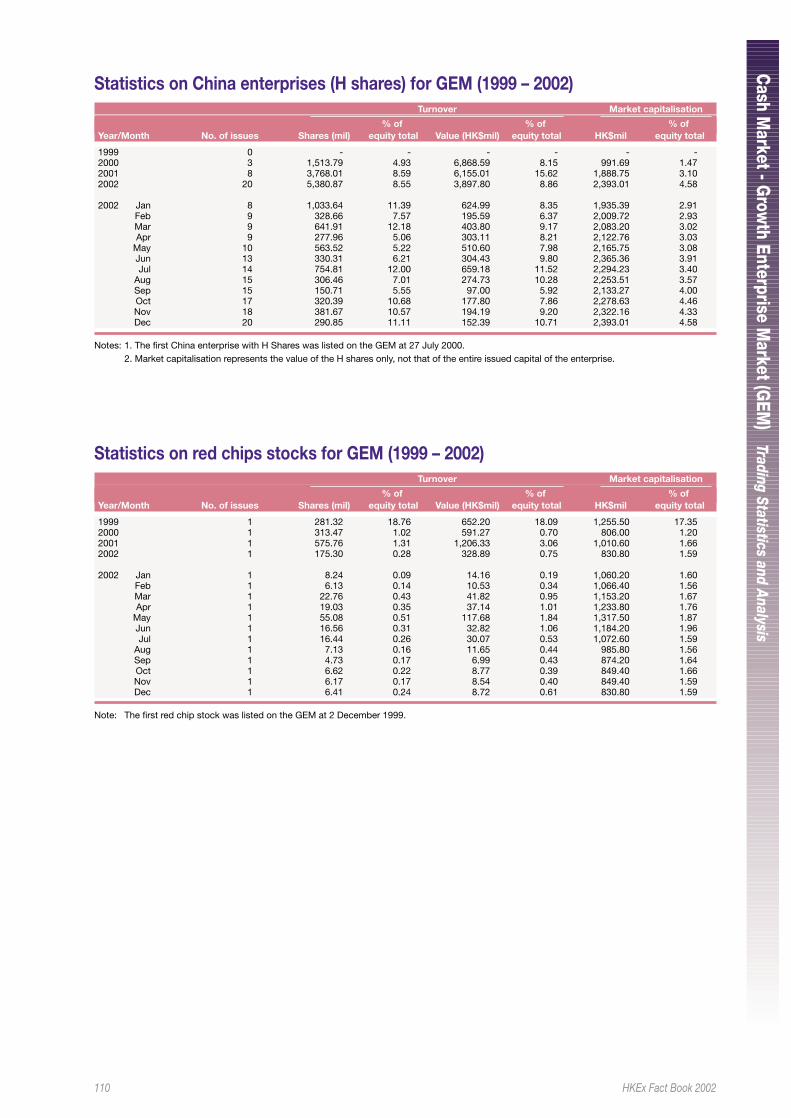
110 HKEx Fact Book 2002
Cash M
arket - Grow
th Enterprise Market (G
EM)
Trading Statistics and Analysis
Statistics on China enterprises (H shares) for GEM (1999 – 2002)Turnover Market capitalisation
% of % of % ofYear/Month No. of issues Shares (mil) equity total Value (HK$mil) equity total HK$mil equity total
1999 0 - - - - - -2000 3 1,513.79 4.93 6,868.59 8.15 991.69 1.472001 8 3,768.01 8.59 6,155.01 15.62 1,888.75 3.102002 20 5,380.87 8.55 3,897.80 8.86 2,393.01 4.58
2002 Jan 8 1,033.64 11.39 624.99 8.35 1,935.39 2.91Feb 9 328.66 7.57 195.59 6.37 2,009.72 2.93Mar 9 641.91 12.18 403.80 9.17 2,083.20 3.02Apr 9 277.96 5.06 303.11 8.21 2,122.76 3.03
May 10 563.52 5.22 510.60 7.98 2,165.75 3.08Jun 13 330.31 6.21 304.43 9.80 2,365.36 3.91Jul 14 754.81 12.00 659.18 11.52 2,294.23 3.40
Aug 15 306.46 7.01 274.73 10.28 2,253.51 3.57Sep 15 150.71 5.55 97.00 5.92 2,133.27 4.00Oct 17 320.39 10.68 177.80 7.86 2,278.63 4.46Nov 18 381.67 10.57 194.19 9.20 2,322.16 4.33Dec 20 290.85 11.11 152.39 10.71 2,393.01 4.58
Notes: 1. The first China enterprise with H Shares was listed on the GEM at 27 July 2000.2. Market capitalisation represents the value of the H shares only, not that of the entire issued capital of the enterprise.
Statistics on red chips stocks for GEM (1999 – 2002)Turnover Market capitalisation
% of % of % ofYear/Month No. of issues Shares (mil) equity total Value (HK$mil) equity total HK$mil equity total
1999 1 281.32 18.76 652.20 18.09 1,255.50 17.352000 1 313.47 1.02 591.27 0.70 806.00 1.202001 1 575.76 1.31 1,206.33 3.06 1,010.60 1.662002 1 175.30 0.28 328.89 0.75 830.80 1.59
2002 Jan 1 8.24 0.09 14.16 0.19 1,060.20 1.60Feb 1 6.13 0.14 10.53 0.34 1,066.40 1.56Mar 1 22.76 0.43 41.82 0.95 1,153.20 1.67Apr 1 19.03 0.35 37.14 1.01 1,233.80 1.76
May 1 55.08 0.51 117.68 1.84 1,317.50 1.87Jun 1 16.56 0.31 32.82 1.06 1,184.20 1.96Jul 1 16.44 0.26 30.07 0.53 1,072.60 1.59
Aug 1 7.13 0.16 11.65 0.44 985.80 1.56Sep 1 4.73 0.17 6.99 0.43 874.20 1.64Oct 1 6.62 0.22 8.77 0.39 849.40 1.66Nov 1 6.17 0.17 8.54 0.40 849.40 1.59Dec 1 6.41 0.24 8.72 0.61 830.80 1.59
Note: The first red chip stock was listed on the GEM at 2 December 1999.
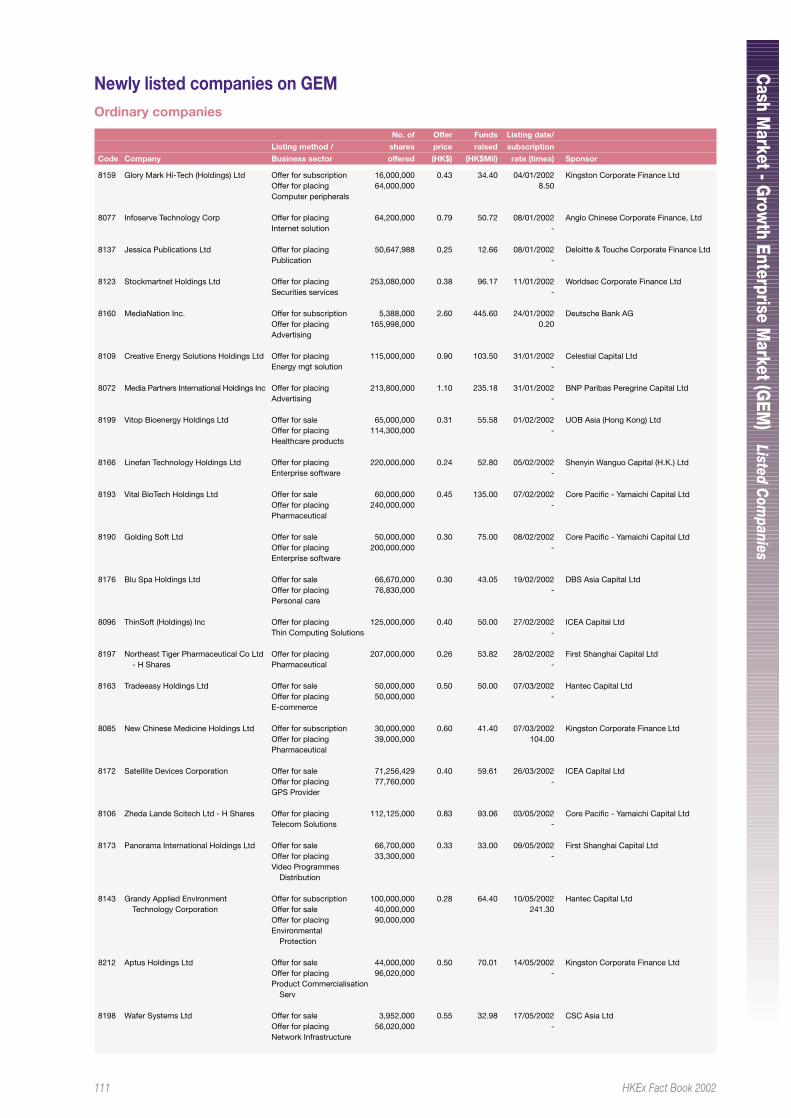
111 HKEx Fact Book 2002
Cash M
arket - Grow
th Enterprise Market (G
EM)
Listed Com
panies
Newly listed companies on GEMOrdinary companies
No. of Offer Funds Listing date/
Listing method / shares price raised subscription
Code Company Business sector offered (HK$) (HK$Mil) rate (times) Sponsor
8159 Glory Mark Hi-Tech (Holdings) Ltd Offer for subscription 16,000,000 0.43 34.40 04/01/2002 Kingston Corporate Finance LtdOffer for placing 64,000,000 8.50Computer peripherals
8077 Infoserve Technology Corp Offer for placing 64,200,000 0.79 50.72 08/01/2002 Anglo Chinese Corporate Finance, LtdInternet solution -
8137 Jessica Publications Ltd Offer for placing 50,647,988 0.25 12.66 08/01/2002 Deloitte & Touche Corporate Finance LtdPublication -
8123 Stockmartnet Holdings Ltd Offer for placing 253,080,000 0.38 96.17 11/01/2002 Worldsec Corporate Finance LtdSecurities services -
8160 MediaNation Inc. Offer for subscription 5,388,000 2.60 445.60 24/01/2002 Deutsche Bank AGOffer for placing 165,998,000 0.20Advertising
8109 Creative Energy Solutions Holdings Ltd Offer for placing 115,000,000 0.90 103.50 31/01/2002 Celestial Capital LtdEnergy mgt solution -
8072 Media Partners International Holdings Inc Offer for placing 213,800,000 1.10 235.18 31/01/2002 BNP Paribas Peregrine Capital LtdAdvertising -
8199 Vitop Bioenergy Holdings Ltd Offer for sale 65,000,000 0.31 55.58 01/02/2002 UOB Asia (Hong Kong) LtdOffer for placing 114,300,000 -Healthcare products
8166 Linefan Technology Holdings Ltd Offer for placing 220,000,000 0.24 52.80 05/02/2002 Shenyin Wanguo Capital (H.K.) LtdEnterprise software -
8193 Vital BioTech Holdings Ltd Offer for sale 60,000,000 0.45 135.00 07/02/2002 Core Pacific - Yamaichi Capital LtdOffer for placing 240,000,000 -Pharmaceutical
8190 Golding Soft Ltd Offer for sale 50,000,000 0.30 75.00 08/02/2002 Core Pacific - Yamaichi Capital LtdOffer for placing 200,000,000 -Enterprise software
8176 Blu Spa Holdings Ltd Offer for sale 66,670,000 0.30 43.05 19/02/2002 DBS Asia Capital LtdOffer for placing 76,830,000 -Personal care
8096 ThinSoft (Holdings) Inc Offer for placing 125,000,000 0.40 50.00 27/02/2002 ICEA Capital LtdThin Computing Solutions -
8197 Northeast Tiger Pharmaceutical Co Ltd Offer for placing 207,000,000 0.26 53.82 28/02/2002 First Shanghai Capital Ltd- H Shares Pharmaceutical -
8163 Tradeeasy Holdings Ltd Offer for sale 50,000,000 0.50 50.00 07/03/2002 Hantec Capital LtdOffer for placing 50,000,000 -E-commerce
8085 New Chinese Medicine Holdings Ltd Offer for subscription 30,000,000 0.60 41.40 07/03/2002 Kingston Corporate Finance LtdOffer for placing 39,000,000 104.00Pharmaceutical
8172 Satellite Devices Corporation Offer for sale 71,256,429 0.40 59.61 26/03/2002 ICEA Capital LtdOffer for placing 77,760,000 -GPS Provider
8106 Zheda Lande Scitech Ltd - H Shares Offer for placing 112,125,000 0.83 93.06 03/05/2002 Core Pacific - Yamaichi Capital LtdTelecom Solutions -
8173 Panorama International Holdings Ltd Offer for sale 66,700,000 0.33 33.00 09/05/2002 First Shanghai Capital LtdOffer for placing 33,300,000 -Video Programmes
Distribution
8143 Grandy Applied Environment Offer for subscription 100,000,000 0.28 64.40 10/05/2002 Hantec Capital LtdTechnology Corporation Offer for sale 40,000,000 241.30
Offer for placing 90,000,000Environmental
Protection
8212 Aptus Holdings Ltd Offer for sale 44,000,000 0.50 70.01 14/05/2002 Kingston Corporate Finance LtdOffer for placing 96,020,000 -Product Commercialisation
Serv
8198 Wafer Systems Ltd Offer for sale 3,952,000 0.55 32.98 17/05/2002 CSC Asia LtdOffer for placing 56,020,000 -Network Infrastructure
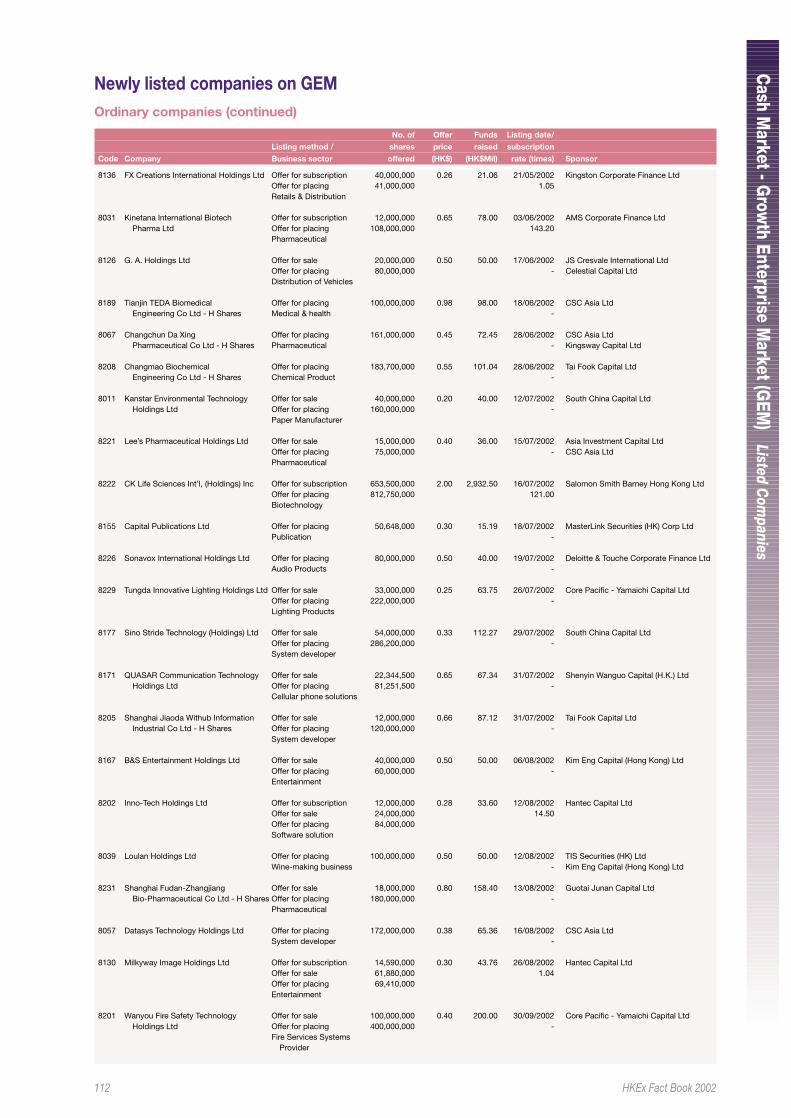
112 HKEx Fact Book 2002
Cash M
arket - Grow
th Enterprise Market (G
EM)
Listed Com
panies
Newly listed companies on GEMOrdinary companies (continued)
No. of Offer Funds Listing date/
Listing method / shares price raised subscription
Code Company Business sector offered (HK$) (HK$Mil) rate (times) Sponsor
8136 FX Creations International Holdings Ltd Offer for subscription 40,000,000 0.26 21.06 21/05/2002 Kingston Corporate Finance LtdOffer for placing 41,000,000 1.05Retails & Distribution
8031 Kinetana International Biotech Offer for subscription 12,000,000 0.65 78.00 03/06/2002 AMS Corporate Finance LtdPharma Ltd Offer for placing 108,000,000 143.20
Pharmaceutical
8126 G. A. Holdings Ltd Offer for sale 20,000,000 0.50 50.00 17/06/2002 JS Cresvale International LtdOffer for placing 80,000,000 - Celestial Capital LtdDistribution of Vehicles
8189 Tianjin TEDA Biomedical Offer for placing 100,000,000 0.98 98.00 18/06/2002 CSC Asia LtdEngineering Co Ltd - H Shares Medical & health -
8067 Changchun Da Xing Offer for placing 161,000,000 0.45 72.45 28/06/2002 CSC Asia LtdPharmaceutical Co Ltd - H Shares Pharmaceutical - Kingsway Capital Ltd
8208 Changmao Biochemical Offer for placing 183,700,000 0.55 101.04 28/06/2002 Tai Fook Capital LtdEngineering Co Ltd - H Shares Chemical Product -
8011 Kanstar Environmental Technology Offer for sale 40,000,000 0.20 40.00 12/07/2002 South China Capital LtdHoldings Ltd Offer for placing 160,000,000 -
Paper Manufacturer
8221 Lee’s Pharmaceutical Holdings Ltd Offer for sale 15,000,000 0.40 36.00 15/07/2002 Asia Investment Capital LtdOffer for placing 75,000,000 - CSC Asia LtdPharmaceutical
8222 CK Life Sciences Int’l, (Holdings) Inc Offer for subscription 653,500,000 2.00 2,932.50 16/07/2002 Salomon Smith Barney Hong Kong LtdOffer for placing 812,750,000 121.00Biotechnology
8155 Capital Publications Ltd Offer for placing 50,648,000 0.30 15.19 18/07/2002 MasterLink Securities (HK) Corp LtdPublication -
8226 Sonavox International Holdings Ltd Offer for placing 80,000,000 0.50 40.00 19/07/2002 Deloitte & Touche Corporate Finance LtdAudio Products -
8229 Tungda Innovative Lighting Holdings Ltd Offer for sale 33,000,000 0.25 63.75 26/07/2002 Core Pacific - Yamaichi Capital LtdOffer for placing 222,000,000 -Lighting Products
8177 Sino Stride Technology (Holdings) Ltd Offer for sale 54,000,000 0.33 112.27 29/07/2002 South China Capital LtdOffer for placing 286,200,000 -System developer
8171 QUASAR Communication Technology Offer for sale 22,344,500 0.65 67.34 31/07/2002 Shenyin Wanguo Capital (H.K.) LtdHoldings Ltd Offer for placing 81,251,500 -
Cellular phone solutions
8205 Shanghai Jiaoda Withub Information Offer for sale 12,000,000 0.66 87.12 31/07/2002 Tai Fook Capital LtdIndustrial Co Ltd - H Shares Offer for placing 120,000,000 -
System developer
8167 B&S Entertainment Holdings Ltd Offer for sale 40,000,000 0.50 50.00 06/08/2002 Kim Eng Capital (Hong Kong) LtdOffer for placing 60,000,000 -Entertainment
8202 Inno-Tech Holdings Ltd Offer for subscription 12,000,000 0.28 33.60 12/08/2002 Hantec Capital LtdOffer for sale 24,000,000 14.50Offer for placing 84,000,000Software solution
8039 Loulan Holdings Ltd Offer for placing 100,000,000 0.50 50.00 12/08/2002 TIS Securities (HK) LtdWine-making business - Kim Eng Capital (Hong Kong) Ltd
8231 Shanghai Fudan-Zhangjiang Offer for sale 18,000,000 0.80 158.40 13/08/2002 Guotai Junan Capital LtdBio-Pharmaceutical Co Ltd - H Shares Offer for placing 180,000,000 -
Pharmaceutical
8057 Datasys Technology Holdings Ltd Offer for placing 172,000,000 0.38 65.36 16/08/2002 CSC Asia LtdSystem developer -
8130 Milkyway Image Holdings Ltd Offer for subscription 14,590,000 0.30 43.76 26/08/2002 Hantec Capital LtdOffer for sale 61,880,000 1.04Offer for placing 69,410,000Entertainment
8201 Wanyou Fire Safety Technology Offer for sale 100,000,000 0.40 200.00 30/09/2002 Core Pacific - Yamaichi Capital LtdHoldings Ltd Offer for placing 400,000,000 -
Fire Services SystemsProvider
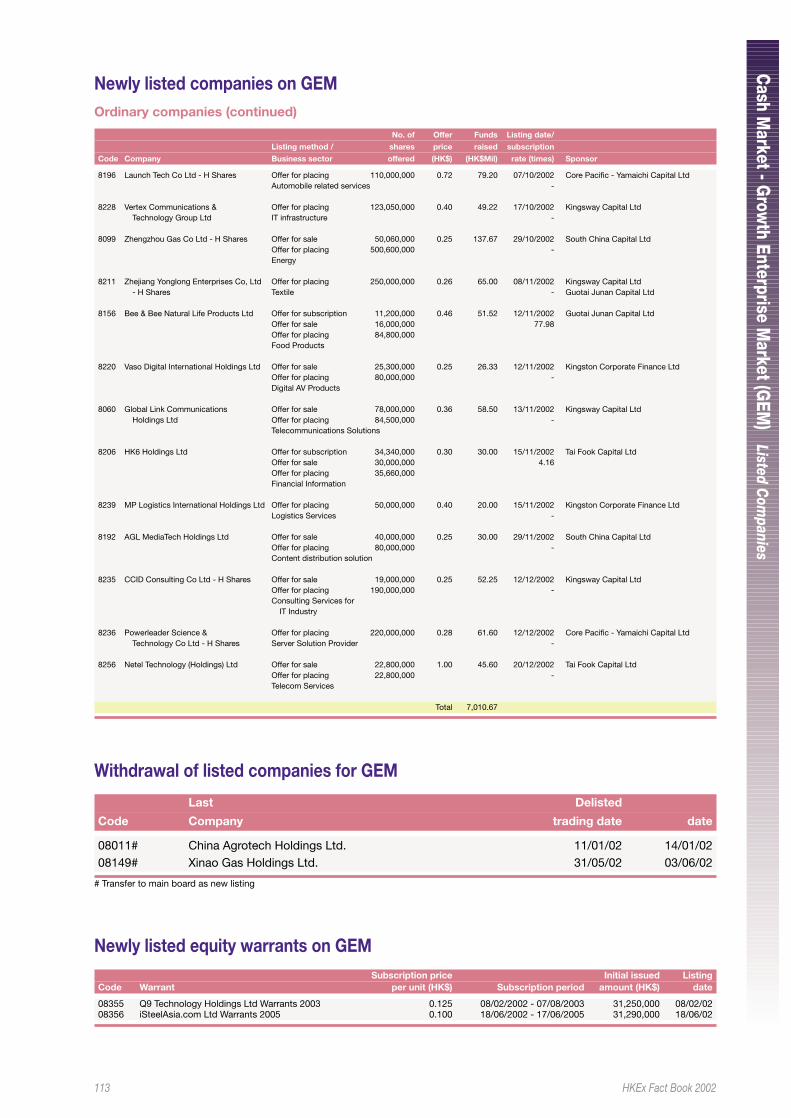
113 HKEx Fact Book 2002
Cash M
arket - Grow
th Enterprise Market (G
EM)
Listed Com
panies
Newly listed companies on GEMOrdinary companies (continued)
No. of Offer Funds Listing date/
Listing method / shares price raised subscription
Code Company Business sector offered (HK$) (HK$Mil) rate (times) Sponsor
8196 Launch Tech Co Ltd - H Shares Offer for placing 110,000,000 0.72 79.20 07/10/2002 Core Pacific - Yamaichi Capital LtdAutomobile related services -
8228 Vertex Communications & Offer for placing 123,050,000 0.40 49.22 17/10/2002 Kingsway Capital LtdTechnology Group Ltd IT infrastructure -
8099 Zhengzhou Gas Co Ltd - H Shares Offer for sale 50,060,000 0.25 137.67 29/10/2002 South China Capital LtdOffer for placing 500,600,000 -Energy
8211 Zhejiang Yonglong Enterprises Co, Ltd Offer for placing 250,000,000 0.26 65.00 08/11/2002 Kingsway Capital Ltd- H Shares Textile - Guotai Junan Capital Ltd
8156 Bee & Bee Natural Life Products Ltd Offer for subscription 11,200,000 0.46 51.52 12/11/2002 Guotai Junan Capital LtdOffer for sale 16,000,000 77.98Offer for placing 84,800,000Food Products
8220 Vaso Digital International Holdings Ltd Offer for sale 25,300,000 0.25 26.33 12/11/2002 Kingston Corporate Finance LtdOffer for placing 80,000,000 -Digital AV Products
8060 Global Link Communications Offer for sale 78,000,000 0.36 58.50 13/11/2002 Kingsway Capital LtdHoldings Ltd Offer for placing 84,500,000 -
Telecommunications Solutions
8206 HK6 Holdings Ltd Offer for subscription 34,340,000 0.30 30.00 15/11/2002 Tai Fook Capital LtdOffer for sale 30,000,000 4.16Offer for placing 35,660,000Financial Information
8239 MP Logistics International Holdings Ltd Offer for placing 50,000,000 0.40 20.00 15/11/2002 Kingston Corporate Finance LtdLogistics Services -
8192 AGL MediaTech Holdings Ltd Offer for sale 40,000,000 0.25 30.00 29/11/2002 South China Capital LtdOffer for placing 80,000,000 -Content distribution solution
8235 CCID Consulting Co Ltd - H Shares Offer for sale 19,000,000 0.25 52.25 12/12/2002 Kingsway Capital LtdOffer for placing 190,000,000 -Consulting Services for
IT Industry
8236 Powerleader Science & Offer for placing 220,000,000 0.28 61.60 12/12/2002 Core Pacific - Yamaichi Capital LtdTechnology Co Ltd - H Shares Server Solution Provider -
8256 Netel Technology (Holdings) Ltd Offer for sale 22,800,000 1.00 45.60 20/12/2002 Tai Fook Capital LtdOffer for placing 22,800,000 -Telecom Services
Total 7,010.67
Withdrawal of listed companies for GEM
Last Delisted
Code Company trading date date
08011# China Agrotech Holdings Ltd. 11/01/02 14/01/0208149# Xinao Gas Holdings Ltd. 31/05/02 03/06/02
# Transfer to main board as new listing
Newly listed equity warrants on GEMSubscription price Initial issued Listing
Code Warrant per unit (HK$) Subscription period amount (HK$) date
08355 Q9 Technology Holdings Ltd Warrants 2003 0.125 08/02/2002 - 07/08/2003 31,250,000 08/02/0208356 iSteelAsia.com Ltd Warrants 2005 0.100 18/06/2002 - 17/06/2005 31,290,000 18/06/02
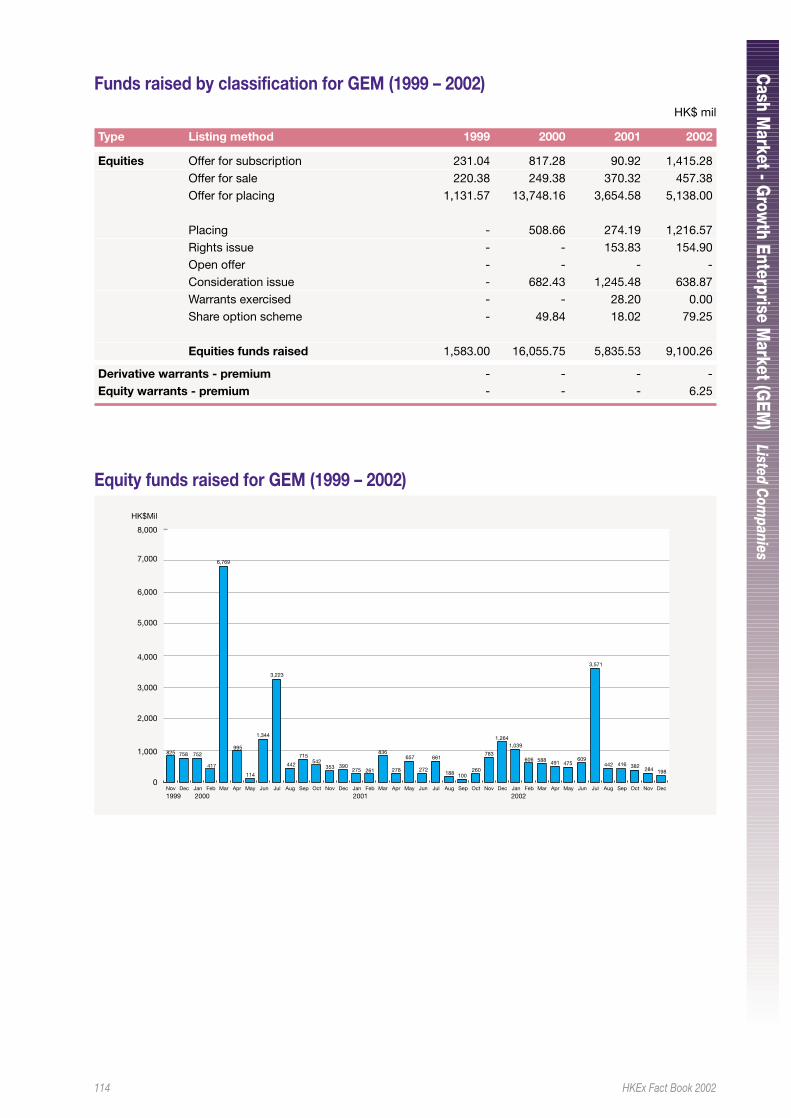
114 HKEx Fact Book 2002
Cash M
arket - Grow
th Enterprise Market (G
EM)
Listed Com
panies
Funds raised by classification for GEM (1999 – 2002)HK$ mil
Type Listing method 1999 2000 2001 2002
Equities Offer for subscription 231.04 817.28 90.92 1,415.28Offer for sale 220.38 249.38 370.32 457.38Offer for placing 1,131.57 13,748.16 3,654.58 5,138.00
Placing - 508.66 274.19 1,216.57Rights issue - - 153.83 154.90Open offer - - - -Consideration issue - 682.43 1,245.48 638.87Warrants exercised - - 28.20 0.00Share option scheme - 49.84 18.02 79.25
Equities funds raised 1,583.00 16,055.75 5,835.53 9,100.26
Derivative warrants - premium - - - -Equity warrants - premium - - - 6.25
Equity funds raised for GEM (1999 – 2002)
0
1,000
2,000
3,000
4,000
5,000
6,000
7,000
8,000
HK$Mil
1,344
661
188
3,571
284 198382416442
609475491588606
1,0391,264
783
260100
272
657
278
836
261275390353
542715
3,223
995
114
442
6,769
417
825 758 752
Nov Dec Jan Feb Mar Apr May Jun Jul Aug Sep Oct Nov Dec Jan Feb Mar Apr May Jun Jul Aug Sep Oct Nov Dec Jan Feb Mar Apr May Jun Jul Aug Sep Oct Nov Dec
1999 2000 2001 2002
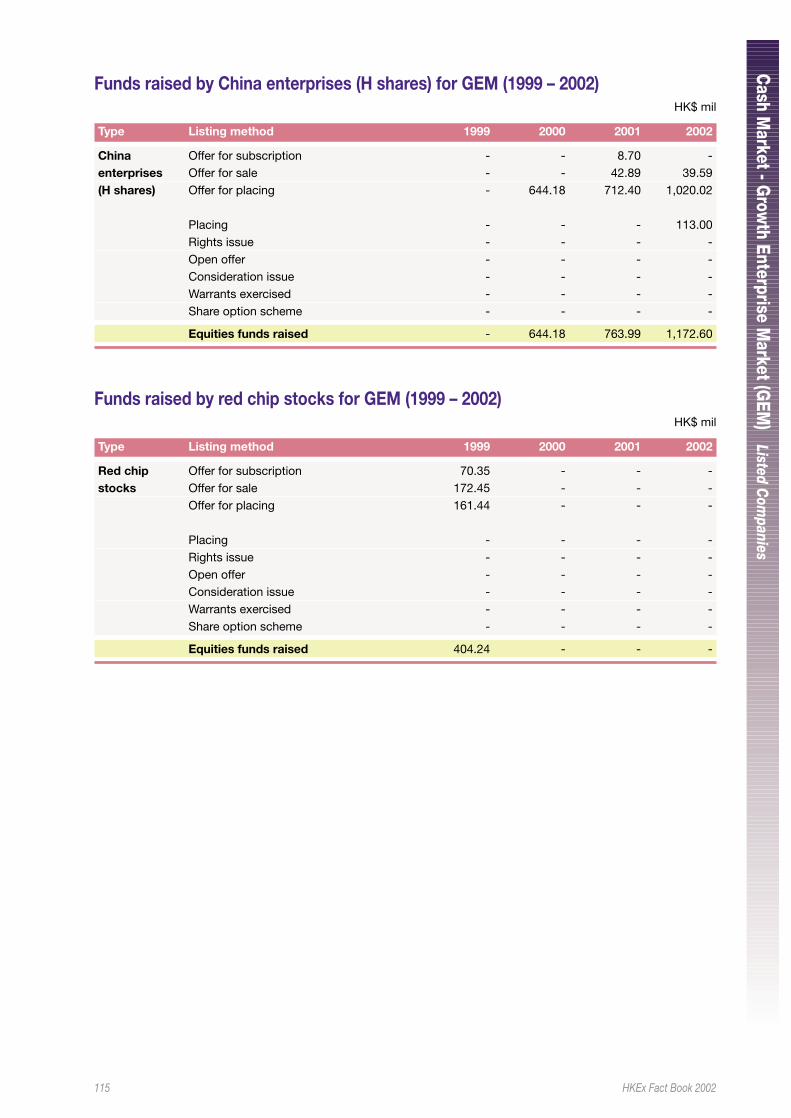
115 HKEx Fact Book 2002
Cash M
arket - Grow
th Enterprise Market (G
EM)
Listed Com
panies
Funds raised by China enterprises (H shares) for GEM (1999 – 2002)HK$ mil
Type Listing method 1999 2000 2001 2002
China Offer for subscription - - 8.70 -enterprises Offer for sale - - 42.89 39.59(H shares) Offer for placing - 644.18 712.40 1,020.02
Placing - - - 113.00Rights issue - - - -Open offer - - - -Consideration issue - - - -Warrants exercised - - - -Share option scheme - - - -
Equities funds raised - 644.18 763.99 1,172.60
Funds raised by red chip stocks for GEM (1999 – 2002)HK$ mil
Type Listing method 1999 2000 2001 2002
Red chip Offer for subscription 70.35 - - -stocks Offer for sale 172.45 - - -
Offer for placing 161.44 - - -
Placing - - - -Rights issue - - - -Open offer - - - -Consideration issue - - - -Warrants exercised - - - -Share option scheme - - - -
Equities funds raised 404.24 - - -
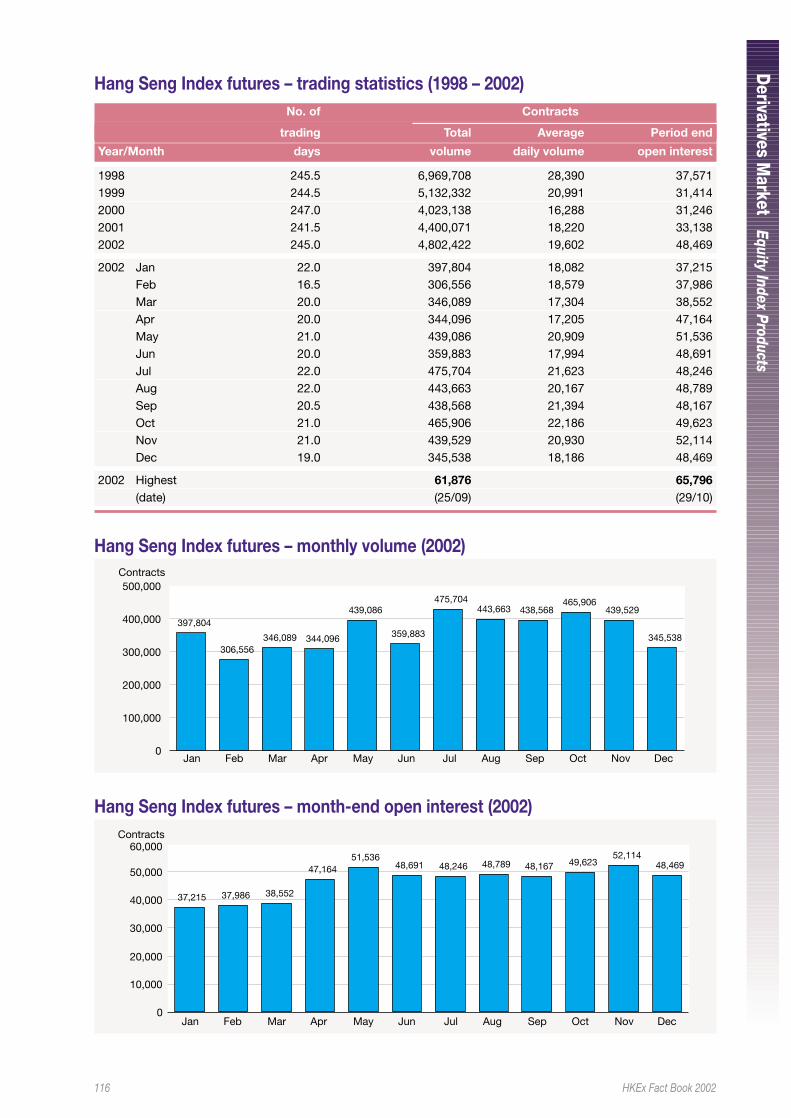
116 HKEx Fact Book 2002
Derivatives M
arketEquity Index Products
Hang Seng Index futures – trading statistics (1998 – 2002)No. of Contracts
trading Total Average Period end
Year/Month days volume daily volume open interest
1998 245.5 6,969,708 28,390 37,5711999 244.5 5,132,332 20,991 31,4142000 247.0 4,023,138 16,288 31,2462001 241.5 4,400,071 18,220 33,1382002 245.0 4,802,422 19,602 48,469
2002 Jan 22.0 397,804 18,082 37,215Feb 16.5 306,556 18,579 37,986Mar 20.0 346,089 17,304 38,552Apr 20.0 344,096 17,205 47,164May 21.0 439,086 20,909 51,536Jun 20.0 359,883 17,994 48,691Jul 22.0 475,704 21,623 48,246Aug 22.0 443,663 20,167 48,789Sep 20.5 438,568 21,394 48,167Oct 21.0 465,906 22,186 49,623Nov 21.0 439,529 20,930 52,114Dec 19.0 345,538 18,186 48,469
2002 Highest 61,876 65,796(date) (25/09) (29/10)
Hang Seng Index futures – monthly volume (2002)
0
100,000
200,000
300,000
400,000
500,000
Jan Feb Mar Apr May Jun Jul Aug Sep Oct Nov Dec
Contracts
397,804
306,556346,089 344,096
439,086
359,883
475,704443,663 438,568
465,906439,529
345,538
Hang Seng Index futures – month-end open interest (2002)
0
10,000
20,000
30,000
40,000
50,000
60,000
Jan Feb Mar Apr May Jun Jul Aug Sep Oct Nov Dec
Contracts
37,215 37,986 38,552
47,16451,536
48,691 48,246 48,789 48,167 49,62352,114
48,469
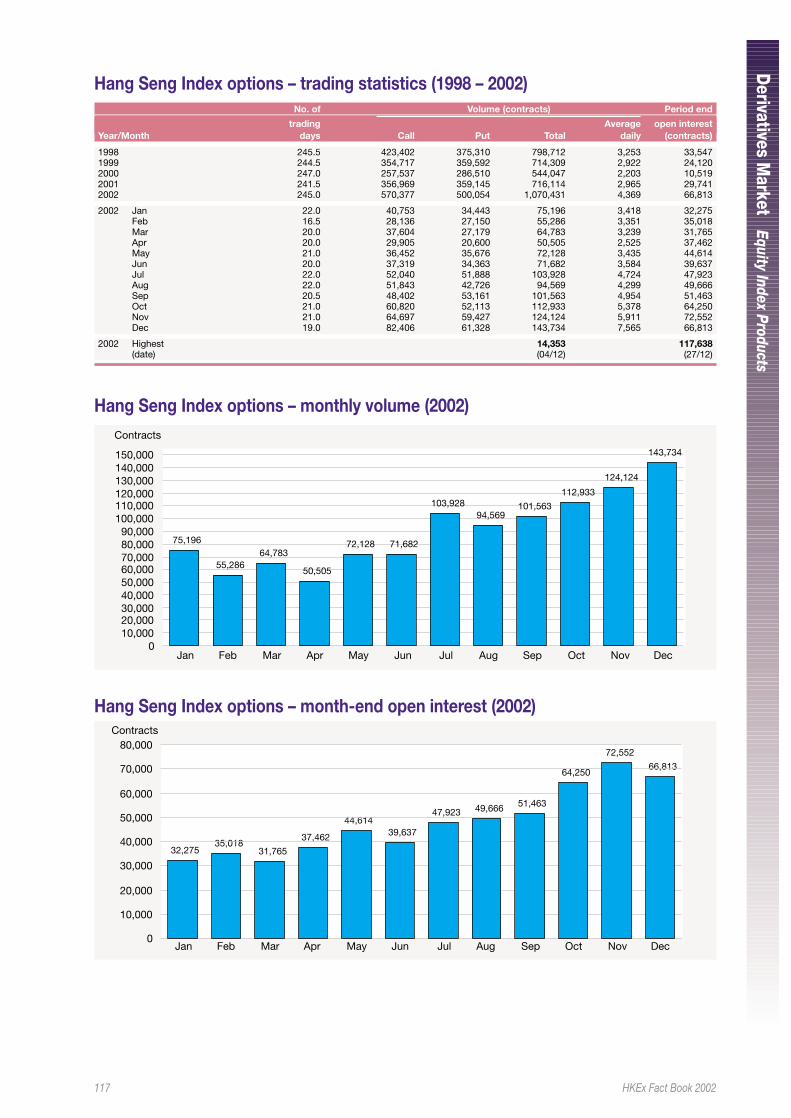
117 HKEx Fact Book 2002
Derivatives M
arketEquity Index Products
Hang Seng Index options – trading statistics (1998 – 2002)No. of Volume (contracts) Period end
trading Average open interestYear/Month days Call Put Total daily (contracts)
1998 245.5 423,402 375,310 798,712 3,253 33,5471999 244.5 354,717 359,592 714,309 2,922 24,1202000 247.0 257,537 286,510 544,047 2,203 10,5192001 241.5 356,969 359,145 716,114 2,965 29,7412002 245.0 570,377 500,054 1,070,431 4,369 66,813
2002 Jan 22.0 40,753 34,443 75,196 3,418 32,275Feb 16.5 28,136 27,150 55,286 3,351 35,018Mar 20.0 37,604 27,179 64,783 3,239 31,765Apr 20.0 29,905 20,600 50,505 2,525 37,462May 21.0 36,452 35,676 72,128 3,435 44,614Jun 20.0 37,319 34,363 71,682 3,584 39,637Jul 22.0 52,040 51,888 103,928 4,724 47,923Aug 22.0 51,843 42,726 94,569 4,299 49,666Sep 20.5 48,402 53,161 101,563 4,954 51,463Oct 21.0 60,820 52,113 112,933 5,378 64,250Nov 21.0 64,697 59,427 124,124 5,911 72,552Dec 19.0 82,406 61,328 143,734 7,565 66,813
2002 Highest 14,353 117,638(date) (04/12) (27/12)
Hang Seng Index options – monthly volume (2002)
Jan Feb Mar Apr May Jun Jul Aug Sep Oct Nov Dec
Contracts
75,196
55,28664,783
50,505
72,128 71,682
103,92894,569
101,563
112,933
124,124
143,734
010,00020,00030,00040,00050,00060,00070,00080,00090,000
100,000110,000120,000130,000140,000150,000
Hang Seng Index options – month-end open interest (2002)
Jan Feb Mar Apr May Jun Jul Aug Sep Oct Nov Dec
Contracts
32,27535,018
31,765
37,462
44,61439,637
47,923 49,666 51,463
64,250
72,552
66,813
0
10,000
20,000
30,000
40,000
50,000
60,000
70,000
80,000
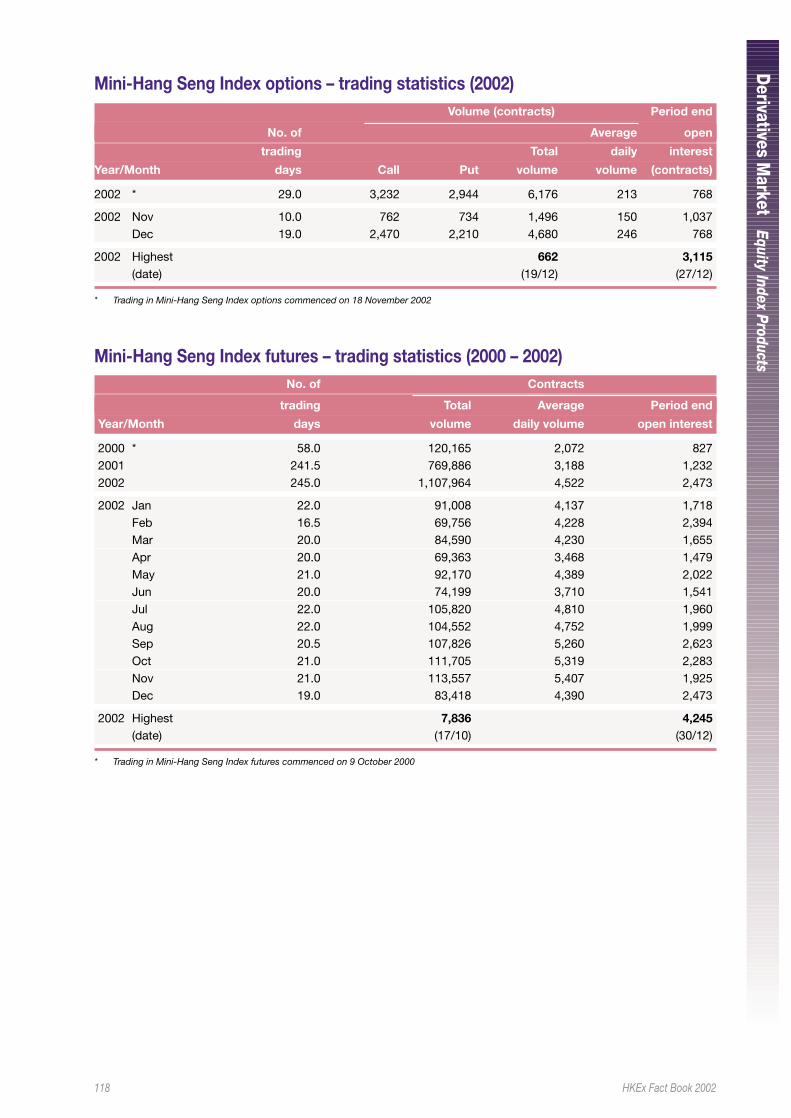
118 HKEx Fact Book 2002
Derivatives M
arketEquity Index ProductsMini-Hang Seng Index futures – trading statistics (2000 – 2002)
No. of Contracts
trading Total Average Period end
Year/Month days volume daily volume open interest
2000 * 58.0 120,165 2,072 8272001 241.5 769,886 3,188 1,2322002 245.0 1,107,964 4,522 2,473
2002 Jan 22.0 91,008 4,137 1,718Feb 16.5 69,756 4,228 2,394Mar 20.0 84,590 4,230 1,655Apr 20.0 69,363 3,468 1,479May 21.0 92,170 4,389 2,022Jun 20.0 74,199 3,710 1,541Jul 22.0 105,820 4,810 1,960Aug 22.0 104,552 4,752 1,999Sep 20.5 107,826 5,260 2,623Oct 21.0 111,705 5,319 2,283Nov 21.0 113,557 5,407 1,925Dec 19.0 83,418 4,390 2,473
2002 Highest 7,836 4,245(date) (17/10) (30/12)
* Trading in Mini-Hang Seng Index futures commenced on 9 October 2000
Mini-Hang Seng Index options – trading statistics (2002)Volume (contracts) Period end
No. of Average open
trading Total daily interest
Year/Month days Call Put volume volume (contracts)
2002 * 29.0 3,232 2,944 6,176 213 768
2002 Nov 10.0 762 734 1,496 150 1,037Dec 19.0 2,470 2,210 4,680 246 768
2002 Highest 662 3,115(date) (19/12) (27/12)
* Trading in Mini-Hang Seng Index options commenced on 18 November 2002
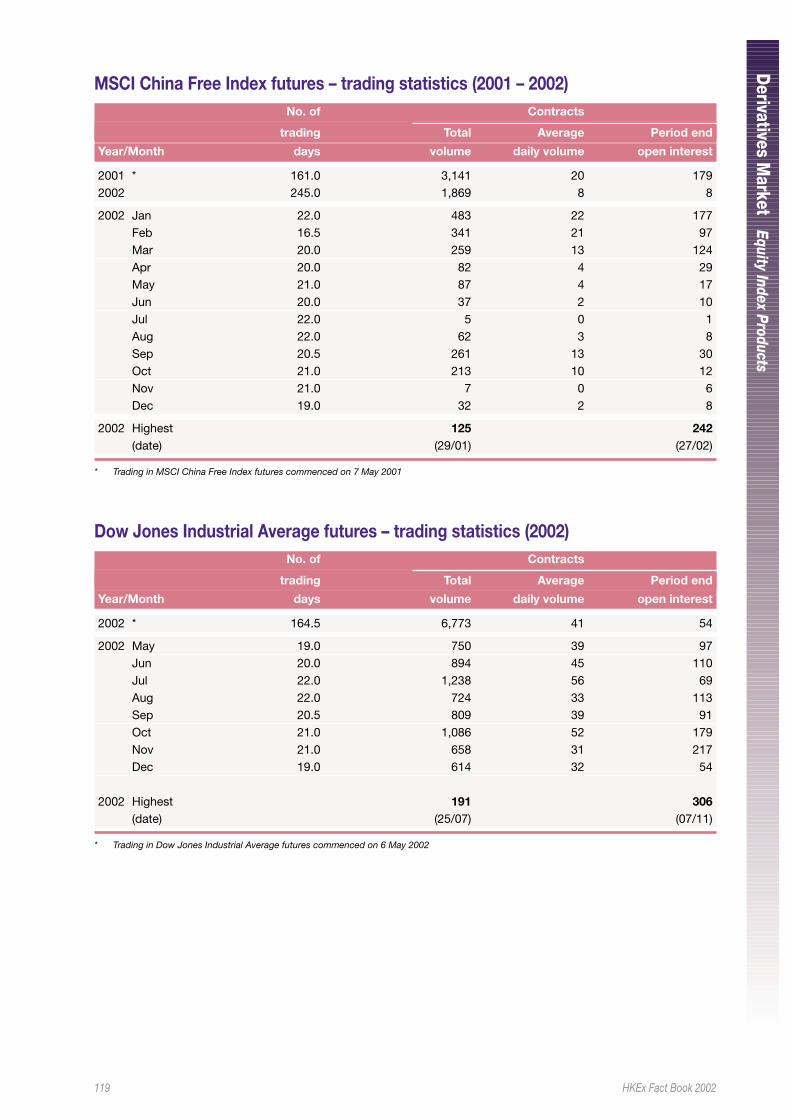
119 HKEx Fact Book 2002
Derivatives M
arketEquity Index Products
MSCI China Free Index futures – trading statistics (2001 – 2002)No. of Contracts
trading Total Average Period end
Year/Month days volume daily volume open interest
2001 * 161.0 3,141 20 1792002 245.0 1,869 8 8
2002 Jan 22.0 483 22 177Feb 16.5 341 21 97Mar 20.0 259 13 124Apr 20.0 82 4 29May 21.0 87 4 17Jun 20.0 37 2 10Jul 22.0 5 0 1Aug 22.0 62 3 8Sep 20.5 261 13 30Oct 21.0 213 10 12Nov 21.0 7 0 6Dec 19.0 32 2 8
2002 Highest 125 242(date) (29/01) (27/02)
* Trading in MSCI China Free Index futures commenced on 7 May 2001
Dow Jones Industrial Average futures – trading statistics (2002)No. of Contracts
trading Total Average Period end
Year/Month days volume daily volume open interest
2002 * 164.5 6,773 41 54
2002 May 19.0 750 39 97Jun 20.0 894 45 110Jul 22.0 1,238 56 69Aug 22.0 724 33 113Sep 20.5 809 39 91Oct 21.0 1,086 52 179Nov 21.0 658 31 217Dec 19.0 614 32 54
2002 Highest 191 306(date) (25/07) (07/11)
* Trading in Dow Jones Industrial Average futures commenced on 6 May 2002
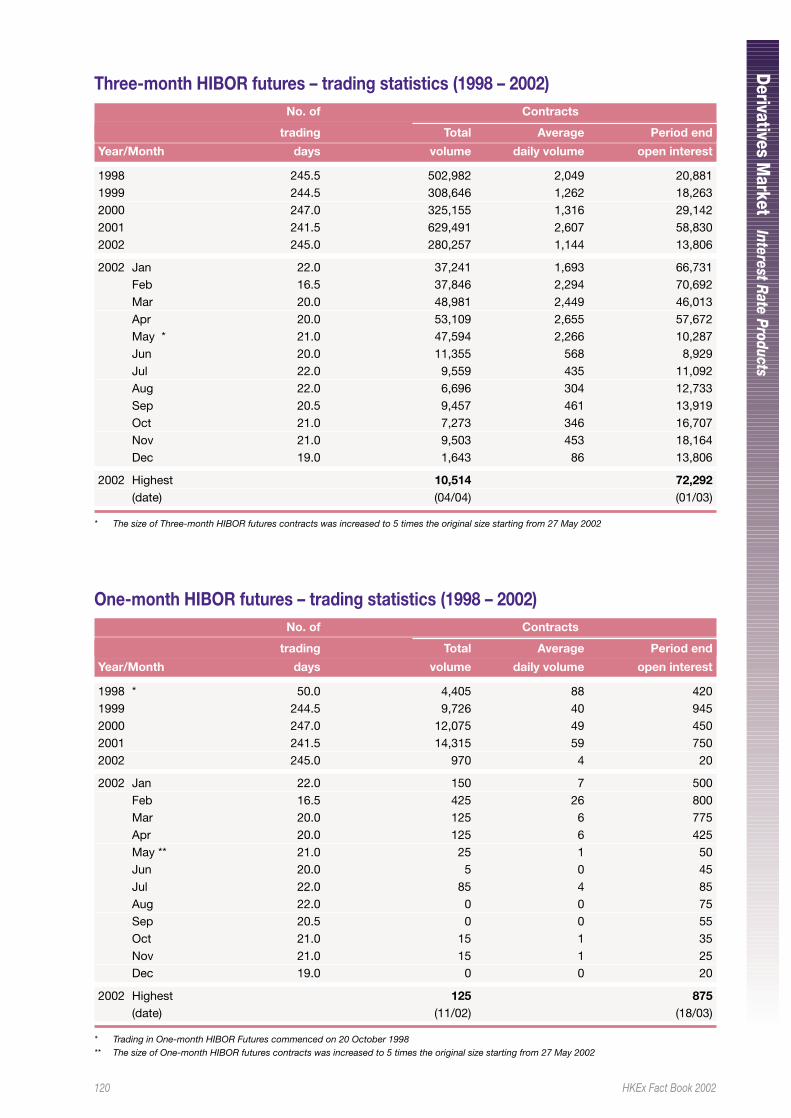
120 HKEx Fact Book 2002
Derivatives M
arketInterest Rate Products
One-month HIBOR futures – trading statistics (1998 – 2002)No. of Contracts
trading Total Average Period end
Year/Month days volume daily volume open interest
1998 * 50.0 4,405 88 4201999 244.5 9,726 40 9452000 247.0 12,075 49 4502001 241.5 14,315 59 7502002 245.0 970 4 20
2002 Jan 22.0 150 7 500Feb 16.5 425 26 800Mar 20.0 125 6 775Apr 20.0 125 6 425May ** 21.0 25 1 50Jun 20.0 5 0 45Jul 22.0 85 4 85Aug 22.0 0 0 75Sep 20.5 0 0 55Oct 21.0 15 1 35Nov 21.0 15 1 25Dec 19.0 0 0 20
2002 Highest 125 875(date) (11/02) (18/03)
* Trading in One-month HIBOR Futures commenced on 20 October 1998** The size of One-month HIBOR futures contracts was increased to 5 times the original size starting from 27 May 2002
Three-month HIBOR futures – trading statistics (1998 – 2002)No. of Contracts
trading Total Average Period end
Year/Month days volume daily volume open interest
1998 245.5 502,982 2,049 20,8811999 244.5 308,646 1,262 18,2632000 247.0 325,155 1,316 29,1422001 241.5 629,491 2,607 58,8302002 245.0 280,257 1,144 13,806
2002 Jan 22.0 37,241 1,693 66,731Feb 16.5 37,846 2,294 70,692Mar 20.0 48,981 2,449 46,013Apr 20.0 53,109 2,655 57,672May * 21.0 47,594 2,266 10,287Jun 20.0 11,355 568 8,929Jul 22.0 9,559 435 11,092Aug 22.0 6,696 304 12,733Sep 20.5 9,457 461 13,919Oct 21.0 7,273 346 16,707Nov 21.0 9,503 453 18,164Dec 19.0 1,643 86 13,806
2002 Highest 10,514 72,292(date) (04/04) (01/03)
* The size of Three-month HIBOR futures contracts was increased to 5 times the original size starting from 27 May 2002
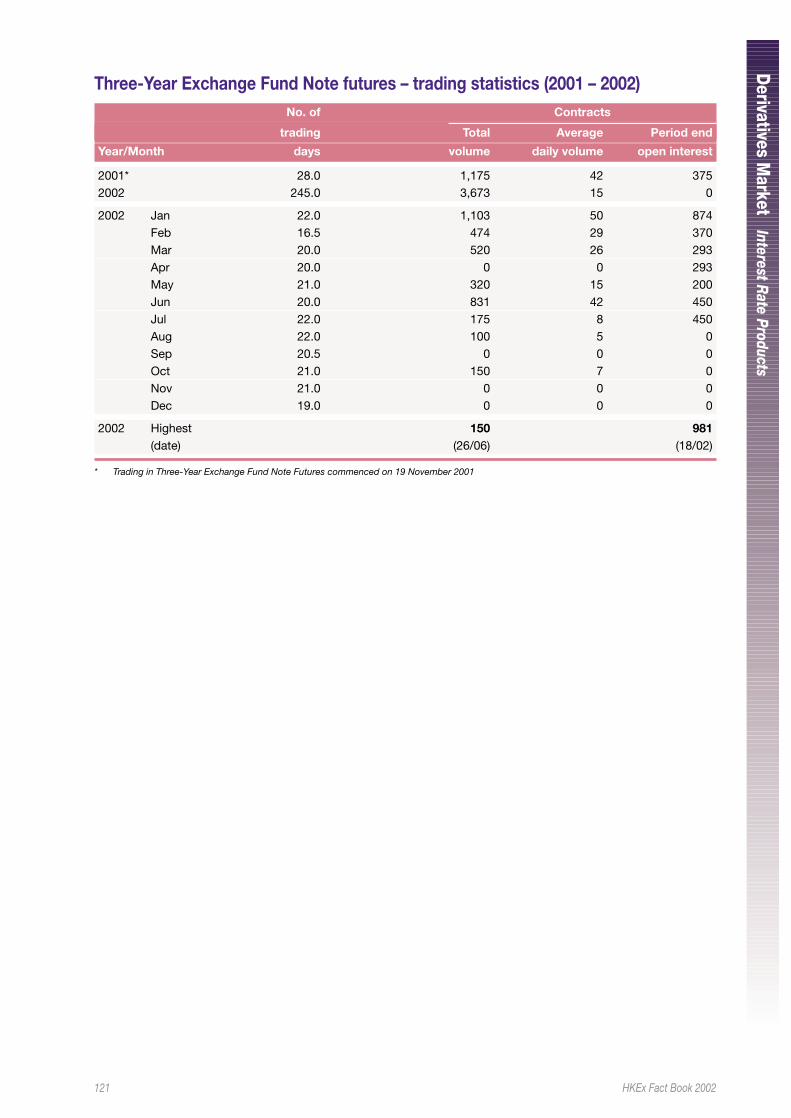
121 HKEx Fact Book 2002
Derivatives M
arketInterest Rate Products
Three-Year Exchange Fund Note futures – trading statistics (2001 – 2002)No. of Contracts
trading Total Average Period end
Year/Month days volume daily volume open interest
2001* 28.0 1,175 42 3752002 245.0 3,673 15 0
2002 Jan 22.0 1,103 50 874Feb 16.5 474 29 370Mar 20.0 520 26 293Apr 20.0 0 0 293May 21.0 320 15 200Jun 20.0 831 42 450Jul 22.0 175 8 450Aug 22.0 100 5 0Sep 20.5 0 0 0Oct 21.0 150 7 0Nov 21.0 0 0 0Dec 19.0 0 0 0
2002 Highest 150 981(date) (26/06) (18/02)
* Trading in Three-Year Exchange Fund Note Futures commenced on 19 November 2001
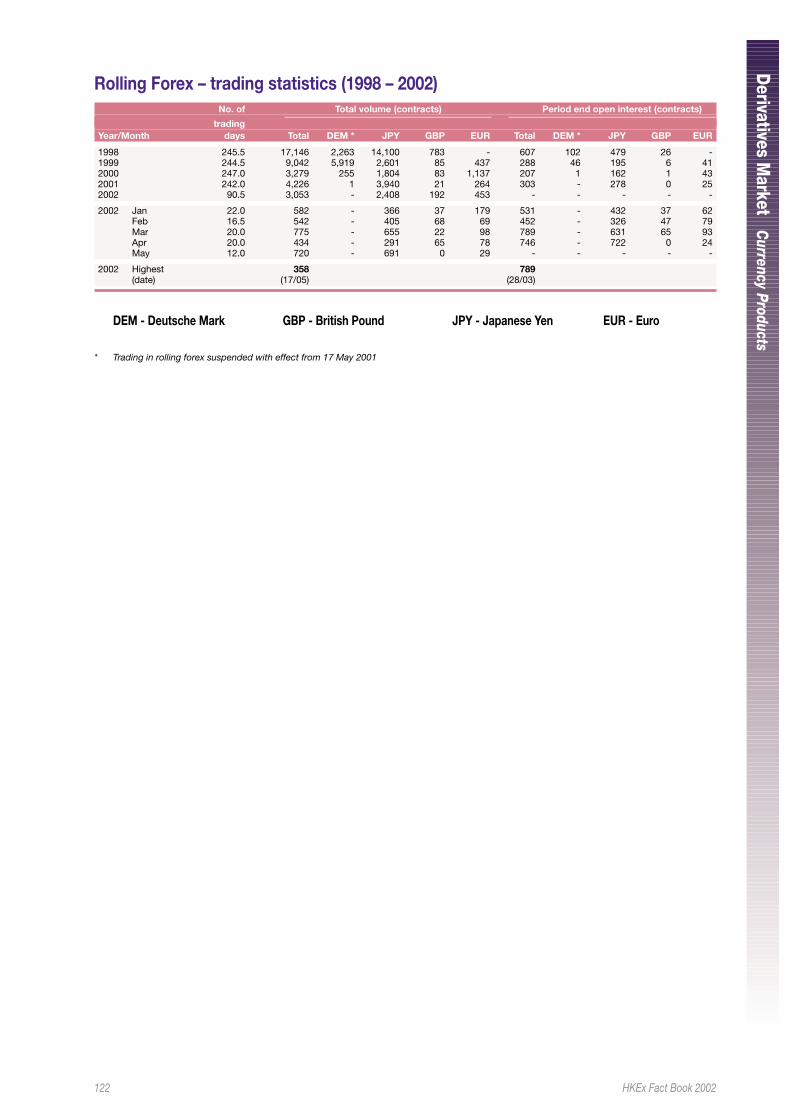
122 HKEx Fact Book 2002
Derivatives M
arketC
urrency Products
Rolling Forex – trading statistics (1998 – 2002)No. of Total volume (contracts) Period end open interest (contracts)
tradingYear/Month days Total DEM * JPY GBP EUR Total DEM * JPY GBP EUR
1998 245.5 17,146 2,263 14,100 783 - 607 102 479 26 -1999 244.5 9,042 5,919 2,601 85 437 288 46 195 6 412000 247.0 3,279 255 1,804 83 1,137 207 1 162 1 432001 242.0 4,226 1 3,940 21 264 303 - 278 0 252002 90.5 3,053 - 2,408 192 453 - - - - -
2002 Jan 22.0 582 - 366 37 179 531 - 432 37 62Feb 16.5 542 - 405 68 69 452 - 326 47 79Mar 20.0 775 - 655 22 98 789 - 631 65 93Apr 20.0 434 - 291 65 78 746 - 722 0 24May 12.0 720 - 691 0 29 - - - - -
2002 Highest 358 789(date) (17/05) (28/03)
DEM - Deutsche Mark GBP - British Pound JPY - Japanese Yen EUR - Euro
* Trading in rolling forex suspended with effect from 17 May 2001
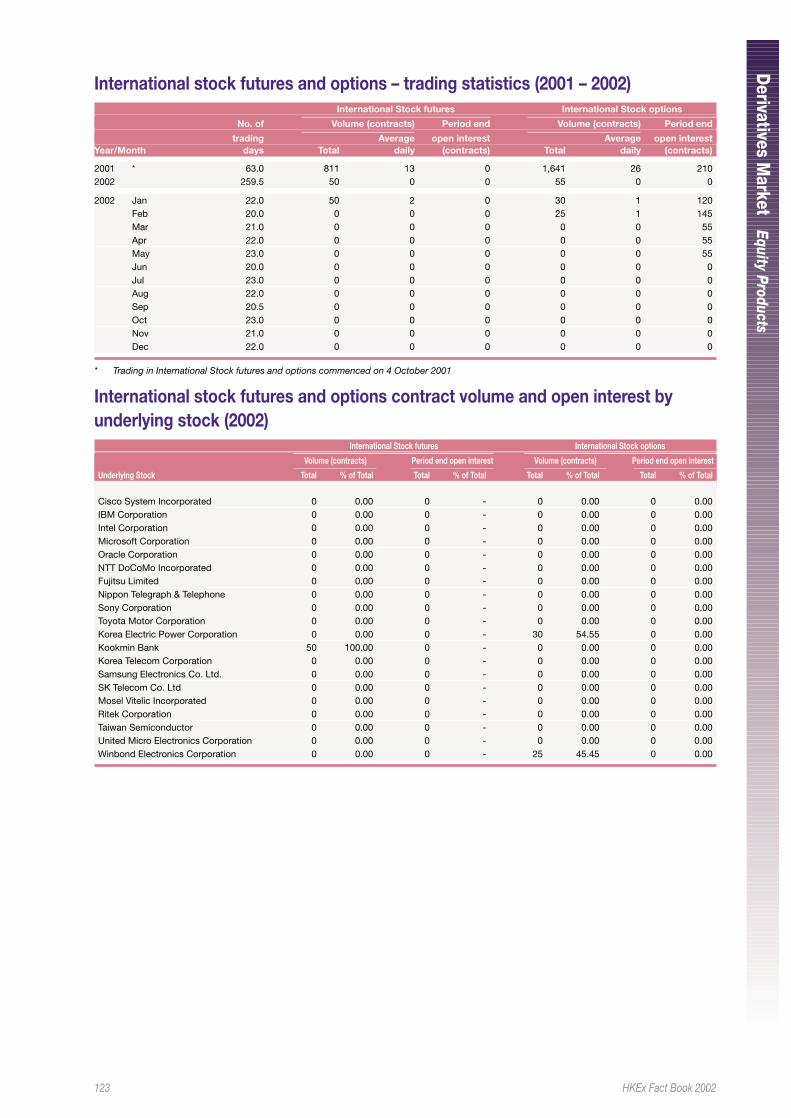
123 HKEx Fact Book 2002
Derivatives M
arketEquity Products
International stock futures and options – trading statistics (2001 – 2002)International Stock futures International Stock options
No. of Volume (contracts) Period end Volume (contracts) Period end
trading Average open interest Average open interestYear/Month days Total daily (contracts) Total daily (contracts)
2001 * 63.0 811 13 0 1,641 26 2102002 259.5 50 0 0 55 0 0
2002 Jan 22.0 50 2 0 30 1 120Feb 20.0 0 0 0 25 1 145Mar 21.0 0 0 0 0 0 55Apr 22.0 0 0 0 0 0 55May 23.0 0 0 0 0 0 55Jun 20.0 0 0 0 0 0 0Jul 23.0 0 0 0 0 0 0Aug 22.0 0 0 0 0 0 0Sep 20.5 0 0 0 0 0 0Oct 23.0 0 0 0 0 0 0Nov 21.0 0 0 0 0 0 0Dec 22.0 0 0 0 0 0 0
* Trading in International Stock futures and options commenced on 4 October 2001
International stock futures and options contract volume and open interest byunderlying stock (2002)
International Stock futures International Stock options
Volume (contracts) Period end open interest Volume (contracts) Period end open interest
Underlying Stock Total % of Total Total % of Total Total % of Total Total % of Total
Cisco System Incorporated 0 0.00 0 - 0 0.00 0 0.00IBM Corporation 0 0.00 0 - 0 0.00 0 0.00Intel Corporation 0 0.00 0 - 0 0.00 0 0.00Microsoft Corporation 0 0.00 0 - 0 0.00 0 0.00Oracle Corporation 0 0.00 0 - 0 0.00 0 0.00NTT DoCoMo Incorporated 0 0.00 0 - 0 0.00 0 0.00Fujitsu Limited 0 0.00 0 - 0 0.00 0 0.00Nippon Telegraph & Telephone 0 0.00 0 - 0 0.00 0 0.00Sony Corporation 0 0.00 0 - 0 0.00 0 0.00Toyota Motor Corporation 0 0.00 0 - 0 0.00 0 0.00Korea Electric Power Corporation 0 0.00 0 - 30 54.55 0 0.00Kookmin Bank 50 100.00 0 - 0 0.00 0 0.00Korea Telecom Corporation 0 0.00 0 - 0 0.00 0 0.00Samsung Electronics Co. Ltd. 0 0.00 0 - 0 0.00 0 0.00SK Telecom Co. Ltd 0 0.00 0 - 0 0.00 0 0.00Mosel Vitelic Incorporated 0 0.00 0 - 0 0.00 0 0.00Ritek Corporation 0 0.00 0 - 0 0.00 0 0.00Taiwan Semiconductor 0 0.00 0 - 0 0.00 0 0.00United Micro Electronics Corporation 0 0.00 0 - 0 0.00 0 0.00Winbond Electronics Corporation 0 0.00 0 - 25 45.45 0 0.00
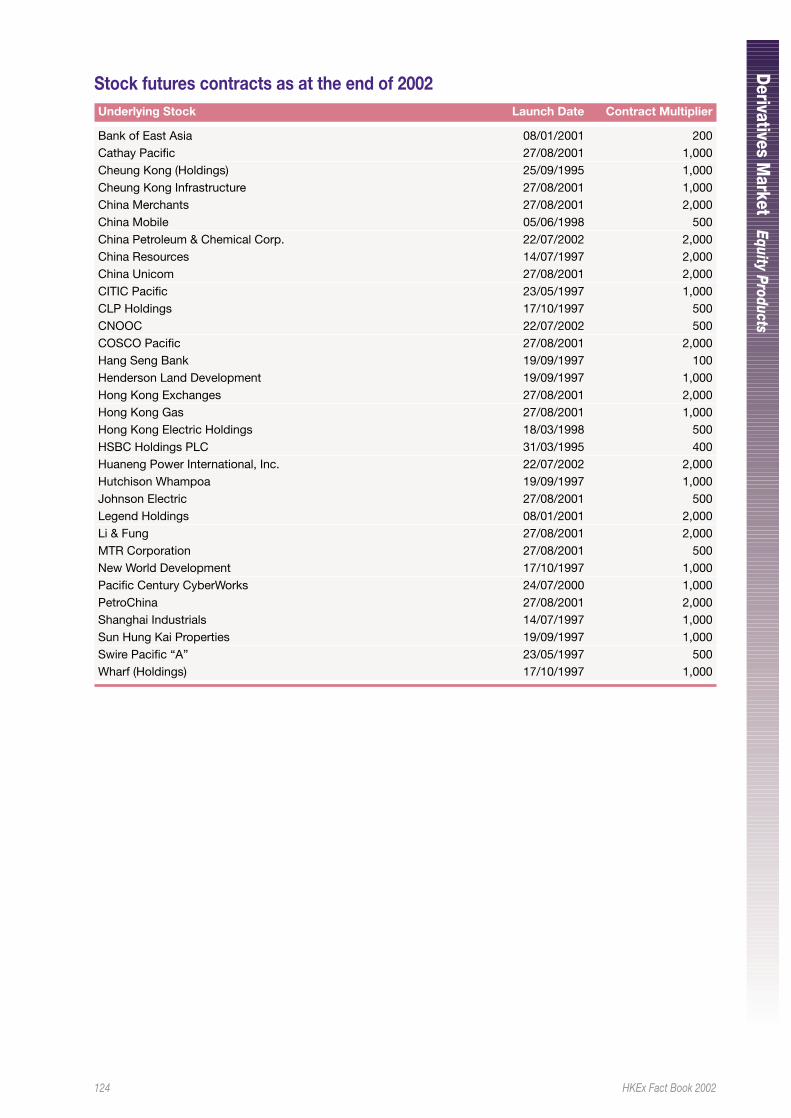
124 HKEx Fact Book 2002
Derivatives M
arketEquity Products
Stock futures contracts as at the end of 2002Underlying Stock Launch Date Contract Multiplier
Bank of East Asia 08/01/2001 200Cathay Pacific 27/08/2001 1,000Cheung Kong (Holdings) 25/09/1995 1,000Cheung Kong Infrastructure 27/08/2001 1,000China Merchants 27/08/2001 2,000China Mobile 05/06/1998 500China Petroleum & Chemical Corp. 22/07/2002 2,000China Resources 14/07/1997 2,000China Unicom 27/08/2001 2,000CITIC Pacific 23/05/1997 1,000CLP Holdings 17/10/1997 500CNOOC 22/07/2002 500COSCO Pacific 27/08/2001 2,000Hang Seng Bank 19/09/1997 100Henderson Land Development 19/09/1997 1,000Hong Kong Exchanges 27/08/2001 2,000Hong Kong Gas 27/08/2001 1,000Hong Kong Electric Holdings 18/03/1998 500HSBC Holdings PLC 31/03/1995 400Huaneng Power International, Inc. 22/07/2002 2,000Hutchison Whampoa 19/09/1997 1,000Johnson Electric 27/08/2001 500Legend Holdings 08/01/2001 2,000Li & Fung 27/08/2001 2,000MTR Corporation 27/08/2001 500New World Development 17/10/1997 1,000Pacific Century CyberWorks 24/07/2000 1,000PetroChina 27/08/2001 2,000Shanghai Industrials 14/07/1997 1,000Sun Hung Kai Properties 19/09/1997 1,000Swire Pacific “A” 23/05/1997 500Wharf (Holdings) 17/10/1997 1,000
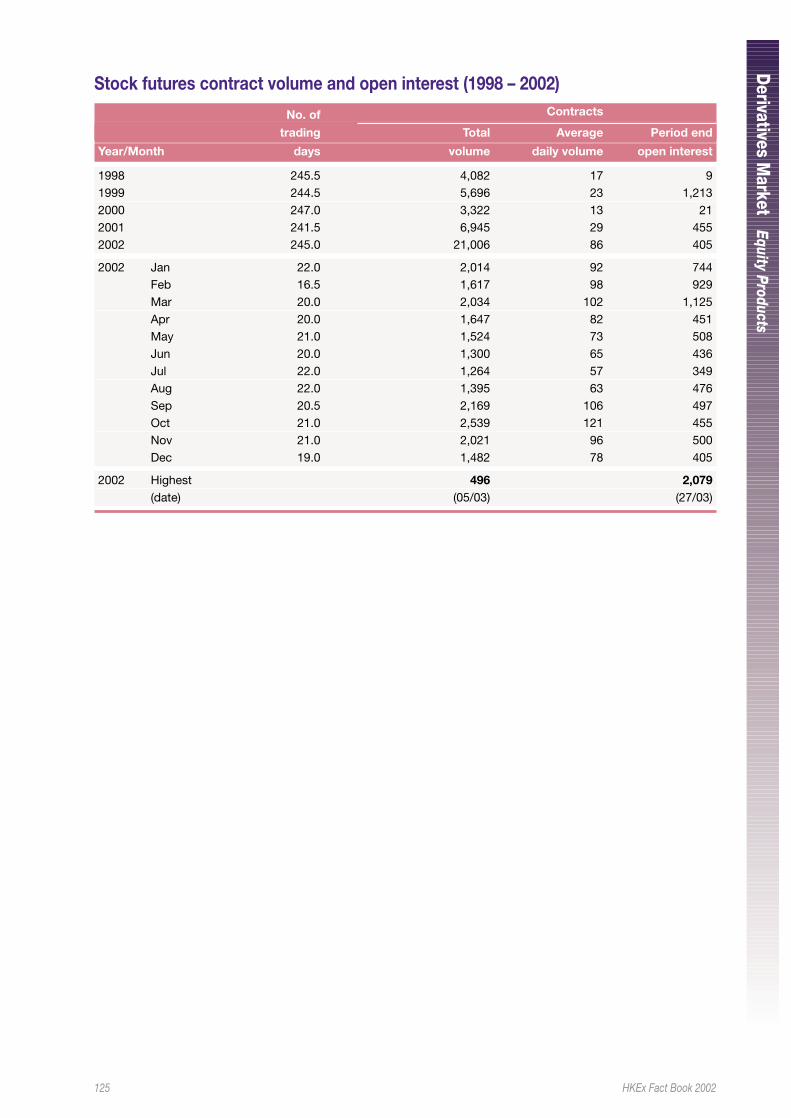
125 HKEx Fact Book 2002
Derivatives M
arketEquity Products
Stock futures contract volume and open interest (1998 – 2002)
No. of Contracts
trading Total Average Period end
Year/Month days volume daily volume open interest
1998 245.5 4,082 17 91999 244.5 5,696 23 1,2132000 247.0 3,322 13 212001 241.5 6,945 29 4552002 245.0 21,006 86 405
2002 Jan 22.0 2,014 92 744Feb 16.5 1,617 98 929Mar 20.0 2,034 102 1,125Apr 20.0 1,647 82 451May 21.0 1,524 73 508Jun 20.0 1,300 65 436Jul 22.0 1,264 57 349Aug 22.0 1,395 63 476Sep 20.5 2,169 106 497Oct 21.0 2,539 121 455Nov 21.0 2,021 96 500Dec 19.0 1,482 78 405
2002 Highest 496 2,079(date) (05/03) (27/03)
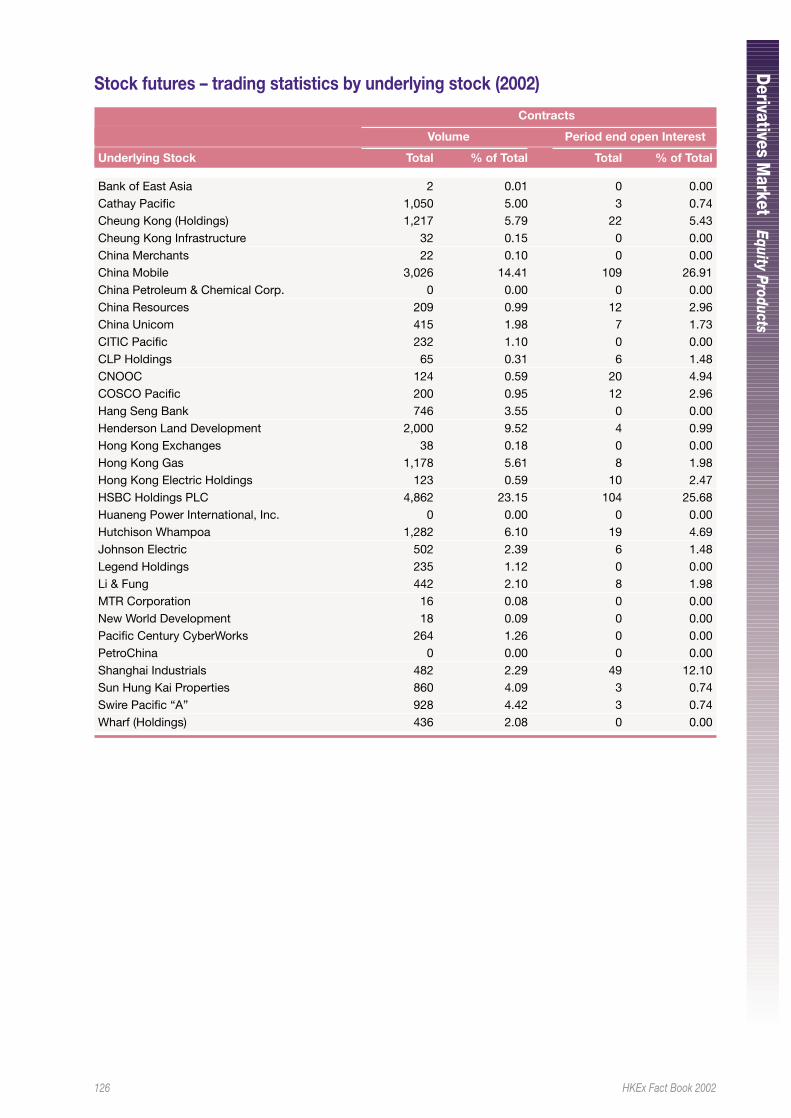
126 HKEx Fact Book 2002
Derivatives M
arketEquity Products
Stock futures – trading statistics by underlying stock (2002)
Contracts
Volume Period end open Interest
Underlying Stock Total % of Total Total % of Total
Bank of East Asia 2 0.01 0 0.00Cathay Pacific 1,050 5.00 3 0.74Cheung Kong (Holdings) 1,217 5.79 22 5.43Cheung Kong Infrastructure 32 0.15 0 0.00China Merchants 22 0.10 0 0.00China Mobile 3,026 14.41 109 26.91China Petroleum & Chemical Corp. 0 0.00 0 0.00China Resources 209 0.99 12 2.96China Unicom 415 1.98 7 1.73CITIC Pacific 232 1.10 0 0.00CLP Holdings 65 0.31 6 1.48CNOOC 124 0.59 20 4.94COSCO Pacific 200 0.95 12 2.96Hang Seng Bank 746 3.55 0 0.00Henderson Land Development 2,000 9.52 4 0.99Hong Kong Exchanges 38 0.18 0 0.00Hong Kong Gas 1,178 5.61 8 1.98Hong Kong Electric Holdings 123 0.59 10 2.47HSBC Holdings PLC 4,862 23.15 104 25.68Huaneng Power International, Inc. 0 0.00 0 0.00Hutchison Whampoa 1,282 6.10 19 4.69Johnson Electric 502 2.39 6 1.48Legend Holdings 235 1.12 0 0.00Li & Fung 442 2.10 8 1.98MTR Corporation 16 0.08 0 0.00New World Development 18 0.09 0 0.00Pacific Century CyberWorks 264 1.26 0 0.00PetroChina 0 0.00 0 0.00Shanghai Industrials 482 2.29 49 12.10Sun Hung Kai Properties 860 4.09 3 0.74Swire Pacific “A” 928 4.42 3 0.74Wharf (Holdings) 436 2.08 0 0.00
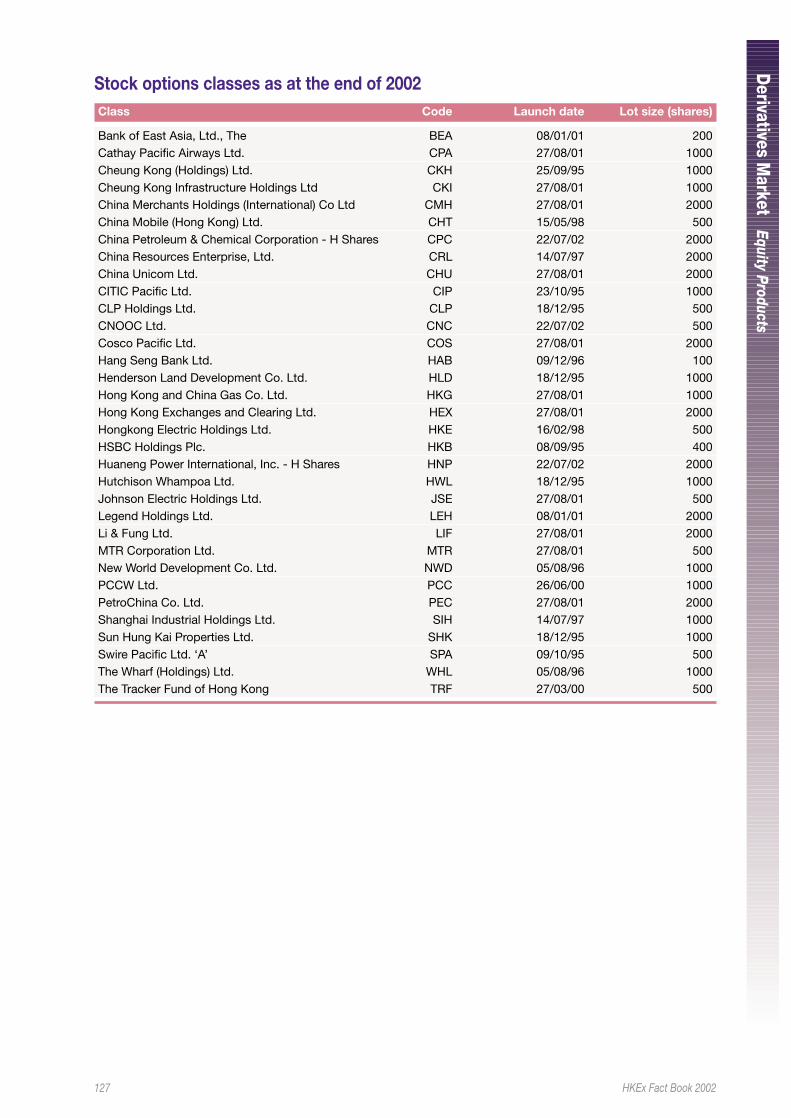
127 HKEx Fact Book 2002
Derivatives M
arketEquity Products
Stock options classes as at the end of 2002Class Code Launch date Lot size (shares)
Bank of East Asia, Ltd., The BEA 08/01/01 200Cathay Pacific Airways Ltd. CPA 27/08/01 1000Cheung Kong (Holdings) Ltd. CKH 25/09/95 1000Cheung Kong Infrastructure Holdings Ltd CKI 27/08/01 1000China Merchants Holdings (International) Co Ltd CMH 27/08/01 2000China Mobile (Hong Kong) Ltd. CHT 15/05/98 500China Petroleum & Chemical Corporation - H Shares CPC 22/07/02 2000China Resources Enterprise, Ltd. CRL 14/07/97 2000China Unicom Ltd. CHU 27/08/01 2000CITIC Pacific Ltd. CIP 23/10/95 1000CLP Holdings Ltd. CLP 18/12/95 500CNOOC Ltd. CNC 22/07/02 500Cosco Pacific Ltd. COS 27/08/01 2000Hang Seng Bank Ltd. HAB 09/12/96 100Henderson Land Development Co. Ltd. HLD 18/12/95 1000Hong Kong and China Gas Co. Ltd. HKG 27/08/01 1000Hong Kong Exchanges and Clearing Ltd. HEX 27/08/01 2000Hongkong Electric Holdings Ltd. HKE 16/02/98 500HSBC Holdings Plc. HKB 08/09/95 400Huaneng Power International, Inc. - H Shares HNP 22/07/02 2000Hutchison Whampoa Ltd. HWL 18/12/95 1000Johnson Electric Holdings Ltd. JSE 27/08/01 500Legend Holdings Ltd. LEH 08/01/01 2000Li & Fung Ltd. LIF 27/08/01 2000MTR Corporation Ltd. MTR 27/08/01 500New World Development Co. Ltd. NWD 05/08/96 1000PCCW Ltd. PCC 26/06/00 1000PetroChina Co. Ltd. PEC 27/08/01 2000Shanghai Industrial Holdings Ltd. SIH 14/07/97 1000Sun Hung Kai Properties Ltd. SHK 18/12/95 1000Swire Pacific Ltd. ‘A’ SPA 09/10/95 500The Wharf (Holdings) Ltd. WHL 05/08/96 1000The Tracker Fund of Hong Kong TRF 27/03/00 500
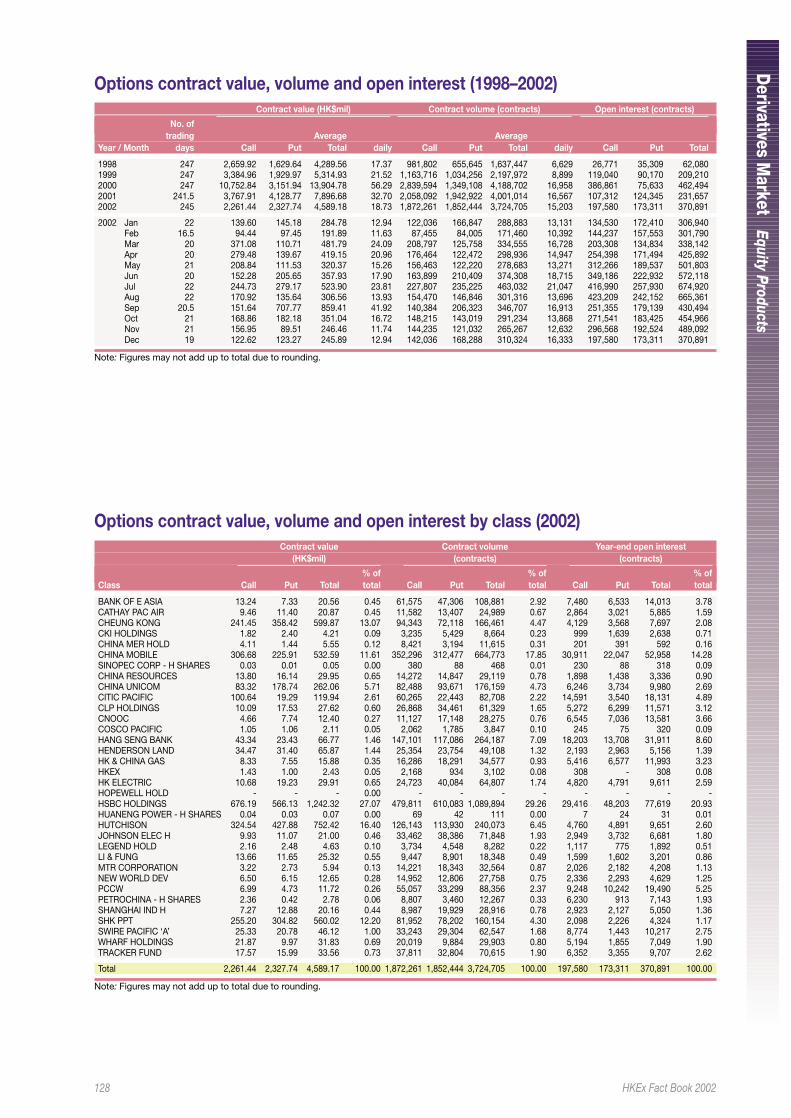
128 HKEx Fact Book 2002
Derivatives M
arketEquity Products
Options contract value, volume and open interest (1998–2002)Contract value (HK$mil) Contract volume (contracts) Open interest (contracts)
No. oftrading Average Average
Year / Month days Call Put Total daily Call Put Total daily Call Put Total
1998 247 2,659.92 1,629.64 4,289.56 17.37 981,802 655,645 1,637,447 6,629 26,771 35,309 62,0801999 247 3,384.96 1,929.97 5,314.93 21.52 1,163,716 1,034,256 2,197,972 8,899 119,040 90,170 209,2102000 247 10,752.84 3,151.94 13,904.78 56.29 2,839,594 1,349,108 4,188,702 16,958 386,861 75,633 462,4942001 241.5 3,767.91 4,128.77 7,896.68 32.70 2,058,092 1,942,922 4,001,014 16,567 107,312 124,345 231,6572002 245 2,261.44 2,327.74 4,589.18 18.73 1,872,261 1,852,444 3,724,705 15,203 197,580 173,311 370,891
2002 Jan 22 139.60 145.18 284.78 12.94 122,036 166,847 288,883 13,131 134,530 172,410 306,940Feb 16.5 94.44 97.45 191.89 11.63 87,455 84,005 171,460 10,392 144,237 157,553 301,790Mar 20 371.08 110.71 481.79 24.09 208,797 125,758 334,555 16,728 203,308 134,834 338,142Apr 20 279.48 139.67 419.15 20.96 176,464 122,472 298,936 14,947 254,398 171,494 425,892May 21 208.84 111.53 320.37 15.26 156,463 122,220 278,683 13,271 312,266 189,537 501,803Jun 20 152.28 205.65 357.93 17.90 163,899 210,409 374,308 18,715 349,186 222,932 572,118Jul 22 244.73 279.17 523.90 23.81 227,807 235,225 463,032 21,047 416,990 257,930 674,920Aug 22 170.92 135.64 306.56 13.93 154,470 146,846 301,316 13,696 423,209 242,152 665,361Sep 20.5 151.64 707.77 859.41 41.92 140,384 206,323 346,707 16,913 251,355 179,139 430,494Oct 21 168.86 182.18 351.04 16.72 148,215 143,019 291,234 13,868 271,541 183,425 454,966Nov 21 156.95 89.51 246.46 11.74 144,235 121,032 265,267 12,632 296,568 192,524 489,092Dec 19 122.62 123.27 245.89 12.94 142,036 168,288 310,324 16,333 197,580 173,311 370,891
Note: Figures may not add up to total due to rounding.
Options contract value, volume and open interest by class (2002)Contract value Contract volume Year-end open interest
(HK$mil) (contracts) (contracts)
% of % of % ofClass Call Put Total total Call Put Total total Call Put Total total
BANK OF E ASIA 13.24 7.33 20.56 0.45 61,575 47,306 108,881 2.92 7,480 6,533 14,013 3.78CATHAY PAC AIR 9.46 11.40 20.87 0.45 11,582 13,407 24,989 0.67 2,864 3,021 5,885 1.59CHEUNG KONG 241.45 358.42 599.87 13.07 94,343 72,118 166,461 4.47 4,129 3,568 7,697 2.08CKI HOLDINGS 1.82 2.40 4.21 0.09 3,235 5,429 8,664 0.23 999 1,639 2,638 0.71CHINA MER HOLD 4.11 1.44 5.55 0.12 8,421 3,194 11,615 0.31 201 391 592 0.16CHINA MOBILE 306.68 225.91 532.59 11.61 352,296 312,477 664,773 17.85 30,911 22,047 52,958 14.28SINOPEC CORP - H SHARES 0.03 0.01 0.05 0.00 380 88 468 0.01 230 88 318 0.09CHINA RESOURCES 13.80 16.14 29.95 0.65 14,272 14,847 29,119 0.78 1,898 1,438 3,336 0.90CHINA UNICOM 83.32 178.74 262.06 5.71 82,488 93,671 176,159 4.73 6,246 3,734 9,980 2.69CITIC PACIFIC 100.64 19.29 119.94 2.61 60,265 22,443 82,708 2.22 14,591 3,540 18,131 4.89CLP HOLDINGS 10.09 17.53 27.62 0.60 26,868 34,461 61,329 1.65 5,272 6,299 11,571 3.12CNOOC 4.66 7.74 12.40 0.27 11,127 17,148 28,275 0.76 6,545 7,036 13,581 3.66COSCO PACIFIC 1.05 1.06 2.11 0.05 2,062 1,785 3,847 0.10 245 75 320 0.09HANG SENG BANK 43.34 23.43 66.77 1.46 147,101 117,086 264,187 7.09 18,203 13,708 31,911 8.60HENDERSON LAND 34.47 31.40 65.87 1.44 25,354 23,754 49,108 1.32 2,193 2,963 5,156 1.39HK & CHINA GAS 8.33 7.55 15.88 0.35 16,286 18,291 34,577 0.93 5,416 6,577 11,993 3.23HKEX 1.43 1.00 2.43 0.05 2,168 934 3,102 0.08 308 - 308 0.08HK ELECTRIC 10.68 19.23 29.91 0.65 24,723 40,084 64,807 1.74 4,820 4,791 9,611 2.59HOPEWELL HOLD - - - 0.00 - - - - - - - -HSBC HOLDINGS 676.19 566.13 1,242.32 27.07 479,811 610,083 1,089,894 29.26 29,416 48,203 77,619 20.93HUANENG POWER - H SHARES 0.04 0.03 0.07 0.00 69 42 111 0.00 7 24 31 0.01HUTCHISON 324.54 427.88 752.42 16.40 126,143 113,930 240,073 6.45 4,760 4,891 9,651 2.60JOHNSON ELEC H 9.93 11.07 21.00 0.46 33,462 38,386 71,848 1.93 2,949 3,732 6,681 1.80LEGEND HOLD 2.16 2.48 4.63 0.10 3,734 4,548 8,282 0.22 1,117 775 1,892 0.51LI & FUNG 13.66 11.65 25.32 0.55 9,447 8,901 18,348 0.49 1,599 1,602 3,201 0.86MTR CORPORATION 3.22 2.73 5.94 0.13 14,221 18,343 32,564 0.87 2,026 2,182 4,208 1.13NEW WORLD DEV 6.50 6.15 12.65 0.28 14,952 12,806 27,758 0.75 2,336 2,293 4,629 1.25PCCW 6.99 4.73 11.72 0.26 55,057 33,299 88,356 2.37 9,248 10,242 19,490 5.25PETROCHINA - H SHARES 2.36 0.42 2.78 0.06 8,807 3,460 12,267 0.33 6,230 913 7,143 1.93SHANGHAI IND H 7.27 12.88 20.16 0.44 8,987 19,929 28,916 0.78 2,923 2,127 5,050 1.36SHK PPT 255.20 304.82 560.02 12.20 81,952 78,202 160,154 4.30 2,098 2,226 4,324 1.17SWIRE PACIFIC ‘A’ 25.33 20.78 46.12 1.00 33,243 29,304 62,547 1.68 8,774 1,443 10,217 2.75WHARF HOLDINGS 21.87 9.97 31.83 0.69 20,019 9,884 29,903 0.80 5,194 1,855 7,049 1.90TRACKER FUND 17.57 15.99 33.56 0.73 37,811 32,804 70,615 1.90 6,352 3,355 9,707 2.62
Total 2,261.44 2,327.74 4,589.17 100.00 1,872,261 1,852,444 3,724,705 100.00 197,580 173,311 370,891 100.00
Note: Figures may not add up to total due to rounding.
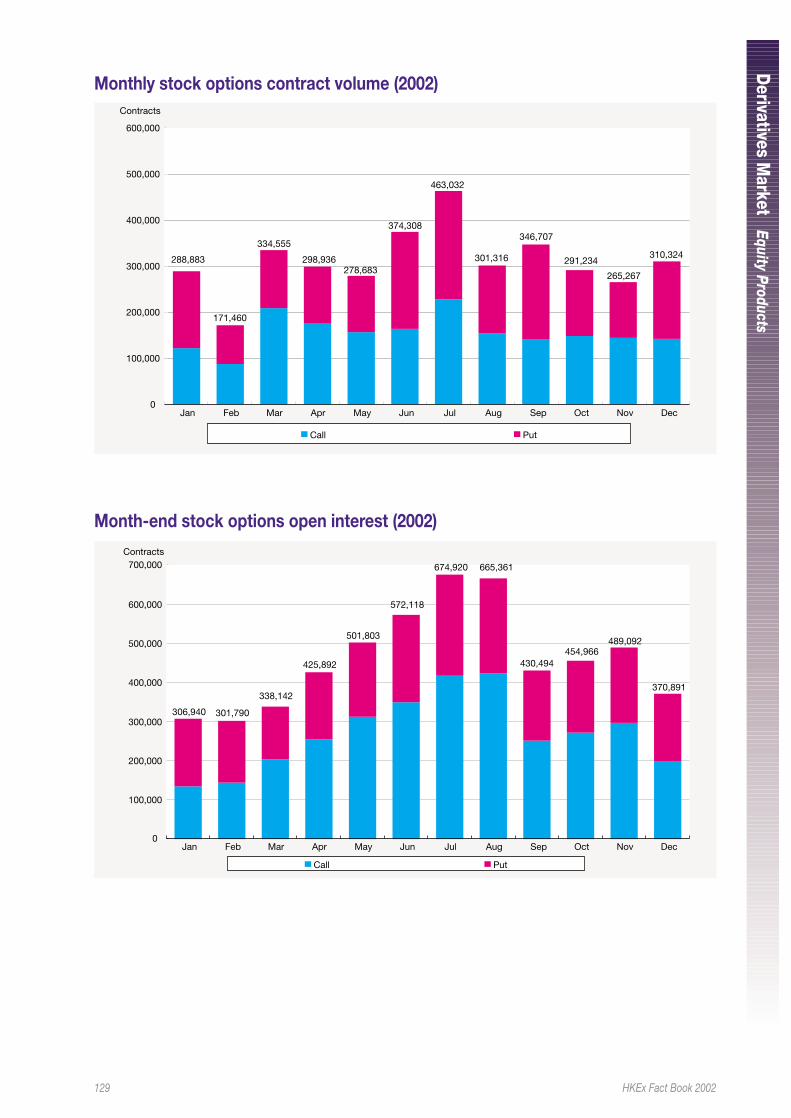
129 HKEx Fact Book 2002
Derivatives M
arketEquity Products
Monthly stock options contract volume (2002)
0
100,000
200,000
300,000
400,000
500,000
600,000
Jan Feb Mar Apr May Jun Jul Aug Sep Oct Nov Dec
Contracts
Call Put
265,267
310,324291,234
346,707
301,316
374,308
278,683
334,555
171,460
288,883 298,936
463,032
Month-end stock options open interest (2002)
0
100,000
200,000
300,000
400,000
500,000
600,000
700,000
Jan Feb Mar Apr May Jun Jul Aug Sep Oct Nov Dec
Contracts
Call Put
370,891
454,966430,494
501,803
425,892
338,142
301,790306,940
572,118
674,920 665,361
489,092
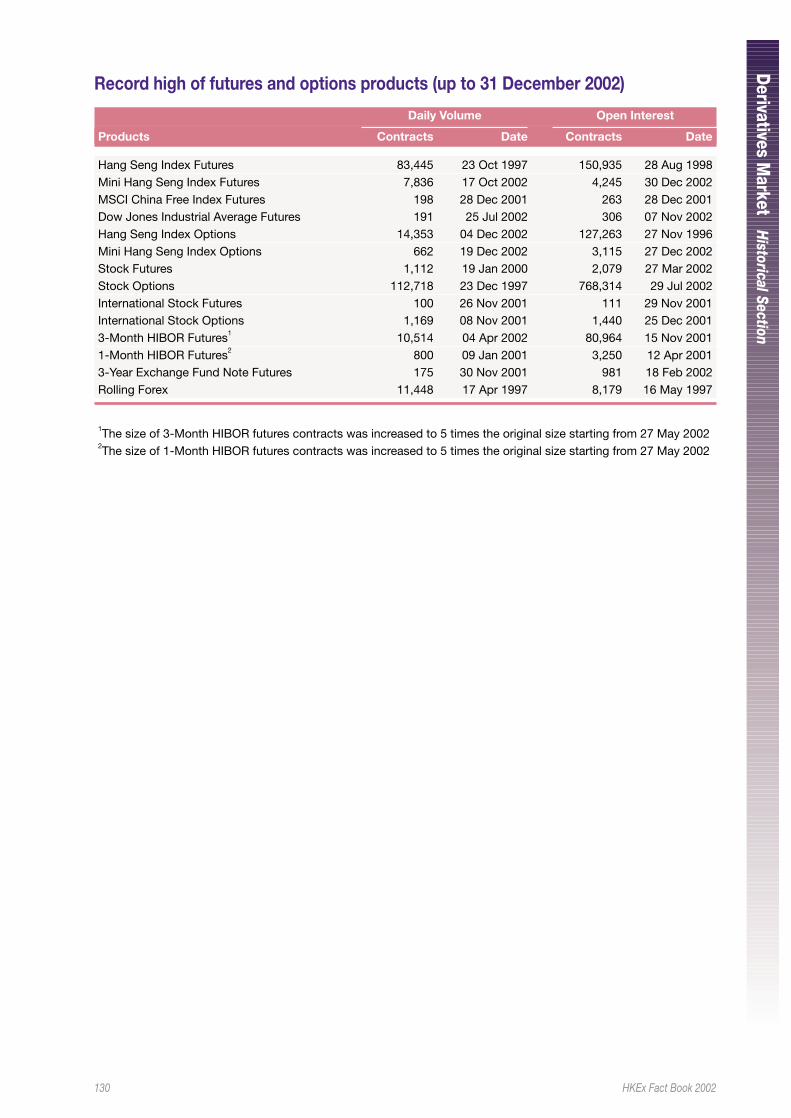
130 HKEx Fact Book 2002
Derivatives M
arketH
istorical Section
Record high of futures and options products (up to 31 December 2002)
Daily Volume Open Interest
Products Contracts Date Contracts Date
Hang Seng Index Futures 83,445 23 Oct 1997 150,935 28 Aug 1998Mini Hang Seng Index Futures 7,836 17 Oct 2002 4,245 30 Dec 2002MSCI China Free Index Futures 198 28 Dec 2001 263 28 Dec 2001Dow Jones Industrial Average Futures 191 25 Jul 2002 306 07 Nov 2002Hang Seng Index Options 14,353 04 Dec 2002 127,263 27 Nov 1996Mini Hang Seng Index Options 662 19 Dec 2002 3,115 27 Dec 2002Stock Futures 1,112 19 Jan 2000 2,079 27 Mar 2002Stock Options 112,718 23 Dec 1997 768,314 29 Jul 2002International Stock Futures 100 26 Nov 2001 111 29 Nov 2001International Stock Options 1,169 08 Nov 2001 1,440 25 Dec 20013-Month HIBOR Futures1 10,514 04 Apr 2002 80,964 15 Nov 20011-Month HIBOR Futures2 800 09 Jan 2001 3,250 12 Apr 20013-Year Exchange Fund Note Futures 175 30 Nov 2001 981 18 Feb 2002Rolling Forex 11,448 17 Apr 1997 8,179 16 May 1997
1The size of 3-Month HIBOR futures contracts was increased to 5 times the original size starting from 27 May 20022The size of 1-Month HIBOR futures contracts was increased to 5 times the original size starting from 27 May 2002
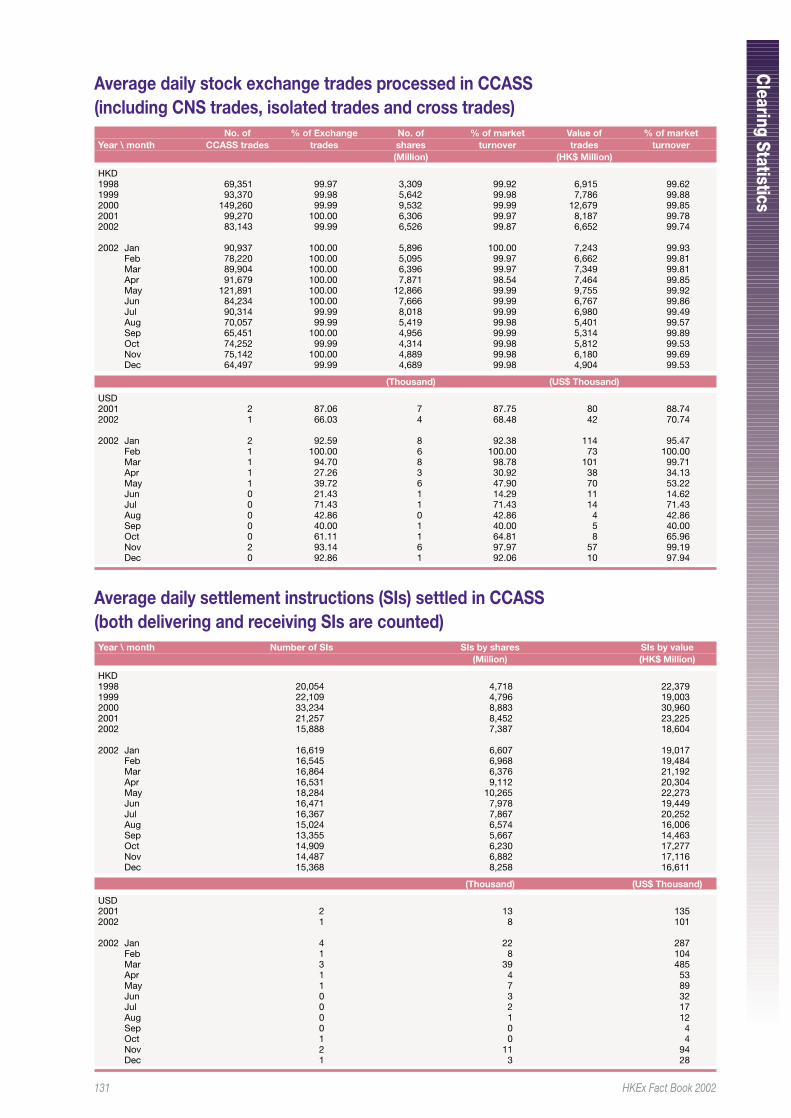
131 HKEx Fact Book 2002
Clearing Statistics
Average daily stock exchange trades processed in CCASS(including CNS trades, isolated trades and cross trades)
No. of % of Exchange No. of % of market Value of % of marketYear \ month CCASS trades trades shares turnover trades turnover
(Million) (HK$ Million)
HKD1998 69,351 99.97 3,309 99.92 6,915 99.621999 93,370 99.98 5,642 99.98 7,786 99.882000 149,260 99.99 9,532 99.99 12,679 99.852001 99,270 100.00 6,306 99.97 8,187 99.782002 83,143 99.99 6,526 99.87 6,652 99.74
2002 Jan 90,937 100.00 5,896 100.00 7,243 99.93Feb 78,220 100.00 5,095 99.97 6,662 99.81Mar 89,904 100.00 6,396 99.97 7,349 99.81Apr 91,679 100.00 7,871 98.54 7,464 99.85May 121,891 100.00 12,866 99.99 9,755 99.92Jun 84,234 100.00 7,666 99.99 6,767 99.86Jul 90,314 99.99 8,018 99.99 6,980 99.49Aug 70,057 99.99 5,419 99.98 5,401 99.57Sep 65,451 100.00 4,956 99.99 5,314 99.89Oct 74,252 99.99 4,314 99.98 5,812 99.53Nov 75,142 100.00 4,889 99.98 6,180 99.69Dec 64,497 99.99 4,689 99.98 4,904 99.53
(Thousand) (US$ Thousand)
USD2001 2 87.06 7 87.75 80 88.742002 1 66.03 4 68.48 42 70.74
2002 Jan 2 92.59 8 92.38 114 95.47Feb 1 100.00 6 100.00 73 100.00Mar 1 94.70 8 98.78 101 99.71Apr 1 27.26 3 30.92 38 34.13May 1 39.72 6 47.90 70 53.22Jun 0 21.43 1 14.29 11 14.62Jul 0 71.43 1 71.43 14 71.43Aug 0 42.86 0 42.86 4 42.86Sep 0 40.00 1 40.00 5 40.00Oct 0 61.11 1 64.81 8 65.96Nov 2 93.14 6 97.97 57 99.19Dec 0 92.86 1 92.06 10 97.94
Average daily settlement instructions (SIs) settled in CCASS(both delivering and receiving SIs are counted)Year \ month Number of SIs SIs by shares SIs by value
(Million) (HK$ Million)
HKD1998 20,054 4,718 22,3791999 22,109 4,796 19,0032000 33,234 8,883 30,9602001 21,257 8,452 23,2252002 15,888 7,387 18,604
2002 Jan 16,619 6,607 19,017Feb 16,545 6,968 19,484Mar 16,864 6,376 21,192Apr 16,531 9,112 20,304May 18,284 10,265 22,273Jun 16,471 7,978 19,449Jul 16,367 7,867 20,252Aug 15,024 6,574 16,006Sep 13,355 5,667 14,463Oct 14,909 6,230 17,277Nov 14,487 6,882 17,116Dec 15,368 8,258 16,611
(Thousand) (US$ Thousand)
USD2001 2 13 1352002 1 8 101
2002 Jan 4 22 287Feb 1 8 104Mar 3 39 485Apr 1 4 53May 1 7 89Jun 0 3 32Jul 0 2 17Aug 0 1 12Sep 0 0 4Oct 1 0 4Nov 2 11 94Dec 1 3 28
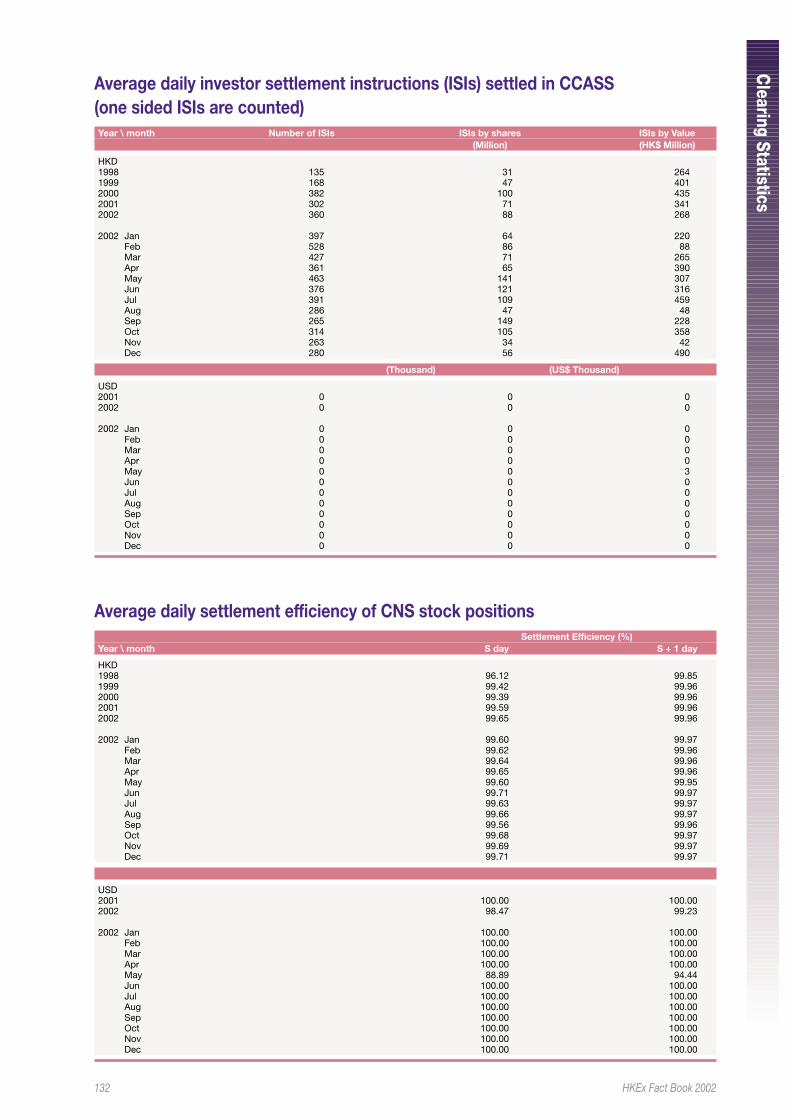
132 HKEx Fact Book 2002
Clearing Statistics
Average daily investor settlement instructions (ISIs) settled in CCASS(one sided ISIs are counted)Year \ month Number of ISIs ISIs by shares ISIs by Value
(Million) (HK$ Million)
HKD1998 135 31 2641999 168 47 4012000 382 100 4352001 302 71 3412002 360 88 268
2002 Jan 397 64 220Feb 528 86 88Mar 427 71 265Apr 361 65 390May 463 141 307Jun 376 121 316Jul 391 109 459Aug 286 47 48Sep 265 149 228Oct 314 105 358Nov 263 34 42Dec 280 56 490
(Thousand) (US$ Thousand)
USD2001 0 0 02002 0 0 0
2002 Jan 0 0 0Feb 0 0 0Mar 0 0 0Apr 0 0 0May 0 0 3Jun 0 0 0Jul 0 0 0Aug 0 0 0Sep 0 0 0Oct 0 0 0Nov 0 0 0Dec 0 0 0
Average daily settlement efficiency of CNS stock positionsSettlement Efficiency (%)
Year \ month S day S + 1 day
HKD1998 96.12 99.851999 99.42 99.962000 99.39 99.962001 99.59 99.962002 99.65 99.96
2002 Jan 99.60 99.97Feb 99.62 99.96Mar 99.64 99.96Apr 99.65 99.96May 99.60 99.95Jun 99.71 99.97Jul 99.63 99.97Aug 99.66 99.97Sep 99.56 99.96Oct 99.68 99.97Nov 99.69 99.97Dec 99.71 99.97
USD2001 100.00 100.002002 98.47 99.23
2002 Jan 100.00 100.00Feb 100.00 100.00Mar 100.00 100.00Apr 100.00 100.00May 88.89 94.44Jun 100.00 100.00Jul 100.00 100.00Aug 100.00 100.00Sep 100.00 100.00Oct 100.00 100.00Nov 100.00 100.00Dec 100.00 100.00
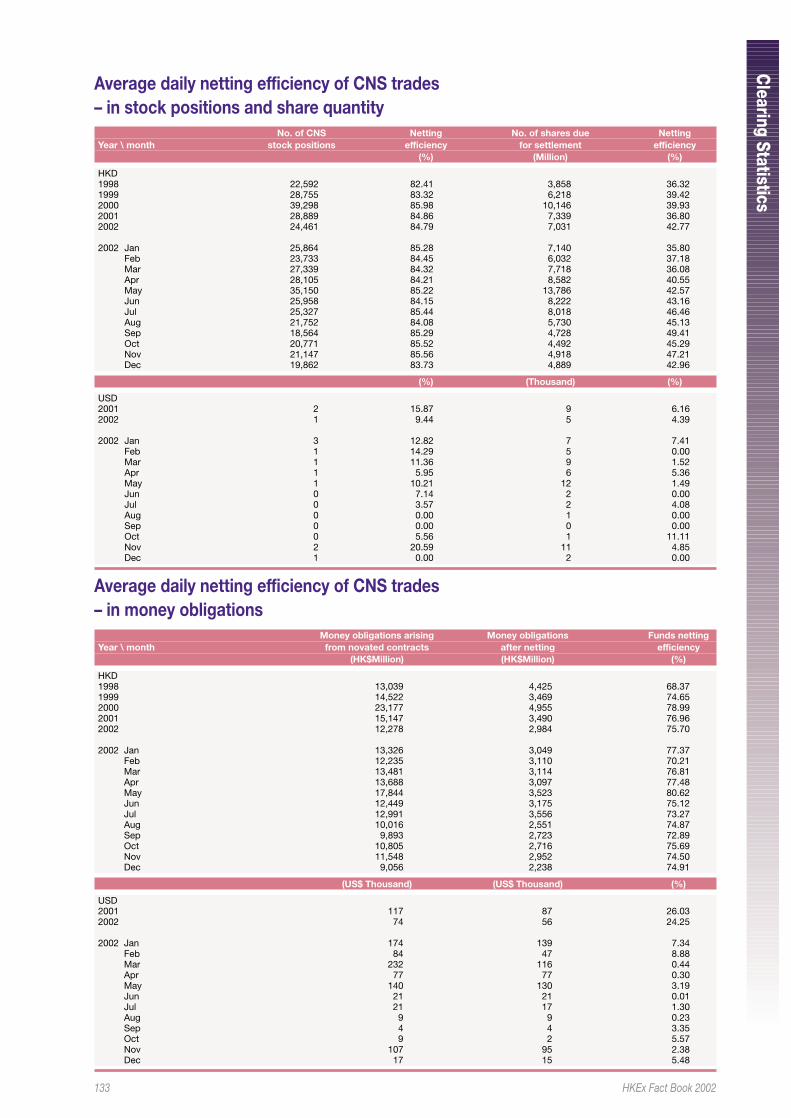
133 HKEx Fact Book 2002
Clearing Statistics
Average daily netting efficiency of CNS trades– in stock positions and share quantity
No. of CNS Netting No. of shares due NettingYear \ month stock positions efficiency for settlement efficiency
(%) (Million) (%)
HKD1998 22,592 82.41 3,858 36.321999 28,755 83.32 6,218 39.422000 39,298 85.98 10,146 39.932001 28,889 84.86 7,339 36.802002 24,461 84.79 7,031 42.77
2002 Jan 25,864 85.28 7,140 35.80Feb 23,733 84.45 6,032 37.18Mar 27,339 84.32 7,718 36.08Apr 28,105 84.21 8,582 40.55May 35,150 85.22 13,786 42.57Jun 25,958 84.15 8,222 43.16Jul 25,327 85.44 8,018 46.46Aug 21,752 84.08 5,730 45.13Sep 18,564 85.29 4,728 49.41Oct 20,771 85.52 4,492 45.29Nov 21,147 85.56 4,918 47.21Dec 19,862 83.73 4,889 42.96
(%) (Thousand) (%)
USD2001 2 15.87 9 6.162002 1 9.44 5 4.39
2002 Jan 3 12.82 7 7.41Feb 1 14.29 5 0.00Mar 1 11.36 9 1.52Apr 1 5.95 6 5.36May 1 10.21 12 1.49Jun 0 7.14 2 0.00Jul 0 3.57 2 4.08Aug 0 0.00 1 0.00Sep 0 0.00 0 0.00Oct 0 5.56 1 11.11Nov 2 20.59 11 4.85Dec 1 0.00 2 0.00
Average daily netting efficiency of CNS trades– in money obligations
Money obligations arising Money obligations Funds nettingYear \ month from novated contracts after netting efficiency
(HK$Million) (HK$Million) (%)
HKD1998 13,039 4,425 68.371999 14,522 3,469 74.652000 23,177 4,955 78.992001 15,147 3,490 76.962002 12,278 2,984 75.70
2002 Jan 13,326 3,049 77.37Feb 12,235 3,110 70.21Mar 13,481 3,114 76.81Apr 13,688 3,097 77.48May 17,844 3,523 80.62Jun 12,449 3,175 75.12Jul 12,991 3,556 73.27Aug 10,016 2,551 74.87Sep 9,893 2,723 72.89Oct 10,805 2,716 75.69Nov 11,548 2,952 74.50Dec 9,056 2,238 74.91
(US$ Thousand) (US$ Thousand) (%)
USD2001 117 87 26.032002 74 56 24.25
2002 Jan 174 139 7.34Feb 84 47 8.88Mar 232 116 0.44Apr 77 77 0.30May 140 130 3.19Jun 21 21 0.01Jul 21 17 1.30Aug 9 9 0.23Sep 4 4 3.35Oct 9 2 5.57Nov 107 95 2.38Dec 17 15 5.48
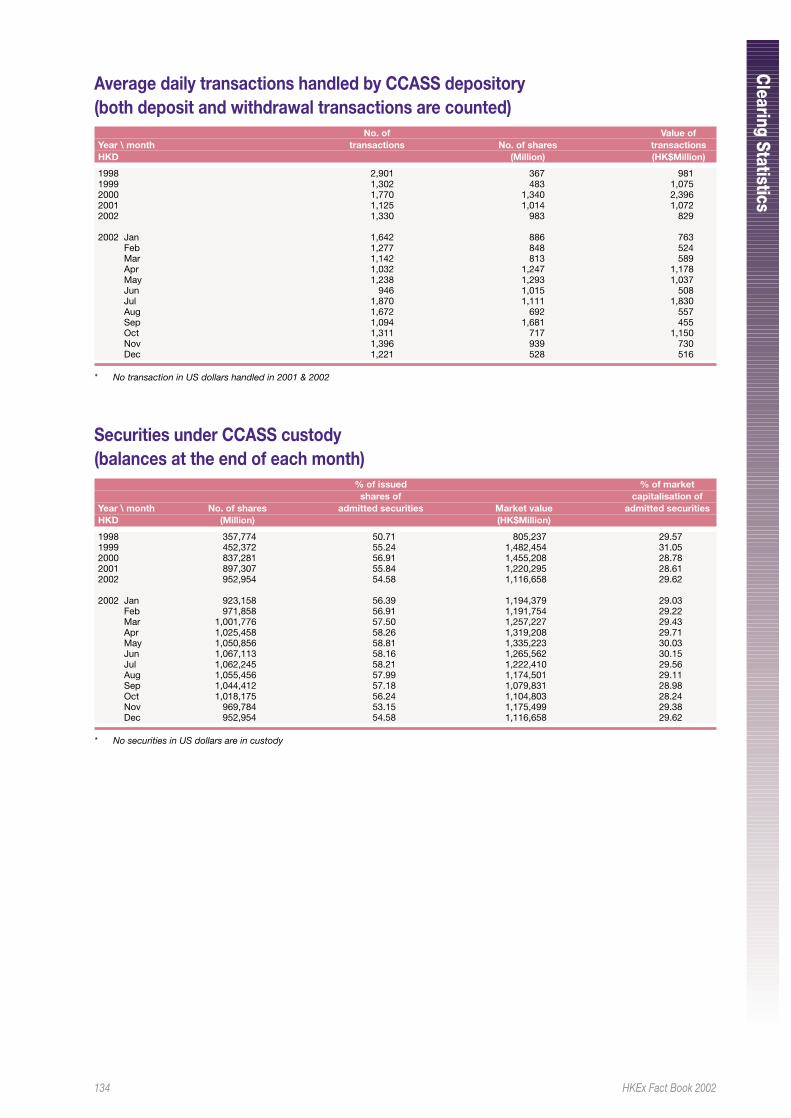
134 HKEx Fact Book 2002
Clearing Statistics
Average daily transactions handled by CCASS depository(both deposit and withdrawal transactions are counted)
No. of Value ofYear \ month transactions No. of shares transactionsHKD (Million) (HK$Million)
1998 2,901 367 9811999 1,302 483 1,0752000 1,770 1,340 2,3962001 1,125 1,014 1,0722002 1,330 983 829
2002 Jan 1,642 886 763Feb 1,277 848 524Mar 1,142 813 589Apr 1,032 1,247 1,178May 1,238 1,293 1,037Jun 946 1,015 508Jul 1,870 1,111 1,830Aug 1,672 692 557Sep 1,094 1,681 455Oct 1,311 717 1,150Nov 1,396 939 730Dec 1,221 528 516
* No transaction in US dollars handled in 2001 & 2002
Securities under CCASS custody(balances at the end of each month)
% of issued % of marketshares of capitalisation of
Year \ month No. of shares admitted securities Market value admitted securitiesHKD (Million) (HK$Million)
1998 357,774 50.71 805,237 29.571999 452,372 55.24 1,482,454 31.052000 837,281 56.91 1,455,208 28.782001 897,307 55.84 1,220,295 28.612002 952,954 54.58 1,116,658 29.62
2002 Jan 923,158 56.39 1,194,379 29.03Feb 971,858 56.91 1,191,754 29.22Mar 1,001,776 57.50 1,257,227 29.43Apr 1,025,458 58.26 1,319,208 29.71May 1,050,856 58.81 1,335,223 30.03Jun 1,067,113 58.16 1,265,562 30.15Jul 1,062,245 58.21 1,222,410 29.56Aug 1,055,456 57.99 1,174,501 29.11Sep 1,044,412 57.18 1,079,831 28.98Oct 1,018,175 56.24 1,104,803 28.24Nov 969,784 53.15 1,175,499 29.38Dec 952,954 54.58 1,116,658 29.62
* No securities in US dollars are in custody
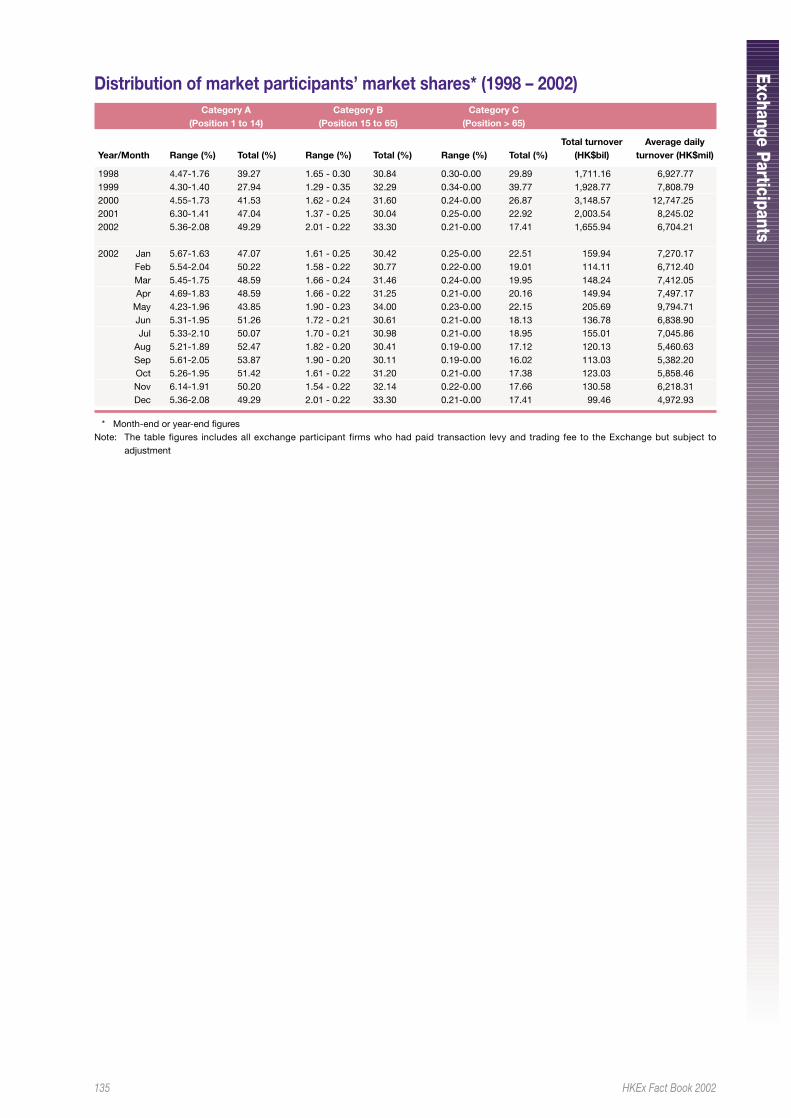
135 HKEx Fact Book 2002
Exchange Participants
Distribution of market participants’ market shares* (1998 – 2002)Category A Category B Category C
(Position 1 to 14) (Position 15 to 65) (Position > 65)
Total turnover Average dailyYear/Month Range (%) Total (%) Range (%) Total (%) Range (%) Total (%) (HK$bil) turnover (HK$mil)
1998 4.47-1.76 39.27 1.65 - 0.30 30.84 0.30-0.00 29.89 1,711.16 6,927.771999 4.30-1.40 27.94 1.29 - 0.35 32.29 0.34-0.00 39.77 1,928.77 7,808.792000 4.55-1.73 41.53 1.62 - 0.24 31.60 0.24-0.00 26.87 3,148.57 12,747.252001 6.30-1.41 47.04 1.37 - 0.25 30.04 0.25-0.00 22.92 2,003.54 8,245.022002 5.36-2.08 49.29 2.01 - 0.22 33.30 0.21-0.00 17.41 1,655.94 6,704.21
2002 Jan 5.67-1.63 47.07 1.61 - 0.25 30.42 0.25-0.00 22.51 159.94 7,270.17Feb 5.54-2.04 50.22 1.58 - 0.22 30.77 0.22-0.00 19.01 114.11 6,712.40Mar 5.45-1.75 48.59 1.66 - 0.24 31.46 0.24-0.00 19.95 148.24 7,412.05Apr 4.69-1.83 48.59 1.66 - 0.22 31.25 0.21-0.00 20.16 149.94 7,497.17
May 4.23-1.96 43.85 1.90 - 0.23 34.00 0.23-0.00 22.15 205.69 9,794.71Jun 5.31-1.95 51.26 1.72 - 0.21 30.61 0.21-0.00 18.13 136.78 6,838.90Jul 5.33-2.10 50.07 1.70 - 0.21 30.98 0.21-0.00 18.95 155.01 7,045.86
Aug 5.21-1.89 52.47 1.82 - 0.20 30.41 0.19-0.00 17.12 120.13 5,460.63Sep 5.61-2.05 53.87 1.90 - 0.20 30.11 0.19-0.00 16.02 113.03 5,382.20Oct 5.26-1.95 51.42 1.61 - 0.22 31.20 0.21-0.00 17.38 123.03 5,858.46Nov 6.14-1.91 50.20 1.54 - 0.22 32.14 0.22-0.00 17.66 130.58 6,218.31Dec 5.36-2.08 49.29 2.01 - 0.22 33.30 0.21-0.00 17.41 99.46 4,972.93
* Month-end or year-end figuresNote: The table figures includes all exchange participant firms who had paid transaction levy and trading fee to the Exchange but subject to
adjustment
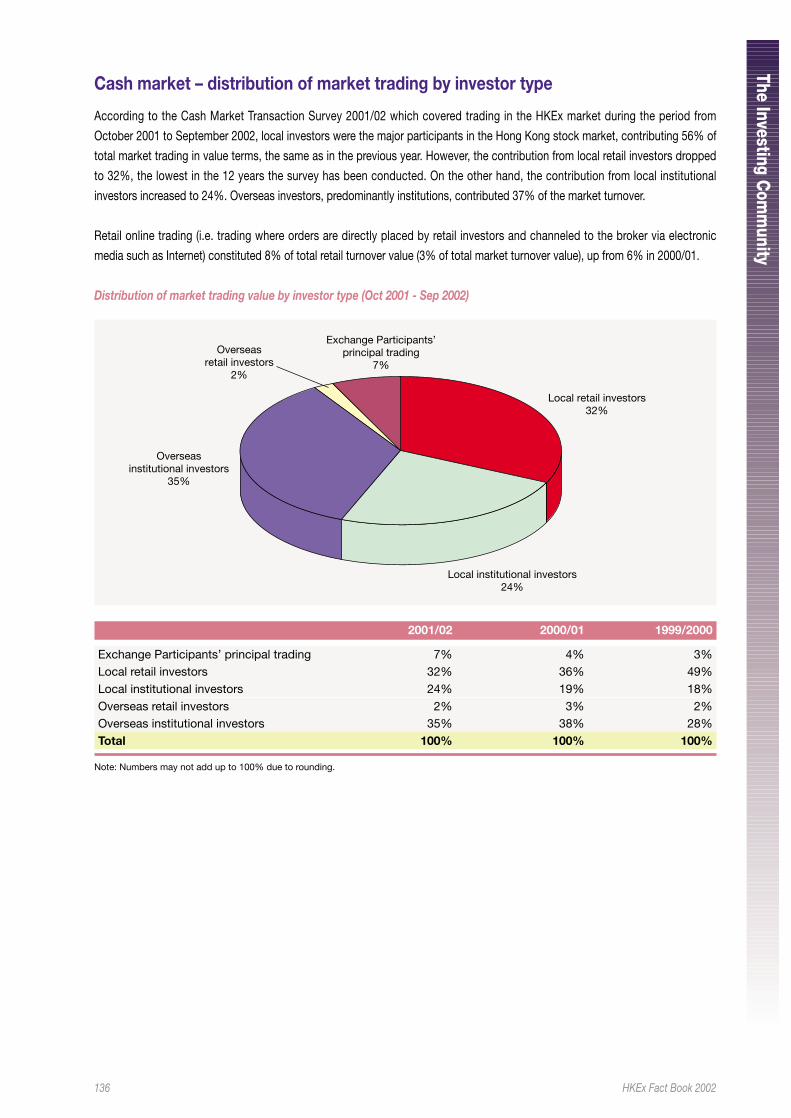
136 HKEx Fact Book 2002
The Investing Com
munity
Cash market – distribution of market trading by investor type
According to the Cash Market Transaction Survey 2001/02 which covered trading in the HKEx market during the period from
October 2001 to September 2002, local investors were the major participants in the Hong Kong stock market, contributing 56% of
total market trading in value terms, the same as in the previous year. However, the contribution from local retail investors dropped
to 32%, the lowest in the 12 years the survey has been conducted. On the other hand, the contribution from local institutional
investors increased to 24%. Overseas investors, predominantly institutions, contributed 37% of the market turnover.
Retail online trading (i.e. trading where orders are directly placed by retail investors and channeled to the broker via electronic
media such as Internet) constituted 8% of total retail turnover value (3% of total market turnover value), up from 6% in 2000/01.
Distribution of market trading value by investor type (Oct 2001 - Sep 2002)
Exchange Participants’principal trading
7%
Local retail investors32%
Local institutional investors24%
Overseasretail investors
2%
Overseasinstitutional investors
35%
2001/02 2000/01 1999/2000
Exchange Participants’ principal trading 7% 4% 3%Local retail investors 32% 36% 49%Local institutional investors 24% 19% 18%Overseas retail investors 2% 3% 2%Overseas institutional investors 35% 38% 28%Total 100% 100% 100%
Note: Numbers may not add up to 100% due to rounding.
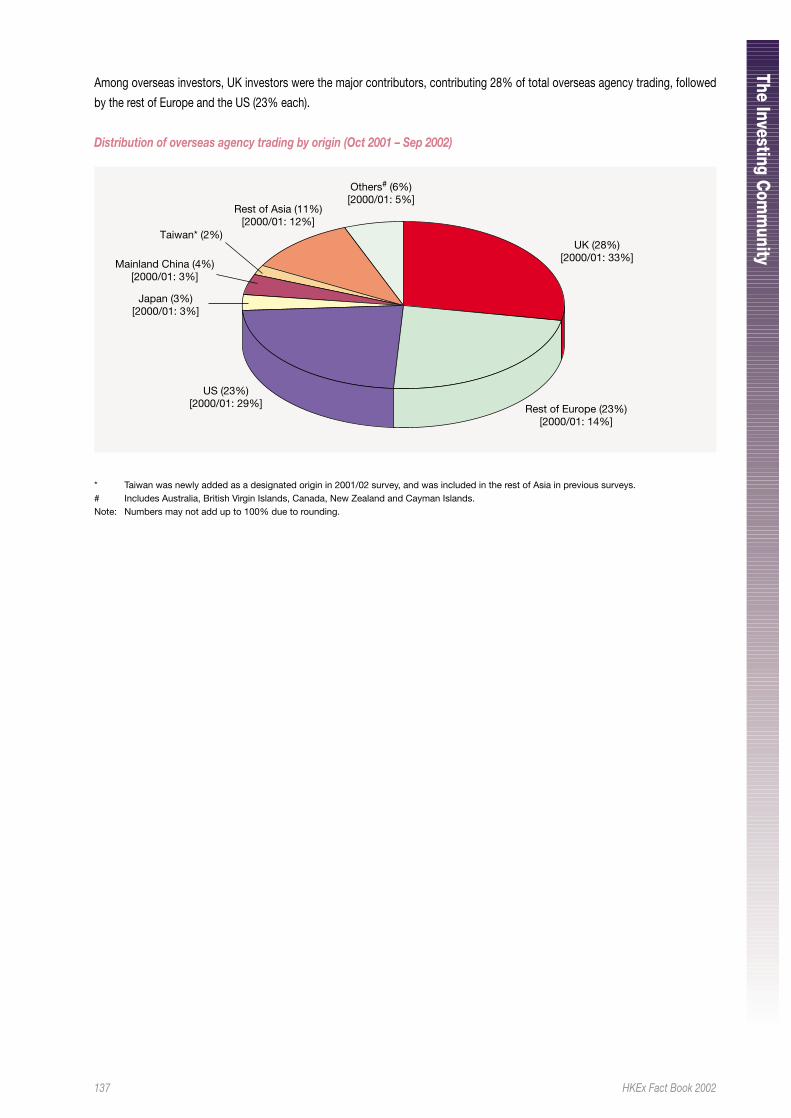
137 HKEx Fact Book 2002
The Investing Com
munity
Among overseas investors, UK investors were the major contributors, contributing 28% of total overseas agency trading, followed
by the rest of Europe and the US (23% each).
Distribution of overseas agency trading by origin (Oct 2001 – Sep 2002)
Others# (6%)[2000/01: 5%]
UK (28%)[2000/01: 33%]
Rest of Europe (23%)[2000/01: 14%]
Japan (3%)[2000/01: 3%]
Mainland China (4%)[2000/01: 3%]
Taiwan* (2%)
Rest of Asia (11%)[2000/01: 12%]
US (23%)[2000/01: 29%]
* Taiwan was newly added as a designated origin in 2001/02 survey, and was included in the rest of Asia in previous surveys.# Includes Australia, British Virgin Islands, Canada, New Zealand and Cayman Islands.Note: Numbers may not add up to 100% due to rounding.
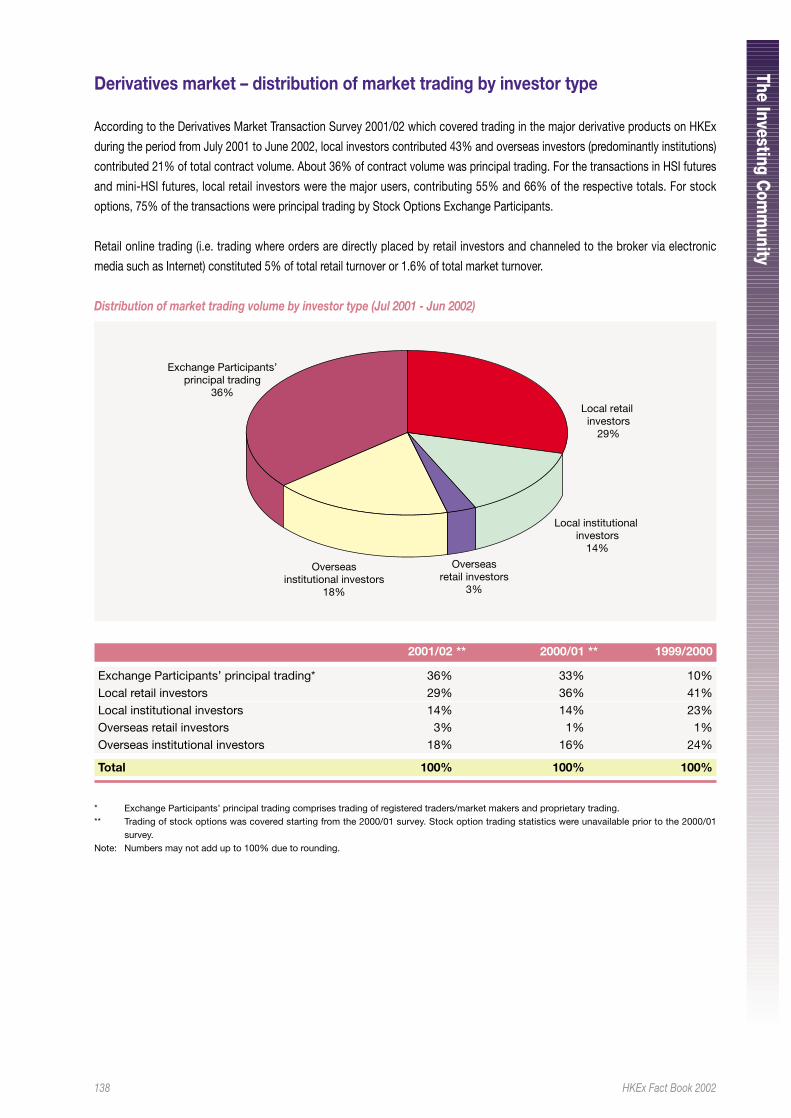
138 HKEx Fact Book 2002
The Investing Com
munity
Derivatives market – distribution of market trading by investor type
According to the Derivatives Market Transaction Survey 2001/02 which covered trading in the major derivative products on HKEx
during the period from July 2001 to June 2002, local investors contributed 43% and overseas investors (predominantly institutions)
contributed 21% of total contract volume. About 36% of contract volume was principal trading. For the transactions in HSI futures
and mini-HSI futures, local retail investors were the major users, contributing 55% and 66% of the respective totals. For stock
options, 75% of the transactions were principal trading by Stock Options Exchange Participants.
Retail online trading (i.e. trading where orders are directly placed by retail investors and channeled to the broker via electronic
media such as Internet) constituted 5% of total retail turnover or 1.6% of total market turnover.
Distribution of market trading volume by investor type (Jul 2001 - Jun 2002)
Exchange Participants’principal trading
36%
Local retail investors
29%
Local institutional investors
14%
Overseasretail investors
3%
Overseasinstitutional investors
18%
2001/02 ** 2000/01 ** 1999/2000
Exchange Participants’ principal trading* 36% 33% 10%Local retail investors 29% 36% 41%Local institutional investors 14% 14% 23%Overseas retail investors 3% 1% 1%Overseas institutional investors 18% 16% 24%
Total 100% 100% 100%
* Exchange Participants’ principal trading comprises trading of registered traders/market makers and proprietary trading.** Trading of stock options was covered starting from the 2000/01 survey. Stock option trading statistics were unavailable prior to the 2000/01
survey.Note: Numbers may not add up to 100% due to rounding.
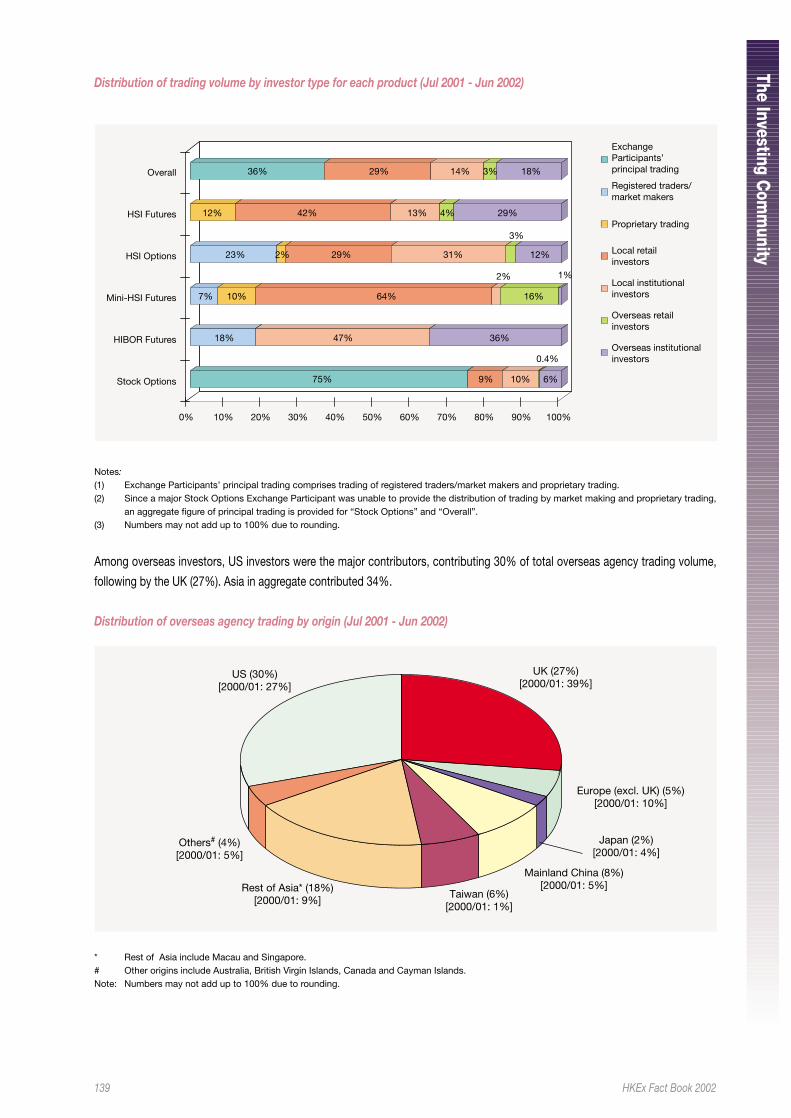
139 HKEx Fact Book 2002
The Investing Com
munity
Distribution of trading volume by investor type for each product (Jul 2001 - Jun 2002)
Overall
HSI Futures
HSI Options
Mini-HSI Futures
HIBOR Futures
Stock Options
0% 10% 20% 30% 40% 50% 60% 70% 80% 90% 100%
Overseas institutionalinvestors
Overseas retailinvestors
Local institutionalinvestors
Local retailinvestors
Proprietary trading
Registered traders/market makers
ExchangeParticipants’principal trading36%
12% 42% 13% 4% 29%
12%
3%
31%29%2%23%
7% 10% 64% 16%
36%47%18%
75% 9% 10% 6%
0.4%
2% 1%
29% 14% 18%3%
Notes:(1) Exchange Participants’ principal trading comprises trading of registered traders/market makers and proprietary trading.(2) Since a major Stock Options Exchange Participant was unable to provide the distribution of trading by market making and proprietary trading,
an aggregate figure of principal trading is provided for “Stock Options” and “Overall”.(3) Numbers may not add up to 100% due to rounding.
Among overseas investors, US investors were the major contributors, contributing 30% of total overseas agency trading volume,
following by the UK (27%). Asia in aggregate contributed 34%.
Distribution of overseas agency trading by origin (Jul 2001 - Jun 2002)
Others# (4%)[2000/01: 5%]
UK (27%)[2000/01: 39%]
Europe (excl. UK) (5%)[2000/01: 10%]
Japan (2%)[2000/01: 4%]
Mainland China (8%)[2000/01: 5%]
Taiwan (6%)[2000/01: 1%]
Rest of Asia* (18%)[2000/01: 9%]
US (30%)[2000/01: 27%]
* Rest of Asia include Macau and Singapore.# Other origins include Australia, British Virgin Islands, Canada and Cayman Islands.Note: Numbers may not add up to 100% due to rounding.
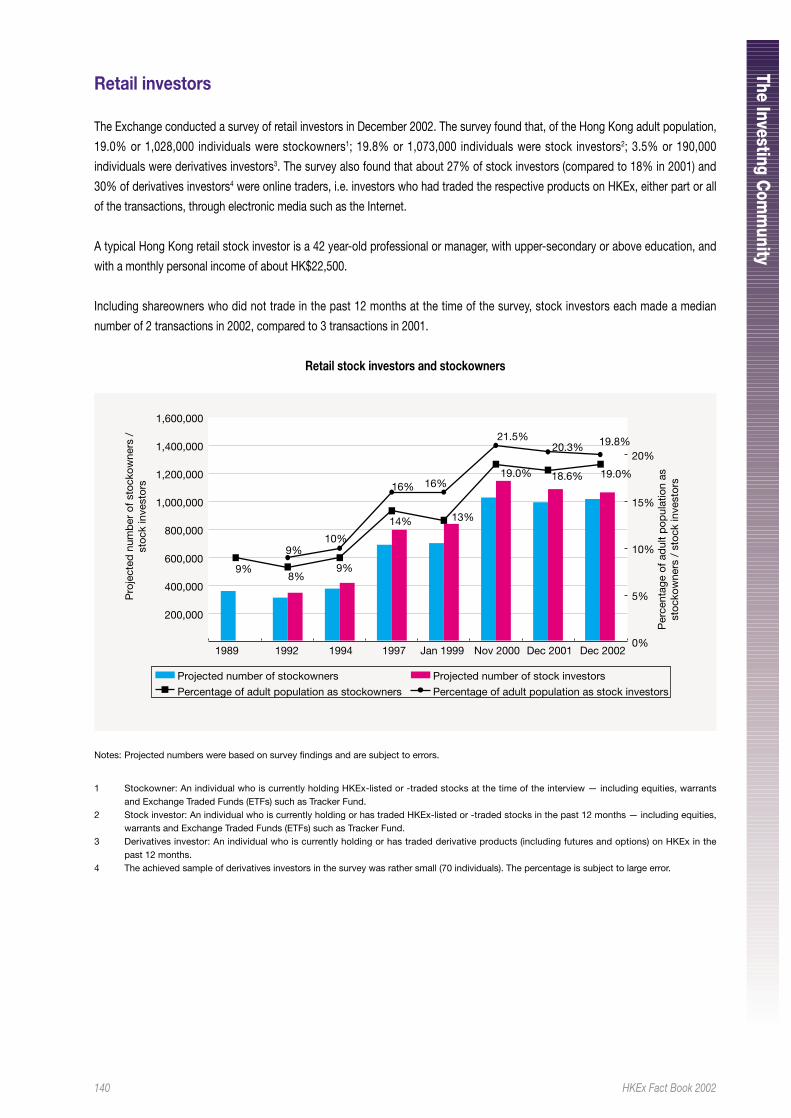
140 HKEx Fact Book 2002
The Investing Com
munity
Retail investors
The Exchange conducted a survey of retail investors in December 2002. The survey found that, of the Hong Kong adult population,
19.0% or 1,028,000 individuals were stockowners1; 19.8% or 1,073,000 individuals were stock investors2; 3.5% or 190,000
individuals were derivatives investors3. The survey also found that about 27% of stock investors (compared to 18% in 2001) and
30% of derivatives investors4 were online traders, i.e. investors who had traded the respective products on HKEx, either part or all
of the transactions, through electronic media such as the Internet.
A typical Hong Kong retail stock investor is a 42 year-old professional or manager, with upper-secondary or above education, and
with a monthly personal income of about HK$22,500.
Including shareowners who did not trade in the past 12 months at the time of the survey, stock investors each made a median
number of 2 transactions in 2002, compared to 3 transactions in 2001.
Retail stock investors and stockowners
9%
14% 13%
18.6%19.0%
9%8%
20.3% 19.8%
19.0%
21.5%
16% 16%
10%9%
200,000
400,000
600,000
800,000
1,000,000
1,200,000
1,400,000
1,600,000
1989 1992 1994 1997 Jan 1999 Nov 2000 Dec 2001 Dec 2002
Pro
ject
ed n
umb
er o
f sto
ckow
ners
/st
ock
inve
stor
s
0%
5%
10%
15%
20%
Per
cent
age
of a
dul
t p
opul
atio
n as
stoc
kow
ners
/ s
tock
inve
stor
sProjected number of stockowners Projected number of stock investors
Percentage of adult population as stockowners Percentage of adult population as stock investors
Notes: Projected numbers were based on survey findings and are subject to errors.
1 Stockowner: An individual who is currently holding HKEx-listed or -traded stocks at the time of the interview — including equities, warrantsand Exchange Traded Funds (ETFs) such as Tracker Fund.
2 Stock investor: An individual who is currently holding or has traded HKEx-listed or -traded stocks in the past 12 months — including equities,warrants and Exchange Traded Funds (ETFs) such as Tracker Fund.
3 Derivatives investor: An individual who is currently holding or has traded derivative products (including futures and options) on HKEx in thepast 12 months.
4 The achieved sample of derivatives investors in the survey was rather small (70 individuals). The percentage is subject to large error.
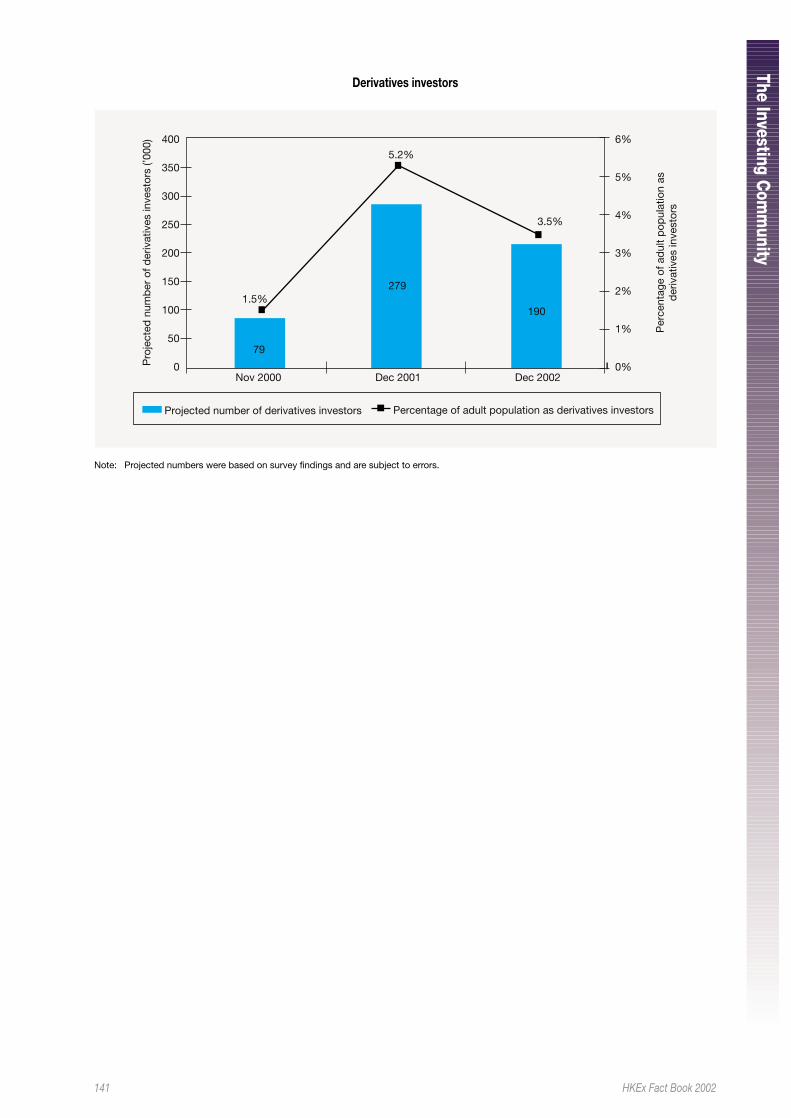
141 HKEx Fact Book 2002
The Investing Com
munity
Derivatives investors
1.5%
5.2%
3.5%
Nov 2000 Dec 2001 Dec 2002
Pro
ject
ed n
umb
er o
f der
ivat
ives
inve
stor
s (’0
00)
Per
cent
age
of a
dul
t p
opul
atio
n as
der
ivat
ives
inve
stor
s
Projected number of derivatives investors Percentage of adult population as derivatives investors
0
50
100
150
200
250
300
350
400
0%
1%
2%
3%
4%
5%
6%
79
279
190
Note: Projected numbers were based on survey findings and are subject to errors.
142 HKEx Fact Book 2002
Hong K
ong Stock Market H
istorical Events
HONG KONG STOCK MARKET HISTORICAL EVENTS
1891 “The Association of Stockbrokers in Hong Kong”, the first formal stock exchange in Hong Kong was formed.
1914 The name of the Association of Stockbrokers in Hong Kong was changed to “The Hong Kong Stock Exchange”.
1921 A second stock exchange, “The Hong Kong Stockbrokers’ Association”, was incorporated.
1947 The Hong Kong Stock Exchange and the Hong Kong Stockbrokers’ Association were merged to form a joint
exchange under the name of “The Hong Kong Stock Exchange Ltd”.
1969 Dec The Far East Exchange Ltd commenced business on 17 December.
1970 Feb The Companies Ordinance was amended to empower the Governor in Council to recognise stock exchanges for
certain limited purposes connected with the offering in writing of shares to any member of the public.
1971 Mar The Kam Ngan Stock Exchange Ltd commenced business on 15 March.
1972 Jan The Kowloon Stock Exchange Ltd commenced business on 5 January.
1973 Jan The four stock exchanges, the Far East Exchange, the Hong Kong Stock Exchange, the Kam Ngan Stock
Exchange and the Kowloon Stock Exchange, agreed to standardise their trading sessions with effect from 8
January.
A Securities Advisory Council was established and a Commissioner for Securities was appointed, but not given
statutory power, to help prepare the way for the statutory provisions to be imposed later.
Feb The Stock Exchange Control Ordinance 1973 was enacted, which imposed heavy penalties on anyone operating a
stock market which was not recognised under the Ordinance. The establishment of stock exchange was effectively
controlled.
The Government announced that it was mandatory for all companies seeking listing to have their prospectuses
registered with the Registrar of Companies.
1974 Feb The Securities Ordinance and The Protection of Investors Ordinance were enacted and were brought into operation
with effect from 1 March.
Apr The Federation of Share Registrars was established.
Jul The Hong Kong Federation of Stock Exchange was established.
Aug Under the Securities Ordinance 1974, a Stock Exchange Compensation Fund was established and contributions to
the fund were paid by the four stock exchanges in proportion to their membership.
Oct Part VI of the Ordinance and the Securities (Dealers, Investment Advisors and Representatives) Regulations 1974
was brought into force, requiring all dealers (whether or not they are members of the stock exchanges), investment
advisors and their representatives to register with the Commissioner for Securities.
143 HKEx Fact Book 2002
Hong K
ong Stock Market H
istorical Events
1975 Aug The Securities Commission approved the Code on Takeovers and Mergers.
Dec The Securities Commission approved a statutory rule prohibiting directors of a listed company incorporated in
Hong Kong from issuing shares - other than on a pro-rata basis to existing shareholders - without the prior
approval of shareholders.
1976 Aug Under the Securities (Stock Exchange Listing) Rule 1976, a listed company should appoint a member of the
Federation of Share Registrars to be its registrar.
1977 May Considerable progress was made towards the formation of a unified stock exchange in Hong Kong in place of the
existing four. A working party on unification was formed.
Dec An Insider Dealing Tribunal was set up.
1978 Mar Stamp duty on securities dealing was reduced from 0.8% to 0.6% (per round trip) with effect from 6 March.
1979 Aug A Practice Note was published by the Securities Commission to clarify the rules concerning the suspension of
dealings in the shares of offeree companies during takeover bids.
1980 Jul The Stock Exchange of Hong Kong Ltd was incorporated.
Aug The Stock Exchanges Unification Ordinance 1980 was passed by the Legislative Council.
1981 Jan The Securities Commission adopted a trigger point of 35% as the maximum percentage shareholding in a listed
company that any group or individual could hold without making a general offer for all the remaining shareholders.
Jul Under the Stamp Duty Ordinance 1981, instruments of transfer of registered warrants were chargeable with fixed
duty and contract notes were required to be stamped with effect from 1 July.
Oct The first committee members of the Exchange were elected.
1983 Mar The Code on Takeovers and Mergers was revised to the effect that bids involving less than 35% of a company’s
voting shares were not subject to control, but other partial bids were subject to the consent of the Takeovers
Committee. Market dealings in an offeree company’s shares before or during a bid were forbidden.
1984 May The Securities Commission released a set of guidelines for the placement of shares as a means of flotation, which
had been banned for some years.
1985 Aug The Securities (Amendment) Ordinance 1985 was enacted. Its purpose was to strengthen the power of the
Commissioner for Securities to monitor the financial viability of dealers.
The Legislative Council passed the Stock Exchanges Unification (Amendment) Ordinance 1985. Under the
Ordinance, locally incorporated firms, including subsidiaries of banks and deposit-taking companies, became
eligible to apply to the Stock Exchange of Hong Kong for corporate membership. And the disqualification of
directors or employees of banks and deposit-taking companies and of lawyers or professional accountants from
becoming members of the Exchange was removed.
144 HKEx Fact Book 2002
Hong K
ong Stock Market H
istorical Events
1986 Feb The Securities (Stock Exchange Listing) Rules 1986 took effect from 1 February.
The Securities (Accounts and Audit) (Amendment) Regulations were published in the Government Gazette. Dealers
and dealing partnerships were required to fulfil certain requirements.
The Securities (Recognition of Stock Market) Notice and the Securities (Registration of Dealers) (Approved
Examinations) Notice were published in the Government Gazette.
The Legislative Council approved the amended Securities (Stock Exchange Listing) Rules 1986.
Mar The Hong Kong Stock Exchange, the Far East Exchange, the Kam Ngan Stock Exchange and the Kowloon Stock
Exchange ceased trading after the close of business on 27 March.
Apr The Exchange commenced trading on 2 April.
Sep The Exchange became a full member of the Federation Internationale des Bourses de Valeurs on 22 September.
1987 Apr On 8 April, the Exchange and the Office of the Commissioner for Securities jointly announced that no further B
shares would be allowed to be quoted on the Exchange.
Oct The trading restrictions in connection with bank-related brokers were relaxed with effect from 2 October.
The General Committee of the Exchange unanimously resolved that trading on the Exchange would be suspended
for four days from 20 October to 23 October, both days inclusive. Trading in the Hang Seng Index Futures was also
suspended for the same period.
The Takeovers Committee, announced on 26 October that the Committee had decided that for a period of one
month, the trigger point, or creeper provision, as the case may be, under the Hong Kong Code on Takeovers and
Mergers, would be waived.
The Hong Kong Government, together with several leading financial institutions, raised a rescue fund of HK$4
billion of which HK$1.8 billion was utilised to enable the Hong Kong Futures Guarantee Corporation Ltd to finance
its obligations to members of the Hong Kong Futures Exchange (HKFE). With effect from 29 October, a levy of
HK$30 per HKFE transaction and a special levy of 0.03% on transaction value of securities dealings were
introduced to repay the interest and principal of the rescue package.
Nov The limit of compensation payable out of the Exchange Fidelity Fund or a member’s guarantee for the default of a
defaulting member was increased from HK$500,000 to HK$2,000,000, subject to the availability of funds, with
effect from the commencement of trading on 9 November.
1988 Jan The new Management Sub-committee of the Exchange was formed on 2 January to take up the duties of the
General Committee.
Jun The Government-appointed Securities Review Committee published the Report on the Operation and Regulation
of Hong Kong Securities Industry on 2 June.
Jul An amendment to the Articles of Association of the Exchange which allowed the Exchange to form a Council of 22
members instead of a committee of 21 members to govern its operations, was endorsed by its members on 20
July.
145 HKEx Fact Book 2002
Hong K
ong Stock Market H
istorical Events
Sep The Exchange and the Securities Commission released a joint announcement on 14 September, in which they
agreed that as a general rule, the Exchange would not list any new B shares. This general rule would not apply only
in exceptional circumstances. The queuing system for new applications for listing was also reviewed and
amended.
Oct The first 22-member Council of the Exchange was formed on 18 October.
Nov The first Nominating Committee of the Exchange was formed on 7 November.
1989 Feb The All Ordinaries Index was launched by the Exchange on 1 February.
Mar The Exchange announced the formation of Hong Kong Securities Clearing Company Ltd, a company limited by
guarantee.
Apr The Legislative Council passed the Securities and Futures Commission Ordinance 1989.
May The new Securities and Futures Commission (SFC) was formally established on 1 May.
Sep The SFC announced on 13 September that it had agreed to authorise warrant funds which had been able to apply
for authorisation with effect from 1 November.
Oct The Council of the Exchange endorsed a rolling T+2 settlement period for the proposed Central Clearing and
Settlement System.
Dec The Securities (Stock Exchange Listing) Rules 1989 were enacted on 1 December.
1990 Feb The minimum brokerage for each securities transaction traded on the Exchange was raised from HK$25 to HK$50
with effect from 8 February. The minimum commission rate of 0.25% for stock broking was maintained.
Apr On 2 April, the Council of the Exchange resolved that Council members on the Board of the Clearing Company
should be broker members and that the Chairman and the Deputy Chairman of the Board of the Clearing Company
must be a broker or banker member of the Board. If the Chairman was a broker member, the Deputy Chairman
must be a banker member and the two would rotate every year.
Jul The Securities (Insider Trading) Draft Bill, was passed by the Legislative Council on 25 July.
1991 Apr With effect from 1 April, stamp duty on share transactions was reduced from 0.6% to 0.5% (per round trip).
On 15 April, the Hong Kong Code on Share Repurchases, which allowed firms listed in Hong Kong to buy back
their own shares, was approved by the SFC and became effective immediately.
Sep The Securities (Disclosure of Interests) Ordinance came into force on 1 September.
Nov The Council of the Exchange and the SFC on 1 November agreed on a series of measures designed to permit all
the substantive elements of the revised voluntary constitutional package, which was unanimously supported at the
Extraordinary General Meeting of the Exchange on 30 October, to be brought into effect in time to govern the next
Council election. The new Council under the revised voluntary constitutional package would consist of 31
members in total - 18 broker members, 11 lay members and the chief executives of the Exchange and the Clearing
Company.
146 HKEx Fact Book 2002
Hong K
ong Stock Market H
istorical Events
On 25 November, the SFC and the Exchange announced the signing of a Memorandum of Understanding
providing for the devolution of day-to-day administration of all listing matters to the Exchange effective 31
December.
1992 Feb On 21 February, the SFC approved the revised Hong Kong Code on Takeovers and Mergers and its integration with
the Hong Kong Code on Share Repurchases. The new integrated Code came into effect on 1 April.
Apr With effect from 1 April, stamp duty on share transactions was reduced from 0.5% to 0.4% (per round trip) and the
stamp duty was extended to the trading of derivative warrants.
May On 11 May, changes made to the Exchange Listing Rules on the Exchange and the listing agreement for a
secondary listing, particularly where the majority of trading was likely to be on the Exchange, took effect.
Jun The settlement period for members of the Exchange was changed from T+1 to T+2 on 8 June.
On 24 June, the Central Clearing and Settlement System (CCASS) commenced operations on the trade-for-trade
basis.
Oct The compulsory Broker’s Fidelity Insurance Scheme came into effect on 1 October.
The Securities (Clearing Houses) Ordinance came into effect on 7 October. The maximum amount payable under
the Unified Exchange Compensation Fund to all persons (except stockbrokers) who suffer loss through any default
of a stockbroker was increased to HK$8 million in respect of each stockbroker concerned in or connected with the
default. The previous limit was HK$2 million.
On 7 October, CCASS commenced the second phase of its operation, starting to admit stocks for clearing and
settlement on a continuous net settlement (CNS) basis.
On 28 October, a memorandum of understanding was signed between the Hong Kong and the British securities
regulatory authorities.
1993 Apr With effect from 1 April, stamp duty on share transactions was reduced from 0.4% to 0.3% (per round trip).
Jun On 19 June, the China Securities Regulatory Commission, the Shanghai Securities Exchange, the Shenzhen Stock
Exchange, the SFC and the Exchange signed a Memorandum of Regulatory Co-operation in Beijing.
Jul Dealings in the H shares in Tsingtao Brewery Co Ltd commenced on 15 July. This was the first China-incorporated
enterprise to obtain a primary listing in Hong Kong.
Aug On 16 August, the Special Levy payable on every transaction recorded on the Exchange and the HKFE was
suspended.
Nov On 1 November, the Exchange launched the Automatic Order Matching and Execution System (AMS).
1994 Jan On 3 January, the Exchange launched a pilot scheme for regulated short-selling of shares.
Mar Jardine Matheson Holdings and Jardine Strategic Holdings announced their decision to delist from Hong Kong.
Other Jardine group companies made similar announcements in September.
147 HKEx Fact Book 2002
Hong K
ong Stock Market H
istorical Events
Jul With effect from 8 July, the Stamp Duty (Amendment) (No.2) Bill 1994 extended relief from stamp duty for stock
borrowing and lending activities and raised the maximum borrowing period from 14 days to 12 months.
1995 Sep On 8 September, the Exchange launched its Traded Stock Options Market. The first stock option was on HSBC
Holdings plc.
1996 Jan On 25 January, trading through the AMS off-floor terminals started. These terminals are installed in Exchange
members’ offices, allowing them to trade from their offices, in addition to trading through terminals in the Trading
Hall.
1997 Nov On 28 November, the Hong Kong Securities Institute was incorporated.
1998 Apr With effect from 1 April, the transaction levy was reduced from 0.013% to 0.011% and the proportion of sharing
between the Exchange and the SFC was changed from 7:6 to 7:4. Stamp duty on share transactions was also
reduced from 0.3% to 0.25% (per round trip).
May On 8 May, Hongkong Clearing launched its Investor Account Service which allows investors to open investor
accounts directly in CCASS.
1999 May On 17 May, Hongkong Clearing launched an Electronic Initial Public Offering (EIPO) service for CCASS
participants.
Nov On 12 November, the Tracker Fund of Hong Kong (TraHK) was listed on the Exchange. TraHK is a collective
investment fund issued by the Hong Kong SAR Government, which follows closely the movement of the
benchmark Hang Seng Index.
On 15 November, Growth Enterprise Market (GEM) was formally launched. The first listings were on 25 November
1999.
2000 Mar On 6 March, the Stock Exchange of Hong Kong Limited, the Hong Kong Futures Exchange and the Hong Kong
Securities Clearing Company became wholly-owned subsidiaries of Hong Kong Exchanges and Clearing Limited
(HKEx). Mr Kwong Ki-chi was appointed the Chief Executive of HKEx.
On 20 March, the Growth Enterprise Index (GEI) was launched. It has a base value of 1000 on the base date of 17
March 2000.
Apr With effect from 7 April, stamp duty on stock transactions was reduced to 0.225% (per round trip).
May On 31 May, the Exchange launched the Pilot Programme for Trading US Securities with initially seven Nasdaq
stocks admitted to trading.
Jun On 5 June, HSI Futures and Options migrated from open outcry trading to the HKFE’s electronic trading system -
HKATS (Hong Kong Futures Automated Trading System). Floor trading in HKFE was totally abolished.
On 27 June, shares of the HKEx were listed by introduction on the SEHK with a stock code of “388”.
148 HKEx Fact Book 2002
Hong K
ong Stock Market H
istorical Events
Sep On 15 September, HKEx announced the introduction of an Internet Initial Public Offering (iIPO) service to provide
individual investors with an additional electronic mechanism for submitting applications for IPOs.
Oct On 5 October, MTR Corporation Ltd (MTRC), the first government-owned organization to be privatized, was listed
on the SEHK. Also, MTRC was the first listing issuer using HKEx’s iIPO.
On 23 October, the first phase of the Third Generation Automatic Order Matching and Execution System (AMS/3)
was launched.
2001 Feb On 23 February, HKEx introduced its Order Routing System (ORS) to AMS/3 and Online Trading Service to its
Stock Exchange Participants.
Aug On 6 August, stock options trading was successfully migrated from TOPS, the Traded Options System, to HKATS,
the Hong Kong Futures Automated Trading System. Clearing and settlement of stock options trades continues to
be performed on TOPS.
Sep On 1 September, the stamp duty on securities transactions was reduced from 0.225% to 0.2% per transaction
(round-trip).
On 1 September, a Trading Fee of 0.005% per side of the consideration of a transaction was introduced by the
Stock Exchange. The transaction levy payable to the SFC increased from 0.005% to 0.007% per side of the
consideration of a transaction.
2002 Mar On 8 March, the SFC levy on trading of options on stock futures was reduced from $1.0 to $0.2 per contract per
side. The compensation fund levy on trading of options on stock futures was reduced from $0.5 to $0.1 per
contract per side.
On 25 March, HKEx introduced a pre-opening session and an index basket order trading mechanism in the
securities market. The 30-minute pre-opening session starts at 9:30 am. The index basket order trading
mechanism is only applicable in the continuous trading session.
May On 16 May, HKEx introduced the first phase of CCASS/3, the new generation of the Central Clearing and
Settlement System.
Aug On 5 August, the first six Equity Linked Instruments (ELIs) were listed on SEHK.
Sep On 16 September, HKMA announced the termination of the Tap Facility of the Tracker Fund of Hong Kong (TraHK)
on exhaustion of the Tap Issue Limit in the fourth quarter of 2002, thus concluding the Government’s stock market
operation in 1998.
Dec On 9 December, HKEx introduced the second phase of CCASS/3.
149 HKEx Fact Book 2002
AppendicesTechnical N
otes To Tables
Technical notes to tables
1. Annual turnover velocity
Annual market turnover in valueAnnual turnover velocity = x 100%
Total market capitalisation
2. Average book value ratio
Total market capitalisationAverage book value ratio =
Total net assets of all listed stocks
3. Average dividend yield
∑(DPS x No. of issued shares)Average dividend yield = x 100%
∑(Closing price x No. of issued shares)
Dividend per share (DPS) is annualised and adjusted as and when bonus and rights issues, share splits and consolidations
are made.
Number of issued shares represents year end number.
4. Average price earning ratio
∑(Closing price x No. of issued shares)Average P/E Ratio =
∑(EPS x No. of issued shares)
Earnings per share (EPS) is derived by dividing the consolidated profit after taxation less minority interests and preference
dividends and before extraordinary items by the weighted average of number of issued shares during the corresponding
financial year.
EPS is annualised and adjusted as and when bonus and rights issues, share splits and consolidations are made.
Number of issued shares represents year end number.
5. China-controlled company (Red Chip)
A company is deemed to be China-controlled company (Red Chip), if
(1) the company has at least 35% shareholding held in aggregate directly by Mainland China entities, and/or through
companies which are controlled by Mainland China entities. Or
(2) the company has below 35% but 20% or above shareholding held in aggregate directly by Mainland China entities,
and/or through companies which are controlled by Mainland China entities and, there is a strong influential presence,
on a judgmental basis, on the company’s board of directors.
Mainland China entities include state-owned organisations, provincial or municipal authorities in Mainland China.
6. Contract volume (options)
The number of contracts traded, counted on a one-way basis.
7. Foreign company
A company that is incorporated overseas AND has a majority of its business outside Hong Kong and China.
150 HKEx Fact Book 2002
AppendicesTechnical N
otes To Tables
8. H shares
Shares issued by a PRC issuer under PRC law and listed on the Stock Exchange of Hong Kong, the par value of which is
denominated in Renminbi, and which are subscribed for and traded in Hong Kong dollars.
9. Listed company
A company in respect of which all or some of the equity securities are listed on the Exchange.
10. Number of listed securities
The total number of ordinary shares, preferred ordinary/preference shares, debt securities and units in a unit trust/mutual
fund listed on the Exchange.
11. Open interest (options)
The total number of options contracts which are outstanding, i.e. not closed or exercised, as at the relevant date.
12. Premium (options)
Total amount payable by holders and payable to writers of options contracts in aspect of the writing of those contracts.
13. Total market capitalisation
The aggregate capitalisation of all listed companies which are regarded as domestic companies except those under
suspension for over one year.
14. Trading volume and value
Figures of trading volume and value are counted on a one-way basis.