lipopolysaccharides-mediated increase in glucose-stimulated insulin secretion: involvement of the...
TRANSCRIPT
Anh Thoai Nguyen,1 Stéphane Mandard,1 Cédric Dray,2 Valérie Deckert,1 Philippe Valet,2 Philippe Besnard,1 Daniel J. Drucker,3
Laurent Lagrost,1,4 and Jacques Grober1
Lipopolysaccharides-MediatedIncrease in Glucose-StimulatedInsulin Secretion: Involvementof the GLP-1 Pathway
Lipopolysaccharides (LPS) of the cell wall of gram–
negative bacteria trigger inflammation, which isassociated with marked changes in glucosemetabolism. Hyperglycemia is frequently observedduring bacterial infection and it is a marker of a poorclinical outcome in critically ill patients. The aim of thecurrent study was to investigate the effect of an acuteinjection or continuous infusion of LPS onexperimentally induced hyperglycemia in wild-typeand genetically engineered mice. The acute injectionof a single dose of LPS produced an increase inglucose disposal and glucose-stimulated insulinsecretion (GSIS). Continuous infusion of LPS throughmini-osmotic pumps was also associated withincreased GSIS. Finally, manipulation of LPSdetoxification by knocking out the plasmaphospholipid transfer protein (PLTP) led to increasedglucose disposal and GSIS. Overall, glucosetolerance and GSIS tests supported the hypothesisthat mice treated with LPS develop glucose-inducedhyperinsulinemia. The effects of LPS on glucosemetabolism were significantly altered as a result ofeither the accumulation or antagonism of glucagon-like peptide 1 (GLP-1). Complementary studies inwild-type and GLP-1 receptor knockout mice furtherimplicated the GLP-1 receptor–dependent pathway in
mediating the LPS-mediated changes in glucosemetabolism. Hence, enhanced GLP-1 secretion andaction underlies the development of glucose-mediated hyperinsulinemia associated withendotoxemia.Diabetes 2014;63:471–482 | DOI: 10.2337/db13-0903
Lipopolysaccharides (LPS) or endotoxins are componentsof the cell wall of gram–negative bacteria. When LPSenters the bloodstream, it activates Toll-like receptor4 (TLR4), which is located at the surface of immune cells,leading to the release of proinflammatory cytokines andinflammation (1). Excessive inflammatory response toLPS can be harmful and may lead to endotoxic shock andultimately death. Because gram–negative bacteria arepresent in large amounts in the gut lumen and the en-vironment, bacterial translocation and the resultingendotoxemia can occur as a result of inflammatory boweldisease (2), a high-fat diet (3), or cigarette smoking (4).Whatever the severity of the insult, endotoxemia is ac-companied by marked metabolic alterations, includingchanges in glucose metabolism, which is of particularimportance. Early hyperglycemia is a common metabolicfeature following exposure to bacterial endotoxins (5).It is known to contribute to poor immune function,
1INSERM UMR866-LabEx LipSTIC, Faculté de Médecine, Université deBourgogne, Dijon, France2INSERM Unité 1048, Institut des Maladies Métaboliques et Cardiovasculaires,Toulouse, France Université de Toulouse, Université Paul Sabatier, Toulouse, France3Department of Medicine, Samuel Lunenfeld Research Institute, Mt. Sinai Hospital,University of Toronto, Toronto, Ontario, Canada4Centre Hospitalier Universitaire Dijon, Hôpital du Bocage, Dijon, France
Corresponding author: Jacques Grober, [email protected], orLaurent Lagrost, [email protected].
Received 9 June 2013 and accepted 30 October 2013.
© 2014 by the American Diabetes Association. See http://creativecommons.org/licenses/by-nc-nd/3.0/ for details.
Diabetes Volume 63, February 2014 471
METABOLISM
at INSERM DISC IST on February 7, 2014http://diabetes.diabetesjournals.org/Downloaded from
oxidative stress, increased susceptibility to infectiouscomplications, impaired recovery of organ failure, andendothelial and myocardial dysfunction (6,7). In criticallyill patients, hyperglycemia is not only a marker of illnessseverity but also a predictor of a poor clinical outcome(7). Although effective glucose control through aggressiveinsulin therapy has been reported to improve clinicaloutcome, it remains unclear to what extent insulin in-fusion may in fact be beneficial (8). Hyperglycemia,moderate-to-severe hypoglycemia, and hyperinsulinemiahave all been found to be associated with an increasedrisk of death in critically ill patients admitted to the in-tensive care unit (9,10). In LPS-treated mice, a decreasein both inflammation and mortality was reported whenthe plasma glucose level was strictly maintained at nor-mal values, suggesting that appropriate/tight glucosecontrol is a major determinant of outcome (11). Whetherabnormalities in glucose control may vary according tothe endotoxemic insult is unknown, and the molecularmechanisms involved are poorly understood.
In the current study, the glucose and insulin re-sponses to experimentally induced hyperglycemia wereinvestigated in LPS-treated mouse models. Endotoxinswere administered through either the acute in-traperitoneal injection of a single dose of LPS, a contin-uous intraperitoneal infusion of a low dose of LPS usingmini-osmotic pumps, or the use of the phospholipidtransfer protein knockout (PLTP-KO) mouse model,which is known to display an impaired capacity to in-activate and detoxify LPS in the body (12). In all of themodels used in the current study, we found that LPSincreased glucose-stimulated insulin secretion (GSIS),which has been shown to be due, at least in part, to anincrease in the level and activity of glucagon-like peptide1 (GLP-1).
RESEARCH DESIGN AND METHODS
Animals
Five- to six-month-old WT mice (Charles River,L’Arbresle, France), GLP-1 receptor knockout(GLP-1R-KO) mice (13), and PLTP-KO mice (a kind giftof Dr. Jiang [14]) from a homogeneous C57BL6/J back-ground were housed in a controlled environment. All ofthe animal experimental procedures were validated bythe local ethics committee of the University of Burgundy(protocol number 1209). Mice had free access to waterand standard diet—A03-10 Rats/Mice Breeder Diet(SAFE, Augy, France). The diet contained 21.4% protein,5.7% mineral, 5.1% fat, 4% cellulose, and mixture ofvitamins and micronutrients.
Surgical Procedures and Injections/Infusions of LPS
LPS were from Escherichia coli 055:B5 (Sigma, St. Louis,MO). The mice were either given intraperitoneal injec-tions of LPS (0.5, 1, or 2 mg/kg) or had a mini-osmoticpump implanted subcutaneously (Alzet Model 2004;Alza, Palo Alto, CA) and linked to the peritoneal cavity
by a catheter. The pumps were filled with either NaCl(0.9%) or LPS to infuse 300 or 1,000 mg $ kg21 $ day21
for 4 weeks. After 4 weeks, plasma samples were drawnand frozen at 220°C. The mice were then killed andmuscle tissue and the liver were immediately excised, im-mersed in liquid N2, and stored at280°C for further mRNAanalyses.
Glucose Tolerance Test
After fasting overnight, the mice were fed with glucoseby oral gavage (1.5–2 g/kg). Blood was drawn from thetail vein at 0, 15, 30, 60, 90, and 120 min following theglucose load, and glucose concentration was determinedwith a glucose meter (OneTouch Ultra, Milpitas, CA).Oral glucose tolerance tests (OGTTs) were performedeither 6 h after the acute intraperitoneal injection of LPSor at the end of the 28-day infusion period. In someexperiments, sitagliptin (Januvia, Merck Sharp andDohme-Chibret, France) (5 mg/kg) or exendin(9–39)(Ex-9) (5 mg/mouse) was administered via oral gavage orintraperitoneal injection, respectively, 30 min prior tothe glucose gavage. NaCl (0.9%) was administered asa control. The area under the curve (AUC) (0–120) wascalculated for each group of mice, and the plasma insulinconcentration was measured 30 min before and 15 minafter the glucose load. The insulinogenic index (IGI) (i.e.,an index of b-cell function) was calculated as the D in-sulin to the D glucose ratio (DI0–15/DG0–15, pmol/mmol)
Insulin Tolerance Test
After 6 h of fasting, mice were given an intraperitonealinjection of 0.5 U/kg insulin (Humalog), and blood glu-cose was measured as mentioned above.
Plasma GLP-1 Concentration
After fasting overnight, mice were given an injection ofthe dipeptidyl peptidase 4 (DPP4) inhibitor sitagliptin(5 mg/kg). One hour later, the mice were given an in-traperitoneal injection of LPS (2 mg/kg) or NaCl (0.9%)as the control. Six hours after the LPS or NaCl injection,the mice were given 2 g/kg of glucose through oral ga-vage. Blood samples were collected in EDTA-containingtubes supplemented with the DPP4 inhibitor (Millipore,France) 30 min before and 15 min after the glucose loadto assess the plasma GLP-1 concentration.
Real-Time Quantitative PCR
Total RNA was isolated from tissues using Trizol reagent(Invitrogen, France). Total RNA (0.5 mg) was reversetranscribed using MMLV reverse transcriptase (Invitrogen)and random primers at 42°C for 1 h. QuantitativePCRs were performed using ABI Prism 7900 (AppliedBiosystems, France). Primer sequences for the targetedmouse genes are available upon request. The mRNAexpression level of target genes was normalized to levelsof b-actin mRNA and the results were expressed asrelative expression levels. The data were quantified bythe method of 2-DDCt.
472 LPS Enhances GLP-1 Diabetes Volume 63, February 2014
at INSERM DISC IST on February 7, 2014http://diabetes.diabetesjournals.org/Downloaded from
Glucose Uptake in Muscle
Muscles were isolated and preincubated for 10 min inKrebs-Henseleit buffer (pH 7.4) containing 2 mg/mLBSA, 2 mmol/L sodium pyruvate, and 20 mmol/L HEPES.The muscles were then incubated for 45 min in the ab-sence or presence of 100 nmol/L insulin as previouslydescribed (15).
Biochemical Analyses
LPS concentrations were measured in total plasma, HDL,and the lipoprotein-free fraction (LFF) through thequantitation of 3-b-hydroxymyristate concentrationaccording to the general procedure previously described(12). Plasma insulin and GLP-1 concentration were de-termined by ELISA (ALPCO, Salem, NH), in accordancewith the manufacturer’s instructions. Muscle glycogencontent was determined with the glycogen synthase as-say kit (BioVision, Mountain View, CA), in accordancewith the manufacturer’s instructions. The concentrationsof interleukin-6 (IL-6) and tumor necrosis factor-a(TNFa,) were measured in mouse plasma by MilliplexMAP 5-Plex kit (mouse cytokine/chemokine magneticbead panel) from Millipore (Millipore, Billerica, MA),according to the manufacturer’s protocol and usinga LuminexR apparatus (Bio-Plex 200, Bio-Rad).
Statistical Analyses
Results are presented as mean 6 SEM. Statisticalsignificance of differences was analyzed by theunpaired t test.
RESULTS
Acute Intraperitoneal Injection of LPS Enhances GSIS
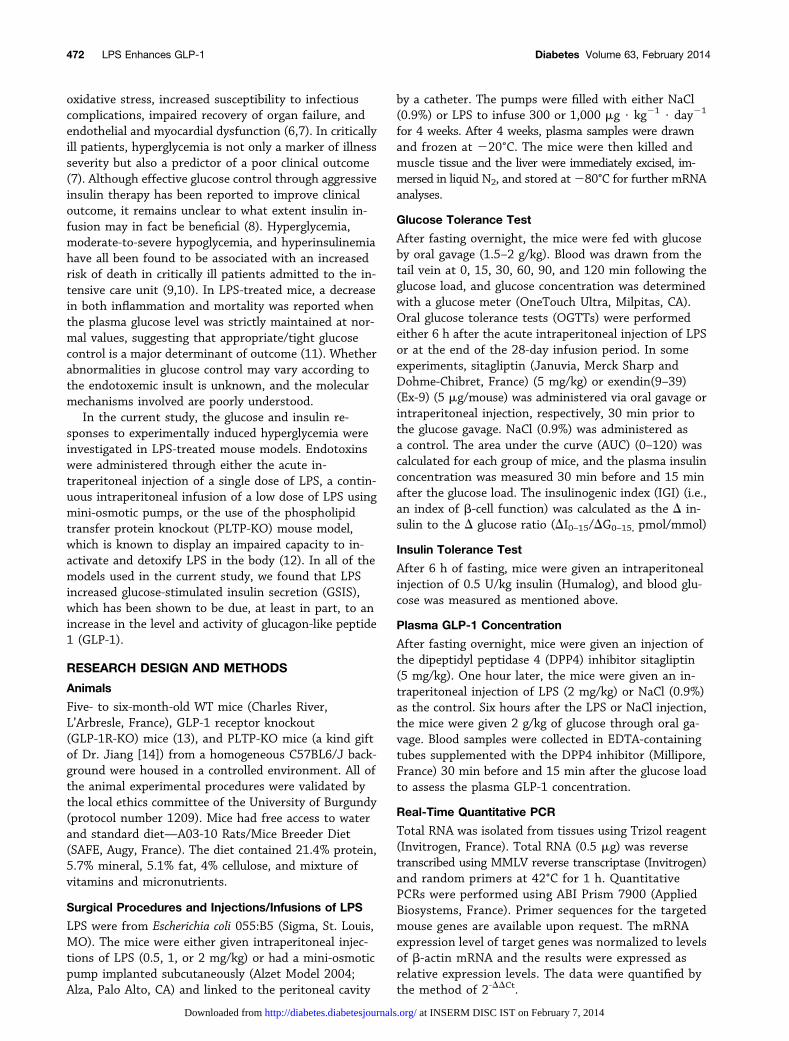
To evaluate the glucose and insulin responses duringLPS-mediated inflammation, wild-type (WT) mice weregiven a single acute intraperitoneal injection of 2 mg/kgof LPS. Plasma b-hydroxymyristate content, reflectingplasma LPS level, was markedly increased upon LPS in-jection (603.2 6 12.2 ng/mL in LPS-injected mice [n = 8]vs. 68.4 6 16.2 ng/mL in NaCl controls [n = 8]; P ,0.001). Six hours after the LPS injection, hyperglycemiawas induced by gavage with a glucose solution (2 g/kg).As shown in Fig. 1A and B, the glucose tolerance curvewas improved with the LPS injection and GSIS increased(Fig. 1C). Consistent results were obtained by using twolower doses of LPS. Whereas in fasting conditions, nosignificant differences were observed in insulin plasmalevels upon injection of either 0.5 mg/kg or 1 mg/kg ofLPS (data not shown). Again, with either dose of LPS,GSIS after the glucose load was significantly enhanced asrevealed by the insulin plasma levels at t = 15 min(766.9 6 125.5 pmol/L in LPS-injected mice [n = 10] vs.434 6 37.49 pmol/L in NaCl controls [n = 9], P , 0.05with the 0.5 mg/kg dose; 666.5 6 89.39 pmol/L inLPS-injected mice [n = 10] vs. 373.8 6 31.16 pmol/L inNaCl controls [n = 10], P , 0.01 with the 1 mg/kg dose).The function of pancreatic b-cells was evaluated bycalculating the IGI at the 15-min time point (i.e., in thevery early phase of insulin secretion). As shown in
Figure 1—Acute intraperitoneal injection of LPS enhances GSIS. A: OGTT (2 g/kg) performed 6 h after injection of NaCl (n = 6) or LPS2 mg/kg (n = 6) in WT mice. B: AUC of glucose response expressed as arbitrary units (a.u.). C: Plasma insulin levels measured before and15 min after an oral glucose load (2 g/kg) in NaCl-injected mice (n = 10) and LPS-injected mice (2 mg/kg) (n = 10). D: IGI. Body mass:NaCl, 29.26 0.6 g; LPS, 30.06 1.6 g (NS). Values are mean6 SEM. *P< 0.05, **P< 0.01, ***P < 0.001, aP 5 NS, b,cP< 0.001 vs. fasting,dP < 0.05 vs. NaCl glucose load.
diabetes.diabetesjournals.org Nguyen and Associates 473
at INSERM DISC IST on February 7, 2014http://diabetes.diabetesjournals.org/Downloaded from
Fig. 1D, the acute intraperitoneal injection of LPS in-creased the IGI.
Continuous Intraperitoneal Infusion of LPSIncreases GSIS
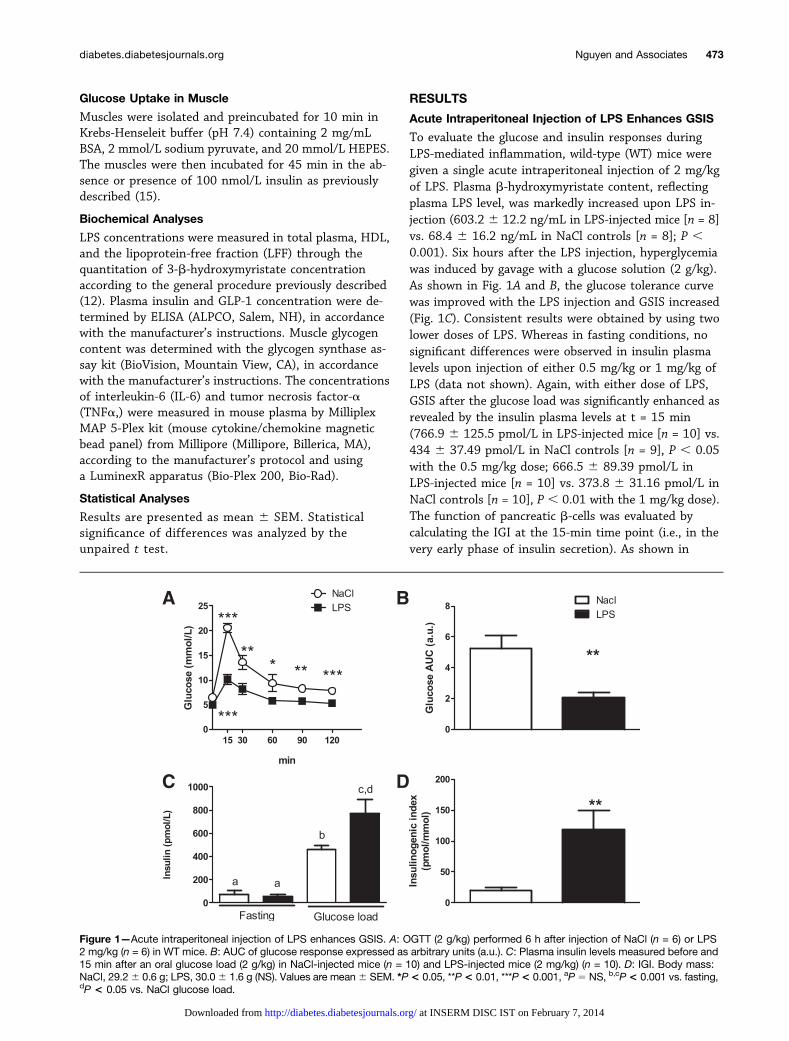
We next assessed the consequences of sustained LPSadministration by implanting mice with mini-osmoticpumps that continuously delivered LPS or NaCl for28 days (300 mg/kg/day). This LPS dose was reported tomimic the metabolic endotoxemia induced by a high-fatdiet (3). Plasma b-hydroxymyristate content was mod-estly but significantly increased upon LPS infusion (LPS-infused mice [n = 7], 51.9 6 3.9 ng/mL; NaCl controls[n = 4], 35.8 6 1.3 ng/mL; P , 0.05). In contrast to theacute intraperitoneal injection of LPS (Fig. 1A), thecontinuous intraperitoneal infusion of LPS did not im-prove the glycemic response during the OGTT (Fig. 2A),as indicated by similar values for the AUC (Fig. 2B).However, GSIS and the IGI were increased with LPStreatment, although to a lesser extent than with acuteLPS injection (Fig. 2C and D vs. Fig. 1C and D). Usinga higher dose of LPS (1 mg/kg/day) during continuousinfusion led to the same enhancement of GSIS aftera glucose load as shown by the insulin plasma levels at t =15 min (LPS-infused mice [n = 4], 892.56 131.4 pmol/L;NaCl controls [n = 4], 431.8 6 10.1 pmol/L; P , 0.05).
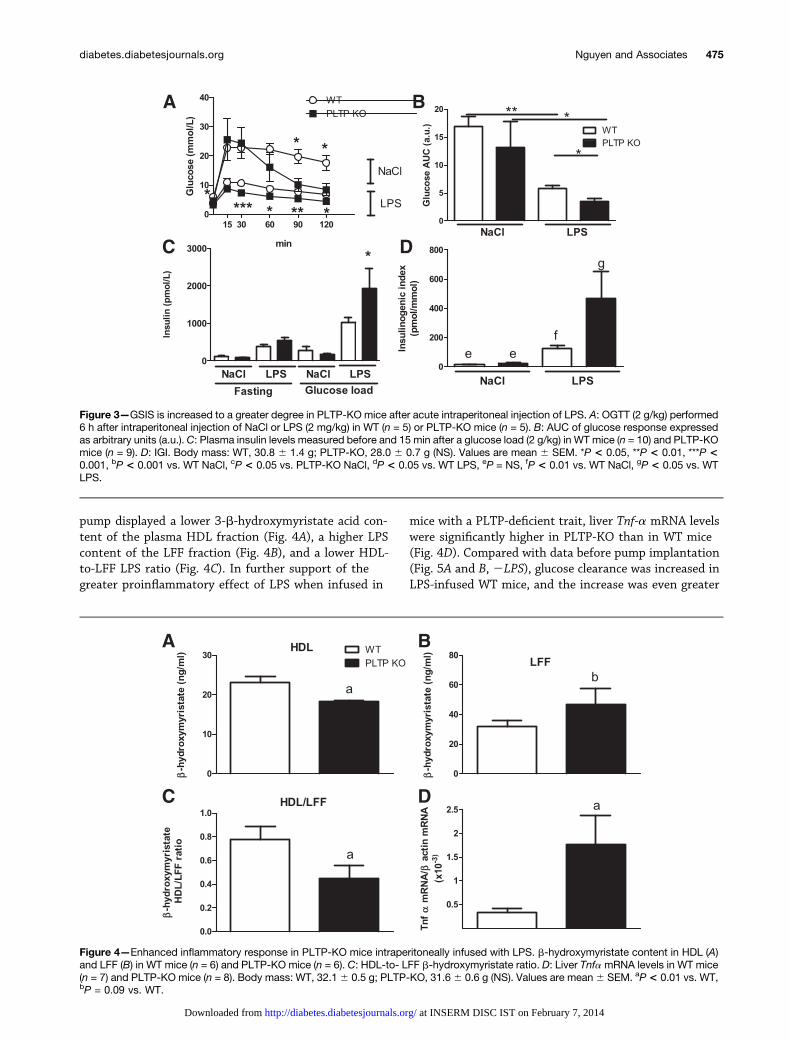
Reduced LPS Neutralization and Detoxification inPLTP-KO Mice Is Associated With Amplification ofGlucose and Insulin Responses
To further evaluate the impact of LPS on glucose andinsulin responses, we took advantage of the PLTP-KO
mouse model, which displays a reduced capacity to de-toxify LPS (12). After acute intraperitoneal LPS injection,plasma b-hydroxymyristate content was higher inPLTP-KO mice as compared with WT mice (371.5 6 24.3ng/mL in PLTP-KO mice [n = 6] vs. 298.7 6 23.8 ng/mLin WT controls [n = 6], P , 0.05). In the absence of LPS,PLTP expression per se did not modify the glucose re-sponse to oral glucose challenge (Fig. 3A and B, NaCl). InLPS-treated mice, glucose clearance was increased toa significantly greater extent in PLTP-KO mice than inWT mice (Fig. 3A and B, LPS). Whereas GSIS was notdependent on PLTP expression in the absence of the LPSchallenge (Fig. 3C, NaCl), insulin levels were significantlygreater in PLTP-KO mice after acute LPS injection(Fig. 3C, LPS). Similarly, the IGI was significantly in-creased after acute intraperitoneal injection of LPS in WTand PLTP-KO mice (Fig. 3D).
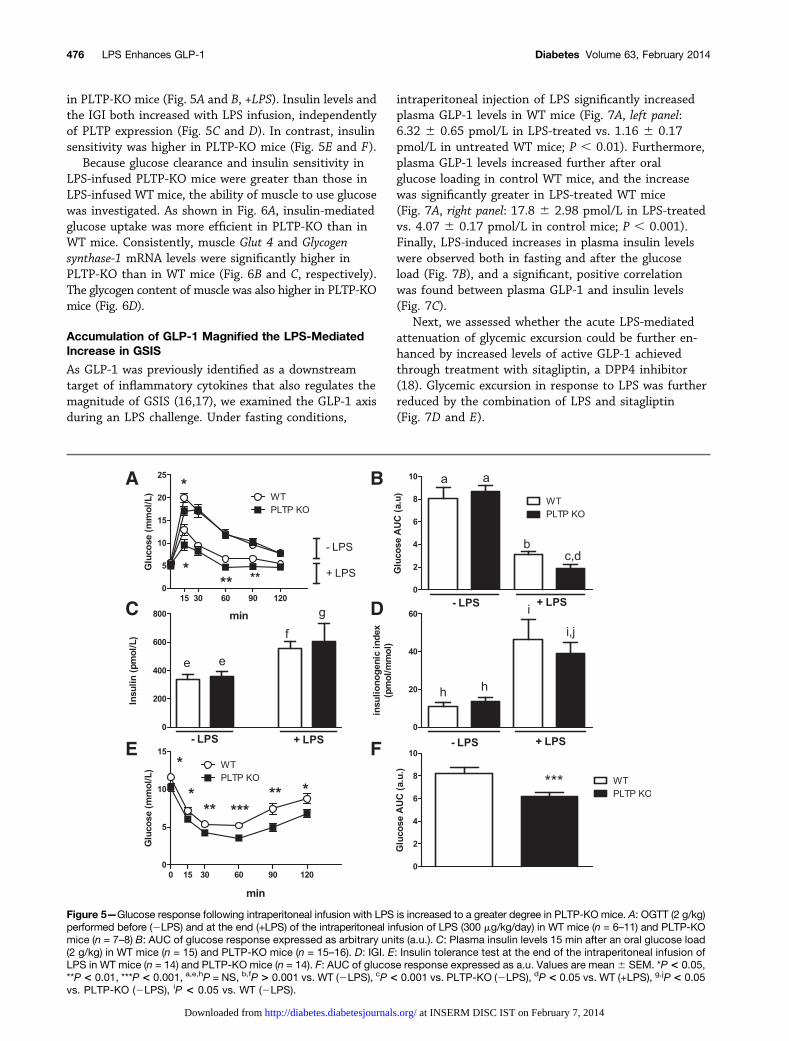
We next assessed the consequences of chronic LPSinfusion in WT and PLTP-KO mice. Continuous infusionof a low dose of LPS did not lead to significant differ-ences in LPS plasma levels between WT and PLTP-KOmice after 28 days of LPS infusion (52.3 6 2.6 ng/mL inPLTP-KO mice [n = 8] vs. 56.6 6 3.5 ng/mL in WT mice[n = 7], P = NS). However, and as PLTP is involved in LPStransfer between the plasma LFF and plasma lip-oproteins, we next determined whether this experimen-tal set up was effective to modulate LPS distributionbetween HDL and LFF as reported earlier with acuteintraperitoneal injection (12). In agreement with earlierobservations, PLTP-KO mice that received a continuousinfusion of LPS through the implanted mini-osmotic
Figure 2—Continuous intraperitoneal infusion of LPS enhances GSIS. WT mice were intraperitoneally infused for 28 days with NaCl orLPS (300 mg/kg/day) using mini-osmotic pumps. A: OGTT (2 g/kg) performed 28 days after a NaCl (n = 4) or LPS (n = 7) intraperitonealinfusion in WT mice. B: AUC of glucose response expressed as arbitrary units (a.u.). C: Plasma insulin levels measured before and 15 minafter an oral glucose load (2 g/kg) in NaCl-infused mice (n = 4) and LPS-infused mice (n = 7). D: IGI. Body mass: NaCl, 26.9 6 0.3 g; LPS,27.3 6 0.5 g (NS). Values are mean 6 SEM. *P < 0.05, aP 5 NS, b,cP < 0.001 vs. fasting, dP < 0.05 vs. NaCl glucose load.
474 LPS Enhances GLP-1 Diabetes Volume 63, February 2014
at INSERM DISC IST on February 7, 2014http://diabetes.diabetesjournals.org/Downloaded from
pump displayed a lower 3-b-hydroxymyristate acid con-tent of the plasma HDL fraction (Fig. 4A), a higher LPScontent of the LFF fraction (Fig. 4B), and a lower HDL-to-LFF LPS ratio (Fig. 4C). In further support of thegreater proinflammatory effect of LPS when infused in
mice with a PLTP-deficient trait, liver Tnf-a mRNA levelswere significantly higher in PLTP-KO than in WT mice(Fig. 4D). Compared with data before pump implantation(Fig. 5A and B, 2LPS), glucose clearance was increased inLPS-infused WT mice, and the increase was even greater
Figure 3—GSIS is increased to a greater degree in PLTP-KO mice after acute intraperitoneal injection of LPS. A: OGTT (2 g/kg) performed6 h after intraperitoneal injection of NaCl or LPS (2 mg/kg) in WT (n = 5) or PLTP-KO mice (n = 5). B: AUC of glucose response expressedas arbitrary units (a.u.). C: Plasma insulin levels measured before and 15 min after a glucose load (2 g/kg) in WT mice (n = 10) and PLTP-KOmice (n = 9). D: IGI. Body mass: WT, 30.8 6 1.4 g; PLTP-KO, 28.0 6 0.7 g (NS). Values are mean 6 SEM. *P < 0.05, **P < 0.01, ***P <0.001, bP < 0.001 vs. WT NaCl, cP < 0.05 vs. PLTP-KO NaCl, dP < 0.05 vs. WT LPS, eP = NS, fP < 0.01 vs. WT NaCl, gP < 0.05 vs. WTLPS.
Figure 4—Enhanced inflammatory response in PLTP-KO mice intraperitoneally infused with LPS. b-hydroxymyristate content in HDL (A)and LFF (B) in WT mice (n = 6) and PLTP-KO mice (n = 6). C: HDL-to- LFF b-hydroxymyristate ratio. D: Liver TnfamRNA levels in WT mice(n = 7) and PLTP-KO mice (n = 8). Body mass: WT, 32.16 0.5 g; PLTP-KO, 31.66 0.6 g (NS). Values are mean6 SEM. aP < 0.01 vs. WT,bP = 0.09 vs. WT.
diabetes.diabetesjournals.org Nguyen and Associates 475
at INSERM DISC IST on February 7, 2014http://diabetes.diabetesjournals.org/Downloaded from
in PLTP-KO mice (Fig. 5A and B, +LPS). Insulin levels andthe IGI both increased with LPS infusion, independentlyof PLTP expression (Fig. 5C and D). In contrast, insulinsensitivity was higher in PLTP-KO mice (Fig. 5E and F).
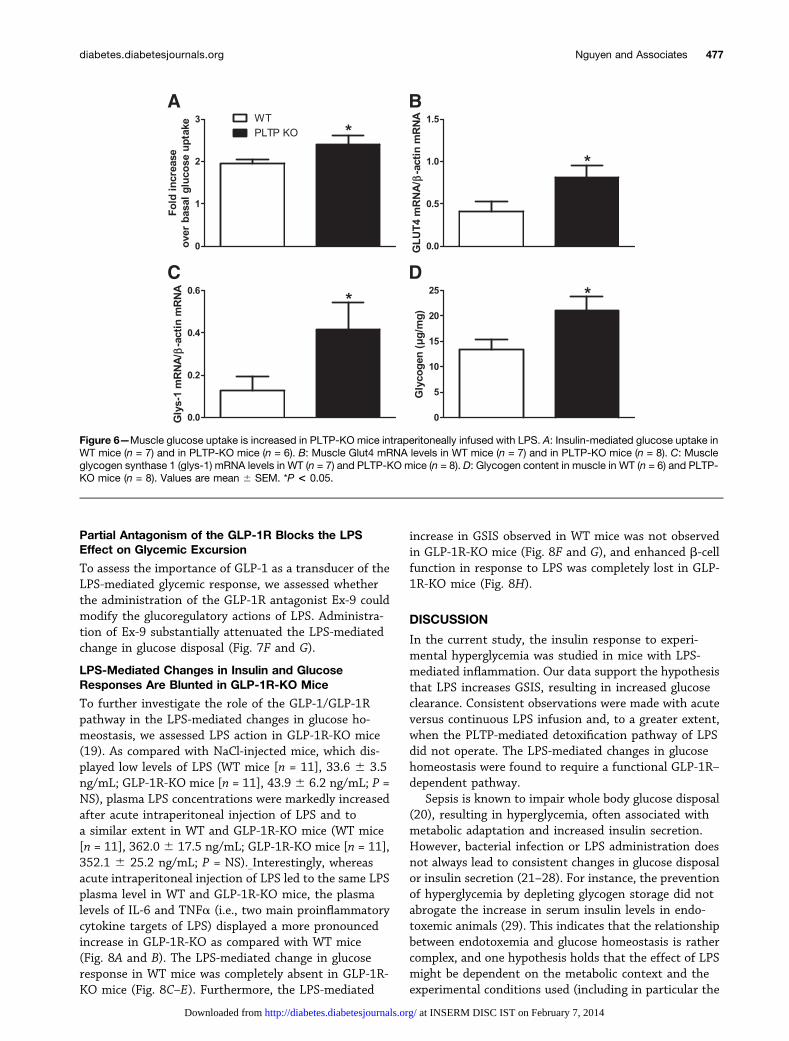
Because glucose clearance and insulin sensitivity inLPS-infused PLTP-KO mice were greater than those inLPS-infused WT mice, the ability of muscle to use glucosewas investigated. As shown in Fig. 6A, insulin-mediatedglucose uptake was more efficient in PLTP-KO than inWT mice. Consistently, muscle Glut 4 and Glycogensynthase-1 mRNA levels were significantly higher inPLTP-KO than in WT mice (Fig. 6B and C, respectively).The glycogen content of muscle was also higher in PLTP-KOmice (Fig. 6D).
Accumulation of GLP-1 Magnified the LPS-MediatedIncrease in GSIS
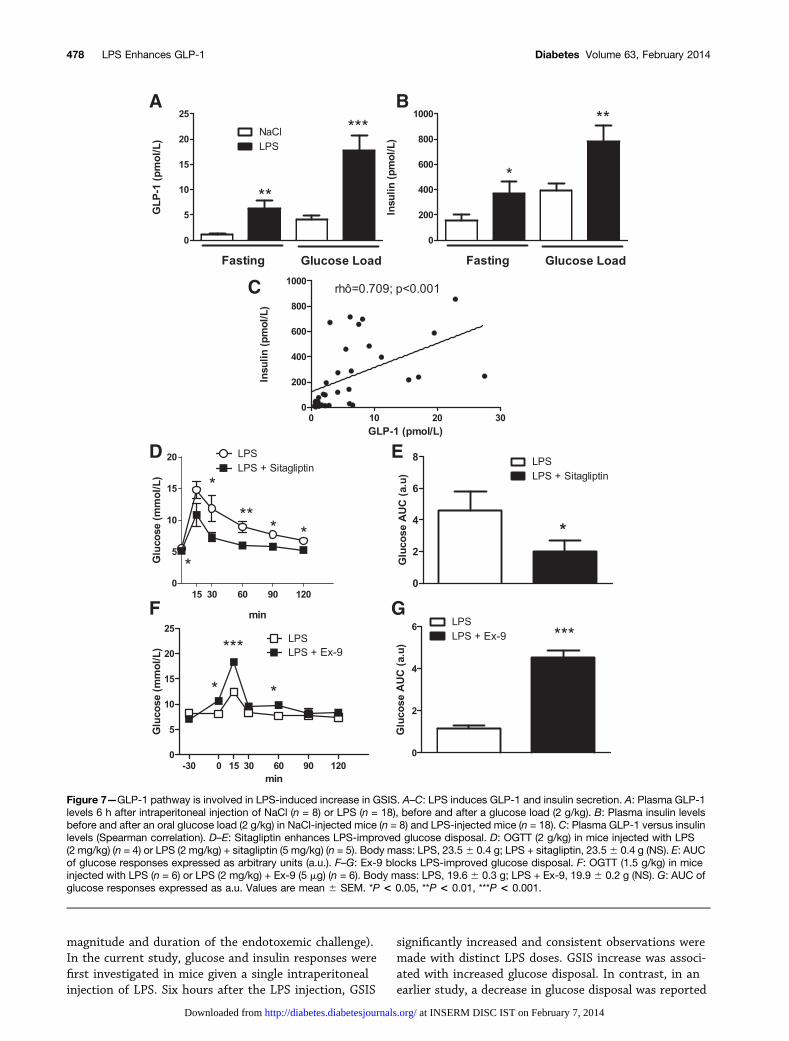
As GLP-1 was previously identified as a downstreamtarget of inflammatory cytokines that also regulates themagnitude of GSIS (16,17), we examined the GLP-1 axisduring an LPS challenge. Under fasting conditions,
intraperitoneal injection of LPS significantly increasedplasma GLP-1 levels in WT mice (Fig. 7A, left panel:6.32 6 0.65 pmol/L in LPS-treated vs. 1.16 6 0.17pmol/L in untreated WT mice; P , 0.01). Furthermore,plasma GLP-1 levels increased further after oralglucose loading in control WT mice, and the increasewas significantly greater in LPS-treated WT mice(Fig. 7A, right panel: 17.8 6 2.98 pmol/L in LPS-treatedvs. 4.07 6 0.17 pmol/L in control mice; P , 0.001).Finally, LPS-induced increases in plasma insulin levelswere observed both in fasting and after the glucoseload (Fig. 7B), and a significant, positive correlationwas found between plasma GLP-1 and insulin levels(Fig. 7C).
Next, we assessed whether the acute LPS-mediatedattenuation of glycemic excursion could be further en-hanced by increased levels of active GLP-1 achievedthrough treatment with sitagliptin, a DPP4 inhibitor(18). Glycemic excursion in response to LPS was furtherreduced by the combination of LPS and sitagliptin(Fig. 7D and E).
Figure 5—Glucose response following intraperitoneal infusion with LPS is increased to a greater degree in PLTP-KO mice. A: OGTT (2 g/kg)performed before (2LPS) and at the end (+LPS) of the intraperitoneal infusion of LPS (300 mg/kg/day) in WT mice (n = 6–11) and PLTP-KOmice (n = 7–8) B: AUC of glucose response expressed as arbitrary units (a.u.). C: Plasma insulin levels 15 min after an oral glucose load(2 g/kg) in WT mice (n = 15) and PLTP-KO mice (n = 15–16). D: IGI. E: Insulin tolerance test at the end of the intraperitoneal infusion ofLPS in WT mice (n = 14) and PLTP-KO mice (n = 14). F: AUC of glucose response expressed as a.u. Values are mean 6 SEM. *P < 0.05,**P < 0.01, ***P < 0.001, a,e,hP = NS, b,fP > 0.001 vs. WT (2LPS), cP< 0.001 vs. PLTP-KO (2LPS), dP < 0.05 vs. WT (+LPS), g,jP< 0.05vs. PLTP-KO (2LPS), iP < 0.05 vs. WT (2LPS).
476 LPS Enhances GLP-1 Diabetes Volume 63, February 2014
at INSERM DISC IST on February 7, 2014http://diabetes.diabetesjournals.org/Downloaded from
Partial Antagonism of the GLP-1R Blocks the LPSEffect on Glycemic Excursion
To assess the importance of GLP-1 as a transducer of theLPS-mediated glycemic response, we assessed whetherthe administration of the GLP-1R antagonist Ex-9 couldmodify the glucoregulatory actions of LPS. Administra-tion of Ex-9 substantially attenuated the LPS-mediatedchange in glucose disposal (Fig. 7F and G).
LPS-Mediated Changes in Insulin and GlucoseResponses Are Blunted in GLP-1R-KO Mice
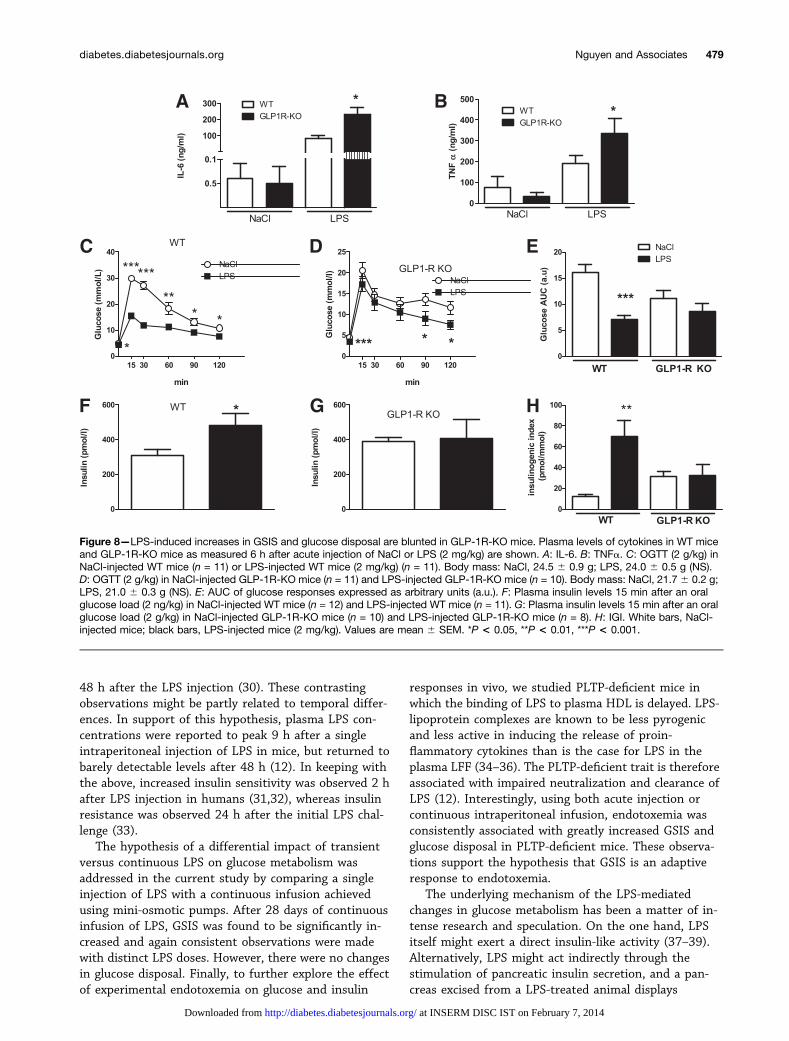
To further investigate the role of the GLP-1/GLP-1Rpathway in the LPS-mediated changes in glucose ho-meostasis, we assessed LPS action in GLP-1R-KO mice(19). As compared with NaCl-injected mice, which dis-played low levels of LPS (WT mice [n = 11], 33.6 6 3.5ng/mL; GLP-1R-KO mice [n = 11], 43.9 6 6.2 ng/mL; P =NS), plasma LPS concentrations were markedly increasedafter acute intraperitoneal injection of LPS and toa similar extent in WT and GLP-1R-KO mice (WT mice[n = 11], 362.0 6 17.5 ng/mL; GLP-1R-KO mice [n = 11],352.1 6 25.2 ng/mL; P = NS). Interestingly, whereasacute intraperitoneal injection of LPS led to the same LPSplasma level in WT and GLP-1R-KO mice, the plasmalevels of IL-6 and TNFa (i.e., two main proinflammatorycytokine targets of LPS) displayed a more pronouncedincrease in GLP-1R-KO as compared with WT mice(Fig. 8A and B). The LPS-mediated change in glucoseresponse in WT mice was completely absent in GLP-1R-KO mice (Fig. 8C–E). Furthermore, the LPS-mediated
increase in GSIS observed in WT mice was not observedin GLP-1R-KO mice (Fig. 8F and G), and enhanced b-cellfunction in response to LPS was completely lost in GLP-1R-KO mice (Fig. 8H).
DISCUSSION
In the current study, the insulin response to experi-mental hyperglycemia was studied in mice with LPS-mediated inflammation. Our data support the hypothesisthat LPS increases GSIS, resulting in increased glucoseclearance. Consistent observations were made with acuteversus continuous LPS infusion and, to a greater extent,when the PLTP-mediated detoxification pathway of LPSdid not operate. The LPS-mediated changes in glucosehomeostasis were found to require a functional GLP-1R–dependent pathway.
Sepsis is known to impair whole body glucose disposal(20), resulting in hyperglycemia, often associated withmetabolic adaptation and increased insulin secretion.However, bacterial infection or LPS administration doesnot always lead to consistent changes in glucose disposalor insulin secretion (21–28). For instance, the preventionof hyperglycemia by depleting glycogen storage did notabrogate the increase in serum insulin levels in endo-toxemic animals (29). This indicates that the relationshipbetween endotoxemia and glucose homeostasis is rathercomplex, and one hypothesis holds that the effect of LPSmight be dependent on the metabolic context and theexperimental conditions used (including in particular the
Figure 6—Muscle glucose uptake is increased in PLTP-KO mice intraperitoneally infused with LPS. A: Insulin-mediated glucose uptake inWT mice (n = 7) and in PLTP-KO mice (n = 6). B: Muscle Glut4 mRNA levels in WT mice (n = 7) and in PLTP-KO mice (n = 8). C: Muscleglycogen synthase 1 (glys-1) mRNA levels in WT (n = 7) and PLTP-KO mice (n = 8). D: Glycogen content in muscle in WT (n = 6) and PLTP-KO mice (n = 8). Values are mean 6 SEM. *P < 0.05.
diabetes.diabetesjournals.org Nguyen and Associates 477
at INSERM DISC IST on February 7, 2014http://diabetes.diabetesjournals.org/Downloaded from
magnitude and duration of the endotoxemic challenge).In the current study, glucose and insulin responses werefirst investigated in mice given a single intraperitonealinjection of LPS. Six hours after the LPS injection, GSIS
significantly increased and consistent observations weremade with distinct LPS doses. GSIS increase was associ-ated with increased glucose disposal. In contrast, in anearlier study, a decrease in glucose disposal was reported
Figure 7—GLP-1 pathway is involved in LPS-induced increase in GSIS. A–C: LPS induces GLP-1 and insulin secretion. A: Plasma GLP-1levels 6 h after intraperitoneal injection of NaCl (n = 8) or LPS (n = 18), before and after a glucose load (2 g/kg). B: Plasma insulin levelsbefore and after an oral glucose load (2 g/kg) in NaCl-injected mice (n = 8) and LPS-injected mice (n = 18). C: Plasma GLP-1 versus insulinlevels (Spearman correlation). D–E: Sitagliptin enhances LPS-improved glucose disposal. D: OGTT (2 g/kg) in mice injected with LPS(2 mg/kg) (n = 4) or LPS (2 mg/kg) + sitagliptin (5 mg/kg) (n = 5). Body mass: LPS, 23.56 0.4 g; LPS + sitagliptin, 23.56 0.4 g (NS). E: AUCof glucose responses expressed as arbitrary units (a.u.). F–G: Ex-9 blocks LPS-improved glucose disposal. F: OGTT (1.5 g/kg) in miceinjected with LPS (n = 6) or LPS (2 mg/kg) + Ex-9 (5 mg) (n = 6). Body mass: LPS, 19.6 6 0.3 g; LPS + Ex-9, 19.9 6 0.2 g (NS). G: AUC ofglucose responses expressed as a.u. Values are mean 6 SEM. *P < 0.05, **P < 0.01, ***P < 0.001.
478 LPS Enhances GLP-1 Diabetes Volume 63, February 2014
at INSERM DISC IST on February 7, 2014http://diabetes.diabetesjournals.org/Downloaded from
48 h after the LPS injection (30). These contrastingobservations might be partly related to temporal differ-ences. In support of this hypothesis, plasma LPS con-centrations were reported to peak 9 h after a singleintraperitoneal injection of LPS in mice, but returned tobarely detectable levels after 48 h (12). In keeping withthe above, increased insulin sensitivity was observed 2 hafter LPS injection in humans (31,32), whereas insulinresistance was observed 24 h after the initial LPS chal-lenge (33).
The hypothesis of a differential impact of transientversus continuous LPS on glucose metabolism wasaddressed in the current study by comparing a singleinjection of LPS with a continuous infusion achievedusing mini-osmotic pumps. After 28 days of continuousinfusion of LPS, GSIS was found to be significantly in-creased and again consistent observations were madewith distinct LPS doses. However, there were no changesin glucose disposal. Finally, to further explore the effectof experimental endotoxemia on glucose and insulin
responses in vivo, we studied PLTP-deficient mice inwhich the binding of LPS to plasma HDL is delayed. LPS-lipoprotein complexes are known to be less pyrogenicand less active in inducing the release of proin-flammatory cytokines than is the case for LPS in theplasma LFF (34–36). The PLTP-deficient trait is thereforeassociated with impaired neutralization and clearance ofLPS (12). Interestingly, using both acute injection orcontinuous intraperitoneal infusion, endotoxemia wasconsistently associated with greatly increased GSIS andglucose disposal in PLTP-deficient mice. These observa-tions support the hypothesis that GSIS is an adaptiveresponse to endotoxemia.
The underlying mechanism of the LPS-mediatedchanges in glucose metabolism has been a matter of in-tense research and speculation. On the one hand, LPSitself might exert a direct insulin-like activity (37–39).Alternatively, LPS might act indirectly through thestimulation of pancreatic insulin secretion, and a pan-creas excised from a LPS-treated animal displays
Figure 8—LPS-induced increases in GSIS and glucose disposal are blunted in GLP-1R-KO mice. Plasma levels of cytokines in WT miceand GLP-1R-KO mice as measured 6 h after acute injection of NaCl or LPS (2 mg/kg) are shown. A: IL-6. B: TNFa. C: OGTT (2 g/kg) inNaCl-injected WT mice (n = 11) or LPS-injected WT mice (2 mg/kg) (n = 11). Body mass: NaCl, 24.5 6 0.9 g; LPS, 24.0 6 0.5 g (NS).D: OGTT (2 g/kg) in NaCl-injected GLP-1R-KO mice (n = 11) and LPS-injected GLP-1R-KO mice (n = 10). Body mass: NaCl, 21.7 6 0.2 g;LPS, 21.0 6 0.3 g (NS). E: AUC of glucose responses expressed as arbitrary units (a.u.). F: Plasma insulin levels 15 min after an oralglucose load (2 ng/kg) in NaCl-injected WT mice (n = 12) and LPS-injected WT mice (n = 11). G: Plasma insulin levels 15 min after an oralglucose load (2 g/kg) in NaCl-injected GLP-1R-KO mice (n = 10) and LPS-injected GLP-1R-KO mice (n = 8). H: IGI. White bars, NaCl-injected mice; black bars, LPS-injected mice (2 mg/kg). Values are mean 6 SEM. *P < 0.05, **P < 0.01, ***P < 0.001.
diabetes.diabetesjournals.org Nguyen and Associates 479
at INSERM DISC IST on February 7, 2014http://diabetes.diabetesjournals.org/Downloaded from
increases in both basal insulin secretion (40,41) and GSIS(40–42). However, neither perfusion of excised pancreaswith LPS (41), nor LPS treatment of cultured pancreaticb-cells (expressing TLR4 [43]) were able to directly in-crease insulin secretion (44), suggesting a more complexpathway with intermediate mediators. IL-1, which hasbeen shown to increase insulin secretion in endotoxemicrats (45), and IL-6, which has been shown to promotehypoglycemia during acute LPS-induced inflammation(46) and to enhance insulin secretion by increasingGLP-1 secretion from L cells and a-cells (17), are possibleglucoregulatory targets of LPS. Although IL-6 secretion isknown to be highly inducible by LPS, a LPS challenge wasnot used in the studies cited above. This led us to in-vestigate whether increased production of GLP-1 (a po-tent inducer of insulin secretion [16]) might underlie theLPS-mediated increase in GSIS. Our data clearly showthat LPS injection increases plasma levels of GLP-1 underboth fasting and glucose-stimulated conditions. More-over, increased levels of GLP-1 correlated positively withincreased GSIS and were associated with higher glucosedisposal during a OGTT. The glucose response aftertreatment with LPS was of lower magnitude when GLP-1degradation was prevented with sitagliptin (18). Ex-9, anantagonist of the GLP-1 receptor, prevented the LPS-mediated change in glucose homeostasis. Finally, theLPS-increased GSIS and glucose disposal was totallyblunted in GLP-1R-KO mice. Collectively, these findingsargue for an important role for GLP-1 as a downstreammetabolic target of a subset of LPS actions. Indeed,GLP-1 has been shown to enhance glucose uptake and toincrease the conversion of glucose into glycogen (47) inmuscle, thus contributing to an overall increase in insulinsensitivity (48). Similar findings were observed in thecurrent study when PLTP-KO mice were continuouslyinfused with LPS. In humans, GLP-1 administration hasbeen associated with increased b-cell function as revealedby the increase in the IGI (49). In the current study, thehigher IGI after LPS administration was completely ab-rogated in GLP-1R-KO mice that, as compared with WTmice, displayed a more pronounced increase in plasmalevels of IL-6 and TNFa after acute LPS injection.
The current study adds to the recently recognizedenteroendocrine pathway through which the proin-flammatory mediator IL-6 (well known as an LPS target)can contribute to increased insulin secretion. BecauseIL-6 increases responsiveness to glucose through theincreased production of GLP-1 by intestinal L cells, IL-6results in increased insulin secretion and production bypancreatic b-cells (17). It is possible that the same mo-lecular mechanism may apply to both the IL-6–mediated(45) and the LPS-mediated effects (present study). It wassuggested that IL-6 increased GLP-1 production throughincreased proglucagon transcription and prohormoneconvertase (PC)1/3 expression (17). In keeping with thishypothesis, LPS sensitizes adenyl cyclase activity (50)and increases the production of cAMP (51), which is
known to be involved in the regulation of proglucagongene expression (52). In addition, the proglucagon pro-tein precursor is known to undergo posttranslationalprocessing through the action of two main PCs, PC1/3and PC2 (53), Given that both PC1/3 and PC2 are in-duced when immune cells are exposed to LPS (54,55),a role for enhanced PC1/3 activity cannot be excluded.Alternatively, neural pathways may also be involved, assensory nerves have been shown to be involved in theglucose metabolic response to endotoxins (56) and theexpression of the neuropeptide calcitonin gene-relatedpeptide, which is thought to play a role in the regulationof GLP-1 secretion (57), is upregulated by LPS (58).Finally, a direct effect of the LPS challenge on TLR4signaling might make a significant contribution to theLPS-induced production of GLP-1. Indeed, it has recentlybeen shown that enteroendocrine cells expressed func-tional TLR4 (59), and hypoglycemia and GSIS werereported to be blunted in TLR4-deficient mice (30).
Cumulative evidence in favor of a link betweenendotoxemia, enteroendocrine cells, and glucose metab-olism was recently brought in patients with in-flammatory bowel diseases. In Crohn disease withabnormally elevated endotoxemia (2), enteroendocrinecell activity was reported to be enhanced (60). It wasassociated with higher expression and circulating levelsof GLP-1 (60,61). In addition, DPP4 expression and ac-tivity are reduced in patients with Crohn disease, thusmaking a putative contribution to increased GLP-1 ex-pression levels and hyperinsulinemia of inflammatorybowel disease (62,63). Observations of the current studycome in direct support of sustained endotoxemia asa significant contributor to enhanced insulin secretion,which constitute one main trait of inflammatory boweldiseases, and a protective factor on relapse rate (61,64).
Acknowledgments. The authors thank Philip Bastable, of CentreHospitalier Universitaire, Dijon, France, for manuscript editing.
Funding. This work was supported by INSERM U866, the Conseil Régionalde Bourgogne, The Fonds Européen de Développement Régional, the Universitéde Bourgogne, and a French government grant managed by the French Na-tional Research Agency under the program “Investissements d’Avenir” (ANR-11-LABX-0021).
Duality of Interest. A.T.N. is supported mostly by the PopularCommittee of Dong Thap province (Vietnam) and by AgroSup Dijon (France).D.J.D. is supported by the Canada Research Chairs program and the Banting &Best Diabetes Centre-Novo Nordisk Chair in Incretin Biology. No other potentialconflicts of interest relevant to this article were reported.
Author Contributions. A.T.N. and C.D. researched data. S.M. andV.D. researched data and reviewed and edited the manuscript. P.V. andP.B. reviewed and edited the manuscript. D.J.D. contributed to discussionand reviewed and edited the manuscript. L.L. contributed to discussion andwrote, reviewed, and edited the manuscript. J.G. designed research,researched data, and wrote the manuscript. J.G. is the guarantor of this workand, as such, had full access to all the data in the study and takesresponsibility for the integrity of the data and the accuracy of the dataanalysis.
480 LPS Enhances GLP-1 Diabetes Volume 63, February 2014
at INSERM DISC IST on February 7, 2014http://diabetes.diabetesjournals.org/Downloaded from
References1. Medzhitov R, Janeway CA Jr. Decoding the patterns of self and nonself by
the innate immune system. Science 2002;296:298–300
2. Caradonna L, Amati L, Magrone T, Pellegrino NM, Jirillo E, Caccavo D.Enteric bacteria, lipopolysaccharides and related cytokines in inflammatorybowel disease: biological and clinical significance. J Endotoxin Res 2000;6:205–214
3. Cani PD, Amar J, Iglesias MA, et al. Metabolic endotoxemia initiatesobesity and insulin resistance. Diabetes 2007;56:1761–1772
4. Hasday JD, Bascom R, Costa JJ, Fitzgerald T, Dubin W. Bacterial endotoxinis an active component of cigarette smoke. Chest 1999;115:829–835
5. Lang CH, Bagby GJ, Nowotny A, Spitzer JJ. Effects of toxic and nontoxicendotoxin derivatives on glucose kinetics. Circ Shock 1985;17:301–311
6. McCowen KC, Malhotra A, Bistrian BR. Stress-induced hyperglycemia. CritCare Clin 2001;17:107–124
7. Taylor JH, Beilman GJ. Hyperglycemia in the intensive care unit: no longerjust a marker of illness severity. Surg Infect (Larchmt) 2005;6:233–245
8. Hirasawa H, Oda S, Nakamura M. Blood glucose control in patients withsevere sepsis and septic shock. World J Gastroenterol 2009;15:4132–4136
9. Finfer S, Liu B, Chittock DR, et al.; NICE-SUGAR Study Investigators.Hypoglycemia and risk of death in critically ill patients. N Engl J Med 2012;367:1108–1118
10. De La Rosa G, Vasquez EM, Quintero AM, et al.; Grupo de Investigacion enCuidado Intensivo GICI-HPTU. The potential impact of admission insulinlevels on patient outcome in the intensive care unit. J Trauma Acute CareSurg 2013;74:270–275
11. Kidd LB, Schabbauer GA, Luyendyk JP, et al. Insulin activation of thephosphatidylinositol 3-kinase/protein kinase B (Akt) pathway reduceslipopolysaccharide-induced inflammation in mice. J Pharmacol Exp Ther2008;326:348–353
12. Gautier T, Klein A, Deckert V, et al. Effect of plasma phospholipid transferprotein deficiency on lethal endotoxemia in mice. J Biol Chem 2008;283:18702–18710
13. Scrocchi LA, Brown TJ, MaClusky N, et al. Glucose intolerance but normalsatiety in mice with a null mutation in the glucagon-like peptide 1 receptorgene. Nat Med 1996;2:1254–1258
14. Jiang XC, Qin S, Qiao C, et al. Apolipoprotein B secretion and athero-sclerosis are decreased in mice with phospholipid-transfer protein defi-ciency. Nat Med 2001;7:847–852
15. Attané C, Daviaud D, Dray C, et al. Apelin stimulates glucose uptake butnot lipolysis in human adipose tissue ex vivo. J Mol Endocrinol 2011;46:21–28
16. Kreymann B, Williams G, Ghatei MA, Bloom SR. Glucagon-like peptide-17-36: a physiological incretin in man. Lancet 1987;2:1300–1304
17. Ellingsgaard H, Hauselmann I, Schuler B, et al. Interleukin-6 enhancesinsulin secretion by increasing glucagon-like peptide-1 secretion fromL cells and alpha cells. Nat Med 2011;17:1481–1489
18. Subbarayan S, Kipnes M. Sitagliptin: a review. Expert Opin Pharmacother2011;12:1613–1622
19. During MJ, Cao L, Zuzga DS, et al. Glucagon-like peptide-1 receptor isinvolved in learning and neuroprotection. Nat Med 2003;9:1173–1179
20. Lang CH, Dobrescu C, Mészáros K. Insulin-mediated glucose uptake byindividual tissues during sepsis. Metabolism 1990;39:1096–1107
21. Blackard WG, Anderson JH Jr, Spitzer JJ. Hyperinsulinism in endotoxinshock dogs. Metabolism 1976;25:675–684
22. Lang CH, Dobrescu C, Bagby GJ, Spitzer JJ. Altered glucose kinetics indiabetic rats during gram-negative infection. Am J Physiol 1987;253:E123–E129
23. Kelleher DL, Fong BC, Bagby GJ, Spitzer JJ. Metabolic and hormonalchanges following endotoxin administration to diabetic rats. Am J Physiol1982;243:R77–R81
24. Manny J, Rabinovici N, Schiller M. Insulin response to continuous glucoseload in endotoxin shock in the dog. Surg Gynecol Obstet 1977;145:198–202
25. Romanosky AJ, Bagby GJ, Bockman EL, Spitzer JJ. Increased muscleglucose uptake and lactate release after endotoxin administration. AmJ Physiol 1980;239:E311–E316
26. Rayfield EJ, Curnow RT, Reinhard D, Kochicheril NM. Effects of acuteendotoxemia on glucoregulation in normal and diabetic subjects. J ClinEndocrinol Metab 1977;45:513–521
27. Adeleye GA, Al-Jibouri LM, Furman BL, Parratt JR. Exdotoxin-inducedmetabolic changes in the conscious, unrestrained rat: hypoglycemia andelevated blood lactate concentrations without hyperinsulinemia. Circ Shock1981;8:543–550
28. Lang CH, Spolarics Z, Ottlakan A, Spitzer JJ. Effect of high-dose endotoxinon glucose production and utilization. Metabolism 1993;42:1351–1358
29. Hand MS, Fettman MJ, Chandrasena LG, Cleek JL, Mason RA, Phillips RW.Increased glucose uptake precedes hyperinsulinemia in awake endotoxe-mic minipigs. Circ Shock 1983;11:287–295
30. Raetzsch CF, Brooks NL, Alderman JM, et al. Lipopolysaccharide inhibitionof glucose production through the Toll-like receptor-4, myeloid differenti-ation factor 88, and nuclear factor kappa b pathway. Hepatology 2009;50:592–600
31. Agwunobi AO, Reid C, Maycock P, Little RA, Carlson GL. Insulin resistanceand substrate utilization in human endotoxemia. J Clin Endocrinol Metab2000;85:3770–3778
32. van der Crabben SN, Blümer RM, Stegenga ME, et al. Early endotoxemiaincreases peripheral and hepatic insulin sensitivity in healthy humans.J Clin Endocrinol Metab 2009;94:463–468
33. Mehta NN, McGillicuddy FC, Anderson PD, et al. Experimental endotoxemiainduces adipose inflammation and insulin resistance in humans. Diabetes2010;59:172–181
34. Cavaillon JM, Fitting C, Haeffner-Cavaillon N, Kirsch SJ, Warren HS. Cy-tokine response by monocytes and macrophages to free and lipoprotein-bound lipopolysaccharide. Infect Immun 1990;58:2375–2382
35. Flegel WA, Wölpl A, Männel DN, Northoff H. Inhibition of endotoxin-inducedactivation of human monocytes by human lipoproteins. Infect Immun 1989;57:2237–2245
36. Harris HW, Grunfeld C, Feingold KR, et al. Chylomicrons alter the fate ofendotoxin, decreasing tumor necrosis factor release and preventing death.J Clin Invest 1993;91:1028–1034
37. Witek-Janusek L, Filkins JP. Insulin-like action of endotoxin: antagonismby steroidal and nonsteroidal anti-inflammatory agents. Circ Shock 1981;8:573–583
38. Witek-Janusek L, Filkins JP. Relation of endotoxin structure to hypogly-cemic and insulinlike actions. Circ Shock 1983;11:23–34
39. Filkins JP. Endotoxin-enhanced secretion of macrophage insulin-like ac-tivity. J Reticuloendothel Soc 1980;27:507–511
40. Yelich MR, Filkins JP. Insulin hypersecretion and potentiation of endotoxinshock in the rat. Circ Shock 1982;9:589–603
41. Yelich MR, Filkins JP. Role for calcium in the insulin hypersecretory state ofthe endotoxic rat pancreas. Circ Shock 1984;14:49–62
diabetes.diabetesjournals.org Nguyen and Associates 481
at INSERM DISC IST on February 7, 2014http://diabetes.diabetesjournals.org/Downloaded from
42. Yelich MR, Filkins JP. Mechanism of hyperinsulinemia in endotoxicosis. Am
J Physiol 1980;239:E156–E161
43. Vives-Pi M, Somoza N, Fernández-Alvarez J, et al. Evidence of expression
of endotoxin receptors CD14, toll-like receptors TLR4 and TLR2 and as-
sociated molecule MD-2 and of sensitivity to endotoxin (LPS) in islet beta
cells. Clin Exp Immunol 2003;133:208–218
44. Garay-Malpartida HM, Mourão RF, Mantovani M, Santos IA, Sogayar MC,
Goldberg AC. Toll-like receptor 4 (TLR4) expression in human and murine
pancreatic beta-cells affects cell viability and insulin homeostasis. BMC
Immunol 2011;12:18
45. Cornell RP. Hyperinsulinemia elicited by interleukin-1 and nonlethal en-
dotoxemia in rats. Circ Shock 1989;28:121–130
46. Tweedell A, Mulligan KX, Martel JE, Chueh FY, Santomango T, McGuinness
OP. Metabolic response to endotoxin in vivo in the conscious mouse: role
of interleukin-6. Metabolism 2011;60:92–98
47. Valverde I, Morales M, Clemente F, et al. Glucagon-like peptide 1: a potent
glycogenic hormone. FEBS Lett 1994;349:313–316
48. Idris I, Patiag D, Gray S, Donnelly R. Exendin-4 increases insulin sensitivity
via a PI-3-kinase-dependent mechanism: contrasting effects of GLP-1.
Biochem Pharmacol 2002;63:993–996
49. Zander M, Madsbad S, Madsen JL, Holst JJ. Effect of 6-week course of
glucagon-like peptide 1 on glycaemic control, insulin sensitivity, and beta-
cell function in type 2 diabetes: a parallel-group study. Lancet 2002;359:
824–830
50. Osawa Y, Lee HT, Hirshman CA, Xu D, Emala CW. Lipopolysaccharide-
induced sensitization of adenylyl cyclase activity in murine macrophages.
Am J Physiol Cell Physiol 2006;290:C143–C151
51. Moon EY, Lee YS, Choi WS, Lee MH. Toll-like receptor 4-mediated cAMP
production up-regulates B-cell activating factor expression in Raw264.7
macrophages. Exp Cell Res 2011;317:2447–2455
52. Drucker DJ, Brubaker PL. Proglucagon gene expression is regulated by
a cyclic AMP-dependent pathway in rat intestine. Proc Natl Acad Sci USA
1989;86:3953–3957
53. Rouillé Y, Martin S, Steiner DF. Differential processing of proglucagon by
the subtilisin-like prohormone convertases PC2 and PC3 to generate
either glucagon or glucagon-like peptide. J Biol Chem 1995;270:26488–26496
54. Vindrola O, Mayer AM, Citera G, Spitzer JA, Espinoza LR. Prohormoneconvertases PC2 and PC3 in rat neutrophils and macrophages. Parallelchanges with proenkephalin-derived peptides induced by LPS in vivo.Neuropeptides 1994;27:235–244
55. Lansac G, Dong W, Dubois CM, et al. Lipopolysaccharide mediated reg-ulation of neuroendocrine associated proprotein convertases and neuro-peptide precursor processing in the rat spleen. J Neuroimmunol 2006;171:57–71
56. Morgan AE, Lang CH. Involvement of capsaicin-sensitive nerves inregulating the hormone and glucose metabolic response to endotoxin.Am J Physiol 1997;273:E328–E335
57. Herrmann-Rinke C, McGregor GP, Göke B. Calcitonin gene-related peptidepotently stimulates glucagon-like peptide-1 release in the isolated per-fused rat ileum. Peptides 2000;21:431–437
58. Ma W, Dumont Y, Vercauteren F, Quirion R. Lipopolysaccharide inducescalcitonin gene-related peptide in the RAW264.7 macrophage cell line.Immunology 2010;130:399–409
59. Bogunovic M, Davé SH, Tilstra JS, et al. Enteroendocrine cells expressfunctional Toll-like receptors. Am J Physiol Gastrointest Liver Physiol 2007;292:G1770–G1783
60. Moran GW, Pennock J, McLaughlin JT. Enteroendocrine cells in terminalileal Crohn’s disease. J Crohn’s Colitis 2012;6:871–880
61. Bendet N, Scapa E, Cohen O, et al. Enhanced glucose-dependentglucagon-like peptide-1 and insulin secretion in Crohn patients withterminal ileum disease is unrelated to disease activity or ileal resection.Scand J Gastroenterol 2004;39:650–656
62. Moran GW, O’Neill C, Padfield P, McLaughlin JT. Dipeptidyl peptidase-4expression is reduced in Crohn’s disease. Regul Pept 2012;177:40–45
63. Xiao Q, Boushey RP, Cino M, Drucker DJ, Brubaker PL. Circulating levels ofglucagon-like peptide-2 in human subjects with inflammatory bowel dis-ease. Am J Physiol Regul Integr Comp Physiol 2000;278:R1057–R1063
64. Bregenzer N, Hartmann A, Strauch U, Schölmerich J, Andus T, BollheimerLC. Increased insulin resistance and beta cell activity in patients withCrohn’s disease. Inflamm Bowel Dis 2006;12:53–56
482 LPS Enhances GLP-1 Diabetes Volume 63, February 2014
at INSERM DISC IST on February 7, 2014http://diabetes.diabetesjournals.org/Downloaded from