lineage divergence detected in the malaria vector anopheles marajoara (diptera: culicidae) in...
TRANSCRIPT
RESEARCH Open Access
Lineage divergence detected in the malariavector Anopheles marajoara (Diptera: Culicidae) inAmazonian BrazilSascha N McKeon1, Margaret A Lehr2, Richard C Wilkerson3, John F Ruiz3, Maria A Sallum4, Jose BP Lima5,Marinete M Povoa6, Jan E Conn1,7*
Abstract
Background: Cryptic species complexes are common among anophelines. Previous phylogenetic analysis basedon the complete mtDNA COI gene sequences detected paraphyly in the Neotropical malaria vector Anophelesmarajoara. The “Folmer region” detects a single taxon using a 3% divergence threshold.
Methods: To test the paraphyletic hypothesis and examine the utility of the Folmer region, genealogical treesbased on a concatenated (white + 3’ COI sequences) dataset and pairwise differentiation of COI fragments wereexamined. The population structure and demographic history were based on partial COI sequences for 294individuals from 14 localities in Amazonian Brazil. 109 individuals from 12 localities were sequenced for the nDNAwhite gene, and 57 individuals from 11 localities were sequenced for the ribosomal DNA (rDNA) internaltranscribed spacer 2 (ITS2).
Results: Distinct A. marajoara lineages were detected by combined genealogical analysis and were also supportedamong COI haplotypes using a median joining network and AMOVA, with time since divergence during thePleistocene (<100,000 ya). COI sequences at the 3’ end were more variable, demonstrating significant pairwisedifferentiation (3.82%) compared to the more moderate 2.92% detected by the Folmer region. Lineage 1 waspresent in all localities, whereas lineage 2 was restricted mainly to the west. Mismatch distributions for bothlineages were bimodal, likely due to multiple colonization events and spatial expansion (~798 - 81,045 ya). Thereappears to be gene flow within, not between lineages, and a partial barrier was detected near Rio Jari in Amapástate, separating western and eastern populations. In contrast, both nDNA data sets (white gene sequences with orwithout the retention of the 4th intron, and ITS2 sequences and length) detected a single A. marajoara lineage.
Conclusions: Strong support for combined data with significant differentiation detected in the COI and absent inthe nDNA suggest that the divergence is recent, and detectable only by the faster evolving mtDNA. A withinsubgenus threshold of >2% may be more appropriate among sister taxa in cryptic anopheline complexes than thestandard 3%. Differences in demographic history and climatic changes may have contributed to mtDNA lineagedivergence in A. marajoara.
BackgroundAbout 1.8 million species are known on Earth, includ-ing more than 1 million insects, 250,000 higher plantsand 69,000 fungi [1]. The Amazon comprises much ofthis biodiversity and is considered the largest gene
reserve in the world, with an estimated 14% of allplant and animal species within its boundaries [2].Because speciation is not always accompanied by mor-phological change [3], the true number of biologicalspecies is likely to be greater than current estimates[4]. Genetic analysis plays an increasingly importantrole in identifying changes in population structureand elucidating taxonomic status and phylogeneticrelationships.
* Correspondence: [email protected] of Biomedical Sciences, School of Public Health, StateUniversity of New York-Albany, Empire State Plaza, Albany, NY 12201 USAFull list of author information is available at the end of the article
McKeon et al. Malaria Journal 2010, 9:271http://www.malariajournal.com/content/9/1/271
© 2010 McKeon et al; licensee BioMed Central Ltd. This is an Open Access article distributed under the terms of the Creative CommonsAttribution License (http://creativecommons.org/licenses/by/2.0), which permits unrestricted use, distribution, and reproduction inany medium, provided the original work is properly cited.
Genetically divergent but morphologically cryptic spe-cies have been described in many aquatic organisms [5],birds [6,7] and insects [8,9], particularly among mosqui-toes in the Dipteran genus Anopheles [10-12]. The Neo-tropical Albitarsis Complex contains at least six species,only some of which are documented malaria vectors:Anopheles marajoara, a local and regionally importantvector in lowland rainforest [13-15], Anopheles jancon-nae (previously Anopheles albitarsis E) implicated inlocal transmission in Amazonian savannah [16]; andAnopheles deaneorum, which appears to consist of mul-tiple species [17], and is a potential vector, as demon-strated by comparative susceptibility laboratory studies[18,19].Various methods have been used to investigate species
delimitation and identifications in the Albitarsis Com-plex [11,20,21], culminating, most recently, in the recog-nition of six species [22], but see Bourke et al [17].Genealogical analyses of complete mtDNA COI (Cyto-chrome oxidase I) sequences found that A. marajoara isparaphyletic, and may consist of at least two phyloge-netic species [10] or lineages [3,23], one of which maybe A. janconnae.The mitochondrial genome has been used extensively
in studies of molecular evolution [24] and the COI genehas resolved evolutionary relationships among closelyrelated species for a wide range of taxa [25,26], includinginsects [27,28] and cryptic species complexes [29,30]. TheFolmer region, 648-bp at the 5’ end of the COI mito-chondrial gene, has emerged as the standard barcoderegion [31,32]. Interspecific divergence within insectsalmost always exceeds 3% and this value has been usedas a speciation threshold [33]. The true test of DNA bar-code precision would include comparisons with sisterspecies [34]. The utility of DNA barcoding among insectsis still being debated, because of success in revealingcryptic species [31,35,36] on one hand, and the inabilityto reliably detect species boundaries on the other [36-38].An estimated 20% failure rate has been noted at the spe-cies level due to non-monophyly [39], which increasesamong insects due to overlapping ranges of intra- andinterspecific sequence divergences [40]. Together thesefindings suggest that the threshold level could be setlower than 3% to minimize false negatives [36].Accurate morphological identification of the adult
females of species within the Albitarsis Complex is vir-tually impossible, and the ITS2 has become a recognizedmolecular tool for identification [21,41,42]. ITS2 varia-tion is low within a species due to homogenization andfixation while the overall fragment length is generallyvariable between species [20,43-45]. As such it canusually resolve phylogenetic relationships at differenttaxonomic levels, and detect recently diverged taxa suchas sibling species of mosquitoes [46].
Members of a species are rarely distributed homoge-neously in space, and population subdivision can occurin response to geographical boundaries, social behaviourand genetic variation [47]. Patterns in biologicalsequence data that arise from ancestry can be useful indetermining the structure and boundaries of a givenspecies [48]. The objective of this study was to test thehypothesis of paraphyly [10] using a combined data set(white gene + COI) and to evaluate the populationstructure of A. marajoara to address the following ques-tions: 1) is the proposed paraphyletic status supported;2) what is the level of genetic differentiation betweenpopulations; 3) can lineages of A. marajoara be distin-guished by the Barcode of Life (BOLD) 3% speciesthreshold; and 4) can genetic differentiation beexplained by demographic phenomena, geographicboundaries and (or) natural selection.
MethodsMosquito collectionAdult female mosquitoes from seven localities spanningroughly 890 kilometers of a transect along the AmazonRiver were collected using Shannon traps adjacent tobreeding habitats between Amazonas state near Urucaraalong the Amazon river and the tributary of Rio Paruentering the Amazon river. They were also collectedfrom Itaituba, south of the Amazon River, Pará State, in2005 (collection protocol approved by the New YorkState Department of Health IRB and Brazilian InstitutoEvandro Chagas, Belém, Pará state Ethical Committee).Mosquitoes were identified morphologically using thekey of Deane et al. [49] as A. albitarsis s.l. Previouslyextracted specimens collected between 1995 and 2001,using a human landing catch protocol approved by theUniversity of Vermont and the Brazilian Instituto Evan-dro Chagas, Belém, Pará state Ethical Committee, fromseven localities in northeastern Pará and Amapá statesof Brazil and from Itaituba, south of the Amazon Riverin Pará State, were also included [50]. Genomic DNAwas extracted using the Puregene DNA isolation kit(Gentra Systems) and maintained at Griffin Laboratoryat -80°C. Ten to 27 mosquitoes per site were selectedfor DNA amplification and sequencing of the COI(Table 1). A subset of four to 15 samples for the whitegene and four to seven samples for ITS2 were amplifiedand sequenced (Table 1).
Amplification and sequencingA 1200-bp fragment of the COI gene was amplified usingthe forward primer UEA3 and the reverse primer UEA10[28]. An 822-bp fragment from the 3’ end using PCR pri-mers: 2195D (5’-TGATTYTTTGGTCATCCNGAAGT-3’;a modification of C1-J-2195 for amplification in Collem-bola [51]) and FLY10A (5’-AATGCACTAATCTGCCA
McKeon et al. Malaria Journal 2010, 9:271http://www.malariajournal.com/content/9/1/271
Page 2 of 13

TATTAG-3’; a modification of TL2-N-3014 for amplifica-tion in Simuliid flies [52]) was previously amplified for thenortheastern collection samples [50]. Individual PCR reac-tions were preformed using Ready-To-Go-PCR bead(Amersham Pharmacia/Biotech, NJ, USA) and run on aPTC 100 or 200 series thermal cycler (Biorad, Inc.), or aPTC-100 (MJ Research, Inc.), using the conditions stipu-lated in Mirabello and Conn [53]. The Applied GenomicsTechnology Core (Wadsworth Center) carried out thesequencing. The forward and reverse COI sequences werealigned using Sequencher 3.0 (Gene Codes Corps, MI,USA), grouped together by sight and trimmed in PAUP*,version 4.0 [54]. The complete overlap of both COI primersets created a 488-bp fragment (Additional file 1).An 800-bp fragment of the white gene was amplified
using the W2R and WF primers, with the PCR condi-tions as reported in Mirabello and Conn [55]. A 500-bpfragment of the ribosomal ITS2 was amplified using theprimers 18S and 28S with the parameters in Li andWilkerson [20]. The PCR products were cleaned,sequenced and aligned creating a 496-bp fragment ofthe white gene and 361-bp of the ITS2 with completeforward and reverse overlap for each marker. Uniquesequences for all markers are available in GenBank[GenBank: HQ026025-HQ026113].
Phylogenetic relationshipAll A. albitarsis s.l. sequences were identified to speciesby multiple gene (COI, white, ITS2) comparisons tothose deposited in GenBank: A. albitarsis [DQ076207/DQ076208; AY956299/AY956300; AF462386/AF462387], A. oryzalimnetes, formerly A. albitarsis B
[DQ076210-DQ076215; AY956297/AY956298; U92333],A. marajoara [DQ076216/DQ076217-DQ076221/DQ076225; AY956295/AY956296; U92334], A. dea-neorum [DQ076226/DQ076229; AY956301/AY956302;AF461751/AF461752], A. janconnae, [DQ076231/DQ076232] and A. albitarsis F [DQ228314/DQ228315].Genealogical trees were estimated using the concate-
nated (white + COI) data set. ITS2 sequences wereexcluded from these analyses because of relatively lim-ited sample size. Maximum Parsimony trees were gener-ated in PAUP*, with one hundred replicates of aheuristic search performed with an initial random step-wise addition of sequences and TBR branch swapping.Branch support was estimated from 1,000 replicates of abootstrap search. Bayesian inference (BI) analysis wasperformed with Mr. Bayes version 3.1 [56,57], parti-tioned by gene, using the model of nucleotide substitu-tion (TPM3uf+G and TIM1+I) that best fit the whitegene and COI respectively, determined with jModelTest[58,59]. The settings were two simultaneous, indepen-dent runs of the Markov Chain Monte Carlo (MCMC)for 4 million generations, sampling every 1,000 genera-tions with a ‘burnin’ of 25%. The outgroup A. albimanusin the Albimanus Section of Nyssorhynchus (unpub-lished sequence) was chosen based upon its phylogeneticposition in Sallum et al [60]. Estimates of time to coa-lescence were calculated for the COI fragment only andcompared using θS values [61] and BEAST [62].
Genetic variationGenetic structure of two lineages was examined by analy-sis of molecular variance (AMOVA), a method of esti-mating population variance directly from molecular data,using Arlequin version 3.1.1 [63]. In addition, spatial ana-lysis of molecular variance (SAMOVA), version 1.0 [64]was used to cluster the 488-bp COI sequence data intogenetically and geographically homogeneous populations.SAMOVA generates F statistics (FSC, FST, FCT) using theAMOVA approach, into K groups to maximize thebetween group variation. SAMOVA estimates were com-puted for K = 2-13 with 1,000 simulated annealing stepsfrom each of 100 sets of initial starting conditions.A comparison of the pairwise divergences calculated
by DnaSP between COI lineages using the 648-bp 5’ endand the 488-bp 3’ end tested the utility of the Folmerregion and the 3% species threshold using 10 to 13 indi-viduals from each lineage, three closely related taxa andan outgroup (Anopheles darlingi). Anopheles darlingi ismore appropriate than A. albimanus for sister taxa com-parisons as both it, and A. marajoara, are in the Argyri-tarsis Section [65]. A species screening threshold (SST)[66] may be more appropriate and can be calculated as10× the mean intraspecific variation for a group [67].The standard sequence threshold was calculated and
Table 1 Anopheles albitarsis s.l. collection information
Sample Size
Site Locality State Coordinates COI white ITS2
1 Urucara Amazonas S2.32 W57.46 25 15 7
2 Paratins Amazonas S2.37 W56.39 25 7 6
3 Campina Pará S2.52 W55.28 25 12 5
4 Itaituba Pará S4.10 W55.50 27 12 4
5 Santarém Pará S2.26 W54.45 25 10 6
6 Monte Alegre Pará S2.01 W54.05 25 9 6
7 Uruará Pará S2.08 W53.38 25 9 6
8 Rio Paru Pará S1.28 W52.44 25 13 7
9 Serra do Navio Amapá N0.53 W52.00 14 0 0
10 Santana Amapá S0.20 W51.11 18 9 2
11 Macapá Amapá N0.20 W51.30 21 4 2
12 Tartarugalzinho Amapá N1.19 W50.57 15 4 0
13 Amapá Amapá N2.10 W50.54 10 0 0
14 Salvaterra Pará S0.46 W48.31 14 5 2
Total 294 107 53
McKeon et al. Malaria Journal 2010, 9:271http://www.malariajournal.com/content/9/1/271
Page 3 of 13
examined for Nyssorhynchus using 4-58 archived Gen-Bank sequences for known species.
Population structure and demographic historyA statistical parsimony network estimated genealogicalrelationships among COI haplotypes with a 93% sequenceidentity and 95% identity for each of the nuclear markersusing TCS 1.13 [68]. Homoplasy in all networks wasresolved using the algorithm estimation rules in Crandalland Templeton [69].The differentiation and polymorphism statistics for
COI sequences by species or lineage and locality werecomputed in DnaSP, Version 4.0 [70], and the hypoth-esis of strict neutrality was examined using the statisticsDT [71], D and F [72], and R2 [73] which are based onthe frequencies of segregating sites, and Fu’s FS [74],based on the haplotype distribution. Tajima’s D andboth Fu and Li’s D* and F* are the most effective teststo detect background selection, whereas Fu’s FS and R2
are among the most powerful tests to detect populationexpansion [73]. All neutrality tests were calculated usingDnaSP, Version 4.0 or MEGA version 3.1 [75].The mismatch distribution (simulated in Arlequin) is a
frequency distribution of the observed number of
pairwise nucleotide differences. The shape of the distri-bution is highly informative and able to differentiatebetween a population expansion and equilibrium [76],whereas the smoothness (raggedness statistic) distin-guishes the fit of the empirical data to the model [77].Statistically significant differences between observed andsimulated distributions were evaluated with the sum ofsquare deviations (SSD) to reject the hypothesis ofdemographic expansion [78].
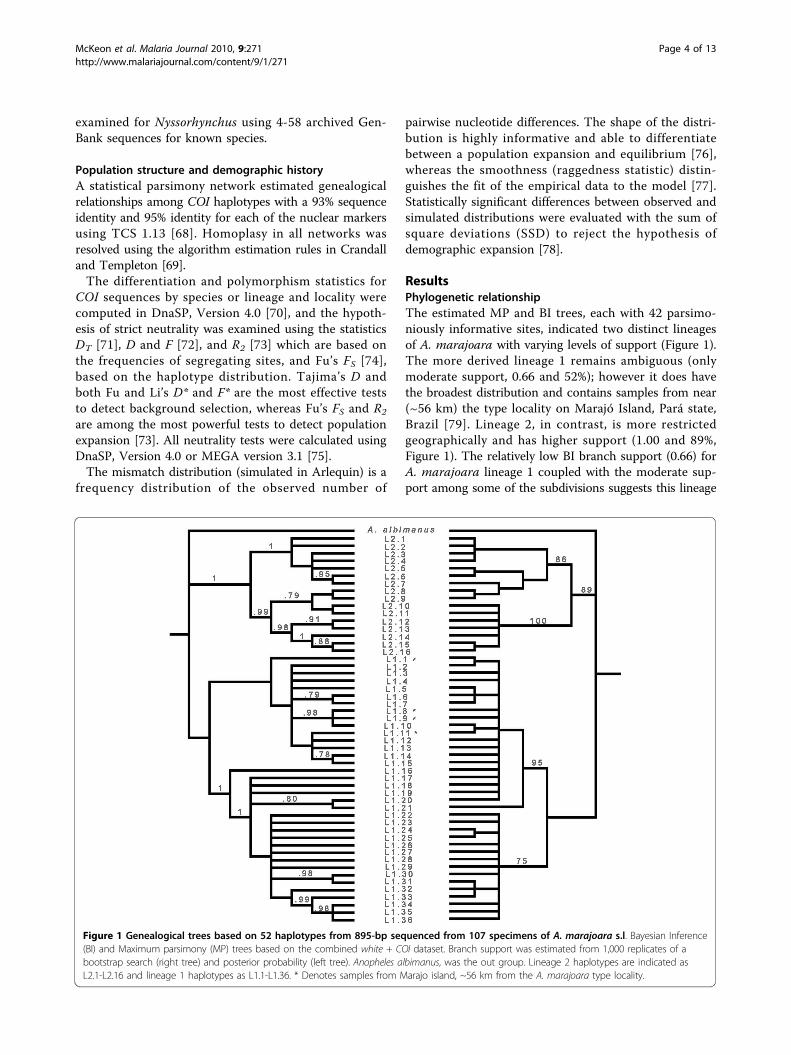
ResultsPhylogenetic relationshipThe estimated MP and BI trees, each with 42 parsimo-niously informative sites, indicated two distinct lineagesof A. marajoara with varying levels of support (Figure 1).The more derived lineage 1 remains ambiguous (onlymoderate support, 0.66 and 52%); however it does havethe broadest distribution and contains samples from near(~56 km) the type locality on Marajó Island, Pará state,Brazil [79]. Lineage 2, in contrast, is more restrictedgeographically and has higher support (1.00 and 89%,Figure 1). The relatively low BI branch support (0.66) forA. marajoara lineage 1 coupled with the moderate sup-port among some of the subdivisions suggests this lineage
Figure 1 Genealogical trees based on 52 haplotypes from 895-bp sequenced from 107 specimens of A. marajoara s.l. Bayesian Inference(BI) and Maximum parsimony (MP) trees based on the combined white + COI dataset. Branch support was estimated from 1,000 replicates of abootstrap search (right tree) and posterior probability (left tree). Anopheles albimanus, was the out group. Lineage 2 haplotypes are indicated asL2.1-L2.16 and lineage 1 haplotypes as L1.1-L1.36. * Denotes samples from Marajo island, ~56 km from the A. marajoara type locality.
McKeon et al. Malaria Journal 2010, 9:271http://www.malariajournal.com/content/9/1/271
Page 4 of 13
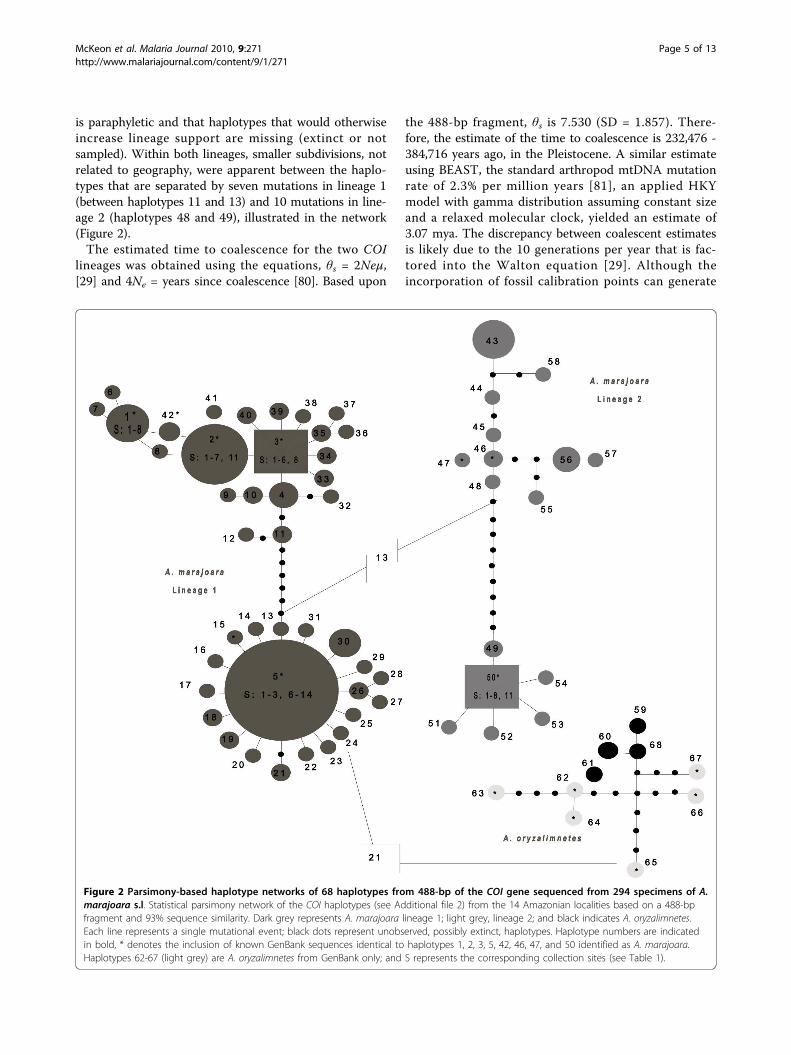
is paraphyletic and that haplotypes that would otherwiseincrease lineage support are missing (extinct or notsampled). Within both lineages, smaller subdivisions, notrelated to geography, were apparent between the haplo-types that are separated by seven mutations in lineage 1(between haplotypes 11 and 13) and 10 mutations in line-age 2 (haplotypes 48 and 49), illustrated in the network(Figure 2).The estimated time to coalescence for the two COI
lineages was obtained using the equations, θs = 2Neμ,[29] and 4Ne = years since coalescence [80]. Based upon
the 488-bp fragment, θs is 7.530 (SD = 1.857). There-fore, the estimate of the time to coalescence is 232,476 -384,716 years ago, in the Pleistocene. A similar estimateusing BEAST, the standard arthropod mtDNA mutationrate of 2.3% per million years [81], an applied HKYmodel with gamma distribution assuming constant sizeand a relaxed molecular clock, yielded an estimate of3.07 mya. The discrepancy between coalescent estimatesis likely due to the 10 generations per year that is fac-tored into the Walton equation [29]. Although theincorporation of fossil calibration points can generate
Figure 2 Parsimony-based haplotype networks of 68 haplotypes from 488-bp of the COI gene sequenced from 294 specimens of A.marajoara s.l. Statistical parsimony network of the COI haplotypes (see Additional file 2) from the 14 Amazonian localities based on a 488-bpfragment and 93% sequence similarity. Dark grey represents A. marajoara lineage 1; light grey, lineage 2; and black indicates A. oryzalimnetes.Each line represents a single mutational event; black dots represent unobserved, possibly extinct, haplotypes. Haplotype numbers are indicatedin bold, * denotes the inclusion of known GenBank sequences identical to haplotypes 1, 2, 3, 5, 42, 46, 47, and 50 identified as A. marajoara.Haplotypes 62-67 (light grey) are A. oryzalimnetes from GenBank only; and S represents the corresponding collection sites (see Table 1).
McKeon et al. Malaria Journal 2010, 9:271http://www.malariajournal.com/content/9/1/271
Page 5 of 13

more reliable divergence estimates [82], no data wereavailable because the mosquito fossil record is toorecent and rare [83].
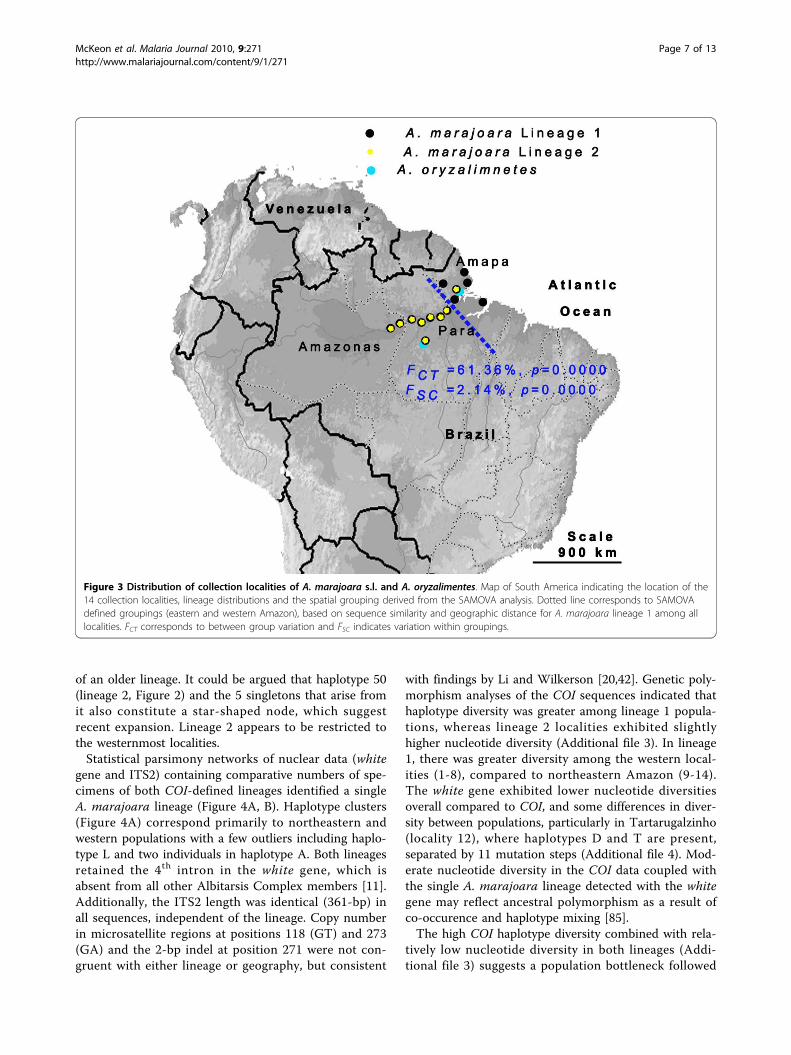
Genetic variationThe between lineage variance for the Folmer region ofthe two lineages of A. marajoara (2.94%) is marginallybelow the 3% BOLD threshold. However, it is compar-able to among species comparisons within the AlbitarsisComplex (e.g., A. albitarsis s.s. vs. A. oryzalimnetes,2.64%; Additional file 2). The 3’ end of the COI (abovediagonal, Additional file 2) is less conserved, resulting inhigher estimates of divergence. Among closely relatedNyssorhynchus spp. (Table 2), the average intraspecificvariation is 0.0116, and suggests that a SST of 11.6%might suffice within this subgenus. However, this esti-mate is limited as only 7 out of 32 currently recognizedspecies [65] were available. Intraspecific nucleotide dif-ferences among Nyssorhynchus species were consistentlyless than 2%, indicating that the higher estimate (0.021)of combined A. marajoara lineages likely represents anoverlooked species complex.AMOVA indicated that 61.94% (p = 0.0000) of the var-iance was explained by between-group variation of A.marajoara lineages 1 and 2. SAMOVA analysis, provid-ing resolution for lineage 1 only, defined two groupsthat correspond to northeastern and western Amazonia,with 61.36% regional variation (Figure 3). Several COIhaplotypes were found in both the northeastern andwestern populations of lineage 1 indicating at least somegene flow across the geographic barrier. High variation,especially between lineages 1 and 2, and between geo-graphic populations in both COI and white genes, isstrongly supported by population differentiation statis-tics, although the GST values were not significantly dif-ferent (Table 3). Furthermore, the Kt values were muchgreater for the COI gene (11.9 and 6.96), compared withthe white gene (1.0).
Population structure and demographic historyAnalysis of mitochondrial data from 294 samples amongseven riverine and seven non-riverine localities in Ama-zonas, Pará, and Amapá states, Brazil (Figure 3) led tothe discovery of two co-occuring, but distinct A. mara-joara lineages that are unable to be connected using sta-tistical parsimony (Figure 2). Therefore, a medianjoining network that uses alternate algorithms to removehomoplasy was conducted and indicated that a mini-mum of 13 mutational steps separate the lineages,shown in Figure 2. Seven fixed mutations were esti-mated between lineages based on DnaSP. Additionally,A. oryzalimenetes was identified from Itaituba and fromMacapá, a new record (Figure 3).COI haplotypes were detected (Figure 2). Of the A.
marajoara haplotypes, 26 (44.8%) were shared amonglocalities, and 32 (55.2%) were unique (Additional file3). The most common haplotypes were 1 (n = 16), 2 (n= 26), 3 (n = 20) and 5 (n = 78) of A. marajoara lineage1, and haplotypes 43 (n = 9) and 46 (n = 9), 50 (n =32), and 56 (n = 11) of A. marajoara lineage 2 (Figure2). There was a relatively high proportion of singletons(32, 55.17%) in the A. marajoara lineages combined,with 24/42 for lineage 1, and 9/16 for lineage 2. Overall,both A. marajoara lineages were indicative of a categoryII pattern [26] characterized by pronounced geneticgaps between some branches and the co-distribution ofprinciple lineages over a wide area, which could theore-tically arise in a species with large evolutionary Ne
(effective population size) and high gene flow. Lineage 1contains a star shaped node surrounding haplotype 5,with short branches and an excess of singleton muta-tions, predominantly from the northeastern localities,which suggests a demographic expansion, backgroundselection or selective sweep [74,84]. In contrast, lineage2 indicates balancing selection with its longer branches,missing haplotypes and near equal distribution of sharedhaplotypes and single mutations, consistent with a signal
Table 2 COI K2P intraspecific nucleotide difference of Nyssorhynchus species using the fragment of the Folmer regionavailable in GenBank with current A. marajoara and individual lineage comparisons below the double line.
Species N Fragment length Intraspecific difference mean (SD) GenBank Accession
A. albitarsis s.s 6 703 0.010 (± 0.003) DQ076204-DQ076209
A. oryzalimnetes 6 703 0.004 (± 0.002) DQ076210-DQ076215
A. deaneorum 4 703 0.015 (± 0.003) DQ076226/227, DQ076229/230
A. goeldii 16 493 0.014 (± 0.003) EU848313-EU848328
A. braziliensis 58 529 0.015 (± 0.003) DQ913858-DQ913877
A. darlingi 36 460 0.012 (± 0.003) DQ298209-DQ298244
A. dunhami 4 493 0.010 (± 0.003) EU848329-EU848332
A. marajoara s.l 10 703 0.024 (± 0.003) DQ076216-DQ076225
Lineage 1 7 703 0.016 (± 0.002) DQ07616, DQ076218-20, DQ076222-24
Lineage 2 3 703 0.014 (± 0.002) DQ076217, DQ076221, DQ076225
McKeon et al. Malaria Journal 2010, 9:271http://www.malariajournal.com/content/9/1/271
Page 6 of 13
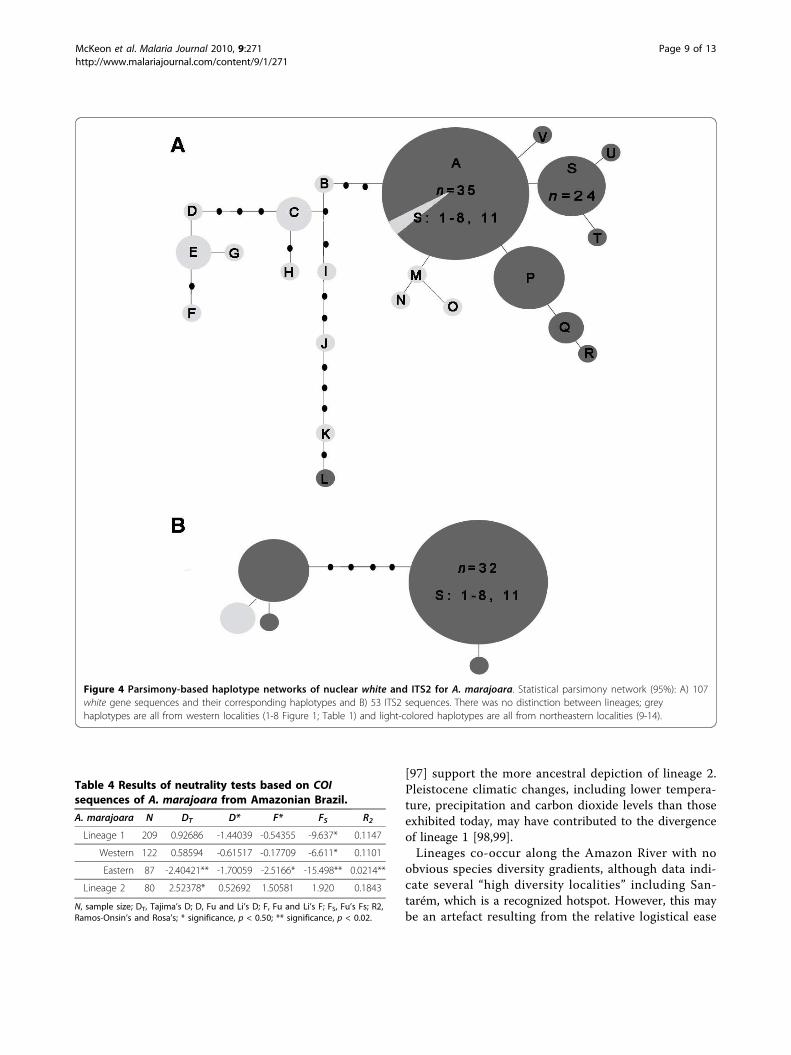
of an older lineage. It could be argued that haplotype 50(lineage 2, Figure 2) and the 5 singletons that arise fromit also constitute a star-shaped node, which suggestrecent expansion. Lineage 2 appears to be restricted tothe westernmost localities.Statistical parsimony networks of nuclear data (white
gene and ITS2) containing comparative numbers of spe-cimens of both COI-defined lineages identified a singleA. marajoara lineage (Figure 4A, B). Haplotype clusters(Figure 4A) correspond primarily to northeastern andwestern populations with a few outliers including haplo-type L and two individuals in haplotype A. Both lineagesretained the 4th intron in the white gene, which isabsent from all other Albitarsis Complex members [11].Additionally, the ITS2 length was identical (361-bp) inall sequences, independent of the lineage. Copy numberin microsatellite regions at positions 118 (GT) and 273(GA) and the 2-bp indel at position 271 were not con-gruent with either lineage or geography, but consistent
with findings by Li and Wilkerson [20,42]. Genetic poly-morphism analyses of the COI sequences indicated thathaplotype diversity was greater among lineage 1 popula-tions, whereas lineage 2 localities exhibited slightlyhigher nucleotide diversity (Additional file 3). In lineage1, there was greater diversity among the western local-ities (1-8), compared to northeastern Amazon (9-14).The white gene exhibited lower nucleotide diversitiesoverall compared to COI, and some differences in diver-sity between populations, particularly in Tartarugalzinho(locality 12), where haplotypes D and T are present,separated by 11 mutation steps (Additional file 4). Mod-erate nucleotide diversity in the COI data coupled withthe single A. marajoara lineage detected with the whitegene may reflect ancestral polymorphism as a result ofco-occurence and haplotype mixing [85].The high COI haplotype diversity combined with rela-
tively low nucleotide diversity in both lineages (Addi-tional file 3) suggests a population bottleneck followed
Figure 3 Distribution of collection localities of A. marajoara s.l. and A. oryzalimentes. Map of South America indicating the location of the14 collection localities, lineage distributions and the spatial grouping derived from the SAMOVA analysis. Dotted line corresponds to SAMOVAdefined groupings (eastern and western Amazon), based on sequence similarity and geographic distance for A. marajoara lineage 1 among alllocalities. FCT corresponds to between group variation and FSC indicates variation within groupings.
McKeon et al. Malaria Journal 2010, 9:271http://www.malariajournal.com/content/9/1/271
Page 7 of 13
by an expansion. The negative values for three neutralitytests in lineage 1 (Table 4) may reflect an excess of rarepolymorphisms consistent with either positive selectionor an increase in population size, although only one ofthese tests (Fs) was significant. In contrast, the positivevalues in lineage 2 indicate an excess of intermediate-frequency alleles in a population, which can result fromeither balancing selection or population bottlenecks[86]. Only the northeastern subdivision of lineage 1revealed strong support for a population expansionevent. The comparison between the northeastern andwestern populations within lineage 1 supports theSAMOVA findings of a geographic barrier, depicted inFigure 3.The mismatch distribution model for sudden expan-
sion was marginally significant for both lineages. Bothexhibited a bi-modal distribution (Figure 5) with a com-plete separation and significant raggedness values, sug-gesting constant population size [87]. However, analternative interpretation would be that there were twoexpansions [88] dated to the Pleistocene (lineages 1 and2, 142,203 (3,678-220,163) and 114,713 (8,545-230,635)ybp, respectively). The lineage 1 northeastern population(Figure 2) expanded more recently, approximately 5,000years ago, during the Holocene.
DiscussionThe combined sequence results support divergence inA. marajoara depicting separate lineages, distinct fromA. janconnae. The more ancestral lineage 2 appearsmonophyletic, whereas moderate substructure withinlineage 1 suggests paraphyly. Nuclear markers, however,consistently depict a single A. marajoara lineage.
Discrepancies between mtDNA and nDNA are notenough to refute speciation, for example the newlyrecognized species A. janconnae and A. marajoara forma single lineage using the protein coding nuclear whitegene and ITS2 sequences [20,21], but complete COIsequences [10] indicate monophyly of each taxon, andmorphometrics analysis depicts A. janconnae as a sepa-rate taxon in the complex [22]. Nuclear mutation ratesare generally slower than mitochondrial ones [89], butsee Hellberg [90], thus the lack of divergence detectedin the nuclear sequences in A. marajoara in the presentstudy suggests either the differentiation is restricted tothe mitochondrial genome, or it is recent and not yetvisible in the nuclear genome. Given that lineage 1 has abroader distribution and includes samples from near thetype locality, lineage 1 would be more appropriatelynamed A. marajoara s.s. The status of lineage 2 is notyet resolved; it may be a new cryptic species belongingto the complex as suggested by Wilkerson et al. (2005)from Manaus, Brazil [41] and confirmed by JF Ruiz(personal communication) using the COI barcode regionof the Albitarsis subgroup across South America.Genetic variation between lineages was explained by
61.94% between group differences. Pairwise divergenceestimates based on the 488-bp fragment confirmed3.82% divergence between lineages (Table 3), which iscomparable to the values observed among well-knownAlbitarsis Complex species (for example, 3.52% betweenA. albitarsis s.s and A. oryzalimnetes). These data maysupport cryptic or incipient speciation [91]. The effec-tiveness of the Folmer region and the BOLD thresholdof 3% are questionable for at least some species of Nys-sorhynchus because there is only moderate supportbetween known species A. oryzalminetes and A. albitar-sis s.s. If the average intraspecific variation of the Folmerregion for the subgenus (11.6%) is used as a speciesthreshold, the pairwise divergences of all sister taxa(including A. darlingi and A. albimanus) do not exceedthis standard. Such a high SST is likely to result in falsenegatives even among recognized species, thereforeseparate intraspecific values and interspecific diver-gences were examined for resolution, where intraspecificCOI variation was <2% and interspecific variation wasbetween 6-10%, comparable to other anopheline speciesdifferences [[92,93], unpublished data].Pleistocene divergence in mtDNA has also been
detected for a wide range of insect taxa across Centraland South America, including L. longipalpis [94], H.erato [81], R. prolixus [95], and mosquitoes A. darlingi[53] and A. albimanus [85] suggesting climatic changesmay be a common force driving Neotropical speciation.Pleistocene divergence coupled with paleoclimaterecords of the Miocene describing the world as warmerand exhibiting greater humidity and precipitation [96];
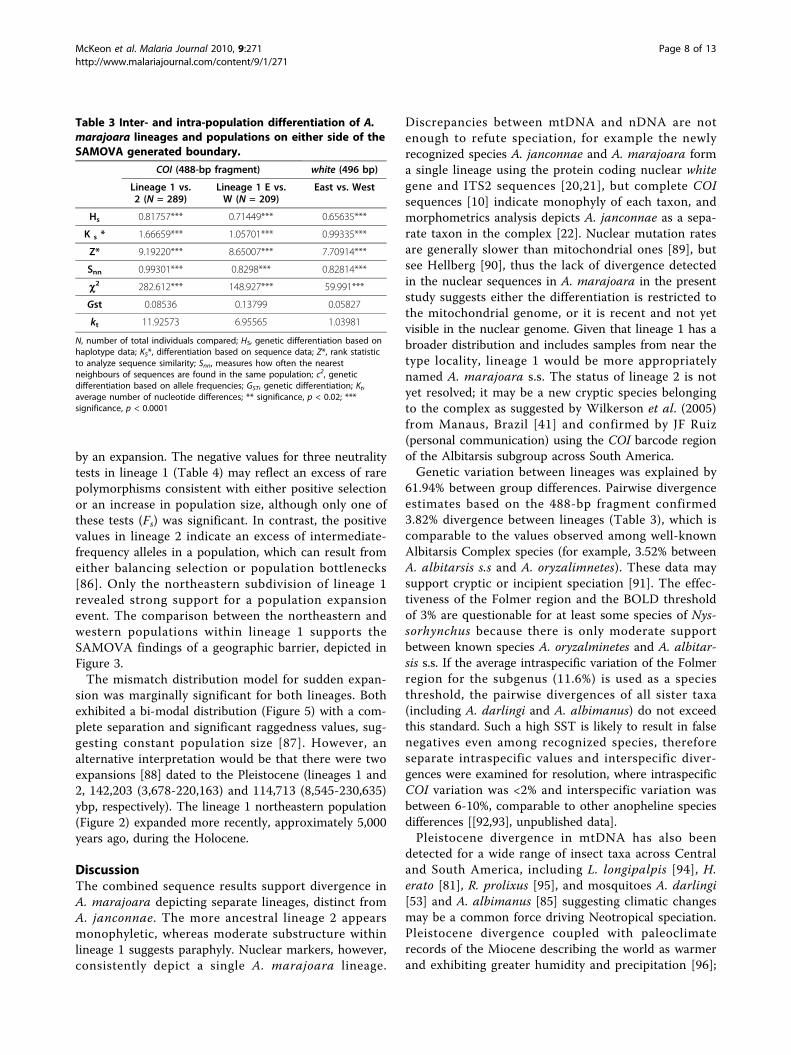
Table 3 Inter- and intra-population differentiation of A.marajoara lineages and populations on either side of theSAMOVA generated boundary.
COI (488-bp fragment) white (496 bp)
Lineage 1 vs.2 (N = 289)
Lineage 1 E vs.W (N = 209)
East vs. West
Hs 0.81757*** 0.71449*** 0.65635***
K s * 1.66659*** 1.05701*** 0.99335***
Z* 9.19220*** 8.65007*** 7.70914***
Snn 0.99301*** 0.8298*** 0.82814***
c2 282.612*** 148.927*** 59.991***
Gst 0.08536 0.13799 0.05827
kt 11.92573 6.95565 1.03981
N, number of total individuals compared; HS, genetic differentiation based onhaplotype data; KS*, differentiation based on sequence data; Z*, rank statisticto analyze sequence similarity; Snn, measures how often the nearestneighbours of sequences are found in the same population; c2, geneticdifferentiation based on allele frequencies; GST, genetic differentiation; Kt,average number of nucleotide differences; ** significance, p < 0.02; ***significance, p < 0.0001
McKeon et al. Malaria Journal 2010, 9:271http://www.malariajournal.com/content/9/1/271
Page 8 of 13
[97] support the more ancestral depiction of lineage 2.Pleistocene climatic changes, including lower tempera-ture, precipitation and carbon dioxide levels than thoseexhibited today, may have contributed to the divergenceof lineage 1 [98,99].Lineages co-occur along the Amazon River with no
obvious species diversity gradients, although data indi-cate several “high diversity localities” including San-tarém, which is a recognized hotspot. However, this maybe an artefact resulting from the relative logistical ease
Table 4 Results of neutrality tests based on COIsequences of A. marajoara from Amazonian Brazil.
A. marajoara N DT D* F* FS R2
Lineage 1 209 0.92686 -1.44039 -0.54355 -9.637* 0.1147
Western 122 0.58594 -0.61517 -0.17709 -6.611* 0.1101
Eastern 87 -2.40421** -1.70059 -2.5166* -15.498** 0.0214**
Lineage 2 80 2.52378* 0.52692 1.50581 1.920 0.1843
N, sample size; DT, Tajima’s D; D, Fu and Li’s D; F, Fu and Li’s F; FS, Fu’s Fs; R2,Ramos-Onsin’s and Rosa’s; * significance, p < 0.50; ** significance, p < 0.02.
Figure 4 Parsimony-based haplotype networks of nuclear white and ITS2 for A. marajoara. Statistical parsimony network (95%): A) 107white gene sequences and their corresponding haplotypes and B) 53 ITS2 sequences. There was no distinction between lineages; greyhaplotypes are all from western localities (1-8 Figure 1; Table 1) and light-colored haplotypes are all from northeastern localities (9-14).
McKeon et al. Malaria Journal 2010, 9:271http://www.malariajournal.com/content/9/1/271
Page 9 of 13

of access to these localities and the many studies thathave been conducted there [100]. The geographic bar-rier detected within A. marajoara lineage 1 is in thesame region as the mtDNA divisions between northeast-ern and central western Amazon populations in A. dar-lingi [101], A. nuneztovari [102] and Atta species ants[103]. With similar distributions and geographic bound-aries noted in both mosquitoes and ants, it seems unli-kely that the boundary is the result of dispersal abilities.The detection of shared haplotypes in the present studyon both sides of the barrier indicates a permeableboundary, suggesting the more geographically restrictedlineage 2 may be an artefact of incomplete sampling, orperhaps a result of climate variation.
Climate, particularly rainfall, is a strong descriptor ofbroad-scale species-richness patterns in the tropics [104].Vasconcelos et al [105] noted a restricted geographicdistribution of ants in the western part of the basin, whichto a great extent reflected a west to east gradientof decreasing rainfall. Additionally, Sombroek [106]explained an intricate pattern of continuous rainfall in thewestern interior of the Amazon, in contrast to the coasts,with a pronounced dry season containing a dry belt orcorridor occurring near Rio Jari, Amapá state (near theSAMOVA barrier for A. marajoara lineage 1). Mioceneflooding [103] and subsequent Pleistocene climatic eventsmay explain the porous nature of the barrier.Recent deforestation and habitat fragmentation result-
ing from the 1967 initiation of the single largest forestplantation in Latin America, an agro-forestry ventureknown as the Jari project [107] in northern Brazil couldhave contributed to an increase in A. marajoara abun-dance in this region. Clearing of forest, in combinationwith an increase in human and domestic animal hostabundance, may have led to an A. marajoara populationincrease in Macapá, the capital of Amapá -state, innortheastern Amazonian Brazil [15].Among the riverine localities, the hypothesis of sud-
den population expansion could not be rejected,although the mismatch distributions were smooth andbimodal for both lineages. The reduced genetic variationof A. marajoara lineage 1 in the northeastern Amazonregion coupled with the unimodal distribution and thestar-like pattern of the haplotype network are consistentwith a rapid population expansion in the northeast.A. marajoara tends to breed in marshy sunlit pools andmay have expanded into the northeast where savannahand agricultural habitats would be favorable. The popu-lation expansion occurred during the Holocene, possiblyindicating a recent colonization. This explanation is sup-ported by the expansion of savannah during periods offire-associated drought and extinction-recolonization ofrainforest tree populations in lowland areas during theHolocene [108-110]. Moderate gene flow in lineage 1may hamper local vector control in Amazonas, Pará andAmapá states because of potential reinvasion and thespread of insecticide resistant genes [111].
ConclusionsAnopheles marajoara is an important vector in thesavannah areas of South America [13], and with some ofthe highest incidences of malaria occurring in the statesof Pará and Amapá [14,15,112] it is likely that A. mara-joara will continue to increase its regional importancein malaria transmission. Additional studies will beneeded to determine whether the subdivision resultingin the two co-occurring lineages in A. marajoara isstrictly the product of genetic variation and evolutionary
Figure 5 Mismatch distributions of pairwise sequencedifferences in A. marajoara among lineages and geographicpopulations. Representative mismatch distributions for A. marajoaralineages with calculated tau and estimated time of spatialexpansion. Black bars indicate observed values, the grey linerepresents the model. A) A. marajoara lineage 1 across all localities;B) A. marajoara lineage 1 from the 6 northeastern localities; and C)A. marajoara lineage 2.
McKeon et al. Malaria Journal 2010, 9:271http://www.malariajournal.com/content/9/1/271
Page 10 of 13
processes impacted by geographical barriers, or varia-tions in ecology and behaviour that may have lead toniche divergences and microallopatry [113-116]. If bothlineages are implicated as vectors, the characteristics oftheir breeding sites, their behaviours and their migrationhistory could be used to predict changes in malariatransmission patterns in the Amazon basin [15] andother endemic regions, and provide useful informationfor targeted vector control strategies.
Additional material
Additional file 1: Complete COI with fragment orientation andoverlap. Representative schematic of the COI gene, Folmer region andfragments; light blue bar indicating the region amplified by primersUEA3 and UEA10; the purple bar depicting fragment previously amplifiedfrom primers 2195D and C1-J-2195. *, denotes the piece of the COI thatwas used for the phylogeography and population structure analysis.
Additional file 2: DXY with Jukes Cantor pairwise divergencebetween species and lineages based upon the 648-bp Folmerregion (below) and the 488-bp COI fragment (above).
Additional file 3: Description of shared COI haplotypes and geneticpolymorphism statistics for A. marajoara lineages and A.oryzalimnetes. N, the number of sequences; 1-Σfi
2, haplotype diversity; Π,nucleotide diversity; SD, standard deviation; P, polymorphic sites; and K,average number of differences. Underlining indicates shared haplotypesand bold indicates diversity among lineages or species.
Additional file 4: Description of shared white haplotypes andgenetic polymorphism statistics for A. marajoara s.l.
AcknowledgementsWe thank M Povoa’s research group at Instituto Evandro Chagas/SVS/MS inAnanindeua, Pará, Brazil as well as Rosa and Roger Hutchings, InstitutoNacional de Pesquisas da Amazônia, Manaus, Brazil, for assistance inmosquito collection and logistics. We also appreciate the help of W.Kilpatrick, UVM, with analysis and interpretation of the eastern Amazon dataearly on. Funding for this study was provided by Instituto Evandro Chagas,Ananindeua, Pará, Brazil and NIH grants 1T32AI05532901A1, “Training inBiodefense and Emerging Infectious Disease” and NIH 2R01 A154139 to JEC.Permission to collect in the Amazon basin was provided by the ConselhoNacional de Desenvolvimento Científico e Tecnológico (CNPq) processo:CMC 028/04 - Expedição Científica and IBAMA RMX 021/04 (Projeto: ?Biologia e sistemática de vetores de malária no Brasil: genética e ecologia?).
Author details1Department of Biomedical Sciences, School of Public Health, StateUniversity of New York-Albany, Empire State Plaza, Albany, NY 12201 USA.2Department of Biology, 120A Marsh Life Sciences Building, University ofVermont, Burlington, VT 05405, USA. 3Department of Entomology, WalterReed Army Institute of Research, 503 Robert Grant Avenue, Silver Spring, MD20910 USA. 4Department of Epidemiology, Universidade de Sao Paulo, 715 -Cerqueira Cesar 01246-904 Sao Paulo, Brazil. 5Laboratório de Fisiologia eControle de Artropodes Vetores, IOC-Fiocruz, 4365 - Manguinhos, Rio deJaneiro, Brazil. 6Laboratório de Pesquisas Básicas em Malaria, InstitutoEvandro Chagas, Secretaria de Vigilância em Saúde/MS, Br 316, Km 7, s/n,CEP 67.030-000, Ananindeua, Para, Brazil. 7The Wadsworth Center, GriffinLaboratory, New York State Department of Health, 5668 State Farm Road,Slingerlands, NY 12159, USA.
Authors’ contributionsSNM extracted DNA, performed all molecular procedures and analysis, anddrafted the manuscript. MAL performed molecular procedures and analysisfor eastern data and helped in manuscript preparation. RCW and MMPcontributed in the design of the study, were involved in field collections
and helped interpret data. JFR assisted in data analysis and interpretation.MAS and JBLP were involved in field collections and performedmorphological identifications of samples with RCW. JEC participated in thedesign of the study, data analysis, drafting of the manuscript, generalsupervision of the research group and funding acquisition. All authors readand approved the final document.
Competing interestsThe authors declare that they have no competing interests.
Received: 15 April 2010 Accepted: 7 October 2010Published: 7 October 2010
References1. Hammond PM: Species inventory. In Global biodiversity: status of the earth’s
living resources. Edited by: Groombridge B. Chapman 1992:17-39.2. Lewinsohn TM, Prado PI: Biodiversity of Brazil: a synthesis of the current
state of knowledge in. Biodiversidade brasileira: síntese do estado doconhecimento atual Contexto Acadêmica, São Paulo 2002, 139-144.
3. De Quieroz K: Species concepts and species delimitation. Syst Biol 2007,56:879-886.
4. Bickford D, Lohman DJ, Sodhi NS, Ng PKL, Meier R, Winker K, Ingram KK,Das I: Cryptic species as a window on diversity and conservation. TrendsEcol Evol 2006, 22:148-155.
5. Gomez A, Serra M, Carvalho GR, Lunt DH: Speciation in ancient crypticspecies complexes: Evidence from the molecular phylogeny ofBrachionus plicatilis (Rotifera). Evol 2002, 56:1431-1444.
6. Olsson U, Alstrom P, Ericson PGP, Sundberg P: Non-monophyletic taxa andcryptic species - evidence from a molecular phylogeny of leaf-warblers(Phylloscopus, Aves). Mol Phylogenet Evol 2005, 36:261-276.
7. Illera JC, Richardson DS, Helm B, Atienza JC, Emerson BC: Phylogeneticrelationships, biogeography and speciation in the avian genus Saxicola.Mol Phylogenet Evol 2008, 48:1145-1154.
8. Pfenninger M, Nowak C, Kley C, Steike D, Streit B: Utility of DNA taxonomyand barcoding for the inference of larval community structure inmorphologically cryptic Chironomus (Diptera) species. Mol Ecol 2007,16:1957-1968.
9. Lins RMMA, Souza NA, Peixoto AA: Genetic divergence between twosympatric species of the Lutzymyia longipalpis complex in the paralyticgene, a locus associated with insecticide resistance and lovesongproduction. Mem Inst Oswaldo Cruz 2008, 103:736-740.
10. Lehr MA, Kilpatrick CW, Wilkerson RC, Conn JE: Cryptic species in theAnopheles (Nyssorhynchus) albitarsis (Diptera: Culcidae) complex:incongruence between random amplified polymorphic DNA-polymerasechain reaction identification and analysis of mitochondrial DNA COIgene sequences. Ann Entomol Soc Am 2005, 98:908-917.
11. Merritt TJ, Young CR, Vogt RG, Wilkerson RC, Quattro JM: Intron retentionidentifies a malaria vector within the Anopheles (Nyssorhynchus) albitarsiscomplex (Diptera: Culicidae). Mol Phylogenet Evol 2005, 35:719-724.
12. Dusfour I, Blondeau J, Harbach RE, Vythilingham I, Baimai V, Trung HD,Sochanta T, Bangs MJ, Manguin S: Polymerase chain reaction identificationof three members of the Anopheles sundaicus (Diptera: Culicidae)complex, malaria vectors in Southeast Asia. J Med Entomol 2007, 44:723-31.
13. Rubio-Palis Y, Zimmerman RH: Ecoregional classification of malaria vectorsin the Neotropics. J Med Entomol 1997, 34:499-510.
14. Povoa MM, Wirtz RA, Lacerda RNL, Miles MA, Warhurst D: Malaria vectorsin the municipality of Serra do Navio, state of Amapá, Amazon region,Brazil. Mem Inst Oswaldo Cruz 2001, 96:179-184.
15. Conn JE, Wilkerson RC, Segura MNO, De Souza RTL, Schlichting CD,Wirtz RA, Povoa MM: Emergence of a new neotropical malaria vectorfacilitated by human migration and changes in land use. Am J Trop MedHyg 2002, 66:18-22.
16. Povoa MM, De Souza RTL, Nonato da Luz Lacerda R, Santa Rosa E, Galiza D,Rodrigues de Souza J, Wirtz R, Schlichting C, Conn JE: The importance ofAnopheles albitarsis E and An. darlingi in human malaria transmission inBoa Vista, state of Roraima, Brazil. Mem Inst Oswaldo Cruz 2006,101:163-168.
17. Bourke BP, Foster PG, Bergo ES, Calado DC, Sallum MAM: Phylogeneticrelationships among species of Anopheles (Nyssorhynchus) (Diptera:Culicidae) based on nuclear and mitochondrial gene sequences. ActaTrop 2010, 114:88-96.
McKeon et al. Malaria Journal 2010, 9:271http://www.malariajournal.com/content/9/1/271
Page 11 of 13

18. Klein TA, Lima JB, Tada MS: Comparative susceptibility of anophelinemosquitoes to Plasmodium falciparum in Rondonia, Brazil. Am J Trop MedHyg 1991, 44:598-603.
19. Klein TA, Lima JB, Tada MS, Miller R: Comparative susceptibility ofanopheline mosquitoes in Rondonia, Brazil to infection by Plasmodiumvivax. Am J Trop Med Hyg 1991, 45:463-470.
20. Li C, Wilkerson RC: Identification of Anopheles (Nyssorhynchus) albitarsiscomplex species (Diptera:Culicidae) using rDNA internal transcribedspacer 2-based polymerase chain reaction primers. Mem Inst OswaldoCruz 2005, 100:495-500.
21. Brochero HL, Li C, Wilkerson RC: A newly recognized species in theAnopheles (Nyssorhynchus) albitarsis complex (Diptera: Culcidae) fromPuerto Carreno, Colombia. Am J Trop Med Hyg 2007, 76:1113-1117.
22. Motoki MT, Wilkerson RC, Sallum MAM: The Anopheles albitarsis complexwith the recognition of Anopheles oryzalimnetes Wilkerson and Motoki,n. sp. and Anopheles janconnae Wilkerson and Sallum, n. sp. (Diptera:Culicidae). Mem Inst Oswaldo Cruz 2009, 104:823-850.
23. Wiens JJ: Species delimitation: New approaches for discovering diversity.Syst Biol 2007, 56:875-878.
24. Bowling AT, Ruvinsky A: The Genetics of the Horse CABI Publishing,Wallingford 2000.
25. Avise JC: Molecular markers, natural history and evolution Chapman & Hall,New York 1994.
26. Avise JC: Phylogeography. The History and Formation of Species UniversityPress: Massachusetts 2000.
27. Brown JM, Pellmyr O, Thompson JN, Harrison RG: Phylogeny of Greya(Lepidoptera: Prodoxidae), based on nucleotide sequence variation inthe mitochondrial cytochrome oxidase I and II: congruence withmorphological data. Mol Biol Evol 1994, 11:128-141.
28. Lunt DH, Zhang DX, Szymura JM, Hewitt GM: The insect cytochromeoxidase I gene: evolutionary patterns and conserved primers forphylogenetic studies. Insect Mol Biol 1996, 5:153-165.
29. Walton C, Handley JM, Tun-Lin W, Collins FH, Harbach RE, Baimai V,Butlin RK: Population structure and population history of Anopheles dirusmosquitoes in Southeast Asia. Mol Biol Evol 2000, 17:962-974.
30. Salvato P, Battisti A, Concato S, Masutti L, Patarnello T, Zane L: Geneticdifferentiation in the winter pine processionary moth (Thaumetopoeapityocampa-wilkinsoni complex) inferred by AFLP and mitochondrialDNA markers. Mol Ecol 2002, 11:2435-2444.
31. Hebert PDN, Penton EH, Burns JM, Janzen DH, Hallwachs W: Ten species inone: DNA barcoding reveals cryptic species in the neotropical skipperbutterfly Astraptes fulgerator. Proc Natl Acad Sci USA 2004,101:14812-14817.
32. Cooper JK, Sykes G, King S, Cottrill K, Ivanova NV, Hanner R, Ikonomi P:Species identification in cell culture: a two-pronged molecular approach.In Vitro Cell Dev Biol Anim 2007, 43:344-351.
33. Hebert PDN, Cywinska A, Ball SL, deWaard JR: Biological identificationsthrough DNA barcodes. Proc R Soc Lond B Biol Sci 2003, 270:313-321.
34. Moritz C, Cicero C: DNA Barcoding: Promise and pitfalls. PLoS Biol 2004,2:1529-1531.
35. Ball SL, Hebert PDN, Burian SK, Webb JM: Biological identifications ofmayflies (Ephemeroptera) using DNA barcodes. J N Am Benthol Soc 2005,24:508-524.
36. Foley DH, Wilkerson RC, Cooper RD, Volovsek ME, Bryan JH: A molecularphylogency of Anopheles annulipes (Diptera: Culicidae) sensu lato: Themost species-rich anopheline complex. Mol Phylogenet Evol 2006,43:283-297.
37. Whitworth TL, Dawson RD, Magalon H, Baudry E: DNA barcoding cannotreliably identify species of the blowfly genus Protocalliphora (Diptera:Calliphoridae). Proc R Soc Biol Sci 2007, 274:1731-1739.
38. Elias M, Hill RI, Willmott KR, Dasmahapatra KK, Brower AVZ, Mallet J,Jiggins CD: Limited performance of DNA barcoding in a diversecommunity of tropical butterflies. Proc R Soc Biol 2007, 274:2881-2889.
39. Meyer CP, Paulay G: DNA Barcoding: Error rates based on comprehensivesampling. PLoS Biol 2005, 3:e422.
40. Cognato AI: Standard percent DNA sequence difference for insects doesnot predict species boundaries. J Econ Entomol 2006, 99:1037-1045.
41. Wilkerson RC, Foster PG, Li C, Sallum MAM: Molecular phylogeny of theneotropical Anopheles (Nyssorhynchus) albitarsis species complex(Diptera: Culicidae). Ann Entomol Soc Am 2005, 98:918-925.
42. Li C, Wilkerson RC: Intragenomic rDNA ITS2 variation in the neotropicalAnopheles (Nyssorhynchus) albitarsis Complex (Diptera: Culicidae). J Hered2007, 98:51-59.
43. Fritz GN, Conn JE, Cockburn AF, Seawright J: Sequence analysis of theribosomal DNA Internal Transcribed Spacer 2 from populations ofAnopheles nuneztovari (Diptera: Culicidae). Mol Biol Evol 1994, 11:406-416.
44. Marrelli MT, Sallum MAM, Marinotti O: The second internal transcribedspacer of the nuclear ribosomal DNA as a tool for Latin Americananopheline taxonomy - a critical review. Mem Inst Oswaldo Cruz 2006,101:817-832.
45. Zapata MA, Cienfuegos AV, Quiros OI, Quinones ML, Luckhard S,Correa MM: Discrimination of seven Anopheles species from San Pedrode Uraba, Antioquia, Colombia, by Polymerase Chain Reaction-Restriction Fragment Length Polymorphism analysis of ITS sequences.Am J Trop Med Hyg 2007, 77:67-72.
46. Marrelli MT, Floeter-Winter LM, Malafronte RS, Tadei WP, Lourenc R, O-De-Oliverira , Flores-Mendoza C, Marinotti O: Amazonian malaria vectoranopheline relationships intrepreted from ITS2 rDNA sequences. Med VetEntomol 2005, 19:208-218.
47. Hartl DL, Clark AG: Principles of Population Genetics Sinauer Associates, Inc.Publishers, Sunderland MA, 4 2007.
48. Caporaso JG, Smit S, Easton BC, Hunter L, Huttley GA, Knight R: Detectingcoevolution without phylogenetic trees? Tree-ignorant metrics ofcoevolution perform as well as tree-aware metrics. BMC Evol Biol 2008, 8:327.
49. Deane LM, Causey OR, Deane MP: An illustrated key by adult femalecharacteristics for identification of thirty-five species of Anophelini fromthe Northeast and Amazon regions of Brazil, with notes on the malariavectors (Diptera: Culicidae). Am J Hyg Monog Ser 1946, 18:1-18.
50. Lehr MA: Inter- and intra-specific relationships of the cryptic members ofthe Anopheles (Nyssorhynchus) albitarsis species complex. Masters thesisUniversity of Vermont, Biology Department 2003.
51. Soto-Adames FN: Molecular phylogeny of the Puerto Rican Lepidocyrtusand pseudosinella (Hexapoda: Collembola: Entomobryidae), a validationof Yoshii’s “color pattern species”. Mol Phylogenet Evol 2002, 25:27-42.
52. Joy DA, Conn JE: Molecular and morphological phylogenetic analysis ofan insular radiation in Pacific black flies (Simulium). Syst Biol 2001,50:18-38.
53. Mirabello L, Conn JE: Molecular population genetics of the malaria vectorAnopheles darlingi in Central and South America. Hered 2006, 96:311-321.
54. Swofford DL: PAUP (Phylogenetic Analysis Using Parsimony) and othermethods, Version 4. Sinauer Associates: Massachusetts 2004.
55. Mirabello L, Conn JE: Population analysis using the nuclear white genedetects Pliocene/Pleistocene lineage divergence within Anophelesnuneztovari in South America. Med Vet Entomol 2008, 22:109-19.
56. Huelsenbeck JP, Ronquist F: MRBAYES: Bayesian inference of phylogeny.Bioinformat 2001, 17:754-755.
57. Ronquist F, Huelsenbeck JP: MRBAYES 3: Bayesian phylogenetic inferenceunder mixed models. Bioinformat 2003, 19:1572-1574.
58. Posada D: jModelTest: Phylogenetic model averaging. Mol Biol Evol 2008,25:1253-1256.
59. Guindon S, Gascuel O: A simple, fast, and accurate algorithm to estimatelarge phylogenies by maximum likelihood. Syst Biol 2003, 52:696-704.
60. Sallum MAM, Schultz TR, Wilkerson RC: Phylogeny of anophelinae (DipteraCulicidae) based on morphological characters. Ann Entomol Soc Am 2000,93:745-775.
61. Watterson GA: On the number of segregating sites in genetic modelswithout recombination. Theor Popul Biol 1975, 7:256-276.
62. Drummond AJ, Rambaut A: “BEAST: Bayesian Evolutionary Analysis bySampling Trees.”. BMC Evol Biol 2007, 7:214.
63. Excoffier L, Laval G, Schmeider S: Arlequin ver 3.0: An integrated softwarepackage for population genetic data analysis. Evol Bioinformat Online2005, 1:47-50.
64. Dupanloup I, Schneider S, Excoffier L: A simulated annealing approach todefine the genetic structure of populations. Mol Ecol 2002, 11:2571-81.
65. Harbach RE: The classification of genus Anopheles (Diptera: Culicidae): aworking hypothesis of phylogenetic relationships. Bull Entomol Res 2004,95:537-553.
66. Witt JDS, Threloff DL, Hebert PDN: DNA barcoding reveals extraordinarycryptic diversity in an amphipod genus: implications for desert springconservation. Mol Ecol 2006, 15:3073-3082.
McKeon et al. Malaria Journal 2010, 9:271http://www.malariajournal.com/content/9/1/271
Page 12 of 13
67. Hebert PDN, Stoeckle MY, Zemlak TS, Francis CM: Identification of birdsthrough DNA barcodes. PloS Biol 2004, 2:e312.
68. Clement M, Posada D, Crandall KA: TCS: a computer program to estimategene genealogies. Mol Ecol 2000, 9:1657-1659.
69. Crandall KA, Templeton AR: Empirical tests of some preditions fromcoaslescent theory with applications to intraspecific phylogenyreconstruction. Genet 1993, 134:959-969.
70. Rozas J, Sanchez-Del Rio JC, Messeguer X, Rozas R: DnaSP, DNApolymorphism analyses by the coalescence and other methods.Bioinformat 2003, 19:2496-2497.
71. Tajima F: Statistical-method for testing the neutral mutation hypothesisby DNA polymorphism. Genet 1989, 123:585-595.
72. Fu YX, Li WH: Statistical tests of neutrality of mutations. Genet 1993,133:693-709.
73. Ramos-Onsins SE, Rozas J: Statistical properties of new neutrality testsagainst population growth. Mol Biol Evol 2002, 19:2092-2100.
74. Fu YX: Statistical tests of neutrality of mutations. Genet 1997, 133:693-709.75. Kumar S, Tamura K, Nei M: MEGA3: Integrated software for Molecular
Evolutionary Genetics Analysis and sequence alignment. Brief Bioinform2004, 5:150-163.
76. Crawford MH: Molecular Markers in Anthropological Genetic Studies.Anthropological genetics: theories, methods and applications CambridgeUniversity Press 2007, 141-186.
77. Harpending HC: Signature of ancient population growth in a low-resolution mitochondrial DNA mismatch distribution. Human Biol 1994,66:591-600.
78. Zarza E, Reynoso VH, Emerson BC: Diversification in the northernneotropics: mitochondrial and nuclear DNA phylogeography of theiguana Ctenosaura pectinata and related species. Mol Ecol 2008,17:3259-3275.
79. Linthicum KJ: A revision of the Argyritarsis Section of the subgenusNyssorhynchus of Anopheles (Diptera: Culicidae). Mosq Sys 1988, 20:98-271.
80. Kimura M, Crow JF: The number of alleles that can be maintained in afinite population. Genet 1964, 49:725-38.
81. Brower A: Rapid morphological radiation and convergence among racesof the butterfly Heliconius erato inferred from patterns of mitochondrialDNA evolution. Proc Natl Acad Sci USA 1994, 91:6491-6495.
82. Reisz RR, Muller J: Molecular timescales and the fossil record: apaleontological perspective. Trends Genet 2004, 20:237-241.
83. Krzywinski J, Besansky N: Molecular systematics of Anopheles: fromsubgenera to subpopulations. Annu Rev Entomol 2003, 48:111-139.
84. Slatkin M, Hudson RR: Pairwise comparisons of mitochondrial DNAsequences in stable and exponentially growing populations. Genet 1991,129:55-562.
85. Loaiza J, Scott M, Bermingham E, Rovira J, Conn JE: Evidence forPleistocene population divergence and expansion of Anophelesalbimanus in southern Central America. Am J Trop Med Hyg 2010,82:156-164.
86. Akey JM, Eberle MA, Rieder MJ, Carlson CS, Shriver MD, Nickerson DA,Kruglyak L: Population history and natural selection shape patterns ofgenetic variation in 132 genes. PLoS Biol 2004, 2:1591-1599.
87. Harpending HC, Sherry ST, Rogers AR, Stoneking M: The genetic structureof ancient human populations. Curr Anthropol 1993, 34:483-496.
88. Hasan AU, Suguri S, Fujimoto C, Londari Itaki R, Masakazu Harada,Kawabata M, Bugoro H, Albino B, Tsukahara T, Hombhanje F, Masta A:Phylogeography and dispersion pattern of Anopheles farauti senso strictomosquitoes in Melanesia. Mol Phylogenet Evol 2008, 46:792-800.
89. Zink RM, Barrowclough GF: Mitochondrial DNA under siege in avianphylgeography. Mol Ecol 2008, 17:2107-2121.
90. Hellberg ME: No variation and low synonymous substitution rates incoral mtDNA despite high nuclear variation. BMC Evol Biol 2006, 6.
91. He L, Watabe H, Xiangyu J, Gao J, Liang XC, Aotsuka T, Zhang Y: Geneticdifferentiation and cryptic speciation in natural populations ofDrosophila lacertosa. Mol Phylogenet and Evol 2007, 43:24-31.
92. Crywinska A, Hunter FF, Hebert PDN: Identifying Canadian mosquitospecies through DNA barcodes. Med Vet Entomol 2006, 20:413-424.
93. Kumar NP, Rajavel AR, Natarajan R, Jambulingam P: DNA Barcodes CanDistinguish Species of Indian Mosquitoes (Diptera: Culicidae). J MedEntomol 2007, 44:1-7.
94. Arrivillaga JC, Norris DE, Feliciangeli MD, Lanzaro GC: Phylogeography ofthe neotropical sand fly Lutzomyia longipalpis inferred frommitochondrial DNA sequences. Infect Genet Evol 2002, 2:83-95.
95. Monteiro FA, Barrett TV, Fitzpatrick S, Cordon-Rosales C, Feliciangeli D,Beard CB: Molecular phylogeography of the Amazonian Chagas diseasevectors Rhodnius prolixus and R. robustus. Mol Ecol 2003, 12:997-1006.
96. Kaandorp RJG, Vonhof HB, Wesselingh FP, Pittman LR, Kroon D, vanHinte JE: Seasonal Amazonian rainfall variation in the Miocene ClimateOptimum. Palaeogeogr Palaeoclimatol Palaeoecol 2005, 221:1-6.
97. Yu Y, Huber M, Muller RD, Poulsen CJ, Ribbe J: Simulation of the MiddleMiocene Climate Optimum. Geophys Res Lett 2009, 36:L04702.
98. Bonaccorso E, Kock I, Peterson AT: Pleistocene fragmentation of Amazonspecies’ ranges. Divers Distrib 2006, 12:157-164.
99. Mayle FE, Beerling DJ, Gosling WD, Bush MB: Responses of Amazonianecosystems to climatic and atmospheric carbon dioxide changes sincethe last glacial maximum. Philos Trans R Soc Lond B Biol Sci 2004,359:499-514.
100. Kress WJ, Heyer WR, Acevedo P, Coddington J, Cole D, Erwin Tl,Meggers BJ, Pogue M, Thorington RW, Vari RP, Weitzman MJ, Weitzman SH:Amazonian biodiversity: assessing conservation priorities with taxonomicdata. Biodivers Conserv 1998, 7:1577-1587.
101. Pedro PM, Sallum MA: Spatial expansion and population structure of theneotropical malaria vector, Anopheles darlingi (Diptera: Culicidae). Biol JLinn Soc 2009, 97:854-866.
102. Conn JE, Mitchell SE, Cockburn AF: Mitochondrial DNA analysis of theneotropical malaria vector Anopheles nuneztovari. Genome 41:313-327.
103. Solomon SE, Bacci M Jr, Martins J Jr, Vinha GG, Mueller UG:Paleodistributions and comparative molecular phylogeography ofleafcutter ants (Atta spp.) provide new insight into the origins ofAmazonian diversity. PLoS ONE 2008, 3.
104. Hawkins BA, Field R, Cornell HV, Currie DJ, Guegan JF, Jaufman DM, Kerr JT,Mittelbach GG, Oberdorff T, O’Brien EM, Porter EE, Turner JRG: Energy,water, and broad-scale geographic patterns of species richness. Ecol2003, 84:3105-3117.
105. Vasconcelos HL, Vilhena JMS, Facure KG, Albernaz ALKM: Patterns of antspecies diversity across 2000 km of Amazonian floodplain forest. JBiogeog 2009, 37:432-440.
106. Sombroek W: Spatial and temporal patterns of Amazon rainfall:consequences for the planning of agricultural occupation and theprotection of primary forests. AMBIO: J Human Environ 2001, 30:388-396.
107. Maeglin RR: Forest products from Latin America: an almanac of the state ofthe knowledge and the state of the art. United States Forest Service, Dept ofAgriculture, Gen Tech Report 1991, FPL-GTR-67.
108. Absy ML, Cleef A, Fournier M, Servant M, Siffedine A, Silva MFF, Suguio K,Turcq B, Van der Hammen T: Mise en évidence de quatre phasesd’ouverture de la forêt dense dans le sud-est de l’Amazonie au coursdes 6000 dernières années. Première comparaison avec d’autres régionstropicales. Compte Rendus de l’Académie des sciences 2nd series 1991,312:673-678.
109. Rull V: Holocene global warming and the origin of the Neotropical GranSabana in the Venezuelan Guayana. J Biogeog 2007, 34:279-88.
110. Mayle FE, Power MJ: Impact of a drier Early-Mid-Holocene climate uponAmazonian forests. Philos Trans R Soc Lond Biol Sci 2008, 363:829-38.
111. Pasteur N, Raymond M: Insecticide resistance genes in mosquitoes: Theirmutations, migration, and selection on field populations. J Hered 1996,87:444-449.
112. Akhavan D, Musgrove P, Abrantes A, Gusmao RD’A: Cost-effective malariacontrol in Brazil. Cost-effectiveness of a malaria control program on theAmazon Basin of Brazil, 1988-96. Soc Sci Med 1999, 49:1385-1399.
113. Smith HM: The perspective of species. Turtox News 1955, 33:74-77.114. Smith HM: More evolutionary terms. J Syst Zool 1965, 14:57-58.115. Schnabel KE, Hebert PDN: Resource-associated divergence in the arctic
marine amphipod Paramphithoe hystrix. Marine Biol 2003, 143:851-857.116. Friesen Vl, Smith AL, Gómez-Díaz E, Bolton M, Furness RW, González-Solís J,
Monteiro LR: Sympatric speciation by allochrony in a seabird. Proc NatlAcad Sci USA 2007, 104:18589-18594.
doi:10.1186/1475-2875-9-271Cite this article as: McKeon et al.: Lineage divergence detected in themalaria vector Anopheles marajoara (Diptera: Culicidae) in AmazonianBrazil. Malaria Journal 2010 9:271.
McKeon et al. Malaria Journal 2010, 9:271http://www.malariajournal.com/content/9/1/271
Page 13 of 13