life of slum occupants saving pattern
TRANSCRIPT

Dr. Hiresh S. Luhar
Dr. Ashok S. Luhar
&
Life of Slum Occupants Saving Pattern

Life of Slum Occupants & Saving Pattern
India | UAE | Nigeria | Uzbekistan | Montenegro

Life of Slum Occupants & Saving Pattern
By: Dr. Hiresh S. Luhar
M. Com, MBA, M. Phil, Ph. D, GMPE (IIM- Lucknow)
Dr. Ashok S. Luhar M. Com, M. A, MBA, MMS, PGDMM, UGC-NET, M. Phil, Ph. D

First Impression: 2019
Life of Slum Occupants & Saving Pattern
ISBN : 978-81-941253-5-8
Rs. 650/- ( $18 )
No part of the book may be printed, copied, stored, retrieved, duplicated and reproduced in any form without the written permission of the author/publisher.
DISCLAIMER Information contained in this book has been published by Empyreal Publishing House and has been obtained by the authors from sources believed to be reliable and are correct to the best of his knowledge. The authors are solely responsible for the contents of the articles compiled in this book. Responsibility of authenticity of the work or the concepts / views presented by the authors through this book shall lie with the authors and the publisher has no role or claim or any responsibility in this regards. Errors, if any, are purely unintentional and readers are requested to communicate such error to the authors to avoid discrepancies in future.
Published by: Empyreal Publishing House

IV
Preface
It gives us immense pleasure to put forth a book titled “Life of Slum Occupants & Saving Pattern” in the hands of the esteemed readers. The book covers various aspects of socio-economic conditions of sample slum area, contribution towards family income by head of family, organized and unorganized saving, their happiness level of slum dwellers, saving pattern and factors affecting quality of life in slums. This book will immensely benefit to the undergraduates, postgraduate and research students in understanding the concepts, methods and applications of the subject.
Authors have tried their best to bring together the scattered literature in the field in a concise manner. The book is divided in six chapters which individually cover the various aspects of the issues involved in the study of Slum Occupants Life & their Saving Pattern.
The book will help readers to understand how to control rampant growth of slums, how to improve living standard, solutions to policy makers regarding PDS financial burden, unorganized to organized economy, etc. The authors have tried their level best to cover the comprehensive areas of Slum Occupants Life & their Saving Pattern which have not been adequately covered so far.
Authors

V
Acknowledgements
It is my great pleasure to publish my Ph. D research work in form of book. It is a beautiful gift for me to honour publicly those who have inspired me, taught me, supported me and stood by my side.
My first thanks goes to my parents whose union provide the spark and love that created me thanks for their unceasing love.
I lift my heart in sincere gratitude to God Almighty, for the blessings showered upon me during the course of study. The strength and courage which was extended to me helped in completing this strenuous work.
Associate Professor Dr. Jayashree F. Mehta, my research guide, Department of Commerce, M.D. Shah Mahila College, Mumbai for her gracious guidance, love and affection, valuable and precious suggestions throughout the research work which contributed to the completion of the study. I express my sincere gratitude to her.
Dr. Arvind S Luhar Head of Accounts Department of I Y College, Mumbai for his constant support, encouragement and cooperation extended during the study, without which I would not have completed this doctoral project.
Dr. Madhukar H. Dalvi Department of Mathematics, Nagindas Khandwala College, Mumbai for the statistical analysis of data, timely help and support for the successful completion of the study and Dr.Santosh Hulagabali Librarian of Nagindas Khandwala College, Mumbai for the timely help and in providing important sources of secondary data’s required to complete this study in time.
A special word of thanks is also to Mrs. Deepali Powar, Community Development Officer of Mira Bhayander Municipal Corporation for providing valuable information.
Dr. Hiresh Shankarlal Luhar
Dr. Ashok Shankarlal Luhar

VI
Table of Contents
Preface Acknowledgement
IV
V
Table of Contents VI
Chapter – I : Introduction 1 – 23
Chapter – II : Review of Literature 24 – 52
Chapter – III : Study of Economic Aspects of Sample Area 53 – 123
Chapter – IV : Summary, Recommdendation, Limitation and Scope for Further Work 124 – 131
Chapter – V : References 132 – 138
Chapter – VI : List of Tables 139 – 142
List of Diagrams 143 – 145
Appendix 146

Life of Slum Occupants & Saving Pattern
1
CHAPTER – I
INTRODUCTION

Life of Slum Occupants & Saving Pattern
2
1.1 INTRODUCTION
1.2 CONCEPTS AND DEFINITIONS
1.3 OVERVIEW OF SLUM AROUND THE WORLD
1.4 OVERVIEW OF MAJOR SLUMS IN INDIA
1.5 BRIEF PROFILE OF MIRA-BHAYANDER CITY
1.6 SCHEMES OF VARIOUS AGENCIES
1.7 STATEMENT OF PROBLEMS
1.8 OBJECTIVES OF THE STUDY
1.9 HYPOTHESES OF THE STUDY
1.10 IMPORTANCE AND UTILITY OF THE STUDY
1.11 RESEARCH DESIGN AND METHODOLOGY
1.12 LIMITATIONS OF THE STUDY
1.13 CHAPTER SCHEME

Life of Slum Occupants & Saving Pattern
3
1.1 INTRODUCTION Our country has been built on such foundation of ancient cultural heritage, where we were told of only one mantra during Vedic period, which is indicative of our work culture, which we have learnt, we have memorized – “Sangachchhdhvam Samvadadhvam sam wo manansi jaanataam.” We walk together, we move together, we think together, we resolve together and together we take this country forward. Having imbibed this basic mantra, 125 crores of countrymen have taken the nation forward.
“India needs to run ahead of time, world will not wait for us.”
-Prime Minister, Mr. Narendra Modi (2014)
As defined by PM Shri Narendra Modi (2014), the youth of India has completely transformed the identity of India in the world; our country has largest number of youths in the world around 65 % populations of the country falls under the age group of 35 years. India needs ‘skill development’ and this will lead to ‘skilled India’. Prime Minister already promised to build a nation that is strong, prosperous and inclusive, where each and every Indian can realize their hopes and aspirations. He said India is urbanizing rapidly, and he sees this not as a challenge but as an opportunity for economic development.
As per planning commission, the Indian economy has fueled growth rate more than 8% (8.91% in 2010-11) in recent two year Indian economy has shown recession and economy growth rate has fall down to 4.47 in 2012-13, but still as per world bank development indicator (2013) developing economies are expected to maintain GDP growth of 6.6 – 6.8 percent over the next three year, with growth of GDP per capita around 5.5 percent. Growth will be fastest in East Asia, Pacific and South Asia. With newly elected full majority government it is expected to make it one of the most successful emerging economies in the world. As per ASSOCHAM, 87th Annual Session (econ.worldbank.org) Indian economy has decisively broken away from the so called Hindu rate of growth of 3.5% per year on an average for the three decades 1950-80.
Although it is a fact that Liberalization and Globalization are major driving forces behind robust growth of Indian economy, one cannot overlook the importance of the role played by Domestic Savings and Investment in Indian growth story. In fact ‘India’s economic growth has been predominantly financed by domestic savings.’ This claim can be proved by the fact that Gross Domestic Savings of India has increased from 9.6% (1950s) to 30.50% (2013-14) and highest of 36.82% (2007-08) according to RBI estimates. Various segments of the domestic financial market have been developed over the period of time to facilitate efficient channeling of resources from savers to investors and enable the continuation of domestic growth momentum.
However, Globalization, the main force behind the economic prosperity of India and also the world, currently is proving to be a factor responsible for world’s economic recession rather than prosperity. The sub-prime fall out in the U.S. economy and resulting turmoil in the international financial markets of advanced economies has also been inevitably transmitted to Indian economy. Credit markets world over appear to be drying up. As a result, macroeconomic variables of Indian economy have started showing downtrend; this can be called as a by-product of Globalization.
As per Dua (2006), the Indian economy, with over one billion population, with projected work force of around 363 million by 2050 (UN), has tremendous potential to be world’s third largest economy by 2032. On the backdrop of world financial crisis and resultant capital fight for India, Globalization policy seems to have more of a damaging impact on the Indian economy. Thus in order to cope up with current financial crisis and also to maintain growth rate, India has to rely more upon its strong domestic demand, the healthy balance-sheet of its’ corporate sector, and strong financial back-up of its Gross Domestic Savings. However, India, since its independence, has consistently been plagued with savings shortage. As per planning commission and World Bank (http://databank.worldbank.org), In India, savings as a percent of nominal GDP was only 32.42% for the period 2013-2014 whereas in China that was 49.69%. This fact demands for policy measures which will augment savings in India. Household savings being the most dominant part of Indian savings, effective policy measures are required for mobilization of household savings and predominantly mobilization of savings of low-income group people, since poor in India has more saving appetite. With this background the researcher has planned to study savings behavior of slum occupants at micro level, hence the title “Life of Slum Occupants & Saving Pattern” assumes importance in the present context.

Life of Slum Occupants & Saving Pattern
4
1.2 CONCEPTS AND DEFINITIONS The major concepts and definitions used in the study are described in detail under different heads.
1.2.1 INCOME As per D.Muraleedharan (2003), ‘The income of a household’ is defined as “the sum total of the current year’s earnings, both in cash and in kind, earned and accrued of all the members in the household during the period under reference, which includes income from salary and wages, agriculture, profession, business, house property, dividend and interest, and income from other external sources”.
1.2.2 INCOME DISTRIBUTION Description of the fractions of a population that are at various levels of income. It refers to “description of the number of households falling into different income categories”.
1.2.3 INCOME INEQUALITY As per (www.investopedia.com), the unequal distribution of household or individual income across the various participants in an economy. Income inequality is often presented as the percentage of income to a percentage of population. For example, a statistic may indicate that 70% of a country's income is controlled by 20% of that country's residents.
1.2.4 SAVINGS As per Jackson Geared (2008), Savings “is that part of disposable income (income after tax) not spent on goods and services”. Savings is therefore ‘total accumulated amount of income that is not spent on consumption’.
1.2.5 SAVINGS BEHAVIOR Saving behavior refers to “general saving pattern followed by a group of people”.
1.2.6 SLUMS Denis Gruber (2008), Definition of ‘slums’ first appeared in the 1820’s. The term ‘slums’ has been used to identify the poorest quality housing, and the most unsanitary conditions; ‘vice’ and drug abuse; a crime; a likely source of many epidemics that devastated urban areas; a place apart from all that was decent and wholesome. But in developing countries, the word ‘slums’ lacks the negative and decisive original connotations. It simply refers to” lower quality or informal housing”.
Thus following to Un-Habitat-2003, the term ‘slums’ is used in this project to describe “a heavily populated urban area characterized by substandard housing and squalor”.
1.2.7 NOTIFIED SLUMS As per Primary Census Abstract for Slum (2011), all notified areas in a town or city notified as ‘Slum’ by State, Union territories Administration or Local Government under any Act including a ‘Slum Act’ may be considered as Notified slums.
1.2.8 SLUM DEWELLER Slum Occupant refers to “group of people living in ‘slums’. That is,’ people residing in heavily populated urban areas with substandard living conditions”.
1.2.9 HOUSEHOLD A ‘household’ is defined as a “group of persons having blood relation. Marital relation or relation through adoption living under one roof, and sharing the food from same kitchen for not less than six months during reference period”.
Newly wedded couples and newborn babies also form part of the household, irrespective of the above-mentioned period. A single person is also treated as a household, if he maintains a kitchen.
1.2.10 HEAD OF THE HOUSEHOLD As per D.Muraleedharan (2003), the ‘head of the household’ is “a person who is the controlling authority recognized by all the other members of a household, and is the one responsible to take decisions on all financial matters”.

Life of Slum Occupants & Saving Pattern
5
1.2.11 GROSS DOMESTIC PRODUCT As per (http://www.investopedia.com), the monetary value of all the finished goods and services produced within a country's borders in a specific time period, though GDP is usually calculated on an annual basis. It includes all of private and public consumption, government outlays, investments and exports less imports that occur within a defined territory.
1.2.12 ANALYTICAL STUDY The definition of analytical is someone who studies and examines the elemental parts of something, or is something related to the study of small parts of a whole.
1.2.13 MIRA BHAYANDER Mira Bhayander is a suburb of Thane, located to the north of Mumbai in the konkan region, and administered by Mira-Bhayander Municipal Corporation (MBMC).
1.3 OVERVIEW OF SLUM AROUND THE WORLD In the United States and Europe slums were found common in the 19th and early 20th centuries. The first slum named Five Points in New York City was found in 1825, it was developed on the filled and dry Collect Lake. During 1800s in New York City Lake named Collect was filled up and became dry, and on it first slum was developed named Five Points. Many persecuted peoples from Europe and Poor rural people shifted to New York City in search of employment opportunity were settled in Five Points Slum.
In America before World War II apart from Five Points slum there was many slums found namely Racob Riis, Walker Evans, Lewis Hine, etc. Slums were found in almost all the major urban area of the United States in the early 20th century. In Britain slum were formed near to industrial area, northern English towns, lowland Scottish towns and Dublin city in Ireland. Slums described as “Cattle-sheds for human beings” by British Neighborhoods. These Cattle-sheds were found until 1940s; thereafter government started slum clearance and built new council houses.
In France, slums were common in Paris and all urban regions in the 19th century; many of these slums were continued till first half of the 20th centuries. After World War II mass migration was found in French people from rural to urban region of France. This demographic and economic trend speedily increased rents of existing housing as well as expanded slums. To control continuous rising of rent, France government passed laws to block increase of house rent, which inadvertently made many new housing project unprofitable this resulted in Slum increment. Further it is found that in underdeveloped and developing countries slum were predominantly found in the urban areas.
As per UN-HABITAT (2012) report around 33% of the populations of developing world are living in slum. The proportion of peoples living in slum was found highest among urban slum are as follows.
Sr. No. Particulars Percentage 1 Sub-Saharan Africa 61.70% 2 South Asia 35% 3 Southeast Asia 31% 4 East Asia 28.2% 5 West Asia 24.6% 6 Oceania 24.1% 7 Latin America and the Caribbean 23.5% 8 North Africa 13.3%
The proportion of urban population living in slum areas in 2009, among individual countries was highest in the Central African Republic (95.9%).
1.1.1 BIGGEST SLUMS OF THE WORLD As per Joshua B (2014), following are the biggest slum around the world- 1 Dharavi Slum in Mumbai, India
Dharavi slum of Mumbai is found biggest slum of the world as well as in Asia.

Life of Slum Occupants & Saving Pattern
6
It is found that poverty; crime, increasing population and dirtiness are increasing black spot on INDIA and especially on Mumbai. Dharavi slum faces a lot of problem like lack of drainages system, Sanitation, water facility, education, health care plan, etc. In Dharavi it is found that illegal activities are increasing like prostitution, drug trafficking, women crime, child labor and their abuse.
2 Orangi Town, Pakistan In Pakistan Orangi town is one of the oldest town which is expanded in northwest part of Karachi. As per 1998 census more than 7,20,000 population was found in Orangi Town. It is expected that it could possibly surpass Mumbai Dharavi slum and it is possible to become the largest slum in Asia. This slum is situated in 22 square miles and has population more than 720000, whereas Mumbai Dharavi slum is situated in 0.67 square miles with 6,00,000 – 10,00,000 population. This slum has highest possibility to become the number one slum of the world. This slum is found the case of worst law in order, every day you will find crime happening in this slum.
3 Kibera Slum, Nairobi, Africa It is that Kibera slum has emerged as the largest slum in Nairobi and Africa. As per 2009 Kenya census report this slum recorded 1,70,700 population. Most of the slum occupants of this slum are living in extreme poverty and has earning less than $ 1.00 per day. It is found that unemployment rate in this slum is found at high level. Because of extreme poverty most of occupants of this slum are unable to educate their child. This slum is facing from various factors like lace of water, sanitation, healthcare, poor law an order and employment opportunities, etc. Still in the 21st century people of this slum are dying from cholera. In this slum more than 50% of the slum occupants are alcoholic and alcohol in this slum found at cheaper cost. It is widely available, very strong in nature and made from incorrect method. Cheap drugs and glue sniffing are an increasing problem.
4 Rio De Janeiro, Brazil In Brazil slum is known by favela. The first slum appeared in the late 19th century and it was built by soldiers. This is the place were former slaves without having land ownership and lack of employment were settled in these slums. However in 1970 due to migration from rural in search of diverse income opportunity, modern slums were created. It is found that there are significant gap between rich and poor in this slum. Government Brazil has initiated various schemes to eradicate the slum. In this slum it is observed that crime rate is on higher side.
5 Kambwe, Zamia, Africa It is found that in Zambia, Kabwe is the second largest city and capital of the Zambian country. As per census 2010 census estimated population was 2,02,914. Politics of Zambia started from from this place. This area is rich from natural resources lead and Zinc. This city has large number of manufacturing plant.
6 Dzerzhinsk, Russia Dzerzhinsk is a special town which is known for “The Most Polluted City in the World”. With their high level of Chemical pollution this city was recorded in the Guinness Book of World Records as “The Most Polluted City in the World”. This city is located along with Oka River. As per 2010 Census report this city recorded 2,40,742 population whereas as per census report 2002 there was 2,61,334 population. According to Blacksmith institute study it was found that due to high level chemical pollution life expectancy has fall down to 42 years for Men and 47 years in case of women. Still Dzerzhinsk holds this auspicious honor, and with good reason. During the cold war this city was producing enormous quantities of chemical arms for the Soviet Union. With the fallen of Soviet Union now this city is no longer called as secret city for producing chemical arms. It is found that still several factories still produces toxic chemicals and people are bound to live in highly polluted area.
7 Magadishu, Somalia The slum of Mogadishu in Somalia has been shocked by years of Conflict, and hundreds of thousands of people have escaped the city. Slum of this regions are suffering from extreme poverty. Majority of the slum occupants are unable to arrange even two time of food and they are waiting for food from some organizations. Apart from extreme poverty line these slums are suffering from various issue like lace of Education, Sanitation, Sewerage and health facility. Etc.

Life of Slum Occupants & Saving Pattern
7
8 Linfen, China It is located along the banks of Fen River. This is located in the southwestern part of Shanxi province in China, this area is worst affected by pollution. Under this city there are around 3 million people living in this region.
9 Bassac Apartments, Cambodia The 300 meter long Bassac apartment was one of the architectural jewels of Cambodia; it was developed by the town planning director Lu Ban Hap as a initiative to build low cost housing in the early 1960s. Since 1979 25,00 refugees were settled in this apartment when its legal tenants left from this apartment because of poor condition of apartment.
10 Cubatao, Sao Paolo, Brazil As per study of popular science this area comes under the rank of top ten dirtiest cities in the world. This city is known for “Valley of Death”, because of birth of brainless children and respiratory, blood illness and hepatic. It was one the most polluted cities in the world.
1.4 OVERVIEW OF MAJOR SLUMS IN INDIA As per Rafiq Maqbool (2013), around 1/6 Slum occupants of Indian urban city are living under unsanitary conditions that are “Unfit for Human Habitation”.
1.4.1 Major Slums of India other than Dharavi: As per Siliconindia (2012), following are the biggest slum around the world-
1 Bhalswa Slum, Delhi Delhi is the heart of India. This slum is located on the bank of Yamuna River. Population of this slum is around 20% of the total population of Delhi. This slum has largest child labors. In this slum majority of the slum occupants are resettled from various part of the Delhi city. Increasing trends of crime leads to one of the most unsafe Indian city for women.
2 Nochikuppam Slum, Chennai Chennai is called “The city of flyovers”. Nochikuppam slum is located in Chennai city of Tamil Nadu and has the locality of 1300 huts and around 5 thousand occupants living under below poverty line. A slum occupant of this region does not have enough money to get two times meal a day. This area is poorly affected from various factors and this slum is lacking from almost all the basic necessity required for human being.
3 Basanti Slum, Kolkata Kolkata city is “the city of Joy”. Basanti Slum is one of the major slum in Kolkata. Around 1/3rd of the Kolkata population settled in this slum. Majority of this slum occupants are living below poverty line, and they are lacking from basic amenities.
4 Rajendra Nagar Slum, Bangalore Bangalore city is known for “The Garden City”. Out of 2000 slum in the state 570 slums are found in Bangalore city. It is found that 20% of the Bangalore population lives in slum.
5 Indiramma Nagar, Hyderabad Hyderabad city is known for “The City of Nizam”. Around 6,24,689 peoples are living in Hyderabad. In Hyderabad city both identified and unidentified slums are found, there are around 104 identified and 24 unidentified slums are found.
6 Saroj Nagar Slum, Nagpur In Nagpur city alone there are total 424 legal slums found. Saroj Nagar is one of the legal slums out of 424 slums. In Saroj Nagar around 1,42,000 peoples are living in this slum. This slum is developed on 1600 hectares of prime land. Due to scarcity of land in Maharashtra, this slum is in process of second largest slum after Dharavi in Mumbai.
7 Mehbullahpur Slum, Lucknow Lucknow is called “The City of Nawabs”. In this slum it is found that majority of the slum occupants are migrated from the various parts of nearest district for employment opportunities. Around 20,000 peoples

Life of Slum Occupants & Saving Pattern
8
are living in this slum. Majority of this slum occupant are poor and are daily wage earner. It is found that slum occupants of this area are facing shortage of basic amenities.
8 Satnami Nagar Slum, Bhopal Bhopal city is known for “The City of Lakes”. In Bhopal there are various slums are found in this city, Satnami Nagar is one of the oldest slum in Bhopal.
9 Parivartan Slum, Ahmadabad Majority of the slum occupants of this slum are migrated from various parts of the country for the diverse income opportunity. This city provides various employment opportunities to almost all the worker. In this city around 4,40,000 peoples are living in slum. This slum is the home for the large poor population expanded around the River banks. This slum is one of the oldest slum of India.
1.4.2 Causes for the creation and expansion of the slum There are various causes for the creation and expansion of the slum; some of the causes are as follows-
1 Rural-urban migration Migration to urban from rural is one of the major reasons for expansion and creation of slum. It is found that citizens normally migrate from rural in search of better job employment opportunities, improved education for their child and to enjoy better living standard. However most of the time migrated citizens are unable to get desired employment, which creates financial scarcity. On the other hand failure of government policy in providing affordable housing and their financial shortage forces them to settle down in only affordable slums.
2 Urbanization It is closely linked to the expansion and creation of slum. Rapid urbanization creates various investment and employment opportunities, which attracts people to the urban side. However as known poor infrastructure and scarcity of affordable housing and government failure in managing the large population this give rise to slum.
3 Poor Housing Planning Lack of budget home and poor planning encourage the expansion of slum. Majority of time government policy outcome are not favorable because of financial scarcity and lack of coordination in government system are the major reason for policy failure which gives rise to slum.
4 Colonialism and Segregation In today’s world some of the slums are the product of urbanization brought by colonization. For instance in nineteenth century Nairobi is the example of Colonialism, during nineteenth century European arrived in Kenya and created urban center to fulfill their financial interest. Similarly many slums were created on the basis of segregation by color. Lagos, Nigeria is the example of Segregation.
5 Poor Infrastructure, Social Exclusion and Economic Stagnation Informal Economy Poor families are unable to afford transportation cost and they prefer to work near their home place. Similarly in Economic stagnation situation people do not want to take risk and they settle themselves in slum.
6 Poverty Urban poverty is also the major factor for the development of Slum. With migration of rural poor people, poverty is also migrating to urban area. The poor people arrives with hope, he or she normally has no access to basic amenities. For them slums are only the options to settle themselves. Poverty is strongly correlated to slum formation.
7 Politics Many times because of political interest in the form of assured vote banks slums are not removed and they are continuously expanding. In French during 19th century political parties are significantly relied on the votes of slum population therefor they are engaged in managing them instead of upgrading to them to proper housing.

Life of Slum Occupants & Saving Pattern
9
8 Social Conflicts During civil war from 1975 to 1990 million of Lebanese citizens migrated from war zone to safe place and that ultimately converted into slum, likewise in recent period due to violence of Taliban’s many slums are formed around the Kabul.
9 Informal economy Development of Informal economy is also the causes for creation and expansion of slum around their. Since informal economy also creates employment opportunities to poor peoples like formal economy. Informal economy is that part of economy which is not registered with any government department and they are not following the rules like Excise, Income Tax, Service Tax and Sales Tax payment. Normally informal economies grow faster than formal economy since they are not required to pay any tax and they are able to easily stand in the competition.
10 Natural Disasters Peoples migrate to unaffected areas from affected areas due to major natural disaster in poor nations. Initially migrated people settle in temporary tent in cities which creates expansion of existing slum. With time passes these slums convert into permanent as these migrated peoples do not want to leave the current place. Slums near Port-au-Prince after the 2010 Haiti earthquakes and slums near Dhaka after 2007 Cyclone are the example of natural disaster.
1.4.3 Characteristics and quality of life in slums 1.4.3.1 Insecure Tenure Informality of land tenure is a key characteristic of urban slums. During growing phase, majority of time slums are established in least needed lands near the town or city without having clear title. In some cases local government or community allot land to people which later forms in to slum and that slum dwellers does not have property right. These various factors creates insecure problem in minds of slum dwellers.
1.4.3.2 Substandard housing and overcrowding Slums areas are characterized substandard housing structures. In slum most of the houses are built on ad hoc basis with unsuitable housing material. Almost all the slum houses are made without attention to proper design and structural engineering requirements.
Overcrowding is the major factor in almost all the slums. Five or more persons may share a single room unit, the same room is used for cooking, sleeping, and living. Overcrowding is also found at sanitation where one toilet may serve dozens of families and near drinking water.
1.4.3.3 Inadequate or no infrastructure Inadequate public infrastructure is found in most of the slums. In slum you will find various shortages of public infrastructure, some of the example are – electricity, safe drinking water, basic health care, affordable public transport, rods, drainage and sanitation.
1.4.4 Risk 1.4.4.1 Disease Slum peoples are living in unhygienic condition which invites various diseases. In slum commonly found disease includes cholera, dengue, typhoid, malaria, measles, HIV/AIDS, drug resistant tuberculosis and epidemics. Diarrhea and cholera found common in slum children.
1.4.4.2 Unemployment and informal economy Slum dwellers are facing high rate of unemployment due to lack of education and required skill. Limitation of job opportunities diverts many of them to informal economy, inside the slum or in developed urban areas near the slum.
1.4.4.3 Child Malnutrition In slum child malnutrition is more common than in non-slum. According to WHO standards these all children suffer from third degree malnutrition. The major nutritional problems found in slum are protein energy malnutrition (PEM), vitamin A deficiency (VAD), iron deficiency anemia (IDA) and iodine deficiency disorders (IDD). Malnutrition in slum sometimes leads to death among children.

Life of Slum Occupants & Saving Pattern
10
1.5 BRIEF PROFILE OF MIRA BHAYANDER CITY Mira-Bhayander city is located in the Thane district with an area 79.40 Sq. km. in the Maharashtra state. This city is located in the north Mumbai on Mumbai-Ahmadabad express highway. It extends between 18°42,N to 20°20, N latitude and 0°25,E to 73°44 E. This city is continuously developed into an important residential locality due to its nearness to Mumbai and lower cost of living as compare to Mumbai. Earlier Bhayander city was administered by the Gram Panchyat system of local government. Mira-Bhayander Municipal Corporation was formed on 12th June, 1985 with merger of 5 Grampanchyats naming Bhayander, Mira, Kashi, Navghar, and Ghoudbunder. During 1990 additional 4 Grampanchayats naming Chena, Varsova, Rai – Murdhe, Dongri – Uttan included in the Mira-Bhayander Municipal Corporation. Since it is formed from 9 Grampanchayat, therefore this corporation has 9 stars on it.
1.5.1 Climate Condition The climate of Mira-Bhayander is naturally coastal, sultry and not really hot. There are normally two different seasons, namely summer and monsoon season.
Table no 1.5.1 (a) Climatic Condition Sr. No. SEASON MAX TEMP°C MIN TEMP°C
1 SUMMER 34.57 32.37 2 WINTER 20.50 17.6
1.5.2 Rainfall The rainy season starts in the month of June beginning and it ends in the month September last week. 2400 mm is the annual mean rainfall and in the month of July maximum rainfall found.
1.5.3 Humidity Highest humidity is found in the month of July and the average range of humidity is from 49% to 87%.
1.5.4 Distribution of Population As per 2011 census 8,14,655 population recorded in Mira-Bhayander city. The total male population is 434330 and Female population is 3,80,325 out of total 8,14,655 population.
Table no 1.5.4 (b) Distribution of Population Sr. No. PARTICULARS POPULATION POPULATION %
1 MALE POPULATION 4,34,330 53.31 2 FEMALE POPULATION 3,80,325 46.69
1.5.5 Land use Pattern As per Government of Maharashtra (2011), Mira-Bhayander Municipal Corporation is spread in 79.40 Sq. km.
Table no. 1.5.5 (c) Land use Pattern Existing Land Uses Area (Hectare) % with developed
area % with MPL area
Residential area 282.82 47.12 3.56 Commercial area 5.33 0.89 0.07
Public & semi public 12.00 2.00 0.15 Industrial area 126.51 21.08 1.59
Transportation & communication
156.90 26.14 1.98
Public utility 1.10 0.18 0.01 Organized open space 13.52 2.25 0.17
Cremation & burial ground 2.03 0.34 0.03 Total developed area 600.24 100.00 7.65
Agriculture 144.29 - 1.82 Horticulture 9.00 - 0.11
Urban vacant land 4440.97 - 55.93

Life of Slum Occupants & Saving Pattern
11
Salt Pan Marshy lands 1394.33 - 17.86 Forest & hilly area 1294.41 - 16.30
Water bodies 57.32 - 0.72 Total developed area 7340 - 92.44 Total municipal area 7940.56 - 100.00
1.5.6 Salt Pans in MBMC In Mira-Bhayander there are several salt pans found comprising of 1394.33 hectare of Land. Salts are produced from sea water, in Mira-Bhayander almost all the salt pans are made by man.
1.5.7 Literacy Rate As per Government of Maharashtra (2011), average 93.67% of the Mira-Bhayander city populations are literate, which is higher than the average national literacy.
Table no. 1.5.7 (d) Literacy Level Sr. NO. Particular Literacy Rate %
1 Male 96.41 2 Female 90.53 Average 93.67
1.5.8 Industrial Area 1.59% of the Mira-Bhayander city is Industrial area. In Mira-Bhayander city as per latest Mira Bhayander Municipal Corporation records there are around 383 industrial estates with around 5,000 industrial galas are found in this area. There are around 20,000 workers are working in these industrial area.
1.5.9 Transportation Western Railway line is the main transportation means for the citizen of this city to travel from Churchgate to Virar. To facilitate Bhayander citizens there is separate train from Bhayander to Borivali, Andheri, Churchgate and Virar. There is four track line from Virar to Churchgate and many new train started by Western Railway.
Apart from Railway transportation this city has Bus services provided by Mira-Bhayander Municipal Corporation, State Transport and Thane Municipal Corporation.
1.5.10 Health & Medical Facilities This city has both private and municipal health care center, there are around 2026 number of vaccination programs conducted per month. 24hrs of Ambulance and Mobile clinic service are made available for citizens.
1.5.11 Fire Brigade & Emergency Service Centre Mira-Bhayander Fire brigade and emergency service center are working 24hrs for the citizens of this city. The department is always working to avoid death during accidents and natural calamities.
1.5.12 Education Facilities Education is the basic and necessary for each and every individual. Education not only enables goods culture but also help in overall substance of the individual in this competitive world. Most renowned institutes in the Mira-Bhayander city are Bhayander Secondary school, Holy cross convent school, Our Lady, N L Dalmia, Royal College, S N College, etc.
There are total 34 primary Municipal Schools, 20 private granted schools, 9 primary non-granted and 150 primary non granted schools in this city.
1.5.13 Tourism Mira-Bhayander is a historical city, Ghodbunder fort is notified in the Gazette of the archeological survey of India. The Daravi fort was also established in the Maratha era by Chimaji Appain 1663, to protect the Basin fort. Bhayander fort was established by Peshwas.

Life of Slum Occupants & Saving Pattern
12
1.6. SCHEMES OF VARIOUS AGENCIES 1.6.1 Government scheme Programs and Policies implemented by Ministry of Housing and Urban Poverty Alleviation of India The Ministry of Housing and Urban Poverty Alleviation has started various programs in the country to address the concern of Housing, Infrastructure, Slum development and basic civic amenities with special emphasis to urban poor. Various programs implemented by the Ministry of HUPA are one way or other for the benefit of urban poor with special emphasis to slum dwellers. Some of the Major Programs of this Ministry are:
1 Jawaharlal Nehru National Urban Renewal Mission: Basic Services to the Urban Poor (BSUP) & Integrated Housing & Slum Development Programme (IHSDP) The Jawaharlal Nehru National Urban Renewal Mission (JNNURM) was launched on 3rd December, 2005. The Mission comprises two Sub-Missions – one for Basic Services to the Urban Poor (BSUP) and other Integrated Housing and Slum Development Programme (IHSDP).
2 Swarna Jayanti Shahari Rozgar Yojana (SJSRY) It was introduced by the Government of India on 01.12.1997. With a vision to provide productive employment to the urban jobless people and underemployed people through encouraging setting up of new self-employment ventures or provision of wage employment.
3 Affordable Housing In Partnership (AHIP) Affordable Housing Partnership was approved and implemented for the period of 2013 to 2022 as part of Rajiv Awas Yojana. This policy was implemented with the following objective:-
1 Institutionalizing mechanism for prevention of slums including creation of affordable housing stock.
2 Address the Housing shortage through Public Private Partnership.
3 Provide necessary fillip to the activities of the housing boards and Development Authorities and
4 Encourage State Government/ Union Territories to provide incentive to facilitate accelerated creation of affordable housing stock.
4 Interest Subsidy Scheme for Housing the Urban Poor (ISHUP) Providing Affordable home to all the citizens is the major object of the government of India. With this object government of India formed this scheme. This scheme provides home loan with central government subsidy to EWS and LIG people for home purchase and for construction purpose. This scheme will be applicable to those families who don’t have home. To support in acquiring and for construction purpose this scheme provides loan up to 100000/- for EWS people for the duration of up to 20 years.
5 Urban Statistics for HR and Assessment (USHA) Urban Statistics for Human Resource and Assessments (USHA) was implemented by the Ministry of Housing and Urban Poverty Alleviation with the object to support Ministry of Housing & Urban Poverty Alleviation and other Ministries with an information base and knowledge inputs for the purpose of planning, policy-making, project design, formulation, implementation, monitoring and evaluation, particularly in the context of programs relating to urban poverty, slums and housing.
6 Integrated Low Cost Sanitation Schemes (ILCS) Since 1980, the Government of India has implemented the Integrated Low Cost Sanitation Scheme. Further the Scheme was revised with effect from January 2008, envisages conversion of dry latrines into low cost twin pit pour flush latrines and creation of new latrine to those citizens who are financially poor and those households who does not have latrines facility inside the home. Under the scheme the pattern of assistance is 75% Central Subsidy, 15% State Subsidy and 10% beneficiary share. This scheme is directly implemented by Ministry of Housing & Urban Poverty Alleviation directly for Economically Weaker Section (EWS) family..
7 Rajiv Awas Yojana (RAY): Vision of Slum Free India Urban Poverty and Slums are emerging as critical issues of public policy. The conditions of poor living in urban slum are relatively worse than people living in rural. Realizing the importance of development

Life of Slum Occupants & Saving Pattern
13
and Up-gradation of slum with basic required amenities, in 2009 the president of India announced Rajiv Awas Yojana with the aim of slum-free Urban India. This scheme gives right to the states that are willing to provide property ownership right to slum occupants. This scheme covers all slums including recognized and non-recognized slum with a mission to provide them all basic amenities available to the other citizens of urban. This scheme also focuses on failure of formal system for creation and expansion of slum. This scheme implemented in a mission mode to provide financial support to States/Union Territories/Urban local bodies/Central government agencies.
1.6.2 NGO Scheme NGO have been continuously working day-in and day-out to solve the problem regarding women, children, senior citizens, environment, etc. Here are various NGOs who have truly worked in the best possible manner.
1 Sammaan Foundation It was established on 25th January, 2007 with object to raise living standard by providing education, training and monetary support. At the moment this organization is more focusing on Rickshaw-pulling class of people by providing opportunities to earn for their livelihoods. This organization is continuously working for women empowerment, health services, providing employment opportunities, education to children and micro credit.
2 Goonj This foundation was established with the mission to solve clothing problems. This foundation was awarded with NGO awards in 2007. Various initiatives taken by Goonj are as follows-
Vastra Samman: This organization believes that cloth problem of poor can be solved by providing old cloth.
Rahat Floods: this organization conducts annually flood program. It collects flood relief materials from the society and distributes them to the flood affected peoples of West Bengal, Assam and Bihar.
Rahat Winters: this organization also works on to provide winter clothing to the poor people.
3 Akshaya Trust The mission of Akshaya trust is to provide support to the mentally ill, old, sick, helpless, forsaken and the road side poor who live in Madurai. This NGO provides rehabilitation opportunities, healthy food and providing them love and affection. Their sole aim is to restore human dignity.
4 Smile Foundation India This trust is formed in 2002 with an object to provide healthcare and education services to the needy people. This foundation provide welfare services on national level and benefiting directly to more than three lakh children and their family annually by 158 national level welfare project for education, healthcare, livelihood and women empowerment across 25 states in more than 700 remote villages of India.
5 Udaan Welfare Foundation Udaan welfare foundation was formed on 16th March 2008 as non-profit organization. This foundation was founded with mission to provide timely and meaningful support to the needy children, women and senior citizens by effectively implementing projects in the area of nutrition, education and healthcare.
6 Pratham Pratham is one of the largest NGO and provides welfare service on national level. This foundation was formed in 1995 to provide education to Mumbai slum children. At present this foundation has provided education to more than 4.7 million children’s across the nation. This foundation was formed with the support of UNICEF, Government of Maharashtra and civil society.
7 Dream Girl Foundation It was established in 2003. This NGO is dedicated to work for the overall improvement of girls including education, income generation, health, AIDS awareness and other major issue. This organization helps to the underprivileged girl children so that they can become capable to compete and come at-par with fast growing community.

Life of Slum Occupants & Saving Pattern
14
8 Tarang Tarang is a Mumbai based NGO education slum occupants. This organization offers innovative schools with a desire to create a meaningful impact on lives of children. Tarang educates children by understanding their self-worth in such a way that their education helps them in stable career.
9 Slum Rehabilitation Society (SRS) This is well known NGO founded by Adolf Tragler in 1972-73. This NGO is especially dedicated to serve Slum Dwellers for improving their lives and securing permanent homes for each family. This NGO provides Slum Rehabilitation Projects, Welfare Activity and provides various Consultancies to improve the quality of the slum dwellers. During the 40 years of its existence, SRS has moved more than 7000 families from slum to private apartment.
DIAGRAM 1.6.2.9 (1)
1.7. STATEMENT OF PROBLEMS The statement of problem was the outcome of the researcher’s understanding based on personal experience and observations. Available literature and discussions with people concerned with the issue has also helped to shape this statement. Important points related to the problem is as follows – 1. Most of the slum dwellers are either illiterate or have secured only secondary education. As a result
majority person’s nature of employment is temporary and earnings are very low. Thus they are forced to do some other work in their free time, sacrificing their leisure.
2. Being residents of Mira-Bhayander, where Cost of Living Index is very high, slum households find it difficult to meet their day to day family needs with their meager earnings. Therefore these people are under tremendous mental stress which affects their family life.
3. Housing prices even of slum areas are so high that it takes a whole lifetime savings to buy a small house. Housing rent is also unduly high that a large portion of household earning goes in rent, which naturally affects their living standard and also their savings capacity.
4. Male members, most of the time those who are considered as ‘head of the household’ are habitual to heavy liquor consumption on daily basis which puts further burden on household earnings and affect their savings.
5. Majority households are so overburdened by their problems associated with earnings and meeting day to day basic family needs that they tend to ignore various issues related to their children like – health of the children, their daily diet, quality of education, type of recreation, investment for their future education etc.

Life of Slum Occupants & Saving Pattern
15
1.8. OBJECTIVES OF THE SYUDY Within the said limitations of time, resources, efforts and geographical area, objectives of the study is framed with the vision of contributing to the improvement in the system. Deciding these objectives has also helped to give a proper direction to the study.
Objectives of the study are as follows 1) To study socio-economic characteristics of slum dwellers and public policy of India.
2) To discover different sources of income of the households in the study area.
3) To analyze the factors which influence the saving behavior of the slum households?
4) To examine person’s awareness about available savings options.
5) To analyze the role played by organized and unorganized financial institutions in the growth of slum household savings.
6) To study the factors affecting quality of life in slums.
7) To know the happiness level of slum dweller in the sample area.
1.9. HYPOTHESES OF THE STUDY Hypotheses are the assumptions to be examined through the study. Literature survey, personal experience and discussions with the experts has helped to develop these hypotheses. This hypothesis has helped to give a direction to the study that has ensured the efficient utilization of efforts and time.
The Hypotheses of the study area is as mentioned below:
1 Hypothesis about contribution towards family income by head of family i. Null hypothesis: there is no significant difference between contribution towards family income by the
head of the slum households and other members of family.
ii. Alternative hypothesis: The head of the family in slum households are contributing significantly more to the family income than the other members of family.
2 Hypothesis on organized and unorganized saving i. Null hypothesis: There is no significant difference between organized sectors household savings and
unorganized sectors household savings.
ii. Alternative hypothesis: organized sectors household savings are less than unorganized sectors household savings.
3 Hypothesis on happiness level i. Null hypothesis: Slum occupants are significantly unhappy in the present condition.
ii. Alternative hypothesis: Slum occupants are significantly happy in the present condition.
4 Hypothesis on basis of decision on saving Saving options are significantly selected on the basis of convenience without doing much research on saving options available.
1.10. IMPORTANCE AND UTILITY OF THE STUDY As per D. Muraleedharan (2003), saving mobilization and capital formation are the infrastructure in which the foundation stone of every economy exists. Over the past four decades, since the post-independence years, household savings occupied a major part within domestic savings. As per planning commission, Ratio of Gross Domestic Savings to GDP (percent at current market price) was 30.09 in 2012-13 and ratio of Household sector savings alone was 21.86. Debt and investments surveys in India have shown that weaker sections of the society have higher saving rates than would have been expected on the basis of their income. This trend suggests that the vulnerable save largely for precautionary reasons. As per planning commission, Small savings table in FINMIN Report, the growth rate of small saving in 2010-11(RE) was 8.2 percentages. However, in comparison with China and many other Asian countries, India is still lagging behind even in terms of growth in savings. So it becomes essential to adopt policies which will give further boost to small savings.

Life of Slum Occupants & Saving Pattern
16
Considering these points, the study has been undertaken on “Life of Slum Occupants & Saving Pattern”, since Mira-Bhayander is a suburb of Thane, located to the north of Mumbai and administered by Mira-Bhayandar Municipal Corporation (MBMC). As per Economic survey Maharashtra (2011-12) Maharashtra alone contribute 9.3% (11.24 crore) of the total population of India (121.02 crore).
Since no study found in these areas relating to life of slum occupants & saving pattern from last 10 years, this study is of a great help to formal financial institutions, local leaders and social workers in numerous ways. Some of the utilities of this study are as follows: 1. The study will generate the awareness of economic vulnerability of slum dwellers.
2. The study will throw light on the circumstances faced by low income earning families which force them to make their children work.
3. The study will give insight into the extent to which slum dwellers are aware about various small saving schemes made available by formal financial institutions.
4. Knowledgze of the level and composition of income and savings, the determinants of savings and savings preferences will enable the policy makers and financial institutions to frame suitable strategies for further enhancement in small savings.
1.11. RESEARCH DESIGN AND METHODOLOGY The research design is the conceptual structure within which the research is conducted. It constitutes the collection, measurement and analysis of the data.
The research design is a very important step to ensure the objectivity, efficiency and the economy of the precious resources employed in the research .The research design for this study was divided in to four parts-
1.11.1. Scope of the study area A study of this size cannot be expected to cover the whole slum population. Looking at the need of in-depth study to bring out important conclusions which could act as a guiding force to policy makers, financial institutions and social workers, the researcher has purposively selected 40% slum area (Fourteen Slums) out of 35 slums of the universe area. Further researcher has purposively selected 10 slum areas which are situated on government land and remaining 4 slums selected which are situated on private land for the study. In order to get the first hand information researcher has purposively taken the response of 549 respondents from all the 14 sample of the study.
1.11.2. Sources of the data Looking at the need of the study, primary and secondary data are collected.
1.11.2.1. Primary data: To collect the primary data, two simple questionnaires have been prepared. One questionnaire is prepared to find out socio-economic conditions of slum dwellers. Another questionnaire is used to find out details of saving behavior. Overall questionnaire is based upon the earlier research studied in the relevant subject and additional information required. Along with these questionnaires, interviews with private and public sector bank’s local branch managers, local chit fund managers are conducted to get the primary information.
1.11.2.2. Secondary data: Secondary data such as total number of households, total slum population, number of schools, water connections etc. has been gathered from the following sources Mira Bhayandar Municipal Corporation’s and also from voter’s list prepared and maintained by local political parties.
Reserve Bank of India’s web site, reference books, periodicals, etc.
1.11.3. Sample Design: 1.11.3.1. Universe: Mira-Bhayandar is a suburb of Thane, located to the north of Mumbai and administered by Mira-Bhayandar Municipal Corporation (MBMC). Total area under Mira Bhayandar Municipal Corporation is 79 Sq. K.M. with 8,14,655 population as per 2011 India census record and the City is spread along Chena, Kajupada to Uttan Junction, Dahisar Check Naka Penkar Pada to Bhainder East Jesal Park, R N P Park.

Life of Slum Occupants & Saving Pattern
17
Under MBMC there are total 35 Slum, 20 slums are located on Government Land remaining 15 Slums are located on private land. Fourteen slums are selected as the universe of the study. For the survey, individual household is selected as the sampling unit.
Table No: 1.11.3.1. (a) List of Slums under Mira-Bhayander Municipal Corporation, Slum under Mira-Bhayander Municipal Corporation,
as per 2001 Census Sr. No.
Area Name Ownership Slum House
Population
1 Indira Nagar, Navghar Bhayander (East) Government 668 1996
2 Dr. Ambedkar Nagar, Bhayander (East) Government 1622 4812 3 Anna Nagar, Bhayander (East) Government 78 220 4 Sena Nagar , Goddev Government 40 252 5 Sainath Sevanagar Ghodbunder Government 181 704 6 Kashi Church Slum Government 283 349 7 Kashimira Slum (Dongri) Government 1590 3717 8 Bhraham Dev, Morva Government 101 165 9 Morva Bhaat Government 83 225
10 Shivneri Nagar, Rai Government 359 1899 11 Murdhakhadi Government 597 269 12 Sadanand Nagar, Murdha Government 678 2872 13 Indira Nagar Devtalav (Bhatebunder) Government 93 356 14 Lalbahadur Shatrinagar, Uttan Government 248 648 15 Moti Nagar, Bhayander (East) Government 143 429 16 Jay Ambe Nagar 1-2 Government 939 2600 17 Ganesh Deval Nagar, Bhayander (East) Government 2285 4602 18 Indira Nagar Kothar, Bhayander (East) Personal 213 852 19 Harishchandra Nagar, Bhayander (West) Personal 97 291 20 Saibaba Nagar, Bhayander (East) Personal 38 87 21 Hanuman Nagar, Bhayander (East) Personal 61 126 22 Magla Bunder (Jay Bajrang) Bhayander (East) Personal 90 222 23 Om Shiv Saibaba Nagar Bhayander (East) Personal 48 120 24 Kajupada Personal 89 267 25 Chena Velnkani Pada Personal 74 222 26 Chena Patil Pada Personal 43 129 27 Daachkul Pada Personal 62 156 28 Mashacha Pada Personal 52 195 29 Kashivibhag, Kashigaon Personal 35 420 30 Modern Company, Slums Personal 279 459 31 Penkar Pada Personal 400 1572 32 Lalbahadur Shatrinagar, Bhayander (East) Government 585 2460 33 Nehrunagar, Bhayander (East) Government 497 1491 34 Naajreth Aagar Government 53 162 35 Bandarwadi Railway Dept. 128 369
Total 12832 35715

Life of Slum Occupants & Saving Pattern
18
1.11.3.2 Overview of Sample Area: The researcher has purposively selected 40% slum area (Fourteen Slums) out of 35 slums of the universe area. Further researcher has purposively selected 10 slum areas which are situated on government land and remaining 4 slums selected which are situated on private land for the study.
DIAGRAM: 1.11.3.2 (1) Slums under Mira-Bhayander Municipal Corporation
In order to get the first hand information researcher has purposively taken the response of the minimum fifty respondents from all the 14 sample of the study. It is also the slum most nearby to the researcher. As a result continuous observation of the sample area is possible. Although the questionnaire technique is used to collect the primary data, still a regular and minute observation of the sample area is required to understand various issues like what factors influence savings of the people, is job, the only source of their income, why even children have to earn etc. The sample area, if it is more familiar to the researcher, enables the researcher to understand the circumstances and the environment that the particular slum inhabitants face so that various small aspects affecting socio-economic behavior of slum population will also be covered to fulfill all objectives of the study.
Table No. 1.11.3.2 (a) List of Selected Sample area Sample Name
Sr. No. Slum Name Ownership 1 Adarsh Indira Nagar, Navghar Bhayander (East) Government 2 Dr. Ambedkar Nagar, Bhayander (West) Government 3 Ganesh Deval Nagar, Bhyander West Government 4 Kashimira Jopadpatti (Dongri) Government 5 Jay Ambe Nagar 1-2 Government 6 Bhraham Dev, Morva Government 7 Moti Nagar, Bhayander (West) Government 8 Shivneri Nagar, Rai Government 9 Sadanand Nagar, Murdha Government
10 Anna Nagar, Bhayander West Government 11 Daachkul Pada Personal 12 Mashacha pada Personal

Life of Slum Occupants & Saving Pattern
19
13 Kashivibhag, Kashigaon Personal 14 Indira Nagar Kothar, Bhayander (East) Personal
1 Adarsh Indira Nagar is the sample area which is one of the biggest and oldest slums situated in Bhayander (East) near to S.N. College. Adarsh Indira Nagar is located at Latitude: 19°18'32.44" N and Longitude: 72°51'59.95" E, has around 1200 slum house and around 5000 population. It is one of the oldest slums in Mira Bhayander Municipal Corporation. In 1980’s Adarsh Indira Nagar was just a small bunch of huts surrounded by forest and hills. Now the jungle has been converted into a closely packed small houses made up of cement with tiled or cement sheets as roofs with literally no ventilation and air circulation. Most of the settlements here were originally illegal which were made legal by MBMC later on. Slum inhabitants are basically unemployed people from rural areas of Maharashtra, Gujarat and U.P. who got established here either as industrial workers or got other types of low income jobs like that of as a driver, watchman, Construction labor, Carpenter, their own business, etc. Many of the families here claim to be residing since 1980’s.
Adarsh Indira Nagar has 15 chawls namely Eakta Nagar, Ganesh Gali, Sai Chawl, etc. It does not have tall buildings, but a long array of chawls, with common sanitation and common municipal water facility with just a three-four feet of space between two rows of houses, where bicycle or bike is the only vehicle which will go on the cement pathway made between two rows of chawls, only mode of immediate transportation possible in case of emergency.
This slum has got locational advantage. It is surrounded by a large number of residential complexes and Industrial area like Vaibhav Nagar, Salasar Nagar, Shirdi Nagar and many Small Scale industries. which provides various sources of earning to slums inhabitants. This area is very close to S.N. College of Junior and Commerce College. This area has one municipal garden, its own market and state transport bus facility. This area lacks from sufficient sanitation facility and even people are bound to use open space in absence of sufficient sanitation.
Majority that is around 85% of inhabitants are Hindus, 10% are Muslims and only 5% are others. There are two Hindu temples and one Mosque. The surrounding area has two private, three nationalized and one co-operative bank. However the slum itself has 2 chit funds, 3-4 co-operative credit societies and 2-3 main jewelry shops that run private gold-funds. All these institutions are private and unregistered and thus become a part of unorganized financial sector.
2 Dr. Ambedkar Nagar, Bhyander (West) is the sample area which is one of the biggest and oldest slums situated at Bhayander (West) towards uttan road. Dr. Ambedkar Nagar is located at Latitude: 19°17'48.12" N and Longitude: 72°50'29.13" E, has more than 2500 slum houses with population around 8500 in this slum. It is one of the oldest slums in Mira-Bhayander Municipal Corporation. In 1950’s Dr. Ambedkar Nagar was just a small bunch of huts surrounded by forest. Now the jungle has been converted into a big ocean of closely packed small houses made up of cement with tiled or cement sheets as roofs with literally no ventilation and air circulation. Slum inhabitants are basically unemployed people from rural areas of Maharashtra, Gujarat, U.P. and from various places of south Indian part who got established here either as industrial workers or got other types of low income jobs like that of as a driver, watchman etc. Many of the families here claim to be residing since 1950’s.
Dr. Ambedkar Nagar is divided in 25 chawls with numeric number for identification of chawls. It does not have tall buildings, but a long array of chawls, with common sanitation and common municipal water facility with just a three-four feet of space between two rows of houses, where bicycle or bike is the only vehicle which will go on the cement pathway made between two rows of chawls, only mode of immediate transportation possible in case of emergency.
This slum has got one locational advantage. It is surrounded by a large number of residential complexes, shopping complex and Industrial area like Burhani Nagar, Chandmal Nagar, Padmavati Nagar, Maxus Mall and Maxus Cinema. This provides various sources of earning to slums inhabitants. This area has one municipal and two private schools, its own market and state transport bus facility. This area lacks from sufficient sanitation facility, present sanitation condition is very poor.

Life of Slum Occupants & Saving Pattern
20
Majority of the slum houses, that is around 75% of inhabitants are Hindus, 15% are Muslims, 5% are Christians and 5% are others. There are three Hindu temples and one Mosque. Within two kilometer distance this area has two private, three nationalized and one co-operative bank. However the slum itself has 2 chit funds, 3-4 co-operative credit societies and 5-6 main jewelry shops that run private gold-funds. All these institutions are private and unregistered and thus become a part of unorganized financial sector.
3 Ganesh Deval Nagar, Bhyander West is the sample area which is the biggest and youngest slum situated in Bhayander west is located at Latitude: 19°18'25.47" N and Longitude: 72°50'41.30" E, it has more than 4500 slum houses and population around 22000. As per census 2001 there were only 2285 slum houses and 4602 population in this slum. As per researchers observation this slum record highest level of population with highest degree of increase in household and population. This slum is situated in Bhayander west towards open area of Bhayander khadi, where highest chances for its development. In 1990’s Ganesh Deval Nagar was just a small bunch of huts surrounded by forest. Now the jungle has been converted into a big ocean of closely packed small houses made up of cement with tiled or cement sheets as roofs with literally no ventilation. Most of the settlements here were originally illegal which were made legal by MBMC later on. Still on yearly basis continuous illegal constructions are made. Slum inhabitants are basically unemployed peoples from rural areas of U.P. and small portion of Nepali, Researcher found that 90% of the migrated are from U.P., who got established here either as industrial workers, own business or got other types of low income jobs like that of as a construction labor, driver, watchman, sweeper, etc.
Ganesh Deval Nagar does not have tall buildings, but a long area of chwals, with majority of people using common sanitation and common municipal water facility with just a three feet space between two rows of houses, where bicycle or bike can be used as immediate mode of transportation during emergency. Researcher found that around 30% of the houses are kucha and they don’t have basic necessities items in their home.
This slum has got one locational advantage. It is surrounded by a large number of residential complexes and industrial area which provide various sources of earning to slum inhabitants. The area has one municipal hospital and around 25-30 private dispensaries, one private schools, its own market, and Majority that is around 90% of inhabitants are Hindus, 5% are Muslims, 2% are Nepali and only 3% are others. There are 5 Hindu temples and one Mosque. The surrounding area has three private, two nationalized and one co-operative bank. However the slum itself has at least 10-12 chit funds, 4-5 co-operative credit societies and 4-5 main jewelry shops that run private gold-funds. All these institutions are private and unregistered and thus become a part of unorganized financial sector.
4 Kashimira Jopadpatti (Dongri) is the sample area which is one of the biggest and oldest slums situated at Mira Road (East). Kashimira is located at Latitude: 19°16'21.03" N and Longitude: 72°53'04.13" E, it has more than 2000 slum houses and around 4900 population. It is one of the oldest slums in Mira-Bhayander Municipal Corporation. In 1980’s Kashimira dongri was just a small bunch of huts surrounded by forest and hills. Now the jungle has been converted into a big ocean of closely packed small houses made up of cement with tiled or cement sheets as roofs with literally no ventilation and air circulation. Slum inhabitants are basically unemployed people from rural areas of Maharashtra, Gujarat, Rajasthan, M.P. and U.P. who got established here either as industrial workers, own business or got other types of low income jobs like that of as a construction worker, carpenter plumber, driver, watchman etc. Many of the families here claim to be residing since 1980’s.
Kashimira dongri is divided in 20 chawls with numeric number for identification of chawls. It is developed on the entire hills behind kashimira police station. This slum has got one locational advantages it is near to the western express highway and developing area which provides various employment opportunities to the slum occupant. This area has three private school, three Hindu temples, one mosque, one bank with ATM facilities, one credit co-op society, one computer classes, four jewelry shops, state transport bus facilities and around 6-7 private dispensary. Majority that is around 85% of inhabitants are Hindus, 12% are Muslims and only 3% are Christians. Majority of migrates are from U.P. and Bihar.

Life of Slum Occupants & Saving Pattern
21
5 Jay Ambe Nagar 1-2 is one of the oldest and biggest slums situated in Bhayandar west outside the main city and near to Bhayander station is located at Latitude: 19°18'56.06" N and Longitude: 72°50'59.73" E, it has more than 1500 slum houses and around 4200 population. This slum is divided in two parts Jay Ambe Nagar 1 and 2. Majorities of the households are migrated from Maharashtra, U.P., and Bihar. Large population of the Jay Ambe Nagar 1 is dependent on fishing business and relatively poor than Jay Ambe Nagar 2. This area has one big fish market in between two areas, one government Park, three temples, five private dispensary and around 80% of the houses are made from Pucca construction.
6 Bhraham Dev Nagar, Morva is the sample area which is one of the oldest Slums situated in Bhayander west towards uttan road is located at Latitude: 19°17'55.24" N and Longitude: 72°50'09.23" E, it has more than 175 slum houses and around 335 population, during 1990 Bhraham Dev Nagar included under Mira Bhayander Municipal Corporationprior, earlier to this it was comes under comes under Rai-Murdhe Grampanchyat.
This slum is more than 60 years old and this area is from least migrated people. This area belongs to Agri Maratha and majority of the occupants are Hindu. This area has one private dispensary, one medical, its own market and municipal water. This area lacks from sufficient sanitation facilities.
7 Shivneri Nagar, Rai is the sample are which is one of the oldest and largest Slums situated in Bhayander west towards uttan road is located at Latitude: 19°17'46.24" N and Longitude: 72°49'05.06" E, it has more than 800 slum houses and around 4500 population. During 1990’s Shivneri Nagar was also included in Mira Bhayandar Municipal Corporation.
This slum is more than 60 years old and divided in 30 chawls by numeric number from 1–30. This area is also least affected by migrated people. This area belongs to Agri Maratha and majority of the occupants are Hindu. This area has one private dispensary, one medical, its own market and municipal water. This area lacks from sufficient sanitation facilities. From this slum only 25 peoples are going to Mumbai for employment rest all are working in local area and Bhayandar Industrial area.
8 Sadanand Nagar, Murdha Rai is the sample are which is one of the oldest and largest Slums situated in Bhayander west towards uttan road is located at Latitude: 19°18'00.66" N and Longitude: 72°49'41.70" E, it has more than 1115 slum houses and around 4800 population. During 1990’s Shivneri Nagar was also included in Mira Bhayandar Municipal Corporation.
This slum is more than 60 years old and this slum is divided in chawls by chawl number. This area is also least affected by migrated people. This area belongs to Agri Maratha and 99% of the population is Hindu. This area has four private dispensaries, two medical, its own market and municipal water. This area is also lacking from sufficient sanitation facilities
Satisfaction level of the above three slum is higher as compare to slum which is close to city like Adarsh Indira Nagar and Dr. Ambedkar Nagar..
9 Moti Nagar, Bhayander (East) is the sample area which is one of the oldest slum situated in Bhayandar west is located at Latitude: 19°18'07.44" N and Longitude: 72°50'46.43" E, it has 150 slum houses and around 500 population. This area belongs to Jain society. It has one Jain Temple, one Shiva Temple, one private school for up to 10th standard near to this slum; most of the people in this society are vegetarian. This slum is surrounded by Godavari Industrial Area which has 300 different Small Scale Industries which provides employment to the various calls of the people.
This slum is divided in 10 chawls, and chawl has alphabetic identity from A to J. This slum is within the city and slums occupants can enjoy all the facility of city. Income level of this slum is at satisfactory level and most of this slum occupant is running their own business.
10 Anna Nagar, Bhayander West is the sample area which is one of the oldest slum and having less population as compare to other big slums it is situated in Bhayandar west behind Axis Bank is located at Latitude: 19°18'12.7" N and Longitude: 72°50'59.1" E, it has only 80 slum houses and around 315 population. This area belongs to South Indian community. This slum has only one chawl of 1000 square foot. Within this slum it has one Temple which is also used for Anganwadi. This slum is within the city

Life of Slum Occupants & Saving Pattern
22
and the occupants of this slum can access all the city facilities. Income level of this slum occupants are above the poverty line and at satisfactory level.
11 Indira Nagar Kothar, Bhayander (East) is the sample area which is one the most oldest slums situated in Bhayander west on 60 feet road is located at Latitude: 19°18'04.01" N and Longitude: 72°51'07.77" E, it has 225 slum houses and around 910 population. This slum has around 60% Maratha community. 95% of this slum is Hindus, 3% is Muslim and only 2% belongs to other. Migrated people in this slum are less than 20%.
12 Daachkul Pada is the sample area which is situated on the personal land situated in Mira Road East, Daachkul pada is next to kashimira dongari is located at Latitude: 19°16'30.10" N and Longitude: 72°53'45.81" E, it has 150 slum houses and around 390 people in this slum. Majority of this slum occupants are migrated from U.P., Bihar and adiwashi. Income level of this slum occupant is very low.
13 Mashacha Pada is the sample area which situated in Mira Road East, Kashi Mira area is lockated at Latitude: 19°16'18.33" N and Longitude: 72°53'40.82" E, , it has 125 slum houses and around 323 people in this slum. Majority of this slum occupants are migrated from U.P., Bihar and adiwashi. Income level of this slum occupant is very low.
14 Kashivibhag, Kashigao is the sample are which is situated on personal land situated in Mira Road east, close to western express highway is located at Latitude: 19°16'31.74" N and Longitude: 72°53'00.02" E, it has 49 slum houses and around 560 people in this slum. This area has one MBMC school for the up to 7th standard, one municipal hospital, two private dispensary, one private school, and one big god Durga Temple. This area has locational advantage of Western express highway, company named “Formkem India Corporation” which provides more than fifty employments to local workers, Adarsh Vidya Niketan School and ST. Ann’s Hospital which operate 24hrs for emergency.
After the overview, it becomes necessary to have a detail analysis of socio-economic conditions of slum inhabitants.
1.11.3.2. Reference period: The reference period of the survey is of four years two month i.e. from 1st August 2010 to 21st October 2014.
1.11.4. Techniques of Analysis: For this study, the collected data is processed and tabulated by the way of tables. Data processing is done by using computer software of ‘Microsoft-excel’. Data analysis is done by simple statistical techniques such as percentage, ratio average; ‘Students T test’, is used. The data is presented with the help of tables, bar diagrams and pie charts. Bar diagrams and pie charts are presented by using different colors.
1.12. LIMITATIONS OF THE STUDY The study is subjected to number of personal and technical limitations. Some important limitations of the study are given below. a. The secondary data collected from various sources could not be verified with the original source.
b. The size of the sample is very small than the universe.
c. The subject of research is sensitive and has a great potential for respondents to avoid stating facts. Under such circumstances, researcher has to collect data by mere observation, in which there is a scope for personal bias.
Secondary data regarding small savings accounts with banks could not be acquired through local banks since bank data collection work is done by other companies which provide ‘core banking’ facilities.
1.13. CHAPTER SCHEME The study is presented in four chapters.
Chapter I – Introduces the subject matter with a brief introduction of current status of Indian economy and on its backdrop, importance of small savings. It also explains related concepts, definitions, research methodology consisting statement of problems, objectives, hypotheses, importance of the study, techniques of analysis, limitations of the study and the chapter scheme.

Life of Slum Occupants & Saving Pattern
23
Chapter II – Reviews the existing literature on socio-economic conditions of slum dweller and their saving behavior.
Chapter III – Contains analysis of the socio-economic conditions faced by the slum dweller in the study area. It also contains analysis of data related to income distribution, savings pattern, happiness level and factors affecting quality of life in sample slum.
Chapter IV – Presents findings of the research study along with their comparison with hypotheses of the study. Suggestions for ways that can be adapted to increase saving with organized sector are also presented in this chapter.

Life of Slum Occupants & Saving Pattern
24
CHAPTER – II
REVIEW OF LITERATURE
Life of Slum Occupants & Saving Pattern
25
2.1. INTRODUCTION
2.2. SOCIO-ECONOMIC CONDITIONS OF SLUM DEWELLER
2.3. SAVINGS AND ECONOMIC GROWTH
2.4. SAVINGS IN INDIA
2.4.1. SMALL SAVINGS
2.4.1.1. SMALL SAVINGS IN MAHARASHTRA
2.5. SUMMARY
Life of Slum Occupants & Saving Pattern
26
2.1. INTRODUCTION As per Golman Sachs white paper (2010), India, a land of billion opportunities, a country with a potential to be third largest economy of the world by 2030. As per PM Modi (2014) Indian country has largest number of youth in the world around 65 % population of the country falls under the age group of 35 years, is also the country of a billion contradictions. Along with a country of luxurious houses, it is also becoming a land of slums. A land of billions, have millions of poor population. Along with country’s economic boom, the number of Indians living in slums has increased by 100% in last two decades. As per Primary Census Abstract for Slum (2011), the number of people living in slums in India has risen from 21.9 million in 1981 to 65.49 million in 2011. Mumbai, the main commercial hub of India alone, has about 6 million slum deweller that are deprived of basic standard of living; have to struggle for minimum required hygienic conditions, sanitary facilities and basic medical care. when the last census was done, Kumari Selja, the Minister for Housing and Urban Poverty Alleviation, said,” The figure is the latest illustration of how India’s recent economic boom has left behind millions of the country’s poorest people, raising fears that social unrest could undermine further growth." The fear expressed by her cannot be ignored. Indian economy to develop at the rate of 9% steadily requires a solid capital base; i.e. Money capital and Human capital.
Prior to 1991, India always suffered from deficiency of ‘money capital’. It is mainly foreign capital inflows, which made ‘brand India’ one of the top ranking brands of the world. However, in the absence of foreign capital Indian economy is vulnerable which can be witnessed in the current capital flight and resultant recession in India. Currently what is needed is building up of India’s own money capital which can be done with effective implementation of saving mobilization machinery already created by Government.
Another important aspect mentioned above is the development of ‘human capital’. A country where 680 million (2014) people are deprived of basic necessities of life, will have to take a lot of efforts to develop its human capital. This study tries to touch both these aspects i.e. building up of money and human capital, at micro level by providing an insight into socio-economic conditions of slum dweller, their income distribution and saving behavior.
However a lot of research work is done already encompassing the above mentioned aspects. At the same time, a lot of policies, agencies have been framed by Indian government for effective saving mobilization. This chapter is an attempt to review the literature that has already been created in this area. Review of literature is done because, it provides some insight into various aspects of the subject matter even before research begins, which makes the research more effective. Review also helps one to find out the areas of the subject matter which are not been much covered till the date and thus can now be covered by the researcher.
The matter concerned with different aspects of the topic is reviewed from various books, reports, journals and also from the working papers available on various sights. The existing literature on the subject is presented under separate heads in this chapter. A. Socio-economic condition of slum dweller,
B. Savings and Economic Growth,
C. Savings in India,
D. Measurement of the Level of Quality of Life,
2.2. SOCIO-ECONOMIC CONDITION OF SLUM DEWELLER Even before understanding various views and studies regarding saving behavior, it becomes essential to review literature that is available on socio-economic condition of urban slum dweller, since these conditions provide an environment either conducive or non-conducive to growth of savings. The socio-economic set up in which individual grows also determines various modes of savings adopted by people.
According to Madhura Swaminathan (1995), as per her paper on ‘Aspects of Urban Poverty in Bombay’, over one-half of total Bombay’s population live in slums or are homeless. As observed by her, slum households are deprived of good housing, they do not have access to hygienic system of waste disposal and in general live in polluted and degraded atmosphere not suited to human habitation. Another problem of slum dweller is inadequate public goods. The paper further observes that although poor households experienced some mobility in respect of incomes but there is no improvement in their living conditions.

Life of Slum Occupants & Saving Pattern
27
From the description of the article, one can deduce that generations of slum dweller live in the degraded atmosphere which itself hampers the overall development of their children which is the future human capital of the country.
As elaborated by Mr. Biswaroop Das (1997), in his working paper on,’ Slum Dweller in Indian Cities: The Case of Surat in Western India’, the level of urbanization and the rate of urban expansion may not be constantly affected by the ‘pull’ of economic prosperity and opportunity in cities, but by the push from rural areas due to substantial changes in the manner of production in agriculture in which there is continuous increase in the proportion of the rural population who are compelled to seek a living outside agriculture. Majority Surat slum dweller are migrated rural poor in search of work joining the lower circuits of labour market and subsequent living in congested and degraded spaces within cities. By 1991-92, slum population in Surat had grown to 4.34 lakhs, distributed in 93,943 households with an average of 4.6 people per unit. As observed by the author 73% of the earning household heads fall in the category of 701 to 1500/- monthly income range. In general population is living in appalling conditions in slums. In order to bring themselves out of these conditions, they save more thus increasing the Marginal Propensity to save which in return should be tapped.
Both of the studies create a bleak picture of Indian slums which certainly raise a doubt regarding fast development of human capital. However experience of Trond Vedeld and Abhay Siddham (2002) differs from that of Madhura Swaminathan and Mr.Biswaroop Das. Trond Vedeld and Abhay Siddham observed that the main reason behind slum development in New Delhi is a large annual influx of migrant labourer from neighboring states, about 1,00,000 annually over a decade. In their paper on’ Livelihoods and Collective Actions among Slum Dweller in a mega- city, they observed, close to half the city population lives in unauthorized colonies and more than one third in illegal slum settlements. In fact it is found that majority of the slum occupants are unemployed, they are poor, non-educated and polluting. From the sample study it was found that majority (85%) of the slum occupant had completed primary education and more than 20 % of the slum occupant completed high school. From the sample study it was found that 95% of the slum workers are employed and their average income is more than the income defined by the official poverty line. Majority of the family having their own house, they have TV, radio and bicycle in their home. Since slum families income are more than poverty line therefor they are able to save some part of their saving for future requirement and their development purpose. They were more aware of their surroundings than expected and on their own were supporting the idea of slum- development. Under such environment with better canvassing small, organized savings can be improved.
A study was conducted by Samik V. Lall et al. (2005) on ‘Household Savings and Residential mobility in Informal Settlements’, the authors have investigated residential mobility among slum dweller in Bhopal, India. The researcher had done survey of 2508 households and conducted between August and October 2003. From the above analysis it is found that one in five households succeed in getting out of a slum settlement. Due to limited reach of institutional housing finance, most slum dweller depends solely on household savings for purchasing a house. Most of the 1652 sample households who purchase their house had to rely solely on savings to finance their homes. It is found that 74% households rely on their own sources of saving for financing homes. 14.5% depends on non-commercial borrowings and only 3.1% have been able to take housing finance from specialized financial institutions like HDFC, it is mainly due to lack of information and lack of collateral they pusess.
As study conducted by Sufaira.C (2013) on “Socio Economic Conditions of Urban Slum Dwellers in Kannur Municipality” the researcher found in his study that cast and religion play an equally important role in patterning and growth of slums. The researcher found that in notified slum, major communities are Muslim (93.2 %) accounted; Hindu and Christian accounted 4.5 and 2.3 percent respectively.
It is found that female unemployment is very high as compare to male person. It is found from the study that 94 percent of households reported an income of less than Rs. 1000 per month and balance 6 percent are getting in between Rs 1000 to Rs 2000 in notified area.
It is found from the above study that slum dwellers are living in miserable conditions. In notified area only 25 percent are having pucca home. The largest houses (68.2%) were a semi pucca home and only 6.8 percent

Life of Slum Occupants & Saving Pattern
28
homes were kutcha home. Whereas in non-notified area, around 79% of houses were semi pucca and 14.6 percent of houses were kutcha and only 6.4 percent were pucca house.
From the above study researcher fund that around 15.9 percent of households informed no saving in notified area. Majority of the slum occupants (84.1 and 74.1 respectively) has a semi-formal saving scheme (kudumbasree) in notified and non-notified area. It is found that those slum occupants who are saving in bank or post offices saving account are 9.7 percent. From the above study researcher had given following suggestion which are as follows- 1 To avoid flooding and sledging problems in the slum measures should be taken to raise their level.
2 To avoid land and water pollution local government should work on providing more latrines for slum households.
3 New planning should be formatted and implemented to prevent the formation of new slums.
As study conducted by Akter T (2008) highlighted on the socio economic condition of slum inhabitants and their consumption pattern. The present study in Dhaka city examines the living situation, physical condition, slum occupant’s health status particularly food practice and their health. It is found that slum occupants were living in poor condition; it is analyzed on the basis of food consumption, living conditions and food security for the slum occupants. It is observed that slum inhabitants are considerably poor with reference to living condition.
Socio-economic status of slum occupants can be identified as mainly low income group with non-education. In slum area poor physical environment and non-availability of solid waste disposal system are very common. Therefore there is a high risk of disease to children living in slum, indicates leading unhealthy environment. In such conditions it is a big challenge to ensure food security for urban poor if their socio economic situation remains miserable. The above study shows that high existence of disease among children shows inadequate education or lack of awareness among parents to provide proper care to their children.
It is found that slum occupants are unable to bare nutritious food for their child as it is highly expensive for them. Various factors like low income, high expenditure as compare to their income and education were influencing the food security in slums.
As study conducted by J. Godwin Premsing and Sheena Philip (2014) on “Improving living conditions in Slums Dwellers”. Researcher found that slum population has increased from 52 million in 2001 to 65 million as per census 2011 records, but over the last one decade slum population had increased slower than the average urban population.
The literacy rate in slums had reached up to 77.7 percent but still lag behind the urban average. Researcher found that that in slum men and women participate a higher rate in the labor force than the urban average. Researcher found that slum house is dilapidated, cramped, poorly ventilated, unclean, which affect safety and health. From the social workers suggestion researcher found that new solutions are required to provide basic services to these residents as in developing countries the number of urban poor in slum is increasing.
Slum life is highly over populated, deprived of basic services, overcrowding, unemployment or underemployment, lack of social and community network, stark inequalities, crippling social problem such as crime and violence and particular vulnerability to health problems, economic shocks, and the risks related to climate change and natural disaster, particularly for the poor. New resident needs job, safe housing and access to basic services.
Ali AM and Toran K (2003) conducted his study to analyze socio economic condition of Gandhi Nagar slum regarding intra and inter migration. Majority of the peoples are migrated from the southern part of the city. Based on Income and expenditure level of the above study area the socio economic condition was not satisfactory. Slum household are built of concrete structures. The above study area has good basic amenities like water supply, drainage system and lighting. Sum occupants of this are lacking from library facility for their children. It is found from the study that people are settled in this area due to availability of low cost house. The above study area has good recreational facilities like various spots activity and people of this slum area visit to their relatives.

Life of Slum Occupants & Saving Pattern
29
As study conducted by Chandrasekhar S (2005) on the basis of Census and NSSO data, researcher found the difference of living conditions in Indian slum. On the basis of survey researcher compared the factor affecting to the Slum, non-slum urban and rural area. Based on the census report it is found that person’s livings in the slum are declining. From the census report it is found that literacy ratio is higher in Kerala, Goa and Delhi state. But as compare to Kerala, Goa and Delhi literacy ratio of slum in the state like Rajasthan, Madhya Pradesh, and Bihar are higher than rural area. Slum gender ratio is higher than rural in the state like Rajasthan, Madhya Pradesh and Bihar. It is found from the above study that per capita consumption percentage of rural household deprived of access to latrine, electricity and water facility was higher than the corresponding households in slums and non-slum urban areas. Thus it is found that in some aspect rural areas are similar to slums and dissimilar in some other aspects.
As study conducted by Geetha S and Swaminathan Madhura (1996), study was conducted in Mumbai slum regarding “Nutritional Status of Slum Children of Mumbai: A Socio-Economic Survey”. In the study area it is found that slum occupants are lacking from many basic amenities like toilet, quantity and quality of water level, sewerage and sanitation facility. Due to under nutrition in slum area it creates the root cause for many diseases. It is found that in girl’s nutrition level is low as compared to boys in below 5 years children.to understand the sample researcher adopted Midarm circumference and weight for age indicators were used.it is found that around 60.9 percent of boys and 72 percent of girls were undernourished on the basis of weight for age measurement. It is found that 19.8 percent of boys and 36.8 percent of girls were undernourished on the basis of the MAC indicators and another 33.1 percent of girls and 25.2 percent of boys were moderately undernourished. From the above study it is found that under nutrition among girls as compare to boys were found significantly higher in both the indicators.
As study conducted by Hatekar Neeraj and Rode Sanjay (2003) researchers conducted his study on “Quitely They Die: A Study of Malnourishment Related Deaths in Mumbai City” to cover the study researcher has collected from 1000 households in Mumbai. From the above study it is found that female illiteracy and poor economic status was found due to behavioral barriers and socio cultural due to this reason nutritional status of children were affected. It is found from the nutritional indicators study that malnourishment was higher in Mumbai than in Jawaharlal colony. From the above study it is found that in girl’s seasonal wasting incidence are likely to be higher chances. Insufficient income with lack of basic amenities and health services is the reason for high chances of Malnourishment. Urban areas girls are in better tend as compare to those who are living in rural areas but the urban slum dwellers are very high undernourished as compare to rural area. The above study was empirically proved that the frequency of malnourishment of children’s of urban slum was highest correlation to the incidence of jawahar tribal.
As study conducted by Karn et al (2003) on “Living Environment and Health of Urban Poor”. From 1070 squatters and pavement dwellers survey the researcher has examined the relationship between health status of urban publics in Mumbai and living environment. It is found that type of employment level has influence of education and location of residence. It is found that condition of house is considerably differing from pavement dwellers to squatters and slum. It is found that overall 33 percent of houses were made of flimsy, 39 percent were made of semi-permanent type and 28 percent were made of cemented building. For germs filtration or pathogen killing none of the slum household was used any kind of scientific device. In slums water related diseases are generated from various factors like polluted drinking water, insanitary living condition, poor personal hygiene and food cleanliness. It is found that the impact of poverty and environment factors highly pronounced between slums and pavement dwellers. The above study discovered that income, sanitation, literacy and personal hygiene had an impact on the morbidity of the people. The above study it is proved empirically that health status of urban poor has effect of socio-economic and the environmental factors.
As study conducted by Gangadharan K (2005), under the study the researcher had studied the Kannur district with reference to health behavior regarding utilization of health service of five social classes’ i.e. lower, upper lower, lower middle, upper middle, and upper class. It is found that those children’s who are aged below 15 years and those people who are aged greater than 55 years living in the slum and urban areas are having high rate of illness chances among them. It is found that high morbidity was found in the slum and urban area that are in the age groups of 36-55 years. Morbidity prevalence effect was inversely connected to household size and education is found in the above study. From the morbidity and occupation

Life of Slum Occupants & Saving Pattern
30
linkage it is found that higher morbidity of infectious illness is found among employed groups of unskilled workers whereas among business class and white collar workers chronic disease were found. Morbidity of chronic illness was also found high in unemployed groups of urban area and slum. From the above study it is proved that utilization of private health facility increases with the increase in level of education and consumption of public health service goes down. It is found from the study that low and very low level income group peoples are dependent on government health service because of their poor financial status.
As study conducted by Retnaraj D (2001), it is found from the study that in recent year’s extraordinary growth was found in Kerala because of high level increase in the prices of pucca houses and land price. It is found that people preferred Kerala as the most preferred cities. Due to abnormal increase in rent prices and land prices people are forced to settle in slum. From the above study researcher found that there is a positive relationship among land prices and urbanization. During 1980’s and in the beginning of 1990’s there was massive foreign inflow remittance which lead to spurt in land prices and real estate market. The huge foreign inflow and high level of land prices created slum growth in Kerala. This created various shortages facility i.e. drinking water, latrine facilities and electric connections.
As study conducted by Patel et all (2011) importance of informal and formal rights of landowners and tenure history recognized. The study describes the importance of executing slum planning schemes, incorporation of slum societies, promising rapid and sustainable upgrading within the formal city. It also defines a network of local, state and national agencies for quickly arranging. Author has recommended that SPS arrangement should be changed.
As study conducted by Aribigbola, (2001) in his study he stated that home is living place which contains physical construction and all required needed equipment’s for the safety of family and their mental satisfaction. As per Ad-Hoc expert group of United Nation, home is a basic requirement which includes all minimum required facilities like waste disposal , road access, water supply, education, recreation facility, health care facility.
As study conducted by Kayode Felix Omle (2010), on “An Assessment of Housing Condition and Socio-Economic Life Styles of Slum Dwellers in Akure, Nigeria”, researcher examined that the importance of housing to man as an essential need and a prerequisite for the survival of man after food. It is found that quality of the housing construction is very poor due to the low quality of material used for construction, inadequate technology and poor planning standards of handling the building components. Based on the study, researcher recommended to the policy maker to implement sustainable policy for urban development.
As study conducted by Bello (2002), emphasized that slum areas are locus of poverty where various factors that enhance slum development and growth are noticeable. He admitted that congestion of building and people as potent factors that created opportunities for the emergence of low environmental quality and unsanitary conditions, which breeds contagious diseases and infections in such deplorable parts of urban area.
As study conducted by Olanrewaju and Akinbamijo (2002), it was affirmed that environment has great and obvious effects on health as poor residents are often seen at zones, which imply poor health. They observed slum dwellers to be group of people who live in old houses with bad structures located in poor environments where they are exposed to ill health from polluted water. Such houses are without toilet and other essential utilities. Their drains are often filled with refuse deposits, which hamper the free flow of run-offs.
As study conducted by the Center for Global Development Research (CGDR), October 2011, slum is the place which provides accommodation to all required families who are unable to get accommodation in costly area because of their low income, there for slum plays an important role for them. Around 14% of the Delhi populations are living in slum, since they are unable to afford to stay in costly area. These slums provides required workforce to the urban city. But on the other side slum occupant creates crime in the city. Majority of the slum houses are made of poor quality material.
As study conducted by Sudesh Nangia and Rupesh Kumar Gupta, (2005), researcher conducted his study on Population explosion and land use changes in Gurgaon city region. It is found from the study that population of Gurgaon city has increased from 57,000 in 1971 to 1,74,000 in 2001, the growth rate in this city has increased at increasing rate.

Life of Slum Occupants & Saving Pattern
31
As study conducted by Registrar General and Census Commissioner, India (2001), it is found that almost all the major developing countries have faced the slum problem. Urban slum now a days become an integrated part of the urban area. by affordable labour supply, slum dwellers contributing significantly to the urban area for production in formal and informal sector of economy.
As per UN-HABITAT (2003), it is found from the study that 3 billion people of the World’s population lives in cities, it is around half of the world’s population. Out of 3 billion one-third population of them are lives in slum. It is found that four out of 10 inhabitants are living in informal shelters in developing world. In the new millennium slums are became the face of world. Slum dwellers are facing various difficulties not only from houses unfit for habitation but also they are facing various problems from required food, health education and basic services. Better quality of life by slum improvement is not only a goal but slum improvement will solve the problem of health burden and the economic development of a country.
A study was conducted by Sandip Tripathy (2013), it is found that sample area is developed on the basis of educational and administrative facilitation since last decade among whole district. The sample area is moderately safe from flood for the location of the natural longitudinal dam. The author in his study taken 1100 respondent data and based on 1100 respondent it is found that the gender ratio of that area is 923 according to the survey it is low from district ratio of 960 and 961found in 2011 and 2001 respectively. Author in his study found that total working population is higher in that area than dependent population.
From the respondent it is found that in the age group of 15-29 year population is much higher the others like another slum area. In the present sample area it is found that gross percentage of educated people is 58.90 percent but male population 80.18 percent and 71.21 percent found female population. Author found that the sample area reflects a low-economic status. Most of the family of that sample area are engaged themselves with secondary activities. Educated people of that area found job related to insurance and mobile sector and other general product with direct sales department. Those who does not have adequate education, they frequently works as daily laborers against daily wages or Rickshaw puller or Trolley Puller, etc. It is found that in the present study area no immense scope of employment could be found. The economy of the sample town has grown up based on transportation system and small scale business. It is found that there is lack of true level of or service sector industry. Most of the people belongs to lower economy level are being forced to get into other small scale business.
A study was conducted by Goswami & Manna (2013), the study deals with issue like human capital improvements, particularly requirement of safe drinking water, improved sanitation facility, road, transportation services, solid waste management, education, health care facility and monetary support. It is found from the study that empowerment of community, good governance and political will power is required for improvement of the slum condition.
Based on the above study authors given various suggestions for improvement of slum dwellers life which are as follows: 1. A system has to be evolved whereby the garbage from slums can be collected from each household
depots or transaction stations and after that it be can cleaned by Municipal services. Improves hygienic conditions with increased awareness on preventive social medicine can reduce the health hazards in slum residents.
2. There is a need for more and more community managed program than administration managed program to improve slum areas.
3. There is need to emphasis and strengthen institutions at the community level in the form of neighborhood committees and to support nongovernmental efforts either individual or institutional or else.
As study conducted by Bala & Kumar (2013), there are many factors which create slum growth which are as follows: 1 It is found that various studies support that in the early phase of industrialization, there was large-scale
migration to city as city offered various advantages in the form of employment opportunities and other community facilities, which were absent in majority of the rural area of developed countries of the world. This leads to the creation of slums.

Life of Slum Occupants & Saving Pattern
32
2 The poverty is another factor for slum development as slum occupants are unable to maintain a decent standard of living as required as per the standards of the society. These forced them to find refuge or to squat on the unused and located near their work place, resulting in to slum formation.
3 Housing shortage is another important factor for the creation of slums.
4 For cost saving people preferred to stay near to the work place this is the another factor for the creation of slums.
5 Migration is the major factor for creation of slum for unskilled workers.
6 Another set of conditions under which a slum develops is the deterioration of a group of building in the older part of the city. The area gets congested and overcrowded in the absence of adequate municipal services and the slum condition increase.
As study conducted by Nayak (2013), it is found that house of the Gondar slum is very old congested and people are living in very in unfavorable condition. From the respondent, researcher found that slum dwellers are vulnerable to many challenges like disease and flood. Since houses are very old and congested that they cannot make in-house toilet. Most of the people are buying water from long distance and they don’t have electricity supply in their home. Income level of the slum was very poor; because of this they cannot change their present condition and cannot eat properly or keep themselves from diseases.
As study conducted by Ogunleye (2013), through the survey result researcher found that most of residents are engaged in the informal sector of the economy (self-employed), their income level is very low and their house size is very high. The researcher found that slum occupants are lacking in essential infrastructure and large number (53.3%) are unsatisfactory by modern standards. It is found that majority (43.4%) had no formal education while about 38.9% that are educated only up to elementary certificate.
As study conducted by Geetha & Swaminathan (1996), from the 500 respondent researcher found that basic amenities available to slum occupants were grossly inadequate. It is found that only 8 households has their own toilets, 69 percent of the households uses public toilet and 26 percent of the household claimed that they are using open space for defecation. 35 percent of the populations are based on non-municipal source of water such as private well and borewell which has high level of bacterial contamination and were not potable.
A study was conducted by Sheena & Premsingh (2014), it is found that slum occupant’s monthly expenses are higher than income and majority (80%) of slum dwellers living in huts covered by sheet, the condition of these huts are very pathetic. It is found that 66 percent of the respondent feels that they lack social security and majority (74%) of the respondent feels that their living condition is bad. It is found that 80 percent of the respondents are not satisfied with their living condition and 74 percent admitted that there is an alcoholic person in their house.
As study conducted by Ghosh (2013), it is found that maximum numbers of people are aware of the works to be initiated by KEIP in their locality. They were actually to some extent confused whether the works were done by KEIP or by some government organization. The basic problem faced by the slum occupants are water logging to some extent, miserable road condition, lack of street light, absence of mass toilets for slum dwellers, lack of bath facility and urinals for the local people.
As study conducted by Ms. Hina (2013), it is found that Janta Colony and seelampur has more dependency on earning members as the non-working group (female and children) are more as compare to balmiki kabristan. Janta colony and Seelampur slum occupants are working 5-7 days a week and 6-12 hours per day, while in other slum it is less. It is found that Janata colony and seelampur slum people are availaing greater government facilities as compare to Balmiki kabristan and ITO.
As study conducted by Kundu (2007), researcher conducted an analytical study on Stigmatization of urban process in India with reference to slum situation. From British rules slums are found as part of urban. A majority of the rural people migrated to urban city in search of better employment. Due to non-availability of housing facility of housing by employer employees are forced to settle in slum. It is found that in some city employer retained the employee by providing housing facility in chawls. Over a time most of the chawls have become extremely poor in terms of quality of life.

Life of Slum Occupants & Saving Pattern
33
As study conducted by South Asian Analysis Group (2006), it is found that main reason behind the slum creation is poverty and this creates hopelessness and crime. The key reason for the above reason is slow economic growth. Major cities in India were dotted with slums by mid-sixties.
As study conducted by Kotnis et all (2012), from 1441woman respondent researcher found that 91 respondents were admitted that their delivery took place at home because of many reasons like customs, monitory problems, spontaneous delivery, homely atmospheres, and service not found satisfactory at hospital. It is found that 62 mothers were literate, 71 women belonged to S.E. class III and IV and 73 women from joint families out of 91 woman respondents. Further it is found that 61 deliveries were conducted by untrained Dai and only 30 deliveries were done by trained Dai.
As study conducted by Operational Research Group (1989), it is found that the apart from migration, main reason for slum formation is the poverty and the local government failure in providing basic amenities to their people, which forces large part of population to settle in slums. Lack of infrastructures in some of localities is also possible reason for the formation of slums. In almost all the slum places it is found that slum occupants has very less awareness regarding availability and application of loan facility, this results in non-utilization of available of fund. It is found that to improve the life of slum occupants it is required to initiate in all the fronts. It includes provision of income generation, health care promotion, education and vocational training and provision for basic amenities.
As study conducted by Imparato and Ruster (2003), in his study researcher done his study with object to find out how to increase services to low income area, how to increase the impact of projects and the durability, how to enhance financial sustainability of projects and kind of initiatives required to address key issue. House is a basic needs and it’s a basic human right. But it is found that urban population is increasing at level in many developing countries including Latin America. It is found that to provide housing within the reach of the people, satisfactory sanitary and basic infrastructure for all the citizens will become an in increasing serious threat to the policymakers. Slum upgrading and participation can improve their housing conditions.
As study conducted by UN-HABITAT (2006-07), it is found from the study that the occurrences of illnesses are found due to poor living style rather than income levels. In slum it is found that children of higher income family have higher diarrhea chances as compared to low income family of rural children since they are not protected from polluted water and food.
As study conducted by Bhandari and Basu (2000), it is found that migrated slum occupants are most adversely affected by quality of life; due to poor income level they are forced to settle in unhealthy and congested places lacking of basic requirements for a healthy life like drainage and sanitation, housing, water supply, slums are also the breeding ground for crime, pollution and health hazards.
As study conducted by Sundari (2003), in his study researcher done micro level study of Tamil Nadu State, it is found from the 820 female migrants’ respondents which are staying around the slum of Chennai city, Tirupur town and Coimbatore. It is found that slum occupants of the study area facing lack of minimum basic amenities like house, drainage and sanitation and water supply. Women and children are worst affected in slum. It is found that drainage system in the sample slum was almost absent, about 92 percent households do not have drainage system and 4 percent had an open katcha drainage system. Only 1 percent of the migrant’s slum households have pucca drainage system. Underground drainage system was totally absent in the sample slum. Around 67 percent of the sample slum households do not have garbage collection and disposal arrangement either by government or by private. It is found that 51 percent of Tripur slums, Coimbatore slums and Chennai slums are found below poverty line. In the sample study Tripur had highest below poverty line slum households. From the above study researchers had given suggestions that massive level slum improvement program to be run by Municipal Corporation.
As study conducted by Aldrich and Sandhu (1995), Slums occupant’s residential conditions are the outcome of the failure of government policy. Living condition which is below poverty line and unhygienic is called slum. Better accommodation is required for human development.
As study conducted by Vaishali D. Mane and D.H. Pawar (2013), on “SOCIO-ECONOMIC STATUS OF SLUM DWELLERS WITH SPECIAL REFERENCE TO WOMEN: GEOGRAPHICAL INVESTIGATION

Life of Slum Occupants & Saving Pattern
34
OF KOLHAPUR SLUM”, the researcher investigated with an objective to study standard of living and women participation in economy of Kolhapur slum city. It is found that various type of occupation or work has been performed by Kolhapur slum city women. Works performed by women are depending upon their education, family background, facility of employment and as per their kills. Some of the works performed by women are tailoring, home servant, retail shopkeeper, construction labor, catering and some of the illegal activity like alcohol retailer. Researcher found that incomes earned by women are very low as compare to their work level. Income of the slum women varies from Rs 900 per month Rs 8000 per month. Majority of the women income group are in the range of Rs 2000 to Rs 3000 per month. Researcher found that slum dwellers are trying to improve their living standard as per their capacity.
A study was conducted by Grace Bahalen Mundu and R.B.Bhagat (2009), on “Slum Conditions in Mumbai with Reference to the Access of Civic Amenities” the researcher found majority of the slum occupants are came from the different parts of the city. Majority of the slum occupants are migrated and they are belong to the lower economic group. It is found that majority of the slum occupants are settled near to their work place as it saves their transportation cost. Slum occupants are continuously contributing to the city significantly.
Researcher found that most of the slum occupants are living in unhygienic condition and they are deprived of basic necessity facilities. It is found that slums are found more vulnerable from the diseases during rainy season because most of the slums are situated in low lying areas particularly in the coastal cities like Mumbai. The major problem of the slum is they are facing lack of private toilet and they are bound to use open sewerage. Most of the community toilets are not maintained in proper condition and as a result people route to open space. This is a big problem for Mumbai city and needs immediate attention of the policy maker.
A study was conducted by Masoumeh Bagheri (2012), on “The Challenge of Slums: Socio-Economic Disparities” and was published by International Journal of Social Science and Humanity in September 2012. It is found from the study that around 16% of the workers of Ghale chenan city are jobless or in search of job. Around 1933 slum occupants who are physical disabled and retired are supported by various NGO’s. It is found that due to industrial disposal and domestic sewage water of Karron River is continuously polluting which is one the drinking water source for the residents of Ahwaz. The major problems for the slum occupants of Ghale Chenan are they don’t have even basic education and they are jobless. These peoples were doing store robbery, most of the time they block road of Ahwaz to Mahshar for extortion, it is validated from several reports. Most of the slum occupants of these areas are poor and illiterate.
A study was conducted by Rajiva Prasad & M.N. Singh (2013), on “Living condition and life style of Mankhurd slum dwellers”, and was published through International Institute for Population Sciences, Mumbai. From the study author found that slum occupants living condition is not satisfactory. No measures have been taken by government and therefor majority of the slum occupants are living in neglected condition. It is found that health of the slum occupants are generally depends on their living style.
As study conducted by Mitra (1994), the researcher studies the array of urbanization particularly city growth in India. In order to tackle these problems it reinforces the importance of productive employment generation in the urban areas.
A study was conducted by Partha Sarathi Das and Kishor Chandra Meher (2013), The Researcher found that the slum problem is a national problem and its origin is found in the structural inequalities of the society. Thus it requires a national policy and both the central and state governments must combine their effort in it.
A study was conducted by M. S. Alamgir et all (2009), on “Assessing the livelihood of slum dwellers in Dhaka city”, and was published J. Bangladesh Agril, University in 2009. The author’s present study was an effort to define the factors affecting the rural-urban migration in slum areas. It is found that resident of this slum does not have formal education; workers of this slum are engaged in working of rickshaw, small self-business and day laborers. Slum occupant’s financial, social and decision making enhanced sustainably by efforts of many NGO’s. Researcher found that around 56% of the families are migrated for financial reason.
A study was conducted by Nihar Ranjan Rout (2008), Lecturer, Department of Population Studies, Fakir Mohan University, Balasore, Orisa on “SLUM GROWTH IN BHUBANESWAR: A PROBLEM OR

Life of Slum Occupants & Saving Pattern
35
SOLUTION?”, and was published in ITPI Journal in 2008. The Author found that the 30 % of the people of this city are living in slum. It is mainly because tremendous growth rate during the last decade. Apart from health related problem and poor living conditions slum occupants are facing from financial problem and employment.
As study conducted by Moona Yasmin (2012), on “Occupational Mobility among Slum Dwellers: A Case Study of Delhi”, author found that citizen’s living in slum are accessing the information related to availability of urban labor market. It is found that they are acquired the information through various informal channel (T.V., Radio, News Paper, etc) and they develop their skill as per required new occupation. Peoples of slum usually prefer job near to their resident. This study covers low income groups and majority people working in the urban informal sector. To conduct the same author had collected 784 households data, 214 household are working since 2000 and 286 households are working since 2009. Authors considered on 214 household who are staying since 2000 and they are from cohort group of workers for her study. To get the study outcome author selected Occupational classification scheme developed by Gokhale Institute of Politics and Economics, Poona. From the study it was found that slum occupants has shown both upward and downward occupational mobility but it is found that upward mobility is higher than downward mobility. Author found that out of 214 households 36 are upward and 22 are downward mobility.
As study conducted by P. Sujatha and P.V.S. Janardhanam (2010), on “Urban City in India: Chennai city as a case study”, author found that technical improvement and industrialization is the main cause for rapid urbanization. Till 1901 urban population was just 11% where as it reached to 18% in 1951 and 32% in 2001. But unfortunately this urbanization created slum and slum citizens become the most vulnerable and blighted areas of the city. Author found that even though various programs conducted for slum improvement but there results were not satisfactory and still slum occupants are found in vulnerable condition. Tamil Nadu slum clearance board rehabilitated the people living around the river. In Chennai, the slum occupants are lacking from municipal corporation are lack of water supply, Sanitation and waste management.
As study conducted by Sunil Kumar et al (2003), on Living Environment and Health of Urban Poor: A Study in Mumbai”, author found that in urban population of developing countries has grown 6.8 times in between 1950 to 2000. During these periods rapid urbanisation has created remarkable pressure on existing urban infrastructure and public services. Author found that around 70% of the urban populations are living in slum; half of the slum population are able to access toilets and 11% of the occupants are found sick at any time. Further author found that water related disease such as diarrhoea, typhoid and malaria are around 614, 68, 126 cases found per thousand.
As study conducted by Upinder Sawhney (2013), on “Slum population in India: Extent and policy response”, author found that increase of urbanization and absence of affordable housing leads to creation and expansion of slum. Poor people migrates to urban in search for better income opportunities and to enjoy better living standard but due to their lack of education and non-qualified skill leads to them unemployment and financial shortage, this leads to them to settle in affordable slum.
As study conducted by Ankur Sarin and Rekha Jain (2009), on “Effect of Mobiles on Socio-economic Life of Urban Poor”, to study the effect of Mobile on slum occupants author has taken 1774 respondents data of mobile and non-user of mobile in 84 slums of Delhi, Kolkata and Ahmadabad. Author found that slum occupants are significantly spending their income on mobile for purchase and daily usages. It is found that they spent around 40% of their average monthly income on this. However it is found that with the usage of mobile their socio-economic situation improved and they got more benefit as compare to the cost of acquisition of the mobile and daily on-going expenses. With the usages of mobile their social relation with long distance improved.
As study conducted by Khan et al. (2013), on “Newborn care practices among slum dwellers in Aligarh city, Uttar Pradesh”, author found that new born health issue in India is more challenging than any other country in the world. The neonatal death rate was 44 per 1000 live births, at least 2 new born deaths every minute. Author found that around 91.5% delivery took place at home and most the delivery was done by untrained dais. It is found that 83% pregnant women were in the age group of 15-30 years and 17% are in the age group of 31-45 years. Author found that overall very poor practices were followed during pregnancy in Aligarh Slum.

Life of Slum Occupants & Saving Pattern
36
As study conducted by Goswami Mihir and Kedia Geeta (2010), on “Socio-Demographic and Morbidity profile of slum area in Ahmedabad, India”, to conduct this study author collected 1389 data from respondents of Ahmedabad slum. Author found that in the selected slums there was no formal drainage and sanitation facility found. In the selected area gender ratio is 987 female per 1000 male found and literacy ratio was very poor only 16.8% male and 5.6% females were literate. Majority of the slum occupants including children up to the age of five years are also are addicted from consumption of alcohol and tobacco. Most of the housing condition was very poor and they are made of katcha construction. These slum occupants do not have sanitation and sewerage facility. In his study author recommended that local government should provide public latrine facility to safeguard the land pollution.
As study conducted by Biplab Das et al. (2012), on “The Challenge of Slum Development in India a case study of Melatala-Dasnagar Slum area of Howrah Municipal Corporation”, author found that developing countries like India phasing massive urbanization growth and this resulted in expansion and creation of slum in the entire urban area. Author found that 28% of the Indian population are in urban area and 21.68% of the urban population are bound to settle in affordable slum area due their financial problem. Urbanization creates huge employment opportunity which creates migration of people from rural to urban. Rapid migration from rural to urban with lack of skill and education creates problem in finding suitable jobs and financial problem this results in creation and expansion of slum.
As per NFHS-3 survey conducted by Kamla Gupta et al. (2009), on “Health and Living Conditions in Eight Indian Cities”, as per the survey of Ministry of Health and Family Welfare Government of India it is found that the expected population of urban India will be more than 550 million by 2030. As per the survey it is found that large proportions of urban people are living in slum. It is found that like other developing countries in the world India has shown significant growth of urbanization since last 50 years. As per Census 2001 28% of the populations are living in Urban and from 1951 to 2001 India’s urban population has grown almost 5 folds. Urban population increased from 62million in 1951 to approx. 286 million in 2001. In terms of urban population India is the 2nd largest country in the world. From 1981 to 2001 Indian Urban city over 1 million populations increased from 12 to 35 cities. It is expected that by 2015 more than 50 Indian cities will cross 1 million populations.
Diagram 2.2(1)
G ro wth of Urban Popu lation in Ind ia300 286
250Urban population Percent urban
218
30
25
200 20160
150109
100 7962
15
10
50 26 26 28 34 44
0
1901 1921 19 31 1 941 1 951Year
1961 1981 1991 2001
From the selected 8 cities survey it is found that altogether 8 cities it contributes around 30% of the total slum population of the nation as per 2001 census. Among these 8 cities the highest slum population was found in Mumbai it was 54%, Meerut 44%, Nagpur 36%, Kolkata 33%, Delhi 19%, Chennai 19%, Indore 18% and Hyderabad 17%.

Life of Slum Occupants & Saving Pattern
37
Diagram 2.2(2)
With Rural people migrated to urban poverty also migrated to Urban areas. Income disparity versus slum and non-slum was highest found in Delhi and lowest in Indore. As compare to slum and non-slum young population was found in slum area, age wise young population was more in slum as compare to non-slum area.
In every city majority of the slum household heads are non-educated, whereas in non-slum area more than 50% of the household are educated up to 10th. From the survey it is found that poor women’s education was found lowest or nil education. As per occupation slum women’s are more found in production and services related work, whereas non-slum women’s are enjoying production and professional related work. Around 2 to 8 per cent of the slum children’s were working for pay.
As compare to non-slum regarding housing condition it was found that slum families housing were in poor condition.
From the survey it is found that most of the selected cities toilet facility is not satisfactory. In almost all the cities it is found that sanitation facility was found worse in all the slum area as compare to non-slum area. Open toilet was found in slum area which creates land and water pollution in that area.
Several studies have proved that poor save more. Such small savings, properly mobilized can play a vital role in stabilizing the economy. To support this statement, a brief review of literature is undertaken below establishing relationship between savings and economic growth.
2.3. Savings and Economic Growth: Savings, the difference between income and expenditure, are usually defined as an act of ‘not consuming’. A high level savings helps the economy to progress on a continuous growth path, since investments are mainly financed out of savings.
Gerard Jackson (2008), economics editor of Brookes News claims that ‘without Savings there can be no Economic Growth’. There is a large literature on the role of savings and investment in promoting economic growth. The early Domar-Harrod models specified investment as the key to promoting economic growth, although this was challenged by the neo-classical Solow model in 1950s. The Solow model argues that savings importantly contributes to economic growth & policies therefore need to be directed to increasing domestic savings.
Dornbusch et al. (2000), in the chapter on Growth and Accumulation state that economic growth results from the accumulation of factors of production, particularly capital, and from increased productivity. That is inputs and productivity are the sources of economic growth. Production function is used to study these two sources of economic growth. The production function provides a quantitative link between inputs and

Life of Slum Occupants & Saving Pattern
38
outputs. Output(Y), depends upon Labour (N) and Capital (K) as the inputs and level of Technology (A) which can also be called as ‘Productivity’.
Y = AF (K,N).
The equation summarizes the contribution of input growth and input productivity (technology) to the growth of output.
From the above discussion, one can deduce that building up of money capital and human capital is the key to economic growth.
According to Nobel Prize winner Robert Solow (1994), Technical progress, increased labour supply and capital accumulation are the important determinants of GDP growth. Solow’s neo-classical growth theory, the product of intense work in 1950’s and 1960’s focuses on capital accumulation and its links to savings decision. The neo classical theory begins with short run where there is no technological progress and the economy strives to reach for steady-state equilibrium which is the combination of per capita GDP and per capita capital, where the economy will remain at rest. The theory presents production (y) as a function of capital labour ratio (k), where rise in capital leads to rise in output, thus y = f (k).
The steady state values of per capita income Yo and capital Ko, are those values where the investment required (n+d)k to provide capital for new workers and to replace machines that have worn out id just equal to the saving (sy) generated by the economy. If saving is greater than this investment requirement, as shown in the diagram below, then capital per worker rises over time and therefore output does as well. If saving is less than the investment requirement, then capital and output per worker will fall. Steady state values are the levels of output and capital at which saving and required investment balance.
DIAGRAM 2.3 (1)
In the short run, an increase in the saving rate (s1y), raises the growth rate of output (y1) as shown in the diagram as follows.

Life of Slum Occupants & Saving Pattern
39
DIAGRAM 2.3 (2)
A country with a higher saving rate will experience faster growth, e.g. Singapore had a 40% saving rate in the period 1960 to 1996 and annual GDP growth of 5-6%, compared with Kenya in the same time period which had a 15% saving rate and annual GDP growth of just 1%.
According to the theory, the long-run rate of growth is exogenously determined - in other words, it is determined outside of the model. A common prediction of these models is that an economy will always converge towards a steady state rate of growth, which depends only on the rate of technological progress and the rate of labor force growth.
The theory implies that if two countries have the same rate of population growth, the same saving rate, and access to the same production function, they will eventually reach the same level of income. In this framework, poor countries are poor because they have less capital, but if they save at the same rate as rich countries and have access to the same technology, they will eventually catch up.
As per RBI, following table the direct relationship between growth of saving and GDP growth in India also establishes.
TABLE 2.3 (a) India’s National Income and Domestic Savings Post Liberalization New Series (Base: 1999-2000) (Cr. Rupees)
Year GDP AT FACTOR COST
GDP AT MARKET PRICE
GDS
1990-91 515032 569624 130010 1991-92 594168 654729 141089 1992-93 681517 752591 159682 1993-94 792150 865805 189933 1994-95 925239 1015764 247462 1995-96 1083289 1191813 291002 1996-97 1260710 1378617 313068 1997-98 1401934 1527158 363506 1998-99 1616082 1751199 389747

Life of Slum Occupants & Saving Pattern
40
1999-00 1786525 1952035 484256 2000-01 1925017 2102314 499033 2001-02 2097726 2278952 534885 2001-03 2261415 2454561 647970 2001-04 2538171 2754621 821027 2001-05 2877706 3149412 1000424
2001-06P 1106 304674 893149 2001-07RE 1122 355747 1053319 2001-08QE 1138 409494 .
Source: Central Statistical Organisation.
As studied by Verma R. and Wilson E.J (2005), the new growth theories since the mid-1980s, typified by Romer (1986, 1990), Lucas (1988) and Baro (1990), reconfirm the view that the accumulation of physical and human capital are the drivers of long run economic growth. The central idea of Lewis’s (1955) Traditional Development theory was that increasing savings would accelerate growth. Kaldor (1956) and Samuelson and Modigiliani (1966) studied how different savings behavior induced growth. A recent study of 32 countries by Krieckhaus (2002) notes that a higher level of national savings led to higher investment and consequently causes higher economic growth. The same ‘savings and economic growth’ relationship is applicable to Indian Economy.
Working paper was presented at University of Wollongong by Verma R. and E.J. Wilson E.J (2005), on ‘A Multivariate Analysis of Savings, Investment and Growth in India’. The paper considered per worker household, private corporate and public sector savings and investment, foreign capital inflows and economic growth for India in a multivariate setting for the period 1950-2001. The paper concludes that increases in savings are necessary condition for economic growth. In the research, strong links were detected from per worker household and private corporate savings to output in the long run and sectoral per worker savings to investment links in both the short and the long run. The table gave below shows high savings, high investment with high growth of GDP in post 1980 period.
DIAGRAM 2.3 (3)
Savings, Investment, Foreign Capital Inflows and Real GDP Rs. crore at constant prices

Life of Slum Occupants & Saving Pattern
41
Yukio Nishikawa, (2007), Senior economist, Japan Center for Economic Research, published a paper on January 25, 2007 on the topic ‘India: Higher Savings Rate holds key to sustained Growth’ According to him, India’s lagging economic growth as compared to China is mainly due to ‘savings shortages in India’. Yukio states that the reasons behind India’s low savings are- a) The economic factors like low PCI;
b) Cultural and Social factors such as industriousness and abhorrence of extravagance;
c) The aged ratio, workforce ratio, and other demographic factors.
Considering the current economic situation in India, one may not agree with the third reason, since current India is a young India, with more working population.
A study was conducted by Ramesh Mohan (2006), Bryant University on “CAUSAL RELATIONSHIP BETWEEN SAVINGS AND ECONOMIC GROWTH IN COUNTRIES WITH DIFFERENT INCOME LEVELS”, and was published in Economics Bulletin in 2006. Author in his paper studies the correlation between economic growth and domestic saving for several nations with different income level. Under this study the author tries to find out different countries with their income level. To study the relationship between economic growth and saving, researcher examined 25 different countries as per their income level. From the study out of 25 countries 3 are excluded on the basis of ADF test.
The logGDP and the logGDS of remaining 18 countries were examined by Johansen test to find out the co-integration; however it is found that in four countries there were no co-integration found and that were estimated by using the VAR model.
From the test it is found that in high income countries saving are dependent on economic growth, except Singapore where saving determines the economic growth. In upper-middle income countries there is bi-direction causality found. In these countries both the relation found i.e economic growth to saving and saving to economic growth. It is found from the study that these countries are in transition phase to high income countries.
Whereas in lower middle income countries it is found that there is same relation with high income countries. In lower middle income countries’ saving depends on economic growth. However, there is no relationship between saving growth and economic growth rate in Ecuador.
In case of low income countries it is found that in some countries there is bi-direction relation, in some countries economic growth to saving growth found and in some countries saving growth determines economic growth.
A study was conducted by Ahmad Zubaidi Baharumshah et al (2003), on “SAVING DYNAMICS IN THE ASIAN COUNTRIES”, and was published in Journal of Asian Economics in 2003. Under this study author studied the factors affecting the saving behavior in South Korea, Malaysia, Thailand, Philippines and Singapore with their capital inflow from foreign, income, interest rate and their dependency ratio. Under this study author divided this study in to four parts. First, foreign saving impedes domestic saving in short run and long run. Second, Ganger causality test used to examine relation between saving and economic growth. Third, interest rate affects the saving growth, fourth, to study the relationship between domestic and foreign savings in long run by using vector error correction model, Engle and Granger.
From the above study it is found that there is stable relationship between Gross National Product, Dependency ratio, currency account, interest rate, savings and its determinants.
Direct impact between saving and economic growth found in South Korea, Malaysia, Thailand and Singapore.
General perception about saving leads to economic growth, whereas author found in his study that there is no major relationship between saving and economic growth.
A study was conducted by Carmen Reinhart and Ernesto Talvion (1998), Department of Economics, University of Maryland on “Capital flows and saving in Latin”, and was published in Journal of Development Economics in 1998. The author in his study tried to find out the

Life of Slum Occupants & Saving Pattern
42
relationship between foreign saving and national saving of 24 countries including Latin America and East Asia. To find out the outcome study has divided into three parts. First, to study whether there is any possible regional difference in household preferences, the limitations of liquidity, the saving rate’s causes, the smoothing of consumption and response to capital inflows; Second, narrow down in evaluation between Latin America and East Asia; Third, examine the connection among national and overseas saving in the context of the specific country level.
From the study it is found that overseas savings and national saving are reverse relationship, and in both the constituency Latin America and Asia have same correlation.
A study was conducted by Rian Le Roux (2010), Head of Economic Research, Old Mutual Investment Group SA in 2010, on “The role of savings in the economy”, the study addresses the relationship between three entities of Savings which saving from Household, Companies and Government.
The author found that to cover the future outlays households’ essential save (children’s higher education, to buy durable goods, etc). Corporate houses saving are the part of net profit which is not distributed to shareholders in the form of dividend and kept for future expansion, to replace machinery, heavy advertisement for new product, etc and to meet uncertain future market. Government saves when their revenue income exceeds expenditure.
It is observed that Asian countries are heavily relied on foreign direct investment (foreign countries saving) which meets our temporary requirement. Our country over the last decades enjoyed major capital inflow.
However country like India cannot continuously depend on foreign investment. Normally foreign investors are fickle and any bad news over the health of the economy or worries about the future policy and government stability may results in withdrawal of foreign investment which creates sudden imbalance of foreign currency and creates balance of payment.
There for savings play an important role in any economy and its role is important at different levels.
A study was conducted by Nurudeen ABU (2010), Department of Economics, University of Abuja – Nigeria on “SAVING-ECONOMIC GROWTH NEXUS IN NIGERIA, 1970-2007: GRANGER CAUSALITY AND CO-INTEGRATION ANALYSES”, and was published in Review of Economic & Business Studies in June, 2010. The study addresses the relationship among economic growth and saving. With the support of Granger and co-integration methods author found the relationship among economic growth and saving in Nigeria from 1970-2007 period. As per Johansen co-integrated there is a long run relation found. In this study author recommended that government and policy maker should employ policy that would accelerate economic growth which ultimately results in increase of saving.
A study was conducted by Muhammad Zafar Iqbal et al (2012), it is found that domestic saving and credit extended to private players played an important role in the economic growth and for the development of Pakistan, for the study of economic growth and domestic saving author has analyzed data from 1973-2007. It is found that 1% increase in lending to private sectors results in 5.59% increase in gross domestic product of the country. From the above study author recommended to implement suitable policies to enhance the savings and credit in the country.
A study conducted by Siddiqui and Siddiqui (1993), studied saving behavior by type of assets and determined the sensitivity of different components of savings to change in its determinants. Household Integrated Economic survey (HIES) data was used for the analysis from 1968-69 to 1987-88 using WLS (Weighted Least Square). They concluded that Income, Employment status, Inverse of Income, Log of Income and log of square of Income were positively influencing Household Savings Dependency ratio was negatively influencing it.
A study conducted by Muradoglu and Taskin (1996), attempted to investigate issues relating to the differences in effectiveness of non-consensus variables in explaining household saving for developing versus industrial countries. The authors collected time series data of 19 developing countries and 11 industrial countries from 1975 to 1989. They found that effect of income growth, trend income and deviation of income from trend on savings was significantly positive; impact of real interest rate and inflation rate were

Life of Slum Occupants & Saving Pattern
43
significantly negative; real balance, foreign savings and dependency ratio had no impact in industrial countries. Trend Income, real balance and dependency ratio had negative parameter coefficients in saving equation. Income growth, deviation of income from trend, real interest rate, inflation rate, and foreign savings had no significant relationship with saving in developing countries.
A study conducted by Wakabayashi and Mackellar (1999), estimated standard life cycle hypothesis based on saving functions using panel data at the province level in China for the period 1993 to 1998. Impact of Income on saving appeared to be positive and dependency rate was estimated to have negative impact on saving in rural and urban areas of China. It was concluded that MPS for urban area was 0.2528 and 0.4538 for rural area.
A study conducted by Loayza et al (2000), defined the major important outcome of the newly completed World Bank investigation project. Based on various researches, author examined the various factors affecting private savings and the relationship among saving and economic growth. From the study it is analyzed that income has positive and major impact on private saving whereas percentage of return has negative and major impact.
A study conducted by Salam and Kulsum (2000), found determinants of savings by analyzing saving behaviour in India using time series data for the period 1980-89 for India. They concluded that an increase in income was bound to cause an increase in household savings, private savings, public savings and total savings. The Value of MPS was 0.2362, 0.0572, 0.0078 and 0.3012 for household sector, private sector, public sector and for whole economy respectively. It was also concluded that rate of interest had a net positive affect on Gross Domestic savings and household savings.
A study conducted by Ozcan et al. (2003), explained effects of a number of policy and non-policy variables on private savings rates using time series data for the period 1968-94 for Turkey. They concluded that previous year savings, Broad Money, Inflation rate, and terms of trade had positive relationship with private savings. Life expectancy and dummy for crisis years were negatively affecting private savings. Credit to private sector, income, growth of income, old dependency ratio, young dependency ratio, urbanization ratio, real interest rate, political instability, and current account deficit were found to have no impact on private savings in Turkey.
A study conducted by Ahmad and Asghar (2004), analyzed the household saving behavior due to different socio-economic and demographic factors in Pakistan using micro data collected by Household Integrated Economic Survey in 1998-99. The authors used Ordinary Least Square Method to estimate and choose data of 8933 rural households and 5374 of urban households. Results of the study revealed that income, employment status, square of age and Sex of household head were found to have positive effect on saving rates; wealth, dependency ratio, education levels and age of household head were negatively affecting household savings of rural as well as urban areas. MPS values were found 0.886 in overall Pakistan, 0.794 in urban Pakistan, and 0.940 in rural Pakistan.
A study conducted by Kibet et al. (2009), adopted a microeconomic approach in investigating the factors that influence savings among teachers, entrepreneurs and farmers. Cross sectional primary data of 359 households for 2008 were collected through multistage sampling technique. The study concluded that income had positive effect on savings of teachers, businessmen and farmers. Credit access, age, and
dependency ratio were found to have negative impact on saving of all household; age and transport cost of teachers, age of businessmen, and credit access of farmers caused a reduction in savings. It was also concluded that the values of MPS were 0.1577, 0.0605, 0.2558 and 0.1936 for all households, teachers, businessmen and farmers respectively.
A study conducted by Bendig et al. (2009), analyzed impact of remittances, risk exposure, shock experience on household savings of rural Ghana in 2008. Authors selected 2 villages of Ghana and surveyed 350 villages. The results of household size, schooling, assets, remittances, death in family, and other shocks were significantly more likely to save. Female head, self-employed, not employed, risk assessment, and Brakwa region were negatively related to savings. It was also concluded that age, square of age, land and illness had no impact on savings.

Life of Slum Occupants & Saving Pattern
44
As study conducted by Saltz, I.S. (1999), researcher found that there is direct co-relation among per capita income, consumption and saving rates. It is found that higher the per capita income higher the consumption and saving rates. In his study using Vector Error Correction model author studied 17 third world countries. From the study it is found that higher growth rates of real GDP contribute to a higher growth of savings.
As study conducted by Anoruo and Ahmad (2001), researcher by using Vector Error Correction model examined relationship among economic growth and saving rate of seven African countries. It is found that 4 out of 7 countries savings are affected by economic growth.
As study conducted by Mavrotas and Kelly (2001), under this study researcher studied relationship among gross domestic saving, gross domestic product and private saving were examined of India and Sri Lanka countries. It found that there is no relationship among gross domestic product and private savings in India. However, it is found that in Sri Lanka there is Bi-directional effect were found.
As study conducted by Baharumshah et al. (2003), to found the behavior of saving growth rate in his study researcher has taken five Asian countries: South Korea, Malaysia, Thailand, Singapore and Philippines. To study this behavior researcher concluded data from 1960 to 1997 by using the Vector Error Correction model. It is found that except Singapore there is no direct relationship among saving to economic growth.
2.4.1 Savings in India: A study was conducted by Ramesh Jangili (2011), on “Causal Relationship between Saving, Investment and Economic Growth for India – What does the Relation Imply?”, and was published in Reserve Bank of India Occasional Papers in summer 2011. In his study researcher explored the relationship among economic growth, saving and Investment of India from 1950-51 to 2007-08 data.
Author found that gross domestic saving growth rate has increased from lowest level of 0.0 % in 1950-51 to 37.7 % in 2007-08 as per diagram 2.4.1 (1). During that period there was substantial positive and strong correlation among growth rate and saving rate was observed. During that period economic growth rate was increased from 10.7 % in 1950-51 to all time high of 39.1% in 2007-08. There is significant co-relation among domestic saving and domestic investment.
DIAGRAM 2.4.1 (1)

Life of Slum Occupants & Saving Pattern
45
Gross domestic saving includes three part, Household saving, Corporate Saving and Government saving. India’s gross domestic saving has consistently increased over time but their composition has experienced a sizeable change as per Diagram 2.4.1(2).
As per diagram the major changes were notices in Government saving. Shortfalls of the domestic saving were met from household and little bit from Private saving, as their growth rate was continuously shown upward sign. .
DIAGRAM 2.4.1 (2)
Similar compositional changes has found in investment as well. Till late 1980s public investment rate was dominant and reached up to 12 % in 1986-87. With liberalization in initial 1990 roll of public sector gradually decreased in many sectors and its position taken over by private sector. Therefore private sector investment gradually increased replacing the declined public sector investment although public sector overall investment was stagnant at around.
Public sector investment was 50% till 1980s and it declined to 23% in 2007-08. On the other hand whereas private sector investment was only little more than 20% in 1980s has rapidly moved to 40% in 2007-08. Along with these household investment also increased from 3.2% in 1963 to 14.2% in 2004-05. Though household sector total investment was approximately stay at same.
DIAGRAM 2.4.1 (3)

Life of Slum Occupants & Saving Pattern
46
From Granger causality test researcher found that there is a direct relationship among the saving and investment to economic growth of the country.
Asis Kumar and Nirbachita (2007), Pain in his article, 'Household Savings in India: Determining Factors and Status', observes that there was a steady increase in the national saving rate in India during the post-independence period. A comparison with various countries (both developed and developing) of the world shows that India shown a high saving rate as compared to various different countries, except those in East Asia. In fact many developed countries like Australia, New- zealand show negative savings, i.e. -2.2% and -6.5% in the year 2003. So the evidences show less propensity to save with high income. Mr. Pain further has observed that, in India household savings accounted for nearly 90% of the national savings. The table given below also proves the fact household savings are the major contributor towards national savings which results into economic development.
TABLE 2.4.1 (a) Sector –wise Domestic savings (Rs in crore)
While studying saving behavior of household sector, the author has observed that, average urban household savings are 2.6 times larger than their rural counterpart. According to the article, the weaker section of the society has higher saving rates, which suggests that the vulnerable save largely for precautionary reasons.
According to Rajesh Shukla (2007), the author of the survey report on ‘How India Earns, Spends and Saves- Result from the Max New York Life Insurance and NCAER in 2007, a financially secure country cannot be built on the base of a small population of financially secure households. If all individuals are financially protected, nation will emerge stronger financially. The study is based on a probability sample comprising of 63,016 households out of a preliminary listed sample of 440,000 households, spread over 1,976 villages and 2,255 urban wards. The average household in India has an annual income of 65,041/- and an expenditure of 48,902/- leaving it with a surplus of 16,139/- to save and invest. An average urban household saves nearly double than that of a rural household. Earning, Expenditure and saving patterns are a function of age, occupation, education and location. The report says that due to the lack of social security system, over 80% of Indians save. The report states that Indian households have various motives for keeping some money separately as savings, for the purpose of emergencies, marriages, social events, house purchase old age security etc. The survey clearly states that out of total savings, 36% savings are kept at home, 51% are kept as a liquid cash in the form of bank deposits, around 5% are invested in post-office saving bank, 6% is saved in chit funds, co-operative credit societies and only 2% in insurance.
As study conducted by Upender et al. (2007), researcher examined savings behavior of the Indian economy in terms of change of growth rate of national savings and income elasticity of the domestic savings at the aggregate and disaggregated levels during the post economic reform period.

Life of Slum Occupants & Saving Pattern
47
Some of the findings of their study are – (i) there is no change in the growth rate of the national savings both at aggregate and disaggregated levels
throughout post economic reform period;
(ii) (ii) There is no shift in the scale of income elasticity of savings of private, public and household sectors during post economic reform period.
From the above discussions one can understand that small savings mobilization is of utmost importance which will stabilize Indian economy.
2.4.2 Small Savings: A Small Saving scheme has always become an important source of household savings in India. These schemes have been tremendously famous amongst a large number of small investors in India who want to invest in a secure instrument. At the same time, these instruments have been treated as resources of providing social benefit to the small savers.
As per Ministry of Finance (2011), Small Savings Schemes was started back in 1882 when Post Office Savings Bank was started in the country. Post Office Savings Bank was nominated as Government Savings Bank vide Section 3(B) of Government Savings Bank Act 1873 and its core object was to inspire habit of savings in all parts of society and to bring the small savings into the mainstream economy for building the nation.
The government framed various small saving schemes to meet the desired needs of the different groups of small investors. In respect of each scheme central government framed various statutory rules to govern the various scheme comprising their maturity period and rate of interest. The schemes are operated all over the country of about 1.5 lakh post offices.
Under the main three head Small savings instruments are classified. 1 Postal Deposits
2 Saving Certificates
3 Social Security schemes
Postal Deposits: Postal saving comprise recurring deposits, savings account, monthly income scheme (MIS), time deposits of varying maturities and.
Saving Certificates: Saving certificate includes National Small Savings Certificate VIII (NSC) and Kisan Vikas Patra (KVP).
Social Security schemes: Social Security includes public provident fund (PPF) and Senior Citizens Savings Scheme (SCSS).
Among all above the main plan are Monthly income Scheme and Kisan Vikas Patra these two contribute around 50% of the total deposit at the end of March 2010.
Trend in small Saving Collections: The yearly growth rate of small savings showed a sharp instability reflecting the changing public preference and it shows the relative attractiveness of alternative savings tools, mainly commercial bank deposits. The trend of net small saving collection over a period of last twenty years can be seen in Diagram 2.4.2(1). The composition of the net collection can be seen in Diagram 2.4.2(2)
Table no. 2.4.2 (a) Growth in Small Savings Deposits vis-à-vis Bank deposits
Growth
Outstanding
Outstanding Rate in Aggregate Growth Rate Small Small Bank in Bank Savings Savings Deposits (` Deposits (Per Collections (` Deposits
Year Crore) cent) Crore) (Per Cent) 1 2 3 4 5

Life of Slum Occupants & Saving Pattern
48
1999-00 8,13,345 2,14,791 2000-01 9,62,618 18.4 2,60,149 21.1 2001-02 11,03,360 14.6 3,04,057 16.9 2002-03 12,80,853 16.1 3,64,390 19.8 2003-04 15,04,416 17.5 4,35,241 19.4 2004-05 17,00,198 13.0 5,32,029 22.2 2005-06 21,09,049 24.0 6,17,116 16.0 2006-07 26,11,933 23.8 6,74,611 9.3 2007-08 31,96,939 22.4 6,73,589 -0.2 2008-09 38,34,110 19.9 6,64,137 -1.4
2009-10 44,92,826 17.2 7,28,447
2010-11 (RE) 7,93,447
DIAGRAM 2.4.2 (1) Trends in small saving collections over last twenty years
120000
100000
80000
60000
40000
20000
0
-00
-01
-02
-03
-04
-05
-06
-07
-08
-09
-20000
1999
2000
2001
2002
2003
2004
2005
2006
2007
2008
-40000
The share of small savings as a percentage of net financial savings of households improved rapidly from 7.9% in 1996-97 to 22.3% in 2004-05. Afterward, it fall down and turned to negative during 2007-08 and 2008-09 as the other savings schemes turn out to be comparatively more attractive. The share was only marginally positive during 2009-10 (RE) and is expected to increase modestly in 2010-11 (BE). Since 2005-06, the rate of growth of small savings was lower than that of aggregate deposits of commercial banks.

Life of Slum Occupants & Saving Pattern
49
DIAGRAM 2.4.2 (2)
Small savings that are savings by low income group people from rural and urban areas of the country were considered a priority concern of the Indian government. National Saving Organization (NSO) was created in 1948. The constitution of India, adopted in 1949, lists the Post Office Saving Bank in its seventh schedule Item No.39, utilizing the Government Savings Certificates Act of 1959, Government Savings Bank Act 1873, Public Provident Fund Act 1968; the Ministry of Finance framed numerous small savings plans under these acts.
Small savings schemes are planned to provide safe and eye-catching investments options to the public and at the same time to generate resources for development. The emphasis, as the words ‘small savings’ suggest, is to bring the small depositors into the fold of savings movement. These schemes are running in all the post offices, throughout all over India. PPF scheme is also found in almost all 8,000 branches of public sector banks in addition to the post offices. Deposit schemes for retired people are operated through selected branches of public sector banks only.
Professors Scher and Yoshino (2004), have written and edited a provocative analysis of the contribution of postal savings in small savings in India in the book,’Small Savings Mobilization and Asian Economic Development – the role of Postal financial services’ (2001). This book is the result of more than a decade of work and field research on postal savings. According to the authors, postal saving systems in the countries where they exist provide more access points for savers than all the world’s bank branches combined. According to them, postal savings has long served as an effective method to provide basic savings and other financial services. These remains in many countries including India the only safe means to accumulate small savings for households and individuals, especially those who are financially excluded, such as the economically disadvantaged, rural population, the urban poor and others who are socially discriminated against particularly women, who often play an important role in local commerce, and all those who are unserved by other formal financial institutions.
Dhirendra Swarup and Anil Bhattachaya (2004), in their paper on ‘The National Saving Organization and the status of small savings in India’ observed that India has by far the world’s most extensive postal savings network. There are approximate 200 million families in India (2000). As of 31st March 2000, there were 114 million accounts under small savings and it was estimated that some 50 million households were small

Life of Slum Occupants & Saving Pattern
50
savings depositors. Small savings collection represents about 3.5% of the GDP in India. The authors have listed out a number of reasons behind growth in small savings with Post Office Savings Bank such as – a) Convenient instruments developed by NSO.
b) Government’s sovereign guarantee.
c) Wide scale canvassing done for small savings on a commission basis by extension agencies.
d) Easily affordable small savings plans.
e) Tax incentives and insurance provisions.
f) User friendliness of the system.
Although small savings promotion heads the priority list of Indian Financial Policy, as observed by V.Arockia Jerold (2008) in the article, “Financial Inclusion and Literacy in India – A Critical Study”, author found that it is very difficult to provide privilege service to large population. According to the article, on an all India basis in year 2005, it is found that around 59% of the adult people in the country have bank accounts. Therefor remaining 41% of people do not have bank account. In rural areas the coverage is 39% against 60% in urban areas. Some of the perceived difficulties in doing banking business with low income group customers include – small sized transaction, customers scattered over wide areas, difficulties in generating local knowledge. Therefore as stated in this article, small savers in rural areas depend on unorganized financial system. It also provided solution for financial inclusion. As stated in the article, huge manpower in banks which has become surplus due to core banking solutions can be reoriented to take up the challenge of advising rural masses and bring them into the fold of banking and credit.
D. Muraleedharan’s (2003) observations are similar to V. Arockia Jerold in case of dominance of unorganized sector in savings of low income group people in India. D. Muraleedharan in his book, 'Savings Mobilisation in Household Sector' observes that in South India, Particularly in Kerala, average saving per household is higher in urban areas than in rural areas. The composition of savings shows that savings in financial assets is higher than savings in physical assets, amongst financial assets savings in chit funds is maximum. The reasons which the author has given are – self liquidating loan, borrower need not reveal loan purpose, local character of chit funds, and more customers friendly.
The above review shows dominance of cash, unorganized and postal savings in case of small savings in all India level. Since study area of this research being a small region of Maharashtra, it becomes essential to review small savings in Maharashtra.
2.4.2.1 Small Savings in Maharashtra: According to major outcome of Economic Survey of Maharashtra (2005-06) published by Directorate of Economics and Statistics, Planning Department, Government of Maharashtra – a) The Maharashtra state achieved more than targeted 8.0% GSDP growth.
b) Income of Maharashtra state at current price of 2004-05 is estimated at Rs.3, 28,451 crore.
c) Maharashtra state’s 45% of the population age are in the age group of 15-40 years, which shows this state is a young state and good opportunities for development.
d) With regards to bank deposit and credit Maharashtra stood first in India.
e) In the financial year 2004-05, collection from small saving was Rs 14981 crores which was more than targeted Rs. 11171 crores.
As Sanchaya report provided by the’ Directorate of Small Savings Finance Department, Government of Maharashtra’, from the report is is found that to attract the small investor government of India introduced scheme in 1955-56 with sharing among state and center. Government of India and Planning commission recommended for establishment of small saving in all the states. Thereafter government of Bombay under finance department decided to form directorate of small savings on 3rd January, 1957. The scheme has rich network of agents for promoting small savings schemes.
Under small saving types of agencies are as follows:

Life of Slum Occupants & Saving Pattern
51
1. Standardized Agency System (SAS)
2. Mahila Pradhan Kshetriya Bachat Yojana Agency (for women)
3. Public Provident Fund Agency
To run these three schemes there are around 120,000 agents are continuously working for the same. The table given below shows the state-wise volume of small savings in India from April to August 2007 as compiled by NSI. The data shows that maximum small savings collection is in the state of Maharashtra. However small savings are showing decline in the year 2007 as compared to the year 2006.
TABLE 2.4.2.1 (a) Growth in Small Savings Deposit vis-à-vis Bank Deposits (Rs in Crore) Year Outstanding
Aggregate Bank Deposit
Growth Rate in Bank Deposit
(%)
Outstanding Small Savings Collection
Growth Rate in Small Savings deposits (%)
1999-00 813345 Nil 214791 Nil 2000-01 962618 18.40 260149 21.10 2001-02 1103360 14.6 304057 16.90 2002-03 1280853 16.10 364390 19.80 2003-04 1504416 17.50 435241 19.40 2004-05 1700198 13.00 532029 22.20 2005-06 2109049 24.00 617116 16.00 2006-07 2611933 23.80 674611 9.30 2007-08 3196939 22.40 673589 -0.20 2008-09 3834110 19.90 664137 -1.40 2009-10 4492826 17.20 728447 8.80 2010-11 00 00 793447 8.20
However savings growth is dependent upon many factors like saving awareness of the people, their income, socio-economic conditions etc.
Fast improvement in these factors will obviously lead to growth in savings. Recent estimates show that still a lot has to be done in this area in Maharashtra. According to news posted by ‘Samachaar.in’ posted on Tuesday January 13,2009, According to urban development sources, about ten years ago in 1998, the percentage of urban below poverty line (BPL) families in Maharashtra was 12% and now a state government survey has shown an increment in the percentage as compared to the previous figure. The Maharashtra state government's survey, covering 156 small towns, confirms that more than one-fifth of the 11 lakhs families still live below the poverty line. The survey highlights the hollowness of tall claims of economic development made by the Maharastra government.This survey was carried out by NSS volunteers, college students, educated unemployed youths and staff from local bodies during the last two years in level 2 and 3 towns' households including towns such as Ambernath, Badlapur, Alibaug, Lonavala, Baramati and Mahabaleshwar. The findings also disclosed that 21 percent of these households comprising of 2.42 lakhs families get less than Rs 591 for each person per month-the minimum level set by the central government to identify Below Poverty Line (BPL) families.
Prachi Jambhekar, Deputy Director of directorate of municipal administration which carried out the survey , said, "These 2.42 lakhs families failed almost all the 54 socio-economic and educational indicators set by us to determine BPL families. To cross the BPL a family of four should have a joint monthly income of more than Rs 2,364 i.e. Rs 591 each person".
T.C. Benjamin, Principal Secretary, Urban Development Department estimated that the BPL data in all urban and semi urban cities in Maharashtra has increased up to 18%. He said, "Migration of the rural poor to cities has contributed to the rise of BPL families in urban centers but such a huge rise needs a more scientific explanation. "However Ratnakar Maahajan executive president of the state planning board felt that the increase in BPL families in urban areas is natural. "The rural poor are relocating to cities in the hope of employment. All state funded poverty alleviation programmes provide relief from stress but fail to address the crucial issue of regular employments and a steady source of income."

Life of Slum Occupants & Saving Pattern
52
2.5. Measurement of the Level of Quality of Life, Most of the migrants to the cities come from rural areas who get attracted due to descent living but the problem of unemployment forced them to be landless, homeless, jobless and without any financial means to occupy the residential houses legally. Hence, the poor people have been forced to constructs their houses on vacant land and they live as illegal occupant of the city. This type of squatting creates conflict with those
2.6. SUMMARY: Current Indian economy with a great potential to be one of the powerful economies of the world, is still lagging behind due to deficiency in its human and money capital. Rural as well as Urban India is still deprived of basic infrastructural facilities. A large number of urban populations are living in slums. As been observed by Madhura Swaminathan, and Mr.Biswaroop Das the slum population which is fast growing in numbers is living in degraded atmosphere not suited to human inhabitation. Growing slums is the product of underdeveloped rural India. A country in which large masses have to put up a great struggle to get basic minimum necessities of life, is definitely lagging behind where development of human capital is concerned. According to Trond Vedeld and Abhay Siddham, policymakers and leaders are more busy in demolition of slums than upgradation of slums. However the authors’ description of New Delhi slums where majority population is employed, literate and are working for self-development, somewhere indicates beginning of Human Resource Development process. Research work by Somik Lall, Ajay Suri and Uwe Deichmann also supports the view that slum population is working towards self-development. As per their findings slum inhabitants are saving more so that they can finance their own development efforts.
However more comprehensive research has to be done in this field so that deficiencies of Government created system for development of human capital can be located. Development of more capable, more aware household is the immediate requirement of the Indian economy. This in turn will also develop money capital of the country. R. Verma and E.J. Wilson as well Yukio Nishikawa have strongly recommended growth in savings which will result into investment and thus economic growth. Gerald Jackson claims that ‘without savings there can be no Economic Growth’. Saving and economic growth relationship has been established by early Harrod-Domer models and Neo classical model by Solow then was pursued by many researchers. According to Ramesh Mohan it is increased income of the country which results into more savings. However what is important for the Indian economy is to increase its savings. From the view point of Asis Kumar Pain, it is low income group which has higher propensity to save. So effective mobilization of small savings of Indian households become more important. Considering these factors, this study which covers savings of slum deweller become more meaningful. Like Asis Kumar Pain, many research scholars have made their own contributions towards study of small savings in India. According to Rajesh Shukla, preferences given to investments in insurance sector are very low amongst low income group. According to D. Muraleedharan, poor prefer to save more with unorganized sector especially chit funds and he also stresses that the chit funds can be effectively utilized by government for mobilization of small savings. According to Dhirendra Swarup and Anil Bhattacharya National Savings Organization has been very effective in mobilizing small savings. However Arockia Jerold feels that although government created savings options are good but awareness amongst poor people about these options and its benefits is less and thus these people are still relying upon unorganized sector.
Some research studies describe socio-economic conditions of slum deweller, some have given reason behind growth of slums, some talk about sources of earnings of slum inhabitants only, whereas some have focused on their modes of savings. This study tries to put all these aspects, from socio-economic conditions, to income distribution and saving behavior of slum dweller. The study also tries to find rationale behind all economic behavior of slum inhabitants.

Life of Slum Occupants & Saving Pattern
53
CHAPTER – III
STUDY OF ECONOMIC ASPECTS OF SAMPLE AREA

Life of Slum Occupants & Saving Pattern
54
3.1. INTRODUCTION
3.2. OVERVIEW OF SELECTED AREA
3.3 STUDY OF SELECTED SULM AREA
3.3.1 SOCIO-ECONOMIC CONDITIONS OF THE SAMPLE AREA
3.3.2 FINANCIAL ANALYSIS OF SLUM DEWELLER IN THE STUDY AREA
3.3.3 SAVING BEHAVIOR OF SLUM DEWELLER IN THE SAMPLE AREA
3.3.4 HAPPINES LEVEL OF SLUM DWELLERS IN THE SAMPLE AREA
3.3.5 RESEARCH ON SAVING OPTIONS OF SLUM DWELLERS IN THE SAMPLE AREA
3.4 FACTORS AFFECTING QUALITY OF LIFE IN SLUMS
3.5. SUMMARY

Life of Slum Occupants & Saving Pattern
55
3.1. INTRODUCTION The global financial melt-down and its inevitable impact on Indian economy due to globalization can act as an eye-opener to Indian citizens and policy makers. The current economic situation demands development of country’s own capital and reduce its reliance on foreign capital. This increases importance of saving mobilization, that too mobilization of small savings. Indian government has developed a system through which small savings across the country can be tapped. However considering the potential of the economy, still growth rate of small savings is low. Reasons behind this slow growth lies somewhere between income distribution, socio-economic conditions of low income group, policy designing and policy implementation by government. This study makes an attempt to analyze the socio-economic conditions of slum dweller of Mira-Bhayander Municipal Corporation, their income distribution, saving pattern, rationale behind their existing saving pattern, their happiness level and various factors affecting in their life.
First of all, a brief introduction of the Mira-Bhayandar is given. Mira-Bhayandar is a suburb of Thane, located in the north of Mumbai in the konkan region, and administered by Mira-Bhayandar Municipal Corporation (MBMC). Total area under Mira Bhayandar Municipal Corporation is 79 Sq. K.M. and 8,14,655 populations as per 2011 census report. Mira Bhayandar Municipal Corporation is spread along Chena, Kajupada to Uttan Junction, Dahisar Check Naka Penkar Pada to Bhainder East Jesal Park, R N P Park.
As per WIKIPEDIA, Population in Mira-Bhayandar on the basis of Religions.
Table No: 3.1 (a) Religions in Mira-Bhayandar
Religion Percept Hindus 53%
Muslims 30%
Buddhists 8.6% Christians 3.4%
Jains 4.7%
Others† 1.3%
Distribution of religions †Includes Sikhs (0.2%), Buddhists (<0.2%).
There are total 35 slums under Mira Bhayandar Municipal Corporation (MBMC). 20 slums are stabilized on government land and remaining 14 slums are stabilized on private land.
As per Mira Bhayander Municipal Corporation List of Slums under Mira-Bhayander Municipal Corporation,
Table No: 3.1 (b) Mira-Bhayander Municipal Corporation,
as per 2001 Census Sr. No. Areas Name Ownership Slum House Population
1 Adarsh Indira Nagar, Navghar Bhayander (East), Government 668 1996 2 Dr. Ambedkar Nagar, Bhayander (West) Government 1622 4812 3 Anna Nagar, Bhayander (West) Government 78 220 4 Sena Nagar , Godddev, Bhyander (East) Government 40 252 5 Sainath Sevanagar Ghodbunder Government 181 704 6 Kashichurch Jopadpatti Government 283 349 7 Kashimira Jopadpatti (Dongri) Government 1590 3717 8 Bhraham Dev, Morva Government 101 165 9 Morva Bhaat Government 83 225

Life of Slum Occupants & Saving Pattern
56
10 Shivneri Nagar, Rai Government 359 1899 11 Murdhakhadi Government 597 269 12 Sadanand Nagar, Murdha Government 678 2872 13 Indira Nagar Devtalav (Bhatebunder) Government 93 356 14 Lalbahadur Shatrinagar, Uttan Government 248 648 15 Moti Nagar, Bhayander (West) Government 143 429 16 Jay Ambe Nagar 1-2, Bhyander (West) Government 939 2600 17 Ganesh Deval Nagar, Bhayander (West) Government 2285 4602 18 Indira Nagar Kothar, Bhayander (West) Personal 213 852 19 Harishchandra Nagar, Bhayander (East) Personal 97 291 20 Saibaba Nagar, Bhayander (West) Personal 38 87 21 Hanuman Nagar, Bhayander (West) Personal 61 126 22 Magla Bunder (Jay Bajrang) Bhayander (West) Personal 90 222 23 Om Shiv Saibaba Nagar Bhayander (West) Personal 48 120 24 Kajupada Personal 89 267 25 Chena Velnkani Pada Personal 74 222 26 Chena Patil Pada Personal 43 129 27 Daachkul Pada Personal 62 156 28 Mashacha Pada Personal 52 195 29 Kashivibhag, Kashigaon Personal 35 420 30 Modern Company, Jopadpatti Personal 279 459 31 Gandhinagar, Bhyander West Personal 400 1572 32 Lalbahadur Shatrinagar, Bhayander (West) Government 585 2460 33 Nehrunagar, Bhayander (West) Government 497 1491 34 Naajreth Aagar Government 53 162 35 Bandarwadi Railway Dept. 128 369
Total 12832 35715
DIAGRAM no: 3.1 (1) Slums under Mira-Bhayander Municipal Corporation
The researcher has purposively selected 40% slum area (Fourteen Slums) out of 35 slums of the universe area. Further researcher has purposively selected 10 slum areas which are situated on government land and remaining 4 slums selected which are situated on private land for the study. In order to get the first hand information researcher has purposively taken the response of 549 respondents from all the 14 sample of the study. It is also the slum most nearby to the researcher. As a result continuous observation of the sample area is possible. Although the questionnaire technique is used to collect the primary data, still a regular and minute observation of the sample area is required to understand various issues like what factors influence savings of the people, is job, the only source of their income, why even children have to earn etc. The sample

Life of Slum Occupants & Saving Pattern
57
area, if it is more familiar to the researcher, enables the researcher to understand the circumstances and the environment that the particular slum inhabitants face so that various small aspects affecting socio-economic behavior of slum population will also be covered to fulfill all objectives of the study.
The socio-economic conditions of inhabitants of sample area are studied because they provide insight into why these people have temporary jobs, why these people are unable to shift their houses away from slum area. These are analyzed in sub chapter 3.3.1 with the help of statistical data and presented in the form of tables, bar diagrams and pie charts.
The sub-chapter 3.3.2 analyzes, ‘financial analysis of slum dweller’ and tries to find out various sources of income for slum population and which created a base for the first hypotheses of the study, ‘The head of the slum households are the real contributors to the family income.’
The sub-chapter 3.3.3 elaborates ‘saving behavior of slum dweller’. This analysis provided as a base for second hypotheses as mentioned in the first chapter and has led to important suggestions for policy makers and financial institutions.
The Sub-chapter 3.3.4 analyzes, ‘happiness level of slum dweller’. This analysis provided as a base for third hypotheses as mentioned in the first chapter.
The sub-chapter 3.3.5 analyses ‘research on saving options’. This analysis provided a base for fourth hypothesis as mentioned in the first chapter.
The sub-chapter 3.4 analyses ‘factors affecting quality of life in slums’.
3.2. OVERVIEW OF SAMPLE AREA:
The researcher has purposively selected 40% slum area (Fourteen Slums) out of 35 slums of the Universal Sample.
Table No: 3.2 (a) List of Selected Sample Sample Name
Sr. No. Slum Name Ownership 1 Adarsh Indira Nagar, Navghar Bhayander (East) Government 2 Dr. Ambedkar Nagar, Bhayander (West) Government 3 Ganesh Deval Nagar, Bhyander West Government 4 Kashimira Jopadpatti (Dongri) Government 5 Jay Ambe Nagar 1-2 Government 6 Bhraham Dev, Morva Government 7 Moti Nagar, Bhayander (West) Government 8 Shivneri Nagar, Rai Government 9 Sadanand Nagar, Murdha Government 10 Anna Nagar, Bhayander West Government 11 Daachkul Pada Personal 12 Mashacha pada Personal 13 Kashivibhag, Kashigaon Personal 14 Indira Nagar Kothar, Bhayander (East) Personal
1 Adarsh Indira Nagar is the sample area which is one of the biggest and oldest slums situated in Bhayander (East) near to S.N. College. Adarsh Indira Nagar is located at Latitude: 19°18'32.44" N and Longitude: 72°51'59.95" E, has around 1200 slum house and around 5000 population. It is one of the oldest slums in Mira Bhayander Municipal Corporation. In 1980’s Adarsh Indira Nagar was just a small bunch of huts surrounded by forest and hills. Now the jungle has been converted into a closely packed small houses made up of cement with tiled or cement sheets as roofs with literally no ventilation and air circulation. Most of the settlements here were originally illegal which were made legal by MBMC later on. Slum inhabitants are basically unemployed people from rural areas of Maharashtra, Gujarat and U.P.

Life of Slum Occupants & Saving Pattern
58
who got established here either as industrial workers or got other types of low income jobs like that of as a driver, watchman, Construction labor, Carpenter, their own business, etc. Many of the families here claim to be residing since 1980’s.
Adarsh Indira Nagar has 15 chawls namely Eakta Nagar, Ganesh Gali, Sai Chawl, etc. It does not have tall buildings, but a long array of chawls, with common sanitation and common municipal water facility with just a three-four feet of space between two rows of houses, where bicycle or bike is the only vehicle which will go on the cement pathway made between two rows of chawls, only mode of immediate transportation possible in case of emergency.
This slum has got locational advantage. It is surrounded by a large number of residential complexes and Industrial area like Vaibhav Nagar, Salasar Nagar, Shirdi Nagar and many Small Scale industries. which provides various sources of earning to slums inhabitants. This area is very close to S.N. College of Junior and Commerce College. This area has one municipal garden, its own market and state transport bus facility. This area lacks from sufficient sanitation facility and even people are bound to use open space in absence of sufficient sanitation.
Majority that is around 85% of inhabitants are Hindus, 10% are Muslims and only 5% are others. There are two Hindu temples and one Mosque. The surrounding area has two private, three nationalized and one co-operative bank. However the slum itself has 2 chit funds, 3-4 co-operative credit societies and 2-3 main jewelry shops that run private gold-funds. All these institutions are private and unregistered and thus become a part of unorganized financial sector.
2 Dr. Ambedkar Nagar, Bhyander (West) is the sample area which is one of the biggest and oldest slums situated at Bhayander (West) towards uttan road. Dr. Ambedkar Nagar is located at Latitude: 19°17'48.12" N and Longitude: 72°50'29.13" E, has more than 2500 slum houses with population around 8500 in this slum. It is one of the oldest slums in Mira-Bhayander Municipal Corporation. In 1950’s Dr. Ambedkar Nagar was just a small bunch of huts surrounded by forest. Now the jungle has been converted into a big ocean of closely packed small houses made up of cement with tiled or cement sheets as roofs with literally no ventilation and air circulation. Slum inhabitants are basically unemployed people from rural areas of Maharashtra, Gujarat, U.P. and from various places of south Indian part who got established here either as industrial workers or got other types of low income jobs like that of as a driver, watchman etc. Many of the families here claim to be residing since 1950’s.
Dr. Ambedkar Nagar is divided in 25 chawls with numeric number for identification of chawls. It does not have tall buildings, but a long array of chawls, with common sanitation and common municipal water facility with just a three-four feet of space between two rows of houses, where bicycle or bike is the only vehicle which will go on the cement pathway made between two rows of chawls, only mode of immediate transportation possible in case of emergency.
This slum has got one locational advantage. It is surrounded by a large number of residential complexes, shopping complex and Industrial area like Burhani Nagar, Chandmal Nagar, Padmavati Nagar, Maxus Mall and Maxus Cinema. This provides various sources of earning to slums inhabitants. This area has one municipal and two private schools, its own market and state transport bus facility. This area lacks from sufficient sanitation facility, present sanitation condition is very poor.
Majority of the slum houses, that is around 75% of inhabitants are Hindus, 15% are Muslims, 5% are Christians and 5% are others. There are three Hindu temples and one Mosque. Within two kilometer distance this area has two private, three nationalized and one co-operative bank. However the slum itself has 2 chit funds, 3-4 co-operative credit societies and 5-6 main jewelry shops that run private gold-funds. All these institutions are private and unregistered and thus become a part of unorganized financial sector.
3 Ganesh Deval Nagar, Bhyander West is the sample area which is the biggest and youngest slum situated in Bhayander west is located at Latitude: 19°18'25.47" N and Longitude: 72°50'41.30" E, it has more than 4500 slum houses and population around 22000. As per census 2001 there were only 2285 slum houses and 4602 population in this slum. As per researchers observation this slum record highest level of population with highest degree of increase in household and population. This slum is situated in Bhayander west towards open area of Bhayander khadi, where highest chances for its development. In

Life of Slum Occupants & Saving Pattern
59
1990’s Ganesh Deval Nagar was just a small bunch of huts surrounded by forest. Now the jungle has been converted into a big ocean of closely packed small houses made up of cement with tiled or cement sheets as roofs with literally no ventilation. Most of the settlements here were originally illegal which were made legal by MBMC later on. Still on yearly basis continuous illegal constructions are made. Slum inhabitants are basically unemployed peoples from rural areas of U.P. and small portion of Nepali, Researcher found that 90% of the migrated are from U.P., who got established here either as industrial workers, own business or got other types of low income jobs like that of as a construction labor, driver, watchman, sweeper, etc.
Ganesh Deval Nagar does not have tall buildings, but a long area of chwals, with majority of people using common sanitation and common municipal water facility with just a three feet space between two rows of houses, where bicycle or bike can be used as immediate mode of transportation during emergency. Researcher found that around 30% of the houses are kucha and they don’t have basic necessities items in their home.
This slum has got one locational advantage. It is surrounded by a large number of residential complexes and industrial area which provide various sources of earning to slum inhabitants. The area has one municipal hospital and around 25-30 private dispensaries, one private schools, its own market, and Majority that is around 90% of inhabitants are Hindus, 5% are Muslims, 2% are Nepali and only 3% are others. There are 5 Hindu temples and one Mosque. The surrounding area has three private, two nationalized and one co-operative bank. However the slum itself has at least 10-12 chit funds, 4-5 co-operative credit societies and 4-5 main jewelry shops that run private gold-funds. All these institutions are private and unregistered and thus become a part of unorganized financial sector.
4 Kashimira Jopadpatti (Dongri) is the sample area which is one of the biggest and oldest slums situated at Mira Road (East). Kashimira is located at Latitude: 19°16'21.03" N and Longitude: 72°53'04.13" E, it has more than 2000 slum houses and around 4900 population. It is one of the oldest slums in Mira-Bhayander Municipal Corporation. In 1980’s Kashimira dongri was just a small bunch of huts surrounded by forest and hills. Now the jungle has been converted into a big ocean of closely packed small houses made up of cement with tiled or cement sheets as roofs with literally no ventilation and air circulation. Slum inhabitants are basically unemployed people from rural areas of Maharashtra, Gujarat, Rajasthan, M.P. and U.P. who got established here either as industrial workers, own business or got other types of low income jobs like that of as a construction worker, carpenter plumber, driver, watchman etc. Many of the families here claim to be residing since 1980’s.
Kashimira dongri is divided in 20 chawls with numeric number for identification of chawls. It is developed on the entire hills behind kashimira police station. This slum has got one locational advantages it is near to the western express highway and developing area which provides various employment opportunities to the slum occupant. This area has three private school, three Hindu temples, one mosque, one bank with ATM facilities, one credit co-op society, one computer classes, four jewelry shops, state transport bus facilities and around 6-7 private dispensary. Majority that is around 85% of inhabitants are Hindus, 12% are Muslims and only 3% are Christians. Majority of migrates are from U.P. and Bihar.
5 Jay Ambe Nagar 1-2 is one of the oldest and biggest slums situated in Bhayandar west outside the main city and near to Bhayander station is located at Latitude: 19°18'56.06" N and Longitude: 72°50'59.73" E, it has more than 1500 slum houses and around 4200 population. This slum is divided in two parts Jay Ambe Nagar 1 and 2. Majorities of the households are migrated from Maharashtra, U.P., and Bihar. Large population of the Jay Ambe Nagar 1 is dependent on fishing business and relatively poor than Jay Ambe Nagar 2. This area has one big fish market in between two areas, one government Park, three temples, five private dispensary and around 80% of the houses are made from Pucca construction.
6 Bhraham Dev Nagar, Morva is the sample area which is one of the oldest Slums situated in Bhayander west towards uttan road is located at Latitude: 19°17'55.24" N and Longitude: 72°50'09.23" E, it has more than 175 slum houses and around 335 population, during 1990 Bhraham Dev Nagar included under Mira Bhayander Municipal Corporationprior, earlier to this it was comes under comes under Rai-Murdhe Grampanchyat.

Life of Slum Occupants & Saving Pattern
60
This slum is more than 60 years old and this area is from least migrated people. This area belongs to Agri Maratha and majority of the occupants are Hindu. This area has one private dispensary, one medical, its own market and municipal water. This area lacks from sufficient sanitation facilities.
7 Shivneri Nagar, Rai is the sample are which is one of the oldest and largest Slums situated in Bhayander west towards uttan road is located at Latitude: 19°17'46.24" N and Longitude: 72°49'05.06" E, it has more than 800 slum houses and around 4500 population. During 1990’s Shivneri Nagar was also included in Mira Bhayandar Municipal Corporation.
This slum is more than 60 years old and divided in 30 chawls by numeric number from 1–30. This area is also least affected by migrated people. This area belongs to Agri Maratha and majority of the occupants are Hindu. This area has one private dispensary, one medical, its own market and municipal water. This area lacks from sufficient sanitation facilities. From this slum only 25 peoples are going to Mumbai for employment rest all are working in local area and Bhayandar Industrial area.
8 Sadanand Nagar, Murdha Rai is the sample are which is one of the oldest and largest Slums situated in Bhayander west towards uttan road is located at Latitude: 19°18'00.66" N and Longitude: 72°49'41.70" E, it has more than 1115 slum houses and around 4800 population. During 1990’s Shivneri Nagar was also included in Mira Bhayandar Municipal Corporation.
This slum is more than 60 years old and this slum is divided in chawls by chawl number. This area is also least affected by migrated people. This area belongs to Agri Maratha and 99% of the population is Hindu. This area has four private dispensaries, two medical, its own market and municipal water. This area is also lacking from sufficient sanitation facilities
Satisfaction level of the above three slum is higher as compare to slum which is close to city like Adarsh Indira Nagar and Dr. Ambedkar Nagar..
9 Moti Nagar, Bhayander (East) is the sample area which is one of the oldest slum situated in Bhayandar west is located at Latitude: 19°18'07.44" N and Longitude: 72°50'46.43" E, it has 150 slum houses and around 500 population. This area belongs to Jain society. It has one Jain Temple, one Shiva Temple, one private school for up to 10th standard near to this slum; most of the people in this society are vegetarian. This slum is surrounded by Godavari Industrial Area which has 300 different Small Scale Industries which provides employment to the various calls of the people.
This slum is divided in 10 chawls, and chawl has alphabetic identity from A to J. This slum is within the city and slums occupants can enjoy all the facility of city. Income level of this slum is at satisfactory level and most of this slum occupant is running their own business.
10 Anna Nagar, Bhayander West is the sample area which is one of the oldest slum and having less population as compare to other big slums it is situated in Bhayandar west behind Axis Bank is located at Latitude: 19°18'12.7" N and Longitude: 72°50'59.1" E, it has only 80 slum houses and around 315 population. This area belongs to South Indian community. This slum has only one chawl of 1000 square foot. Within this slum it has one Temple which is also used for Anganwadi. This slum is within the city and the occupants of this slum can access all the city facilities. Income level of this slum occupants are above the poverty line and at satisfactory level.
11 Indira Nagar Kothar, Bhayander (East) is the sample area which is one the most oldest slums situated in Bhayander west on 60 feet road is located at Latitude: 19°18'04.01" N and Longitude: 72°51'07.77" E, it has 225 slum houses and around 910 population. This slum has around 60% Maratha community. 95% of this slum is Hindus, 3% is Muslim and only 2% belongs to other. Migrated people in this slum are less than 20%.
12 Daachkul Pada is the sample area which is situated on the personal land situated in Mira Road East, Daachkul pada is next to kashimira dongari is located at Latitude: 19°16'30.10" N and Longitude: 72°53'45.81" E, it has 150 slum houses and around 390 people in this slum. Majority of this slum occupants are migrated from U.P., Bihar and adiwashi. Income level of this slum occupant is very low.
13 Mashacha Pada is the sample area which situated in Mira Road East, Kashi Mira area is lockated at Latitude: 19°16'18.33" N and Longitude: 72°53'40.82" E, , it has 125 slum houses and around 323

Life of Slum Occupants & Saving Pattern
61
people in this slum. Majority of this slum occupants are migrated from U.P., Bihar and adiwashi. Income level of this slum occupant is very low.
14 Kashivibhag, Kashigaon is the sample are which is situated on personal land situated in Mira Road east, close to western express highway is located at Latitude: 19°16'31.74" N and Longitude: 72°53'00.02" E, it has 49 slum houses and around 560 people in this slum. This area has one MBMC school for the up to 7th standard, one municipal hospital, two private dispensary, one private school, and one big god Durga Temple. This area has locational advantage of Western express highway, company named “Formkem India Corporation” which provides more than fifty employments to local workers, Adarsh Vidya Niketan School and ST. Ann’s Hospital which operate 24hrs for emergency.
After the overview, it becomes necessary to have a detail analysis of socio-economic conditions of slum inhabitants.
3.3. SOCIO-ECONOMIC CONDITIONS OF THE SAMPLE AREA: Most of the slums in Mira Bhayandar Municipal Corporation including ‘Dharavi’, can be described as settlements of people falling below poverty line, living in tenements and huts, on pavements along railway tracks, under bridges and in other spaces available to them. The conditions which they live in are of terrible poverty, squalor and deprivation. In short, most of the time slums are characterized as settlements of people who are illiterate, poor, unemployed and polluting. However in contrast to this description, it is found that 82.25% of sample slum inhabitants are literate, more than 95% are employed including parttime, temporary & permanenet job. The entire respondent family gets average income twice that of official poverty line. About 71.22% of sample households have own house, T.V, Refrigerator, Mixer. Some interesting facts were found during survey. Out of 549 families, there are 435 families who have electrical gadgets more than five like Mobile, Computer, Music System, T.V., Fan, Heater, mixer, tape recorder, refrigerator, DVD player that bought from their own saving, Installment from Banks and Non-Banking Financial Institution and by loan from friends, relatives and other sources.
TABLE – 3.3.1 (a) Ownership of Gadgets by 549 Families Particulars Electric
Gadgets Percentages
(%) Non-Electric
Gadgets Percentages
(%) Families having more
than 5 Gadgets 435
79.23
505
91.99
Families having less
than 5 Gadgets 114
20.77
44
8.01
Total 549 100 549 100
DIAGRAM – 3.3.1 (1) Ownership of Gadgets by 549 Families
From the above Table 3.3.1 (a) and Diagram 3.3.1 (1) it is found that 435 (79.22%) out of 549 respondents are having more than 5 Electric Gadgets like Mobile, Computer, Music System, T.V., Fan, Etc. and also majority of the sample respondents are having more than 5 Non-Electric Gadgets in their home.

Life of Slum Occupants & Saving Pattern
62
DIAGRAM – 3.3.1 (2) Purchasing Pattern of Gadgets by 549 Families
From the above Pie-Diagram researcher found that most of the slum families are able to accumulate some savings and has a capacity of own development. It is found that 84% of the families bought their gadgets from their own saving, 10% of the families bought on installment from banks and non-banking financial institution and remaining 6% of the families who bought their gadgets on temporary loan from their friends, relatives and other sources.
TABLE – 3.3.1 (b) Ownership of Vehicle by 549 Families Particulars Families Percentages (%)
Families having Vehicle 194 35.34 Families without Vehicle 355 64.66
Total 549 100.00
DIAGRAM – 3.3.1 (3) Ownership of Vehicle by 549 Families
From the above Pie-diagram it is found that most of the slum families do not have any vehicle. It is found that only 194 (35%) out of 549 families are having vehicles for their personal use.

Life of Slum Occupants & Saving Pattern
63
Slum living here is a long-term economic strategy that provides access to nearby employment and low cost housing. It clearly shows that such type of slums can be posed as ‘a ray of Hope’, for building up country’s capital. This is a gradual process in which some changes need to occur in socio-economic set up of these slum areas for which in-depth analysis of their socio-economic conditions, its impact on their income and savings has to be done.
TABLE – 3.3.1 (c) Community of 549 Families Particulars Families Percentage %
Open 471 85.79 Reserved 78 14.21
Total 549 100.00
DIAGRAM – 3.3.1 (4) Community of 549 Families
From the above the 549 respondent families, out of these, 471 families are belongs to Open community and 78 are belonging to reserved community families as shown in the bar diagram above. It means 85.79% of the total families are open community families and only 14.21% are reserved community families.
TABLE – 3.3.1 (d) Religion of 549 Families Particulars Families Percentage %
Hindu 454 82.70 Muslim 49 8.93
Christian 16 2.91 Jain 24 4.37
Other 6 1.09 Total 549 100.00

Life of Slum Occupants & Saving Pattern
64
DIAGRAM – 3.3.1 (5) Religion of 549 Families
Among the above 549 respondent families, out of these, around 83% families are Hindu, 9% families are Muslim, 3% families are Christian, 4% families are Jain and remaining 1% are other religion communities. Out of 4% of Jain families more than 95% of the Jain families are found in Moti Nagar slum, which is surrounded by Godavari Industrial area which has more than 300 various small scale industries.
TABLE – 3.3.1 (e) Number of joint and nuclear families Particulars Families Percentage (%)
Joint Families 76 13.84 Nuclear Families 473 86.16
Total 549 100.00
DIAGRAM – 3.3.1 (6) Number of joint and nuclear families

Life of Slum Occupants & Saving Pattern
65
Among the above diagram of 549 respondent families, out of 473 families are nuclear family and 76 are joint families as shown in the pie-chart below. It means 86% of the total families are nuclear and only 14% are joint families. It is because most of them are migrants from various parts of the country in search of jobs.
It is found from the sample survey that most of the families consist of parents and their children, where parents are either going out for the whole for their work or are busy in the labor work they do from home. There is no one else in the house to take care of children. As a result, most of the children are out of the house fooling around, playing games like cards which gets gradually develops into habits like gambling, drinking, smoking at very early age of 10 to 12 years and increases burden on family expenditure. This is a major threat to the society where majority of the children are growing in the environment non conducive to knowledge and economic development.
Table – 3.3.1 (f) Gender Ratio Particulars Gender Percentage (%)
Male 1269 52.77 Female 1136 47.23 Total 2405 100.00
DIAGRAM – 3.3.1 (7) Gender Ratio
From the above diagram of 549 respondent families, 1269 are male members and 1136 is female members as shown in the pie-chart above. It means around 53% are male and 47% are female member.
In the below sample area, 391 households (71.22%) have their own houses and 158 families are living in rented house.
TABLE – 3.3.1 (g) Number of Owned houses and Rented Houses Particulars House Percentage (%)
Owned 391 71.22 Rented 158 28.78 Total 549 100.00

Life of Slum Occupants & Saving Pattern
66
DIAGRAM – 3.3.1 (8) Number of Owned houses and Rented Houses
From the data obtained from respondent families it is found that around 263 families claim that they had bought the house during the period of 1980-1990 by using their own savings and by selling gold jewelry. Remaining 128 families have borrowed from banks. The families that have own houses tend to save more in order to buy a bigger house; some of them save so that they can buy another house for their children. Those families who have rented houses, have more expenditure since the average rent paid to a single room in the sample area is 1,800/- per month. Still they tend to earn and save more by doing some additional work so that they can buy a house.
Although majority of the respondent family have their own houses, but it is found that some households income is not sufficient and they are not able to arrange fund for house construction. In the below diagram of sample slum house, around 82% of slum houses are found of Pucca construction, 13% are Semi-Pucca and rest 5% slum houses are found of katcha construction.
TABLE – 3.3.1 (h) House Structure Particulars House Structure Percentage (%)
Pucca 451 82.15 Semi-Pucca 71 12.93
Katcha 27 4.92 Total 549 100.00

Life of Slum Occupants & Saving Pattern
67
DIAGRAM – 3.3.1 (9) House Structure
Majority of the katcha and Semi-Pucca houses are found in Jay Ambe Nagar 1 and Ganesh Deval Nagar, majority of these slums household are migrated from Uttar Pradesh. It is found that in these two slum area some of the family income is very low to construct their home.
Among the 549 respondent families, 263 households are staying at same place more than 10 years, 176 households are staying at same place in between 5yeras to 10 years and 110 households are staying at the same place less than 5 years. History of staying at one place is shown below in Bar Diagram.
TABLE – 3.3.1 (i) History of Staying at one place Particulars Families Percentage (%)
Less than 5 Yrs 110 20.04 More than 5 Yrs and Less
than 10 Yrs 176 32.06
More than 10 Yrs 263 47.91 Total 549 100.00

Life of Slum Occupants & Saving Pattern
68
DIAGRAM – 3.3.1 (10) History of Staying at one place
Among the below diagram of 549 respondent family, only 33 families have more than two rooms in their house, 146 families have two room house but remaining 370 families have only single room as their house for a family of four or even more that. Even that single rooms is extremely small.
TABLE – 3.3.1 (j) Number of Rooms in House Particulars Number of Rooms in House Percentage (%)
One Room 370 67.40 Two Room 146 26.59 More than Two Room 33 6.01
Total 549 100.00
DIAGRAM – 3.3.1 (11)
Among the below diagram of respondent family, 354 houses have a single room of size as small as 100 Sq Ft., 157 families have a room slightly bigger than 100 Sq. Ft. and only 38 families have a house bigger than 200 Sq. Ft..

Life of Slum Occupants & Saving Pattern
69
TABLE – 3.3.1 (k) House Area Particulars House Area Percentage (%)
Up to 100 Sq. Ft. 354 64.48 More than 100 Sq. Ft. and
Less than 200 Sq. Ft. 157 28.60
More than 200 Sq. Ft. 38 6.92 Total 549 100.00
DIAGRAM – 3.3.1 (12)
Almost all houses are made up of cement but do not have any windows since they are surrounded by adjacent houses by three sides, hence entry door is the only source of ventilation. Most of the houses have either tiled roofs or cement sheet roofs, which are most of the time unsuitable for a windy weather, especially during monsoon. So many times in monsoon, due to water dripping in the house, most of the area remains unusable. During summer, the house is so hot that people are not able to stay in the same, many complain that they cannot sleep properly at night during the season. Small children cannot get a separate place for their studies. All family members become easily prone to viral diseases. Regular illness is the common feature of these families.
Among below 549 respondent families, it is found that 522 families are able to access the municipal water, whereas remaining slum households are dependent on private source which is very costly as compare to their income level, source of water shown in below Pie-chart.
TABLE – 3.3.1 (l) Source of water Particulars Source of Water Percentage (%) Municipal 522 95.08
Private 27 4.92 Total 549 100.00
DIAGRAM – 3.3.1 (13) Source of water

Life of Slum Occupants & Saving Pattern
70
Among below 549 respondent families, it is found that only 97 households are able to access indoor water facility, whereas remaining 452 slum households are dependent on common source of water. Slums are increasing at continuous level whereas water connections in the slum area are not increased, this results in overcrowding on common water place and this leads to less availability of water as shown in below Pie-Diagram.
TABLE – 3.3.1 (m) Availability of Water Particulars Availability of Water Percentage (%)
Indoor Water 97 17.67 Common Water 452 82.33
Total 549 100.00
DIAGRAM – 3.3.1 (14) Common water supply and Indoor water supply
Water is the bare minimum necessity of human life. Every day they have to put up a great stuggle for water. All slum inhabitants have to share water which they get from municipal corporation through the common taps ibstalled by muncipal corporation. Number of taps are very less as compared to the number of people. They get water supply just for three hours of the day, which has to be shared by many households, which results into constant fights between these people which take up a lot of time and energy of these people which they could have used to earn some income. Working schedule of females depend upon the water supply timings. Even as compared to family requirement the water which they get is very less. Many times they use water directly from municiple taps for drinking purposes without any purification process. Limited education has kept them unaware of water contamination, its effects etc.
Among below 549 respondent families, it is found that only 37 households have indoor sanitation facility whereas remaining 512 households are using common sanitation. Further it is found that in almost all the 14 sample slums sanitation facilities are not adequate and they are very poorly maintained. It is found that in absence of sufficient sanitation facility People or bound to use open area, as shown in below Bar Diagram.
TABLE – 3.3.1 (n) Sanitation Facility Particulars Sanitation Facility Percentage (%)
Indoor 37 6.74 Common 512 93.26
Total 549 100.00

Life of Slum Occupants & Saving Pattern
71
DIAGRAM – 3.3.1 (15)
Among below 549 respondent families, it is found that 27 household does not have Electricity line in their houses, they are using illegal electricity supply and some of them take electricity supply from their neighborhood at high prices. Electricity supply in slum houses are shown in below Pie-Diagram.
TABLE – 3.3.1 (o) Electricity Supply Particulars Electricity Supply Percentage (%)
Households with electricity 522 95.08 Households without
electricity 27 4.92
Total 549 100.00
DIAGRAM – 3.3.1 (16) Electricity supply in Slum houses

Life of Slum Occupants & Saving Pattern
72
Generations and generations are living in the same area and even in the same house. Buying a bigger house and shifting house out of slum area is very difficult for them because of two main reasons. Firstly, house prices of Mira road and Bhayandar city are very high since it is an over populated city. And another reason is low earning of the families. Their low earnings are because of low level of education. The sample area have considerably large number of literate population that is 1978 out of 2405 people are literate and only 427 are illiterate.
TABLE – 3.3.1 (p) Literacy Ratio Particulars Literate % Illiterate %
Male 1146 90.31 123 9.69
Female 832 73.24 304 26.76
DIAGRAM – 3.3.1 (17) Literacy Ratio
As shown in the above table, 82.25% of the population is literate. Literacy ratio among male is high and female is low since school drop outs among girls is much higher since due to less income many parents still tend to sacrifice girl’s education and they are made to do some job or take care of households since mothers have to go out to earn. Although literacy ratio is not too low, the level of education secured by majority is very low which results in securing lowly paid jobs.
TABLE – 3.3.1 (q) Level of education secured
DIAGRAM – 3.3.1 (18) Level of education secured
Particulars Primary Secondary Higher Secondary University Male 160 486 276 224
Female 210 403 111 108

Life of Slum Occupants & Saving Pattern
73
As shown in the above table and diagram, level of education secured is low among female, i.e. number of female securing only primary education are maximum as compared to female securing secondary, higher secondary and University education. As a result, most of the female from sample household is seen working as unskilled worker, either as a maid servant or a cook or take up other small labour work on daily wages like making jwellery parts, making bindis, papads etc.in which labour they need to put is huge but money received in return is very less.
In comparison, education secured by male is much higher but not very good to get well paid jobs. Majority heads of the households who has secured higher education, have just finished their education upto H.S.C. This level of education cannot secure a well paid job to these people. It has been observed in the sample area that 77.26% of Male and 88.54% of Female have temporary jobs.
TABLE – 3.3.1 (r) Employment Ratio Particulars Temporary % Permanent %
Male 452 77.26 133 22.74 Female 394 88.54 51 11.46
DIAGRAM – 3.3.1 (19) Number of Temporary and Permanent job
Which in return increases future insecurity for them and they tend to save more as a precaution.
TABLE – 3.3.1 (s) Alcohol Consumption Patern Particulars Alcohol Consumption Patern Percentage
Without Alcohol Consumption
164 29.87
Alcohol Consumption 215 39.16 Heavy Alcohol Consumption 170 30.97
Total 549 100.00

Life of Slum Occupants & Saving Pattern
74
DIAGRAM – 3.3.1 (20) Alcohol Consumption Pattern
Low level of education among male population in sample area has led to a major social problem and that is of cultivation of bad habits among the male population like drinking liquor, smoking, gambling. 170 out of 549 households female members have admitted heavy drinking problem of the head of the family which aggrevates financial condition of the whole family. Around 210 household females indicated to be facing same problem. As a result the whole family have to do some or other work to earn their livelihood. Even small children are compelled to do some or other work in order to earn their tution fee. Either they will distribute newspapers or will do some part time evening job at some grocer’s shop.
An important feature of the sample area is, all the family members are engaged in some or other labour. Thus everybody contributes to family income but at the same parents do not have time to spend for their children. A culture of learning doesnot get cultivated amongst the children of this area since most of the children get affected by the bad habits of their fathers, even they themselves do not have much time for persuing their studies seriously since even they have to work to earn money.
Water is the bare minimum necessity of human life. Every day they have to put up a great stuggle for water. All slum inhabitants have to share water which they get from municipal corporation through the common taps installed by muncipal corporation. Number of taps are very less as compared to the number of people. They get water supply just for three hours of the day, which has to be shared by many households, which results into constant fights between these people which take up a lot of time and energy of these people which they could have used to earn some income. Working schedule of females depend upon the water supply timings. Even as compared to family requirement the water which they get is very less. Many times they use water directly from municiple taps for drinking purposes without any purification process. Limited education has kept them unaware of water contamination, its effects etc. Even number of sanitation facility provided by municipal corporation is less compared to requirement. As a result many people use open space available to them, which pollutes the evironment and exposes the slum inhabitants to various diseases.Considering all these points it can be realised the level of education has to be increased for slum deweller which will make them more capable to work for their progress. In the sample area 40% households are sending their children to private english medium schools and tution classes which shows that the future generation can be more educated provided conducive social atmosphere is provided to them.On the basis of the socio-economic background it will be necessary to study income distribution of these households before assessing their saving behavior.
3.3.2 FINANCIAL ANALYSIS OF SLUM DEWELLER IN THE STUDY AREA: Current India is a young India, i.e. have maximum working population. So investment in human capital will have more returns. Maximum working population that works more, produces more, earns more, spends more and also saves more is what is needed by Indian economy. The sample area also represents young India since number of people in the age group 15-59 are maximum.

Life of Slum Occupants & Saving Pattern
75
TABLE – 3.3.2 (a) Age – Composition 0-14 Years % 15-59 Years % 60+ Years %
Male 237 18.68 956 75.33 76 5.99 Female 157 13.82 915 80.55 64 5.63
DIAGRAM – 3.3.2 (1) Age - Composition
More young population means more human capital and also more money capital provided proper policies are implemented in time to take advantage of the situation. This analysis about income distribution of 14 selected sample slum has put light onto the facts and problems associated with earnings of the people.
With a view to curb diversion of food grains and to provide more food grains to needy families, the maharashtra government introduced tri colour ration card scheme w.e.f 1st may, 1999. As per following 3 different coloured ration card are issued in the state, yellow ration cards are issued to the families having annual income up to Rs 15000/- in urban area. Saffron ration cards are issued to the families having annual income of Rs 15,001 to Rs 1,00,000/- and white ration cards are issued to the families having annual income of Rs 1,00,001/- or above.
TABLE – 3.3.2 (b) Status of Ration Card Particulars Ration Card Percentage (%)
Yellow 0 0 Orange 380 69.22 White 169 30.78 Total 549 100.00

Life of Slum Occupants & Saving Pattern
76
DIAGRAM – 3.3.2 (2) Status of Ration Card
From the above pie diagram of 549 respondent family it is found that all the respondent family are above the poverty line and Zero families holds yellow ration card. It is found from the respondent family that 169 families holds white ration card and remaining 380 families hold orange ration card and they take the benefit of government subsidy.
It is found that majority of the family earining memebrs have temporary jobs and most of the time they get cash payment and they do not disclose their right income to the government and they are continiously enjoying the benefit of government subsidy. From the below income table 3.3.2(b) it is found that outof 380 orange ration card holder arround 283 families fall under white ration card category.
TABLE – 3.3.2 (c) Status of Aadhar Card Particulars Status of Aadhar card Percentage (%)
Aadhar card Family 495 90.16 Without Aadhar card Family 54 9.84
Total 549 100.00
DIAGRAM – 3.3.2 (3)
With the aim of the government to provide direct cash subsidy to the ultimate benecifiary, it is found from the above diagram that majority of the respondent family have aadhar card. It is found that 549 (81%) respondent family have aadhar card and around 19 % of the families are still waiting for aadhar card.

Life of Slum Occupants & Saving Pattern
77
TABLE – 3.3.2 (d) Credit Card Particulars Credit Card Percentage (%)
Family with credit card Family 37 6.74 Without credit card Family 512 93.26
Total 549 100.00
DIAGRAM – 3.3.2 (4)
From the above diagram it is found that majority of the selected sample slum occupants are not having credit card of any bank. Only 7% of the families are having credit card facility. It is also found that one of the major reason behind this is bank are very cautious on issuing credit card to slum occupants.
In order to find out income distribution of the study area, statistical technique of Frequency Distribution is used by dividing monthly family income into class intervals and by using tally marks frequency is calculated. The results derived are as follows.
TABLE –3.3.2 (e) Monthly income earned by 549 families (Rs/-)
As seen in the table, it can be clearly seen that all the respondent family are well above poverty line since there are zero families falling into category of less than 1000/- and even in the category of 1000 – 3000/- income per month, all are falling into class interval of more than 3000/- .Maximum number of families is falling into a class interval of 11000 – 13000/- and 13000 – 15000 per month. It means even poorest family of the sample household earns income even more than double of the poverty line norm. So the respondent families fall into category of low income group nut certainly not in the category of poorest people.

Life of Slum Occupants & Saving Pattern
78
DIAGRAM – 3.3.2 (5) Income-wise distribution of 549 respondent family (in Rs/-)
As seen in the above diagram, even some families fall in the income category as high as more than 15,000/- per month. So the income distribution of the respondent family clearly indicated relatively higher standard of living for the particular slum as compared to many other slum deweller in Mumbai. There are many reasons behind relatively better income earned by these slum deweller, which we do find in its socio-economic characteristics of these respondent family. The first reason is more number of young population who can work more. Another reason is majority of the slum deweller are literate and have secured secondary and higher secondary education which makes them capable of seeking slightly better paid jobs. The location of study area is also a reson behind better income distribution amongst the sample slum households. As has been mentioned earlier, the sample area is surrouned by a large number of residential complexes of middle class, higher middle class and even rich class people and many small scale industrial area which provides employment. Since in these families too, majority of the both parents are working, there is a lot of demand for maid servants, cooks, drivers, electricians, carpenters, watchmen, painters etc. As a result getting employment that too nearby is very easy for the slum deweller, as a result vertually every member of the household works and earns. Even small school going children are seen to be delivering news paper, milk from house to house on a daily basis and earning their own tution fees. In the surrounding area, there are few small scale industries which gives out some labour work to these people like making assembling some jwellery parts, making ‘bindis’, making hair bands, stitching shirt collars, making ‘papads’, which female and small children can make in their spare time, in their own house and earn some income against it.
The main feature of income distribution amongst the slum deweller is that although total family income of the majoity of the households is resonable but if we devide their total family income with non family earner i.e. children and old people who are not supposed to earn than average family income fall down, which press them to live in slum. There are various reasons for that. First of all cost of living index of Mira Bhyandar is very high, even basic goods like food, clothing, shelter, education and health care are expensive. House rent, electricity expenses, travelling expenses are high enough. House rent in the sample area is very high. A single room with area even little less than 100 Sq Ft., with cement sheets as a roof, no windows, no internal sanitation and water will be available for the rent as high as 1,700/- per month and Rs/- 30,000 as deposit. So those households who has rental house, 1700/- expenditure just on rent puts a lot of burden on their income. At the same time in many cases job of the head of the family is temporary, so the family becomes more

Life of Slum Occupants & Saving Pattern
79
vulnerable and all members of family has to earn extra as a precaution. All the slum families are aware of importance of eduction, so are sending their children to schools and also to tution classes since parents are not capable of helping their children in their education. So monthly expenditure of families is considerable high. So all the family members need to earn in order to cope up with the expenses. At the same time one major social problem faced by respondent family is bad habits of the fathers of the families who are also considered as head of the families. Some families are suffering due to heavy drinking problem by head of the family. Many sample area housewives have admitted that income that family receive from the head of the family is not sufficient since they spend money on liquor and other members need to earn in order to manage the household. In many cases heavy drinking and then harrassing the family members is a regular feature of these households. So in many respondent family it is seen that female member have to take care of household and also have to do some work may be part time work like of a maid servant, cook etc or do some labour work from home and earn money to support the family.
Hypothesis 1 Contribution towards family income by head of family I. Null hypothesis: there is no significant difference between contribution towards family income by the
head of the slum households and other members of family.
II. Alternative hypothesis: The head of the family in slum households are contributing significantly more to the family income than the other members of family.
Although as have been mentioned earlier, family income is the summation of income of all family members, still head of the family is the major contributor to family income. This is the first hypotheses of this study as being mentioned into the first chapter.In order to test this hypotheses, total of the income earned by all heads of 549 respondent family is taken and then total of income earned by other family members is taken.
To test above hypotheses, parametric independent ‘t’ test was applied for data related to contribution of the head of the slum households and other members of family.
The result of the same is tabulated in following table no. 3.3.2 (f)
Table - 3.3.2 (f) Parametric independent ‘t’ test Applied for Data Related to contribution of the head of the slum
households and other members of family. ‘t’ test value Mean S.D. n d. f. t value p value
Mean income of the head of the slum households. 13,809. 6,950.9 549
1198 9.25 0.000 Mean income of other members of family. 3,129.6 4,849.8 549
Observation: As p value is 0.000 which is less than α = 0.01 (1% significant level) we reject null hypothesis.
It is also observed that calculated ‘t’ value is 9.25 is more than 2.326 (table value of at 1% significant level, lower tailed and d.f. 1198). Hence we reject null hypothesis Ho.
Interpretation: On the basis of above data it can be inferred Mean income of the head of the slum households is less than or equal to Mean income of other members of family.
Findings: It is accepted that the head of the slum households are contributing significantly more income in the family income than the other members of family.
Although the survey has shown that all family members earn including children and old people, but their income is a supportive income which they earn as a precaution. Thus this result further proves economic vulnerability of these slum dweller. Most of the male members have temporary jobs that too in private companies, if they lose job or suffer from any illness and accident, they will neither get any help from their

Life of Slum Occupants & Saving Pattern
80
employer nor from Govt. since in India social security measures are almost non-existing. At the same time if the head of the family have bad habits like smoking, consuming liquor etc. then too the family have to suffer a lot. Considering all these factors these families have to save to make their future secure. However how do they save is also equally important for the households and also for the economy along with how much they save. Thus the following topic deals with Saving Behavior of Slum Dweller.
3.3.3 SAVING BEHAVIOR OF SLUM DEWELLER IN THE SAMPLE AREA: The sample area is not as downtrodden as is generally seen in many slums in most of the Indian cities. Slum population is all above the poverty line. Still day to day life for them is not easy. Whole day they are found to be slogging, with very less leisure so that they can get reasonable quantity of basic goods. Income distribution of the sample slum households clearly indicate financial insecurity of the households for which saving becomes the most necessary part. Many househlods are found to be compulsarily putting some part of the income aside as savings. It has been observed that slum households are able to save only 8.53% of their income which is reosonably not sufficient amount considering living cost of city like Mira- Bhyandar. It has been observed that respondent family saving has continiously fallen down because of high inflation cost and majority of their income consumed for their day to day expenses. There are many reasons behind saving amongst slum deweller. Most important is their financial insecirity of the slum deweller. Another reason can be specified in case of the particular sample area is number of literate people is more, who are more aware of need for savings. More number of young population also contributes to increase in savings. As mentioned earlier, these slum area is surrounded by a number of sophisticated residential complexes. Many of slum deweller come into direct contact with these people since they work for them. This demonstration effect acts as a positive factor in case of more amount of savings. At the same time the surrounding area has many financial institutions like private banks, co-operative banks, nationalised banks and also a post office which certainly has influenced saving behavior of slum deweller.
However along with amount of savings, mode of savings of the slum deweller is also an important factor. Indian financial sector is of dual nature, there is organised,regulated sector and at the same time unorganised and non-regulated sector in existance. Various studies have shown dominance of unorganised sector amongst rural poor as compared to organized sector. Infact the unorganized sector in India is like a parallel financial system itself which proves to be undesirable for Indian financial sector and eventually Indian economy. Therefore it is necessary for Indian economy to creat its money capital, but most desirable condition is money to get mobilised through organized sector. The sample area has many number of chit funds, co-operative credit societies and gold funds, all are mostly non-registered, and are privately run which shows existance of unorganized sector. After undertaking survey of the study area, it can be claimed that even amongst urban poor, savings with unorganized sector are more prominent.
Households in the study area basically save with chit funds which are called as’Bhishis’, co-operative credit societies called as ‘Pat Pedhi’ and gold funds which is called as’Gold Bhishi’ or ‘Suverna Sanchay Yojna’. In the study area both co-operative credit societies and chit fund are referred as ‘Fund’ that is why for reseach purpose both chit funds and co-operative credit societies are combined under one heading called as ‘Chit Fund’. So chit fund and Gold fund consists of unorganized sector. However it is also been observed that all the families that save with unorganized sector, also save with organized sector also. But there are few families who do not save with unorganized sector. People are aware of advantages of organized savings and disadvantages of unorganized savings. Many times their needs are such that, approaching unorganized sector becomes inevitable for them. During the survey the approximate amount saved by each household in various instruments per month is calculated. The findings are presented below with the help of a bar diagram.

Life of Slum Occupants & Saving Pattern
81
DIGRAM : 3.3.3 (1) Organized and unorganized savings
The above diagram clearly shows that maximum savings of respondent family are with chit funds and credit co-operative societies which amounts to be around 1,88,700/- per month. It has been abserved that in majority households atleast one member is a part of some or other chit fund. Most of their bigger expenditures like buying a T.V., refriderator, even house renovation is done from the chit fund money. Many households do save with co-operative credit society which they call as a ‘Fund’ so that they can pick up small amount of loan for buying second hand gadgets, house renovation etc. Many Slum families have very old chit funds of 25 to 30 years, where group has remained same over the period, one member of the group manages the fund for which he gets the very first lottery every year and no one else can enter the group. They all are together as a social obligation, having their own rules which no one can break. Credit co-operative societies take very high interest on the loan they give which amounts somewhere around 25% to 30%, still people deal with those, save and also take loan. There are two reasons behind it, first one is that most of the time all neighbouring households join the ‘Fund’ together which itself is situated nearby the area, because of which saving, taking loan is easier. Another reason is the fund gives loan for any reason and that also immediately which people may not get from banks. So convenience is the main reason for the savings with fund which is the main part of unorganized financial sector. After chit fund savings, the saple households have been observed to be investing their money with LIC. Most of the time it has been observed that the slum families do invest into insurance policies for their children especially boys. The monthly investment of slum families amounts to be 72,800/- This growth of LIC savings is mainly due to a system followed by LIC agents. The system is, these agents collect money from these households on monthly basis which they pay as a lumpsum amount later on to LIC, considering the fact that these poor households are generally not capable of paying a larger amount at a time. So it becomes convenient for the households to pay 200/- or 250/- per month instead of paying 3000/- or greater amount twice in a year or once in a year.
The third largest mode of savings for slum households in the sample area is ‘gold funds’ which amounts to be 42,500/- per month. There are many gold shops in the neighbouring area of the slum who are running this kind of fund where a person has to pay a fix amount per month, generally in multiples of 100/- for one year. After one year, they get the lumpsum amount with interest of around 8% which they have to take in the form of gold at existing gold rate. Gold is considered as a safe investment in India. At the time of marriages, giving gold jwellery to daughter is a custom. As mentioned earlier, these families do not have a capacity to pay a big amount at a time so they prefer these types of ‘Gold Funds’.
The next popular mode of savings is savings with Nationalized banks, which is maximum in the bank savings where nationalized bank savings are almost 83,311/- per month, Private bank savings are 31,400/- and co-operative bank savings are 17,350/- Main reason behind more savings with nationalized bank is that savings with nationalized bank is considered more secure. It has been observed that most of the young family members mainly in the age group of 20-35 years, hold accounts with private banks mainly ICICI and HDFC bank, some of the people of the same age group even use phone banking, they do online share trading. Most of the people were found to be saving with private banks and particularly ICICI and HDFC are the people

Life of Slum Occupants & Saving Pattern
82
who already have taken home loan from the bank or those who intend to take such loan. Many people have given reason behind saving with ICICI and HDFC is that, banking service is very smooth where their energy and time is saved.
Around 58,800/- per month are saved in the Post Office Fixed Deposits. While conducting survey three main post office schemes were considered. One is post office fixed deposits and Monthly income scheme which has got maximum response from the particular sample area. However in case of recurring deposit, close to zero amount is found to be saved in these instruments. Similar are the observations in case of intruments like National Savings Certificate and Indira Vikas Patra. The savings held in the form of cash are also very less or negligible amount.
Considering the survey results, it seems that even in the sample slum area unorganized sector savings are more than organized sector savings. This statement can be tested and verified. Since two groups comparison is done, Student’s ‘t’ test is used in this data.
Hypothesis 2: The unorganized sector has the significant household savings.
I. Null hypothesis: There is no significant difference between organized sectors household savings and unorganized sectors household savings.
II. Alternative hypothesis: organized sectors household savings are less than unorganized sectors household savings.
To test above hypotheses, parametric paired ‘t’ test was applied for data related to organized sectors household savings and unorganized sectors household savings.
The result of the same is tabulated in following table no. 3.3.3. (a)
Table no. 3.3.3 (a) Parametric paired ‘t’ test Applied for Data Related to organized sectors household savings and
unorganized sectors household savings ‘t’ test value Mean S.D. n d. f. t value p value
Organized sectors household savings 690.0 486.84 549 548 4.060 0.9999 Unorganized sectors household savings. 421.1
Observation: As p value is 0.9999 which is greater than α = 0.05 (5% significant level) we reject null hypothesis.
It is also observed that calculated ‘t’ value is 4.060 is more than 2.326 (table value of at 1% significant level, lower tailed and d.f. 549). Hence we failed to reject null hypothesis Ho.
Interpretation: On the basis of above data it can be inferred that there is no significant difference between organized sectors household savings and unorganized sectors household savings.
Findings: It is found that unorganized sector has the significant household savings.
There are many reasons behind dominance of unorganized sector. Many of the slum deweller are not aware of the disadvantages of unorganized sector. It has been observed that many times people who take loan from co-operative credit societies even do not know how much interest they are paying, instead they just know that they have to pay a certain amount every month as interest but do not have any idea that they are paying very high interest and they will have to pay very less if they will take loan from a bank. The most important reason behind their unorganized sector savings is convenience.
Most of the slum households have to work the whole day along in order to earn their bread and butter. So they neither have time nor energy to search for more and better saving options. Their choice of saving option depends more upon convenience. They choose those instruments which are more popular in their area and are less time and energy consuming. Majority of the slum deweller of the sample area are not aware of

Life of Slum Occupants & Saving Pattern
83
existance of many new and beneficial small savings instruments. When the respondent family were surveyed in order to find out awareness amongst the people about new saving options available, following results are received.
Table 3.3.3 (b) Policy awareness of 549 respondent family Know % Don’t know % Have some idea %
Senior Citizen Policy 49 8.93 302 55.01 198 36.07
Mahasaraswati Yojna 38 6.92 330 60.11 181 32.97
Zero Deposit Account 222 40.44 50 9.11 277 50.46
Yuva-Yojna 121 22.04 35 6.38 393 71.58
For survey four main schemes are considered. The above table shows that a very few households are aware of existence of these schemes.
DIAGRAM 3.3.3 (2) Policy awareness of 549 respondent family
From the data collected from Survey it is found from the above bar diagram, households are more aware of zero deposit account and Yuva-yojna, whereas majority of the sample area are not aware about Senior Citizen and Mahasaraswati Yojna. Most of the young educated people are more aware about Zero deposit account and Yuva-Yojna schemes.

Life of Slum Occupants & Saving Pattern
84
DIAGRAM 3.3.3 (3)
As can be seen in the above pie chart, just 9 % respondent families know about the senior citizens scheme. Most of the people with age more than sixty are illiterate. According to them, they do not have any faith on banking system. Some of them responded that they do not understand much about it and bank staff is not ready to help them so they are much better off in putting their money either in the post office or chit funds.
DIAGRAM 3.3.3 (4)
As shown in the pie chart, only 7% know about the scheme but still have not thought of saving into the scheme. The main reason most of the households gave for not using this instrument is that they have already invested somewhere else and now their income doesn’t allow them to save some more in this new instrument. However out of 60% households who had no idea about the scheme have shown inclination towards putting their money into it since it is meant for children. The main problem according to them was time which they will have to spend in order to apply for the scheme. According to them next door chit fund is a better venture for them since it has flexible timings

Life of Slum Occupants & Saving Pattern
85
DIAGRAM 3.3.3 (5)
Considerably more number of households is aware of the ‘zero deposit account’ but are hesitant to apply for the same. Many of the households responded that they are not comfortable with the restrictions that the account has and also responded that they are still comfortable with the fund which they are saving from years.
DIAGRAM 3.3.3 (6)
Although 22% households are aware of the scheme, they are still comfortable with the same saving modes and not very keen on changing the mode of savings.

Life of Slum Occupants & Saving Pattern
86
Most of the time people who say that they know about the scheme it means that they have seen the name displayed on the walls and notice board of the banks but they do not know about the details of the schemes. According to them either bank are flooded by customers that they do not get a chance to read the displayed information. Some have responded that they do not have time to read the whole scheme. Some complain that if they ask for some explanation about the scheme, bank staff do not co-operate with them. Many of them, who know about the schemes have not tried to avail the benefit of the scheme because they are scared and have prejudice that they will have to visit the bank for many times to follow the procedure and they can’t afford to miss their job for that purpose so just want to continue with the same saving modes which they are using from years. So it is clear from the above observations that most of the slum population is not aware of benefits of the instruments of savings made available by the organized sector. They follow the same techniques of savings they are using or majority families are using for years. They want to use those saving options which are more convenient to them considering the limited time they have.
TABLE 3.3.3 (c) Life Insurance plan awareness of 549 respondent family Know % Have some
idea % Don’t Know %
Retirement Plan 164 29.87 326 59.38 59 10.75 Guaranteed Income Plan 197 35.88 311 56.65 41 7.47
Child plan 322 58.65 188 34.24 39 7.10 Tax Saving Plan 65 11.84 179 32.60 305 55.56
Term Plan 91 16.58 282 51.37 176 32.06
The above table shows that a majority of the households are unaware about these schemes.
DIAGRAM 3.3.3 (7) Life Insurance plan awareness of 549 respondent family
As shown in the above bar diagram, households are more aware of Child plan, Retirement Plan and Guaranteed Income Plan. Most of the young educated people are more aware of these schemes.

Life of Slum Occupants & Saving Pattern
87
Table 3.3.3 (d) Retirement plan awareness of 549 respondent families Particulars Retirement Plan Percentage (%)
Know 164 29.87 Don’t Know 59 10.75
Have Some Idea 326 59.38 Total 549 100.00
DIAGRAM 3.3.3 (8)
From the above pie-diagram out of 549 respondent families it shows that around 30 % of the households know about life insurance Retirement plan, and 59 % of the households have some idea about retirement plan of various life insurance companies. From the above sample it is found that there are many illiterate people who do not know about retirement plan.
Table 3.3.3 (e) Guaranteed Income Plan awareness of 549 respondent families Particulars Guaranteed Income Plan Percentage (%)
Know 197 35.88 Don’t Know 41 7.47
Have Some Idea 311 56.65 Total 549 100.00
DIAGRAM 3.3.3 (9)
From the above pie-diagram out of 549 respondent families it shows that around 36 % of the households know about life insurance guaranteed income plan, and 57 % of the households have some idea about retirement plan of various life insurance companies.

Life of Slum Occupants & Saving Pattern
88
Table 3.3.3 (f) Child Plan awareness of 549 respondent families Particulars Child Plan Percentage (%)
Know 322 58.65 Don’t Know 39 7.10
Have Some Idea 188 34.24 Total 549 100.00
DIAGRAM 3.3.3 (10)
From the above pie-diagram out of 549 respondent families it shows that majority of the young households are literate and they know the importance of saving. It is found that around 59 % of the respondent families invest in child plan for the future of their Child.
It is found that some respondent family income is not sufficient and they are unable to invest in any investment plan.
Table 3.3.3 (g) Tax Saving Plan awareness of 549 respondent families Particulars Tax Saving Plan Percentage (%)
Know 65 11.84 Don’t Know 305 55.56
Have Some Idea 179 32.60 Total 549 100.00
DIAGRAM 3.3.3 (11)
From the above 549 sample just around 12 % of the households know about Tax saving plan. It is found that majority of the worker are temporary and daily wage earner whose income is not deducted while they receive income, i.e TDS on salary. It is found that majority of the respondent family are not tax payer and they don’t have awareness about tax saving plan.

Life of Slum Occupants & Saving Pattern
89
Table 3.3.3 (h) Term Plan awareness of 549 respondent families Particulars Term Plan Percentage (%)
Know 91 16.58 Don’t Know 176 32.06
Have Some Idea 282 51.37 Total 549 100.00
DIAGRAM 3.3.3 (12)
From the above 549 respondent family it is found that just 17 % of the households know about term plan of various life insurance companies. It is found that there are about 51 % of the respondent families who have some idea about term plan. Since term plan is linked with return on share market, it is found from the survey that majority of the respondent family want to invest which gives fix return.
Table 3.3.3 (i) Awareness of health plan of 549 respondent families Know % Have some idea % Don’t Know %
Cashless Hospitalization 52 9.47 336 61.20 161 29.33 Major Critical Illness 36 6.56 176 32.06 337 61.38 Senior Citizen 21 3.83 98 17.85 430 78.32
From the data obtained from 549 respondent families it is found that majority of the respondents are not aware about the various health plans and their benefits available in the market as per their income and their requirement. In India still majority of the peoples are considering this as non-returnable investment.
From the survey it is found that sudden illness is the major hurdles in their financial planning, which can be easily minimized with the Health plan available in the market.
DIAGRAM 3.3.3 (13) Awareness of health plan of 549 respondent families

Life of Slum Occupants & Saving Pattern
90
As shown in the above bar diagram of 549 respondent families it is found that majority of the respondent family does not have awareness of health plan. But majority of the young educated people are aware about the health plan benefits, like cashless hospitalization, Reimbursement, etc.
Table 3.3.3 (j) Cashless Hospitalization Health Plan awareness of 549 respondent families Particulars Cashless Plan Percentage (%)
Know 52 9.47
Don’t Know 161 29.33
Have Some Idea 336 61.20
Total 549 100.00
DIAGRAM 3.3.3 (14)
From the above pie diagram of 549 respondent families it is found that just 10% of the households know the cashless hospitalization health plan. There are 61% of the households who have some idea about the above plan.
Table 3.3.3 (k) Major Critical Illness Health Plan awareness of 549 respondent families Particulars Major Critical Plan Percentage (%)
Know 36 6.56 Don’t Know 337 61.38
Have Some Idea 176 32.06 Total 549 100.00

Life of Slum Occupants & Saving Pattern
91
DIAGRAM 3.3.3 (15)
From the above pie diagram it is found just 7% of the households know about major critical illness health plan. It is found that majority of the households does not have awareness about the above health plan; only 32 % have some idea about the major critical illness health plan.
Table 3.3.3 (l) Senior Citizen Health Plan awareness of 549 respondent families Particulars Senior Citizen Plan Percentage (%)
Know 21 3.83 Don’t Know 430 78.32
Have Some Idea 98 17.85 Total 549 100.00
DIAGRAM 3.3.3 (16)
From the above pie diagram it is found that majority of the respondent family does not have awareness about the above plan. It is found that just 4 % of the respondent families know about the senior citizen health plan.
It is found that majority of the respondent family does not know the importance of health plan; they think this is an expense because premium paid on these health plan does not gives return like other investment plan.

Life of Slum Occupants & Saving Pattern
92
Table 3.3.3 (m) Sources of Loan last 3 years Particulars Sources of Loan last 3 Years Percentage (%)
Loan from Bank 71 19.89 Loan from Unorganised Sector including friends
& family 286 80.11
Total 357 100.00
DIAGRAM 3.3.3 (17)
From the data collected from 549 respondents it is found that 357 families taken loan during last 3 years. It is found that majority of the families has taken loan Unorganized sector. From the survey it is found that in absence of their bank account and their credit history bank refused to provide loan and sometimes due to bank long process time slum occupants prefer to take loan from unorganized sector.
Table 3.3.3 (n) Reason of Loan Particulars Reason of Loan Percentage (%)
Loan for Marriage 77 17.23 Home Construction or
Renovation 188 42.06
Medical Emergency 91 20.36 Education 26 5.82
Other 65 14.54 Total 447 100.00
DIAGRAM 3.3.3 (18)

Life of Slum Occupants & Saving Pattern
93
From the data collected from 549 respondents it is found that in absence of sufficient saving slum occupants meet their financial requirement by availing loan. From the above diagram it is clear that loan for home, medical emergency and marriage is the main reason for loan.
Table 3.3.3 (o) Cost of Borrowing Particulars Cost of Borrowing Percentage (%) Up to 18% 71 19.89
More than 18% 286 80.11 Total 357 100.00
DIAGRAM 3.3.3 (19)
From the data collected from 549 respondents it is found that in absence of bank account and their bank credit history bank normally refused to provide loan to slum occupants. Some times because of bank long process slum occupants prefer to take loan from unorganized sector from their they normally get quick loan at higher rate as compare to bank loan rate..
Table 3.3.3 (p) Loan Repayment Status Particulars Loan Repayment Status Percentage (%)
On Time Repayment 304 85.15 Dealay 53 14.85 Total 357 100.00
DIAGRAM 3.3.3 (20)
From the above Table & Diagram it is clear that around 85% of the respondents are paying their loan installment on time, whereas 15% of the respondents admitted that due to low income and unplanned other financial emergency they are delay in repaying their loan installment.

Life of Slum Occupants & Saving Pattern
94
Table 3.3.3 (q) Saving Bank a/c with Particulars Saving Bank A/c with Percentage (%)
SBI & SBI group 121 30.79 Bank of India 31 7.89
Bank of Maharashtra 16 4.07 ICICI Bank 43 10.94 HDFC Bank 35 8.91 Axis Bank 39 9.92
Basin Cathlic Co.Op. Bank 17 4.33 Any Other Bank 91 23.16
Total 393 100.00
DIAGRAM 3.3.3 (21)
From the above Table & Diagram it is found from the 549 respondents that majority of the respondent prefer to keep account with public sector undertaking bank.
Table 3.3.3 (r) Bank a/c Status Particulars Bank A/c Status Percentage (%)
Families with Bank A/c 393 71.58 Families without Bank A/c 156 28.42
Total 549 100.00
DIAGRAM 3.3.3 (22)
From the above Table and Diagram it is found that large saving is held with unorganized sector. Although out of 549 respondent 72% of the families are operating their bank account, majority of the slum occupant have bank account but sill large population is untouched from organized sector.

Life of Slum Occupants & Saving Pattern
95
3.3.4 HAPPINES LEVEL OF SLUM DWELLERS IN THE SAMPLE AREA
Table 3.3.4 (a) Normally people are happy with migration Particulars Happiness from Migration Percentage (%)
Strongly agree 0 0 Agree 115 20.95
Neutral/no opinion 109 19.85 Disagree 313 57.01
Strongly disagree 12 2.19 Total 549 100.00
DIAGRAM 3.3.4 (1)
From the above Table and Diagram it is found that most of the slum occupants are not happy with migration. It is found that around 57% of the slum occupants are disagree with migration, whereas around 21% of the respondents are agree with happy from migration.
Table 3.3.4 (b) The existing Security Level in the area is good Particulars Existing security Level Percentage (%)
Strongly agree 0 0 Agree 148 26.95
Neutral/no opinion 5 0.91 Disagree 396 72.13
Strongly disagree 0 0 Total 549 100.00
DIAGRAM 3.3.4 (2)

Life of Slum Occupants & Saving Pattern
96
From the above Table and Diagram it is found that majority of the slum occupants are not satisfied from existing security level in their area. It is found that around 72% of the respondents are disagree with existing security level, whereas around 27% of the slum occupants are happy with existing security level in their area.
Table 3.3.4 (c) The existing quality level of water in the area is excellent. Particulars Water Quality Percentage (%)
Strongly agree 0 0 Agree 381 69.40
Neutral/no opinion 10 1.82 Disagree 158 28.78
Strongly disagree 0 0 Total 549 100.00
DIAGRAM 3.3.4 (3)
From the above Table and Diagram it is found that majority of the slum occupants are satisfied from existing water quality supplied by local Municipal Corporation. It is found that around 70% of the respondents are agree with existing water quality level, whereas around 29% of the slum occupants are disagree with existing water quality level.
Table 3.3.4 (d) The existing drainage & Sanitation systems in the area are good. Particulars Drainage & Sanitation Percentage (%)
Strongly agree 0 0 Agree 15 2.73
Neutral/no opinion 0 0 Disagree 120 21.86
Strongly disagree 414 75.41 Total 549 100.00

Life of Slum Occupants & Saving Pattern
97
DIAGRAM 3.3.4 (4)
From the above Table and Diagram it is found that all most all the slum occupants are not satisfied from existing Drainage & Sanitation services provided by local Municipal Corporation. It is found that around 75% of the respondents are strongly disagreeing and around 22% of the respondents are disagreeing with existing Drainage & Sanitation level.
Table 3.3.4 (e) The existing transportation facility in the area is good Particulars Transportation Facility Percentage (%)
Strongly agree 0 0 Agree 157 28.60
Neutral/no opinion 35 6.38 Disagree 357 65.03
Strongly disagree 0 0 Total 549 100.00
DIAGRAM 3.3.4 (5)
From the above Table and Diagram it is found that most of the slum occupants are not satisfied from existing transportation level. It is found that around 27% of the respondents are agreed and around 65% of the respondents are disagreed with existing transportation level.
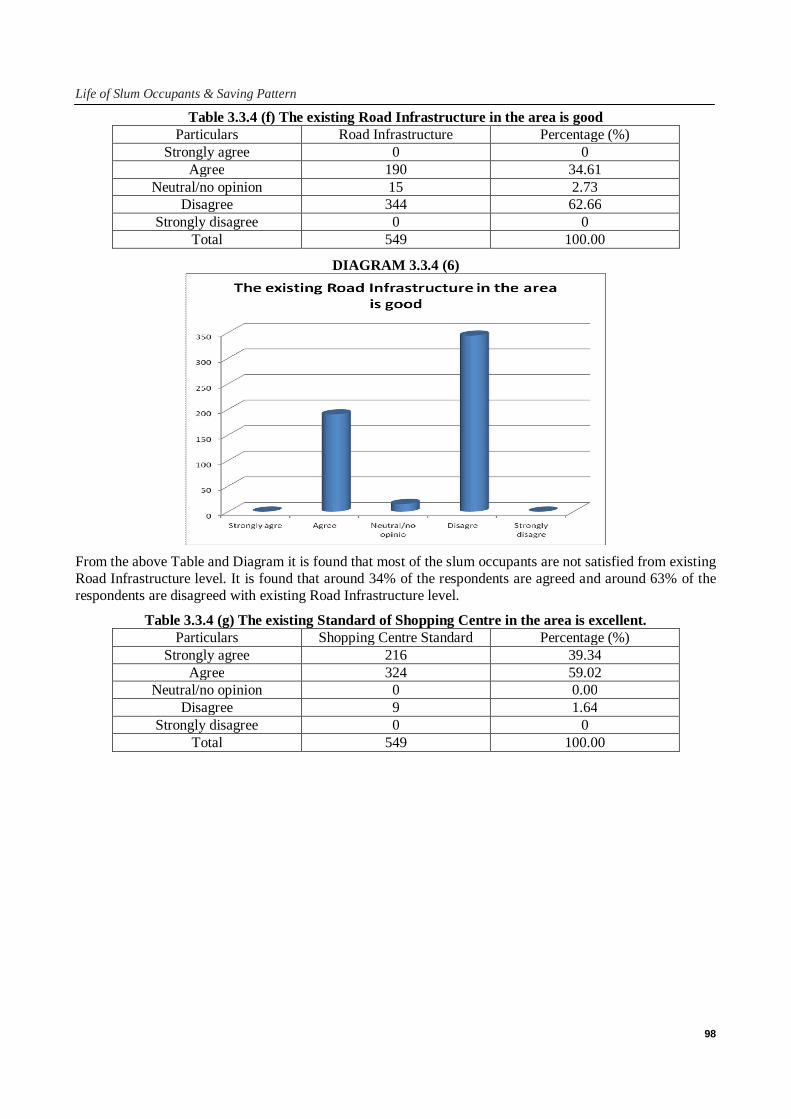
Life of Slum Occupants & Saving Pattern
98
Table 3.3.4 (f) The existing Road Infrastructure in the area is good Particulars Road Infrastructure Percentage (%)
Strongly agree 0 0 Agree 190 34.61
Neutral/no opinion 15 2.73 Disagree 344 62.66
Strongly disagree 0 0 Total 549 100.00
DIAGRAM 3.3.4 (6)
From the above Table and Diagram it is found that most of the slum occupants are not satisfied from existing Road Infrastructure level. It is found that around 34% of the respondents are agreed and around 63% of the respondents are disagreed with existing Road Infrastructure level.
Table 3.3.4 (g) The existing Standard of Shopping Centre in the area is excellent. Particulars Shopping Centre Standard Percentage (%)
Strongly agree 216 39.34 Agree 324 59.02
Neutral/no opinion 0 0.00 Disagree 9 1.64
Strongly disagree 0 0 Total 549 100.00

Life of Slum Occupants & Saving Pattern
99
DIAGRAM 3.3.4 (7)
From the above Table and Diagram it is found that almost all the slum occupants are strongly satisfied from existing standard of shopping center. It is found that around 39% of the respondents are strongly agreed and around 59% of the respondents are agreed with existing standard of shopping center.
Table 3.3.4 (h) The crime level in the area is very low Particulars Crime Level Percentage (%)
Strongly agree 0 0 Agree 0 0
Neutral/no opinion 9 1.64 Disagree 235 42.81
Strongly disagree 305 55.56 Total 549 100.00
DIAGRAM 3.3.4 (8)
From the above Table and Diagram it is found that almost all the slum occupants are not satisfied from existing crime level. It is found that around 43% of the respondents are disagreed and around 63% of the respondents are strongly disagreed with existing crime level.

Life of Slum Occupants & Saving Pattern
100
Table 3.3.4 (i) The existing quantity of water supply is excellent. Particulars Water Quality Percentage (%)
Strongly agree 0 0 Agree 205 37.34
Neutral/no opinion 0 0.00 Disagree 334 60.84
Strongly disagree 10 1.82 Total 549 100.00
DIAGRAM 3.3.4 (9)
From the above Table and Diagram it is found that most of the slum occupants are facing water supply shortage. It is found that around 37% of the respondents are agreed and around 61% of the respondents are disagreed with existing water supply level.
Hypothesis 3: Hypothesis on happiness level I. Null hypothesis: Slum occupants are significantly unhappy in the present condition.
II. Alternative hypothesis: Slum occupants are significantly happy in the present condition.
To test above hypothesis, respondents were asked to respond on five point likert scale with following code.
(SA (5) – Strongly agree, A (4) –agree (3) – neutral/no opinion, D (2) –disagree, SD (1) – strongly disagree)
STATEMENTS A Normally people are happy with migration B The existing Security Level in the area is good C The existing quality level of water in the area is excellent. D The existing drainage & Sanitation systems in the area are good. E The existing transportation facility in the area is good F The existing Road Infrastructure in the area is good G The existing Standard of Shopping Centre in the area is excellent. H The crime level in the area is very low I Existing level of water supply is sufficient

Life of Slum Occupants & Saving Pattern
101
For testing purpose arithmetic mean of values are considered as scores for the variable happiness. We have applied on sample parametric‘t’ test to test null hypothesis with hypothesized value 3.
The details of which are tabulated as follows.
Table – 3.3.4 (j) One sample ‘t’ test of mean v/s hypothesized score 3 for happiness
Mean score
Sample size
Degree of freedom
Calculated ‘t’ value
(one tailed, upper )
Significant P value
Hypothesized scores for happiness μ0 = 3
n= 549
d.f.= 548 t = -29.89
p = 1.0000 Observed Mean rating scores for happiness.
μ1= 2.639
Critical t values: 1. At 5% level of significance the corresponding value t with d.f. 548 is 1.645 2. At 1% level of significance the corresponding t value with d.f. 548 is 2.326
Observation: From the above table it is observed that ‘t’ value for null hypothesis is -29.89 which is less than + 2.326. Also p value is p = 1 which is more than 0.01. Hence the null hypothesis cannot be rejected at 1% level of significance.
Interpretation: On the basis of above data it can be inferred Mean scores for happiness is less than or equal to 3
Findings: It is found that slum occupants are significantly unhappy in the present condition.
3.3.5 RESEARCH ON SAVING OPTIONS OF SLUM DWELLERS IN THE SAMPLE AREA
Hypothesis 4: Basis of decision on saving Saving options are significantly selected on the basis of convenience without doing much research on saving options available.
Considering the survey results, it seem that Saving options are significantly selected on the basis of convenience without doing much research on saving options available. This is the fourth hypothesis of this study as being mentioned in the first chapter. In order to test this hypothesis, total 549 sample divided into households relied on research or advice while saving and on the basis of convenience without doing much research.
DIAGRAM 3.3.5 (1) Saving behavior of 549 respondent family

Life of Slum Occupants & Saving Pattern
102
From the above Pie-diagram it is clear that majority of the households saves their money on the basis of their convenience. Although as have been mentioned earlier number of peoples in these sample slum area is more literate, who are more aware of need for savings. These sample slum area is surrounded by a number of sophisticated residential complexes and industrial area. Many of slum occupants come into direct contact with these people since they work for them.
3.4 FACTORS AFFECTING QUALITY OF LIFE IN SLUMS There are around 1 billion slum dwellers in the world, and by 2020 it is estimated to grow to 1.4 billion. Research proves that children’s living in slums have high chances of disease as compared to their adult counterparts.
The factors affecting the Slum dwellers life are both physically and culturally in nature. Among the physical factors the terrain conditions on which the slums have been sited. The climatic and atmospheric conditions, which change according to seasonal changes, types of vegetation and crops grown in the area, geographic conditions, and slums near to the River or Sea along with the wild animals found in the area. Among the man-made factors the infrastructure facilities of roads, railways, number of persons per residential house, art, theatre, cinema houses, schools, college, training institutes, water supply, sanitation, provision of garbage disposal, administrative peace, facilities of sports, games and the quality of food available to the slum dwellers. This Chapter deals with Objective no. 1, 6, 7 and Problem no. 2, 3, 4 and 5
3.4.1 FACTORS AFFECTING QUALITY OF LIFE IN SLUMS There are several factors which affects Slum dwellers life in the urban cities. The some of the factor affects the slum dwellers lives are as follows:
3.4.1.1 Social Factors
3.4.1.2 Economic Factors
3.4.1.3 Educational Factors
3.4.1.4 Environmental Factors
3.4.1.5 Political Factors
3.4.1.1 SOCIAL FACTORS
Caste Differentiation Caste differentiations are still found in the Hindu society. The whole society is divided into religion and castes. Hindu, Muslim. Christian. Sikh, Parsi are the main religious segments.
Still in India cast discrimination is found, from the study it is found that more than 165 million people are suffering from exploitation because of their caste.
Festivals in the City The Slum life is full of festivals, e.g. Durga Puja in October. The festival of color, i.e. Holi in March. ChhaththeStun worship in November, Saraswati Puja on the eve of BasantPanchmi in February, KartikPurnima bath and MaghiPurnima bath, TilaSankranti on 14th of January along with Christmas day on 25th of December and GancshPuja in September is important. Besides these, several other festive occasions come such as Deepawali the festival of light, Anant Puja, The cultural variations and life of slum could be seen as colourful and joyable occasions.
Religious Performance From the religious point of view Hindus believe more in worship of idols, whereas Muslims read Namaj in mosques, Christians do prayer of Jesus Christ in the Church and Sikh people do prayer to Guru Nanak in Gurdwaras. Besides these, Hindus keep themselves without taking food on religious occasions, Muslims keep themselves hungry at the lime of Ramjan and this practice is not found among Christians. Religious performance has been considered as pious act in almost all religion.
Dress Material of People The people of urban slum are ready to wear any kind of dress because they perceive the innovation earlier unlike other. They always perceive the developed fashions of the society. This makes strong base of urban

Life of Slum Occupants & Saving Pattern
103
life. The young’s are becoming more fashion conscious and they are better exposed to quick change. Urban slum area provides almost a complete family fashion store with something for everyone. So the urban streets are found shops full of bags, belts, shoes, costumes, jewelry, perfume and even laces of the shoes. Hence, in the slum shops of cap, sports, toys, lady's wear and gent's wear are found.
Housing Designs The designs of houses also help in the differentiation of quality of life. Multi-story building, tile roofed houses, tin scan houses of refugees along with poor men's hutments arc quite different from one another. The house types of Hindus arc relatively more open in comparison with houses of the Muslims. This happens because Muslim believes more and more in Purdah system.
Food habit of Residents In slum area those people who are well off they take much better balanced food as compare with poor people. Among the slum the bread, cake, jelly, cream, ice cream, soup and the amount of meat, fish and eggs arc relatively higher in percentage in comparison with rural people. On the whole, slum people prefer ready-made food but not the rural people.
Dance, Music, Art and Science Slum people like dance, music and art more than rural folk. Among them art painting is more popular. Music and dance come under fine arts. Among art Ramlila is more liked by the people slum. Under the category of science the use of telephone, computer, training of radio mechanic, motor mechanic, motorcycle and television repairing arc more important. The learning of dance and music are common practice among the school going and college girls.
Social Conflicts Millions of Lebanese people formed slums throughout the civil war from 1975 to 1990, likewise in recent years due to Taliban violence many rural Afghans were shifted around Kabul.
3.4.1.2 ECONOMIC FACTORS Income Differentiation The society could also be divided into different groups on the basis of income. i.e. high income group; medium income group and low income group. The urban life of these people also varies considerably. The living standards of rich people are always better while the poor people living in slums and squatter settlements have deplorable condition.
Industrial Scenario In Slum the light industries like bakery, oil ghani, flour mill, saw mill and rice mills, Small scale industries like steel furniture and kitchen related products are found in different localities. All these provide employment to the people, but they create nuisance in the residential area along with polluting the environment. Industry has the capacity to provide sustenance to more and more people but it is not easy to manage the affairs of the industry without proper open space and arrangement of sufficient amount of capital.
Rise of Slums Rise of Slums in many different parts of the world has several different reasons. Major reason behind rise of slum are poverty, migration of rural people in search of better jobs and education for their child, informal economy, political reason, unemployment, social conflicts, natural disasters and poor planning. Policy maker are trying their best to make city slum free by slum upgrading, relocation and removal of slum.
Poor Housing Planning Lack of budget home and poor planning encourage the expansion of slum. Lack of financial resources and lack of coordination in government bureaucracy are the two main reasons for slum development.
Colonialism and Segregation In today’s world some of the slums are the product of urbanization brought by colonization. For instance in nineteenth century Nairobi is the example of Colonialism, during nineteenth century European arrived in Kenya and created urban center to fulfill their financial interest. Similarly many slums were created on the basis of segregation by color. Lagos, Nigeria is the example of Segregation.

Life of Slum Occupants & Saving Pattern
104
Social Exclusion, Poor Infrastructure and Economic Stagnation Informal Economy Poor infrastructure and social exclusion forces the economically poor people to adjust in situations beyond his or her control. Poor families are unable to afford transportation cost and lack of transportation forces the worker to settle near to their work place. Similarly in Economic stagnation situation people do not want to take risk and they settle themselves in slum.
Poverty Urban poverty is also the major factor for the development of Slum. With migration of rural poor people, poverty is also migrating to urban area. The poor people arrives with hope, he or she normally has no access to basic amenities. For them slums are only the options to settle themselves. Poverty is strongly correlated to slum formation.
Rural-Urban Migration Rural-urban migration is one the major causes for the formation and creation of slum. Many people attracted to urban areas in the search of diverse income opportunities and better education to their child. However most of the time rural migrants are unable to get immediate job, which leads to their financial shortage. On the other hand many cities do not provide low-cost-housing to the large number of rural migrants and ultimately settle down in only affordable slums.
Standard of Shopping Centers The shopping in the area of slum is of medium and poor standard. This happens due to paucity of fund to the business. Although shopkeepers try themselves to arrange the things in a better way but everything have been done under strain. According to the government record all shops will open at 9 a.m. in the morning and shutters down at about 9 p.m. in the evening. All shopkeepers have to pay tax to the labour office for running a business in the city. On almost all shops huge rush of consumers could be seen from 10 a.m. in the morning up to 7 p.m. in the evening.
Urbanization Rural-urban migration is one the major causes for the formation and creation of slum. Many people attracted to urban areas in the search of diverse income opportunities and better education to their child. However some rural migrants are unable to get immediate job, which leads to their financial shortage. On the other hand many cities do not provide low-cost-housing to the large number of rural migrants and ultimately settle down in only affordable slums.
3.4.1.3 EDUCATIONAL FACTORS The Level of Education The number of literate persons in a society decides the level of education. This could also be done with the presence of schools and colleges in slum area. Education plays an important role in economic growth of any economy. With increasing urbanization, urban migration has led to a serious problem of increase in urban slums. These urban poor usually consist of semi-skilled or unskilled labor. The poor condition of these urban poor in slum areas is mainly due to their inability to compete with skilled labor class and afford a decent standard of living.
3.4.1.4 ENVIRONMENTAL FACTORS Quality of Water Supply Many millions of slum dwellers are excluded from formal systems of water service delivery. Without access to piped water services, households and individual are forced to use inadequate supplies of water, often poor quality with full of dirt’s and dusts, from unreliable sources and usually at high cost. The drinking of unfiltered water is always risky because that may cause roundworm, hookworm, Jaundice and several other forms of diseases.
The share of urban population to the total population of India has increased from 27.81% in 2001 to 31.16% in 2011. This increase has also been accompanied by rapid growth of slums in cities. The 2011 Census of India reveals that 17.4% of urban households in India live in slums. The ever increasing number of slum-dwellers poses serious challenges to provision of basic urban services. Water availability, its access by urban poor and water quality emerged as key concern for urban planners.

Life of Slum Occupants & Saving Pattern
105
Sanitation There are many slums without access to sanitation services. Some are lucky enough to have public latrine. Better sanitation is pre-requisite for the entire citizen. Cleanliness of the slum, lighting arrangement, dump of garbage at requisite place and proper planning of the municipal localities arc quite essential for a hygienic environment.
Occupancy Rate In the Slum the occupancy rate varies from 4 persons per room to 8 persons per room4. Occupancy rate is a sign of level of overcrowding of population in a particular family. In slum room many times it took long time to take bath because of large family living in small room and they have to share common bathroom.
Terrain Condition The mode of terrain is decided by the ups and downs of land in the Slum. Generally, well of people resides in upland area where as poor’s reside on fringe of the slum especially in low-lying area where the price of the land is relatively less. Terrain is the guiding factor of flow of water either through drains or surface run-off of rainwater.
Atmospheric Condition For the development of a city, market centre, and commercial centre the availability of healthy climate is quite essential. The temperature around 30°C, the rainfall amounting to 150 cm annually, lack of gales, etc. arc essential. Dry climate, heavy downpour and snowfall are not conducive for a good marketing environment6.
Types of Vegetation and Crops Normal growths of vegetation and agriculturally productive hinterland have been considered essential for the proper growth of a city. Forest environment repel urban development and so is the excessive importance of crop production.
Problems of Flood and High Tide High tide due to the nearness of Sea or river flood is a rampant problem especially during the rainy season for the slum occupant. Maximum rainfall and flood recorded especially in 1930, 1974, 1976, 1991 and 200512. The problem is acute especially for the poor’s and vegetable growers around the market centre as knee deep to neck deep water flows in most of the slum area near to Sea or River area during rainy season.
Natural Disasters Peoples migrate to unaffected areas from affected areas due to major natural disaster in poor nations. Initially migrated people settle in temporary tent in cities which creates expansion of existing slum. With time passes these slums convert into permanent as these migrated peoples do not want to leave the current place. Slums near Port-au-Prince after the 2010 Haiti earthquakes and slums near Dhaka after 2007 Cyclone are the example of natural disaster.
3.4.1.5 POLITICAL AND OTHER FACTORS Politics Many local and national level politicians for their political interest, subverted efforts to remove, reduce or upgrade slum into better housing options for the poor. During the second half of the 19th century, i.e. political parties of the French relied on votes of slum population and they are engaged in maintaining that voting bloc. Replacement and removal of slum created a conflict of interest, and politics prohibited efforts to remove, relocate or upgrade the slums into housing projects that are better than the slums. Similar situations are found in the slum of Brazil, slums of India, and slums of Kenya.
Levels of Theft and burglary Theft and burglary are affecting the lives of thousands of people in slum area. In a survey of fifteen thousand households is found that most of senior citizen, children and women’s are unsafe in Mumbai north central area.
Alcoholism Alcohol consumption has been identified as a risk factor for many health, social and economic problems of commerce. The family plays a major role in terms of social, economic and cultural value. These influences can have both a positive or negative effect on developing norms and values within the family. Alcohol

Life of Slum Occupants & Saving Pattern
106
consumption has been identified as a major risk factor for occurrence of both intentional and unintentional injuries.
Crime Rate In the slum areas the refinement of crime could be seen in terms of the use of gun, revolver, and attack with bomb. Now-a-days, food poisoning, suicide, dacoity and theft arc common practices and what to talk of murder of public as even the police personnel's some time feel themselves unsafe. Use of unfair means in the examination, rape, kidnapping, murder and atrocities arc rampant everywhere.
Standard of Living In Indian slum area the standard of living is very low. Income of the public is so low that they cannot afford full meal of balanced food and what to talk of nutritious food. Anyhow the general public is filling their stomach with their meager income. Wretched clothes, illiteracy, congested living; wrath of rangdars could be seen in almost all parts of the slum.
Provision of Recreation In the urban slum area cinema houses, Ramlila party, programme of dance, music, theatre and cultural show in terms of exhibitions are common practices which need to be redressed and rearranged for better performance of entertainment. These days the cinema on television has sufficiently reduced the cincgoers in the cinema halls.
Administrative Peace It has been considered essential for running a business otherwise the fear of rangdars, thieves, dacoits and politicians arc always there who like to grab money by force. Without peace no business could prosper. It is essential either by police force or by keeping private guard for the purpose. Especially Nepalese are kept as night guard in the slum area.
3.4.2 STUDY FACTORS AFFECTING QUALITY OF LIFE IN SELECTED SLUM AREA To identify important factors affecting quality of life in slums, respondents were asked to response on five point agreement scale with following code.
(SA (5) – Strongly agree, A (4) –agree (3) – neutral/no opinion, D (2) –disagree, SD(1) – strongly disagree)
Table 3.4.2 (a) The existing housing condition is satisfactory to live. Particulars Housing Condition Percentage (%)
Strongly agree 0 0 Agree 109 19.85
Neutral/no opinion 61 11.11 Disagree 218 39.71
Strongly disagree 161 29.33 Total 549 100.00
DIAGRAM 3.4.2 (1)

Life of Slum Occupants & Saving Pattern
107
From the above Table and Diagram it is found that most of the slum occupant’s income is not sufficient to repair or maintain their housing condition therefor they are not satisfied form existing housing condition. It is found that around 20% of the respondents are agreed for satisfactory house condition, around 40% of the respondents are disagreed and around 29% of the respondents are strongly disagreed with existing housing condition to live.
Table 3.4.2 (b) Peoples in the society are divided by their cast Particulars Cast Factor Percentage (%)
Strongly agree 0 0 Agree 134 24.41
Neutral/no opinion 66 12.02 Disagree 348 63.39
Strongly disagree 1 0.18 Total 549 100.00
DIAGRAM 3.4.2 (2)
From the above Table & Diagram it is found that most of the slum occupants are not divided by their cast factor and they are living together. It is found that 63% of the respondent admitted that they are not divided by cast vise, only 24% of the respondent admitted that they are divided by cast factor but majority of the slum occupants are not divided by cast factor.
Table 3.4.2 (c) The level of theft and burglary in area is very low. Particulars Theft and Burglary Percentage (%)
Strongly agree 0 0.00 Agree 201 36.61
Neutral/no opinion 51 9.29 Disagree 297 54.10
Strongly disagree 0 0.00 Total 549 100.00

Life of Slum Occupants & Saving Pattern
108
DIAGRAM 3.4.2 (3)
From the above table and diagram it is found that some part of the slum occupants are not safe in the present security system. It is found that 54% of the slum occupants admitted that theft and burglary incidence in their area is high, whereas 19% of the slum occupant admitted that theft and burglary in their area is very low and satisfactory.
Table 3.4.2 (d) The existing occupancy rate is very high. Particulars Occupancy Rate Percentage (%)
Strongly agree 0 0.00 Agree 317 57.74 Neutral/no opinion 126 22.95 Disagree 106 19.31 Strongly disagree 0 0.00 Total 549 100.00
DIAGRAM 3.4.2 (4)
From the above table and diagram it is found that high occupancy is the major issue. It is found that around 58% of the slum respondent family admitted that they are facing from high occupancy problems in their home whereas around 19% of the respondent slums are not facing from high occupancy rate in their home.

Life of Slum Occupants & Saving Pattern
109
Table 3.4.2 (e) The environment condition is excellent to live. Particulars Environment Condition Percentage (%)
Strongly agree 0 0.00 Agree 0 0.00
Neutral/no opinion 53 9.65 Disagree 451 82.15
Strongly disagree 45 8.20 Total 549 100.00
DIAGRAM 3.4.2 (5)
From the above table and diagram it is found that environment conditions of the slum occupants are not excellent to live, slum occupants are commonly facing problems from various pollution. It is found that almost all the slum occupants admitted that slum environment condition is not satisfactory to live.
Table 3.4.2 (f) The cleanliness in the area is excellent. Particulars Cleanliness in the area Percentage (%)
Strongly agree 0 0.00 Agree 22 4.01
Neutral/no opinion 141 25.68 Disagree 338 61.57
Strongly disagree 48 8.74 Total 549 100.00

Life of Slum Occupants & Saving Pattern
110
DIAGRAM 3.4.2 (6)
From the above table and diagram it is found that cleanliness in the slum area is the major concern, slum occupants are largely affected by cleanliness problems in their area and because of this many families are suffering from illness problem. It is found that around 62% of the respondent are disagree with the present cleanliness system and around 9% respondents are strongly disagree with the present cleanliness system.
Table 3.4.2 (g) All parents want to educate their children. Particulars Education to Children Percentage (%)
Strongly agree 400 72.86 Agree 147 26.78 Neutral/no opinion 0 0.00 Disagree 2 0.36 Strongly disagree 0 0.00 Total 549 100.00

Life of Slum Occupants & Saving Pattern
111
DIAGRAM 3.4.2 (7)
From the above table and diagram it is found that almost all the parents want to educate their child. It is found that around 73% of the respondent family strongly admitted regarding education to their child.
Table 3.4.2 (h) Peoples in the society are divided according to their income level. Particulars People divided by Income
Group Percentage (%)
Strongly agree 0 0.00 Agree 364 66.30
Neutral/no opinion 95 17.30 Disagree 90 16.39
Strongly disagree 0 0.00 Total 549 100.00
DIAGRAM 3.4.2 (8)
From the above table and diagram it is found that people normally divided by their income group. It is found that around 66% of the respondent admitted and agreed that they are divided by income level and around 16% of the respondent admitted that they had not formed their group as per their income level.

Life of Slum Occupants & Saving Pattern
112
Table 3.4.2 (i) The industrial level is satisfactory to provide employment to all the workers as per their skill.
Particulars Employment from Industry Percentage (%) Strongly agree 72 13.11
Agree 280 51.00 Neutral/no opinion 102 18.58
Disagree 95 17.30 Strongly disagree 0 0.00
Total 549 100.00
DIAGRAM 3.4.2 (9)
From the above table and diagram it is found that local industries are providing sufficient employment opportunities to the slum occupants. it is found that around 13% of the respondents are strongly agreed that local industry is sufficiently providing employment opportunities and also around 51% of the respondents are agreed for the same. Whereas 17% of the respondents are disagreed and they admitted that local industry are not providing employment opportunities as per their skill set.
Table 3.4.2 (j) Migration from rural to urban is in search of better jobs. Particulars Migration for better Jobs
from Rural Percentage (%)
Strongly agree 153 27.87 Agree 366 66.67
Neutral/no opinion 0 0.00 Disagree 30 5.46
Strongly disagree 0 0.00 Total 549 100.00

Life of Slum Occupants & Saving Pattern
113
DIAGRAM 3.4.2 (10)
From the above table and diagram it is clearly understood that rural people are migrated to urban in search of better employment opportunities. It is found that around 28% of the respondents are strongly admitted that people are migrated for better employment opportunities and around 67% of the respondents are also admitted. Whereas 5% of the respondent are disagree for the same.
Table 3.4.2 (k) The Peoples in their society like to participate in festivals. Particulars Festival Participation Percentage (%)
Strongly agree 125 22.77 Agree 349 63.57
Neutral/no opinion 67 12.20 Disagree 8 1.46
Strongly disagree 0 0.00 Total 549 100.00
DIAGRAM 3.4.2 (11)
From the above table and diagram it is found that slum families are jointly celebrates all the festivals in their area. It is found that around 23% of the respondents are strongly admitted that they all celebrate jointly and also 64% of the respondent agreed for the same.

Life of Slum Occupants & Saving Pattern
114
Table 3.4.2 (l) Rural-urban migration is the major factor for rise in slum. Particulars Migration is major factor for
Slum rise Percentage (%)
Strongly agree 125 22.77 Agree 349 63.57
Neutral/no opinion 67 12.20 Disagree 8 1.46
Strongly disagree 0 0.00 Total 549 100.00
DIAGRAM 3.4.2 (12)
From the above table and diagram it is found that migration is the major reason for creation and expansion of the slum. Rural people normally migrate to urban in better job employment opportunities and to provide better education to their child. But due to non-availability of job as per their desire and non-availability of low cost accommodation, these factor forces them to settle in slum. It is found that around 80% of the respondents agreed that migration is the major factor for slum rise.
Table 3.4.2 (m) The existing government policy is not satisfactory to eradicate the slums. Particulars Government Policy non
Satisfactory Percentage (%)
Strongly agree 78 14.21 Agree 390 71.04
Neutral/no opinion 80 14.57 Disagree 1 0.18
Strongly disagree 0 0.00 Total 549 100.00

Life of Slum Occupants & Saving Pattern
115
DIAGRAM 3.4.2 (13)
From the above table and diagram it is found that still present government policies are not sufficient to completely eradicate the slum from urban area. It is found that around 71% of the respondent agreed that exiting government policies are not sufficient to completely eradicate the slum from urban and 14% of the respondent strongly admitted for the same.
Table 3.4.2 (n) Government needs to create more funds for improvement of housing conditions in slums.
Particulars Fund creation for slum development
Percentage (%)
Strongly agree 243 44.26 Agree 181 32.97
Neutral/no opinion 124 22.59 Disagree 1 0.18
Strongly disagree 0 0.00 Total 549 100.00
DIAGRAM 3.4.2 (14)

Life of Slum Occupants & Saving Pattern
116
From the above table and diagram it is found that present allocated fund is not sufficient for the development of slum and government has to create more funds for improvement of the slum. It is found that around 44% of the respondent strongly agreed that government has to allocate more funds from the existing level for the development and eradication of the slum from urban area. And around 33% of the respondents also agreed for the same.
Table 3.4.2 (o) Lower income people are forced to live in slum, this gives rise to slum. Particulars Low Income gives rise to
slum Percentage (%)
Strongly agree 407 74.13 Agree 141 25.68
Neutral/no opinion 0 0.00 Disagree 1 0.18
Strongly disagree 0 0.00 Total 549 100.00
DIAGRAM 3.4.2 (15)
From the above table and diagram it is found that in absence of low cost housing and lower income, poor people are forced to settle themselves in slum area. It is found that around 74% of the respondents strongly agreed that lower income is the main reason to settle them in slum area, and also 26% of the respondents are agreed for the same.
Table 3.4.2 (p) Social conflict like civic war is responsible for rise in slums. Particulars Social conflict creates slum
rise Percentage (%)
Strongly agree 0 0.00 Agree 311 56.65
Neutral/no opinion 151 27.50 Disagree 87 15.85
Strongly disagree 0 0.00 Total 549 100.00

Life of Slum Occupants & Saving Pattern
117
DIAGRAM 3.4.2 (16)
It is found from the table and diagram that during social conflict peoples normally migrate to other safe place, which gives rise to population in that area which create expansion of slum in many times. It is found that around 57% of the respondent agreed that situations like social conflict gives rise to slum. Whereas around 16% of the respondents are disagree for the same.
Table 3.4.2 (q) The existing recreational facilities are satisfactory. Particulars Recreation facility Percentage (%)
Strongly agree 0 0.00 Agree 22 4.01
Neutral/no opinion 272 49.54 Disagree 253 46.08
Strongly disagree 2 0.36 Total 549 100.00
DIAGRAM 3.4.2 (17)
It is found from the table and diagram that slums are normally overcrowded and lack of land, there is not sufficient recreation facility available for the slum occupants. it is found that around 46% of the respondents are disagree with the existing recreational facility in their area.
Table 3.4.2 (r) The measure part of income is utilized for alcohol consumption. Particulars Income utilized for Alcohol
consumption Percentage (%)
Strongly agree 0 0.00 Agree 240 43.72

Life of Slum Occupants & Saving Pattern
118
Neutral/no opinion 66 12.02 Disagree 243 12.02
Strongly disagree 0 0.00 Total 549 100.00
DIAGRAM 3.4.2 (18)
From the above table and diagram it is found that major part of the income is utilized in Alcohol consumption. It is found that around 44% of the respondents agreed that their major part of the income is utilized for alcohol consumption, whereas 44% of the respondents disagreed for the same.
Table 3.4.2 (s) The existing level of transportation facility is satisfactory. Particulars Transportation facility Percentage (%)
Strongly agree 0 0.00 Agree 80 14.57
Neutral/no opinion 168 30.68 Disagree 301 54.83
Strongly disagree 0 0.00 Total 549 100.00
DIAGRAM 3.4.2 (19)
From the above table and diagram it is found that transportation facility around the slum area has improved but still it requires attention of the government. It is found that around 15% of the respondents are satisfied and agreed from the exiting transportation facility available for them; whereas still 55% of the respondents are not satisfied and they are disagree from the satisfaction level from existing transportation facility.

Life of Slum Occupants & Saving Pattern
119
Reliability test of factors forming construct: Initially reliability test of Factors of a construct is conducted which indicates that data are reliable as the value of Cronbach alpha is 0.628 more than 0.60.
Adequacy of Sample and Applicability of Factor Analysis: Table no. 3.4.2(t) indicates Kaiser-Meyer-Olkin test which measures the sampling adequacy and Barlett’s test of sphericity to measure whether factor analysis can be applied or not.
Table no. 3.4.2 (t) KMO and Bartlett's Test
Kaiser-Meyer-Olkin Measure of Sampling Adequacy. 0.474 Bartlett's Test of Sphericity Approx. Chi-Square 8246.764
D.f. 171 Sig. 0.000
From the above, it is reveals that sample for study is adequate because KMO value is 0.474 which is close to five. While significance values of Bartlett test i.e. 0.000 indicates that factor analysis can be applied.
Communalities (Factor loading): The values of communalities explain the variables explained by the factors under study.
Table no. 3.4.2 (u) Values of Communalities Statement Initial Extraction
A The existing housing condition is satisfactory to live. 1.000 .859 B Peoples in the society are divided by their cast 1.000 .731 C The level of theft and burglary in area is very low. 1.000 .829 D The existing occupancy rate is very high. 1.000 .487 E The environment condition is excellent to live. 1.000 .856 F The cleanliness in the area is excellent. 1.000 .831 G All parents want to educate their children. 1.000 .740 H Peoples in the society are divided according to their income level. 1.000 .860 I The industrial level is satisfactory to provide employment to all the
workers as per their skill. 1.000 .657
J Migration from rural to urban is in search of better jobs. 1.000 .885 K The Peoples in their society like to participate in festivals. 1.000 .703 L Rural-urban migration is the major factor for rise in slum. 1.000 .738 M The existing government policy is not satisfactory to eradicate the
slums. 1.000 .724
N Government needs to create more funds for improvement of housing conditions in slums.
1.000 .846
O Lower income people are forced to live in slum, this gives rise to slum.
1.000 .631
P Social conflict like civic war is responsible for rise in slums. 1.000 .705 Q The existing recreational facilities are satisfactory. 1.000 .903 R The measure part of income is utilized for alcohol consumption. 1.000 .808 S The existing level of transportation facility is satisfactory. 1.000 .806 Note: Extraction Method: Principal Component Analysis.
The value of communalities in the table no. 3.4.2.(u) Shows that all but one the factor has values more than 0.50. Thus all but one factor are considered for factor analysis.
Total Variables explanation as factors: The table no.3.4.2(v) and diagram no. 3.1 indicates Total Variance explained and its Scree Plot for factor analysis under study. Method used for the same is Principal component method for extraction.

Life of Slum Occupants & Saving Pattern
120
Table no. 3.4.2 (v) Total Variance Explained
Component
Initial Eigen values Extraction Sums of Squared
Loadings Rotation Sums of Squared
Loadings
Total % of
Variance Cumulative
% Total % of
Variance Cumulative
% Total % of
Variance Cumulative
% 1 3.921 20.636 20.636 3.921 20.636 20.636 3.037 15.986 15.986 2 3.135 16.502 37.138 3.135 16.502 37.138 2.663 14.017 30.003 3 2.770 14.579 51.717 2.770 14.579 51.717 2.502 13.167 43.170 4 2.213 11.647 63.364 2.213 11.647 63.364 2.407 12.669 55.839 5 1.431 7.534 70.898 1.431 7.534 70.898 2.396 12.610 68.449 6 1.127 5.932 76.830 1.127 5.932 76.830 1.592 8.381 76.830 7 .936 4.928 81.757 8 .754 3.970 85.727 9 .681 3.585 89.313
10 .554 2.913 92.226 11 .328 1.727 93.954 12 .288 1.515 95.469 13 .257 1.351 96.820 14 .208 1.093 97.913 15 .120 .631 98.544 16 .115 .608 99.152 17 .092 .483 99.635 18 .039 .206 99.841 19 .030 .159 100.000
Extraction Method: Principal Component Analysis.
Diagram no. 3.4.2 (20)

Life of Slum Occupants & Saving Pattern
121
The above table and graph reveals that Factors of analysis for quality of life in slums are formed into six groups explaining 76.83 percentages of variables.
3.4.2.2 Rotated Component Matrix for forming group (Construct): In order to form the group, Rotated component matrix using principal component analysis, Varimax with Kaiser Normalization. It helps to form the group under study for the factors influencing the choice of service provider for sending mails. Table no. 3.4 indicates factor loading forming the groups and their comparison.
Table no. 3.4.2.2 (a) Rotated Component Matrixa Component
1 2 3 4 5 6
A .024 -.020 .168 .029 .045 .909
B -.033 .397 .616 .001 .205 .388
C .696 .531 -.048 .105 .128 .179
D -.023 -.617 -.143 .095 .205 -.184
E -.441 .093 .035 -.740 .267 .181 F .019 .757 .354 .186 .125 -.287
G -.123 .076 .665 -.023 -.414 .325 H -.052 -.102 -.069 .518 .724 .221
I -.019 -.063 -.182 -.090 .782 .005 J .175 -.610 .180 -.332 .456 .362
K -.274 -.022 .716 .076 -.259 -.205
L -.064 -.061 .017 .850 .061 .066 M -.684 -.021 .343 .087 .288 -.219
N -.103 -.601 -.023 .329 .591 -.125 O -.729 .127 .198 .144 .118 .098
P .147 .192 .789 -.033 -.013 .153
Q .834 .077 .324 .115 .284 -.048 R .609 .620 .167 -.143 -.039 -.055
S .361 -.243 -.088 -.719 -.302 .007 Extraction Method: Principal Component Analysis.
Rotation Method: Varimax with Kaiser Normalization. a. Rotation converged in 12 iterations.
Table no. 3.4.2.2 (b) Factor groups along with their components Component Variables forming groups 1 2 3 4 5 6
C The level of theft and burglary in area is very low.
0.696
Q The existing recreational facilities are satisfactory.
0.834
F The cleanliness in the area is excellent. 0.757 R The measure part of income is utilized for alcohol
consumption 0.620
B Peoples in the society are divided by their cast 0.616

Life of Slum Occupants & Saving Pattern
122
G All parents want to educate their children. 0.665 K The Peoples in their society like to participate in
festivals. 0.716
P Social conflict like civic war is responsible for rise in slums.
0.789
L Rural-urban migration is the major factor for rise in slum.
0.850
H Peoples in the society are divided according to their income level.
0.724
I The industrial level is satisfactory to provide employment to all the workers as per their skill.
0.782
A The existing housing condition is satisfactory to live.
0.909
From above table it is observed that, there are 6 important factors extracted which are affecting quality of life in slums. For these purpose 12 variables (Table no. 3.4.2.2(b)) contributes towards the quality of life in these slums. Remaining seven variables are not contributing much.
As this chapter also discusses factors affecting the quality of life in slums the researcher has stated the general factors responsible for quality of life and factor affecting the quality of life in selected areas. The researcher found there are many factors which affect the life of people is basically related to social, economical, educational, environmental and political and others. He concluded that there is an integrated impact of several factors on the quality of urban life of people in Mira Bhayander.
3.5. SUMMARY This chapter presents and analyses various socio economic conditions faced by slum dweller in the study area of 14 sample slum.
At the same time the chapter also describes income distribution amongst 549 sample slum dweller, and their saving pattern which is an important activity for every household and eventually of the whole country.
The socio-economic condition of 549 sample slum has been described in topic 3.3.1 shows an economically developing slum population which is aware and even capable of their self-development. Some of the problems they face are low level of public goods made available to these people like water, sanitation facilities, proper roads, etc. which makes their day to day life full of stress. Bad habits of male members of the houses increase this stress further which also create bad environment for growth of children.
The happiness level of 549 sample slum dweller is described in sub topic 3.3.4. One of the hypotheses of the study is concerned with satisfaction from migration, existing security level in the area, water quality and quantity, the existing drainage and sanitation system, existing transportation facility, road infrastructure, standard of shopping centre and crime level in the area. It is found that slum occupants are significantly unhappy in the present condition.
The income distribution of 549 sample slum dweller, along with various sources of income, is described in sub topic 3.3.2. One of the hypotheses of the study is concerned with relative contribution of slum family members towards the family income. This sub topic indicates that head of each family is the main contributor towards the family income. But these families have to face main problem is low level of education which is unable to provide secure and well-paid jobs to these people. With growing cost of living in Mira Bhayandar, a need to buy a house and some of the basic amenities, income of only one person is not enough for the family that is why all other family members are compelled to work and earn. Most of the families are being nuclear, when parent are busy whole day they cannot give proper attention to their children.
The last two hypotheses are related to saving of slum dweller with organized and unorganized sectors and also the basis on which saving option are selected which has been reviewed in the sub topic 3.3.3 and 3.3.5. This sub topic discloses the fact that in the particular study area, significant savings are done with unorganized sector mainly because it is more convenient. This sub topic also discloses another fact that slum population do not have time and energy to do research about various new saving options, pros and cons of

Life of Slum Occupants & Saving Pattern
123
each option and take a conscious decision. It becomes a mechanical process, in which the household saves in the instruments which is more popular amongst the slum people, which saves their time and energy and are not much aware of all merits and demerits of those instruments. This chapter provides a detailed review of socio economic environment and mental set up of slum dweller, which also describes the rationale behind saving behavior of slum inhabitants. This review shows the need for further and effective marketing of new small saving instruments made available by organized sector and also indicates the need for NGOs in providing proper social and financial education to the slum population.

Life of Slum Occupants & Saving Pattern
124
CHAPTER – IV
SUMMARY, RECOMMDENDATION, LIMITATION AND SCOPE FOR
FURTHER WORK

Life of Slum Occupants & Saving Pattern
125
4.1. SUMMARY 4.1.1 SOCIO-ECONOMIC CONDITIONS OF THE SAMPLE AREA
4.1.2 FINANCIAL ANALYSIS OF SLUM DEWELLER IN THE STUDY AREA.
4.1.3 SAVING BEHAVIOR OF SLUM DEWELLER IN THE SAMPLE AREA
4.1.4. HAPPINES LEVEL OF SLUM DWELLERS IN THE SAMPLE AREA
4.1.5 RESEARCH ON SAVING OPTIONS OF SLUM DWELLERS IN THE SAMPLE AREA
4.1.6 FACTORS AFFECTING QUALITY OF LIFE IN SLUMS
4.2. RECOMMENDATION 4.2.1 SOCIO-ECONOMICAL CONDITIONS AND INCOME DISTRIBUTION OF SLUM
DWELLER OF SELECTED AREA.
4.2.2. SAVING BEHAVIOR OF SLUM DEWELLER IN THE SAMPLE AREA
4.2.3 HAPPINES LEVEL OF SLUM DWELLERS IN THE SAMPLE AREA
4.2.4 RESEARCH ON SAVING OPTIONS OF SLUM DWELLERS IN THE SAMPLE AREA
4.2.5 FACTORS AFFECTING QUALITY OF LIFE IN SLUMS
4.3 LIMITATION OF THE STUDY
4.4 SCOPE FOR FURTHER STUDY
4.5 SUMMARY

Life of Slum Occupants & Saving Pattern
126
INTRODUCTION The study on “Life of Slum Occupants & Saving Pattern” is based on through analytical research methodology. The researcher has finely used primary as well as secondary source of data collected and same is being analyzed with different tools and techniques for interpretation and methodological finding of the very study. This topic will give the brief summary of findings and researcher suggestions and recommendations related to area of his study. The major findings of the study are as follows:
4.1 SUMMARY: 4.1.1 SOCIO-ECONOMIC CONDITIONS OF THE SAMPLE AREA 1. The research findings reveals that in overall history of slums in Maharashtra state where the people is
living below the poverty line, this study surprisingly shows that the slum occupants economic wellbeing sample area is much higher than the poverty line. Majority of selected slum dwellers are literate, employed and are receiving all basic necessities of life with few comforts. The living standard that they are enjoying is slight better than the degraded living faced by many slum dwellers of metropolitan cities of the India. The standard of living is based on their own efforts and saving system.
2. Most of the sample-area-inhabitants are laborers hailing from various parts of the country who have migrated to Mira-Bhayander in search of better job. Generally these migrant families are nuclear families where both parents are busy in their work for the whole day. They have no time to take care of their children because of which, most of children become reveler and they get addicted to different wrong practices.
3. Although the selected slum area enjoys relatively better living than other slums, still daily life is struggleful for them. Their cost of living is relatively higher. As the houses in this area are congested and large in number, they don’t have proper ventilation facilities. These dwellers in this area facing various problems such as availability of drinking water, sanitation facilities, playground and size of road etc. are the major issues pertaining to environment.
4. The study shows due to awareness and government facilities the majority of the population are moderate literate. This helps them to secure job in the market for their survival. They can do task based job which is daily basis or monthly. As the researcher has also focused on their job nature. He found that majority of population have temporary job which has less earnings and no surety about future. This resultant in to low saving and increases dropout rate, basically girl child in getting basic education. The girl helps their parent by different ways.
5. As the most of the family are migrated with singly family. Both the parent is working. They do not get much time to spend with their kids. There is lack of communication, guidance, attention and affection and inculcation of social values among them. This leads to different bad effects among them such drinking liquor, smoking and other social issues.
6. Due to lack of guidance and attention make them think out of society which leads to serious issues in respect of economy, society and environment.
4.1.2 FINANCIAL ANALYSIS OF SLUM DEWELLER IN THE STUDY AREA: 1. The study indicates that most of the families are above the poverty line. This is because ratio of literate
and working population is quit higher. Growth of sophisticated residential complexes in the surrounding area provides a large number of employment opportunities for these people. Most of the populations are working as driver, electrician, painter and other work.
2. Due to high living cost, temporary job of head of the family compels all family members to contribute towards total family income. Neighboring residential complexes and small scale industrial units become a source of income to their family members whereas children distribute newspapers, milk to the residential complexes, women work as maid, cook, even do some labour work for nearby SSI units from home and earn.
3. It is observed from the study of 14 selected sample areas, majority of the slum dwellers are young generation and they are in the age group of 15-59 years.

Life of Slum Occupants & Saving Pattern
127
4. As per Government of Maharashtra rationing guidelines, the affluent families are not allowed to purchase food grains under PDS and therefore with a view to curb diversion of food grains and to provide more food grains to the needy families, the State Government introduced Tri color ration card scheme w.e.f. 1st May, 1999. Three different colored ration cards are Yellow, Saffron and White ration card. It observed from the study that majority of the slum dwellers are taking the benefit of PDS scheme even though their family income is higher as prescribed by Controller of Rationing and director of civil supplies of Government of Maharashtra.
5. Up to the age group of 30 years it is observed from the respondent that non-educated peoples are getting higher than educated slum dwellers.
6. Although all family members contribute towards family income, still head of the family is the major contributor to the family income. It is mainly because job and earning is the main priority of the family head and thus he is using majority of his time to earn livelihood for his family. Whereas other members of the family have different priorities. Women have to take care of the household, manage food and water for the family. Children have school and studies. So these members use remaining time to work and earn to provide some support to family income.
7. Average income of family heads and average earnings of other family members are taken separately. In order to test first hypotheses, parametric independent ‘t’ test was applied for data related to contribution of the head of the slum households and other members of family. As p value is 0.000 which is less than α = 0.01 null hypothesis is rejected. It is also observed that calculated ‘t’ value is 9.25 which is more than 2.326, hence null hypothesis Ho is rejected, the test proved head of the family as the major contributor to family income. In short, the study shows that “the head of the family is the major contributor towards family income” Hence null hypothesis (Ho) is rejected.
4.1.3 SAVING BEHAVIOR OF SLUM DEWELLER IN THE SAMPLE AREA: 1. It has been observed that sample slum households are able to save only 8.53% of their family income
which is reosonably not sufficient amount as even it is not able to beat the rising inflation. However they save because they are financial vulnerable due to temporary jobs, low incomes and high living cost. So the reason behind their savings is precaution.
2. Comparatively large portion of savings of slum households are with unorganized sector rather than organized financial sector. Although growth of literacy and growth of Indian banking and Insurance sector, have led to increased savings with organized financial sector, as compared to the period before liberalization, it is much less if considered the potential. It is because still low income group are saving more with unorganized sector.
3. In spite of being aware about the drawbacks of unorganized sector, slum inhabitants still opt for saving with chit funds and similar instruments of unorganized sector also because at the time of taking loan, no restrictions are imposed on them, even without putting any query about reason behind loan. At any hour any amount of loan is given to them.
4. In order to find out relatives dominance of organized and unorganized sector on slum savings, parametric paired ‘t’ test was applied. From the observation p value 0.9999 which is greater than α = 0.05 (5% significant level) we reject null hypothesis. Since calculated ‘t’ value is 4.060 is more than 2.326 (table value of at 1% significant level, lower tailed and d.f. 549). Hence we failed to reject null hypothesis Ho. On the basis of above data it can be inferred that there is no significant difference between organized sectors household savings and unorganized sectors household savings.
5. Thus considering all the above facts and finding of the study it concluded that null hypothesis (Ho) is accepted. The second hypotheses of the study,’ the unorganized sector has maximum household’s savings’. So, the Hypotheses number two is accepted.
6. Although many new and convenient and useful saving options are made available by organized financial sector, still people opt for unorganized saving. This only because of lack of awareness regarding policy and return on unorganized sector is relatively higher as compare to organized sector. There are two main reasons behind their unawareness; firstly, lack time, interaction with concern person. Secondly, is efforts

Life of Slum Occupants & Saving Pattern
128
taken by banks and financial institutions to promote new available schemes, its benefits etc. amongst the slum inhabitants.
7. Hence with the help of study the researcher has concluded that saving options are selected on the basis of convenience to them. They do not involve in searching for saving option and best polices.
4.1.4 HAPPINES LEVEL OF SLUM DWELLERS IN THE SAMPLE AREA: 1 To understand the happiness level of selected respondent family, nine parameter i.e., happiness from
migration, existing security level in the area, quality and quantity of the water, drainage and sanitation system, transportation services, standard of shopping centre and crime level were used.
2 To test above hypothesis, respondents were asked to respond on five point likert scale with following code. (SA (5) – Strongly agree, A (4) –agree (3) – neutral/no opinion, D (2) –disagree, SD (1) – strongly disagree).
3 Parametric‘t’ were applied to test Null Hypothesis with hypothesized value 3. From the above study it is revealed that ‘t’ value for null hypothesis is -29.89 which is less than + 2.326. Also p value is p = 1 which is more than 0.01. Hence the null hypothesis cannot be rejected at 1% level of significance. On the basis of data interpretation it is found Mean scores for happiness is less than or equal to 3.
4 Thus considering all the above facts and finding of the study it concluded that null hypothesis (Ho) is accepted. The third hypothesis of the study, ‘slum occupants are significantly unhappy in the present condition’. So the Hypothesis number three is accepted.
4.1.5 RESEARCH ON SAVING OPTIONS OF SLUM DWELLERS IN THE SAMPLE AREA: 1 To test the fourth hypothesis, ‘Saving options are significantly selected on the basis of convenience
without doing much research on saving options available’ 549 respondent data were taken. In the study area, it has been observed that majority (66%) of the household’s saves their money on the basis of their convenience, which is available to them even at their door step in the city like Mira-Bhayander. They are not concerned with organized and unorganized sector but are more concerned about saving their time and energy, concerned about getting money at their suitable time.
2 Thus considering all the above facts and finding of the study it concluded that the fourth hypothesis of the study, ‘Saving options are significantly selected on the basis of convenience without doing much research on saving options available’ is accepted.
4.1.6 FACTORS AFFECTING QUALITY OF LIFE IN SLUMS: 1 To understand the factors affecting quality of life in slum, Principal component method applied. To
study the same 19 factors were analyzed i.e. existing housing condition, theft and burglary, occupancy rate, environment condition, cleanliness, employment level, migration, Government policy, low income, social conflict, alcoholism, transportation, etc.
2 After analyzing data collected from 549 respondents there are 12 important factors which affects the quality of life in selected slum area, which are the existing housing condition, people in the society are divided by their cast, the level of theft and burglary , occupancy rate, the environment condition, cleanliness in the area, parents want to educate their child, peoples in the society are divided according to their income level, employment from industry, migration for better job, people participate in festivals, rural-urban migration is the cause for slum expansion, existing government policy, more fund allocation by government for slum development, low income gives expansion for slum, social conflict, recreational facilities, alcoholism, transportation level.

Life of Slum Occupants & Saving Pattern
129
4.2 RECOMMENDATION ANS SUGGESTION 4.2.1 SOCIO-ECONOMICAL CONDITIONS AND INCOME DISTRIBUTION OF SLUM
DWELLER OF SELECTED AREA: 1. First and foremost it is necessary to develop rural India and creation of new Mega city with job creation
and skill development, which will control rampant growth of slums.
2. Children are future intellectual capital of the country. They should get proper guidelines and support to develop their physical and intellectual caliber. So that they stand as benchmark for the country. They should provide get proper atmosphere related to socio-economic development. Hence most of the local NGOs and State Government taking care of such children by providing necessary facilities such street schooling, free education to all children under the age of 14. Along with that they are getting other facilities such books, dress, and afternoon meals etc.
3. Better provision of public goods like more number of sanitation facilities, wider roads, and more number of water taps etc. are necessary to reduce the amount of their day to day struggle in order to create better environment. It will naturally increase their leisure, and improve their quality of life and even they will have more time and energy at their disposal which they can use to provide better care to their children and even the entire family’s health.
4. In order to provide more public goods the main constraint in Mira-Bhayander is shortage of space. This problem can be solved through slum redevelopment project which has been already introduced by Government yet not implemented due to local politics. The redevelopment procedure can be made quickly effective if being pursued effectively by ruling party itself.
5. Public distribution system (PDS) should be improved, currently majority of the households who are not eligible for PDS system they are also taking benefit of PDS system which creates additional financial burden on the government. Along with PDS more focus should be given on job creation and skill development this will reduce PDS financial burden in long run.
6. Provision of low cost houses is necessary in order to improve their economic condition. Even this improved standard of living will result into fall in school dropouts.
7. Since most of the times male members of the family are major contributors to family income, bad habits of these people makes the whole family financially more vulnerable. NGOs should put efforts in convincing family members to participate in a drive against liquor consumption. Rehabilitation camps can be organized in the slum area itself with the help of local leaders and local residents. Participation of family members will make such rehabilitation camps more effective.
4.2.2 SAVING BEHAVIOUR AND RESEARCH ON SAVING OPTIONS OF SLUM DWELLERS IN THE SAMPLE AREA:
Effective promotion and marketing of new saving instruments are the main requirements. Marketing can be done by putting more amounts of banners, posters not only in the banks but also in the slum area where these will be seen by all of them on regular basis.
1. Money invested by slum dwellers in the unorganized sector has high risky, many time they lose their money in unorganized sector investment. Slum dwellers are required to aware about the solvency of the organized sector.
2. Many times it has been observed that banking branches as compared to the population are less which results into overcrowding of the banks due to which customers that need guidance and help, are not provided properly. It discourages use of organized sector by less educated slum population. Separate counter can be opened within the bank itself which will satisfy queries of such customers.
3. Considering the limited time these people have, it is necessary to make these new instruments available to them at their door step the way unorganized sector makes it available. By appointing agents on commission basis even the individual bank unit can encourage savings into new instruments, where agents will go to houses, provide them information as well as services like filling forms, collecting amount and depositing it with the banks. These agents will even make these people more aware of the drawbacks of unorganized sector.

Life of Slum Occupants & Saving Pattern
130
4. Chit funds which become more suitable option to the slum population considering their requirement of lump sum amount by these people. If provision is made through which these funds which are run privately can be registered with the local branch in which the deposited amount can be credited to the bank account itself. In such case even working of these funds can be made more authentic and small savings will get mobilized through banking system.
5. Return on investment in organized sector is comparatively is less as compare to unorganized sector therefor even knowing the disadvantage of unorganized sector majority of the peoples are investing in unorganized sector. To overcome this factor organized sector should have to design their product with features that cannot be provided by unorganized sectors like providing insurance facility, etc.
6. Awareness should be created regarding the importance of Health plan; this will reduce their unplanned financial burden and Government should have to bring health plan insurance sector under eligibility of corporate social responsibility scheme so that needy family can get benefit from this scheme.
4.2.3 HAPPINES LEVEL AND FACTORS AFFECTING QUALITY OF SLUM DWELLERS LIFE IN THE SAMPLE AREA:
1 Slum dwellers are not happy with the present condition. It has been observed that majority of the slum dwellers are not satisfied from safety and security level in the slum, every time they live in fear atmosphere. It is essential either by police force or by keeping private guard for the purpose. Especially Nepalese are kept as night guard in the slum area.
2 Shortage of water supply in the slum area creates conflict in the society; local municipal body should have to increase the water supply and have to check quality of water on continuous basis. Along with checking they have to check leakages in water supply line.
3 Drainage and sanitation are not sufficient and even existing available were not maintained in proper condition. To overcome this problem government should have to work in collaboration with private agency.
4 Particularly in slum relatively high consumption of alcohol by head of the family member and by other members also found which crates measure financial burden on slum family. Government should have to take strong measures to control supply of alcohol by increasing duty, ban of alcohol and enhancement of social values from school level.
5 Creation of new megacity with employment opportunity with their skill set to be implemented.
6 Government should have to create more budgets for slum free city plan of action under Rajiv Awas Yojana.
7 100% literacy and skill development plan to be conducted on continuous basis by government and non-government organization.
8 Apart from above Slum upgrading, Slum removal, Slum relocation and affordable housing to be created for poor citizens.
4.3 LIMITATIONS OF THE STUDY The study is subjected to number of personal and technical limitations. Some important limitations of the study are given below. a. The secondary data collected from various sources could not be verified with the original source.
b. The size of the sample is very small than the universe.
c. The subject of research is sensitive and has a great potential for respondents to avoid stating facts. Under such circumstances, researcher has to collect data by mere observation, in which there is a scope for personal bias.
Secondary data regarding small savings accounts with banks could not be acquired through local banks since bank data collection work is done by other companies which provide ‘core banking’ facilities.

Life of Slum Occupants & Saving Pattern
131
4.4 SCOPE FOR FURTHER WORK This is a small slum area which has been covered but it provides some basis on which new policies that can be formulated where socio economic development of the particular area is concerned. In future the same topic can be pursued for all different slum areas of all metropolitan cities because these areas may have different socio economic conditions, different problems than the problems witnessed in the sample slum area. A study encompassing all slum establishments can provide a better insight into problems of urban poor, their saving behavior which will provide a strong basis for formulation of suitable policies for development of country’s human and money capital. A macro level study of all poor establishments is a further scope of the study.
4.5 SUMMARY: By undertaking the topic, ‘Life of Slum Occupants & Saving Pattern’ of 14 Slums out of 35 slums; the researcher has studied different socio-economic aspects of slum life along with study of their living standard, their income and saving pattern in organized and unorganized sector, their happiness level and various factors affecting in their life. The study begins with a brief overview of Indian economy and need for building up of human and money capital. The study further elaborates importance of small household savings for development of money capital of Indian economy. Thus from the macro aspect, the study ventures into micro aspect and elaborates socio economic conditions, income distribution and saving pattern of sample slum households. The study does not cover all these three variables in seclusion but it tries to describe the interrelationship between all these variables and concludes with specific suggestion for improving socio economic conditions of slum dweller of particular study area which is important for development of human capital and money capital.

Life of Slum Occupants & Saving Pattern
132
CHAPTER – V

Life of Slum Occupants & Saving Pattern
133
REFERENCES 1. Adedeji, Y.M.D (2004), “Sustainable Housing for Low-Income Industrial Workers in Ikeja – Ilupeju
Estate: Materials Initiative Options”, Paper presented at the School of Environmental Technology, Federal University of Technology, Akure.
2. Ahmad Zubaidi Baharumshah, Marwan A. Thanoon, and Salim Rashid (2003), “Saving Dynamics in the Asian Countries”, Journal of Asian Economics, Vol. No.13, Issue No. 6, pp 827-845.
3. Ahmad, M. and Asghar, T. (2004), “Estimation of Saving Behavior in Pakistan Using Micro data”, The Lahore Journal of Economics, 9(2).
4. Akter T (2008), “Migration and living conditions in urban slums: implication for food security” www.unnayan.org
5. Aldrich, B., and Sandhu, R. (1995), Housing the Urban Poor: Policy and Practice in Developing Countries, London: Zed Books Ltd.
6. Ali AM and Toran K (2003), “Migration, Slums and Urban Squalor- case study of Ghandhinagar Slum” Third International conference on Environment and Health, pp 1-10.
7. Ankur Sarin and Rekha Jain (2009), “Effect of Mobiles on Socio-economic Life of Urban Poor”, IIMA-India, W.P. No. 2009-02-05, pp1-47
8. Aribigbola, A. (2001), “Housing and Nigerian Development: Assessment of Policy Measure and Direction”, African Journal of Environmental Studies, 2(2), pp117-122.
9. Arimah, Ben C. (2010). "The face of urban poverty: Explaining the prevalence of slums in developing countries, working paper". World Institute for Development Economics Research 30
10. ASSOCHAM, 87th Annual Session Paper on “Globalization, Growth and People”, pp5, econ.worldbank.org
11. Bala & Kumar (2013), “Society, Culture and Economy of Indian Slums: A Critical Perspective”, Vignettes of research, Vol I, Issue II, Pp 66-74
12. Bello, A.A. (2002). An Appraisal of Socio-Economic Effects of Slum Environment on Urban Dwellers: A case study of Osogbo in Osun State. Unpublished B. Sc. Thesis, Obafemi Awolowo University, Ile-Ife, Nigeria
13. Bendig, M., Giesbert, L., and Steiner, S. (2009), “Savings, Credit, and Insurance: Household Demand for formal financial services in Rural Ghana”, BWPI Working Paper no 76.
14. Bhandari, L. and K. Basu, 2000, In Action Plan for Slum Auction and Relocation for the State of Delhi, www.thinktankinitiative.org/think-tanks
15. Biplab Das, Utpal Khara, Pradip Giri and Aditya Bandyopadhya (2012),“The Challenge of Slum Development in India a case study of Melatala-Dasnagar Slum area of Howrah Municipal Corporation”,IJASSER, Vol. 2, Issue 1, pp22-27.
16. Carmen Reinhart and Ernesto Talvion (1998), “Capital flows and saving in Latin”, Journal of Development Economics, Vol 57, No. 1 October 1998, Pp 45-66.
17. Caste Discrimination in India, centre for human rights and global justice www.chrgj.org
18. Census of India 2011
19. Chandrasekhar S (2005), “Growth of Slums, Availability of Infrastructure and Demographic Outcomes in Slums: Evidence from India” International Population Conference, (http://iussp2005.princeton.edu/papers/52133)
20. Chhaya Singh, (2011) Center for Global Development Research (CGDR), October 2011, http://planningcommission.nic.in/reports/sereport/ser/ser_slum.pdf
21. Controller of rationing & Director of civil supplies, Government of Maharashtra.

Life of Slum Occupants & Saving Pattern
134
22. D.Muraleedharan, “Saving Mobilization in Household Sector”, (authorspress) 2003 pg.no.vi
23. D.Muraleedharan, “Saving Mobilization in Household Sector”, (authorspress) 2003 pg.no.xxxiii
24. Das Biswaroop (1997), “Slum Deweller in Indian cities: The case of Surat in Western India”, QEH working papers, University of Oxford, econpapers.repec.org.
25. Denis Gruber, Andre Kirschner, Sandra Mill, working paper on, “Living and Working in Slums in Mumbai” www.uni-magdeburg.de
26. Dhirendra Swarup and Anil Bhattachaya, “Small Savings Mobilization and Asian Economic Development – The Role of Postal Financial Services”, M.E.Sharpe publication, 2004, pg.no.147-163
27. Dornbusch, R., Fischer, S., Startz, R. (2000), Macroeconomics, Eighth International Edition, McGraw-Hill/Irwin.
28. Dua Ajay, India “Parameters for Growth”, www.dipp.gov.in
29. Economic Survey of Maharashtra (2005-06), Directorate of Economics and Statistics, Planning Department, Government of Maharashtra, maccia.org.In
30. Emmanuel Anoruo and Yusuf Ahmad (2001), “Causal Relationship between Domestic Savings and Economic Growth: Evidence from Seven African Countries”, African Development Review, Vol No. 12, Issue No. 2, pp238-249.
31. Gangadharan K (2005), “Utilization of Health Services In Urban Kerla: A Socio Economic Study” Serials Publication (1st Jan, 2005) Books.
32. Geetha & Swaminathan, “Nutritional Status of Slum Children of Mumbai: A Socio-Economic Survey”, Economic & Political Weekly, Vol 31, No. 14, 6th April 1996, pp 896-900
33. Geetha S and SwaminathanMadhura (1996), “Nutritional Status of Slum Children of Mumbai: A Socio-Economic Survey” Economic & Political Weekly, Vol 31, No. 14 (April 6, 1996), Pp 896-900.
34. George Mavrotas and Roger Kelly (2001), “Old Wine in New Bottles: Testing Causality between Savings and Growth”, The Manchester School, Vol No. 69, Issue S1, Pp 97-105.
35. Gerard Jackson(2008), “without Savings there can be no Economic Growth”, Brookes New, 20th Jan 2008, www.safehevaen.com
36. Ghosh (2013), “Regional disparities of Slums, 2013- An Overview with special Emphasis to Kolkata”, International Journal of Humanities and Social Science Invenstion, Volume 2, Issue No.3, March 2013, Pp48-54
37. Goldman Sachs White Paper (2010), “India Revisited” (www.goldmansachs.com)
38. Goswami & Manna (2013), “Urban Poor Living in Slums: A Case Study of Raipur City in india”, Global Journal of Human Social Science Sociology & Culture, Volume 13 Issue No. 4, Version 1.0, 2013, Pp 15-22
39. Goswami Mihir and Kedia Geeta (2010),”Socio-Demographic and Morbidity profile of slum area in Ahmedabad, India”,NJCM,. Vol.1, Issue 2, pp 106-110.
40. Government of Maharashtra (2011), MBMC Sanitation Plan submitted to Ministry of Urban Development Government of India by Water Supply and Sanitation Department, April 2011.
41. Grace BahalenMundu and R.B.Bhagat(2008) on “Slum Conditions in Mumbai with Reference to the Access of Civic Amenities” IIPS Mumbai, ENVIS Centre on March 2008. www.udri.org
42. Gulnur Muradoglu and Fatma Taskin (1996), “DIFFERENCES IN HOUSEHOLD SAVINGS BEHAVIOR: EVIDENCE FROM INDUSTRIAL AND DEVELOPING COUNTRIES”, The Developing Economies, Vol No. 34 Issue No. 2, Pp 138-153.

Life of Slum Occupants & Saving Pattern
135
43. HatekarNeeraj and Rode Sanjay (2003), Quietly They Die: A Study of Malnourishment Related Deaths in Mumbai City”, Department of Economics University of Mumbai, Working paper 1/2003, February 2003, Pp 1-43.
44. http://controllerofrationing.net/rationcard.html
45. http://en.wikipedia.org/
46. http://en.wikipedia.org/wiki/Mira-Bhayandar
47. http://en.wikipedia.org/wiki/Slum
48. http://planningcommission.nic.in/data/datatable/
49. http://www.huffingtonpost.com/2013/03/22/india-slums_n_2931634.html
50. http://www.investopedia.com/terms/g/gdp.asp
51. Imparato, Ivo and Jeff Ruster, 2003, Slum Upgrading and Participation: Lesson from Latin America, The World Bank, Washington, D.C., www.worldbank.org
52. J. Godwin Premsing and Sheena Philip (2014), “Improving living conditions in Slums Dwellers” IOSR Journal of Humanities And Social Science (IOSR-JHSS), Volume No. 19, Issue 6 (June 2014), Pp 62-65.
53. Jackson Gerard, “Without Savings there can be no Economic Growth”, by Gerard Jackson, BrookesNews.com Mon 21 Jan 2008.
54. Joshua B, (2014), 10 of the biggest slums in the world, (www.therichest.com)
55. Kamla Gupta, Fred Arnold, H. Lhungdim (2009), on “Health and Living Conditions in Eight Indian Cities”, Ministry of Health and Family Welfare Government of India, NFHS-3, pp1-119
56. Karn S.K, Shigeo Shikura and Harada Hideki (2003),” Living Environment and Health of Urban Poor”, Economic & Political Weekly, Vol no. XXXVIII No. 34 (August 23, 2003) pp 3575- 3586
57. Kayode Felix Omle (2010), “An Assessment of Housing Condition and Socio-Economic Life Styles of Slum Dwellers in Akure, Nigeria” Contemporary Management Research (December 2010), Vol 6, No.4, Pp 273-290
58. Khan MH, Khalique N, Siddiqui AR, AmirA (2013),”Newborn care practices among slum dwellers in Aligarh city, Uttar Pradesh”, IJCH, Vol 25. No.1, pp 28-33
59. Kibet, L. K., Mutai, B. K., Ouma, D. E., Ouma, S. A., and Owuor, G. (2009), “Determinants of household saving: Cast study of Small holder farmers, entrepreneurs and teachers in rural areas of Kenya”, Journal of Development and Agricultural Economics, 1(7).
60. Kundu, A., 2007, "Stigmatization of Urban Processes in India: An Analysis of Terminology with Special Reference to Slum Situations." MOST City Words Project Inde du Nord / Northern India, Working Paper N° 4, December 1999. Available at www.unesco.org/shs/most.html, accessed on 24th August 2007.
61. Lall Samik, Suri Ajay, Deichmann,”Household Savings and Residential Mobility in Informal Settlements”, World Bank Policy Research Papers (May 2005); econ.worldbank.org
62. M. S. Alamgir, M. A. Jabbar and M. S. Islam (2009), “Assessing the livelihood of slum ewellers in Dhaka city”, J. Bangladesh Agril. Univ., Vol No. 7(2) Page 373-380
63. Maharashtra planning department, (2011-12) Economic Survey of Maharashtra Page 6.
64. Masoumeh Bagheri (2012), “The Challenge of Slums: Socio-Economic Disparities” International Journal of Social Science and Humanity, Vol No, 2 No.5, September 2012, Pp 410-414.
65. Ministry of Finance (2011), “Report of the Committee on Comprehensive Review of National Small Saving Fund”, Government of India, Ministry of Finance, June 2011.

Life of Slum Occupants & Saving Pattern
136
66. Ministry of Housing and Urban Poverty Alleviation, (http://mhupa.gov.in)
67. Mira Bhayander Municipal Corporation
68. Mitra Arup (1994), Urbanization, slums, Informal sector employment and poverty, B.R. Publishng Corporation:New Delhi.
69. Mohan Ramesh (2006), “Causal Relationship Between Savings and Economic Growth in Countries with Different Income Levels”, EconomicsBulletin, vol5(3)pgs1-12,ideas.repec.org.
70. MoonaYasmin (2012),”Occupational Mobility among Slum Dwellers: A case study of Delhi” Developing Country Studies, Vol 2, No. 11, pp 91-97
71. Mr. Sandip Tripathy (2013), “ Assessment of Socioeconomic Status of Marginalized Semi-Urban Slum-Dwellers on the Basis of Attainment of Education: A case study in Patharghata Slum, Ballavpur Mouza, Midnapur District, West Bengal” International Business Management & Social Sciences Research, Volume 2, No.6, June 2013, Pp 57-61
72. Ms. Hina (2013), “ Poorest of the Poor: A Comparative Study of Two Slums of Central and North East Delhi, India”, Global Advanced Research Journal of Geography and Regional Planning, Vol No. 2(5), Page no, 87-96
73. Muhammad Zafar Iqbal, Nisar Ahmad, and Zakir Hussain,(2012) on “Impact of Savings and Credit on Economic Growth in Pakistan”, Pakistan Journal Social Sciences, Vol No. 32 No. 1, 2012 pp 39-48.
74. Muraleedharan (2003), “Savings Mobilization in Household Sector”, Authors Press,Delhi 2003, 165-197
75. National Sample survey office, (2013) “Key Indicators of Urban Slums in India”, NSS 69th Round, pp 6
76. Nayak (2013). “The Plight of Slum Dwellers at Gondar City in Ethiopia”, International Journal of Management and Social Science Research, Volume 2, No.10, October 2013, Pp 56-63.
77. Nihar Ranjan Rout (2008), “SLUM GROWTH IN BHUBANESWAR: A PROBLEM OR SOLUTION?” ITPI Journal Vol No. 5(4), Pp 59-64
78. Nishikawa Yukio (2007), “India: Higher Savings Rate Holds Key to Sustained Growth”, JCER; www.jcer.or.jp
79. Norman Loayza, Klaus Schmidt-Hebbel and Luis Serven (2000), “What Drives Private Saving around the World?” World Bank Policy Research Working Paper No. 2309, pp1-32
80. Nurudeen ABU (2010), “SAVING-ECONOMIC GROWTH NEXUS IN NIGERIA, 1970-2007: GRANGER CAUSALITY AND CO-INTEGRATION ANALYSES”, Review of Economic & Business Studies, June, 2010, Pp 93-104.
81. Office of the Registrar General & Census Commissioner, India (2013), Primary Census Abstract for Slum 2011, report dated 30.09.2013
82. Office of the Registrar General & Census Commissioner, India, Primary Census Abstract for Slum 2011, http://www.censusindia.gov.in
83. Ogunleye (2013), “Analysis of the Socio-economic characteristics and housing condition in the core neighbouhood of Akure, Nigeria”, Journal of Geography and Regional Planning, Vol 6(6), August 2013, Pp 229-236
84. Olanrewaju and Akinbamijo (2002), “Town planning: a veritable means for poverty reduction” book
85. Operational Research Group, 1989, "Accessibility to Basic Services in Slums of Five Urban Centre’s." Baroda.
86. Ozcan, K. M., Gunay, A., and Ertac, S. (2003), “Determinants of Private Savings Behavior in Turkey”, Applied Economics, 35(12)

Life of Slum Occupants & Saving Pattern
137
87. P.Sujata and P.V.S. Janardhanam (2010),”Urban health in India: Chennai city as a case study”, Indian Journal of Science and Technology, Vol3 No.12, (Dec 2010), pp 1236-1246
88. Pain Asis Kumar and Karmarkar Nirbachita, “Household Savings – Perspectives and country Experiences”, The Icfai University Press, 2007, pgs 225 – 239.
89. Pandit, B.L. (1991), “The Growth and Structure of saving in India”, Oxford University Press, Delhi.
90. Partha Sarathi Das and Kishor Chandra Meher (2013), “A Critical Analysis of Economic Activities of Slum Dwellers: A Study of Khurda District, Odisha”, International Journal of Management, Vol:1/issue:2,April 2013 (www.theijm.com)
91. Patel, Bimal, Rajendra Joshi, Shirley Ballaney and Matt Nohn. 2011. “Slum Planning Schemes.” Environment and Urbanization Asia, (March 2011) Vol(2) No.1. London: Sag, Page 45-75.
92. PM Shri Narendra Modi, (2014), http://pmindia.gov.in
93. Rafiq Maqbool (2013), India census says 1 in 6 lives in unsanitary slums, (http://www.cbc.ca/news)
94. Rajiva Prasad & M.N. Singh (2013), “Living condition and life style of Mankhurd slum dwellers”, International Institute for Population Sciences.
95. Rajkesh Shukla (2007), “How India Earns, Spends and Saves” Max Newyork Life Insurance and NCAER, 2007, www.ncaer.org
96. Ramesh Jangili (2011),“Causal Relationship between Saving, Investment and Economic Growth for India – What does the Relation Imply?”, Reserve Bank of India Occasional Papers, Vol. 32, No.1, Summer 2011.
97. Registrar General and Census Commissioner, India (2001), Census of India, Maharashtra population data with Slum population in urban, Mumbai.
98. Rehana Siddique and Rizwana Siddiqui (1993), “Household Saving Behavior in Pakistan”, The Pakistan Development Review, Vol No. 32(4) pp 1281-1292.
99. Retnaraj, D., 2001, "Fast Growing Cities, Spurt in Land Prices and Urban Slums: The Kerala Experience." IASSI Quarterly 20(2) pp123-133.
100. Rian Le Roux (2010), “The role of savings in the economy”, Old Mutual Investment Group SA, 15th July 2010, (www.oldmutual.co.za)
101. Robert M. Solow (1994), “Perspectives on Growth Theory”, Journal of Economic Perspective, Vol 8, No. 1, Winter 1994, Pp 44-54.
102. S D Kotnis, R M Gokhale & M V Rayate (2012), “Why Still home deliveries in urban Slum Dwellers ?”, National Journal of Community Medicine, Vol 3, Issue 1, Jan-March 2012 pp 85-88.
103. Salam, M. A., and Kulsum, U. (2000), “Savings behavior in India: An empirical study”, Indian Economic Journal, 50(1).
104. Saltz, I.S. (1999), “An examination of the causal relationship between saving and growth in the third world”, Journal of Economics and Finance, Vol.23, No.1, pp.90-98.
105. Samachaar.in , “know India now”, Tuesday January 13, 2009, www.samachaar.in/mumbai
106. Sanchaya, nsiindia.gov.in
107. Scher Mark J. and Yoshino Naoyuki, “Small Savings Mobilization and Asian Economic Development – The Role of Postal Financial Services”, M.E.Sharpe publication, 2004, pg.no.147
108. Sheena and Premsing (2014),“A Study on The Socio-Economic Condition of Slum Dwellers with Special Reference to Calicut Corporation”, International Journal of Scientific Research, Vol 3, Issue 3, March 2014, Pp 392-394
109. Siliconindia (2012), 10 Major Slums of India, http://www.siliconindia.com/news

Life of Slum Occupants & Saving Pattern
138
110. South Asian Analysis Group, 2006, "Poverty and Slums in India: Impact of Changing Economic Landscape." pp 5-10.
111. Sudesh Nangia and Rupesh Kumar Gupta, (2005), “Population Explosion and Land use Changes in Gurgaon city region-A Satellite of Delhi metropolis” http://iussp2005.princeton.edu/papers/50502
112. Sufaira.C (2013), “Socio Economic Conditions of Urban Slum Dwellers in Kannur Municipality” IOSR Journal of Humanities And Social Science (IOSR-JHSS), Volume No. 10, Issue 5 (May-Jun.2013), Pp 12-24.
113. Sundari, S. “Quality Of Life of Migrant Households in Urban Slums” Proceedings of the Third International Conference on Environment and Health, Chennai, India, 15-17 December, 2003. Pp 537-552.
114. Sunil Kumar Karn, Shigeo Shikura, Hideki Harada (2003), “Living Environment and Health of Urban Poor: A Study in Mumbai”, Economic and Political Weekly, August 23, 2003, pp 3575-3586.
115. Swaminathan Madhura, “Aspects of Urban Poverty in Bombay”, Environment and Urbanization, volume: 7, Number 1,pg.133-143 www.archidev.org.
116. UB-HABITAT (2012), Evaluation of the UN-Habitat Urban Programme in Iraq 2004-2012, http://unhabitat.org
117. UN-Habitat (2007),”What are slums and why do they exist?”, Kenya.
118. UN-HABITAT study conducted in 2003 (www.unhabitat.org/)
119. United Nations Human Settlements Programme (UN-HABITAT), 2006/07, State of World Cities 2006/07, http://unhabitat.org
120. Upender,M., Reddy, N.L. (2007),”Saving Behavior in the Indian Economy” International Journal of Applied Economics and Quantitative studies” Vol 4 No,1 (2007) Pp 35-56
121. Upinder Sawhney (2013), “Slum population in India: Extent and policy response”, IJRBS, Vol. 2. No.1, pp 47-56.
122. V.Arockia Jerold (2008), “Financial Inclusion and Literacy in India – A critical Study”, Indian Journal of Finance, Article 5, pp 25
123. Vaishali D. Mane and D.H. Pawar on “SOCIO-ECONOMIC STATUS OF SLUM DWELLERS WITH SPECIAL REFERENCE TO WOMEN: GEOGRAPHICAL INVESTIGATION OF KOLHAPUR SLUM” Research front, Vol 1 No.1 March 2013, pp 69-72.
124. Vedeld Trond and Siddham Abhay,”Livelihoods and collective Actions among Slum Deweller in a Mega city”, IASCP conference 2002, dic.dlib.indiana.edu
125. Verma R. and Wilson E.J (2005), “A Multivariate Analysis of Savings, Investment and Growth in India”, University of Wollongong; ideas.repec.org
126. Wakabayashi M and Mackellar FL (1999), “Demographic Trends and Household Saving in China”, International Institute for Applied Systems Analysis, Vol No.99-057, pp 1-16
127. World bank world development indicator report, (2013), http://databank.worldbank.org
128. www.rbi.org.in

Life of Slum Occupants & Saving Pattern
139
CHAPTER – VI

Life of Slum Occupants & Saving Pattern
140
LIST OF TABLES
S.NO. TITLE PAGE NO. 1.5.1 (a) Climate Condition 10 1.5.4 (b) Distribution of Population 10 1.5.5 (c) Land use Patron 10 1.5.7 (d) Literacy Level 11
1.11.3.1 (a) List of Slums under Mira-Bhayander Municipal Corporation 17 1.11.3.2 (a) List of Selected Sample Slum 18
2.3 (a) India’s National Income and Domestic Savings Post Liberalization 39 2.4.1 (a) Sector- wise Domestic saving 46 2.4.2 (a) Growth in Small Savings Deposits vis-à-vis Bank deposits 47
2.4.2.1 (a) Growth in Small Savings Deposit vis-à-vis Bank Deposits (Rs in Crore)
51
3.1 (a) Religions in Mira-Bhayander 55 3.1 (b) Mira-Bhayander Municipal Corporation, as per 2001 Census 55 3.2 (a) List of Selected Sample 57
3.3.1 (a) Ownership of Gadgets by 549 Families 61 3.3.1 (b) Ownership of Vehicle by 549 Families 62 3.3.1 (c) Community of 549 Families 63 3.3.1 (d) Religion of 549 Families 63 3.3.1 (e) Number of joint and nuclear families 64 3.3.1 (f) Gender Ratio 65 3.3.1 (g) Number of Owned houses and Rented Houses 65 3.3.1 (h) House Structure 66 3.3.1 (i) History of Staying at one place 67 3.3.1 (j) Number of Rooms in House 68 3.3.1 (k) House Area 69 3.3.1 (l) Source of water 69
3.3.1 (m) Availability of Water 70 3.3.1 (n) Sanitation Facility 70 3.3.1 (o) Electricity Supply 71 3.3.1 (p) Literacy Ratio 72 3.3.1 (q) Level of education secured 72 3.3.1 (r) Employment Ratio 73 3.3.1 (s) Alcohol Consumption Patern 73 3.3.2 (a) Age-Composition 75 3.3.2 (b) Status of Ration Card 75 3.3.2 (c) Status of Aadhar Card 76 3.3.2 (d) Credit Card 77 3.3.2 (e) Monthly income earned by 549 families (Rs/-) 77

Life of Slum Occupants & Saving Pattern
141
3.3.2 (f) Parametric independent ‘t’ test Applied for Data Related to contribution of the head of the slum households and other members of family
79
3.3.3 (a) Parametric paired ‘t’ test Applied for Data Related to organized sectors household savings and unorganized sectors household savings
82
3.3.3 (b) Policy awareness of 549 respondent family 83 3.3.3 (c) Life Insurance plan awareness of 549 respondent family 86 3.3.3 (d) Retirement plan awareness of 549 respondent families 87 3.3.3 (e) Guaranteed Income Plan awareness of 549 respondent families 87 3.3.3 (f) Child Plan awareness of 549 respondent families 88 3.3.3 (g) Tax Saving Plan awareness of 549 respondent families 88 3.3.3 (h) Term Plan awareness of 549 respondent families 89 3.3.3 (i) Awareness of health plan of 549 respondent families 89 3.3.3 (j) Cashless Hospitalization Health Plan awareness of 549 respondent
families 90
3.3.3 (k) Major Critical Illness Health Plan awareness of 549 respondent families
90
3.3.3 (l) Senior Citizen Health Plan awareness of 549 respondent families 91 3.3.3 (m) Sources of Loan last 3 years 92 3.3.3 (n) Reason of Loan 92 3.3.3 (o) Cost of Borrowing 93 3.3.3 (p) Loan Repayment Status 93 3.3.3 (q) Saving Bank a/c with 94 3.3.3 (r) Bank a/c Status 94 3.3.4 (a) Normally people are happy with migration 95 3.3.4 (b) The existing Security Level in the area is good 95 3.3.4 (c) The existing quality level of water in the area is excellent. 96 3.3.4 (d) The existing drainage & Sanitation systems in the area are good. 96 3.3.4 (e) The existing transportation facility in the area is good 97 3.3.4 (f) The existing Road Infrastructure in the area is good 98 3.3.4 (g) The existing Standard of Shopping Centre in the area is excellent. 98 3.3.4 (h) The crime level in the area is very low 99 3.3.4 (i) The existing quantity of water supply is excellent. 100 3.3.4 (j) One sample ‘t’ test of mean v/s hypothesized score 3 for 101 3.4.2 (a) The existing housing condition is satisfactory to live. 106 3.4.2 (b) Peoples in the society are divided by their cast 107 3.4.2 (c) The level of theft and burglary in area is very low. 107 3.4.2 (d) The existing occupancy rate is very high. 108 3.4.2 (e) The environment condition is excellent to live. 109 3.4.2 (f) The cleanliness in the area is excellent. 109 3.4.2 (g) All parents want to educate their children. 110 3.4.2 (h) Peoples in the society are divided according to their income level. 111

Life of Slum Occupants & Saving Pattern
142
3.4.2 (i) The industrial level is satisfactory to provide employment to all the workers as per their skill.
112
3.4.2 (j) Migration from rural to urban is in search of better jobs. 112 3.4.2 (k) The Peoples in their society like to participate in festivals. 113 3.4.2 (l) Rural-urban migration is the major factor for rise in slum. 114
3.4.2 (m) The existing government policy is not satisfactory to eradicate the slums.
114
3.4.2 (n) Government needs to create more funds for improvement of housing conditions in slums.
115
3.4.2 (o) Lower income people are forced to live in slum, this gives rise to slum.
116
3.4.2 (p) Social conflict like civic war is responsible for rise in slums. 116 3.4.2 (q) The existing recreational facilities are satisfactory. 117 3.4.2 (r) The measure part of income is utilized for alcohol consumption. 117 3.4.2 (s) The existing level of transportation facility is satisfactory. 118 3.4.2 (t) KMO and Bartlett's Test 119 3.4.2 (u) Values of Communalities 119 3.4.2 (v) Total Variance Explained 120
3.4.2.2 (a) Rotated Component Matrixa 121 3.4.2.2 (b) Factor groups along with their components 121

Life of Slum Occupants & Saving Pattern
143
LIST OF DIAGRAMS
S.NO. TITLE PAGE NO. 1.6.2.9 (1) Slum Rehabilitation Society 14
1.11.3.2 (1) Slum under Mira-Bhayander Municipal Corporation 18 2.2 (1) Growth of Urban Population in India 36 2.2 (2) Proportion of Slum households and Poor households in Selected
cities, India 2005-06 37
2.3 (1) Solow Growth Model 38 2.3 (2) Solow Growth Model and Changes in the saving rate 39 2.3 (3) Savings, Investment, Foreign Capital Inflows and Real GDP 40
2.4.1 (1) Saving, Investment rates and nominal growth 44 2.4.1 (2) Composition of Investment 45 2.4.1 (3) Composition of Saving 45 2.4.2 (1) Trends in small saving collections over last twenty years 48 2.4.2 (2) Composition of Small Saving Collection 49 3.1 (1) Slums under Mira-Bhayander Municipal Corporation 56
3.3.1 (1) Ownership of Gadgets by 549 Families 61 3.3.1 (2) Purchasing Pattern of Gadgets by 549 Families 62 3.3.1 (3) Ownership of Vehicle by 549 Families 62 3.3.1 (4) Community of 549 Families 63 3.3.1 (5) Religion of 549 Families 64 3.3.1 (6) Number of Joint and Nuclear Families 64 3.3.1 (7) Gender Ratio 65 3.3.1 (8) Number of owned houses and rented houses 66 3.3.1 (9) House Structure 67 3.3.1 (10) History of staying at one place 68 3.3.1 (11) Number of rooms in house 68 3.3.1 (12) House area 69 3.3.1 (13) Source of water 69 3.3.1 (14) Common water supply and Indoor water supply 70 3.3.1 (15) Sanitation facility 71 3.3.1 (16) Electricity supply in slum houses 71 3.3.1 (17) Literacy Ratio 72 3.3.1 (18) Level of education secured 72 3.3.1 (19) Number of temporary and permanent jobs 73 3.3.1 (20) Alcohol Consumption Pattern 74 3.3.2 (1) Age-Composition 75 3.3.2 (2) Status of Ration Card 76 3.3.2 (3) Aadhar Card Status 76 3.3.2 (4) Status of Credit Card 77 3.3.2 (5) Income-wise distribution of 549 respondent family (Rs.) 78

Life of Slum Occupants & Saving Pattern
144
3.3.3 (1) Organized & Unorganized Savings 81 3.3.3 (2) Policy awareness of 549 respondent family 83 3.3.3 (3) Account for senior citizen 84 3.3.3 (4) Mahasaraswati Yojna 84 3.3.3 (5) Zero deposit account 85 3.3.3 (6) Yuva-Yojna 85 3.3.3 (7) Life Insurance plan awareness of 549 respondent family 86 3.3.3 (8) Retirement plan 87 3.3.3 (9) Guaranteed income plan 87 3.3.3 (10) Child plan 88 3.3.3 (11) Tax saving plan 88 3.3.3 (12) Term plan 89 3.3.3 (13) Awareness of health plan of 549 respondent family 89 3.3.3 (14) Cashless hospitalization health plan 90 3.3.3 (15) Major critical illness health plan 91 3.3.3 (16) Senior citizen health plan 91 3.3.3 (17) Sources of Loan last 3 years 92 3.3.3 (18) Reason of Loan 92 3.3.3 (19) Cost of Borrowing 93 3.3.3 (20) Loan Repayment Status 93 3.3.3 (21) Saving Bank a/c with 94 3.3.3 (22) Bank a/c Status 94 3.3.4 (1) Happiness from Migration 95 3.3.4 (2) The existing Security Level in the area is good 95 3.3.4 (3) The existing quality level of water in the area is excellent. 96 3.3.4 (4) The existing drainage & Sanitation systems in the area are good. 97 3.3.4 (5) The existing transportation facility in the area is good 97 3.3.4 (6) The existing Road Infrastructure in the area is good 98 3.3.4 (7) The existing Standard of Shopping Centre in the area is excellent. 99 3.3.4 (8) The crime level in the area is very low 99 3.3.4 (9) The existing quantity of water supply is excellent. 100 3.3.5 (1) Saving behavior of 549 respondent family 101 3.4.2 (1) The existing housing condition is satisfactory to live. 106 3.4.2 (2) Peoples in the society are divided by their cast 107 3.4.2 (3) The level of theft and burglary in area is very low. 108 3.4.2 (4) The existing occupancy rate is very high. 108 3.4.2 (5) The environment condition is excellent to live. 109 3.4.2 (6) The cleanliness in the area is excellent. 110 3.4.2 (7) All parents want to educate their children. 111 3.4.2 (8) Peoples in the society are divided according to their income level. 111

Life of Slum Occupants & Saving Pattern
145
3.4.2 (9) The industrial level is satisfactory to provide employment to all the workers as per their skill.
112
3.4.2 (10) Migration from rural to urban is in search of better jobs. 113 3.4.2 (11) The Peoples in their society like to participate in festivals. 113 3.4.2 (12) Rural-urban migration is the major factor for rise in slum. 114 3.4.2 (13) The existing government policy is not satisfactory to eradicate the
slums. 115
3.4.2 (14) Government needs to create more funds for improvement of housing conditions in slums.
115
3.4.2 (15) Lower income people are forced to live in slum, this gives rise to slum.
116
3.4.2 (16) Social conflict like civic war is responsible for rise in slums. 117 3.4.2 (17) The existing recreational facilities are satisfactory. 117 3.4.2 (18) The measure part of income is utilized for alcohol consumption. 118 3.4.2 (19) The existing level of transportation facility is satisfactory. 118 3.4.2 (20) Scree Plot 120

Life of Slum Occupants & Saving Pattern
146
APPENDIX
ABBREVIATIONS: 1. MBMC : : Mira Bhayandar Municipal Corporation
2. BPL : Below Poverty Line
3. CSO : Central Statistical Organization
4. GDP : Gross Domestic Product
5. HDFC : Housing Development Finance Corporation
6. HSC : Higher Secondary Certificate
7. LIC : Life Insurance Corporation
8. MPKBY : Mahila Pradhan Kshetriya Bachat Yojana
9. NGO : Non Governmental Organization
10. NSO : National Saving Organization
11. PCI : Per Capita Income
12. PPF : Public Provident Fund
13. RBI : Reserve Bank of India
14. SAS : Standardized Agency System
15. UN : United Nations
16. CSP : City Sanitation plan
17. EWS : Economically Weaker Section
18. LIG : Low Income Group
19. RAY : Rajiv Awas Yojana
20. SJSRY : Swarna Jayanti Shahari Rojgar Yojana
21. PDS : Public Distribution System
22. SSI : Small Scale Industries
