level set-based core segmentation of mammographic masses facilitating three stage (core, periphery,...
TRANSCRIPT

Abstract—We present mammographic mass core
segmentation, based on the Chan-Vese level set method. The
proposed method is analyzed via resulting feature efficacies.
Additionally, the core segmentation method is used to
investigate the idea of a three stage segmentation approach, i.e.
segment the mass core, periphery, and spiculations (if any exist)
and use features from these three segmentations to classify the
mass as either benign or malignant. The proposed core
segmentation method and a proposed end-to-end computer
aided detection (CAD) system using a three stage segmentation
are implemented and experimentally tested with a set of 60
mammographic images from the Digital Database of Screening
Mammography. Receiver operating characteristic (ROC) curve
AZ values for morphological and texture features extracted
from the core segmentation are shown to be on par, or better,
than those extracted from a periphery segmentation. The
efficacy of the core segmentation features when combined with
the periphery and spiculation segmentation features are shown
to be feature set dependent. The proposed end-to-end system
uses stepwise linear discriminant analysis for feature selection
and a maximum likelihood classifier. Using all three stages (core
+ periphery + spiculations) results in an overall accuracy (OA)
of 90% with 2 false negatives (FN). Since many CAD systems
only perform a periphery analysis, adding core features could
be a benefit to potentially increase OA and reduce FN cases.
Keywords—Breast Cancer, Cancer, Chan-Vese, Computer
Aided Detection, CAD, Digital Mammography, Image
Segmentation, Level Sets, Spiculations, Stellate Lesions
I. INTRODUCTION
ammograms are currently considered to be the best
method of detecting breast cancer [1]. Jemal et al.
show breast cancer is the number two cancer killer of
women, second only to lung cancer (40,970 deaths expected
in 2006) [2]. In this letter, we propose mass core
segmentation via level sets, enabling a three-stage
mammographic image segmentation method for computer
aided detection (CAD) systems to aid in breast cancer
detection. The three segmentations include mass core (the
brightest central parts of the tumor, which have low
variance), mass periphery (the main tumor area), and mass
spiculations (small, linear projections extending from some
tumor peripheries). The motivation for the core segmentation
Manuscript received March 2, 2007.
J.E. Ball is with the Navy Surface Warfare Center, Dahlgren, VA 22485,
USA (e-mail: [email protected]).
L.M. Bruce is with the Electrical and Computer Engineering
Department and the GeoResources Institute, Mississippi State University,
Starkville, MS 39759, USA (e-mail: [email protected]).
is that features derived from the core and from the region
between the core and periphery segmentation borders may
provide important information which could improve
classification results, especially when these features are
combined with the periphery or spiculation features. This
work is an extension of [3] by the authors. To the best of our
knowledge, published mammography CAD systems do not
use a three stage approach as proposed in this letter, i.e. a
core, periphery, and spicules (some CAD systems may
segment the periphery and spicules, and also look for
microcalcifications). Most segment the periphery only, some
segment spicules only, and a very small number segment the
periphery and spicules.
II. BACKGROUND AND PREVIOUS METHODS
In a conventional end-to-end mammographic CAD
system, the digital mammogram is preprocessed to remove
noise and enhance the image. Then an image segmentation
algorithm segments the mass, or in some systems, the mass
and spicules. Next, features are extracted and optimized.
Finally, the optimized features are input to a classifier, which
labels the suspicious mass as benign or malignant.
Some common mammographic image enhancement
methods include adaptive neighborhood contrast
enhancement, gamma correction, fuzzy transformations,
convolving the original image with an isotropic 2D Gaussian
kernel, and wavelet and multi-scale enhancement. These
methods are described in detail in [4]1. In this study, for the
periphery segmentation, image enhancement consists of
contrast limited adaptive histogram equalization (CLAHE),
as well as custom non-linear methods described in [4].
There are many approaches to mammographic mass
segmentation. These include morphological approaches,
texture analysis, gray level statistical thresholding and
statistical models, level sets, bilateral subtraction of breast
image pairs, functional minimization and region growing,
multi-resolution analysis and fuzzy region growing,
modified median filtering and template matching, adaptive
filtering, the radial gradient index and probabilistic methods,
vicinal support vector based segmentation, and steerable
filters. These methods are described in detail in [4].
In this study, the periphery segmentation is
accomplished with level set-based approach previous by the
authors [4]. The system uses the narrowband level set
methodology with an adaptive segmentation threshold
1 Dissertations from Mississippi State Univeristy can be searched at
http://www.library.msstate.edu. Select “Search for Materials” then choose
Electronic Thesis and Dissertations
Level Set-Based Core Segmentation of Mammographic Masses
Facilitating Three Stage (Core, Periphery, Spiculation) Analysis
John E. Ball, Graduate Student Member, IEEE, Lori Mann Bruce, Senior Member, IEEE
M
Proceedings of the 29th Annual InternationalConference of the IEEE EMBSCité Internationale, Lyon, FranceAugust 23-26, 2007.
ThP2B3.12
1-4244-0788-5/07/$20.00 ©2007 IEEE 819

controlled by a custom designed border complexity term.
This method is denoted as the adaptive level set
segmentation method (ALSSM). Details may be found in [4].
Previous methods for spiculation detection and/or
segmentation include shape analysis using the wavelet
modulus-maxima method, the continuous Radon transform
and custom radial spiculation filters, pixel orientation
statistics, morphological processing, gradient histogram
analysis, analysis using a modified Hough transform, two-
dimensional (2D) wavelet transforms with gradient phase
directions, multi-scale directional recursive median filtering ,
and directional recursive median filtering with pattern
analysis. These methods are discussed in detail in [4].
In this study, the spiculation detection and segmentation
is accomplished using a method previous developed by Ball
and Bruce [4]. This method uses the Dixon and Taylor line
operator (DTLO), and a generalized version of DTLO
(GDTLO) in conjunction with level set segmentation. The
approach is referred to as the spiculation segmentation with
level sets (SSLS), and further details can be found in [4].
III. LEVEL SETS
In 2D image segmentation, the segmentation boundary is
the zero level set of an implicit function φ , where the
segmentation boundary is controlled by the following partial
differential equation 0t Fφ φ+ ∇ = . The zero level set of φ
moves in a direction normal to the front, and is controlled by
the speed function, ( ),F x y . If 0F > , then the level set
boundary will expand outward normal to the boundary; if
0F = , then the boundary will not move; if 0F < , then the
level set boundary will shrink inwards normal to the
boundary [5]. Level sets offer numerically fast algorithms to
perform robust image segmentation.
The Chan-Vese image segmentation method is a binary
segmentation method (i.e. two regions in an image) which
provides a segmentation with a minimal variance criterion
[6]. This method is well suited for our purpose of segmenting
the mass core, as we want the core to be an area with high
graylevel mean and low variance. The functional controlling
the segmentation is
[ ] ( )( )
( )( )
2
1
2
2
\
1,
2
1,
2
R
R
E R I x y c dx dy
I x y c dx dy
Ω
= − +
−
∫∫
∫∫ (1)
where R and Ω\R denote the segmented region and the area
outside of the segmented region, respectively, and c1 and c2
are the average image intensities inside R and Ω\R,
respectively, and the image pixel is I(x,y). This method can
easily be implemented using the level set methodology. A
derivation of the speed function is given in [6] by solving the
corresponding Euler-Lagrange equations:
( ) ( ) ( ) ( )1 2 1 2, , 0.5F x y c c I x y c c= − − + . (2)
In practice, the level set is allowed to progress through
several iterations, then the constants c1 and c2 are re-
evaluated, and the process repeats until the stopping criteria
is met. The Chan-Vese method has been previously used in
many image segmentation tasks [7], and directly and in
modified forms for medical image segmentation [8-10]. To
the best of our knowledge, this is the first paper to use the
Chan-Vese method for segmentation in and end-to-end
digital mammography CAD system.
IV. DATA SET
This study uses a difficult image subset from the DDSM
database [11]. The 60 cases in our data set consist of 30
benign cases and 30 malignant cases, where only 17 of the
malignant cases are spiculated. Note that spiculated benign
cases are relatively rare, and none were included in this
study. Each test case consists of a mammographic image, the
diagnosis (malignant or benign, which are validated with
biopsies and follow–up visits), the patient’s age, a physician
supplied region of interest (ROI), and a radiologist
assessment of whether the mass is spiculated. Only an
indication of the presence of spicules is provided (a
spiculation template is not provided). The original
mammographic images are scanned with a Howtek scanner
with a pixel size of 43.52 µm2
and 12 bits per pixel
radiometric resolution [11]. Each mammogram is cropped to
[2048 × 2048] pixels in an area around the physician
supplied ROI. The data set is the same set used in [4] for
SSLS and ALSSM segmentations. Further discussion of this
dataset in terms of subtlety, margins, density, and Bi-RADS
distributions, may be found in [4].
V. METHODOLOGY
Our hypothesis is that overall results may be improved if
multiple segmentations of the mass are analyzed. The
ALSSM (periphery segmentation) is designed to accurately
segment the main mass. The SSLS (spiculation
segmentation) in [4] is designed to detect and segment the
spicules for spiculated masses. This paper discusses the core
segmentation, and what effects it has on the classification
results and feature efficacy.
Combining the ALSSM and SSLS segmentation systems
gives a two-stage system, potentially providing two
segmentations and two separate feature sets. This work is
extended in this paper to include a third stage, which is the
mass core, which we define as the largest bright connected
area inside the main mass. The mammogram is first analyzed
via the ALSSM periphery analysis, which includes a semi-
automated seed point selection algorithm based on a
physician-supplied region of interest [4]. The periphery is
segmented, and the results are passed to a feature extraction
stage. Next, if spicules are detected by the SSLS system,
then the spicules are segmented. These results are then
passed to a feature extraction stage. If no spicules are
detected, then the spicule segmentation defaults to the
periphery segmentation.
820

The features extracted from the periphery and
spiculation segmentations include combinations of standard
mammographic features such as morphological features,
graylevel statistical features, normalized radial length (NRL)
features, and gray level co-occurrence matrix features
(GLCM).
The periphery segmentation result is also passed to the
core segmentation algorithm. Once the core has been
segmented, then those results are passed to a feature
extraction stage. This feature set contains the standard
features used in the periphery and spiculation segmentations,
respectively. The core features also contain some specialized
features based on the core and the periphery segmentations.
The user can then select which combinations of features
to use, i.e. periphery only, spiculations only, core only,
periphery and core, etc. For multiple segmentations, the
features are concatenated into a larger feature set. Stepwise
linear discriminant analysis (SLDA) with forward selection
and backwards rejection is used to reduce the large number
of potential features to a scalar feature. A limit is set so
SLDA could select at most ten features. This limit is set
because of the limited amount of training data available in
this study. Since only 60 mammograms total are used and a
LOO method is employed, each iteration of the system
testing is based on a training set of 59 cases. Limiting the
SLDA feature selection to ten avoid overtraining and ensures
proper covariance matrix and inverse matrix calculations in
the SLDA implementation [4]. The last stage of an end-to-
end CAD system is a classifier. The optimized features are
passed to the classifier, and the mass is labeled as benign or
malignant. In this study, a maximum likelihood (ML)
classifier [12] is used to make a benign or malignant decision
[13].
For core analysis, the mammogram image is
preprocessed by a transformation to the polar domain around
the geometric centroid of the periphery segmentation. The
pixel mean values are calculated. A square mean filter sized
5 pixels radially by 5 degrees in the theta direction is applied
to the polar image at each pixel. The filtered polar image is
then multiplied pixel by pixel with the unfiltered polar
image, in order to enhance the contrast. This enhanced image
is then transformed back into the Cartesian domain. The final
Cartesian enhanced image is denoted IE.
The level set segmentation starts by calculating the
cumulative distribution function (CDF) of pixels in the
periphery segmentation, using 200 bins. Let ( , )P x yφ be the
signed distance function (SDF) of the periphery
segmentation. The SDF is defined as the smallest Euclidean
distance to the segmentation boundary, with a positive
(negative) sign inside (outside) the segmentation. Thus, the
SDF on the periphery segmentation border or inside the
periphery segmentation area are less than or equal to zero.
The initial core candidate region is defined by pixels
satisfying the condition ( , )CS x y = 1, where
( ) ( )( , ) ( , ) ( , )C P PS x y H C x y H x yα φ β= − − . (3)
H(x) is the Heaviside step function, defined as H(x)=1 if x≥0
and H(x) = 0 otherwise; ( , )PC x y is the CDF at location
(x,y); the CDF threshold α = 0.7 is chosen experimentally;
and β = -10 is a constant used to force the core at least β
pixels away from the periphery segmentation border. This
restriction forces a small gap between the core segmentation
boundary and the periphery boundary, which allows texture
features to be calculated in the region between the core and
periphery boundaries. Because of the step function
thresholding, this initial segmentation can contain more than
one region, and can also contain small islands. For that
reason, the initial core segmentation is set to the largest
connected region defined by 1CS = . The signed distance
function Cφ is then calculated from this region.
The Chan-Vese method is applied, with the inner region
R set to the initial region described above, and the outer
region set to the periphery segmentation. That is,
( ) ( )1P CH Hφ β φ Ω = − − . The level set is propagated
with a time step t∆ =0.1 and will stop if either (i) 500
iterations complete, or (ii) the segmentation changes less
than four pixels in three consecutive iterations; these values
were determined experimentally.
If there is more than one region found by the above
method, then the core is chosen as the largest region.
Because of the core algorithm, at least one core will be
found.
The features extracted are listed in Table I and include
morphological, statistical graylevel, texture features, as well
as patient age. In addition to these standard features, a set of
features based on the core and periphery segmentation is
extracted, and is denoted extended core features. These
features include morphological and statistical feature ratios;
a delta normalized radial length (DRNL) feature set, and a
set of texture features. All of these features are based on both
the core and periphery segmentations. These core features
are listed in Table II. For further details, reference [4].
For the morphological and statistical features, the ratios
of the periphery features to the corresponding core features
are calculated. For example, the morphological feature
referred to as major axis length ratio is the periphery major
axis length divided by the core major axis length. The DNRL
is the NRL of the periphery minus the NRL of the core. Note
that the NRL vectors are usually not the same length, so the
shortest NRL vector is interpolated using bilinear
interpolation to have the same length of the longer vector.
The DNRL features are differences in the core NRL and
periphery NRL features. For example, the DNRL length
feature is calculated as the length of the original core NRL
vector minus the length of the original periphery NRL
vector.
A final set of texture features are created via the
application of the 25 2D Laws texture kernels [14,15]. To
create the Laws texture features, a small image containing
the core segmentation is extracted from the mammogram
image. The image is convolved with each of the Laws 2D
kernels. The L5L5 feature is a special Laws feature image is
821
used to normalize all of the other laws feature images. Thus,
each image is then normalized by dividing pixel by pixel
with the L5L5 image, and is termed Im for each 2D Laws
texture kernel 1,2, ,25m∈ ⋯ . For each 2D Laws texture
and each pixel in the convolved image, the following
equation is used to calculate the m-th LAWS texture:
( , ) ( , )
D D
m m
j D k D
L x y I x j y k
=− =−
= + +∑ ∑ , (4)
where the texture mask size is (2D+1) by (2D+1). The
variable D is selected as 7, thus eq. (4) uses a [15 × 15]
region centered at each pixel for analysis. The Laws features
are extracted for three regions: the core only, the periphery,
and the region between the core and periphery. The laws
features include three features for the mean value of the
L5L5 image pixels for the three regions, and the standard
deviation and entropy for each laws texture kernel for each
region. Therefore there are three mean features plus (25
kernels) * (3 regions) * (2 feature types) = 153 laws texture
features.
There are a large number of features, and the feature set
must be reduced due to the limited training samples
available. SLDA uses the area under the ROC curve (AZ)
[16] with forward selection and backward rejection to
optimally select up to ten features and then linearly project
them to maximize class separation. It is noted that age is
included only once (age is only allowed to be selected by
SDLA once, even though age is in each feature set). The
optimized features are then passed to a classifier to label the
mass as malignant or benign.
VI. RESULTS AND DISCUSSION
The following notation is used for the different
combinations of features extracted from the three different
segmentations: P - Periphery, C - Core, S - Spiculations.
A “+” will be used to indicate that features from multiple
segmentations are utilized, e.g. P+C = Periphery and Core.
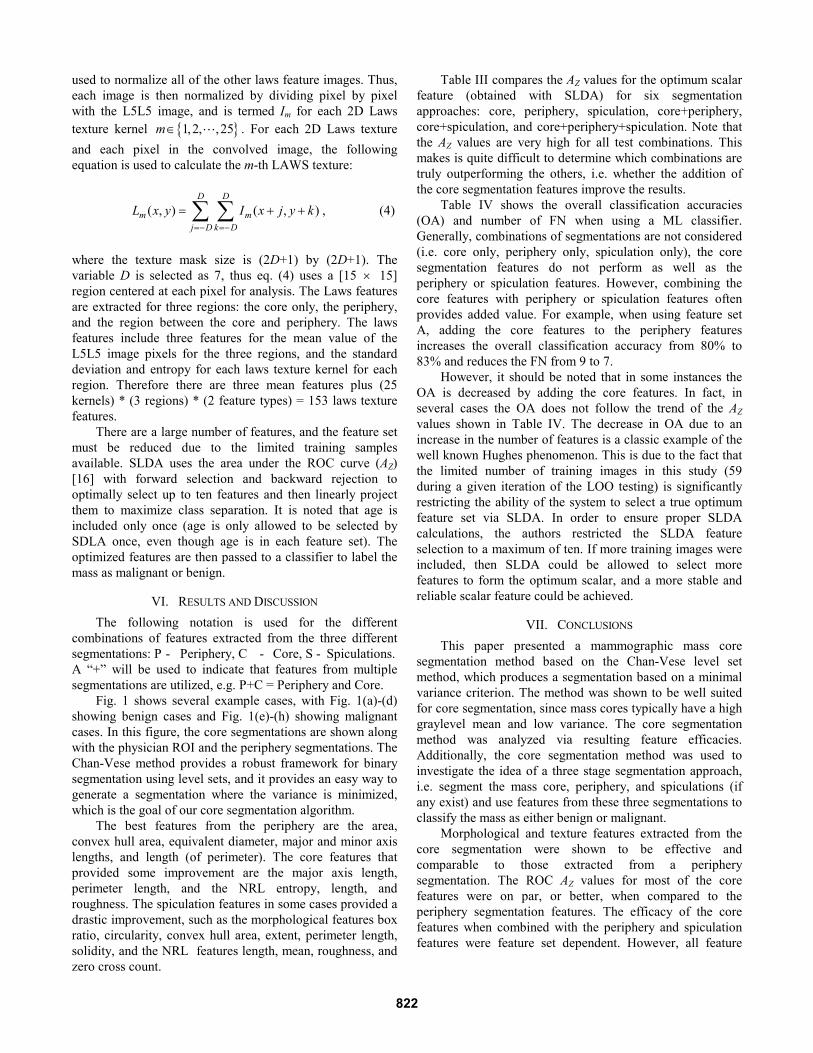
Fig. 1 shows several example cases, with Fig. 1(a)-(d)
showing benign cases and Fig. 1(e)-(h) showing malignant
cases. In this figure, the core segmentations are shown along
with the physician ROI and the periphery segmentations. The
Chan-Vese method provides a robust framework for binary
segmentation using level sets, and it provides an easy way to
generate a segmentation where the variance is minimized,
which is the goal of our core segmentation algorithm.
The best features from the periphery are the area,
convex hull area, equivalent diameter, major and minor axis
lengths, and length (of perimeter). The core features that
provided some improvement are the major axis length,
perimeter length, and the NRL entropy, length, and
roughness. The spiculation features in some cases provided a
drastic improvement, such as the morphological features box
ratio, circularity, convex hull area, extent, perimeter length,
solidity, and the NRL features length, mean, roughness, and
zero cross count.
Table III compares the AZ values for the optimum scalar
feature (obtained with SLDA) for six segmentation
approaches: core, periphery, spiculation, core+periphery,
core+spiculation, and core+periphery+spiculation. Note that
the AZ values are very high for all test combinations. This
makes is quite difficult to determine which combinations are
truly outperforming the others, i.e. whether the addition of
the core segmentation features improve the results.
Table IV shows the overall classification accuracies
(OA) and number of FN when using a ML classifier.
Generally, combinations of segmentations are not considered
(i.e. core only, periphery only, spiculation only), the core
segmentation features do not perform as well as the
periphery or spiculation features. However, combining the
core features with periphery or spiculation features often
provides added value. For example, when using feature set
A, adding the core features to the periphery features
increases the overall classification accuracy from 80% to
83% and reduces the FN from 9 to 7.
However, it should be noted that in some instances the
OA is decreased by adding the core features. In fact, in
several cases the OA does not follow the trend of the AZ
values shown in Table IV. The decrease in OA due to an
increase in the number of features is a classic example of the
well known Hughes phenomenon. This is due to the fact that
the limited number of training images in this study (59
during a given iteration of the LOO testing) is significantly
restricting the ability of the system to select a true optimum
feature set via SLDA. In order to ensure proper SLDA
calculations, the authors restricted the SLDA feature
selection to a maximum of ten. If more training images were
included, then SLDA could be allowed to select more
features to form the optimum scalar, and a more stable and
reliable scalar feature could be achieved.
VII. CONCLUSIONS
This paper presented a mammographic mass core
segmentation method based on the Chan-Vese level set
method, which produces a segmentation based on a minimal
variance criterion. The method was shown to be well suited
for core segmentation, since mass cores typically have a high
graylevel mean and low variance. The core segmentation
method was analyzed via resulting feature efficacies.
Additionally, the core segmentation method was used to
investigate the idea of a three stage segmentation approach,
i.e. segment the mass core, periphery, and spiculations (if
any exist) and use features from these three segmentations to
classify the mass as either benign or malignant.
Morphological and texture features extracted from the
core segmentation were shown to be effective and
comparable to those extracted from a periphery
segmentation. The ROC AZ values for most of the core
features were on par, or better, when compared to the
periphery segmentation features. The efficacy of the core
features when combined with the periphery and spiculation
features were feature set dependent. However, all feature
822

combinations that were investigated resulted in AZ values
that were very high and made comparisons difficult.
In this study, however, the feature efficacies were
limited because of the small number of training images, i.e.
small relative to the very large number of potential features,
particularly large when the three segmentation approaches
were combined. Since SLDA was used for feature selection
and optimization, the number of selected features was
limited to ten, and as a result the overall classification
accuracies were relatively low and unstable, i.e. suffering
from the Hughes phenomenon. With a much larger dataset,
more features could be used to form the feature vector
resulting in a more stable and reliable feature vector (or
scalar feature if using a reduction technique like SLDA). As
a result, CAD systems that segment the mass periphery only
could benefit from adding a core segmentation and resulting
core features.
In this study, classification results were obtained for a
commonly used maximum likelihood classifier. In future
work, results for a true end-to-end CAD system using a three
stage segmentation could be improved if a more powerful
classifier is used, e.g. support vector machines, and by
adding an automated detection system instead of starting
with a physician supplied region of interest.
TABLE III
MEAN LOO ROC AZ VALUES AND 95 % CONFIDENCE INTERVAL.
Feature Set
Seg A B C
C 0.9702 ± 0.0010 0.9716 ± 0.0012 0.9717 ± 0.0022
P 0.9787 ± 0.0011 0.9708 ± 0.0011 0.9679 ± 0.0013
S 0.9862 ± 0.0011 0.9862 ± 0.0013 0.9849 ± 0.0011
C+P 0.9645 ± 0.0008 0.9674 ± 0.0010 0.9717 ± 0.0022
C+S 0.9861 ± 0.0007 0.9861 ± 0.0007 0.9827 ± 0.0014
C+P+S 0.9858 ± 0.0007 0.9858 ± 0.0007 0.9827 ± 0.0014
FS = feature set (reference tables I and II). Segmentations: C=Core,
P=Periphery, S=Spicules.
TABLE I
FEATURE LIST. FOR FURTHER INFORMATION, REFERENCE [4].
Feature
Set
A B C
Feature Type Feature List Number
of
Features
• • • Patient age Age 1
• • Morphological Area, Axis ratio, Box ratio, Circularity, Convex hull area, Eccentricity, Equivalent diameter, Extent,
Extent ratio, Major axis length, Minor axis length, Perimeter length, Solidity, Width to height ratio 14
• • Statistical Gray level mean, Gray level std. dev, Gray level std. dev. ratio 3
• • NRL Entropy, Length, Mean, Roughness, Std. dev., Zero crossing count 6
• • GLCM (RBST) Energy, Variance, Correlation, Inertia, Inverse Difference Moment, Entropy 1008
TABLE II
FEATURE LIST FOR THE EXTENDED CORE FEATURES. FOR FURTHER INFORMATION, REFERENCE [4].
Feature
Set
A B C
Feature Type Feature List Number of
Features
• • • Morphological Ratios of standard morphological features 14
• Statistical Ratios of statistical features (Gray level std. Dev., Gray level std. dev. ratio) 2
• • NRL Delta Delta NRL Entropy, Length, Mean, Roughness, Std. dev., Zero crossing count 6
• • Laws Texture Laws features for core, areas between core and periphery, and periphery. 153
TABLE IV
RESULTS. OVERALL ACCURACIES IN PERCENT AND FALSE NEGATIVES.
Overall Accuracy (%) False Negatives
Fea
ture S
et
C
P
S
C+P
C+S
C+P+S
C
P
S
C+P
C+S
C+P+S
A 78 80 88 83 88 90 8 9 5 7 4 4
B 83 87 88 82 90 90 4 4 5 7 4 4
C 88 87 90 88 88 90 5 4 3 4 2 2
Notes: P=Periphery, C=Core, S=Spicules, C+P=Core, etc. Reference
Tables I and II for feature set definitions.
823
REFERENCES
[1] National Cancer Institute, "National Cancer Institute Fact Sheet:
Improving Methods for Breast Cancer Detection and Diagnosis,"
2006. Available: http://www.cancer.gov/cancertopics/screening
/breast.
[2] A. Jemal, T. Murray, E. Ward, A. Samuels, R.C. Tiwari, A. Ghafoor,
E.J. Feuer, and M.J. Thun, "Cancer Statistics, 2005," CA: A Cancer
Journal for Clinicians, vol. 55, no. 1, pp. 10-30, 2005.
[3] J.E. Ball, T.W. Butler, and L.M. Bruce, "Towards automated
segmentation and classification of masses in mammograms," Proc. of
the 26th Annual Intl. Conference of the Engineering in Medicine and
Biology Society, San Francisco, CA, vol. 1, pp. 1814-1817, 2004.
[4] J.E. Ball, "Three stage level set segmentation of mass core, periphery,
and spiculations for automated image analysis of digital
mammograms." Ph.D. in Electrical Engineering. Starkville, MS:
Mississippi State Univ., May 2007.
[5] J.A. Sethian, Level Set Methods and Fast Marching Methods:
Evolving Interfaces in Computational Geometry, Fluid Mechanics,
Computer Vision, and Materials Science, 2nd ed. Cambridge, UK:
Cambridge University Press, 2002.
[6] T.F. Chan and L.A. Vese, "Active contours without edges," IEEE
Trans. on Image Processing, vol. 10, no. 2, pp. 266-277, 2001.
[7] T. Chan and Z. Wei, "Level set based shape prior segmentation,"
Proc. of the IEEE Computer Society Conference on Computer Vision
and Pattern Recognition, vol. 2, pp. 1164-1170, 20-25 Jun. 2005.
[8] A. Tsai, A. Yezzi, Jr., W. Wells, C. Tempany, D. Tucker, A. Fan,
W.E. Grimson, and A. Willsky, "A shape-based approach to the
segmentation of medical imagery using level sets," IEEE Trans. on
Medical Imaging, vol. 22, no. 2, pp. 137-154, Feb. 2003.
[9] W. Ying, X. Xin-he, J. Tong, and Z. Da-zhe, "An Optimal Level Sets
Method for Lung Nodules Detection in CT Images," Proc. of the Sixth
Intl. Conference on Intelligent Systems Design and Applications,
Jian, China, vol. 2, pp. 251-255, Oct. 2006.
[10] M.F. Hansen, R. Larsen, B. Ersboll, and L.B. Christensen, "Coupled
Shape Model Segmentation in Pig Carcasses," Proc. of the 18th
International Conference on Pattern Recognition, vol. 1, pp. 468-
471, 2006.
[11] M. Heath, K.W. Bowyer, D. Kopans, W. Kegelmeyer, R. Moore, K.
Chang, and S. Munishkumaran, "Current status of the Digital
Database for Screening Mammography," in Digital Mammography,
N. Karssemeijer, M. Thijssen, J. Hendriks, and L. van Erning, Eds.
Boston, MA: Kluwer Academic Publishers, pp. 457-460, 1998.
[12] R.O. Duda, P.E. Hart, and D.G. Stork, Pattern Classification, 2nd ed.
New York: John Wiley & Sons, 2001.
[13] V.P. Shah, L.M. Bruce, and N.H. Younan, "Applying modular
classifiers to mammographic mass classification," Proc. of the 26th
Annual Intl. Conference of the Engineering in Medicine and Biology
Society (EMBC) vol. 3, pp. 1585-1588, Sept. 2004.
[14] K. Laws, "Textured Image Segmentation." PhD in Electrical
Engineering. Los Angeles, CA: Image Processing Institute, University
of Southern California, Jan. 1980.
[15] K. Laws, "Rapid Texture Identification," Proc. of the Image
processing for missile guidance seminar, San Diego, CA, pp. 376-
380, Jan. 1980.
[16] M. Kallergi, "Medical Image Analysis Methods," in The Electrical
Engineering and Applied Signal Processing Series, L. Costaridou,
Ed. New York: Taylor & Francis, pp. 433-472, 2005.
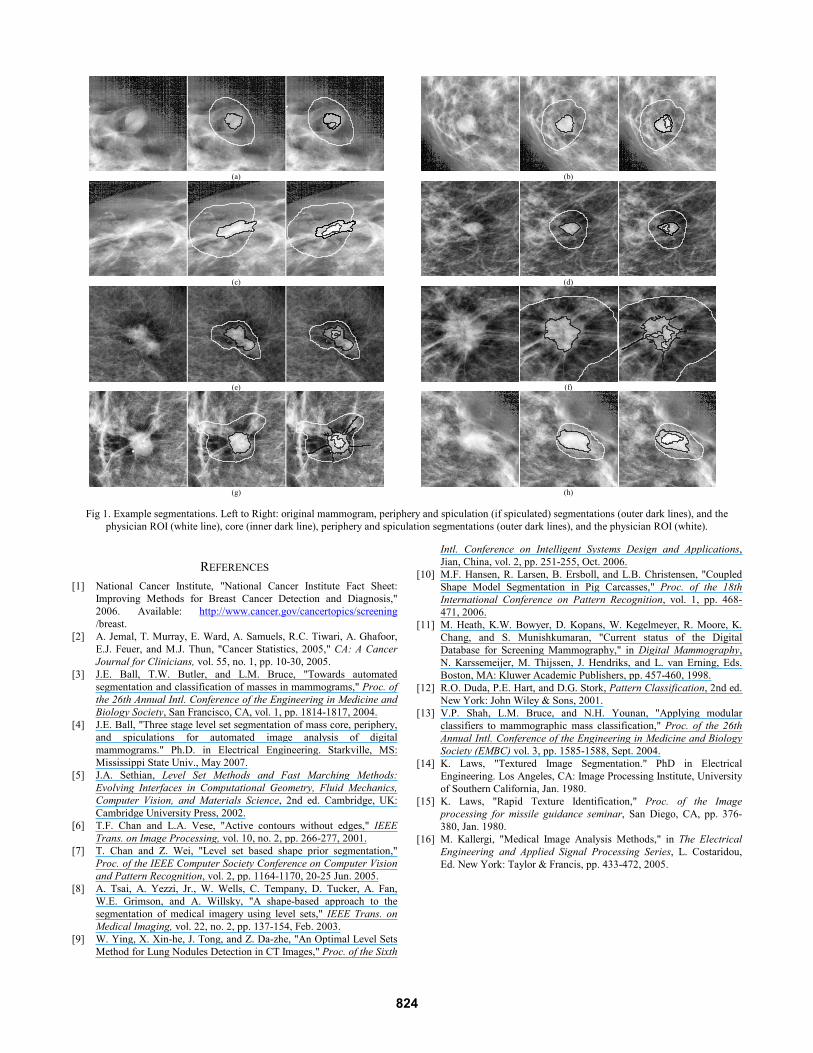
(a) (b)
(c) (d)
(e) (f)
(g) (h)
Fig 1. Example segmentations. Left to Right: original mammogram, periphery and spiculation (if spiculated) segmentations (outer dark lines), and the
physician ROI (white line), core (inner dark line), periphery and spiculation segmentations (outer dark lines), and the physician ROI (white).
824