lean production, market share and value creation in the agricultural machinery sector in brazil
TRANSCRIPT
Lean production, marketshare and value creation in the
agricultural machinerysector in Brazil
Paul L. ForresterBirmingham Business School, The University of Birmingham,
Birmingham, UK
Ullisses Kazumi ShimizuMackenzie Presbyterian University, Sao Paulo, Brazil
Horacio Soriano-MeierNorthampton Business School, The University of Northampton,
Northampton, UK
Jose Arturo Garza-ReyesSchool of Technology, The University of Derby, Derby, UK, and
Leonardo Fernando Cruz BassoBusiness School-Graduate Department, Mackenzie Presbyterian University,
Sao Paulo, Brazil
Abstract
Purpose – The “resource-based view” (RBV) of firms considers that major operational andorganisational advantages are created in the internal environment of a firm. The implementation oflean manufacturing represents the potential for strategic advantage over competitors, especially incraft-based industries in developing regions of the world. The purpose of this paper is to investigatethe relationship between the adoption of lean manufacturing and market share and value creation ofcompanies in the agricultural machinery and implements sector in Brazil.
Design/methodology/approach – The paper is based on data collected in a survey conductedacross 37 firms in the agricultural machinery and implements industry in Brazil. The data were usedwithin a model for assessing the degree of leanness to test three hypotheses using correlation,regression, analysis of variance and cluster statistical methods.
Findings – Brazilian firms and managers in this sector that have supported a transition towards theadoption (and adaptation) of lean manufacturing practices have shown a significant improvement intheir business performance.
Originality/value – The paper presents an empirical study where lean manufacturing is investigatedand tested from a “RBV” perspective. It demonstrates the application of an emergent model formeasuring the degree of leanness and the extent of business improvement. The study and the model areapplied to smaller, craft-based industries and so is applicable in developing countries and regions, incomparison with most literature on lean production in advanced economies. It provides a usefulperspective for firms to corroborate and understand the potential benefits that lean manufacturing canbring if adopted.
Keywords Lean production, Craft production, Brazil, Resource management, Market share
Paper type Research paper
The current issue and full text archive of this journal is available at
www.emeraldinsight.com/1741-038X.htm
Lean productionin Brazil
853
Received July 2009Revised February 2010
Accepted March 2010
Journal of Manufacturing TechnologyManagement
Vol. 21 No. 7, 2010pp. 853-871
q Emerald Group Publishing Limited1741-038X
DOI 10.1108/17410381011077955
1. IntroductionOne of the main objectives in strategy formulation and implementation is the creation ofsustainable advantages for firms. De Oliveira and Fensterseifer (2003) argue the need forunderstanding why some firms perform better than others which operate in similar marketand competitive situations. These differences in performance may be attributed to adifferentiation in internal factors such as knowledge and other strategic assets, whichhave an impact on the firm’s overall performance. This thinking is embodied in the“resource-based view” (RBV) approach which considers firms as different amalgams ofproductive and strategic resources and capabilities that lead them to different performancepotentials. The “RBV” has gained prominence in the strategy literature by emphasizing thefirm’s internal resources as the main determinants for improved performance. However,despite the global appeal and attractiveness of this view, empirical studies to prove itsworth are still in short supply in many regions of the world, including Brazil.
This paper is based on data collected from an in-depth survey and interviews inBrazil but has application beyond. It adds to our knowledge on lean manufacturing andperformance by demonstrating that adaptations to the basic lean model are necessaryto match the context of the organisation and industry sector. Furthermore, thepaper demonstrates the application and applicability of the Soriano-Meier andForrester (2002) model for measuring the degree of leanness and lean performance to afurther context, beyond the original UK study. It is shown that this model offers ageneric tool for measuring degree of leanness, degree of commitment of managers andlinking these to business performance.
The economic success attained by companies engaged in lean production programmeshas boosted interest in the understanding and adoption of “lean” by Brazilian companies.Lean is defined by NIST (2000) as a systematic approach to identify and eliminate wastethrough continuous improvement (CI), a demand-pull flow of materials and the pursuit oferror-free processes. Although the origins of lean thinking can be found on the shop floor ofJapanese manufactures and, in particular, innovations at the Toyota Motor Corporation(Hines et al., 2004), it was the publication of the bookTheMachine that Changed theWorld(Womack et al., 1990) that popularised the method and the lean terminology. Theapplication of lean manufacturing concepts and practices, as well as their application inkey business processes and industry sectors, has grown and evolved since 1990 and isnow accepted generally as “best practice” for manufacturing in developed industries ofthe world.
But how generic is the application of lean? Can it be readily applied to advantage insmaller, craft-based industries in more remote and developing regions of the world?This paper argues that it can. It tests the relationship between the adoption of leanproduction programmes and the market share and value creation of companies in theagricultural machinery and implements manufacturing sector in Brazil. This sectorwas chosen for its growing strategic importance in the country. According to theMetalworking Insider Report (2004), the agricultural machinery and implements sectorof Brazil ranked 15th in the world in 2004, with production levels similar to those ofAustria and The Netherlands. Brazil is fast becoming a major world grain and animalproducts provider, which has attracted multinational companies in the food sector andtherefore demonstrates growth in the Brazilian agriculture machinery sector.
The paper argues that the capacity to perform lean production is a key resource forthe creation of a competitive advantage. The constructs relating to the degree of leanness
JMTM21,7
854
were extrapolated from a study by Soriano-Meier and Forrester (2002). Four valuecreation measures of profitability (value creation rates) and measures of sum (sundryaccounting measurements for profit) were used. In addition, the paper features atheoretical benchmark based on the RBV which emphasizes the attributes a resourcerequires in order to create a sustainable competitive advantage. This constitutes thetheoretical grounds to measure the degree of leanness and to test the research hypothesesfrom the RBV.
2. Theoretical benchmark: RBV and the degree of leannessThe lean manufacturing model associates advantage in productive performance withadherence to three key principles:
(1) Improvement in the flow of materials and information through operations.
(2) The emphasis on demand (or usage) pull of materials and products, in place ofpushing inventories through the system (triggering production by kanban).
(3) The commitment to CI facilitated by people development.
All these grounds indicate that lean manufacturing is a production process that cannotbe easily or immediately imitated. Interestingly, the original study of InternationalMotor Vehicle Programme (IMVP) was largely influenced by Toyota and the work ofOhno (1988). It took Ohno ten years after his retirement to write the book that effectivelydescribed the productive process of Toyota in a coherent and replicable way. Socialscientists, engineers and consultants sought a systematic explanation of the success ofToyota (Womack et al., 1990; Monden, 1983; Goddard, 1986; Harrison, 1992; Cheng andPodolsky, 1996). This resulted in a number of “deconstructions” of the lean system. It wasrecognised that any system or form of production organisation must take into accountthe history and context of the region in which it was designed. Lean manufacturing, bornin Japan fathered by Taiichi Ohno, is to a degree culturally bound and needed someadaptation, but its principles have generic application and were even partially inexistence before Ohno’s system. For example, innovations in operations acclaimed as thework of Toyota (Ohno, 1988) were already being used by Ford in 1920 (see Williams et al.,1994, for a review of some myths of lean manufacturing).
Lean evolved in a practical manner, and for some years, academics “chased” thework of the practitioners in a quest to theorise and model lean principles. The RBV hasbeen a major vehicle in accomplishing this. Barney (1991) identifies that resources aresources of sustainable competitive advantage if they are as follows:
. Valuable. Valuable meaning the resource that enables the company to maintainor implement a strategy that increases its effectiveness or efficiency.
. Scant or rare. It is intuitive that if a company possesses a resource that isabsolutely rare or scanty among its competitors, this resource will generatecompetitive advantage in relation to its rivals and will also have the possibility ofbecoming a sustainable competitive advantage for the company.
. Imperfectly imitable. Meaning other competitors cannot replicate as they lackrelevant and key resources that comprise the strategy.
Resources are imperfectly imitable when the company’s ability to obtain the resourcedepends solely on historic conditions, the connection between the ownership of the
Lean productionin Brazil
855
resource and the sustainable competitive advantage is ambiguous as far as the cause ofthe advantage is concerned (i.e. casual ambiguity exists when the connection between theresources controlled by the company and the competitive advantage is not understood)and the resource that generates sustainable competitive advantage is socially complexand depends on the relationship between people and processes, for example, interpersonalrelationships between and among managers, the company culture and reputation amongsuppliers and customers.
Barney (1991) also identified another characteristic of a resource, imperfectlysubstitutable, that provides the company with a competitive advantage where there isno equivalent resource that enables the rival to implement a similar strategy.
Grant (1991) observes that the internal resources and capabilities of the organisationrepresent a more stable and secure basis for the formulation of competitive strategies.Resources and organisational capabilities should be the bases for the definitionof competitive strategies sustainable over the long term, as they are more efficientthan strategies sustained by external factors. Therefore, companies should be wellcoordinated internally and aware that the level of resources (physical, financial andtechnological media and the reputation of the company) and the organisational climate(organisational skills) will define the company’s capacity to adapt to changes in thestandard of competition. These are clearly key concerns in the case of lean production.
In the language of traditional strategic analysis, company resources are forces thatcan be used to design and implement strategies (Learned et al., 1969; Porter, 1981).According to Collis and Montgomery (1997), resources can come in various shapes,ranging from the most common, widely available and easily purchasable factor to themost differentiated resource such as brand, which should be developed for many yearsand is very hard to imitate. The same authors propose the classification of resources inthree categories: tangible assets, intangible assets and organisational capabilities.It appears that the latter two are particularly to the fore in the adoption of leanproduction. Intangible assets offer the basis for diversified expansion as they aredifficult to replicate. Applied to production, organisational capability is what governsthe efficiency of the company’s activities. If well developed, the organisationalcapabilities can be sources of competitive advantage, as they enable the organisation toconvert inputs (whether services or products that result in greater efficiency or quality)into outputs, such as lean manufacturing, more efficiently than its rivals.
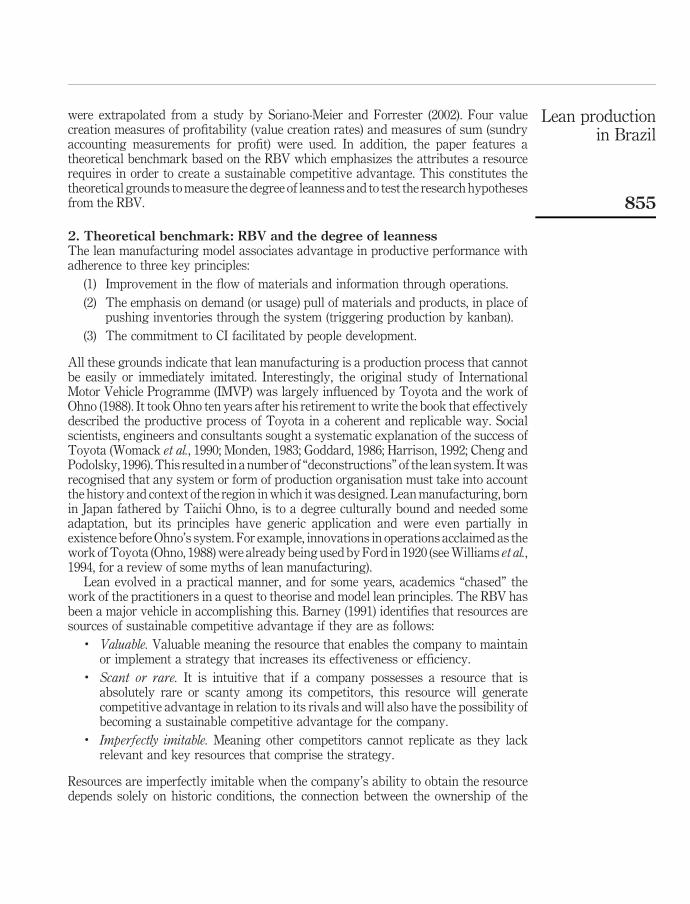
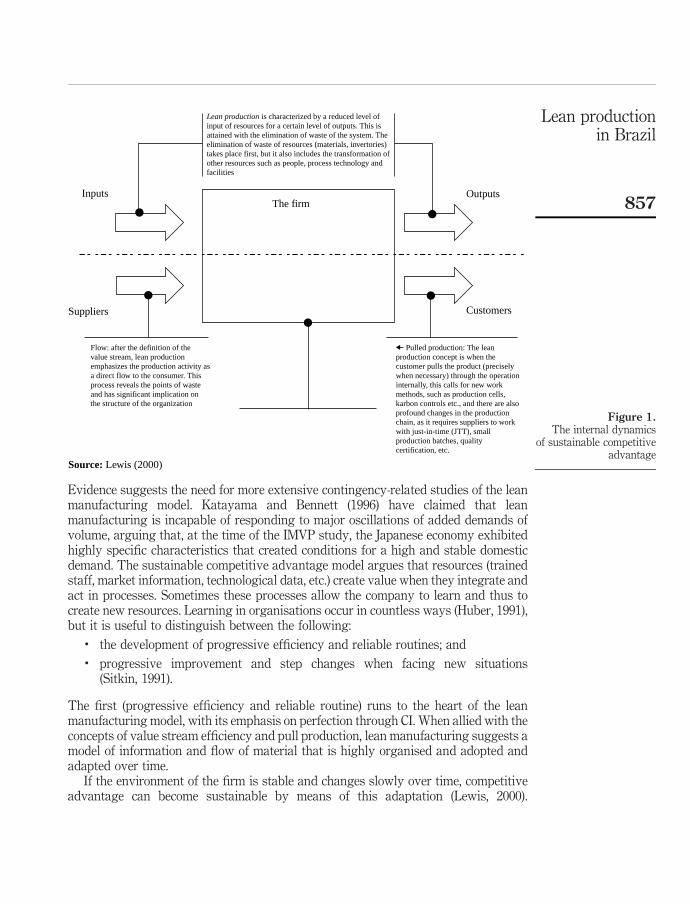
The use of the resources and capabilities of the firm as the foundation for a long-termstrategy is based on two assumptions. First, internal resources and capabilities providethe basic direction for the firm’s strategy. Second, resources and capabilities are theprimary origin of profit for the firm (Grant, 1991). Extending this to productionstrategies, Lewis (2000) illustrates how the dynamics of sustainable competitiveadvantage works (Figure 1). Resources can be strategic if inimitable by rivals. Firms donot need to own strategic resources as they can belong to their suppliers. Likewise, valuecreation processes go beyond the borders of the firm, involving current and potentialcustomers. Significant results are attained when they improve the firm’s performanceand differentiate it from its competitors.
Lewis (2000) proposes that the success of lean manufacturing in affordingsustainable competitive advantage is contingent to the external context of the firm.Contextual factors can include type of market (competition activity, profile of differentdemands), dominant technology in the sector and productive chain structure.
JMTM21,7
856
Evidence suggests the need for more extensive contingency-related studies of the leanmanufacturing model. Katayama and Bennett (1996) have claimed that leanmanufacturing is incapable of responding to major oscillations of added demands ofvolume, arguing that, at the time of the IMVP study, the Japanese economy exhibitedhighly specific characteristics that created conditions for a high and stable domesticdemand. The sustainable competitive advantage model argues that resources (trainedstaff, market information, technological data, etc.) create value when they integrate andact in processes. Sometimes these processes allow the company to learn and thus tocreate new resources. Learning in organisations occur in countless ways (Huber, 1991),but it is useful to distinguish between the following:
. the development of progressive efficiency and reliable routines; and
. progressive improvement and step changes when facing new situations(Sitkin, 1991).
The first (progressive efficiency and reliable routine) runs to the heart of the leanmanufacturing model, with its emphasis on perfection through CI. When allied with theconcepts of value stream efficiency and pull production, lean manufacturing suggests amodel of information and flow of material that is highly organised and adopted andadapted over time.
If the environment of the firm is stable and changes slowly over time, competitiveadvantage can become sustainable by means of this adaptation (Lewis, 2000).
Figure 1.The internal dynamics
of sustainable competitiveadvantage
Lean production is characterized by a reduced level ofinput of resources for a certain level of outputs. This isattained with the elimination of waste of the system. Theelimination of waste of resources (materials, invertories)takes place first, but it also includes the transformation ofother resources such as people, process technology andfacilities
Inputs
Suppliers Customers
Outputs
Flow: after the definition of thevalue stream, lean productionemphasizes the production activity asa direct flow to the consumer. Thisprocess reveals the points of wasteand has significant implication onthe structure of the organization
Pulled production: The leanproduction concept is when thecustomer pulls the product (preciselywhen necessary) through the operationinternally, this calls for new workmethods, such as production cells,karbon controls etc., and there are alsoprofound changes in the productionchain, as it requires suppliers to workwith just-in-time (JTT), smallproduction batches, qualitycertification, etc.
The firm
Source: Lewis (2000)
Lean productionin Brazil
857
Another finding presented by Lewis (2000) is that the greater the success of the firm inthe principles of lean manufacturing, the lower the degree of engagement for innovativeor transforming activities, as the emphasis of the programme is on CI (kaizen),understood to be incremental and not revolutionary or transforming.
There has been much attention in the literature on the benefits lean manufacturing canoffer to companies (Soriano-Meier and Forrester, 2002; Lewis, 2000; Karlsson andAhlstrom, 1996) and how to measure these results. According to the model proposed byKarlsson and Ahlstrom (1996), in order to determine whether a firm is lean, in transition orstill works according to traditional models, it is necessary to measure the progress madefrom an earlier point in time. It is important to distinguish between the determinants andperformance of lean manufacturing. The objectives of lean manufacturing are animprovement in productivity, attain an adequate level of quality and reduce productiontimes, cut costs and others. The determinants of lean manufacturing are the actions taken,the principles implemented and the changes made in the organisation to attain the desiredperformance. According to Karlsson and Ahlstrom (1996), the notion of progress isimportant in the lean concept. This view is supported by Soriano-Meier and Forrester(2002), who do not see lean manufacturing as a short-term technical tool but rather along-term strategic initiative. This model can be used as a tool to keep track of progress inthe direction of lean manufacturing. It can provide answers to the important questions: arethe actions we take leading us in the direction of lean manufacturing? And what progressare we making in relation to the different variables?
3. Creating and measuring valueValue creation is one of the touchiest topics in the economic theory, as there is noconsensus among various economic paradigms. To Marxists, the creation of value is theproduct of labour, while to neo-classicists, it is the product of utility. RBV focuses onresources (with the properties mentioned by Barney (1991)) as value creators. Ourconcern here will be with the measurement of value creation. Young and O’Byrne (2003)divide the measures into five categories: measures of residual profit, measures of thecomponents of residual profit, market-based measures, cash flow measures andtraditional profit measures. They argue that residual profit measures take intoconsideration the cost of “own” and “third-party” capital, unlike the market-basedmeasures where the advantage lies in the incorporation of the market expectation.Yet, these are restricted to listed companies. However, residual profit ratios, such aseconomic value added, are not as limited as the generally accepted accounting principles,making them ratios that generate numbers with appropriate economic significance. Onthe other hand, they require complex adjustments, making them limited in calculation.
Measures based on the components of residual profit, although more direct in theirdetermination, can only be calculated at the level of sector, division or business unit.Below these levels, apportionments and allocations are necessary, which is why theirresults are not precise. Cash flow measures are easier to calculate and offer theadvantage of associating performance with the business’s capacity to generate cashflow. Yet, in an analysis carried out by Young and O’Byrne (2003), it was verified thatthe calculation for these ratios requires accounting adjustments, which make themcomplex and arduous. Traditional measures of profit have the advantage of alreadybeing available in the required financial reports, and in spite of their weak points, areaccompanied by the market and are well known and widely used, as it is the case of
JMTM21,7
858
earnings per share. One of the main negative aspects is that they do not consider thecosts of own capital.
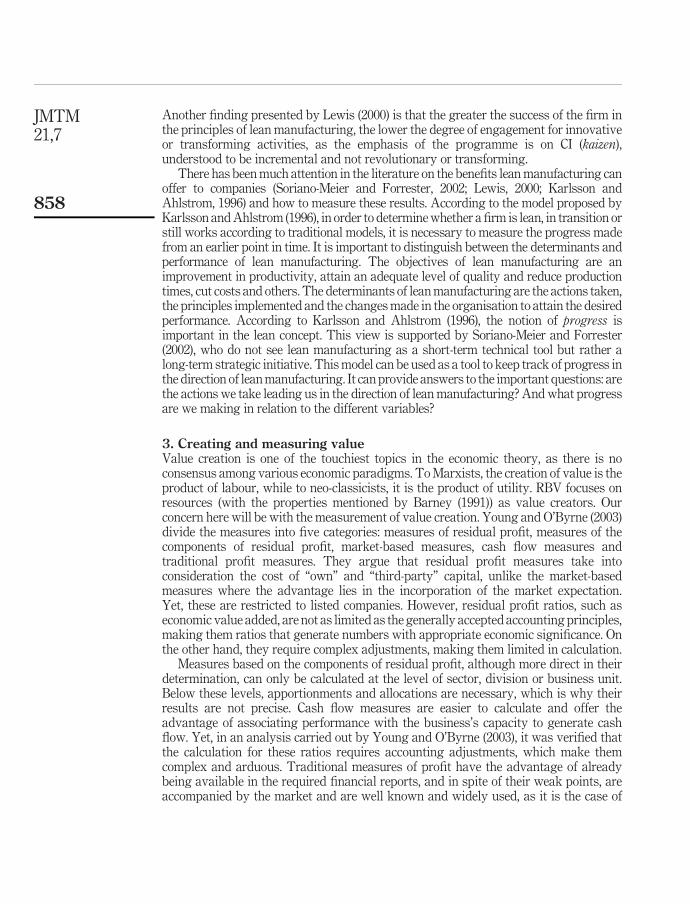
Soriano-Meier and Forrester’s (2002) study used two economic-financial ratios: salesby employee and turnover of the asset. These ratios were used in the Brazilian studycontained in this paper, but it is recognised that these are limited as measures of valuecreation. The first ratio is a market share ratio and market share does not necessarilylead to greater profitability. For example, a company can increase its market shareby acquiring similar companies with old plants. Old facilities imply a slump inproductivity and an increase of costs, which can reduce the profitability. On the otherhand, it is possible that greater market share is being obtained via competition overprices, which implies a profitability downslide. To overcome these limitations in theBrazilian study, we therefore opted to work with measures of value creation rates(sundry profitability concepts, expressed in terms of a flow by an inventory) and of sums(expressed in value streams), which measure value creation. The measures are includedin the category of traditional measures (accounting) of profit and profitability. Thesespecific measures used in this study are presented in Tables I and II.
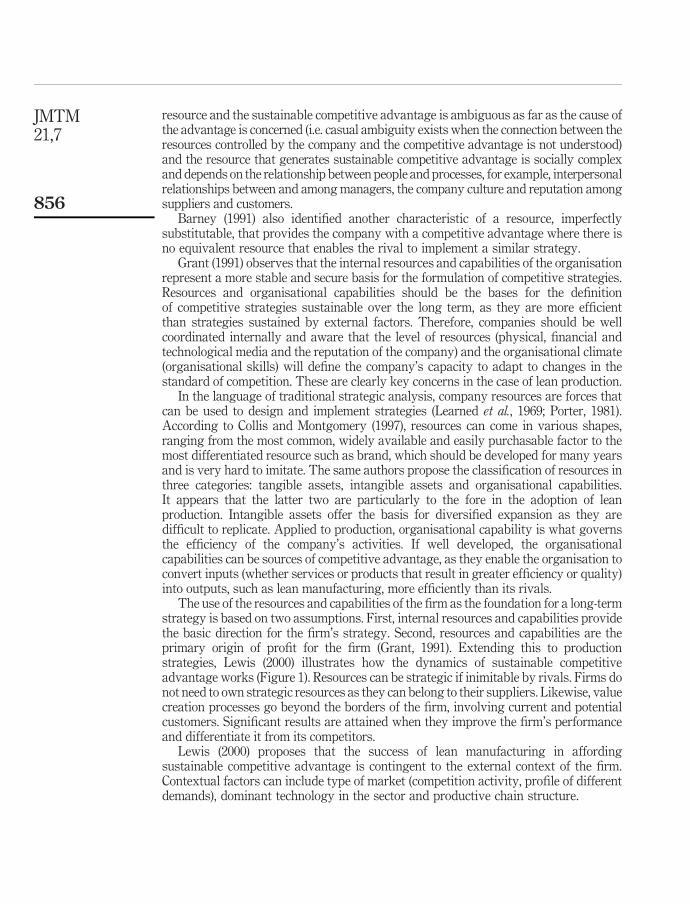
Model and hypothesesThe Soriano-Meier and Forrester (2002) model, shown in Figure 2, tests a set ofhypotheses with respect to lean production. The model refers to the performance ofsenior management in the transformation of the firm through the adoption of leanmanufacturing. On one side, there is the commitment of senior management to investingin manufacturing infrastructure through quality leadership (QLEAD), the formation ofproblem-solving teams, training and empowerment, which means the release ofdecision-making power to levels below. On the other side, there is continuous changethrough the implementation of lean manufacturing concepts including elimination ofwaste (EW), CI, just-in-time ( JIT) deliveries, pulling of materials, multifunctional teams(MFT), decentralization of responsibilities, integration of functions (IF) and verticalinformation system (VIS). With the implementation of these two groups of initiatives,the company becomes leaner and improves its performance.
The study aimed to corroborate three hypotheses using as a base a group of 37Brazilian firms of the agricultural machinery and implements sector. For this, twoquestionnaires were designed and given to the firms. One of the questionnaireswas addressed to the general manager (chief executive officer (CEO), president,
Description Variable
Growth of turnover between 2000 and 2003 ratioturnovGrowth of total assets between 2000 and 2003 rationetassGrowth of sales between 2000 and 2003 ratiovendasGrowth of operating revenue between 2000 and 2003 ratiorecoperGrowth of operating result between 2000 and 2003 ratioresultoperGrowth of result before income tax between 2000 and 2003 ratioresultairGrowth of result for the year between 2000 and 2003 ratioresultexercGrowth of asset turnover between 2000 and 2003 ratioasstur
Source: AuthorsTable I.
Measures of flow
Lean productionin Brazil
859

managing director, etc.) and the second to operations managers (plant manager,operations director, etc.).
The hypotheses tested were as follows:
H1. Companies that say they have a high management degree of commitment tolean manufacturing (measured by commitment to JIT and total qualitymanagement (TQM) programme) simultaneously demonstrate thiscommitment to investments in manufacturing infrastructure (structuralmanufacturing infrastructure (SMI) – human infrastructure that provides
Figure 2.Model 4-C
Management
The company becomes“leaner” and improves
its performance
Source: Soriano-Meier and Forrester (2002)
1. Elimination of waste2. Continuous improvement3. Zero defect4. Just-in-time deliveries5. Pulling of materials6. Multifunctional teams7. Decentralization8. Integration of functions9. Vertical information system
Continuous change towardslean manufacturing
a. Quality leadershipb. Problem-solving teamsc. Trainingd. Empowerment
Continuous managementcommitment towards lean
manufacturing
Description Variable
Growth of turnover value (turnover 2003/total asset 2003) 2 turnover 2000/totalasset 2000)/(turnover 2003/total asset 2003)
turnover
Growth of sales value (sales 2003/total assets 2003) 2 (sales 2000/total asset2000)/(sales 2003/total asset 2003)
sales
Growth of operating revenue value (recoper 2003/total asset 2003) 2 (recoper2000/total asset 2000)/(recoper 2003/total asset 2003)
recoper
Growth of operating result value (resultoper 2003/total asset 2003) 2 (resultoper2000/total asset 2000)/(resultoper 2003/total asset 2003)
resultoper
Growth of value of result before income tax (resultair 2003/total asset2003) 2 (resultair 2000 2 total asset 2000)/(resultair 2003/total asset 2003)
resultair
Growth of value of result for the year (resultexerc 2003/total asset2003) 2 (resultexerc 2000/total asset 2000)/(resultexerc 2003 – total asset 2003)
resultexerc
Growth of value of operating result (resultoper 2003/sales 2003) 2 (resultoper2000/sales 2000)/(resultoper 2003/sales 2000)
resultopervendas
Growth of value of result before income tax (resultair 2003/sales2003) 2 (resultair 2000/sales 2000)/(resultair 2003/sales 2003)
resultairvendas
Growth of value of results for the year (resultexerc 2003/sales2003) 2 (resultexerc 2000/sales 2000)/(resultexerc 2003/sales 2003)
resultexercvendas
Source: AuthorsTable II.Measures of value
JMTM21,7
860

support to manufacturing), measured by QLEAD; problem-solving groups(GROUP); training (TRAIN) and worker empowerment (WEMP).
H2. Companies that allegedly adopt lean manufacturing principles (measured bydegree of adoption (DOA)) have made changes in the direction of theseprinciples (measured by EW, CI, zero defects (ZDs), JIT deliveries, pulling ofmaterial, MFT, decentralization, IF and VIS).
H3. Companies that continuously made investments in the plant infrastructure(SMI) and changes in the direction of lean manufacturing principles are leancompanies, and therefore have better performances than those in transition andthose still working in the traditional model.
The three hypotheses are needed to examine the conceptual structure developed in thisstudy. H1 evaluates the first component of the 4-C model, the degree of managementcommitment to lean manufacturing. H2 analyses the degree of changes made in thedirection of lean manufacturing. H3 associates the first two components, commitment tolean manufacturing and changes in the direction of lean manufacturing, with performance.
Dependent variablesThe dependent variables tested in the model are commitment to JIT, commitment tototal quality management, DOA of the principles of lean manufacturing andperformance (this variable covers both the variables of market share in Basso et al.(2006) and the variables of value creation).
Independent variablesThe independent variables tested in the model are QLEAD, problem-solving group,training, empowerment, EW, CI, ZDs, JIT, pulled instead of pushed, MFT, decentralizationof responsibilities, integrated functions and vertical information system.
5. Analyses and results – testing the hypotheses
H1. Management commitment and investment in manufacturing infrastructure.
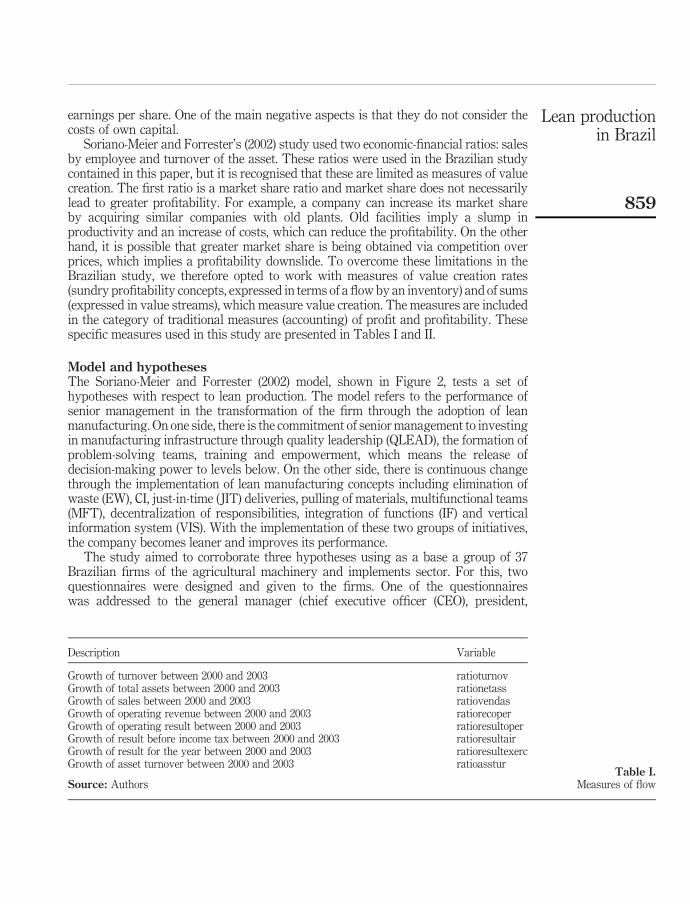
Correlation and multiple regressions were applied to testH1. The hypothesis verifies therelationship between the level of management commitment to the lean manufacturingprogramme (measured by commitment to JIT “Com-to-JIT” and commitment to the TQMprogramme “Com-to-TQM”) and the level of investments made in the manufacturinginfrastructure (measured by “QLEAD”, problem-solving group “GROUP”, training“TRAIN” and empowerment “WEMP”).
The CEOs of the firms surveyed confirmed that 65 per cent (24 out of 37) have anaverage or low level of commitment to the JIT programme. Of these 24, ten (27 per cent)reported an average level of commitment. One of the possible causes for this lowcommitment is that the sector is still in the initial stage of implementation of the leanmanufacturing programme, since as verified during the fact finding, many of thecompanies that started the journey in the direction of lean manufacturing began inaround the year 2000, when strong incentive was provided by the sectoral chamber ofagricultural machinery and implements for companies from the sector to hear about theprogramme. This characteristic could be distorting the vision of the CEO when it isasked whether there is a commitment to JIT.
Lean productionin Brazil
861
Similar to the commitment to JIT, the commitment to TQM is not high: 62 per cent(23 out of 37) declared that the degree of commitment is low, and of these 23, seven(19 per cent) attribute an average level of commitment in relation to TQM. Amongsenior managers, there is an understanding that the programme is still taking its firststeps and that there is still much to be accomplished until to reach a threshold wherethere is a commitment to JIT and to TQM.
Correlation analysisCorrelation among variables is a ratio that ranges from 21 to þ1, indicating the powerof association among them. When positive, between 0 and þ1, it indicates that when avariable increases, the other accompanies the increase in the proportion calculated. Ifthe correlation is negative, between 21 and 0, this indicates that when a variableincreases, the order decreases in the proportion indicated by the value calculated.Therefore, values close to 21 and þ1 indicate that there is a strong relation among thevariables analysed, while values close to 0 show a lesser degree of correlation.
Soriano-Meier and Forrester (2002) emphasized that lean manufacturing can only beobtained with time and is not a tool for short-term problem solving. It is a strategic toolfor improving resource utilisation and growing competitiveness. According to Liker(2004), knowledge about lean manufacturing at Toyota was gradually accumulated byworkers and managers over 20 years in their daily activities through the constantlearning of new methods and variations of methods consolidated on the plant floor.There was no blueprint or documentation of “lean” as a theory upfront. The tacitknowledge acquired was then passed on to the other production units of Toyota andsubsequently also to suppliers.
Sirkin (1999) perceives that correlations in social surveys found above 0.70 are rareand many tend to be in the range 0.0-0.50. As it can be seen in Table III, according tothis statement, the coefficients found for both the dependent variables, commitment toJIT (measured by Com-to-JIT) and commitment to TQM (measured by Com-to-TQM)are located between 0.20 and 0.50 (although some are in the confidence interval of5 per cent and other coefficients in the interval of 1 per cent). This contrasts withresults of the original UK-based survey by Soriano-Meier and Forrester (2002) wherethe correlations were above 0.5. A possible explanation for the low among the variablesanalysed for commitment to TQM in the Brazil agricultural machinery industry is the
1 2 3 4 5 6
Variable Com-to JITCom-to-TQM QLEAD GROUP TRAIN WEMP
1. Commitment to JIT (Com-to-JIT) 1 0.411 ** 0.307 * 0.447 ** 0.381 ** 0.319 *
2. Commitment to TQM(Com-to-TQM) 1 0.538 ** 0.351 * 0.296 * 0.368 *
3. QLEAD 0.443 ** 0.548 ** 0.597 **
4. Problem-solving group (GROUP) 1 0.471 ** 0.33 *
5. Training (TRAIN) 1 0.728 **
6. Empowerment (WEMP) 1
Note: Correlation is significance at *0.05 and **0.01 levels (one tailed)
Table III.Correlation between andamong Com-to-JIT,Com-to-TQM, QLEAD,GROUP, TRAINand WEMP
JMTM21,7
862

very new and recent history of implementation which, according to some interviewees,only truly commenced around the year 2000.
Analysing the data for this study (Table III), there is a strong correlation betweenempowerment and the training given to employees (0.728), which is significant at1 per cent. This indicates that the sector seeks to release decision-making power toemployees as they are trained in the tasks they perform.
The multiple regression analysis was performed with the following purposes:. to verify the degree of relationship between the two dependent variables and the
four independent variables, considered one by one;. to determine the relative importance of each independent variable in the forecast
of the dependent variable; and. to determine the existence of co-linearity effects.
The results show to what extent the dependent variable is explained by each one of theindependent variables. The standardized regression coefficient or the beta coefficient(b) is used to determine the relative importance of each independent variable in thedependent variable (Table IV). It explains the individual contribution that each type ofinvestment in plant infrastructure makes in the commitment to JIT and commitmentto TQM.
As a conclusion, there is support to accept H1 with a basis on the previous analyses,where it was verified that all the 15 variables proved significant at statisticallyacceptable levels.
H2. Companies that allegedly adopt the lean manufacturing principles have madechanges in the direction of these principles.
Correlation and multiple regression analyses were conducted to test H2. Thishypothesis seeks to verify whether the companies that allegedly adopt the leanmanufacturing principles (measured by DOA) have made changes in the direction ofthese principles (measured by “EW”, “CI”, “ZD”, JIT deliveries “JIT”, pulling ofmaterial “PULL”, “MFT”, decentralization “DEC”, “IF” and “VIS”). Paradoxically to thevariables of commitment to JIT and commitment to TQM, where there is a low degreeof commitment, it was verified that for the DOA, 73 per cent of the firms (27 out of 37)have a mean value of four or higher, which indicates a high degree of emphasis on theadoption of the lean manufacturing programme. This perception of DOA of the leanmanufacturing programme is provided by the chief operations officer (COO), andwe can report a convergence and similarity of views among the CEOs and COOs as tothe stage of implementation of the programme at the companies.
F p R 2 adjusted b t p
Model 1 (dependent variable Com-to-TQM)Commitment to TQM (Com-to-TQM) 193.92 0.000 0.843QLEAD 0.697 13.93 0.000Model 2 (dependent variable Com-to-JIT)Commitment to JIT (Com-to-JIT) 97.489 0.000 0.843Problem-solving group (GROUP) 0.562 4.294 0.000Commitment to TQM (Com-to-TQM) 0.342 2.149 0.039
Table IV.Analysis of multiple
regression H1
Lean productionin Brazil
863

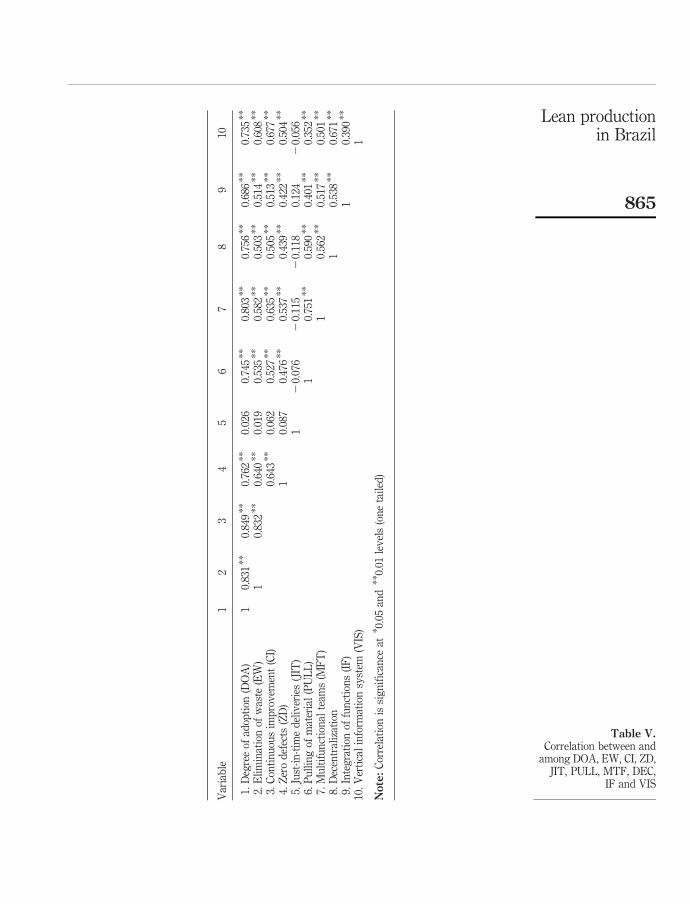
Correlation analysisTable V presents the analysis of correlation between the DOA (measured by DOA) andthe changes in direction of these principles (measured by “EW”, “CI”, “ZD”, JITdeliveries “JIT”, pulling of material “PULL”, “MFT”, decentralization “DEC”, “IF” and“VIS”). In the Soriano-Meier and Forrester’s (2002) study, the variables pulling ofmaterial (PULL) and IF did not appear to be statistically significant; likewise in thisstudy, we also verified the same behaviour in relation to the variable JIT deliveries.
Even with the broad scope of a lean adoption programme, which contemplates allthe areas of the manufacturing process, we can verify that there are significantcorrelations of the DOA of the programme with practically all the variables analysed inthis hypothesis, with the exception of JIT deliveries. The statistical analysis performedcorroborates the acceptance of H2.
H3. Degree of leanness, degree of commitment and the relation with performance.
Using the same techniques adopted for other hypotheses, correlation analyses, analysisof multiple regression, cluster analysis and one-way analysis of variance (ANOVA)were performed, followed by a Tukey honestly significant difference (HSD) test. Thishypothesis verifies the relationship between the degree of leanness (measured by DOL),the degree of commitment to the lean manufacturing programme (measured by DOC)and the performance (measured by PERF).
The degree of leanness (measured by DOL) was obtained through the mean of thevariables that measure the DOA of the lean manufacturing programme, which are EW,CI, ZD, JIT deliveries ( JIT), pulling of material (PULL), MFT, decentralization (DEC),IF and VIS. The variable degree of commitment (measured by DOC) is the mean ofthe variables: QLEAD, problem-solving group (GROUP), training (TRAIN) andempowerment (WEMP). Variable performance (measured by PERF) was measured bya proportion between billing by employee and turnover of assets, in comparison to theyears 2000 and 2003.
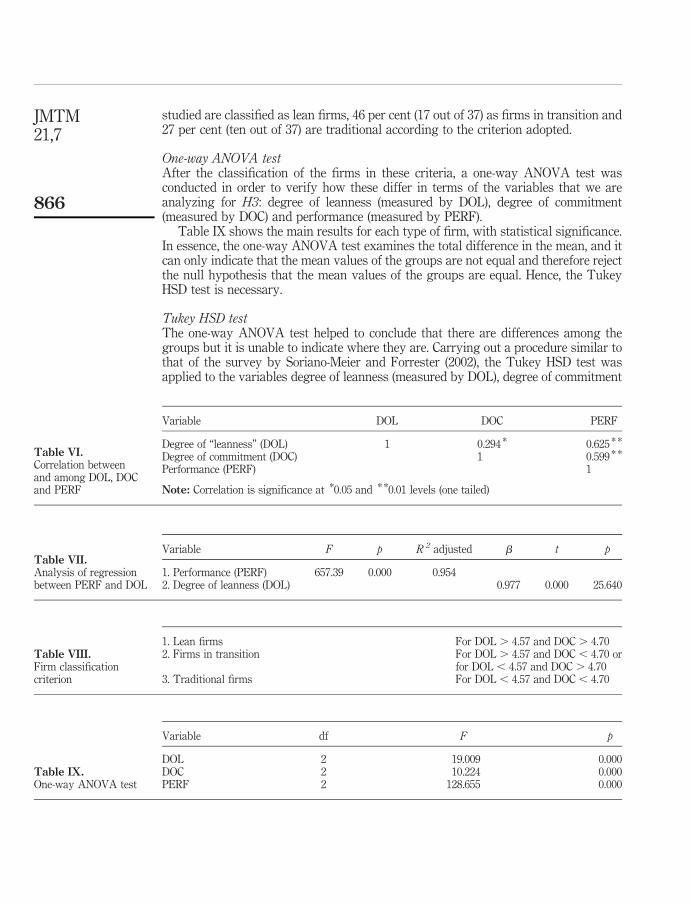
Correlation analysisAs it can be seen in Table VI, all the three variables have high levels of correlation and inaccordance with the parameters to avoid co-linearity do not exceed 0.80. The results ofthis correlation analysis can be considered acceptable. Therefore, the regressionanalysis shown below was performed in order to identify the nature of this relationship.
Regression analysisTable VII shows the result of the regression analysis conducted for the coefficients ofDOL and DOC. We verified that only the variable DOL explains the variable PERF at95 per cent and with high significance ( p , 0.01).
Cluster analysisThe cluster analysis was performed in order to group individuals or objects in clusters;hence, individuals in the same cluster are more alike than individuals in the other cluster.The objective is to maximize the homogeneity of individuals inside the cluster, while thereis also a maximisation of heterogeneity between and among the clusters (Hair et al., 1998).
Table VIII shows the classification of firms into “lean”, “in transition” and“traditional”. The classification reveals that 27 per cent (ten out of 37) of the firms
JMTM21,7
864
Var
iab
le1
23
45
67
89
10
1.D
egre
eof
adop
tion
(DO
A)
10.
831
**
0.84
9*
*0.
762
**
0.02
60.
745
**
0.80
3*
*0.
756
**
0.68
6*
*0.
735
**
2.E
lim
inat
ion
ofw
aste
(EW
)1
0.83
2*
*0.
640
**
0.01
90.
535
**
0.58
2*
*0.
503
**
0.51
4*
*0.
608
**
3.C
onti
nu
ous
imp
rov
emen
t(C
I)0.
643
**
0.06
20.
527
**
0.63
5*
*0.
505
**
0.51
3*
*0.
677
**
4.Z
ero
def
ects
(ZD
)1
0.08
70.
476
**
0.53
7*
*0.
439
**
0.42
2*
*0.
504
**
5.Ju
st-i
n-t
ime
del
iver
ies
(JIT
)1
20.
076
20.
115
20.
118
0.12
42
0.05
66.
Pu
llin
gof
mat
eria
l(P
UL
L)
10.
751
**
0.59
0*
*0.
401
**
0.35
2*
*
7.M
ult
ifu
nct
ion
alte
ams
(MF
T)
10.
562
**
0.51
7*
*0.
501
**
8.D
ecen
tral
izat
ion
10.
538
**
0.67
1*
*
9.In
teg
rati
onof
fun
ctio
ns
(IF
)1
0.39
0*
*
10.
Ver
tica
lin
form
atio
nsy
stem
(VIS
)1
Note:
Cor
rela
tion
issi
gn
ifica
nce
at* 0
.05
and
** 0
.01
lev
els
(on
eta
iled
)
Table V.Correlation between and
among DOA, EW, CI, ZD,JIT, PULL, MTF, DEC,
IF and VIS
Lean productionin Brazil
865
studied are classified as lean firms, 46 per cent (17 out of 37) as firms in transition and27 per cent (ten out of 37) are traditional according to the criterion adopted.
One-way ANOVA testAfter the classification of the firms in these criteria, a one-way ANOVA test wasconducted in order to verify how these differ in terms of the variables that we areanalyzing for H3: degree of leanness (measured by DOL), degree of commitment(measured by DOC) and performance (measured by PERF).
Table IX shows the main results for each type of firm, with statistical significance.In essence, the one-way ANOVA test examines the total difference in the mean, and itcan only indicate that the mean values of the groups are not equal and therefore rejectthe null hypothesis that the mean values of the groups are equal. Hence, the TukeyHSD test is necessary.
Tukey HSD testThe one-way ANOVA test helped to conclude that there are differences among thegroups but it is unable to indicate where they are. Carrying out a procedure similar tothat of the survey by Soriano-Meier and Forrester (2002), the Tukey HSD test wasapplied to the variables degree of leanness (measured by DOL), degree of commitment
Variable DOL DOC PERF
Degree of “leanness” (DOL) 1 0.294 * 0.625 * *
Degree of commitment (DOC) 1 0.599 * *
Performance (PERF) 1
Note: Correlation is significance at *0.05 and * *0.01 levels (one tailed)
Table VI.Correlation betweenand among DOL, DOCand PERF
Variable F p R 2 adjusted b t p
1. Performance (PERF) 657.39 0.000 0.9542. Degree of leanness (DOL) 0.977 0.000 25.640
Table VII.Analysis of regressionbetween PERF and DOL
1. Lean firms For DOL . 4.57 and DOC . 4.702. Firms in transition For DOL . 4.57 and DOC , 4.70 or
for DOL , 4.57 and DOC . 4.703. Traditional firms For DOL , 4.57 and DOC , 4.70
Table VIII.Firm classificationcriterion
Variable df F p
DOL 2 19.009 0.000DOC 2 10.224 0.000PERF 2 128.655 0.000
Table IX.One-way ANOVA test
JMTM21,7
866

(measured by DOC) and performance (measured by PERF). Table X presents thecomparison of the Tukey HSD test for the three variables: degree of leanness (measuredby DOC), degree of commitment (measured by DOC) and performance (measuredby PERF).
The test was aimed to verify whether lean firms have higher significant meanvalues than traditional firms, in the three variables studied in the model, and as it canbe verified in Table X, this is confirmed. Another important analysis was to verifywhether lean firms also have higher mean values than firms in transition, which wasconfirmed in the table, as lean firms have higher statistically significant mean valuesthan firms in transition for the three variables studied. It was concluded that, with abasis on the tests carried out and on the results of the correlations, multiple regressionanalysis, cluster analysis and one-way ANOVA test followed by the Tukey HSD test,the results corroborate H3.
6. ConclusionThe objective of this paper was to study the performance of manufacturing companiesfrom the agricultural machinery sector in Brazil, which strategically opted for theimplementation of lean manufacturing. The variables defined and studied in this paperwere based on the survey by Soriano-Meier and Forrester (2002), where nineindependent variables were defined to measure the DOA of the programme, which wassummarised in a dependent variable-designated degree of leanness. Another metricwas also developed to identify the degree of commitment to the programme. Once thesetwo variables were obtained, the authors verified their relationship with performance,which was measured through the ratios of billing by employee and turnover of assets,calculated using secondary data. A group of 37 firms from the sector of agricultural
Tukey HSDVariable (I) Type ( J) Type Difference of mean values (I 2 J) p
DOL 1 2 0.651 0.0003 0.927 0.000
2 1 20.651 0.0003 0.276 0.130
3 1 20.927 0.0002 20.276 0.130
Degree of commitment (DOC) 1 2 1.095 0.0033 1.510 0.000
2 1 21.095 0.0033 0.415 0.000
3 1 21.510 0.0032 20.415 0.387
Performance (PERF) 1 2 2.212 0.0003 4.700 0.000
2 1 22.212 0.0003 2.488 0.000
3 1 24.700 0.0002 22.488 0.000
Table X.Tukey HSD test
Lean productionin Brazil
867
machinery and implements took part in the survey. Two questionnaires per firm wereapplied: the first for the CEO and the second for the COO.
The agricultural machinery and implements sector are characterized by complex,hard-to-make products often presenting long lead times, facts which might delay orhamper the real benefits of the implementation of lean principles as viable strategyin this particular sector. Correlation and multiple regression analyses were conductedin order to test H1. With a basis on the statistical analyses performed, it was verifiedthat there is enough support to accept H1: firms with a high degree of managementcommitment to the simultaneously support this commitment to investments in supportof the plant infrastructure, measured by QLEAD, problem-solving groups (GROUP),training (TRAIN) and empowerment (WEMP).
However, for H2, it was verified that the relationship of DOA of the model (measuredby DOA) proved significant when compared with the variables: measured by “EW”,“CI”, “ZD”, pulling of materials “PULL”, “MFT”, decentralization “DEC”, “IF” and “VIS”.The relationship with the variable JIT deliveries “JIT” did not prove statisticallysignificant. Although this single variable did not prove statistically significant, it can beaccepted that for the sector of agricultural machinery and implements in Brazil, thishypothesis is true. A possible explanation of this result is the lack of continuous supportby top management – a tendency to view the adoption of lean principles as a short-termpanacea to achieve immediate improvements, thus failing to embrace the real benefits ofthe strategic element of the lean approach. This near term perspective inhibits the longerterm continuous support of lean principles. As a consequence, and in line withSchonberger’s (2008) analogy, waste reduction should not be the dominant lean target.Pursuing lean provides a system that encourages value creation, improves capabilitiesand provides a longer financial health, strategic concerns that tend not to be identifiedwith a short-term view, particularly in this sector.
Finally, correlation analyses, multiple regression, cluster and one-way ANOVAanalyses followed by a Tukey HSD test were applied to test H3: firms that madecontinuous investments in plant infrastructure (SMI) in the direction of the lean principles(measured by degree of leanness “DOL” and DOA “DOC”) have better performances(measured by PERF). With a basis on the data and the analyses proposed, it was verifiedthat the data corroborates the validation of H3.
This paper, therefore, provides a detailed and original analysis of the implementationof lean operations in the agricultural sector in Brazil. It provides a “state of play” in termsof the degree of leanness and the degree of commitment – and the link to businessperformance. The paper demonstrates that the adoption of lean manufacturing is takinggrip within the agricultural machinery and implements sector of Brazilian industry andalso demonstrates that early adopters and those “in transition” to lean have improvedtheir performance and competitiveness over competitors. It is clear that the adoption ofJIT is less central a concern to businesses in Brazil (perhaps due to logistical andgeographical reasons), compared with those in other economies of the world, and so notas central to their interpretation of lean. The paper also shows that the Soriano-Meierand Forrester’s (2002) model is applicable to other industries and economies, beyond theoriginal UK context, for measuring and comparing degrees of leanness. But clearlyfurther investigation is required to understand the drivers for change and adoption inBrazil. So further research will test the model in other sectors of the Brazilian economyand also in the same sector but in different national contexts.
JMTM21,7
868
References
Barney, J. (1991), “Firm resources and sustained competitive advantage”, Journal ofManagement, Vol. 17 No. 1, pp. 99-120.
Basso, L., Shimizu, U. and Nakamura, W. (2006), “Producao Enxuta e Desempenho de Mercado,Uma Analise para o Setor de Maquinas e Implementos Agrıcolas no Brasil”, IX SIMPOI2006, paper presented at: Simposio de Administracao da Producao, Logıstica e OperacoesInternacionais.
Cheng, T. and Podolsky, S. (1996), Just-in-time Manufacturing: An Introduction, 2nd ed.,Chapman & Hall, London.
Collis, D. and Montgomery, C. (1997), Corporate Strategy: A Resource-based Approach,McGraw-Hill, New York, NY.
De Oliveira, E. and Fensterseifer, J. (2003), “Use of resource-based view in industrial clusterstrategic analysis”, International Journal of Operations & Production Management, Vol. 9No. 23, pp. 995-1009.
Goddard, W. (1986), Just-in-time, Oliver Wight, Brattleboro, VT.
Grant, R. (1991), “The resource-based theory of competitive advantage: implications for strategyformulation”, California Management Review, Vol. 33 No. 3, pp. 114-35.
Hair, J.F. Jr, Anderson, R., Totha, R. and Bloch, W. (1998), Multivariate Data Analysis, 5th ed.,Prentice-Hall, Englewood Cliffs, NJ.
Harrison, A. (1992), Just-in-time Manufacturing in Perspective, Prentice-Hall, Hemel Hempstead.
Hines, P., Holweg, M. and Rich, N. (2004), “Learning to evolve: a review of contemporary leanthinking”, International Journal of Operations & Production Management, Vol. 24 No. 10,pp. 994-1011.
Huber, G. (1991), “Organizational learning: the contributing processes and the literature”,Organization Science, Vol. 2 No. 1, pp. 88-115.
Karlsson, C. and Ahlstrom, P. (1996), “Assessing changes towards lean production”,International Journal of Operations & Production Management, Vol. 16 No. 2, pp. 24-41.
Katayama, H. and Bennett, D. (1996), “Lean production in a changing competitive world: aJapanese perspective”, International Journal of Operations & Production Management,Vol. 16 No. 2, pp. 8-23.
Learned, E., Christensen, C., Andrew, K. and Guth, W. (1969),Business Policy, Irwin, Homewood, IL.
Lewis, M. (2000), “Lean production and sustainable competitive advantage”, InternationalJournal of Operations & Production Management, Vol. 20 No. 8, pp. 959-78.
Liker, J. (2004), The Toyota Way – 14 Management Principle from the World’s GreatestManufacturer, McGraw-Hill, New York, NY.
Metalworking Insider Report (2004), “Brazil’s machinery sector launches and export drive”,available at: www.allbusiness.com/manufacturing/fabricated-metal-product-manufacturing/184393-1.html (accessed June 7, 2009).
Monden, Y. (1983), Toyota Production Systems, Industrial Engineering & Management Press,Norcross, GA.
NIST (2000), Principles of Lean Manufacturing with Live Simulation, Manufacturing ExtensionPartnership, National Institute of Standards and Technology, Gaithersburg, MD.
Ohno, T. (1988), The Toyota Production System: Beyond Large-scale Production, ProductivityPress, Portland, OR.
Porter, M. (1981), “The contribution of industrial organization to strategic management”,Academy of Management Review, Vol. 6, pp. 609-20.
Lean productionin Brazil
869

Schonberger, R. (2008), World Class Manufacturing, The Free Press, New York, NY.
Sirkin, M. (1999), Statistics for the Social Sciences, Sage, Thousand Oaks, CA.
Sitkin, S. (1991), “Learning through failure: the strategy of small losses”, in Staw, B. andCummings, L. (Eds), Research in Organizational Behaviour, Vol. 14, JAI Press,New York, NY.
Soriano-Meier, H. and Forrester, P. (2002), “A model for evaluating the degree of leanness ofmanufacturing firms”, Integrated Manufacturing Systems, Vol. 13 No. 2, pp. 104-9.
Williams, K., Haslam, C., Johal, S. and Williams, J. (1994),Cars: Analysis, History, Cases, Berghahn,Oxford.
Womack, J., Jones, D. and Roos, D. (1990),TheMachine that Changed theWorld, Rawson Associates,New York, NY.
Young, D. and O’Byrne, S. (2003), EVA e Gestao Baseada em Valor – Guia Pratico paraImplementacao, Bookman, Porto Alegre.
About the authorsPaul L. Forrester is a Senior Lecturer in Operations Management at the Birmingham BusinessSchool of the University of Birmingham, UK, where he is also the Director of full-time MBA andDipBA programmes. Paul L. Forrester has held various research and teaching appointmentsincluding eight years at Keele University where he became the Director of MBA Programmesand three years prior to joining Birmingham at Aston Business School (Director of part-timeMBA programmes and Convenor of the Technology and Operations Management ResearchGroup). His research interests lie in the strategic, design and organisational issues of managingoperations and projects, the extension of operations management concepts to serviceorganisations and the use of virtual learning for management education. He has supervised anumber of successful PhD projects and has over 30 academic journal and book chapterpublications in addition to over 100 conference papers.
Ullisses Kazumi Shimizu is a Lecturer in Cost Accounting, Planning & Control and ScientificMethodology at Mackenzie University, Brazil. He has 26 years of professional experience in thefinancial area (administration, accounting, planning and control, cost accounting and plantcontrolling) that was acquired while working for a German multinational pharmaceuticalcompany, an American multinational medical devices company and a general private hospital.
Horacio Soriano-Meier is a Senior Lecturer in Operations Management at the NorthamptonBusiness School of the University of Northampton. Horacio Soriano-Meier received his BSc inCivil Engineering in 1978 from the “Universidad Central de Venezuela”, Caracas; his MBA fromBryant College (now Bryant University), Smithfield, USA, in 1985 and his PhD in OperationsManagement at Keele University, UK, in 2001. He has held previous academic posts in the area ofOperations Management in the Universities of Cardiff and Birmingham in the UK, and ULA,UCV and INTEL in Venezuela. Horacio Soriano-Meier has supervised a number of successfulPhD and MSc projects, and prior to his academic career, he worked as an Engineer andManagement Consultant.
Jose Arturo Garza-Reyes is a Lecturer in Manufacturing Engineering at the School ofTechnology of the University of Derby, UK. Jose Arturo Garza-Reyes was graduated in 1998 fromthe Autonoma de Nuevo Leon University (UANL) in Mexico as Mechanical AdministratorEngineer. In 2001, he was graduated as Master in Sciences, with major in Production and Quality,from the same University. In 2003, he was awarded a scholarship from the Mexico’s NationalCouncil of Science and Technology (CONACYT) to pursue a PhD in Manufacturing Systems andOperations Management at the University of Manchester, from where he graduated in 2008. He hasrecently completed an MBA at the Northampton Business School of the University ofNorthampton and is also a certified Six Sigma-Green Belt. Jose Arturo Garza-Reyes has six yearsof industrial experience working as Production Manager, Production Engineer and
JMTM21,7
870
Operations Manager for several international and local companies in the UK and Mexico.Jose Arturo Garza-Reyes is the corresponding author and can be contacted at: [email protected]
Leonardo Fernando Cruz Basso is a Professor at the Universidade Mackenzie and financed byConselho Nacional de Desenvolvimento Cientıfico e Tecnologico, Brazil. He has experience in thefield of economics, with emphasis in economic theory. Fernando Leonardo Cruz Basso’s researchinterests are in exchange rate, monetary economy and money valuation. He graduated from theInstituto Tecnologico da Aeronautica, ITA in 1974 as Mechanical Engineer and specialised inEconomic Theory at the Universidade de Sao Paulo, USP, in 1978. Leonardo Fernando Cruz Bassohas a Master’s degree in Economics from the New School for Social Research (1981), a doctorate inEconomics from the same university (1984) and a post-doctorate from Bielefeld University (1993).
Lean productionin Brazil
871
To purchase reprints of this article please e-mail: [email protected] visit our web site for further details: www.emeraldinsight.com/reprints