laryngeal response to nasal ventilation in nonsedated newborn lambs
TRANSCRIPT
LARYNGEAL RESPONSE TO NASAL VENTILATION
IN NON-SEDATED NEWBORN LAMBS
François Moreau-Bussière*, Nathalie Samson*, Marie St-Hilaire,
Philippe Reix, Joëlle Rouillard Lafond, Élise Nsegbe and Jean-Paul Praud
*co-first-authors; both authors contributed equally to the work
Neonatal Respiratory Research Unit
Departments of Pediatrics and Physiology
Université de Sherbrooke
Present address of Philippe Reix, MD : Department of Pediatrics, Université de Lyon 1,
France
Short title : Active glottal closure during nasal ventilation
Address for correspondenceJean-Paul Praud MD PhD
Departments of Pediatrics and Physiology
Université de Sherbrooke
J1H 5N4 – Quebec, Canada
Email: [email protected]
Phone : 1 819 346 1110, ext 14851
Fax : 1 819 564 5215
Page 1 of 38 Articles in PresS. J Appl Physiol (March 1, 2007). doi:10.1152/japplphysiol.00891.2006
Copyright © 2007 by the American Physiological Society.

2
ABSTRACT
Although endoscopic studies in adult humans have suggested that laryngeal closure can
limit alveolar ventilation during nasal intermittent positive ventilation (nIPPV), there are
no available data regarding glottal muscle activity during nIPPV. In addition, laryngeal
behavior during nIPPV has not been investigated in neonates. The aim of the present
study was to assess laryngeal muscle response to nIPPV in non-sedated newborn
lambs. Nine newborn lambs were instrumented for recording states of alertness,
electrical activity (EMG) of glottal constrictor (thyroarytenoid, TA) and dilator
(cricothyroid, CT) muscles, EMG of the diaphragm (Dia), and mask and tracheal
pressures. Nasal intermittent positive ventilation in pressure support (PS) and volume
control (VC) modes was delivered to the lambs via a nasal mask. Results show that
increasing nIPPV during wakefulness and quiet sleep led to a progressive
disappearance of Dia and CT EMG and to the appearance and subsequent increase in
TA EMG during inspiration, together with an increase in trans-upper airway pressure
(TUAP). On rare occasions, transmission of nIPPV through the glottis was prevented by
complete, active glottal closure, a phenomenon more frequent during active sleep
epochs, when irregular bursts of TA EMG were observed. In conclusion, results of the
present study suggest that active glottal closure develops with nIPPV in non-sedated
lambs, especially in the VC mode. Our observations further suggest that such closure
can limit lung ventilation when raising nIPPV in neonates.
Keywords: thyroarytenoid muscle, cricothyroid muscle, diaphragm, states of
alertness, intermittent positive-pressure ventilation.
Page 2 of 38
3
INTRODUCTION
Nasal intermittent positive pressure ventilation (nIPPV) is increasingly used in the
neonatal period (12) as treatment for respiratory distress syndrome (22), apneas of
prematurity (3, 27) and as a bridge between endotracheal tube ventilation and
spontaneous ventilation (6, 19). Previous studies using endoscopic observations in adult
humans have shown that laryngeal closure can occur during nIPPV, especially in the
volume control (VC) mode (17, 18, 34-36). In addition, laryngeal closure appears to
increase with increasing ventilatory support, together with decreasing sub-glottal
(alveolar) ventilation (40). Such laryngeal behavior is of high clinical importance since it
has been linked to falls in oxygen saturation when increasing nIPPV during sleep in
adult humans (7), and could divert positive pressure from the airways, leading to
increased gastric distension (11). However, although the glottal closure observed
endoscopically during nIPPV suggests an active contraction of glottal constrictor
muscles, there are, to our knowledge, no data on glottal muscle EMG during nIPPV.
Moreover, there are no currently available studies on laryngeal dynamics during nIPPV
in the neonatal period. Thus, the aim of the present study was to test the hypotheses
that 1) glottal narrowing during nIPPV is also present in the neonatal period, especially
in the VC mode; 2) glottal narrowing during nIPPV is due to both an increase in
thyroarytenoid (TA, a glottal constrictor) and a decrease in cricothyroid (CT, a glottal
dilator) muscle electrical activity (EMG). The experiments were conducted in the VC and
pressure support (PS) modes throughout the different states of alertness.
Page 3 of 38
4
MATERIALS AND METHODS
Experiments were conducted in 9 mixed-bred term lambs aged from 3 to 5 days and
weighing 4.2 kg (standard deviation SD 1.2; range 3.1 to 7) on the day of the
experiment. All lambs were born at term by spontaneous vaginal delivery and housed
with their mother in our animal quarters. The study protocol was approved by the ethics
committee of the Université de Sherbrooke for animal care and experimentation.
Surgical preparation
Surgery was performed 1-3 days after birth under general anaesthesia (1 - 2%
Isoflurane + 30 - 50% N2O + 48 – 68% O2). Intramuscular atropine sulphate (0.1 mg/kg)
and ketamine (10 mg/kg) were injected prior to endotracheal intubation. Vital sign
monitoring included electrocardiogram, rectal temperature, pulsed oximetry, end tidal
CO2, venous pH and glycemia. A mixture of dextrose 5%, NaCl 3 mEq/kg/day, KCl 1.5
mEq/kg/day and Ca2+ 2 mEq/kg/day was systematically infused per-operatively. Bipolar
enamelled chrome wire electrodes were inserted into the thyroarytenoid (TA, a glottal
constrictor), cricothyroid (CT, a glottal dilator) and diaphragm (Dia) muscles for recording
electromyographic (EMG) activity (20). Custom-designed electrodes for electro-
encephalogram (EEG), electrooculogram (EOG) and ECG recordings were also
implanted as previously described (39). A custom catheter was inserted between the
third and fourth tracheal rings to record sub-glottal pressure (26). Leads from each
electrode were subcutaneously tunnelled to exit on the back of the lambs. Finally, an
arterial catheter (Insyte, 18GA, Infusion Therapy Systems, Sandy, UT) was inserted into
a radial artery for blood sampling and gas analysis.
Page 4 of 38

5
Post-operative care included daily intramuscular injection of penicillin G (Duplocillin 0.05
ml/kg/day) and gentamicin (5 mg/kg/day) until the end of the experimentation. The
arterial catheter was flushed daily with heparin solution. Lambs were euthanized at the
end of experiments by pentobarbital overdose. Correct electrode positioning was
systematically verified at autopsy.
Experimental equipment
Ventilatory equipment. Nasal ventilation was performed with a Siemens Servo 300
ventilator and Servo Screen (Siemens Corporation, New York, NY) with heated (33ºC)
and humidified air. A custom-made nasal mask was built from a plaster shell filled with
dental paste to fit the muzzle of each lamb as previously described (42). Briefly, the
mask included a double nasal canula, a naso-gastric tube and a plastic catheter for end
tidal CO2 (PETCO2) sampling.
Recording Equipment. Polysomnographic recordings were obtained by using our
custom-designed radiotelemetry system with channels for EEG, electrooculogram
(EOG), electrocardiogram (ECG) and 4 EMGs, as previously described (28, 29). The
raw EMG signals were sampled at 500Hz, rectified and moving-time averaged on 100
ms. Mask pressure (a measure of the level of ventilatory support) and sub-glottal
pressure (a measure of the ventilatory support reaching the lower airways) were
recorded using two calibrated pressure transducers (MP 45-30-871, Validyne,
Northridge, CA). Thoracic and abdominal volume variations were qualitatively assessed
with their sum using respiratory inductance plethysmography (Respitrace, NIMS, Miami
Beach, FL). Arterial hemoglobin O2 saturation (SpO2) was monitored with a probe
attached at the base of the tail (38). PETCO2 was continuously recorded using a CO2
Page 5 of 38

6
analyzer (Capnomac II, Datex-Ohmeda Canada Inc., Mississauga, ON, Canada), with a
50 ml/min flow sampling rate. Arterial blood gases and pH were also measured (IL 1306;
Instrumentation Laboratory, Lexington, MA) and corrected for rectal temperature of the
lamb (1). All signals were recorded on a Power Macintosh 7300 using the Acknowledge
3.2 acquisition software (Biopac Systems, Santa Barbara, CA).
Design of the study
The study was performed without sedation and at least 48 hours after surgery. The
lambs were comfortably positioned in a sling with loose restraints. The study was
designed to allow for simultaneous recording of EEG, EOG, ECG and EMG activity,
variations of sub-glottal and mask pressure, respiratory movements, PETCO2 and SpO2
while using different levels of ventilation in the three different states of alertness. Arterial
blood gases (PaO2, PaCO2, pHa) were measured at each level of ventilation.
Following a first recording with the nasal mask only (no CPAP, i.e., no connection to the
ventilator), ventilatory support was initiated via the nasal mask at CPAP 4 cmH20. Two
ventilatory modes, i.e. pressure support (PS) and volume control (VC), were used in all
lambs in a random order. In the PS mode, three different levels of positive inspiratory
pressure (PIP) were studied, namely 10, 15 and 20 cmH20, while maintaining positive
end expiratory pressure (PEEP) at 4 cmH2O, as used in a previous study in adult
humans (34, 36). The trigger was adjusted in flow mode at the lowest (easiest) stable
setting. In the VC mode, respiratory rate (RR) and tidal volume (VT) were initially set at
the same level as when the lamb was spontaneously breathing with CPAP 4 cmH2O (VC
baseline). Minute ventilation was then successively increased three times (VC #1, VC #2
and VC #3). Following preliminary tests, VC#1 was associated with an increase in RR
Page 6 of 38
7
to 40 or 50 breaths per minute (mean 42, SD 4.2, range 40 to 50) to avoid both auto-
PEEP and rebreathing. VC#2 and VC#3 corresponded to an increase in VT with 15 or 20
ml increments (depending on the lamb’s weight) to a maximum of 23 ml/kg (SD 3.2,
range 18 to 27). Positive end expiratory pressure was maintained at 4 cmH2O
throughout the VC mode experiments. Since stable ventilation has been shown to be
difficult to obtain in the pressure control mode in a previous study (36) and during our
preliminary tests in lambs, this mode was not tested in the present study. Every effort
was made to obtain recordings in wakefulness (W), quiet sleep (QS) and active sleep
(AS) at each level of ventilation. At any given time during experiments, ventilation was
stopped if the following criteria were met: 1) lamb discomfort or agitation; 2) obvious
abdominal distension or presence of liquid reflux via the nasogastric tube; 3) sub-glottal
pressure over 30 cmH2O; 4) presence of auto-PEEP; 5) inability to obtain the three
states of alertness after one hour of continuous recording.
Data analysis
States of alertness. Standard electrophysiological and behavioural criteria were used
to define W, QS and AS, from EEG, EOG and continuous observation (39). Arousal from
QS was characterized by sudden disappearance of high-amplitude, low-frequency
waves on the EEG trace, together with sudden appearance of any EMG activity and
increase in heart rate, whereas arousal from AS was recognized by direct observation of
the lamb and disappearance of intense EOG activity.
Respiratory parameters. For each state of alertness and every ventilatory level, an
observer blinded to the goal and hypothesis of the study selected 20 consecutive
breaths, which had to be preceded and followed by 20 seconds of stable respiratory
Page 7 of 38
8
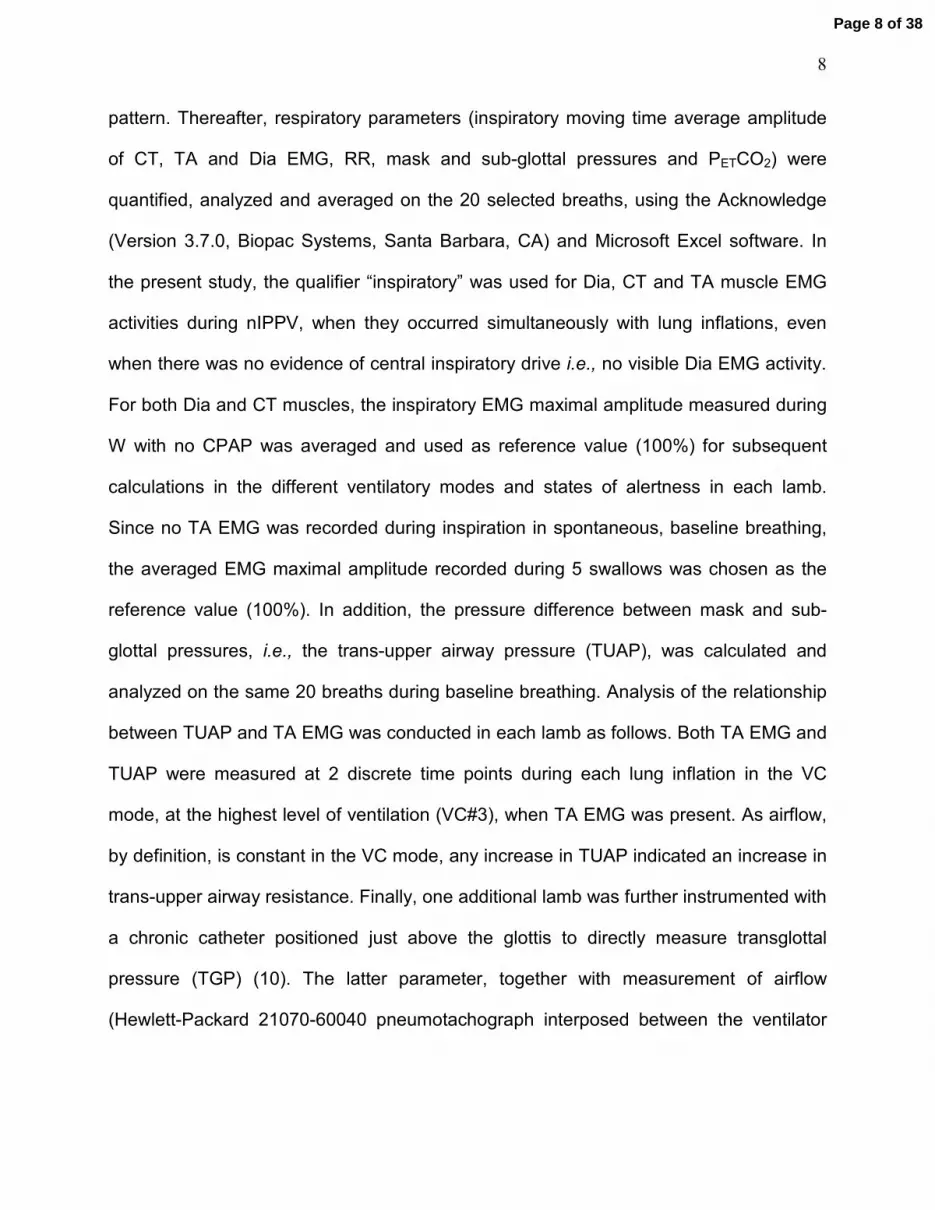
pattern. Thereafter, respiratory parameters (inspiratory moving time average amplitude
of CT, TA and Dia EMG, RR, mask and sub-glottal pressures and PETCO2) were
quantified, analyzed and averaged on the 20 selected breaths, using the Acknowledge
(Version 3.7.0, Biopac Systems, Santa Barbara, CA) and Microsoft Excel software. In
the present study, the qualifier “inspiratory” was used for Dia, CT and TA muscle EMG
activities during nIPPV, when they occurred simultaneously with lung inflations, even
when there was no evidence of central inspiratory drive i.e., no visible Dia EMG activity.
For both Dia and CT muscles, the inspiratory EMG maximal amplitude measured during
W with no CPAP was averaged and used as reference value (100%) for subsequent
calculations in the different ventilatory modes and states of alertness in each lamb.
Since no TA EMG was recorded during inspiration in spontaneous, baseline breathing,
the averaged EMG maximal amplitude recorded during 5 swallows was chosen as the
reference value (100%). In addition, the pressure difference between mask and sub-
glottal pressures, i.e., the trans-upper airway pressure (TUAP), was calculated and
analyzed on the same 20 breaths during baseline breathing. Analysis of the relationship
between TUAP and TA EMG was conducted in each lamb as follows. Both TA EMG and
TUAP were measured at 2 discrete time points during each lung inflation in the VC
mode, at the highest level of ventilation (VC#3), when TA EMG was present. As airflow,
by definition, is constant in the VC mode, any increase in TUAP indicated an increase in
trans-upper airway resistance. Finally, one additional lamb was further instrumented with
a chronic catheter positioned just above the glottis to directly measure transglottal
pressure (TGP) (10). The latter parameter, together with measurement of airflow
(Hewlett-Packard 21070-60040 pneumotachograph interposed between the ventilator
Page 8 of 38

9
and nasal mask) enabled us to study the relationship between trans-glottal resistance
(TGR) (AirflowTGPTGR = ) and TA EMG in VC#3.
Statistical analysis. Statistical analyses were performed using the SAS software
version 9.1 (SAS Institute Inc., Cary, IL). Results were first averaged in each lamb, then
in all lambs as a whole, and expressed as mean and standard deviation (SD). Normality
was first tested using the Shapiro-Wilks test. Blood gases, which assumed a normal
distribution, were analyzed using ANOVA with repeated measures. All the other
analyses (CT, TA and Dia EMG, TUAP and respiratory rate) were performed using the
Poisson regression model with repeated measures (GENMOD procedure). Power
analysis was performed for each variable using the Nquery 4.0 software. Unless
specified, all non-statistically significant results given in this report have been tested
beforehand for at least 80% power. Finally, regression analysis (REG and MIXED
procedures) were also performed for testing the relationship between trans-upper airway
pressure and TA EMG in the VC#3 mode. All results with p value < 0.05 were
considered as statistically significant.
Page 9 of 38
10
RESULTS
Of the nine lambs that underwent surgery, CT and TA muscles could be analyzed in 8
lambs only, due to displacement of the electrodes observed at autopsy in one lamb.
Total duration of polysomnographic recordings analyzed was 2151 min, with a mean
recording time of 239 min (SD 60; range 149 to 369). Mean duration of states of
alertness in each lamb was 187 min (SD 63; range 103 to 330) in W, 47 min (SD 20;
range 18 to 74) in QS and 4 min (SD 5; range 0 to 13) in AS.
Baseline breathing with no CPAP in wakefulness
Regular phasic inspiratory Dia and CT EMG were consistently observed in all lambs
during baseline recording with no CPAP, i.e., with the nasal mask in place but without
the ventilator. In addition, phasic CT EMG was observed during the second part of
expiration (E2) in 4 out of 8 lambs, while consistently absent in the first part of expiration
(E1 or post-inspiratory period). No tonic CT EMG was present during baseline breathing
with no CPAP. While phasic expiratory TA EMG was observed in E1 in 4 out of the 8
lambs studied, TA EMG was consistently absent during both inspiration and E2 in all
lambs. Values for the various respiratory parameters measured during baseline
breathing and during different ventilatory support modes are given in table 1.
Breathing with CPAP 4 during wakefulness
A small but statistically significant decrease in RR was observed with CPAP 4, as
compared to no CPAP (p < 0.0001). No changes in inspiratory Dia EMG was observed
from breathing with no CPAP to CPAP 4 (p = 0.32). In contrast, a significant decrease in
Page 10 of 38
11
inspiratory CT EMG was observed from no CPAP to CPAP 4 (p = 0.03). Inspiratory CT
EMG even disappeared in two of the 8 lambs when breathing with CPAP 4. Small
amplitude, phasic inspiratory TA EMG was observed in one of the 8 lambs with CPAP 4.
A significant decrease in expiratory TA EMG was observed with CPAP 4, as compared
to no CPAP (p = 0.03). Finally, a small but significant increase in inspiratory TUAP was
observed from CPAP 0 to CPAP 4 (p < 0.0001) (table 1).
Pressure support mode in wakefulness
A progressive decrease in RR was observed with each step increase in ventilatory
support. Overall, a 58% decrease in respiratory rate was observed with PS 20/4 as
compared to no CPAP (p < 0.0001). A progressive decrease in Dia EMG was observed
with increasing PS, dropping to half of the values recorded with no CPAP (p < 0.0001).
Similarly, inspiratory CT EMG decreased steadily with every increase in PS and
eventually disappeared in 5 lambs (p < 0.0001). Phasic inspiratory TA EMG appeared
with PS 10/4 (in one lamb) and was eventually observed in 7 of the 8 lambs with PS
20/4 (p < 0.0001) (see figure 1 as an example of EMG changes between no CPAP and
PS 20/4). Meanwhile, expiratory (E1) TA EMG decreased and disappeared, except in 3
lambs where both inspiratory and expiratory (E1) TA EMG were present. Finally, a
significant increase in TUAP was observed from CPAP 0 to PS 20/4 (p = 0.01) (see
table 1 and figure 2 for graphic illustration).
Volume control mode in wakefulness
While RR was maintained virtually constant in the VC mode throughout the experiment,
VT was progressively increased from 56 ml in VC baseline to 89 ml in VC #3. As noted
Page 11 of 38
12
previously in PS mode, both Dia (p = 0.0004) and CT (p < 0.0001) EMG decreased from
no CPAP and from VC baseline to VC #3. Also, inspiratory TA EMG appeared in 7 out of
8 lambs and increased progressively from VC baseline to VC #3 (p = 0.006). Expiratory
(E1) TA EMG was still present in 4 lambs in VC #3 (3 of which already had E1 TA EMG
activity with no CPAP). A major increase in TUAP was progressively observed with
increasing VC, culminating at 17.5 cmH2O on average in VC #3 (p < 0.0001) (see table
1). Interestingly, the pattern of inspiratory TA EMG was different in VC, when compared
to PS. Indeed, the slope of the increase in TA at the onset of inspiration was less abrupt
in VC than in PS. Also, during PS mode, following the early peak of activity at onset of
lung inflation, a decrescendo in inspiratory TA EMG was observed, as opposed to a
more sudden decrease in VC mode (figure 3).
Further analysis showed that the increase in trans-upper airway pressure was
significantly correlated with TA EMG in VC #3 in each lamb, indicating that trans-upper
airway resistance increased simultaneously with TA EMG (p < 0.001) in the VC mode in
each lamb (figure 4A).
End tidal CO2 and arterial blood gases
A slight but statistically significant decrease in PCO2 and PETCO2 was observed when
increasing nasal ventilation in both PS and VC (table 2). While averaged values
remained within normal physiological ranges, PCO2 was outside the normal range in
some lambs. One hypercapnic lamb during no CPAP (PCO2 = 50 Torr) decreased its
PCO2 to 45 Torr in VC#3. Two other lambs went from normocapnia to PCO2 = 32 Torr. A
fourth lamb remained hypercapnic throughout the entire experiments (maximal PCO2 =
Page 12 of 38
13
49 Torr). However, neither TA nor CT EMG evolved differently in lambs with PCO2
values out of the normal range.
Apneas
Twenty-nine central apneas were recorded during the experiments (0.8 apnea/h), with a
mean duration of 8.7 sec (SD 2.9; range 3 to 14.9). Most apneas occurred in W (25/29)
in the PS mode (15/29) and were preceded by a sigh (24/29). Seven apneas occurred
during no CPAP, five during CPAP 4 and finally two in VC mode. No episodes of
periodic breathing were observed in any of the lambs or ventilatory modes.
Influence of the states of alertness
Overall, the majority of results obtained in PS and VC modes in QS were identical to
those obtained in W, including a significant decrease in inspiratory Dia and CT EMG and
a significant increase in both inspiratory TA EMG and TUAP (see table 3). However, low
statistical power precluded any possible comparison of glottal muscle EMG response
between QS and W for the same level of nIPPV in a given ventilatory mode.
No statistical analysis could be performed in AS, due to a lack of sufficient data,
including 4 out of 9 lambs, who did not sleep in AS. Semi-quantitative observations
suggested that Dia EMG was increased in CPAP 4, PS and especially in the VC mode.
In addition, while CT EMG was clearly increased in both inspiration and expiration in all
five lambs in AS, TA EMG did not appear to change, aside from bursts of TA EMG
resembling bursts of non-nutritive swallows. Interestingly, the latter occasionally
occurred simultaneously with ventilator insufflations, leading to a total glottal blockade of
ventilation, with a marked increase in trans-glottal pressure and an absence of
Page 13 of 38
14
inspiratory volume variation on the respiratory plethysmography in VC mode (see figure
5). Complete glottal closure in such cases induced a marked elevation in mask pressure
in the VC mode, from 15 to 20 cmH2O in normal breaths to as high as 55 cmH2O. The
VC mode was also associated with asynchronism between respiration and the ventilator
in 5 out of 8 AS episodes in the VC mode, due to irregular respiratory pattern of the
lambs in AS.
Page 14 of 38
15
DISCUSSION
The present results in lambs indicate that raising nIPPV progressively inhibits phasic
laryngeal dilator EMG and triggers the onset of phasic laryngeal constrictor EMG during
lung inflations in wakefulness and quiet sleep. In addition, our observations further
suggest that modifications in laryngeal muscle EMG are responsible for active glottal
narrowing, which limits lung inflation during nIPPV. The observation that nIPPV is
accompanied by modifications of laryngeal muscle activity is a unique finding and
furthers previous endoscopic reports of glottal narrowing in adult humans. We believe
that such findings are of high physiological interest, and may bear significant
consequences for neonatal respiratory care.
Inspiratory glottal muscle electrical activity during nIPPV
Thyroarytenoid muscle inspiratory activity. When present, phasic respiratory
contraction of the TA muscle normally occurs in early expiration (13, 23, 31, 32, 41, 47).
This has been shown to be especially important in the neonatal period as a braking
mechanism for expiratory lung emptying, ultimately helping the newborn to maintain a
sufficiently high residual functional capacity, thus preventing atelectasis and enhancing
oxygenation (4, 8, 13). Conversely, phasic inspiratory TA EMG is rare with eupneic
breathing (37) and has been observed only in limited experimental or pathological
conditions such as anoxic gasping (15, 30, 46), hypoxia (9), C fiber stimulation by
capsaicin (31), upper airway occlusion (21) or in patients with amyotrophic lateral
sclerosis (16). Consequences and mechanisms of phasic inspiratory TA EMG in the
above conditions are unclear.
Page 15 of 38

16
To our knowledge, the activation of TA EMG with lung inflation during nIPPV is a unique
observation, whose causal mechanisms are likely related to stimulation of extra- and/or
intrathoracic airway receptors by increased transmural pressure. Accordingly, the earlier
onset of TA EMG during lung inflation in the PS vs. the VC mode (see figures 1 and 3)
may be related to the fact that airway pressure peaks earlier in the PS mode. As
recently reviewed (2), available but scarce data suggest that, while stimulation of slow
adapting receptors inhibits TA EMG (5, 13), stimulation of rapidly adapting receptors or
C fibers could enhance phasic TA EMG, although in the expiration phase (14, 45).
Alternatively, increased afferent activity from positive pressure receptors in the upper
airways (pharynx and/or larynx) (33, 43) could be involved in the activation of inspiratory
TA EMG, as suggested by recent results from experiments on isolated larynx in piglets
(44). Involvement of other laryngeal receptors such as “flow” (thermal) receptors (43, 44)
during nIPPV is less likely, since insufflated air utilized in the present study was heated
and humidified. Finally, while passive hyperventilation to hypocapnia using nIPPV has
been shown to activate TA EMG during expiration (24), involvement of this mechanism
would at best be marginal. Indeed, even if PCO2 was slightly decreased in a few lambs,
the increase in TA EMG was similar in lambs with or without any change in PCO2.
Cricothyroid muscle inspiratory activity. As recently shown in both humans and
lambs, CT muscle acts as a glottal dilator in phase with the posterior cricoarytenoid
muscle during inspiration (25, 32, 41). The present results showing disappearance of
inspiratory CT EMG in newborn lambs in both PS and VC modes extend similar
observations in adult humans during nIPPV in the PS mode (24). Disappearance of
phasic inspiratory Dia and CT EMG is likely, or at least partly, related to the increase in
Page 16 of 38

17
vagal afferent activity from bronchopulmonary stretch receptors (2). Reflexes originating
from the upper airways can also be at play, secondary to loss of negative inspiratory
pressure. Indeed, this negative inspiratory pressure normally increases posterior
cricoarytenoid muscle activity in eupneic breathing (44). Finally, while passive
hypocapnia reduces inspiratory CT EMG (24), this mechanism is most likely not involved
in the present study, as explained previously for TA EMG.
Active inspiratory glottal narrowing during nIPPV
The present observations of both enhanced TA and decreased CT EMG during lung
inflations strongly suggest that the glottis is actively narrowed in inspiration during
nIPPV, as previously hypothesized from endoscopic observations during nIPPV in the
VC mode in adult humans (40). The simultaneous increase in TA EMG and trans-upper
airway pressure (TUAP) observed in all lambs at constant airflow in the VC mode
indicates that upper airway resistance is increased with TA EMG during lung inflation.
This increase in upper airway resistance could theoretically be related to active
contraction of pharyngeal constrictor muscles, e.g., at the velopharyngeal level, or to
passive mechanisms such as narrowing of the pliable laryngeal inlet due to the Venturi
effect. However, several evidences strongly suggest that active glottal closure is at least
partly responsible for the increase in upper airway resistance. Firstly, this study provides
one example in which that trans-glottal resistance increases with TA EMG during
inflation in the VC mode (see figure 4B). Secondly, previous endoscopic observations in
adult humans have shown that the glottis narrows in inspiration during nIPPV in the VC
mode (17, 18). Finally, the existence of a complete stoppage in pressure transmission
Page 17 of 38

18
throughout the upper airways during the burst in TA EMG activity in AS, as shown in
figure 5, strongly suggests an active mechanism.
Increased laryngeal resistance during lung inflation in nIPPV may consequently limit
lung ventilation with increasing levels of nIPPV, especially in the VC mode. This is
readily apparent in the one lamb illustrated in figure 4B during wakefulness, with lower
tidal volume when both TA EMG and trans-glottal pressures are higher. In addition,
bursts of TA EMG during AS were at times strong enough to totally prevent transmission
of ventilator insufflations to the trachea (Figure 5). Though such bursts of TA EMG have
already been reported in adult humans during eupnea (23) and in newborn lambs during
nIPPV (42), their relation with effective ventilation has not previously been discussed.
Furthermore, such limitation of pressure transmission across the glottis may further
increase the risk of gastric dilation and digestive perforations in newborns (11).
While we were not able to compare the PS and VC mode with regards to glottal
resistance during lung inflations, some observations are nonetheless noteworthy.
Indeed, as previously described, TA EMG in PS mode in all lambs was maximal in early
inspiration and progressively decreased to zero before the end of inspiration (see figure
1), allowing prolonged transmission of constant ventilator pressure through the open
glottis. Conversely, TA EMG in VC mode increased in parallel with ventilator pressure
throughout inspiration, which suggests that glottal resistance was maximal when
ventilator pressure peaked at the end of inspiration. In addition, pressure transmission
across the glottis was further impeded in VC mode by a much shorter inspiratory
duration, comparatively to the PS mode (see figure 3). While these observations could
explain the important differences in TUAP between the PS and VC modes (2.3 and 17.5
cm H2O respectively, see table 1), it is clear that a definitive assessment regarding the
Page 18 of 38
19
superiority of one nIPPV mode vs. the other in achieving lung ventilation in the newborn
cannot conclusively be reached from the present results.
In conclusion, the present study shows that nIPPV, in either the PS or VC mode,
induces both an inspiratory increase in glottal constrictor EMG and a decrease in glottal
dilator EMG in lambs. Presence of this active glottal narrowing significantly limits lung
ventilation, especially in the VC mode.
Page 19 of 38

20
ACKNOWLEDGEMENTS
The authors wish to acknowledge Christophe Grenier and Christine Mayrand-Charette
for their technical assistance as well as Robert Black (PhD in Biostatistics) and Marie-
Pierre Garant (MSc in Biostatistics) for their invaluable help for the statistical analyses.
François Moreau-Bussière was a MD-MSc scholar of the Fonds de la recherche en
santé du Québec at the time of the study. Jean-Paul Praud is a national scholar of the
Fonds de la recherche en santé du Québec. This work was supported by the Canadian
Institutes for Health Research (FRN 15558) and the Foundation for Research into
Children’s Diseases.
Page 20 of 38

21
REFERENCES
1. Andritsch RF, Muravchick S and Gold MI. Temperature correction of arterial blood-
gas parameters: A comparative review of methodology. Anesthesiology 55: 3: 311-316,
1981.
2. Bailey EF and Fregosi RF. Modulation of Upper Airway Muscle Activities by
Broncho-Pulmonary Afferents. J.Appl.Physiol. 2006.
3. Barrington KJ, Bull D and Finer NN. Randomized trial of nasal synchronized
intermittent mandatory ventilation compared with continuous positive airway pressure
after extubation of very low birth weight infants. Pediatrics 107: 4: 638-641, 2001.
4. Bartlett D,Jr. Respiratory functions of the larynx. Physiol.Rev. 69: 1: 33-57, 1989.
5. Bartlett D,Jr, Remmers JE and Gautier H. Laryngeal regulation of respiratory
airflow. Respir.Physiol. 18: 2: 194-204, 1973.
6. Davis PG, Lemyre B and de Paoli AG. Nasal intermittent positive pressure
ventilation (NIPPV) versus nasal continuous positive airway pressure (NCPAP) for
preterm neonates after extubation. Cochrane Database Syst.Rev. 3: 003212, 2001.
7. Delguste P, Aubert-Tulkens G and Rodenstein DO. Upper airway obstruction
during nasal intermittent positive-pressure hyperventilation in sleep. Lancet 338: 8778:
1295-1297, 1991.
Page 21 of 38

22
8. Diaz V, Kianicka I, Letourneau P and Praud JP. Inferior pharyngeal constrictor
electromyographic activity during permeability pulmonary edema in lambs.
J.Appl.Physiol. 81: 4: 1598-1604, 1996.
9. Dutschmann M and Paton JF. Trigeminal reflex regulation of the glottis depends on
central glycinergic inhibition in the rat. Am.J.Physiol.Regul.Integr.Comp.Physiol. 282: 4:
R999-R1005, 2002.
10. Fortier PH, Reix P, Arsenault J, Dorion D and Praud JP. Active upper airway
closure during induced central apneas in lambs is complete at the laryngeal level only.
J.Appl.Physiol. 95: 1: 97-103, 2003.
11. Garland JS, Nelson DB, Rice T and Neu J. Increased risk of gastrointestinal
perforations in neonates mechanically ventilated with either face mask or nasal prongs.
Pediatrics 76: 3: 406-410, 1985.
12. Goldbart AD and Gozal D. Non-invasive ventilation in preterm infants.
Pediatr.Pulmonol.Suppl. 26: 158-161, 2004.
13. Harding R, England SJ, Stradling JR, Kozar LF and Phillipson EA. Respiratory
activity of laryngeal muscles in awake and sleeping dogs. Respir.Physiol. 66: 3: 315-
326, 1986.
14. Holmes HR and Remmers JE. Stimulation of vagal C-fibers alters timing and
distribution of respiratory motor output in cats. J.Appl.Physiol. 67: 6: 2249-2256, 1989.
Page 22 of 38

23
15. Hutchison AA, Burchfield DJ, Wozniak JA and Mohrman SJ. Laryngeal muscle
activities with cerebral hypoxia-ischemia in newborn lambs. Am.J.Respir.Crit.Care Med.
166: 1: 85-91, 2002.
16. Isozaki E, Osanai R, Horiguchi S, Hayashida T, Hirose K and Tanabe H.
Laryngeal electromyography with separated surface electrodes in patients with multiple
system atrophy presenting with vocal cord paralysis. J.Neurol. 241: 9: 551-556, 1994.
17. Jounieaux V, Aubert G, Dury M, Delguste P and Rodenstein DO. Effects of nasal
positive-pressure hyperventilation on the glottis in normal awake subjects.
J.Appl.Physiol. 79: 1: 176-185, 1995.
18. Jounieaux V, Aubert G, Dury M, Delguste P and Rodenstein DO. Effects of nasal
positive-pressure hyperventilation on the glottis in normal sleeping subjects.
J.Appl.Physiol. 79: 1: 186-193, 1995.
19. Khalaf MN, Brodsky N, Hurley J and Bhandari V. A prospective randomized,
controlled trial comparing synchronized nasal intermittent positive pressure ventilation
versus nasal continuous positive airway pressure as modes of extubation. Pediatrics
108: 1: 13-17, 2001.
20. Kianicka I, Leroux JF and Praud JP. Thyroarytenoid muscle activity during
hypocapnic central apneas in awake nonsedated lambs. J.Appl.Physiol. 76: 3: 1262-
1268, 1994.
21. Kianicka I and Praud JP. Influence of sleep states on laryngeal and abdominal
muscle response to upper airway occlusion in lambs. Pediatr.Res. 41: 6: 862-871, 1997.
Page 23 of 38
24
22. Kieffer F, Magny J- and Voyer M. Ventilation nasale chez le nouveau-né. In:
Ventilation artificielle chez le nouveau-né et l'enfant, edited by Devictor D, Hubert P and
Moriette G. Paris: Arnette Blackwell, 1997, p. 149-155.
23. Kuna ST, Insalaco G and Woodson GE. Thyroarytenoid muscle activity during
wakefulness and sleep in normal adults. J.Appl.Physiol. 65: 3: 1332-1339, 1988.
24. Kuna ST, McCarthy MP and Smickley JS. Laryngeal response to passively
induced hypocapnia during NREM sleep in normal adult humans. J.Appl.Physiol. 75: 3:
1088-1096, 1993.
25. Kuna ST, Smickley JS, Vanoye CR and McMillan TH. Cricothyroid muscle activity
during sleep in normal adult humans. J.Appl.Physiol. 76: 6: 2326-2332, 1994.
26. Lemaire D, Letourneau P, Dorion D and Praud JP. Complete glottic closure during
central apnea in lambs. J.Otolaryngol. 28: 1: 13-19, 1999.
27. Lemyre B, Davis PG and de Paoli AG. Nasal intermittent positive pressure
ventilation (NIPPV) versus nasal continuous positive airway pressure (NCPAP) for
apnea of prematurity. Cochrane Database Syst.Rev. 1: 002272, 2002.
28. Letourneau P, Dumont S, Kianicka I, Diaz V, Dorion D, Drolet R and Praud JP.
Radiotelemetry system for apnea study in lambs. Respir.Physiol. 116: 1: 85-93, 1999.
29. Letourneau P and Praud JP. A radiotelemetry system for polysomnographic
recordings in lambs. Methods 30: 2: 115-121, 2003.
Page 24 of 38

25
30. Lieske SP, Thoby-Brisson M, Telgkamp P and Ramirez JM. Reconfiguration of
the neural network controlling multiple breathing patterns: eupnea, sighs and gasps.
Nat.Neurosci. 3: 6: 600-607, 2000.
31. Lu IJ, Lee KZ, Lin JT and Hwang JC. Capsaicin administration inhibits the
abducent branch but excites the thyroarytenoid branch of the recurrent laryngeal nerves
in the rat. J.Appl.Physiol. 98: 5: 1646-1652, 2005.
32. Ludlow CL. Central nervous system control of the laryngeal muscles in humans.
Respir.Physiolo Neurobiol. 147: 2-3: 205-222, 2005.
33. Mathew OP, Sant'Ambrogio G, Fisher JT and Sant'Ambrogio FB. Laryngeal
pressure receptors. Respir.Physiol. 57: 1: 113-122, 1984.
34. Parreira VF, Delguste P, Jounieaux V, Aubert G, Dury M and Rodenstein DO.
Effectiveness of controlled and spontaneous modes in nasal two-level positive pressure
ventilation in awake and asleep normal subjects. Chest 112: 5: 1267-1277, 1997.
35. Parreira VF, Delguste P, Jounieaux V, Aubert G, Dury M and Rodenstein DO.
Glottic aperture and effective minute ventilation during nasal two-level positive pressure
ventilation in spontaneous mode. Am.J.Respir.Crit.Care Med. 154: 6 Pt 1: 1857-1863,
1996.
36. Parreira VF, Jounieaux V, Aubert G, Dury M, Delguste PE and Rodenstein DO.
Nasal two-level positive-pressure ventilation in normal subjects. Effects of the glottis and
ventilation. Am.J.Respir.Crit.Care Med. 153: 5: 1616-1623, 1996.
Page 25 of 38
26
37. Praud JP, Kianicka I, Leroux JF and Dalle D. Laryngeal response to hypoxia in
awake lambs during the first postnatal days. Pediatr.Res. 37: 4 Pt 1: 482-488, 1995.
38. Reix P, Dumont S, Duvareille C, Cyr J, Moreau-Bussiere F, Arsenault J and
Praud JP. Monitoring pulse oximetry via radiotelemetry in freely-moving lambs.
Respir.Physiolo Neurobiol. 147: 1: 65-72, 2005.
39. Renolleau S, Letourneau P, Niyonsenga T, Praud JP and Gagne B.
Thyroarytenoid muscle electrical activity during spontaneous apneas in preterm lambs.
Am.J.Respir.Crit.Care Med. 159: 5 Pt 1: 1396-1404, 1999.
40. Rodenstein DO. The Upper Airway in Noninvasive Ventilation. In: Long-Term
Mechanical Ventilation, edited by Hill NS. New York: Marcel Dekker, 2001, chapt. 5, p.
87-103.
41. Samson N, Lafond JR, Moreau-Bussiere F, Reix P and Praud JP. Cricothyroid
muscle electrical activity during respiration and apneas in lambs.
Respir.Physiol.Neurobiol. 2006.
42. Samson N, St-Hilaire M, Nsegbe E, Reix P, Moreau-Bussiere F and Praud JP.
Effect of nasal continuous or intermittent positive airway pressure on nonnutritive
swallowing in the newborn lamb. J.Appl.Physiol. 99: 5: 1636-1642, 2005.
43. Sant'Ambrogio G, Mathew OP, Fisher JT and Sant'Ambrogio FB. Laryngeal
receptors responding to transmural pressure, airflow and local muscle activity.
Respir.Physiol. 54: 3: 317-330, 1983.
Page 26 of 38

27
44. Stella MH and England SJ. Modulation of laryngeal and respiratory pump muscle
activities with upper airway pressure and flow. J.Appl.Physiol. 91: 2: 897-904, 2001.
45. Stransky A, Szereda-Przestaszewska M and Widdicombe JG. The effects of lung
reflexes on laryngeal resistance and motoneurone discharge. J.Physiol.(Lond) 231: 3:
417-438, 1973.
46. Thuot F, Lemaire D, Dorion D, Letourneau P and Praud JP. Active glottal closure
during anoxic gasping in lambs. Respir.Physiol. 128: 2: 205-218, 2001.
47. Zhou D, Huang Q, St John WM and Bartlett D,Jr. Respiratory activities of
intralaryngeal branches of the recurrent laryngeal nerve. J.Appl.Physiol. 67: 3: 1171-
1178, 1989.
Page 27 of 38

28
TABLES
Table 1: Respiratory parameters during no CPAP, CPAP 4 cmH2O and nasal intermittent positive pressureventilation in wakefulness
CT inspi EMG TA inspi EMG Dia inspi EMG Inspi TUAP (cm H20) RR (breaths / min)
No CPAP 1 0 1 -0.2 (0.5; -1.1-+0.6) b,c,e 40 (11;24-56) b,c,d,e
CPAP 4 0.58 (0.44; 0.18-1.54) a,d,e 0 0.9 (0.2; 0.7-1.3) c,d,e 1.1 (0.4; 0.5-1.7) e 35 (8;25-44) d,e
PS 10 /4 0.34 (0.23; 0.11-0.78) a,d,e 0.07 (0.05; 0.03-0.20) a,d,e 0.7 (0.3; 0.3-1.1) a,d,e 1.1 (1.0; 0.1-3.1) e 34 (8;25-45) d,e
PS 15 /4 0.27 (0.18; 0.12-0.68) a 0.14 (0.09; 0.06-0.34) a,b,e 0.4 (0.2; 0.2-0.7) a,e 1.5 (2.5; 0.0-8.1) 25 (9;14-37) e
PS 20 /4 0.25 (0.09; 0.17-0.46) a 0.29 (0.17; 0.06-0.53) a,b 0.5( 0.2; 0.3-0.7) a 2.3 (1.6; 0.2-5.4) 17 (6;9-26)
VC base 0.59 (0.45; 0.10-1.40) a,g,h,i 0.10 (0.08; 0.03-0.24) i 0.8 (0.3; 0.4-1.3) g,h,i 3.9 (2.4; 1.4-9.7) a,h,i 40 (8;30-53)
VC # 1 0.38 (0.41; 0.11-1.22) a,h,i 0.17( 0.16; 0.04-0.45) a 0.4 (0.2; 0.2-0.7) a 6.7 (4.8; 2.6-18.1) a,h,i 41 (2;40-45)
VC # 2 0.18 (0.10; 0.08-0.37) a 0.20 (0.14; 0.04-0.44) a 0.4 (0.1; 0.1-0.6) a 10.4 (2.6; 6.7-14.3) a,i 41 (3; 40-50)
VC # 3 0.21 (0.08; 0.08-0.35) a 0.26 (0.17; 0.05-0.53) a 0.5 (0.3; 0.1-1.2) a 17.5 (5.5; 10.6-25-8) a 40 (5;30-50)
RR : respiratory rate; Dia, CT, TA inspi EMG : diaphragm, cricothyroid, thyroarytenoid phasic inspiratory electrical activity;TUAP : trans upper airway pressure; CPAP : continuous positive airway pressure; PS : pressure support; VC : volumecontrol ventilation.All superscript letters are P < 0.05 : a vs. no CPAP ; b vs. CPAP4 ; c vs. PS 10 / 4 ; d vs. PS 15 /4 ; e vs. PS 20 / 4 ; f vs. VCbase ; g vs. VC # 1 ; h vs. VC # 2 ; I vs. VC # 3.
Page 28 of 38
29
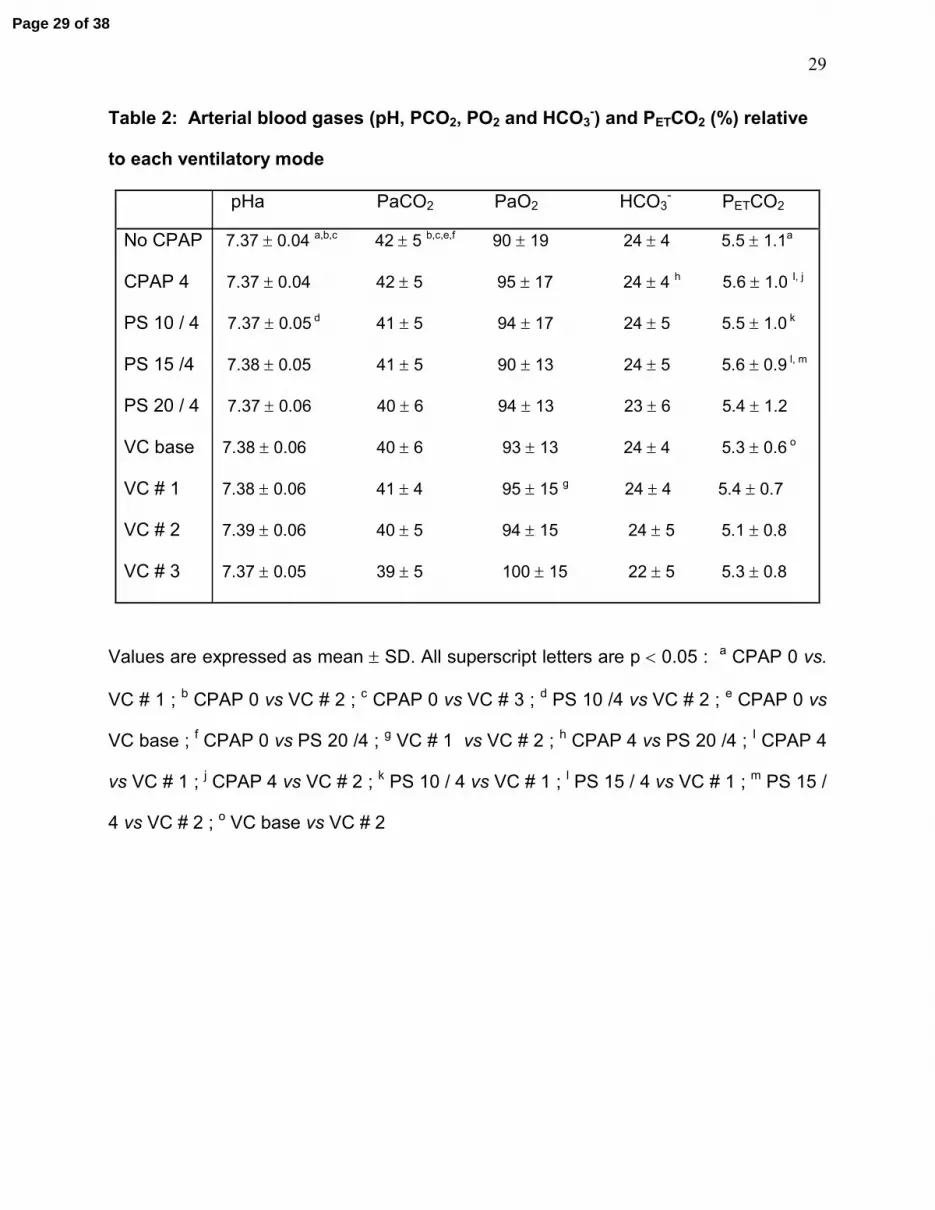
Table 2: Arterial blood gases (pH, PCO2, PO2 and HCO3-) and PETCO2 (%) relative
to each ventilatory mode
pHa PaCO2 PaO2 HCO3- PETCO2
No CPAP 7.37 ± 0.04 a,b,c 42 ± 5 b,c,e,f 90 ± 19 24 ± 4 5.5 ± 1.1a
CPAP 4 7.37 ± 0.04 42 ± 5 95 ± 17 24 ± 4 h 5.6 ± 1.0 I, j
PS 10 / 4 7.37 ± 0.05 d 41 ± 5 94 ± 17 24 ± 5 5.5 ± 1.0 k
PS 15 /4 7.38 ± 0.05 41 ± 5 90 ± 13 24 ± 5 5.6 ± 0.9 l, m
PS 20 / 4 7.37 ± 0.06 40 ± 6 94 ± 13 23 ± 6 5.4 ± 1.2
VC base 7.38 ± 0.06 40 ± 6 93 ± 13 24 ± 4 5.3 ± 0.6 o
VC # 1 7.38 ± 0.06 41 ± 4 95 ± 15 g 24 ± 4 5.4 ± 0.7
VC # 2 7.39 ± 0.06 40 ± 5 94 ± 15 24 ± 5 5.1 ± 0.8
VC # 3 7.37 ± 0.05 39 ± 5 100 ± 15 22 ± 5 5.3 ± 0.8
Values are expressed as mean ± SD. All superscript letters are p < 0.05 : a CPAP 0 vs.
VC # 1 ; b CPAP 0 vs VC # 2 ; c CPAP 0 vs VC # 3 ; d PS 10 /4 vs VC # 2 ; e CPAP 0 vs
VC base ; f CPAP 0 vs PS 20 /4 ; g VC # 1 vs VC # 2 ; h CPAP 4 vs PS 20 /4 ; I CPAP 4
vs VC # 1 ; j CPAP 4 vs VC # 2 ; k PS 10 / 4 vs VC # 1 ; l PS 15 / 4 vs VC # 1 ; m PS 15 /
4 vs VC # 2 ; o VC base vs VC # 2
Page 29 of 38

30
Table 3: Respiratory parameters during no CPAP, CPAP 4 cm H2O and nasal intermittent positive pressureventilation in quiet sleep
CT inspi EMG TA inspi EMG Dia inspi EMG Inspi TUAP (cm H20) RR (breaths / min)
No CPAP 0.85 (0.18;0.66-1.07) b,c,d,e 0 e 1.1 (0.2;0.8-1.5) b,c,d,e -0.7 (1.2; -2.5-+0.6) b,c,d,e 42 (9;29-53) b,c,d,e
CPAP 4 0.41 (0.27;0.16-0.92) c,d,e 0 d,e 0.8 (0.2;0.6-1.2) c,d,e 1.1 (0.6;0.4-2.3) c 35 (10;24-51) d,e
PS 10 /4 0.26 (0.25; 0.10-0.85) 0.07 (0.06;0.02-0.22) e 0.6 (0.2;0.3-.09) 0.7 (0.7;0.1-2.4) 33 (9;24-47) d,e
PS 15 /4 0.22 (0.08;0.11-0.36) 0.13 (0.08;0.05-0.29) 0.5 (0.3;0.1-1.1) 0.8 (0.7:0.0-2.5) e 25 (8;13-37) e
PS 20 /4 0.21 (0.13;0.04-0.35) 0.20 (0.19;0.02-0.48) 0.4 (0.3;0.1-0.7) 1.8 (1.3;0.7-4.2) 16 (4;10-21)
VC base 0.52 (0.50;0.11-1.35) h,i 0.08 (0.06;0.03-0.20) i 0.9 (0.5;0.3-1.7) g,h,i 3.3 (1.1;1.9-5.1) a,g,h,i 40 (9;31-54)
VC # 1 0.39 (0.57;0.09-1.67) 0.13 (0.10;0.04-0.31) i 0.4 (0.1;0.3-0.7) a,i 6.7 (3.9;2.7-14.4) a,h,i 40 (1;38-40)
VC # 2 0.21 (0.08;0.09-0.28) a,i 0.10 (0.02;0.09-0.13) i 0.3 (0.2;0.1-0.5) a 9.8 (1.9;7.7-11.9) a,i 40 (0;40)
VC # 3 0.18 (0.06;0.09-0.21) a 0.29 (0.17;0.17-0.48) a 0.3 (0.1;0.1-0.4) a 17.6 (4.4;13.4-23.6) a 38 (5;30-40)
RR : respiratory rate; Dia, CT, TA inspi EMG : diaphragm, cricothyroid, thyroarytenoid phasic inspiratory electrical activity;TUAP : trans upper airway pressure; CPAP : continuous positive airway pressure; PS : pressure support; VC : volumecontrol ventilation. Note that the statistical power is < 80% for Dia, CT and TA inspi EMG in VC baseline and VC #3.All superscript letters are P < 0.05 : a vs. no CPAP ; b vs. CPAP4 ; c vs. PS 10 / 4 ; d vs. PS 15 /4 ; e vs. PS 20 / 4 ; f vs. VCbase ; g vs. VC # 1 ; h vs. VC # 2 ; I vs. VC # 3.
Page 30 of 38

31
FIGURE LEGENDS :
Figure 1: Electrical activities of thyroarytenoid, cricothyroid and diaphragm muscles
during nasal intermittent positive pressure ventilation (left: no CPAP; right: pressure
support 20 / 4) during wakefulness. Nasal ventilation inhibits diaphragm and CT EMG
and triggers inspiratory TA EMG, which limits sub-glottal (tracheal) pressure until late
inspiration. Abbreviations: TA: thyroarythenoid muscle EMG; ∫TA: moving time averaged
TA; CT: cricothyroid muscle EMG; ∫CT: moving time averaged CT; Dia: diaphragm
muscle EMG; ∫Dia: moving time averaged Dia; Pulmonary volumes: sum signal of the
respiratory inductance plethysmograph (inspiratory upwards). Inspiration (i) and
expiration (e) are delimited according to lung inflation duration.
Figure 2: Variations in inspiratory cricothyroid (CT, left), thyroarytenoid (TA, center) and
diaphragm (Dia, right) EMG from baseline breathing to nasal intermittent positive
pressure ventilation in the pressure support (top diagrams, A) and volume control
(bottom diagrams, B) modes. The x axis represents varying levels of ventilation while
the y axis represents the % of variation from baseline activity (CT and Dia) or % of
maximal activity during swallowing (TA) as defined in data analysis.
Figure 3: Differences in respiratory parameters between pressure support (left) and
volume control modes (right) during wakefulness. Note: 1) the sudden increase in TA
EMG in pressure support compared to a progressive increase in volume control mode;
2) the disappearance of TA EMG in late inspiration in pressure support compared to
continuous TA EMG throughout inspiration in volume control mode; 3) the sub-glottal
Page 31 of 38
32
pressure plateau in late inspiration in pressure support, which is not observed in volume
control mode. See figure 1 for abbreviations.
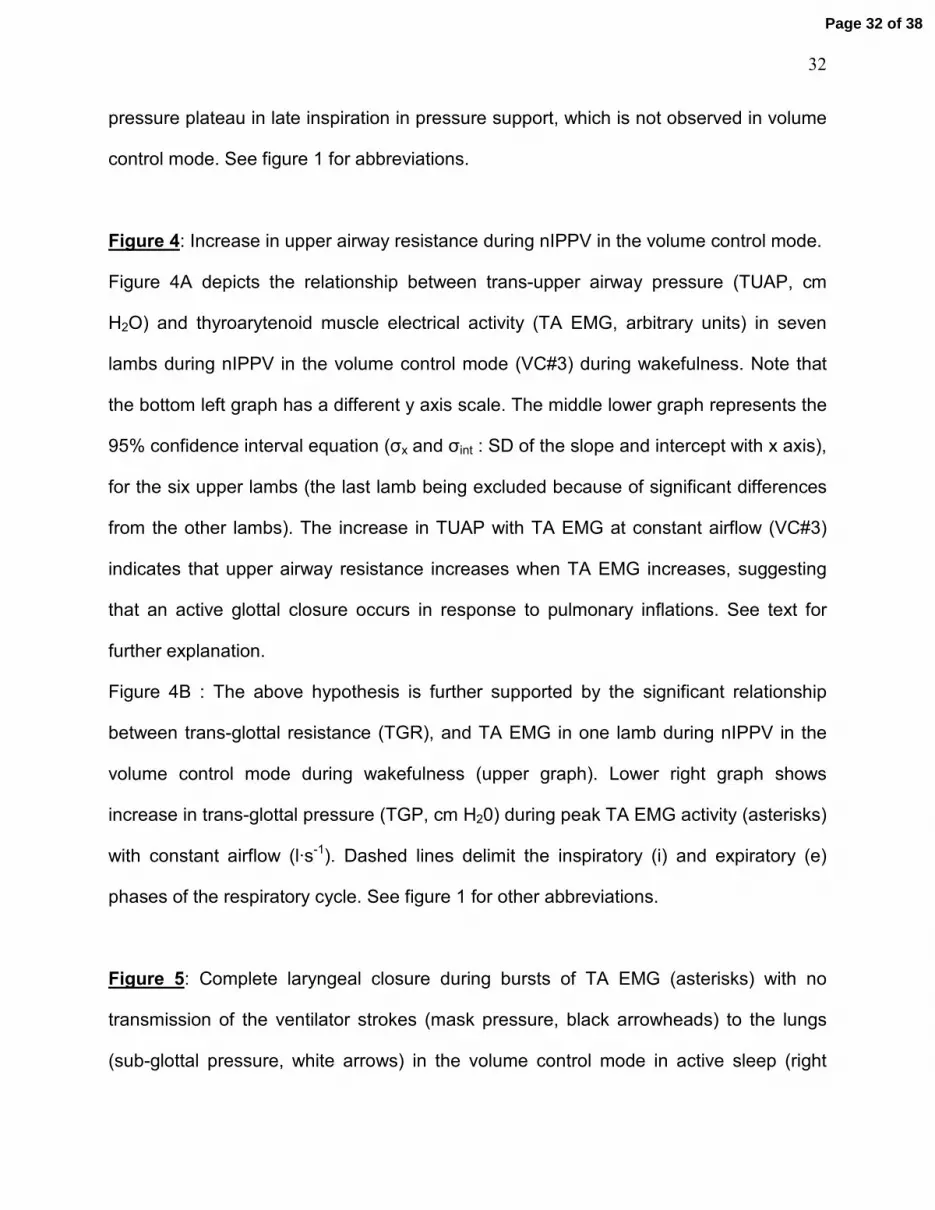
Figure 4: Increase in upper airway resistance during nIPPV in the volume control mode.
Figure 4A depicts the relationship between trans-upper airway pressure (TUAP, cm
H2O) and thyroarytenoid muscle electrical activity (TA EMG, arbitrary units) in seven
lambs during nIPPV in the volume control mode (VC#3) during wakefulness. Note that
the bottom left graph has a different y axis scale. The middle lower graph represents the
95% confidence interval equation (σx and σint : SD of the slope and intercept with x axis),
for the six upper lambs (the last lamb being excluded because of significant differences
from the other lambs). The increase in TUAP with TA EMG at constant airflow (VC#3)
indicates that upper airway resistance increases when TA EMG increases, suggesting
that an active glottal closure occurs in response to pulmonary inflations. See text for
further explanation.
Figure 4B : The above hypothesis is further supported by the significant relationship
between trans-glottal resistance (TGR), and TA EMG in one lamb during nIPPV in the
volume control mode during wakefulness (upper graph). Lower right graph shows
increase in trans-glottal pressure (TGP, cm H20) during peak TA EMG activity (asterisks)
with constant airflow (l·s-1). Dashed lines delimit the inspiratory (i) and expiratory (e)
phases of the respiratory cycle. See figure 1 for other abbreviations.
Figure 5: Complete laryngeal closure during bursts of TA EMG (asterisks) with no
transmission of the ventilator strokes (mask pressure, black arrowheads) to the lungs
(sub-glottal pressure, white arrows) in the volume control mode in active sleep (right
Page 32 of 38

33
column). Indeed, with TA inspiratory EMG activity, maximal mask pressure increased
from 17 to 32 cmH2O and sub-glottal pressure dropped from 12 to 7 cmH2O. High
amplitude, tonic cricothyroid EMG activity was usually present in active sleep in the 5
lambs studied in this particular state. The left traces were obtained during wakefulness
in the volume control mode in the same lamb.
Page 33 of 38

Figure 1
5 sec 5 sec
20
4 cm H2O
i e i e
No CPAP
18
4 cm H2O 4
0 cm H2O
0 cmH2O Mask pressure
Pulmonary volumes
Sub-glottal pressure
Pressure support 20 / 4
TA
∫ TA
CT
∫ CT
Dia
∫ Dia
Page 34 of 38
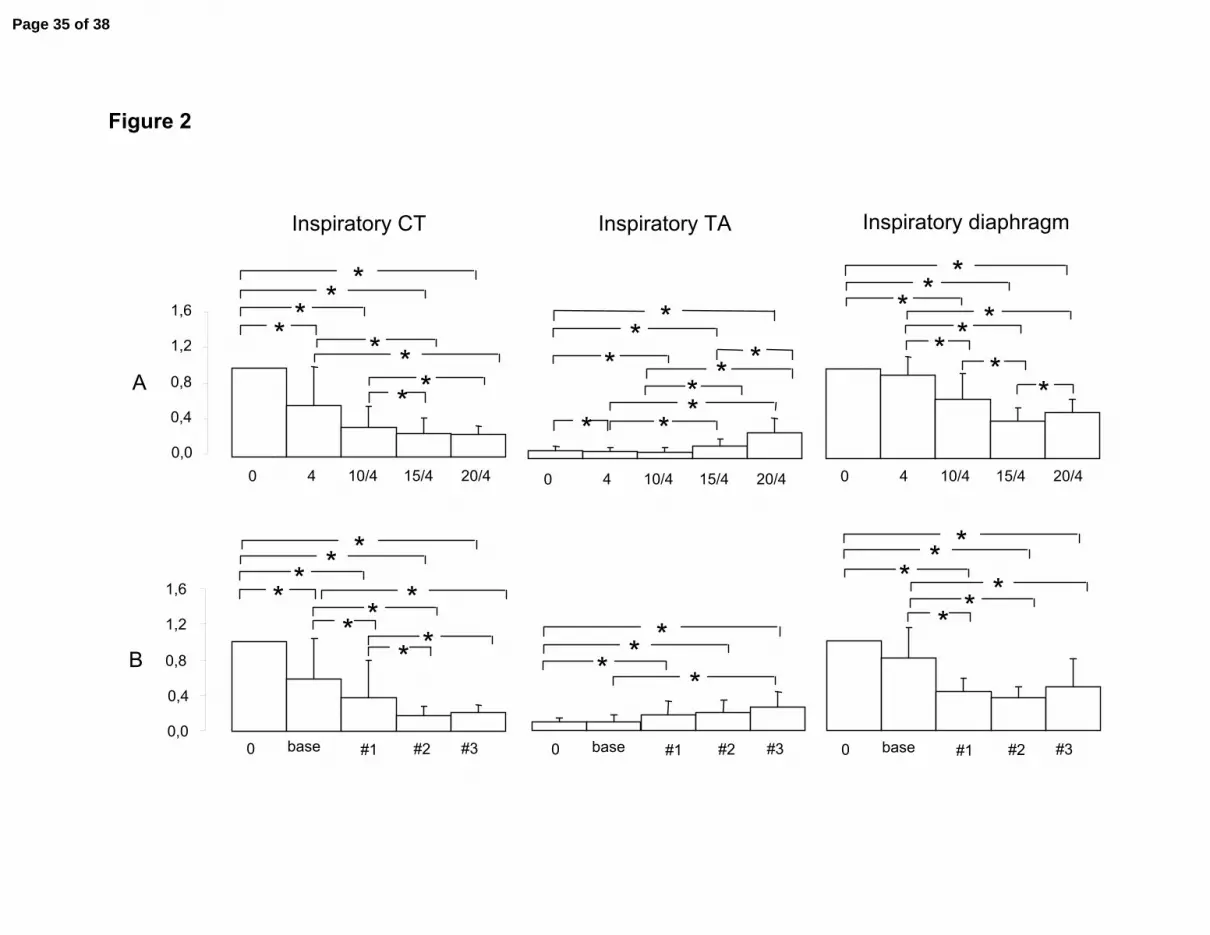
Figure 2
0,0
0,4
0,8
1,2
1,6
0 4 10/4 15/4 20/4
* * *
* * * **
0 4 10/4 15/4 20/4
*
** *
* * ** *
Inspiratory CT Inspiratory TA
0,0
0,4
0,8
1,2
1,6
base #1 #2 #3 0
* * * *
* * *
* *
base #1 #2 #3 0
* * * *
A
B
0 4 10/4 15/4 20/4
* * *
* * * *
*
Inspiratory diaphragm
*
base #1 #2 #3 0
* *
* * *
Page 35 of 38
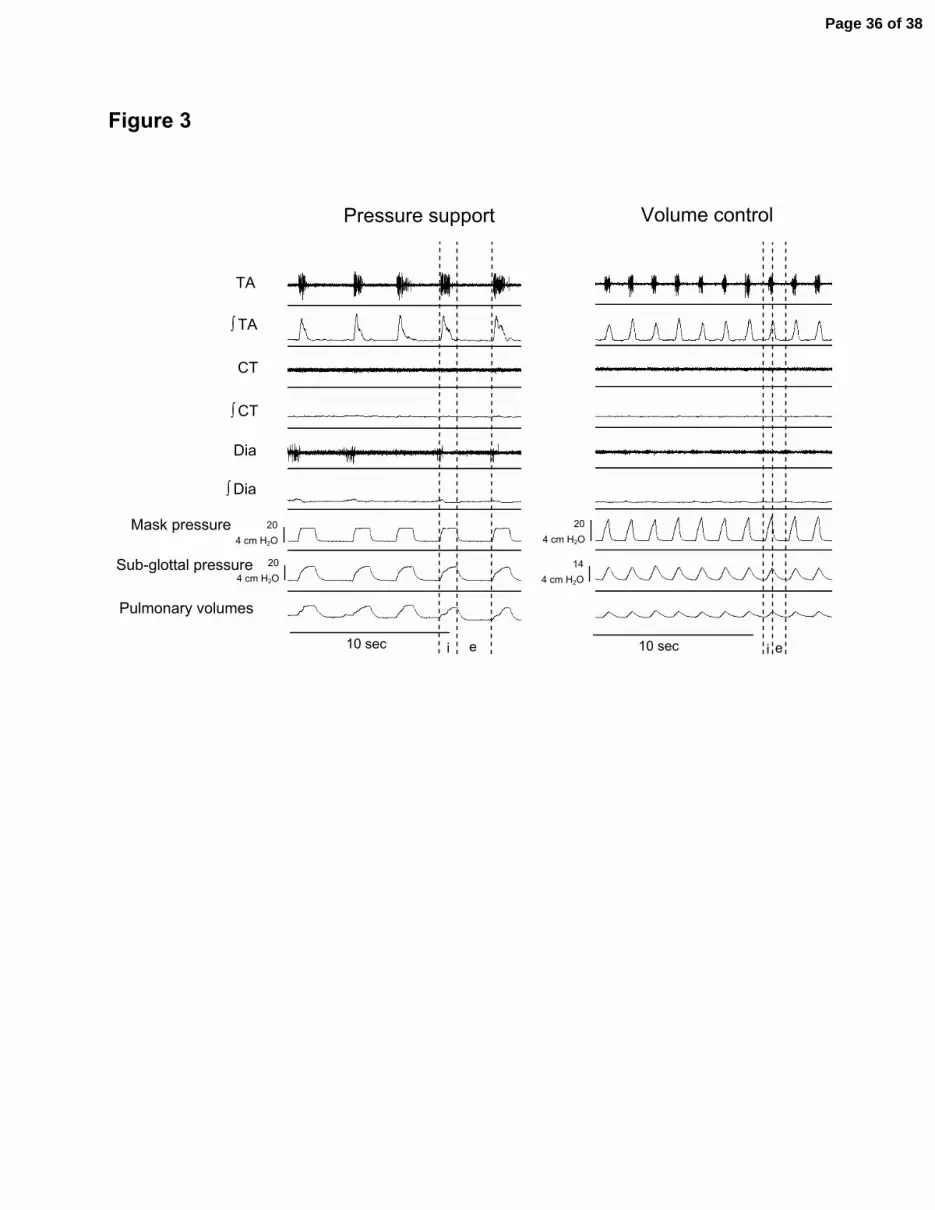
Figure 3
e
CT
∫ CT
TA
∫ TA
Dia
∫ Dia
i e i
Mask pressure
10 sec 10 sec
Pressure support Volume control
4 cm H2O 20
4 cm H2O 14
Pulmonary volumes
4 cm H2O 20
4 cm H2O 20 Sub-glottal pressure
Page 36 of 38

y = 10.3x - 4.8R2 = 0.72 p<0.001
0
10
20
0 1 2 3
TA EMG (a.u.)
TG
R (
cm H
2O·s·L
-1)
- A -
y = 4.5x + 5.9
R2 = 0.47 p<0.0010
10
20
30
0 2,5 5
y = 6.7x + 7.3R2 = 0.76 p<0.001
0
10
20
30
0 2,5 5
y = 9.9x - 5.5R2 = 0.33 p<0.001
0
10
20
30
0 2,5 5
y = 39.1x - 59.5R2 = 0.65 p<0.001
0
25
50
0 2,5 5
y = 2.9x + 1.7R2 = 0.48 p<0.001
0
10
20
30
0 2,5 5
y = 2.8x + 4.0
R2 = 0,.8 p<0.001
0
10
20
30
0 2,5 5
y = 2.9x + 4.1R2 = 0.63 p<0.001
0
10
20
30
0 2,5 5
TU
AP
(c
m H
2O)
TA EMG (a.u.)
0
10
20
30
0 2,5 5
y = 4.1x + 4.5 p=0.002
σx = 1.9 σint = 2.7
TGP
∫ TA
TA
Vol.
5 sec
030
05
* * *
* * *
i ie
Flow
- B -
Page 37 of 38

Figure 5
10 sec
TA
∫ TA
CT
∫ CT
Dia
∫ Dia
Mask pressure
Pulmonary volumes
* * * * * * * * *
10 sec
Wakefulness REM
4 cm H2O 12
4 cm H2O 12 Sub-glottal pressure
4 cm H2O
32
4 cm H2O 17
Page 38 of 38