landslides triggered by the gorkha earthquake in the
TRANSCRIPT
Lacroix Earth, Planets and Space (2016) 68:46 DOI 10.1186/s40623-016-0423-3
LETTER
Landslides triggered by the Gorkha earthquake in the Langtang valley, volumes and initiation processesPascal Lacroix1,2,3*
Abstract
The Gorkha earthquake (Nepal, 2015, Mw 7.9) triggered many landslides. The most catastrophic mass movement was a debris avalanche that buried several villages in the Langtang valley. In this study, questions are raised about its volume and initiation. I investigate the possibility of high-resolution digital surface models computed from tri-stereo SPOT6/7 images to resolve this issue. This high-resolution dataset enables me to derive an inventory of 160 landslides triggered by this earthquake. I analyze the source of errors and estimate the uncertainties in the landslide volumes. The vegetation prevents to correctly estimate the volumes of landslides that occured in vegetated areas. However, I evaluate the volume and thickness of 73 landslides developing in vegetated-free areas, showing a power law between their surface areas and volumes with exponent of 1.20. Accumulations and depletion volumes are also well constrained for larger landslides, and I find that the main debris avalanches accumulated 6.95 × 10⁶ m3 of deposits in the valley with thicknesses reaching 60 m, and 9.66 × 10⁶ m3 in the glaciated part above 5000 m asl. The large amount of sediments is explained by an initiation of the debris avalanche due to serac falls and snow avalanches from five separate places between 6800 and 7200 m asl over 3 km length.
Keywords: Landslides, Seismic triggering, Nepal, DEM, SPOT, Volumes, Optical satellite photogrammetry, Debris avalanche
© 2016 Lacroix. This article is distributed under the terms of the Creative Commons Attribution 4.0 International License (http://creativecommons.org/licenses/by/4.0/), which permits unrestricted use, distribution, and reproduction in any medium, provided you give appropriate credit to the original author(s) and the source, provide a link to the Creative Commons license, and indicate if changes were made.
BackgroundThe Gorkha earthquake (Mw 7.9) of April 25, 2015, trig-gered many catastrophic landslides and avalanches. Two separate teams, one led by the University of Arizona (Kargel et al. 2015) and the other led by the British Geo-logical Survey (BGS) and Durham University, mapped more than 4000 landslides in the weeks following the earthquake in a collaborative work that focused on the rapid evaluation of the earthquake aftermath.1 These inventories show landslides of relatively small size and few river dams, compared with other recent earthquake-triggered landslides of similar magnitude in Pakistan (Owen et al. 2008) or in China (Gorum et al. 2011), or after medieval earthquakes in the same area (Schwang-hart et al. 2015). Reasons for this small number of
1 Inventory available at http://www.bgs.ac.uk/research/earthHazards/epom/nepalEarthquakeResponse.html.
landslides are still in debate. One can conjure up the ground motion intensity, an important parameter in the landslide triggering (Meunier et al. 2007, 2008; Lacroix et al. 2015), that was possibly smaller for the Gorkha earthquake than for previous large himalayan earth-quakes, due to the steady rupture velocity (Grandin et al. 2015; Galetzka et al. 2015) or the deeper source com-pared with other recent himalayan earthquakes that broke the surface.
The largest and most destructive landslide triggered by the Gorkha earthquake occured in the Langtang val-ley (Collins and Jibson 2015; Kargel et al. 2015), where the shaking triggered a debris avalanche composed of ice, snow and soil, burying several villages, and killing at least 350 people (Kargel et al. 2015). This avalanche also dammed the river for few days and destroyed a large part of the valley
Open Access
*Correspondence: [email protected] 1 University of Grenoble Alpes, ISTerre, 38041 Grenoble, FranceFull list of author information is available at the end of the article
Page 2 of 10Lacroix Earth, Planets and Space (2016) 68:46
due to the air blast produced by the avalanche (Kargel et al. 2015). Volume of this avalanche is unknown, whereas it would be of large interest to constrain the mass budget of this earthquake. Indeed, landslides participate to the gen-eral erosion budget, and question was raised whether large earthquakes create or destroy topography (Parker et al. 2011; Molnar 2012). The answer to this question is far from trivial, as the volume estimation of landslides is most of the time estimated by statistical relationships between sur-face and volume, and not directly measured (e.g., Parker et al. 2011). Errors can come from the uncertainties in the empirical law used (Larsen et al. 2010), as well as the defi-nition of the surface used (Marc and Hovius 2015). Other options to constrain the landslide volumes include (1) field measurements of the characteristic dimensions of land-slides, including depth (e.g., Ohmori 1992), (2) difference of pre- and post-failure 3D topography (e.g., Kerle 2002; Mar-tha et al. 2010), and (3) inversion of deformation data on slow-moving landslides (e.g., Booth et al. 2013).
The 3D topography difference has been previously applied to estimate volumes of landslides using either very-high-resolution Lidar images (e.g., Chen et al. 2006), or stereo images of optical satellites. For instance, SPOT5 (Tsutsui et al. 2007) or CartoSat-1 (Martha et al. 2010) images with 2.5-m resolution have been used to derive digital surface models (DSM) before and after two large landslides. Lidar data have the advantage of a better preci-sion compared with the satellite DSMs but are rarely avail-able before and after a rapid event. Remote sensing images, on the contrary, are acquired with an increasing frequency, improving the chance to get pre-event stereo images.
Previous studies showed that DSMs produced with SPOT5 satellites display 4- to 10-m uncertainties depend-ing on the slopes (Tsutsui et al. 2007). These numbers limit the use of DSMs from satellites to the volume estimation of deep-seated and large landslides. However, the increas-ing resolution of satellites and the better gyroscopes onboard enable now to produce DSMs with better uncer-tainties. For instance, DSMs produced with the Pléiades satellites (70 cm of resolution) have 70 cm–3 m uncertain-ties on urban-free and vegetation-free terrains depend-ing on the slope gradient and the acquisition parameters (Berthier et al. 2014; Stumpf et al. 2014; Lacroix et al. 2015; Heijenk 2015). Therefore, these new satellites can provide sufficient resolution to estimate the volumes of landslides of smaller size. The recently launched SPOT6/7 satellites present the advantages of a very high resolution (1.5 m), good steering capabilities (tri-stereo mode), and a large footprint (120 × 60 km) that make them very much suit-able for hazard studies over a large area, typically the study of landslides triggered by a large earthquake.
Here, I use these tri-stereo SPOT6/7 data to build a pre- and post-Gorkha earthquake topography of the Langtang
valley. I use this dataset to study the landslides triggered by this earthquake. In particular, I show the possibility to retrieve landslide volumes even of small size, and study volumes and initiation processes of the main avalanche.
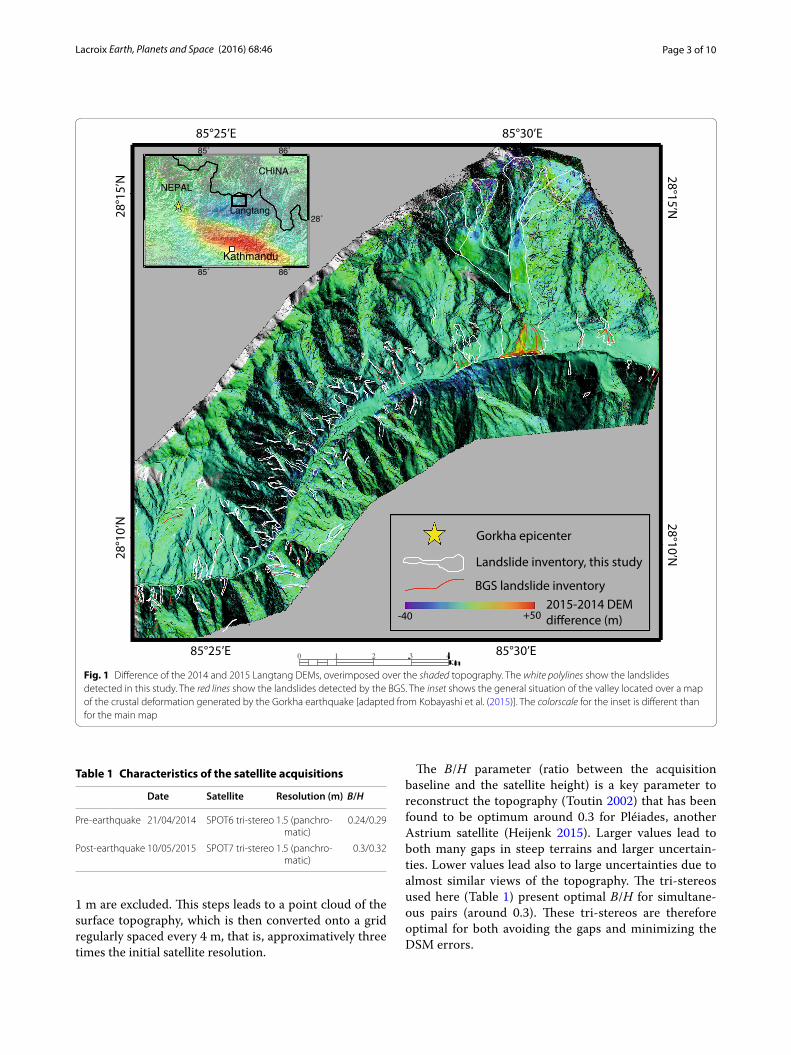
MethodsStudy areaThe Langtang valley is a touristic area situated in the high Himalayan range, 60 km north of Kathmandu (Fig. 1). The valley at 3000 m asl is surrounded by high peaks that culmi-nate with the Langtang Lirung at 7227 m. This large denive-lation creates steep slopes (median slope of the area is 41°), prone to landslides. The monsoon in the Langtang valley brings about 80 % of the annual precipitation, between June and September. The intense monsoon rain is the main trig-gering factor of landslides causing approximately 80 casual-ties per year over the all Nepal (Petley et al. 2007).
In the vicinity of the Langtang valley, it has been shown that erosion is dominated by few major landslides (Gallo and Lavé 2014) and debris flows (Burtin et al. 2009). Rainfall has been pointed out in the development of these mass movements (Upreti and Dhital 1996; Petley et al. 2007), with the existence of threshold of rainfall inten-sity in the landslide triggering (Gabet et al. 2004; Dahal and Hasegawa 2008; Burtin et al. 2009). The impact of earthquakes on the landslide triggering has little been explored in Nepal, until the Gorkha earthquake (Kargel et al. 2015). The Langtang valley is situated just above the fault ruptured by the Gorkha earthquake (Fig. 1, inset).
DSM generationTo derive a landslide inventory and estimate their vol-umes, two tri-stereo SPOT6/7 images were acquired on the Langtang valley over an area of 100 km2 (Table 1). Resolution of these images is 1.5 m. Based on these tri-stereo images, a DSM is reconstruct in April 2014 and another one in May 2015, 15 days after the Gorkha earthquake. The DSMs were computed using the NASA open source software Ames Stereo Pipeline (Broxton and Edwards 2008). This software was first developed for planetary purposes, but recent developments make it now suitable for computing DSMs on Earth with Astrium and Digital Globe images. Each image is first map-pro-jected using the low-resolution SRTM DSM. Then, the different images are bundle-adjusted based on automati-cally extracted tie points, before finding the disparities between each pair of the tri-stereo. This solution pro-vides better results on the steep slopes of our area, than searching directly the disparities without first map pro-jecting the images. Finally, the triangulation step, which is finding the intersection between all the rays coming from the homologous points, is realized jointly with all the three images. Intersections with errors larger than
Page 3 of 10Lacroix Earth, Planets and Space (2016) 68:46
1 m are excluded. This steps leads to a point cloud of the surface topography, which is then converted onto a grid regularly spaced every 4 m, that is, approximatively three times the initial satellite resolution.
The B/H parameter (ratio between the acquisition baseline and the satellite height) is a key parameter to reconstruct the topography (Toutin 2002) that has been found to be optimum around 0.3 for Pléiades, another Astrium satellite (Heijenk 2015). Larger values lead to both many gaps in steep terrains and larger uncertain-ties. Lower values lead also to large uncertainties due to almost similar views of the topography. The tri-stereos used here (Table 1) present optimal B/H for simultane-ous pairs (around 0.3). These tri-stereos are therefore optimal for both avoiding the gaps and minimizing the DSM errors.
28°1
5’N
E’03°58E’52°5828°15’N
28°1
0’N 28°10’N
E’03°58E’52°58
Landslide inventory, this study
BGS landslide inventory
-40 +502015-2014 DEM
Gorkha epicenter
85˚
85˚
86˚
86˚
28˚
CHINA
NEPAL
Kathmandu
Langtang
Fig. 1 Difference of the 2014 and 2015 Langtang DEMs, overimposed over the shaded topography. The white polylines show the landslides detected in this study. The red lines show the landslides detected by the BGS. The inset shows the general situation of the valley located over a map of the crustal deformation generated by the Gorkha earthquake [adapted from Kobayashi et al. (2015)]. The colorscale for the inset is different than for the main map
Table 1 Characteristics of the satellite acquisitions
Date Satellite Resolution (m) B/H
Pre-earthquake 21/04/2014 SPOT6 tri-stereo 1.5 (panchro-matic)
0.24/0.29
Post-earthquake 10/05/2015 SPOT7 tri-stereo 1.5 (panchro-matic)
0.3/0.32
Page 4 of 10Lacroix Earth, Planets and Space (2016) 68:46
Error estimationNo ground control points (GCP) were used to derive the DSMs. This can lead to horizontal and vertical bias of a few meters. In the case of DSMs computed with the Pléi-ades satellite (another Astrium satellite, with same qual-ity of the rational polynomial coefficient than SPOT6/7) without any GCP, this bias is lower than 5 m in each direction (Lacroix et al. 2015), but has no impact on the relative errors of the DSMs (Stumpf et al. 2014; Lac-roix et al. 2015). However, while comparing two DSMs, even small horizontal and vertical shifts can lead to false alarms of volume changes mostly on steep slopes. These shifts must therefore be corrected. I use the method of Berthier et al. (2007) to co-register the 2015 DSM on the 2014 one. Shifts were found of 1.55 m toward the West, 1 m in the Northern direction, and 3.66 m in the vertical. The area of study is, however, affected by altitude changes between 2014 and 2015 due to landslides, snow cover, glacier, and vegetation changes, which can lead to errors in the previous estimation of the vertical bias. I there-fore re-estimate this vertical bias by comparing the 2014 and 2015 altitudes on the relatively flat non-vegetated valley floors, not affected by either landslides or depos-its. A correction of 40 cm is thus retrieved and removed from the DSM difference. The difference between the two shifted DSMs is shown in Fig. 1.
Errors of the DSMs are then estimated using the rela-tion between the standard deviation of a single DSM and the DSM difference (dDSM), assuming the two DSMs have a similar uncertainties (Lacroix et al. 2015):
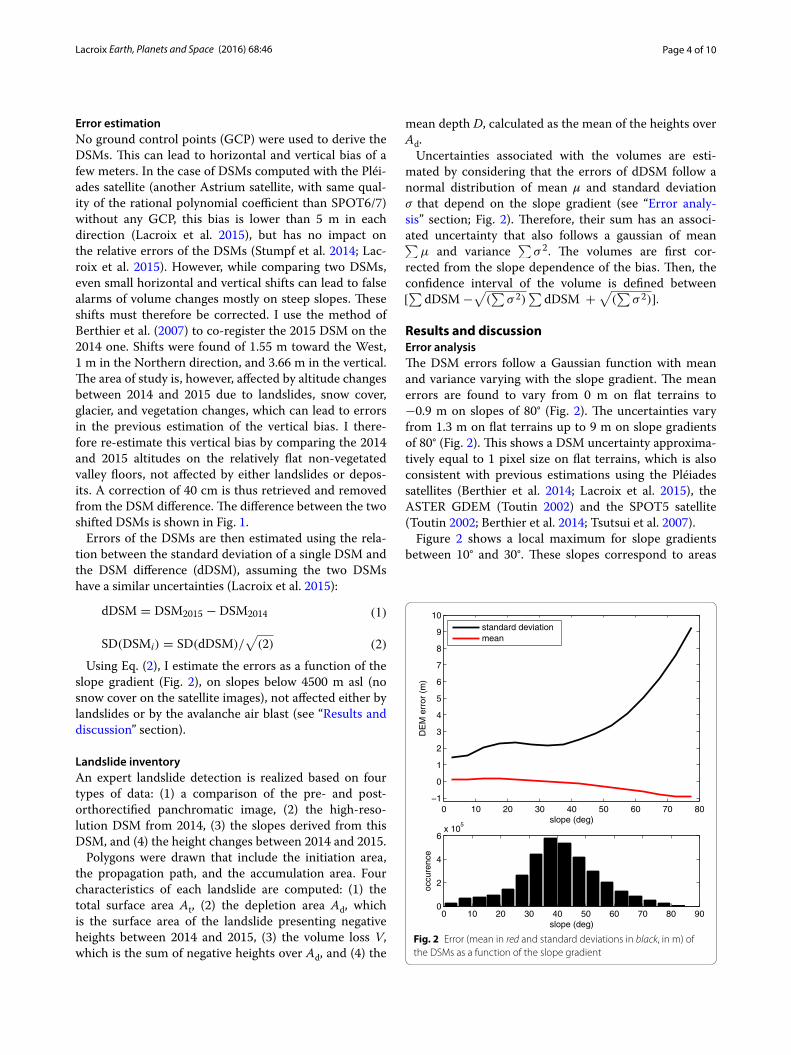
Using Eq. (2), I estimate the errors as a function of the slope gradient (Fig. 2), on slopes below 4500 m asl (no snow cover on the satellite images), not affected either by landslides or by the avalanche air blast (see “Results and discussion” section).
Landslide inventoryAn expert landslide detection is realized based on four types of data: (1) a comparison of the pre- and post-orthorectified panchromatic image, (2) the high-reso-lution DSM from 2014, (3) the slopes derived from this DSM, and (4) the height changes between 2014 and 2015.
Polygons were drawn that include the initiation area, the propagation path, and the accumulation area. Four characteristics of each landslide are computed: (1) the total surface area At, (2) the depletion area Ad, which is the surface area of the landslide presenting negative heights between 2014 and 2015, (3) the volume loss V, which is the sum of negative heights over Ad, and (4) the
(1)dDSM = DSM2015 − DSM2014
(2)SD(DSMi) = SD(dDSM)/√
(2)
mean depth D, calculated as the mean of the heights over Ad.
Uncertainties associated with the volumes are esti-mated by considering that the errors of dDSM follow a normal distribution of mean μ and standard deviation σ that depend on the slope gradient (see “Error analy-sis” section; Fig. 2). Therefore, their sum has an associ-ated uncertainty that also follows a gaussian of mean ∑
µ and variance ∑
σ 2. The volumes are first cor-rected from the slope dependence of the bias. Then, the confidence interval of the volume is defined between [∑
dDSM −√
(∑
σ 2)∑
dDSM +√
(∑
σ 2)].
Results and discussionError analysisThe DSM errors follow a Gaussian function with mean and variance varying with the slope gradient. The mean errors are found to vary from 0 m on flat terrains to −0.9 m on slopes of 80° (Fig. 2). The uncertainties vary from 1.3 m on flat terrains up to 9 m on slope gradients of 80° (Fig. 2). This shows a DSM uncertainty approxima-tively equal to 1 pixel size on flat terrains, which is also consistent with previous estimations using the Pléiades satellites (Berthier et al. 2014; Lacroix et al. 2015), the ASTER GDEM (Toutin 2002) and the SPOT5 satellite (Toutin 2002; Berthier et al. 2014; Tsutsui et al. 2007).
Figure 2 shows a local maximum for slope gradients between 10° and 30°. These slopes correspond to areas
0 10 20 30 40 50 60 70 80−1
0
1
2
3
4
5
6
7
8
9
10
slope (deg)
DE
M e
rror
(m
)
0 10 20 30 40 50 60 70 80 900
2
4
6x 10
5
slope (deg)
occu
renc
e
standard deviationmean
Fig. 2 Error (mean in red and standard deviations in black, in m) of the DSMs as a function of the slope gradient
Page 5 of 10Lacroix Earth, Planets and Space (2016) 68:46
covered by forests, on the sides of the valley floor and the valley floor itself. This local maximum can there-fore be explained by several factors: (1) The valley floors have experienced changes due to landslide deposits and changes in the river stream. (2) The vegetated areas might have changed a little in between 2014 and 2015. (3) The uncertainties on vegetated areas increase due to problems of stereo-photogrammetric modeling (Stumpf et al. 2014). (4) Finally, the errors are estimated by differ-entiating two DSMs realized with sets of images of differ-ent viewing angles (Table 1). This leads to difference of DSM reconstruction and therefore to larger uncertainties on their difference.
Landslide inventoryOne hundred and sixty mass movements were detected, including rockfalls, soil slides, debris avalanche, and serac falls. This inventory compares very well with the BGS landslide inventory. Indeed, only six landslides over the 62 detected by the BGS in the area were not detected in this study. I found 102 more landslides here, mostly in the central part of the studied area. This can-not be easily explained as no clouds were reported in the images used by the BGS and many landslides are large enough to be detected by images of smaller resolutions. I checked the hypothesis that parts of these landslides have been triggered before the earthquake. Indeed, the images used here span 1 year between April 21, 2014, and May 10, 2015, including the 2014 monsoon. Nev-ertheless, a check on Google Earth with satellite images taken in November 09, 2014, and January 21, 2015, con-firms that all the 160 landslides detected except two of them were triggered after the 2014 monsoon. Moreo-ver, testimonies provide evidences that the main land-slides were triggered during the earthquake (Kargel et al. 2015). Therefore, it is highly probable that almost all the mapped landslides were triggered by the Gorkha earthquake.
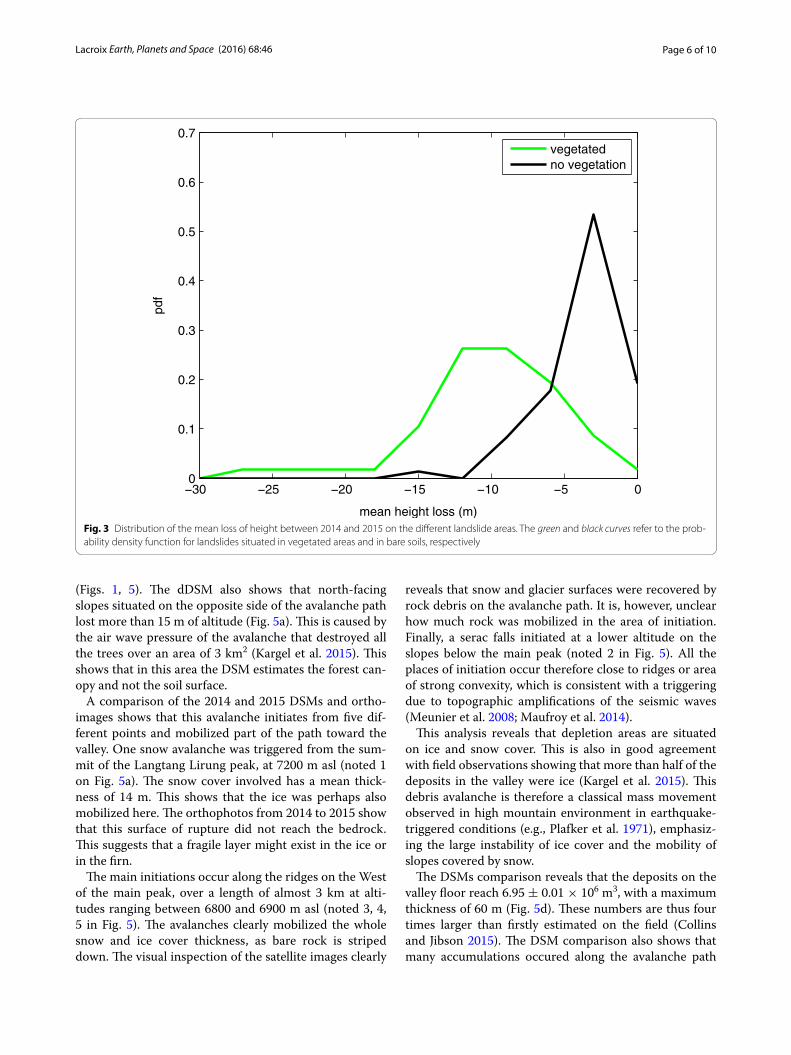
The landslide surface area At ranges between 500 m2 and 3 km2, covering a total area of 8.1 km2, that is, 1/12th of the total studied area. The probability distribution function of their surface area is computed following Mal-amud et al. (2004) (Fig. 4a). This distribution displays a power-law relation for surface areas >3000 m2, with an exponent of 2.2, close to values found for other invento-ries (e.g., Stark and Hovius 2001; Malamud et al. 2004). The altitude of initiation of these mass movements ranges between 2100 m and 7200 m, with a median at 3390 m. The slope of initiation ranges between 15° and 82° with a median at 47°. This median value is slightly larger than the median of the slopes available on the area (41°), showing the effect of the slope gradient on the landslide triggering (e.g., Lacroix et al. 2013).
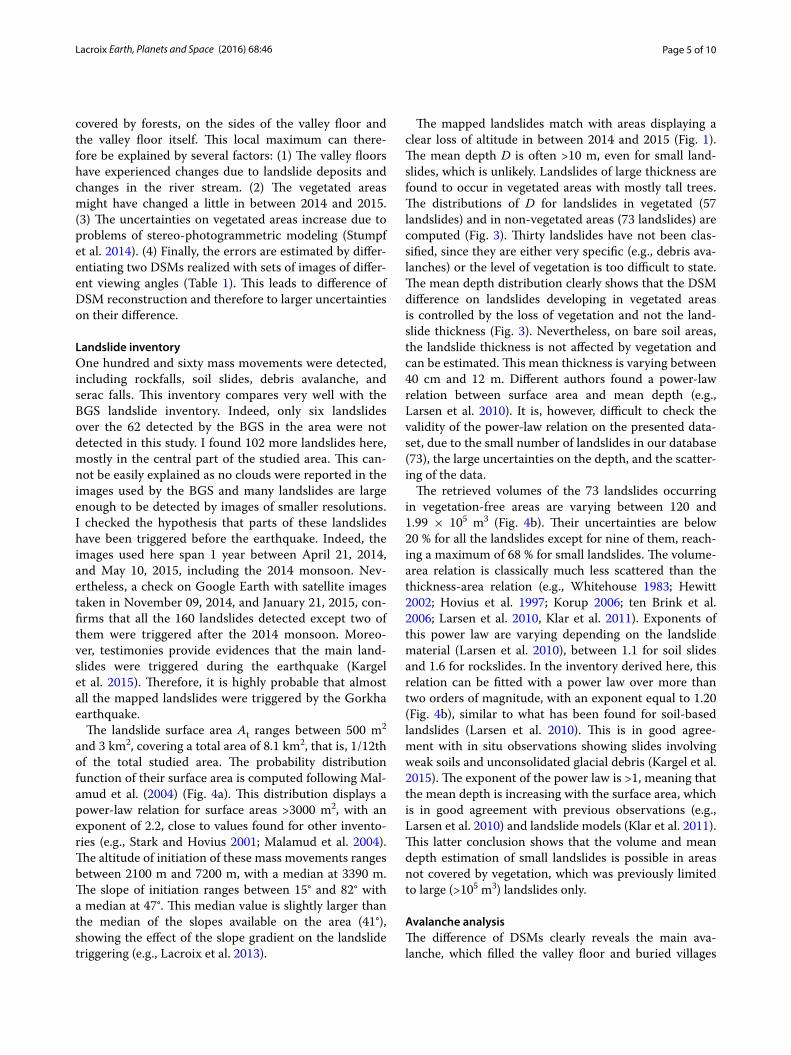
The mapped landslides match with areas displaying a clear loss of altitude in between 2014 and 2015 (Fig. 1). The mean depth D is often >10 m, even for small land-slides, which is unlikely. Landslides of large thickness are found to occur in vegetated areas with mostly tall trees. The distributions of D for landslides in vegetated (57 landslides) and in non-vegetated areas (73 landslides) are computed (Fig. 3). Thirty landslides have not been clas-sified, since they are either very specific (e.g., debris ava-lanches) or the level of vegetation is too difficult to state. The mean depth distribution clearly shows that the DSM difference on landslides developing in vegetated areas is controlled by the loss of vegetation and not the land-slide thickness (Fig. 3). Nevertheless, on bare soil areas, the landslide thickness is not affected by vegetation and can be estimated. This mean thickness is varying between 40 cm and 12 m. Different authors found a power-law relation between surface area and mean depth (e.g., Larsen et al. 2010). It is, however, difficult to check the validity of the power-law relation on the presented data-set, due to the small number of landslides in our database (73), the large uncertainties on the depth, and the scatter-ing of the data.
The retrieved volumes of the 73 landslides occurring in vegetation-free areas are varying between 120 and 1.99 × 10⁵ m3 (Fig. 4b). Their uncertainties are below 20 % for all the landslides except for nine of them, reach-ing a maximum of 68 % for small landslides. The volume-area relation is classically much less scattered than the thickness-area relation (e.g., Whitehouse 1983; Hewitt 2002; Hovius et al. 1997; Korup 2006; ten Brink et al. 2006; Larsen et al. 2010, Klar et al. 2011). Exponents of this power law are varying depending on the landslide material (Larsen et al. 2010), between 1.1 for soil slides and 1.6 for rockslides. In the inventory derived here, this relation can be fitted with a power law over more than two orders of magnitude, with an exponent equal to 1.20 (Fig. 4b), similar to what has been found for soil-based landslides (Larsen et al. 2010). This is in good agree-ment with in situ observations showing slides involving weak soils and unconsolidated glacial debris (Kargel et al. 2015). The exponent of the power law is >1, meaning that the mean depth is increasing with the surface area, which is in good agreement with previous observations (e.g., Larsen et al. 2010) and landslide models (Klar et al. 2011). This latter conclusion shows that the volume and mean depth estimation of small landslides is possible in areas not covered by vegetation, which was previously limited to large (>105 m3) landslides only.
Avalanche analysisThe difference of DSMs clearly reveals the main ava-lanche, which filled the valley floor and buried villages
Page 6 of 10Lacroix Earth, Planets and Space (2016) 68:46
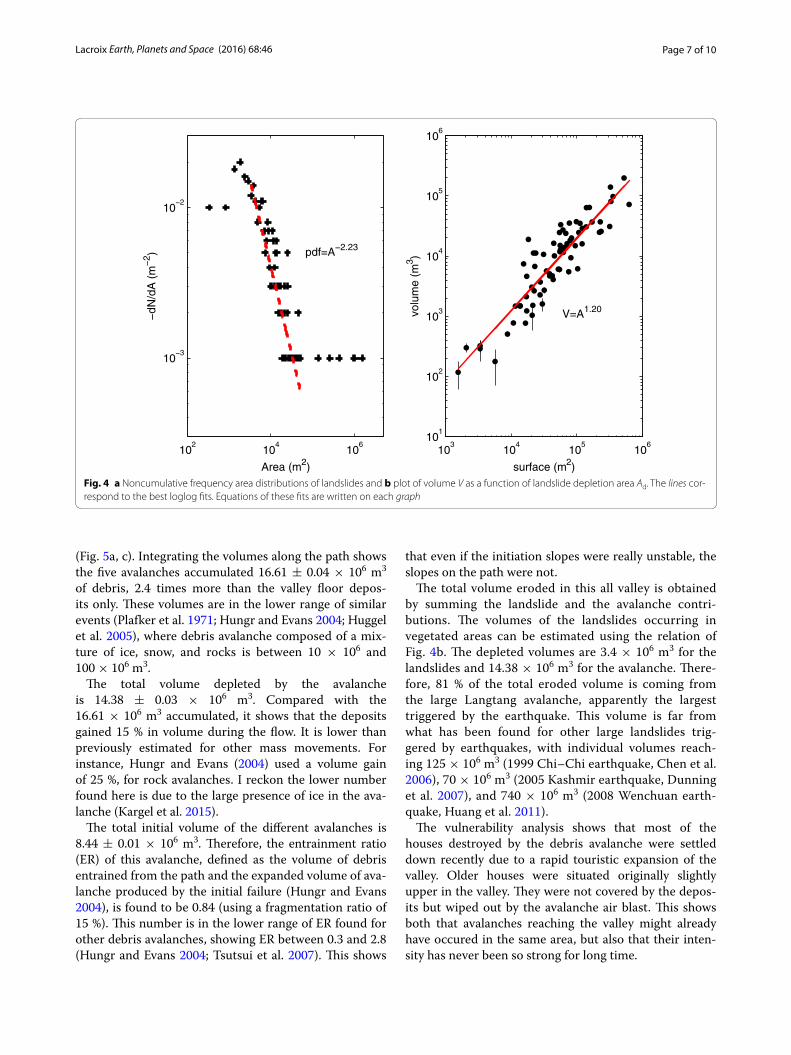
(Figs. 1, 5). The dDSM also shows that north-facing slopes situated on the opposite side of the avalanche path lost more than 15 m of altitude (Fig. 5a). This is caused by the air wave pressure of the avalanche that destroyed all the trees over an area of 3 km2 (Kargel et al. 2015). This shows that in this area the DSM estimates the forest can-opy and not the soil surface.
A comparison of the 2014 and 2015 DSMs and ortho-images shows that this avalanche initiates from five dif-ferent points and mobilized part of the path toward the valley. One snow avalanche was triggered from the sum-mit of the Langtang Lirung peak, at 7200 m asl (noted 1 on Fig. 5a). The snow cover involved has a mean thick-ness of 14 m. This shows that the ice was perhaps also mobilized here. The orthophotos from 2014 to 2015 show that this surface of rupture did not reach the bedrock. This suggests that a fragile layer might exist in the ice or in the firn.
The main initiations occur along the ridges on the West of the main peak, over a length of almost 3 km at alti-tudes ranging between 6800 and 6900 m asl (noted 3, 4, 5 in Fig. 5). The avalanches clearly mobilized the whole snow and ice cover thickness, as bare rock is striped down. The visual inspection of the satellite images clearly
reveals that snow and glacier surfaces were recovered by rock debris on the avalanche path. It is, however, unclear how much rock was mobilized in the area of initiation. Finally, a serac falls initiated at a lower altitude on the slopes below the main peak (noted 2 in Fig. 5). All the places of initiation occur therefore close to ridges or area of strong convexity, which is consistent with a triggering due to topographic amplifications of the seismic waves (Meunier et al. 2008; Maufroy et al. 2014).
This analysis reveals that depletion areas are situated on ice and snow cover. This is also in good agreement with field observations showing that more than half of the deposits in the valley were ice (Kargel et al. 2015). This debris avalanche is therefore a classical mass movement observed in high mountain environment in earthquake-triggered conditions (e.g., Plafker et al. 1971), emphasiz-ing the large instability of ice cover and the mobility of slopes covered by snow.
The DSMs comparison reveals that the deposits on the valley floor reach 6.95 ± 0.01 × 10⁶ m3, with a maximum thickness of 60 m (Fig. 5d). These numbers are thus four times larger than firstly estimated on the field (Collins and Jibson 2015). The DSM comparison also shows that many accumulations occured along the avalanche path
−30 −25 −20 −15 −10 −5 00
0.1
0.2
0.3
0.4
0.5
0.6
0.7
mean height loss (m)
vegetatedno vegetation
Fig. 3 Distribution of the mean loss of height between 2014 and 2015 on the different landslide areas. The green and black curves refer to the prob-ability density function for landslides situated in vegetated areas and in bare soils, respectively
Page 7 of 10Lacroix Earth, Planets and Space (2016) 68:46
(Fig. 5a, c). Integrating the volumes along the path shows the five avalanches accumulated 16.61 ± 0.04 × 10⁶ m3 of debris, 2.4 times more than the valley floor depos-its only. These volumes are in the lower range of similar events (Plafker et al. 1971; Hungr and Evans 2004; Huggel et al. 2005), where debris avalanche composed of a mix-ture of ice, snow, and rocks is between 10 × 106 and 100 × 106 m3.
The total volume depleted by the avalanche is 14.38 ± 0.03 × 10⁶ m3. Compared with the 16.61 × 10⁶ m3 accumulated, it shows that the deposits gained 15 % in volume during the flow. It is lower than previously estimated for other mass movements. For instance, Hungr and Evans (2004) used a volume gain of 25 %, for rock avalanches. I reckon the lower number found here is due to the large presence of ice in the ava-lanche (Kargel et al. 2015).
The total initial volume of the different avalanches is 8.44 ± 0.01 × 10⁶ m3. Therefore, the entrainment ratio (ER) of this avalanche, defined as the volume of debris entrained from the path and the expanded volume of ava-lanche produced by the initial failure (Hungr and Evans 2004), is found to be 0.84 (using a fragmentation ratio of 15 %). This number is in the lower range of ER found for other debris avalanches, showing ER between 0.3 and 2.8 (Hungr and Evans 2004; Tsutsui et al. 2007). This shows
that even if the initiation slopes were really unstable, the slopes on the path were not.
The total volume eroded in this all valley is obtained by summing the landslide and the avalanche contri-butions. The volumes of the landslides occurring in vegetated areas can be estimated using the relation of Fig. 4b. The depleted volumes are 3.4 × 10⁶ m3 for the landslides and 14.38 × 10⁶ m3 for the avalanche. There-fore, 81 % of the total eroded volume is coming from the large Langtang avalanche, apparently the largest triggered by the earthquake. This volume is far from what has been found for other large landslides trig-gered by earthquakes, with individual volumes reach-ing 125 × 106 m3 (1999 Chi–Chi earthquake, Chen et al. 2006), 70 × 106 m3 (2005 Kashmir earthquake, Dunning et al. 2007), and 740 × 106 m3 (2008 Wenchuan earth-quake, Huang et al. 2011).
The vulnerability analysis shows that most of the houses destroyed by the debris avalanche were settled down recently due to a rapid touristic expansion of the valley. Older houses were situated originally slightly upper in the valley. They were not covered by the depos-its but wiped out by the avalanche air blast. This shows both that avalanches reaching the valley might already have occured in the same area, but also that their inten-sity has never been so strong for long time.
102
104
106
10−3
10−2
Area (m2)
−dN
/dA
(m
−2 ) pdf=A−2.23
103
104
105
106
101
102
103
104
105
106
surface (m2)
volu
me
(m3 )
V=A1.20
Fig. 4 a Noncumulative frequency area distributions of landslides and b plot of volume V as a function of landslide depletion area Ad. The lines cor-respond to the best loglog fits. Equations of these fits are written on each graph
Page 8 of 10Lacroix Earth, Planets and Space (2016) 68:46
ConclusionsThe comparison of two high-resolution DSMs acquired at 1-year interval highlights the processes involved in the triggering of mass movement due to the Gorkha earth-quake in the Langtang valley. One hundred and sixty mass movements were detected, covering 1/12th of the studied area. The hot spot of this mass-movement dis-tribution is a debris avalanche composed mostly of ice, which mobilized 14.38 × 10⁶ m3 of material, and accu-mulated a volume of 6.95 × 10⁶ m3 in the valley. This analysis shows the high mobility of the ice ridges but a small entrainment of the slopes in the avalanche path.
Based on this coseismic landslide inventory realized over 100 km2 only, it is, however, hard to conclude on
the total erosion budget and the topography building of the Gorkha earthquake. Indeed, Kargel et al. (2015) show that the affected surface is larger than 55,000 km2. Moreover, Elliott et al. (2016) show that the high Hima-layas is affected by subsidence during the earthquake, so that the topographic building can only be evaluated over the long term. Finally, the rates of erosion in the follow-ing years after earthquakes are often higher than before, due to destabilization and damaging of the slopes during the shaking (Marc et al. 2015). In the future, it will there-fore be important (1) to estimate the erosion budget of landslides over larger areas and (2) to monitor and quan-tify the volumes of landslides during the next few years after the earthquake. The SPOT6/7 satellites are highly
12
3
4
5
0 700 1400Meters
0 1000 2000 3000 4000 5000
3000
4000
5000
6000
7000
distance (m)
altit
ude
(m)
−30
−20
−10
0
10
20
30
1
23 4
5
51024102
Langtang Lirung
0 400 800 1200
thic
knes
s (m
)
0
10
20
30
40
50
distance (m)
AB
A B
mean height change (m
)
deforested area
ab
c
d
0 200 400Mètres
Fig. 5 Zoom on the main debris avalanche. a Difference of 2014 and 2015 DSMs, b SPOT6/7 images of one of the avalanche initiation place (Lang-tang Lirung, 7227 m asl) in 2014 and 2015. The red line represents the scar of the avalanche rupture. c Mean thickness mobilized by each ones of the five avalanches along their path. d Thickness profile of the avalanche deposits in the valley
Page 9 of 10Lacroix Earth, Planets and Space (2016) 68:46
recommended to realize this work due to the simulta-neous good DSM uncertainties obtained with tri-stereo images and their large footprints.
AbbreviationsBGS: British Geological Survey; DSM: digital surface model; ER: entrainment ratio; ICIMOD: International Centre for Integrated Mountain Development; SRTM: shuttle radar topography mission; GCP: ground control point.
Author details1 University of Grenoble Alpes, ISTerre, 38041 Grenoble, France. 2 CNRS, ISTerre, 38041 Grenoble, France. 3 IRD, ISTerre, 38041 Grenoble, France.
AcknowledgementsI am grateful to the TOSCA CNES program for funding this project. I also deeply thank the Stereo Pipeline developers at NASA Ames for their great work and reactivity on the Ames Stereo Pipeline software, and Xavier Robert for rereading this manuscript. This manuscript also benefits from the com-ments of Laurent Bollinger and two anonymous reviewers.
Competing interestsThe author declares that he has no competing interests.
Received: 21 October 2015 Accepted: 3 March 2016
ReferencesBerthier E, Arnaud Y, Kumar R, Ahmad S, Wagnon P, Chevallier P
(2007) Remote sensing estimates of glacier mass balances in the Himachal Pradesh (Western Himalaya, India). Remote Sens Environ 108(3):327–338
Berthier E, Vincent C, Magnusson E, Gunnlaugsson A, Pitte P, Le Meur E et al (2014) Glacier topography and elevation changes derived from Pléiades sub-meter stereo images. Cryosphere 8(6):2275–2291
Booth AM, Lamb MP, Avouac JP, Delacourt C (2013) Landslide velocity, thick-ness, and rheology from remote sensing: La Clapière landslide, France. Geophys Res Lett 40:4299–4304
Broxton MJ, Edwards LJ (2008) The Ames Stereo Pipeline: automated 3D sur-face reconstruction from orbital imagery. In: Lunar and planetary science conference, vol 39, abstract 2419
Burtin A, Bollinger L, Cattin R, Vergne J, Nabelek J (2009) Spatiotemporal sequence of Himalayan debris flow from analysis of high-frequency seismic noise. J Geophys Res 114:F04009. doi:10.1029/2008JF001198
Chen RF, Chang KJ, Angelier J, Chan YC, Deffontaines B, Lee CT, Lin ML (2006) Topographical changes revealed by high-resolution airborne lidar data: the 1999 Tsaoling landslide induced by the Chi–Chi earthquake. Eng Geol 88:160–172
Collins BD, Jibson RW (2015) Assessment of existing and potential landslide hazards resulting from the April 25, 2015 Gorkha, Nepal earthquake sequence. U.S. Geological Survey OpenFile Report 2015-1142, Reston, VA
Dahal RK, Hasegawa S (2008) Representative rainfall thresholds for landslides in the Nepal Himalaya. Geomorphology 100(3–4):429–443. doi:10.1016/j.geomorph.2008.01.014
Dunning SA, Mitchell WA, Rosser NJ, Petley DN (2007) The Hattian Bala rock avalanche and associated landslides triggered by the Kashmir earthquake of 8 October 2005. Eng Geol 93:130–144
Elliott JR, Jolivet R, González PJ, Avouac J-P, Hollingsworth J, Searle MP, Ste-vens VL (2016) Himalayan megathrust geometry and relation to topog-raphy revealed by the Gorkha earthquake. Nat Geosci. doi:10.1038/NGEO2623
Gabet EJ, Burbank DW, Putkonen JK, Pratt-Sitaula BA, Oiha T (2004) Rainfall thresholds for landsliding in the Himalayas of Nepal. Geomorphology 63(131):143
Galetzka J, Melgar D, Genrich JF, Geng J, Owen S et al (2015) Slip pulse and resonance of the Kathmandu basin during the 2015 Gorkha earthquake, Nepal. Science 349(6252):1091–1095. doi:10.1126/science.aac6383
Gallo F, Lavé J (2014) Evolution of a large landslide in the high Himalaya of cen-tral Nepal during the last half-century. Geomorphology 223(2014):20–32
Gorum T, Fan X, van Westen CJ, Huang RQ, Xu Q, Tang C, Wang G (2011) Distri-bution pattern of earthquake-induced landslides triggered by the 12 May 2008 Wenchuan earthquake. Geomorphology 133:152–167
Grandin R, Vallée M, Satriano C, Lacassin R, Klinger Y, Simoes M, Bollinger L (2015) Rupture process of the Mw = 7.9 2015 Gorkha earthquake (Nepal): insights into Himalayan megathrust segmentation. Geophys Res Lett. doi:10.1002/2015GL066044
Heijenk R (2015) Characteristics of the kinematics and geomorphology of slow-moving landslides in the Colca valley, South-Peru. Master thesis, Utrecht University
Hewitt K (2002) Styles of rock avalanche depositional complex in very rugged terrain, Karakoram Himalaya, Pakistan, in catastrophic landslides: effects, occurrence and mechanisms. Rev Eng Geol 15:345–378
Hovius N, Stark C, Allen PA (1997) Sediment flux from a mountain belt derived by landslide mapping. Geology 25:231–234
Huang R, Xiangjun P, Weifeng Z, Shigui L, Biliang L (2011) The characteris-tics and failure mechanism of the largest landslide triggered by the Wenchuan earthquake, May 12, 2008, China. Landslides 9(1):131–142. doi:10.1007/s10346-011-0276-6
Huggel C, Zgraggen-Oswald S, Haeberli W, Kääb A, Polkvoj A, Galushkin I, Evans SG (2005) The 2002 rock/ice avalanche at Kolka/Karmadon, Russian Caucasus: assessment of extraordinary avalanche formation and mobility, and application of QuickBird satellite imagery. Nat Hazards Earth Syst Sci 5:173–187
Hungr O, Evans SG (2004) Entrainment of debris in rock avalanches: an analysis of a long run-out mechanism. Geol Soc Am Bull 116(9–10):1240–1252
Kargel GJ, Leonard DH, Shugar UK, Haritashya ABevington et al (2015) Geo-morphic and geologic controls of geohazards induced by Nepal’s 2015 Gorkha earthquake. Science. doi:10.1126/science.aac8353
Kerle N (2002) Volume estimation of the 1998 flank collapse at Casita volcano, Nicaragua: a comparison of photogrammetric and conventional tech-niques. Earth Surf Process Landf 27:759–772
Klar A, Aharonov E, Kalderon-Asael B, Katz O (2011) Analytical and observa-tional relations between landslide volume and surface area. J Geophys Res 116:F02001. doi:10.1029/2009JF001604
Kobayashi T, Morishita Y, Yarai H (2015) Detailed crustal deformation and fault rupture of the 2015 Gorkha earthquake, Nepal, revealed from ScanSAR-based interferograms of ALOS-2. Earth Planets Space 67(1):201
Korup O (2006) Effects of large deep-seated landslides on hillslope morphol-ogy, western Southern Alps, New Zealand. J Geophys Res 111:F01018. doi:10.1029/2004JF000242
Lacroix P, Zavala B, Berthier E, Audin L (2013) Supervised method of landslide inventory using panchromatic SPOT5 images and application to the earthquake-triggered landslides of Pisco (Peru, 2007, Mw 8.0). Remote Sens 5(6):2590–2616
Lacroix P, Berthier E, Taipe Maquerhua E (2015) Earthquake-driven acceleration of slow-moving landslides in the Colca valley, Peru, detected from Pléi-ades images. Remote Sens Environ 165(2015):148–158
Larsen IJ, Montgomery DR, Korup O (2010) Landslide erosion controlled by hillslope material. Nat Geosci 3:247–251
Malamud BD, Turcotte DL, Guzzetti F, Reichenbach P (2004) Landslide invento-ries and their statistical properties. Earth Surf Process Landf 29:687–711. doi:10.1002/esp.1064
Marc O, Hovius N (2015) Amalgamation in landslide maps: effects and auto-matic detection. Nat Hazards Earth Sys Sci 15(4):723–733. doi:10.5194/nhess-15-723-2015
Marc O, Hovius N, Meunier P, Uchida T, Hayashi S (2015) Transient changes of landslide rates after earthquakes. Geology 43(10):883–886
Martha TR, Kerle N, Jetten V, van Westen CJ, Kumar KV (2010) Landslide volu-metric analysis using Cartosat-1-derived DEMs. IEEE Geosci Remote Sens Lett 7(3):582–586
Maufroy E, Cruz-Atienza VM, Cotton F, Gaffet S (2014) Frequency-scaled curva-ture as a proxy for topographic site-effect amplification and ground-motion variability. Bull Seismol Soc Am 105(1):354–367
Meunier P, Hovius N, Haines AJ (2007) Regional patterns of earthquake-trig-gered landslides and their relation to ground motion. Geophys Res Lett 34:L20408. doi:10.1029/2007GL031337
Meunier P, Hovius N, Haines JA (2008) Topographic site effects and the loca-tion of earthquake induced landslides. Earth Planet Sci Lett 275:221–232

Page 10 of 10Lacroix Earth, Planets and Space (2016) 68:46
Molnar P (2012) Isostasy can’t be ignored. Nat Geosci 5(2):83Ohmori H (1992) Morphological characteristics of the scar created by
large-scale rapid mass movement. Jpn Geomorphol Union Trans 13:185–202
Owen LA, Kamp U, Khattak GA, Harp E, Keefer DK, Bauer M (2008) Landslides triggered by the October 8, 2005, Kashmir earthquake. Geomorphology 94:1–9
Parker RN, Densmore AL, Rosser NJ, de Michele M, Li Y, Huang R, Whadcoat S, Petley DN (2011) Mass wasting triggered by the 2008 Wenchuan earth-quake is greater than orogenic growth. Nat Geosci 4:449–452
Petley DN, Hearn GJ, Hart A, Rosser NJ, Dunning SA, Oven K, Mitchell WA (2007) Trends in landslide occurrence in Nepal. Nat Hazards 43:23–44. doi:10.1007/s11069-006-9100-3
Plafker G, Ericksen GE, Fernández Concha J (1971) Geological aspects of the May 31, 1970, Peru earthquake. Bull Seismol Soc Am 61(3):543–578
Schwanghart W, Bernhardt A, Stolle A, Hoelzmann P, Adhikari BR, Ander-mann C, Tofelde S, Merchel S, Rugel G, Fort M, Korup O (2015) Repeated catastrophic valley infill following medieval earthquakes in the Nepal Himalaya. Science. doi:10.1126/science.aac9865
Stark CP, Hovius N (2001) The characterization of landslide size distributions. Geophys Res Lett 28:1091–1094
Stumpf A, Malet JP, Allemand P, Ulrich P (2014) Surface reconstruction and landslide displacement measurements with Pléiades satellite images. ISPRS J Photogramm Remote Sens 95:1–12
ten Brink US, Geist EL, Andrews BD (2006) Size distribution of submarine landslides and its implication to tsunami hazard in Puerto Rico. Geophys Res Lett 33:L11307. doi:10.1029/2006GL026125
Toutin T (2002) Three-dimensional topographic mapping with ASTER stereo data in rugged topography. IEEE Trans Geosci Remote Sens 40(10):2241–2247
Tsutsui K, Rokugawa S, Nakagawa H, Miyazaki S, Cheng C-T, Shiraishi T, Yang S-D (2007) Detection and volume estimation of large-scale landslides based on elevation-change analysis using DEMs extracted from high-resolution satellite stereo imagery. IEEE Trans Geosci Remote Sens 45(6):1681–1696
Upreti BN, Dhital MR (1996) Landslide studies and management in Nepal. ICIMOD, Kathmandu
Whitehouse IE (1983) Distribution of large rock avalanche deposits in central Southern Alps, New Zealand. N Z J Geol Geophys 26:272–279