land use transitions and their effects on water environment in huang-huai-hai plain, china
TRANSCRIPT
LH
Ya
b
a
ARRA
KLEWSMUC
1
ort2LTftrJ
h0
Land Use Policy 47 (2015) 293–301
Contents lists available at ScienceDirect
Land Use Policy
j o ur na l ho me page: www.elsev ier .com/ locate / landusepol
and use transitions and their effects on water environment inuang-Huai-Hai Plain, China
ongqiang Liua,b, Hualou Longa,∗, Tingting Lia,b, Shuangshuang Tua,b
Institute of Geographic Sciences and Natural Resources Research, Chinese Academy of Sciences, Beijing 100101, ChinaUniversity of Chinese Academy of Sciences, Beijing 100049, China
r t i c l e i n f o
rticle history:eceived 17 February 2015eceived in revised form 14 April 2015ccepted 23 April 2015
eywords:and use transitionnvironmental effectater environmental quality
patial regression analysisanagement policyrban–rural transformation developmenthina
a b s t r a c t
This paper analyzes the spatio-temporal dynamic patterns of land use in Huang-Huai-Hai Plain, one of theChina’s most important grain production bases experiencing rapid urban–rural transformation develop-ment, using high-resolution Landsat TM (Thematic Mapper) data and series data of water environmentalquality monitoring in 2000 and 2010, and related socio-economic data from government departments.After assessing the change of water environmental quality of Huang-Huai-Hai Plain during 2000–2010,three spatial econometric regression models including Spatial Lag Model (SLM), Spatial Error Model (SEM)and ordinary least squares (OLS) are used to explore the correlationships between land use transitionsand water environmental changes. The outcomes indicated that, during the research period, land usepattern changes in the study area were characterized by the loss of large quantities of farmland andthe increase of construction land and water body. On the whole, the water environment in the studyarea was obviously improved, but there also existed partial deterioration as evidenced by the increase ofmonitoring sections with water environmental quality below Class V. In general, the increases of grass-land, forested land and water body have positive effects on water environmental quality while farmlandand construction land have negative effects on that. The authors argue that construction land use andfarmland use have almost equal negative effects on water environmental quality, and managing agricul-
tural non-point source pollution is pivotal to improve local water environmental quality. Finally, some ofthe major implications for managing the land and water resources in the plain areas of China as well asother developing countries undergoing rapid urban–rural transformation development are discussed inthe aspects of ecological farming practices, rural construction land management, land use planning andurban planning.© 2015 Elsevier Ltd. All rights reserved.
. Introduction
With the acceleration of urbanization and subsequent increasef human activities, significant changes occurred in the aspects ofegional land use and their patterns at different scale, leading toremendous land use transitions (Andersson et al., 2011; Chen et al.,014; Lambin and Meyfroidt, 2010; Liu et al., 2010; Long, 2014a;ong et al., 2009; Robinson and Carson, 2013; Tan et al., 2011).he land use types of the river basin have been gradually trans-ormed to agricultural or urban land from natural vegetation due
o human activities, which caused the degradation of water envi-onmental quality finally (Amiri and Nakane, 2009; Gao et al., 2004;ohnson et al., 1997; Mou et al., 2004; Uuemaa et al., 2007). Under∗ Corresponding author. Tel.: +86 10 64888169.E-mail address: [email protected] (H. Long).
ttp://dx.doi.org/10.1016/j.landusepol.2015.04.023264-8377/© 2015 Elsevier Ltd. All rights reserved.
the condition of point-source pollution has been effectively con-trolled, non-point source pollution from agricultural land use andprivate rural land has become one of the most important issues forthe management of freshwater worldwide because of its extensiveand uncertainty (Duncan, 2014; Short, 2013; Zhang et al., 2011).Temporal and spatial changes of land use are regarded as one ofthe main factors of non-point source pollution, not only because itaffects the surface runoff, evaporation, infiltration of hydrologicalprocesses (Chen et al., 2003; Fu et al., 2005), but also influences thesubstance form and its transportation, biogeochemical cycle and aseries of other ecological processes, thereby changing the numberof pollutants flowed into rivers and lakes which causes an impor-tant impact on water environmental quality finally (Li et al., 2013;
Mehaffey et al., 2005).The plain areas in China have made a great contribution inensuring China’s food security and have been regarded as themost important grain production bases. However, due to lacking of

2 Polic
eae5uacsZ
b22mcceAsieKlbc
drhda(Ha
94 Y. Liu et al. / Land Use
ffective land use planning and management, these plain areas paid heavy price for this, evidenced by having brought about severenvironmental problems. For example, there are about more than500 million tons of fertilizer and 170 tons of pesticide per yearsed in the plain areas (NBSC, 2012), but quite a few has not beenbsorbed by crops, which flowed into surface waters ultimately,ausing serious water pollution and threatening the sustainableocio-economic development (Jia et al., 2010; Zhang et al., 2014;hang and Kong, 2014).
Land use transitions and their environmental effects haveecome the focus of land change science (Cai, 2011, 2013; Li, 2008,009; Li et al., 2010a,b; Long, 2014b; Long et al., 2014; Turner et al.,007). Currently, some countermeasures such as water environ-ental quality monitoring, evaluation and point-source pollution
ontrol are not sufficient enough to handle a series of problemsoncerning water environmental quality deterioration and aquaticcosystem degradation in the process of China’s rapid urbanization.s for water environment management, while there are numeroustudies focusing on the sensitivity of water environmental qual-ty (Liu et al., 2014a; Versace and Ierodiaconou, 2008; Zampellat al., 2007), scale effect and distance effect (Basnyat et al., 1999;ing et al., 2005; Li et al., 2010a,b; Liu et al., 2014b) due to the
and use/cover change, the quantitative studies of the correlationetween land use transitions and water environmental qualityhange have found much less attention.
The aims of this paper are: (1) to examine the spatio-temporalynamic patterns of land use in Huang-Huai-Hai Plain expe-iencing rapid urban–rural transformation development, usingigh-resolution Landsat TM (Thematic Mapper) data and seriesata of water environmental quality monitoring in 2000 and 2010,
nd related socio-economic data from government departments;2) to assess the change of water environmental quality of Huang-uai-Hai Plain during 2000–2010, using the mathematical statisticsnd analyze its spatio-temporal variations; (3) to explore theFig. 1. Location of th
y 47 (2015) 293–301
correlationships between land use transitions and water environ-mental changes based on spatial regression analysis; and (4) todiscuss some of the major implications for managing the landand water resources in the plain areas of China as well as otherdeveloping countries undergoing rapid urban–rural transformationdevelopment.
2. Study area
Huang-Huai-Hai Plain, the study area, is located in the south ofthe Yan Mountain, the north of the Dabie Mountains, the east of Tai-hang Mountain and Funiu Mountain, and the west of Bohai and theYellow Sea, including the areas of five provinces and two munici-palities, i.e., the whole Shandong, most of the Beijing, Tianjin, Hebeiand Henan, and north part of Anhui and Jiangsu, and it covers about400 thousand km2 (Fig. 1). Huang-Huai-Hai Plain has a populationof 210 million or more in 2009, and it is a representative of China’splains, its land area and population account for 31.7% and 52.6%,respectively, of the total plain areas in China (Li et al., 2012). Thefarmland of Huang-Huai-Hai Plain accounts for about one-sixth ofChina’s total and ranks the first in terms of land reclamation rate,with 50 million ha sowing area, 33% that of the whole country, andproducing 35–40% and 60–80% of China’s wheat and corn, respec-tively, which has played an important role in ensuring the nationalfood security (Kong et al., 2014; Li et al., 2012). In Huang-Huai-HaiPlain, there are a large number of rivers and lakes, which belong tofour major river basins, i.e., Yellow River Basin, Huaihe River Basin,Haihe River Basin and Coastal Jiaodong Basin. The total amount ofwater resources is only about 70 billion m3 and accounts for only
one-eighth of national average farmland water consumption permu (1 mu = 1/15 ha) (Zhang and Kong, 2014). Huang-Huai-Hai Plainis characterized by water shortages and diffusing pollution fromagricultural sources (Kong et al., 2014; Qiu, 2010; Yu et al., 2011).e study area.
Y. Liu et al. / Land Use Policy 47 (2015) 293–301 295
uai-Hai Plain in 2000 and 2010.
3
3
wTtcthtaadfdLlpmE1T2tsrIiaisaicwsCd
3
d
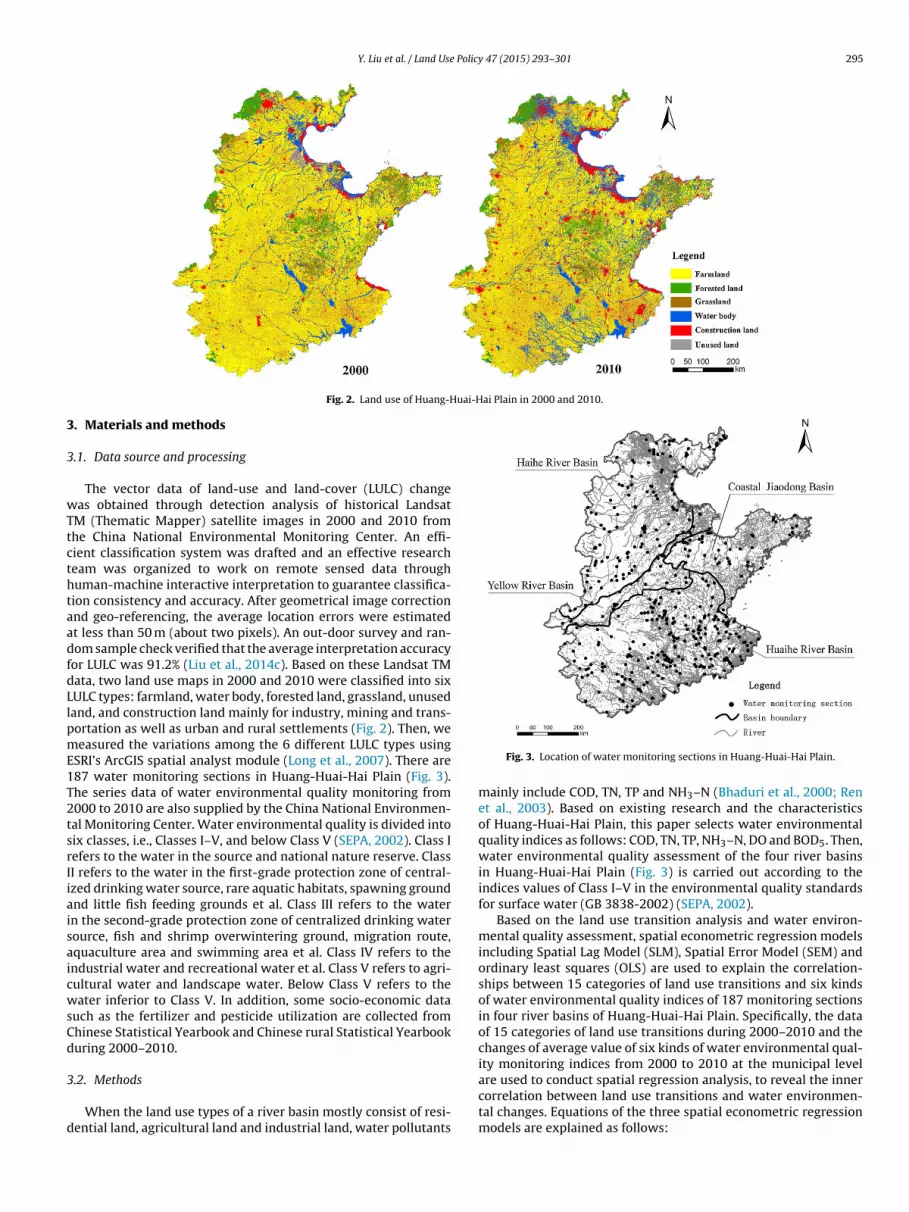
Fig. 2. Land use of Huang-H
. Materials and methods
.1. Data source and processing
The vector data of land-use and land-cover (LULC) changeas obtained through detection analysis of historical Landsat
M (Thematic Mapper) satellite images in 2000 and 2010 fromhe China National Environmental Monitoring Center. An effi-ient classification system was drafted and an effective researcheam was organized to work on remote sensed data throughuman-machine interactive interpretation to guarantee classifica-ion consistency and accuracy. After geometrical image correctionnd geo-referencing, the average location errors were estimatedt less than 50 m (about two pixels). An out-door survey and ran-om sample check verified that the average interpretation accuracyor LULC was 91.2% (Liu et al., 2014c). Based on these Landsat TMata, two land use maps in 2000 and 2010 were classified into sixULC types: farmland, water body, forested land, grassland, unusedand, and construction land mainly for industry, mining and trans-ortation as well as urban and rural settlements (Fig. 2). Then, weeasured the variations among the 6 different LULC types using
SRI’s ArcGIS spatial analyst module (Long et al., 2007). There are87 water monitoring sections in Huang-Huai-Hai Plain (Fig. 3).he series data of water environmental quality monitoring from000 to 2010 are also supplied by the China National Environmen-al Monitoring Center. Water environmental quality is divided intoix classes, i.e., Classes I–V, and below Class V (SEPA, 2002). Class Iefers to the water in the source and national nature reserve. ClassI refers to the water in the first-grade protection zone of central-zed drinking water source, rare aquatic habitats, spawning groundnd little fish feeding grounds et al. Class III refers to the watern the second-grade protection zone of centralized drinking waterource, fish and shrimp overwintering ground, migration route,quaculture area and swimming area et al. Class IV refers to thendustrial water and recreational water et al. Class V refers to agri-ultural water and landscape water. Below Class V refers to theater inferior to Class V. In addition, some socio-economic data
uch as the fertilizer and pesticide utilization are collected fromhinese Statistical Yearbook and Chinese rural Statistical Yearbookuring 2000–2010.
.2. Methods
When the land use types of a river basin mostly consist of resi-ential land, agricultural land and industrial land, water pollutants
Fig. 3. Location of water monitoring sections in Huang-Huai-Hai Plain.
mainly include COD, TN, TP and NH3–N (Bhaduri et al., 2000; Renet al., 2003). Based on existing research and the characteristicsof Huang-Huai-Hai Plain, this paper selects water environmentalquality indices as follows: COD, TN, TP, NH3–N, DO and BOD5. Then,water environmental quality assessment of the four river basinsin Huang-Huai-Hai Plain (Fig. 3) is carried out according to theindices values of Class I–V in the environmental quality standardsfor surface water (GB 3838-2002) (SEPA, 2002).
Based on the land use transition analysis and water environ-mental quality assessment, spatial econometric regression modelsincluding Spatial Lag Model (SLM), Spatial Error Model (SEM) andordinary least squares (OLS) are used to explain the correlation-ships between 15 categories of land use transitions and six kindsof water environmental quality indices of 187 monitoring sectionsin four river basins of Huang-Huai-Hai Plain. Specifically, the dataof 15 categories of land use transitions during 2000–2010 and thechanges of average value of six kinds of water environmental qual-ity monitoring indices from 2000 to 2010 at the municipal level
are used to conduct spatial regression analysis, to reveal the innercorrelation between land use transitions and water environmen-tal changes. Equations of the three spatial econometric regressionmodels are explained as follows: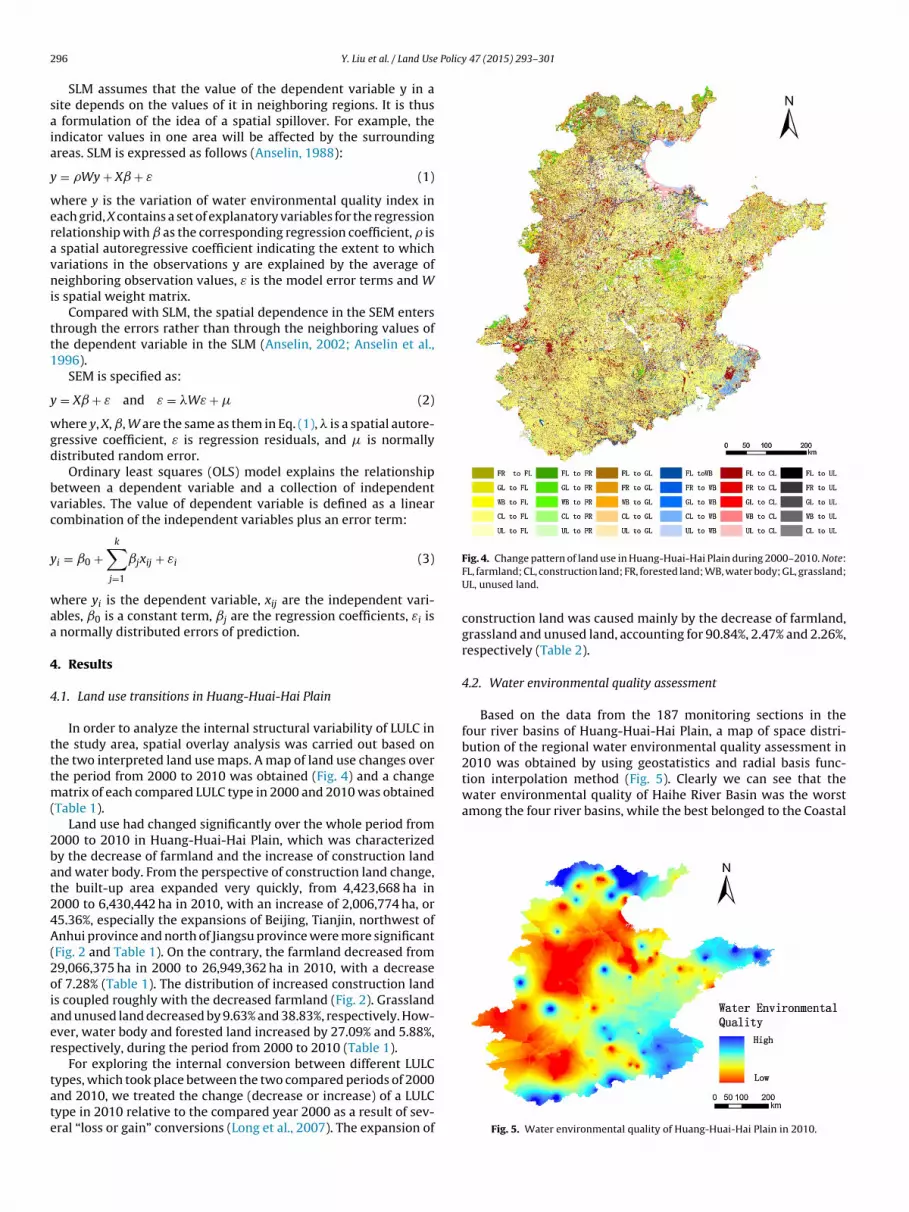
2 Policy 47 (2015) 293–301
saia
y
weravni
tt1
y
wgd
bvc
y
waa
4
4
tttm(
2bat24A(2oiaer
tate
2010 was obtained by using geostatistics and radial basis func-tion interpolation method (Fig. 5). Clearly we can see that thewater environmental quality of Haihe River Basin was the worstamong the four river basins, while the best belonged to the Coastal
96 Y. Liu et al. / Land Use
SLM assumes that the value of the dependent variable y in aite depends on the values of it in neighboring regions. It is thus
formulation of the idea of a spatial spillover. For example, thendicator values in one area will be affected by the surroundingreas. SLM is expressed as follows (Anselin, 1988):
= �Wy + X ̌ + ε (1)
here y is the variation of water environmental quality index inach grid, X contains a set of explanatory variables for the regressionelationship with ̌ as the corresponding regression coefficient, � is
spatial autoregressive coefficient indicating the extent to whichariations in the observations y are explained by the average ofeighboring observation values, ε is the model error terms and W
s spatial weight matrix.Compared with SLM, the spatial dependence in the SEM enters
hrough the errors rather than through the neighboring values ofhe dependent variable in the SLM (Anselin, 2002; Anselin et al.,996).
SEM is specified as:
= X ̌ + ε and ε = �Wε + � (2)
here y, X, ˇ, W are the same as them in Eq. (1), � is a spatial autore-ressive coefficient, ε is regression residuals, and � is normallyistributed random error.
Ordinary least squares (OLS) model explains the relationshipetween a dependent variable and a collection of independentariables. The value of dependent variable is defined as a linearombination of the independent variables plus an error term:
i = ˇ0 +k∑
j=1
ˇjxij + εi (3)
here yi is the dependent variable, xij are the independent vari-bles, ˇ0 is a constant term, ˇj are the regression coefficients, εi is
normally distributed errors of prediction.
. Results
.1. Land use transitions in Huang-Huai-Hai Plain
In order to analyze the internal structural variability of LULC inhe study area, spatial overlay analysis was carried out based onhe two interpreted land use maps. A map of land use changes overhe period from 2000 to 2010 was obtained (Fig. 4) and a change
atrix of each compared LULC type in 2000 and 2010 was obtainedTable 1).
Land use had changed significantly over the whole period from000 to 2010 in Huang-Huai-Hai Plain, which was characterizedy the decrease of farmland and the increase of construction landnd water body. From the perspective of construction land change,he built-up area expanded very quickly, from 4,423,668 ha in000 to 6,430,442 ha in 2010, with an increase of 2,006,774 ha, or5.36%, especially the expansions of Beijing, Tianjin, northwest ofnhui province and north of Jiangsu province were more significant
Fig. 2 and Table 1). On the contrary, the farmland decreased from9,066,375 ha in 2000 to 26,949,362 ha in 2010, with a decreasef 7.28% (Table 1). The distribution of increased construction lands coupled roughly with the decreased farmland (Fig. 2). Grasslandnd unused land decreased by 9.63% and 38.83%, respectively. How-ver, water body and forested land increased by 27.09% and 5.88%,espectively, during the period from 2000 to 2010 (Table 1).
For exploring the internal conversion between different LULC
ypes, which took place between the two compared periods of 2000nd 2010, we treated the change (decrease or increase) of a LULCype in 2010 relative to the compared year 2000 as a result of sev-ral “loss or gain” conversions (Long et al., 2007). The expansion ofFig. 4. Change pattern of land use in Huang-Huai-Hai Plain during 2000–2010. Note:FL, farmland; CL, construction land; FR, forested land; WB, water body; GL, grassland;UL, unused land.
construction land was caused mainly by the decrease of farmland,grassland and unused land, accounting for 90.84%, 2.47% and 2.26%,respectively (Table 2).
4.2. Water environmental quality assessment
Based on the data from the 187 monitoring sections in thefour river basins of Huang-Huai-Hai Plain, a map of space distri-bution of the regional water environmental quality assessment in
Fig. 5. Water environmental quality of Huang-Huai-Hai Plain in 2010.

Y. Liu et al. / Land Use Policy 47 (2015) 293–301 297
Table 1Change matrix of each compared LULC type in 2000 and 2010 in Huang-Huai-Hai Plain (ha).
LULC type in 2000 LULC type in 2010 Changes in 2010 (%)
FL FR GL WB CL UL Total
FL 25,235,074 320,182 155,761 502,219 2,806,220 46,919 29,066,375 −7.28FR 222,594 1,542,866 99,994 18,297 68,499 6538 1,958,788 5.88GL 193,778 147,565 1,358,491 33,527 76,311 57,686 1,867,359 −9.63WB 200,816 20,237 25,600 800,867 68,214 30,148 1,145,882 27.09CL 927,849 36,499 31,946 77,544 3,341,342 8487 4,423,668 45.36UL 169,250 6592 15,783 23,804 69,856 63,729 349,013 −38.83Total 26,949,362 2,073,941 1,687,575 1,456,258 6,430,442 213,507 38,811,085 –
Note: FL, farmland; CL, construction land; FR, forested land; WB, water body; GL, grassland; UL, unused land.
Table 2Internal conversions between LULC types from 2000 to 2010 and the percentages taken by corresponding types in such loss or gain conversions.
LULC type Loss or gain in 2010 (%) Type (1) Percent (%) Type (2) Percent (%) Type (3) Percent (%) Type (4) Percent (%) Type (5) Percent (%)
FL −7.28 CL 73.24 WB 13.11 FL 8.36 GL 4.07 UL 1.22FR 5.88 FL 60.29 GL 27.79 CL 6.87 WB 3.81 UL 1.24GL −9.63 FL 38.08 FL 29.00 CL 15.00 UL 11.33 WB 6.59WB 27.09 FL 76.63 CL 11.83 GL 5.12 UL 3.63 FL 2.79CL 45.36 FL 90.84 GL 2.47 UL 2.26 FL 2.22 WB 2.21
.49
N asslan
JiinwoTmcdH
btoabfttmNNWRcCtp
TW
N
UL −38.83 FL 59.33 CL 24
ote: FL, farmland; CL, construction land; FR, forested land; WB, water body; GL, gr
iaodong Basin. Specifically, the areas of water environmental qual-ty belonging to Class V and below Class V were mainly distributedn the central of Hebei province, northwest of Shandong province,orth of Henan and Anhui provinces, and south of Tianjin. Waterith Class IV was mainly distributed in the mid-west coastal area
f Shandong Peninsula and the northern part of Jiangsu province.he areas with Classes II and III of water environmental quality wereainly distributed in the north of Huang-Huai-Hai Plain, the east of
oastal area of Shandong Peninsula. Water with Class I was mainlyistributed in the two cities of and Zhangjiakou and Chengde ofebei province.
The water of Haihe River Basin mainly belonged to Class V andelow Class V in 2000. There were 35 and 4 water environmen-al quality monitoring sections, the water environmental qualityf which belonged to Class V and below Class V, respectively,ccounting for 53.85% and 6.15% of the monitoring sections in thisasin, while the number decreased to 27 and 8 in 2010, accountingor 41.54% and 12.31% of 65 total sections in this basin, respec-ively. Although the sections with Class V water decreased 8, buthat below Class V increased 4 during this period. In terms of
ajor water pollutants of Haihe River, there are DO, COD, BOD5,H3–N, volatile phenol and oil, which were distributed in theorth Canal flowing through Yulinzhuang section of Beijing and theangjiabai section of Langfang city of Hebei province, the Chahe
iver flowing through the Dongsongmen section of Cangzhouity of Hebei province and the Tianlongzhuang section of Dezhou
ity of Shandong province, and the Fuhe River flowing throughhe Anzhou and Jiaozhuang sections of Baoding city of Hebeirovince.able 3ater quality statistics of monitoring sections in Huang-Huai-Hai Plain in 2000 and 2010
Water quality index (mg/L) Mean SD
2000 2010 2000
DO 5.8348 6.8561 2.6139
BOD5 15.7779 7.4091 21.6699
NH3–N 6.1672 3.5369 10.8859
COD 83.9489 35.7828 96.9631
TN – 7.2410 –
TP – 0.4975 –
ote: The data of TN and TP in 2000 are lacked.
WB 8.34 GL 5.53 FL 2.31
d; UL, unused land.
The water of Huaihe River Basin mainly belonged to Classes IVand V, and below Class V, and the corresponding water environ-mental quality monitoring sections were 25, 11 and 27 in 2000,accounting for 33.78%, 14.86% and 36.49% of 74 total sections inthis basin, respectively; however, in 2010, the corresponding waterenvironmental quality monitoring sections were changed to 15, 9and 30, respectively. It is worth to mention that the sections withwater below Class V increased 3, although the general water envi-ronment was improved to some extent during this period. Themajor water pollutants of Huaihe River Basin included DO, COD,BOD5 and NH3–N, which were mainly distributed in the Huiji Riverand Wohe River in Bozhou city, the Heici River and Quanhe Riverin Fuyang city and the Kuihe River and Sui River in Suzhou city ofAnhui province.
The water of Yellow River Basin mainly belonged to Classes IIIand IV in 2000, and the water environmental quality was graduallygetting better. In 2010, water environmental quality of Yellow RiverBasin mainly belonged to Classes II and III instead. COD, NH3–N,and oil were the main water pollutants in this basin. The waterof Coastal Jiaodong Basin mainly belonged to Classes II–IV, andthe corresponding water environmental quality monitoring sec-tions were 3, 5 and 22 in 2000, respectively, but in 2010, whichwere changed to 5, 8 and 23, respectively. The increase of sectionswith Classes II and III water showed that the water environment inthis basin was improved obviously. The major water pollutants ofCoastal Jiaodong Basin included COD, BOD5 and Oil. COD and BOD5
were mainly distributed in the Xiaoqinghe River and ZhangzengheRiver flowing through Binzhou city and Weifang city of Shandongprovince. However, Oil was mainly distributed in the Xiaoqinghe.
Min Max
2010 2000 2010 2000 2010
2.3749 0.1000 0.1000 11.7600 14.92008.1255 1.3600 0.7500 125.4600 65.74005.8162 0.0060 0.0300 63.2455 37.1000
27.0169 7.5000 4.0800 413.9091 187.20008.5090 – 0.4750 – 46.38000.7796 – 0.0130 – 4.7990
2 Policy 47 (2015) 293–301
Rd
Hmswai8itio1lii
4e
aelqsfftT
m(cfpSaapcnaiflgrslltwarftmi
ochB
oeffi
cien
ts
betw
een
lan
d
use
tran
siti
ons
and
wat
er
envi
ron
men
tal q
ual
ity
ind
ices
chan
ges.
NH
3–N
DO
TN
TP
BO
D5
CO
D
OLS
SLM
SEM
OLS
SLM
SEM
OLS
SLM
SEM
OLS
SLM
SEM
OLS
SLM
SEM
OLS
SLM
SEM
−0.2
666a
−0.2
993b
−0.2
302a
0.05
68
0.04
34
0.04
88
−0.5
458b
−0.5
230b
−0.5
313b
−0.0
384
−0.0
325
−0.0
379a
−0.4
845a
−0.4
409a
−0.4
892b
−1.2
759
−1.2
905a
−1.1
214a
−0.3
689c
−0.3
491c
−0.3
940c
0.09
05a
0.09
65b
0.09
68b
−0.2
268
−0.2
395
−0.2
337
−0.0
527b
−0.0
557c
−0.0
518c
−0.7
911c
−0.8
124c
−0.7
812c
−2.0
512c
−2.0
443c
−2.2
270c
−0.2
024
−0.2
016
−0.2
483a
0.20
53b
0.21
49c
0.20
00c
−0.2
939
−0.2
914
−0.2
406
−0.0
323
−0.0
325
−0.0
299
−0.1
799
−0.1
920
−0.1
762
−1.1
365
−1.1
327
−1.1
252
−0.0
083
−0.0
038
0.01
86
0.00
62
0.00
81
0.00
51
0.01
48
0.01
12
−0.0
071
−0.0
001
−0.0
008
−0.0
012
0.00
93
0.00
60
0.00
34
0.02
69
0.02
83
0.10
470.
0474
0.05
44
0.06
33
0.01
18
0.01
45
0.01
17
−0.0
431
−0.0
450
−0.0
466
0.00
78
0.00
75
0.00
71
−0.0
014
−0.0
038
−0.0
054
−0.3
200
−0.3
198
−0.2
645
−0.1
630
−0.2
171
−0.2
311
−0.0
430
−0.0
614
−0.0
338
0.21
68
0.23
36
0.23
64
−0.0
350
−0.0
292
−0.0
309
−0.1
702
−0.1
178
−0.1
437
−0.5
131
−0.5
298
−0.8
391
−2.3
280
−2.2
449
−1.7
034
0.72
00
0.69
12
0.57
33
−4.5
794
−4.5
275
−4.8
141
−0.3
369
−0.3
425
−0.3
543
−7.2
709a
−7.4
799a
−7.4
804a
−10.
8652
−10.
7905
−7.5
457
−12.
1588
−11.
6916
a−1
2.41
61a
3.95
08
4.14
39
3.67
10
−19.
0507
−19.
1131
a−1
7.50
08a
−1.8
564
−1.8
706a
−1.8
127a
−11.
6524
−11.
7697
−11.
6964
−58.
2352
−58.
1400
a−5
5.20
39a
0.19
55
0.12
94
−0.0
475
−0.3
713
−0.4
251
−0.3
425
1.86
90
1.90
28
2.07
04a
0.01
69
0.02
73
0.03
09
−1.0
121
−1.0
500
−0.9
902
1.83
55
1.86
42
1.57
33
−3.5
959a
−3.5
873b
−3.9
775c
1.26
09a
1.32
73b
1.27
18a
−5.0
982a
−5.1
237b
−5.0
050b
−0.5
369a
−0.5
423b
−0.5
216b
−4.1
412
−4.1
634a
−4.0
590a
−16.
0241
a−1
6.04
33b
−18.
2727
b
0.12
50
0.04
32
0.12
64
−0.2
888
−0.3
152
−0.2
813
0.69
18
0.72
34
0.65
37
0.01
06
0.01
88
0.01
03
0.58
84
0.67
17
0.61
48
−0.7
223
−0.7
515
−0.4
959
−2.1
124
−2.1
892
−2.1
015
1.03
43
−1.0
831a
0.96
96
−5.5
944a
5.56
64b
5.63
59b
−0.3
152
−0.3
109
−0.3
161
−0.2
519
−0.1
418
−0.2
603
−4.8
505
−4.9
174
−5.5
341
1.46
01
1.60
92
1.72
32a
0.07
82
0.13
69
0.04
17
0.45
44
0.40
13
0.40
56
0.14
48
0.13
08
0.13
18
0.50
21
0.40
20
0.41
74
0.92
58
0.96
47
2.22
740.
3720
0.44
71a
0.39
35a
−0.1
897a
−0.1
749a
−0.2
0038
42b
0.55
66
0.52
99
0.57
25a
0.05
88
0.04
95
0.05
67a
0.44
57
0.36
32
0.42
45
2.42
00b
2.45
33b
2.49
50b
−1.2
197
−1.6
847
−1.0
561
−1.1
688
−1.1
766
−1.1
502
1.57
98
1.76
17
1.46
74
−0.5
662
−0.5
149
−0.5
791
0.34
75
1.04
63
0.62
62
−43.
3213
−43.
6441
−40.
2133
−0.1
124a
0.11
40b
0.04
14a
0.12
48b
0.08
43a
−0.0
109aa
−0.3
683a
−0.1
907b
0.12
65a
0.09
73b
0.05
15a
−0.2
857a
0.74
70
0.75
21
0.76
83
0.62
84
0.64
09
0.63
68
0.68
01
0.68
10
0.68
38
0.63
13
0.63
88
0.63
36
0.76
80
0.77
05
0.76
83
0.74
98
0.74
99
0.76
13
lan
d;
CL,
con
stru
ctio
n
lan
d;
FR, f
ores
ted
lan
d;
WB
, wat
er
bod
y;
GL,
gras
slan
d;
UL,
un
use
d
lan
d.
ce
at
10%
.ce
at
5%.
ce
at
1%.
98 Y. Liu et al. / Land Use
iver and Zhimaihe River flowing through Dongying city of Shan-ong province.
The statistical analysis of the water environmental quality inuang-Huai-Hai Plain (Table 3), i.e., the maximum, minimum andean value of the major water environmental quality indices
howed that on the whole the water environment in the study areaas obviously improved. For example, the maximum value of COD
ppeared in Huangzhuang monitoring section of Guangfu River, Jin-ng city of Shandong province in 2000 was 132.44 mg/L, which was.33 times of the limited standard value of Class V water. However,
n 2010 the value reduced to 10.53 mg/L, which was much betterhan that in 2000. The maximum value of BOD5 had been mon-tored in Dongjiazhuang section of Bailanghe River, Weifang cityf Shandong province in 2000 was 125.46 mg/L, which was about2.5 times of the limited standard value of Class V water. Neverthe-
ess, in 2010 the value reduced to 7.64 mg/L, which was also muchmproved than that in 2000. Of course, there was also certain indexncreased during this period, e.g., DO (Table 3).
.3. Correlationships between land use transitions and waternvironmental changes
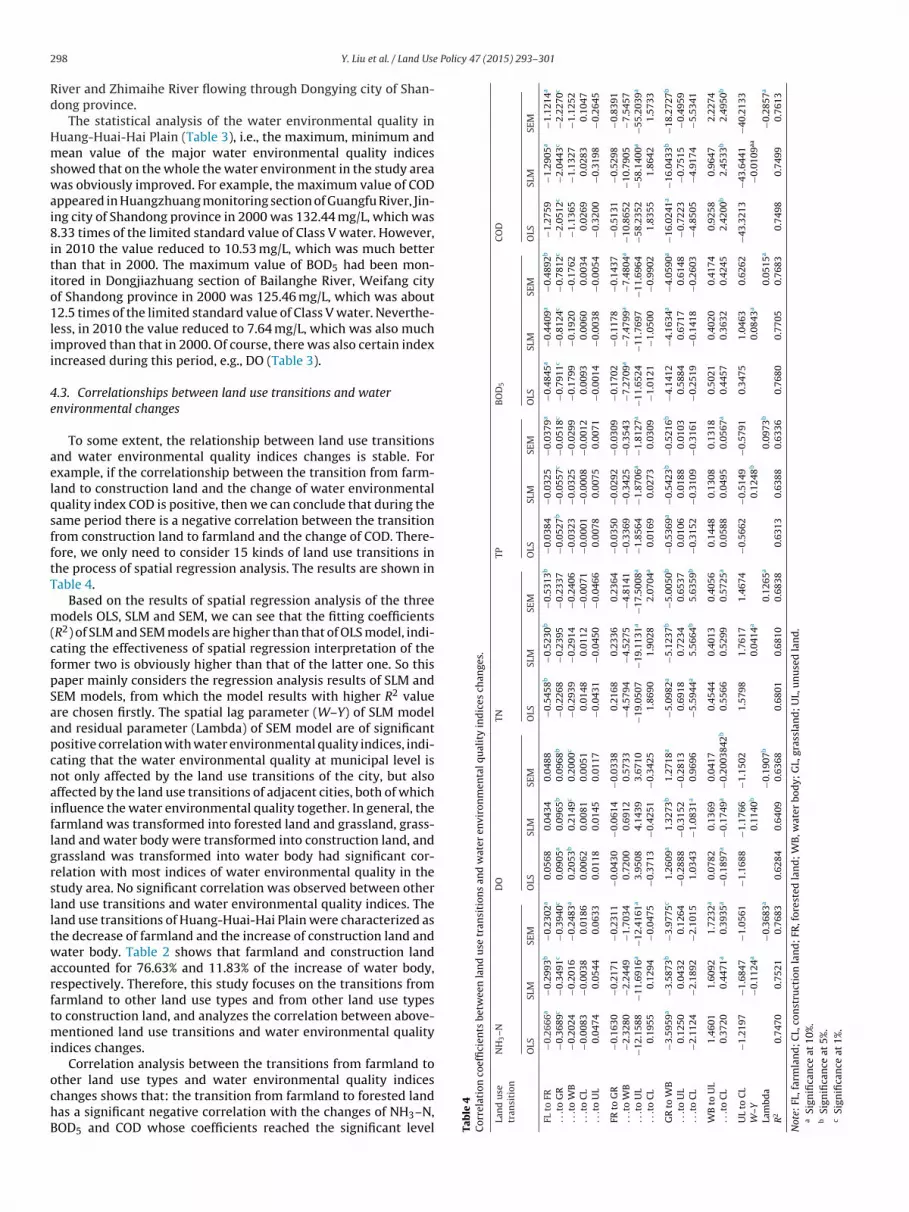
To some extent, the relationship between land use transitionsnd water environmental quality indices changes is stable. Forxample, if the correlationship between the transition from farm-and to construction land and the change of water environmentaluality index COD is positive, then we can conclude that during theame period there is a negative correlation between the transitionrom construction land to farmland and the change of COD. There-ore, we only need to consider 15 kinds of land use transitions inhe process of spatial regression analysis. The results are shown inable 4.
Based on the results of spatial regression analysis of the threeodels OLS, SLM and SEM, we can see that the fitting coefficients
R2) of SLM and SEM models are higher than that of OLS model, indi-ating the effectiveness of spatial regression interpretation of theormer two is obviously higher than that of the latter one. So thisaper mainly considers the regression analysis results of SLM andEM models, from which the model results with higher R2 valuere chosen firstly. The spatial lag parameter (W–Y) of SLM modelnd residual parameter (Lambda) of SEM model are of significantositive correlation with water environmental quality indices, indi-ating that the water environmental quality at municipal level isot only affected by the land use transitions of the city, but alsoffected by the land use transitions of adjacent cities, both of whichnfluence the water environmental quality together. In general, thearmland was transformed into forested land and grassland, grass-and and water body were transformed into construction land, andrassland was transformed into water body had significant cor-elation with most indices of water environmental quality in thetudy area. No significant correlation was observed between otherand use transitions and water environmental quality indices. Theand use transitions of Huang-Huai-Hai Plain were characterized ashe decrease of farmland and the increase of construction land andater body. Table 2 shows that farmland and construction land
ccounted for 76.63% and 11.83% of the increase of water body,espectively. Therefore, this study focuses on the transitions fromarmland to other land use types and from other land use typeso construction land, and analyzes the correlation between above-
entioned land use transitions and water environmental qualityndices changes.
Correlation analysis between the transitions from farmland to
ther land use types and water environmental quality indiceshanges shows that: the transition from farmland to forested landas a significant negative correlation with the changes of NH3–N,OD5 and COD whose coefficients reached the significant level Table
4C
orre
lati
on
c
Lan
d
use
tran
siti
on
FL
to
FR
. .
.to
GR
. .
.to
WB
. .
.to
CL
. .
.to
UL
FR
to
GR
. .
.to
WB
. .
.to
UL
. .
.to
CL
GR
to
WB
. .
.to
UL
. .
.to
CL
WB
to
UL
. .
.to
CL
UL
to
CL
W–Y
Lam
bda
R2
Not
e:
FL, f
arm
aSi
gnifi
can
bSi
gnifi
can
cSi
gnifi
can

Policy
oiasccof(a1acsprlttcbtrre
tclcgwtTiCcflwwdtmse
5
aHtudPolmHHtwte
Y. Liu et al. / Land Use
n statistics, especially with TN at the significant level of 5%,ndicating that the amount of NH3–N, BOD5, COD and TN decreaseds the farmland transformed into forested land (Table 4). The tran-ition from farmland to grassland has also a significant negativeorrelation with the changes of NH3–N, TP, BOD5 and COD whoseoefficients reached 1% significant level, indicating that the amountf NH3–N, TP, BOD5 and COD decreased as the farmland trans-ormed into grassland, while DO increased in this kind of transitionTable 4). Besides, the transition from farmland to water body has
significant positive correlation with DO at the significant level of%. Due to the transition from farmland to forested land, grasslandnd water body, there is no use of chemical fertilizers and pesti-ides. Along with the functions plants and grass have in reducingoil erosion and adsorption of pollutants can effectively reduce theollutants runoff into the waters and then improve the water envi-onmental quality. The increase of water body area can make dryand or rivers gradually restore the ecological function and improveheir purification ability, which has positive effects on improvinghe water environmental quality. From the above analysis, we canonclude that the increases of grassland, forested land and waterody have positive effects on water environmental quality whilehe increase of farmland has negative effects on the water envi-onmental quality, which is also consistent with recently relatedesearch (Fiquepron et al., 2013; Leon-Munoz et al., 2013; Zhangt al., 2011; Zhao et al., 2012).
Correlation analysis between the transitions from other land useypes to construction land and water environmental quality indiceshanges shows that: the transition from grassland to constructionand has a significant positive correlation with TN at the signifi-ant level of 5%, indicating that the amount of TN increased as therassland transformed into construction land. The transition fromater body to construction land has a significant positive correla-
ion with COD at the significant level of 5%, and with NH3–N andN whose coefficients also reached 10% significant level, but signif-cant negative correlation with DO, indicating that the amount ofOD, NH3–N and TN increased as the water body transformed intoonstruction land, while DO decreased as the water body trans-ormed into construction land. Besides, the transition from forestedand to construction land also has a significant positive correlation
ith TN at the significant level of 10%. During 2000–2010, thereas 90.84% of the increased construction land derived from theecrease of farmland (Table 2), but the correlation between theransition from farmland to construction land and water environ-
ental quality indices changes is not significant (Table 4), whichhows that construction land use and farmland use have almostqual negative effects on water environmental quality.
. Conclusions and discussion
This paper firstly analyzes the land use transitions, and thenssesses the water environmental quality changes of Huang-Huai-ai Plain. Finally, it discusses the correlations between land use
ransitions and water environmental quality indices changes bysing spatial regression analysis method. The results indicated that,uring the research period, land use patterns of Huang-Huai-Hailain changed significantly, which were characterized by the lossf large quantities of farmland and the increase of constructionand and water body. According to the results of water environ-
ental quality assessment, the water environmental quality ofaihe River basin was the worst among the four river basins ofuang-Huai-Hai Plain, while the Coastal Jiaodong Basin showed
he best. On the whole, the water environment in the study areaas obviously improved, but there also existed partial deteriora-
ion as evidenced by the increase of monitoring sections with waternvironmental quality below Class V during 2000–2010, three in
47 (2015) 293–301 299
Huaihe River Basin and four in Haihe River Basin. In general, theincreases of grassland, forested land and water body have posi-tive effects on water environmental quality while farmland andconstruction land have negative effects on that. Interestingly, thecorrelation between the transition from farmland to constructionland and water environmental quality indices changes is not sig-nificant, which shows that construction land use and farmland usehave almost equal negative effects on water environmental qual-ity. From the above analysis, we can infer that accompanied byrapid industrialization and urbanization, large quantities of farm-land and other non-construction land have been transformed intoconstruction land gradually, which further led to the changes ofwater environmental quality.
The farmland accounts for 67.63% of the total area of Huang-Huai-Hai Plain, which can reflect the common important role offarmland in the socio-economic development of other developingcountries in East Asia even other continents. Although the farm-land showed a decreasing trend, it is still the major land use typein most developing countries. Therefore, the chemical fertilizerand pesticide washed away from farmland are still important fac-tors affecting local water environmental quality in the future. So,strengthening the management of agricultural non-point sourcepollution is pivotal to improve local water environmental quality. Inaddition, along with the farmland was transformed into construc-tion land, a large number of industrial and domestic sewage wouldbe produced, which must be strictly controlled to satisfy dischargestandards and to ensure water environmental quality and safety.Based on the above analysis, the authors put forward some implica-tions for the formulation of sound decisions from the perspectivesof land resource rational use and water resource protection, espe-cially the farming practices to improve the water environmentalquality of plain areas in China and other developing countries.
First of all, to encourage the farmers rationally use the chem-ical fertilizer and pesticide so as to realize the ecological farmingpractices and the sustainable land use. Different types of farmingpractices such as application of chemical fertilizer and pesticides,and straw processing may cause different influences on surfacewater environmental quality (De Girolamo and Lo Porto, 2012;Ouyang et al., 2004; Valle et al., 2014), so a sound use of fertil-izers could substantially reduce the amount of nutrients flowinginto surface waters, although the effects of such a policy on cropyield and farm income would be negative in some cases. Therefore,at the household level, we need to strengthen the basic education toimprove farmers’ ability to carry out ecological farming practices,at the same time, strengthen the agricultural technology and sci-ence popularization such as soil testing in order to control the use ofpesticide and fertilizer application amount and develop ecologicalagriculture and organic agriculture. In addition, it is indispensableto apply the economic measures and policies to promote sustain-able land use, by subsidizing the economic loss of farmers due toadopting abovementioned ecological farming practices.
Secondly, to strengthen the management of rural constructionland is also an important way to mitigate the negative effects onwater environmental quality. As for rural settlements and ruralland for affiliated facilities, the land uses of breeding livestock andpoultry and residential activities would also cause heavy non-pointpollution if not treated properly (Casali et al., 2010; Seeboonruang,2012), so the layout and construction of the disposal facilities forliving garbage and livestock and poultry manure are of great impor-tance in Huang-Huai-Hai Plain. The location of village garbage andsewage collection, storage and disposal places must be distributedproperly in order to connect with the garbage and sewage treat-
ment facilities of the town and the city. So domestic sewage can betreated unified, avoid dispersed discharging. As for those farmerswho live scattered with complex terrain conditions should con-struct a decentralized treatment of sewage, sullage, and garbage by
3 Polic
itpTtt
npltaalmFhulsSssi
teiocastdtppattlswt
A
dKaR
R
A
A
A
A
A
B
00 Y. Liu et al. / Land Use
ndividual houses and establishments (Sheela et al., 2014). Besides,he location of livestock and poultry breeding must be distributedroperly too, ensuring it is not located in or near the living places.o advocate the solid–liquid pollutants of livestock and poultryreated respectively, solid waste for the production of organic fer-ilizer, and liquid waste discharges after biochemical treatment.
Thirdly, to improve the water environmental quality by ratio-ally compiling and implementing village and town land uselanning as well as urban planning. It is necessary to compile special
and use planning at village and town level to promote the bet-er integration of water resources management with land use plannd river basin management plan (Fidelis and Roebeling, 2014; Qind Altinakar, 2011). Since the increases of grassland and forestedand have positive effects on water environmental quality (Table 4),
ore attentions need to be paid to the urban green space system.or a long time, green space planning has been a relatively loop-oles in China’s urban and land use planning. The green land issually relocated on edges or fragmented belt, resulting in its iso-
ation with original green land and limit its ecological functionsuch as improving water environmental quality (Long et al., 2014).o, the urban areas of Huang-Huai-Hai Plain need to plan to con-truct more urban green land such as suburban forest park, waterource conservation forests, wide urban forest belt, large lawn andntroducing farmland into the city, and so on.
China is experiencing a rapid and far-reaching urban and ruralransition development (Liu et al., 2014b; Long et al., 2012; Tant al., 2013), which is also being experienced by other develop-ng countries to a great extent. In the future, with the accelerationf industrialization and urbanization, China and other developingountries will face an accelerated land use transitions and undergo
process of agricultural intensification, which will bring about fore-eeable threatening for water environmental quality, and affecthe regional ecological environment and economical sustainableevelopment. As such, we should strengthen the study of land useransitions, especially on the changes of recessive land use mor-hology includes land use features in terms of aspects of quality,rice, property rights, management mode, input and productivebility (Long, 2014a), and their relations with the groundwater andhe biophysical basis that determines the land-use/water interac-ions (Garmendia et al., 2012; Ouyang et al., 2014), so can we use theand resource sustainably, and promote the coordinated economic,ocial and ecological development of the plain areas of China asell as other developing countries undergoing rapid urban–rural
ransformation development.
cknowledgments
This work was supported by the National Natural Science Foun-ation of China (Grant Nos. 41171149 and 41130748), the Nationaley Technology R&D Program of China (Grant No. 2014BAL01B05)nd Non-profit Industry Financial Program of Ministry of Land andesources of China (Grant No. 201511004-3).
eferences
miri, B.J., Nakane, K., 2009. Modeling the linkage between river water environmen-tal quality and landscape metrics in the Chugoku District of Japan. Water Resour.Manag. 23 (5), 931–956.
ndersson, E., Brogaard, S., Olsson, L., 2011. The political ecology of land degradation.Annu. Rev. Environ. Resour. 36, 295–319.
nselin, L., 1988. Spatial Econometrics: Methods and Models. Kluwer AcademicPublisher, Dordrecht.
nselin, L., 2002. Under the hood: issues in the specification and interpretation ofspatial regression analysis. Agric. Econ. 27, 247–267.
nselin, L., Bera, A., Florax, R., Yoon, M., 1996. Simple diagnostic tests for spatialdependence. Reg. Sci. Urban Econ. 26, 77–104.
asnyat, P., Teeter, L.D., Flynn, K.M., Lockaby, B.G., 1999. Relationships between land-scape characteristics and non-point source pollution inputs to coastal estuaries.Environ. Manag. 23 (4), 539–549.
y 47 (2015) 293–301
Bhaduri, B., Harbor, J., Engel, B., 2000. Assessing watershed-scale long-term hydro-logic impacts of land-use change using a GIS-NPS model. Environ. Manag. 26 (6),643–658.
Cai, Y.L., 2011. Understanding environmental change planning sustainable develop-ment: development directions for geography in China. Bull. Chin. Acad. Sci. 26(4), 390–398 (in Chinese).
Cai, Y.L., 2013. On geography in contemporary scientific and social perspectives.Chin. J. Nat. 35 (1), 30–39 (in Chinese).
Casali, J., Gimenez, R., Diez, J., Alvarez-Mozos, J., 2010. Sediment production andwater environmental quality of watersheds with contrasting land use in Navarre(Spain). Agric. Water Manag. 97 (10), 1683–1694.
Chen, L.D., Fu, B.J., Xu, J.Y., Gong, J., 2003. Location-weighted landscape contrastindex: a scale independent approach for landscape pattern evaluation basedon “Source-Sink” ecological processes. Acta Ecol. Sin. 23 (11), 2406–2413 (inChinese).
Chen, R.S., Ye, C., Cai, Y.L., Xing, X.S., Chen, Q., 2014. Rural out-migration and landusetransition in China: past, present and trend. Land Use Policy 40, 101–110.
De Girolamo, A.M., Lo Porto, A., 2012. Land use scenario development as a tool forwatershed management within the Rio Mannu Basin. Land Use Policy 29 (3),691–701.
Duncan, R., 2014. Regulating agricultural land use to manage water environmentalquality: the challenges for science and policy in enforcing limits on non-pointsource pollution in New Zealand. Land Use Policy 41, 378–387.
Fidelis, T., Roebeling, P., 2014. Water resources and land use planning systems inPortugal-exploring better synergies through Ria de Aveiro. Land Use Policy 39,84–95.
Fiquepron, J., Garcia, S., Stenger, A., 2013. Land use impact on water environmentalquality: valuing forest services in terms of the water supply sector. J. Environ.Manag. 126, 113–121.
Fu, B.J., Zhao, W.W., Chen, L.D., Liu, Z.F., Lu, Y.H., 2005. Eco-hydrological effects oflandscape pattern change. Landsc. Ecol. Eng. 1 (1), 25–32.
Gao, C., Zhu, J.Y., Dou, Y.J., Zhang, T.L., 2004. Landscape management practices forthe control of non-point source pollution: methods and principals. Acta Ecol.Sin. 24 (1), 109–116 (in Chinese).
Garmendia, E., Mariel, P., Tamayo, I., Aizpuru, I., Zabaleta, A., 2012. Assessing theeffect of alternative land uses in the provision of water resources: evidence andpolicy implications from southern Europe. Land Use Policy 29, 761–770.
Jia, L., Wang, W.Y., Li, Y.H., Yang, L.S., 2010. Heavy metals in soil and crops of anintensively farmed area: a case study in Yucheng city, Shandong province, China.Int. J. Environ. Res. Public Health 7 (2), 395–412.
Johnson, L.B., Richards, C., Host, G.E., Arthur, J.W., 1997. Landscape influenceson water chemistry in midwestern stream ecosystems. Freshw. Biol. 37 (1),193–208.
King, R.S., Baker, M.E., Whigham, D.F., 2005. Spatial considerations for linking water-shed land cover to ecological indicators in streams. Ecol. Appl. 15 (1), 137–153.
Kong, X.B., Lai, R., Li, B.G., 2014. Fertilizer intensification and its impacts in China’sHHH plains. Adv. Agron. 125, 135–169.
Lambin, E.F., Meyfroidt, P., 2010. Land use transitions: socio-ecological feedbackversus socio-economic change. Land Use Policy 27 (2), 108–118.
Leon-Munoz, J., Echeverria, C., Marce, R., Riss, W., Sherman, B., Iriarte, J.L., 2013. Thecombined impact of land use change and aquaculture on sediment and waterenvironmental quality in oligotrophic Lake Rupanco. J. Environ. Manag. 128,283–291.
Li, X.B., 2008. Theoretical hypotheses about agricultural land use changes and therelevant propositions about environmental impacts. Adv. Earth Sci. 23 (11),1124–1129 (in Chinese).
Li, X.B., 2009. Research priorities for land use in the accelerated phase of urbaniza-tion. China Popul. Resour. Environ. 19 (5), 1–5 (in Chinese).
Li, X.B., Hao, H.G., Ran, S.H., Zhu, H.Y., Tian, Y.J., 2010a. Management transition ofthe ecological building in China and its demand for science and technologyinnovations. Acta Ecol. Sin. 30 (12), 3340–3345 (in Chinese).
Li, Y.R., Liu, Y.S., Long, H.L., 2012. Characteristics and mechanism of village trans-formation development in typical regions of Huang-Huai-Hai plain. Acta Geogr.Sin. 67 (6), 771–782 (in Chinese).
Li, Y.R., Liu, Y.S., Long, H.L., Guo, Y.J., 2013. Village transformation development,resources and environment effects and their optimal regulation in the suburbof metropolitan: the case of Beicun in Shunyi District, Beijing. Acta Geogr. Sin.68 (6), 825–838 (in Chinese).
Li, Y.R., Long, H.L., Liu, Y.S., 2010b. Industrial development and land use/cover changeand their effects on local environment: a case study of Changshu in easterncoastal China. Front. Environ. Sci. Eng. China 4 (4), 438–448.
Liu, J.Y., Kuang, W.H., Zhang, Z.X., Xu, X.L., Qin, Y.W., Ning, J., Zhou, W.C., Zhang,S.W., Li, R.D., Yan, C.Z., Wu, S.X., Shi, X.Z., Jiang, N., Yu, D.S., Pan, X.Z., Chi, W.F.,2014c. Spatiotemporal characteristics, patterns, and causes of land-use changesin China since the late 1980s. J. Geogr. Sci. 24 (2), 195–210.
Liu, Y., Huang, X.J., Yang, H., Zhong, T.Y., 2014a. Environmental effects of land-use/cover change caused by urbanization and policies in Southwest China Karstarea: a case study of Guiyang. Habitat Int. 44, 339–348.
Liu, Y.S., Fang, F., Li, Y.H., 2014b. Key issues of land use in China and implications forpolicy making. Land Use Policy 40, 6–12.
Liu, Y.S., Wang, J.Y., Long, H.L., 2010. Analysis of arable land loss and its impact on
rural sustainability in Southern Jiangsu Province of China. J. Environ. Manag. 91(3), 646–653.Long, H.L., 2014a. Land consolidation: an indispensable way of spatial restructuringin rural China. J. Geogr. Sci. 24 (2), 211–225.
Long, H.L., 2014b. Land use policy in China: introduction. Land Use Policy 40, 1–5.
Policy
L
L
L
L
M
M
N
O
O
Q
QR
R
S
S
Y. Liu et al. / Land Use
ong, H.L., Li, Y.R., Liu, Y.S., Woods, M., Zou, J., 2012. Accelerated restructuring in ruralChina fueled by ‘increasing vs. decreasing balance’ land-use policy for dealingwith hollowed villages. Land Use Policy 29, 11–22.
ong, H.L., Liu, Y.Q., Hou, X.G., Li, T.T., Li, Y.R., 2014. Effects of land use transitions dueto rapid urbanization on ecosystem services: implications for urban planning inthe new developing area of China. Habitat Int. 44, 536–544.
ong, H.L., Liu, Y.S., Wu, X.Q., Dong, G.H., 2009. Spatio-temporal dynamic patterns offarmland and rural settlements in Su-Xi-Chang region: implications for buildinga new countryside in coastal China. Land Use Policy 26 (2), 322–333.
ong, H.L., Tang, G.P., Li, X.B., Heilig, G.K., 2007. Socio-economic driving forces ofland-use change in Kunshan, the Yangtze River delta economic area of China. J.Environ. Manag. 83, 351–364.
ehaffey, M.H., Nash, M.S., Wade, T.Q., 2005. Linking land cover and water environ-mental quality in New York city’s supply watersheds. Environ. Monit. Assess.107, 29–44.
ou, B., Wang, Q.C., Hershey, A.E., Yu, H.L., Guo, B.Q., 2004. Land-use, tream order andstream water physical and chemical qualities. Acta Ecol. Sin. 24 (7), 1486–1492(in Chinese).
ational Bureau of Statistics of China (NBSC), 2012. China Statistical Yearbook. ChinaStatistics Press, Beijing.
uyang, J.L., Song, C.M., Yu, Z.R., Zhang, F.R., 2004. The farm household’s choice ofland use type and its effectiveness on land quality and environment in Huang-Huai-Hai Plain. J. Nat. Resour. 19 (1), 1–11 (in Chinese).
uyang, Y., Zhang, J.E., Cui, L.H., 2014. Estimating impacts of land use on groundwaterenvironmental quality using trilinear analysis. Environ. Monit. Assess. 186 (9),5353–5362.
i, H.H., Altinakar, M.S., 2011. A conceptual framework of agricultural land use plan-ning with BMP for integrated watershed management. J. Environ. Manag. 92 (1),149–155.
iu, J., 2010. China faces up to groundwater crisis. Nature 466, 308.en, W., Zhong, Y., Meligrana, J., 2003. Urbanization, land use, and water environ-
mental quality in Shanghai: 1947–1996. Environ. Int. 29 (5), 649–659.obinson, G.M., Carson, D.A., 2013. Applying landscape science to natural resource
management. Ecol. Soc. 18 (1), 32, http://dx.doi.org/10.5751/ES-05639-180132eeboonruang, U., 2012. A statistical assessment of the impact of land uses on surface
water environmental quality indexes. J. Environ. Manag. 101, 134–142.heela, A.M., Letha, J., Swarnalatha, K., Baiju, K.V., Sankar, D., 2014. Urgency for
sustainable development in coastal urban areas with reference to weather pat-tern, land use, and water environmental quality. Environ. Monit. Assess. 186 (5),3221–3237.
47 (2015) 293–301 301
Short, A.G., 2013. Governing change: land-use change and the prevention of non-point source pollution in the North Coastal Basin of California. Environ. Manag.51 (1), 108–125.
State Environmental Protection Administration (SEPA), 2002. Environmental Qual-ity Standards for Surface Water (GB 3838-2002).
Tan, M.H., Robinson, G.M., Li, X.B., 2011. Urban spatial development and land use inBeijing: implications from London’s experiences. J. Geogr. Sci. 21, 49–64.
Tan, M.H., Robinson, G.M., Li, X.B., Xin, L.J., 2013. Spatial and temporal variabilityof farm size in China in context of rapid urbanization. Chin. Geogr. Sci. 23 (5),607–619.
Turner, I.I., Lambin, B.L., Reenberg, E.F.A., 2007. The emergence of land change sci-ence for global environmental change and sustainability. Proc. Natl. Acad. Sci. U.S. A. 104 (52), 20666–20671.
Uuemaa, E., Roosaare, J., Mander, U., 2007. Landscape metrics as indicators ofriver water environmental quality at catchment scale. Nord. Hydrol. 38 (2),125–138.
Valle, R.F., Varandas, S.G.P., Fernandes, L.F.S., Pacheco, F.A.L., 2014. Environmen-tal land use conflicts: a threat to soil conservation. Land Use Policy 41,172–185.
Versace, V.L., Ierodiaconou, D.F., 2008. Regional scale models for relating land coverto basin surface water environmental quality using remotely sensed data in aGIS. Environ. Monit. Assess. 142 (2), 171–184.
Yu, C.Q., Gong, P., Yin, Y.Y., 2011. China’s water crisis needs more than words. Nature470, 307.
Zampella, R.A., Procopio, N.A., Lathrop, R.G., 2007. Relationship of land use/landcover patterns and surface–water environmental quality in the Mullica riverbasin. J. Am. Water Resour. Assoc. 43 (3), 594–694.
Zhang, S.H., Liu, Y., Wang, T.W., 2014. How land use change contributes to reduc-ing soil erosion in the Jialing River Basin, China. Agric. Water Manag. 133,65–73.
Zhang, X.L., Kong, X.B., 2014. The sustainable utilization of cultivated land resourcesin Huang-Huai-Hai Plain under groundwater crisis. China Land Sci. 28 (5), 90–96(in Chinese).
Zhang, Y.J., Chen, S., Xiang, J.C., 2011. Correlation between the water environ-mental quality and land use composition in the river side area: a case of
Chaohu Lake Basin in China. Resour. Environ. Yangtze Basin 20 (9), 1054–1060(in Chinese).Zhao, P., Xia, B.C., Qin, J.Q., Zhao, H.R., 2012. Multivariate correlation analysisbetween landscape pattern and water environmental quality. Acta Ecol. Sin. 32(8), 2331–2341 (in Chinese).