labour market flexibility and innovation: geographical and technological determinants
TRANSCRIPT
Labour market flexibility andinnovation: geographical andtechnological determinants
Luca Pieroni and Fabrizio PompeiDepartment of Economics, Finance and Statistics,
University of Perugia, Perugia, Italy
Abstract
Purpose – This paper aims to shed light upon the controversial relationship between labour marketflexibility and innovation in Italy, paying attention both to inter-sectoral heterogeneity and to theregional differences.
Design/methodology/approach – A set of hypotheses concerning the context-dependentrelationship between labour market flexibility and innovation has been formulated by combiningthe main results of the theoretical literature concerning this topic. Regional patents are used as a proxyof innovation, while job turnover and wages represent labour market indicators of flexibility.Non-parametric models and dynamic structural specification of panel data have been estimated to testthe aforementioned hypotheses.
Findings – The results show that higher job turnover has a significant and negative impact onpatent activities in regional sectors of northern Italy, while a positive and significant effect of blue andwhite collar wages has been generally found in the estimations.
Research limitations/implications – There is a lack of updated information regarding labourmarket data in the Italian economy.
Practical implications – Knowing in which sectoral and regional context labour flexibility has (ordoes not have) a positive influence on innovation plays a key role for the decisions of policy makers.
Originality/value – This paper deals with the influence that the heterogeneity of the contexts (at thesectoral and geographical level) exerts on the relationship between the labour market and innovation.Moreover, the endogenous character of this relationship and the cumulative nature of innovativeactivities have been taken into account by means of a parsimonious dynamic econometric model.
Keywords Labour market, Flexible labour, Innovation, Italy
Paper type Research paper
IntroductionIn the last decades, new approaches have accompanied the classical “compensationliterature” in analysing the relationships between innovation and the labour market(Vivarelli and Pianta, 2000; Aghion and Howitt, 1994; Mortensen and Pissarides, 1998).The skill-biased technological changes (SBTC) theory has largely analysed the impactof innovations on the wages and skills of the workforce (Bound and Johnson, 1992;Berman et al., 1994; Johnson, 1997; Mortensen and Pissarides, 1999; Mincer, 2003).Theoretical and empirical results have dealt with the magnitude of the shift of therelative demand for skilled labour, yielding a new equilibrium characterised by ahigher relative wage and a higher share of skilled employment. According to this pointof view, wage inequality has been seen as a direct consequence of higher innovationactivities.
The current issue and full text archive of this journal is available at
www.emeraldinsight.com/0143-7720.htm
IJM29,3
216
International Journal of ManpowerVol. 29 No. 3, 2008pp. 216-238q Emerald Group Publishing Limited0143-7720DOI 10.1108/01437720810878897
In the same field of studies, other authors have stressed the importance ofcomplementarity between investments in innovation activities and the demand forskilled labour (Machin and Van Reenen, 1998; Acemoglu, 2002). The importance oflabour market regulation emerges in shaping the level and the growth rate ofinnovation activity when an endogenous characterisation is recognised in theaforementioned relationship (Acemoglu, 1997a). Even though labour market flexibilityis conditioned by the innovation rate, since it can affect human capital investments bymeans of job training and learning by doing, the characteristics of labour markets areresponsible for feedbacks on innovative abilities (Acemoglu, 1997b).
On the other hand, qualitative surveys on innovation in regional economic systemshave shown the important influence that the labour market has on innovation (Storperand Scott, 1995). According to these studies, labour market regulation mightpotentially affect the diffusion of knowledge and its accumulation process in the localproduction system.
The impact of the labour market on innovation has been explored in some empiricalanalyses. For example, Bassanini and Ernst (2002) carried out a comparative surveyamong OECD countries in which the impact of product and labour market regulationson innovation was highlighted. Michie and Sheehan (2003), using a survey of UK firms,explicitly investigated firms’ use of various practices of flexible work connected withthe innovative activities.
Following the empirical specification of these models, the present paper aims toanalyse the impact of the labour market flexibility indicators, i.e. job turnover and realwages, on the innovative activities of Italian industry in the 1990-1996 period, Weattempt to take a step forward with respect to other empirical surveys. Firstly, adynamic model is estimated to account for the likely endogeneity between innovationand labour market flexibility relationships in which the static econometricspecification is nested. Secondly, through the lagged variable of innovation, we canaccount for persistent behaviours in innovation since in some sectors the innovativeprocess may be characterised by cumulative effects.
In order to obtain a clear picture in shaping the link between innovation and thelabour market indicators, our empirical strategy includes detailed non-parametricanalyses jointly with the estimations of the dynamic parametric models. Thesensitivity analysis of our parametric model was performed by including or excludingvariables that regard the development patterns at the regional level.
It is worth noting that the Italian economic debate around the labour market hasbeen particularly animated in recent years. The lack of flexibility has often beenidentified as the determinant of a pathological unemployment rate which has beenrecognised as hindering investments in innovations. Despite the abundance of theempirical literature dealing with the innovation-labour market nexus, we think that,specifically for the Italian economy, the reverse causality of the relationship (the impactof labour market regulation on innovation) has not been explored enough. Thus, thefinal purpose of our study is twofold: by shedding light on the relationship between thelabour market and innovation activities, we wish to contribute both to an overallupdating of the models for the empirical analysis applied to this topic and to providesome evidence regarding the Italian case.
The remainder of the paper is organised as follows. In section 2, we develop aconceptual framework supporting our empirical analysis. Section 3 focuses on the
Labour marketflexibility and
innovation
217
variables included in the econometric model, while section 4 presents a non-parametricanalysis. Details on our econometric specifications and a brief discussion on theArellano-Bond dynamic panel data estimator are reported in section 5. In section 6, ourestimated results are discussed, while our final considerations are given in section 7.
The framework for the empirical analysisFrom a theoretical point of view, the relationship between labour market flexibility andinnovation has been mainly treated in the context of labour turnover (Stiglitz, 1974;Arnott and Stiglitz, 1985; Arnott et al., 1988) and job-search theories (Mortensen andPissarides, 1994, 1999) aiming to explain unemployment variability. It is worth notingthat, in the labour turnover context, innovation is only tacitly considered while thefocus is on the labour mobility-wage structure as a result of imbalances between flowsinto and out of the job market. Lower wages cause a higher cost of labour mobility that,in turn, negatively affects labour costs, productivity and the human capitalaccumulation of workers. On the other hand, if efficiency-wage considerations emergeto solve this issue and labour market rules make layoffs prohibitively expensive,labour mobility decreases in the short term but rises in the long term. In fact, firmscannot lay off workers, go bankrupt and an increase in the unemployment level occurs.
In job-search theories, the relationship between the labour market and innovation isexplicitly explained. According to these theories, job security reduces job destruction.The incentive to create new jobs is reduced in response to changes in products andproduction processes. Therefore, market regulations that are too restrictive inhibit anefficient reallocation of labour and hinder innovation activities.
An extension of the job-search models was carried out by Acemoglu (1997a, b).According to this author, when complementarities between workforce skills andtechnology choices are taken into account (i.e. an economy with the possibility ofchoosing endogenous technology), a deregulated labour market is no longer the bestsolution. Increases in the job turnover rate reduces the firm’s investment in newtechnology (or R&D) and on-the-job training for workers, since the additional return ontraining, or gains stemming from acquired knowledge in R&D activities, will benefitthe worker, who will probably soon leave the firm. On the other hand, workers do notexpect firms to invest in new technology (or R&D), so that their wages cannot beadequately high and do not invest in human capital accumulation. Thus, lifetimeemployment relationships are important factors contributing to technological changes.
The wage level can play an important role in stimulating innovation as a result ofthe good performance of innovative and highly profitable firms. However, a reversedirection of the causality must be taken into account. When wages are kept above theirmarket-clearing level, regulative interventions (minimum wages, union power,normative traditions) and efficiency are involved (Shapiro and Stiglitz, 1984; Stiglitzand Greenwald, 1995). Efficiency wages exert a direct and positive effect on the activeparticipation of the workforce in the learning process, enhancing loyalty andcommitment, and stimulate practitioners into developing informal relationships,sharing information and accelerating the emergence of tacit knowledge (Antonelli,1999; Kitson et al., 2000).
As mentioned above, efficiency wages also exert a strong influence on labourmobility (lower wages encourage the skilled worker to change jobs), often involving anincrease in the unemployment rate (Stiglitz and Greenwald, 1995).
IJM29,3
218
Empirical works have found that the impact of labour market regulation oninnovation does not produce a well-defined causal relationship, revealing a strongdependence on the context (Bassanini and Ernst, 2002; Michie and Sheehan, 2003). Ifwe choose labour mobility and wage levels as proxies of labour market regulation[1],we cannot ignore that these variables contribute to shaping the multidimensionalcharacter of labour flexibility. Michie and Sheehan (2003) define numerical flexibilityas the ability of firms to change the number of people they employ, while functionalflexibility is the ability to vary the amount of labour that firms use without resorting tothe external labour market. Finally, wage flexibility is the ability of payment systemsto respond to labour market conditions. It is our conviction that these forms of labourflexibility may affect the innovation performances of industries in different ways, notexcluding their dependence on their specific regional system of innovation.
The regional innovation system (RIS) approach is developed within the theoreticalcontext of the national innovation system (NIS), where parallel technological changesin work organisation and production are associated with changes in habits androutines (Lundvall, 1993; Cooke et al., 1997; Asheim and Coenen, 2005). The shift fromNIS to RIS concerns the extent of the systemic character of the geographical andadministrative area as well as the territorial range of knowledge spillovers. If the tacitcharacter of knowledge is recognised as playing a key role in innovation, the lattercannot be easily shared and applied outside its territory of generation (Amin andWilkinson, 1999; Antonelli, 2005). This geographical stickiness of knowledge diffusionand learning process is only one of the main characteristics of RIS. Within it, firms,other economic agents and local institutions co-evolve and contribute to shaping aspecific political-administrative body. Finally, the RIS becomes an institutionalrepository of a negotiated, evolving social order that establishes routines, norms andvalues by which actors may come to trust each other collectively (Cooke et al., 1997).Different institutional settings will be likely to give rise to distinctive conventions orforms of collective social order, leading to the establishment of different kinds oforganisations of innovative activities, but also favouring different micro-constitutionalregulations that affect the labour market.
Within this conceptual framework, the endogenous relationship between numericalflexibility (or labour mobility) and innovative activity can be differentiated. Thenumerical flexibility of the labour market can affect the innovative activities ofindustries and regions in different ways.
In an innovative milieu characterised by a specialisation in scale intensive sectors,lower job turnover is not expected to hinder the generation of innovation and/or itsadoption. Knowledge accumulation at the firm level generates a strong incentive to usethe firm’s internal labour market (functional flexibility). The tenure of the workforcenot only allows a simple “learning by doing” process within the firm, but alsoguarantees a possible co-evolution among tangible assets, the firm’s core competencesand the workers’ skills[2].
On the other hand, inter-firm mobility of workers has been recognised as the mainmechanism for knowledge transmission and learning in an innovative milieucharacterised by small and medium enterprises (SME) (Keeble and Wilkinson, 1999).The most innovative activities, realised in regions where benefit from externaleconomies are important for SMEs, rely on a collective learning. The latter consists ofthe creation of a stock of common knowledge among individuals that allows the
Labour marketflexibility and
innovation
219
coordination of their actions in the resolution of technological and organisationalproblems (Lawson and Lorenz, 1999; Capello, 1999). Given that the shared knowledgeboosting the flexible capability of the region to combine the diverse resources is largelytacit, the labour mobility of a highly skilled personnel in the local labour marketguarantees suitably technological transfers across firms.
It must also be noted that the different systems of governance acting at the regionallevel and stemming from the evolution of different socio-economic developmentpatterns (Papagni, 1995; Cooke et al., 1997) might also affect the joint behaviour of thelabour flexibility and innovative activities. For example, aside from different modes ofmanaging innovative activities, higher labour flexibility may exert a different impacton the Southern regions of Italy, where the adjustments for wages and mobility oflabour are deemed to be more severe than in the North of Italy (Faini, 1997).
These theoretical arguments provide support for an empirical analysis where theaspects concerning the relationship between labour flexibility and innovative activitieshave been detected by paying attention to geographical features.
Data sources and variablesThe empirical model that will be presented in this section uses the manufacturingsectors of Italian industry taken at the regional level over the period 1990-1996[3]. Thesize of the sample adds up to 1,400 observations (20 regions £ ten sectors £ sevenyears).
As far as the variables are concerned, we chose as dependent variable the per capitanumber of patents registered, which proxies innovative activities that have occurredwithin a specific regional sector of industries. Patents are a measure of innovativeoutput and are quite “popular” among scholars, even though they are not free ofdisadvantages (Malerba and Orsenigo, 2000; Jacobsson and Philipson, 1996; Griliches,1990). For example, the propensity to patent can vary across sectors and products (orproduction processes) according to the institutional and structural characteristic thatconcerns the appropriability of innovations (Malerba and Torrisi, 2000). Thesecharacteristics contribute to describe specifically the technological context of thesectors, even if it may severely bias the relationships to be examined. However, as willbe discussed in section 4, the Arellano-Bond estimator will allow us to test thepropensity to patent the innovation across sectors.
It is worth noting that with respect to other indicators, such as R&D expenditures,patents often account for informal technological activity by representing the amount ofthe innovative activity of medium and small firms (Malerba and Torrisi, 2000; Ferrariet al., 2002). The patent data used in the present analysis come from the CRENOS[4]databank and refer to European Patent Office (EPO) applications. This indicatorshould be particularly effective in taking into account the higher remunerativeinnovations, which, for this reason, are patented abroad (Paci and Usai, 2000). Thepatent data, initially classified by means of the International Patent Classifications(IPC)[5], have been converted to the manufacturing industry by using the YaleTechnology Concordance, so that the dataset is in line with the ATECO91classification (Paci and Usai, 2000).
As far as the numerical flexibility of the labour market is concerned, we chose thegross job turnover rate. Actually, there is little agreement on using gross job turnover(also termed job reallocation) as a proxy for numerical flexibility, i.e. fewer hiring and
IJM29,3
220
firing restrictions (Bertola and Rogerson, 1997; Contini et al., 1996; Boeri, 1996; 1999). Incomparative analyses between European countries and the USA, Bertola and Rogerson(1997) and Boeri (1999) criticise the use of turnover rate to demonstrate the negligibledifferences found in labour flexibility indicators. Conversely, they claim that a highwage compression (coming from collective bargaining) and a high rigidity regardinghiring and firing in the workforce, produce higher European and Italian turnover ratesalso in the absence of flexibility in the labour market. We tested these differenthypotheses by including the wage levels in the model and by assessing the statisticalsignificance of their estimated parameters.
Job turnover also depends on the business cycle (Schivardi, 1998). In order to takeinto account the impact of the business cycle upon innovation-labour marketrelationship, we will include temporal dummies in the econometric specification.
Quantitatively, in line with the aforementioned literature, we refer to the measure ofgross job turnover as the sum of job creation and job destruction that has occurred atthe firm level and has been measured by means of surveys carried out by the NationalInstitution of Social Security (NISS).
Formally, the average of the job creation occurring in the regional sector is given as:
Ci;j ¼f
PðEf ;i;j;t 2 Ef ;i;j;t21Þ
ðNi;j;t þ Ni;j;t21Þ=2; ð1Þ
where Ef ;i;j;t 2 Ef ;i;j;t21 is the positive difference between jobs registered in firm f,belonging to region j and sector i, over the yearly period (t and t 2 1). ðNi;j;t þNi;j;t21Þ=2 represents the average number of firms belonging to region j and sector i, inwhich the growth in jobs occurred.
The average of job destruction at the regional sector is obtained as:
Di;j ¼f
PEf ;i;j;t 2 Ef ;i;j;t21
��
��
ðNi;j;t þ Ni;j;t21Þ=2; ð2Þ
where Ef ;i;j;t 2 Ef ;i;j;t21
��
�� is the negative difference, taken in absolute value, between
jobs registered in firm f, belonging to region j and sector i, over the yearly period (t andt 2 1).
Thus, the average of the gross job turnover in region j and sector i is found as:
GJTi;j ¼ Ci;j þ Di;j: ð3Þ
Also, the dataset used to derive the wage levels has been drawn from the NISSdatabank. This source allows us to differentiate between the wages of white and bluecollar workers. Since the white collar category includes researchers and other highlyskilled workers, we can assess whether or not the efficiency wage effect is concentratedin different groups of workers.
In order to consider the territorial context corresponding to different models ofindustrialisation, we use, as interaction dummies, the five geographical macro-areasinto which the Italian territory is traditionally divided (Northwest, Northeast, Centre,South and the Islands).
Furthermore, we consider four mature sectors (wood-furniture, textiles, non-metallicmineral products and metal products) in which Italy showed international
Labour marketflexibility and
innovation
221
specialisation in terms of patent demand during the 1990s (Ferrari et al., 2002). Inparticular, there are some economic activities in which the territorial localisation of thefirms plays a key role by means of externalities produced in the industrial districts.Taking into account these stylised facts, we carried out restricted estimations on thesefour sectors, testing the influence of the presence of industrial districts in therelationship between labour market indicators of flexibility and innovation.
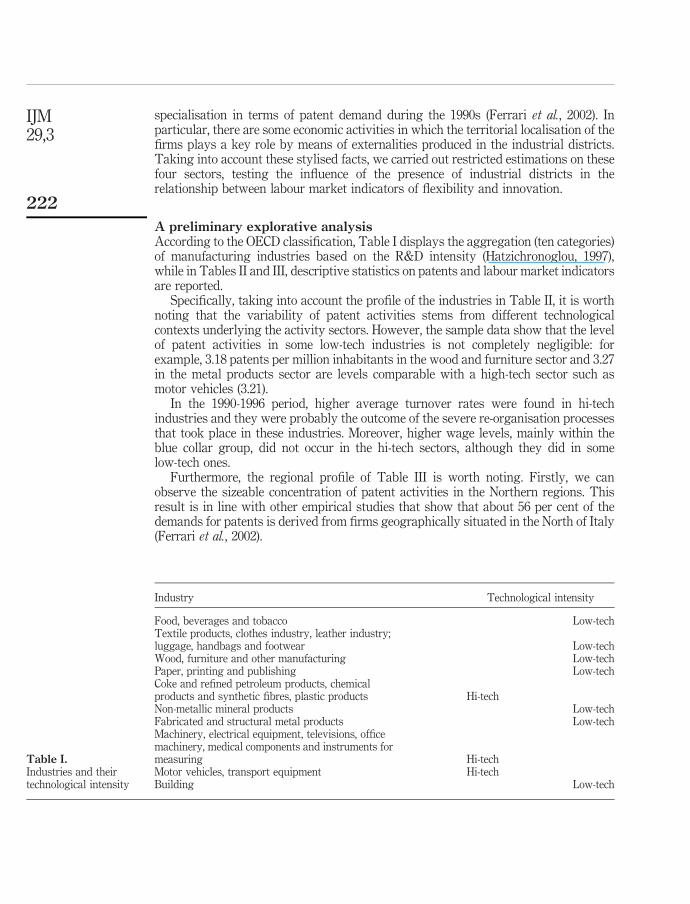
A preliminary explorative analysisAccording to the OECD classification, Table I displays the aggregation (ten categories)of manufacturing industries based on the R&D intensity (Hatzichronoglou, 1997),while in Tables II and III, descriptive statistics on patents and labour market indicatorsare reported.
Specifically, taking into account the profile of the industries in Table II, it is worthnoting that the variability of patent activities stems from different technologicalcontexts underlying the activity sectors. However, the sample data show that the levelof patent activities in some low-tech industries is not completely negligible: forexample, 3.18 patents per million inhabitants in the wood and furniture sector and 3.27in the metal products sector are levels comparable with a high-tech sector such asmotor vehicles (3.21).
In the 1990-1996 period, higher average turnover rates were found in hi-techindustries and they were probably the outcome of the severe re-organisation processesthat took place in these industries. Moreover, higher wage levels, mainly within theblue collar group, did not occur in the hi-tech sectors, although they did in somelow-tech ones.
Furthermore, the regional profile of Table III is worth noting. Firstly, we canobserve the sizeable concentration of patent activities in the Northern regions. Thisresult is in line with other empirical studies that show that about 56 per cent of thedemands for patents is derived from firms geographically situated in the North of Italy(Ferrari et al., 2002).
Industry Technological intensity
Food, beverages and tobacco Low-techTextile products, clothes industry, leather industry;luggage, handbags and footwear Low-techWood, furniture and other manufacturing Low-techPaper, printing and publishing Low-techCoke and refined petroleum products, chemicalproducts and synthetic fibres, plastic products Hi-techNon-metallic mineral products Low-techFabricated and structural metal products Low-techMachinery, electrical equipment, televisions, officemachinery, medical components and instruments formeasuring Hi-techMotor vehicles, transport equipment Hi-techBuilding Low-tech
Table I.Industries and theirtechnological intensity
IJM29,3
222
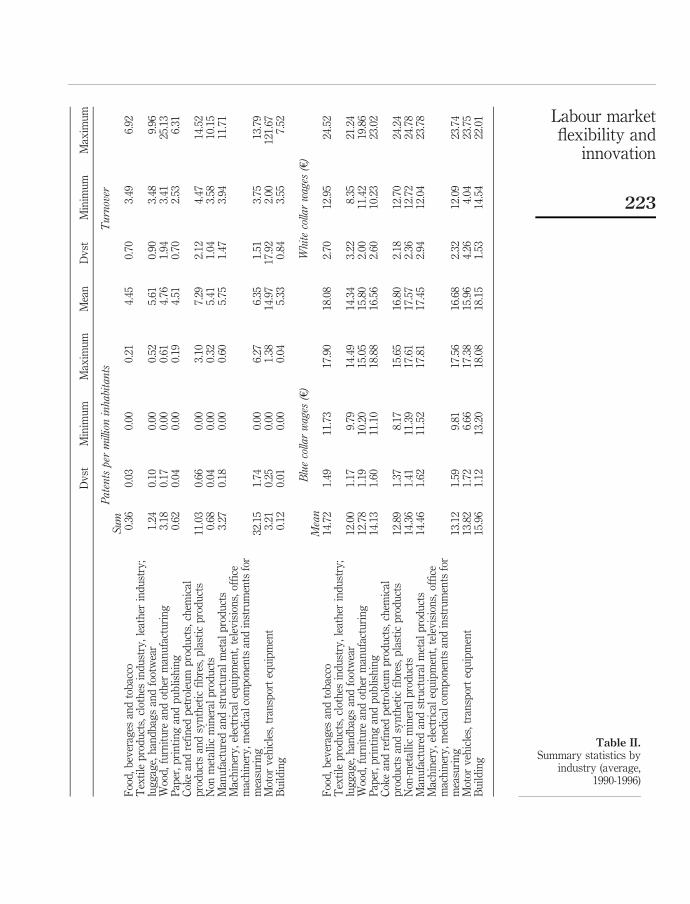
Table II.Summary statistics by
industry (average,1990-1996)
Dv
stM
inim
um
Max
imu
mM
ean
Dv
stM
inim
um
Max
imu
m
Patentspermillioninhabitants
Turnover
Sum
Foo
d,
bev
erag
esan
dto
bac
co0.
360.
030.
000.
214.
450.
703.
496.
92T
exti
lep
rod
uct
s,cl
oth
esin
du
stry
,le
ath
erin
du
stry
;lu
gg
age,
han
db
ags
and
foot
wea
r1.
240.
100.
000.
525.
610.
903.
489.
96W
ood
,fu
rnit
ure
and
oth
erm
anu
fact
uri
ng
3.18
0.17
0.00
0.61
4.76
1.94
3.41
25.1
3P
aper
,p
rin
tin
gan
dp
ub
lish
ing
0.62
0.04
0.00
0.19
4.51
0.70
2.53
6.31
Cok
ean
dre
fin
edp
etro
leu
mp
rod
uct
s,ch
emic
alp
rod
uct
san
dsy
nth
etic
fib
res,
pla
stic
pro
du
cts
11.0
30.
660.
003.
107.
292.
124.
4714
.52
Non
met
alli
cm
iner
alp
rod
uct
s0.
680.
040.
000.
325.
411.
043.
5810
.15
Man
ufa
ctu
red
and
stru
ctu
ral
met
alp
rod
uct
s3.
270.
180.
000.
605.
751.
473.
9411
.71
Mac
hin
ery
,el
ectr
ical
equ
ipm
ent,
tele
vis
ion
s,of
fice
mac
hin
ery
,med
ical
com
pon
ents
and
inst
rum
ents
for
mea
suri
ng
32.1
51.
740.
006.
276.
351.
513.
7513
.79
Mot
orv
ehic
les,
tran
spor
teq
uip
men
t3.
210.
250.
001.
3814
.97
17.9
22.
0012
1.67
Bu
ild
ing
0.12
0.01
0.00
0.04
5.33
0.84
3.55
7.52
Bluecollarwages(e)
Whitecollarwages(e)
Mean
Foo
d,
bev
erag
esan
dto
bac
co14
.72
1.49
11.7
317
.90
18.0
82.
7012
.95
24.5
2T
exti
lep
rod
uct
s,cl
oth
esin
du
stry
,le
ath
erin
du
stry
;lu
gg
age,
han
db
ags
and
foot
wea
r12
.00
1.17
9.79
14.4
914
.34
3.22
8.35
21.2
4W
ood
,fu
rnit
ure
and
oth
erm
anu
fact
uri
ng
12.7
81.
1910
.20
15.0
515
.80
2.00
11.4
219
.86
Pap
er,
pri
nti
ng
and
pu
bli
shin
g14
.13
1.60
11.1
018
.88
16.5
62.
6010
.23
23.0
2C
oke
and
refi
ned
pet
role
um
pro
du
cts,
chem
ical
pro
du
cts
and
syn
thet
icfi
bre
s,p
last
icp
rod
uct
s12
.89
1.37
8.17
15.6
516
.80
2.18
12.7
024
.24
Non
-met
alli
cm
iner
alp
rod
uct
s14
.36
1.41
11.3
917
.61
17.5
72.
3612
.72
24.7
8M
anu
fact
ure
dan
dst
ruct
ura
lm
etal
pro
du
cts
14.4
61.
6211
.52
17.8
117
.45
2.94
12.0
423
.78
Mac
hin
ery
,el
ectr
ical
equ
ipm
ent,
tele
vis
ion
s,of
fice
mac
hin
ery
,med
ical
com
pon
ents
and
inst
rum
ents
for
mea
suri
ng
13.1
21.
599.
8117
.56
16.6
82.
3212
.09
23.7
4M
otor
veh
icle
s,tr
ansp
ort
equ
ipm
ent
13.8
21.
726.
6617
.38
15.9
64.
264.
0423
.75
Bu
ild
ing
15.9
61.
1213
.20
18.0
818
.15
1.53
14.5
422
.01 Labour market
flexibility andinnovation
223
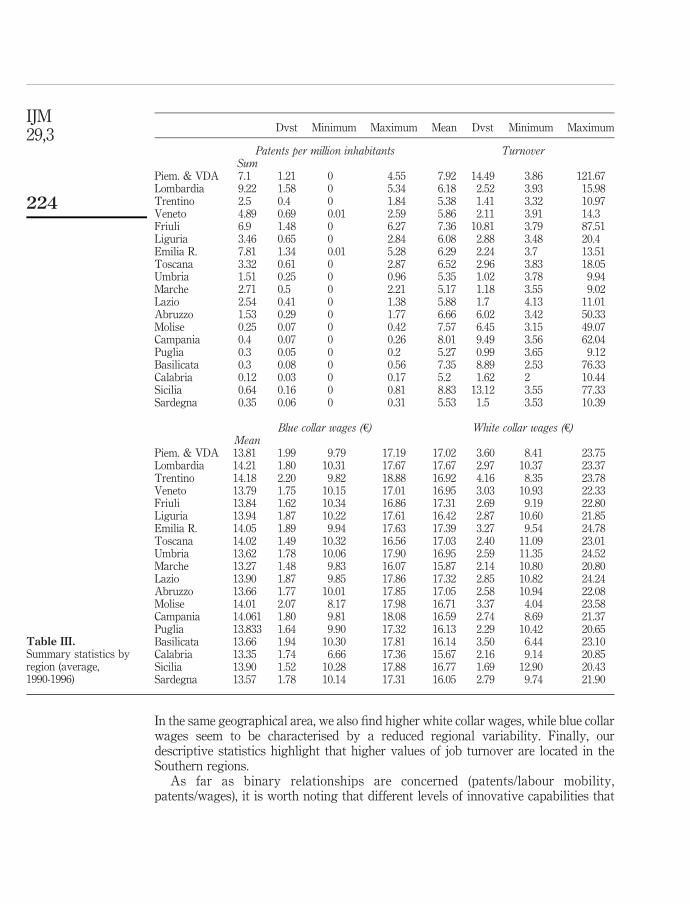
In the same geographical area, we also find higher white collar wages, while blue collarwages seem to be characterised by a reduced regional variability. Finally, ourdescriptive statistics highlight that higher values of job turnover are located in theSouthern regions.
As far as binary relationships are concerned (patents/labour mobility,patents/wages), it is worth noting that different levels of innovative capabilities that
Dvst Minimum Maximum Mean Dvst Minimum Maximum
Patents per million inhabitants TurnoverSum
Piem. & VDA 7.1 1.21 0 4.55 7.92 14.49 3.86 121.67Lombardia 9.22 1.58 0 5.34 6.18 2.52 3.93 15.98Trentino 2.5 0.4 0 1.84 5.38 1.41 3.32 10.97Veneto 4.89 0.69 0.01 2.59 5.86 2.11 3.91 14.3Friuli 6.9 1.48 0 6.27 7.36 10.81 3.79 87.51Liguria 3.46 0.65 0 2.84 6.08 2.88 3.48 20.4Emilia R. 7.81 1.34 0.01 5.28 6.29 2.24 3.7 13.51Toscana 3.32 0.61 0 2.87 6.52 2.96 3.83 18.05Umbria 1.51 0.25 0 0.96 5.35 1.02 3.78 9.94Marche 2.71 0.5 0 2.21 5.17 1.18 3.55 9.02Lazio 2.54 0.41 0 1.38 5.88 1.7 4.13 11.01Abruzzo 1.53 0.29 0 1.77 6.66 6.02 3.42 50.33Molise 0.25 0.07 0 0.42 7.57 6.45 3.15 49.07Campania 0.4 0.07 0 0.26 8.01 9.49 3.56 62.04Puglia 0.3 0.05 0 0.2 5.27 0.99 3.65 9.12Basilicata 0.3 0.08 0 0.56 7.35 8.89 2.53 76.33Calabria 0.12 0.03 0 0.17 5.2 1.62 2 10.44Sicilia 0.64 0.16 0 0.81 8.83 13.12 3.55 77.33Sardegna 0.35 0.06 0 0.31 5.53 1.5 3.53 10.39
Blue collar wages (e) White collar wages (e)Mean
Piem. & VDA 13.81 1.99 9.79 17.19 17.02 3.60 8.41 23.75Lombardia 14.21 1.80 10.31 17.67 17.67 2.97 10.37 23.37Trentino 14.18 2.20 9.82 18.88 16.92 4.16 8.35 23.78Veneto 13.79 1.75 10.15 17.01 16.95 3.03 10.93 22.33Friuli 13.84 1.62 10.34 16.86 17.31 2.69 9.19 22.80Liguria 13.94 1.87 10.22 17.61 16.42 2.87 10.60 21.85Emilia R. 14.05 1.89 9.94 17.63 17.39 3.27 9.54 24.78Toscana 14.02 1.49 10.32 16.56 17.03 2.40 11.09 23.01Umbria 13.62 1.78 10.06 17.90 16.95 2.59 11.35 24.52Marche 13.27 1.48 9.83 16.07 15.87 2.14 10.80 20.80Lazio 13.90 1.87 9.85 17.86 17.32 2.85 10.82 24.24Abruzzo 13.66 1.77 10.01 17.85 17.05 2.58 10.94 22.08Molise 14.01 2.07 8.17 17.98 16.71 3.37 4.04 23.58Campania 14.061 1.80 9.81 18.08 16.59 2.74 8.69 21.37Puglia 13.833 1.64 9.90 17.32 16.13 2.29 10.42 20.65Basilicata 13.66 1.94 10.30 17.81 16.14 3.50 6.44 23.10Calabria 13.35 1.74 6.66 17.36 15.67 2.16 9.14 20.85Sicilia 13.90 1.52 10.28 17.88 16.77 1.69 12.90 20.43Sardegna 13.57 1.78 10.14 17.31 16.05 2.79 9.74 21.90
Table III.Summary statistics byregion (average,1990-1996)
IJM29,3
224
characterise sectors and regions might generate different modes of interaction. Forexample, regional sectors showing highly concentrated patent activities may leadlabour flexibility indicators to impact in different ways with respect to geographicalareas where patents are lower or absent.
Therefore, a more complex econometric specification is justified if the responses ofthe empirical density function for the patents variable is found. Non-parametricestimations were performed to test the empirical heterogeneity of the patent indicatorby using the quintile distribution of observed data. For practical reasons, wecategorised the pooled patent variable separately by progressively ordering data froma low (or absent) level of patents to the highest and limited them by each twentiethpercentile of the cumulative distribution of probability.
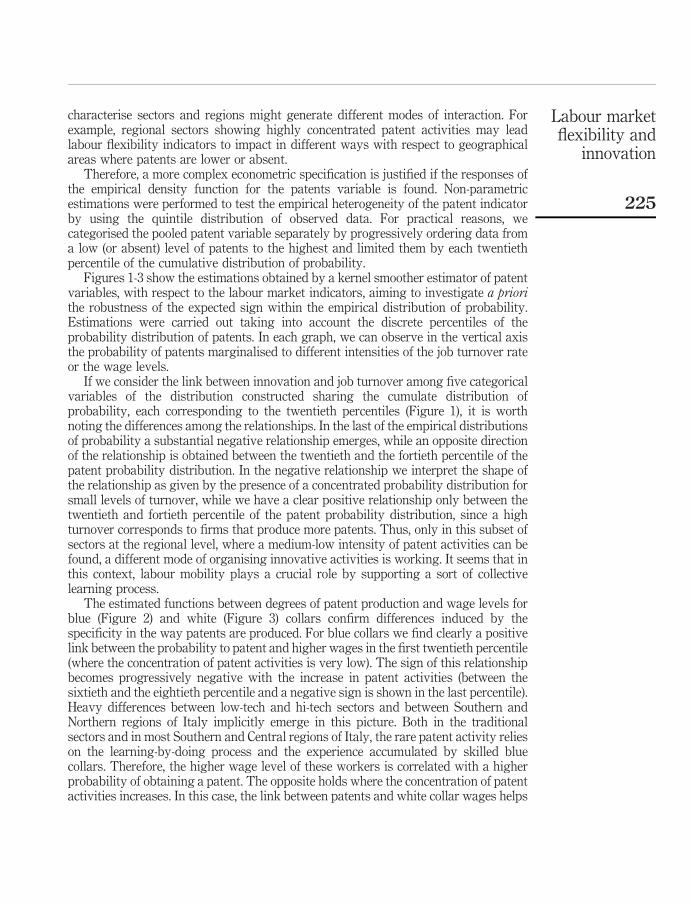
Figures 1-3 show the estimations obtained by a kernel smoother estimator of patentvariables, with respect to the labour market indicators, aiming to investigate a priorithe robustness of the expected sign within the empirical distribution of probability.Estimations were carried out taking into account the discrete percentiles of theprobability distribution of patents. In each graph, we can observe in the vertical axisthe probability of patents marginalised to different intensities of the job turnover rateor the wage levels.
If we consider the link between innovation and job turnover among five categoricalvariables of the distribution constructed sharing the cumulate distribution ofprobability, each corresponding to the twentieth percentiles (Figure 1), it is worthnoting the differences among the relationships. In the last of the empirical distributionsof probability a substantial negative relationship emerges, while an opposite directionof the relationship is obtained between the twentieth and the fortieth percentile of thepatent probability distribution. In the negative relationship we interpret the shape ofthe relationship as given by the presence of a concentrated probability distribution forsmall levels of turnover, while we have a clear positive relationship only between thetwentieth and fortieth percentile of the patent probability distribution, since a highturnover corresponds to firms that produce more patents. Thus, only in this subset ofsectors at the regional level, where a medium-low intensity of patent activities can befound, a different mode of organising innovative activities is working. It seems that inthis context, labour mobility plays a crucial role by supporting a sort of collectivelearning process.
The estimated functions between degrees of patent production and wage levels forblue (Figure 2) and white (Figure 3) collars confirm differences induced by thespecificity in the way patents are produced. For blue collars we find clearly a positivelink between the probability to patent and higher wages in the first twentieth percentile(where the concentration of patent activities is very low). The sign of this relationshipbecomes progressively negative with the increase in patent activities (between thesixtieth and the eightieth percentile and a negative sign is shown in the last percentile).Heavy differences between low-tech and hi-tech sectors and between Southern andNorthern regions of Italy implicitly emerge in this picture. Both in the traditionalsectors and in most Southern and Central regions of Italy, the rare patent activity relieson the learning-by-doing process and the experience accumulated by skilled bluecollars. Therefore, the higher wage level of these workers is correlated with a higherprobability of obtaining a patent. The opposite holds where the concentration of patentactivities increases. In this case, the link between patents and white collar wages helps
Labour marketflexibility and
innovation
225
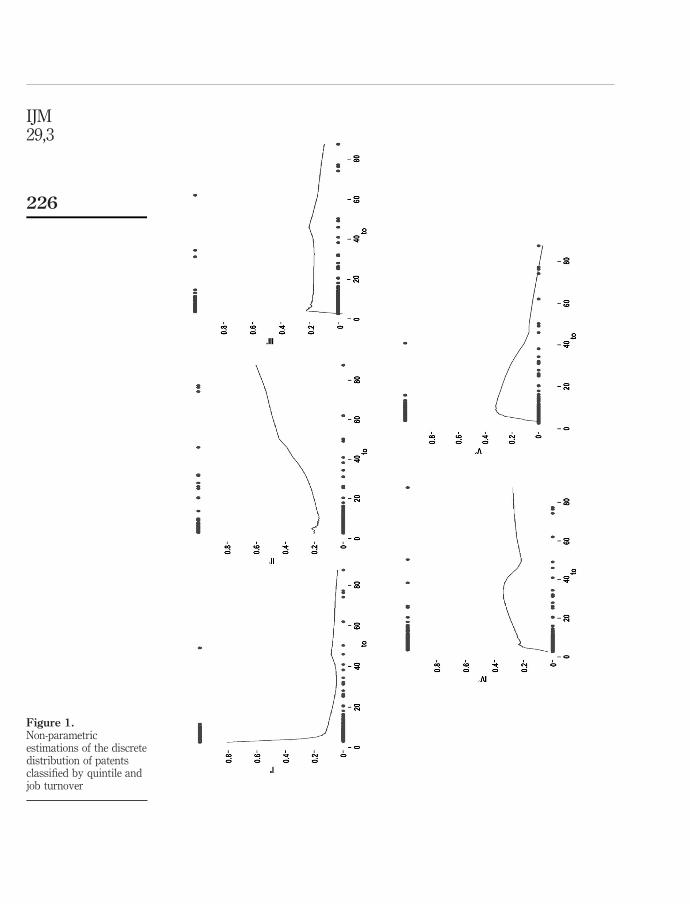
Figure 1.Non-parametricestimations of the discretedistribution of patentsclassified by quintile andjob turnover
IJM29,3
226
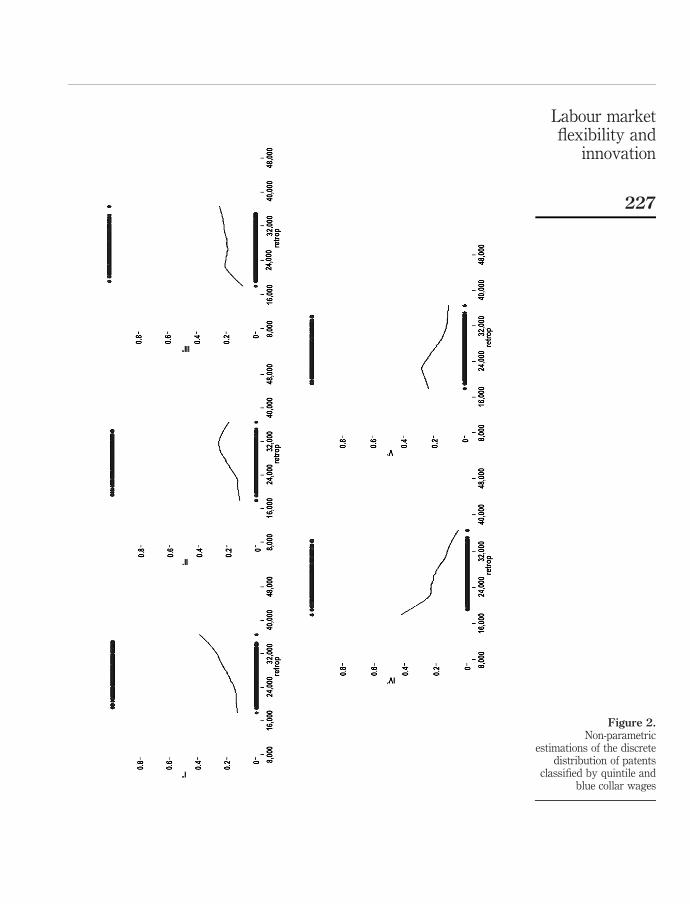
Figure 2.Non-parametric
estimations of the discretedistribution of patents
classified by quintile andblue collar wages
Labour marketflexibility and
innovation
227
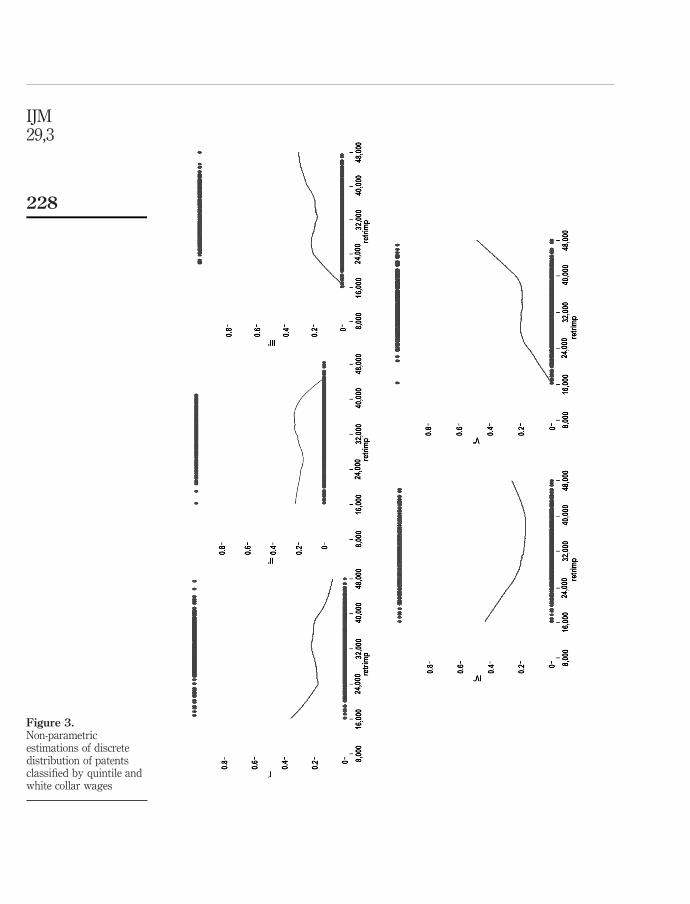
Figure 3.Non-parametricestimations of discretedistribution of patentsclassified by quintile andwhite collar wages
IJM29,3
228
us to complete the explanation. In fact, higher wages for white collar workers play acrucial role in the last quantile of Figure 3, probably because most of the techniciansand other R&D personnel who are included in this category of workers operate in theNorthern area of Italy or in hi-tech contexts. Conversely, where patent activity is rare(until the fortieth percentile of Figure 3), the negative relationship with the wages ofwhite collars confirms that to stimulate innovation in Southern or Central areas of Italyor in low-tech contexts, the wages of skilled manual workers should be higher thanthose of simple administrative office clerks.
To sum up the previous results, we can say that there is no straightforwardrelationship between the labour market indicators and innovation. In line with theliterature that stresses that the nature of this relationship is strongly dependent on thegeographical context (Keeble and Wilkinson, 1999; Lawson and Lorenz, 1999; Capello,1999), we attempt to explain it by including the geographical control variables in theparametric model. Moreover, the estimations show non-linear profiles. Given thatinnovation might be seen as activities that may produce cumulative effects, thenon-linearity previously found may be taken into account to specify the dynamic modelcorrectly.
Models and estimationsThe hypothesis that innovative activities are influenced by flexibility in the labourmarket has been widely supported by micro-econometric and macro-econometricworks (Chennells and Van Reenen, 1997; Flaig and Stadler, 1994; Mohnen et al., 1986).However, an improvement over the coherence of the results may be obtained if twoempirical facts are modelled. Firstly, the cumulative effects in innovation maycharacterise the processes to obtain patents. Secondly, innovation processes mightdepend on some explicative proxies of the labour market that are not strictlyexogenous. Consequently, the causality relationships may be questionable.
Within empirical works, the use of panel estimators has been growing recently. Ingeneral, these enable the analyst to incorporate into a single effect, unobserved andspecific to each unit used, all the characteristics of that unit that are not includedamong the control variables. Formally, the specification of a model that uses a panelestimator is given as:
yi;t ¼ yi;t21uþ x 0i;tbþ mi;t; ð4Þ
where yi,t is the dependent variable that measures the innovation activity, yi;t21 is thelagged dependent variable and u is the associate parameter. x0i;t is the 1 £ K vector ofvariables hypothesised as determining the innovation, and b is a K £ 1 vector of theparameters. Moreover, we have assumed that the error mi,t follows a two-way errorcomponent model:
mi;t ¼ mi þ lt þ ni;t; ð5Þ
where ni;t 2 IIDð0;s2vÞ.
mi denotes the individual-specific residual that differs across sectors, while ltyear-period effects is assumed to be the fixed estimated parameters of time dummiesfor each year in the sample. Their inclusion is justified by macroeconomic cyclicalfluctuations concerning the downturn in the 1990-1996 period.
Labour marketflexibility and
innovation
229
Since yi,t is a function of mi, the lagged dependent variable yi;t21 is also a function ofmi. Hence, yi;t21, a right-hand regressor in equation (4), is correlated with the error term,leading the OLS estimator to be biased and inconsistent. Moreover, the fixed effectestimator is biased and potentially inconsistent even if ni;t is serially uncorrelated,since yi;t21 is correlated with the residuals (Baltagi, 2001). It is therefore necessary touse other techniques. The GMM estimator a la Arellano and Bond (1991) avoidsendogeneity problems. The illustration of this estimator might conveniently begin witha version of equation (4) in first differences:
Dyi;t ¼ qð yi;t21 2 yi;t22Þ þ ðx0i;t 2 x0i;t21Þbþ ðni;t 2 ni;t21Þ: ð6Þ
In fact, the differentiation eliminates the term mi. If it were not for the correlationbetween yi;t21 and ni;t21, application of OLS are consistent estimates of equation (6).This problem can be easily avoided by including values of yi,t antecedent to time t asinstruments[6]. However, from an econometric point of view, the estimator in differenceentirely ignores cross-section variability to concentrate on intra-temporal variability.Moreover, the use of equations in differences often raises the practical problem of weakinstruments affecting the efficiency of the estimator (Baltagi, 2001).
In order to deal with this problem, it is possible to use the Arellano and Bover (1995)estimator, which combines equations in differences and levels in a GMM framework.This system estimator enables the achievement of a more efficient estimator in thepresence of predetermined variables whose correlation with the individual effect isconstant over time, but less robust to misspecification problems (Blundell and Bond,1998).
The specification used reflects the theoretical model outlined in the previoussections and denotes the variable yi,t as the value of innovation activity at time t (witht ¼ 0; . . . ; 7), that belongs to sectoral group i.
As far as job turnover is concerned, the explorative nature of the analysis leads us tohypothesise that a negative sign might support the predictions of Acemoglu’s (1997a)model. High flexibility in the labour market hinders innovation investments of firmsand human capital investments of workers, respectively. Conversely, if the result doesnot appear statistically significant, a geographical differentiation is needed in order toexplore the same hypothesis in heterogeneous contexts.
According to efficiency wages theory, wage levels are expected with positive signsand significant estimated parameters. The explanatory variables on the right-handside of equation (4) also include one immediate lag of the innovative activities. Since thedataset is a collection of sectoral information, the dynamic components control for thecumulative effects of innovation activities within regional sectors.
The assumption of strict exogeneity of the labour flexibility variables is notpersuasive since the variables may be predetermined or endogeneous, which leads to amis-specification of the true relationship between labour market indicators andinnovation. In order to obtain the best rationale of data, we specify wage levels (bothfor white and blue collars) as a predetermined variable, including the possibility thatthe unforecastable errors in the innovation activity (at time t) might affect futurechanges in wage levels. Moreover, the possibility of a relationship of causality movingfrom innovation to the indicator of the job turnover is questionable if we consider aneconomy with endogenous technology choices (Acemoglu, 1997a). In the empiricalpart, we assess endogenous behaviours of the job turnover, non-rejecting its
IJM29,3
230
endogenous specifications to depict a possible circular causality. From an econometricpoint of view, we remark that lagged levels of endogenous variables are available toserve as instruments, while we specify a different characterisation of job turnover andwage levels as endogenous and predetermined variables, respectively.
Summing up, equation (4) is used as a maintained hypothesis with the job turnovervariable included as an endogenous variable and wage levels as a predeterminedvariable also when we distinguish between hi-tech from low-tech technologicalintensity levels and macro-geographical areas. To evaluate different impacts oninnovation when the statistical parameters of labour market indicators are notsignificant, interaction dummies, as well as restricted samples, are included, aiming tospecify a restricted hypothesis for the impact of labour flexibility indicators.
ResultsThe estimated relationship between the labour market indicators and innovation, byusing the static panel data, confirms the statistical significance of time-dummyparameters. This result addresses the specification of a dynamic panel data model[7].The estimations of the baseline dynamic model are set out in Table IV.
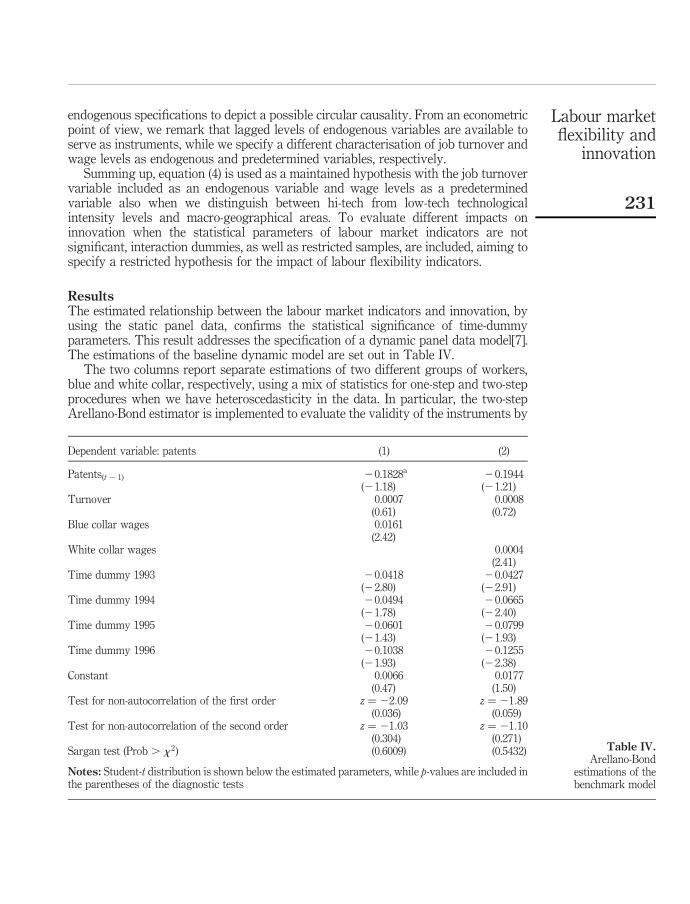
The two columns report separate estimations of two different groups of workers,blue and white collar, respectively, using a mix of statistics for one-step and two-stepprocedures when we have heteroscedasticity in the data. In particular, the two-stepArellano-Bond estimator is implemented to evaluate the validity of the instruments by
Dependent variable: patents (1) (2)
Patents(t 2 1) 20.1828a 20.1944(21.18) (21.21)
Turnover 0.0007 0.0008(0.61) (0.72)
Blue collar wages 0.0161(2.42)
White collar wages 0.0004(2.41)
Time dummy 1993 20.0418 20.0427(22.80) (22.91)
Time dummy 1994 20.0494 20.0665(21.78) (22.40)
Time dummy 1995 20.0601 20.0799(21.43) (21.93)
Time dummy 1996 20.1038 20.1255(21.93) (22.38)
Constant 0.0066 0.0177(0.47) (1.50)
Test for non-autocorrelation of the first order z ¼ 22:09 z ¼ 21:89(0.036) (0.059)
Test for non-autocorrelation of the second order z ¼ 21:03 z ¼ 21:10(0.304) (0.271)
Sargan test (Prob . x 2) (0.6009) (0.5432)
Notes: Student-t distribution is shown below the estimated parameters, while p-values are included inthe parentheses of the diagnostic tests
Table IV.Arellano-Bond
estimations of thebenchmark model
Labour marketflexibility and
innovation
231
the Sargan test. It is known that in a one-step framework, the Sargan test over-rejectedthe null hypothesis. The dynamic specification of the model is supported by showingthe p-value of the Sargan test (0.60 and 0.54, respectively). On the contrary, the one-stepestimation, corrected for heteroscedasticity, is used to obtain significant statisticaldistribution for inference in the estimated coefficients and for testing autocorrelationhigher than the first-order. The estimations reject the null hypothesis of the first-orderno-autocorrelation at the usual 5 per cent level, while second-order no-autocorrelation isnot rejected; this confirms the validity of the dynamic panel data specification(Arellano and Bond, 1991).
The estimated parameters in column 1 of Table IV suggest that only blue-collarwages have a meaningful impact on patent performances. More precisely, the higherwages of blue collar workers seem to improve innovative activities, whereas neither jobturnover nor the cumulative effect of technology (proxied by using the laggeddependent variable) play a role in this model. In the second column, where we replaceblue collar wages with white collar wages, the same result holds. We would like toremark that the positive impact of the latter on innovative activities is slightly lessstressed. Moreover, the significant influence of temporal dummies, with a negativesign, underlines the role played by cyclical fluctuations. Probably, the downturn periodthat characterised the Italian business cycle in that period negatively affected R&Dinvestment levels and, in turn, discouraged patent activities[8].
In Table V, the interaction dummies have been included in the model to test thesensitivity of job turnover to the geographical differentiation. Once again, both the firstand second autocorrelation tests are in line with a dynamic specification of the paneldata in each equation reported below, as well as with the Sargan tests. In column 1,where the specification includes blue collar wages as a predetermined variable, jobturnover exerts a significant and negative impact on the Northwest and Northeast ofthe country. Conversely, the same geographical interaction dummies lack statisticalsignificance when we replace white collar wages with blue collar wages (column 2).The significance of the results obtained for parameters in the Northwest and Northeastregions is increased by restricting the estimation of the equation in column 3 to theseareas. As expected, the conditional estimation shows a negative and statisticallysignificant parameter for the job turnover, while the robustness of the parameter forthe blue collar workers is remarkable with respect to the unconditional estimation incolumn 1. As mentioned in section 3, the majority of the demands for patents islocalised in these areas. These findings are not negligible and seem to support theinsights of the recent views summarized in Acemoglu (1997a), in which higher mobilitycosts or uncertainty concerning job tenure relations negatively affect innovationactivities.
Finally, we provide the results that concern our four mature sectors (textiles, woodand furniture, non-metallic mineral products and metal products), quoted both for therelevant contributions they have made to the technological specialisation in terms ofthe patent numbers and for the plentiful supply of skilled workers (Ferrari et al., 2002).Indeed, the patent stocks and flows obtained in these branches have been morerelevant in Italy with respect to the OECD countries, and seem to be responsible for thehigh persistence of technological specialisation in the low-tech sectors. Within thiscontext, we have explored the relationships between labour market flexibility andinnovation, by using as dummy variable the presence (or absence) of industrial
IJM29,3
232
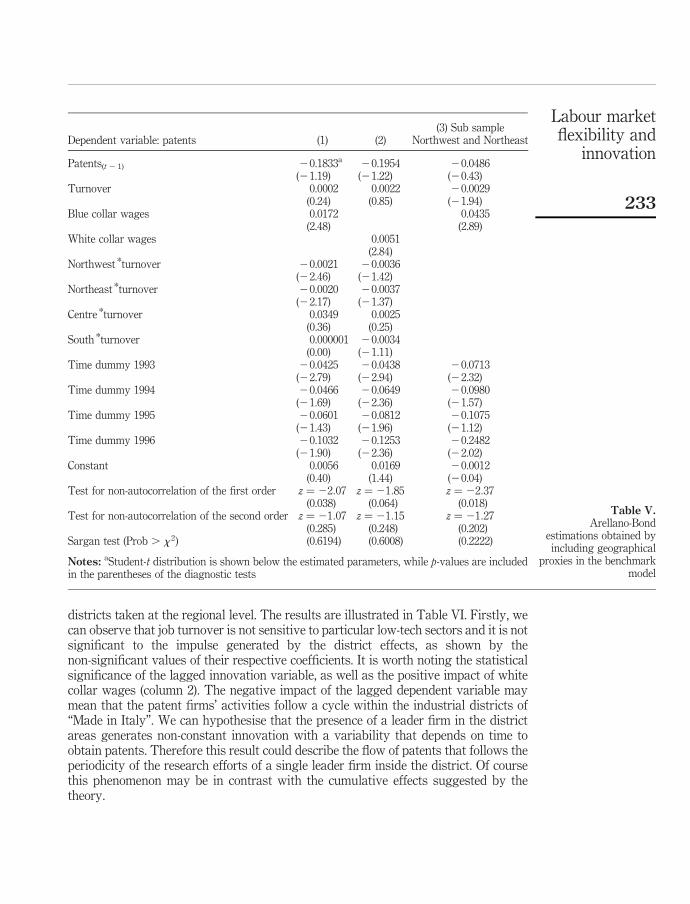
districts taken at the regional level. The results are illustrated in Table VI. Firstly, wecan observe that job turnover is not sensitive to particular low-tech sectors and it is notsignificant to the impulse generated by the district effects, as shown by thenon-significant values of their respective coefficients. It is worth noting the statisticalsignificance of the lagged innovation variable, as well as the positive impact of whitecollar wages (column 2). The negative impact of the lagged dependent variable maymean that the patent firms’ activities follow a cycle within the industrial districts of“Made in Italy”. We can hypothesise that the presence of a leader firm in the districtareas generates non-constant innovation with a variability that depends on time toobtain patents. Therefore this result could describe the flow of patents that follows theperiodicity of the research efforts of a single leader firm inside the district. Of coursethis phenomenon may be in contrast with the cumulative effects suggested by thetheory.
Dependent variable: patents (1) (2)(3) Sub sample
Northwest and Northeast
Patents(t 2 1) 20.1833a 20.1954 20.0486(21.19) (21.22) (20.43)
Turnover 0.0002 0.0022 20.0029(0.24) (0.85) (21.94)
Blue collar wages 0.0172 0.0435(2.48) (2.89)
White collar wages 0.0051(2.84)
Northwest *turnover 20.0021 20.0036(22.46) (21.42)
Northeast *turnover 20.0020 20.0037(22.17) (21.37)
Centre *turnover 0.0349 0.0025(0.36) (0.25)
South *turnover 0.000001 20.0034(0.00) (21.11)
Time dummy 1993 20.0425 20.0438 20.0713(22.79) (22.94) (22.32)
Time dummy 1994 20.0466 20.0649 20.0980(21.69) (22.36) (21.57)
Time dummy 1995 20.0601 20.0812 20.1075(21.43) (21.96) (21.12)
Time dummy 1996 20.1032 20.1253 20.2482(21.90) (22.36) (22.02)
Constant 0.0056 0.0169 20.0012(0.40) (1.44) (20.04)
Test for non-autocorrelation of the first order z ¼ 22:07 z ¼ 21:85 z ¼ 22:37(0.038) (0.064) (0.018)
Test for non-autocorrelation of the second order z ¼ 21:07 z ¼ 21:15 z ¼ 21:27(0.285) (0.248) (0.202)
Sargan test (Prob . x 2) (0.6194) (0.6008) (0.2222)
Notes: aStudent-t distribution is shown below the estimated parameters, while p-values are includedin the parentheses of the diagnostic tests
Table V.Arellano-Bond
estimations obtained byincluding geographical
proxies in the benchmarkmodel
Labour marketflexibility and
innovation
233
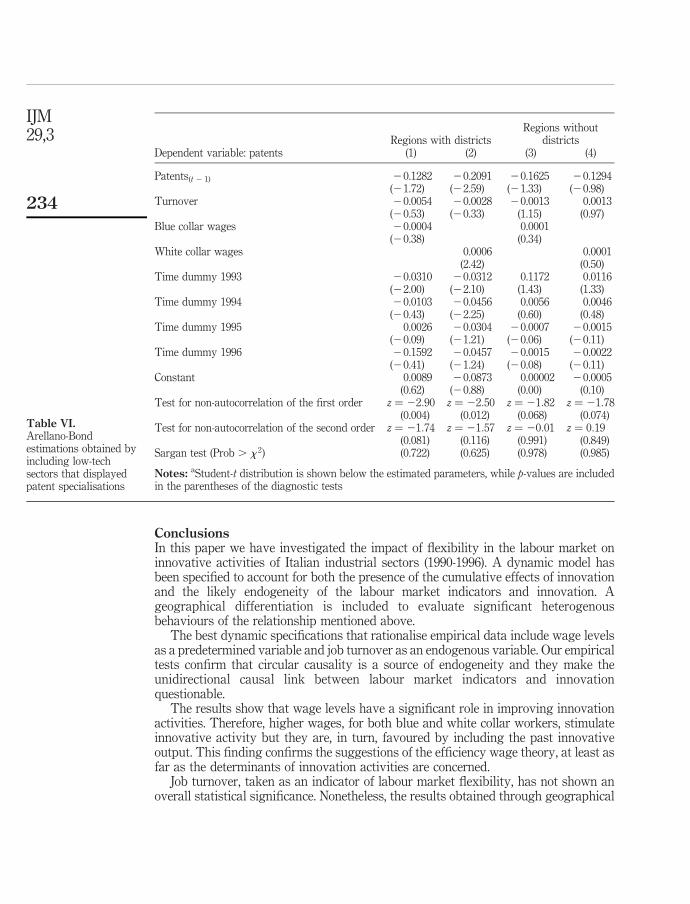
ConclusionsIn this paper we have investigated the impact of flexibility in the labour market oninnovative activities of Italian industrial sectors (1990-1996). A dynamic model hasbeen specified to account for both the presence of the cumulative effects of innovationand the likely endogeneity of the labour market indicators and innovation. Ageographical differentiation is included to evaluate significant heterogenousbehaviours of the relationship mentioned above.
The best dynamic specifications that rationalise empirical data include wage levelsas a predetermined variable and job turnover as an endogenous variable. Our empiricaltests confirm that circular causality is a source of endogeneity and they make theunidirectional causal link between labour market indicators and innovationquestionable.
The results show that wage levels have a significant role in improving innovationactivities. Therefore, higher wages, for both blue and white collar workers, stimulateinnovative activity but they are, in turn, favoured by including the past innovativeoutput. This finding confirms the suggestions of the efficiency wage theory, at least asfar as the determinants of innovation activities are concerned.
Job turnover, taken as an indicator of labour market flexibility, has not shown anoverall statistical significance. Nonetheless, the results obtained through geographical
Regions with districtsRegions without
districtsDependent variable: patents (1) (2) (3) (4)
Patents(t 2 1) 20.1282 20.2091 20.1625 20.1294(21.72) (22.59) (21.33) (20.98)
Turnover 20.0054 20.0028 20.0013 0.0013(20.53) (20.33) (1.15) (0.97)
Blue collar wages 20.0004 0.0001(20.38) (0.34)
White collar wages 0.0006 0.0001(2.42) (0.50)
Time dummy 1993 20.0310 20.0312 0.1172 0.0116(22.00) (22.10) (1.43) (1.33)
Time dummy 1994 20.0103 20.0456 0.0056 0.0046(20.43) (22.25) (0.60) (0.48)
Time dummy 1995 0.0026 20.0304 20.0007 20.0015(20.09) (21.21) (20.06) (20.11)
Time dummy 1996 20.1592 20.0457 20.0015 20.0022(20.41) (21.24) (20.08) (20.11)
Constant 0.0089 20.0873 0.00002 20.0005(0.62) (20.88) (0.00) (0.10)
Test for non-autocorrelation of the first order z ¼ 22:90 z ¼ 22:50 z ¼ 21:82 z ¼ 21:78(0.004) (0.012) (0.068) (0.074)
Test for non-autocorrelation of the second order z ¼ 21:74 z ¼ 21:57 z ¼ 20:01 z ¼ 0:19(0.081) (0.116) (0.991) (0.849)
Sargan test (Prob . x 2) (0.722) (0.625) (0.978) (0.985)
Notes: aStudent-t distribution is shown below the estimated parameters, while p-values are includedin the parentheses of the diagnostic tests
Table VI.Arellano-Bondestimations obtained byincluding low-techsectors that displayedpatent specialisations
IJM29,3
234
differentiation are not negligible; in regions where the number of patents is moresignificant (the Northwest and Northeast of the country), the indicators of labourflexibility exert a negative impact on innovation. According to recent views that extendthe job-search theory, when a negative impact on innovative activity occurs, the highmobility of labour might affect technology investments within the firm and/or humancapital investments carried out by the workers before being hired.
Finally, in our four “Made in Italy” sectors (textiles, wood and furniture,non-metallic mineral products and metal products) we find a significant relationship inthe industrial district areas. In this context, job turnover does not have a significantrole, while the white collar wages have a significant and positive influence. A notablefinding in this model is the presence of non-cumulative innovative activities, brought tolight by the significant and negative impact of the lagged dependent variable. Thelikely explanation is based on the presence of one firm within an industrial district that,for specific characteristics, produces innovation and periodically patents its products.This motivation can therefore explain the counter-intuitive results concerning thecumulative process of innovation obtained in the district areas.
Notes
1. Actually, this choice is quite questionable. As we will discuss in the next section, labourmobility is often the result of an ambiguous proxy of labour market regulation. In any case,there is no accordance around this point and the debate is still open. We consider thisquestion a technical problem, related to the selection of indicators describing labour marketflexibility, whereas the crucial point faced in this section concerns the consistency of thebasic idea relying on the multidimensional character of the labour flexibility-innovationrelationship.
2. The crucial role played by the co-evolution of tangible (capital, natural resources, etc.) andintangible (competencies, reputation, etc.) resources within corporations has been examinedby the resource-based view and other fields of strategic management theory (Prahalad andHamel, 1990; Teece and Pisano, 1994; Teece, 2000).
3. Technical problems faced by the National Institution of Social Security in updating andreleasing the specific data on the labour market used in this study constrained us to limit ouranalysis to this period.
4. CRENOS is the acronym for the Center for Economic Research North-South, which isaffiliated with the University of Sassari (Italy).
5. A system that categorises invention by product or process.
6. It is known that valid instruments are yi;t22 and lagged values of x0i;t .
7. In order to save space, the results of static model 4 are not reported. The estimated results,the full data set and the program carried out with package STATA 8 are available from theauthors upon request.
8. We could not control directly for R&D investment by including them on the right side of theeconometric specification because of the lack of a suitable breakdown of R&D data involvingboth a sectoral and regional profile. For this reason we think that temporal dummies alsocapture the influence that R&D investment flows exert on patent activities.
References
Acemoglu, D. (1997a), “Technology, unemployment and efficiency”, European Economic Review,Vol. 41 Nos 3-5, pp. 525-33.
Labour marketflexibility and
innovation
235
Acemoglu, D. (1997b), “Training and innovation in an imperfect labour market”, Review ofEconomic Studies, Vol. 64 No. 3, pp. 445-64.
Acemoglu, D. (2002), “Technical change, inequality, and the labour market”, Journal of EconomicLiterature, Vol. XL No. 1, pp. 7-72.
Aghion, P. and Howitt, P. (1994), “Growth and unemployment”, Review of Economic Studies,Vol. 61 No. 3, pp. 477-94.
Amin, A. and Wilkinson, F. (1999), “Learning, proximity and industrial performance: anintroduction”, Cambridge Journal of Economics, Vol. 23 No. 2, pp. 121-5.
Antonelli, C. (1999), The Microdynamics of Technological Changes, Routledge, London.
Antonelli, C. (2005), “Models of knowledge and systems of governance”, Journal of InstitutionalEconomics, Vol. 1 No. 1, pp. 51-73.
Arellano, M. and Bond, S. (1991), “Some test of specification for panel data: Monte Carlo evidenceand an application to employment application”, Review of Economic Studies, Vol. 58 No. 2,pp. 277-97.
Arellano, M. and Bover, O. (1995), “Another look at the instrumental variable estimation of errorcomponents models”, Journal of Econometrics, Vol. 68 No. 1, pp. 29-51.
Arnott, R.J. and Stiglitz, J.E. (1985), “Labor turnover, wage structures and moral hazard: theinefficiency of competitive markets”, Journal of Labor Economics, Vol. 3 No. 4, pp. 434-62.
Arnott, R.J., Hosios, H.J. and Stiglitz, J.E. (1988), “Implicit contracts, labour mobility andunemployment”, The American Economic Review, Vol. 785, pp. 1046-66.
Asheim, B.T. and Coenen, L. (2005), “Knowledge bases and regional innovation system:comparing Nordic clusters”, Research Policy, Vol. 34 No. 8, pp. 1173-90.
Baltagi, H.B. (2001), Econometric Analysis of Panel Data, Wiley, Chichester.
Bassanini, A. and Ernst, E. (2002), “Labour market institutions, product market regulation andinnovation: cross-country evidence”, Working Paper No. 316, Economic Department,Organisation for Economic Co-operation and Development, Paris.
Berman, E., Bound, J. and Griliches, Z. (1994), “Changes in the demand for skilled labour withinUS manufacturing industries”, Quarterly Journal of Economics, Vol. 109 No. 2, pp. 367-98.
Bertola, G. and Rogerson, R. (1997), “Institutions and labour reallocation”, European EconomicReview, Vol. 41 No. 6, pp. 1147-71.
Blundell, R. and Bond, S. (1998), “Initial conditions and moment restrictions in dynamic paneldata models”, Journal of Econometrics, Vol. 87 No. 1, pp. 115-43.
Boeri, T. (1996), “Is job turnover countercyclical?”, Journal of Labor Economics, Vol. 14 No. 4,pp. 603-25.
Boeri, T. (1999), “Enforcement of employment security regulations, on the job-search andunemployment duration”, European Economic Review, Vol. 43 No. 1, pp. 65-89.
Bound, J. and Johnson, G. (1992), “Changes in the structure of wages in the 1980s: an evaluationof alternative explanations”, American Economic Review, Vol. 113 No. 4, pp. 1245-79.
Capello, R. (1999), “Spatial transfer of knowledge in high technology milieux: learning versuscollective learning processes”, Regional Studies, Vol. 33 No. 4, pp. 353-65.
Chennells, L. and Van Reenen, J. (1997), “Technical change and earnings in Britishestablishments”, Economica, Vol. 64 No. 256, pp. 587-604.
Contini, B., Malpele, C. and Villosio, C. (1996), “Wage dynamics and labour mobility in Italy”,Quaderni di Ricerca 96 No. 06, Dipartimento di Economia, Universita di Torino, Turin.
IJM29,3
236
Cooke, P., Gomez Uranga, M. and Etxebarria, G. (1997), “Regional innovation systems:institutional and organizational dimensions”, Research Policy, Vol. 26 Nos 4/5, pp. 475-91.
Faini, R. (1997), “Trade unions and regional development”, Working Paper No. 115, Centro Studid’Agliano, Turin.
Ferrari, S., Guerrieri, P., Malerba, F., Mariotti, S. and Palma, D. (2002), L’Italia nella competizionetecnologica internazionale, Terzo rapporto, Franco Angeli, Milan.
Flaig, G. and Stadler, M. (1994), “Success breeds success: the dynamics of the innovationprocess”, Empirical Economics, Vol. 19 No. 1, pp. 55-68.
Griliches, Z. (1990), “Patent statistics as economic indicators: a survey”, Journal of EconomicLiterature, Vol. XXVIII No. 4, pp. 1661-707.
Hatzichronoglou, T. (1997), “Revision of the hi-technology sector and product classification”, STIWorking Paper No. 2, Organisation for Economic Co-operation and Development, Paris.
Keeble, D. and Wilkinson, F. (1999), “Collective learning and knowledge development in theevolution of regional clusters of high technology SMEs in Europe”, Regional Studies,Vol. 33 No. 4, pp. 295-303.
Kitson, M., Martin, R. and Wilkinson, F. (2000), “Labour markets, social justice and economicefficiency”, Cambridge Journal of Economics, Vol. 24 No. 6, pp. 631-41.
Jacobsson, S. and Philipson, J. (1996), “Sweden’s technological profile. What can R&D andpatents tell and what do they fail to tell us?”, Technovation, Vol. 16 No. 5, pp. 245-53.
Johnson, G. (1997), “Changes in earnings in equality: the role of demand shifts”, Journal ofEconomics Perspectives, Vol. 11 No. 2, pp. 41-54.
Lawson, C. and Lorenz, E. (1999), “Collective learning, tacit knowledge and regional innovativecapacity”, Regional Studies, Vol. 33 No. 4, pp. 305-17.
Lundvall, B.A. (1993), National Systems of Innovation, F. Pinter Publishers, London.
Malerba, F. and Orsenigo, L. (2000), “Reply to letter to the editor regarding paper ‘Technologicalentry, exit and survival: an empirical analysis of patent data’”, Research Policy, Vol. 29No. 9, pp. 1187-8.
Malerba, F. and Torrisi, S. (2000), “La politica pubblica per l’innovazione”, in Malerba, F. (Ed.),Economia dell’innovazione, Carocci editore, Rome.
Machin, S. and Van Reenen, J. (1998), “Technology and changes in skill structure: evidence froman international panel of industries”, Quarterly Journal of Economics, Vol. 113 No. 4,pp. 1215-44.
Michie, J. and Sheehan, M. (2003), “Labour market deregulation, flexibility and innovation”,Cambridge Journal of Economics, Vol. 27 No. 1, pp. 123-43.
Mincer, J. (2003), “Technology and the labour market”, Review of Economics of the Household,Vol. 1, pp. 249-72.
Mohnen, P.A., Nadiri, M.I. and Prucha, I.R. (1986), “R&D, production structure and rates of returnin the US, Japanese and German manufacturing sectors”, European Economic Review,Vol. 30 No. 4, pp. 381-401.
Mortensen, D.T. and Pissarides, C.A. (1994), “Job creation and job destruction in the theory ofunemployment”, Review of Economic Studies, Vol. 61 No. 3, pp. 435-56.
Mortensen, D.T. and Pissarides, C.A. (1998), “Techonological progress, job creation and jobdestruction”, Review of Economic Dynamic, Vol. 1 No. 4, pp. 733-53.
Mortensen, D.T. and Pissarides, C.A. (1999), “Unemployment responses to ‘skill-biased’technology shocks: the role of labour market policy”, Economic Journal, Vol. 109 No. 455,pp. 242-65.
Labour marketflexibility and
innovation
237
Paci, R. and Usai, S. (2000), “The role of specialisation and diversity externalities in theagglomeration of innovative activities”, Rivista Italiana degli Economisti, No. 2.
Papagni, E. (1995), Sviluppo rurale e progresso tecnico nell’economia italiana, Franco Angeli,Milan.
Prahalad, C.K. and Hamel, G. (1990), “The core competence of the corporation”, Harvard BusinessReview, Vol. 68, pp. 79-91.
Shapiro, C. and Stiglitz, J.E. (1984), “Equilibrium unemployment as a worker disciplining device”,American Economic Review, Vol. 74 No. 3, pp. 433-44.
Schivardi, F. (1998), Reallocation and learning over the business cycle, Temi di discussione No. 345,Banca d’Italia, Rome.
Stiglitz, J.E. (1974), “Alternative theories of wage determination and unemployment in LDCs: thelabour turnover model”, The Quarterly Journal of Economics, Vol. 88 No. 2, pp. 194-227.
Stiglitz, J.E. and Greenwald, B.C. (1995), “Labor-market adjustments and the persistence ofunemployment”, American Economic Review, Vol. 85 No. 2, pp. 219-25.
Storper, M. and Scott, A.J. (1995), “The wealth of regions”, Futures, Vol. 27 No. 5, pp. 505-26.
Teece, D.J. (2000), “Strategies for managing knowledge assets: the role of firm structure andindustrial context”, Long Range Planning, Vol. 33 No. 1, pp. 35-54.
Teece, D.J. and Pisano, G. (1994), “The dynamic capabilities of the firm: an introduction”,Industrial and Corporate Change, Vol. 3 No. 3, pp. 537-56.
Vivarelli, M. and Pianta, M. (Eds) (2000), The Employment Impact of Innovation. Evidence andPolicy, Routledge, London.
About the authorsLuca Pieroni is an Assistant Professor at the Department of Economics, Finance and Statistics,University of Perugia, Italy. His research interests are in the field of demand, labour market,growth and commodity markets. Recently, his main research program has analysed thecrowding out/in effects of the components of government expenditure on private categories ofconsumption. Luca Pieroni is the corresponding author and can be contacted at:[email protected]
Fabrizio Pompei is a Post-doctoral Research Fellow at the Department of Economics, Financeand Statistics, University of Perugia, Italy. His research interests are in the field of economics ofinnovation. In recent years he has paid particular attention to the impact of sectoral patterns ofinnovation both in the labour market and its flexibility, and in the market for corporate control.
IJM29,3
238
To purchase reprints of this article please e-mail: [email protected] visit our web site for further details: www.emeraldinsight.com/reprints