ksigdel.pdf - worcester polytechnic institute
TRANSCRIPT
Abstract
This Dissertation presents a series of studies of dilution and different form of dis-order effect on liquid crystal (LC) phase transitions. We have used high-resolutionAC-calorimetry, dielectric spectroscopy as well as polarizing microscopy to char-acterize the effects of solvent such as hexane, acetone, decane, and nanomate-rials such as multiwall carbon nanotubes and ferroelectric nanoparticles on thephase transitions of several liquid crystals. The liquid crystals of interest are:pentylcyanobiphenyl (5CB), octylcyanobiphenyl (8CB), and decylcyanobiphenyl(10CB). Studies have been carried out as a function of solvent, nanotube, andnanoparticles concentration and temperature spanning the isotropic to nematic(I-N), nematic to smectic-A (N -SmA), and isotropic to smectic-A (I-SmA) phasetransitions.
The effect of dilution by a nonmesogenic, low molecular weight, miscible, andcompatible solvent (n-hexane) on the isotropic-nematic (I-N) and the nematic-smectic-A (N -SmA) phase transition in the liquid crystal (LC) octylcyanobiphenyl(8CB) as a function of n-hexane concentration is reported. The heating and cool-ing temperature scans were performed without continuous mixing for all sam-ples of n-hexane mole fraction ranging from 0.02 to 0.12 including the bulk 8CB.Generally, the I-N specific heat peaks shift towards lower temperature nonlin-early while becoming broader but retain the same first-order character as the bulkwith increasing hexane concentration. The N -SmA heat capacity peak shifts non-monotonically to lower temperature and evolves in shape, with a reproduciblehysteresis, as xhex increases. The N -SmA imaginary part of heat capacity remainszero up to xTCP
hex ≃ 0.07 above which the distinct peak is observed, correspondingto a jump in both the real and imaginary enthalpy. A simple power-law analysisreveals an effective exponent that increases smoothly from 0.30 to 0.50 with anamplitude ratio A−/A+ → 1 as xhex → xTCP
hex . This observed crossover towards theN -SmA tricritical point driven by solvent concentration is consistent with previousresults and can be understood as weakening of the liquid crystal intermolecular po-tential promoting increased nematic fluctuations. It is shown that solvent dilution
ii
of an LC, if miscible and depending on solvent structure, can lead to a controlledaltering of the intermolecular potentials responsible for mesophasic behavior.
The first-order transition from the isotropic (I) to smectic-A (SmA) phase inthe liquid crystal 4-cyano-4’-decylbiphenyl (10CB) doped with the polar solventacetone (ace) has been studied as a function of solvent concentration. Heating andcooling scans were performed for miscible 10CB+ace samples having acetone molefractions from xace = 0.05(1 wt.%) to 0.36(10%) over a wide temperature rangefrom 310 to 327 K. Two distinct first-order phase transition features are observedin the mixture whereas there is only one transition (I-SmA) in the pure 10CBfor that particular temperature range. Both calorimetric features reproduce onrepeated heating and cooling scans and evolve with increasing xace with the hightemperature feature relatively stable in temperature but reduced in size whilethe low temperature feature shifts dramatically to lower temperature and exhibitsincreased dispersion. The coexistence region increases for the low-temperaturefeature but remains fairly constant for the high-temperature feature as functionof xace. Polarizing optical microscopy supports the identification of a smecticphase below the high-temperature heat capacity signature indicating that the low-temperature feature represents an injected smectic-smectic phase transition. Theseeffects may be the consequence of screening the intermolecular potential of theliquid crystals by the solvent that stabilizes a weak smectic phase intermediate ofthe isotropic and pure smectic-A.
The study on the weakly first-order isotropic to nematic (I-N) and the con-tinuous nematic to smectic-A (N -SmA) phase transitions of the liquid crystaloctyl-cyanobiphenyl (8CB) doped with well dispersed multiwall carbon nanotubes(CNTs) as a function of CNT concentrations is reported. Thermal scans wereperformed for all samples having CNT weight fraction from ϕw = 0.0005 to 0.0060over a wide temperature range well above and below the two transitions in pure8CB. Both the I-N and the N -SmA transitions evolve in character and have theirtransition temperatures qualitatively offset by ∼ 1.1 K lower as compared to thatin pure 8CB for all 8CB+CNTs samples. The enthalpy change associated witheach phase transition is essentially the same as that of pure 8CB and remainsunchanged with increasing ϕw. However, there is an evidence that the thermaltransport properties of the composites differ from the pure LC upon cooling belowa ϕw dependent temperature within the nematic phase. In addition, a new Cp
feature is resolved for intermediate ϕw samples that appears to be correlated tothis onset temperature.
A combined high-resolution dielectric and calorimetric study of the isotropic (I)to nematic (N) phase transition of carbon nanotube (CNT) doped liquid crystal(LC) as a function of CNT concentration is reported. The evolution of the I-Nphase transition, the temperature dependence of local nematic ordering formedby dispersed CNTs in the LC media and the transition enthalpy, were coherently
iii
monitored. Anisotropic CNT-aggregates induce local deformation to the nematicdirector and form pseudo-nematic domains within the LC media. Results clearlyindicate the dramatic impact of dispersed CNTs on both the isotropic and nematicphases of the LC+CNT hybrid system.
Finally, the weakly first-order isotropic to nematic (I-N) and the continuousnematic to smectic-A (N -SmA) phase transition study is reported on liquid crys-tal octylcyanibiphenyl (8CB) doped with a ferroelectric nano-particle Barium Ti-tanate, BaTiO3 (BT ). A high-resolution ac-calorimetric study was performed asa function of temperature and BT concentration over a wide temperature rangewell above and below the two transitions. From the thermal scans of all samples(ϕm = 0.001 to 0.014 and pure 8CB), it is revealed that both the I -N and the N -SmA transitions evolve in character and have their transition temperatures shiftlower as the ϕm increases. Increasing hysteresis with increasing concentration isalso observed at the I -N transition between heating and cooling ∆Cp peaks withinthe two-phase I+N coexistence region. These effects suggest that there are stronginteractions between the polar LC molecules and ferroelectric BT nanoparticles.
iv
Table of Contents
List of Figures viii
List of Tables xv
Acknowledgments xvi
1 Introduction 11.1 Introduction . . . . . . . . . . . . . . . . . . . . . . . . . . . . . . . 11.2 Liquid crystalline Phases . . . . . . . . . . . . . . . . . . . . . . . . 3
1.2.1 Nematic Phase . . . . . . . . . . . . . . . . . . . . . . . . . 41.2.2 Smectic Phase . . . . . . . . . . . . . . . . . . . . . . . . . . 7
1.3 Review of Thermodynamics . . . . . . . . . . . . . . . . . . . . . . 91.3.1 Thermodynamic state functions . . . . . . . . . . . . . . . . 111.3.2 Thermodynamic Response functions . . . . . . . . . . . . . . 12
1.4 General Description of Phase Transition . . . . . . . . . . . . . . . 131.4.1 Symmetry . . . . . . . . . . . . . . . . . . . . . . . . . . . . 141.4.2 Order of Phase transition . . . . . . . . . . . . . . . . . . . 141.4.3 Order Parameter . . . . . . . . . . . . . . . . . . . . . . . . 15
1.5 Theoretical Background . . . . . . . . . . . . . . . . . . . . . . . . 161.5.1 Landau Theory of Phase Transition . . . . . . . . . . . . . . 16
1.5.1.1 Isotropic to nematic (I-N) phase transition . . . . 181.5.1.2 Nematic to Smectic-A (N -SmA) phase transition . 201.5.1.3 Isotropic to smectic-A (I-SmA)phase transition . . 221.5.1.4 Effect of solvent on phase transitions . . . . . . . . 23
1.6 Review of LC mixtures and composites . . . . . . . . . . . . . . . . 241.7 Dissertation Outline . . . . . . . . . . . . . . . . . . . . . . . . . . 25
2 Experimental Techniques 322.1 Review of AC-Calorimetry . . . . . . . . . . . . . . . . . . . . . . . 32
2.1.1 Introduction . . . . . . . . . . . . . . . . . . . . . . . . . . . 32
v
2.1.2 Theory of Operation . . . . . . . . . . . . . . . . . . . . . . 332.1.3 Design and Operation of the AC Calorimeter . . . . . . . . 41
2.1.3.1 Calorimetric Cell Design . . . . . . . . . . . . . . . 412.1.3.2 Calorimeter Design . . . . . . . . . . . . . . . . . . 42
2.1.4 Thermometry . . . . . . . . . . . . . . . . . . . . . . . . . . 462.2 Polarizing Microscopy . . . . . . . . . . . . . . . . . . . . . . . . . 482.3 Dielectric Spectroscopy . . . . . . . . . . . . . . . . . . . . . . . . . 492.4 Materials . . . . . . . . . . . . . . . . . . . . . . . . . . . . . . . . 51
2.4.1 Liquid crystals . . . . . . . . . . . . . . . . . . . . . . . . . 512.4.1.1 Characteristics of 5CB . . . . . . . . . . . . . . . . 512.4.1.2 Characteristics of 8CB . . . . . . . . . . . . . . . . 522.4.1.3 Characteristics of 10CB . . . . . . . . . . . . . . . 52
2.4.2 Solvents . . . . . . . . . . . . . . . . . . . . . . . . . . . . . 532.4.2.1 Characteristics of n-hexane . . . . . . . . . . . . . 532.4.2.2 Characteristics of acetone . . . . . . . . . . . . . . 542.4.2.3 Characteristics of decane . . . . . . . . . . . . . . . 54
2.4.3 Nanomaterials . . . . . . . . . . . . . . . . . . . . . . . . . . 552.4.3.1 Characteristics of carbon nanotubes . . . . . . . . 552.4.3.2 Characteristics of BaTiO3 . . . . . . . . . . . . . . 56
2.5 Sample preparation . . . . . . . . . . . . . . . . . . . . . . . . . . . 572.5.1 Calorimetry Sample Preparation . . . . . . . . . . . . . . . . 57
2.5.1.1 8CB+n-hexane mixtures . . . . . . . . . . . . . . . 572.5.1.2 10CB+acetone mixtures . . . . . . . . . . . . . . . 582.5.1.3 LC+nanomaterials composites . . . . . . . . . . . . 58
2.5.2 Microscopy Sample and Cell Preparation . . . . . . . . . . . 592.6 Experimental procedure . . . . . . . . . . . . . . . . . . . . . . . . 59
3 Isotropic to nematic phase transition in octylcyanobiphenyl andn-hexane binary mixtures 643.1 Introduction . . . . . . . . . . . . . . . . . . . . . . . . . . . . . . . 643.2 Results . . . . . . . . . . . . . . . . . . . . . . . . . . . . . . . . . . 66
3.2.1 Overview . . . . . . . . . . . . . . . . . . . . . . . . . . . . 663.2.2 Phase Diagram . . . . . . . . . . . . . . . . . . . . . . . . . 683.2.3 The I-N phase transition enthalpy . . . . . . . . . . . . . . 72
3.3 Discussion and conclusions . . . . . . . . . . . . . . . . . . . . . . 74
4 Nematic to smectic-A phase transition in octylcyanobiphenyland hexane binary mixtures 814.1 Introduction . . . . . . . . . . . . . . . . . . . . . . . . . . . . . . . 814.2 Results . . . . . . . . . . . . . . . . . . . . . . . . . . . . . . . . . . 84
4.2.1 The N -SmA Heat Capacity . . . . . . . . . . . . . . . . . . 844.2.2 Power-law Analysis of the N -SmA phase transition . . . . . 89
4.3 Discussion and Conclusions . . . . . . . . . . . . . . . . . . . . . . 93
vi
5 Isotropic to smectic-A phase transition in liquid crystal + ace-tone binary mixtures 995.1 Introduction . . . . . . . . . . . . . . . . . . . . . . . . . . . . . . . 995.2 Results . . . . . . . . . . . . . . . . . . . . . . . . . . . . . . . . . . 1015.3 Discussion and conclusions . . . . . . . . . . . . . . . . . . . . . . . 108
6 Phase transitions in carbon nanotubes and liquid crystal com-posites 1186.1 Introduction . . . . . . . . . . . . . . . . . . . . . . . . . . . . . . . 1186.2 Experimental . . . . . . . . . . . . . . . . . . . . . . . . . . . . . . 120
6.2.1 Materials and Sample Preparation . . . . . . . . . . . . . . . 1206.2.2 Ac-Calorimetry . . . . . . . . . . . . . . . . . . . . . . . . . 121
6.3 Phase transitions in 8CB+CNT . . . . . . . . . . . . . . . . . . . . 1236.3.1 Overview . . . . . . . . . . . . . . . . . . . . . . . . . . . . 1236.3.2 The I-N and N -SmA phase transitions . . . . . . . . . . . . 1256.3.3 Thermodynamic Anomaly . . . . . . . . . . . . . . . . . . . 130
6.4 Phase transition on 5CB+CNT . . . . . . . . . . . . . . . . . . . . 1346.5 Conclusions . . . . . . . . . . . . . . . . . . . . . . . . . . . . . . . 138
7 Phase transitions in ocylcyanobiphenyl-barium titanate nanopar-ticle dispersions 1467.1 Introduction . . . . . . . . . . . . . . . . . . . . . . . . . . . . . . . 1467.2 Results . . . . . . . . . . . . . . . . . . . . . . . . . . . . . . . . . . 1487.3 Discussion and conclusions . . . . . . . . . . . . . . . . . . . . . . . 156
8 Concluding Remarks 1628.1 Future Directions . . . . . . . . . . . . . . . . . . . . . . . . . . . . 164
A Appendix 165A.1 Publications . . . . . . . . . . . . . . . . . . . . . . . . . . . . . . . 165
vii
List of Figures
1.1 Building Block of LCs. . . . . . . . . . . . . . . . . . . . . . . . . 31.2 Cartoon of nematic phase along with nematic texture observed un-
der polarizing microscope. The scale bar is of 10 µm. . . . . . . . . 51.3 Schematic of chiral nematic liquid crystal phase . . . . . . . . . . . 61.4 Cartoon of Smectic-A along with Smectic-A texture observed under
polarizing microscope. The scale bar is of 10 µm. . . . . . . . . . . 71.5 Cartoon of Smectic-A phase demonstrating molecular arrangement,
the director orientation, and density distribution along layer normalz . . . . . . . . . . . . . . . . . . . . . . . . . . . . . . . . . . . . . 8
1.6 Cartoon of Smectic-C phase . . . . . . . . . . . . . . . . . . . . . . 9
2.1 Schematic diagram of the One Lump Thermal Model used for ACCalorimetry. . . . . . . . . . . . . . . . . . . . . . . . . . . . . . . 35
2.2 Log - log plot of ωTac vs ω . . . . . . . . . . . . . . . . . . . . . . . 402.3 Cell design of an envelope type cell. . . . . . . . . . . . . . . . . . . 412.4 Design of the AC Calorimeter. . . . . . . . . . . . . . . . . . . . . 432.5 Design of the AC Calorimeter. . . . . . . . . . . . . . . . . . . . . 442.6 Block diagram the calorimeter, showing all the connections to the
instruments. . . . . . . . . . . . . . . . . . . . . . . . . . . . . . . 452.7 Design of the Dielectric spectrometer. . . . . . . . . . . . . . . . . 492.8 Design of the Dielectric spectrometer. . . . . . . . . . . . . . . . . 502.9 Molecular structure of the 5CB molecule. . . . . . . . . . . . . . . . 512.10 3D structure of the 5CB molecule. . . . . . . . . . . . . . . . . . . . 512.11 Molecular structure of the 8CB molecule. . . . . . . . . . . . . . . . 522.12 3D structure of the 8CB molecule. . . . . . . . . . . . . . . . . . . 522.13 Molecular structure of the 10CB molecule. . . . . . . . . . . . . . . 532.14 3D structure of the 10CB molecule. . . . . . . . . . . . . . . . . . . 532.15 Structure of the n-hexane molecule. . . . . . . . . . . . . . . . . . . 542.16 Structure of the acetone molecule. . . . . . . . . . . . . . . . . . . . 552.17 Molecular structure of the acetone molecule. . . . . . . . . . . . . . 552.18 Structure of the CNT [31]. . . . . . . . . . . . . . . . . . . . . . . . 56
viii
2.19 Structure of the BaTiO3 molecule. . . . . . . . . . . . . . . . . . . . 57
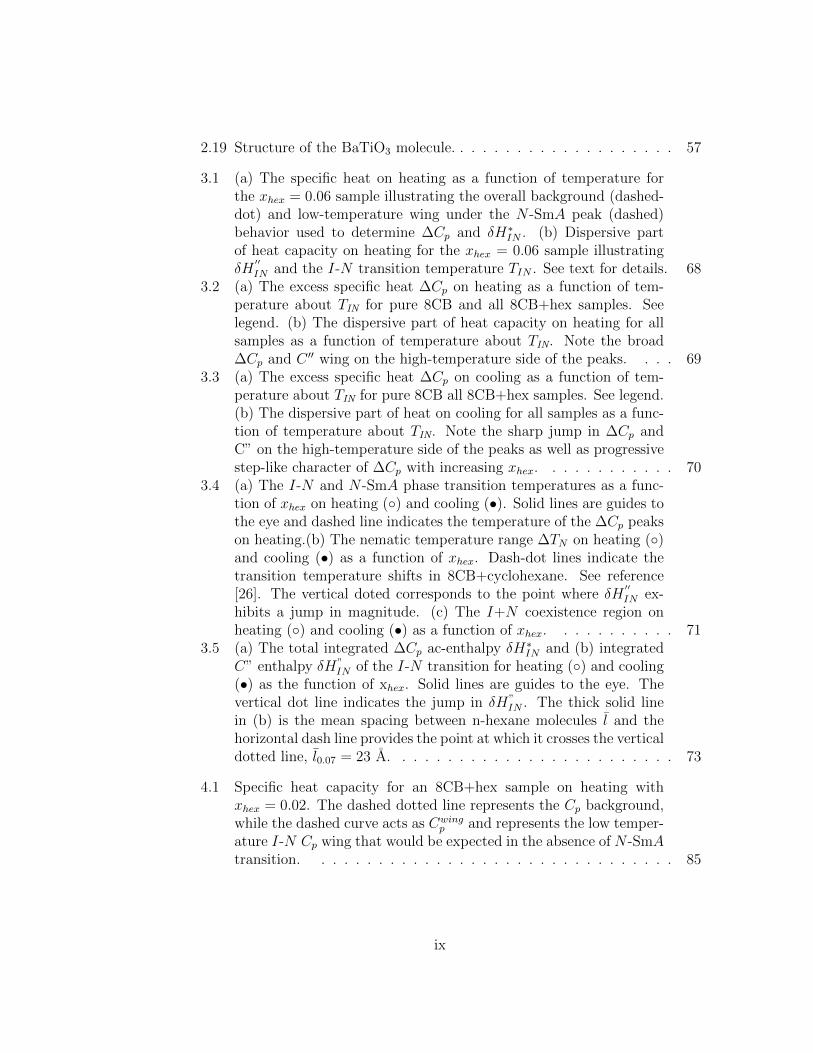
3.1 (a) The specific heat on heating as a function of temperature forthe xhex = 0.06 sample illustrating the overall background (dashed-dot) and low-temperature wing under the N -SmA peak (dashed)behavior used to determine ∆Cp and δH∗IN . (b) Dispersive partof heat capacity on heating for the xhex = 0.06 sample illustratingδH
′′IN and the I-N transition temperature TIN . See text for details. 68
3.2 (a) The excess specific heat ∆Cp on heating as a function of tem-perature about TIN for pure 8CB and all 8CB+hex samples. Seelegend. (b) The dispersive part of heat capacity on heating for allsamples as a function of temperature about TIN. Note the broad∆Cp and C ′′ wing on the high-temperature side of the peaks. . . . 69
3.3 (a) The excess specific heat ∆Cp on cooling as a function of tem-perature about TIN for pure 8CB all 8CB+hex samples. See legend.(b) The dispersive part of heat on cooling for all samples as a func-tion of temperature about TIN. Note the sharp jump in ∆Cp andC” on the high-temperature side of the peaks as well as progressivestep-like character of ∆Cp with increasing xhex. . . . . . . . . . . . 70
3.4 (a) The I-N and N -SmA phase transition temperatures as a func-tion of xhex on heating () and cooling (•). Solid lines are guides tothe eye and dashed line indicates the temperature of the ∆Cp peakson heating.(b) The nematic temperature range ∆TN on heating ()and cooling (•) as a function of xhex. Dash-dot lines indicate thetransition temperature shifts in 8CB+cyclohexane. See reference[26]. The vertical doted corresponds to the point where δH
′′IN ex-
hibits a jump in magnitude. (c) The I+N coexistence region onheating () and cooling (•) as a function of xhex. . . . . . . . . . . 71
3.5 (a) The total integrated ∆Cp ac-enthalpy δH∗IN and (b) integratedC” enthalpy δH”
IN of the I-N transition for heating () and cooling(•) as the function of xhex. Solid lines are guides to the eye. Thevertical dot line indicates the jump in δH”
IN . The thick solid linein (b) is the mean spacing between n-hexane molecules l and thehorizontal dash line provides the point at which it crosses the verticaldotted line, l0.07 = 23 A. . . . . . . . . . . . . . . . . . . . . . . . . 73
4.1 Specific heat capacity for an 8CB+hex sample on heating withxhex = 0.02. The dashed dotted line represents the Cp background,while the dashed curve acts as Cwing
p and represents the low temper-ature I-N Cp wing that would be expected in the absence of N -SmAtransition. . . . . . . . . . . . . . . . . . . . . . . . . . . . . . . . 85
ix
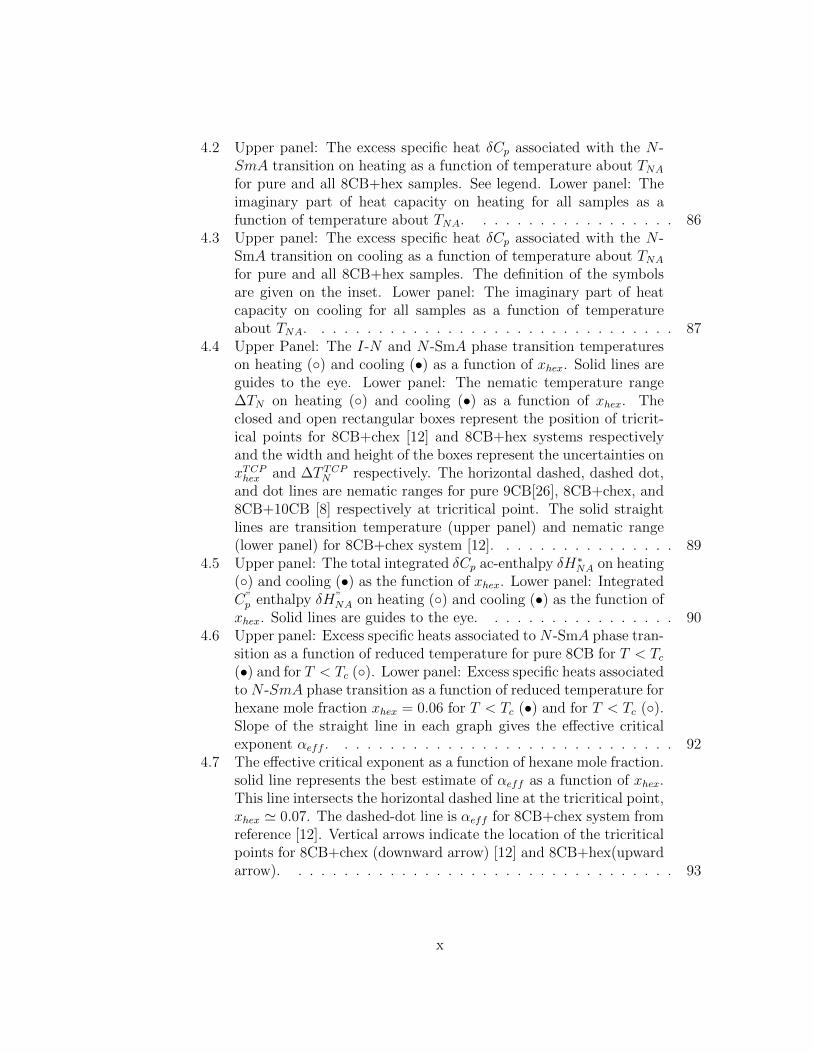
4.2 Upper panel: The excess specific heat δCp associated with the N -SmA transition on heating as a function of temperature about TNA
for pure and all 8CB+hex samples. See legend. Lower panel: Theimaginary part of heat capacity on heating for all samples as afunction of temperature about TNA. . . . . . . . . . . . . . . . . . 86
4.3 Upper panel: The excess specific heat δCp associated with the N -SmA transition on cooling as a function of temperature about TNA
for pure and all 8CB+hex samples. The definition of the symbolsare given on the inset. Lower panel: The imaginary part of heatcapacity on cooling for all samples as a function of temperatureabout TNA. . . . . . . . . . . . . . . . . . . . . . . . . . . . . . . . 87
4.4 Upper Panel: The I-N and N -SmA phase transition temperatureson heating () and cooling (•) as a function of xhex. Solid lines areguides to the eye. Lower panel: The nematic temperature range∆TN on heating () and cooling (•) as a function of xhex. Theclosed and open rectangular boxes represent the position of tricrit-ical points for 8CB+chex [12] and 8CB+hex systems respectivelyand the width and height of the boxes represent the uncertainties onxTCP
hex and ∆T TCPN respectively. The horizontal dashed, dashed dot,
and dot lines are nematic ranges for pure 9CB[26], 8CB+chex, and8CB+10CB [8] respectively at tricritical point. The solid straightlines are transition temperature (upper panel) and nematic range(lower panel) for 8CB+chex system [12]. . . . . . . . . . . . . . . . 89
4.5 Upper panel: The total integrated δCp ac-enthalpy δH∗NA on heating() and cooling (•) as the function of xhex. Lower panel: IntegratedC”
p enthalpy δH”NA on heating () and cooling (•) as the function of
xhex. Solid lines are guides to the eye. . . . . . . . . . . . . . . . . 904.6 Upper panel: Excess specific heats associated to N -SmA phase tran-
sition as a function of reduced temperature for pure 8CB for T < Tc
(•) and for T < Tc (). Lower panel: Excess specific heats associatedto N -SmA phase transition as a function of reduced temperature forhexane mole fraction xhex = 0.06 for T < Tc (•) and for T < Tc ().Slope of the straight line in each graph gives the effective criticalexponent αeff . . . . . . . . . . . . . . . . . . . . . . . . . . . . . . 92
4.7 The effective critical exponent as a function of hexane mole fraction.solid line represents the best estimate of αeff as a function of xhex.This line intersects the horizontal dashed line at the tricritical point,xhex ≃ 0.07. The dashed-dot line is αeff for 8CB+chex system fromreference [12]. Vertical arrows indicate the location of the tricriticalpoints for 8CB+chex (downward arrow) [12] and 8CB+hex(upwardarrow). . . . . . . . . . . . . . . . . . . . . . . . . . . . . . . . . . 93
x
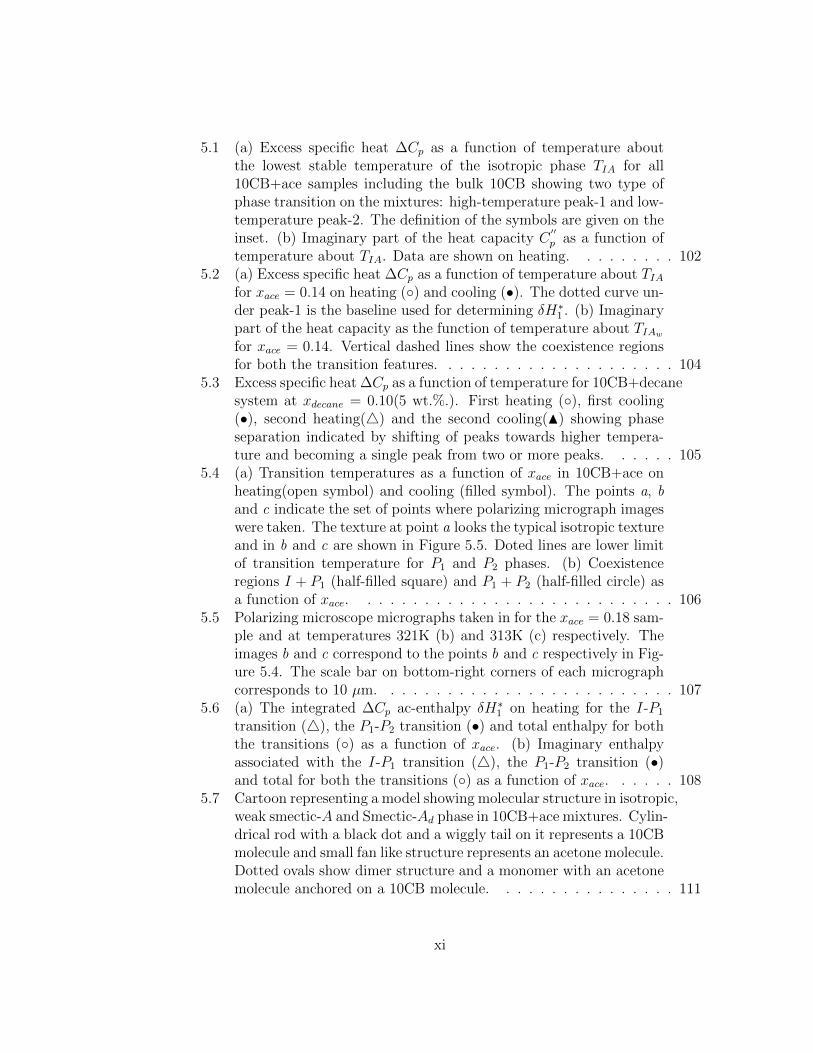
5.1 (a) Excess specific heat ∆Cp as a function of temperature aboutthe lowest stable temperature of the isotropic phase TIA for all10CB+ace samples including the bulk 10CB showing two type ofphase transition on the mixtures: high-temperature peak-1 and low-temperature peak-2. The definition of the symbols are given on theinset. (b) Imaginary part of the heat capacity C
′′p as a function of
temperature about TIA. Data are shown on heating. . . . . . . . . 1025.2 (a) Excess specific heat ∆Cp as a function of temperature about TIA
for xace = 0.14 on heating () and cooling (•). The dotted curve un-der peak-1 is the baseline used for determining δH∗1 . (b) Imaginarypart of the heat capacity as the function of temperature about TIAw
for xace = 0.14. Vertical dashed lines show the coexistence regionsfor both the transition features. . . . . . . . . . . . . . . . . . . . . 104
5.3 Excess specific heat ∆Cp as a function of temperature for 10CB+decanesystem at xdecane = 0.10(5 wt.%.). First heating (), first cooling(•), second heating() and the second cooling(N) showing phaseseparation indicated by shifting of peaks towards higher tempera-ture and becoming a single peak from two or more peaks. . . . . . 105
5.4 (a) Transition temperatures as a function of xace in 10CB+ace onheating(open symbol) and cooling (filled symbol). The points a, band c indicate the set of points where polarizing micrograph imageswere taken. The texture at point a looks the typical isotropic textureand in b and c are shown in Figure 5.5. Doted lines are lower limitof transition temperature for P1 and P2 phases. (b) Coexistenceregions I + P1 (half-filled square) and P1 + P2 (half-filled circle) asa function of xace. . . . . . . . . . . . . . . . . . . . . . . . . . . . 106
5.5 Polarizing microscope micrographs taken in for the xace = 0.18 sam-ple and at temperatures 321K (b) and 313K (c) respectively. Theimages b and c correspond to the points b and c respectively in Fig-ure 5.4. The scale bar on bottom-right corners of each micrographcorresponds to 10 µm. . . . . . . . . . . . . . . . . . . . . . . . . . 107
5.6 (a) The integrated ∆Cp ac-enthalpy δH∗1 on heating for the I-P1
transition (), the P1-P2 transition (•) and total enthalpy for boththe transitions () as a function of xace. (b) Imaginary enthalpyassociated with the I-P1 transition (), the P1-P2 transition (•)and total for both the transitions () as a function of xace. . . . . . 108
5.7 Cartoon representing a model showing molecular structure in isotropic,weak smectic-A and Smectic-Ad phase in 10CB+ace mixtures. Cylin-drical rod with a black dot and a wiggly tail on it represents a 10CBmolecule and small fan like structure represents an acetone molecule.Dotted ovals show dimer structure and a monomer with an acetonemolecule anchored on a 10CB molecule. . . . . . . . . . . . . . . . 111
xi
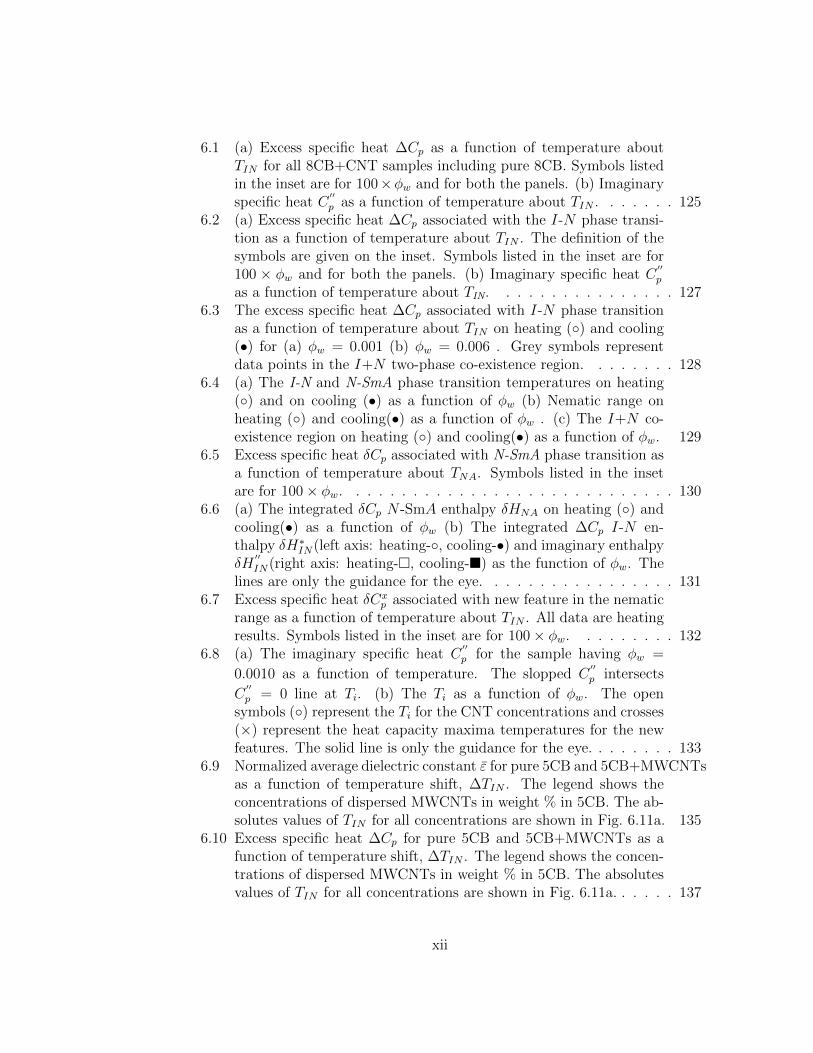
6.1 (a) Excess specific heat ∆Cp as a function of temperature aboutTIN for all 8CB+CNT samples including pure 8CB. Symbols listedin the inset are for 100×ϕw and for both the panels. (b) Imaginaryspecific heat C
′′p as a function of temperature about TIN . . . . . . . 125
6.2 (a) Excess specific heat ∆Cp associated with the I-N phase transi-tion as a function of temperature about TIN . The definition of thesymbols are given on the inset. Symbols listed in the inset are for100 × ϕw and for both the panels. (b) Imaginary specific heat C
′′p
as a function of temperature about TIN. . . . . . . . . . . . . . . . 1276.3 The excess specific heat ∆Cp associated with I-N phase transition
as a function of temperature about TIN on heating () and cooling(•) for (a) ϕw = 0.001 (b) ϕw = 0.006 . Grey symbols representdata points in the I+N two-phase co-existence region. . . . . . . . 128
6.4 (a) The I-N and N-SmA phase transition temperatures on heating() and on cooling (•) as a function of ϕw (b) Nematic range onheating () and cooling(•) as a function of ϕw . (c) The I+N co-existence region on heating () and cooling(•) as a function of ϕw. 129
6.5 Excess specific heat δCp associated with N-SmA phase transition asa function of temperature about TNA. Symbols listed in the insetare for 100 × ϕw. . . . . . . . . . . . . . . . . . . . . . . . . . . . . 130
6.6 (a) The integrated δCp N -SmA enthalpy δHNA on heating () andcooling(•) as a function of ϕw (b) The integrated ∆Cp I-N en-thalpy δH∗IN(left axis: heating-, cooling-•) and imaginary enthalpyδH
′′IN(right axis: heating-, cooling-) as the function of ϕw. The
lines are only the guidance for the eye. . . . . . . . . . . . . . . . . 1316.7 Excess specific heat δCx
p associated with new feature in the nematicrange as a function of temperature about TIN . All data are heatingresults. Symbols listed in the inset are for 100 × ϕw. . . . . . . . . 132
6.8 (a) The imaginary specific heat C′′p for the sample having ϕw =
0.0010 as a function of temperature. The slopped C′′p intersects
C′′p = 0 line at Ti. (b) The Ti as a function of ϕw. The open
symbols () represent the Ti for the CNT concentrations and crosses(×) represent the heat capacity maxima temperatures for the newfeatures. The solid line is only the guidance for the eye. . . . . . . . 133
6.9 Normalized average dielectric constant ε for pure 5CB and 5CB+MWCNTsas a function of temperature shift, ∆TIN . The legend shows theconcentrations of dispersed MWCNTs in weight % in 5CB. The ab-solutes values of TIN for all concentrations are shown in Fig. 6.11a. 135
6.10 Excess specific heat ∆Cp for pure 5CB and 5CB+MWCNTs as afunction of temperature shift, ∆TIN . The legend shows the concen-trations of dispersed MWCNTs in weight % in 5CB. The absolutesvalues of TIN for all concentrations are shown in Fig. 6.11a. . . . . . 137
xii
6.11 a) The transition temperature, ∆TIN , as a function of MWCNTsconcentration and comparison between the two techniques used forthe measurements, b) ac-enthalpy (right) and imaginary enthalpy(left) as a function of MWCNTs concentration, for details see text,c) The normalized dielectric constant, ε, as a function of MWCNTsconcentration at the starting temperature, 302 K (left) and absolutedielectric constant in the deep isotropic phase (315 K) as a functionof MWCNTs concentration (right). . . . . . . . . . . . . . . . . . . 139
7.1 (a) Excess specific heat ∆Cp on heating as a function of tempera-ture about TIN for all 8CB+CNT samples including pure 8CB. (b)Imaginary specific heat C
′′p on heating as a function of temperature
about TIN . Same Symbols listed in the inset of (a) are used for bothfigures (a) and (b) and are for 100 × ϕm. . . . . . . . . . . . . . . . 149
7.2 (a) Excess specific heat ∆Cp associated with the I-N phase tran-sition on heating as a function of temperature about TIN for all8CB+CNT samples including pure 8CB. (b) The I-N Imaginaryspecific heat C
′′p on heating as a function of temperature about TIN .
Symbols listed in the inset are for 100 × ϕm and applied for boththe figures (a) and (b). . . . . . . . . . . . . . . . . . . . . . . . . . 150
7.3 (a) Excess specific heat ∆Cp on cooling as a function of temperatureabout TIN . (b) Imaginary specific heat C
′′p on cooling as a function
of temperature about TIN. The definition of the symbols are givenon the inset. Symbols listed in the inset are for 100 × ϕm. . . . . . . 151
7.4 Excess specific heat δCp associated with N-SmA phase transition(a) on heating (b) on cooling as a function of temperature aboutTNA. Symbols listed in the inset are for 100 × ϕm. . . . . . . . . . 152
7.5 (a) The I-N phase transition temperature as a function of ϕw. Thedashed curve represents the I-N ∆Cp peak temperature on heating.(b) The I+N co-existence region as a function of ϕm. (c) TheN-SmA phase transition temperatures as a function of ϕm. (d) Thenematic range as a function of ϕm . All data shown are the average ofheating and cooling. The solid and doted curves on (a)-(c) representheating and cooling behavior respectively. The vertical dot linerepresents the boundary between low-ϕm and high-ϕm regime. . . . 154
7.6 (a) The integrated ∆Cp I-N enthalpy δH∗IN as the function of ϕw.(b) The imaginary enthalpy δH
′′IN as the function of ϕm. (c) The
integrated δCp N -SmA enthalpy δHNA as a function of ϕm. Thelines are only the guidance for the eye. All data are averaged outfrom heating and cooling data. The vertical dot line represents theboundary between low-ϕm and high-ϕm regime. . . . . . . . . . . . 155
xiii
7.7 The I-N () andN -SmA (•) phase transition temperature differenceon heating and cooling as a function of ϕm. The vertical dot linerepresents the boundary between low-ϕm and high-ϕm regime. . . . 156
xiv
List of Tables
3.1 Summary of the calorimetric results for pure 8CB and the 8CB+hexsamples on heating. Shown are n-hexane molar fraction xhex, I-Ntransition temperature TIN , nematic temperature range ∆TN , I+Nco-existence region δTI+N (in Kelvins), effective ac-enthalpy changeδH∗IN and dispersive enthalpy δH
′′IN (in J/g). . . . . . . . . . . . . 67
4.1 Summary of the calorimetric results for pure and all 8CB+hex sam-ples on heating. Shown are hexane molar fraction xhex, N -SmAtransition temperature TNA, nematic range ∆TN = TIN − TNA(in Kelvin), integrated enthalpy change δH∗NA, imaginary enthalpyδH”
NA (in J/g), McMillan’s Ratio MR, and heat capacity maximumhM u δCmax
p (N − A) in (JK−1g−1). . . . . . . . . . . . . . . . . . 91
5.1 Summary of the ac-calorimetric results for the 10CB+ace samples.Shown are acetone molar fraction xace, the I-P1 phase transitiontemperature T1, the P1- P2 transition temperature T2 (in Kelvin),integrated enthalpy change for the I-P1 transition δH∗1 , integratedenthalpy change for the P1-P2 transition δH∗2 , total integrated en-thalpy δH∗T , imaginary enthalpy for the I-P1 transition δH
′′1 , imag-
inary enthalpy for the P1-P2 transition δH′′2 , and total imaginary
enthalpy for both the transitions δH′′T (in J/g). . . . . . . . . . . . 109
6.1 Summary of the calorimetric results for the 8CB+CNT sampleson heating. Shown are CNT wt. fraction ϕw, the I-N transitiontemperature TIN , the N -SmA transition temperature TNA, nematicrange ∆TN(in Kelvin), integrated enthalpy change δH∗IN , imaginaryenthalpy δH”
IN (in J/g), height of the N -SmA δCp peak, hNA (inJ/g K) and δHNA, integrated enthalpy change for the N-SmA tran-sition in (J/g). . . . . . . . . . . . . . . . . . . . . . . . . . . . . . 126
xv

Acknowledgments
I would like to offer my deep and sincere gratitude to my supervisor ProfessorGermano S. Iannacchione, for his excellent guidance, stimulating suggestions, as-sistance and encouragement throughout this work. His profound knowledge andexcellent experimental skill gave me an extraordinary experience. This work wouldnever have been possible without his support and encouragement. I am deeply in-debted for putting a lot of effort to teach me about experimental physics, technicalwriting and presentation techniques. Thank you very much.
I really appreciate a lot the help from all the members of the Physics Depart-ment at WPI, but especially that of the two secretaries, Jacqueline H. Malone andMargaret Caisse. Special thanks go to the department of Physics providing finan-cial and moral support. I want to thank Roger Steele for his technical assistance.
I would like to express my sincere thank to Prof. P. K. Aravind for suggestions,guidelines and help throughout my stay at WPI and for serving my dissertationcommittee. Next, I would like to thank Prof. Georgi Georgiev from AssumptionCollege for serving my dissertation committee.
I am also very grateful to my Dad, Mom and my daughters for their uncon-ditional love and support. Lastly and most importantly, I thank my wife SrijanaSigdel for her support, encouragement, and understanding.
xvi

Dedicated to my Dad and Mom.
xvii
Chapter 1Introduction
1.1 Introduction
Liquid crystal (LC) is an anisotropic fluid which exhibits both the properties of
solid and liquid. As its name suggests it is an intermediate phase of matter in
between the liquid and crystal[1, 2]. The molecules in a crystal possess both
positional and orientational order while the molecules in a liquid do not have
any order and can move freely in random manner. The liquid crystal molecules
possess orientational and partial translational order. LC can flow as a liquid and
at the same time its molecules may be oriented in a certain direction like the
molecules in a crystal do. LC has some crystalline properties such as magnetic,
electric and optical anisotropy, periodic arrangement of molecules in one spatial
direction as well as some typical properties of a liquid such as fluidity, elasticity
and formation of droplets. For this reason, the LC phases are called mesophases(
meaning ‘in between phase’) and the molecules that show mesomorphic phases
are called ‘mesogens’. Typically, the molecules are rod-like or disk-like. The rod
like molecules or rod-like mesogens are elongated (∼ 25A) and have anisotropic
geometry which leads to preferential alignment along one spatial direction. Disc-
like molecules or discotic mesogens are flat and have more or less disc-shaped
central core leading to two dimensional columnar ordering. A large number of well-
known compounds show liquid crystalline behavior e.g. cellulose, DNA, cholesterol
esters, paraffins.
The credit for the discovery of liquid crystal goes to an Austrian botanical
1
2
physiologist Friedrich Reinitzer, even though the liquid crystalline behavior, with-
out recognizing its nature, was observed in the past as well [3]. In 1888, Reitnizer
observed two melting temperatures of cholesteryl benzoate [4, 5, 6]. At 145.5 C it
melts forming a cloudy liquid, that become clear at 178.5 C. Reitnizer was puz-
zled with this peculiar feature shown by the compound and wrote to physicist Otto
Lehmann seeking help from later’s expertise of polarizing microscopy. After the
observation of the sample gotten from Reinitzer, Lehmann realized that the cloudy
liquid observed was a new state of matter and coined the name “liquid crystal”,
illustrating that it is something between a liquid and a solid, sharing important
properties of both [7]. Today, thousands of other substances are known which
have a diversity of phases between the solid and liquids. Interest in LC research
increased after world war II. Development of industrial applications and basic stud-
ies of structure and phase transition of LC has promoted dramatic growth in LC
research in recent years.
Liquid crystal technology has had a major effect in many areas of science and
technology [8, 9]. The most common application of liquid crystal technology is
liquid crystal displays which has grown to a multi-billion companies. From simple
wrist watch, to an advanced computer screen LCDs have evolved into an versatile
interface. LCD uses much less power than that CRTs use. Progress in understand-
ing LC phases also helps the understanding of more complex soft materials such
as cell membrane and of natural processes- e.g. certain diseases such as sickle-cell
anemia.
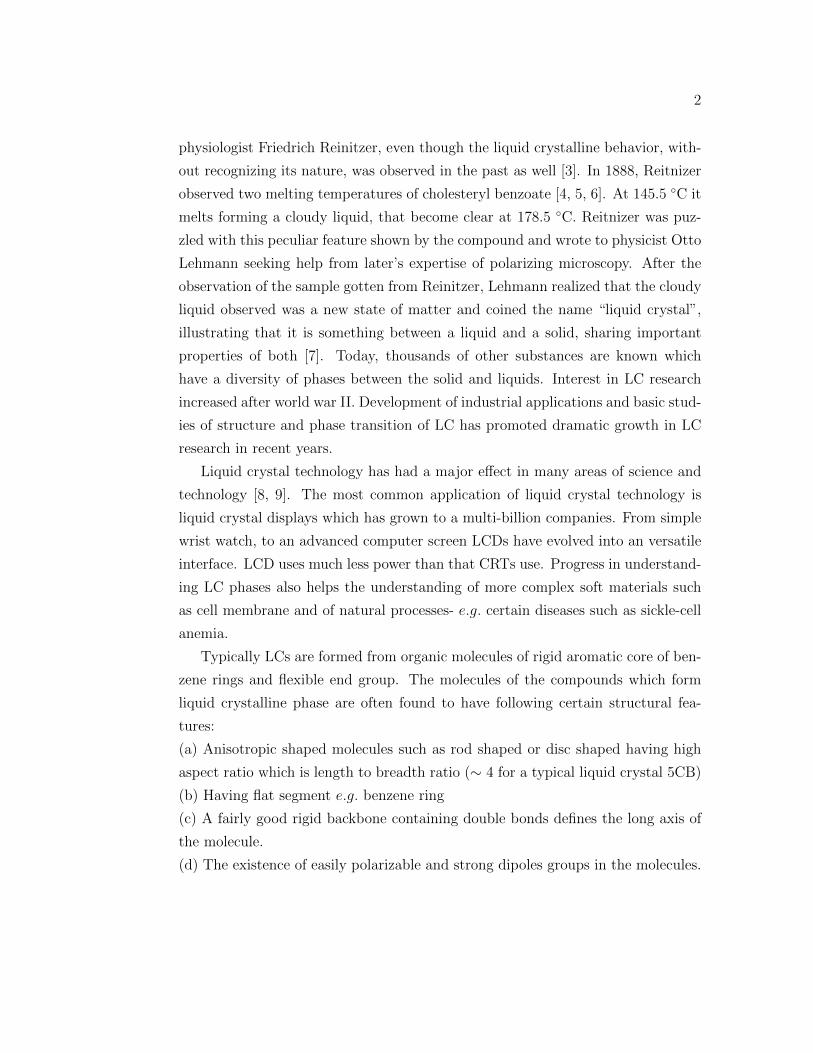
Typically LCs are formed from organic molecules of rigid aromatic core of ben-
zene rings and flexible end group. The molecules of the compounds which form
liquid crystalline phase are often found to have following certain structural fea-
tures:
(a) Anisotropic shaped molecules such as rod shaped or disc shaped having high
aspect ratio which is length to breadth ratio (∼ 4 for a typical liquid crystal 5CB)
(b) Having flat segment e.g. benzene ring
(c) A fairly good rigid backbone containing double bonds defines the long axis of
the molecule.
(d) The existence of easily polarizable and strong dipoles groups in the molecules.
3
X RR
~2 nm
X RR X RR
~2 nm~2 nm
~2 nm
Physicist s View:
Chemist s View:
0.5nm
0.5nm
R-C N-Cl, -Br-F-NO2
-CnH2n+1; n= 1, ------
-OCnH2n+1; n= 1,-----
-COO-
-OOC-CnH2n+1
-OOC-OCnH2n+1
-N=N-
-N=NO-
-CH=CH-
-O-CO
-CH=N-
RRXR-C N-Cl, -Br-F-NO2
-CnH2n+1; n= 1, ------
-OCnH2n+1; n= 1,-----
-COO-
-OOC-CnH2n+1
-OOC-OCnH2n+1
-N=N-
-N=NO-
-CH=CH-
-O-CO
-CH=N-
RRX
Figure 1.1. Building Block of LCs.
A broad class of organic molecules with the general pattern as shown in Fig. 1.1
form liquid crystalline phases.
1.2 Liquid crystalline Phases
Based on the mechanism that drives the liquid crystalline self-assembly, LCs are
usually classified into two broad categories: Thermotropic and Lyotropic liquid
crystals. Thermotropic LCs are induced by thermal process. They show phase
behavior change as a function of temperature. Thermotropic mesogens can be
obtained either lowering the temperature of its isotropic phase or raising the tem-
perature of its solid phase. The thermotropic LC which can be changed into the
LC state either from lowering the temperature of a liquid or raising the tempera-
ture of a solid is called enantiotropic LC and the liquid crystal which reaches LC
phase only upon a unidirectional change in temperature is called monotropic.
Lyotropic LCs are induced by solvent. Their phase behavior change due to the
4
change in concentration of solvent. The most common and conventional lyotropic
LCs consist of amphiphilic (surfactant) molecules having a hydrophilic (polar)
head and hydrophobic (non-polar) tail dissolved in water. When the amphiphilic
molecules are dissolved in an appropriate solvent (e.g. water), they self-assemble
in such a way that the polar heads are in contact with a polar solvent (water)
and the non-polar tails are in contact with non-polar co-solvent producing small,
essentially spherical aggregates (∼ 5 nm in diameter) known as micelles. These
micelles are formed only when the concentration of amphiphilic molecules is greater
than some critical value. Below the critical concentration, the solution looks like
general solvent with solute particles distributed randomly in a solvent. At higher
concentrations, the molecules may arrange into planer bilayer membrane forming
a lamellar phase. Lyotropic LCs are of great interest in biological studies.
LC displays varieties of intermediate thermodynamically stable phases but the
most common and important are “Nematic” and “Smectic” phases. This nomen-
clature was provided by Friedel [10]. The brief description of each of these phases
are as follows;
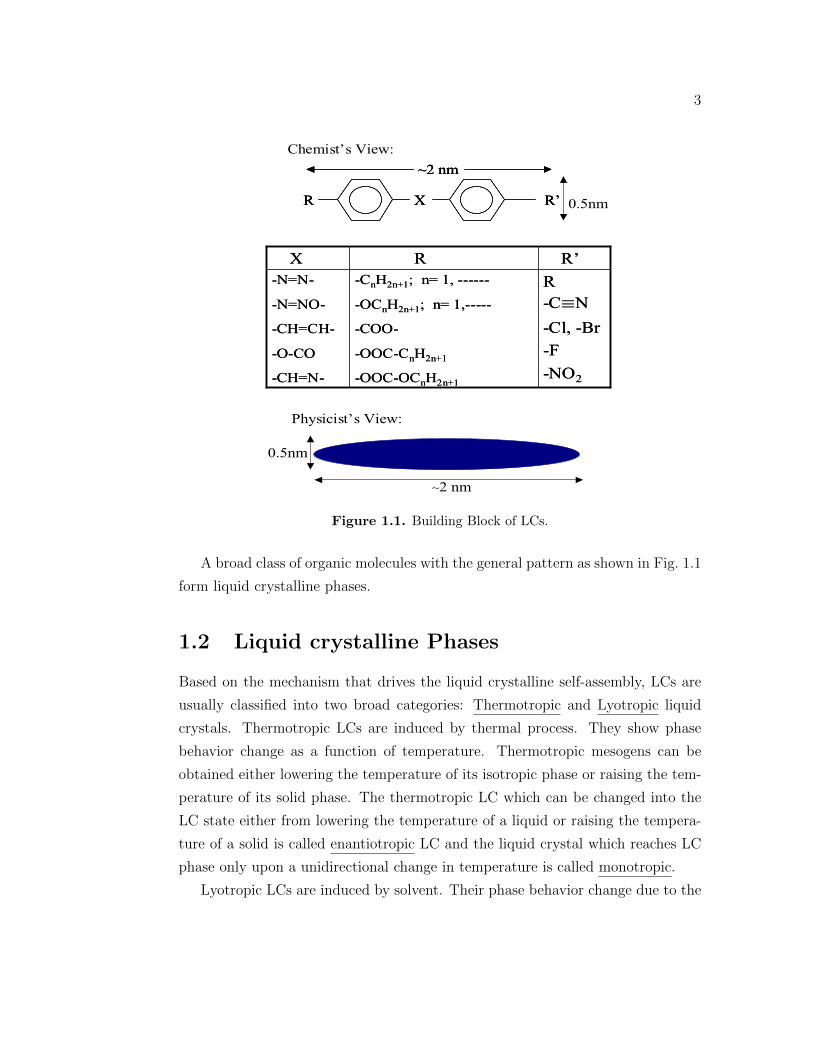
1.2.1 Nematic Phase
Nematic is the simplest liquid crystalline phase and derived its name from a Greek
word νηµα meaning thread because of the observed thread-like defects in their
structures while seen under polarizing microscope. In nematic phases (Fig. 1.2),
the molecules are free to move in all directions i.e. there is no positional order of
centers of mass but they tend to orient in a certain direction. The direction of
preferred orientation can be described by a unit vector, n, and is called nematic-
director. For uniaxial nematic, the director n is a “headless” vector i.e. n = −n.
A nematic sample can be considered as a collection of large number of domains
each of which has a single director. The directors in different domains may point
in different directions and it changes smoothly from one domain to another due to
the absence of real boundaries between the domains. The interface between the
domains is called a topological defect.
The magnitude of local order is described by the orientational order parameter
5
Nematic
Figure 1.2. Cartoon of nematic phase along with nematic texture observed underpolarizing microscope. The scale bar is of 10 µm.
which is the average of the second Legendre polynomial in the most useful form
S = ⟨P2(cosθ)⟩ = (1/2)⟨3cos2θ − 1⟩, (1.1)
where θ is the angle between a molecule’s long axis and the director n. The angled
bracket indicates the local average over all the molecules. This quantity measures
the average degree of molecular alignment with respect to the director[2]. In an
isotropic phase, molecules are randomly oriented in all possible directions where
⟨cos2θ⟩ = 1/3, so the order parameter S = 0. When the director n is parallel to
the long molecular axis (if all the molecules are oriented in one direction), θ = 0
for all molecules, then ⟨cos2θ⟩ = 1 and S = 1 and we get perfectly ordered nematic
phase. If θ = π/2, then ⟨cos2θ⟩ = 0 making the order parameter S = −1/2. It
is worth noting that S varies from -1/2 to 1 where -1/2 represents the unstable
situation with all the molecules perpendicular to the director. Typically, S lies in
between 0.6 − 0.8 in the deep nematic phase. Also, a simple form ⟨cosθ⟩ can not
be used as an order parameter because of the fact that n = −n.
To get the information of order of molecules in a nematic phase the scalar
nematic order parameter, S, is not sufficient and we need a macroscopic order
parameter which is more general a symmetric and traceless second rank tensor
(Qij) [2] and is established in three dimensions. For uniaxial nematic, it is given
6
P/2
n
P/2
nn
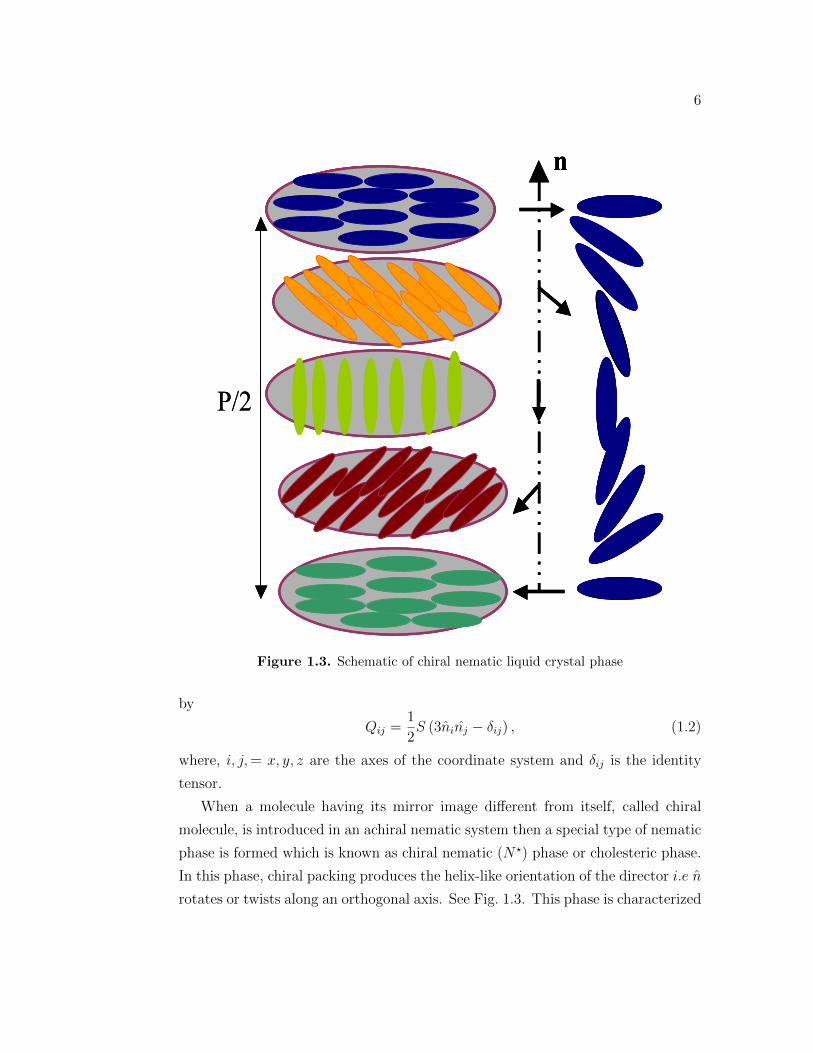
Figure 1.3. Schematic of chiral nematic liquid crystal phase
by
Qij =1
2S (3ninj − δij) , (1.2)
where, i, j,= x, y, z are the axes of the coordinate system and δij is the identity
tensor.
When a molecule having its mirror image different from itself, called chiral
molecule, is introduced in an achiral nematic system then a special type of nematic
phase is formed which is known as chiral nematic (N⋆) phase or cholesteric phase.
In this phase, chiral packing produces the helix-like orientation of the director i.e n
rotates or twists along an orthogonal axis. See Fig. 1.3. This phase is characterized
7
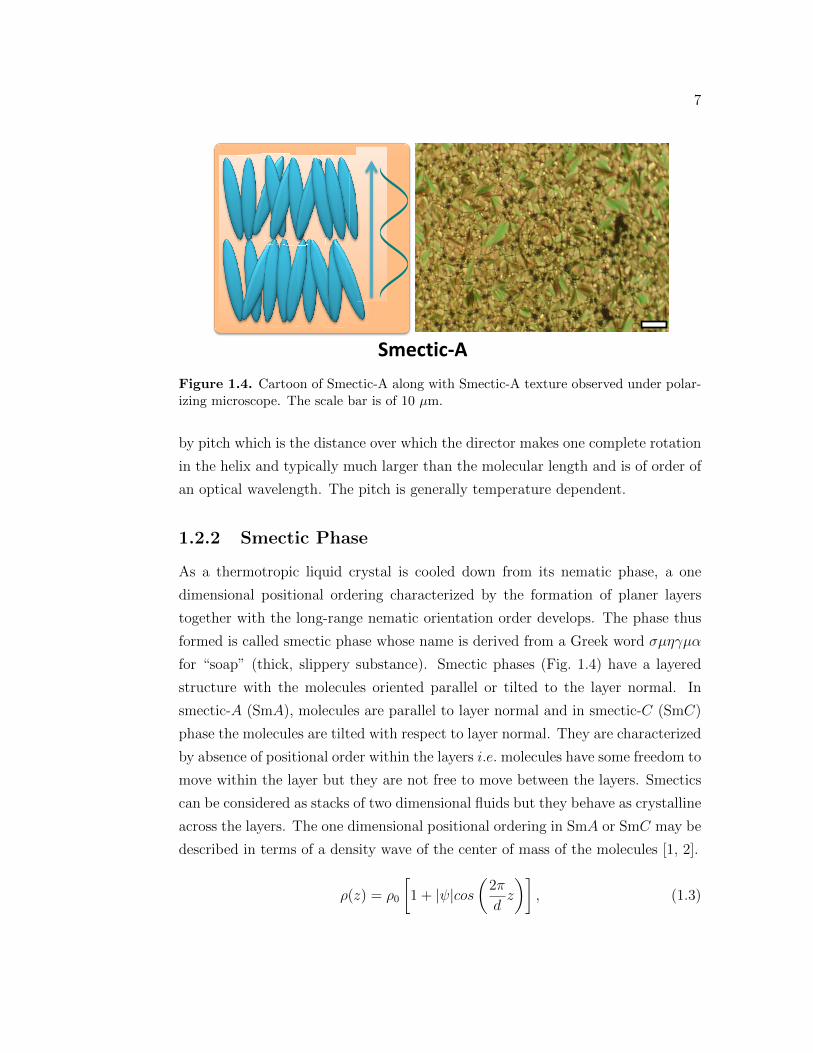
Smectic-A
Figure 1.4. Cartoon of Smectic-A along with Smectic-A texture observed under polar-izing microscope. The scale bar is of 10 µm.
by pitch which is the distance over which the director makes one complete rotation
in the helix and typically much larger than the molecular length and is of order of
an optical wavelength. The pitch is generally temperature dependent.
1.2.2 Smectic Phase
As a thermotropic liquid crystal is cooled down from its nematic phase, a one
dimensional positional ordering characterized by the formation of planer layers
together with the long-range nematic orientation order develops. The phase thus
formed is called smectic phase whose name is derived from a Greek word σµηγµα
for “soap” (thick, slippery substance). Smectic phases (Fig. 1.4) have a layered
structure with the molecules oriented parallel or tilted to the layer normal. In
smectic-A (SmA), molecules are parallel to layer normal and in smectic-C (SmC)
phase the molecules are tilted with respect to layer normal. They are characterized
by absence of positional order within the layers i.e. molecules have some freedom to
move within the layer but they are not free to move between the layers. Smectics
can be considered as stacks of two dimensional fluids but they behave as crystalline
across the layers. The one dimensional positional ordering in SmA or SmC may be
described in terms of a density wave of the center of mass of the molecules [1, 2].
ρ(z) = ρ0
[1 + |ψ|cos
(2π
dz
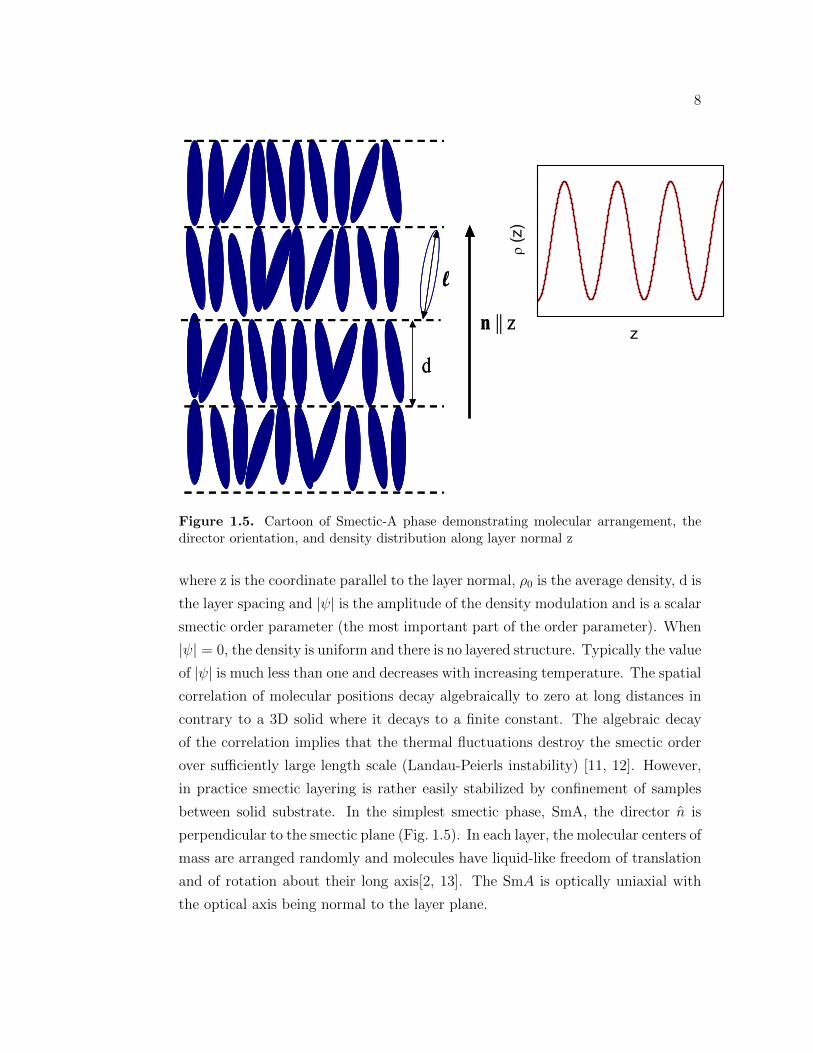
)], (1.3)
8
d
n || z
l
d
n || z
l
(z)
z
z
Figure 1.5. Cartoon of Smectic-A phase demonstrating molecular arrangement, thedirector orientation, and density distribution along layer normal z
where z is the coordinate parallel to the layer normal, ρ0 is the average density, d is
the layer spacing and |ψ| is the amplitude of the density modulation and is a scalar
smectic order parameter (the most important part of the order parameter). When
|ψ| = 0, the density is uniform and there is no layered structure. Typically the value
of |ψ| is much less than one and decreases with increasing temperature. The spatial
correlation of molecular positions decay algebraically to zero at long distances in
contrary to a 3D solid where it decays to a finite constant. The algebraic decay
of the correlation implies that the thermal fluctuations destroy the smectic order
over sufficiently large length scale (Landau-Peierls instability) [11, 12]. However,
in practice smectic layering is rather easily stabilized by confinement of samples
between solid substrate. In the simplest smectic phase, SmA, the director n is
perpendicular to the smectic plane (Fig. 1.5). In each layer, the molecular centers of
mass are arranged randomly and molecules have liquid-like freedom of translation
and of rotation about their long axis[2, 13]. The SmA is optically uniaxial with
the optical axis being normal to the layer plane.
9
d
nl
z
d
nl
z
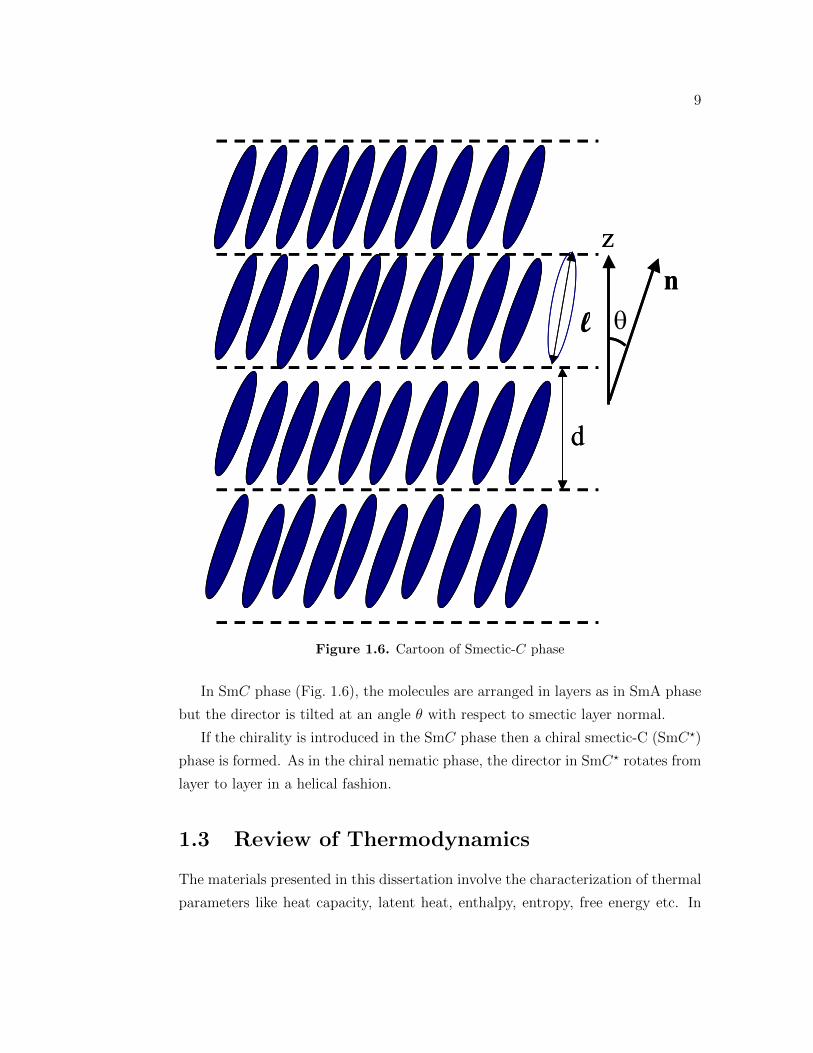
Figure 1.6. Cartoon of Smectic-C phase
In SmC phase (Fig. 1.6), the molecules are arranged in layers as in SmA phase
but the director is tilted at an angle θ with respect to smectic layer normal.
If the chirality is introduced in the SmC phase then a chiral smectic-C (SmC⋆)
phase is formed. As in the chiral nematic phase, the director in SmC⋆ rotates from
layer to layer in a helical fashion.
1.3 Review of Thermodynamics
The materials presented in this dissertation involve the characterization of thermal
parameters like heat capacity, latent heat, enthalpy, entropy, free energy etc. In
10
this section a brief review of thermodynamic parameters and basic thermodynamic
relations are presented.
The word ‘thermodynamics’ comes from Greek origin meaning heat (therme)
and energy or power (dynamics). Thermodynamics is that branch of physics which
deals with the transformation of heat into mechanical work. Thermodynamics is
used in many discipline such as physics, engineering, biochemistry etc. to under-
stand physical processes and has innumerable applications. In thermodynamics, we
consider macroscopic systems and never are interested in the atomic constitution
of the matter.
A certain quantity of matter bounded by some closed surface is known as a
system and anything outside this system which can exchange energy with it and
has a direct bearing on the behavior of the system is called surroundings. The
state of a system is defined by assigning values to a sufficient number of variables.
The state of a system can be represented by specifying its pressure P, volume
V, and temperature T provided the system is in equilibrium. These parameters
describing the state of the system are called thermodynamic variables or thermo-
dynamic coordinates. Therefore, a thermodynamic system can be described in
terms of thermodynamic coordinates. A certain relation exists between these ther-
modynamic coordinates. The first and second law of thermodynamics provide two
relations which respectively can be stated as,
dQ = dU + PdV, (1.4)
dQ = TdS. (1.5)
Combining the two laws, we have
TdS = dU + PdV, (1.6)
dU = TdS − PdV. (1.7)
Here, dQ is amount of heat change, dU is change in internal energy, and dS is
entropy change. For the complete description of a system these coordinates are
not sufficient and we need some function which are the function of variables P, V,
11
T, and S and are known as thermodynamic potentials or the state functions. Four
important thermodynamic state functions are as follows;
1.3.1 Thermodynamic state functions
1. Internal or Intrinsic energy: The internal energy of a thermodynamic system
is the energy possessed by the system by virtue of its molecular constitution
and the position of the molecules and is defined by the equation,
dU = dQ− dW, (1.8)
where, dW is the external work done and may be replaced by PdV and dQ
may be replaced by TdS by second law of thermodynamics. Therefore,
dU = TdS − PdV. (1.9)
When a system passes from one state to another, the change in internal
energy is independent of the route followed between the two states.
2. Helmholtz free energy:
It is defined as
F = U − TS. (1.10)
A small change in the Helmholtz free energy is related to change in heat and
work via first law of thermodynamics:
dF = dU−d(TS) = dQ−dW−SdT−TdS = dQ−TdS−SdT−dW. (1.11)
In reversible process
dF = −SdT − dW. (1.12)
At constant temperature
12
dF = −dW. (1.13)
The Helmholtz free energy measures the amount of work a system can do in
an isothermal reversible process. If the process is not reversible, dQ−Tds = 0
and dQ < TdS. Therefore, dF < −dW . The F at constant T is a minimum
as a function of all parameters which are not fixed by external constraints.
3. Enthalpy: It is defined as
H = U + PV. (1.14)
The enthalpy measures the amount of work a system can do in an adia-
batic, isobaric process. This is the amount of non-mechanical work, since
the pressure has to be kept constant.
4. Gibb’s free energy:
It is defined as,
G = U − TS + PV. (1.15)
The Gibbs potential measures the amount of work a system can do at con-
stant temperature and pressure. The Gibbs potential measures the amount
of non-mechanical work a system can do on the outside world at constant
pressure and temperature.
1.3.2 Thermodynamic Response functions
Thermodynamic response functions are derivatives of one thermodynamic param-
eter with respect to another under specific conditions on the remaining variables.
1. Heat Capacity:
It is one of the most important response functions to measure. Measurement
of heat capacity is the heart of our research in ac-calorimetry. It tells us
how much heat the system will take up if we increase its temperature. These
measurements can be done either at fixed pressure or volume. The specific
13
heat at constant pressure is given by
Cp =
(dH
dT
)
p
= T
(∂S
∂T
)
p
= −T(∂2G
∂T 2
). (1.16)
In general, the source of a sample’s heat capacity (C) are the fluctuations of
the sample’s energy. Thus, it is natural to consider C as a dynamic quantity.
However, for most materials the characteristic relaxation time of the energy
fluctuations are too short to be sensed by traditional calorimetric techniques.
Nevertheless, a complex heat capacity may be defined containing a real (C′)
and imaginary (C′′) component indicating the storage (capacitance) and loss
(dispersion) of the energy in the sample analogous to a complex permittivity.
C∗ = C′ − iC
′′. (1.17)
2. Thermal expansivity:
Another important response function is thermal expansivity (or coefficient
of thermal expansion) which is defined as
α =1
V
(∂V
∂T
)
p
. (1.18)
3. Isothermal compressibility:
It is defined as
κ = − 1
V
(∂V
∂P
)
T
. (1.19)
1.4 General Description of Phase Transition
The sudden, dramatic change in a system’s properties may occur by altering the
thermodynamic variables such as temperature, pressure etc. We refer to this sit-
uation as a phase transition. Phase transitions present a challenge to statistical
mechanics. By definition, at the transition point the system is expected to exhibit
singular behavior.
14
1.4.1 Symmetry
The change in temperature of a system can cause a change in order and disorderness
of a system. At the highest temperature a system will be at its most disordered
state. It will have the highest symmetry possible. As the temperature is lowered,
when there is a phase transition, that symmetry is frequently broken; the resultant
system will have a lower symmetry.
1.4.2 Order of Phase transition
Order of a phase transition is an important tool to classify the nature of the non-
analytic behavior at the phase transition. When two phases co-exist they will each
have same Gibbs free energy G.
Traditionally, phase transitions were characterized, by Paul Ehrenfest, on the
basis of the nature of kink (discontinuity) in G. If nth derivative of G with respect
to temperature T, keeping other intensive variables constant, is discontinuous then
the transition was said to be nth order. Since (∂G/∂T )p = −S, we see that the
discontinuity in (∂G/∂T ) is the change in entropy between the two phases. Thus at
a first order phase transition, the entropy changes discontinuously, while at second
order and higher order transitions the entropy varies continuously. And since the
latent heat is given by T∆S it follows that there is latent heat involved with a first
order phase transition, but not with higher orders.
Nowadays Ehrenfest classification is no longer used. According to modern
classification, there are two types of transitions one being a first-order and the
other second-order or continuous phase transition. First-order phase transition
involves latent heat and discontinuity in thermodynamical parameters. In second-
order phase transition no discontinuity occurs; all the thermodynamic parameters
vary continuously.
A first-order phase transition from a phase a to phase b can be formulated as
[13]
Ga −Gb = 0, (1.20a)
−[∂Gb
∂T
]
P
+
[∂Ga
∂T
]
P
= Sb − Sa = ∆S = L/T, (1.20b)
15
[∂Gb
∂P
]
T
−[∂Ga
∂P
]
T
= Vb − Va = ∆V, (1.20c)
where, ∆S and ∆V are changes in entropy and volume respectively at the transi-
tion and L is latent heat. For the first-order transition, changes in enthalpy ∆H(
or ∆S) and in volume ∆V are observed.
For second-order phase transition both ∆H and ∆V are zero but second deriva-
tive of Gibbs function with respect to temperature and pressure lead to change in
heat capacity, expansivity and compressibility [13].
Ga(T, P ) = Gb(T, P ), (1.21a)
−[∂Gb
∂T
]
P
+
[∂Ga
∂T
]
P
= Sb − Sa = ∆S = 0, (1.21b)
[∂Gb
∂P
]
T
−[∂Ga
∂P
]
T
= Vb − Va = ∆V = 0, (1.21c)
[∂2Gb
∂T 2
]
P
+
[∂2Ga
∂T 2
]
P
=1
T[Cpa − Cpb
] =∆Cp
T, (1.21d)
[∂2Gb
∂P 2
]
T
−[∂2Ga
∂P 2
]
T
= V [κa − κb] = V∆κ, (1.21e)
[∂2Gb
∂P∂T
]−
[∂2Ga
∂T∂P
]= V [αa − αb] = V∆α. (1.21f)
1.4.3 Order Parameter
A Phase transition occurs when a new state of symmetry develops from either
ordered (low temperature) or disordered (high temperature) phase. The ordered
phase has a lower symmetry due to the breaking of symmetry during the transi-
tion of disordered to ordered phase. The ordered state can be characterized by
introducing a parameter that describes the character and strength of the broken
symmetry which is called an order parameter, ϕ. The order parameter provides
the extent to which the configuration of molecules in the less symmetric (more
ordered) phase differs from that in the more symmetric (less ordered) phase. In
general, an order parameter describing a phase transition satisfies the following
requirements:
1. ϕ = 0, in the more symmetric (less ordered) phase, and
2. ϕ = 0, in the less symmetric (more ordered) phase.
16
The choice of a order parameter follows in a quite natural way and depends upon
the system involved but not in the unique way given by the above requirements.
In the case of ferromagnetic transitions, the magnetization which is a vector with
three components is an order parameter. In the case of liquid-vapor transition, the
order parameter is the difference in density between liquid and vapor phases.
1.5 Theoretical Background
1.5.1 Landau Theory of Phase Transition
Phase transitions involve symmetry breaking (or developing). Generally more
symmetric (disordered) phase is a high-temperature phase and lower symmetric
(ordered) phase is a low-temperature phase. This symmetry breaking can be rep-
resented by order parameters. The original Landau theory is based on the fact
that the thermodynamic quantities of the lower symmetry phase can be obtained
by expanding the thermodynamic potential in powers of the order parameters and
its spatial variation in the neighborhood of the order-disorder transition point and
that sufficiently close to the transition, only the leading terms of the series are
important so that the said expansion becomes a single low-power polynomial. The
thermodynamic behavior of the order parameters in the more ordered phase is then
determined by minimizing the thermodynamic potential.
Let us consider a macroscopic system the equilibrium state of which is char-
acterized by a spatially invariant, dimensionless, scalar order parameter ϕ. The
general form of the Landau free energy is postulated to be
F (P, T, ϕ) = F (P, T, 0) + rϕ+1
2Aϕ2 +
1
3Bϕ3 +
1
4Cϕ4 + · · ·, (1.22)
where, F(p,T,0) is free energy for a given pressure and temperature of the state
with ϕ = 0. The coefficients r, A, B, C are phenomenological constants and
function of temperature and pressure. The equilibrium states can be obtained by
minimizing F with respect to ϕ for fixed P and T i.e.
dF
dϕ= 0,
d2F
dϕ2> 0. (1.23)
17
At the transition temperature these stability conditions are
dF
dϕ= r = 0,
d2F
dϕ2= A = 0, (1.24)
because of the coexistence of both the regions. The condition, r = 0, is derived
from the fact that high temperature phase with ϕ = 0 must give rise to an extreme
value of F (P, T, ϕ). The second condition, A = a(T−Tc) with a = (dA/dT )Tc > 0,
follows from the behavior of F at ϕ = 0 for T above and below the transition
temperature Tc. The landau theory postulates that the phase transition can be
described by the expression
F (P, T, ϕ) = F (P, T, 0) +1
2a(T − Tc)ϕ
2 − 1
3Bϕ3 +
1
4Cϕ4 + · · ·. (1.25)
The Eq. (1.25) has following solutions near the phase transition;
ϕ = 0, ϕ =B ± [B2 − 4ac(T − Tc)]
1/2
2C. (1.26)
Here, the negative sign of B is chosen for the reason of convenience. The coefficients
B and C may be treated as temperature independent coefficients. The discontinuity
of ϕ at the transition requires B = 0 i.e. for low temperature ϕ reads
ϕ =a[(T − Tc)]
1/2
C, C > 0. (1.27)
For a phase which remains invariant by replacing ϕ with −ϕ, only even powers of
ϕ survive. Thus in case of second order phase transition
F (P, T, ϕ) = F (P, T, 0) +1
2Aϕ2 +
1
4Cϕ4 + · · ·. (1.28)
For spatially non-uniform system where the order parameter varies in space (ϕ =
ϕ(r)), we need to add a term of the form γ[∇ϕ(r)]2 in free energy expansion. The
equation then reads,
F (P, T, ϕ) = F (P, T, 0)+1
2Aϕ2− 1
3Bϕ3+
1
4Cϕ4+..................+
1
2γ[∇ϕ(r)]2. (1.29)
Even though the Landau theory is mainly for second order phase transition, it
18
can be extended to the first order phase transition. For the first order transition,
B = 0, C < 0 and the third order term Bϕ3 must present in the free energy
expansion.
The problem with this theory is that the coefficients appearing in the expansion
are phenomenological and their dependence on the molecular properties are not
defined. In addition, this theory does not contain any information about the molec-
ular interactions. Despite these difficulties, Landau theory has been successfully
applied to varieties of phenomena. It is simpler than mean-field (MF) theory.
1.5.1.1 Isotropic to nematic (I-N) phase transition
The nematic state is described by the symmetric traceless tensor order parameter
Q. For description of the isotropic to nematic (I-N) phase transition, the free
energy density (energy per unit volume) f near the transition is expanded up to
fourth or sixth order in Q and all the terms must be invariant combinations of
order parameter under all rotations. For uniaxial nematic, in general, the free
energy density is given by [14]
f = f0 +1
2A(
2
3Tr(Q2)) − 1
3B(
4
3Tr(Q3)) +
1
4C(
4
3Tr(Q4)) + ..................
+D[∇Q]2 + E(n.∇Q)2 + fFE + fSE + fEM + ⃝(Q5),(1.30)
where, A, B, C, D, and E are phenomenological parameters. The terms fFE,
fSE, and fEM add the contribution of free energy due to frank elastic energy,
surface elastic free energy, and electromagnetic interaction respectively. The terms
containing gradient account for the spatial variation of the order parameter. The
presence of cubic term ensures the first order nature of the I-N phase transition.
Since the I-N transition takes place near A = 0 it is assumed that the parameter A
is only temperature dependent term and the others can be regarded as temperature
independent. We can write
A = a(T − T ∗), (1.31)
where, a is a positive phenomenological constant and T ∗ is the limit of metastability
of the isotropic phase.
In the simplest model and in terms of scalar nematic order parameter S, the
19
free energy density for the I-N phase transition can be written as
f = f0 +1
2AS2 − 1
3BS3 +
1
4CS4 + · · ·. (1.32)
In the isotropic phase S = 0 and in the nematic phase S = 0. The constant B > 0
for uniaxial phase with positive anisotropy.
The thermodynamic quantities such as transition temperature TIN , the value
of order parameter, entropy and latent heat can be calculated by requiring that f
be an extremum with respect to S in equilibrium and that the free energies of the
ordered and disordered phases (nematic and isotropic) be equal at the transition.
The later condition implies that the nematic and the isotropic phases can coexist at
the transition temperature. If other variables such as pressure, density are included
in our expression, the two phase would exist along a range of temperatures rather
than at a single point. The equations determining thermodynamic parameters are
f = [1
2a(TIN − T ∗) − 1
3BS +
1
4CS2]S2 = 0, (1.33)
∂f
∂S= [a(TIN − T ∗) −BS + CS2]S = 0. (1.34)
Solving these equations, we can get two possible solutions:
SIN = 0, TIN = T ∗; (1.35)
SIN =2B
3C, TIN = T ∗ +
2B2
9aC. (1.36)
When T ∗ < T < TIN , the minimum corresponds to a nematic phase. There exists
a local minimum corresponding to a possible supercooled isotropic state.
The transition entropy density at TIN is given by
∆s = −∂(f − f0)
∂T|T=TIN
= −1
2aS2 = −2aB2
9C2. (1.37)
The contributions other than included in the model always ensure the positive
value of the entropy. Since the I-N is a first-order transition, there is presence of
latent heat (discontinuity of enthalpy) associated with the transition. The latent
20
heat per unit volume is given by
∆H = TIN∆s =2aB2TIN
9C2. (1.38)
The heat capacity Cp in the nematic phase diverges close to TIN as
Cp ∼ |t|−0.5, (1.39)
where, t = (T ∗∗−T )/TIN , and T ∗∗ is the superheating temperature of the nematic
phase. In the isotropic phase, C = C0 is constant and at T ∗∗ it shows a jump.
1.5.1.2 Nematic to Smectic-A (N-SmA) phase transition
The nematic to smectic-A (N -SmA) transition in an uniaxial nematic liquid crys-
tal involves the rearrangement of the molecules in the layered structure. Molecular
centers in SmA are, on average, arranged in equidistant plane. Within these lay-
ers the molecules can move randomly remaining the director perpendicular to the
smectic layers. In the thermodynamic limit, there exist no true long-range trans-
lational order in SmA phase and the N -SmA phase transition theory is a theory of
one dimensional melting. At the N -SmA phase transition, the continuous transla-
tional symmetry of the nematic phase is spontaneously broken by the appearance
of one dimensional density wave in the SmA phase. Mcmillan [15] and de Gennes
[2] theories suggested that the N -SmA transition could be first-order or second-
order changing the order at tricritical point (TCP). However HPL theory [16, 17]
argued that the N -SmA transition can never be second order ruling out the possi-
bility of TCP. Now, it is believed that the N -SmA phase transition is continuous
in the absence of special circumstances [2].
The Landau-de Gennes theory for the N -SmA phase transition can be devel-
oped by defining order parameter for the SmA phase. The order parameter is |ψ|and is defined as the amplitude of a one dimensional density wave where wave vec-
tor q0 is parallel to the nematic director ( the z-axis), ρ(r) = Re[ρ0+exp(iq0.r)ψ(r)],
q0 = 2π/d is the wave vector corresponding to the layer spacing d. The complex
field ψ(r) = ψ0 exp(iq0.r) has its spatial variation on scale larger than d. Since the
difference between a value of -|ψ| and |ψ| only amounts to the choice of the origin
the expansion in terms of |ψ| only contains even-power terms. The free energy
21
density near the N -SmA transition is given by
fSmA =1
2α|ψ|2 +
1
4β|ψ|4 + · · ·, (1.40)
where, α = α0(T − T0), α0, and β are constants. At temperature TNA = T0 and
below T0, α vanishes and above this temperature it is positive. The coefficient
β is always positive. On these consideration alone one could have second-order
(continuous) N -SmA phase transition but there are number of complications that
needs to be considered.
First, the coupling between smectic order parameter ψ and scalar nematic order
parameter S. To account this coupling a term of the form f1 = −Cψ2δS should
be added in the free energy density expression. Here, C is a positive constant and
δS = S − S0 is increase in the nematic order that comes from the fact that the
value of S does not coincide with S0 obtained in the absence of smectic order.
Second, the nematic free energy density which is minimum for δS = 0 must
be added to the free energy expression (1.40). The nematic free energy density is
given by
fN = fN(s0) +1
2χδS2, (1.41)
where, χ(T ) is a response function (susceptibility), which is large but finite near
the I-N transition TIN and small for T < TIN because of the nearly saturation of
S0. The total free energy density is
fS = fN(s0)+f1+fSmA = fN(s0)+1
2α|ψ|2+ 1
4β|ψ|4−Cψ2δS+
1
2χδS2+···. (1.42)
Minimizing fS with respect to δS, we get δS = Cψ|2χ. Therefore,
fS = fN(s0) +1
2α|ψ|2 +
1
4β′|ψ|4 + · · ·, (1.43)
with β′ = β − 2C2χ. Depending on the values of C and χ and the resulting sign
of β′ three different cases can be obtained:
(i) If T0 ∼ TIN , χ(T0) is large and β′ is negative. In this case the transition is of
first-order and takes place at TNA > T0. One must add a positive sixth order term
in the free energy to ensure the stability.
(ii) If T0 << TIN , χ(T0) is large and β′ is positive. In this case the transition is of
22
second-order and takes place at TNA = T0.
(iii) When β′ = 0, χ(TNA) = 2β/C2 and one has a crossover from a continuous
(second-order) to first-order transition and corresponds to a tricritical point (TCP).
We also need to consider the following effects:
the director fluctuation in nematic phase [18, 19] which gives rise to a coupling
term of the form fn = −Cn|ψ|2 and should be added to the free energy relation.
layer fluctuation in the smectic phases.
the coupling between the nematic order parameter tensor Qij with the smectic
order parameter (may be in the form of f2 ∼ Dψ2δQ).
In summary, one should include all possible effects in free energy.
1.5.1.3 Isotropic to smectic-A (I-SmA)phase transition
The direct I-SmA transition is observed for some liquid crystals and is of first order
in nature. As in the case of the I-N and the N -SmA phase transitions we begin by
defining order parameters. The nematic order parameter is a symmetric, traceless
tensor given by Qij = (1/2)S (3ninj − δij). The smectic order parameter ψ(r) =
ψ0 exp(−iφ) is a complex quantity the modulus |ψ0| of which is the amplitude of
a one dimensional density wave characterized by a phase φ. The layer spacing
is given by d = (2π)/q0 with q0 = |∇φ|. The total free energy density near the
I-SmA transition reads [20]
f = f0 +1
2AS2 − 1
4BS3 +
9
16CS4 +
1
2αψ2
0 +1
4βψ4
0 +3
4λψ2S2
+1
2b1ψ
20q
20 +
1
2b2ψ
20q
20 +
1
2e1Sψ
20q
00),
(1.44)
where, f0 is the free energy density of the isotropic phase, A = a(T − T ∗IN), and
α = α0(T − T ∗IA). The T ∗IN and T ∗IA are the critical temperatures for hypothetical
second order transition to nematic and smectic state respectively in the absence
of cross coupling. All other coefficients including α and α0 are assumed to be
constant near the transition point. The sign of the coupling coefficient λ of the
direct coupling between nematic and smectic order determines the stability of a
phase over the other. The negative sign of λ favors the smectic-A phase over the
nematic whereas the positive λ favors the nematic phase over the smectic-A phase.
For negative λ, the transition is always the I-SmA without a nematic phase in
23
between. At T = TIA, the free energy has two minima: one at S = 0 corresponding
to an isotropic phase and the other at S = 0 corresponding to a smectic-A phase.
At the I-SmA transition, the isotropic minima at S = 0 and the smectic-A minima
at S = 0 (or at SSmA) have equal free energies with a barrier height separating
them. To prevent the possible arrival of the I-N transition before the I-SmA
transition, the TIA has to be larger than the TIN .
1.5.1.4 Effect of solvent on phase transitions
Phase transitions are modified in the presence of non-mesogenic, low-molecular
weight solvents. Generally solvents dilute the liquid crystal and change the inter-
molecular potential significantly. Consequently the change in the phase transition
behavior in the mixture takes place. In the presence of a non-mesogenic, low-
molecular weight solvent, the Landau-de Gennes free energy density for the I-N
transition takes the form [21]
f = f0 +1
2AS2 − 1
3BS3 +
1
4CS4 + E(x)S2 + · · ·, (1.45)
where, the term E(x)S2 has been added to account for the coupling of the order
parameter S and the solvent concentration x. E(x) can be expanded as a power
series of x. Keeping only the leading terms and solving the equation, the new
transition temperature, new order parameter etc. under the influence of the solvent
can be found.
For the N -SmA phase transition, we can modify Landau-de Gennes free energy
density by adding two solvent concentration dependent terms and a term related
to the free energy density of the solvent itself [21]
fS = fN(s0)+1
2α|ψ|2 +
1
4β|ψ|4 −Cψ2δS+
1
2χδS2 +Aψ2x+Dψ2δSx+ES2x+ · · ·.
(1.46)
Minimizing this energy with respect to δS, different thermodynamic quantities can
be found.
Similarly free energy density expression for the I-SmA phase transition can be
modified by adding appropriate x dependent terms in the general expression.
To fully understand the system, all the possible effects such as effect of director
24
fluctuations, coupling between Q (not only S) and ψ, coupling between Q, ψ, and
x should be included in the free energy density relation.
1.6 Review of LC mixtures and composites
As a way of exploring the fundamental nature of the LC interactions responsible
for mesogenic order, critical behavior, and the tuning of viscoelastic properties,
attention has been drawn to the study of miscible mixtures of liquid crystals and
non-mesogenic, low-molecular weight, solvents [21, 22, 23, 24, 25]. X-ray diffraction
experiments performed on the smectic-A and smectic-C phases of thermotropic
liquid crystals mixed with an organic solvent have shown that the smectic layer
spacing increases with solvent content [25]. This research also demonstrated the
formation of an organic lyotropic lamellar liquid crystal phase in which the solvent
molecules largely intercalate between the smectic layers of the LC. It was also
mentioned that from a visual inspection of octylcyanobiphenyl (8CB) and n-hexane
(hex) mixtures that the solvent was not uniformly distributed throughout the host
LC and minimal, non-reproducible, swelling of smectic layers occurred for solvent
volume fractions ≥ 0.1. It was then suggested that the amount of solvent that
can be miscibly incorporated in an LC depends on the host LC, temperature, as
well as the nature and amount of solvent; noting that the 8CB+hex mixture phase
separates for a solvent to liquid crystal mole ratio & 0.1. Other studies of the effect
of a biphenyl solvent on the splay and bend elastic constants and the rotational
viscosity coefficient observed an anomalous behavior of the splay elastic constant
K11, the dielectric anisotropy ∆ε, and the effective rotational viscosity coefficient
γ∗1 near the N -SmA transition [26]. A theoretical study on the influence of non-
mesogenic solvent on the N -SmA phase transition using Landau approach found
a concentration induced tricritical point for the N -SmA transition and that the
Frank elastic constants K11, K22, and K33 are modified as a function of solvent
concentration near the N -SmA phase transition [23].
When carbon nanotubes (CNTs) are dispersed in a liquid crystal, they can
modify the physical properties of the liquid crystal. In a well-dispersed CNT in
a LC host, there is surface anchoring of the LCs on the CNT surfaces, presum-
ably through the π − π stacking of the hexagonal structure of both the biphenyl
25
and graphene, that is strengthened by a binding energy originating from charge
transfer between the LCs and CNT [27]. In recent years, the dispersion of CNTs
in liquid crystal media has attracted intense interest. Research has been focused
on dispersion and alignment of CNTs in thermotropic or lyotropic liquid crystals
[28, 29, 30, 31, 32, 33, 34], and studies of LC+CNT composite system for improving
electro-optical switching properties [35, 36, 37, 38, 39]. Some research efforts have
also been made on phase behavior and phase transitions of LC+CNT mixtures
[40, 41, 42]. LC+CNT binary systems were investigated using optical microscopy
and DSC, finding an enhancement of the isotropic to nematic (I-N) phase transi-
tion temperature revealing a “chimney” type phase diagram in LC+CNT mixtures
over a narrow range of ∼ 0.1 − 0.2 wt.% of CNT [40]. An I-N phase transition
was observed in a LC+CNT suspension due to the joule heating produced by
a dc-electric field that rotates the CNT out of sample plane short-circuiting the
electrodes and producing a current flow through the CNT [42].
The hybrid system containing liquid crystal and ferroelectric nano-particles
such as barium titanate (BaTiO3) and tin-hypodiphosphate (Sn2P2S6) are inter-
esting because of the composite system shows the new properties that are not
observed in pure LC. The ferroelectric nano-particles of smaller size (around 20
nm) can influence the physical properties of liquid crystal without forming de-
fects and disturbing the LC director [43]. It has been shown that the addition
causes an increase of the isotropic to nematic phase transition temperature [44],
increase in dielectric anisotropy [43, 45], higher birefringence and lower voltage
and conductivity [46].
1.7 Dissertation Outline
This dissertation presents the experimental results on the effect of solvents on
the liquid crystalline phase transitions using high-resolution AC-calorimetry, di-
electric spectroscopy, and polarizing microscopy. It also provides the studies of
the influence of nano-materials such as carbon nano-tubes (CNTs) and BaTi03
nano-particles, on the LC phase transitions. We emphasize the I-N , N -SmA, and
I-SmA phase transitions.
Chapter 2 deals with the brief review of experimental techniques we used ac-
26
calorimetry, polarizing microscopy, and dielectric spectroscopy. Chapter 3 presents
the result of influence of hexane (hex) on the I-N transition of octylcyanobiphenyl
(8CB) in the binary mixture of 8CB+hex. Chapter 4 provides the details of the
investigation of 8CB+hex system on the N-SmA phase transition. Chapter 5
presents the effect of acetone (ace) on the I-SmA phase transition in 10CB+ace
system. Chapter 6 provides the effect of carbon nano-tubes on the I-N and the N -
SmA phase transition of 8CB+CNT and 5CB+CNT systems. Chapter 7 provides
the studies on the influence of BaTiO3 ferroelectric nano-particles on the I-N and
the N -SmA phase transition. Chapter 8 presents the conclusion of our work and
the future directions.
Bibliography
[1] S. Chandrashekhar, Liquid Crystals. England: Cambridge University Press,
1992.
[2] P. G. de Gennes and J. Prost, The Physics of Liquid Crystals. Clarendon,
Oxford, England: Oxford University Press, 1993.
[3] P. Palffy-Muhoray Physisc Today, vol. 60, pp. 54–60, 2007.
[4] H. Kelker, “History of liquid crystals,” Mol. Cryst. Liq. Cryst., vol. 21, p. 1,
1973.
[5] P. J. Collings, Liquid Crystals: Natures delicate Phase of Matter. USA: Prince-
ton University Press, 2nd edition, 2002.
[6] T. J. Sluckin, D. Dunmer, and H. Stegemeyer, Crystals That Flow. Taylor &
Francis, 2004.
[7] O. Lehmann, “On flowing crystals,” Z. Physika. Chem., vol. 4, pp. 462–72,
1889.
[8] B. Bahadur, eds. Liquid Crystals-Applications and Uses. Singapore: 1-3 World
Scientific, 1990.
[9] D. Demus, J. Goodby, G. Gray, H. Spiess, and V. V. eds., Hand Book of Liquid
Crystals. Canada: 1 Wiley-VCH,Weinheim, 1998.
[10] G. Friedel, “The mesomorphic state of matter,” Ann. de Physque, vol. 18,
pp. 273–474, 1922.
27
28
[11] C. Bahr International of modern Physics:Condensed Matter Physics, Statis-
tical Mechanics, Applied Physics, vol. 8, p. 3051, 1994.
[12] W. de Jue, B. I. Ostrovskii, and A. Shakginov Rev. Mod. Phys., vol. 75, p. 181,
2003.
[13] S. Singh Physics Reports, vol. 324, pp. 107–269, 2000.
[14] A. Roshi Ph. D. Dissertation, WPI, 2005.
[15] W. L. McMillan Phys. Rev. A, vol. 4, p. 1238, 1971.
[16] B. Halperin, T. C. Lubensky, and S. K. Ma Phys. Rev. Lett., vol. 32, p. 292,
1974.
[17] M. A. Anisimov, P. E. Cladis, E. E. Gorodetskii, D. A. Huse, V. E. Podneks,
V. G. Taratuta, W. van Saarloos, and V. P. Voronov Phys. Rev. A, vol. 41,
p. 6749, 1990.
[18] B. R. Patton and B. S. Andereck Phys. Rev. Lett., vol. 69, p. 1556, 1992.
[19] B. S. Andereck and B. R. Patton, “Anisotropic renormalization of thermo-
dynamic quantities above the nematic to smectic-a phase transition,” Phys.
Rev. E, vol. 49, p. 1393, 1994.
[20] P. K. Mukherjee, H. Pleiner, and H. R. Brand, “Simple landau model of the
smectic-a-isotropic phase transition,” Eur. Phys. J. E, vol. 4, pp. 293–297,
2001.
[21] K. Denolf, G. Cordoyiannis, C. Glorienx, and J. Thoen, “Effect of non-
mesogenic impurities on the liquid crystalline phase transitions of octyl-
cyanobiphenyl,” Phys. Rev. E, vol. 76, p. 051702, 2007.
[22] K. Denolf, B. V. Roie, C. Glorienx, and J. Thoen, “Effect of nonmesogenic
impurities on the order of the nematic to smectic-a phase transition in liquid
crystals,” Phys. Rev. Lett., vol. 97, p. 107801, 2006.
[23] P. K. Mukherjee, “Effect of nonmesogenic solute on the nematic-smectic-a
phase transition,” J. Chem. Phys., vol. 116, pp. 9531–9536, 2002.
29
[24] S. DasGupta and S. K. Roy, “The bend elastic constant in a mixture of 4,
4’-n-octyl-cyanobiphenyl and biphenyl,” Phys. Lett. A, vol. 288, pp. 323–328,
6 2001.
[25] T. P. Rieker, “Organic lyotropic lamellar liquid crystal,” Liquid Crystals,
vol. 19, p. 497, 1995.
[26] S. DasGupta, P. Chattopadhyay, and S. K. Roy, “Effect of a rigid nonpolar
solute on splay, bend elastic constants and on rotational viscocity coefficient
of 4,4’-n-octyl-cyanobiphenyl,” Phys. Rev. E, vol. 63, p. 041703, 2001.
[27] K. A. Park, S. M. Lee, S. H. Lee, and Y. H. Lee, “Anchoring a liquid crystal
molecule on a single-walled carbon nanotube,” J. Phys. Chem. C, vol. 111,
pp. 1620–1624, 2007.
[28] M. D. Lynch and D. L. Patrick Nano Letters, vol. 2, no. 11, pp. 1197–1201,
2002.
[29] I. Dierking, G. Scalia, P. Morales, and D. LeClere Adv. Mater., vol. 16, p. 865,
2004.
[30] I. Dierking, G. Scalia, and P. Morales J. Appl. Phys., vol. 97, p. 044309, 2005.
[31] J. P. F. Lagerwall, G. Scalia, M. Haluska, U. Dettlaff-Weglikowska, F. Giessel-
mann, and S. Roth, “Simultanoeus alignment and dispersion of carbon nan-
otubes with lyotropic liquid crystals,” Phys. Stat. Sol. (b), vol. 243, pp. 3046–
3049, 2006.
[32] S. Kumar and H. K. Bisoyi, “Aligned carbon naotubes in the supramolecular
order of discotic liquid crystals,” Angew. Chem., vol. 119, pp. 1523–1525,
2007.
[33] V. Popa-Nita and S. Kralj, “Liquid crystal-carbon naotubes mixtures,” J.
Cmem. Phys., vol. 132, p. 024902, 2010.
[34] G. Scalia, “Alignment of carbon naotubes in thermotropic and lyotropic liquid
crystals,” ChemPhysChem, vol. 11, pp. 333–340, 2010.
30
[35] P. V. Kamat, K. G. Thomas, S. Barazzouk, G. Girishkumar, K. Vinodgopal,
and D. Meisel, “Self-assembled linear bundles of single wall carbon nanotubes
and their alignment and deposition as a film in a dc field,” J. Am. Chem.
Soc., vol. 126, pp. 10757–10762, 2004.
[36] H.-Y. Chen and W. Lee, “Electro-optical characterization of a twisted nematic
liquid-crystal cell doped with carbon nanotubes in a dc electric field,” Optical
Review, vol. 12, pp. 223–225, 2005.
[37] I.-S. Baik, S. Y. Jeon, S. H. Lee, K. A. Park, S. H. Jeong, K. H. An, and Y. H.
Lee Appl. Phys. Lett., vol. 87, p. 263110, 2005.
[38] H.-Y. Chen, W. Lee, and N. A. Clark, “Faster electro-optical response charac-
teristics of a carbon-nanotube-nematic suspension,” Applied Physics Letters,
vol. 90, p. 033510, 2007.
[39] M. Rahman and W. Lee, “Scientific duo of carbon nanotubes and nematic
liquid crystals,” J. Phys. D: Appl. Phys., vol. 42, p. 063001, 2009.
[40] H. Duran, B. Gazdecki, A. Yamashita, and T. Kyu, “Effect of carbon nan-
otubes on phase transition of nematic liquid crystals,” Liquid Crystals, vol. 30,
pp. 815–821, 2005.
[41] J. P. F. Lagerwall, R. Dabrowski, and G. Scalia, “Antiferroelectric liquid
crystals with induced intermediate polar phases and the effects of doping with
carbon nanotubes,” Journal of Non-Crystalline Solids, vol. 353, pp. 4411–
4417, 2007.
[42] H. J. Shah, A. K. Fontecchio, D. Mattia, and Y. Gogotsi, “Field controlled
nematic-to-isotropic phase transition in liquid crystal-carbon nanotube com-
posites,” J. Appl. Phys., vol. 103, p. 064314, 2008.
[43] Y. Reznikov, O. Tereshchenko, V. Reshetnyak, A. Glushchenko, and J. West,
“Ferroelectric nematic suspension,” Appl. Phys. Lett., vol. 82, p. 1917, 2003.
[44] F. Li, A. Buchnev, C. I. Cheon, A. Glushchenko, V. Reshetnyak, Y. Reznikov,
T. J. Sluckin, and J. West, “Orientational coupling amplification in ferroelec-
tric nematic colloids,” Phys. Rev. Lett., vol. 97, p. 147801, 2006.
31
[45] E. Ouskova, O. uchnev, V. Reshetnyak, Y. Reznikov, and H. Kresso Liq.
Cryst., vol. 30, p. 1235, 2003.
[46] F. Li, J. West, A. Glushchenko, C. I. Cheon, and Y. Reznikov, “Ferroelectric
nanoparticle/liquid-crystal colloids for display application,” J. SID, vol. 14/6,
p. 523, 2006.
Chapter 2Experimental Techniques
2.1 Review of AC-Calorimetry
2.1.1 Introduction
There are many successful methods to study different phase transitions of liquid
crystals; some of them include calorimetry, x-ray diffraction, neutron scattering,
light scattering, NMR, optical microscopy, etc. Among the different calorimetric
techniques to study liquid crystals, traditional adiabatic calorimetry has high pre-
cision and can be used to determine the latent heat of strong first-order transitions.
However, this method does not have enough resolution possibilities to character-
ize a second-order transition and requires a large sample of several grams to get
reliable data [1]. Differential Scanning Calorimetry (DSC) has high sensitivity,
making it a widely used method because of its ease of operation and small sample
size (10 mg). Due to rapid scan rates of 1-5 K/min, the precision and absolute
accuracy in enthalpy changes are modest, and the temperature resolution is poor
[2]. Since its introduction into the literature during the late 1960s [3], the AC-
calorimetry has developed into a very powerful, well-established and widely used
technique for studying a variety of phase transitions in liquid crystals, polymers
and biological systems.
AC-calorimetry, originally introduced by Sullivan and Seidel [3], and Handler
et al. [4], is a semi-classical, well-established, widely used, and very reliable tech-
nique. AC technique is a versatile technique which is demonstrated by many
32
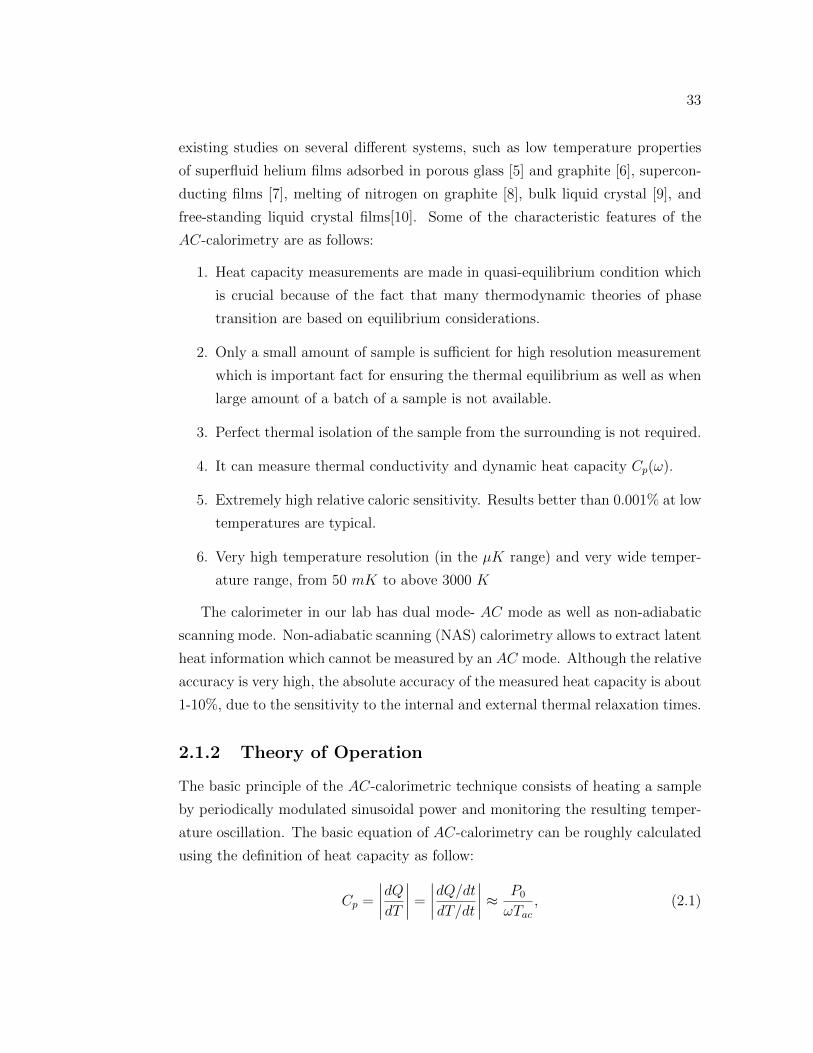
33
existing studies on several different systems, such as low temperature properties
of superfluid helium films adsorbed in porous glass [5] and graphite [6], supercon-
ducting films [7], melting of nitrogen on graphite [8], bulk liquid crystal [9], and
free-standing liquid crystal films[10]. Some of the characteristic features of the
AC-calorimetry are as follows:
1. Heat capacity measurements are made in quasi-equilibrium condition which
is crucial because of the fact that many thermodynamic theories of phase
transition are based on equilibrium considerations.
2. Only a small amount of sample is sufficient for high resolution measurement
which is important fact for ensuring the thermal equilibrium as well as when
large amount of a batch of a sample is not available.
3. Perfect thermal isolation of the sample from the surrounding is not required.
4. It can measure thermal conductivity and dynamic heat capacity Cp(ω).
5. Extremely high relative caloric sensitivity. Results better than 0.001% at low
temperatures are typical.
6. Very high temperature resolution (in the µK range) and very wide temper-
ature range, from 50 mK to above 3000 K
The calorimeter in our lab has dual mode- AC mode as well as non-adiabatic
scanning mode. Non-adiabatic scanning (NAS) calorimetry allows to extract latent
heat information which cannot be measured by an AC mode. Although the relative
accuracy is very high, the absolute accuracy of the measured heat capacity is about
1-10%, due to the sensitivity to the internal and external thermal relaxation times.
2.1.2 Theory of Operation
The basic principle of the AC-calorimetric technique consists of heating a sample
by periodically modulated sinusoidal power and monitoring the resulting temper-
ature oscillation. The basic equation of AC-calorimetry can be roughly calculated
using the definition of heat capacity as follow:
Cp =
∣∣∣∣dQ
dT
∣∣∣∣ =
∣∣∣∣dQ/dt
dT/dt
∣∣∣∣ ≈ P0
ωTac
, (2.1)
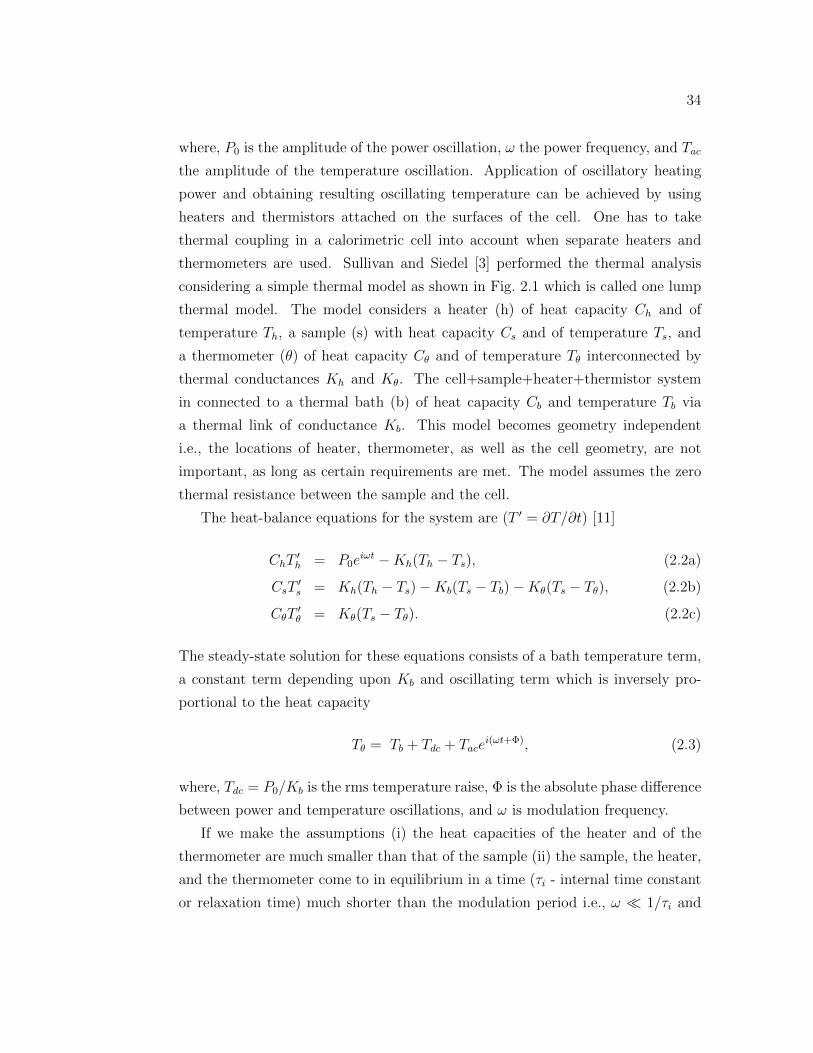
34
where, P0 is the amplitude of the power oscillation, ω the power frequency, and Tac
the amplitude of the temperature oscillation. Application of oscillatory heating
power and obtaining resulting oscillating temperature can be achieved by using
heaters and thermistors attached on the surfaces of the cell. One has to take
thermal coupling in a calorimetric cell into account when separate heaters and
thermometers are used. Sullivan and Siedel [3] performed the thermal analysis
considering a simple thermal model as shown in Fig. 2.1 which is called one lump
thermal model. The model considers a heater (h) of heat capacity Ch and of
temperature Th, a sample (s) with heat capacity Cs and of temperature Ts, and
a thermometer (θ) of heat capacity Cθ and of temperature Tθ interconnected by
thermal conductances Kh and Kθ. The cell+sample+heater+thermistor system
in connected to a thermal bath (b) of heat capacity Cb and temperature Tb via
a thermal link of conductance Kb. This model becomes geometry independent
i.e., the locations of heater, thermometer, as well as the cell geometry, are not
important, as long as certain requirements are met. The model assumes the zero
thermal resistance between the sample and the cell.
The heat-balance equations for the system are (T ′ = ∂T/∂t) [11]
ChT′h = P0e
iωt −Kh(Th − Ts), (2.2a)
CsT′s = Kh(Th − Ts) −Kb(Ts − Tb) −Kθ(Ts − Tθ), (2.2b)
CθT′θ = Kθ(Ts − Tθ). (2.2c)
The steady-state solution for these equations consists of a bath temperature term,
a constant term depending upon Kb and oscillating term which is inversely pro-
portional to the heat capacity
Tθ = Tb + Tdc + Tacei(ωt+Φ), (2.3)
where, Tdc = P0/Kb is the rms temperature raise, Φ is the absolute phase difference
between power and temperature oscillations, and ω is modulation frequency.
If we make the assumptions (i) the heat capacities of the heater and of the
thermometer are much smaller than that of the sample (ii) the sample, the heater,
and the thermometer come to in equilibrium in a time (τi - internal time constant
or relaxation time) much shorter than the modulation period i.e., ω ≪ 1/τi and
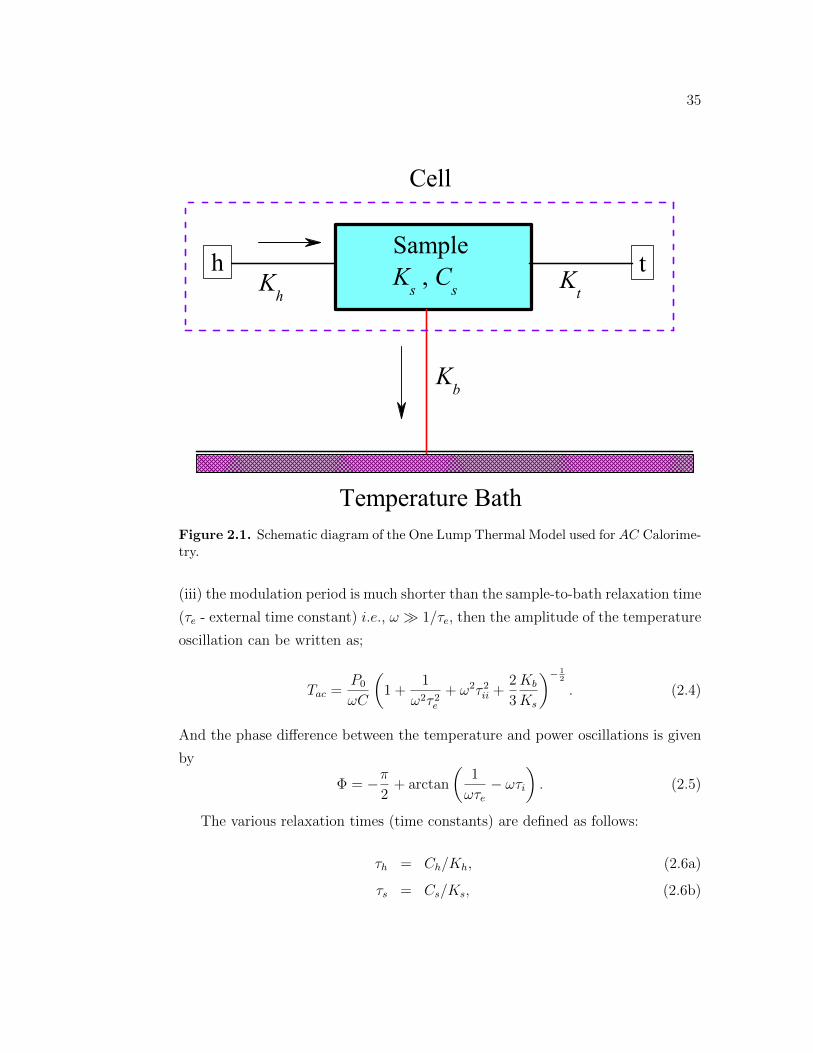
35
Kh
Temperature Bath
h K
t
t
Kb
Cell
SampleK
s , C
s
Figure 2.1. Schematic diagram of the One Lump Thermal Model used for AC Calorime-try.
(iii) the modulation period is much shorter than the sample-to-bath relaxation time
(τe - external time constant) i.e., ω ≫ 1/τe, then the amplitude of the temperature
oscillation can be written as;
Tac =P0
ωC
(1 +
1
ω2τ 2e
+ ω2τ 2ii +
2
3
Kb
Ks
)− 12
. (2.4)
And the phase difference between the temperature and power oscillations is given
by
Φ = −π2
+ arctan
(1
ωτe− ωτi
). (2.5)
The various relaxation times (time constants) are defined as follows:
τh = Ch/Kh, (2.6a)
τs = Cs/Ks, (2.6b)
36
τθ = Cθ/Kθ, (2.6c)
τe = C/Kb, (2.6d)
τi = τh + τs + τθ, (2.6e)
τ 2ii = τ 2
h + τ 2s + τ 2
θ , (2.6f)
for the sample (s), heater (h), and thermometer (θ), indicating the characteristic
thermal relaxation time for each element with the total heat capacity of the system
C = Ch + Cs + Cθ. Under the conditions where the above assumptions mainly,
1
τe<< ω <<
1
τi, (2.7)
are well satisfied, the expression calculating heat capacity takes the form
C =P0
ωTac
= C∗. (2.8)
We usually use the relative phase shift φ, which doesn’t carry the constant
−π/2 phase difference, between the temperature and the power as:
φ = Φ + π/2. (2.9)
Therefore,
tan(φ) =1
ωτe− ωτi =
Ke
ωC− ω
(Cs
Ks
− Ch + Cθ
Kh +Kθ
). (2.10)
The phase shift is related to both the heat capacity and the thermal conductance
of the system.
The heat capacity is frequency dependent and can be considered as a complex
quantity which can be expressed as combination of real, C ′(ω), and imaginary,
C ′′(ω), parts:
C′(ω) = C
′(ω) − iC
′′(ω), (2.11)
analogous to the complex permittivity real heat capacity representing in-phase
(capacitive) part and imaginary part representing loss (dispersive) part of heat
capacity. Solving Eqs. (2.4) and (2.10) for C ′ and C ′′, yields:
C′(ω) =
P0
ωTac
cosφ ∗ f(ω), (2.12a)
37
C′′(ω) =
P0
ωTac
sinφ ∗ g(ω) − Kb
ω, (2.12b)
where,
f(ω) =
[1 + cos2(φ)
(2Kb
3Ks
+2τiτe
− 2τsτcω2
)]−1/2
, g(ω) = f(ω)
[1 +
ωτitan(φ)
]≈ 1,
(2.13)
with τc the internal thermal relaxation time for the cell, τi and τe are given from
Eqs. (2.6e) and (2.6d). In the limit of zero internal thermal resistance, or τi ≪ τe,
both f(ω) and g(ω) approach one for all ω. These corrections were applied to all
samples studied here. The value of the external thermal resistance Re(= 1/Kb) is
typically the same for all samples, Re ∼ 200 K W−1.
The specific heat capacity, Cp, can then be found as
Cp =C ′(ω) − Cempty
ms
=C∗cos(φ)f(ω) − Cempty
ms
, (2.14)
C ′′(ω) = C∗sin(φ)g(w) − 1
ωRe
, (2.15)
where, Cempty is the heat capacity of the empty cell, C∗ = P0/(ωTAC), ms is the
mass in grams of the liquid crystal.
Eqs. (2.14) and (2.15) are the basic equations used in the calculation of the real
and imaginary heat capacities for our calorimeter. Experimentally, the amplitude
of the temperature oscillations Tac, and the relative phase shift φ, are measured.
At the beginning of each experiment, for a set frequency ω, the amplitude of the
power dissipated in the resistive heater, P0, as well as its phase shift, are measured.
The excess specific heat associated with a phase transition can be determined
by subtracting an appropriate background CBGp from total specific heat over a wide
temperature range. The excess specific heat is given by
∆Cp = Cp − CBGp . (2.16)
For the N -SmA phase transition,
δCp = Cp(N − SmA) − CBLp , (2.17)
38
where, CBLp is the baseline or wing below N -SmA Cp phase transition peak.
The enthalpy change associated with a phase transition is defined as
δH =
∫∆CpdT. (2.18)
For a second-order or continuous phase transition, the integration covers the en-
tire δCp peak over as a wide temperature range as possible and gives the total
enthalpy change δH associated with the transition. But, for a first-order transi-
tion the situation is complicated due to the presence of a coexistence region and
a latent heat ∆H. Due to partial phase conversion during a Tac cycle, typical
δCp values obtained in the two-phase coexistence region are artificially high and
frequency dependent, due to the dynamics of the phase conversion. The pretransi-
tional enthalpy δH is typically obtained by integrating the linearly truncated δCp
peak between high-temperature and low-temperature limits [12]. A simple inte-
gration of the observed ∆Cp peak yields an effective enthalpy change δH∗, which
includes some of the latent heat contribution. Here, δH < δH∗ < δH + ∆H.
The total enthalpy change for a weakly first-order phase transition is the sum of
the integrated pretransitional enthalpy and the latent heat, ∆Htotal = δH + ∆H,
where ∆Htotal can be obtained from non-adiabatic scanning calorimetry[12]. The
integration of the imaginary part of heat capacity given by Eq. (2.15) yields the
imaginary transition enthalpy δH′′
and is a measure of dispersive component of
the complex enthalpy. The quantity δH′′
can be used as an accurate indicator
of first-order behavior. Since the fixed heating frequency ω is used in this work,
the δH′′
is only approximately proportional to the latent heat. Since the two-
phase conversion rate may be different for different samples, the proportionality
between the δH′′
and the latent heat changes as the sample changes and requires
a detailed frequency scan for each sample to establish the accurate relation. In an
AC-calorimetric technique the uncertainty in determining the enthalpy is typically
10% mainly due to the uncertainty in the baseline and background subtraction.
The phase shift contains information about the heat capacity and the internal
time constant, which is directly related to the sample’s thermal conductivity. Em-
pirically, it has been observed that for a weak first order transition there is always
a peak in the phase, while, for strong first order transitions, the phase might show
a 1 point anomaly or a simple discontinuity. This is because the transition hap-
39
pens very fast and pre-transitional fluctuations are very small compared with the
latent heat of the transition. For the case of the weak first order transitions, the
width of the phase peak has been associated with the two-phase coexistence region
where the release or absorption of the latent heat occurs. In this case, another
heat source or heat sink appears which has an energy spectrum. This spectrum is
generally, completely different from the one applied at the heater (delta function),
which is being detected. This shows up as a peak in the imaginary heat capacity,
the width of which is equal to the two-phase coexistence. In most of the other
cases, i.e., outside the two-phase coexistence region, and for most of the second
order phase transitions, the heat capacity is purely real and independent of ω, so
C′′(ω) ≡ 0. This fact may be used to extract the external resistance Re directly
from the AC-technique.
The inequalities in Eq. (2.7) are the most important approximations needed
to solve Eqs. (2.2). Experimentally, the approximations (2.7) should be verified
for every sample and can be done by performing frequency scans. A frequency
scan determines the frequency range where the heat capacity data are frequency
independent. A frequency scan is done by changing the frequency maintaining the
same voltage amplitude of applied power oscillation to the heater, keeping the bath
temperature constant, and measuring the sample temperature oscillation for each
frequency. A log-log plot of ωTac vs. ω gives a frequency independent ‘plateau’
in some range of frequencies which provides the range of working frequency of
the calorimeter. In this range the heat capacity is frequency independent and has
smallest value and neither of the thermal relaxation times, internal and external,
plays a major role and can be neglected. A typical frequency scan profile is shown
in Fig. 2.2. The internal and external time constants are extracted by fitting the
graph 2.2 with the equation;
ωTac =A√
1 + (ωτe)−2 + (ωτi)2 +R, (2.19)
where, the fit parameter, R, is typically fixed to zero, because it is generally very
small and the nonlinear least squares fit is insensitive to this parameter.
Experimentally, it is feasible to fulfil the requirements of Eq. (2.7) controlling
external and internal time constants. The external time constant can be controlled
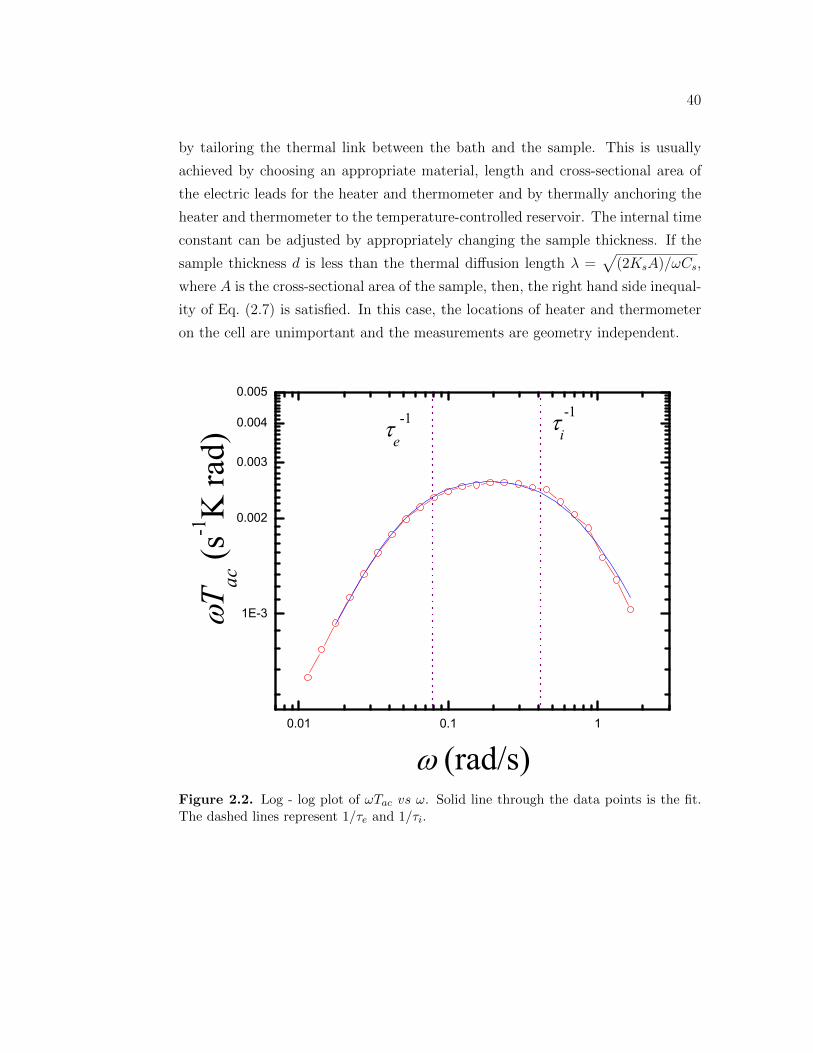
40
by tailoring the thermal link between the bath and the sample. This is usually
achieved by choosing an appropriate material, length and cross-sectional area of
the electric leads for the heater and thermometer and by thermally anchoring the
heater and thermometer to the temperature-controlled reservoir. The internal time
constant can be adjusted by appropriately changing the sample thickness. If the
sample thickness d is less than the thermal diffusion length λ =√
(2KsA)/ωCs,
where A is the cross-sectional area of the sample, then, the right hand side inequal-
ity of Eq. (2.7) is satisfied. In this case, the locations of heater and thermometer
on the cell are unimportant and the measurements are geometry independent.
0.01 0.1 1
1E-3
0.002
0.003
0.004
0.005
i-1
T ac (s
-1K
rad)
(rad/s)
e-1
Figure 2.2. Log - log plot of ωTac vs ω. Solid line through the data points is the fit.The dashed lines represent 1/τe and 1/τi.
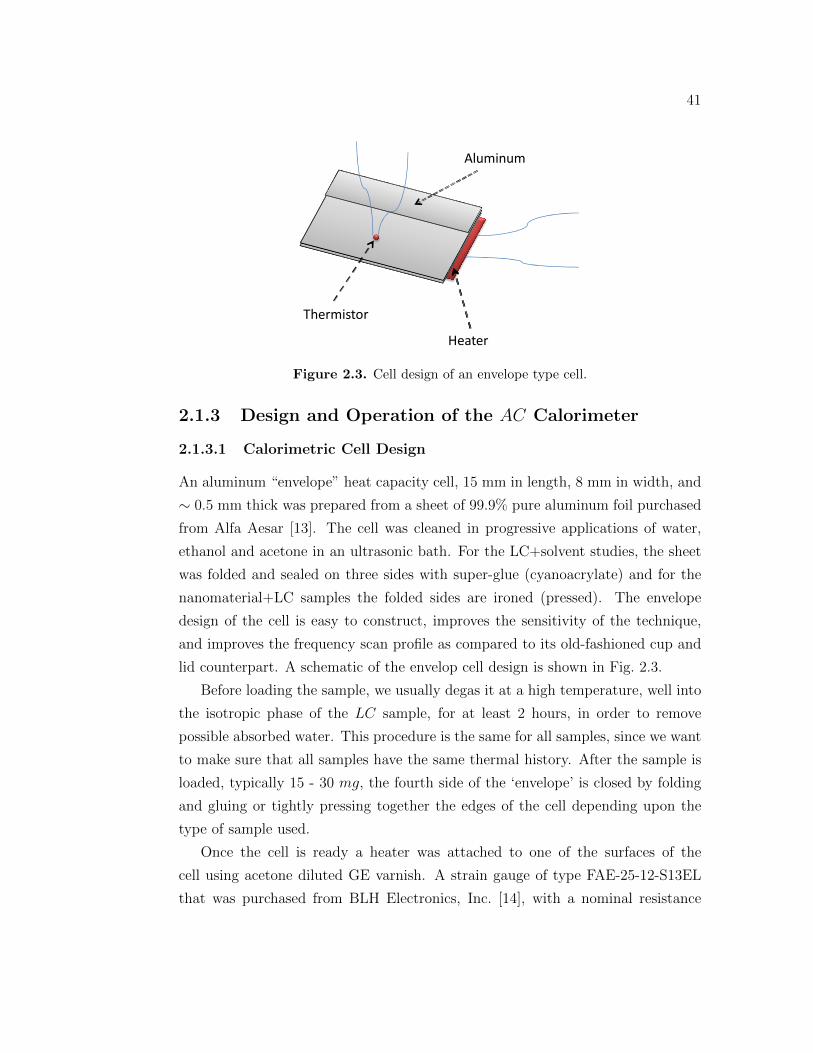
41
Heater
Thermistor
Aluminum
Figure 2.3. Cell design of an envelope type cell.
2.1.3 Design and Operation of the AC Calorimeter
2.1.3.1 Calorimetric Cell Design
An aluminum “envelope” heat capacity cell, 15 mm in length, 8 mm in width, and
∼ 0.5 mm thick was prepared from a sheet of 99.9% pure aluminum foil purchased
from Alfa Aesar [13]. The cell was cleaned in progressive applications of water,
ethanol and acetone in an ultrasonic bath. For the LC+solvent studies, the sheet
was folded and sealed on three sides with super-glue (cyanoacrylate) and for the
nanomaterial+LC samples the folded sides are ironed (pressed). The envelope
design of the cell is easy to construct, improves the sensitivity of the technique,
and improves the frequency scan profile as compared to its old-fashioned cup and
lid counterpart. A schematic of the envelop cell design is shown in Fig. 2.3.
Before loading the sample, we usually degas it at a high temperature, well into
the isotropic phase of the LC sample, for at least 2 hours, in order to remove
possible absorbed water. This procedure is the same for all samples, since we want
to make sure that all samples have the same thermal history. After the sample is
loaded, typically 15 - 30 mg, the fourth side of the ‘envelope’ is closed by folding
and gluing or tightly pressing together the edges of the cell depending upon the
type of sample used.
Once the cell is ready a heater was attached to one of the surfaces of the
cell using acetone diluted GE varnish. A strain gauge of type FAE-25-12-S13EL
that was purchased from BLH Electronics, Inc. [14], with a nominal resistance
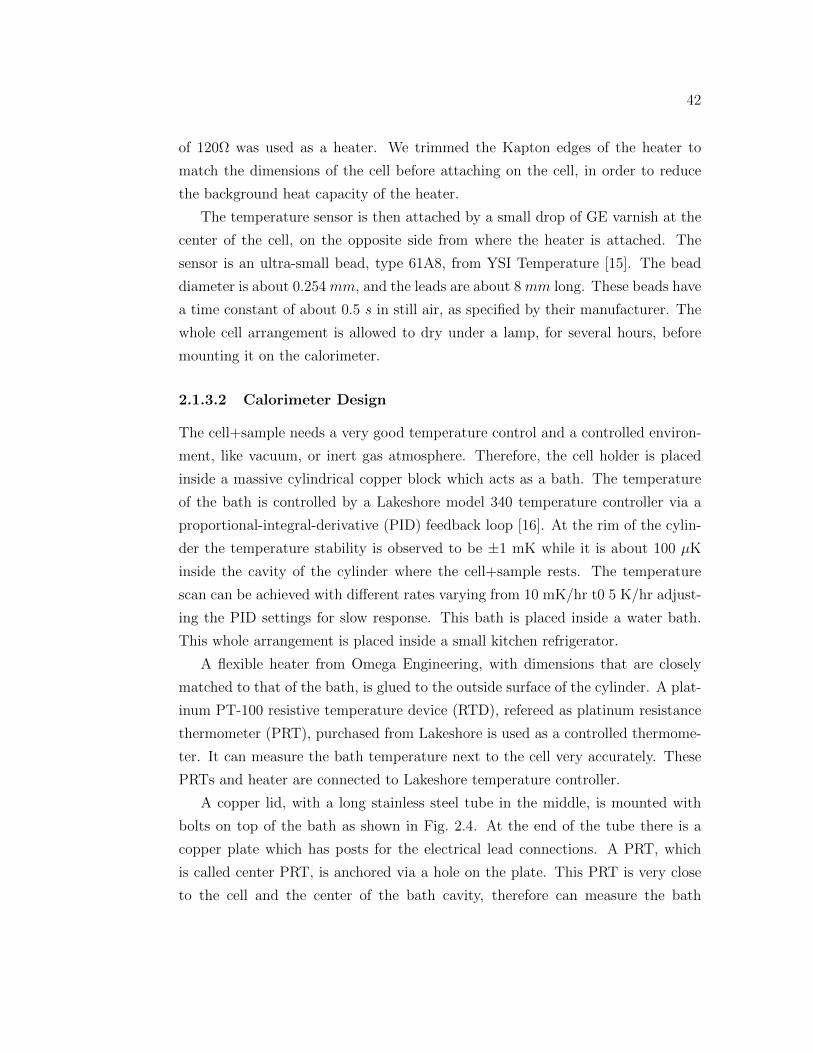
42
of 120Ω was used as a heater. We trimmed the Kapton edges of the heater to
match the dimensions of the cell before attaching on the cell, in order to reduce
the background heat capacity of the heater.
The temperature sensor is then attached by a small drop of GE varnish at the
center of the cell, on the opposite side from where the heater is attached. The
sensor is an ultra-small bead, type 61A8, from YSI Temperature [15]. The bead
diameter is about 0.254 mm, and the leads are about 8 mm long. These beads have
a time constant of about 0.5 s in still air, as specified by their manufacturer. The
whole cell arrangement is allowed to dry under a lamp, for several hours, before
mounting it on the calorimeter.
2.1.3.2 Calorimeter Design
The cell+sample needs a very good temperature control and a controlled environ-
ment, like vacuum, or inert gas atmosphere. Therefore, the cell holder is placed
inside a massive cylindrical copper block which acts as a bath. The temperature
of the bath is controlled by a Lakeshore model 340 temperature controller via a
proportional-integral-derivative (PID) feedback loop [16]. At the rim of the cylin-
der the temperature stability is observed to be ±1 mK while it is about 100 µK
inside the cavity of the cylinder where the cell+sample rests. The temperature
scan can be achieved with different rates varying from 10 mK/hr t0 5 K/hr adjust-
ing the PID settings for slow response. This bath is placed inside a water bath.
This whole arrangement is placed inside a small kitchen refrigerator.
A flexible heater from Omega Engineering, with dimensions that are closely
matched to that of the bath, is glued to the outside surface of the cylinder. A plat-
inum PT-100 resistive temperature device (RTD), refereed as platinum resistance
thermometer (PRT), purchased from Lakeshore is used as a controlled thermome-
ter. It can measure the bath temperature next to the cell very accurately. These
PRTs and heater are connected to Lakeshore temperature controller.
A copper lid, with a long stainless steel tube in the middle, is mounted with
bolts on top of the bath as shown in Fig. 2.4. At the end of the tube there is a
copper plate which has posts for the electrical lead connections. A PRT, which
is called center PRT, is anchored via a hole on the plate. This PRT is very close
to the cell and the center of the bath cavity, therefore can measure the bath
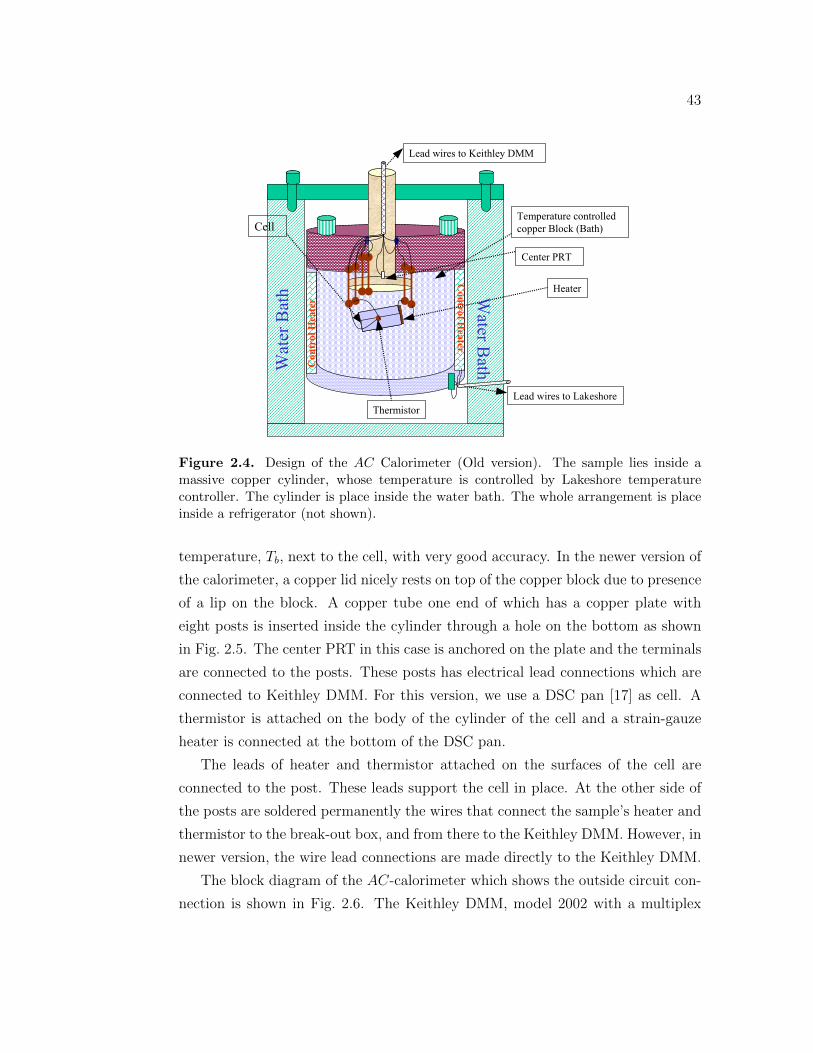
43
Lead wires to Keithley DMM
Control Heater
Control Heater
Center PRT
Heater
Lead wires to Lakeshore
Temperature controlled
copper Block (Bath)Cell
Water Bath W
ater Bath
Thermistor
Figure 2.4. Design of the AC Calorimeter (Old version). The sample lies inside amassive copper cylinder, whose temperature is controlled by Lakeshore temperaturecontroller. The cylinder is place inside the water bath. The whole arrangement is placeinside a refrigerator (not shown).
temperature, Tb, next to the cell, with very good accuracy. In the newer version of
the calorimeter, a copper lid nicely rests on top of the copper block due to presence
of a lip on the block. A copper tube one end of which has a copper plate with
eight posts is inserted inside the cylinder through a hole on the bottom as shown
in Fig. 2.5. The center PRT in this case is anchored on the plate and the terminals
are connected to the posts. These posts has electrical lead connections which are
connected to Keithley DMM. For this version, we use a DSC pan [17] as cell. A
thermistor is attached on the body of the cylinder of the cell and a strain-gauze
heater is connected at the bottom of the DSC pan.
The leads of heater and thermistor attached on the surfaces of the cell are
connected to the post. These leads support the cell in place. At the other side of
the posts are soldered permanently the wires that connect the sample’s heater and
thermistor to the break-out box, and from there to the Keithley DMM. However, in
newer version, the wire lead connections are made directly to the Keithley DMM.
The block diagram of the AC-calorimeter which shows the outside circuit con-
nection is shown in Fig. 2.6. The Keithley DMM, model 2002 with a multiplex
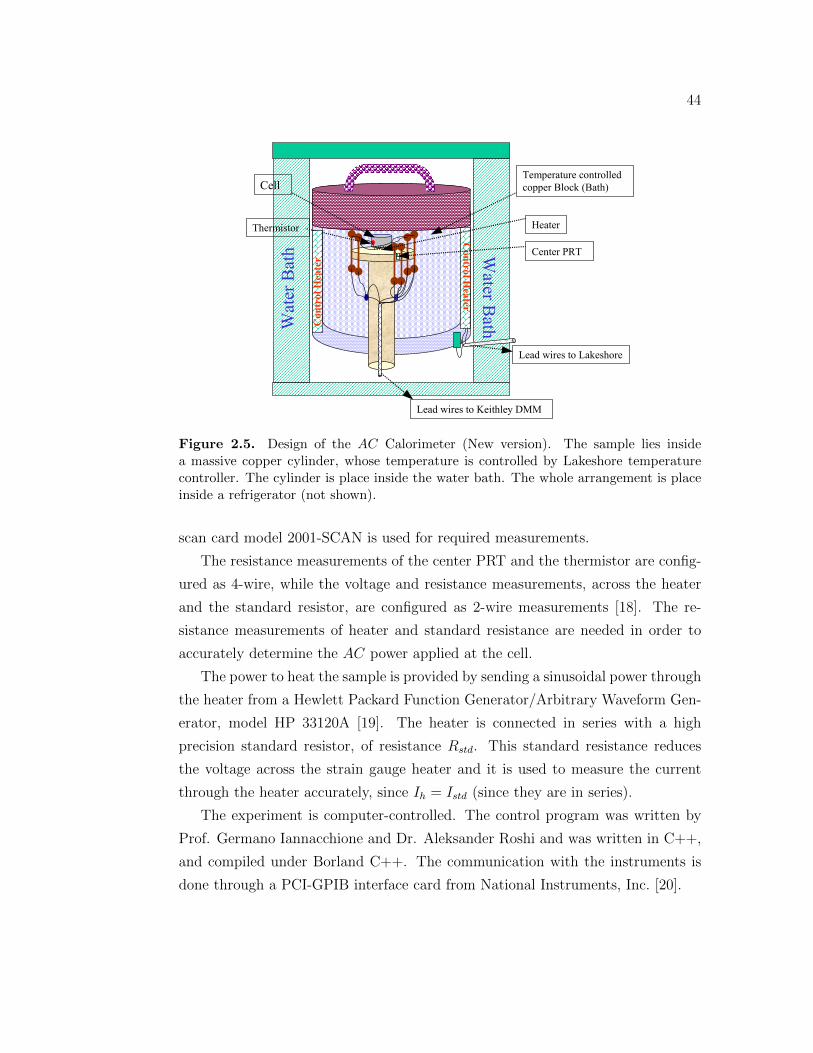
44
Lead wires to Keithley DMM
Control Heater
Control Heater
Center PRT
HeaterThermistor
Lead wires to Lakeshore
Temperature controlled
copper Block (Bath)Cell
Water Bath W
ater Bath
Figure 2.5. Design of the AC Calorimeter (New version). The sample lies insidea massive copper cylinder, whose temperature is controlled by Lakeshore temperaturecontroller. The cylinder is place inside the water bath. The whole arrangement is placeinside a refrigerator (not shown).
scan card model 2001-SCAN is used for required measurements.
The resistance measurements of the center PRT and the thermistor are config-
ured as 4-wire, while the voltage and resistance measurements, across the heater
and the standard resistor, are configured as 2-wire measurements [18]. The re-
sistance measurements of heater and standard resistance are needed in order to
accurately determine the AC power applied at the cell.
The power to heat the sample is provided by sending a sinusoidal power through
the heater from a Hewlett Packard Function Generator/Arbitrary Waveform Gen-
erator, model HP 33120A [19]. The heater is connected in series with a high
precision standard resistor, of resistance Rstd. This standard resistance reduces
the voltage across the strain gauge heater and it is used to measure the current
through the heater accurately, since Ih = Istd (since they are in series).
The experiment is computer-controlled. The control program was written by
Prof. Germano Iannacchione and Dr. Aleksander Roshi and was written in C++,
and compiled under Borland C++. The communication with the instruments is
done through a PCI-GPIB interface card from National Instruments, Inc. [20].
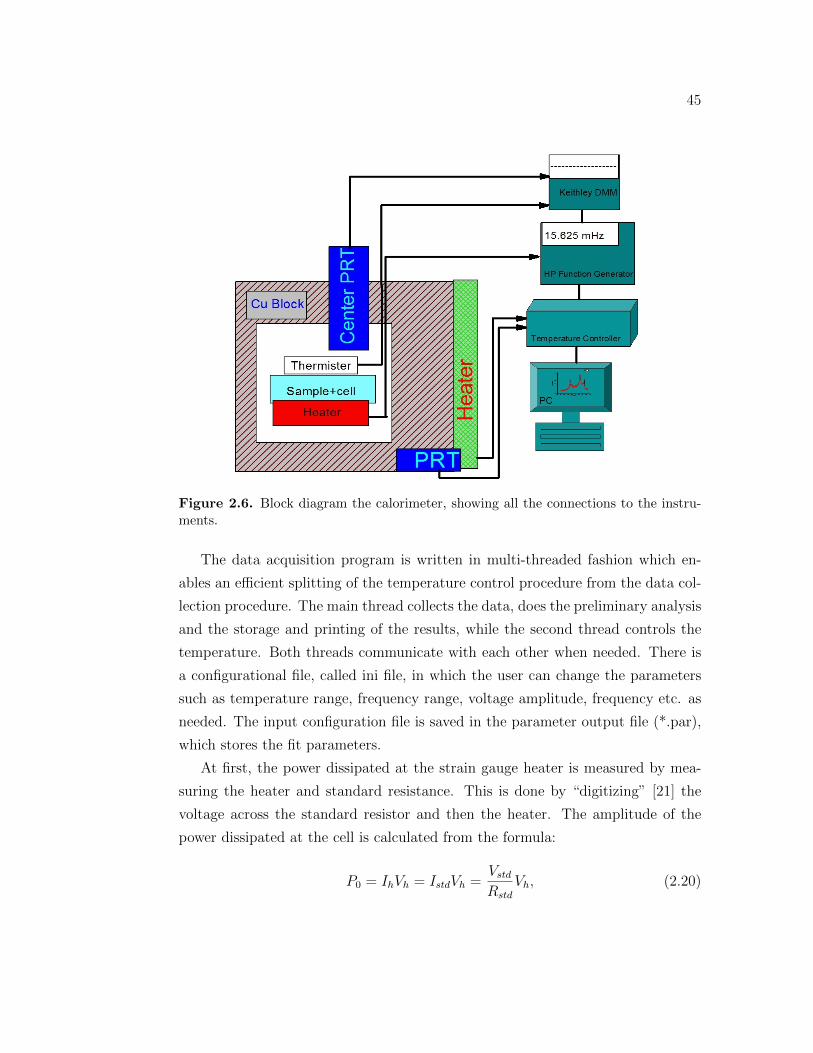
45
Figure 2.6. Block diagram the calorimeter, showing all the connections to the instru-ments.
The data acquisition program is written in multi-threaded fashion which en-
ables an efficient splitting of the temperature control procedure from the data col-
lection procedure. The main thread collects the data, does the preliminary analysis
and the storage and printing of the results, while the second thread controls the
temperature. Both threads communicate with each other when needed. There is
a configurational file, called ini file, in which the user can change the parameters
such as temperature range, frequency range, voltage amplitude, frequency etc. as
needed. The input configuration file is saved in the parameter output file (*.par),
which stores the fit parameters.
At first, the power dissipated at the strain gauge heater is measured by mea-
suring the heater and standard resistance. This is done by “digitizing” [21] the
voltage across the standard resistor and then the heater. The amplitude of the
power dissipated at the cell is calculated from the formula:
P0 = IhVh = IstdVh =Vstd
Rstd
Vh, (2.20)
46
where, Vstd, Vh are the voltage amplitudes at the heating frequency and Rstd is
the resistance of the standard resistor. From the waveform the phase of the power
oscillations φ is also extracted.
Once the power measurement is over, the temperature controlling thread (TCT)
is started. The data collection, starts after the TCT has signaled the main thread
to start digitizing.
2.1.4 Thermometry
The accurate measurement of temperature is one of the most important part of
AC-calorimetry. Two types of resistive temperature sensors were used in this work,
platinum resistance thermometer (PRT), and carbon-flake thermistors. The PRTs
are used to monitor the bath temperature and the carbon-flake thermistor is used to
monitor the cell+sample temperature. These devices work on the principle that the
resistance changes as a function of temperature. Change in resistance as a function
of temperature are measured first and then these resistance values are converted
into temperature using specific calibration functions. PRTs have an almost linear
function with a positive temperature coefficient (∂R/∂T ≃ const > 0). They
are generally very stable and very reproducible even for different thermometers;
therefore they are good for calibration and control. The temperature dependence
of resistance for PRT can be expressed as
R = R0
(1 + αT + βT 2
), (2.21)
where, R0, is the resistance at 0C, and α, β are calibration constants. Rearranging
Eq. (2.21), we get;
T =1
2β
[−α+
√α2 − 4β(1 −R/R0)
]. (2.22)
The bath temperature can be calculated as;
Tprt =T prt
b + T prta
2, (2.23)
where, T prtb and T prt
a are found by converting the resistances before and after
47
digitizing respectively.
Carbon flake thermistors are very small and very sensitive. They have highly
nonlinear temperature-resistance relation with a negative temperature coefficient
(∂R/∂T < 0).
For the thermistor, the relation between temperature and resistance can be
expressed as;1
T= a0 + a1 log
(R
R0
)+ a2
[log
(R
R0
)]2
, (2.24)
where, a0, a1, a2 are constants, and R0 is the resistance at some temperature. We
consider R0 = 10000 Ω for all calculations. Since the coefficients will drift slightly
with time, recalibration of the thermistor against the PRT at the end of each run
is required.
Experimentally, the digitized resistance waveforms are fitted with the function;
X = a+ bt+ ct2 + Aωsin(ωt) + A′ωcos(ωt) + A2ωsin(ωt) + A
′2ωsin(ωt), (2.25)
where, the term a+bt+ct2 represents the background term and the others represent
oscillating term with the voltage frequency ω and power frequency 2ω. From the
fit, the amplitude ∆R and phase ϕ for each frequency are found:
∆Rω =√A2
ω + (A′ω)2, φω = tan−1
(Aω
A′ω
); (2.26a)
∆R2ω =√A2
2ω + (A′2ω)2, φ2ω = tan−1
(A2ω
A′2ω
); (2.26b)
Therefore, the amplitude ∆R, the average thermistor resistance Rth, and the phase
φR, of the resistance oscillation, are found from the fit of the digitized waveform.
From Eq. (2.24), the temperature of the thermistor Tth, can be easily calculated.
From the amplitude ∆R, since the amplitude of the oscillations is very small, we
can find TaC , (the corresponding amplitude of temperature oscillations), by using
the relation:
Tac ≈∣∣∣∣dT
dR
∣∣∣∣ ∆R, (2.27)
Tac is needed in the calculation of C∗ (see Eq. (2.8)). From Eqs. (2.24) and (2.27),
48
Tac is then calculated by:
Tac = T 2th
∆R
Rth
[a1 + 2a2 log
(Rth
R0
)]. (2.28)
2.2 Polarizing Microscopy
The polarizing microscopy was originally developed for investigating structures of
rocks and minerals. But this technique has become a popular tool for different
field of science such as biology, medicine, polymer chemistry, physics etc.
The polarized light microscope is used to study the materials that are visible
under crossed polarizers due to their optical anisotropic property. These materials
have two different refractive indices for different direction of polarization which is
called the properties of birefringence. The microscope must be equipped with a
polarizer and an analyzer. The polarizer is positioned in the light pathway before
the sample to be studied and the analyzer is placed in the pathway between the
objective of the microscope and the sample. Liquid crystal textures were observed
under the crossed-polarizers condition where the optical axes of the polarizer and
analyzer are perpendicular to each other. In the absence of the sample, dark field of
view is observed because of the action of crossed polarizer analyzer arrangement.
When a sample like liquid crystal is inserted in between the crossed-polarizers,
textures or patterns are observed due to the interaction of light with the sample.
A simple experimental arrangement is shown in Fig. 2.7 [22]. Since liquid crystals
exhibit optical anisotropy (birefringence), polarizing microscopes are popular to
study liquid crystals. Peculiar optical patterns within a liquid crystal sample can
be observed by using a polarizing microscope. The phases and defects can be
investigated by observing these optical patterns.
Textures for different liquid crystals, LC+solvent, and LC+nanomaterial com-
posites were observed as a function of temperature. The temperature control was
achieved using a microscopic hot stage.
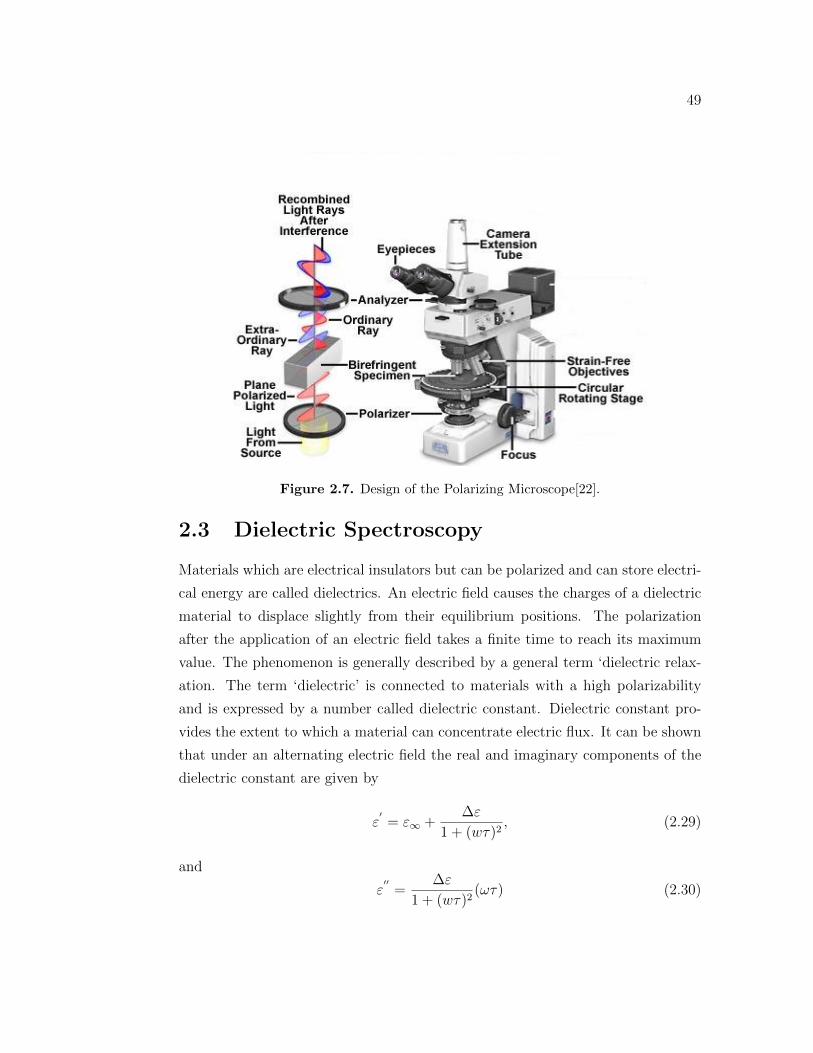
49
Figure 2.7. Design of the Polarizing Microscope[22].
2.3 Dielectric Spectroscopy
Materials which are electrical insulators but can be polarized and can store electri-
cal energy are called dielectrics. An electric field causes the charges of a dielectric
material to displace slightly from their equilibrium positions. The polarization
after the application of an electric field takes a finite time to reach its maximum
value. The phenomenon is generally described by a general term ‘dielectric relax-
ation. The term ‘dielectric’ is connected to materials with a high polarizability
and is expressed by a number called dielectric constant. Dielectric constant pro-
vides the extent to which a material can concentrate electric flux. It can be shown
that under an alternating electric field the real and imaginary components of the
dielectric constant are given by
ε′= ε∞ +
∆ε
1 + (wτ)2, (2.29)
and
ε′′
=∆ε
1 + (wτ)2(ωτ) (2.30)
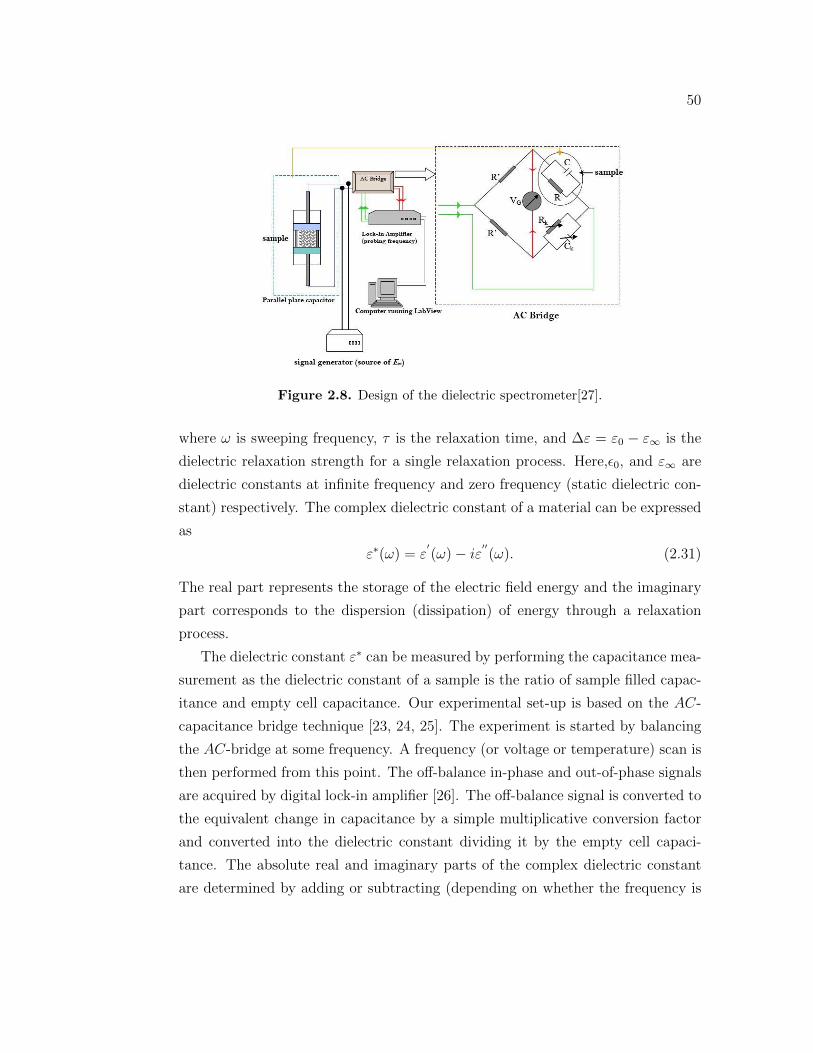
50
Figure 2.8. Design of the dielectric spectrometer[27].
where ω is sweeping frequency, τ is the relaxation time, and ∆ε = ε0 − ε∞ is the
dielectric relaxation strength for a single relaxation process. Here,ϵ0, and ε∞ are
dielectric constants at infinite frequency and zero frequency (static dielectric con-
stant) respectively. The complex dielectric constant of a material can be expressed
as
ε∗(ω) = ε′(ω) − iε
′′(ω). (2.31)
The real part represents the storage of the electric field energy and the imaginary
part corresponds to the dispersion (dissipation) of energy through a relaxation
process.
The dielectric constant ε∗ can be measured by performing the capacitance mea-
surement as the dielectric constant of a sample is the ratio of sample filled capac-
itance and empty cell capacitance. Our experimental set-up is based on the AC-
capacitance bridge technique [23, 24, 25]. The experiment is started by balancing
the AC-bridge at some frequency. A frequency (or voltage or temperature) scan is
then performed from this point. The off-balance in-phase and out-of-phase signals
are acquired by digital lock-in amplifier [26]. The off-balance signal is converted to
the equivalent change in capacitance by a simple multiplicative conversion factor
and converted into the dielectric constant dividing it by the empty cell capaci-
tance. The absolute real and imaginary parts of the complex dielectric constant
are determined by adding or subtracting (depending on whether the frequency is
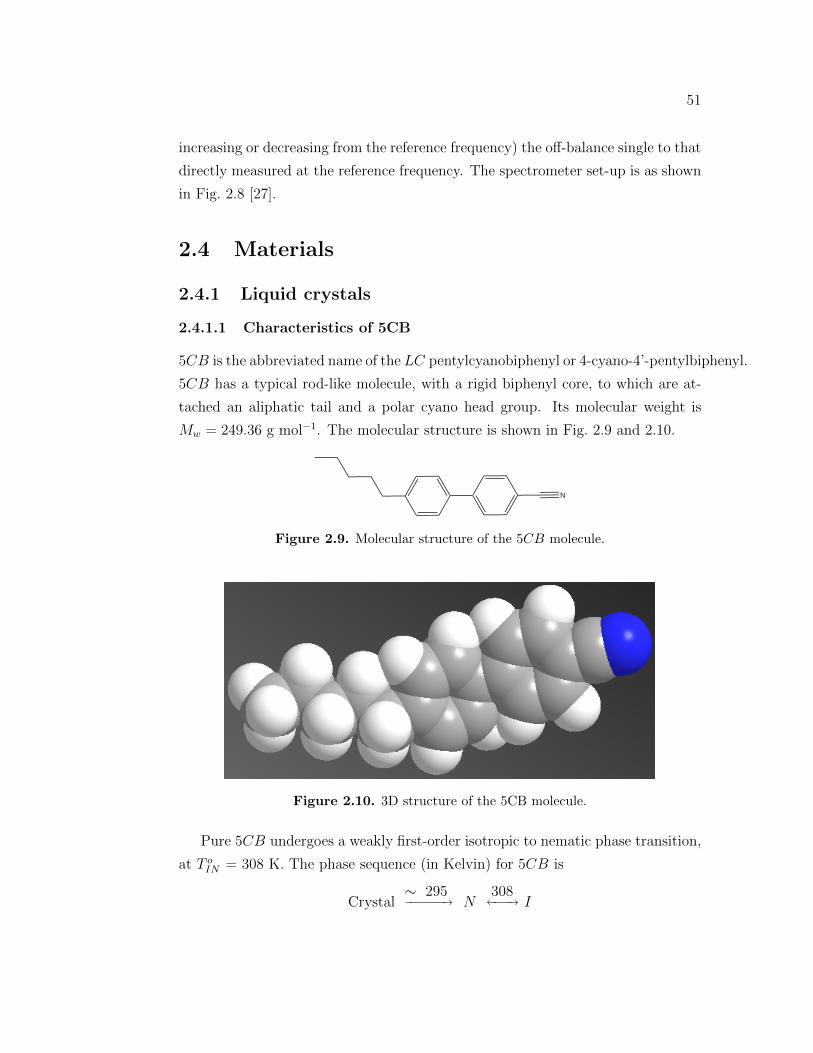
51
increasing or decreasing from the reference frequency) the off-balance single to that
directly measured at the reference frequency. The spectrometer set-up is as shown
in Fig. 2.8 [27].
2.4 Materials
2.4.1 Liquid crystals
2.4.1.1 Characteristics of 5CB
5CB is the abbreviated name of the LC pentylcyanobiphenyl or 4-cyano-4’-pentylbiphenyl.
5CB has a typical rod-like molecule, with a rigid biphenyl core, to which are at-
tached an aliphatic tail and a polar cyano head group. Its molecular weight is
Mw = 249.36 g mol−1. The molecular structure is shown in Fig. 2.9 and 2.10.
N
Figure 2.9. Molecular structure of the 5CB molecule.
Figure 2.10. 3D structure of the 5CB molecule.
Pure 5CB undergoes a weakly first-order isotropic to nematic phase transition,
at T oIN = 308 K. The phase sequence (in Kelvin) for 5CB is
Crystal∼ 295−−−−−−−→ N
308←−−−→ I
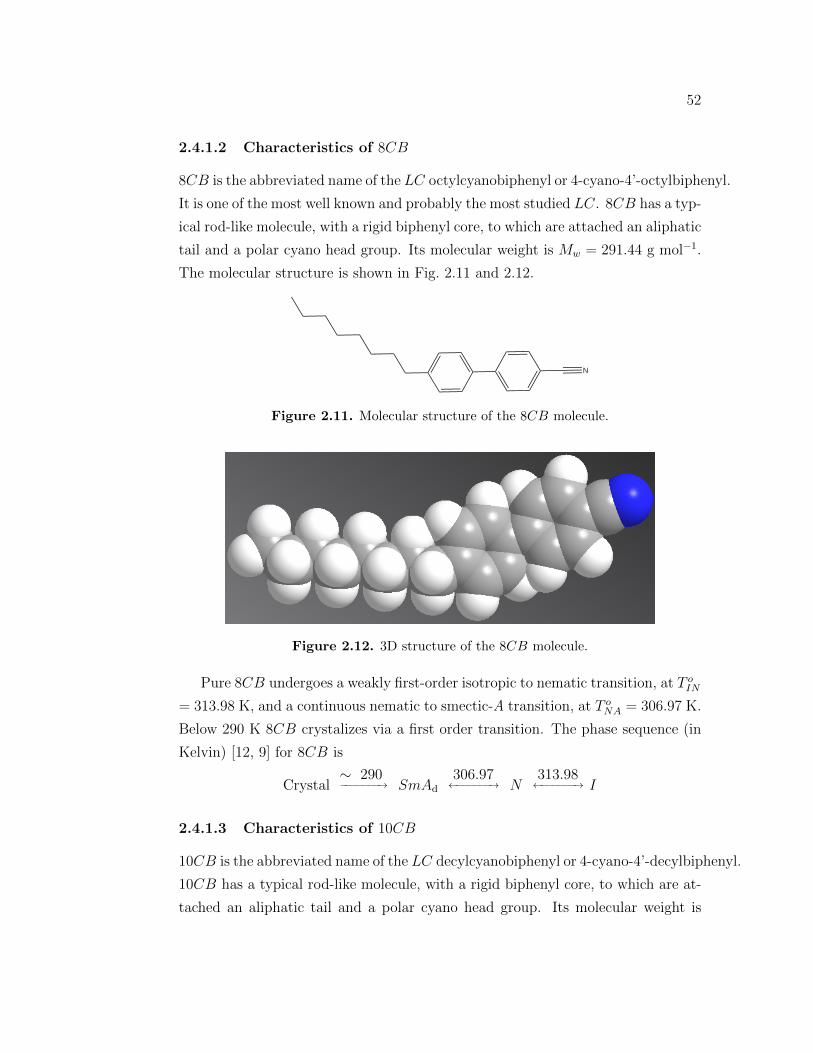
52
2.4.1.2 Characteristics of 8CB
8CB is the abbreviated name of the LC octylcyanobiphenyl or 4-cyano-4’-octylbiphenyl.
It is one of the most well known and probably the most studied LC. 8CB has a typ-
ical rod-like molecule, with a rigid biphenyl core, to which are attached an aliphatic
tail and a polar cyano head group. Its molecular weight is Mw = 291.44 g mol−1.
The molecular structure is shown in Fig. 2.11 and 2.12.
N
Figure 2.11. Molecular structure of the 8CB molecule.
Figure 2.12. 3D structure of the 8CB molecule.
Pure 8CB undergoes a weakly first-order isotropic to nematic transition, at T oIN
= 313.98 K, and a continuous nematic to smectic-A transition, at T oNA = 306.97 K.
Below 290 K 8CB crystalizes via a first order transition. The phase sequence (in
Kelvin) [12, 9] for 8CB is
Crystal∼ 290−−−−−−−→ SmAd
306.97←−−−−−−→ N
313.98←−−−−−−→ I
2.4.1.3 Characteristics of 10CB
10CB is the abbreviated name of the LC decylcyanobiphenyl or 4-cyano-4’-decylbiphenyl.
10CB has a typical rod-like molecule, with a rigid biphenyl core, to which are at-
tached an aliphatic tail and a polar cyano head group. Its molecular weight is
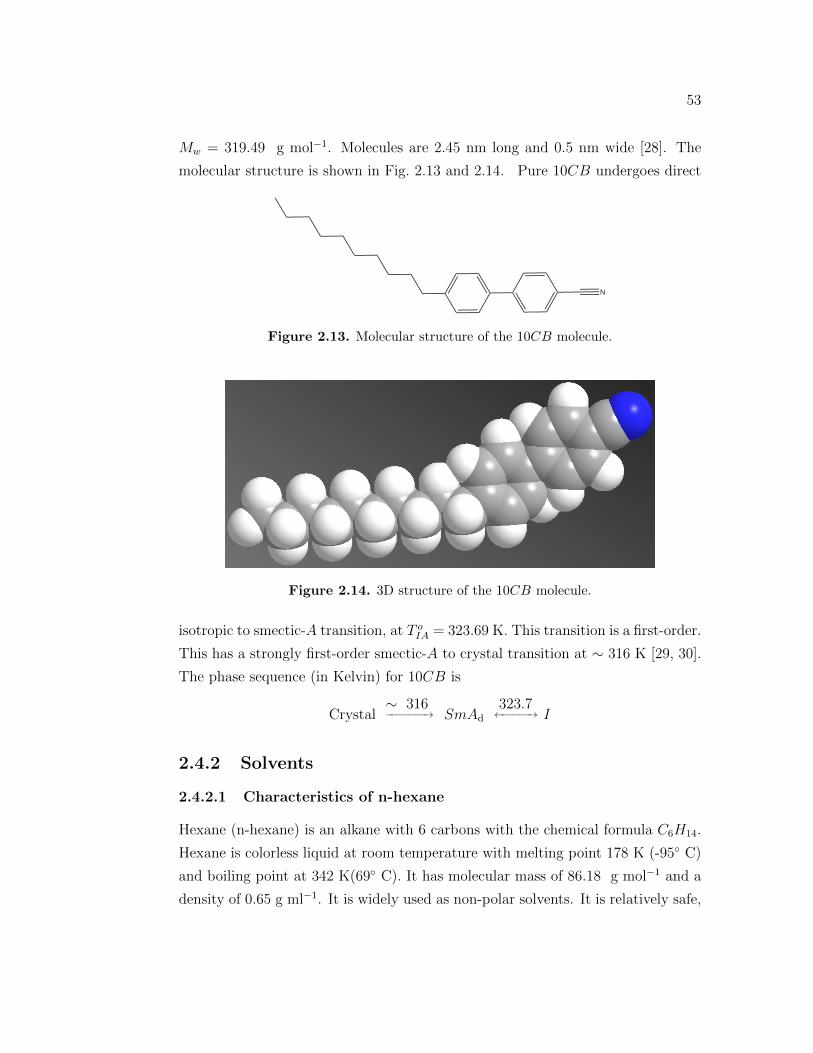
53
Mw = 319.49 g mol−1. Molecules are 2.45 nm long and 0.5 nm wide [28]. The
molecular structure is shown in Fig. 2.13 and 2.14. Pure 10CB undergoes direct
N
Figure 2.13. Molecular structure of the 10CB molecule.
Figure 2.14. 3D structure of the 10CB molecule.
isotropic to smectic-A transition, at T oIA = 323.69 K. This transition is a first-order.
This has a strongly first-order smectic-A to crystal transition at ∼ 316 K [29, 30].
The phase sequence (in Kelvin) for 10CB is
Crystal∼ 316−−−−−−−→ SmAd
323.7←−−−−−→ I
2.4.2 Solvents
2.4.2.1 Characteristics of n-hexane
Hexane (n-hexane) is an alkane with 6 carbons with the chemical formula C6H14.
Hexane is colorless liquid at room temperature with melting point 178 K (-95 C)
and boiling point at 342 K(69 C). It has molecular mass of 86.18 g mol−1 and a
density of 0.65 g ml−1. It is widely used as non-polar solvents. It is relatively safe,
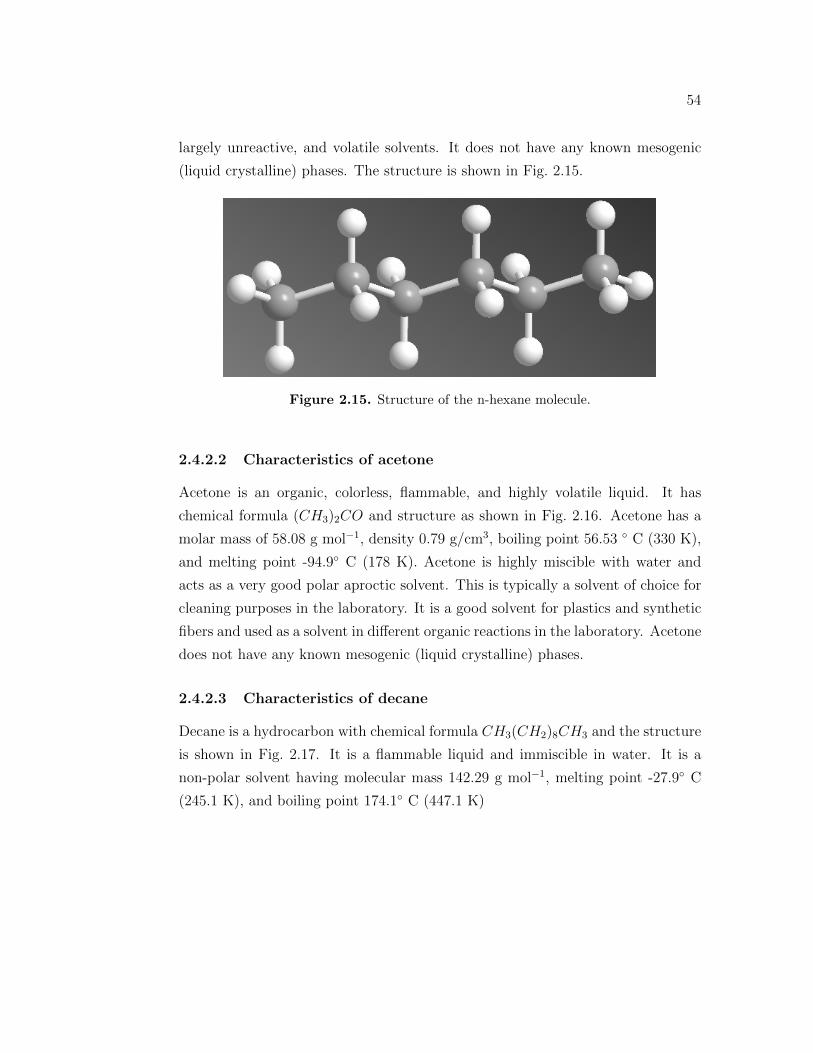
54
largely unreactive, and volatile solvents. It does not have any known mesogenic
(liquid crystalline) phases. The structure is shown in Fig. 2.15.
Figure 2.15. Structure of the n-hexane molecule.
2.4.2.2 Characteristics of acetone
Acetone is an organic, colorless, flammable, and highly volatile liquid. It has
chemical formula (CH3)2CO and structure as shown in Fig. 2.16. Acetone has a
molar mass of 58.08 g mol−1, density 0.79 g/cm3, boiling point 56.53 C (330 K),
and melting point -94.9 C (178 K). Acetone is highly miscible with water and
acts as a very good polar aproctic solvent. This is typically a solvent of choice for
cleaning purposes in the laboratory. It is a good solvent for plastics and synthetic
fibers and used as a solvent in different organic reactions in the laboratory. Acetone
does not have any known mesogenic (liquid crystalline) phases.
2.4.2.3 Characteristics of decane
Decane is a hydrocarbon with chemical formula CH3(CH2)8CH3 and the structure
is shown in Fig. 2.17. It is a flammable liquid and immiscible in water. It is a
non-polar solvent having molecular mass 142.29 g mol−1, melting point -27.9 C
(245.1 K), and boiling point 174.1 C (447.1 K)
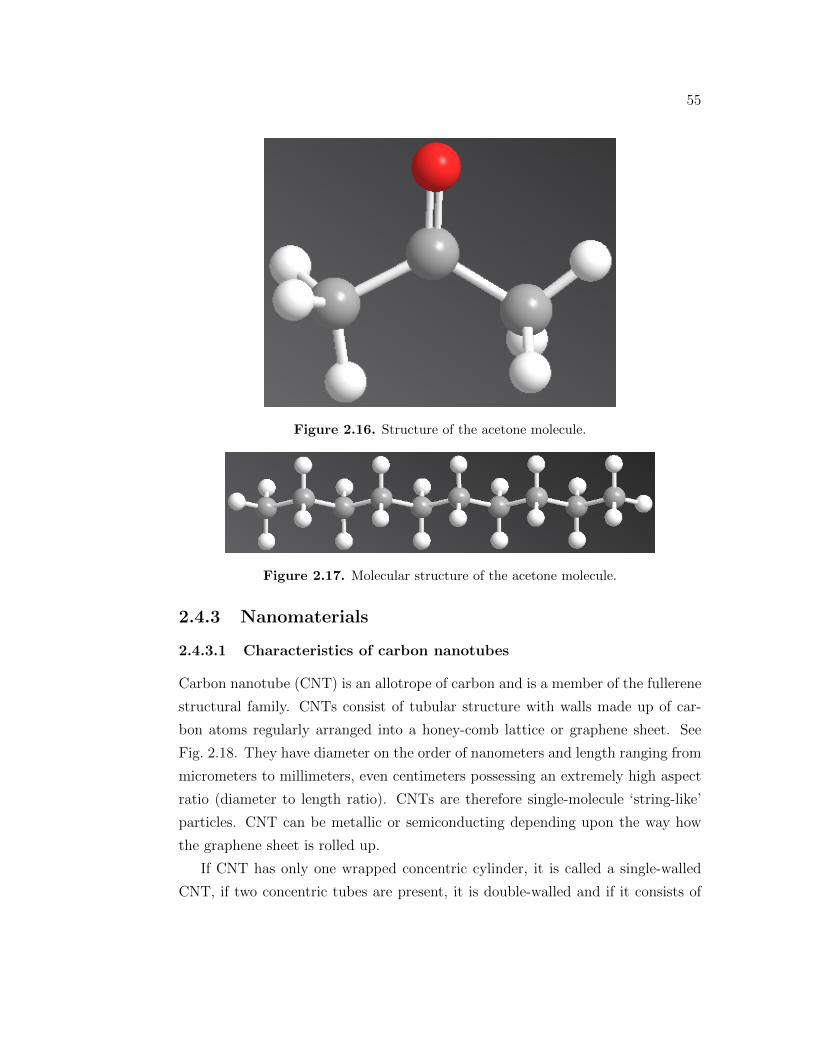
55
Figure 2.16. Structure of the acetone molecule.
Figure 2.17. Molecular structure of the acetone molecule.
2.4.3 Nanomaterials
2.4.3.1 Characteristics of carbon nanotubes
Carbon nanotube (CNT) is an allotrope of carbon and is a member of the fullerene
structural family. CNTs consist of tubular structure with walls made up of car-
bon atoms regularly arranged into a honey-comb lattice or graphene sheet. See
Fig. 2.18. They have diameter on the order of nanometers and length ranging from
micrometers to millimeters, even centimeters possessing an extremely high aspect
ratio (diameter to length ratio). CNTs are therefore single-molecule ‘string-like’
particles. CNT can be metallic or semiconducting depending upon the way how
the graphene sheet is rolled up.
If CNT has only one wrapped concentric cylinder, it is called a single-walled
CNT, if two concentric tubes are present, it is double-walled and if it consists of
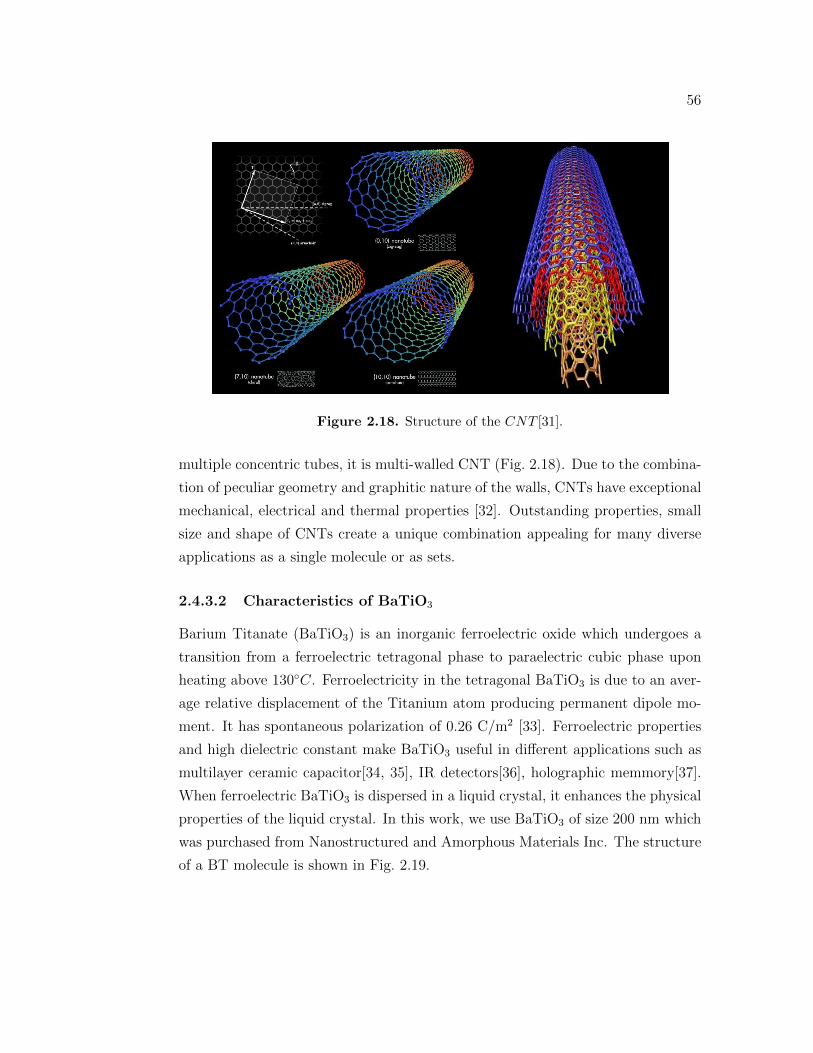
56
Figure 2.18. Structure of the CNT [31].
multiple concentric tubes, it is multi-walled CNT (Fig. 2.18). Due to the combina-
tion of peculiar geometry and graphitic nature of the walls, CNTs have exceptional
mechanical, electrical and thermal properties [32]. Outstanding properties, small
size and shape of CNTs create a unique combination appealing for many diverse
applications as a single molecule or as sets.
2.4.3.2 Characteristics of BaTiO3
Barium Titanate (BaTiO3) is an inorganic ferroelectric oxide which undergoes a
transition from a ferroelectric tetragonal phase to paraelectric cubic phase upon
heating above 130C. Ferroelectricity in the tetragonal BaTiO3 is due to an aver-
age relative displacement of the Titanium atom producing permanent dipole mo-
ment. It has spontaneous polarization of 0.26 C/m2 [33]. Ferroelectric properties
and high dielectric constant make BaTiO3 useful in different applications such as
multilayer ceramic capacitor[34, 35], IR detectors[36], holographic memmory[37].
When ferroelectric BaTiO3 is dispersed in a liquid crystal, it enhances the physical
properties of the liquid crystal. In this work, we use BaTiO3 of size 200 nm which
was purchased from Nanostructured and Amorphous Materials Inc. The structure
of a BT molecule is shown in Fig. 2.19.
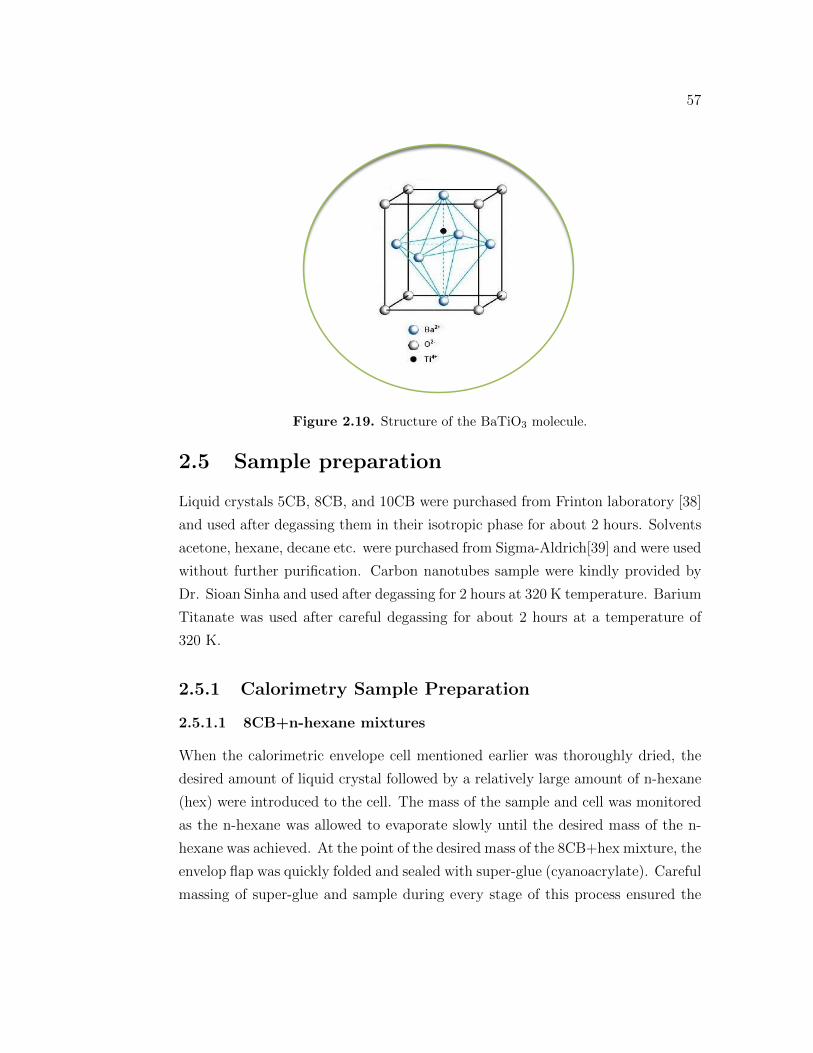
57
Figure 2.19. Structure of the BaTiO3 molecule.
2.5 Sample preparation
Liquid crystals 5CB, 8CB, and 10CB were purchased from Frinton laboratory [38]
and used after degassing them in their isotropic phase for about 2 hours. Solvents
acetone, hexane, decane etc. were purchased from Sigma-Aldrich[39] and were used
without further purification. Carbon nanotubes sample were kindly provided by
Dr. Sioan Sinha and used after degassing for 2 hours at 320 K temperature. Barium
Titanate was used after careful degassing for about 2 hours at a temperature of
320 K.
2.5.1 Calorimetry Sample Preparation
2.5.1.1 8CB+n-hexane mixtures
When the calorimetric envelope cell mentioned earlier was thoroughly dried, the
desired amount of liquid crystal followed by a relatively large amount of n-hexane
(hex) were introduced to the cell. The mass of the sample and cell was monitored
as the n-hexane was allowed to evaporate slowly until the desired mass of the n-
hexane was achieved. At the point of the desired mass of the 8CB+hex mixture, the
envelop flap was quickly folded and sealed with super-glue (cyanoacrylate). Careful
massing of super-glue and sample during every stage of this process ensured the
58
proper amounts of materials were sealed within the cell. Extensive care was taken
in handling the sample due to relatively rapid evaporative nature of n-hexane and
total mass of the cell was periodically checked. Different samples having xhex
ranging from 0 (pure 8CB) to 0.12 were prepared. Here xhex is n-hexane mole
fraction, and is defined as xhex = nhex/(nhex + nLC), where nhex and nLC are the
moles of hexane and liquid crystal used.
2.5.1.2 10CB+acetone mixtures
A specified amount of 10CB was transferred to a vial to which a relatively large
amount of acetone (HPLC grade, 99.9+% pure acetone from Aldrich) was added
and ultrasonicated to thoroughly mix. The acetone was then allowed to slowly
evaporate until the desired mass of the mixture was reached.
2.5.1.3 LC+nanomaterials composites
The degassed LC, proper amount of degassed carbon nanotubes and relatively
large amount of spectroscopic grade (ultra-low water content with purity of 99.9%)
acetone were mixed in a vial. The mixture was then mechanically mixed in a touch-
mixer for about an hour and ultrasonicated in an ultrasonic bath for about 10 hours
in the isotropic phase of pure 8CB. After ultrasonication the dispersion was placed
over the hot plate to evaporate the acetone slowly out of the mixture and then the
mixture was degassed under vacuum at 318K for about 2 hours. Different samples
having ϕw ranging from 0.0010 to 0.0060 were prepared using same procedure.
Here, ϕw = mCNT/(mLC +mCNT ) is the weight fraction of CNT, where mCNT and
mLC are masses of CNTs and LC respectively.
The degassed LC, proper amount of degassed Barium Titanate (BT) and rel-
atively large amount of spectroscopic grade (ultra-low water content with purity
of 99.9%) acetone were transferred in a vial. The mixture was then mechanically
mixed in a touch-mixer for about an hour and ultrasonicated in an ultrasonic bath
for about 10 hours in the isotropic phase of pure 8CB. After ultrasonication the
dispersion was placed over the hot plate to evaporate the acetone slowly out of
the mixture and then was degassed under vacuum at 318K for about 2 hours. Dif-
ferent samples having ϕm ranging from 0.001 to 0.014 were prepared using same
procedure. Here, ϕm = mBT/(mLC +mBT ) is the mass fraction of BT, where mBT
59
and mLC are masses of BT and LC respectively.
2.5.2 Microscopy Sample and Cell Preparation
Same samples prepared for calorimetry were used to observe the texture in the
polarizing microscope (crossed polarizer). For the LC+solvent studies microscope
slides with a concave cavity were used. After putting a drop of sample it was
covered by a cover slip. The cover-slip was glued over the slide using super-glue.
In the case of LC+nanomaterial sample, a drop of sample was put on the plane
surface of the microscope slide and was covered by a cover-slip. Thus made slides
were observed under the crossed polarizer and analyzer.
2.6 Experimental procedure
This section describes the experimental procedure and provides the parameters
used such as frequency, thermal scan rate etc. in the experiments.
For 8CB+hex system, the first heating scan followed by a cooling scan was
performed with a thermal scan of 1 K/h. The sample was kept in isotropic phase
for about 6 hours in between the heating scan and the following cooling scan.
Another set of heating and cooling was done at a heating frequency of 0.03125 Hz
and a final slow scanning rate of ±0.4 K/h. All the samples experienced the same
thermal history. The second set of data is presented here.
For 10CB+solvent and 8CB+BaTiO3 systems, the first heating scan followed
by a cooling scan was performed at a heating frequency of 0.196 rad/s (0.03125 Hz)
and a thermal scan of 1 K/hr. The sample was kept in isotropic phase for about 6
hours in between the heating scan and the following cooling scan. Another set of
heating and cooling was done at the same heating frequency and the same thermal
scanning rate to see whether there is significant drift of heat capacity peaks. All the
samples experienced the same thermal history. The second set of data is presented
here.
For 8CB+CNT system, the first heating scan followed by a cooling scan was
performed at a heating frequency of 0.196 rad/s (0.03125 Hz) and a thermal scan
of 1 K/hr. The sample was kept in isotropic phase for about 6 hours in between the
heating scan and the following cooling scan. Another set of heating and cooling
60
was done at a heating frequency of 0.03125 Hz and a thermal scanning rate of
±0.2 K/h for -3 K < TNA < +3 K and ± 1 K/h for other ranges of temperature.
The second set of data is presented here.
Bibliography
[1] M. Anisimov, Critical Phenomena in Liquids and Liquid Crystals. Gordon
and Breach, 1991.
[2] J. Thoen Int. J. Mod. Phys. B, vol. 9, p. 2157, 1995.
[3] P. F. Sullivan and G. Seidel Phys. Rev., vol. 173, p. 679, 1968.
[4] P. Handler, D.E.Mapother, and M. Rayl Phys. Rev. Lett, vol. 19, p. 356, 1967.
[5] Y. P. Feng, A. Jin, D. Finotello, K. Gillis, and M. Chan Phys. Rev. B, vol. 38,
p. 7041, 1998.
[6] H. B. Chae and M. Bretz J. Low Temp. Phys., vol. 76, p. 199, 1989.
[7] T. Kenny and P. L. Richard Rev. Sci. Instrum., vol. 61, p. 822, 1990.
[8] H. K. Kim, Q. M. Zhang, and M. H. W. Chan Phys. Rev., vol. 56, p. 1579,
1986.
[9] J. Thoen, H. Marynissen, and G. M. Mochel Phys. Rev. A, vol. 26, p. 2886,
1982.
[10] R. Geer, T. Stoebe, T. Pithford, and C. C. Haung Rev. Sci. Instrum., vol. 62,
p. 415, 1991.
[11] Y. Kraftmakher Physics Reports, vol. 356, pp. 1–117, 2002.
[12] G. S. Iannacchione, C. W. Garland, J. T. Mang, and T. P. Rieker Phys. Rev.
E, vol. 58, p. 5966, 1998.
61
62
[13] AlfaAesar, 30 Bond Street, Ward Hill, MA 01835, USA.
[14] BLH Electronics, Inc., 75 Shawmut Road, Canton, MA 02021, USA.
[15] YSI Temperature, 118 Victory Road, Springfield, NJ 07081, USA.
[16] Lakeshore Cryotronics, Inc., http://www.lakeshore.com.
[17] TA Instruments, New Castle DE, USA.
[18] In the two-wire measurement a single pair of lines that apply the current, does
the voltage measurement, therefore the resistance of the connecting leads is
added to the resistance of interest. This can be a source of error especially
if small resistances are to be measured. In the 4-wire measurement two of
the wires supply the current while the other two measure the voltage drop
across the resistance; this way only the value of the resistance of interest gets
measured, without adding the lead’s resistance.
[19] Agilent Technologies, Inc., http://www.agilent.com.
[20] National Instruments, Inc., http://www.ni.com.
[21] The DMM is set to do a specified number of measurements at equally spaced
time intervals. For each measurement the time elapsed and the measured value
get stored in the internal memory. After the specified number of measurements
is carried out, the data are then downloaded at the computer. The digitizing
gets triggered by the TTL trigger of the HP, which happens at every zero
crossing of the voltage.
[22] Nikon MicroscopyU, http://www.microscopyu.com.
[23] M. C. Foote and A. C. Anderson Rev. of Sci. Instrum., vol. 58, p. 130, 1987.
[24] S. Pilla, J. A. Hamida, and N. S. Sullivan Rev. of Sci. Instrum., vol. 70,
p. 4055, 1999.
[25] S. C. Bera and S. Chattopadhyay Measurement, vol. 33, p. 3, 2003.
[26] Standford Research Systems, http://www.thinksrs.com.
63
[27] R. Basu. PhD thesis, WPI, 2010.
[28] A. Leadbetter, J. Frost, J. Gaughan, G. Gray, and A. Mosley, “The structure
of smectic a phases of compounds with cyano end groups,” J. Physique, vol. 40,
p. 375, 1979.
[29] J. Leys, G. Sinha, C. Glorieux, and J. Thoen, “Influence of nanosized confine-
ments on 4-n-decyl-4’-cyanobiphenyl (10cb): A broadband dielectric study,”
Phys. Rev. E, vol. 71, p. 051709, 2005.
[30] F. V. Chavez, R. Acosta, and D. Pusiol, “Molecular dynamics above the
smectic a-isotropic phase transition of thermotropic liquid crystals studied by
nmr,” Chem. Phys. Lett., vol. 392, pp. 403–408, 2004.
[31] http://upload.wikimedia.org and http://students.chem.tue.nl.
[32] R. Saito, M. S. Dresselhaus, and G. Dresselhaus, Physical properties of carbon
nanotubes. Imperial College Press, London, 1998.
[33] A. Glushchenko, C. Cheon, J. West, F. Li, E. Buyuktanir, Y. Reznikov, and
A. Buchnav Mol. Cryst. Liq. Cryst., vol. 453, pp. 227–237, 2006.
[34] S. F. Wang and G. O.Dayton J. Am. Ceram. Soc., vol. 82, p. 2677, 1999.
[35] D. Hennings, M. Klee, and R. Waser Adv. Matter, vol. 3, p. 334, 1991.
[36] E. P. Pevesov, E. G. Elkin, and M. A. Pospelova Proc. SPIE-Int. Soc. Opt.
Am., vol. 3200, p. 179, 1997.
[37] H. Funakoshi, A. Okamoto, and K. Sato J. mod. opt., vol. 52, pp. 1511–1527,
2005.
[38] Frinton Laboratory, http://www.frinton.com.
[39] Sigma-Aldrich, http://www.sigmaaldrich.com.
[40] K. P. Sigdel and G. S. Iannacchione, “Evolution of the isotropic to nematic
phase transition in binary mixtures of octylcyanobiphenyl and n-hexane,” J.
Chem. Phys., vol. 133, p. 044513, 2010.
Chapter 3Isotropic to nematic phase transition
in octylcyanobiphenyl and n-hexane
binary mixtures
3.1 Introduction
The effect of the disorder and impurities on condensed matter systems is an impor-
tant and challenging problem to the fundamental understanding of phase ordering
or self-assembly and continually attracts the attention of researchers. The disor-
dered systems often display complex and rich phenomena, being the generalization
of the pure (ideal) systems. Disorder can dramatically alter the physical proper-
ties of multi-component, composite systems. In particular, the effect of disorder
on phase transitions is important as the disorder typically couples to the order pa-
rameter, which can be usefully described as a random local field that is conjugate
to the order parameter. This is usually realized in systems with random inclusions
in a phase ordering media, e.g., a colloidal dispersion of solids in a complex fluid.
Another form of disorder is presented by dilution effects, which imposes instead the
random breaking or weakening of intermolecular bonds or interactions responsible
for the phase ordering. Exploring a good physical system representing random di-
lution effects in a controlled manner offers a physical probe to unresolved problems
in the understanding of mesophasic order [1].
Liquid crystals (LCs) are an attractive model system for studying mesophasic
64
65
ordering and phase transitions. The phase behavior of LC is strongly influenced by
disorder and impurities, and are easily handled allowing for unique control of the
important physical parameters. Examples of induced random field-like disorder
through random surface interactions are silica aerosil [2, 3, 4, 5], aerogel [6, 7],
controlled porous glass [8, 9, 10], and other uniform cylindrical confinements [11,
12]. The LC phase behavior can also be altered by using external electric and
magnetic fields [13, 14]. Also, by employing LC+LC mixtures [15, 16, 17, 18],
new phases and phase diagrams have been explored. Finally, mixture systems
comprised of water, surfactant, and a nematic liquid crystal have revealed unique
arrangements of spherical micelles in a microemulsion upon full phase separation
either by cooling into the nematic phase or the addition of an appropriate co-
surfactant [19, 20, 21].
Recently, renewed attention has been drawn to miscible mixtures of liquid crys-
tals and non-mesogenic, low-molecular weight, solvents for furthering basic under-
standing of mesogenic order and tuning viscoelastic properties [22, 23, 24, 25, 26].
An x-ray study of a binary mixture of a LC and n-hexane focussing on the nematic
to smectic-A phase transition indicated from visual inspection that in 8CB/n-
hexane mixtures (for n-hexane volume fraction 0.1 and up) the solvent is not uni-
formly distributed throughout the host LC, and minimal, non-reproducible swelling
is observed [22]. The experimental studies on 8CB+cyclohexane [26] system that
enforced uniformity by continuous mixing, revealed a linear decrease in isotropic
to nematic transition temperatures, and constant latent heat during the transition
with increasing solvent mole fraction.
In this work, we study the effect of a non-mesogenic, low molecular weight,
solvent (n-hexane) concentration on the weakly first-order isotropic to nematic
(I-N) phase transition on octylcyanobiphenyl (8CB) and n-hexane (hex) binary
mixtures (8CB+hex) as a function of n-hexane concentrations. The introduction
of n-hexane on 8CB causes the dramatic change in the phase transition behavior
in 8CB+hex mixtures. The heat capacity peak associated with the I-N phase
transition, ∆Cp, shifts towards lower temperature non-monotonically and becomes
progressively smeared as the hexane concentration increases. There is significant
hysteresis in the ∆Cp shape between heating and cooling, especially for higher
hexane concentrations. On heating, the ∆Cp peak exhibits a broad tail where the
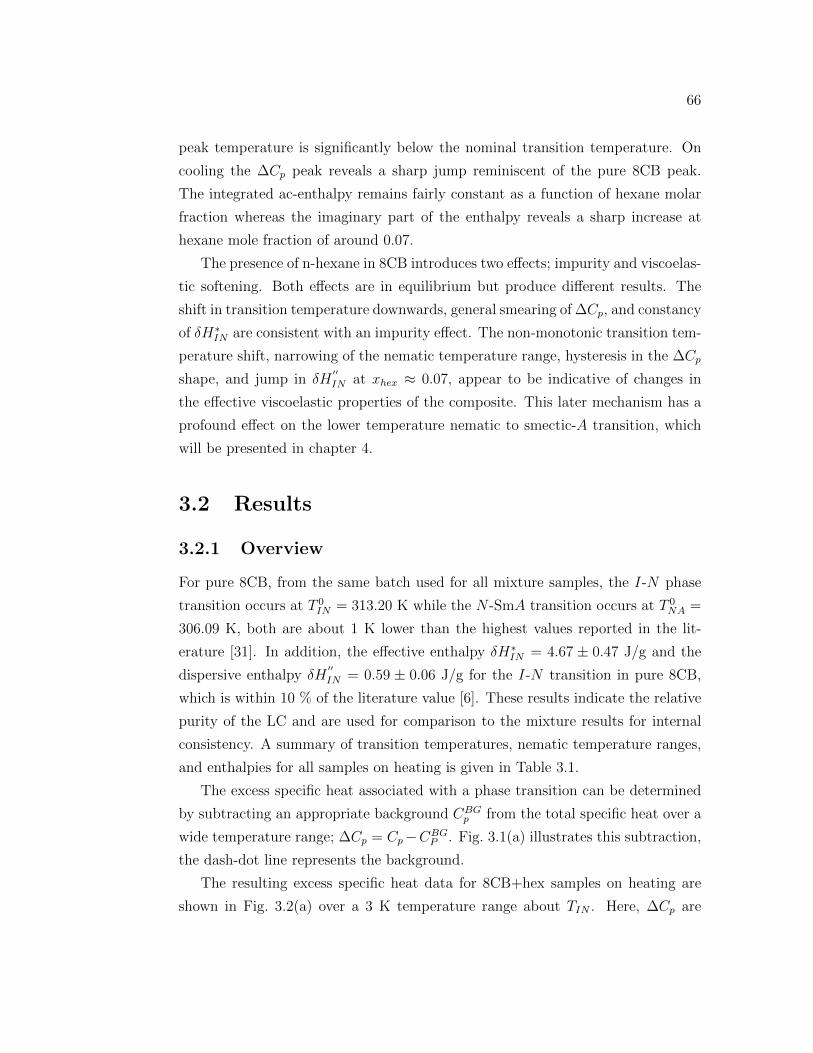
66
peak temperature is significantly below the nominal transition temperature. On
cooling the ∆Cp peak reveals a sharp jump reminiscent of the pure 8CB peak.
The integrated ac-enthalpy remains fairly constant as a function of hexane molar
fraction whereas the imaginary part of the enthalpy reveals a sharp increase at
hexane mole fraction of around 0.07.
The presence of n-hexane in 8CB introduces two effects; impurity and viscoelas-
tic softening. Both effects are in equilibrium but produce different results. The
shift in transition temperature downwards, general smearing of ∆Cp, and constancy
of δH∗IN are consistent with an impurity effect. The non-monotonic transition tem-
perature shift, narrowing of the nematic temperature range, hysteresis in the ∆Cp
shape, and jump in δH′′IN at xhex ≈ 0.07, appear to be indicative of changes in
the effective viscoelastic properties of the composite. This later mechanism has a
profound effect on the lower temperature nematic to smectic-A transition, which
will be presented in chapter 4.
3.2 Results
3.2.1 Overview
For pure 8CB, from the same batch used for all mixture samples, the I-N phase
transition occurs at T 0IN = 313.20 K while the N -SmA transition occurs at T 0
NA =
306.09 K, both are about 1 K lower than the highest values reported in the lit-
erature [31]. In addition, the effective enthalpy δH∗IN = 4.67 ± 0.47 J/g and the
dispersive enthalpy δH′′IN = 0.59 ± 0.06 J/g for the I-N transition in pure 8CB,
which is within 10 % of the literature value [6]. These results indicate the relative
purity of the LC and are used for comparison to the mixture results for internal
consistency. A summary of transition temperatures, nematic temperature ranges,
and enthalpies for all samples on heating is given in Table 3.1.
The excess specific heat associated with a phase transition can be determined
by subtracting an appropriate background CBGp from the total specific heat over a
wide temperature range; ∆Cp = Cp −CBGP . Fig. 3.1(a) illustrates this subtraction,
the dash-dot line represents the background.
The resulting excess specific heat data for 8CB+hex samples on heating are
shown in Fig. 3.2(a) over a 3 K temperature range about TIN . Here, ∆Cp are
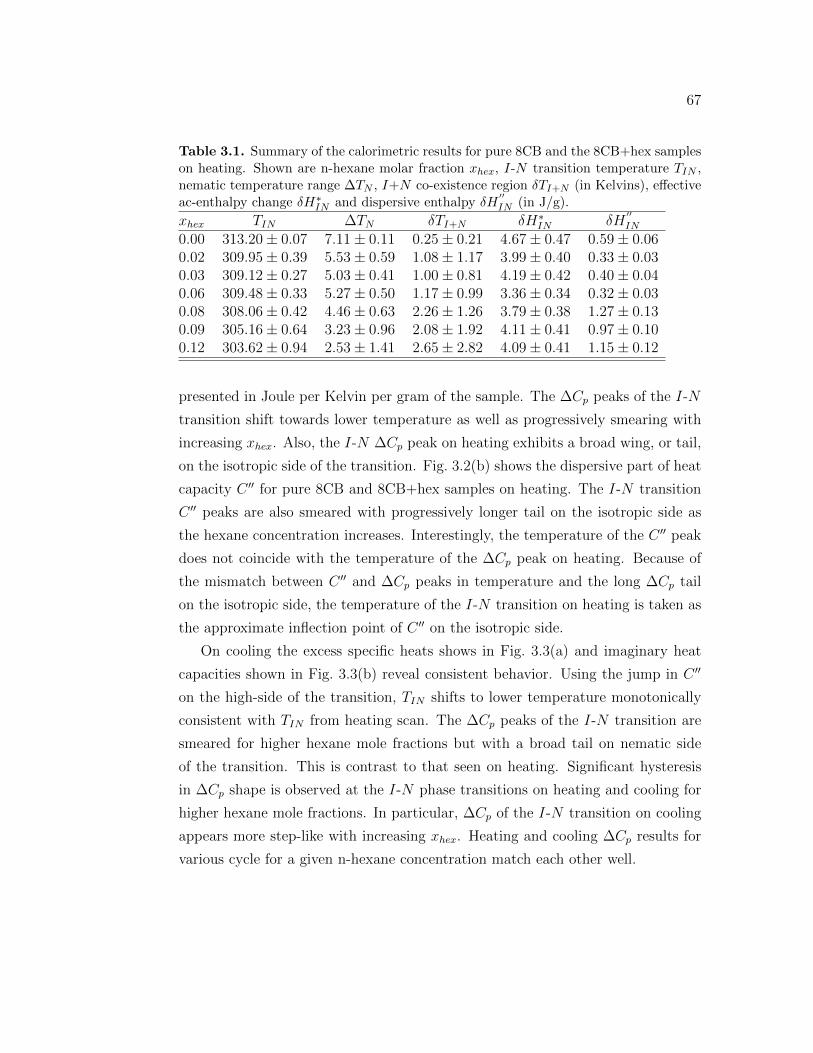
67
Table 3.1. Summary of the calorimetric results for pure 8CB and the 8CB+hex sampleson heating. Shown are n-hexane molar fraction xhex, I-N transition temperature TIN ,nematic temperature range ∆TN , I+N co-existence region δTI+N (in Kelvins), effectiveac-enthalpy change δH∗IN and dispersive enthalpy δH
′′IN (in J/g).
xhex TIN ∆TN δTI+N δH∗IN δH′′IN
0.00 313.20 ± 0.07 7.11 ± 0.11 0.25 ± 0.21 4.67 ± 0.47 0.59 ± 0.060.02 309.95 ± 0.39 5.53 ± 0.59 1.08 ± 1.17 3.99 ± 0.40 0.33 ± 0.030.03 309.12 ± 0.27 5.03 ± 0.41 1.00 ± 0.81 4.19 ± 0.42 0.40 ± 0.040.06 309.48 ± 0.33 5.27 ± 0.50 1.17 ± 0.99 3.36 ± 0.34 0.32 ± 0.030.08 308.06 ± 0.42 4.46 ± 0.63 2.26 ± 1.26 3.79 ± 0.38 1.27 ± 0.130.09 305.16 ± 0.64 3.23 ± 0.96 2.08 ± 1.92 4.11 ± 0.41 0.97 ± 0.100.12 303.62 ± 0.94 2.53 ± 1.41 2.65 ± 2.82 4.09 ± 0.41 1.15 ± 0.12
presented in Joule per Kelvin per gram of the sample. The ∆Cp peaks of the I-N
transition shift towards lower temperature as well as progressively smearing with
increasing xhex. Also, the I-N ∆Cp peak on heating exhibits a broad wing, or tail,
on the isotropic side of the transition. Fig. 3.2(b) shows the dispersive part of heat
capacity C ′′ for pure 8CB and 8CB+hex samples on heating. The I-N transition
C ′′ peaks are also smeared with progressively longer tail on the isotropic side as
the hexane concentration increases. Interestingly, the temperature of the C ′′ peak
does not coincide with the temperature of the ∆Cp peak on heating. Because of
the mismatch between C ′′ and ∆Cp peaks in temperature and the long ∆Cp tail
on the isotropic side, the temperature of the I-N transition on heating is taken as
the approximate inflection point of C ′′ on the isotropic side.
On cooling the excess specific heats shows in Fig. 3.3(a) and imaginary heat
capacities shown in Fig. 3.3(b) reveal consistent behavior. Using the jump in C ′′
on the high-side of the transition, TIN shifts to lower temperature monotonically
consistent with TIN from heating scan. The ∆Cp peaks of the I-N transition are
smeared for higher hexane mole fractions but with a broad tail on nematic side
of the transition. This is contrast to that seen on heating. Significant hysteresis
in ∆Cp shape is observed at the I-N phase transitions on heating and cooling for
higher hexane mole fractions. In particular, ∆Cp of the I-N transition on cooling
appears more step-like with increasing xhex. Heating and cooling ∆Cp results for
various cycle for a given n-hexane concentration match each other well.
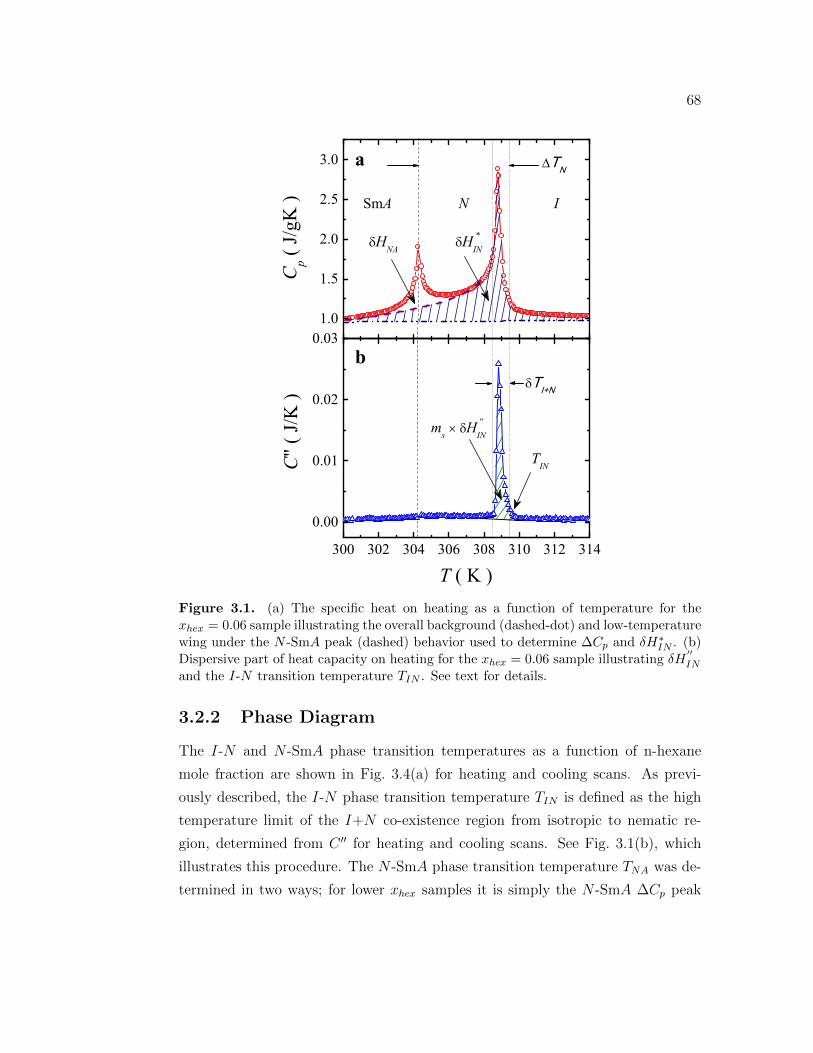
68
300 302 304 306 308 310 312 314
0.00
0.01
0.02
0.03b
T ( K )
C"
( J/K
)
ms H ''IN
TIN
TI+N
1.0
1.5
2.0
2.5
3.0
Cp (
J/gK
)
HNA H *IN
a
SmA N I
TN
Figure 3.1. (a) The specific heat on heating as a function of temperature for thexhex = 0.06 sample illustrating the overall background (dashed-dot) and low-temperaturewing under the N -SmA peak (dashed) behavior used to determine ∆Cp and δH∗IN . (b)Dispersive part of heat capacity on heating for the xhex = 0.06 sample illustrating δH
′′IN
and the I-N transition temperature TIN . See text for details.
3.2.2 Phase Diagram
The I-N and N -SmA phase transition temperatures as a function of n-hexane
mole fraction are shown in Fig. 3.4(a) for heating and cooling scans. As previ-
ously described, the I-N phase transition temperature TIN is defined as the high
temperature limit of the I+N co-existence region from isotropic to nematic re-
gion, determined from C ′′ for heating and cooling scans. See Fig. 3.1(b), which
illustrates this procedure. The N -SmA phase transition temperature TNA was de-
termined in two ways; for lower xhex samples it is simply the N -SmA ∆Cp peak
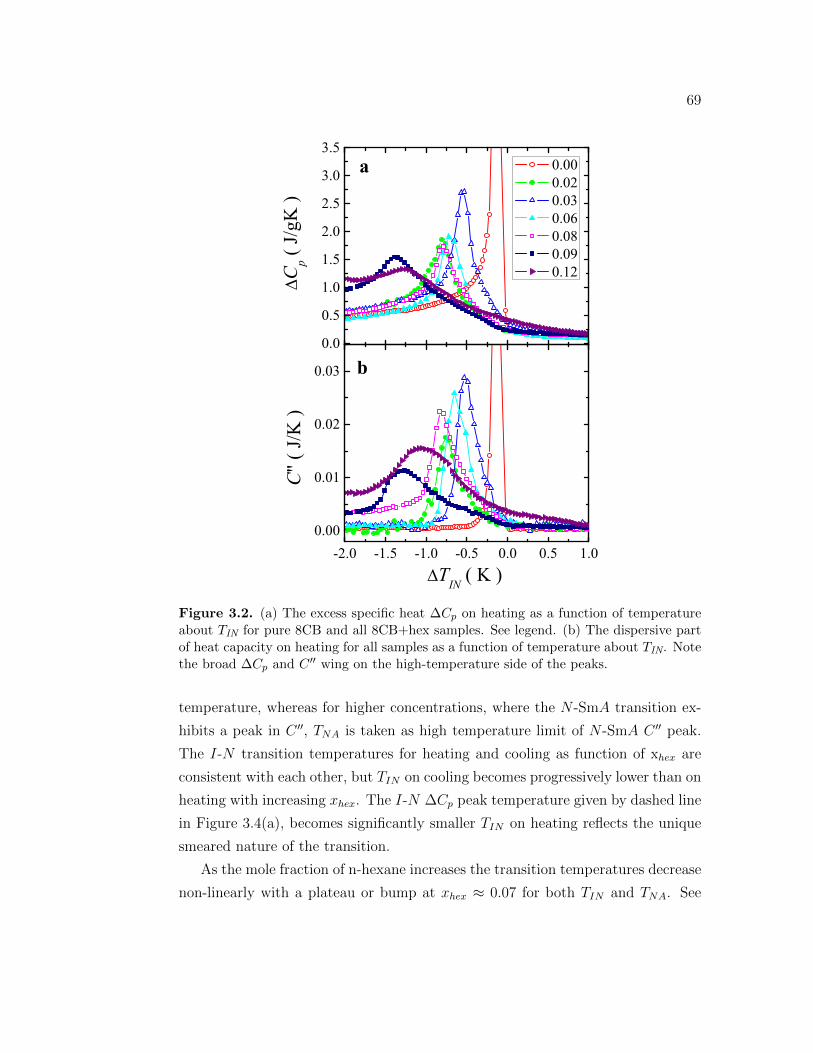
69
-2.0 -1.5 -1.0 -0.5 0.0 0.5 1.00.00
0.01
0.02
0.03 b
TIN ( K )
C"
( J/K
)
0.0
0.5
1.0
1.5
2.0
2.5
3.0
3.5a
Cp (
J/gK
)
0.00 0.02 0.03 0.06 0.08 0.09 0.12
Figure 3.2. (a) The excess specific heat ∆Cp on heating as a function of temperatureabout TIN for pure 8CB and all 8CB+hex samples. See legend. (b) The dispersive partof heat capacity on heating for all samples as a function of temperature about TIN. Notethe broad ∆Cp and C ′′ wing on the high-temperature side of the peaks.
temperature, whereas for higher concentrations, where the N -SmA transition ex-
hibits a peak in C ′′, TNA is taken as high temperature limit of N -SmA C ′′ peak.
The I-N transition temperatures for heating and cooling as function of xhex are
consistent with each other, but TIN on cooling becomes progressively lower than on
heating with increasing xhex. The I-N ∆Cp peak temperature given by dashed line
in Figure 3.4(a), becomes significantly smaller TIN on heating reflects the unique
smeared nature of the transition.
As the mole fraction of n-hexane increases the transition temperatures decrease
non-linearly with a plateau or bump at xhex ≈ 0.07 for both TIN and TNA. See
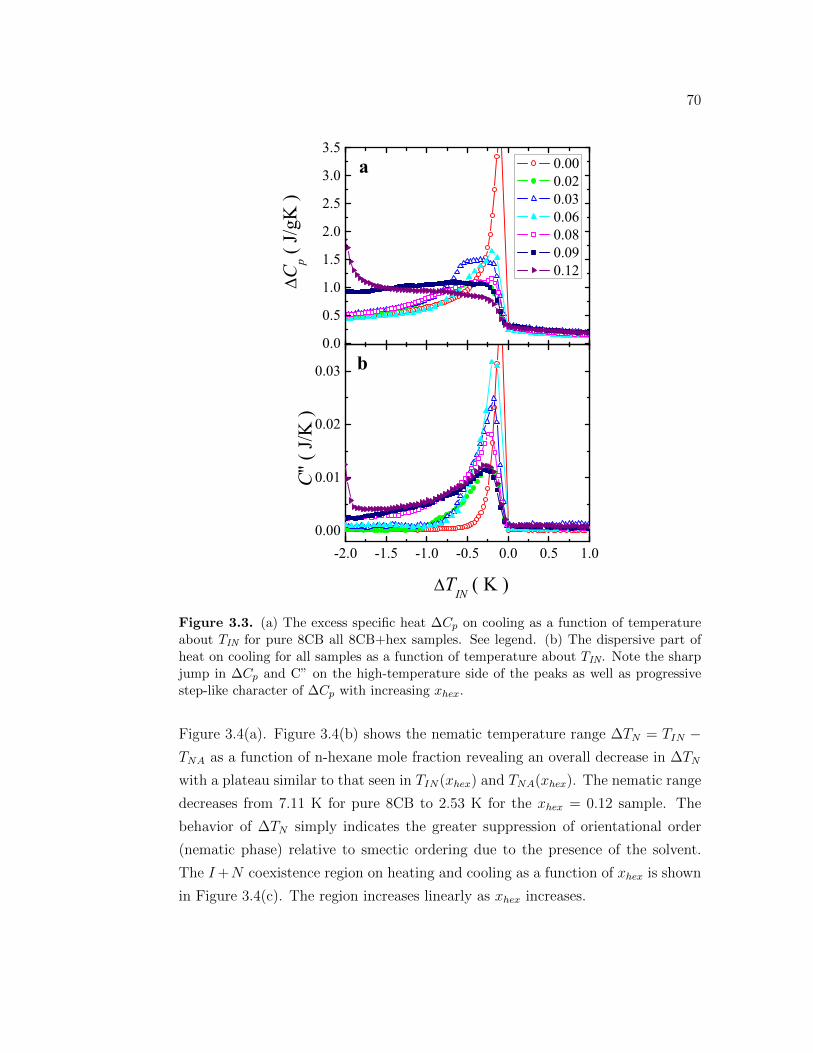
70
-2.0 -1.5 -1.0 -0.5 0.0 0.5 1.00.00
0.01
0.02
0.03 b
C"
( J/K
)
TIN ( K )
0.0
0.5
1.0
1.5
2.0
2.5
3.0
3.5a
Cp (
J/gK
)
0.00 0.02 0.03 0.06 0.08 0.09 0.12
Figure 3.3. (a) The excess specific heat ∆Cp on cooling as a function of temperatureabout TIN for pure 8CB all 8CB+hex samples. See legend. (b) The dispersive part ofheat on cooling for all samples as a function of temperature about TIN. Note the sharpjump in ∆Cp and C” on the high-temperature side of the peaks as well as progressivestep-like character of ∆Cp with increasing xhex.
Figure 3.4(a). Figure 3.4(b) shows the nematic temperature range ∆TN = TIN −TNA as a function of n-hexane mole fraction revealing an overall decrease in ∆TN
with a plateau similar to that seen in TIN(xhex) and TNA(xhex). The nematic range
decreases from 7.11 K for pure 8CB to 2.53 K for the xhex = 0.12 sample. The
behavior of ∆TN simply indicates the greater suppression of orientational order
(nematic phase) relative to smectic ordering due to the presence of the solvent.
The I+N coexistence region on heating and cooling as a function of xhex is shown
in Figure 3.4(c). The region increases linearly as xhex increases.
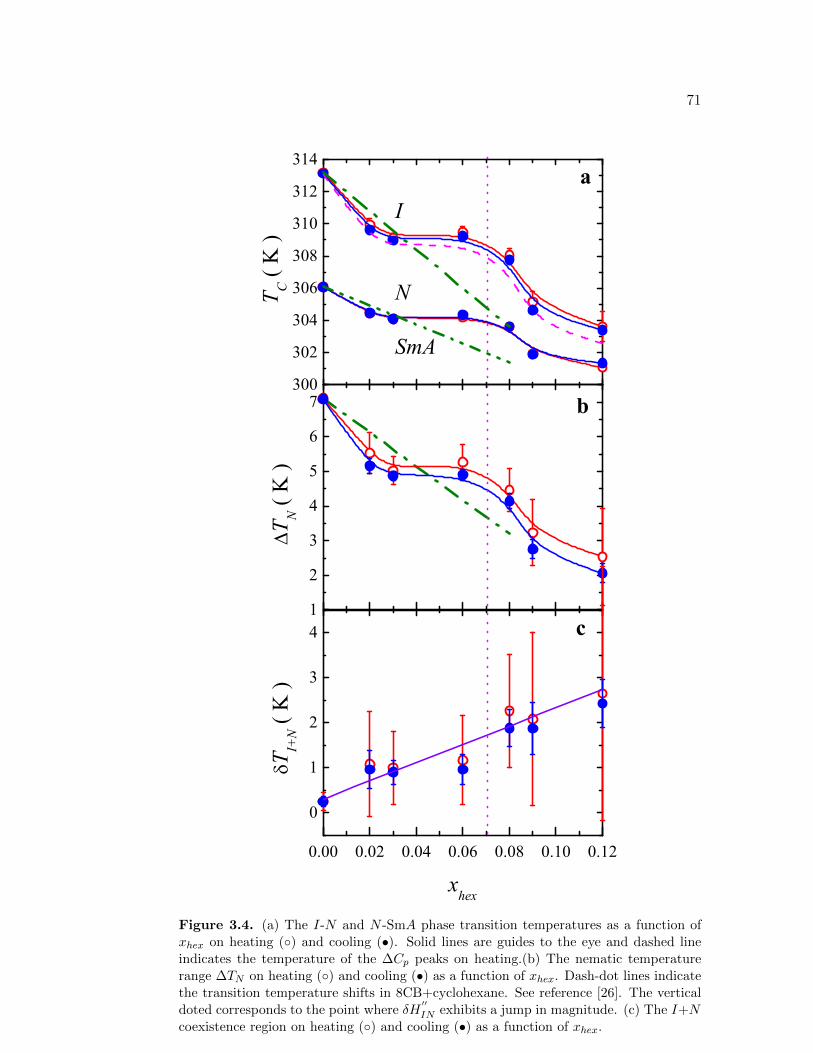
71
300
302
304
306
308
310
312
314
1
2
3
4
5
6
7
0.00 0.02 0.04 0.06 0.08 0.10 0.12
0
1
2
3
4
a
I
N
SmA
xhex
T C (
K )
T I+N (
K )
b
T N (
K )
c
Figure 3.4. (a) The I-N and N -SmA phase transition temperatures as a function ofxhex on heating () and cooling (•). Solid lines are guides to the eye and dashed lineindicates the temperature of the ∆Cp peaks on heating.(b) The nematic temperaturerange ∆TN on heating () and cooling (•) as a function of xhex. Dash-dot lines indicatethe transition temperature shifts in 8CB+cyclohexane. See reference [26]. The verticaldoted corresponds to the point where δH
′′IN exhibits a jump in magnitude. (c) The I+N
coexistence region on heating () and cooling (•) as a function of xhex.
72
3.2.3 The I-N phase transition enthalpy
The enthalpy change associated with a phase transition is defined as
δH =
∫∆CpdT (3.1)
where the integration is usually carried over as wide a temperature range as pos-
sible. For first-order phase transitions, the situation is complicated due to the
presence of coexistence region as well as a latent heat ∆H. The total transition
enthalpy change for weakly first-order phase transitions is the sum of the pretran-
sitional enthalpy and latent heat associated with the transition and is given by
∆Htotal = δH + ∆H. Due to partial phase conversion N I during a Tac cycle,
typical ∆Cp values using ac-calorimetry obtained in two phase coexistence region
are frequency dependent and remarkably high. The integration of observed ∆Cp
yields an effective enthalpy δH∗IN , which includes some but not all of the latent
heat contributions. In addition, the enthalpic contribution of a near-by phase tran-
sition must be subtracted to further isolate the appropriate ∆Cp. This typically
involves defining the ∆Cp wing contribution that underlays the lower tempera-
ture transition. The integration of the imaginary part of heat capacity given by
Eq. (6.6) yields the imaginary transition enthalpy δH′′IN , which is the dispersion of
energy in the sample and an indicator of the first-order character of the transition.
Fig. 3.1(a) and (b) illustrates the way how we calculate the effective ac-enthalpy
change δH∗IN and imaginary enthalpy δH′′IN respectively. The shaded regions give
δH∗IN and δH”IN . In ac-calorimetric technique the uncertainty in determining the
enthalpy is typically 10 % due to the base line and background subtractions.
The effective I-N transition enthalpy δH∗IN was obtained by integrating ∆Cp
from 299K to 317 K for pure 8CB and all 8CB+hex samples then subtracting the
N -SmA transition enthalpy contribution. See Fig. 3.1(a). The dispersive enthalpy
of the I-N transition was obtained by integrating C ′′ just over the I-N C ′′ peak
and then scaling by mass of the sample ms. See Fig. 3.1(b). In this work, fixed
heating frequency was used, thus δH′′IN is only proportional to the transition latent
heat.
The resulting δH∗IN and δH′′IN for heating and cooling scans as the function of
hexane mole fraction for all 8CB+hex samples are shown in Fig. 3.5. The δH∗IN
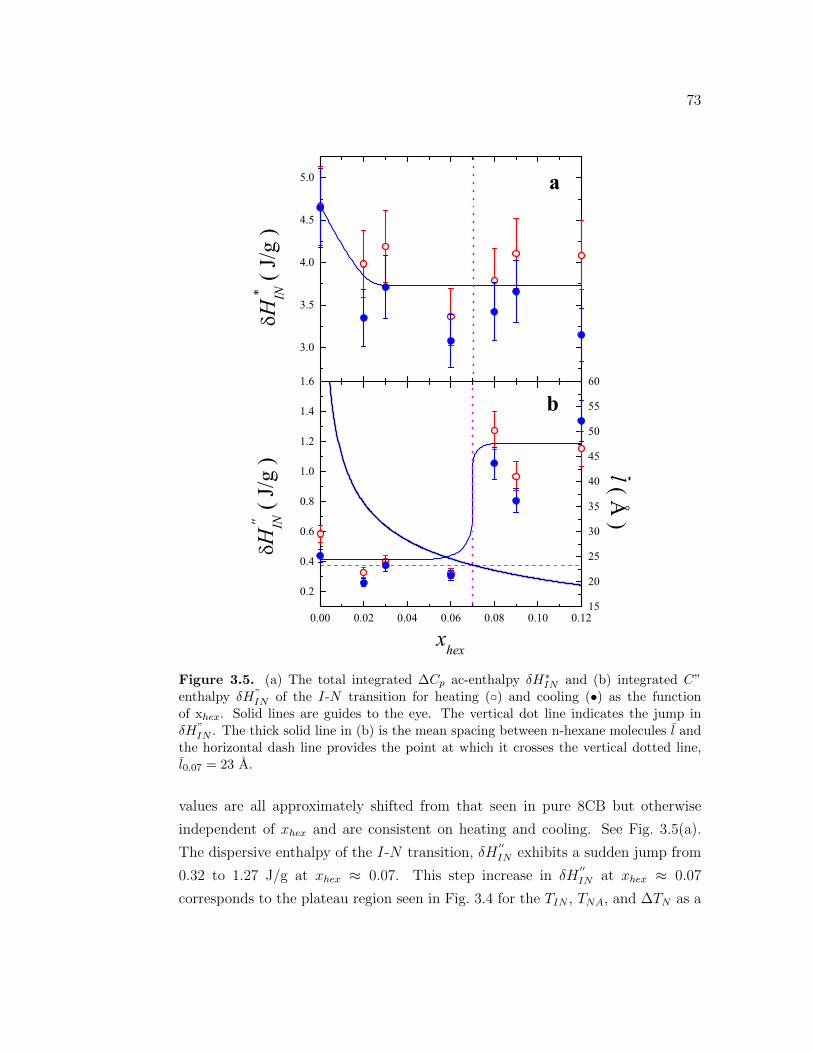
73
0.00 0.02 0.04 0.06 0.08 0.10 0.12
0.2
0.4
0.6
0.8
1.0
1.2
1.4
1.6
3.0
3.5
4.0
4.5
5.0
15
20
25
30
35
40
45
50
55
60
b
xhex
H '' IN
( J/
g )
H * IN
( J/
g )
a
l ( Å )
Figure 3.5. (a) The total integrated ∆Cp ac-enthalpy δH∗IN and (b) integrated C”enthalpy δH”
IN of the I-N transition for heating () and cooling (•) as the functionof xhex. Solid lines are guides to the eye. The vertical dot line indicates the jump inδH”
IN . The thick solid line in (b) is the mean spacing between n-hexane molecules l andthe horizontal dash line provides the point at which it crosses the vertical dotted line,l0.07 = 23 A.
values are all approximately shifted from that seen in pure 8CB but otherwise
independent of xhex and are consistent on heating and cooling. See Fig. 3.5(a).
The dispersive enthalpy of the I-N transition, δH′′IN exhibits a sudden jump from
0.32 to 1.27 J/g at xhex ≈ 0.07. This step increase in δH′′IN at xhex ≈ 0.07
corresponds to the plateau region seen in Fig. 3.4 for the TIN , TNA, and ∆TN as a
74
function of xhex.
3.3 Discussion and conclusions
The introduction of n-hexane to 8CB greatly affects the behavior of the I-N phase
transition. The main effect of solvent is to dilute the liquid crystal, resulting in two
main changes; an impurity effect and viscoelastic softening of the mixture. The
impurity mechanism introduces concentration fluctuations (random local transition
temperatures) and a generic truncation of the order parameter correlation length.
However, the presence of solvent can screen LC molecules from one another, a
dilution effect, that softens the viscoelastic properties of the mixture with respect
to that of pure LC. This viscoelastic softening can substantially change the role
of order fluctuation in the phase transition leading to non-linear shifts in Tc and
hysteresis of the transition behavior.
T. P. Rieker [22] studied the LCs/n-hexane systems on the N -SmA phase
transitions in LC/n-hexane systems and observed from visual inspection that for
8CB/n-hexane, the solvent was not uniformly distributed throughout the host LC
and only a minimal, non-reproducible, swelling of the SmA layers were observed.
However, these samples were of higher n-hexane concentration than ours, a re-
ported volume fraction of 0.1. In the concentration range studied here, correspond-
ing to a volume fraction from 0.015 to 0.060, visual inspection of sealed 8CB+hex
samples over many months did not reveal any sign of de-mixing/separation. Large
scale phase separation is not likely to play a major role in the results reported
here.
Broader peaks and significant tails of ∆Cp in isotropic side of the transition on
heating for higher hexane mole fraction indicate that the melting of the samples
takes place for large temperature range. But during the cooling scans crystalliza-
tion starts sharply. Therefore the melting and crystallization are driven by different
dynamics which may be due to the coupling of viscoelastic properties with orien-
tational order of the sample. Matching of heating and cooling ∆Cp results for
various cycles for a given n-hexane sample indicates that the significant hysteresis
observed during cooling and heating is not due to phase separation rather due to
the different dynamics in heating and cooling scans. Shifting ∆Cp towards lower
75
temperature and diminishing I-N ∆Cp peaks height indicate that the scalar or-
der parameter S and correlation length ξ are greatly affected by n-hexane in the
composites.
Non-linear transition temperature dependence on n-hexane mole fraction in
8CB+hex mixtures is unique as compared to that seen in 8CB+cyclohexane [26].
The authors showed that for 8CB+cyclohexane systems the I-N latent heat re-
mains constant for all the cyclohexane concentrations. Similar behavior is observed
in 8CB+hex system with a nearly constant ac-enthalpy for all n-hexane mole frac-
tions studied. Details of the I-N heat capacity peaks were not published, so
further comparison is not possible. The linear versus non-linear transition temper-
ature behavior in 8CB+cyclohexane and 8CB+hex systems can be accounted in
the following two ways: the first is the linear structure of n-hexane as compared to
cyclohexane ring structure and the second is the procedure of mixing the sample
during the experiment. Our experiments does not involve any stirring of the sam-
ple during the experiment where as the study of 8CB+cyclohexane was done with
continuous stirring of the samples during the experiments, which may wash out
this behavior. Non-stirring effect may produce nanoscale phase separation which
consequently can cause two driving forces to develop in two opposite directions.
These forces probably cause the increment in transition temperature showing non-
linear behavior in the phase diagram. The dash-dot lines in the phase diagram
show the data from reference [26], which indicate the good agreement with our
data in lower hexane concentration regime only but not for higher concentration
regime.
A distinct jump in δH′′IN at xhex ≈ 0.07 is observed that indicates the sudden
change in dynamics of the I-N phase conversion. Since screening is presumably
playing an important role, one measure of this effect is the mean distance between
solvent molecules, l. Assuming that the solvent molecules are uniformly distributed
throughout the mixture, the value of l may be estimated from the specific volume
of the LC and that of the solvent. For 8CB and n-hexane, the specific volume
(volume per particle) are v8CB = 486.14 A3 and vhex = 218.17 A3, respectively.
We assume a linear variation as vmix = v8CB at xhex = 0 to vmix = vhex at xhex = 1
yielding a dependence of vmix(xhex) = −267.97(xhex)+486.14 in units of A3 for the
volume per ‘average’ molecule in the 8CB+hex mixtures. Considering a uniformly
76
distributed n-hexane molecules, each centered in a spherical unit cell, the volume
per molecule can be calculated as vmix = xhex(πl3)/6, the volume of the unit cell
times the number of n-hexane molecules gives the total sample volume divided by
the total number of molecules. Equating these two definitions of vmix gives
l = [(6/π)(vmix(xhex))/(xhex)]1/3 (3.2)
where the linear vmix(xhex) dependence is used. For l smaller than the length-scale
for the LC interaction, approximately the LC molecular length, the screening effect
on the LC interaction potential should dominant. The δH′′IN jump occurs around
at hexane mole fraction of ∼ 0.07 where the mean distance between the hexane
molecules l is found to be approximately equal to 8CB molecular length (≃ 23 A).
The functional dependence of l(xhex) is shown in the lower panel of Fig. 3.5.
We have undertaken a detailed ac-calorimetric study on the effect of non-
mesogenic, low molecular weight solvent (n-hexane) on octylcyanobiphenyl (8CB)
with an emphasis on the weakly first-order I-N phase transition. The dilution of
the liquid crystal causes the decrease in liquid crystal molecular interactions and
change in viscoelastic properties, which consequently gives rise the evolution of the
phase transitions. The results obtained in this work reveal new aspects of the ef-
fect of non-mesogenic disorder on the mesogenic ordering. Non-mesogenic solvents
like n-hexane, could be an important tool to probe and tune intermolecular poten-
tials of liquid crystals. Continued experimental efforts are needed specifically, light
scattering studies probing the nematic elastic constants as a function of solvent
content and temperature would be particulary important and interesting.
Bibliography
[1] P. G. de Gennes and J. Prost, The Physics of Liquid Crystals. Clarendon,
Oxford, England: Oxford University Press, 1993.
[2] G. S. Iannacchione, C. W. Garland, J. T. Mang, and T. P. Rieker Phys. Rev.
E, vol. 58, p. 5966, 1998.
[3] T. Bellini, M. Buscaglia, C. Chiccoli, F. Mantegazza, P. Pasini, and C. Zan-
noni Phys. Rev. Lett., vol. 88, p. 245506(4), 2002.
[4] G. S. Iannacchione, S. Park, C. W. Garland, R. J. Birgeneau, and R. L. Leheny
Phys. Rev. E, vol. 67, p. 011709, 2003.
[5] G. S. Iannacchione, “Review of liquid-crystal phase transitions with quenched
random disorder,” Fluid Phase Equilibria, vol. 222–223, pp. 177–187, 2004.
[6] L. Wu, B. Zhou, C. W. Garland, T. Bellini, and D. W. Schaefer Phys. Rev.
E, vol. 51, p. 2157, 1995.
[7] T. Bellini, L. Radzihosky, J. Toner, and N. A. Clark Science, vol. 294, p. 1074,
2001.
[8] Z. Kutnjak, S. Kralj, G. Lahajnar, and S. Zumer, “Calorimetric study of
octylcyanobiphenyl liquid crystal confined to a controlled-pore glass,” Phy.
Rev. E, vol. 68, p. 021705, 2000.
[9] A. Zidan, G. Lahajnar, and S. Kralj, “Phase transitions in 8cb liquid crys-
tal confined to a controlled-pore glass:deuteron nmr and small angle x-ray
scattering studies,” Appl. Magn. Reson., vol. 27, p. 311, 2004.
77
78
[10] Z. Kutnjak, S. Kralj, G. Lahajnar, and S. Zumer, “Thermal study of octyl-
cyanobiphenyl liquid crystal confined to controlled-pore glass,” Fluid Phase
Equilibria, vol. 222-223, pp. 275–288, 2004.
[11] G. S. Iannacchione and D. Finotello, “Calorimetric study of phase transitions
in confined liquid crystals,” Phys. Rev. Lett., vol. 69, p. 2094, 1992.
[12] S. Qian, G. S. Iannacchione, and D. Finotello, “Critical behavior at the
smectic-a to nematic transition confined to a random network,” Phys. Rev.
E, vol. 53, p. 4291, 1996.
[13] R. Mukhopadhyay, A. Yethiraj, and J. Bechhoefer, “External-field-induced
tricritical point in a fluctuation-driven nematic-smectic- A transition,” Phys.
Rev. Lett., vol. 83, pp. 4796–4799, 1999.
[14] A. Primak, M. Fisch, and S. Kumar, “Critical behavior at the nematic-to-
smectic- A transition in a strong magnetic field,” Phys. Rev. Lett., vol. 88,
p. 035701, 2002.
[15] K. J. Stine and C. W. Garland, “Calorimetric study of nematic to smectic-a
tricritical behavior,” Phys. Rev. A, vol. 39, p. 3148, 1989.
[16] M. B. Sied, J. Salud, D. O. Lopez, M. Barrio, and J. L. Tamarit, “Binary
mixtures of ncb and nocb liquid crystals. two experimental evidences for a
smectic Anematic tricritical point,” Phys. Chem. Chem. Phys., vol. 4, p. 2587,
2002.
[17] M. B. Sied, D. O. Lopez, J. L. Tamarit, and M. Barrio, “Liquid crystal binary
mixtures 8cb+8ocb: critical behaviour at the smecticA-nematic transition,”
Liquid Crystals, vol. 29, pp. 57–66, 2002.
[18] M. G. Lafouresse, M. B. Sied, H. Allouchi, D. O. Lopez, J. Salud, and J. L.
Tamarit, “On the nature of the smectic mesophase in 8cb + 10cb binary
mixtures. evidences for a smectic-A to nematic tricritical point,” Chem. Phys.
Lett., vol. 376, p. 188, 2003.
79
[19] J.-C. Loudet, P. Barois, and P. Poulin, “Colloidal ordering from phase sepa-
ration in a liquid- crystalline continuous phase,” Nature, vol. 407, pp. 611–13,
2000.
[20] J. Yamamoto and H. Tanaka, “Transparent nematic phase in a liquid-crystal-
based microemulsion,” Nature, vol. 409, pp. 321–25, 2001.
[21] M. Caggioni, A. Giacometti, T. Bellini, N. A. Clark, F. Mantegazza, and
A. Maritan, “Pretransitional behavior of a water in liquid crystal microemul-
sion close to the demixing transition: Evidence for intermicellar attraction
mediated by paranematic fluctuations,” J. Chem. Phys., vol. 122, p. 214721,
2005.
[22] T. P. Rieker, “Organic lyotropic lamellar liquid crystal,” Liquid Crystals,
vol. 19, p. 497, 1995.
[23] S. DasGupta and S. K. Roy, “The bend elastic constant in a mixture of 4,4’-
n-octyl-cyanobiphenyl and biphenyl,” Phys. Lett. A, vol. 288, pp. 323–328,
2001.
[24] P. K. Mukherjee, “Effect of nonmesogenic solute on the nematic-smectic-A
phase transition,” J. Chem. Phys., vol. 116, pp. 9531–9536, 2002.
[25] K. Denolf, B. V. Roie, C. Glorienx, and J. Thoen, “Effect of nonmesogenic
impurities on the order of the nematic to smectic-A phase transition in liquid
crystals,” Phys. Rev. Lett., vol. 97, p. 107801, 2006.
[26] K. Denolf, G. Cordoyiannis, C. Glorienx, and J. Thoen, “Effect of non-
mesogenic impurities on the liquid crystalline phase transitions of octyl-
cyanobiphenyl,” Phys. Rev. E, vol. 76, p. 051702, 2007.
[27] P. F. Sullivan and G. Seidel, “Steady-state ac-temperature calorimetry,” Phys.
Rev., vol. 173, pp. 679–685, 1968.
[28] D. Finotello, S. Qian, and G. S. Iannacchione, “Ac calorimetrie studies of
phase transitions in porous substrates. superfluid helium and liquid crystals,”
Thermochimica Acta, vol. 304–305, pp. 303–316, 1997.
80
[29] H. Yao and C. W. Garland, “Nonadiabatic scanning calorimeter,” Rev. Sci.
Instrum., vol. 69, p. 172, 1998.
[30] A. Roshi, G. S. Iannacchione, P. S. Clegg, and R. J. Birgeneau, “Evolution
of the isotropic-to-nematic phase transition in octyloxycyanobiphenyl-aerosil
dispersions,” Phys. Rev. E, vol. 69, p. 031703, 2004.
[31] B. Zhou, G. S. Iannacchione, and C. W. Garland, “Random-field effects on
the nematicsmectic-a phase transition due to silica aerosil particless,” Phys.
Rev. E, vol. 55, p. 2962, 1997.
Chapter 4Nematic to smectic-A phase
transition in octylcyanobiphenyl and
hexane binary mixtures
4.1 Introduction
The phase transition between the nematic and smectic-A (N -SmA) phases is inter-
esting and important because it involves the breaking of a continuous symmetry as
well as belonging to the same universality class as the superconducting transition
in metals and the superfluid transition in 4He. The N -SmA transition has been
used as a model phase transition for the study of confinement and disorder effects
[1, 2, 3]. The phase transition behavior is also sensitive to an applied external elec-
tric or magnetic field [4, 5] as well as with LC+LC mixtures [6, 7, 8, 9, 10]. Even
though the N -SmA transition has been extensively studied [11], there remains
some unresolved issues regarding the fundamental nature of the transition.
Recently, attention has been drawn to the study of miscible mixtures of liquid
crystals and non-mesogenic, low-molecular weight, solvents as a way of exploring
the fundamental nature of the LC interactions responsible for mesogenic order,
critical behavior, and the tuning of viscoelastic properties [12, 13, 14, 15, 16].
X-ray diffraction experiments performed on the smectic-A and smectic-C phases
of thermotropic liquid crystals doped with an organic solvent have shown that
the smectic layer spacing increases with solvent content [16]. This research also
81
82
demonstrated the formation of an organic lyotropic lamellar liquid crystal phase
in which the solvent molecules largely intercalate between the smectic layers of
the LC. It was also mentioned that from a visual inspection of octylcyanobiphenyl
(8CB) and n-hexane (hex) mixtures that the solvent was not uniformly distributed
throughout the host LC and minimal, non-reproducible, swelling of smectic layers
occurred for solvent volume fractions ≥ 0.1. It was then suggested that the amount
of solvent that can be miscibly incorporated in an LC depends on the host LC,
temperature, as well as the nature and amount of solvent; noting that the 8CB+hex
mixture phase separates for a solvent to liquid crystal mole ratio & 0.1. Other
studies of the effect of a biphenyl solvent on the splay and bend elastic constants
and the rotational viscosity coefficient observed an anomalous behavior of the
splay elastic constant K11, the dielectric anisotropy ∆ε, and the effective rotational
viscosity coefficient γ∗1 near the N -SmA transition [17]. A theoretical study on the
influence of non-mesogenic solvent on the N -SmA phase transition using Landau
approach found a concentration induced tricritical point for the N -SmA transition
and that the Frank elastic constants K11, K22, and K33 are modified as a function
of solvent concentration near the N -SmA phase transition [14].
A recent calorimetric study of the N -SmA transition in mixtures of 8CB and
cyclohexane (8CB+chex) was performed under continuous stirring conditions [12].
This study found a linear decrease of the transition temperatures TNA and a lin-
ear increase of critical heat capacity exponent α with increasing mole fraction of
cyclohexane xchex. This behavior ends at a tricritical point (TCP) where the tran-
sition becomes first-order at xTCPchex = 0.046, just below which α = 0.5 and the
nematic range ∆TN = TIN − TNA = 4.8 K. For xchex > xTCPchex , the N -SmA latent
heat smoothly increases non-linearly from zero [12]. This work also presented a
theoretical effort to understand the linear transition temperature shift along the
same lines as Ref [14].
To review the relevant concepts, the N -SmA phase transition is a non-trivial
member of the 3D-XY universality class due to the anisotropy of its critical fluctu-
ations parallel and perpendicular to the director [11, 18, 19]. The N -SmA critical
behavior is strongly effected by the coupling between the smectic order parameter
ψ(r) = ψ0 exp(iq0.r) and the nematic order parameter Qij = (1/2)S (3ninj − δij).
Here, the ψ is the amplitude of the one-dimensional density wave, ρ(r) = Re[ρ0 +
83
exp(iq0.r)ψ(r)], q0 = 2π/d is the wave vector corresponding to the layer spacing d,
S is a scalar parameter measuring the magnitude of orientational order on short
length scales, and n is the nematic director describing spatial orientation of the
orientational axis on longer length scales. The δS and δn couplings introduce two
more terms in free energy expression as compared to the usual standard form. One
term is of the form ψ2S, which is nematic-smectic order parameter coupling [20, 21]
and the other is smectic order-nematic director fluctuation coupling ψ2δn [22, 23].
The former coupling reveals the effects of the elasticity of the nematic order prior
to the onset of the smectic order and can drive the N -SmA transition from XY like
to tricritical to weakly first-order [24]. The coupling ψ2δn causes the anisotropic
elastic deformations in the smectic. The strength of this coupling depends on the
magnitude of the splay elastic constant K11, which is directly proportional to S2.
Since it is expected that a low-molecular weight solvent miscible in an LC would
affect both δS and δn fluctuations, the xsol dependence would be accounted for
using similar terms in a free-energy expansion.
In this work, the effect of a non-mesogenic, low molecular weight, solvent (n-
hexane) on the continuous nematic to smectic-A (N -SmA) phase transition on
octylcyanobiphenyl (8CB) and n-hexane (hex) binary mixtures (8CB+hex) as a
function of n-hexane mole fraction, xhex, was studied using high-resolution ac-
calorimetry without continuous stirring. This was done so as not to mask demix-
ing or phase separation effects. The introduction of n-hexane on 8CB causes a
dramatic change in the N -SmA phase transition behavior. The heat capacity
peak associated with the N -SmA transition, δCp, shifts towards lower temperature
non-monotonically and becomes progressively larger as the hexane concentration
increases. The dispersive part of heat capacity C′′p associated with the N -SmA
transition abruptly appears as a peak for xhex ≥ 0.08 but is zero for xhex ≤ 0.06
indicating a crossover from continuous (second-order) behavior to first-order be-
havior for the N -SmA transition with a tricritical point at xTCPhex ≈ 0.07. The
integrated ac-enthalpy increases overall as a function of hexane molar fraction. A
simple but consistently applied power-law analysis for δCp with xhex ≤ 0.06 find a
non-linear increase in the heat capacity effective critical exponent towards the tri-
critical value (αTCP = 0.50) as xhex → xTCPhex is observed. A small hysteresis of the
δCp shape between heating and cooling is seen and is likely due to a microscopic
84
phase separation of the solvent, perhaps into intersticial region between smectic
layers. The non-monotonic transition temperature shift and extended curvature of
αeff behavior with extended curvature as xhex → xTCPhex as compared to the linear
behavior seen in the previous study on continuously mixed 8CB+chex samples [12]
may be due to the competing interactions of microphase separation and dilution
effects. Both these effects have significant consequences on the higher temperature
I-N phase transition as well and has been previously reported in chapter 3.
4.2 Results
4.2.1 The N-SmA Heat Capacity
The liquid crystal octylcyanobiphenyl, 8CB, has a molecular mass ofMw = 291.44 g mol−1
and a density of ρLC = 0.996 g ml−1 at 300 K. A single batch of 8CB, purchased
from Frinton Lab, was degassed under vacuum for about two hours in the isotropic
phase before use for pure and mixture samples. Spectroscopic grade n-hexane
(molecular mass of 86.18 g mol−1 and a density of 0.655 g ml−1 at 298 K with
a boiling point of 342 K) purchased from EM Science was used without further
purification. The 8CB and n-hexane mixtures appear to be miscible up to an n-
hexane mole fraction of ≤ 0.12. This was confirmed by polarizing micrographs of
the samples and is consistent with the miscibility limit mentioned by Rieker [16].
Measurements were performed on seven samples as a function of n-hexane mole
fraction xhex ranging from 0 (pure 8CB) to 0.12.
Figure 4.1 illustrates the specific heat capacity variation over an extended tem-
perature range for the xhex = 0.02 sample. The dashed curve under the N -SmA
heat capacity peak represents the I-N specific heat capacity wing Cwingp , which is
the hypothetical baseline behavior of Cp in the absence of the N -SmA transition.
This wing is used to determine the excess specific heat associated with the N -SmA
phase transition as
δCp = Cp − Cwingp . (4.1)
The resulting δCp data of the N -SmA transition on heating for 8CB+hex and
pure 8CB samples over a ±1.5 K temperature range window about the δCp peak
is shown in Fig. 4.2 (upper panel). As the mole fraction of n-hexane increases,
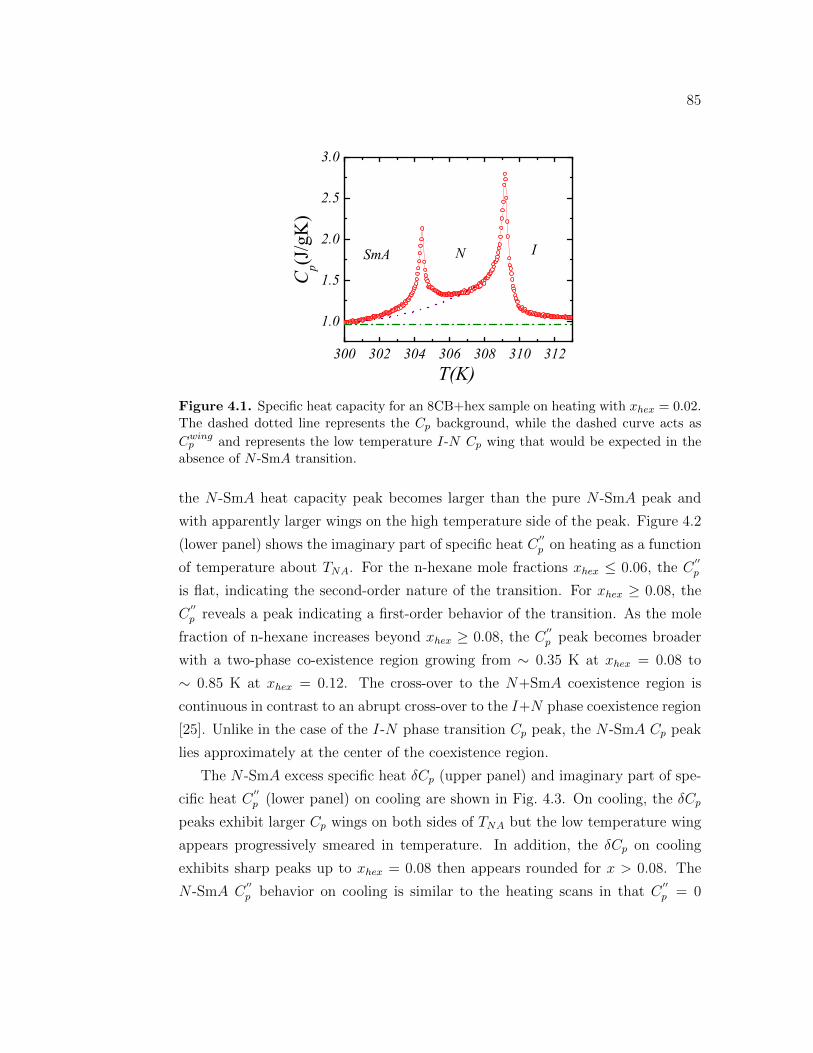
85
300 302 304 306 308 310 312
1.0
1.5
2.0
2.5
3.0
SmA N I
Cp(J
/gK
)
T(K)Figure 4.1. Specific heat capacity for an 8CB+hex sample on heating with xhex = 0.02.The dashed dotted line represents the Cp background, while the dashed curve acts as
Cwingp and represents the low temperature I-N Cp wing that would be expected in the
absence of N -SmA transition.
the N -SmA heat capacity peak becomes larger than the pure N -SmA peak and
with apparently larger wings on the high temperature side of the peak. Figure 4.2
(lower panel) shows the imaginary part of specific heat C′′p on heating as a function
of temperature about TNA. For the n-hexane mole fractions xhex ≤ 0.06, the C′′p
is flat, indicating the second-order nature of the transition. For xhex ≥ 0.08, the
C′′p reveals a peak indicating a first-order behavior of the transition. As the mole
fraction of n-hexane increases beyond xhex ≥ 0.08, the C′′p peak becomes broader
with a two-phase co-existence region growing from ∼ 0.35 K at xhex = 0.08 to
∼ 0.85 K at xhex = 0.12. The cross-over to the N+SmA coexistence region is
continuous in contrast to an abrupt cross-over to the I+N phase coexistence region
[25]. Unlike in the case of the I-N phase transition Cp peak, the N -SmA Cp peak
lies approximately at the center of the coexistence region.
The N -SmA excess specific heat δCp (upper panel) and imaginary part of spe-
cific heat C′′p (lower panel) on cooling are shown in Fig. 4.3. On cooling, the δCp
peaks exhibit larger Cp wings on both sides of TNA but the low temperature wing
appears progressively smeared in temperature. In addition, the δCp on cooling
exhibits sharp peaks up to xhex = 0.08 then appears rounded for x > 0.08. The
N -SmA C′′p behavior on cooling is similar to the heating scans in that C
′′p = 0
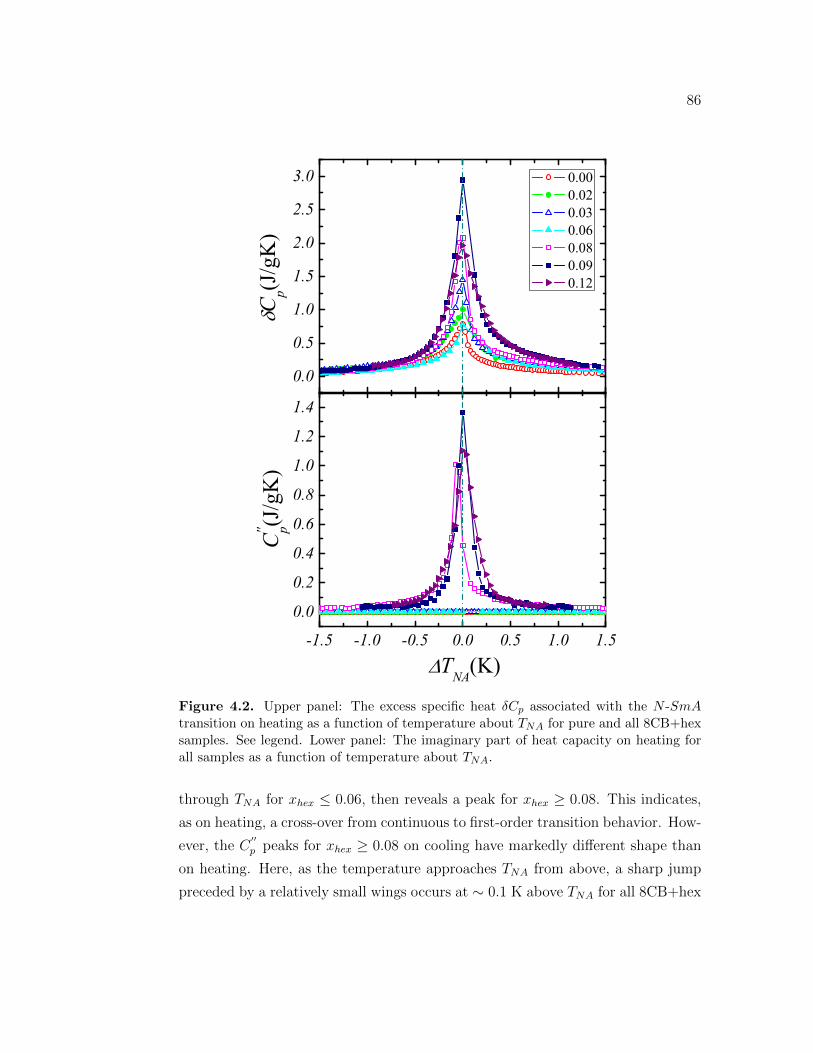
86
-1.5 -1.0 -0.5 0.0 0.5 1.0 1.5
0.0
0.2
0.4
0.6
0.8
1.0
1.2
1.4
TNA(K)
0.0
0.5
1.0
1.5
2.0
2.5
3.0
C'' p(J
/gK
)
Cp(J
/gK
)
0.00 0.02 0.03 0.06 0.08 0.09 0.12
Figure 4.2. Upper panel: The excess specific heat δCp associated with the N -SmAtransition on heating as a function of temperature about TNA for pure and all 8CB+hexsamples. See legend. Lower panel: The imaginary part of heat capacity on heating forall samples as a function of temperature about TNA.
through TNA for xhex ≤ 0.06, then reveals a peak for xhex ≥ 0.08. This indicates,
as on heating, a cross-over from continuous to first-order transition behavior. How-
ever, the C′′p peaks for xhex ≥ 0.08 on cooling have markedly different shape than
on heating. Here, as the temperature approaches TNA from above, a sharp jump
preceded by a relatively small wings occurs at ∼ 0.1 K above TNA for all 8CB+hex
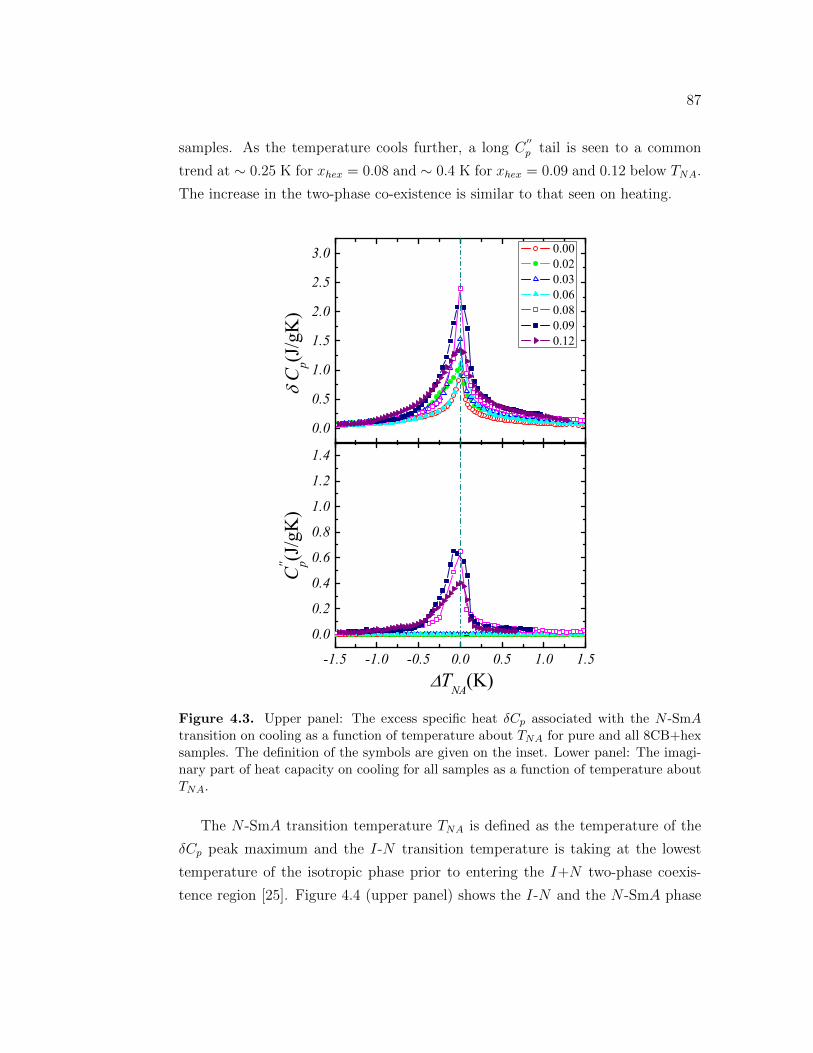
87
samples. As the temperature cools further, a long C′′p tail is seen to a common
trend at ∼ 0.25 K for xhex = 0.08 and ∼ 0.4 K for xhex = 0.09 and 0.12 below TNA.
The increase in the two-phase co-existence is similar to that seen on heating.
-1.5 -1.0 -0.5 0.0 0.5 1.0 1.5
0.0
0.2
0.4
0.6
0.8
1.0
1.2
1.4
TNA(K)
C'' p(J
/gK
)
0.0
0.5
1.0
1.5
2.0
2.5
3.0
C
p(J/g
K)
0.00 0.02 0.03 0.06 0.08 0.09 0.12
Figure 4.3. Upper panel: The excess specific heat δCp associated with the N -SmAtransition on cooling as a function of temperature about TNA for pure and all 8CB+hexsamples. The definition of the symbols are given on the inset. Lower panel: The imagi-nary part of heat capacity on cooling for all samples as a function of temperature aboutTNA.
The N -SmA transition temperature TNA is defined as the temperature of the
δCp peak maximum and the I-N transition temperature is taking at the lowest
temperature of the isotropic phase prior to entering the I+N two-phase coexis-
tence region [25]. Figure 4.4 (upper panel) shows the I-N and the N -SmA phase
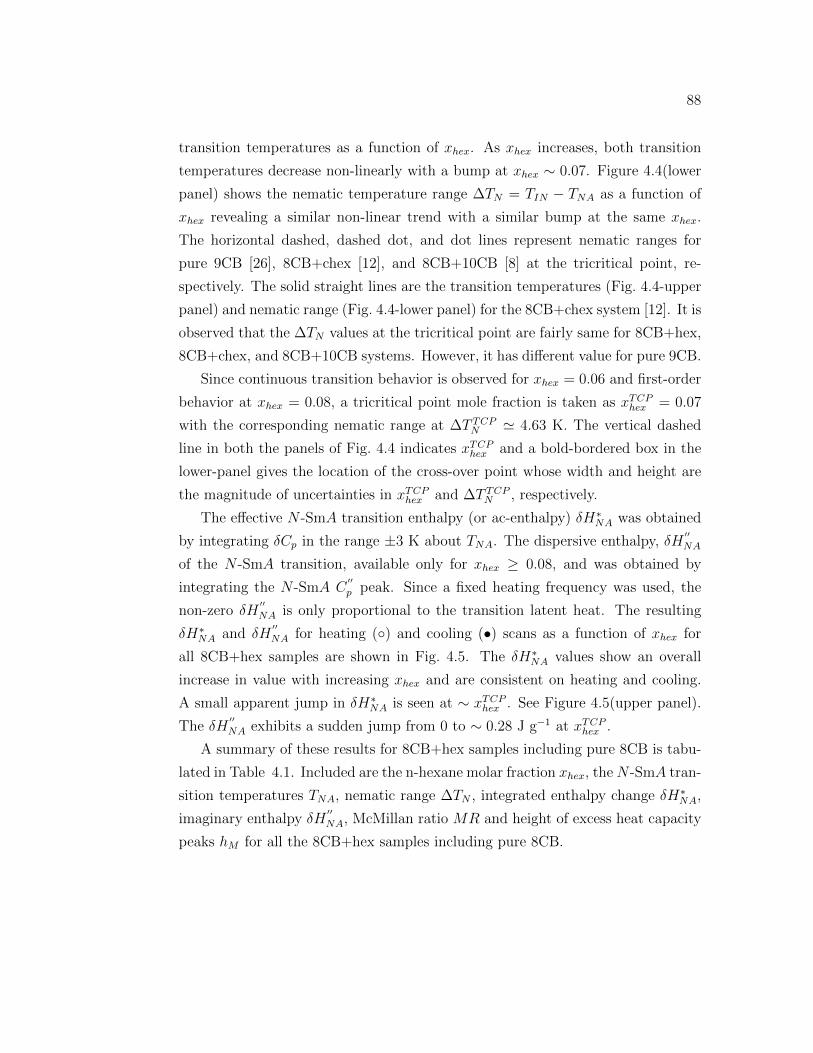
88
transition temperatures as a function of xhex. As xhex increases, both transition
temperatures decrease non-linearly with a bump at xhex ∼ 0.07. Figure 4.4(lower
panel) shows the nematic temperature range ∆TN = TIN − TNA as a function of
xhex revealing a similar non-linear trend with a similar bump at the same xhex.
The horizontal dashed, dashed dot, and dot lines represent nematic ranges for
pure 9CB [26], 8CB+chex [12], and 8CB+10CB [8] at the tricritical point, re-
spectively. The solid straight lines are the transition temperatures (Fig. 4.4-upper
panel) and nematic range (Fig. 4.4-lower panel) for the 8CB+chex system [12]. It is
observed that the ∆TN values at the tricritical point are fairly same for 8CB+hex,
8CB+chex, and 8CB+10CB systems. However, it has different value for pure 9CB.
Since continuous transition behavior is observed for xhex = 0.06 and first-order
behavior at xhex = 0.08, a tricritical point mole fraction is taken as xTCPhex = 0.07
with the corresponding nematic range at ∆T TCPN ≃ 4.63 K. The vertical dashed
line in both the panels of Fig. 4.4 indicates xTCPhex and a bold-bordered box in the
lower-panel gives the location of the cross-over point whose width and height are
the magnitude of uncertainties in xTCPhex and ∆T TCP
N , respectively.
The effective N -SmA transition enthalpy (or ac-enthalpy) δH∗NA was obtained
by integrating δCp in the range ±3 K about TNA. The dispersive enthalpy, δH′′NA
of the N -SmA transition, available only for xhex ≥ 0.08, and was obtained by
integrating the N -SmA C′′p peak. Since a fixed heating frequency was used, the
non-zero δH′′NA is only proportional to the transition latent heat. The resulting
δH∗NA and δH′′NA for heating () and cooling (•) scans as a function of xhex for
all 8CB+hex samples are shown in Fig. 4.5. The δH∗NA values show an overall
increase in value with increasing xhex and are consistent on heating and cooling.
A small apparent jump in δH∗NA is seen at ∼ xTCPhex . See Figure 4.5(upper panel).
The δH′′NA exhibits a sudden jump from 0 to ∼ 0.28 J g−1 at xTCP
hex .
A summary of these results for 8CB+hex samples including pure 8CB is tabu-
lated in Table 4.1. Included are the n-hexane molar fraction xhex, theN -SmA tran-
sition temperatures TNA, nematic range ∆TN , integrated enthalpy change δH∗NA,
imaginary enthalpy δH′′NA, McMillan ratio MR and height of excess heat capacity
peaks hM for all the 8CB+hex samples including pure 8CB.
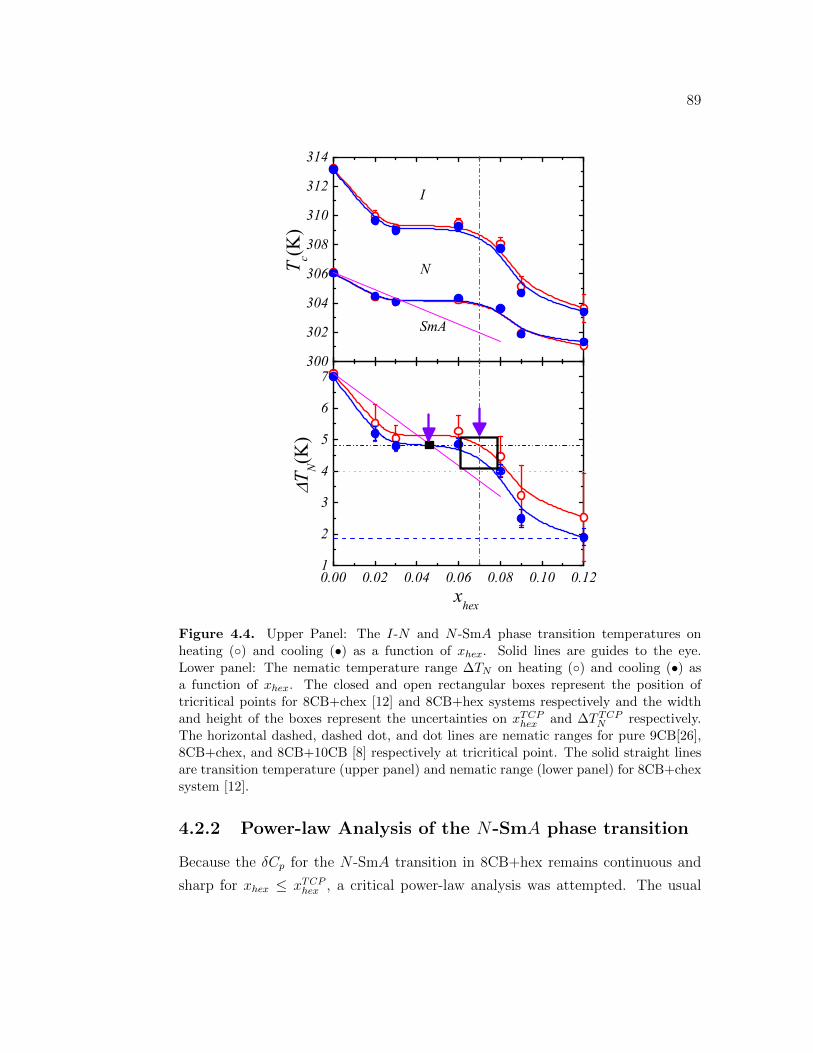
89
0.00 0.02 0.04 0.06 0.08 0.10 0.121
2
3
4
5
6
7300
302
304
306
308
310
312
314
xhex
T N(K
)
T c(K
)
I
N
SmA
Figure 4.4. Upper Panel: The I-N and N -SmA phase transition temperatures onheating () and cooling (•) as a function of xhex. Solid lines are guides to the eye.Lower panel: The nematic temperature range ∆TN on heating () and cooling (•) asa function of xhex. The closed and open rectangular boxes represent the position oftricritical points for 8CB+chex [12] and 8CB+hex systems respectively and the widthand height of the boxes represent the uncertainties on xTCP
hex and ∆T TCPN respectively.
The horizontal dashed, dashed dot, and dot lines are nematic ranges for pure 9CB[26],8CB+chex, and 8CB+10CB [8] respectively at tricritical point. The solid straight linesare transition temperature (upper panel) and nematic range (lower panel) for 8CB+chexsystem [12].
4.2.2 Power-law Analysis of the N-SmA phase transition
Because the δCp for the N -SmA transition in 8CB+hex remains continuous and
sharp for xhex ≤ xTCPhex , a critical power-law analysis was attempted. The usual
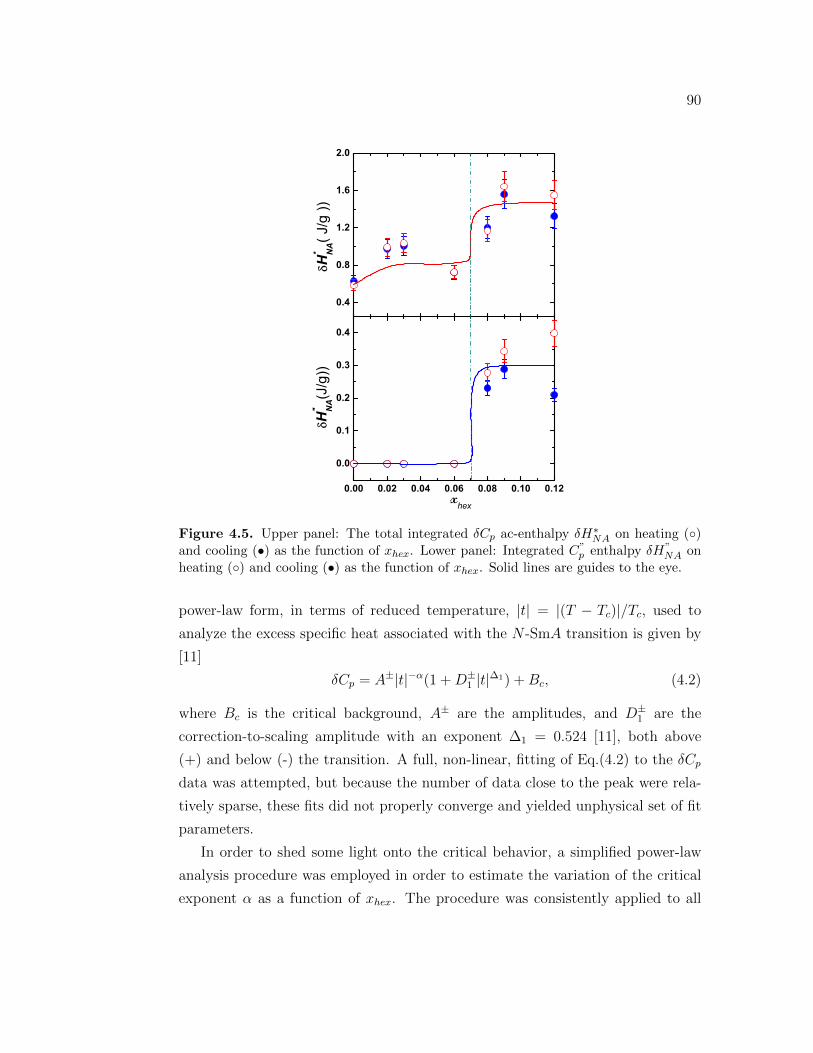
90
0.00 0.02 0.04 0.06 0.08 0.10 0.12
0.0
0.1
0.2
0.3
0.4
0.4
0.8
1.2
1.6
2.0
xhex
H" NA(J
/g))
H
* NA( J
/g ))
Figure 4.5. Upper panel: The total integrated δCp ac-enthalpy δH∗NA on heating ()and cooling (•) as the function of xhex. Lower panel: Integrated C”
p enthalpy δH”NA on
heating () and cooling (•) as the function of xhex. Solid lines are guides to the eye.
power-law form, in terms of reduced temperature, |t| = |(T − Tc)|/Tc, used to
analyze the excess specific heat associated with the N -SmA transition is given by
[11]
δCp = A±|t|−α(1 +D±1 |t|∆1) +Bc, (4.2)
where Bc is the critical background, A± are the amplitudes, and D±1 are the
correction-to-scaling amplitude with an exponent ∆1 = 0.524 [11], both above
(+) and below (-) the transition. A full, non-linear, fitting of Eq.(4.2) to the δCp
data was attempted, but because the number of data close to the peak were rela-
tively sparse, these fits did not properly converge and yielded unphysical set of fit
parameters.
In order to shed some light onto the critical behavior, a simplified power-law
analysis procedure was employed in order to estimate the variation of the critical
exponent α as a function of xhex. The procedure was consistently applied to all
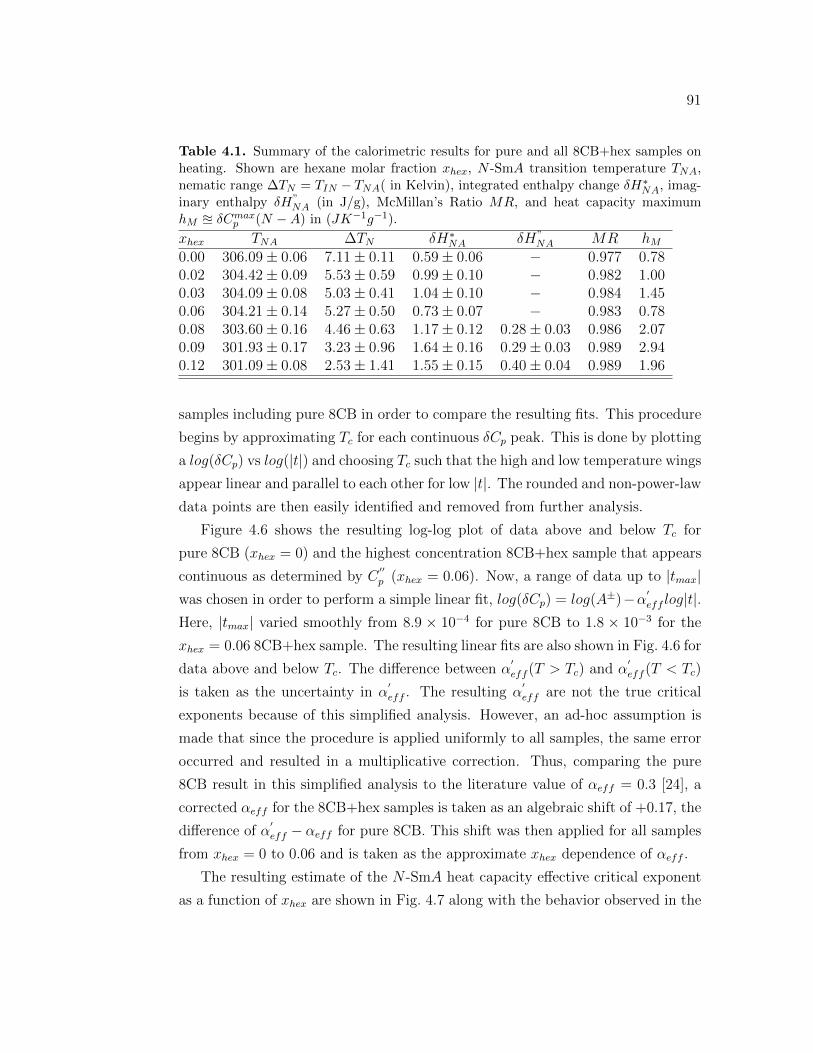
91
Table 4.1. Summary of the calorimetric results for pure and all 8CB+hex samples onheating. Shown are hexane molar fraction xhex, N -SmA transition temperature TNA,nematic range ∆TN = TIN − TNA( in Kelvin), integrated enthalpy change δH∗NA, imag-inary enthalpy δH”
NA (in J/g), McMillan’s Ratio MR, and heat capacity maximumhM u δCmax
p (N − A) in (JK−1g−1).
xhex TNA ∆TN δH∗NA δH”NA MR hM
0.00 306.09 ± 0.06 7.11 ± 0.11 0.59 ± 0.06 − 0.977 0.780.02 304.42 ± 0.09 5.53 ± 0.59 0.99 ± 0.10 − 0.982 1.000.03 304.09 ± 0.08 5.03 ± 0.41 1.04 ± 0.10 − 0.984 1.450.06 304.21 ± 0.14 5.27 ± 0.50 0.73 ± 0.07 − 0.983 0.780.08 303.60 ± 0.16 4.46 ± 0.63 1.17 ± 0.12 0.28 ± 0.03 0.986 2.070.09 301.93 ± 0.17 3.23 ± 0.96 1.64 ± 0.16 0.29 ± 0.03 0.989 2.940.12 301.09 ± 0.08 2.53 ± 1.41 1.55 ± 0.15 0.40 ± 0.04 0.989 1.96
samples including pure 8CB in order to compare the resulting fits. This procedure
begins by approximating Tc for each continuous δCp peak. This is done by plotting
a log(δCp) vs log(|t|) and choosing Tc such that the high and low temperature wings
appear linear and parallel to each other for low |t|. The rounded and non-power-law
data points are then easily identified and removed from further analysis.
Figure 4.6 shows the resulting log-log plot of data above and below Tc for
pure 8CB (xhex = 0) and the highest concentration 8CB+hex sample that appears
continuous as determined by C′′p (xhex = 0.06). Now, a range of data up to |tmax|
was chosen in order to perform a simple linear fit, log(δCp) = log(A±)−α′eff log|t|.
Here, |tmax| varied smoothly from 8.9 × 10⁻⁴ for pure 8CB to 1.8 × 10⁻³ for the
xhex = 0.06 8CB+hex sample. The resulting linear fits are also shown in Fig. 4.6 for
data above and below Tc. The difference between α′eff (T > Tc) and α
′eff (T < Tc)
is taken as the uncertainty in α′eff . The resulting α
′eff are not the true critical
exponents because of this simplified analysis. However, an ad-hoc assumption is
made that since the procedure is applied uniformly to all samples, the same error
occurred and resulted in a multiplicative correction. Thus, comparing the pure
8CB result in this simplified analysis to the literature value of αeff = 0.3 [24], a
corrected αeff for the 8CB+hex samples is taken as an algebraic shift of +0.17, the
difference of α′eff − αeff for pure 8CB. This shift was then applied for all samples
from xhex = 0 to 0.06 and is taken as the approximate xhex dependence of αeff .
The resulting estimate of the N -SmA heat capacity effective critical exponent
as a function of xhex are shown in Fig. 4.7 along with the behavior observed in the
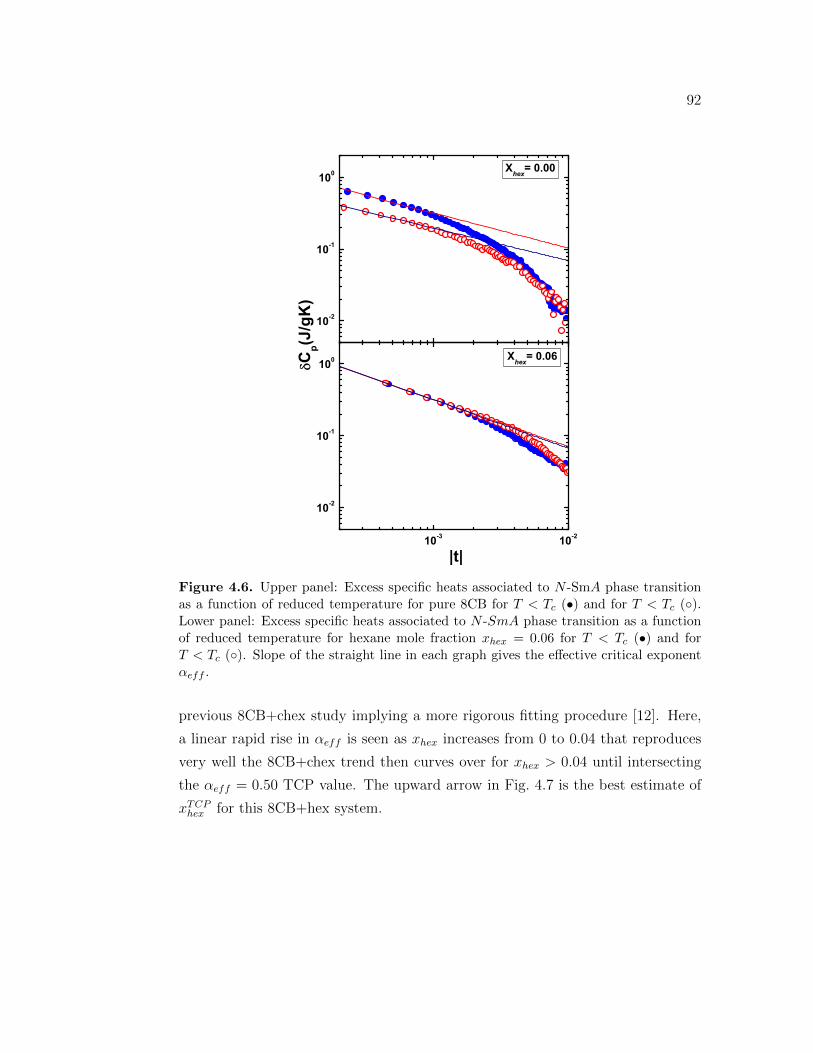
92
10-3 10-2
10-2
10-1
100 Xhex= 0.06
|t|
10-2
10-1
100 Xhex= 0.00
C
p(J/g
K)
Figure 4.6. Upper panel: Excess specific heats associated to N -SmA phase transitionas a function of reduced temperature for pure 8CB for T < Tc (•) and for T < Tc ().Lower panel: Excess specific heats associated to N -SmA phase transition as a functionof reduced temperature for hexane mole fraction xhex = 0.06 for T < Tc (•) and forT < Tc (). Slope of the straight line in each graph gives the effective critical exponentαeff .
previous 8CB+chex study implying a more rigorous fitting procedure [12]. Here,
a linear rapid rise in αeff is seen as xhex increases from 0 to 0.04 that reproduces
very well the 8CB+chex trend then curves over for xhex > 0.04 until intersecting
the αeff = 0.50 TCP value. The upward arrow in Fig. 4.7 is the best estimate of
xTCPhex for this 8CB+hex system.
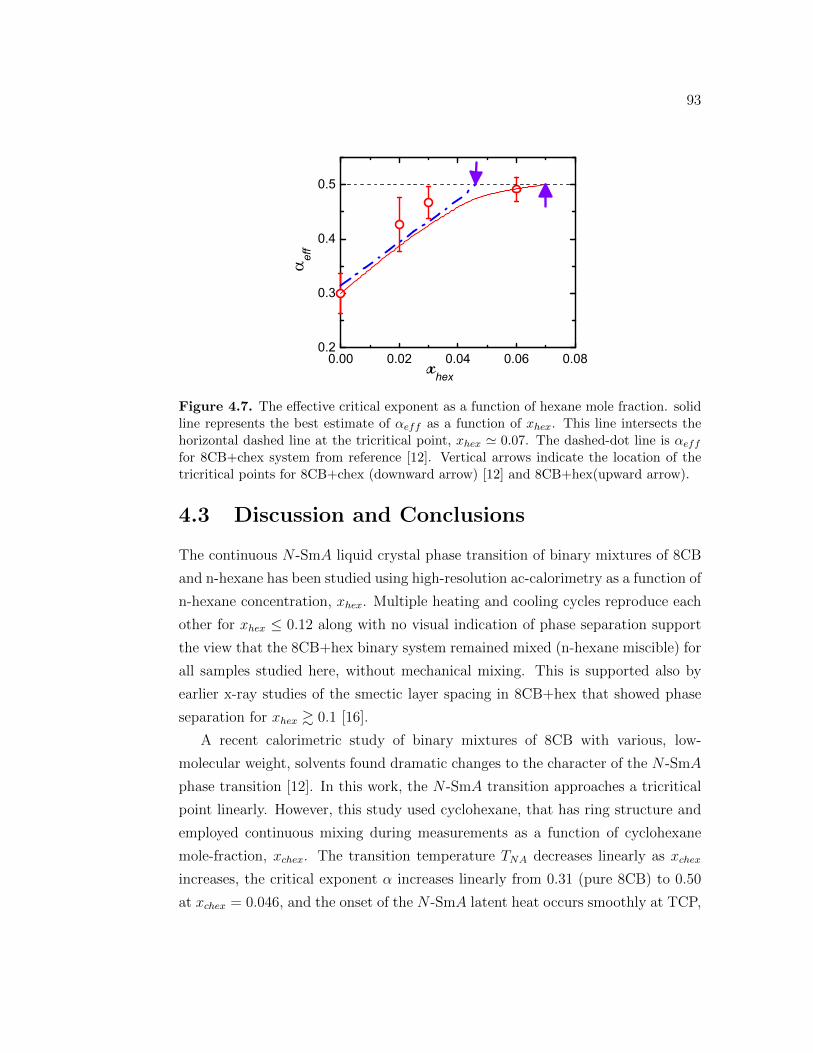
93
0.00 0.02 0.04 0.06 0.080.2
0.3
0.4
0.5
xhex
eff
Figure 4.7. The effective critical exponent as a function of hexane mole fraction. solidline represents the best estimate of αeff as a function of xhex. This line intersects thehorizontal dashed line at the tricritical point, xhex ≃ 0.07. The dashed-dot line is αeff
for 8CB+chex system from reference [12]. Vertical arrows indicate the location of thetricritical points for 8CB+chex (downward arrow) [12] and 8CB+hex(upward arrow).
4.3 Discussion and Conclusions
The continuous N -SmA liquid crystal phase transition of binary mixtures of 8CB
and n-hexane has been studied using high-resolution ac-calorimetry as a function of
n-hexane concentration, xhex. Multiple heating and cooling cycles reproduce each
other for xhex ≤ 0.12 along with no visual indication of phase separation support
the view that the 8CB+hex binary system remained mixed (n-hexane miscible) for
all samples studied here, without mechanical mixing. This is supported also by
earlier x-ray studies of the smectic layer spacing in 8CB+hex that showed phase
separation for xhex & 0.1 [16].
A recent calorimetric study of binary mixtures of 8CB with various, low-
molecular weight, solvents found dramatic changes to the character of the N -SmA
phase transition [12]. In this work, the N -SmA transition approaches a tricritical
point linearly. However, this study used cyclohexane, that has ring structure and
employed continuous mixing during measurements as a function of cyclohexane
mole-fraction, xchex. The transition temperature TNA decreases linearly as xchex
increases, the critical exponent α increases linearly from 0.31 (pure 8CB) to 0.50
at xchex = 0.046, and the onset of the N -SmA latent heat occurs smoothly at TCP,
94
xTCPchex = 0.046. These results were modelled using mean-field Landau-de Gennes
theory incorporating the nematic free-energy, smectic free-energy, and a coupling
between nematic and smectic order parameters. This model was extended to ac-
count for the solvent by adding a solvent mole-fraction coupling to ψ2 and to ψ2δS
to the total solvent free-energy. Similar results were found in 8CB+biphenyl bi-
nary mixtures and a Landau-de Gennes model that accounted for change in the
LC elastic constants with xsol. However, a TCP was not found in 8CB+biphenyl
system [17].
In this present study, several important differences emerge. As xhex increases,
TNA decreases as well as the nematic range ∆TN in a non-linear way. The character
of N -SmA transition remains continuous up to xhex ≃ 0.07 where it appears to
jump suddenly to a first-order transition. The bump in TNA and ∆TN as well
as the jump in δH”NA all occur at xTCP
hex . The critical behavior, estimated by
the simple power-law analysis presented here, evolves with αeff initially increases
linearly as in the 8CB+chex system but then curves over to reach αeff = 0.50 at
xhex → xTCPhex . Qualitatively, the correction-to-scaling terms D± and the amplitude
ratio A−/A+ are changing their values towards the tricritical values as a function
of xhex. Here, the qualitative measurement of the amplitude ratio A−/A+ was
extracted examining the gap between two slope lines of the linear fit of log-log plot
of δCp vs |t| (Fig. 4.6) and the curvature of the curve at high |t| was observed to
get qualitative measure of D±.
The addition of n-hexane in 8CB may be thought of as a random dilution
effect, decreasing both the transition temperature TNA and the nematic range
∆TNA accordingly. A key point to remember is that these experiments were done
without continuous stirring and so should have revealed any effect of macroscopic
phase separation, which was not observed. However, phase separation on much
shorter micro- and/or nano-scale, such as intercalation of the solvent between the
smectic layers, is certainly possible. These dilution and microphase separation
effects, may lead to two competing interactions causing the non-linearity in the
transition temperature TNA, nematic range ∆TN , effective critical exponent αeff
and jump in the imaginary enthalpy δH′′NA. The microphase separation promotes
bulk-like behavior while the random dilution is a strong suppressor of any transition
behavior and their superposition need not be linear. These effects also cause the
95
change in coupling between the order parameters ψ and Q which consequently
change the order of the N -SmA phase transition from continuous to first order
with a critical point at xTCPhex ≃ 0.07.
We have undertaken a detailed calorimetric studies on the effect of non- meso-
genic, low molecular weight solvent (hexane) on octylcyanobiphenyl (8CB) phase
transitions with emphasis on the most extensively studied but controversial N -
SmA phase transition. The dilution of 8CB due to the addition of n-hexane causes
the change in the liquid crystal molecular interactions. Interesting and striking ef-
fects are observed in 8CB+hex system including the observation of nearly the same
tricritical nematic range for 8CB+hex as that for 8CB+chex, and 8CB+10CB sys-
tems. But the nematic range for pure 9CB, which is very nearly at TCP, is quite
different. This does not appear accidental and raises important questions as to
the underlying physics. Continued research efforts are needed to understand the
behavior of the such LC+solvent mixture systems as a model system for the in-
termolecular interactions responsible for mesogenic order. In particular, detailed
scattering experiments such as x-ray or neutron as a function of solvent concen-
tration and temperature through the N -SmA transition would be most desirable
to explore the critical behavior of the smectic correlation length as susceptibility.
Bibliography
[1] T. Bellini, L. Radzihosky, J. Toner, and N. A. Clark Science, vol. 294, p. 1074,
2001.
[2] G. S. Iannacchione, “Review of liquid-crystal phase transitions with quenched
random disorder,” Fluid Phase Equilibria, vol. 222/223, pp. 177–187, 2004.
[3] F. Cruceanu, D. Liang, R. L. Leheny, C. W. Garland, and G. S. Iannacchione,
“High-resolution calorimetric study of the nematic to smectic-A transition in
aligned liquid crystal+aerosil gels,” Phys. Rev. E, vol. 79, p. 011710, 2009.
[4] R. Mukhopadhyay, A. Yethiraj, and J. Bechhoefer, “External-field-induced
tricritical point in a fluctuation-driven nematic˘smectic- A transition,” Phys.
Rev. Lett., vol. 83, pp. 4796–4799, 1999.
[5] A. Primak, M. Fisch, and S. Kumar, “Critical behavior at the nematic-to-
smectic- a transition in a strong magnetic field,” Phys. Rev. Lett., vol. 88,
p. 035701, 2002.
[6] K. J. Stine and C. W. Garland, “Calorimetric study of nematic to smectic A
tricritical behavior,” Phys. Rev. A, vol. 39, p. 3148, 1989.
[7] M. B. Sied, J. Salud, D. O. Lopez, M. Barrio, and J. L. Tamarit Phys. Chem.
Chem. Phys., vol. 4, p. 2587, 2002.
[8] M. G. Lafouresse, M. B. Sied, H. Allouchi, D. O. Lopez, J. Salud, and J. L.
Tamarit Chem. Phys. Lett., vol. 376, p. 188, 2003.
96
97
[9] M. B. Sied, D. O. Lopez, J. L. Tamarit, and M. Barrio, “Liquid crystal binary
mixtures 8cb+8ocb: critical behaviour at the smecticA-nematic transition,”
Liquid Crystals, vol. 29, pp. 57–66, 2002.
[10] S.-Y. Jeong, D.-W. Kim, K.-W. Rhie, M.-P. Hong, S. Kumar, W.-G. Jang,
and S.-T. Shin, “Studies of critical behaviour at the nematic to smectic a
phase transition in C6 and C7 binary mixture system,” Journal of Physics D:
Applied Physics, vol. 41, p. 062002, 2008.
[11] C. W. Garland and G. Nounesis, “Critical behavior at nematic-semctic-A
phase transitions,” Phys. Rev. E, vol. 49, p. 2964, 1994.
[12] K. Denolf, G. Cordoyiannis, C. Glorienx, and J. Thoen, “Effect of non-
mesogenic impurities on the liquid crystalline phase transitions of octyl-
cyanobiphenyl,” Phys. Rev. E, vol. 76, p. 051702, 2007.
[13] K. Denolf, B. V. Roie, C. Glorienx, and J. Thoen, “Effect of nonmesogenic
impurities on the order of the nematic to smectic-A phase transition in liquid
crystals,” Phys. Rev. Lett., vol. 97, p. 107801, 2006.
[14] P. K. Mukherjee, “Effect of nonmesogenic solute on the nematic-smectic-A
phase transition,” J. Chem. Phys., vol. 116, pp. 9531–9536, 2002.
[15] S. DasGupta and S. K. Roy, “The bend elastic constant in a mixture of 4,
4’-n-octyl-cyanobiphenyl and biphenyl,” Phys. Lett. A, vol. 288, pp. 323–328,
2001.
[16] T. P. Rieker, “Organic lyotropic lamellar liquid crystal,” Liquid Crystals,
vol. 19, p. 497, 1995.
[17] S. DasGupta, P. Chattopadhyay, and S. K. Roy, “Effect of a rigid nonpolar
solute on splay, bend elastic constants and on rotational viscocity coefficient
of 4,4’-n-octyl-cyanobiphenyl,” Phys. Rev. E, vol. 63, p. 041703, 2001.
[18] A. Yethiraj, R. Mukhopadhyay, and J. Bechhoefer, “Two experimental tests
of a fluctuation-induced first-order phase transition: Intensity fluctuation mi-
croscopy at the nematic-smectic-a transition,” Phys. Rev. E, vol. 65, p. 021702,
2002.
98
[19] C. W. Garland and G. S. Iannacchione, “Effect of aerosil gels on de gennes
nematic-smectic coupling,” J. Phys. Chem. B, vol. 113, p. 3901, 2008.
[20] P. G. de Gennes and J. Prost, The Physics of Liquid Crystals. Clarendon,
Oxford, England: Oxford University Press, 1993.
[21] W. L. McMillan Phys. Rev. A, vol. 4, p. 1238, 1971.
[22] B. I. Halperin, T. C. Lubensky, and S. K. Ma Phys. Rev. Lett., vol. 32, p. 292,
1974.
[23] M. A. Anisimov, P. E. Cladis, E. E. Gorodetskii, D. A. Huse, V. E. Podneks,
V. G. Taratuta, W. van Saarloos, and V. P. Voronov Phys. Rev. A, vol. 41,
p. 6749, 1990.
[24] G. S. Iannacchione, S. Park, C. W. Garland, R. J. Birgeneau, and R. L. Leheny
Phys. Rev. E, vol. 67, p. 011709, 2003.
[25] K. P. Sigdel and G. S. Iannacchione, “Evolution of the isotropic to nematic
phase transition in binary mixtures of octylcyanobiphenyl and n-hexane,” J.
Chem. Phys., vol. 133, p. 044513, 2010.
[26] S. Qian, G. S. Iannacchione, and D. Finotello, “Critical behavior of the
smectic-A to nematic phase transition imbedded in a random network of
voids,” Phys. Rev. E, vol. 57, p. 4305, 1998.
[27] G. S. Iannacchione, C. W. Garland, J. T. Mang, and T. P. Rieker Phys. Rev.
E, vol. 58, p. 5966, 1998.
Chapter 5Isotropic to smectic-A phase
transition in liquid crystal + acetone
binary mixtures
5.1 Introduction
Recently, attention has been given to binary mixtures of liquid crystal and a com-
patible (i.e. miscible), low-molecular weight, solvent as a system in which the inter-
molecular potential responsible for the LC order can be screened or modified. The
studies to date of LC+solvent systems have focused exclusively on the isotropic to
nematic (I-N) [3, 4] and the nematic to smectic-A (N -SmA) [4, 5, 6, 7, 8] phase
transitions as a function of solvent type and concentration. These studies differ
from those systems that employ surfactant [9, 10, 11], to create a colloidal emulsion
in that these LC+solvent binary mixtures are in equilibrium and miscible.
The direct first-order transition from the isotropic to the smectic-A (I-SmA)
phase has attracted attention in experimental [12, 13, 14, 15, 16, 17, 18, 19, 20]
and theoretical research [21, 22, 23, 24] as a prototypical symmetry breaking phase
transition. High-resolution synchrotron x-ray diffraction study of the I-SmA phase
transition in 10CB-aerosil showed that the transition remains first-order for all gel
densities with systematic evolution of correlation length[17]. The study of phase
transition behavior of 10CB in the presence of silica aerogels showed that the
direct I-SmA transition occurs through the nucleation of smectic domains[16].
99
100
The effect of pressure on the I-SmA phase transition was examined and pointed
out that the effect is to increase the transition temperature and to decrease the
discontinuity of the transition[23]. The macroscopic dynamic behavior was studied
in vicinity of the I-SmA transition and the dynamic equations were presented on
the isotropic and smectic-A side of the phase transition incorporating the effect of
an external electric field[24]. The existence of surface induced order was shown in
the isotropic phase of 12CB, which has the direct I-SmA transition, confined to
anapore membranes through specific-heat and x-ray scattering studies[12]. All the
observations showed that the I-SmA transition is more first order than the very
weak I-N transition indicating that the orientational order of SmA phase is higher
than that in the nematic phase. Even though significant effort was applied for the
study of the I-SmA transition behavior, many problems related to fundamentals
of the transition are yet to be solved.
Modification of the smectic structure as well as the introduction of new smec-
tic phases has traditionally been carried out in binary mixtures of two LCs, each
exhibiting a different smectic structure. An early study on a binary LC mix-
ture, dibenzoate and TBBA, reported the first SmA-SmA transition[25], which
was modelled by an extension of the Meyer-Lubensky free-energy form [26]. Since
this early work, a host of SmA-SmA type transitions have been explored in binary
LC mixtures [27, 28, 29, 30, 31, 32, 33] though nearly all involve incommensurate
smectic structures with very wide two-phase coexistence ranges. A rare exam-
ple of a single LC system is the dimesogenic LC KI5 and KII5, but these highly
asymmetric LCs also involve incommensurate smectic structures with long lived
metastability [34, 35, 36]. Among these early studies only the SmAd-A2 transition
has been studied thoroughly.
Most recently, a new phenomenological model of a de Vries type smectic LC has
been developed that also appears applicable to a smectic-smectic phase transition
[37]. This theoretical work predicts the possibility of a sharp, true first-order
transition between two smectic phases. In all these studies, the smectic phase
was modified by the mixture of two smectic LCs typically having different smectic
structures. Here, the difference in space packing drives the stability and structure,
even for the single component dimesogenic LC [34, 35, 36]. A more attractive route
to studying smectic ordering is directly modifying the intermolecular potential for
101
an LC that only exhibits a single smectic phase.
In this work, we report a high-resolution ac-calorimetric study on the effects
of a non-mesogenic, low-molecular weight, polar solvent (acetone) on the first-
order I-SmA phase transition in decyl-cyanobiphenyl (10CB) and acetone (ace)
binary mixtures (10CB+ace) as a function of acetone concentration, xace. The
addition of acetone to 10CB changes the phase behavior of the 10CB+ace system
dramatically. Two distinct first-order phase transition features are observed in the
mixture. The high-temperature transition feature shifts marginally to lower tem-
perature while the low-temperature feature shifts markedly towards lower temper-
ature with increasing xace. The ∆Cp peak evolves for both the transition features
with significant effect on low-temperature phase transition feature. The two-phase
coexistence region for the low-temperature feature increases as a function of xace
while remains fairly constant for the high-temperature feature. The hysteresis in
the ∆Cp shape on heating and cooling is observed and increases as xace increases
only for the low-temperature feature. These results were reproducible upon mul-
tiple thermal cycles and not likely affected by macroscopic phase separation. An
example of such phase separation behavior is seen in mixtures of 10CB with the
non-polar solvent decane.
5.2 Results
The I-SmA phase transition for pure 10CB occurred at TIA = 323.69 K, in good
agreement with the literature value[38, 18]. The excess real specific heat ∆Cp
and the imaginary specific heat C′′p for pure 10CB and six 10CB+ace samples on
heating are shown in Fig. 5.1 as a function of temperature about the lowest stable
temperature of the isotropic phase ∆TIA = T − TIA. The characteristic features
of the I-SmA transition in pure 10CB, a single, sharp, peak in ∆Cp and C′′p with
small wings above and below TIA, transform into two heat capacity features for
the 10CB+ace samples. The high-temperature signature, labelled peak-1, appears
as a small peak in ∆Cp and very small signature in C′′p . Peak-1 represents a very
weak first-order transition into a phase labelled P1. The low-temperature peak,
labelled peak-2, appears as a large peak in both ∆Cp and C′′p , that are similar in
shape. This peak-2 clearly represents a much stronger first-order transition from
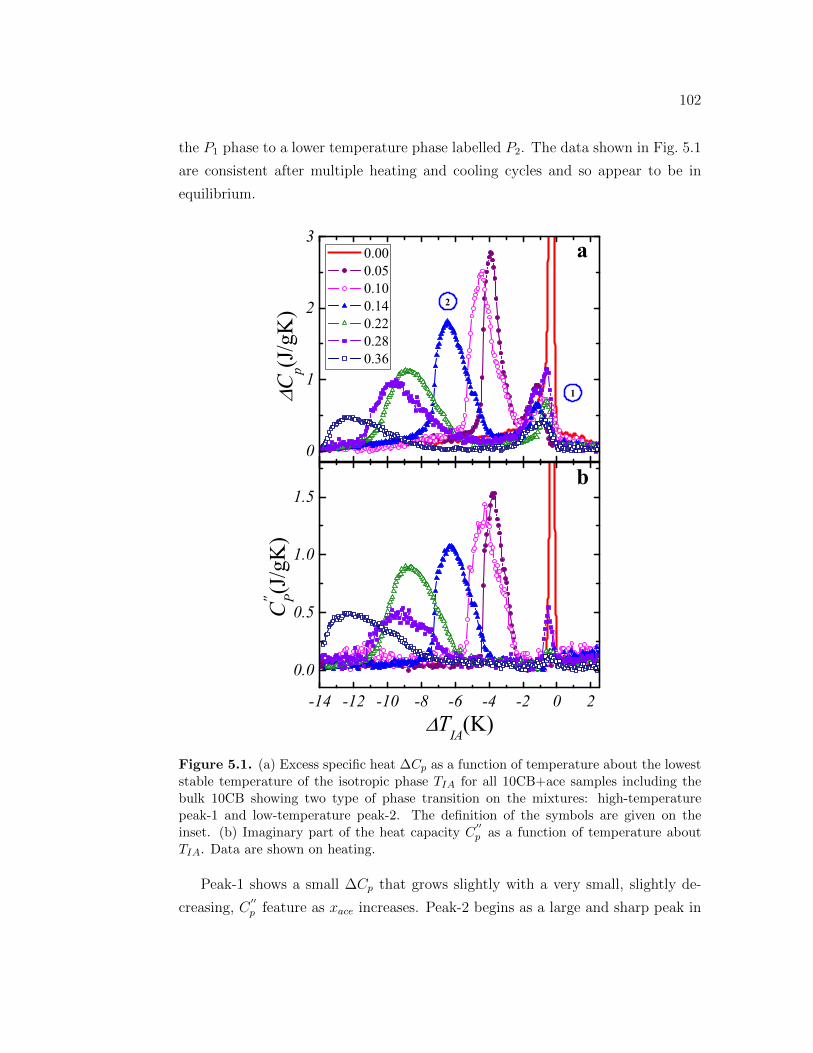
102
the P1 phase to a lower temperature phase labelled P2. The data shown in Fig. 5.1
are consistent after multiple heating and cooling cycles and so appear to be in
equilibrium.
-14 -12 -10 -8 -6 -4 -2 0 2
0.0
0.5
1.0
1.5b
C'' P(J
/gK
)
TIA(K)
0
1
2
3
Cp(J
/gK
) 0.00 0.05 0.10 0.14 0.22 0.28 0.36
1
2
a
Figure 5.1. (a) Excess specific heat ∆Cp as a function of temperature about the loweststable temperature of the isotropic phase TIA for all 10CB+ace samples including thebulk 10CB showing two type of phase transition on the mixtures: high-temperaturepeak-1 and low-temperature peak-2. The definition of the symbols are given on theinset. (b) Imaginary part of the heat capacity C
′′p as a function of temperature about
TIA. Data are shown on heating.
Peak-1 shows a small ∆Cp that grows slightly with a very small, slightly de-
creasing, C′′p feature as xace increases. Peak-2 begins as a large and sharp peak in
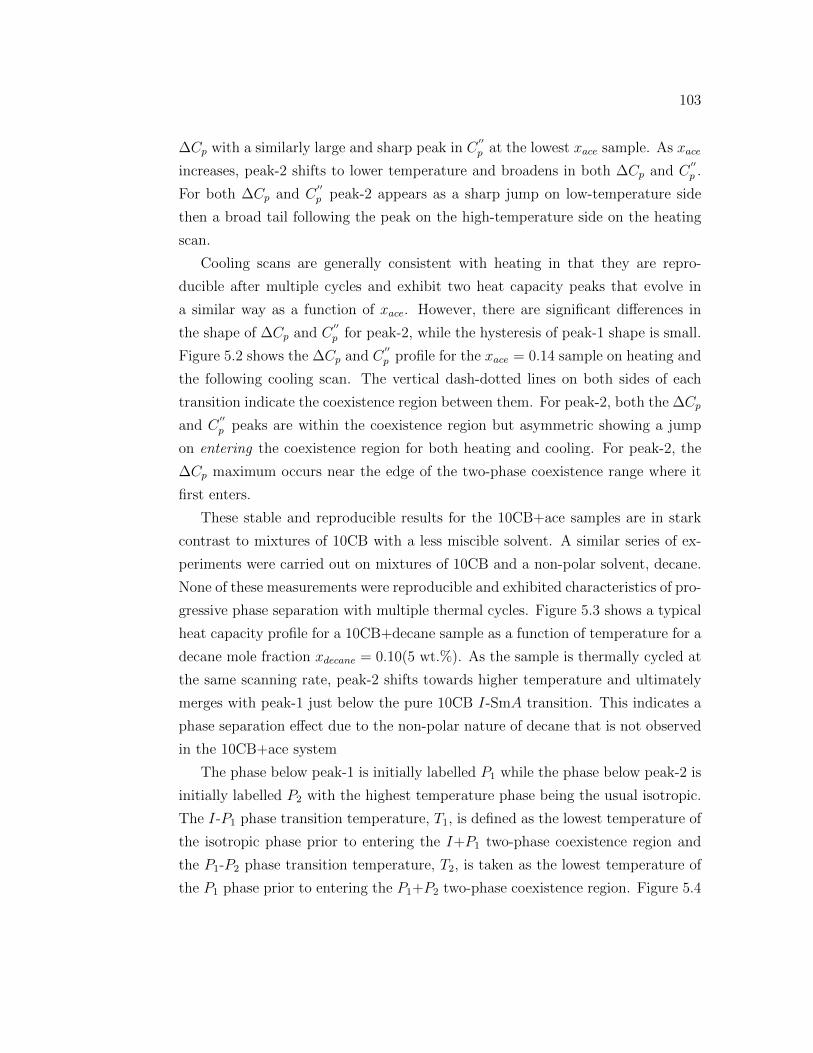
103
∆Cp with a similarly large and sharp peak in C′′p at the lowest xace sample. As xace
increases, peak-2 shifts to lower temperature and broadens in both ∆Cp and C′′p .
For both ∆Cp and C′′p peak-2 appears as a sharp jump on low-temperature side
then a broad tail following the peak on the high-temperature side on the heating
scan.
Cooling scans are generally consistent with heating in that they are repro-
ducible after multiple cycles and exhibit two heat capacity peaks that evolve in
a similar way as a function of xace. However, there are significant differences in
the shape of ∆Cp and C′′p for peak-2, while the hysteresis of peak-1 shape is small.
Figure 5.2 shows the ∆Cp and C′′p profile for the xace = 0.14 sample on heating and
the following cooling scan. The vertical dash-dotted lines on both sides of each
transition indicate the coexistence region between them. For peak-2, both the ∆Cp
and C′′p peaks are within the coexistence region but asymmetric showing a jump
on entering the coexistence region for both heating and cooling. For peak-2, the
∆Cp maximum occurs near the edge of the two-phase coexistence range where it
first enters.
These stable and reproducible results for the 10CB+ace samples are in stark
contrast to mixtures of 10CB with a less miscible solvent. A similar series of ex-
periments were carried out on mixtures of 10CB and a non-polar solvent, decane.
None of these measurements were reproducible and exhibited characteristics of pro-
gressive phase separation with multiple thermal cycles. Figure 5.3 shows a typical
heat capacity profile for a 10CB+decane sample as a function of temperature for a
decane mole fraction xdecane = 0.10(5 wt.%). As the sample is thermally cycled at
the same scanning rate, peak-2 shifts towards higher temperature and ultimately
merges with peak-1 just below the pure 10CB I-SmA transition. This indicates a
phase separation effect due to the non-polar nature of decane that is not observed
in the 10CB+ace system
The phase below peak-1 is initially labelled P1 while the phase below peak-2 is
initially labelled P2 with the highest temperature phase being the usual isotropic.
The I-P1 phase transition temperature, T1, is defined as the lowest temperature of
the isotropic phase prior to entering the I+P1 two-phase coexistence region and
the P1-P2 phase transition temperature, T2, is taken as the lowest temperature of
the P1 phase prior to entering the P1+P2 two-phase coexistence region. Figure 5.4
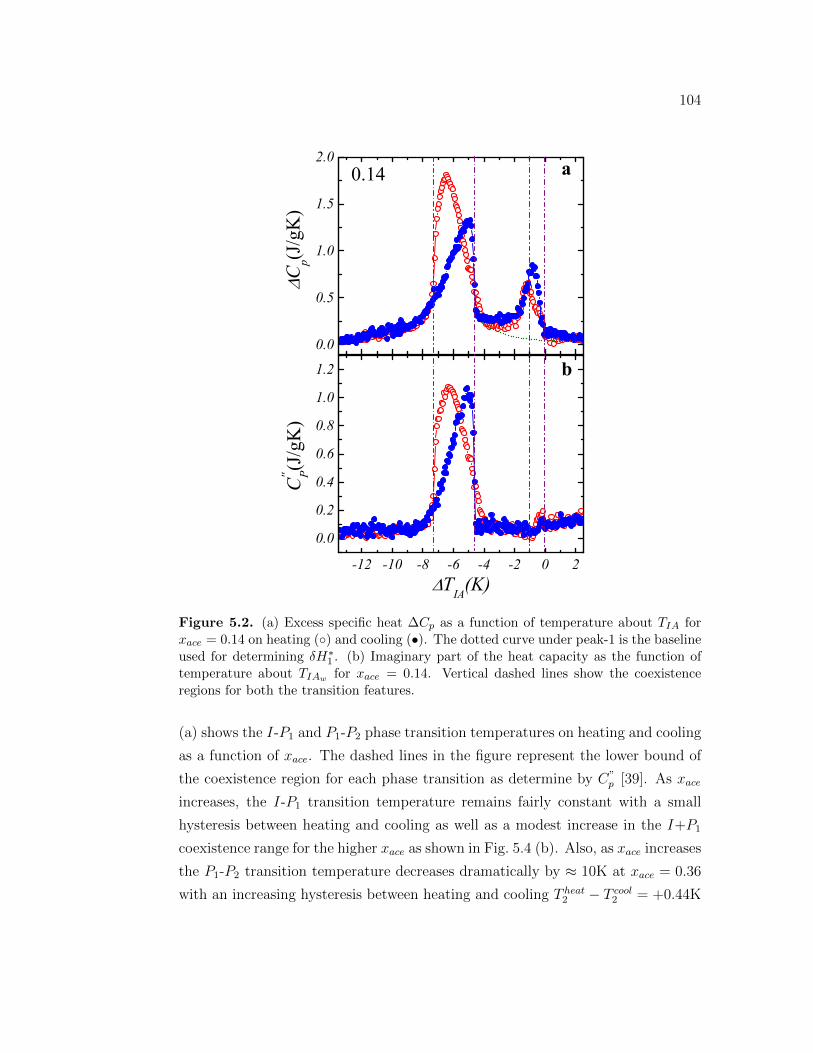
104
0.0
0.5
1.0
1.5
2.0
-12 -10 -8 -6 -4 -2 0 2
0.0
0.2
0.4
0.6
0.8
1.0
1.2
a
Cp(J
/gK)
0.14
b
TIA(K)
C'' P(J/gK
)
Figure 5.2. (a) Excess specific heat ∆Cp as a function of temperature about TIA forxace = 0.14 on heating () and cooling (•). The dotted curve under peak-1 is the baselineused for determining δH∗1 . (b) Imaginary part of the heat capacity as the function oftemperature about TIAw for xace = 0.14. Vertical dashed lines show the coexistenceregions for both the transition features.
(a) shows the I-P1 and P1-P2 phase transition temperatures on heating and cooling
as a function of xace. The dashed lines in the figure represent the lower bound of
the coexistence region for each phase transition as determine by C”p [39]. As xace
increases, the I-P1 transition temperature remains fairly constant with a small
hysteresis between heating and cooling as well as a modest increase in the I+P1
coexistence range for the higher xace as shown in Fig. 5.4 (b). Also, as xace increases
the P1-P2 transition temperature decreases dramatically by ≈ 10K at xace = 0.36
with an increasing hysteresis between heating and cooling T heat2 − T cool
2 = +0.44K
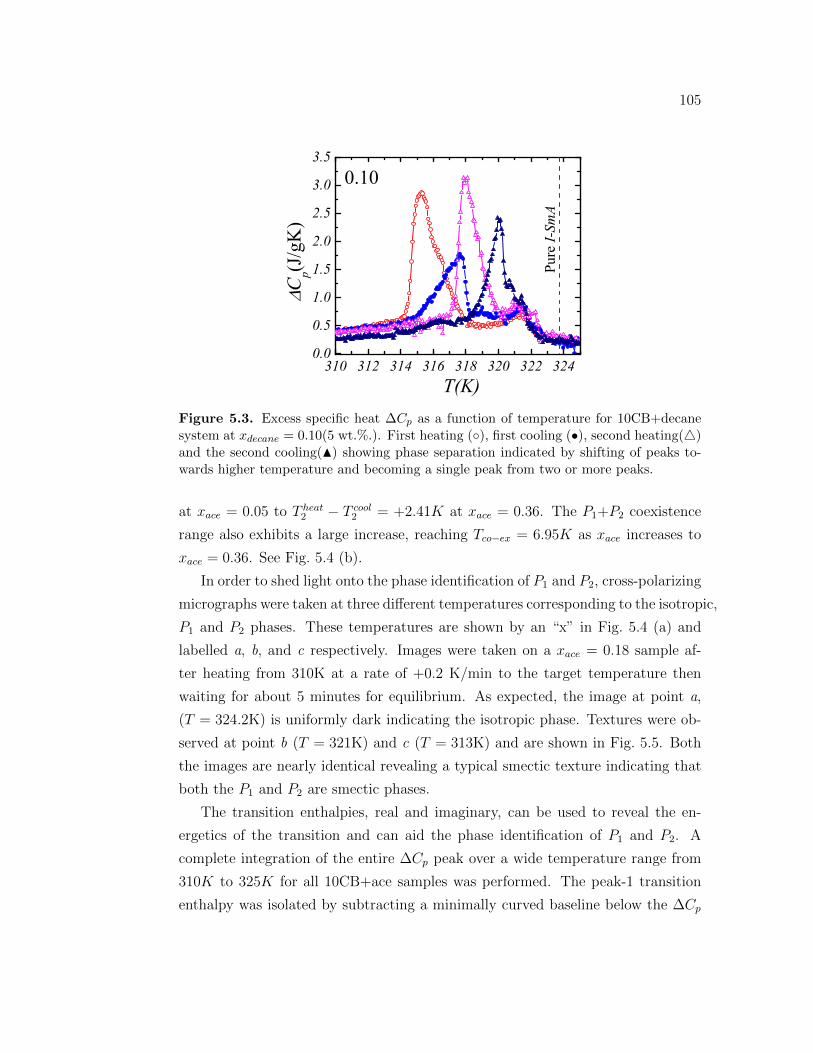
105
310 312 314 316 318 320 322 3240.0
0.5
1.0
1.5
2.0
2.5
3.0
3.5
Cp(J
/gK
)
T(K)
0.10
Pure
I-Sm
A
Figure 5.3. Excess specific heat ∆Cp as a function of temperature for 10CB+decanesystem at xdecane = 0.10(5 wt.%.). First heating (), first cooling (•), second heating()and the second cooling(N) showing phase separation indicated by shifting of peaks to-wards higher temperature and becoming a single peak from two or more peaks.
at xace = 0.05 to T heat2 − T cool
2 = +2.41K at xace = 0.36. The P1+P2 coexistence
range also exhibits a large increase, reaching Tco−ex = 6.95K as xace increases to
xace = 0.36. See Fig. 5.4 (b).
In order to shed light onto the phase identification of P1 and P2, cross-polarizing
micrographs were taken at three different temperatures corresponding to the isotropic,
P1 and P2 phases. These temperatures are shown by an “x” in Fig. 5.4 (a) and
labelled a, b, and c respectively. Images were taken on a xace = 0.18 sample af-
ter heating from 310K at a rate of +0.2 K/min to the target temperature then
waiting for about 5 minutes for equilibrium. As expected, the image at point a,
(T = 324.2K) is uniformly dark indicating the isotropic phase. Textures were ob-
served at point b (T = 321K) and c (T = 313K) and are shown in Fig. 5.5. Both
the images are nearly identical revealing a typical smectic texture indicating that
both the P1 and P2 are smectic phases.
The transition enthalpies, real and imaginary, can be used to reveal the en-
ergetics of the transition and can aid the phase identification of P1 and P2. A
complete integration of the entire ∆Cp peak over a wide temperature range from
310K to 325K for all 10CB+ace samples was performed. The peak-1 transition
enthalpy was isolated by subtracting a minimally curved baseline below the ∆Cp
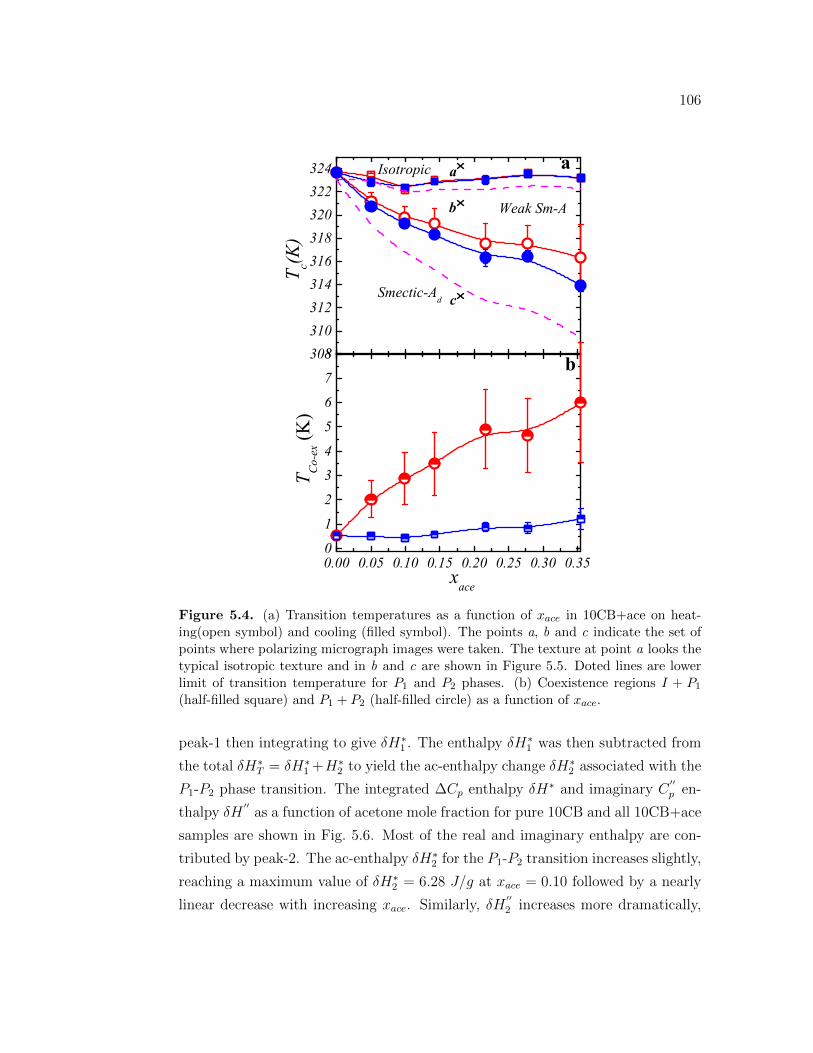
106
308310312314316318320322324
0.00 0.05 0.10 0.15 0.20 0.25 0.30 0.35012345678
a
T c(K)
Isotropic
Weak Sm-A
Smectic-Ad
a
b
c
b
xace
T
Co-
ex (K
)
Figure 5.4. (a) Transition temperatures as a function of xace in 10CB+ace on heat-ing(open symbol) and cooling (filled symbol). The points a, b and c indicate the set ofpoints where polarizing micrograph images were taken. The texture at point a looks thetypical isotropic texture and in b and c are shown in Figure 5.5. Doted lines are lowerlimit of transition temperature for P1 and P2 phases. (b) Coexistence regions I + P1
(half-filled square) and P1 + P2 (half-filled circle) as a function of xace.
peak-1 then integrating to give δH∗1 . The enthalpy δH∗1 was then subtracted from
the total δH∗T = δH∗1 +H∗2 to yield the ac-enthalpy change δH∗2 associated with the
P1-P2 phase transition. The integrated ∆Cp enthalpy δH∗ and imaginary C′′p en-
thalpy δH′′
as a function of acetone mole fraction for pure 10CB and all 10CB+ace
samples are shown in Fig. 5.6. Most of the real and imaginary enthalpy are con-
tributed by peak-2. The ac-enthalpy δH∗2 for the P1-P2 transition increases slightly,
reaching a maximum value of δH∗2 = 6.28 J/g at xace = 0.10 followed by a nearly
linear decrease with increasing xace. Similarly, δH′′2 increases more dramatically,
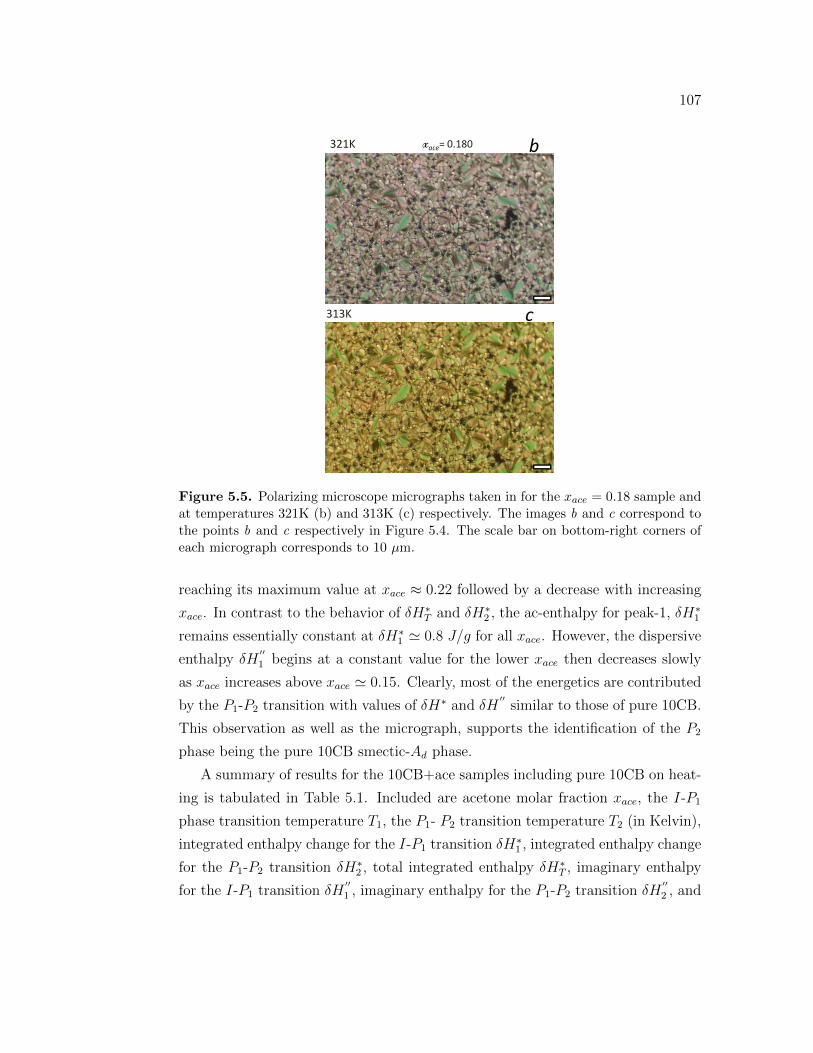
107
321K
313K
b
c
xace
= 0.180
Figure 5.5. Polarizing microscope micrographs taken in for the xace = 0.18 sample andat temperatures 321K (b) and 313K (c) respectively. The images b and c correspond tothe points b and c respectively in Figure 5.4. The scale bar on bottom-right corners ofeach micrograph corresponds to 10 µm.
reaching its maximum value at xace ≈ 0.22 followed by a decrease with increasing
xace. In contrast to the behavior of δH∗T and δH∗2 , the ac-enthalpy for peak-1, δH∗1
remains essentially constant at δH∗1 ≃ 0.8 J/g for all xace. However, the dispersive
enthalpy δH′′1 begins at a constant value for the lower xace then decreases slowly
as xace increases above xace ≃ 0.15. Clearly, most of the energetics are contributed
by the P1-P2 transition with values of δH∗ and δH′′
similar to those of pure 10CB.
This observation as well as the micrograph, supports the identification of the P2
phase being the pure 10CB smectic-Ad phase.
A summary of results for the 10CB+ace samples including pure 10CB on heat-
ing is tabulated in Table 5.1. Included are acetone molar fraction xace, the I-P1
phase transition temperature T1, the P1- P2 transition temperature T2 (in Kelvin),
integrated enthalpy change for the I-P1 transition δH∗1 , integrated enthalpy change
for the P1-P2 transition δH∗2 , total integrated enthalpy δH∗T , imaginary enthalpy
for the I-P1 transition δH′′1 , imaginary enthalpy for the P1-P2 transition δH
′′2 , and
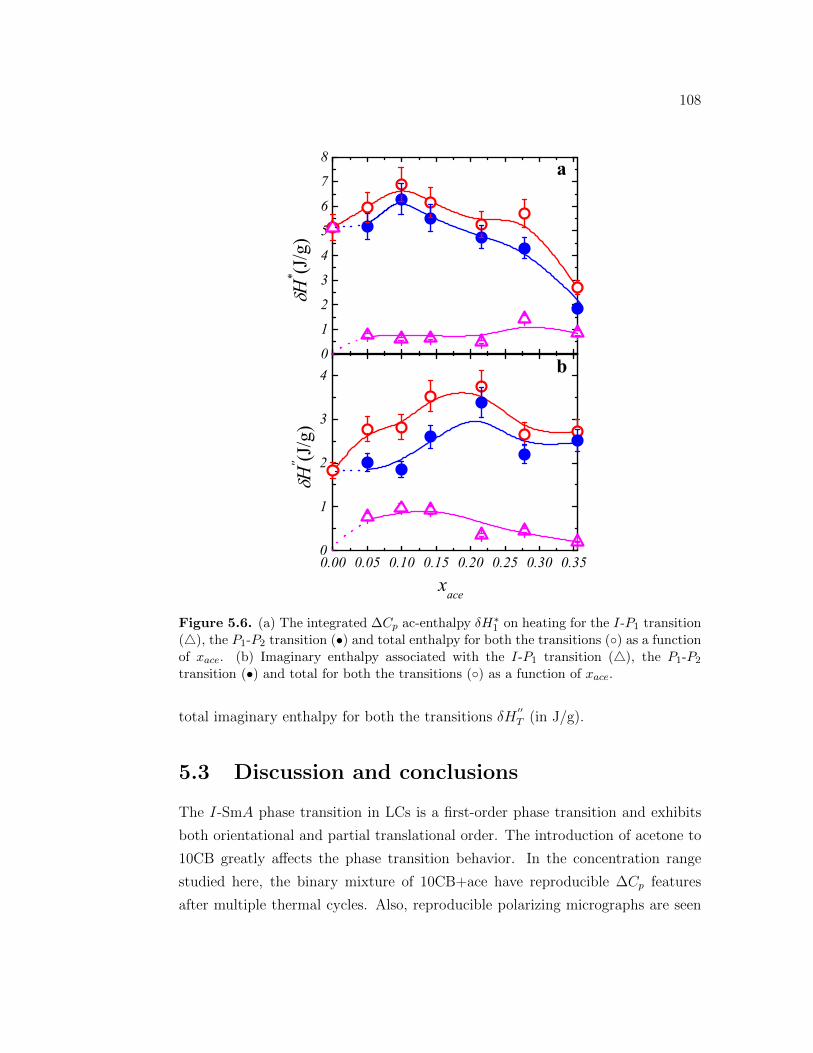
108
0
1
2
3
4
5
6
7
8
0.00 0.05 0.10 0.15 0.20 0.25 0.30 0.350
1
2
3
4
a
H* (J
/g)
b
xace
H'' (J
/g)
Figure 5.6. (a) The integrated ∆Cp ac-enthalpy δH∗1 on heating for the I-P1 transition(), the P1-P2 transition (•) and total enthalpy for both the transitions () as a functionof xace. (b) Imaginary enthalpy associated with the I-P1 transition (), the P1-P2
transition (•) and total for both the transitions () as a function of xace.
total imaginary enthalpy for both the transitions δH′′T (in J/g).
5.3 Discussion and conclusions
The I-SmA phase transition in LCs is a first-order phase transition and exhibits
both orientational and partial translational order. The introduction of acetone to
10CB greatly affects the phase transition behavior. In the concentration range
studied here, the binary mixture of 10CB+ace have reproducible ∆Cp features
after multiple thermal cycles. Also, reproducible polarizing micrographs are seen
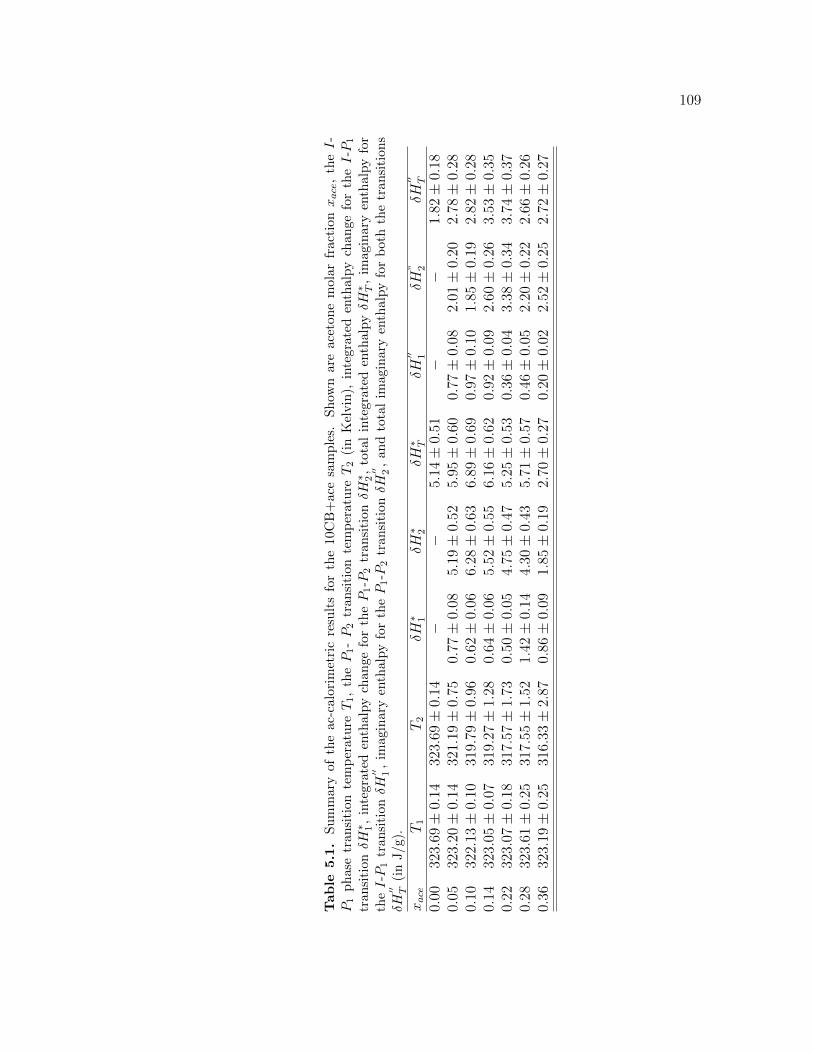
109
Table
5.1
.Sum
mar
yof
the
ac-c
alor
imet
ric
resu
lts
for
the
10C
B+
ace
sam
ple
s.Show
nar
eace
tone
mola
rfr
act
ion
xace
,th
eI-
P1
phas
etr
ansi
tion
tem
per
ature
T1,
the
P1-
P2
tran
siti
onte
mper
atu
reT
2(i
nK
elvin
),in
tegra
ted
enth
alp
ych
ange
for
the
I-P
1
tran
siti
onδH∗ 1,
inte
gra
ted
enth
alpy
change
for
the
P1-P
2tr
ansi
tion
δH∗ 2,
tota
lin
tegr
ate
den
thal
py
δH∗ T,
imagin
ary
enth
alp
yfo
rth
eI-P
1tr
ansi
tion
δH′′ 1,im
agin
ary
enth
alpy
for
the
P1-P
2tr
ansi
tion
δH′′ 2,an
dto
talim
agin
ary
enth
alp
yfo
rboth
the
transi
tions
δH′′ T
(in
J/g)
.
xace
T1
T2
δH∗ 1
δH∗ 2
δH∗ T
δH′′ 1
δH” 2
δH′′ T
0.00
323.
69±
0.14
323.
69±
0.14
−−
5.14
±0.
51−
−1.
82±
0.18
0.05
323.
20±
0.14
321.
19±
0.75
0.77
±0.
085.
19±
0.52
5.95
±0.
600.
77±
0.08
2.01
±0.
202.
78±
0.28
0.10
322.
13±
0.10
319.
79±
0.96
0.62
±0.
066.
28±
0.63
6.89
±0.
690.
97±
0.10
1.85
±0.
192.
82±
0.28
0.14
323.
05±
0.07
319.
27±
1.28
0.64
±0.
065.
52±
0.55
6.16
±0.
620.
92±
0.09
2.60
±0.
263.
53±
0.35
0.22
323.
07±
0.18
317.
57±
1.73
0.50
±0.
054.
75±
0.47
5.25
±0.
530.
36±
0.04
3.38
±0.
343.
74±
0.37
0.28
323.
61±
0.25
317.
55±
1.52
1.42
±0.
144.
30±
0.43
5.71
±0.
570.
46±
0.05
2.20
±0.
222.
66±
0.26
0.36
323.
19±
0.25
316.
33±
2.87
0.86
±0.
091.
85±
0.19
2.70
±0.
270.
20±
0.02
2.52
±0.
252.
72±
0.27
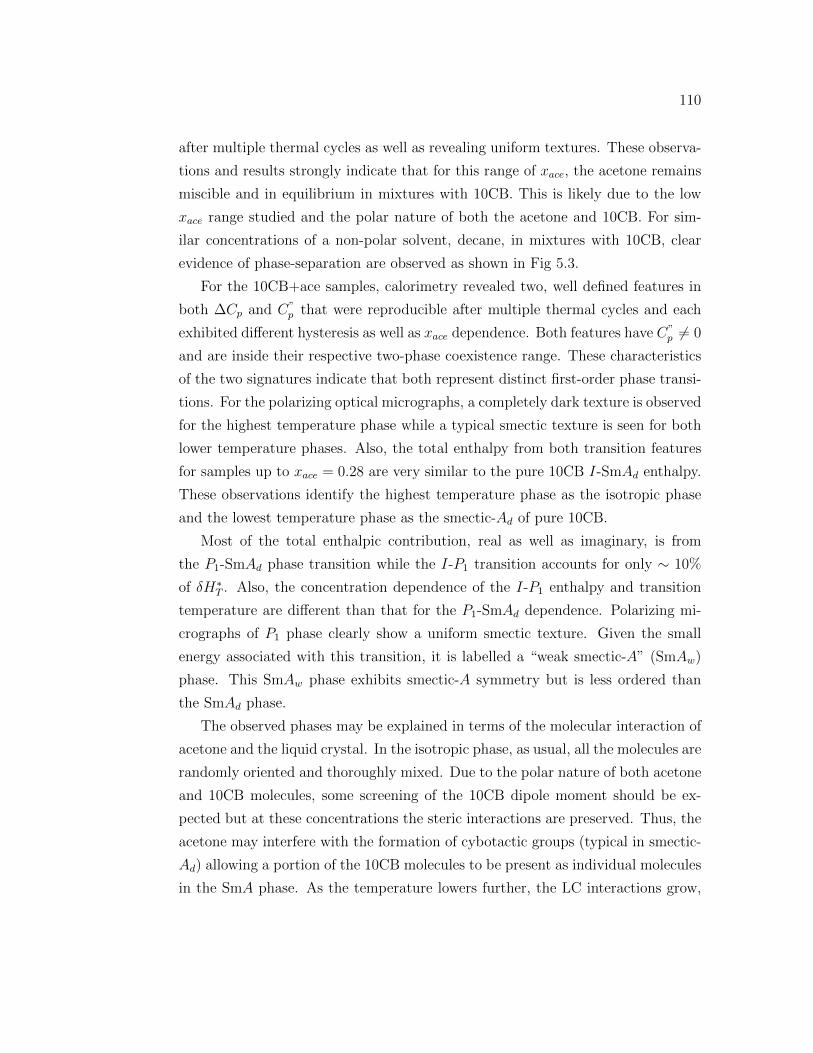
110
after multiple thermal cycles as well as revealing uniform textures. These observa-
tions and results strongly indicate that for this range of xace, the acetone remains
miscible and in equilibrium in mixtures with 10CB. This is likely due to the low
xace range studied and the polar nature of both the acetone and 10CB. For sim-
ilar concentrations of a non-polar solvent, decane, in mixtures with 10CB, clear
evidence of phase-separation are observed as shown in Fig 5.3.
For the 10CB+ace samples, calorimetry revealed two, well defined features in
both ∆Cp and C”p that were reproducible after multiple thermal cycles and each
exhibited different hysteresis as well as xace dependence. Both features have C”p = 0
and are inside their respective two-phase coexistence range. These characteristics
of the two signatures indicate that both represent distinct first-order phase transi-
tions. For the polarizing optical micrographs, a completely dark texture is observed
for the highest temperature phase while a typical smectic texture is seen for both
lower temperature phases. Also, the total enthalpy from both transition features
for samples up to xace = 0.28 are very similar to the pure 10CB I-SmAd enthalpy.
These observations identify the highest temperature phase as the isotropic phase
and the lowest temperature phase as the smectic-Ad of pure 10CB.
Most of the total enthalpic contribution, real as well as imaginary, is from
the P1-SmAd phase transition while the I-P1 transition accounts for only ∼ 10%
of δH∗T . Also, the concentration dependence of the I-P1 enthalpy and transition
temperature are different than that for the P1-SmAd dependence. Polarizing mi-
crographs of P1 phase clearly show a uniform smectic texture. Given the small
energy associated with this transition, it is labelled a “weak smectic-A” (SmAw)
phase. This SmAw phase exhibits smectic-A symmetry but is less ordered than
the SmAd phase.
The observed phases may be explained in terms of the molecular interaction of
acetone and the liquid crystal. In the isotropic phase, as usual, all the molecules are
randomly oriented and thoroughly mixed. Due to the polar nature of both acetone
and 10CB molecules, some screening of the 10CB dipole moment should be ex-
pected but at these concentrations the steric interactions are preserved. Thus, the
acetone may interfere with the formation of cybotactic groups (typical in smectic-
Ad) allowing a portion of the 10CB molecules to be present as individual molecules
in the SmA phase. As the temperature lowers further, the LC interactions grow,
111
Weak Smectic-ASmectic-AdIsotropic
Temperature
Peak 2 Peak 1
Figure 5.7. Cartoon representing a model showing molecular structure in isotropic,weak smectic-A and Smectic-Ad phase in 10CB+ace mixtures. Cylindrical rod with ablack dot and a wiggly tail on it represents a 10CB molecule and small fan like structurerepresents an acetone molecule. Dotted ovals show dimer structure and a monomer withan acetone molecule anchored on a 10CB molecule.
eventually overcoming the partial dipole screening by the acetone allowing for the
full formation of the SmAd phase. The proposed weak smectic-A phase can be
considered as a smectic-A layered structure comprised of a mixture of individual
and cybotactic groups of 10CB. See Fig. 5.7 for the illustration of these phases.
The downward shift of the transition temperatures in 10CB+ace system is
consistent with an impurity (dilution) effect [3]. The increasing co-existence region,
and increasing hysteresis of the SmAw-SmAd transition ∆Cp shape on heating
and cooling as a function of xace can be explained in terms of the interaction
of acetone polar molecules with 10CB molecules. During a temperature scan, the
heat capacity peak exhibits a jump when entering the coexistence region and leaves
the region with a broad tail. As the coexistence region is approaching, nucleation
process starts sharply and as coarsening processes, the screening by the acetone
begins to slow the establishment of order, giving rise to a broad tail.
We have undertaken detailed calorimetric studies on the effect of non-mesogenic,
low molecular weight polar solvent (acetone) on the first order I-SmA phase transi-
tion of decyl-cyanobiphenyl (10CB). Acetone dilutes the liquid crystal and changes
112
the intermolecular potential among the molecules in the mixture. Dramatic change
in phase behavior with a new transition feature from less orientationally order
weak smectic-A to more orientationally ordered smectic-Ad including the isotropic
to less-ordered weak smectic-A phase is observed due to the presence of acetone on
10CB. Both the transition features evolve in shape and size of ∆Cp as a function of
xace. Downwards shifting of transition temperature for both the transitions with
dramatic shifts on weak smectic-A to smectic-Ad transition temperature has been
observed. These all reveal a new aspect of the effect of polar solvent interactions
on the liquid crystal transitions. Continued experimental efforts are needed specif-
ically, x-ray and/or neutron scattering studies probing the smectic structure as a
function of solvent content and temperature would be particulary important and
interesting.
Bibliography
[1] P. G. de Gennes and J. Prost, The Physics of Liquid Crystals. Clarendon,
Oxford, England: Oxford University Press, 1993.
[2] S. Chandrashekhar, Liquid Crystals. England: Cambridge University Press,
1992.
[3] K. P. Sigdel and G. S. Iannacchione, “Evolution of the isotropic to nematic
phase transition in binary mixtures of octylcyanobiphenyl and n-hexane,” J.
Chem. Phys., vol. 133, p. 044513, 2010.
[4] K. Denolf, G. Cordoyiannis, C. Glorienx, and J. Thoen, “Effect of non-
mesogenic impurities on the liquid crystalline phase transitions of octyl-
cyanobiphenyl,” Phys. Rev. E, vol. 76, p. 051702, 2007.
[5] K. Denolf, B. V. Roie, C. Glorienx, and J. Thoen, “Effect of nonmesogenic
impurities on the order of the nematic to smectic-A phase transition in liquid
crystals,” Phys. Rev. Lett., vol. 97, p. 107801, 2006.
[6] P. K. Mukherjee, “Effect of nonmesogenic solute on the nematic-smectic-A
phase transition,” J. Chem. Phys., vol. 116, pp. 9531–9536, 2002.
[7] S. DasGupta and S. K. Roy, “The bend elastic constant in a mixture of 4,
4’-n-octyl-cyanobiphenyl and biphenyl,” Phys. Lett. A, vol. 288, pp. 323–328,
2001.
[8] T. P. Rieker, “Organic lyotropic lamellar liquid crystal,” Liquid Crystals,
vol. 19, p. 497, 1995.
113
114
[9] P. Poulin, H. Stark, T. C. Lubensky, and D. Weitz, “Novel colloidal interac-
tions in anisotropic fluids,” Science, vol. 275, p. 1770, 1997.
[10] J. Yamamoto and H. Tanaka, “Transparent nematic phase in a liquid-crystal-
based microemulsion,” Nature, vol. 409, pp. 321–25, 2001.
[11] M. Caggioni, A. Giacometti, T. Bellini, N. A. Clark, F. Mantegazza, and
A. Maritan, “Pretransitional behavior of a water in liquid crystal microemul-
sion close to the demixing transition: Evidence for intermicellar attraction
mediated by paranematic fluctuations,” J. Chem. Phys., vol. 122, p. 214721,
June 2005.
[12] G. Iannacchione, J. Mang, S. Kumar, and D. Finotello, “Surface-induced dis-
crete smectic order in the isotropic phase of 12CB in cylindrical pores,” Phys.
Rev. Lett., vol. 73, p. 2708, 1994.
[13] M. Olbrich, H. Brand, H. Finkelmann, and K. Kawasaki, “Fluctuations above
the smectic-A-isotropic transition in liquid crystalline elastomers under exter-
nal stress,” Europhys. Lett., vol. 31, pp. 281–286, 1995.
[14] T. Bellini, A. Rappaport, N. Clark, and B. Thomas, “First-order transitions
and hexatic ordering in the aerogel-confined liquid crystal 650BC,” Phys. Rev.
Lett., vol. 77, p. 2507, 1996.
[15] A. Drozd-Rzoska, S. Rzoska, and J. Ziolo, “Quasicritical behavior of dielectric
permittivity in the isotropic phase of smectogenic n-cyanobiphenyls,” Phys.
Rev. E, vol. 61, p. 5349, 2000.
[16] T. Bellini, N. Clark, and D. Link, “Isotropic to smectic-A phase transitions in
a porous matrix: a case of multiporous phase coexistence,” J. Phys.: Condens.
Matter, vol. 15, p. S175, 2003.
[17] M. K. Ramazanoglu, P. Clegg, R. J. Birgeneau, C. W. Garland, M. E. Neubert,
and J. M. Kim, “First-order isotropic-smectic-A transition in liquid-crystal-
aerosil gels,” Phys. Rev. E, vol. 69, p. 061706, 2004.
115
[18] J. Leys, G. Sinha, C. Glorieux, and J. Thoen, “Influence of nanosized confine-
ments on 4-n-decyl-4’-cyanobiphenyl (10CB): A broadband dielectric study,”
Phys. Rev. E, vol. 71, p. 051709, 2005.
[19] P. Kedziora, “Short-range order fluctuation in the isotropic phase of solu-
tions of 4-trans-40-n-dodecylcyanobiphenyl in benzene studied by nonlinear
dielectric spectroscopy,” Acta Phys. Pol. A, vol. 107, pp. 907–916, 2005.
[20] G. Chahine, A. V. Kityk, K. Knorr, R. Lefort, and M. Guendouz, “Criti-
cality of an isotropic-to-smectic transition induced by anisotropic quenched
disorder,” Phys. Rev. E, vol. 80, p. 031703, 3 2010.
[21] I. lelidis and G. Durand, “Landau model of electric field induced smectic
phases in thermotropic liquid crystals,” J. Phys. II France, vol. 6, 1996.
[22] P. Mukherjee, H. Pleiner, and H. R. Brand, “Simple landau model of the
smectic-Aisotropic phase transition,” Eur. Phys. J. E, vol. 4, pp. 293–297,
2001.
[23] P. Mukherjee and H. Pleiner, “Pressure effect on the smectic-aisotropic phase
transition,” Phys. Rev. E, vol. 65, p. 051705, 2000.
[24] H. R. Brand, P. Mukherjee, and J. Ziolo, “Macroscopic dynamics near the
isotropicsmectic-A phase transition,” Phys. Rev. E, vol. 63, p. 061708, 2001.
[25] G. Sigaud, F. Hardouin, M. Achard, and H. Gasparoux, “Anomalous transi-
tional behaviour in mixtures of liquid crystals : A new transition of sa-sa type
?,” J. Physique Colloq. C3, vol. 40, pp. 356–359, 1979.
[26] J. Prost, “Smectic-A to smectic-A phase transition,” J. Physique, vol. 40,
p. 581, 1979.
[27] B. R. Ratna, R. Shashidhar, and V. N. Raja, “Smecti-a phase with two
colloneaar incommensurate density modulations,” Phys. Rev. Lett., vol. 55,
p. 1476, 1985.
[28] Y. H. Jeong, G. Nounesis, C. W. Garland, and R. Shashidhar, “Calorimet-
ric study of the smectic-Ad-smecti-A2 critical point,” Phys. Rev. A, vol. 40,
p. 4022, 1989.
116
[29] E. Fontes, W. K. Lee, P. A. Heiney, G. Nounesis, C. W. Garland, A. Riera,
J. P. McCauley, and A. B. Smith, “Smectic-smectic phase transitions in binary
liquid-crystalline mixtures of db5 − t8,” J. Chem. Phys., vol. 92, p. 3917, 1990.
[30] X. Wen, C. W. Garland, R. Shashidhar, and P. Barois, “Calorimetric study of
the smectic-Ad-smectic-A2 critical point in a binary homologs,” Phys. Rev.B,
vol. 45, p. 5131, 1992.
[31] P. Patel, S. S. Keast, M. E. Neubert, and S. Kumar, “Nonexistence of incom-
mensurate smectic-A phases in binary mixtures of 8OBCAC and DB8OCN,”
Phys. Rev. Lett., vol. 69, p. 301, 1992.
[32] P. Patel, L. Chen, and S. Kumar, “Phase diagram of a frustated smectic liquid-
crystal system and the absence of the incommensurate smectic-Ai1 phase,”
Phys. Rev. E, vol. 47, p. 2643, 1993.
[33] J. T. Mang, B. Cull, Y. Shi, P. Patel, and S. Kumar, “True incommensurate
phase in mixture of two polar liquid crystal materials,” Phys. Rev. Lett.,
vol. 74, p. 4241, 1995.
[34] F. Hardouin, M. F. Achard, J.-I. Jin, J.-W. Shin, and Y.-K. Yun, “Novel
sequence with incommensurate sa phases in a new dimesogenic liquid crystal,”
J. Phys. II France, vol. 4, pp. 627–643, 1994.
[35] F. Hardouin, M. F. Achard, J.-I. Jin, Y.-K. Yun, and S.-J. Chung, “Compe-
tition in low ordered smectics between incommensurate phases sic and two
dimensional modulated ones for dimesogenic compounds,” Eur. Phys. J. B,
vol. 1, pp. 47–56, 1998.
[36] P. Toledano, B. Mettout, and A. Primak, “Theory of the incommensurate
smectic-A phases in dimesogenic liquid crystals,” Eur. Phys. J. E, vol. 14,
pp. 49–54, 2004.
[37] K. Saunders, D. Hernandez, S. Pearson, and J. Toner, “Disordering to order:
de vries behavior from a landau theory for smectic phases,” Phys.Rev. Lett.,
vol. 98, p. 197801, 2007.
117
[38] F. V. Chavez, R. Acosta, and D. Pusiol, “Molecular dynamics above the
smectic a-isotropic phase transition of thermotropic liquid crystals studied by
nmr,” Chem. Phys. Lett., vol. 392, pp. 403–408, 2004.
[39] G. S. Iannacchione, C. W. Garland, J. T. Mang, and T. P. Rieker,
“Calorimetric and small angle x-ray scattering study of phase transitions in
octylcyanobiphenyl-aerosil dispersions,” Phys. Rev. E, vol. 58, p. 5966, 1998.
Chapter 6Phase transitions in carbon
nanotubes and liquid crystal
composites
6.1 Introduction
Carbon nanotubes(CNTs) are highly anisometric rigid “string-like” particles with
diameters on the order of nanometers and lengths ranging from micrometers to mil-
limeters [1]. Since their discovery [1, 2, 3], extensive studies of their unique struc-
ture and properties as well as possible applications have been reported [4, 5, 6, 7].
Liquid crystals (LCs)[8, 9] are anisotropic fluids that exhibit numerous thermo-
dynamically stable phases between an isotropic liquid and a three-dimensionally
ordered solid. In their least ordered phase, the nematic, LCs show orientational
order due to molecular self assembly and at the same time maintaining fluid flow
properties. In the smectic phase, they show both orientational and partial transla-
tional order characterized by a 1-d density wave [8, 9]. Liquid crystalline substances
have been extensively studied due to their applications and as important physical
models of self-assembly [10].
When CNTs are dispersed in a liquid crystal, they can modify the physical
properties and hence the phase behavior of the liquid crystal. In a well-dispersed
CNT in a LC host, there is surface anchoring of the LCs on the CNT surfaces,
presumably through the π − π stacking of the hexagonal structure of both the
118
119
biphenyl and graphene, that is strengthened by a binding energy originating from
charge transfer between the LCs and CNT [11]. The dispersion of these rigid
string-like nanoparticles can also locally pin the nematic director as well as the
smectic layers given homogenous surface alignment. These physical interactions
are responsible for the coupling between the orientational order parameter of the
LC with that of the CNT and represent a unique physical assembly.
In recent years, the dispersion of carbon nanotubes in different liquids and liquid
crystal media has attracted intense interest. Research has been focused on liquid
crystalline phases of CNTs [12, 13, 14, 15, 16], dispersion and alignment of CNTs
in thermotropic or lyotropic liquid crystals [17, 18, 19, 20, 21, 22, 23, 24, 25, 26, 27],
and studies of LC+CNT composite system for improving electro-optical switching
properties[28, 29, 30, 31, 32]. Recently, investigations on LC+CNT composites
have shown that the orientational order can be transferred to the dispersed CNTs
[17, 33]. It has also been observed that the aligned CNT can cause an increase of
the orientational order in the LCs [34]. Such composites have been proposed as
memory devices using their nanoelectromechanical properties [35].
Some research efforts have also been made on phase behavior and phase tran-
sitions of LC+CNT mixtures [36, 37, 38, 39, 40] . LC+CNT binary systems were
investigated using optical microscopy and DSC, finding an enhancement of the
isotropic to nematic (I-N) phase transition temperature revealing a “chimney”
type phase diagram in LC+CNT mixtures over a narrow range of ∼ 0.1−0.2 wt.%
of CNT [36]. An I-N phase transition was observed in a LC+CNT suspension
due to joule heating produced by a dc-electric field that rotates the CNT out of
sample plane short-circuiting the electrodes and producing a current flow through
the CNT [38]. A high-resolution ac-calorimetry and dielectric study of the I-N
phase transition of 5CB+CNT showed the induction of local deformations of the
nematic director and the formation of pseudo-nematic domains within the LC me-
dia [40]. Most of these studies were focused on the nematic ordering and the I-N
phase transition behavior.
In this work, we study the phase transition behavior of the liquid crystal octyl-
cyanobiphenyl, 8CB, doped with multiwall carbon naotubes (CNTs) as a function
of concentration of CNT. The incorporation of CNTs in 8CB reveals a unique phase
behavior. The I-N excess specific heat ∆Cp peak in 8CB+CNT samples is wider
120
as compared to that in pure 8CB but the N -SmA excess specific heat δCp peaks are
sharp and the wings for all the 8CB+CNT samples and the bulk overlay each other.
The I-N and the N -SmA phase transition temperatures shift slightly downwards
as compared to that of pure 8CB but remains fairly constant as a function of CNT
content up to 0.0060 weight fraction of CNTs. However, the order of the phase
transition remains unchanged from bulk, the I-N is first-order and the N -SmA is
continuous. The thermal transport properties of 8CB+CNT evolve in the ordered
nematic and smectic-A phases as a function of temperature. New calorimetric
features are observed in the nematic temperature range for intermediate CNT
concentrations. The evolution of heat capacity peak, slight change in transition
temperature and change in the thermal transport properties are likely due to the
elastic coupling between LC director and the CNT.
6.2 Experimental
6.2.1 Materials and Sample Preparation
The liquid crystal, 4-cyano-4’-octylbiphenyl (8CB), used for this experiment was
purchased from Frinton laboratory. Pure 8CB (2.3nm long and 0.5nm wide molecules
with molecular mass Mw = 291.44 g mol−1) has a weakly first-order isotropic to
nematic phase transition at T 0IN = 313.98 K, the second-order nematic to smectic-
A transition at T 0NA = 306.97 K, and strongly first-order crystal to SmA transition
at T 0CrA = 290 K [41]. Multiwall carbon nanotubes (CNTs), synthesized by chem-
ical vapor deposition technique, containing nanotubes 5 − 30 nm in diameter and
1− 5 µm in length were obtained from Dr. Saion Sinha [42] and used without fur-
ther processing. In general, the CNT are in the bundles due to the attractive Van
der Waals interaction between individual nanotubes. There is also a possibility
of physical entanglement among the tubes due to high aspect ratio and flexibility
of nanotubes. When the CNT in the composite are in bundles they may have
disordering effect in the host phase, possibly revealing strongly disturbed ordered
domain in the vicinity of the CNT bundles and the natural LC domain between
them. They can be disbundled by ultrasonication.
The 8CB was degassed under vacuum in its isotropic phase about two hours
before use. The LC, proper amount of carbon nanotubes and relatively large
121
amount of pure acetone were mixed in a vial. The mixture was then mechanically
mixed in a touch-mixer for about an hour and ultrasonicated in an ultrasonic bath
for about 10 hours in the isotropic phase of pure 8CB. After ultrasonication the
dispersion was placed over the hot plate to evaporate the acetone slowly out of the
mixture and then the mixture was degassed under vacuum at 318 K for about 2
hours. Different samples having ϕw ranging from 0.0005 to 0.0060 were prepared
using the same procedure. Here, ϕw = mCNT/(mLC +mCNT ) is the weight fraction
of CNT, where mCNT and mLC are masses of CNT and LC respectively.
When the composite sample was ready it was introduced into an envelope type
aluminum cell of dimensions ∼ 12 × 8 × 0.5 mm3. A 120 Ω strain gauge heater
and 1 MΩ carbon-flake thermistor were attached on the opposite surfaces of the
cell. The filled cell was then mounted in the high resolution calorimeter, the details
of which can be found elsewhere [43, 44, 45].
6.2.2 Ac-Calorimetry
High resolution ac-calorimetric measurement were carried out on a home made
calorimeter at WPI. In its ac mode, oscillating power Pac exp(iωt) is applied to the
cell containing a sample of finite thermal conductivity resulting in the temperature
oscillations with an amplitude Tac and a relative phase shift between temperature
oscillation and input power, φ = Φ + π2
where Φ is the absolute phase shift. The
amplitude of the temperature oscillation is given by [46],
Tac =Pac
ωC
(1 + (ωτe)
−2 + ω2τ 2ii +
2Ke
3Ki
)−1/2
, (6.1)
where, Pac is the amplitude and ω is the angular frequency of the applied heating
power, C = Cs + Cc is the total heat capacity of the sample+cell which includes
heater and thermistor. τe = C/Ke and τ 2ii = τ 2
s + τ 2c = (Cs/Ks)
2 + (Cc/Kc)2
are external and internal relaxation times respectively. Here, Ks is the thermal
conductance of the sample and Ke is the external thermal conductance to the bath.
The relative phase shift between the applied power and resulting temperature
oscillations is given by,
tanφ =1
ωτe− ωτi =
Ke
ωC− ω
(Cs
Ks
− Ch + Cθ
Kh +Kθ
), (6.2)
122
where, τi = τs + τc. The phase shift is related to both the heat capacity and the
thermal conductance of the system. If frequency of the temperature oscillation
is faster than the external equilibration time and slower than the sample internal
equilibration time, i.e.
ωτi < 1 < ωτe. (6.3)
Then, the Eq. 6.1 becomes
C ∼= Pac
ωTac
. (6.4)
The region where the inequalities 6.3 are valid can be found experimentally plotting
ωTac versus ω. The plateau observed in log-log scale of the curve is the region
where the inequalities 6.3 are valid and gives the working frequency region for the
calorimeter[47].
The specific heat at a heating frequency ω can be expressed as
Cp =C
′filled − Cempty
ms
=(Pac/ωTac) cosφ− Cempty
ms
, (6.5)
C′′p =
C′′filled
ms
=(Pac/ωTac) sinφ− (Ke/ω)
ms
, (6.6)
where, C′filled and C
′′filled are the real and imaginary parts of the heat capacity,
Cempty is the heat capacity of the empty cell, ms is the mass of the sample (in the
range of 15 to 30 mg). Equations (6.5) and (6.6) requires a small correction to
account the non-negligible internal thermal resistance as compared to Re(= 1/Ke)
and this was applied to all samples [48]. The real part of heat capacity indicates
storage (capacitance) of the thermal energy whereas the imaginary part indicates
the loss (dispersion) of energy in the sample analogous to the real and imaginary
parts of the complex permittivity. The imaginary part of the heat capacity exhibits
its non-zero value only on the dispersive regions, such as a two-phase coexistence
where the latent heat is released. But, it is zero at the temperatures corresponding
to equilibrium, one-phase states[41].
The excess specific heat associated with a phase transition can be determined
by subtracting an appropriate background CBGp from total specific heat over a wide
123
temperature range. The excess specific heat is given by
∆Cp = Cp − CBGP . (6.7)
For the N -SmA phase transition,
δCp = Cp(N − SmA) − CBLP , (6.8)
where, CBLP is the baseline or wing below N -SmA Cp phase transition peak.
The enthalpy change associated with a phase transition can be defined as
δH =
∫∆CpdT. (6.9)
For a second-order or continuous phase transitions, the limits of integration are
as wide as possible about ∆Cp peaks and the integration yields the total enthalpy
change associated with the transition. But for the first-order transitions the situ-
ation is complicated due to the presence of the coexistence region and latent heat
∆H. In this case, the total enthalpy change is the sum of the pretransitional en-
thalpy and latent heat ∆Htotal = δH + ∆H. An integration of the observed ∆Cp
peak yields an effective enthalpy change δH∗ which includes some of the latent
heat contribution. The integration of the imaginary part of heat capacity given
by Eq. 6.6 gives an imaginary enthalpy δH′′
which is the dispersion of energy in
the sample and is an indicator of the first-order character of the transition. In
ac-calorimetric technique the uncertainty in determining the enthalpy is typically
10% due to the uncertainty in the baseline and background subtraction.
6.3 Phase transitions in 8CB+CNT
6.3.1 Overview
For pure 8CB, the I-N phase transition occurs at T 0IN = 313.21 K while the N -
SmA transition occurs at T 0NA = 306.09 K, both are about 1 K lower than the
highest values reported in the literature [49]. The I-N effective enthalpy δH∗IN =
5.13 ± 0.51 J/g, the N -SmA effective enthalpy δHNA = 0.59 ± 0.06 J/g and the
I-N dispersive enthalpy δH′′IN = 0.60 ± 0.06 J/g in pure 8CB are within 10% of
124
the literature value [50]. These results are used for comparison to the composite
results.
The resulting excess specific heat ∆Cp data for 8CB+CNT samples studied on
heating as a function of temperature about TIN are shown in Fig. 6.1(a). The
TIN is defined as the high temperature limit of the I+N coexistence range. The
I-N and the N -SmA phase transitions are characterized by a distinct ∆Cp peak
for all 8CB+CNT samples similar in character to those in pure 8CB. The ∆Cp
wings are similar for all 8CB+CNT composite samples and pure 8CB below and
above the transitions revealing that the bulk-like order fluctuations are present
in the isotropic, nematic and smectic-A phases. In addition to the bulk-like 8CB
transition signatures, a new ∆Cp feature is observed in the nematic range for
intermediate values of ϕw from 0.0010 to 0.0020. This new feature presents as a
small broad peak mid-way in the nematic phase.
The imaginary specific heat C′′p as a function of temperature about TIN is
shown in Fig. 6.1(b). The C′′p exhibits a sharp peak associated with the I-N phase
transition and no peak corresponding to the N -SmA phase transition. This is
consistent with the I-N transition being weakly first-order and the N -SmA being
continuous or second-order phase transition for all ϕw. Surprisingly, the C′′p baseline
does not remain zero and temperature independent for 8CB+CNT samples. Here,
the C′′p baseline breaks to a linear temperature dependence in the nematic and
smectic-A phases on cooling. See Figure 6.1(b). The negative slope of this linear
behavior appears to be ϕw independent but the break temperature shifts towards
the TIN with increasing ϕw. This new observation will be discussed in detail in
Section 6.3.3.
A summary of transition temperatures, the nematic temperature ranges, and
enthalpies for all samples on heating is given in Table 6.1. Included are CNT
weight fraction ϕw, the I-N transition temperature TIN , the N -SmA transition
temperature TNA, the nematic range ∆TN (in Kelvin), integrated enthalpy change
δH∗IN , imaginary enthalpy δH”IN (in J/g), height of the N -SmA δCp peak, hNA (in
J/gK) and δHNA, integrated enthalpy change for the N -SmA transition (in J/g).
All data presented here were taken at a heating frequency of 31.25 mHz and at a
scanning rate of 0.2 K h−1 for -3 K≤ TNA ≤3 K and 1 K h−1 for other ranges
of temperature. For all 8CB + CNT samples each heating scan was followed by
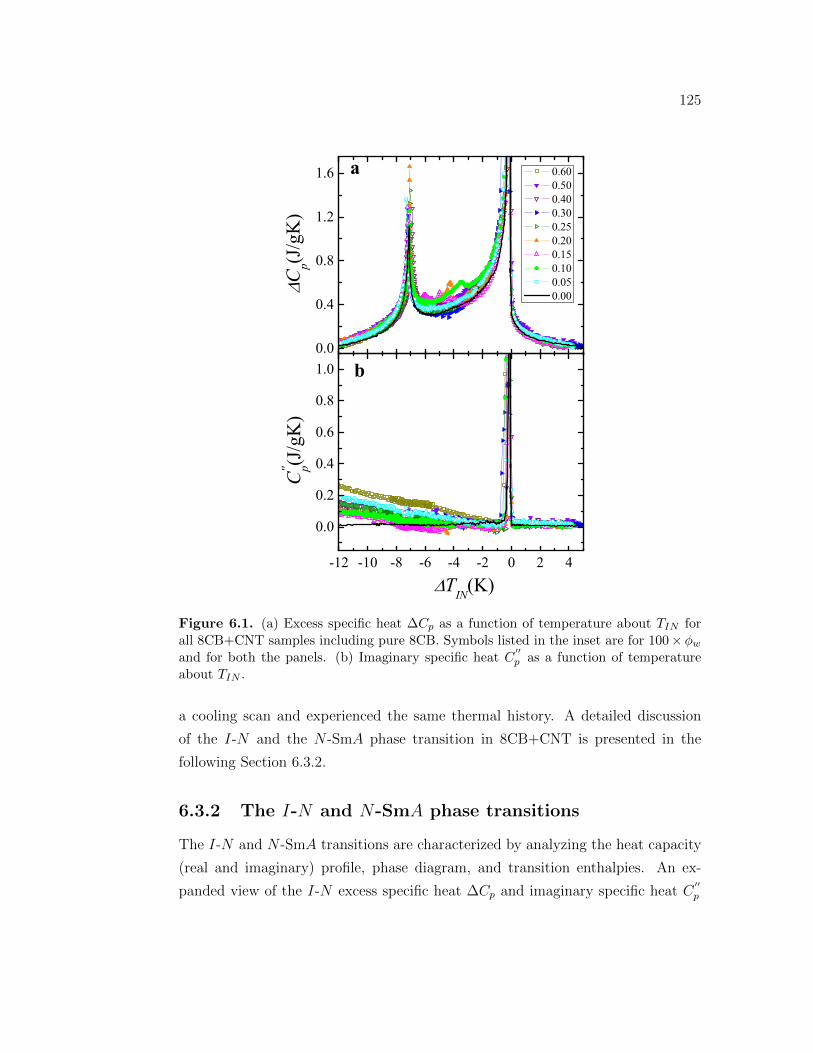
125
-12 -10 -8 -6 -4 -2 0 2 4
0.0
0.2
0.4
0.6
0.8
1.0 b
C'' p(J
/gK
)
TIN(K)
0.0
0.4
0.8
1.2
1.6 a 0.60 0.50 0.40 0.30 0.25 0.20 0.15 0.10 0.05 0.00
Cp(J
/gK
)
Figure 6.1. (a) Excess specific heat ∆Cp as a function of temperature about TIN forall 8CB+CNT samples including pure 8CB. Symbols listed in the inset are for 100 × ϕw
and for both the panels. (b) Imaginary specific heat C′′p as a function of temperature
about TIN .
a cooling scan and experienced the same thermal history. A detailed discussion
of the I-N and the N -SmA phase transition in 8CB+CNT is presented in the
following Section 6.3.2.
6.3.2 The I-N and N-SmA phase transitions
The I-N and N -SmA transitions are characterized by analyzing the heat capacity
(real and imaginary) profile, phase diagram, and transition enthalpies. An ex-
panded view of the I-N excess specific heat ∆Cp and imaginary specific heat C′′p
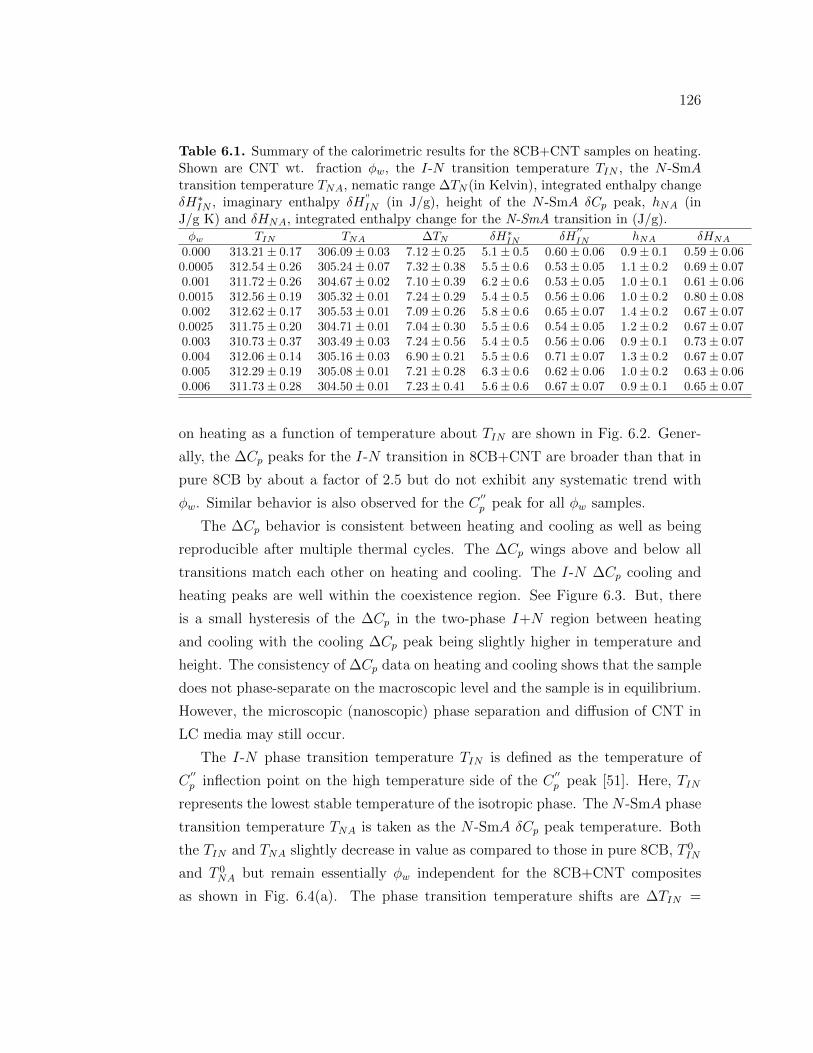
126
Table 6.1. Summary of the calorimetric results for the 8CB+CNT samples on heating.Shown are CNT wt. fraction ϕw, the I-N transition temperature TIN , the N -SmAtransition temperature TNA, nematic range ∆TN (in Kelvin), integrated enthalpy changeδH∗IN , imaginary enthalpy δH”
IN (in J/g), height of the N -SmA δCp peak, hNA (inJ/g K) and δHNA, integrated enthalpy change for the N-SmA transition in (J/g).
ϕw TIN TNA ∆TN δH∗IN δH
′′IN hNA δHNA
0.000 313.21 ± 0.17 306.09 ± 0.03 7.12 ± 0.25 5.1 ± 0.5 0.60 ± 0.06 0.9 ± 0.1 0.59 ± 0.060.0005 312.54 ± 0.26 305.24 ± 0.07 7.32 ± 0.38 5.5 ± 0.6 0.53 ± 0.05 1.1 ± 0.2 0.69 ± 0.070.001 311.72 ± 0.26 304.67 ± 0.02 7.10 ± 0.39 6.2 ± 0.6 0.53 ± 0.05 1.0 ± 0.1 0.61 ± 0.060.0015 312.56 ± 0.19 305.32 ± 0.01 7.24 ± 0.29 5.4 ± 0.5 0.56 ± 0.06 1.0 ± 0.2 0.80 ± 0.080.002 312.62 ± 0.17 305.53 ± 0.01 7.09 ± 0.26 5.8 ± 0.6 0.65 ± 0.07 1.4 ± 0.2 0.67 ± 0.070.0025 311.75 ± 0.20 304.71 ± 0.01 7.04 ± 0.30 5.5 ± 0.6 0.54 ± 0.05 1.2 ± 0.2 0.67 ± 0.070.003 310.73 ± 0.37 303.49 ± 0.03 7.24 ± 0.56 5.4 ± 0.5 0.56 ± 0.06 0.9 ± 0.1 0.73 ± 0.070.004 312.06 ± 0.14 305.16 ± 0.03 6.90 ± 0.21 5.5 ± 0.6 0.71 ± 0.07 1.3 ± 0.2 0.67 ± 0.070.005 312.29 ± 0.19 305.08 ± 0.01 7.21 ± 0.28 6.3 ± 0.6 0.62 ± 0.06 1.0 ± 0.2 0.63 ± 0.060.006 311.73 ± 0.28 304.50 ± 0.01 7.23 ± 0.41 5.6 ± 0.6 0.67 ± 0.07 0.9 ± 0.1 0.65 ± 0.07
on heating as a function of temperature about TIN are shown in Fig. 6.2. Gener-
ally, the ∆Cp peaks for the I-N transition in 8CB+CNT are broader than that in
pure 8CB by about a factor of 2.5 but do not exhibit any systematic trend with
ϕw. Similar behavior is also observed for the C′′p peak for all ϕw samples.
The ∆Cp behavior is consistent between heating and cooling as well as being
reproducible after multiple thermal cycles. The ∆Cp wings above and below all
transitions match each other on heating and cooling. The I-N ∆Cp cooling and
heating peaks are well within the coexistence region. See Figure 6.3. But, there
is a small hysteresis of the ∆Cp in the two-phase I+N region between heating
and cooling with the cooling ∆Cp peak being slightly higher in temperature and
height. The consistency of ∆Cp data on heating and cooling shows that the sample
does not phase-separate on the macroscopic level and the sample is in equilibrium.
However, the microscopic (nanoscopic) phase separation and diffusion of CNT in
LC media may still occur.
The I-N phase transition temperature TIN is defined as the temperature of
C′′p inflection point on the high temperature side of the C
′′p peak [51]. Here, TIN
represents the lowest stable temperature of the isotropic phase. The N -SmA phase
transition temperature TNA is taken as the N -SmA δCp peak temperature. Both
the TIN and TNA slightly decrease in value as compared to those in pure 8CB, T 0IN
and T 0NA but remain essentially ϕw independent for the 8CB+CNT composites
as shown in Fig. 6.4(a). The phase transition temperature shifts are ∆TIN =
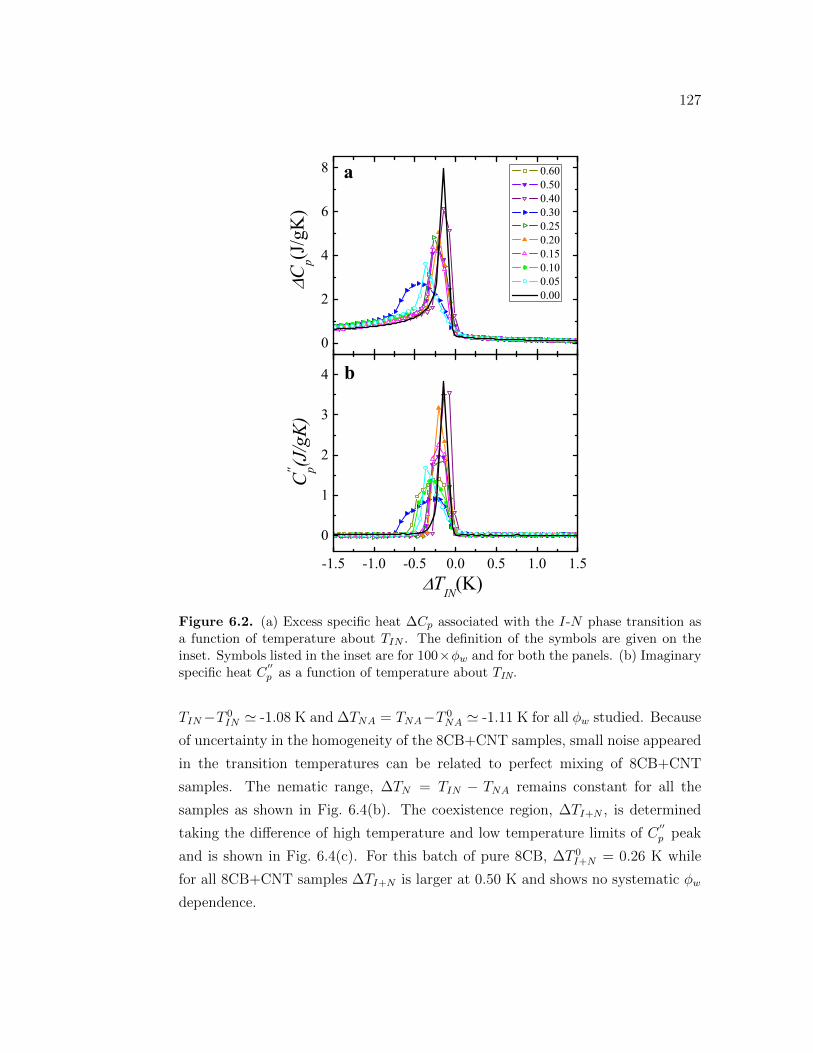
127
-1.5 -1.0 -0.5 0.0 0.5 1.0 1.5
0
1
2
3
4 b
C'' p(J
/gK)
TIN(K)
0
2
4
6
8 0.60 0.50 0.40 0.30 0.25 0.20 0.15 0.10 0.05 0.00
Cp(J
/gK
)
a
Figure 6.2. (a) Excess specific heat ∆Cp associated with the I-N phase transition asa function of temperature about TIN . The definition of the symbols are given on theinset. Symbols listed in the inset are for 100×ϕw and for both the panels. (b) Imaginaryspecific heat C
′′p as a function of temperature about TIN.
TIN −T 0IN ≃ -1.08 K and ∆TNA = TNA−T 0
NA ≃ -1.11 K for all ϕw studied. Because
of uncertainty in the homogeneity of the 8CB+CNT samples, small noise appeared
in the transition temperatures can be related to perfect mixing of 8CB+CNT
samples. The nematic range, ∆TN = TIN − TNA remains constant for all the
samples as shown in Fig. 6.4(b). The coexistence region, ∆TI+N , is determined
taking the difference of high temperature and low temperature limits of C′′p peak
and is shown in Fig. 6.4(c). For this batch of pure 8CB, ∆T 0I+N = 0.26 K while
for all 8CB+CNT samples ∆TI+N is larger at 0.50 K and shows no systematic ϕw
dependence.
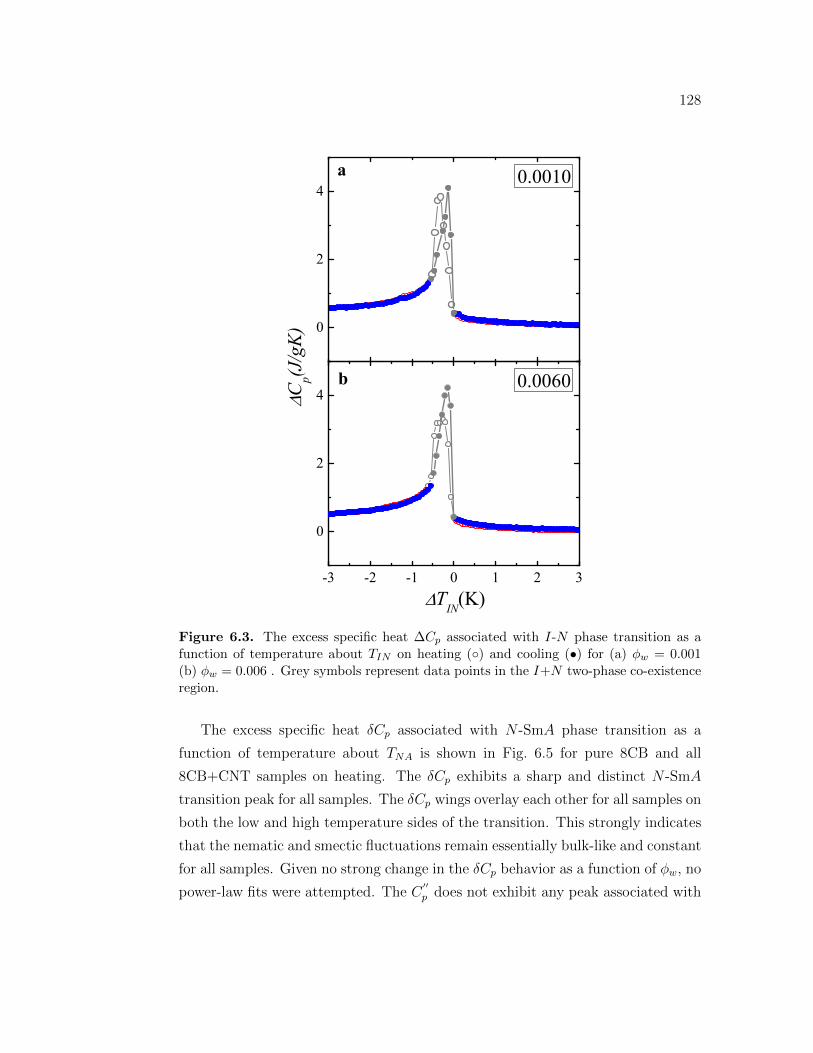
128
-3 -2 -1 0 1 2 3
0
2
40.0060b
TIN(K)
0
2
4a
C
p(J/gK)
0.0010
Figure 6.3. The excess specific heat ∆Cp associated with I-N phase transition as afunction of temperature about TIN on heating () and cooling (•) for (a) ϕw = 0.001(b) ϕw = 0.006 . Grey symbols represent data points in the I+N two-phase co-existenceregion.
The excess specific heat δCp associated with N -SmA phase transition as a
function of temperature about TNA is shown in Fig. 6.5 for pure 8CB and all
8CB+CNT samples on heating. The δCp exhibits a sharp and distinct N -SmA
transition peak for all samples. The δCp wings overlay each other for all samples on
both the low and high temperature sides of the transition. This strongly indicates
that the nematic and smectic fluctuations remain essentially bulk-like and constant
for all samples. Given no strong change in the δCp behavior as a function of ϕw, no
power-law fits were attempted. The C′′p does not exhibit any peak associated with
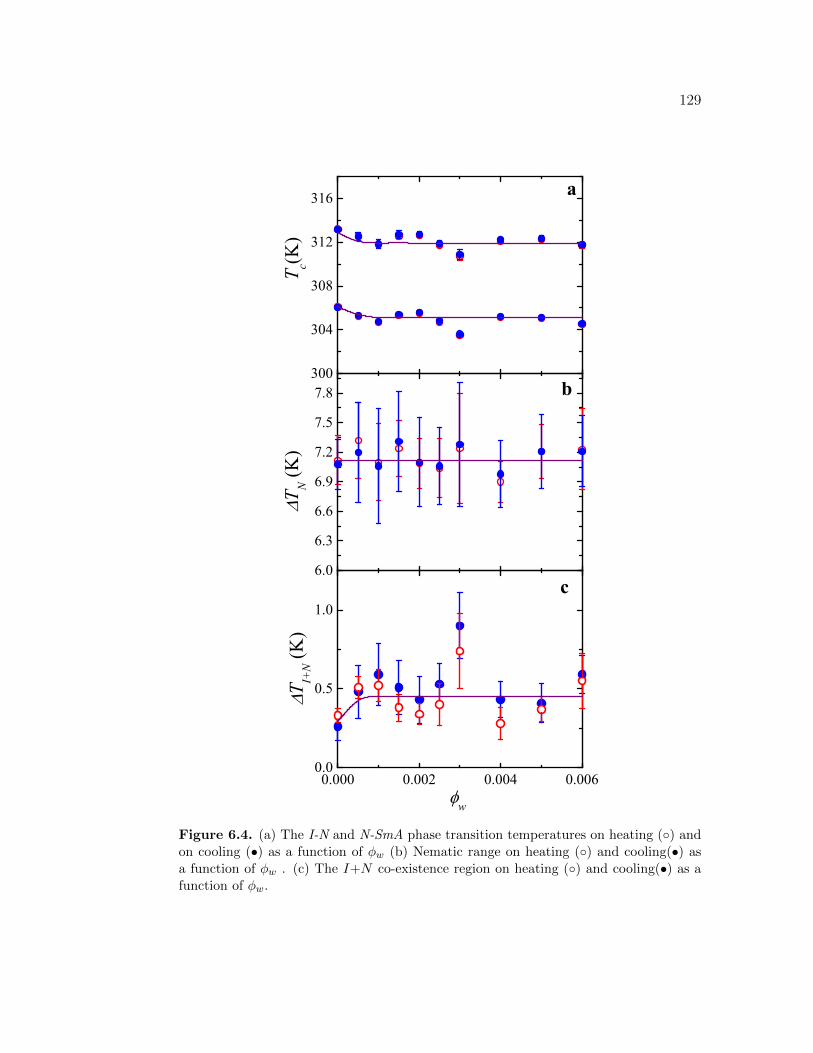
129
6.0
6.3
6.6
6.9
7.2
7.5
7.8300
304
308
312
316
0.000 0.002 0.004 0.0060.0
0.5
1.0
b
T c(K)
T N (K
)
a
c
w
T I+N (K
)
Figure 6.4. (a) The I-N and N-SmA phase transition temperatures on heating () andon cooling (•) as a function of ϕw (b) Nematic range on heating () and cooling(•) asa function of ϕw . (c) The I+N co-existence region on heating () and cooling(•) as afunction of ϕw.
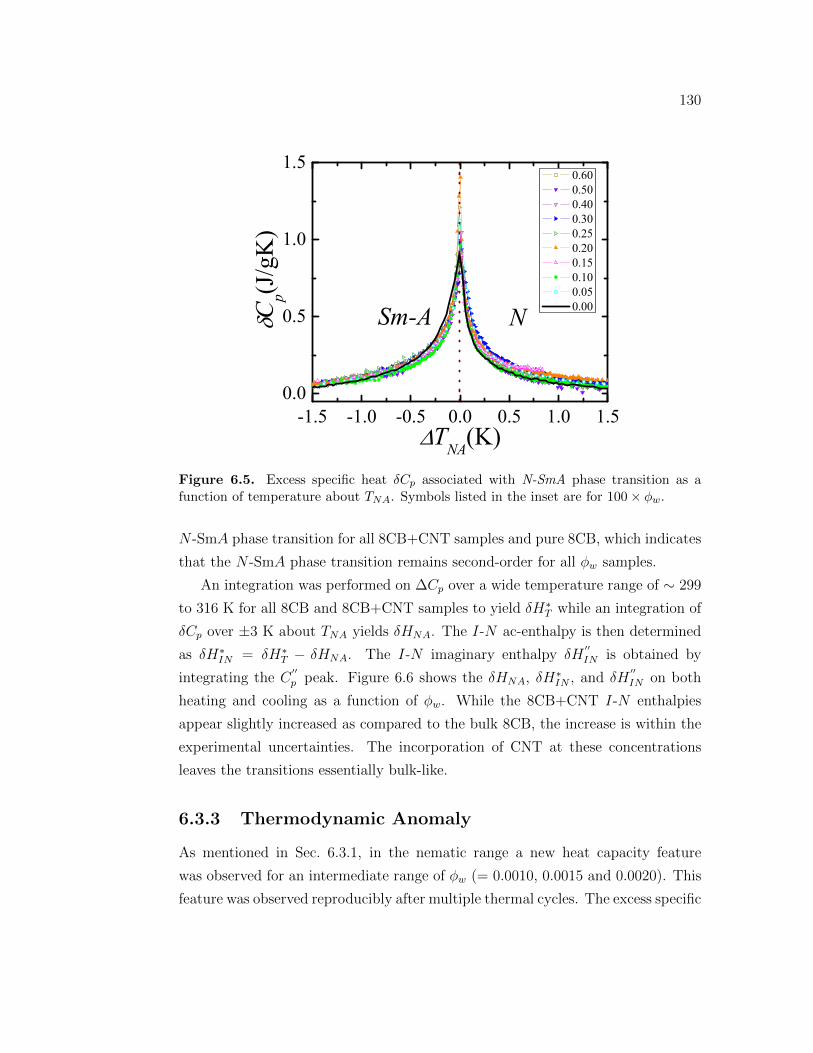
130
-1.5 -1.0 -0.5 0.0 0.5 1.0 1.50.0
0.5
1.0
1.5 0.60 0.50 0.40 0.30 0.25 0.20 0.15 0.10 0.05 0.00
Cp(J
/gK
)
TNA(K)
NSm-A
Figure 6.5. Excess specific heat δCp associated with N-SmA phase transition as afunction of temperature about TNA. Symbols listed in the inset are for 100 × ϕw.
N -SmA phase transition for all 8CB+CNT samples and pure 8CB, which indicates
that the N -SmA phase transition remains second-order for all ϕw samples.
An integration was performed on ∆Cp over a wide temperature range of ∼ 299
to 316 K for all 8CB and 8CB+CNT samples to yield δH∗T while an integration of
δCp over ±3 K about TNA yields δHNA. The I-N ac-enthalpy is then determined
as δH∗IN = δH∗T − δHNA. The I-N imaginary enthalpy δH′′IN is obtained by
integrating the C′′p peak. Figure 6.6 shows the δHNA, δH∗IN , and δH
′′IN on both
heating and cooling as a function of ϕw. While the 8CB+CNT I-N enthalpies
appear slightly increased as compared to the bulk 8CB, the increase is within the
experimental uncertainties. The incorporation of CNT at these concentrations
leaves the transitions essentially bulk-like.
6.3.3 Thermodynamic Anomaly
As mentioned in Sec. 6.3.1, in the nematic range a new heat capacity feature
was observed for an intermediate range of ϕw (= 0.0010, 0.0015 and 0.0020). This
feature was observed reproducibly after multiple thermal cycles. The excess specific
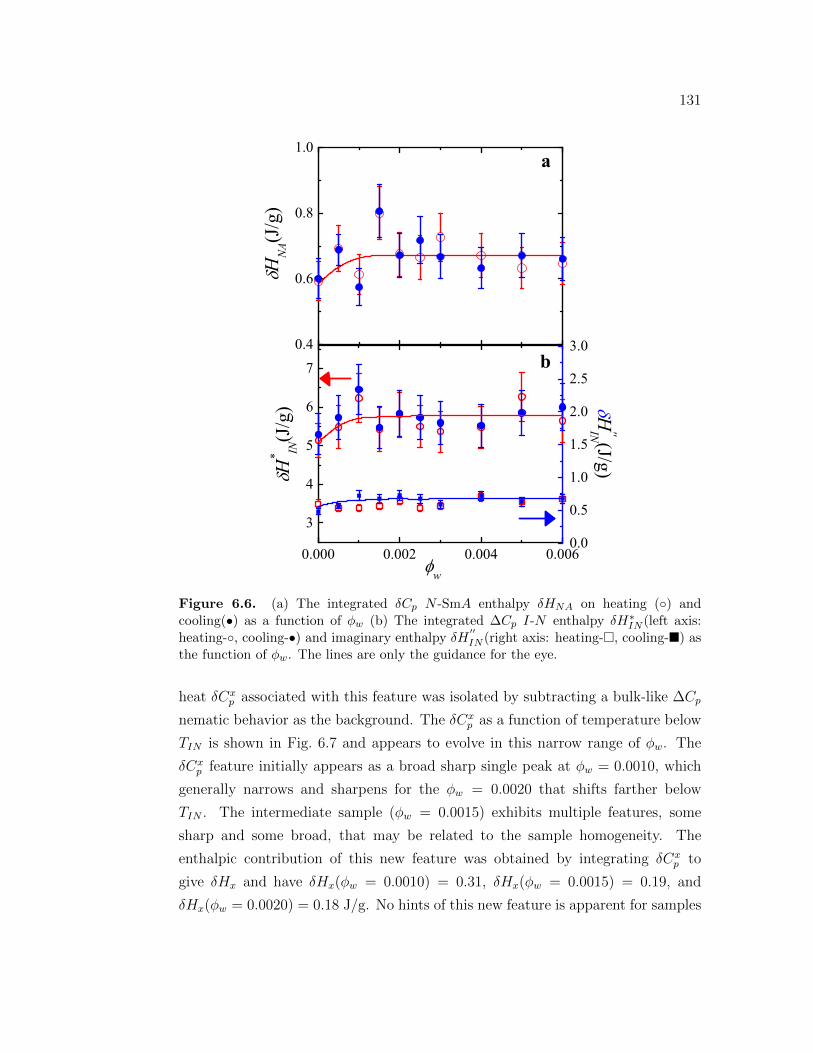
131
0.4
0.6
0.8
1.0
0.000 0.002 0.004 0.006
3
4
5
6
7
0.0
0.5
1.0
1.5
2.0
2.5
3.0
a
H
NA(
J/g)
w
b
H* IN
(J/g
)
H''IN (J/g)
Figure 6.6. (a) The integrated δCp N -SmA enthalpy δHNA on heating () andcooling(•) as a function of ϕw (b) The integrated ∆Cp I-N enthalpy δH∗IN (left axis:heating-, cooling-•) and imaginary enthalpy δH
′′IN (right axis: heating-, cooling-) as
the function of ϕw. The lines are only the guidance for the eye.
heat δCxp associated with this feature was isolated by subtracting a bulk-like ∆Cp
nematic behavior as the background. The δCxp as a function of temperature below
TIN is shown in Fig. 6.7 and appears to evolve in this narrow range of ϕw. The
δCxp feature initially appears as a broad sharp single peak at ϕw = 0.0010, which
generally narrows and sharpens for the ϕw = 0.0020 that shifts farther below
TIN . The intermediate sample (ϕw = 0.0015) exhibits multiple features, some
sharp and some broad, that may be related to the sample homogeneity. The
enthalpic contribution of this new feature was obtained by integrating δCxp to
give δHx and have δHx(ϕw = 0.0010) = 0.31, δHx(ϕw = 0.0015) = 0.19, and
δHx(ϕw = 0.0020) = 0.18 J/g. No hints of this new feature is apparent for samples
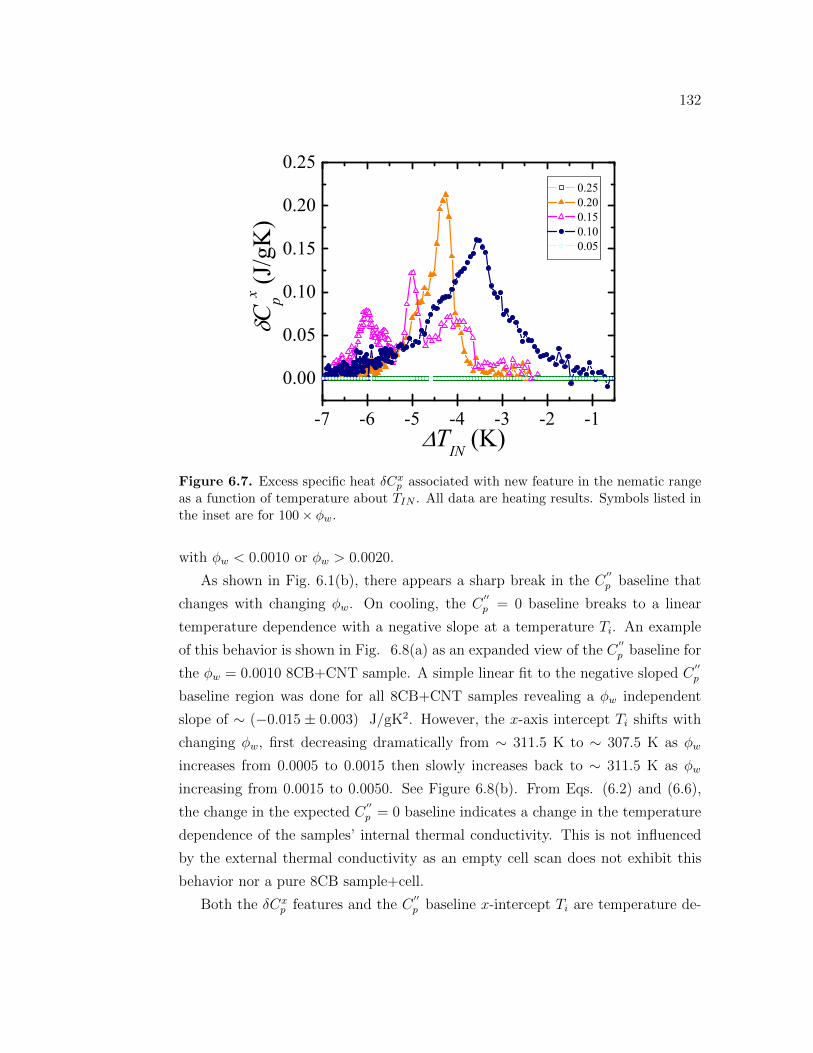
132
-7 -6 -5 -4 -3 -2 -1
0.00
0.05
0.10
0.15
0.20
0.25
TIN (K)
Cpx (J
/gK
)
0.25 0.20 0.15 0.10 0.05
Figure 6.7. Excess specific heat δCxp associated with new feature in the nematic range
as a function of temperature about TIN . All data are heating results. Symbols listed inthe inset are for 100 × ϕw.
with ϕw < 0.0010 or ϕw > 0.0020.
As shown in Fig. 6.1(b), there appears a sharp break in the C′′p baseline that
changes with changing ϕw. On cooling, the C′′p = 0 baseline breaks to a linear
temperature dependence with a negative slope at a temperature Ti. An example
of this behavior is shown in Fig. 6.8(a) as an expanded view of the C′′p baseline for
the ϕw = 0.0010 8CB+CNT sample. A simple linear fit to the negative sloped C′′p
baseline region was done for all 8CB+CNT samples revealing a ϕw independent
slope of ∼ (−0.015 ± 0.003) J/gK2. However, the x-axis intercept Ti shifts with
changing ϕw, first decreasing dramatically from ∼ 311.5 K to ∼ 307.5 K as ϕw
increases from 0.0005 to 0.0015 then slowly increases back to ∼ 311.5 K as ϕw
increasing from 0.0015 to 0.0050. See Figure 6.8(b). From Eqs. (6.2) and (6.6),
the change in the expected C′′p = 0 baseline indicates a change in the temperature
dependence of the samples’ internal thermal conductivity. This is not influenced
by the external thermal conductivity as an empty cell scan does not exhibit this
behavior nor a pure 8CB sample+cell.
Both the δCxp features and the C
′′p baseline x-intercept Ti are temperature de-
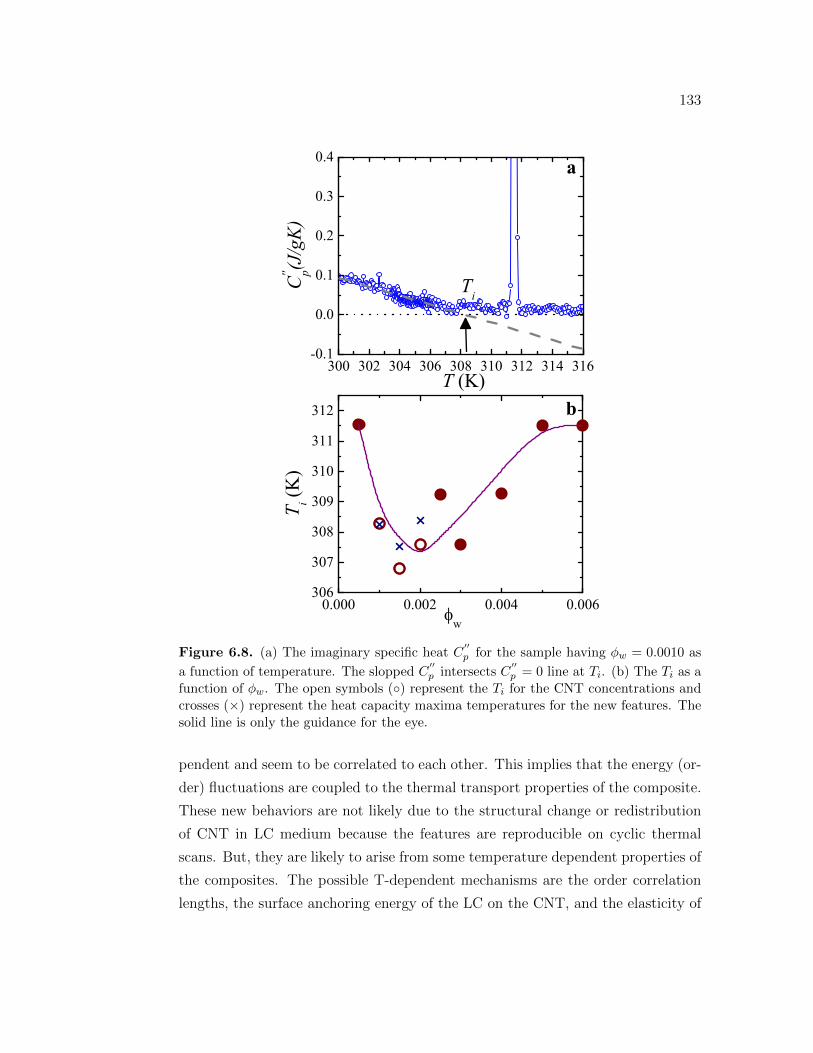
133
0.000 0.002 0.004 0.006306
307
308
309
310
311
312
T (K)
T i (K
)
w
b
300 302 304 306 308 310 312 314 316
-0.1
0.0
0.1
0.2
0.3
0.4
Ti
a
C
'' p(J/gK)
Figure 6.8. (a) The imaginary specific heat C′′p for the sample having ϕw = 0.0010 as
a function of temperature. The slopped C′′p intersects C
′′p = 0 line at Ti. (b) The Ti as a
function of ϕw. The open symbols () represent the Ti for the CNT concentrations andcrosses (×) represent the heat capacity maxima temperatures for the new features. Thesolid line is only the guidance for the eye.
pendent and seem to be correlated to each other. This implies that the energy (or-
der) fluctuations are coupled to the thermal transport properties of the composite.
These new behaviors are not likely due to the structural change or redistribution
of CNT in LC medium because the features are reproducible on cyclic thermal
scans. But, they are likely to arise from some temperature dependent properties of
the composites. The possible T-dependent mechanisms are the order correlation
lengths, the surface anchoring energy of the LC on the CNT, and the elasticity of
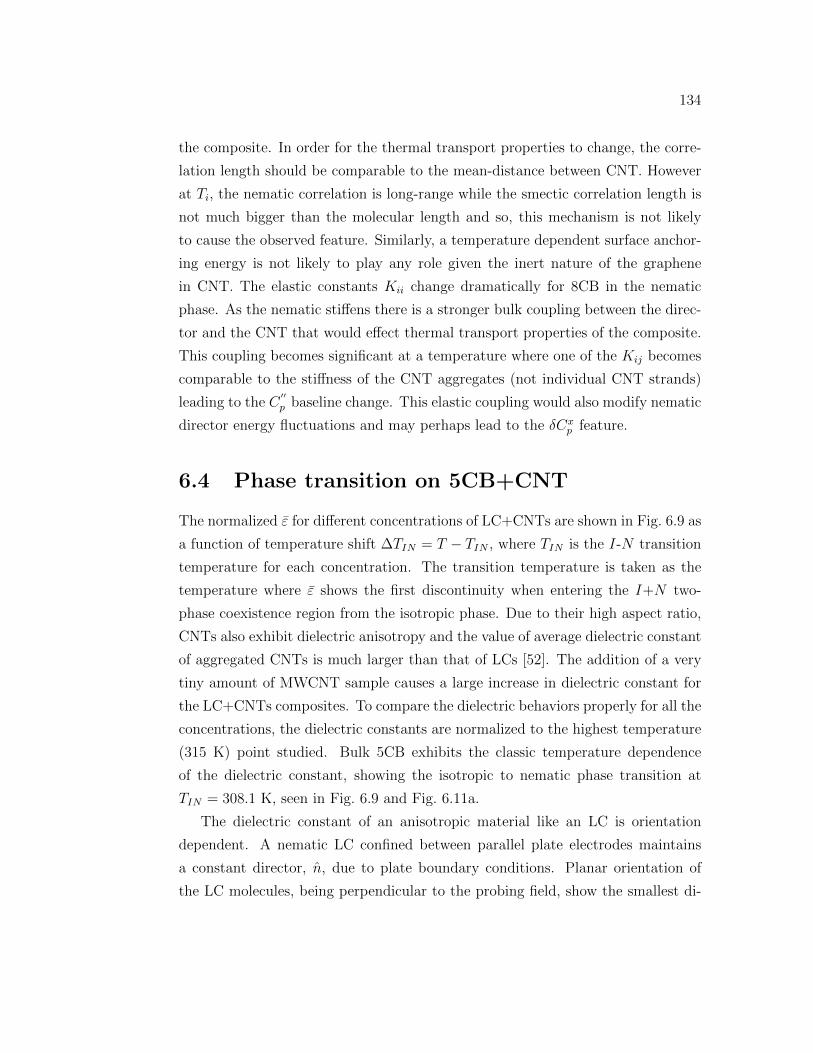
134
the composite. In order for the thermal transport properties to change, the corre-
lation length should be comparable to the mean-distance between CNT. However
at Ti, the nematic correlation is long-range while the smectic correlation length is
not much bigger than the molecular length and so, this mechanism is not likely
to cause the observed feature. Similarly, a temperature dependent surface anchor-
ing energy is not likely to play any role given the inert nature of the graphene
in CNT. The elastic constants Kii change dramatically for 8CB in the nematic
phase. As the nematic stiffens there is a stronger bulk coupling between the direc-
tor and the CNT that would effect thermal transport properties of the composite.
This coupling becomes significant at a temperature where one of the Kij becomes
comparable to the stiffness of the CNT aggregates (not individual CNT strands)
leading to the C′′p baseline change. This elastic coupling would also modify nematic
director energy fluctuations and may perhaps lead to the δCxp feature.
6.4 Phase transition on 5CB+CNT
The normalized ε for different concentrations of LC+CNTs are shown in Fig. 6.9 as
a function of temperature shift ∆TIN = T − TIN , where TIN is the I-N transition
temperature for each concentration. The transition temperature is taken as the
temperature where ε shows the first discontinuity when entering the I+N two-
phase coexistence region from the isotropic phase. Due to their high aspect ratio,
CNTs also exhibit dielectric anisotropy and the value of average dielectric constant
of aggregated CNTs is much larger than that of LCs [52]. The addition of a very
tiny amount of MWCNT sample causes a large increase in dielectric constant for
the LC+CNTs composites. To compare the dielectric behaviors properly for all the
concentrations, the dielectric constants are normalized to the highest temperature
(315 K) point studied. Bulk 5CB exhibits the classic temperature dependence
of the dielectric constant, showing the isotropic to nematic phase transition at
TIN = 308.1 K, seen in Fig. 6.9 and Fig. 6.11a.
The dielectric constant of an anisotropic material like an LC is orientation
dependent. A nematic LC confined between parallel plate electrodes maintains
a constant director, n, due to plate boundary conditions. Planar orientation of
the LC molecules, being perpendicular to the probing field, show the smallest di-
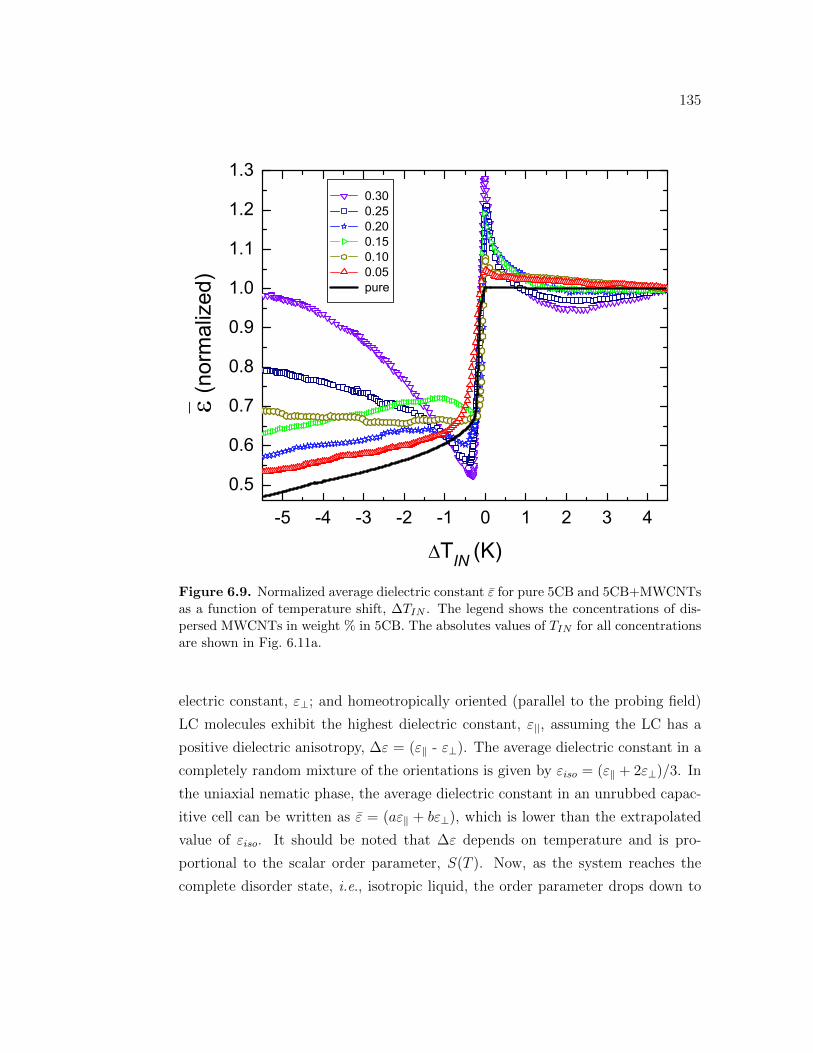
135
-5 -4 -3 -2 -1 0 1 2 3 4
0.5
0.6
0.7
0.8
0.9
1.0
1.1
1.2
1.3 0.30 0.25 0.20 0.15 0.10 0.05 pure
(nor
mal
ized
)
TIN (K)
Figure 6.9. Normalized average dielectric constant ε for pure 5CB and 5CB+MWCNTsas a function of temperature shift, ∆TIN . The legend shows the concentrations of dis-persed MWCNTs in weight % in 5CB. The absolutes values of TIN for all concentrationsare shown in Fig. 6.11a.
electric constant, ε⊥; and homeotropically oriented (parallel to the probing field)
LC molecules exhibit the highest dielectric constant, ε||, assuming the LC has a
positive dielectric anisotropy, ∆ε = (ε∥ - ε⊥). The average dielectric constant in a
completely random mixture of the orientations is given by εiso = (ε∥ + 2ε⊥)/3. In
the uniaxial nematic phase, the average dielectric constant in an unrubbed capac-
itive cell can be written as ε = (aε∥ + bε⊥), which is lower than the extrapolated
value of εiso. It should be noted that ∆ε depends on temperature and is pro-
portional to the scalar order parameter, S(T ). Now, as the system reaches the
complete disorder state, i.e., isotropic liquid, the order parameter drops down to
136
zero. This leads to the idea of having no temperature dependence of εiso. As
seen in Fig. 6.9, above the I-N transition temperature the dielectric constant flat-
tens out in the isotropic phase and shows no significant temperature dependence
(∂εiso/∂T = f(T )), indicating that bulk 5CB reaches complete disorder state with
S(T ) = 0.
The I-N phase transition for pure 5CB has been found at TIN = 307.8 K by
using the ac-calorimetry technique. The excess heat capacity, ∆Cp, associated with
the phase transition was determined by subtracting an appropriate background
CBGp from total heat capacity over a wide temperature range; ∆Cp = Cp−CBG
P [41,
53]. The resulting ∆Cp data for LC+CNTs samples studied are shown in Fig. 6.10
over a 10 K temperature range window about TIN . The transition temperature TIN
is taken as the approximate inflection point of C” vs T curve on the isotropic side
of the transition. The excess heat capacity ∆Cp peaks evolved in size and have a
small downward shift of the transition temperature with increasing wt% of CNTs.
The small transition temperatures shift in the presence of CNTs is likely due to
the large density differences between the liquid crystal and CNTs [54]. The nature
of the ∆Cp wings in Fig. 6.10 for the I-N transitions are similar for all samples
with two extra features on each side of the transition for the highest concentration
(0.3 wt%) studied. This is possibly due to the transition of pseudo-nematic phases
of dispersed CNTs in the LC media.
Small wt% of CNTs dispersed and suspended in the LC media do not appear
to be frozen in the system but rather diffuse in the nematic matrix due to ther-
mal fluctuation. This situation can be visualized as annealed random variables
evolving with time. The nano-dynamics of CNTs induce local deformation of LC
nematic director. As the CNT concentration increases the larger local deformation
occurs. The local molecular arrangements have a profound impact on the dielec-
tric response in a particular system and the larger the ∆ε the smaller the electric
field is needed to reorient the director. Here, the ∆ε of aggregated CNTs is much
higher than that of LCs and so presumably ∆ε increases locally in the LC+CNTs
system. This results in locally ordered domains more responsive to the fixed prob-
ing field, hence the dramatic evolution in the nematic phase with increasing CNTs
concentrations, clearly seen in Fig. 6.9. Figure 6.11c shows the normalized ε at
the lowest temperature (302 K) as a function of concentration of CNTs. Clearly
137
-5 -4 -3 -2 -1 0 1 2 3 40.00
0.25
0.50
0.75
1.00
1.25
1.50
1.75
2.00
0.30 0.25 0.20 0.15 0.10 0.05 pure
CP(J
/gK
)
TIN (K)
Figure 6.10. Excess specific heat ∆Cp for pure 5CB and 5CB+MWCNTs as a functionof temperature shift, ∆TIN . The legend shows the concentrations of dispersed MWCNTsin weight % in 5CB. The absolutes values of TIN for all concentrations are shown inFig. 6.11a.
there is a crossover region between 0.1 to 0.2 wt%. Above the crossover region
the locally ordered domains tend to align along the field and below the crossover
region, the system is not as responsive to the low probing field. This explains
the downward curvatures in the nematic phase for the higher concentrations ob-
served in Fig. 6.9. Due to the elastic coupling and presumably strong anchoring
of LCs to the nanotube-surfaces, both species co-operatively create local short-
range orientation order [55, 34]. In addition, the CNTs themselves may form a
lyotropic nematic phase when they are dispersed in a fluid [13]. The curvatures
(∂εiso/∂T = f(T )) in the isotropic phase for LC+CNTs seen in Fig. 6.9 are evi-
dence of local pseudo-nematic order formed by CNTs in an isotropic liquid. The
larger the CNT concentration the more curvature in ε occurs above TIN consis-
tent with the formation of local order as a lyotropic pseudo-nematic. It has been
observed that for T ≥ 315 K, the ε becomes independent of temperature for all
138
concentrations, indicating that the pseudo-nematic order eventually erases and the
system reaches a complete isotropic state.
The total enthalpy change associated with a first-order phase transition is the
sum of the pre-transitional enthalpy (area under the pre-transitional ∆Cp wings)
and the latent heat. Due to partial phase conversion (N ↔ I) during a Tac cycle,
typical ∆Cp values obtained in two phase coexistence region are artificially high
and frequency dependent. An effective enthalpy change δH∗IN which includes some
of the latent heat contribution was obtained by integrating the observed ∆Cp peak
over a wide temperature range of around 300 to 312 K for all 5CB+CNTs samples.
The integration of the imaginary part of the heat capacity given by Eq. (6.6) yields
the imaginary transition enthalpy δH”IN , which is the dispersion of energy in the
sample and an indicator of the first-order character of the transition. As fixed
frequency was used for this work, δH”IN is only proportional to the transition latent
heat. In an ac-calorimetric technique, the uncertainty in determining the enthalpy
is typically 10% due to the base-line and background subtractions. The results of
δH∗IN and δH”IN as a function of CNT concentrations for all 5CB+CNTs samples
are shown in Fig. 6.11b. The effective enthalpy δH∗IN and the imaginary-enthalpy,
δH”IN fluctuates slightly, but overall are essentially constant with increasing CNT
concentration. This taken with the sharpness of ∆Cp shown in Fig. 6.10 indicate
that the presence of the CNTs do not induce quenched disorder.
6.5 Conclusions
We have undertaken a detailed calorimetric and dielectric studies on the effect of
anisometric, rod like carbon nanotubes in octylcyanobiphenyl (8CB) and pentyl-
cyanobiphenyl (5CB) on the weakly first-order I-N and the continuous N -SmA
phase transitions. Slight change in transition temperatures occur as CNT are
added in LC but remains fairly constant for all composites. Both transitions evolve
without showing any systematic trend with change in ϕw. The order of the tran-
sition remains the same being the I-N first-order and the N -SmA second-order.
The addition of CNT causes small change in order fluctuations in nematic and
smectic-A phases. The change in thermal transport properties is observed as a
function of carbon nanotube concentration and temperature due to the interaction
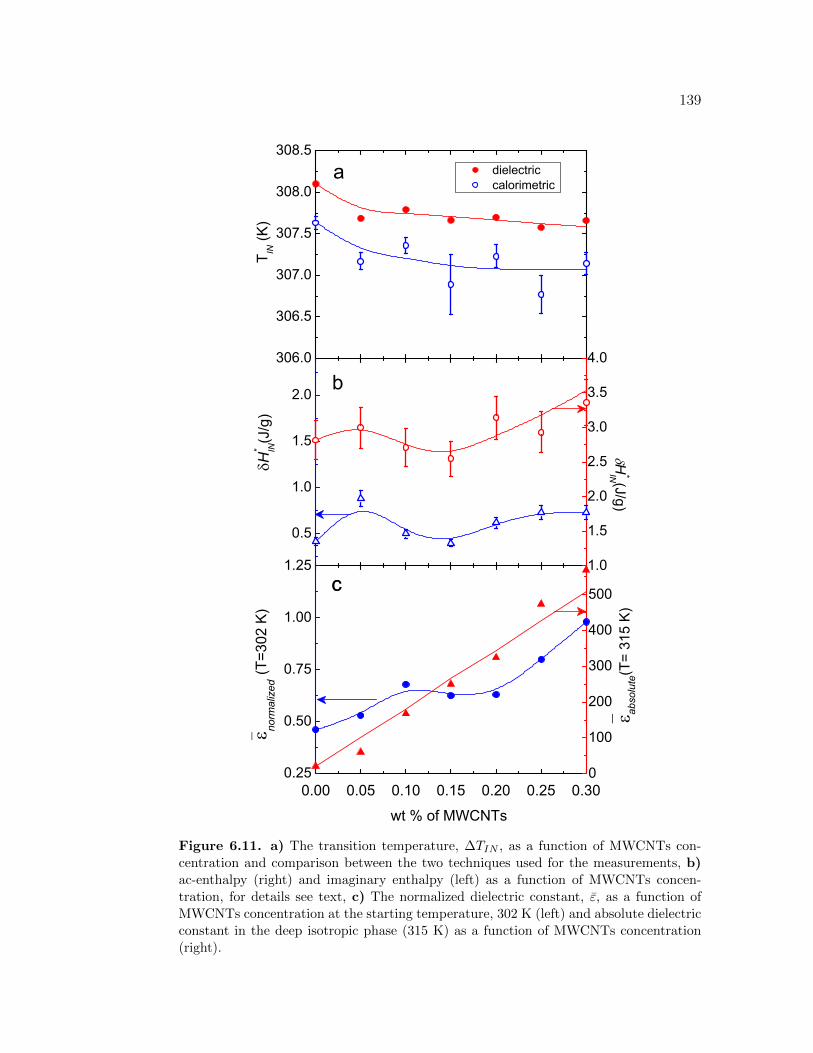
139
306.0
306.5
307.0
307.5
308.0
308.5
1.0
1.5
2.0
2.5
3.0
3.5
4.0
0.5
1.0
1.5
2.0
0.00 0.05 0.10 0.15 0.20 0.25 0.300.25
0.50
0.75
1.00
1.25
0
100
200
300
400
500
dielectric calorimetric
a
T IN (K
)
b
H*IN (J/g)
H" IN
(J/g
)
c
norm
alized
(T=3
02 K
)
wt % of MWCNTs
c
abso
lute
(T=
315
K)
Figure 6.11. a) The transition temperature, ∆TIN , as a function of MWCNTs con-centration and comparison between the two techniques used for the measurements, b)ac-enthalpy (right) and imaginary enthalpy (left) as a function of MWCNTs concen-tration, for details see text, c) The normalized dielectric constant, ε, as a function ofMWCNTs concentration at the starting temperature, 302 K (left) and absolute dielectricconstant in the deep isotropic phase (315 K) as a function of MWCNTs concentration(right).
140
of CNTs with LC molecules. The slight transition temperature change is likely
due to the density differences between the liquid crystal and CNTs and due to
the coupling between CNTs and LC ordering. But slight change in enthalpies is
observed in the samples due to the addition of CNT.
These effects of incorporating the CNT with LC are likely due to the elastic
coupling between the CNT and LC, the change in the elastic properties of the
composite and the thermal anisotropic properties of CNT.
Bibliography
[1] M. Dresselhaus, G. Dreselhaus, and R. Satito, “Carbob fibers based on c60
and their symmetry,” Phys. Rev B, vol. 45, pp. 6234–6242, 1992.
[2] S. Iijima Nature, vol. 354, pp. 56–58, 1991.
[3] M. Bockrath, D. H. Cobden, P. L. McEuen, N. G. Chopra, A. Zettl, A. Thess,
and R. E. Smalley Sceince, vol. 275, p. 1922, 1997.
[4] R. H. Baughman, C. Cui, A. A. Zakhidov, Z. Iqbal, J. N. Barisci, G. M.
Spinks, G. G. Wallace, A. Mazzoldi, D. D. Rossi, A. G. Rinzler, O. Jaschinski,
S. Roth, and M. Kertesz Science, vol. 284, p. 1340, 1999.
[5] W. A. de Heer, J.-M. Bonard, A. C. Kai Fauth, L. Forro, and D. U. Herr Adv.
Mater., vol. 9, p. 87, 1997.
[6] G. Che, B. B. Lakshmi, E. R. Fisher, and C. R. Martin Nature, vol. 393,
p. 346, 1998.
[7] P. G. Collins, A. Zettl, H. Bando, A. Thess, and R. E. Smalley Science,
vol. 278, p. 100, 1997.
[8] P. G. de Gennes and J. Prost, The Physics of Liquid Crystals. Clarendon,
Oxford, England: Oxford University Press, 1993.
[9] S. Chandrashekhar, Liquid Crystals. England: Cambridge University Press,
1992.
141
142
[10] D. Demus, J. Goodby, G. Gray, H. Spiess, and V. Vill-eds., Hand Book of
Liquid Crystals. Canada: 1 Wiley-VCH, Weinheim, 1998.
[11] K. A. Park, S. M. Lee, S. H. Lee, and Y. H. Lee, “Anchoring a liquid crystal
molecule on a single-walled carbon nanotube,” J. Phys. Chem. C, vol. 111,
pp. 1620–1624, 2007.
[12] A. M. Somoza, C. Sagui, and C. Roland, “Liquid-crystal phases of capped
carbon nanotubes,” Phys. Rev. B, vol. 63, p. 081403(R), 2001.
[13] W. Song, I. A. Kinloch, and A. H. Windle, “Nematic liquid crystallinity of
multiwall carbon nanotubes,” Science, vol. 302, p. 1363, 2003.
[14] W. Song and A. H. Windle, “Isotropic -nematic phase transition of dispersion
of multiwall carbon nanotubes,” Macromolecules, vol. 38, pp. 6181–6188, 2005.
[15] P. K. Rai, R. A. Pinnick, A. N. G. Para-Vasquez, V. A. Davis, H. K. Schmidt,
R. H. Hauge, R. E. Smalley, and M. Pasquali, “Isotropic-nematic phase tran-
sition of single-walled carbon nanotubes in strong acids,” J. Am. Chem. Soc.,
vol. 128, pp. 591–595, 2006.
[16] S. Zhang and S. Kumar, “Carbon nanotubes as liquid crystals,” Small, vol. 4,
no. 9, pp. 1270–1283, 2008.
[17] M. D. Lynch and D. L. Patrick Nano Letters, vol. 2, pp. 1197–1201, 2002.
[18] I. Dierking, G. Scalia, P. Morales, and D. LeClere, “Aligning and reorienting
carbon nanotubes with nematic liquid crystals,” Adv. Mater., vol. 16, p. 865,
2004.
[19] I. Dierking, G. Scalia, and P. Morales, “Liquid crystal-carbon nanotube dis-
persions,” J. Appl. Phys., vol. 97, p. 044309, 2005.
[20] J. P. F. Lagerwall, G. Scalia, M. Haluska, U. Dettlaff-Weglikowska, F. Giessel-
mann, and S. Roth, “Simultanoeus alignment and dispersion of carbon nan-
otubes with lyotropic liquid crystals,” Phys. Stat. Sol. (b), vol. 243, pp. 3046–
3049, 2006.
143
[21] S. Kumar and H. K. Bisoyi, “Aligned carbon naotubes in the supramolecular
order of discotic liquid crystals,” Angew. Chem., vol. 119, pp. 1523–1525,
2007.
[22] C. Zakri, “Carbon nanotubes and liquid crystalline phases,” Liquid Crystals
Today, vol. 16, pp. 1–11, 2007.
[23] O. Trushkevych, N. Collings, T. Hasan, V. scardaci, A. C. Ferrari, T. D.
Wilkinson, W. A. Crossland, W. I. Milne, J. Geng, B. F. G. Johnson, and
S. Macaulay, “Characterization of carbon nanotube-thermotropic nematic liq-
uid crsyatal composites,” J. Phys. D: Appl. Phys., vol. 41, p. 125106, 2008.
[24] J. P. F. Lagerwall and G. Scalia, “Carbon naotubes in liquid crystals,” J.
Mater. Chem., vol. 18, pp. 2890–2898, 2008.
[25] R. Basu and G. Iannacchione, “Carbon nanotube dispersed liquid crystal:a
nano electromechanical system,” Appl. Phys. Lett., vol. 93, p. 183105, 2008.
[26] V. Popa-Nita and S. Kralj, “Liquid crystal-carbon naotubes mixtures,” J.
Cmem. Phys., vol. 132, p. 024902, 2010.
[27] G. Scalia, “Alignment of carbon naotubes in thermotropic and lyotropic liquid
crystals,” ChemPhysChem, vol. 11, pp. 333–340, 2010.
[28] P. V. Kamat, K. G. Thomas, S. Barazzouk, G. Girishkumar, K. Vinodgopal,
and D. Meisel, “Self-assembled linear bundles of single wall carbon nanotubes
and their alignment and deposition as a film in a dc field,” J. Am. Chem.
Soc., vol. 126, pp. 10757–10762, 2004.
[29] H.-Y. Chen and W. Lee, “Electro-optical characterization of a twisted nematic
liquid-crystal cell doped with carbon nanotubes in a dc electric field,” Optical
Review, vol. 12, pp. 223–225, 2005.
[30] I.-S. Baik, S. Y. Jeon, S. H. Lee, K. A. Park, S. H. Jeong, K. H. An, and Y. H.
Lee Appl. Phys. Lett., vol. 87, p. 263110, 2005.
[31] H.-Y. Chen, W. Lee, and N. A. Clark, “Faster electro-optical response charac-
teristics of a carbon-nanotube-nematic suspension,” App. Phys. Lett., vol. 90,
p. 033510, 2007.
144
[32] M. Rahman and W. Lee, “Scientific duo of carbon nanotubes and nematic
liquid crystals,” J. Phys. D: Appl. Phys., vol. 42, p. 063001, 2009.
[33] R. Basu and G. Iannacchione, “Nematic anchoring on carbon nanotubes,”
Appl. Phys. Lett., vol. 95, p. 173113, 2009.
[34] R. Basu and G. Iannacchione, “Orientational coupling enhancement in a car-
bon nanotube dispersed liquid crystal,” Phys. Rev. E, vol. 81, p. 051705, 2010.
[35] R. Basu and G. Iannacchione, “Dielectric hysteresis, relaxation dynamics,
and nonvolatile memory effect in carbon nanotube dispersed liquid crystal,”
J. Appl. Phys., vol. 106, p. 124312, 2009.
[36] H. Duran, B. Gazdecki, A. Yamashita, and T. Kyu, “Effect of carbon nan-
otubes on phase transition of nematic liquid crystals,” Liquid Crystals, vol. 32,
pp. 815–821, 2005.
[37] J. P. F. Lagerwall, R. Dabrowski, and G. Scalia, “Antiferroelectric liquid
crystals with induced intermediate polar phases and the effects of doping with
carbon nanotubes,” Journal of Non-Crystalline Solids, vol. 353, pp. 4411–
4417, 2007.
[38] H. J. Shah, A. K. Fontecchio, D. Mattia, and Y. Gogotsi, “Field controlled
nematic-to-isotropic phase transition in liquid crystal-carbon nanotube com-
posites,” J. Appl. Phys., vol. 103, p. 064314, 2008.
[39] A. I. Goncharuk, N. I. Lebovka, L. N. Lisetski, and S. S. Minenko, “Aggrega-
tion, percolation and phase transitions in nematic liquid crystal ebba doped
with carbon nanotubes,” J. Phys. D: Appl. Phys., vol. 42, p. 165411, 2009.
[40] R. Basu, K. P. Sigdel, and G. S. Iannacchione, “Study of the isotropic to
nematic phase transition in carbon nanotube dispersed liquid crystal compos-
ites,” arXiv:0905.2779v1 [cond-mat.soft], 2009.
[41] G. S. Iannacchione, C. W. Garland, J. T. Mang, and T. P. Rieker Phys. Rev.
E, vol. 58, p. 5966, 1998.
[42] Dr. Saion Sinha, Department of Physics, University of New Haven, CT (Pri-
vate Communication).
145
[43] D. Finotello, S. Qian, and G. S. Iannacchione Thermochimica Acta, vol. 304-
305, pp. 303–316, 1997.
[44] P. F. Sullivan and G. Seidel Phys. Rev., vol. 173, pp. 679–685, 1968.
[45] H. Yao, K. Ema, and C. W. Garland Rev. Sci. Instrum., vol. 69, p. 172, 1998.
[46] D. Sharma and G. S. Iannacchione, “Induced thermal dynamics in the melt of
glycerol and aerosil dispersions,” J. Chem. Phys., vol. 126, p. 094503, 2007.
[47] L. M. Steele, G. S. Iannacchione, and D. Finotello, “Ac calorimetry technique.
applications to liquid helium films and liquid crystals,” Revista Mexicana de
Fisica, vol. 39, no. 4, pp. 588–601, 1993.
[48] A. Roshi, G. S. Iannacchione, P. S. Clegg, and R. J. Birgeneau, “Evolution
of the isotropic-to-nematic phase transition in octyloxycyanobiphenyl?aerosil
dispersions,” Phys. Rev. E, vol. 69, p. 031703, 2004.
[49] B. Zhou, G. S. Iannacchione, C. W. Garland, and T. Bellini Phys. Rev. E,
vol. 55, p. 2962, 1997.
[50] L. Wu, B. Zhou, C. W. Garland, T. Bellini, and D. W. Schaefer Phys. Rev.
E, vol. 51, p. 2157, 1995.
[51] K. P. Sigdel and G. S. Iannacchione, “Evolution of the isotropic to nematic
phase transition in binary mixtures of octylcyanobiphenyl and n-hexane,” J.
Chem. Phys., vol. 133, p. 044513, 2010.
[52] R. Basu and G. S. Iannacchione Appl. Phys. Lett., vol. 92, p. 052906, 2008.
[53] G. S. Iannacchione Fluid Phase Equilibria, vol. 222–223, pp. 177–187, 2004.
[54] P. van der Schoot, V. Popa-Nita, and S.Kralj J. Phys. Chem. B, vol. 112,
p. 4512, 2008.
[55] R. Basu and G. S. Iannacchione Appl. Phys. Lett., vol. 95, p. 173113, 2009.
Chapter 7Phase transitions in
ocylcyanobiphenyl-barium titanate
nanoparticle dispersions
7.1 Introduction
Liquid crystal (LC) based colloidal suspensions of nano-materials are of immense
technological and scientific interest in recent years because of the capacity of the
LC media acting as a platform for nano-material self-assembly. Various nano-
materials of zero-, one-, and two- dimensions have been dispersed and studied in
LC medium to enhance the physical properties of LCs, liquid crystalline phase
behavior of nano-material themselves, and synthesis of nano-materials by using
liquid crystals as ‘template’[1]. Being an anisotropic media, LC provides a good
support for self-assembly of nano-materials and act as a tunable solvent for nano-
material dispersion. Therefore, the LC mediated self assembly can be efficiently
used to organize different kinds of nanomaterials into soft and well defined func-
tional structures [2]. It has been observed that the addition of nanomaterials
to LC materials has improved many special characteristics in the form of faster
electro-optical response and low threshold switching [3, 4], low driving voltage [5],
non-volatile memory effect[6, 7], enhanced photoluminescence[8]. These improve-
ments and enhancement in properties are mainly due to the surface modification of
the aligned layers [9, 10] and structure modification of the LC host [11, 12, 13, 14]
146
147
due to the incorporation of nano-scale materials. The self organization of nano-
materials in two and three dimensional space offered by the LC medium seems
to be an ideal vehicle to explore and control the organization of matters on the
nanometers to micrometers scale which is a key to the further development of
nano-technology.
Recently, the hybrid system containing liquid crystal and ferroelectric nano-
particles such as barium titanate (BaTiO3) and tin-hypodiphosphate (Sn2P2S6)
attracts great interest in experimental [15, 16, 17, 18, 19, 20] as well as theoretical
research[21, 22, 23]. These composites are interesting because of the observation
of new properties that are not observed in pure LC and due to the interaction of
the nano-sized particles with the anisotropic LC host. The ferroelectric nanopar-
ticle of smaller size (around 20 nm) can influence the physical properties of liquid
crystal without forming defects and disturbing the LC director [15]. It has been
shown that the addition causes to increase the isotropic to nematic phase transi-
tion temperature [16], increase in dielectric anisotropy [15, 24], higher birefringence
and lower voltage and conductivity [25]. However, some issues about the physical
properties enhancement have not been clearly established. For example, the study
[15] of a multicomponent liquid crystal ZL4801 doped with ferroelectric nanopar-
ticle Sn2P2S6 showed that the I-N transition temperature TIN remains essentially
same as that of the pure LC but a more recent study [26] on the same LC (with
and without surfactant added in it) showed slight decrease (∼ 2.3%) in the TIN .
Similarly, it has been shown that the addition of ferroelectric nanoparticle BaTiO3
in 5CB does not change the Freedricksz threshold but enhances the dielectric re-
sponse [27] but a more recent study [18] showed the significant decrease in the
Freedricksz threshold. A very recent work on a single component LC 8OCB doped
with BaTiO3 showed the significant changes in the physical properties with de-
crease in the I-N phase transition temperature due to the presence of BaTiO3
[19]. Most of these studies are focused on the multicomponent liquid crystals and
only in the nematic regions.
In this work, we study the phase transition behavior of single component liq-
uid crystal octyl-cyanobiphenyl (8CB), which has nematic and smectic-A phases,
doped with ferroelectric nanoparticle barium titanate-BaTiO3 (BT) as a function
of concentration of BT, ϕm. The incorporation of BT in 8CB causes to display
148
a unique phase behavior. Both the I-N and the N -SmA transitions evolve in
character remaining the order of phase transition same being the I-N first-order
and the N -SmA transition second-order. The I-N ∆Cp peaks shift towards the
lower temperature as well as the peaks are getting broader as a function of ϕm.
A broad tail is observed on the I-N ∆Cp peak on the isotropic side of the phase
transition on heating only. The N -SmA specific heat δCp wings overlay each other
very nicely for all 8CB+BT samples with a slight mismatch with that of the bulk
except for the SmA side of N -SmA transition on heating. Both the I-N and the
N -SmA transition temperatures decrease as ϕm increases. The I-N and N -SmA
ac-enthalpy increase first for low-ϕm with their constant value for high-ϕm.
7.2 Results
For pure 8CB, the I-N phase transition occurs at T 0IN = 313.17 K while the N -
SmA transition occurs at T 0NA = 306.08 K, both are about 1 K lower than the
highest values reported in the literature [11]. The I-N effective enthalpy δH∗IN =
4.50 ± 0.45 J/g, the N -SmA effective enthalpy δHNA = 0.64 ± 0.06 J/g and the
I-N dispersive enthalpy δH′′IN = 0.45 ± 0.05 J/g in pure 8CB are within 10% of
the literature value [28]. These results are used for comparison to the composite
results.
The resulting excess specific heat ∆Cp data for 8CB+BT samples studied on
heating as a function of temperature ∆TIN = T − TIN are shown in Fig. 7.1(a).
The isotropic to nematic phase transition temperature TIN is taken as the point
where C′′p = 0 on the isotropic side [29]. The I-N and the N -SmA phase transitions
are characterized by a distinct ∆Cp peak for all 8CB+BT samples. The ∆Cp wings
are similar for all 8CB+BT composite samples and pure 8CB below and above the
two transitions revealing that the bulk-like order fluctuations are present in the
isotropic and smectic-A phases. However, slight mismatch of the heat capacity
wings on the nematic phase below TIN close to the I-N transition is observed as
ϕm changes.
The imaginary specific heat C′′p as a function of temperature about TIN on
heating is shown in Fig. 7.1(b). The C′′p exhibits a sharp peak associated with
I-N phase transition and no peak corresponding to the N -SmA phase transition
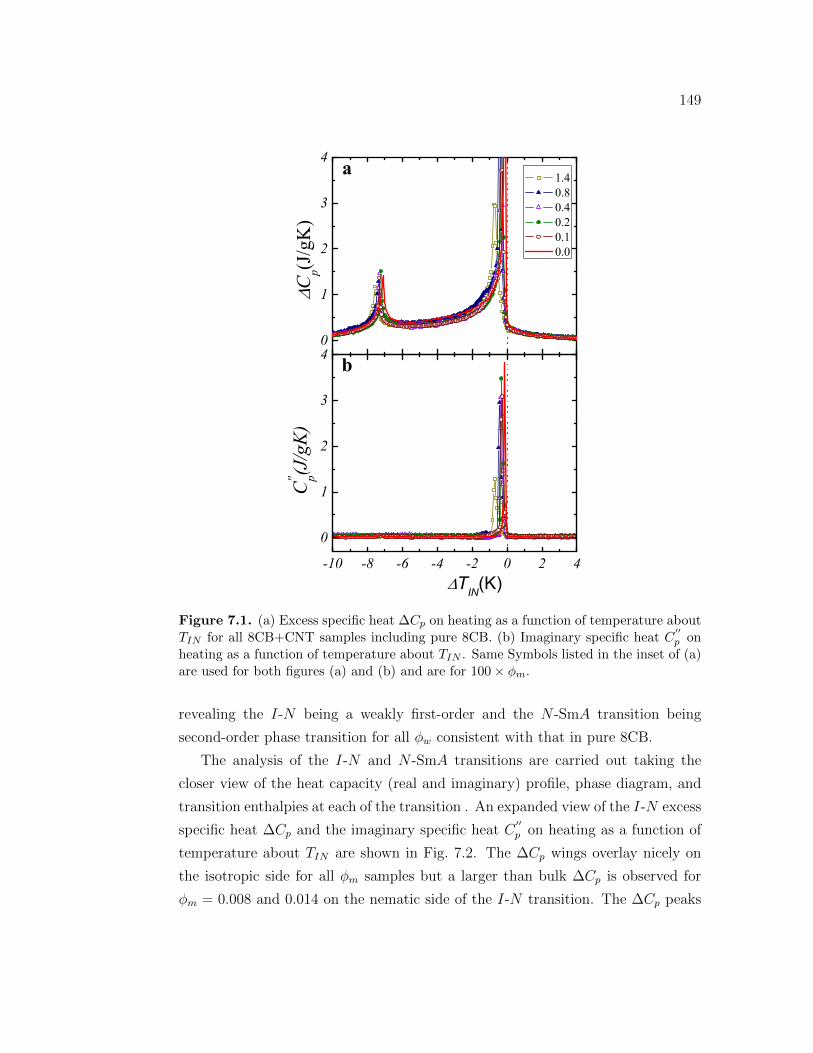
149
0
1
2
3
4
C'' p(J
/gK)
1.4 0.8 0.4 0.2 0.1 0.0
TIN(K)
a
-10 -8 -6 -4 -2 0 2 4
0
1
2
3
4 b
Cp(J
/gK
)
Figure 7.1. (a) Excess specific heat ∆Cp on heating as a function of temperature aboutTIN for all 8CB+CNT samples including pure 8CB. (b) Imaginary specific heat C
′′p on
heating as a function of temperature about TIN . Same Symbols listed in the inset of (a)are used for both figures (a) and (b) and are for 100 × ϕm.
revealing the I-N being a weakly first-order and the N -SmA transition being
second-order phase transition for all ϕw consistent with that in pure 8CB.
The analysis of the I-N and N -SmA transitions are carried out taking the
closer view of the heat capacity (real and imaginary) profile, phase diagram, and
transition enthalpies at each of the transition . An expanded view of the I-N excess
specific heat ∆Cp and the imaginary specific heat C′′p on heating as a function of
temperature about TIN are shown in Fig. 7.2. The ∆Cp wings overlay nicely on
the isotropic side for all ϕm samples but a larger than bulk ∆Cp is observed for
ϕm = 0.008 and 0.014 on the nematic side of the I-N transition. The ∆Cp peaks
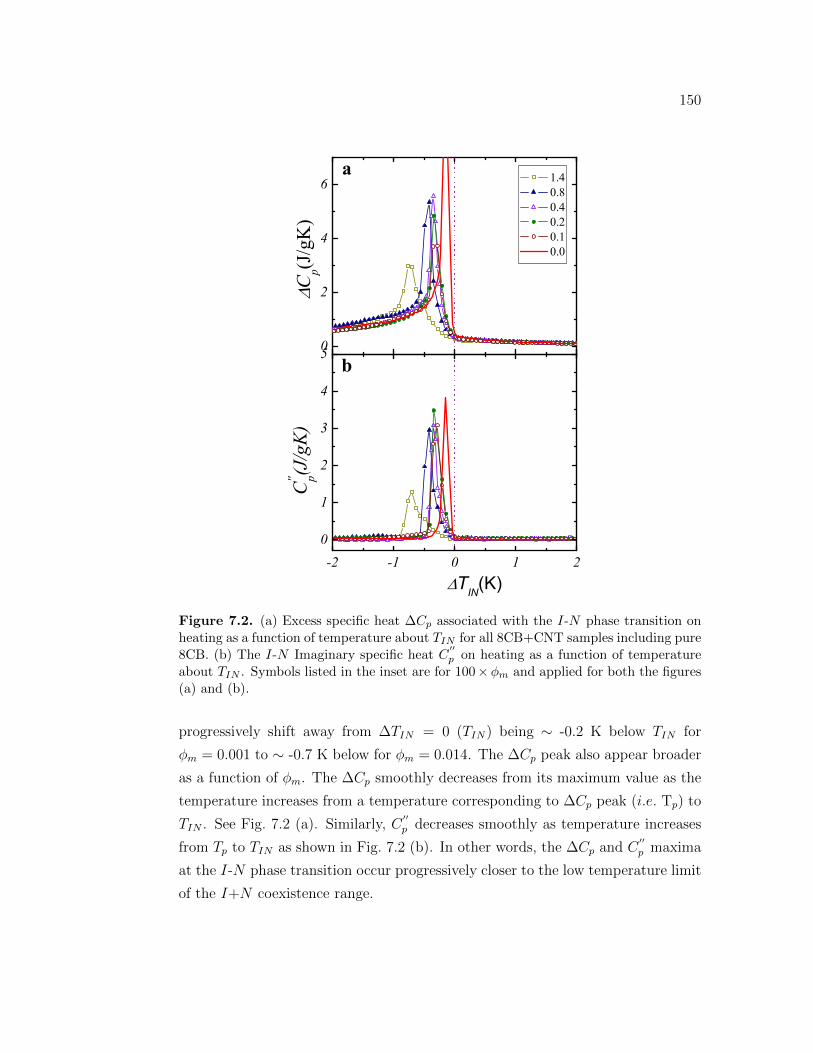
150
0
2
4
6
C'' p(J
/gK)
1.4 0.8 0.4 0.2 0.1 0.0
TIN(K)
a
-2 -1 0 1 20
1
2
3
4
5b
Cp(J
/gK)
Figure 7.2. (a) Excess specific heat ∆Cp associated with the I-N phase transition onheating as a function of temperature about TIN for all 8CB+CNT samples including pure8CB. (b) The I-N Imaginary specific heat C
′′p on heating as a function of temperature
about TIN . Symbols listed in the inset are for 100 × ϕm and applied for both the figures(a) and (b).
progressively shift away from ∆TIN = 0 (TIN) being ∼ -0.2 K below TIN for
ϕm = 0.001 to ∼ -0.7 K below for ϕm = 0.014. The ∆Cp peak also appear broader
as a function of ϕm. The ∆Cp smoothly decreases from its maximum value as the
temperature increases from a temperature corresponding to ∆Cp peak (i.e. Tp) to
TIN . See Fig. 7.2 (a). Similarly, C′′p decreases smoothly as temperature increases
from Tp to TIN as shown in Fig. 7.2 (b). In other words, the ∆Cp and C′′p maxima
at the I-N phase transition occur progressively closer to the low temperature limit
of the I+N coexistence range.
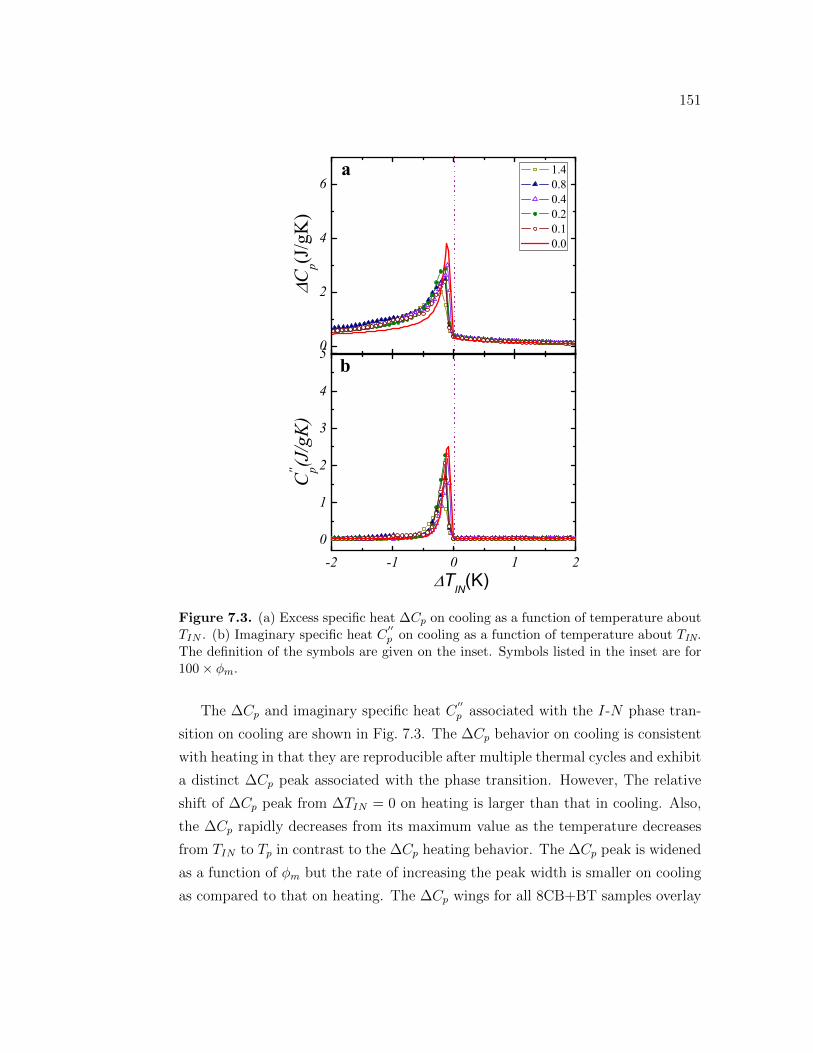
151
-2 -1 0 1 20
1
2
3
4
5b
TIN(K)
0
2
4
6a
C'' p(J
/gK)
1.4 0.8 0.4 0.2 0.1 0.0
Cp(J
/gK)
Figure 7.3. (a) Excess specific heat ∆Cp on cooling as a function of temperature aboutTIN . (b) Imaginary specific heat C
′′p on cooling as a function of temperature about TIN.
The definition of the symbols are given on the inset. Symbols listed in the inset are for100 × ϕm.
The ∆Cp and imaginary specific heat C′′p associated with the I-N phase tran-
sition on cooling are shown in Fig. 7.3. The ∆Cp behavior on cooling is consistent
with heating in that they are reproducible after multiple thermal cycles and exhibit
a distinct ∆Cp peak associated with the phase transition. However, The relative
shift of ∆Cp peak from ∆TIN = 0 on heating is larger than that in cooling. Also,
the ∆Cp rapidly decreases from its maximum value as the temperature decreases
from TIN to Tp in contrast to the ∆Cp heating behavior. The ∆Cp peak is widened
as a function of ϕm but the rate of increasing the peak width is smaller on cooling
as compared to that on heating. The ∆Cp wings for all 8CB+BT samples overlay
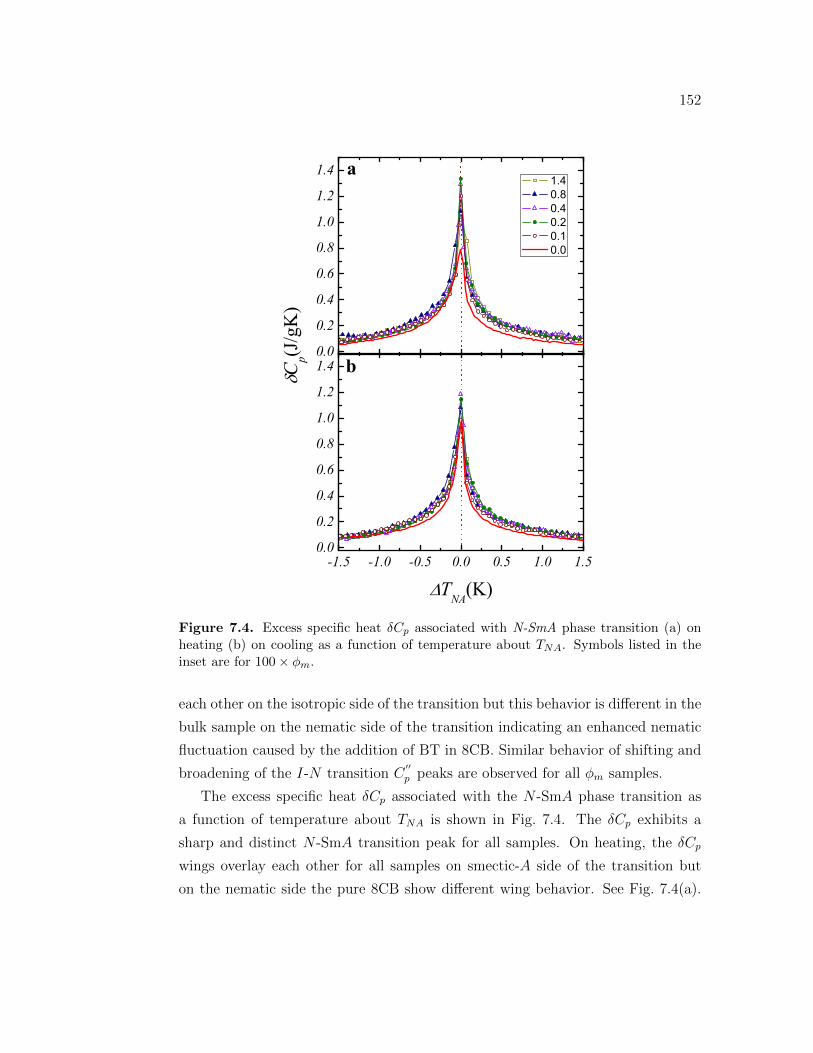
152
0.0
0.2
0.4
0.6
0.8
1.0
1.2
1.4
-1.5 -1.0 -0.5 0.0 0.5 1.0 1.50.0
0.2
0.4
0.6
0.8
1.0
1.2
1.4
a
1.4 0.8 0.4 0.2 0.1 0.0
b
Cp(J
/gK)
TNA(K)
Figure 7.4. Excess specific heat δCp associated with N-SmA phase transition (a) onheating (b) on cooling as a function of temperature about TNA. Symbols listed in theinset are for 100 × ϕm.
each other on the isotropic side of the transition but this behavior is different in the
bulk sample on the nematic side of the transition indicating an enhanced nematic
fluctuation caused by the addition of BT in 8CB. Similar behavior of shifting and
broadening of the I-N transition C′′p peaks are observed for all ϕm samples.
The excess specific heat δCp associated with the N -SmA phase transition as
a function of temperature about TNA is shown in Fig. 7.4. The δCp exhibits a
sharp and distinct N -SmA transition peak for all samples. On heating, the δCp
wings overlay each other for all samples on smectic-A side of the transition but
on the nematic side the pure 8CB show different wing behavior. See Fig. 7.4(a).
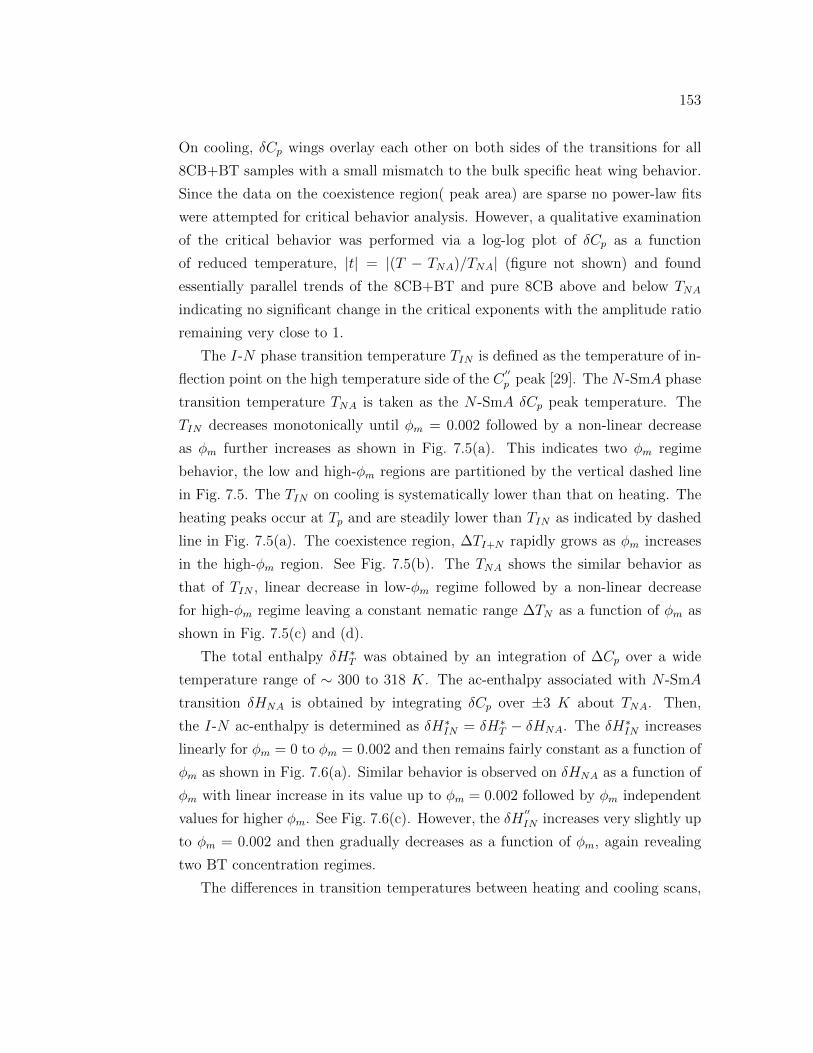
153
On cooling, δCp wings overlay each other on both sides of the transitions for all
8CB+BT samples with a small mismatch to the bulk specific heat wing behavior.
Since the data on the coexistence region( peak area) are sparse no power-law fits
were attempted for critical behavior analysis. However, a qualitative examination
of the critical behavior was performed via a log-log plot of δCp as a function
of reduced temperature, |t| = |(T − TNA)/TNA| (figure not shown) and found
essentially parallel trends of the 8CB+BT and pure 8CB above and below TNA
indicating no significant change in the critical exponents with the amplitude ratio
remaining very close to 1.
The I-N phase transition temperature TIN is defined as the temperature of in-
flection point on the high temperature side of the C′′p peak [29]. The N -SmA phase
transition temperature TNA is taken as the N -SmA δCp peak temperature. The
TIN decreases monotonically until ϕm = 0.002 followed by a non-linear decrease
as ϕm further increases as shown in Fig. 7.5(a). This indicates two ϕm regime
behavior, the low and high-ϕm regions are partitioned by the vertical dashed line
in Fig. 7.5. The TIN on cooling is systematically lower than that on heating. The
heating peaks occur at Tp and are steadily lower than TIN as indicated by dashed
line in Fig. 7.5(a). The coexistence region, ∆TI+N rapidly grows as ϕm increases
in the high-ϕm region. See Fig. 7.5(b). The TNA shows the similar behavior as
that of TIN , linear decrease in low-ϕm regime followed by a non-linear decrease
for high-ϕm regime leaving a constant nematic range ∆TN as a function of ϕm as
shown in Fig. 7.5(c) and (d).
The total enthalpy δH∗T was obtained by an integration of ∆Cp over a wide
temperature range of ∼ 300 to 318 K. The ac-enthalpy associated with N -SmA
transition δHNA is obtained by integrating δCp over ±3 K about TNA. Then,
the I-N ac-enthalpy is determined as δH∗IN = δH∗T − δHNA. The δH∗IN increases
linearly for ϕm = 0 to ϕm = 0.002 and then remains fairly constant as a function of
ϕm as shown in Fig. 7.6(a). Similar behavior is observed on δHNA as a function of
ϕm with linear increase in its value up to ϕm = 0.002 followed by ϕm independent
values for higher ϕm. See Fig. 7.6(c). However, the δH′′IN increases very slightly up
to ϕm = 0.002 and then gradually decreases as a function of ϕm, again revealing
two BT concentration regimes.
The differences in transition temperatures between heating and cooling scans,
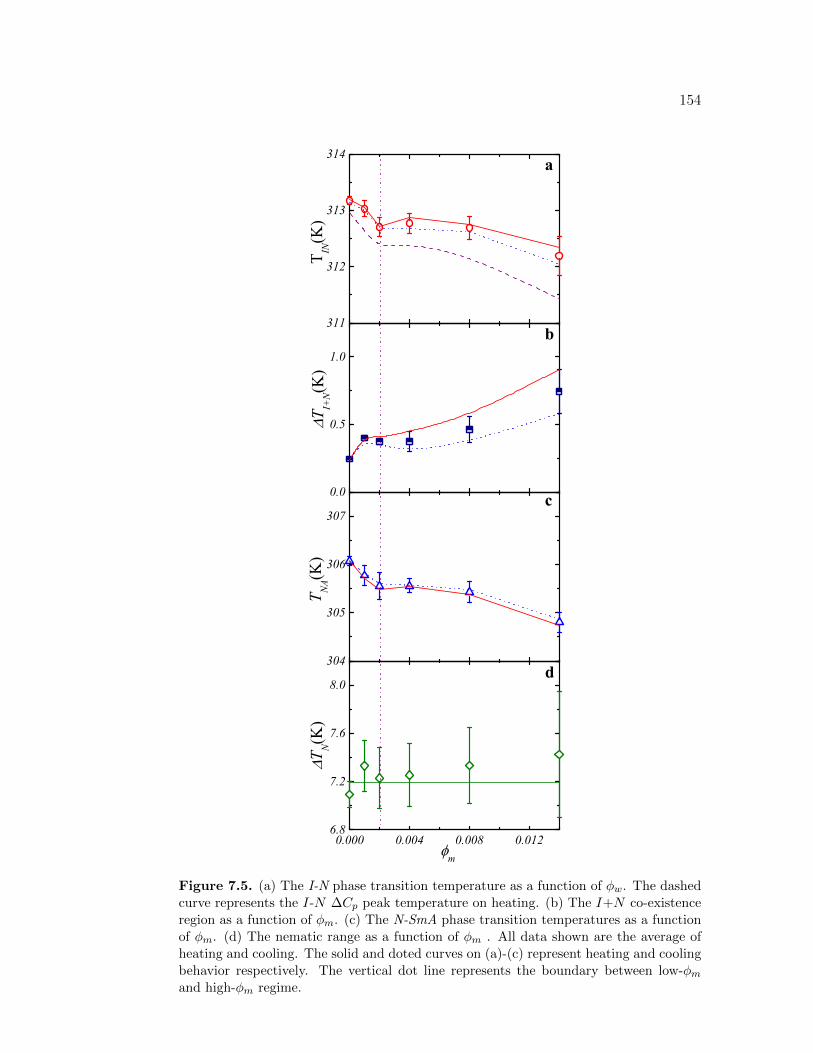
154
0.0
0.5
1.0
0.000 0.004 0.008 0.0126.8
7.2
7.6
8.0
304
305
306
307
311
312
313
314
d
m
T I
+N(K
)
c
T N(K
)b
T NA(
K)
a
T IN(K
)
Figure 7.5. (a) The I-N phase transition temperature as a function of ϕw. The dashedcurve represents the I-N ∆Cp peak temperature on heating. (b) The I+N co-existenceregion as a function of ϕm. (c) The N-SmA phase transition temperatures as a functionof ϕm. (d) The nematic range as a function of ϕm . All data shown are the average ofheating and cooling. The solid and doted curves on (a)-(c) represent heating and coolingbehavior respectively. The vertical dot line represents the boundary between low-ϕm
and high-ϕm regime.
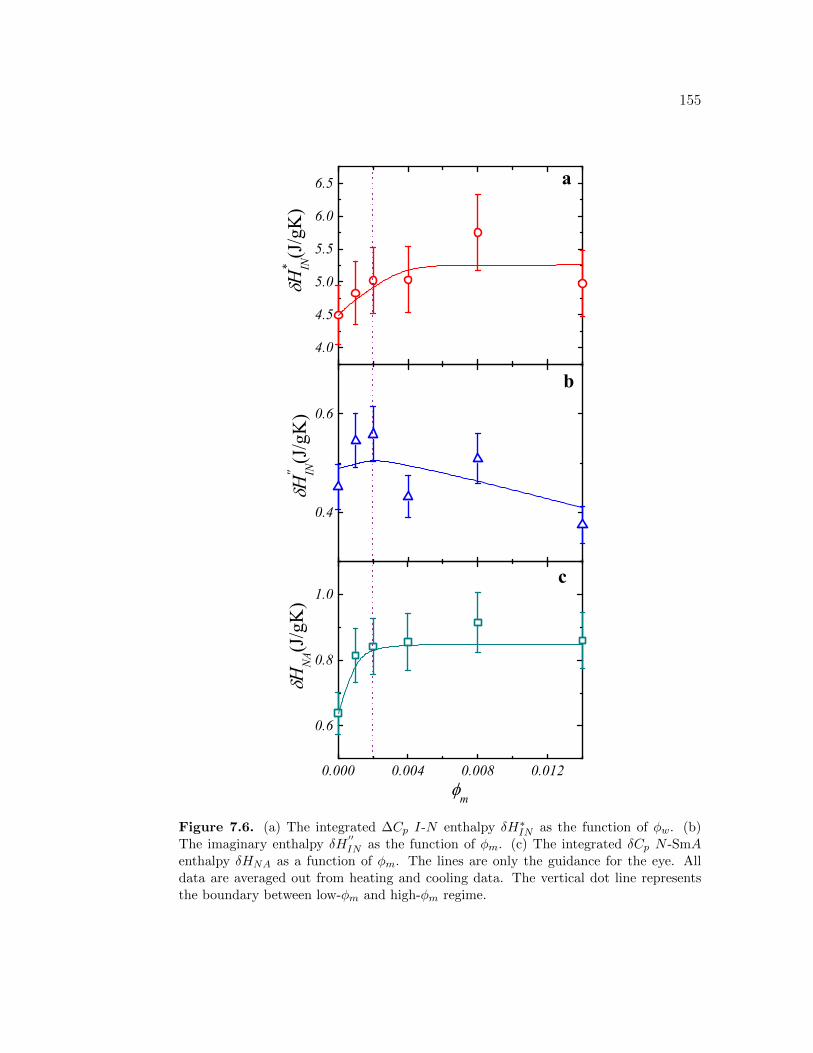
155
4.0
4.5
5.0
5.5
6.0
6.5
0.4
0.6
0.000 0.004 0.008 0.012
0.6
0.8
1.0
a
m
b
H* IN(J/gK)
c
HNA(J/gK
)
H'' IN(J/gK)
Figure 7.6. (a) The integrated ∆Cp I-N enthalpy δH∗IN as the function of ϕw. (b)The imaginary enthalpy δH
′′IN as the function of ϕm. (c) The integrated δCp N -SmA
enthalpy δHNA as a function of ϕm. The lines are only the guidance for the eye. Alldata are averaged out from heating and cooling data. The vertical dot line representsthe boundary between low-ϕm and high-ϕm regime.
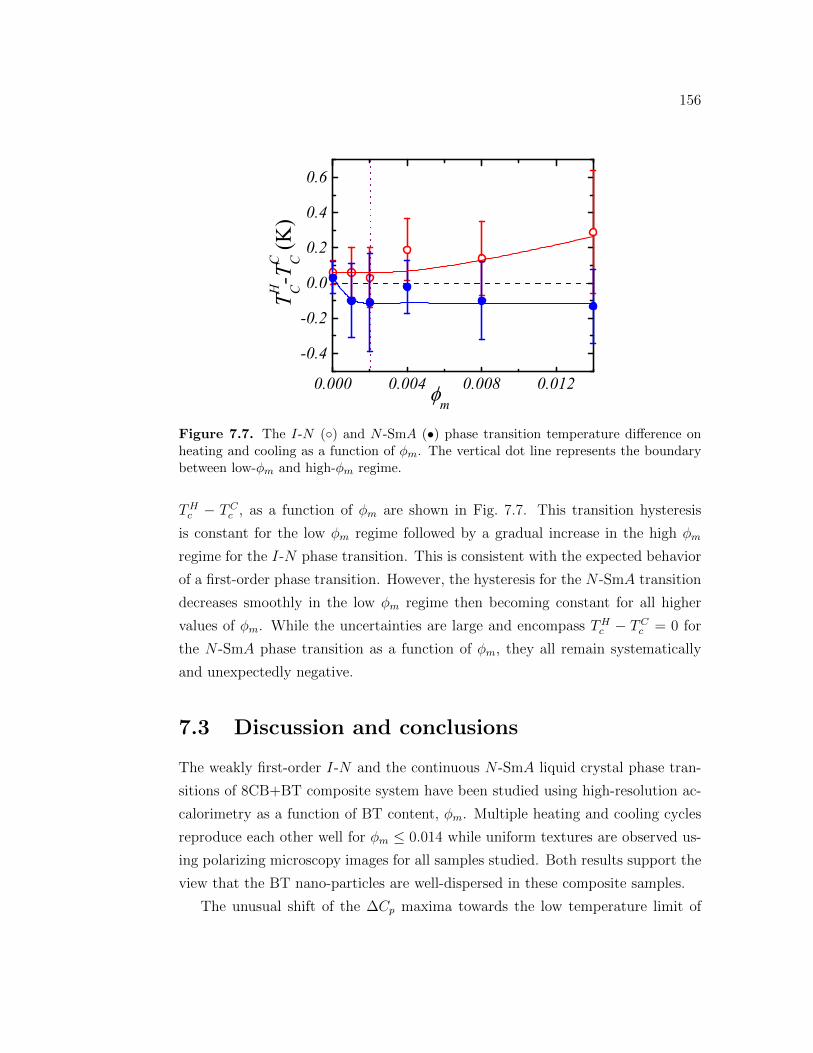
156
0.000 0.004 0.008 0.012
-0.4
-0.2
0.0
0.2
0.4
0.6
m
TH C-T
C C (K
)
Figure 7.7. The I-N () and N -SmA (•) phase transition temperature difference onheating and cooling as a function of ϕm. The vertical dot line represents the boundarybetween low-ϕm and high-ϕm regime.
THc − TC
c , as a function of ϕm are shown in Fig. 7.7. This transition hysteresis
is constant for the low ϕm regime followed by a gradual increase in the high ϕm
regime for the I-N phase transition. This is consistent with the expected behavior
of a first-order phase transition. However, the hysteresis for the N -SmA transition
decreases smoothly in the low ϕm regime then becoming constant for all higher
values of ϕm. While the uncertainties are large and encompass THc − TC
c = 0 for
the N -SmA phase transition as a function of ϕm, they all remain systematically
and unexpectedly negative.
7.3 Discussion and conclusions
The weakly first-order I-N and the continuous N -SmA liquid crystal phase tran-
sitions of 8CB+BT composite system have been studied using high-resolution ac-
calorimetry as a function of BT content, ϕm. Multiple heating and cooling cycles
reproduce each other well for ϕm ≤ 0.014 while uniform textures are observed us-
ing polarizing microscopy images for all samples studied. Both results support the
view that the BT nano-particles are well-dispersed in these composite samples.
The unusual shift of the ∆Cp maxima towards the low temperature limit of
157
the I+N coexistence range on heating is in contrast to the expected behavior
on cooling, i.e. the ∆Cp maxima is near the high temperature limit of the I+N
coexistence range. This is illustrated as a dashed line for the Tp behavior in
Fig. 7.5(a). Clearly, the melting and ordering process of the I-N phase transition
are driven by different dynamics. A possible scenario to explain this observed
hysteresis emerges if there exists coupling of the ferroelectric nano-particles to the
orientational order in the polar LC and that the LC mediates interactions through
this coupling between BT particles. Given this view, entering the I+N coexistence
range on heating would result in a sharp rise in ∆Cp followed by a stretched tail as
the BT particles “unbind” from each other as the nematic phase disappears. See
Fig. 7.2.
Conversely, on cooling into the I+N coexistence range there would be a sharp
rise in ∆Cp due to nucleation of N domains followed on cooling by a tail as the
BT particles begin to “bind” to one another. This tail on cooling would smoothly
extend into the fully established N phase as shown in the tails of both ∆Cp and
C′′p in Fig. 7.3. This physical picture, which essentially describes a Kosterlitz-
Thouless (K-T) type transition [30], where the unbinding of vortices is equivalent
to the unbinding of ferroelectric BT particle pairs, is supported by the observations
at the N -SmA transition. Here, the N -SmA δCp appears as sharp and distinct
peaks with only slight mismatching of the wing behavior of the composite samples
with that of the pure 8CB. Also, the TNA shifts with shifting of TIN in such a way
that the nematic range ∆TN remains unchanged.
These results clearly indicate that the BT particles are orientationally coupled
to each other and the LC without significant positional coupling. This is not
unexpected given the ferroelectric nature of the BT particles and that they are not
likely positionally fixed i.e. form a gel and so would pin the SmA phase locally.
This physical picture may also explain the apparent negative Tc hysteresis at the
N -SmA phase transition. Here, the smectic domains are much smaller than the
nematic domains and would “cut” coupling between BT particles so that heating
into and out of the SmA phase would involve different dynamics. However, this is
not a large effect and the data are not unambiguous.
The rapid and linear change in transition temperatures for the low-ϕm regime
followed by a non-linear and gradual change for high-ϕm are likely due to different
158
distribution of BT nano-particles in LC medium in two regimes. For low-ϕm regime,
due to the small number of nano-particles, presumably floating of particles in LC
medium rather produce disorder effect giving rise to rapid decrease in transition
temperatures. However, for the high-ϕm, BT nano-particles interact each other
via LC molecules producing somehow ordered effect revealing a gradual change in
transition temperature as a function of BT content. The I+N coexistence region
data also supports the existence of two ϕm regimes. The transition enthalpies are
essentially constant but real parts (δH∗IN and δHNA) are slightly larger than that
of the bulk due to the BT ‘binding’ having extra modes and the slight decrease
in the imaginary I-N enthalpy reflects this binding of BT-BT and LC suppressing
nematic dispersion.
We have undertaken a detailed calorimetric studies on the effect of ferroelec-
tric nano-particles on octylcyanobiphenyl (8CB) on the weakly first-order I-N and
the continuous N -SmA phase transitions. The addition of BT on 8CB causes the
change in the liquid crystal molecular interactions which consequently gives rise
the evolution of both the phase transitions. Interesting and striking effects are ob-
served in 8CB+BT system including the unusual shift of I-N specific heat peaks
on heating towards low temperature limit of I+N coexistence range. Isotropic fer-
roelectric nano-particle like BT, could be an important tool to change the physical
properties of a LC media. Continued experimental efforts are needed specifically,
probing the structural behavior of the composite as a function of BT content, BT
size and temperature would be particulary important and interesting.
Bibliography
[1] H. K. Bisoyi and S. Kumar Chem. Soc. Rev, vol. 40, pp. 306–319, 2011.
[2] T. Hegmann, H. Qi, and V. M. Marx J. Inorg. Organomet. Polym. Matter,
vol. 17, pp. 483–508, 2007.
[3] J. Prakash, A. Choudhary, D. S. Mehta, and A. M. Biradar Phys. Rev. E,
vol. 80, p. 012701, 2009.
[4] R. Dhar, A. S. Pandey, M. B. Pandey, S. Kumar, and R. Dabrowski Appl.
Phys. Express, vol. 1, p. 121501, 2008.
[5] W. Lee, C.-Y. Wang, and Y.-C. Shih Appl. Phys. Lett, vol. 85, p. 513, 2004.
[6] R. Basu and G. S. Iannacchione J. Appl. Phys., vol. 106, p. 124312, 2009.
[7] J. Prakash, A. Choudhary, A. Kumar, D. S. Mehta, and A. M. Biradar Appl.
Phys. Lett., vol. 93, p. 112904, 2008.
[8] A. Kumar, J. Prakash, D. S. Mehta, W. Hasse, and A. M. Biradar Appl. Phys.
Lett., vol. 85, p. 1, 2009.
[9] N. V. Kamanina and L. N. Kaporskii Tech. Phys. Lett., vol. 26, p. 864, 2000.
[10] L. P. Rakcheeva and N. V. Kamanina Tech. Phys. Lett., vol. 28, p. 457, 2002.
[11] B. Zhou, G. S. Iannacchione, C. W. Garland, and T. Bellini Phys. Rev. E,
vol. 55, p. 2962, 1997.
159
160
[12] S. Lee and C. Park Mol. Cryst. Liq. Cryst. Sci. Technol. Sec. A, vol. 333,
p. 123, 1999.
[13] M. Suzuki, H. Furue, and S. Kobayashi Mol. Cryst. Liq. Cryst. Sci. Technol.
Sec. A, vol. 368, p. 191, 2001.
[14] Y. Shiraishi, N. Toshima, K. Maeda, H. Yoshikawa, J. Xu, and S. Kobayoshi
Appl. Phys. Lett., vol. 81, p. 2845, 2002.
[15] Y. Reznikov, O. Tereshchenko, V. Reshetnyak, A. Glushchenko, and J. West,
“Ferroelectric nematic suspension,” Appl. Phys. Lett., vol. 82, p. 1917, 2003.
[16] F. Li, A. Buchnev, C. I. Cheon, A. Glushchenko, V. Reshetnyak, Y. Reznikov,
T. J. Sluckin, and J. West, “Orientational coupling amplification in ferroelec-
tric nematic colloids,” Phys. Rev. Lett., vol. 97, p. 147801, 2006.
[17] A. Mikulko, P. Arora, A. Glushchenko, A. Lapanic, and W. Haase Eur. Phys.
Lett., vol. 87, p. 27009, 2009.
[18] J.-F. Blach, S. Saitzek, C. Legrand, L. Dupont, J.-F. Henninot, and
M. Warenghem, “Nanoparticle induced director distortion and disorder in
the liquid crystal-nanoparticl dispersions,” J. Colloid. Interf. Sci., vol. 352,
pp. 292–298, 2010.
[19] M. Gupta, I. Satpathy, A. Roy, and R. Pratibha, “Nanoparticle induced di-
rector distortion and disorder in the liquid crystal-nanoparticl dispersions,”
J. Colloid. Interf. Sci., vol. 352, pp. 292–298, 2010.
[20] G. Cook, V. Reshetnyak, R. F. Ziolo, S. A. Basun, P. P. Banerjee, and D. R.
Evans Optics Express, vol. 18, p. 17339, 2010.
[21] V. Reshetnyak, “Effective dielectric function of ferroelectric lc suspension,”
Mol. Cryst. Liq. Cryst., vol. 421, pp. 219–224, 2004.
[22] L. M. Lopatina and J. V. Selinger, “Theory of ferroelectric nanoparticles in
nematic liquid crystals,” Phys. Rev. Lett., vol. 102, p. 197802, 2009.
161
[23] M. S. S. Pereira, A. A. Canabarro, I. N. de Oliveira, M. L. Lyra, and L. V. Mi-
rantsev, “A molecular dynamic study of ferroelectric nanoparticles immersed
in a nematic liquid crystal,” Eur. Phys. J. E, vol. 31, pp. 81–87, 2010.
[24] E. Ouskova, O. uchnev, V. Reshetnyak, Y. Reznikov, and H. Kresso Liq.
Cryst., vol. 30, p. 1235, 2003.
[25] F. Li, J. West, A. Glushchenko, C. I. Cheon, and Y. Reznikov, “Ferroelectric
nanoparticle/liquid-crystal colloids for display application,” J. SID, vol. 14/6,
p. 523, 2006.
[26] O. Kurochkin, O. Buchnev, A. Iljin, S. K. Park, S. B. Kwon, O. Grabar, and
Y. Reznikov, “A colloid of ferroelectric nanoparticles in a cholesteric liquid
crystal,” J. Opt. A: Pure Appl. Opt., vol. 11, p. 024003, 2009.
[27] A. Glushchenko, C. I. Cheon, J. West, F. Li, E. Buyuktanir, Y. Reznikov,
and A. Buchnev, “Ferroelectric particles in liquid crystals: Recent frontiers,”
Mol. Cryst. Liq. Cryst., vol. 453, pp. 227–237, 2006.
[28] L. Wu, B. Zhou, C. W. Garland, T. Bellini, and D. W. Schaefer Phys. Rev.
E, vol. 51, p. 2157, 3 1995.
[29] K. P. Sigdel and G. S. Iannacchione, “Evolution of the isotropic to nematic
phase transition in binary mixtures of octylcyanobiphenyl and n-hexane,” J.
Chem. Phys., vol. 133, p. 044513, 2010.
[30] J. M. Kosterlitz and D. J. Thouless, “Metastablity and phse transitions in two-
dimensional syatems,” J. Phys. C: Solid State Phys., vol. 6, pp. 1181–1203,
1973.
Chapter 8Concluding Remarks
In general, this work reveals dramatic effect produced by doping solvents on the
I-N , N -SmA, and the I-SmA phase transition. It also shows the effect of nano-
materials like carbon nanotubes and ferroelectric Barium Titanate nano-particles
on the I-N and N -SmA phase transitions.
In the 8CB+hex mixture, the introduction of n-hexane on 8CB causes the dra-
matic change in the phase transition behavior. The heat capacity peak associated
with the I-N transition ∆Cp shifts towards lower temperature non-monotonically
and becomes progressively smeared as the hexane concentration increases. There
is significant hysteresis in the ∆Cp shape between heating and cooling, especially
for higher hexane concentrations. On heating, the ∆Cp peak exhibits a broad tail
where the peak temperature is significantly below the nominal transition temper-
ature. On cooling, the ∆Cp peak reveals a sharp jump reminiscent of the pure
8CB peak. The integrated ac-enthalpy remains fairly constant as a function of
hexane molar fraction whereas the imaginary part of the enthalpy reveals a sharp
increase at hexane mole fraction of around 0.07. The dilution of the liquid crystal
causes the decrease in liquid crystal molecular interactions and change in viscoelas-
tic properties, which consequently gives rise the evolution of the phase transitions.
The results obtained in this work reveal new aspects of the effect of non-mesogenic
disorder on the mesogenic ordering.
The heat capacity peak associated with the N -SmA transition, δCp, shifts
towards lower temperature non-monotonically and becomes progressively larger
as the hexane concentration increases. The dispersive part of heat capacity C′′p
162
163
associated with the N -SmA transition abruptly appears as a peak for xhex ≥ 0.08
but is zero for xhex ≤ 0.06 indicating a crossover from continuous (second-order)
behavior to first-order behavior for the N -SmA transition with a tricritical point
at xTCPhex ≈ 0.07. The integrated ac-enthalpy increases overall as a function of
hexane molar fraction. A simple but consistently applied power-law analysis for
δCp with xhex ≤ 0.06 find a non-linear increase in the heat capacity effective critical
exponent towards the tricritical value (αTCP = 0.50) as xhex → xTCPhex is observed.
A small hysteresis of the δCp shape between heating and cooling is seen and is
likely due to a microscopic phase separation of the solvent, perhaps into intersticial
region between smectic layers. The non-monotonic transition temperature shift
and extended curvature of αeff behavior with extended curvature as xhex → xTCPhex
may be due to the competing interactions of microphase separation and dilution
effects.
Dramatic change in phase behavior with a new transition feature from less
orientationally order weak smectic-A to more orientationally ordered smectic-Ad
along with the isotropic to less-ordered weak smectic-A phase is observed due to
the presence of acetone on 10CB. Both the transition features evolve in shape and
size of ∆Cp as a function of xace. Downwards shifting of transition temperature
for both the transitions with dramatic shifts on weak smectic-A to smectic-Ad
transition temperature has been observed. These all reveal a new aspect of the
effect of polar solvent interactions on the liquid crystal transitions.
Slight change in transition temperatures occur as CNTs are added in LC but
remains fairly constant for all composites. Both transitions evolve without show-
ing any systematic trend with change in ϕw. The order of the transition remains
the same being the I-N first-order and the N -SmA second-order. The addition of
CNT causes small change in order fluctuations in nematic and smectic-A phases.
The change in thermal transport properties is observed as a function of ϕw and
temperature due to the interaction of CNTs with LC molecules. The slight transi-
tion temperature change is likely due to the density differences between the liquid
crystal and CNTs and due to the coupling between CNTs and LC ordering.
The addition of barium titanate (BT) on 8CB causes the change in the liquid
crystal molecular interactions which consequently gives rise the evolution of both
the phase transitions. Interesting and striking effects are observed in 8CB+BT
164
system including the observation of broad tail of the I-N specific heat on heating.
Isotropic ferroelectric nanoparticle like BT, could be an important tool to change
the physical properties of a LC media without using any expensive synthesizing
technique.
8.1 Future Directions
Continued research efforts are needed to further understand the behavior of the
systems we have studied.
1. Experimental efforts such as light scattering studies probing the nematic
elastic constants as a function of solvent content and temperature would be
particulary important and interesting for the LC+solvent mixtures.
2. Detailed scattering experiments such as x-ray or neutron as a function of
solvent concentration and temperature through the N -SmA transition would
be most desirable to explore the critical behavior of the smectic correlation
length as susceptibility and probing the smectic structure for the LC+solvent
systems.
3. Experimental efforts for studying the sample homogeneity in the liquid crys-
tal and nanomaterials composite system would be interesting and are needed
to understand the behavior of the LC+nanomaterial systems.
So far, I have studied the behavior of thermotropic liquid crystals only. I would
like to study the behavior of various lyotropic liquid crystalline materials.
Appendix AAppendix
A.1 Publications
1. Krishna P. Sigdel and Germano Iannacchione; “Study of the isotropic to
nematic and nematic to smectic-A phase transitions in liquid crystal and
carbon nanotubes composites” Eur. Phys. J. E (2011), 34:34.
2. Krishna P. Sigdel and Germano Iannacchione; “Calorimetric study of the
nematic to smectic-A phase transition in octylcyanobiphenyl-hexane binary
mixtures” Phys. Rev. E, 82, 051702 (2010).
3. Krishna P. Sigdel and Germano Iannacchione; “Study of the isotropic to
smectic-A phase transition in liquid crystal and acetone binary mixtures” J.
Chem. Phys., 133, 174501 (2010).
4. Krishna P. Sigdel and Germano Iannacchione; “Evolution of the isotropic
to nematic phase transition in binary mixtures of octylcyanobiphenyl and
n-hexane” J. Chem. Phys., 133, 044513 (2010).
5. Rajratan Basu, Krishna P. Sigdel, and Germano S. Iannacchione; “Study
of the isotropic to nematic phase transition in carbon nanotubes dispersed
liquid crystal composites” submitted to Liquid Crystal.
6. Krishna P. Sigdel and Germano Iannacchione; “Calorimetric study of
phase transitions in barium titanate- liquid crystal nano-colloidal disper-
sions” to be submitted.
165
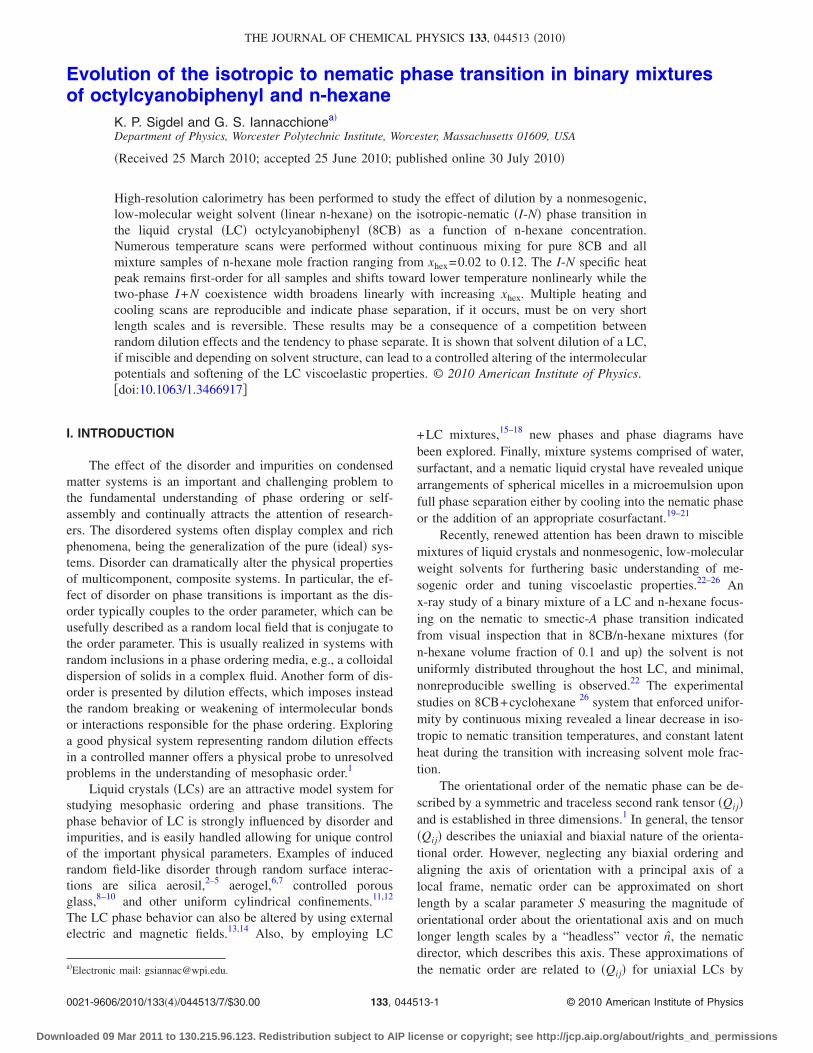
Evolution of the isotropic to nematic phase transition in binary mixturesof octylcyanobiphenyl and n-hexane
K. P. Sigdel and G. S. Iannacchionea
Department of Physics, Worcester Polytechnic Institute, Worcester, Massachusetts 01609, USA
Received 25 March 2010; accepted 25 June 2010; published online 30 July 2010
High-resolution calorimetry has been performed to study the effect of dilution by a nonmesogenic,low-molecular weight solvent linear n-hexane on the isotropic-nematic I-N phase transition inthe liquid crystal LC octylcyanobiphenyl 8CB as a function of n-hexane concentration.Numerous temperature scans were performed without continuous mixing for pure 8CB and allmixture samples of n-hexane mole fraction ranging from xhex=0.02 to 0.12. The I-N specific heatpeak remains first-order for all samples and shifts toward lower temperature nonlinearly while thetwo-phase I+N coexistence width broadens linearly with increasing xhex. Multiple heating andcooling scans are reproducible and indicate phase separation, if it occurs, must be on very shortlength scales and is reversible. These results may be a consequence of a competition betweenrandom dilution effects and the tendency to phase separate. It is shown that solvent dilution of a LC,if miscible and depending on solvent structure, can lead to a controlled altering of the intermolecularpotentials and softening of the LC viscoelastic properties. © 2010 American Institute of Physics.doi:10.1063/1.3466917
I. INTRODUCTION
The effect of the disorder and impurities on condensedmatter systems is an important and challenging problem tothe fundamental understanding of phase ordering or self-assembly and continually attracts the attention of research-ers. The disordered systems often display complex and richphenomena, being the generalization of the pure ideal sys-tems. Disorder can dramatically alter the physical propertiesof multicomponent, composite systems. In particular, the ef-fect of disorder on phase transitions is important as the dis-order typically couples to the order parameter, which can beusefully described as a random local field that is conjugate tothe order parameter. This is usually realized in systems withrandom inclusions in a phase ordering media, e.g., a colloidaldispersion of solids in a complex fluid. Another form of dis-order is presented by dilution effects, which imposes insteadthe random breaking or weakening of intermolecular bondsor interactions responsible for the phase ordering. Exploringa good physical system representing random dilution effectsin a controlled manner offers a physical probe to unresolvedproblems in the understanding of mesophasic order.1
Liquid crystals LCs are an attractive model system forstudying mesophasic ordering and phase transitions. Thephase behavior of LC is strongly influenced by disorder andimpurities, and is easily handled allowing for unique controlof the important physical parameters. Examples of inducedrandom field-like disorder through random surface interac-tions are silica aerosil,2–5 aerogel,6,7 controlled porousglass,8–10 and other uniform cylindrical confinements.11,12
The LC phase behavior can also be altered by using externalelectric and magnetic fields.13,14 Also, by employing LC
+LC mixtures,15–18 new phases and phase diagrams havebeen explored. Finally, mixture systems comprised of water,surfactant, and a nematic liquid crystal have revealed uniquearrangements of spherical micelles in a microemulsion uponfull phase separation either by cooling into the nematic phaseor the addition of an appropriate cosurfactant.19–21
Recently, renewed attention has been drawn to misciblemixtures of liquid crystals and nonmesogenic, low-molecularweight solvents for furthering basic understanding of me-sogenic order and tuning viscoelastic properties.22–26 Anx-ray study of a binary mixture of a LC and n-hexane focus-ing on the nematic to smectic-A phase transition indicatedfrom visual inspection that in 8CB/n-hexane mixtures forn-hexane volume fraction of 0.1 and up the solvent is notuniformly distributed throughout the host LC, and minimal,nonreproducible swelling is observed.22 The experimentalstudies on 8CB+cyclohexane 26 system that enforced unifor-mity by continuous mixing revealed a linear decrease in iso-tropic to nematic transition temperatures, and constant latentheat during the transition with increasing solvent mole frac-tion.
The orientational order of the nematic phase can be de-scribed by a symmetric and traceless second rank tensor Qijand is established in three dimensions.1 In general, the tensorQij describes the uniaxial and biaxial nature of the orienta-tional order. However, neglecting any biaxial ordering andaligning the axis of orientation with a principal axis of alocal frame, nematic order can be approximated on shortlength by a scalar parameter S measuring the magnitude oforientational order about the orientational axis and on muchlonger length scales by a “headless” vector n, the nematicdirector, which describes this axis. These approximations ofthe nematic order are related to Qij for uniaxial LCs byaElectronic mail: [email protected].
THE JOURNAL OF CHEMICAL PHYSICS 133, 044513 2010
0021-9606/2010/1334/044513/7/$30.00 © 2010 American Institute of Physics133, 044513-1
Downloaded 09 Mar 2011 to 130.215.96.123. Redistribution subject to AIP license or copyright; see http://jcp.aip.org/about/rights_and_permissions
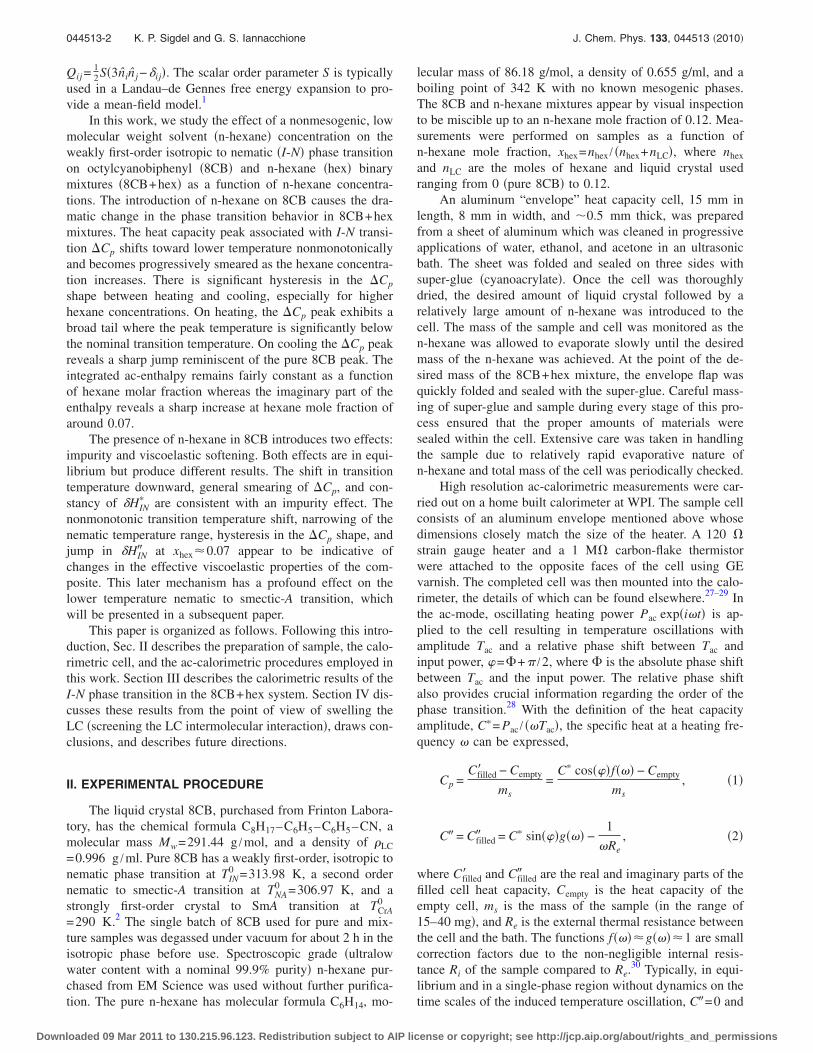
Qij =12S3ninj −ij. The scalar order parameter S is typically
used in a Landau–de Gennes free energy expansion to pro-vide a mean-field model.1
In this work, we study the effect of a nonmesogenic, lowmolecular weight solvent n-hexane concentration on theweakly first-order isotropic to nematic I-N phase transitionon octylcyanobiphenyl 8CB and n-hexane hex binarymixtures 8CB+hex as a function of n-hexane concentra-tions. The introduction of n-hexane on 8CB causes the dra-matic change in the phase transition behavior in 8CB+hexmixtures. The heat capacity peak associated with I-N transi-tion Cp shifts toward lower temperature nonmonotonicallyand becomes progressively smeared as the hexane concentra-tion increases. There is significant hysteresis in the Cp
shape between heating and cooling, especially for higherhexane concentrations. On heating, the Cp peak exhibits abroad tail where the peak temperature is significantly belowthe nominal transition temperature. On cooling the Cp peakreveals a sharp jump reminiscent of the pure 8CB peak. Theintegrated ac-enthalpy remains fairly constant as a functionof hexane molar fraction whereas the imaginary part of theenthalpy reveals a sharp increase at hexane mole fraction ofaround 0.07.
The presence of n-hexane in 8CB introduces two effects:impurity and viscoelastic softening. Both effects are in equi-librium but produce different results. The shift in transitiontemperature downward, general smearing of Cp, and con-stancy of HIN
are consistent with an impurity effect. Thenonmonotonic transition temperature shift, narrowing of thenematic temperature range, hysteresis in the Cp shape, andjump in HIN at xhex0.07 appear to be indicative ofchanges in the effective viscoelastic properties of the com-posite. This later mechanism has a profound effect on thelower temperature nematic to smectic-A transition, whichwill be presented in a subsequent paper.
This paper is organized as follows. Following this intro-duction, Sec. II describes the preparation of sample, the calo-rimetric cell, and the ac-calorimetric procedures employed inthis work. Section III describes the calorimetric results of theI-N phase transition in the 8CB+hex system. Section IV dis-cusses these results from the point of view of swelling theLC screening the LC intermolecular interaction, draws con-clusions, and describes future directions.
II. EXPERIMENTAL PROCEDURE
The liquid crystal 8CB, purchased from Frinton Labora-tory, has the chemical formula C8H17–C6H5–C6H5–CN, amolecular mass Mw=291.44 g /mol, and a density of LC
=0.996 g /ml. Pure 8CB has a weakly first-order, isotropic tonematic phase transition at TIN
0 =313.98 K, a second ordernematic to smectic-A transition at TNA
0 =306.97 K, and astrongly first-order crystal to SmA transition at TCrA
0
=290 K.2 The single batch of 8CB used for pure and mix-ture samples was degassed under vacuum for about 2 h in theisotropic phase before use. Spectroscopic grade ultralowwater content with a nominal 99.9% purity n-hexane pur-chased from EM Science was used without further purifica-tion. The pure n-hexane has molecular formula C6H14, mo-
lecular mass of 86.18 g/mol, a density of 0.655 g/ml, and aboiling point of 342 K with no known mesogenic phases.The 8CB and n-hexane mixtures appear by visual inspectionto be miscible up to an n-hexane mole fraction of 0.12. Mea-surements were performed on samples as a function ofn-hexane mole fraction, xhex=nhex / nhex+nLC, where nhex
and nLC are the moles of hexane and liquid crystal usedranging from 0 pure 8CB to 0.12.
An aluminum “envelope” heat capacity cell, 15 mm inlength, 8 mm in width, and 0.5 mm thick, was preparedfrom a sheet of aluminum which was cleaned in progressiveapplications of water, ethanol, and acetone in an ultrasonicbath. The sheet was folded and sealed on three sides withsuper-glue cyanoacrylate. Once the cell was thoroughlydried, the desired amount of liquid crystal followed by arelatively large amount of n-hexane was introduced to thecell. The mass of the sample and cell was monitored as then-hexane was allowed to evaporate slowly until the desiredmass of the n-hexane was achieved. At the point of the de-sired mass of the 8CB+hex mixture, the envelope flap wasquickly folded and sealed with the super-glue. Careful mass-ing of super-glue and sample during every stage of this pro-cess ensured that the proper amounts of materials weresealed within the cell. Extensive care was taken in handlingthe sample due to relatively rapid evaporative nature ofn-hexane and total mass of the cell was periodically checked.
High resolution ac-calorimetric measurements were car-ried out on a home built calorimeter at WPI. The sample cellconsists of an aluminum envelope mentioned above whosedimensions closely match the size of the heater. A 120 strain gauge heater and a 1 M carbon-flake thermistorwere attached to the opposite faces of the cell using GEvarnish. The completed cell was then mounted into the calo-rimeter, the details of which can be found elsewhere.27–29 Inthe ac-mode, oscillating heating power Pac expit is ap-plied to the cell resulting in temperature oscillations withamplitude Tac and a relative phase shift between Tac andinput power, =+ /2, where is the absolute phase shiftbetween Tac and the input power. The relative phase shiftalso provides crucial information regarding the order of thephase transition.28 With the definition of the heat capacityamplitude, C= Pac / Tac, the specific heat at a heating fre-quency can be expressed,
Cp =Cfilled − Cempty
ms=
C cosf − Cempty
ms, 1
C = Cfilled = C sing −1
Re, 2
where Cfilled and Cfilled are the real and imaginary parts of thefilled cell heat capacity, Cempty is the heat capacity of theempty cell, ms is the mass of the sample in the range of15–40 mg, and Re is the external thermal resistance betweenthe cell and the bath. The functions fg1 are smallcorrection factors due to the non-negligible internal resis-tance Ri of the sample compared to Re.
30 Typically, in equi-librium and in a single-phase region without dynamics on thetime scales of the induced temperature oscillation, C=0 and
044513-2 K. P. Sigdel and G. S. Iannacchione J. Chem. Phys. 133, 044513 2010
Downloaded 09 Mar 2011 to 130.215.96.123. Redistribution subject to AIP license or copyright; see http://jcp.aip.org/about/rights_and_permissions
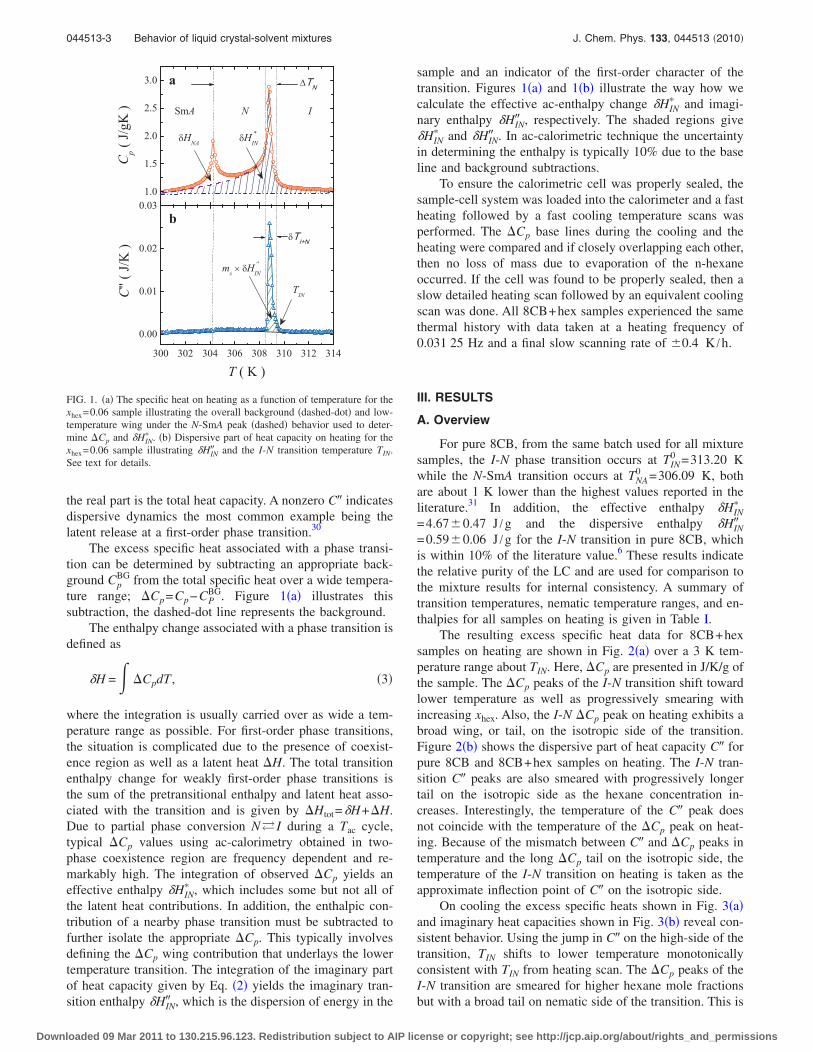
the real part is the total heat capacity. A nonzero C indicatesdispersive dynamics the most common example being thelatent release at a first-order phase transition.30
The excess specific heat associated with a phase transi-tion can be determined by subtracting an appropriate back-ground Cp
BG from the total specific heat over a wide tempera-ture range; Cp=Cp−CP
BG. Figure 1a illustrates thissubtraction, the dashed-dot line represents the background.
The enthalpy change associated with a phase transition isdefined as
H = CpdT , 3
where the integration is usually carried over as wide a tem-perature range as possible. For first-order phase transitions,the situation is complicated due to the presence of coexist-ence region as well as a latent heat H. The total transitionenthalpy change for weakly first-order phase transitions isthe sum of the pretransitional enthalpy and latent heat asso-ciated with the transition and is given by Htot=H+H.Due to partial phase conversion N I during a Tac cycle,typical Cp values using ac-calorimetry obtained in two-phase coexistence region are frequency dependent and re-markably high. The integration of observed Cp yields aneffective enthalpy HIN
, which includes some but not all ofthe latent heat contributions. In addition, the enthalpic con-tribution of a nearby phase transition must be subtracted tofurther isolate the appropriate Cp. This typically involvesdefining the Cp wing contribution that underlays the lowertemperature transition. The integration of the imaginary partof heat capacity given by Eq. 2 yields the imaginary tran-sition enthalpy HIN , which is the dispersion of energy in the
sample and an indicator of the first-order character of thetransition. Figures 1a and 1b illustrate the way how wecalculate the effective ac-enthalpy change HIN
and imagi-nary enthalpy HIN , respectively. The shaded regions giveHIN
and HIN . In ac-calorimetric technique the uncertaintyin determining the enthalpy is typically 10% due to the baseline and background subtractions.
To ensure the calorimetric cell was properly sealed, thesample-cell system was loaded into the calorimeter and a fastheating followed by a fast cooling temperature scans wasperformed. The Cp base lines during the cooling and theheating were compared and if closely overlapping each other,then no loss of mass due to evaporation of the n-hexaneoccurred. If the cell was found to be properly sealed, then aslow detailed heating scan followed by an equivalent coolingscan was done. All 8CB+hex samples experienced the samethermal history with data taken at a heating frequency of0.031 25 Hz and a final slow scanning rate of 0.4 K /h.
III. RESULTS
A. Overview
For pure 8CB, from the same batch used for all mixturesamples, the I-N phase transition occurs at TIN
0 =313.20 Kwhile the N-SmA transition occurs at TNA
0 =306.09 K, bothare about 1 K lower than the highest values reported in theliterature.31 In addition, the effective enthalpy HIN
=4.670.47 J /g and the dispersive enthalpy HIN=0.590.06 J /g for the I-N transition in pure 8CB, whichis within 10% of the literature value.6 These results indicatethe relative purity of the LC and are used for comparison tothe mixture results for internal consistency. A summary oftransition temperatures, nematic temperature ranges, and en-thalpies for all samples on heating is given in Table I.
The resulting excess specific heat data for 8CB+hexsamples on heating are shown in Fig. 2a over a 3 K tem-perature range about TIN. Here, Cp are presented in J/K/g ofthe sample. The Cp peaks of the I-N transition shift towardlower temperature as well as progressively smearing withincreasing xhex. Also, the I-N Cp peak on heating exhibits abroad wing, or tail, on the isotropic side of the transition.Figure 2b shows the dispersive part of heat capacity C forpure 8CB and 8CB+hex samples on heating. The I-N tran-sition C peaks are also smeared with progressively longertail on the isotropic side as the hexane concentration in-creases. Interestingly, the temperature of the C peak doesnot coincide with the temperature of the Cp peak on heat-ing. Because of the mismatch between C and Cp peaks intemperature and the long Cp tail on the isotropic side, thetemperature of the I-N transition on heating is taken as theapproximate inflection point of C on the isotropic side.
On cooling the excess specific heats shown in Fig. 3aand imaginary heat capacities shown in Fig. 3b reveal con-sistent behavior. Using the jump in C on the high-side of thetransition, TIN shifts to lower temperature monotonicallyconsistent with TIN from heating scan. The Cp peaks of theI-N transition are smeared for higher hexane mole fractionsbut with a broad tail on nematic side of the transition. This is
FIG. 1. a The specific heat on heating as a function of temperature for thexhex=0.06 sample illustrating the overall background dashed-dot and low-temperature wing under the N-SmA peak dashed behavior used to deter-mine Cp and HIN
. b Dispersive part of heat capacity on heating for thexhex=0.06 sample illustrating HIN and the I-N transition temperature TIN.See text for details.
044513-3 Behavior of liquid crystal-solvent mixtures J. Chem. Phys. 133, 044513 2010
Downloaded 09 Mar 2011 to 130.215.96.123. Redistribution subject to AIP license or copyright; see http://jcp.aip.org/about/rights_and_permissions
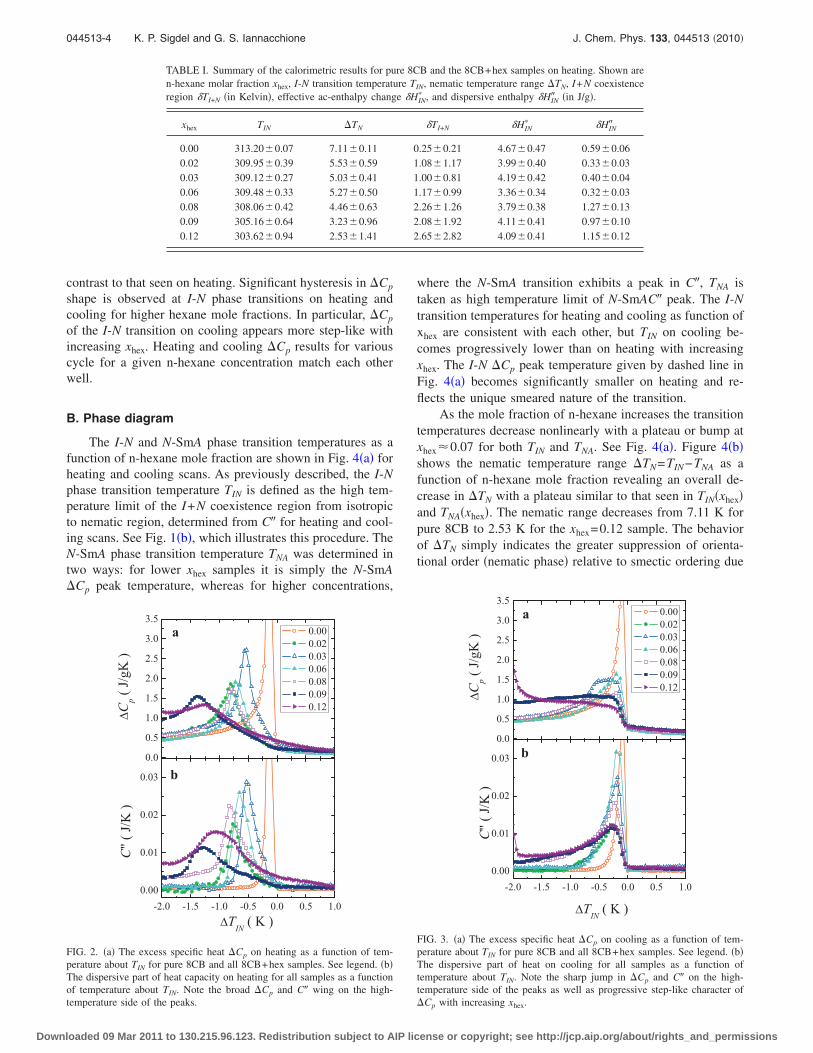
contrast to that seen on heating. Significant hysteresis in Cp
shape is observed at I-N phase transitions on heating andcooling for higher hexane mole fractions. In particular, Cp
of the I-N transition on cooling appears more step-like withincreasing xhex. Heating and cooling Cp results for variouscycle for a given n-hexane concentration match each otherwell.
B. Phase diagram
The I-N and N-SmA phase transition temperatures as afunction of n-hexane mole fraction are shown in Fig. 4a forheating and cooling scans. As previously described, the I-Nphase transition temperature TIN is defined as the high tem-perature limit of the I+N coexistence region from isotropicto nematic region, determined from C for heating and cool-ing scans. See Fig. 1b, which illustrates this procedure. TheN-SmA phase transition temperature TNA was determined intwo ways: for lower xhex samples it is simply the N-SmACp peak temperature, whereas for higher concentrations,
where the N-SmA transition exhibits a peak in C, TNA istaken as high temperature limit of N-SmAC peak. The I-Ntransition temperatures for heating and cooling as function ofxhex are consistent with each other, but TIN on cooling be-comes progressively lower than on heating with increasingxhex. The I-N Cp peak temperature given by dashed line inFig. 4a becomes significantly smaller on heating and re-flects the unique smeared nature of the transition.
As the mole fraction of n-hexane increases the transitiontemperatures decrease nonlinearly with a plateau or bump atxhex0.07 for both TIN and TNA. See Fig. 4a. Figure 4bshows the nematic temperature range TN=TIN−TNA as afunction of n-hexane mole fraction revealing an overall de-crease in TN with a plateau similar to that seen in TINxhexand TNAxhex. The nematic range decreases from 7.11 K forpure 8CB to 2.53 K for the xhex=0.12 sample. The behaviorof TN simply indicates the greater suppression of orienta-tional order nematic phase relative to smectic ordering due
TABLE I. Summary of the calorimetric results for pure 8CB and the 8CB+hex samples on heating. Shown aren-hexane molar fraction xhex, I-N transition temperature TIN, nematic temperature range TN, I+N coexistenceregion TI+N in Kelvin, effective ac-enthalpy change HIN
, and dispersive enthalpy HIN in J/g.
xhex TIN TN TI+N HIN HIN
0.00 313.200.07 7.110.11 0.250.21 4.670.47 0.590.060.02 309.950.39 5.530.59 1.081.17 3.990.40 0.330.030.03 309.120.27 5.030.41 1.000.81 4.190.42 0.400.040.06 309.480.33 5.270.50 1.170.99 3.360.34 0.320.030.08 308.060.42 4.460.63 2.261.26 3.790.38 1.270.130.09 305.160.64 3.230.96 2.081.92 4.110.41 0.970.100.12 303.620.94 2.531.41 2.652.82 4.090.41 1.150.12
FIG. 2. a The excess specific heat Cp on heating as a function of tem-perature about TIN for pure 8CB and all 8CB+hex samples. See legend. bThe dispersive part of heat capacity on heating for all samples as a functionof temperature about TIN. Note the broad Cp and C wing on the high-temperature side of the peaks.
FIG. 3. a The excess specific heat Cp on cooling as a function of tem-perature about TIN for pure 8CB and all 8CB+hex samples. See legend. bThe dispersive part of heat on cooling for all samples as a function oftemperature about TIN. Note the sharp jump in Cp and C on the high-temperature side of the peaks as well as progressive step-like character ofCp with increasing xhex.
044513-4 K. P. Sigdel and G. S. Iannacchione J. Chem. Phys. 133, 044513 2010
Downloaded 09 Mar 2011 to 130.215.96.123. Redistribution subject to AIP license or copyright; see http://jcp.aip.org/about/rights_and_permissions
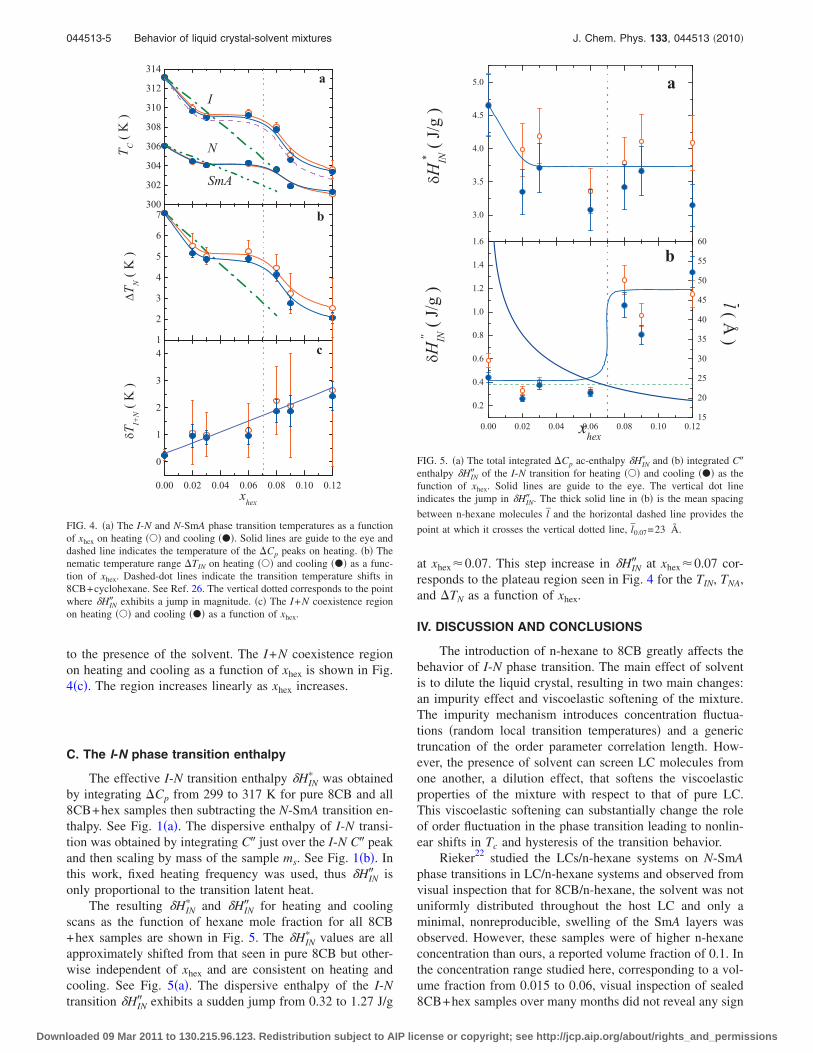
to the presence of the solvent. The I+N coexistence regionon heating and cooling as a function of xhex is shown in Fig.4c. The region increases linearly as xhex increases.
C. The I-N phase transition enthalpy
The effective I-N transition enthalpy HIN was obtained
by integrating Cp from 299 to 317 K for pure 8CB and all8CB+hex samples then subtracting the N-SmA transition en-thalpy. See Fig. 1a. The dispersive enthalpy of I-N transi-tion was obtained by integrating C just over the I-N C peakand then scaling by mass of the sample ms. See Fig. 1b. Inthis work, fixed heating frequency was used, thus HIN isonly proportional to the transition latent heat.
The resulting HIN and HIN for heating and cooling
scans as the function of hexane mole fraction for all 8CB+hex samples are shown in Fig. 5. The HIN
values are allapproximately shifted from that seen in pure 8CB but other-wise independent of xhex and are consistent on heating andcooling. See Fig. 5a. The dispersive enthalpy of the I-Ntransition HIN exhibits a sudden jump from 0.32 to 1.27 J/g
at xhex0.07. This step increase in HIN at xhex0.07 cor-responds to the plateau region seen in Fig. 4 for the TIN, TNA,and TN as a function of xhex.
IV. DISCUSSION AND CONCLUSIONS
The introduction of n-hexane to 8CB greatly affects thebehavior of I-N phase transition. The main effect of solventis to dilute the liquid crystal, resulting in two main changes:an impurity effect and viscoelastic softening of the mixture.The impurity mechanism introduces concentration fluctua-tions random local transition temperatures and a generictruncation of the order parameter correlation length. How-ever, the presence of solvent can screen LC molecules fromone another, a dilution effect, that softens the viscoelasticproperties of the mixture with respect to that of pure LC.This viscoelastic softening can substantially change the roleof order fluctuation in the phase transition leading to nonlin-ear shifts in Tc and hysteresis of the transition behavior.
Rieker22 studied the LCs/n-hexane systems on N-SmAphase transitions in LC/n-hexane systems and observed fromvisual inspection that for 8CB/n-hexane, the solvent was notuniformly distributed throughout the host LC and only aminimal, nonreproducible, swelling of the SmA layers wasobserved. However, these samples were of higher n-hexaneconcentration than ours, a reported volume fraction of 0.1. Inthe concentration range studied here, corresponding to a vol-ume fraction from 0.015 to 0.06, visual inspection of sealed8CB+hex samples over many months did not reveal any sign
FIG. 4. a The I-N and N-SmA phase transition temperatures as a functionof xhex on heating and cooling . Solid lines are guide to the eye anddashed line indicates the temperature of the Cp peaks on heating. b Thenematic temperature range TIN on heating and cooling as a func-tion of xhex. Dashed-dot lines indicate the transition temperature shifts in8CB+cyclohexane. See Ref. 26. The vertical dotted corresponds to the pointwhere HIN exhibits a jump in magnitude. c The I+N coexistence regionon heating and cooling as a function of xhex.
FIG. 5. a The total integrated Cp ac-enthalpy HIN and b integrated C
enthalpy HIN of the I-N transition for heating and cooling as thefunction of xhex. Solid lines are guide to the eye. The vertical dot lineindicates the jump in HIN . The thick solid line in b is the mean spacing
between n-hexane molecules l and the horizontal dashed line provides the
point at which it crosses the vertical dotted line, l0.07=23 Å.
044513-5 Behavior of liquid crystal-solvent mixtures J. Chem. Phys. 133, 044513 2010
Downloaded 09 Mar 2011 to 130.215.96.123. Redistribution subject to AIP license or copyright; see http://jcp.aip.org/about/rights_and_permissions
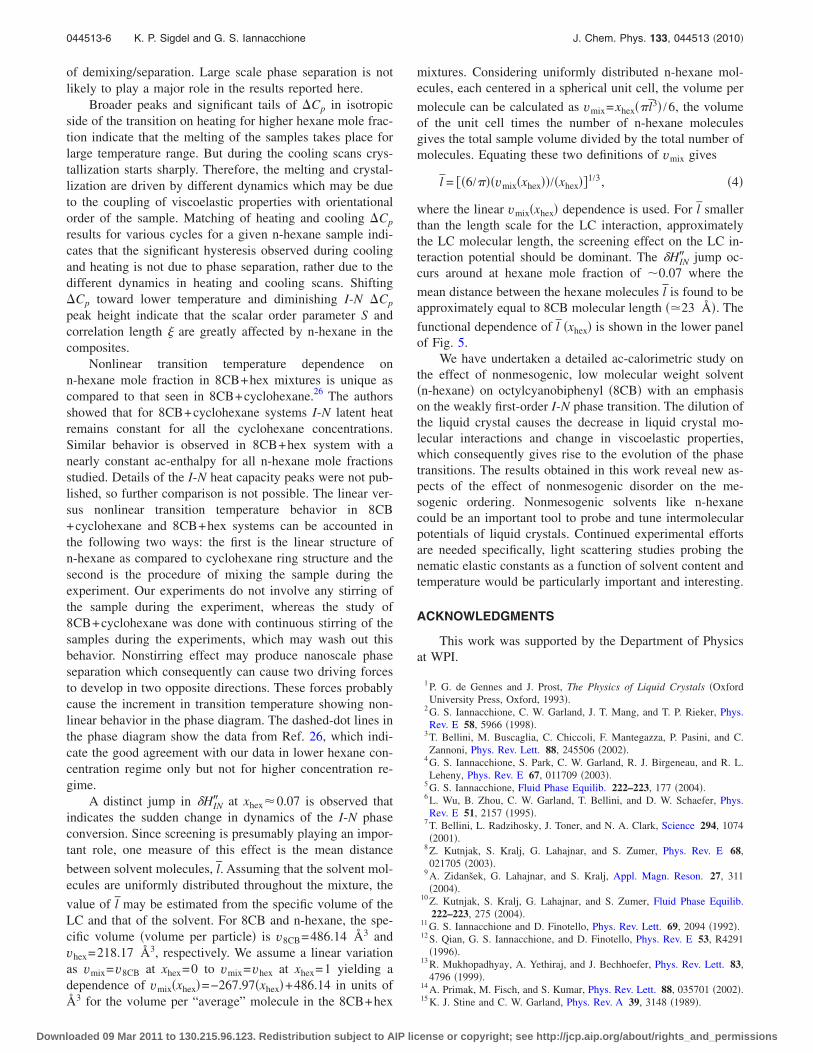
of demixing/separation. Large scale phase separation is notlikely to play a major role in the results reported here.
Broader peaks and significant tails of Cp in isotropicside of the transition on heating for higher hexane mole frac-tion indicate that the melting of the samples takes place forlarge temperature range. But during the cooling scans crys-tallization starts sharply. Therefore, the melting and crystal-lization are driven by different dynamics which may be dueto the coupling of viscoelastic properties with orientationalorder of the sample. Matching of heating and cooling Cp
results for various cycles for a given n-hexane sample indi-cates that the significant hysteresis observed during coolingand heating is not due to phase separation, rather due to thedifferent dynamics in heating and cooling scans. ShiftingCp toward lower temperature and diminishing I-N Cp
peak height indicate that the scalar order parameter S andcorrelation length are greatly affected by n-hexane in thecomposites.
Nonlinear transition temperature dependence onn-hexane mole fraction in 8CB+hex mixtures is unique ascompared to that seen in 8CB+cyclohexane.26 The authorsshowed that for 8CB+cyclohexane systems I-N latent heatremains constant for all the cyclohexane concentrations.Similar behavior is observed in 8CB+hex system with anearly constant ac-enthalpy for all n-hexane mole fractionsstudied. Details of the I-N heat capacity peaks were not pub-lished, so further comparison is not possible. The linear ver-sus nonlinear transition temperature behavior in 8CB+cyclohexane and 8CB+hex systems can be accounted inthe following two ways: the first is the linear structure ofn-hexane as compared to cyclohexane ring structure and thesecond is the procedure of mixing the sample during theexperiment. Our experiments do not involve any stirring ofthe sample during the experiment, whereas the study of8CB+cyclohexane was done with continuous stirring of thesamples during the experiments, which may wash out thisbehavior. Nonstirring effect may produce nanoscale phaseseparation which consequently can cause two driving forcesto develop in two opposite directions. These forces probablycause the increment in transition temperature showing non-linear behavior in the phase diagram. The dashed-dot lines inthe phase diagram show the data from Ref. 26, which indi-cate the good agreement with our data in lower hexane con-centration regime only but not for higher concentration re-gime.
A distinct jump in HIN at xhex0.07 is observed thatindicates the sudden change in dynamics of the I-N phaseconversion. Since screening is presumably playing an impor-tant role, one measure of this effect is the mean distance
between solvent molecules, l. Assuming that the solvent mol-ecules are uniformly distributed throughout the mixture, the
value of l may be estimated from the specific volume of theLC and that of the solvent. For 8CB and n-hexane, the spe-cific volume volume per particle is v8CB=486.14 Å3 andvhex=218.17 Å3, respectively. We assume a linear variationas vmix=v8CB at xhex=0 to vmix=vhex at xhex=1 yielding adependence of vmixxhex=−267.97xhex+486.14 in units ofÅ3 for the volume per “average” molecule in the 8CB+hex
mixtures. Considering uniformly distributed n-hexane mol-ecules, each centered in a spherical unit cell, the volume per
molecule can be calculated as vmix=xhexl3 /6, the volumeof the unit cell times the number of n-hexane moleculesgives the total sample volume divided by the total number ofmolecules. Equating these two definitions of vmix gives
l = 6/vmixxhex/xhex1/3, 4
where the linear vmixxhex dependence is used. For l smallerthan the length scale for the LC interaction, approximatelythe LC molecular length, the screening effect on the LC in-teraction potential should be dominant. The HIN jump oc-curs around at hexane mole fraction of 0.07 where the
mean distance between the hexane molecules l is found to beapproximately equal to 8CB molecular length 23 Å. The
functional dependence of l xhex is shown in the lower panelof Fig. 5.
We have undertaken a detailed ac-calorimetric study onthe effect of nonmesogenic, low molecular weight solventn-hexane on octylcyanobiphenyl 8CB with an emphasison the weakly first-order I-N phase transition. The dilution ofthe liquid crystal causes the decrease in liquid crystal mo-lecular interactions and change in viscoelastic properties,which consequently gives rise to the evolution of the phasetransitions. The results obtained in this work reveal new as-pects of the effect of nonmesogenic disorder on the me-sogenic ordering. Nonmesogenic solvents like n-hexanecould be an important tool to probe and tune intermolecularpotentials of liquid crystals. Continued experimental effortsare needed specifically, light scattering studies probing thenematic elastic constants as a function of solvent content andtemperature would be particularly important and interesting.
ACKNOWLEDGMENTS
This work was supported by the Department of Physicsat WPI.
1 P. G. de Gennes and J. Prost, The Physics of Liquid Crystals OxfordUniversity Press, Oxford, 1993.
2 G. S. Iannacchione, C. W. Garland, J. T. Mang, and T. P. Rieker, Phys.Rev. E 58, 5966 1998.
3 T. Bellini, M. Buscaglia, C. Chiccoli, F. Mantegazza, P. Pasini, and C.Zannoni, Phys. Rev. Lett. 88, 245506 2002.
4 G. S. Iannacchione, S. Park, C. W. Garland, R. J. Birgeneau, and R. L.Leheny, Phys. Rev. E 67, 011709 2003.
5 G. S. Iannacchione, Fluid Phase Equilib. 222–223, 177 2004.6 L. Wu, B. Zhou, C. W. Garland, T. Bellini, and D. W. Schaefer, Phys.Rev. E 51, 2157 1995.
7 T. Bellini, L. Radzihosky, J. Toner, and N. A. Clark, Science 294, 10742001.
8 Z. Kutnjak, S. Kralj, G. Lahajnar, and S. Zumer, Phys. Rev. E 68,021705 2003.
9 A. Zidanšek, G. Lahajnar, and S. Kralj, Appl. Magn. Reson. 27, 3112004.
10 Z. Kutnjak, S. Kralj, G. Lahajnar, and S. Zumer, Fluid Phase Equilib.222–223, 275 2004.
11 G. S. Iannacchione and D. Finotello, Phys. Rev. Lett. 69, 2094 1992.12 S. Qian, G. S. Iannacchione, and D. Finotello, Phys. Rev. E 53, R4291
1996.13 R. Mukhopadhyay, A. Yethiraj, and J. Bechhoefer, Phys. Rev. Lett. 83,
4796 1999.14 A. Primak, M. Fisch, and S. Kumar, Phys. Rev. Lett. 88, 035701 2002.15 K. J. Stine and C. W. Garland, Phys. Rev. A 39, 3148 1989.
044513-6 K. P. Sigdel and G. S. Iannacchione J. Chem. Phys. 133, 044513 2010
Downloaded 09 Mar 2011 to 130.215.96.123. Redistribution subject to AIP license or copyright; see http://jcp.aip.org/about/rights_and_permissions
16 M. B. Sied, J. Salud, D. O. Lopez, M. Barrio, and J. L. Tamarit, Phys.Chem. Chem. Phys. 4, 2587 2002.
17 M. B. Sied, D. O. Lopez, J. L. Tamarit, and M. Barrio, Liq. Cryst. 29, 572002.
18 M. G. Lafouresse, M. B. Sied, H. Allouchi, D. O. Lopez, J. Salud, and J.L. Tamarit, Chem. Phys. Lett. 376, 188 2003.
19 J.-C. Loudet, P. Barois, and P. Poulin, Nature London 407, 611 2000.20 J. Yamamoto and H. Tanaka, Nature London 409, 321 2001.21 M. Caggioni, A. Giacometti, T. Bellini, N. A. Clark, F. Mantegazza, and
A. Maritan, J. Chem. Phys. 122, 214721 2005.22 T. P. Rieker, Liq. Cryst. 19, 497 1995.23 S. DasGupta and S. K. Roy, Phys. Lett. A 288, 323 2001.24 P. K. Mukherjee, J. Chem. Phys. 116, 9531 2002.
25 K. Denolf, B. V. Roie, C. Glorienx, and J. Thoen, Phys. Rev. Lett. 97,107801 2006.
26 K. Denolf, G. Cordoyiannis, C. Glorienx, and J. Thoen, Phys. Rev. E 76,051702 2007.
27 P. F. Sullivan and G. Seidel, Phys. Rev. 173, 679 1968.28 D. Finotello, S. Qian, and G. S. Iannacchione, Thermochim. Acta 304–
305, 303 1997.29 H. Yao and C. W. Garland, Rev. Sci. Instrum. 69, 172 1998.30 A. Roshi, G. S. Iannacchione, P. S. Clegg, and R. J. Birgeneau, Phys.
Rev. E 69, 031703 2004.31 B. Zhou, G. S. Iannacchione, and C. W. Garland, Phys. Rev. E 55, 2962
1997.
044513-7 Behavior of liquid crystal-solvent mixtures J. Chem. Phys. 133, 044513 2010
Downloaded 09 Mar 2011 to 130.215.96.123. Redistribution subject to AIP license or copyright; see http://jcp.aip.org/about/rights_and_permissions
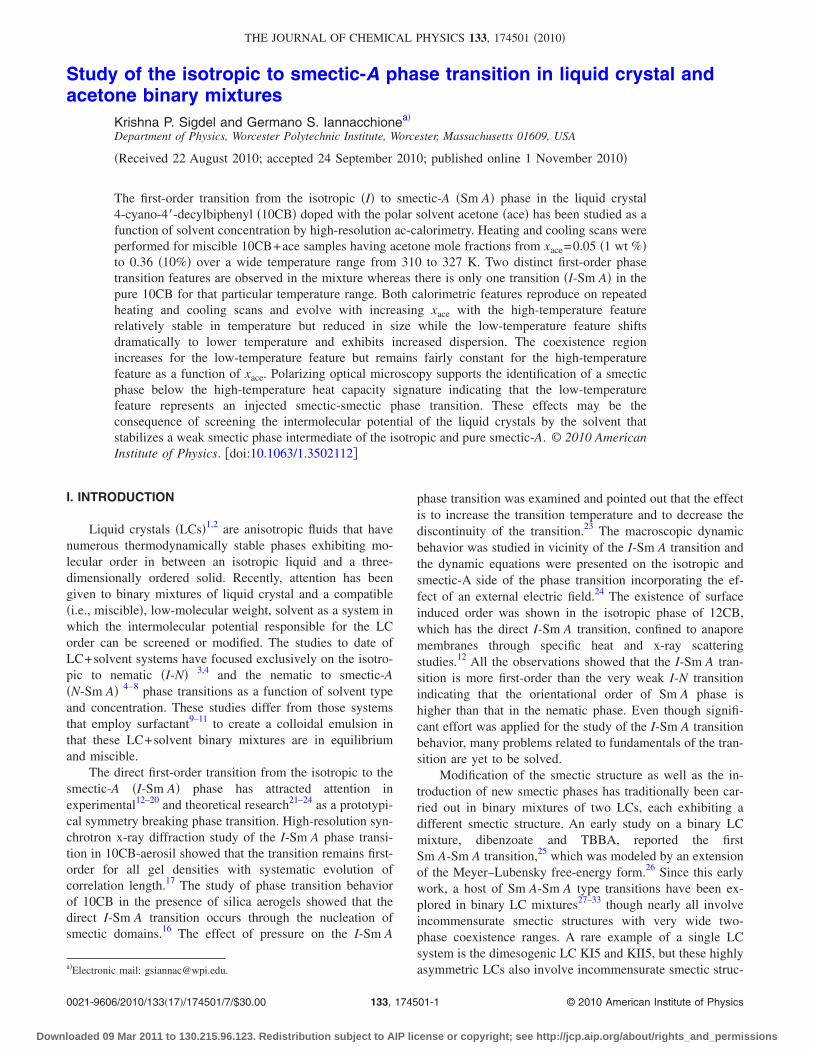
Study of the isotropic to smectic-A phase transition in liquid crystal andacetone binary mixtures
Krishna P. Sigdel and Germano S. Iannacchionea
Department of Physics, Worcester Polytechnic Institute, Worcester, Massachusetts 01609, USA
Received 22 August 2010; accepted 24 September 2010; published online 1 November 2010
The first-order transition from the isotropic I to smectic-A Sm A phase in the liquid crystal4-cyano-4-decylbiphenyl 10CB doped with the polar solvent acetone ace has been studied as afunction of solvent concentration by high-resolution ac-calorimetry. Heating and cooling scans wereperformed for miscible 10CB+ace samples having acetone mole fractions from xace=0.05 1 wt %to 0.36 10% over a wide temperature range from 310 to 327 K. Two distinct first-order phasetransition features are observed in the mixture whereas there is only one transition I-Sm A in thepure 10CB for that particular temperature range. Both calorimetric features reproduce on repeatedheating and cooling scans and evolve with increasing xace with the high-temperature featurerelatively stable in temperature but reduced in size while the low-temperature feature shiftsdramatically to lower temperature and exhibits increased dispersion. The coexistence regionincreases for the low-temperature feature but remains fairly constant for the high-temperaturefeature as a function of xace. Polarizing optical microscopy supports the identification of a smecticphase below the high-temperature heat capacity signature indicating that the low-temperaturefeature represents an injected smectic-smectic phase transition. These effects may be theconsequence of screening the intermolecular potential of the liquid crystals by the solvent thatstabilizes a weak smectic phase intermediate of the isotropic and pure smectic-A. © 2010 AmericanInstitute of Physics. doi:10.1063/1.3502112
I. INTRODUCTION
Liquid crystals LCs1,2 are anisotropic fluids that havenumerous thermodynamically stable phases exhibiting mo-lecular order in between an isotropic liquid and a three-dimensionally ordered solid. Recently, attention has beengiven to binary mixtures of liquid crystal and a compatiblei.e., miscible, low-molecular weight, solvent as a system inwhich the intermolecular potential responsible for the LCorder can be screened or modified. The studies to date ofLC+solvent systems have focused exclusively on the isotro-pic to nematic I-N 3,4 and the nematic to smectic-AN-Sm A 4–8 phase transitions as a function of solvent typeand concentration. These studies differ from those systemsthat employ surfactant9–11 to create a colloidal emulsion inthat these LC+solvent binary mixtures are in equilibriumand miscible.
The direct first-order transition from the isotropic to thesmectic-A I-Sm A phase has attracted attention inexperimental12–20 and theoretical research21–24 as a prototypi-cal symmetry breaking phase transition. High-resolution syn-chrotron x-ray diffraction study of the I-Sm A phase transi-tion in 10CB-aerosil showed that the transition remains first-order for all gel densities with systematic evolution ofcorrelation length.17 The study of phase transition behaviorof 10CB in the presence of silica aerogels showed that thedirect I-Sm A transition occurs through the nucleation ofsmectic domains.16 The effect of pressure on the I-Sm A
phase transition was examined and pointed out that the effectis to increase the transition temperature and to decrease thediscontinuity of the transition.23 The macroscopic dynamicbehavior was studied in vicinity of the I-Sm A transition andthe dynamic equations were presented on the isotropic andsmectic-A side of the phase transition incorporating the ef-fect of an external electric field.24 The existence of surfaceinduced order was shown in the isotropic phase of 12CB,which has the direct I-Sm A transition, confined to anaporemembranes through specific heat and x-ray scatteringstudies.12 All the observations showed that the I-Sm A tran-sition is more first-order than the very weak I-N transitionindicating that the orientational order of Sm A phase ishigher than that in the nematic phase. Even though signifi-cant effort was applied for the study of the I-Sm A transitionbehavior, many problems related to fundamentals of the tran-sition are yet to be solved.
Modification of the smectic structure as well as the in-troduction of new smectic phases has traditionally been car-ried out in binary mixtures of two LCs, each exhibiting adifferent smectic structure. An early study on a binary LCmixture, dibenzoate and TBBA, reported the firstSm A-Sm A transition,25 which was modeled by an extensionof the Meyer–Lubensky free-energy form.26 Since this earlywork, a host of Sm A-Sm A type transitions have been ex-plored in binary LC mixtures27–33 though nearly all involveincommensurate smectic structures with very wide two-phase coexistence ranges. A rare example of a single LCsystem is the dimesogenic LC KI5 and KII5, but these highlyasymmetric LCs also involve incommensurate smectic struc-aElectronic mail: [email protected].
THE JOURNAL OF CHEMICAL PHYSICS 133, 174501 2010
0021-9606/2010/13317/174501/7/$30.00 © 2010 American Institute of Physics133, 174501-1
Downloaded 09 Mar 2011 to 130.215.96.123. Redistribution subject to AIP license or copyright; see http://jcp.aip.org/about/rights_and_permissions
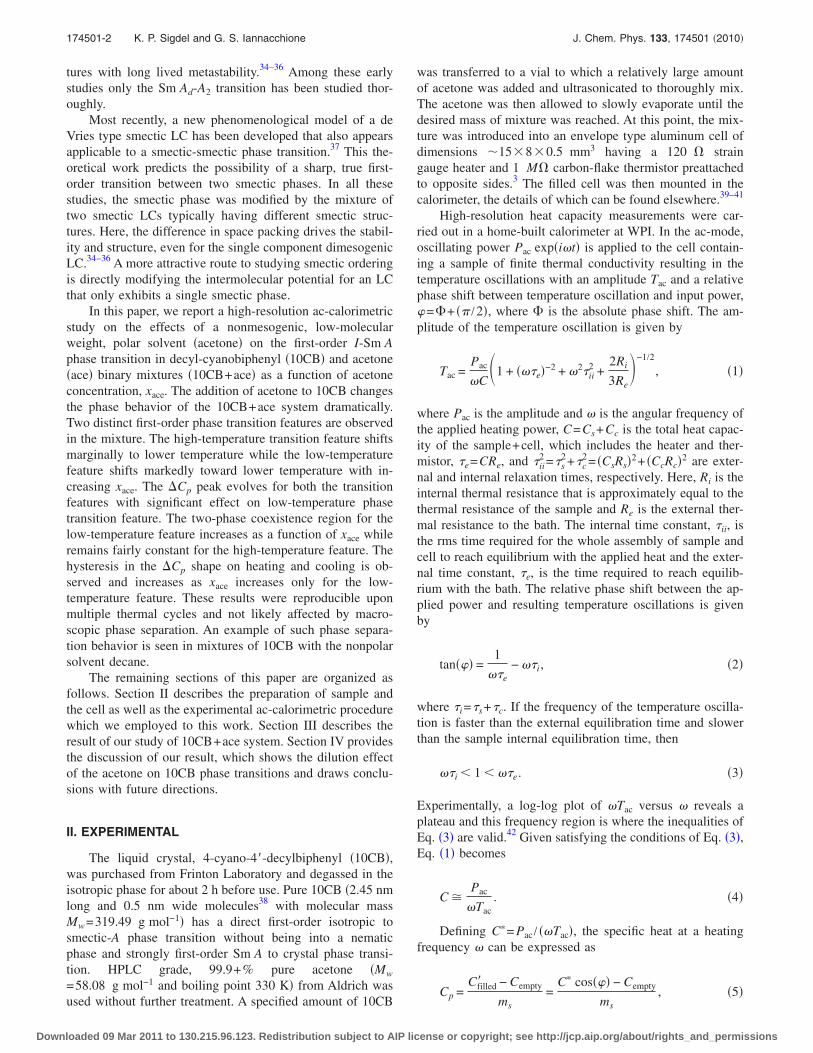
tures with long lived metastability.34–36 Among these earlystudies only the Sm Ad-A2 transition has been studied thor-oughly.
Most recently, a new phenomenological model of a deVries type smectic LC has been developed that also appearsapplicable to a smectic-smectic phase transition.37 This the-oretical work predicts the possibility of a sharp, true first-order transition between two smectic phases. In all thesestudies, the smectic phase was modified by the mixture oftwo smectic LCs typically having different smectic struc-tures. Here, the difference in space packing drives the stabil-ity and structure, even for the single component dimesogenicLC.34–36 A more attractive route to studying smectic orderingis directly modifying the intermolecular potential for an LCthat only exhibits a single smectic phase.
In this paper, we report a high-resolution ac-calorimetricstudy on the effects of a nonmesogenic, low-molecularweight, polar solvent acetone on the first-order I-Sm Aphase transition in decyl-cyanobiphenyl 10CB and acetoneace binary mixtures 10CB+ace as a function of acetoneconcentration, xace. The addition of acetone to 10CB changesthe phase behavior of the 10CB+ace system dramatically.Two distinct first-order phase transition features are observedin the mixture. The high-temperature transition feature shiftsmarginally to lower temperature while the low-temperaturefeature shifts markedly toward lower temperature with in-creasing xace. The Cp peak evolves for both the transitionfeatures with significant effect on low-temperature phasetransition feature. The two-phase coexistence region for thelow-temperature feature increases as a function of xace whileremains fairly constant for the high-temperature feature. Thehysteresis in the Cp shape on heating and cooling is ob-served and increases as xace increases only for the low-temperature feature. These results were reproducible uponmultiple thermal cycles and not likely affected by macro-scopic phase separation. An example of such phase separa-tion behavior is seen in mixtures of 10CB with the nonpolarsolvent decane.
The remaining sections of this paper are organized asfollows. Section II describes the preparation of sample andthe cell as well as the experimental ac-calorimetric procedurewhich we employed to this work. Section III describes theresult of our study of 10CB+ace system. Section IV providesthe discussion of our result, which shows the dilution effectof the acetone on 10CB phase transitions and draws conclu-sions with future directions.
II. EXPERIMENTAL
The liquid crystal, 4-cyano-4-decylbiphenyl 10CB,was purchased from Frinton Laboratory and degassed in theisotropic phase for about 2 h before use. Pure 10CB 2.45 nmlong and 0.5 nm wide molecules38 with molecular massMw=319.49 g mol−1 has a direct first-order isotropic tosmectic-A phase transition without being into a nematicphase and strongly first-order Sm A to crystal phase transi-tion. HPLC grade, 99.9+% pure acetone Mw
=58.08 g mol−1 and boiling point 330 K from Aldrich wasused without further treatment. A specified amount of 10CB
was transferred to a vial to which a relatively large amountof acetone was added and ultrasonicated to thoroughly mix.The acetone was then allowed to slowly evaporate until thedesired mass of mixture was reached. At this point, the mix-ture was introduced into an envelope type aluminum cell ofdimensions 1580.5 mm3 having a 120 straingauge heater and 1 M carbon-flake thermistor preattachedto opposite sides.3 The filled cell was then mounted in thecalorimeter, the details of which can be found elsewhere.39–41
High-resolution heat capacity measurements were car-ried out in a home-built calorimeter at WPI. In the ac-mode,oscillating power Pac expit is applied to the cell contain-ing a sample of finite thermal conductivity resulting in thetemperature oscillations with an amplitude Tac and a relativephase shift between temperature oscillation and input power,=+ /2, where is the absolute phase shift. The am-plitude of the temperature oscillation is given by
Tac =Pac
C1 + e−2 + 2ii
2 +2Ri
3Re−1/2
, 1
where Pac is the amplitude and is the angular frequency ofthe applied heating power, C=Cs+Cc is the total heat capac-ity of the sample+cell, which includes the heater and ther-mistor, e=CRe, and ii
2 =s2+c
2= CsRs2+ CcRc2 are exter-nal and internal relaxation times, respectively. Here, Ri is theinternal thermal resistance that is approximately equal to thethermal resistance of the sample and Re is the external ther-mal resistance to the bath. The internal time constant, ii, isthe rms time required for the whole assembly of sample andcell to reach equilibrium with the applied heat and the exter-nal time constant, e, is the time required to reach equilib-rium with the bath. The relative phase shift between the ap-plied power and resulting temperature oscillations is givenby
tan =1
e− i, 2
where i=s+c. If the frequency of the temperature oscilla-tion is faster than the external equilibration time and slowerthan the sample internal equilibration time, then
i 1 e. 3
Experimentally, a log-log plot of Tac versus reveals aplateau and this frequency region is where the inequalities ofEq. 3 are valid.42 Given satisfying the conditions of Eq. 3,Eq. 1 becomes
C Pac
Tac. 4
Defining C= Pac / Tac, the specific heat at a heatingfrequency can be expressed as
Cp =Cfilled − Cempty
ms=
C cos − Cempty
ms, 5
174501-2 K. P. Sigdel and G. S. Iannacchione J. Chem. Phys. 133, 174501 2010
Downloaded 09 Mar 2011 to 130.215.96.123. Redistribution subject to AIP license or copyright; see http://jcp.aip.org/about/rights_and_permissions
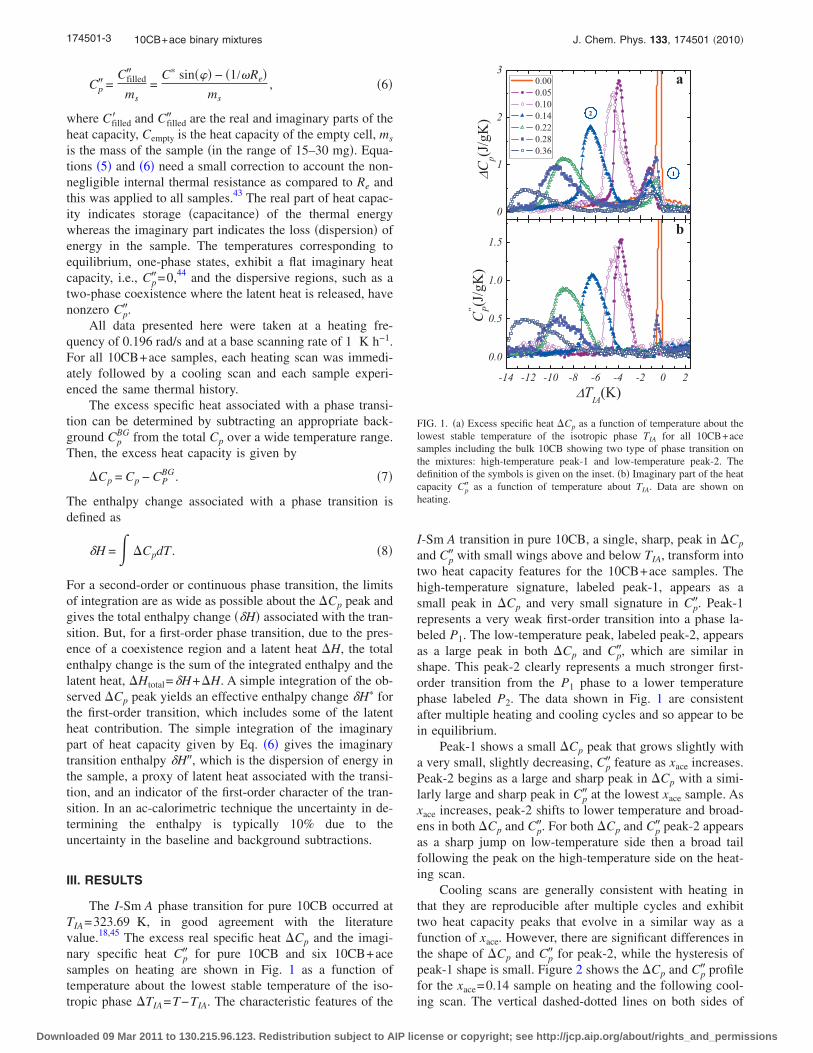
Cp =Cfilled
ms=
C sin − 1/Rems
, 6
where Cfilled and Cfilled are the real and imaginary parts of theheat capacity, Cempty is the heat capacity of the empty cell, ms
is the mass of the sample in the range of 15–30 mg. Equa-tions 5 and 6 need a small correction to account the non-negligible internal thermal resistance as compared to Re andthis was applied to all samples.43 The real part of heat capac-ity indicates storage capacitance of the thermal energywhereas the imaginary part indicates the loss dispersion ofenergy in the sample. The temperatures corresponding toequilibrium, one-phase states, exhibit a flat imaginary heatcapacity, i.e., Cp=0,44 and the dispersive regions, such as atwo-phase coexistence where the latent heat is released, havenonzero Cp.
All data presented here were taken at a heating fre-quency of 0.196 rad/s and at a base scanning rate of 1 K h−1.For all 10CB+ace samples, each heating scan was immedi-ately followed by a cooling scan and each sample experi-enced the same thermal history.
The excess specific heat associated with a phase transi-tion can be determined by subtracting an appropriate back-ground Cp
BG from the total Cp over a wide temperature range.Then, the excess heat capacity is given by
Cp = Cp − CPBG. 7
The enthalpy change associated with a phase transition isdefined as
H = CpdT . 8
For a second-order or continuous phase transition, the limitsof integration are as wide as possible about the Cp peak andgives the total enthalpy change H associated with the tran-sition. But, for a first-order phase transition, due to the pres-ence of a coexistence region and a latent heat H, the totalenthalpy change is the sum of the integrated enthalpy and thelatent heat, Htotal=H+H. A simple integration of the ob-served Cp peak yields an effective enthalpy change H forthe first-order transition, which includes some of the latentheat contribution. The simple integration of the imaginarypart of heat capacity given by Eq. 6 gives the imaginarytransition enthalpy H, which is the dispersion of energy inthe sample, a proxy of latent heat associated with the transi-tion, and an indicator of the first-order character of the tran-sition. In an ac-calorimetric technique the uncertainty in de-termining the enthalpy is typically 10% due to theuncertainty in the baseline and background subtractions.
III. RESULTS
The I-Sm A phase transition for pure 10CB occurred atTIA=323.69 K, in good agreement with the literaturevalue.18,45 The excess real specific heat Cp and the imagi-nary specific heat Cp for pure 10CB and six 10CB+acesamples on heating are shown in Fig. 1 as a function oftemperature about the lowest stable temperature of the iso-tropic phase TIA=T−TIA. The characteristic features of the
I-Sm A transition in pure 10CB, a single, sharp, peak in Cp
and Cp with small wings above and below TIA, transform intotwo heat capacity features for the 10CB+ace samples. Thehigh-temperature signature, labeled peak-1, appears as asmall peak in Cp and very small signature in Cp. Peak-1represents a very weak first-order transition into a phase la-beled P1. The low-temperature peak, labeled peak-2, appearsas a large peak in both Cp and Cp, which are similar inshape. This peak-2 clearly represents a much stronger first-order transition from the P1 phase to a lower temperaturephase labeled P2. The data shown in Fig. 1 are consistentafter multiple heating and cooling cycles and so appear to bein equilibrium.
Peak-1 shows a small Cp peak that grows slightly witha very small, slightly decreasing, Cp feature as xace increases.Peak-2 begins as a large and sharp peak in Cp with a simi-larly large and sharp peak in Cp at the lowest xace sample. Asxace increases, peak-2 shifts to lower temperature and broad-ens in both Cp and Cp. For both Cp and Cp peak-2 appearsas a sharp jump on low-temperature side then a broad tailfollowing the peak on the high-temperature side on the heat-ing scan.
Cooling scans are generally consistent with heating inthat they are reproducible after multiple cycles and exhibittwo heat capacity peaks that evolve in a similar way as afunction of xace. However, there are significant differences inthe shape of Cp and Cp for peak-2, while the hysteresis ofpeak-1 shape is small. Figure 2 shows the Cp and Cp profilefor the xace=0.14 sample on heating and the following cool-ing scan. The vertical dashed-dotted lines on both sides of
FIG. 1. a Excess specific heat Cp as a function of temperature about thelowest stable temperature of the isotropic phase TIA for all 10CB+acesamples including the bulk 10CB showing two type of phase transition onthe mixtures: high-temperature peak-1 and low-temperature peak-2. Thedefinition of the symbols is given on the inset. b Imaginary part of the heatcapacity Cp as a function of temperature about TIA. Data are shown onheating.
174501-3 10CB+ace binary mixtures J. Chem. Phys. 133, 174501 2010
Downloaded 09 Mar 2011 to 130.215.96.123. Redistribution subject to AIP license or copyright; see http://jcp.aip.org/about/rights_and_permissions
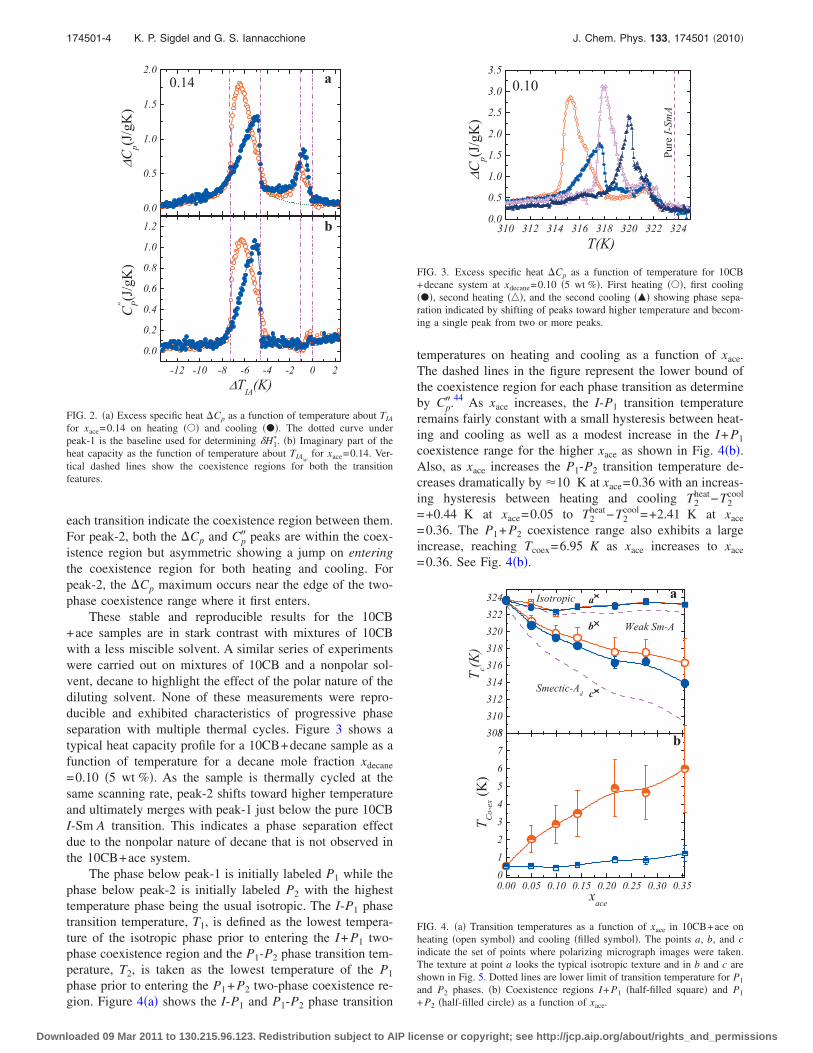
each transition indicate the coexistence region between them.For peak-2, both the Cp and Cp peaks are within the coex-istence region but asymmetric showing a jump on enteringthe coexistence region for both heating and cooling. Forpeak-2, the Cp maximum occurs near the edge of the two-phase coexistence range where it first enters.
These stable and reproducible results for the 10CB+ace samples are in stark contrast with mixtures of 10CBwith a less miscible solvent. A similar series of experimentswere carried out on mixtures of 10CB and a nonpolar sol-vent, decane to highlight the effect of the polar nature of thediluting solvent. None of these measurements were repro-ducible and exhibited characteristics of progressive phaseseparation with multiple thermal cycles. Figure 3 shows atypical heat capacity profile for a 10CB+decane sample as afunction of temperature for a decane mole fraction xdecane
=0.10 5 wt %. As the sample is thermally cycled at thesame scanning rate, peak-2 shifts toward higher temperatureand ultimately merges with peak-1 just below the pure 10CBI-Sm A transition. This indicates a phase separation effectdue to the nonpolar nature of decane that is not observed inthe 10CB+ace system.
The phase below peak-1 is initially labeled P1 while thephase below peak-2 is initially labeled P2 with the highesttemperature phase being the usual isotropic. The I-P1 phasetransition temperature, T1, is defined as the lowest tempera-ture of the isotropic phase prior to entering the I+ P1 two-phase coexistence region and the P1-P2 phase transition tem-perature, T2, is taken as the lowest temperature of the P1
phase prior to entering the P1+ P2 two-phase coexistence re-gion. Figure 4a shows the I-P1 and P1-P2 phase transition
temperatures on heating and cooling as a function of xace.The dashed lines in the figure represent the lower bound ofthe coexistence region for each phase transition as determineby Cp.
44 As xace increases, the I-P1 transition temperatureremains fairly constant with a small hysteresis between heat-ing and cooling as well as a modest increase in the I+ P1
coexistence range for the higher xace as shown in Fig. 4b.Also, as xace increases the P1-P2 transition temperature de-creases dramatically by 10 K at xace=0.36 with an increas-ing hysteresis between heating and cooling T2
heat−T2cool
=+0.44 K at xace=0.05 to T2heat−T2
cool=+2.41 K at xace
=0.36. The P1+ P2 coexistence range also exhibits a largeincrease, reaching Tcoex=6.95 K as xace increases to xace
=0.36. See Fig. 4b.
FIG. 2. a Excess specific heat Cp as a function of temperature about TIA
for xace=0.14 on heating and cooling . The dotted curve underpeak-1 is the baseline used for determining H1
. b Imaginary part of theheat capacity as the function of temperature about TIAw
for xace=0.14. Ver-tical dashed lines show the coexistence regions for both the transitionfeatures.
FIG. 3. Excess specific heat Cp as a function of temperature for 10CB+decane system at xdecane=0.10 5 wt %. First heating , first cooling, second heating , and the second cooling showing phase sepa-ration indicated by shifting of peaks toward higher temperature and becom-ing a single peak from two or more peaks.
FIG. 4. a Transition temperatures as a function of xace in 10CB+ace onheating open symbol and cooling filled symbol. The points a, b, and cindicate the set of points where polarizing micrograph images were taken.The texture at point a looks the typical isotropic texture and in b and c areshown in Fig. 5. Dotted lines are lower limit of transition temperature for P1
and P2 phases. b Coexistence regions I+ P1 half-filled square and P1
+ P2 half-filled circle as a function of xace.
174501-4 K. P. Sigdel and G. S. Iannacchione J. Chem. Phys. 133, 174501 2010
Downloaded 09 Mar 2011 to 130.215.96.123. Redistribution subject to AIP license or copyright; see http://jcp.aip.org/about/rights_and_permissions
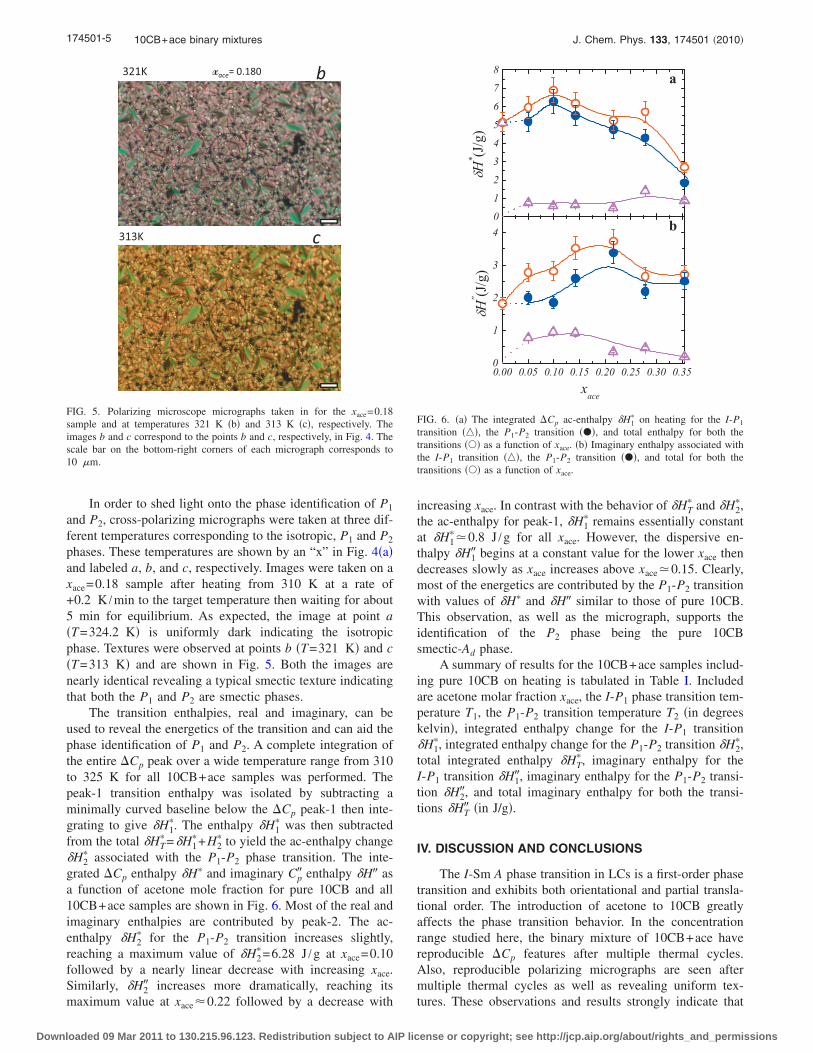
In order to shed light onto the phase identification of P1
and P2, cross-polarizing micrographs were taken at three dif-ferent temperatures corresponding to the isotropic, P1 and P2
phases. These temperatures are shown by an “x” in Fig. 4aand labeled a, b, and c, respectively. Images were taken on axace=0.18 sample after heating from 310 K at a rate of+0.2 K /min to the target temperature then waiting for about5 min for equilibrium. As expected, the image at point aT=324.2 K is uniformly dark indicating the isotropicphase. Textures were observed at points b T=321 K and cT=313 K and are shown in Fig. 5. Both the images arenearly identical revealing a typical smectic texture indicatingthat both the P1 and P2 are smectic phases.
The transition enthalpies, real and imaginary, can beused to reveal the energetics of the transition and can aid thephase identification of P1 and P2. A complete integration ofthe entire Cp peak over a wide temperature range from 310to 325 K for all 10CB+ace samples was performed. Thepeak-1 transition enthalpy was isolated by subtracting aminimally curved baseline below the Cp peak-1 then inte-grating to give H1
. The enthalpy H1 was then subtracted
from the total HT =H1
+H2 to yield the ac-enthalpy change
H2 associated with the P1-P2 phase transition. The inte-
grated Cp enthalpy H and imaginary Cp enthalpy H asa function of acetone mole fraction for pure 10CB and all10CB+ace samples are shown in Fig. 6. Most of the real andimaginary enthalpies are contributed by peak-2. The ac-enthalpy H2
for the P1-P2 transition increases slightly,reaching a maximum value of H2
=6.28 J /g at xace=0.10followed by a nearly linear decrease with increasing xace.Similarly, H2 increases more dramatically, reaching itsmaximum value at xace0.22 followed by a decrease with
increasing xace. In contrast with the behavior of HT and H2
,the ac-enthalpy for peak-1, H1
remains essentially constantat H1
0.8 J /g for all xace. However, the dispersive en-thalpy H1 begins at a constant value for the lower xace thendecreases slowly as xace increases above xace0.15. Clearly,most of the energetics are contributed by the P1-P2 transitionwith values of H and H similar to those of pure 10CB.This observation, as well as the micrograph, supports theidentification of the P2 phase being the pure 10CBsmectic-Ad phase.
A summary of results for the 10CB+ace samples includ-ing pure 10CB on heating is tabulated in Table I. Includedare acetone molar fraction xace, the I-P1 phase transition tem-perature T1, the P1-P2 transition temperature T2 in degreeskelvin, integrated enthalpy change for the I-P1 transitionH1
, integrated enthalpy change for the P1-P2 transition H2,
total integrated enthalpy HT, imaginary enthalpy for the
I-P1 transition H1, imaginary enthalpy for the P1-P2 transi-tion H2, and total imaginary enthalpy for both the transi-tions HT in J/g.
IV. DISCUSSION AND CONCLUSIONS
The I-Sm A phase transition in LCs is a first-order phasetransition and exhibits both orientational and partial transla-tional order. The introduction of acetone to 10CB greatlyaffects the phase transition behavior. In the concentrationrange studied here, the binary mixture of 10CB+ace havereproducible Cp features after multiple thermal cycles.Also, reproducible polarizing micrographs are seen aftermultiple thermal cycles as well as revealing uniform tex-tures. These observations and results strongly indicate that
321K
313K
b
c
xace= 0.180
FIG. 5. Polarizing microscope micrographs taken in for the xace=0.18sample and at temperatures 321 K b and 313 K c, respectively. Theimages b and c correspond to the points b and c, respectively, in Fig. 4. Thescale bar on the bottom-right corners of each micrograph corresponds to10 m.
FIG. 6. a The integrated Cp ac-enthalpy H1 on heating for the I-P1
transition , the P1-P2 transition , and total enthalpy for both thetransitions as a function of xace. b Imaginary enthalpy associated withthe I-P1 transition , the P1-P2 transition , and total for both thetransitions as a function of xace.
174501-5 10CB+ace binary mixtures J. Chem. Phys. 133, 174501 2010
Downloaded 09 Mar 2011 to 130.215.96.123. Redistribution subject to AIP license or copyright; see http://jcp.aip.org/about/rights_and_permissions
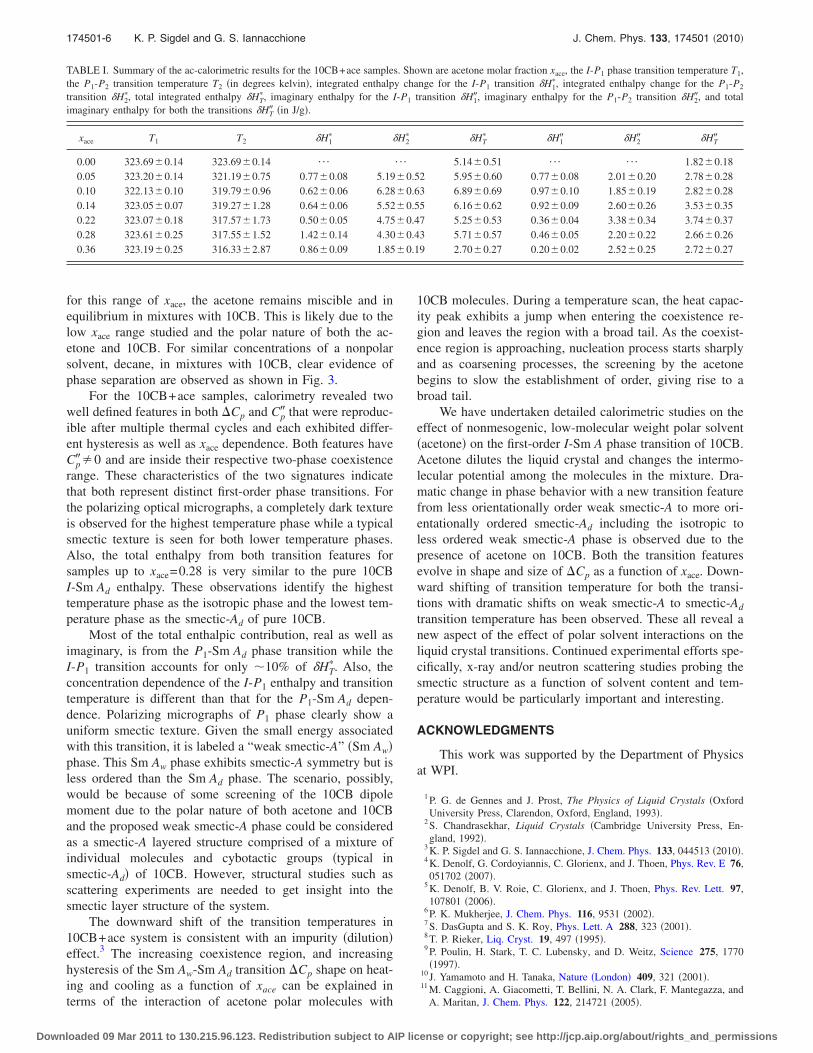
for this range of xace, the acetone remains miscible and inequilibrium in mixtures with 10CB. This is likely due to thelow xace range studied and the polar nature of both the ac-etone and 10CB. For similar concentrations of a nonpolarsolvent, decane, in mixtures with 10CB, clear evidence ofphase separation are observed as shown in Fig. 3.
For the 10CB+ace samples, calorimetry revealed twowell defined features in both Cp and Cp that were reproduc-ible after multiple thermal cycles and each exhibited differ-ent hysteresis as well as xace dependence. Both features haveCp0 and are inside their respective two-phase coexistencerange. These characteristics of the two signatures indicatethat both represent distinct first-order phase transitions. Forthe polarizing optical micrographs, a completely dark textureis observed for the highest temperature phase while a typicalsmectic texture is seen for both lower temperature phases.Also, the total enthalpy from both transition features forsamples up to xace=0.28 is very similar to the pure 10CBI-Sm Ad enthalpy. These observations identify the highesttemperature phase as the isotropic phase and the lowest tem-perature phase as the smectic-Ad of pure 10CB.
Most of the total enthalpic contribution, real as well asimaginary, is from the P1-Sm Ad phase transition while theI-P1 transition accounts for only 10% of HT
. Also, theconcentration dependence of the I-P1 enthalpy and transitiontemperature is different than that for the P1-Sm Ad depen-dence. Polarizing micrographs of P1 phase clearly show auniform smectic texture. Given the small energy associatedwith this transition, it is labeled a “weak smectic-A” Sm Awphase. This Sm Aw phase exhibits smectic-A symmetry but isless ordered than the Sm Ad phase. The scenario, possibly,would be because of some screening of the 10CB dipolemoment due to the polar nature of both acetone and 10CBand the proposed weak smectic-A phase could be consideredas a smectic-A layered structure comprised of a mixture ofindividual molecules and cybotactic groups typical insmectic-Ad of 10CB. However, structural studies such asscattering experiments are needed to get insight into thesmectic layer structure of the system.
The downward shift of the transition temperatures in10CB+ace system is consistent with an impurity dilutioneffect.3 The increasing coexistence region, and increasinghysteresis of the Sm Aw-Sm Ad transition Cp shape on heat-ing and cooling as a function of xace can be explained interms of the interaction of acetone polar molecules with
10CB molecules. During a temperature scan, the heat capac-ity peak exhibits a jump when entering the coexistence re-gion and leaves the region with a broad tail. As the coexist-ence region is approaching, nucleation process starts sharplyand as coarsening processes, the screening by the acetonebegins to slow the establishment of order, giving rise to abroad tail.
We have undertaken detailed calorimetric studies on theeffect of nonmesogenic, low-molecular weight polar solventacetone on the first-order I-Sm A phase transition of 10CB.Acetone dilutes the liquid crystal and changes the intermo-lecular potential among the molecules in the mixture. Dra-matic change in phase behavior with a new transition featurefrom less orientationally order weak smectic-A to more ori-entationally ordered smectic-Ad including the isotropic toless ordered weak smectic-A phase is observed due to thepresence of acetone on 10CB. Both the transition featuresevolve in shape and size of Cp as a function of xace. Down-ward shifting of transition temperature for both the transi-tions with dramatic shifts on weak smectic-A to smectic-Ad
transition temperature has been observed. These all reveal anew aspect of the effect of polar solvent interactions on theliquid crystal transitions. Continued experimental efforts spe-cifically, x-ray and/or neutron scattering studies probing thesmectic structure as a function of solvent content and tem-perature would be particularly important and interesting.
ACKNOWLEDGMENTS
This work was supported by the Department of Physicsat WPI.
1 P. G. de Gennes and J. Prost, The Physics of Liquid Crystals OxfordUniversity Press, Clarendon, Oxford, England, 1993.
2 S. Chandrasekhar, Liquid Crystals Cambridge University Press, En-gland, 1992.
3 K. P. Sigdel and G. S. Iannacchione, J. Chem. Phys. 133, 044513 2010.4 K. Denolf, G. Cordoyiannis, C. Glorienx, and J. Thoen, Phys. Rev. E 76,051702 2007.
5 K. Denolf, B. V. Roie, C. Glorienx, and J. Thoen, Phys. Rev. Lett. 97,107801 2006.
6 P. K. Mukherjee, J. Chem. Phys. 116, 9531 2002.7 S. DasGupta and S. K. Roy, Phys. Lett. A 288, 323 2001.8 T. P. Rieker, Liq. Cryst. 19, 497 1995.9 P. Poulin, H. Stark, T. C. Lubensky, and D. Weitz, Science 275, 17701997.
10 J. Yamamoto and H. Tanaka, Nature London 409, 321 2001.11 M. Caggioni, A. Giacometti, T. Bellini, N. A. Clark, F. Mantegazza, and
A. Maritan, J. Chem. Phys. 122, 214721 2005.
TABLE I. Summary of the ac-calorimetric results for the 10CB+ace samples. Shown are acetone molar fraction xace, the I-P1 phase transition temperature T1,the P1-P2 transition temperature T2 in degrees kelvin, integrated enthalpy change for the I-P1 transition H1
, integrated enthalpy change for the P1-P2
transition H2, total integrated enthalpy HT
, imaginary enthalpy for the I-P1 transition H1, imaginary enthalpy for the P1-P2 transition H2, and totalimaginary enthalpy for both the transitions HT in J/g.
xace T1 T2 H1 H2
HT H1 H2 HT
0.00 323.69 0.14 323.69 0.14 ¯ ¯ 5.14 0.51 ¯ ¯ 1.82 0.180.05 323.20 0.14 321.19 0.75 0.77 0.08 5.19 0.52 5.95 0.60 0.77 0.08 2.01 0.20 2.78 0.280.10 322.13 0.10 319.79 0.96 0.62 0.06 6.28 0.63 6.89 0.69 0.97 0.10 1.85 0.19 2.82 0.280.14 323.05 0.07 319.27 1.28 0.64 0.06 5.52 0.55 6.16 0.62 0.92 0.09 2.60 0.26 3.53 0.350.22 323.07 0.18 317.57 1.73 0.50 0.05 4.75 0.47 5.25 0.53 0.36 0.04 3.38 0.34 3.74 0.370.28 323.61 0.25 317.55 1.52 1.42 0.14 4.30 0.43 5.71 0.57 0.46 0.05 2.20 0.22 2.66 0.260.36 323.19 0.25 316.33 2.87 0.86 0.09 1.85 0.19 2.70 0.27 0.20 0.02 2.52 0.25 2.72 0.27
174501-6 K. P. Sigdel and G. S. Iannacchione J. Chem. Phys. 133, 174501 2010
Downloaded 09 Mar 2011 to 130.215.96.123. Redistribution subject to AIP license or copyright; see http://jcp.aip.org/about/rights_and_permissions
12 G. Iannacchione, J. Mang, S. Kumar, and D. Finotello, Phys. Rev. Lett.73, 2708 1994.
13 M. Olbrich, H. Brand, H. Finkelmann, and K. Kawasaki, Europhys. Lett.31, 281 1995.
14 T. Bellini, A. Rappaport, N. Clark, and B. Thomas, Phys. Rev. Lett. 77,2507 1996.
15 A. Drozd-Rzoska, S. Rzoska, and J. Ziolo, Phys. Rev. E 61, 5349 2000.16 T. Bellini, N. Clark, and D. Link, J. Phys.: Condens. Matter 15, S175
2003.17 M. K. Ramazanoglu, P. Clegg, R. J. Birgeneau, C. W. Garland, M. E.
Neubert, and J. M. Kim, Phys. Rev. E 69, 061706 2004.18 J. Leys, G. Sinha, C. Glorieux, and J. Thoen, Phys. Rev. E 71, 051709
2005.19 P. Kedziora, Acta Phys. Pol. A 107, 907 2005.20 G. Chahine, A. V. Kityk, K. Knorr, R. Lefort, and M. Guendouz, Phys.
Rev. E 81, 031703 2010.21 I. Lelidis and G. Durand, J. Phys. II 6, 1359 1996.22 P. Mukherjee, H. Pleiner, and H. R. Brand, Eur. Phys. J. E 4, 293 2001.23 P. Mukherjee and H. Pleiner, Phys. Rev. E 65, 051705 2002.24 H. R. Brand, P. Mukherjee, and J. Ziolo, Phys. Rev. E 63, 061708 2001.25 G. Sigaud, F. Hardouin, M. Achard, and H. Gasparoux, J. Phys. Colloq.
40, 356 1979.26 J. Prost, J. Phys. France 40, 581 1979.27 B. R. Ratna, R. Shashidhar, and V. N. Raja, Phys. Rev. Lett. 55, 1476
1985.28 Y. H. Jeong, G. Nounesis, C. W. Garland, and R. Shashidhar, Phys. Rev.
A 40, 4022 1989.29 E. Fontes, W. K. Lee, P. A. Heiney, G. Nounesis, C. W. Garland, A.
Riera, J. P. McCauley, and A. B. Smith, J. Chem. Phys. 92, 3917 1990.
30 X. Wen, C. W. Garland, R. Shashidhar, and P. Barois, Phys. Rev. B 45,5131 1992.
31 P. Patel, S. S. Keast, M. E. Neubert, and S. Kumar, Phys. Rev. Lett. 69,301 1992.
32 P. Patel, L. Chen, and S. Kumar, Phys. Rev. E 47, 2643 1993.33 J. T. Mang, B. Cull, Y. Shi, P. Patel, and S. Kumar, Phys. Rev. Lett. 74,
4241 1995.34 F. Hardouin, M. F. Achard, J.-I. Jin, J.-W. Shin, and Y.-K. Yun, J. Phys. II
4, 627 1994.35 F. Hardouin, M. F. Achard, J.-I. Jin, Y.-K. Yun, and S.-J. Chung, Eur.
Phys. J. B 1, 47 1998.36 P. Tolédano, B. Mettout, and A. Primak, Eur. Phys. J. E 14, 49 2004.37 K. Saunders, D. Hernandez, S. Pearson, and J. Toner, Phys. Rev. Lett.
98, 197801 2007.38 A. Leadbetter, J. Frost, J. Gaughan, G. Gray, and A. Mosley, J. Phys.
France 40, 375 1979.39 D. Finotello, S. Qian, and G. S. Iannacchione, Thermochim. Acta 304-
305, 303 1997.40 P. F. Sullivan and G. Seidel, Phys. Rev. 173, 679 1968.41 H. Yao and C. W. Garland, Rev. Sci. Instrum. 69, 172 1998.42 L. M. Steele, G. S. Iannacchione, and D. Finotello, Rev. Mex. Fis. 39,
588 1993.43 A. Roshi, G. S. Iannacchione, P. S. Clegg, and R. J. Birgeneau, Phys.
Rev. E 69, 031703 2004.44 G. S. Iannacchione, C. W. Garland, J. T. Mang, and T. P. Rieker, Phys.
Rev. E 58, 5966 1998.45 F. V. Chávez, R. Acosta, and D. Pusiol, Chem. Phys. Lett. 392, 403
2004.
174501-7 10CB+ace binary mixtures J. Chem. Phys. 133, 174501 2010
Downloaded 09 Mar 2011 to 130.215.96.123. Redistribution subject to AIP license or copyright; see http://jcp.aip.org/about/rights_and_permissions
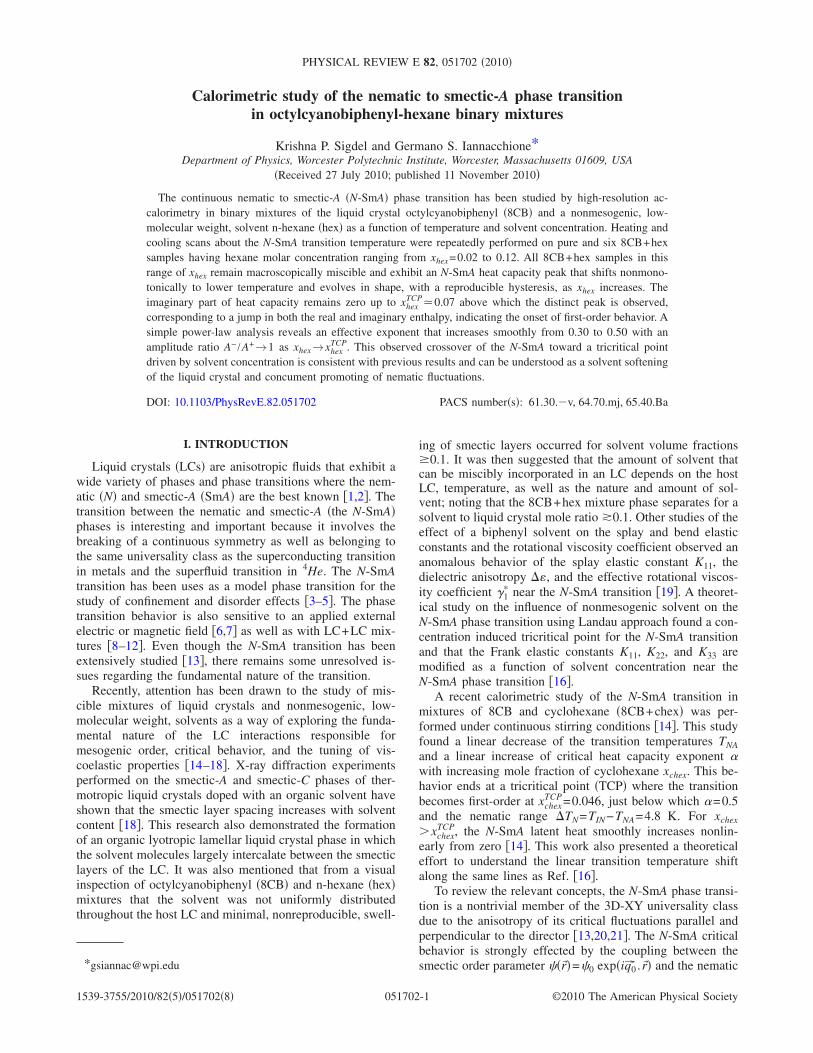
Calorimetric study of the nematic to smectic-A phase transitionin octylcyanobiphenyl-hexane binary mixtures
Krishna P. Sigdel and Germano S. Iannacchione*Department of Physics, Worcester Polytechnic Institute, Worcester, Massachusetts 01609, USA
Received 27 July 2010; published 11 November 2010
The continuous nematic to smectic-A N-SmA phase transition has been studied by high-resolution ac-calorimetry in binary mixtures of the liquid crystal octylcyanobiphenyl 8CB and a nonmesogenic, low-molecular weight, solvent n-hexane hex as a function of temperature and solvent concentration. Heating andcooling scans about the N-SmA transition temperature were repeatedly performed on pure and six 8CB+hexsamples having hexane molar concentration ranging from xhex=0.02 to 0.12. All 8CB+hex samples in thisrange of xhex remain macroscopically miscible and exhibit an N-SmA heat capacity peak that shifts nonmono-tonically to lower temperature and evolves in shape, with a reproducible hysteresis, as xhex increases. Theimaginary part of heat capacity remains zero up to xhex
TCP0.07 above which the distinct peak is observed,corresponding to a jump in both the real and imaginary enthalpy, indicating the onset of first-order behavior. Asimple power-law analysis reveals an effective exponent that increases smoothly from 0.30 to 0.50 with anamplitude ratio A− /A+→1 as xhex→xhex
TCP. This observed crossover of the N-SmA toward a tricritical pointdriven by solvent concentration is consistent with previous results and can be understood as a solvent softeningof the liquid crystal and concument promoting of nematic fluctuations.
DOI: 10.1103/PhysRevE.82.051702 PACS numbers: 61.30.v, 64.70.mj, 65.40.Ba
I. INTRODUCTION
Liquid crystals LCs are anisotropic fluids that exhibit awide variety of phases and phase transitions where the nem-atic N and smectic-A SmA are the best known 1,2. Thetransition between the nematic and smectic-A the N-SmAphases is interesting and important because it involves thebreaking of a continuous symmetry as well as belonging tothe same universality class as the superconducting transitionin metals and the superfluid transition in 4He. The N-SmAtransition has been uses as a model phase transition for thestudy of confinement and disorder effects 3–5. The phasetransition behavior is also sensitive to an applied externalelectric or magnetic field 6,7 as well as with LC+LC mix-tures 8–12. Even though the N-SmA transition has beenextensively studied 13, there remains some unresolved is-sues regarding the fundamental nature of the transition.
Recently, attention has been drawn to the study of mis-cible mixtures of liquid crystals and nonmesogenic, low-molecular weight, solvents as a way of exploring the funda-mental nature of the LC interactions responsible formesogenic order, critical behavior, and the tuning of vis-coelastic properties 14–18. X-ray diffraction experimentsperformed on the smectic-A and smectic-C phases of ther-motropic liquid crystals doped with an organic solvent haveshown that the smectic layer spacing increases with solventcontent 18. This research also demonstrated the formationof an organic lyotropic lamellar liquid crystal phase in whichthe solvent molecules largely intercalate between the smecticlayers of the LC. It was also mentioned that from a visualinspection of octylcyanobiphenyl 8CB and n-hexane hexmixtures that the solvent was not uniformly distributedthroughout the host LC and minimal, nonreproducible, swell-
ing of smectic layers occurred for solvent volume fractions0.1. It was then suggested that the amount of solvent thatcan be miscibly incorporated in an LC depends on the hostLC, temperature, as well as the nature and amount of sol-vent; noting that the 8CB+hex mixture phase separates for asolvent to liquid crystal mole ratio 0.1. Other studies of theeffect of a biphenyl solvent on the splay and bend elasticconstants and the rotational viscosity coefficient observed ananomalous behavior of the splay elastic constant K11, thedielectric anisotropy , and the effective rotational viscos-ity coefficient 1
near the N-SmA transition 19. A theoret-ical study on the influence of nonmesogenic solvent on theN-SmA phase transition using Landau approach found a con-centration induced tricritical point for the N-SmA transitionand that the Frank elastic constants K11, K22, and K33 aremodified as a function of solvent concentration near theN-SmA phase transition 16.
A recent calorimetric study of the N-SmA transition inmixtures of 8CB and cyclohexane 8CB+chex was per-formed under continuous stirring conditions 14. This studyfound a linear decrease of the transition temperatures TNAand a linear increase of critical heat capacity exponent with increasing mole fraction of cyclohexane xchex. This be-havior ends at a tricritical point TCP where the transitionbecomes first-order at xchex
TCP=0.046, just below which =0.5and the nematic range TN=TIN−TNA=4.8 K. For xchexxchex
TCP, the N-SmA latent heat smoothly increases nonlin-early from zero 14. This work also presented a theoreticaleffort to understand the linear transition temperature shiftalong the same lines as Ref. 16.
To review the relevant concepts, the N-SmA phase transi-tion is a nontrivial member of the 3D-XY universality classdue to the anisotropy of its critical fluctuations parallel andperpendicular to the director 13,20,21. The N-SmA criticalbehavior is strongly effected by the coupling between thesmectic order parameter r=0 expiq0 .r and the nematic*[email protected]
PHYSICAL REVIEW E 82, 051702 2010
1539-3755/2010/825/0517028 ©2010 The American Physical Society051702-1
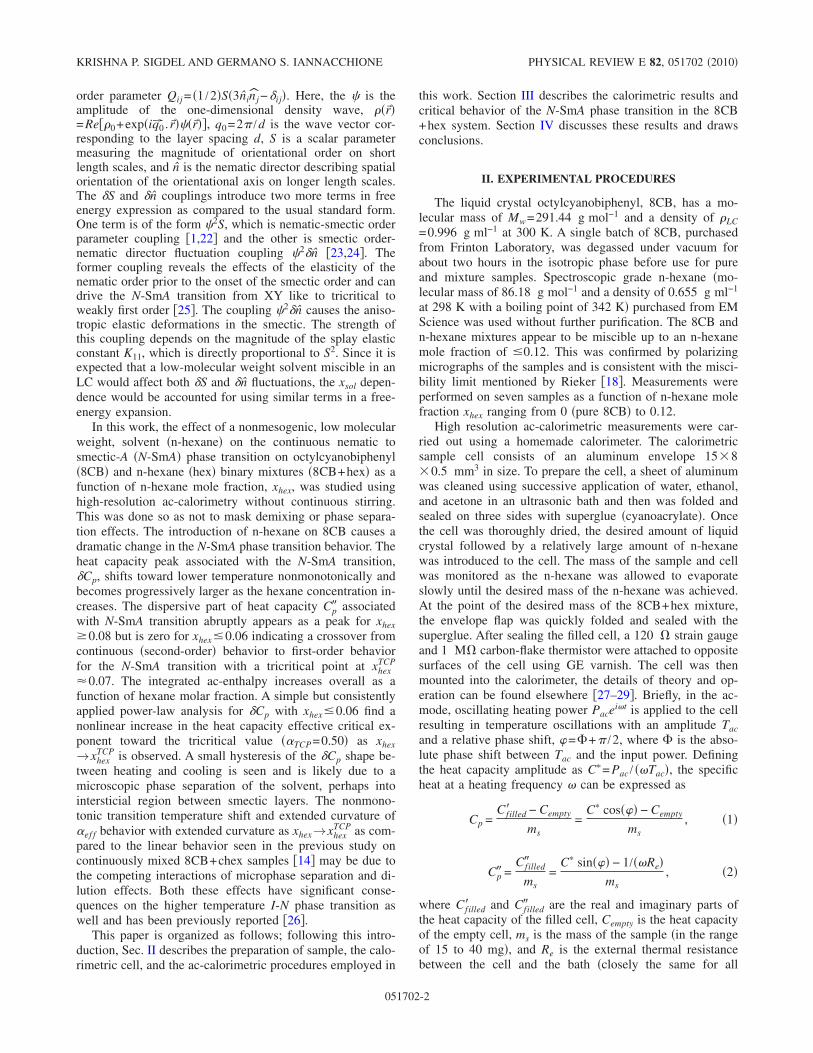
order parameter Qij = 1 /2S3ninj−ij. Here, the is theamplitude of the one-dimensional density wave, r=Re0+expiq0 .rr, q0=2 /d is the wave vector cor-responding to the layer spacing d, S is a scalar parametermeasuring the magnitude of orientational order on shortlength scales, and n is the nematic director describing spatialorientation of the orientational axis on longer length scales.The S and n couplings introduce two more terms in freeenergy expression as compared to the usual standard form.One term is of the form 2S, which is nematic-smectic orderparameter coupling 1,22 and the other is smectic order-nematic director fluctuation coupling 2n 23,24. Theformer coupling reveals the effects of the elasticity of thenematic order prior to the onset of the smectic order and candrive the N-SmA transition from XY like to tricritical toweakly first order 25. The coupling 2n causes the aniso-tropic elastic deformations in the smectic. The strength ofthis coupling depends on the magnitude of the splay elasticconstant K11, which is directly proportional to S2. Since it isexpected that a low-molecular weight solvent miscible in anLC would affect both S and n fluctuations, the xsol depen-dence would be accounted for using similar terms in a free-energy expansion.
In this work, the effect of a nonmesogenic, low molecularweight, solvent n-hexane on the continuous nematic tosmectic-A N-SmA phase transition on octylcyanobiphenyl8CB and n-hexane hex binary mixtures 8CB+hex as afunction of n-hexane mole fraction, xhex, was studied usinghigh-resolution ac-calorimetry without continuous stirring.This was done so as not to mask demixing or phase separa-tion effects. The introduction of n-hexane on 8CB causes adramatic change in the N-SmA phase transition behavior. Theheat capacity peak associated with the N-SmA transition,Cp, shifts toward lower temperature nonmonotonically andbecomes progressively larger as the hexane concentration in-creases. The dispersive part of heat capacity Cp associatedwith N-SmA transition abruptly appears as a peak for xhex0.08 but is zero for xhex 0.06 indicating a crossover fromcontinuous second-order behavior to first-order behaviorfor the N-SmA transition with a tricritical point at xhex
TCP
0.07. The integrated ac-enthalpy increases overall as afunction of hexane molar fraction. A simple but consistentlyapplied power-law analysis for Cp with xhex 0.06 find anonlinear increase in the heat capacity effective critical ex-ponent toward the tricritical value TCP=0.50 as xhex→xhex
TCP is observed. A small hysteresis of the Cp shape be-tween heating and cooling is seen and is likely due to amicroscopic phase separation of the solvent, perhaps intointersticial region between smectic layers. The nonmono-tonic transition temperature shift and extended curvature ofef f behavior with extended curvature as xhex→xhex
TCP as com-pared to the linear behavior seen in the previous study oncontinuously mixed 8CB+chex samples 14 may be due tothe competing interactions of microphase separation and di-lution effects. Both these effects have significant conse-quences on the higher temperature I-N phase transition aswell and has been previously reported 26.
This paper is organized as follows; following this intro-duction, Sec. II describes the preparation of sample, the calo-rimetric cell, and the ac-calorimetric procedures employed in
this work. Section III describes the calorimetric results andcritical behavior of the N-SmA phase transition in the 8CB+hex system. Section IV discusses these results and drawsconclusions.
II. EXPERIMENTAL PROCEDURES
The liquid crystal octylcyanobiphenyl, 8CB, has a mo-lecular mass of Mw=291.44 g mol−1 and a density of LC=0.996 g ml−1 at 300 K. A single batch of 8CB, purchasedfrom Frinton Laboratory, was degassed under vacuum forabout two hours in the isotropic phase before use for pureand mixture samples. Spectroscopic grade n-hexane mo-lecular mass of 86.18 g mol−1 and a density of 0.655 g ml−1
at 298 K with a boiling point of 342 K purchased from EMScience was used without further purification. The 8CB andn-hexane mixtures appear to be miscible up to an n-hexanemole fraction of 0.12. This was confirmed by polarizingmicrographs of the samples and is consistent with the misci-bility limit mentioned by Rieker 18. Measurements wereperformed on seven samples as a function of n-hexane molefraction xhex ranging from 0 pure 8CB to 0.12.
High resolution ac-calorimetric measurements were car-ried out using a homemade calorimeter. The calorimetricsample cell consists of an aluminum envelope 1580.5 mm3 in size. To prepare the cell, a sheet of aluminumwas cleaned using successive application of water, ethanol,and acetone in an ultrasonic bath and then was folded andsealed on three sides with superglue cyanoacrylate. Oncethe cell was thoroughly dried, the desired amount of liquidcrystal followed by a relatively large amount of n-hexanewas introduced to the cell. The mass of the sample and cellwas monitored as the n-hexane was allowed to evaporateslowly until the desired mass of the n-hexane was achieved.At the point of the desired mass of the 8CB+hex mixture,the envelope flap was quickly folded and sealed with thesuperglue. After sealing the filled cell, a 120 strain gaugeand 1 M carbon-flake thermistor were attached to oppositesurfaces of the cell using GE varnish. The cell was thenmounted into the calorimeter, the details of theory and op-eration can be found elsewhere 27–29. Briefly, in the ac-mode, oscillating heating power Pace
it is applied to the cellresulting in temperature oscillations with an amplitude Tacand a relative phase shift, =+ /2, where is the abso-lute phase shift between Tac and the input power. Definingthe heat capacity amplitude as C= Pac / Tac, the specificheat at a heating frequency can be expressed as
Cp =Cfilled − Cempty
ms=
C cos − Cempty
ms, 1
Cp =Cfilled
ms=
C sin − 1/Rems
, 2
where Cfilled and Cfilled are the real and imaginary parts ofthe heat capacity of the filled cell, Cempty is the heat capacityof the empty cell, ms is the mass of the sample in the rangeof 15 to 40 mg, and Re is the external thermal resistancebetween the cell and the bath closely the same for all
KRISHNA P. SIGDEL AND GERMANO S. IANNACCHIONE PHYSICAL REVIEW E 82, 051702 2010
051702-2
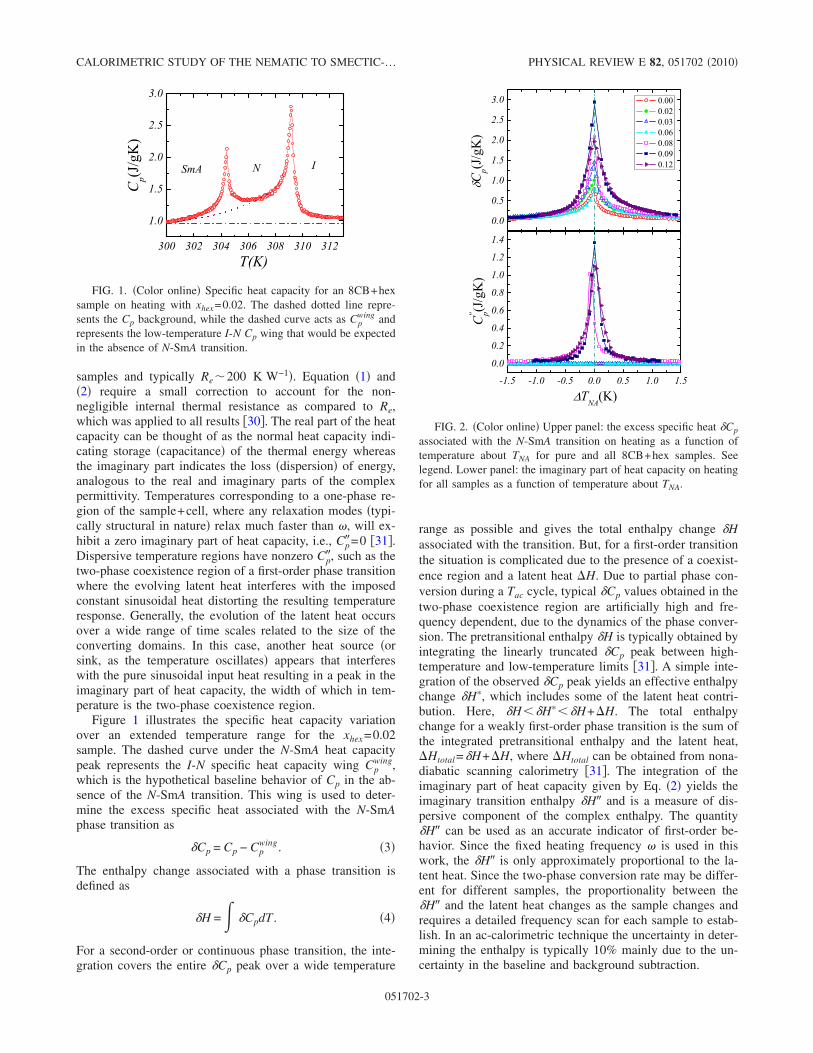
samples and typically Re200 K W−1. Equation 1 and2 require a small correction to account for the non-negligible internal thermal resistance as compared to Re,which was applied to all results 30. The real part of the heatcapacity can be thought of as the normal heat capacity indi-cating storage capacitance of the thermal energy whereasthe imaginary part indicates the loss dispersion of energy,analogous to the real and imaginary parts of the complexpermittivity. Temperatures corresponding to a one-phase re-gion of the sample+cell, where any relaxation modes typi-cally structural in nature relax much faster than , will ex-hibit a zero imaginary part of heat capacity, i.e., Cp=0 31.Dispersive temperature regions have nonzero Cp, such as thetwo-phase coexistence region of a first-order phase transitionwhere the evolving latent heat interferes with the imposedconstant sinusoidal heat distorting the resulting temperatureresponse. Generally, the evolution of the latent heat occursover a wide range of time scales related to the size of theconverting domains. In this case, another heat source orsink, as the temperature oscillates appears that interfereswith the pure sinusoidal input heat resulting in a peak in theimaginary part of heat capacity, the width of which in tem-perature is the two-phase coexistence region.
Figure 1 illustrates the specific heat capacity variationover an extended temperature range for the xhex=0.02sample. The dashed curve under the N-SmA heat capacitypeak represents the I-N specific heat capacity wing Cp
wing,which is the hypothetical baseline behavior of Cp in the ab-sence of the N-SmA transition. This wing is used to deter-mine the excess specific heat associated with the N-SmAphase transition as
Cp = Cp − Cpwing. 3
The enthalpy change associated with a phase transition isdefined as
H = CpdT . 4
For a second-order or continuous phase transition, the inte-gration covers the entire Cp peak over a wide temperature
range as possible and gives the total enthalpy change Hassociated with the transition. But, for a first-order transitionthe situation is complicated due to the presence of a coexist-ence region and a latent heat H. Due to partial phase con-version during a Tac cycle, typical Cp values obtained in thetwo-phase coexistence region are artificially high and fre-quency dependent, due to the dynamics of the phase conver-sion. The pretransitional enthalpy H is typically obtained byintegrating the linearly truncated Cp peak between high-temperature and low-temperature limits 31. A simple inte-gration of the observed Cp peak yields an effective enthalpychange H, which includes some of the latent heat contri-bution. Here, HHH+H. The total enthalpychange for a weakly first-order phase transition is the sum ofthe integrated pretransitional enthalpy and the latent heat,Htotal=H+H, where Htotal can be obtained from nona-diabatic scanning calorimetry 31. The integration of theimaginary part of heat capacity given by Eq. 2 yields theimaginary transition enthalpy H and is a measure of dis-persive component of the complex enthalpy. The quantityH can be used as an accurate indicator of first-order be-havior. Since the fixed heating frequency is used in thiswork, the H is only approximately proportional to the la-tent heat. Since the two-phase conversion rate may be differ-ent for different samples, the proportionality between theH and the latent heat changes as the sample changes andrequires a detailed frequency scan for each sample to estab-lish. In an ac-calorimetric technique the uncertainty in deter-mining the enthalpy is typically 10% mainly due to the un-certainty in the baseline and background subtraction.
FIG. 2. Color online Upper panel: the excess specific heat Cp
associated with the N-SmA transition on heating as a function oftemperature about TNA for pure and all 8CB+hex samples. Seelegend. Lower panel: the imaginary part of heat capacity on heatingfor all samples as a function of temperature about TNA.
FIG. 1. Color online Specific heat capacity for an 8CB+hexsample on heating with xhex=0.02. The dashed dotted line repre-sents the Cp background, while the dashed curve acts as Cp
wing andrepresents the low-temperature I-N Cp wing that would be expectedin the absence of N-SmA transition.
CALORIMETRIC STUDY OF THE NEMATIC TO SMECTIC-… PHYSICAL REVIEW E 82, 051702 2010
051702-3
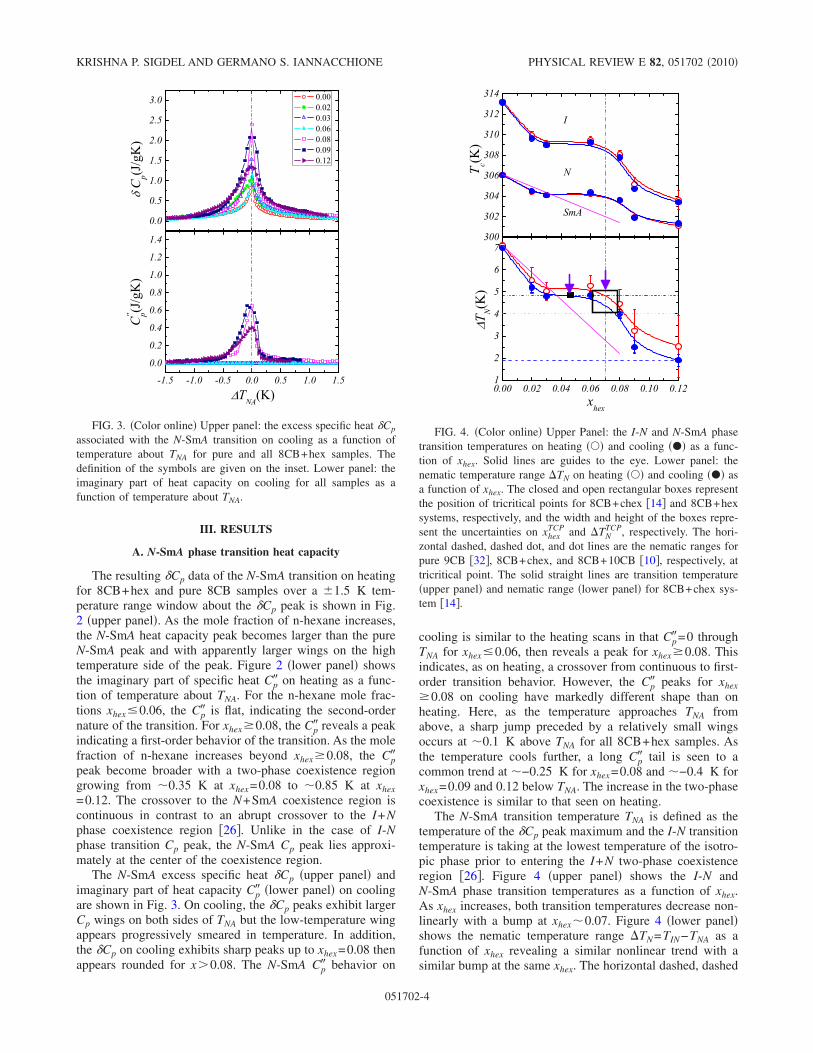
III. RESULTS
A. N-SmA phase transition heat capacity
The resulting Cp data of the N-SmA transition on heatingfor 8CB+hex and pure 8CB samples over a 1.5 K tem-perature range window about the Cp peak is shown in Fig.2 upper panel. As the mole fraction of n-hexane increases,the N-SmA heat capacity peak becomes larger than the pureN-SmA peak and with apparently larger wings on the hightemperature side of the peak. Figure 2 lower panel showsthe imaginary part of specific heat Cp on heating as a func-tion of temperature about TNA. For the n-hexane mole frac-tions xhex 0.06, the Cp is flat, indicating the second-ordernature of the transition. For xhex0.08, the Cp reveals a peakindicating a first-order behavior of the transition. As the molefraction of n-hexane increases beyond xhex0.08, the Cppeak become broader with a two-phase coexistence regiongrowing from 0.35 K at xhex=0.08 to 0.85 K at xhex=0.12. The crossover to the N+SmA coexistence region iscontinuous in contrast to an abrupt crossover to the I+Nphase coexistence region 26. Unlike in the case of I-Nphase transition Cp peak, the N-SmA Cp peak lies approxi-mately at the center of the coexistence region.
The N-SmA excess specific heat Cp upper panel andimaginary part of heat capacity Cp lower panel on coolingare shown in Fig. 3. On cooling, the Cp peaks exhibit largerCp wings on both sides of TNA but the low-temperature wingappears progressively smeared in temperature. In addition,the Cp on cooling exhibits sharp peaks up to xhex=0.08 thenappears rounded for x0.08. The N-SmA Cp behavior on
cooling is similar to the heating scans in that Cp=0 throughTNA for xhex 0.06, then reveals a peak for xhex0.08. Thisindicates, as on heating, a crossover from continuous to first-order transition behavior. However, the Cp peaks for xhex0.08 on cooling have markedly different shape than onheating. Here, as the temperature approaches TNA fromabove, a sharp jump preceded by a relatively small wingsoccurs at 0.1 K above TNA for all 8CB+hex samples. Asthe temperature cools further, a long Cp tail is seen to acommon trend at −0.25 K for xhex=0.08 and −0.4 K forxhex=0.09 and 0.12 below TNA. The increase in the two-phasecoexistence is similar to that seen on heating.
The N-SmA transition temperature TNA is defined as thetemperature of the Cp peak maximum and the I-N transitiontemperature is taking at the lowest temperature of the isotro-pic phase prior to entering the I+N two-phase coexistenceregion 26. Figure 4 upper panel shows the I-N andN-SmA phase transition temperatures as a function of xhex.As xhex increases, both transition temperatures decrease non-linearly with a bump at xhex0.07. Figure 4 lower panelshows the nematic temperature range TN=TIN−TNA as afunction of xhex revealing a similar nonlinear trend with asimilar bump at the same xhex. The horizontal dashed, dashed
FIG. 3. Color online Upper panel: the excess specific heat Cp
associated with the N-SmA transition on cooling as a function oftemperature about TNA for pure and all 8CB+hex samples. Thedefinition of the symbols are given on the inset. Lower panel: theimaginary part of heat capacity on cooling for all samples as afunction of temperature about TNA.
FIG. 4. Color online Upper Panel: the I-N and N-SmA phasetransition temperatures on heating and cooling as a func-tion of xhex. Solid lines are guides to the eye. Lower panel: thenematic temperature range TN on heating and cooling asa function of xhex. The closed and open rectangular boxes representthe position of tricritical points for 8CB+chex 14 and 8CB+hexsystems, respectively, and the width and height of the boxes repre-sent the uncertainties on xhex
TCP and TNTCP, respectively. The hori-
zontal dashed, dashed dot, and dot lines are the nematic ranges forpure 9CB 32, 8CB+chex, and 8CB+10CB 10, respectively, attricritical point. The solid straight lines are transition temperatureupper panel and nematic range lower panel for 8CB+chex sys-tem 14.
KRISHNA P. SIGDEL AND GERMANO S. IANNACCHIONE PHYSICAL REVIEW E 82, 051702 2010
051702-4
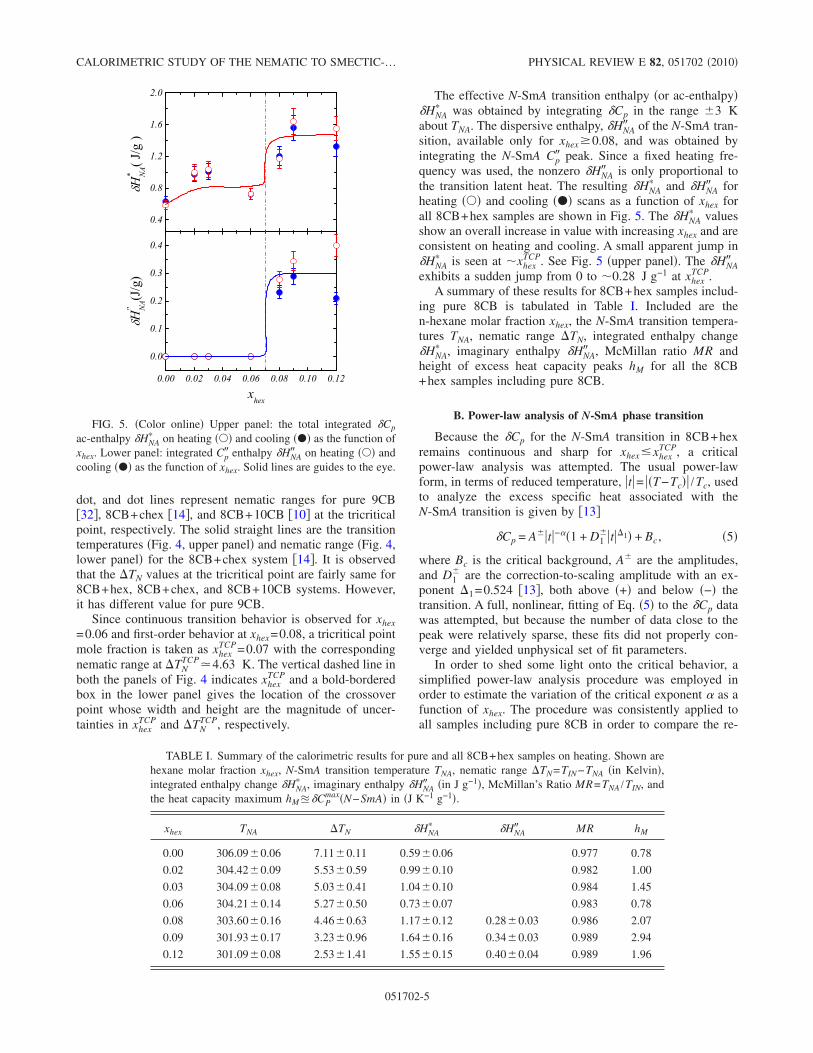
dot, and dot lines represent nematic ranges for pure 9CB32, 8CB+chex 14, and 8CB+10CB 10 at the tricriticalpoint, respectively. The solid straight lines are the transitiontemperatures Fig. 4, upper panel and nematic range Fig. 4,lower panel for the 8CB+chex system 14. It is observedthat the TN values at the tricritical point are fairly same for8CB+hex, 8CB+chex, and 8CB+10CB systems. However,it has different value for pure 9CB.
Since continuous transition behavior is observed for xhex=0.06 and first-order behavior at xhex=0.08, a tricritical pointmole fraction is taken as xhex
TCP=0.07 with the correspondingnematic range at TN
TCP4.63 K. The vertical dashed line inboth the panels of Fig. 4 indicates xhex
TCP and a bold-borderedbox in the lower panel gives the location of the crossoverpoint whose width and height are the magnitude of uncer-tainties in xhex
TCP and TNTCP, respectively.
The effective N-SmA transition enthalpy or ac-enthalpyHNA
was obtained by integrating Cp in the range 3 Kabout TNA. The dispersive enthalpy, HNA of the N-SmA tran-sition, available only for xhex0.08, and was obtained byintegrating the N-SmA Cp peak. Since a fixed heating fre-quency was used, the nonzero HNA is only proportional tothe transition latent heat. The resulting HNA
and HNA forheating and cooling scans as a function of xhex forall 8CB+hex samples are shown in Fig. 5. The HNA
valuesshow an overall increase in value with increasing xhex and areconsistent on heating and cooling. A small apparent jump inHNA
is seen at xhexTCP. See Fig. 5 upper panel. The HNA
exhibits a sudden jump from 0 to 0.28 J g−1 at xhexTCP.
A summary of these results for 8CB+hex samples includ-ing pure 8CB is tabulated in Table I. Included are then-hexane molar fraction xhex, the N-SmA transition tempera-tures TNA, nematic range TN, integrated enthalpy changeHNA
, imaginary enthalpy HNA , McMillan ratio MR andheight of excess heat capacity peaks hM for all the 8CB+hex samples including pure 8CB.
B. Power-law analysis of N-SmA phase transition
Because the Cp for the N-SmA transition in 8CB+hexremains continuous and sharp for xhex xhex
TCP, a criticalpower-law analysis was attempted. The usual power-lawform, in terms of reduced temperature, t= T−Tc /Tc, usedto analyze the excess specific heat associated with theN-SmA transition is given by 13
Cp = At−1 + D1t1 + Bc, 5
where Bc is the critical background, A are the amplitudes,and D1
are the correction-to-scaling amplitude with an ex-ponent 1=0.524 13, both above + and below − thetransition. A full, nonlinear, fitting of Eq. 5 to the Cp datawas attempted, but because the number of data close to thepeak were relatively sparse, these fits did not properly con-verge and yielded unphysical set of fit parameters.
In order to shed some light onto the critical behavior, asimplified power-law analysis procedure was employed inorder to estimate the variation of the critical exponent as afunction of xhex. The procedure was consistently applied toall samples including pure 8CB in order to compare the re-
FIG. 5. Color online Upper panel: the total integrated Cp
ac-enthalpy HNA on heating and cooling as the function of
xhex. Lower panel: integrated Cp enthalpy HNA on heating andcooling as the function of xhex. Solid lines are guides to the eye.
TABLE I. Summary of the calorimetric results for pure and all 8CB+hex samples on heating. Shown arehexane molar fraction xhex, N-SmA transition temperature TNA, nematic range TN=TIN−TNA in Kelvin,integrated enthalpy change HNA
, imaginary enthalpy HNA in J g−1, McMillan’s Ratio MR=TNA /TIN, andthe heat capacity maximum hM CP
maxN−SmA in J K−1 g−1.
xhex TNA TN HNA HNA MR hM
0.00 306.090.06 7.110.11 0.590.06 0.977 0.78
0.02 304.420.09 5.530.59 0.990.10 0.982 1.00
0.03 304.090.08 5.030.41 1.040.10 0.984 1.45
0.06 304.210.14 5.270.50 0.730.07 0.983 0.78
0.08 303.600.16 4.460.63 1.170.12 0.280.03 0.986 2.07
0.09 301.930.17 3.230.96 1.640.16 0.340.03 0.989 2.94
0.12 301.090.08 2.531.41 1.550.15 0.400.04 0.989 1.96
CALORIMETRIC STUDY OF THE NEMATIC TO SMECTIC-… PHYSICAL REVIEW E 82, 051702 2010
051702-5
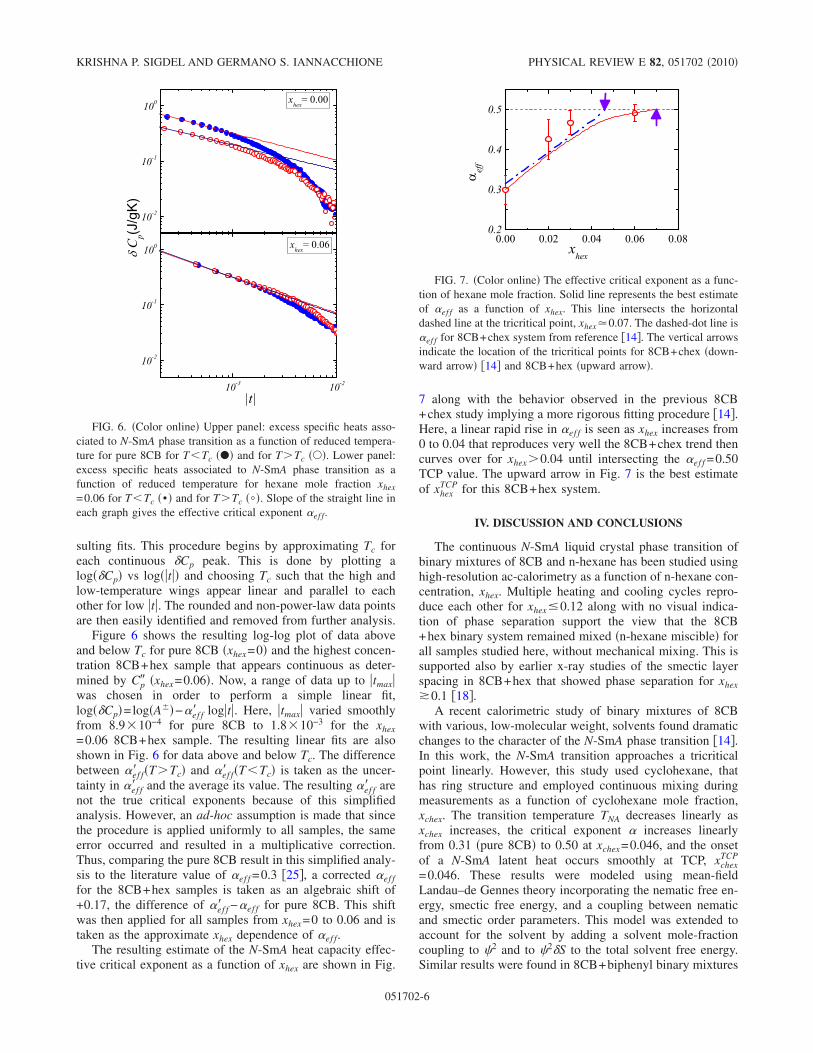
sulting fits. This procedure begins by approximating Tc foreach continuous Cp peak. This is done by plotting alogCp vs logt and choosing Tc such that the high andlow-temperature wings appear linear and parallel to eachother for low t. The rounded and non-power-law data pointsare then easily identified and removed from further analysis.
Figure 6 shows the resulting log-log plot of data aboveand below Tc for pure 8CB xhex=0 and the highest concen-tration 8CB+hex sample that appears continuous as deter-mined by Cp xhex=0.06. Now, a range of data up to tmaxwas chosen in order to perform a simple linear fit,logCp=logA−ef f logt. Here, tmax varied smoothlyfrom 8.910−4 for pure 8CB to 1.810−3 for the xhex=0.06 8CB+hex sample. The resulting linear fits are alsoshown in Fig. 6 for data above and below Tc. The differencebetween ef f TTc and ef f TTc is taken as the uncer-tainty in ef f and the average its value. The resulting ef f arenot the true critical exponents because of this simplifiedanalysis. However, an ad-hoc assumption is made that sincethe procedure is applied uniformly to all samples, the sameerror occurred and resulted in a multiplicative correction.Thus, comparing the pure 8CB result in this simplified analy-sis to the literature value of ef f =0.3 25, a corrected ef ffor the 8CB+hex samples is taken as an algebraic shift of+0.17, the difference of ef f −ef f for pure 8CB. This shiftwas then applied for all samples from xhex=0 to 0.06 and istaken as the approximate xhex dependence of ef f.
The resulting estimate of the N-SmA heat capacity effec-tive critical exponent as a function of xhex are shown in Fig.
7 along with the behavior observed in the previous 8CB+chex study implying a more rigorous fitting procedure 14.Here, a linear rapid rise in ef f is seen as xhex increases from0 to 0.04 that reproduces very well the 8CB+chex trend thencurves over for xhex0.04 until intersecting the ef f =0.50TCP value. The upward arrow in Fig. 7 is the best estimateof xhex
TCP for this 8CB+hex system.
IV. DISCUSSION AND CONCLUSIONS
The continuous N-SmA liquid crystal phase transition ofbinary mixtures of 8CB and n-hexane has been studied usinghigh-resolution ac-calorimetry as a function of n-hexane con-centration, xhex. Multiple heating and cooling cycles repro-duce each other for xhex 0.12 along with no visual indica-tion of phase separation support the view that the 8CB+hex binary system remained mixed n-hexane miscible forall samples studied here, without mechanical mixing. This issupported also by earlier x-ray studies of the smectic layerspacing in 8CB+hex that showed phase separation for xhex0.1 18.
A recent calorimetric study of binary mixtures of 8CBwith various, low-molecular weight, solvents found dramaticchanges to the character of the N-SmA phase transition 14.In this work, the N-SmA transition approaches a tricriticalpoint linearly. However, this study used cyclohexane, thathas ring structure and employed continuous mixing duringmeasurements as a function of cyclohexane mole fraction,xchex. The transition temperature TNA decreases linearly asxchex increases, the critical exponent increases linearlyfrom 0.31 pure 8CB to 0.50 at xchex=0.046, and the onsetof a N-SmA latent heat occurs smoothly at TCP, xchex
TCP
=0.046. These results were modeled using mean-fieldLandau–de Gennes theory incorporating the nematic free en-ergy, smectic free energy, and a coupling between nematicand smectic order parameters. This model was extended toaccount for the solvent by adding a solvent mole-fractioncoupling to 2 and to 2S to the total solvent free energy.Similar results were found in 8CB+biphenyl binary mixtures
FIG. 6. Color online Upper panel: excess specific heats asso-ciated to N-SmA phase transition as a function of reduced tempera-ture for pure 8CB for TTc and for TTc . Lower panel:excess specific heats associated to N-SmA phase transition as afunction of reduced temperature for hexane mole fraction xhex
=0.06 for TTc • and for TTc . Slope of the straight line ineach graph gives the effective critical exponent ef f.
FIG. 7. Color online The effective critical exponent as a func-tion of hexane mole fraction. Solid line represents the best estimateof ef f as a function of xhex. This line intersects the horizontaldashed line at the tricritical point, xhex0.07. The dashed-dot line isef f for 8CB+chex system from reference 14. The vertical arrowsindicate the location of the tricritical points for 8CB+chex down-ward arrow 14 and 8CB+hex upward arrow.
KRISHNA P. SIGDEL AND GERMANO S. IANNACCHIONE PHYSICAL REVIEW E 82, 051702 2010
051702-6
and a Landau–de Gennes model that accounted for change inthe LC elastic constants with xsol. However, a TCP was notfound in 8CB+biphenyl system 19.
In this present study, several important differencesemerge. As xhex increases, TNA decreases as well as the nem-atic range TN in a nonlinear way. The character of N-SmAtransition remains continuous up to xhex0.07 where it ap-pears to jump suddenly to a first-order transition. The bumpin TNA and TN as well as the jump in HNA all occur at xhex
TCP.The critical behavior, estimated by the simple power-lawanalysis presented here, evolves with ef f initially increaseslinearly as in the 8CB+chex system but then curves over toreach ef f =0.50 at xhex→xhex
TCP. Qualitatively, the correction-to-scaling terms D and the amplitude ratio A− /A+ arechanging their values toward the tricritical values as a func-tion of xhex. Here, the qualitative measurement of the ampli-tude ratio A− /A+ was extracted examining the gap betweentwo slope lines of the linear fit of log-log plot of Cp vs tFig. 6 and the curvature of the curve at high t was ob-served to get qualitative measure of D.
The addition of n-hexane in 8CB may be thought of as arandom dilution effect, decreasing both the transition tem-perature TNA and nematic range TNA accordingly. A keypoint to remember is that these experiments were done with-out continuous stirring and so should have revealed any ef-fect of macroscopic phase separation, which was not ob-served. However, phase separation on much shorter micro-and/or nanoscale, such as intercolation of the solvent be-tween the smectic layers, is certainly possible. These dilutionand microphase separation effects, may lead to two compet-ing interactions causing the nonlinearity in the transitiontemperature TNA, nematic range TN, effective critical expo-
nent ef f and jump in the imaginary enthalpy HNA . Themicrophase separation promotes bulklike behavior while therandom dilution is a strong suppressor of any transition be-havior and their superposition need not be linear. These ef-fects also cause the change in coupling between the orderparameters and Q which consequently change the order ofthe N-SmA phase transition from continuous to first orderwith a critical point at xhex
TCP0.07.We have undertaken a detailed calorimetric studies on the
effect of nonmesogenic, low-molecular weight solventhex-ane on octylcyanobiphenyl8CB phase transitions with em-phasis on the most extensively studied but controversialN-SmA phase transition. The dilution of 8CB due to the ad-dition of n-hexane causes the change in the liquid crystalmolecular interactions. Interesting and striking effects areobserved in 8CB+hex system including the observation ofnearly the same tricritical nematic range for 8CB+hex asthat for 8CB+chex, and 8CB+10CB systems. But the nem-atic range for pure 9CB, which is very nearly at TCP, is quitedifferent. This does not appear accidental and raises impor-tant questions as to the underlying physics. Continued re-search efforts are needed to understand the behavior of thesuch LC+solvent mixture systems as a model system for theintermolecular interactions responsible for mesogenic order.In particular, detailed scattering experiments such as x-ray orneutron as a function of solvent concentration and tempera-ture through the N-SmA transition would be most desirableto explore the critical behavior of the smectic correlationlength as susceptibility.
ACKNOWLEDGMENT
This work was supported by the Department of Physics atWPI.
1 P. G. de Gennes and J. Prost, The Physics of Liquid CrystalsOxford University Press, Clarendon, Oxford, England, 1993.
2 S. Chandrasekhar, Liquid Crystals Cambridge UniversityPress, Cambridge, England, 1992.
3 G. S. Iannacchione, Fluid Phase Equilib. 222-223, 177 2004.4 T. Bellini, L. Radzihosky, J. Toner, and N. A. Clark, Science
294, 1074 2001.5 F. Cruceanu, D. Liang, R. L. Leheny, C. W. Garland, and G. S.
Iannacchione, Phys. Rev. E 79, 011710 2009.6 R. Mukhopadhyay, A. Yethiraj, and J. Bechhoefer, Phys. Rev.
Lett. 83, 4796 1999.7 A. Primak, M. Fisch, and S. Kumar, Phys. Rev. Lett. 88,
035701 2002.8 K. J. Stine and C. W. Garland, Phys. Rev. A 39, 3148 1989.9 M. B. Sied, J. Salud, D. O. Lopez, M. Barrio, and J. L. Tam-
arit, Phys. Chem. Chem. Phys. 4, 2587 2002.10 M. G. Lafouresse, M. B. Sied, H. Allouchi, D. O. Lopez, J.
Salud, and J. L. Tamarit, Chem. Phys. Lett. 376, 188 2003.11 M. B. Sied, D. O. Lopez, J. L. Tamarit, and M. Barrio, Liq.
Cryst. 29, 57 2002.12 S.-Y. Jeong, D.-W. Kim, K.-W. Rhie, M.-P. Hong, S. Kumar,
W.-G. Jang, and S.-T. Shin, J. Phys. D 41, 062002 2008.13 C. W. Garland and G. Nounesis, Phys. Rev. E 49, 2964 1994.
14 K. Denolf, G. Cordoyiannis, C. Glorieux, and J. Thoen, Phys.Rev. E 76, 051702 2007.
15 K. Denolf, B. Van Roie, C. Glorieux, and J. Thoen, Phys. Rev.Lett. 97, 107801 2006.
16 P. K. Mukherjee, J. Chem. Phys. 116, 9531 2002.17 S. DasGupta and S. K. Roy, Phys. Lett. A 288, 323 2001.18 T. P. Rieker, Liq. Cryst. 19, 497 1995.19 S. DasGupta, P. Chattopadhyay, and S. K. Roy, Phys. Rev. E
63, 041703 2001.20 A. Yethiraj, R. Mukhopadhyay, and J. Bechhoefer, Phys. Rev.
E 65, 021702 2002.21 C. W. Garland and G. S. Iannacchione, J. Phys. Chem. B 113,
3901 2009.22 W. L. McMillan, Phys. Rev. A 4, 1238 1971.23 B. I. Halperin, T. C. Lubensky, and S. K. Ma, Phys. Rev. Lett.
32, 292 1974.24 M. A. Anisimov, P. E. Cladis, E. E. Gorodetskii, D. A. Huse, V.
E. Podneks, V. G. Taratuta, W. van Saarloos, and V. P.Voronov, Phys. Rev. A 41, 6749 1990.
25 G. S. Iannacchione, S. Park, C. W. Garland, R. J. Birgeneau,and R. L. Leheny, Phys. Rev. E 67, 011709 2003.
26 K. P. Sigdel and G. S. Iannacchione, J. Chem. Phys. 133,044513 2010.
CALORIMETRIC STUDY OF THE NEMATIC TO SMECTIC-… PHYSICAL REVIEW E 82, 051702 2010
051702-7
27 P. F. Sullivan and G. Seidel, Phys. Rev. 173, 679 1968.28 D. Finotello, S. Qian, and G. S. Iannacchione, Thermochim.
Acta 304-305, 303 1997.29 H. Yao and C. W. Garland, Rev. Sci. Instrum. 69, 172 1998.30 A. Roshi, G. S. Iannacchione, P. S. Clegg, and R. J. Birgeneau,
Phys. Rev. E 69, 031703 2004.31 G. S. Iannacchione, C. W. Garland, J. T. Mang, and T. P.
Rieker, Phys. Rev. E 58, 5966 1998.32 S. Qian, G. S. Iannacchione, and D. Finotello, Phys. Rev. E
57, 4305 1998.
KRISHNA P. SIGDEL AND GERMANO S. IANNACCHIONE PHYSICAL REVIEW E 82, 051702 2010
051702-8
EPJ ESoft Matter and Biological Physics
your physics journal
EPJ .org
Eur. Phys. J. E (2011) 34: 34 DOI: 10.1140/epje/i2011-11034-7
Effect of carbon nanotubes on the isotropic tonematic and the nematic to smectic-A phasetransitions in liquid crystal and carbon nanotubescomposites
K.P. Sigdel and G.S. Iannacchione
DOI 10.1140/epje/i2011-11034-7
Regular Article
Eur. Phys. J. E (2011) 34: 34 THE EUROPEANPHYSICAL JOURNAL E
Effect of carbon nanotubes on the isotropic to nematic and thenematic to smectic-A phase transitions in liquid crystaland carbon nanotubes composites
K.P. Sigdela and G.S. Iannacchioneb
Department of Physics, Worcester Polytechnic Institute, Worcester, Massachusetts 01609, USA
Received 16 December 2010 and Received in final form 30 January 2011Published online: 8 April 2011 – c© EDP Sciences / Societa Italiana di Fisica / Springer-Verlag 2011
Abstract. A high-resolution ac-calorimetric study on the weakly first-order isotropic to nematic (I-N) andthe continuous nematic to smectic-A (N -SmA) phase transitions of the liquid crystal octyl-cyanobiphenyl(8CB) doped with well-dispersed multiwall carbon nanotubes (CNTs) as a function of CNT concentrationsis reported. Thermal scans were performed for all samples having CNT weight fraction from φw = 0.0005to 0.0060 over a wide temperature range well above and below the two transitions in pure 8CB. Both theI-N and the N -SmA transitions evolve in character and have their transition temperatures qualitativelyoffset by ∼ 1.10K lower as compared to that in pure 8CB for all 8CB+CNTs samples. The enthalpy changeassociated with each phase transition is essentially the same as that of pure 8CB and remains unchangedwith increasing φw. However, there is an evidence that the thermal transport properties of the compositesdiffer from the pure LC upon cooling below a φw-dependent temperature within the nematic phase. Inaddition, a new Cp feature is resolved for intermediate φw samples that appears to be correlated to thisonset temperature.
1 Introduction
Carbon nanotubes (CNTs) are highly anisometric rigid“string-like” particles with diameters on the order ofnanometers and lengths ranging from micrometers to mil-limeters [1]. Since their discovery [1–3], extensive studiesof their unique structure and properties as well as possi-ble applications have been reported [4–7]. Liquid crystals(LCs) [8,9] are anisotropic fluids that exhibit numerousthermodynamically stable phases between an isotropic liq-uid and a three-dimensionally ordered solid. In their leastordered phase, the nematic (N), LCs show orientationalorder due to molecular self-assembly and at the same timemaintaining fluid flow properties. In the smectic-A (SmA)phase, they show both orientational and partial transla-tional order characterized by a 1-d density wave [8,9]. Liq-uid crystalline substances have been extensively studieddue to their applications and as important physical mod-els of self-assembly [10].
When CNTs are dispersed in a liquid crystal, they canmodify the physical properties and hence the phase be-havior of the liquid crystal. The dispersion of these rigidstring-like nanoparticles can locally pin the nematic direc-tor as well as the smectic layers given homogenous surface
a e-mail: [email protected] e-mail: [email protected]
alignment. These physical interactions are responsible forthe coupling between the orientational order parameterof the LC with that of the CNT and represent a uniquephysical assembly.
In recent years, the dispersion of carbon nanotubesin different liquids and liquid crystal media has attractedintense interest. Research has been focused on liquid crys-talline phases of CNTs [11–15], dispersion and alignmentof CNTs in thermotropic or lyotropic liquid crystals [16–26], and studies of LC+CNT composite system for improv-ing electro-optical switching properties [27–31]. Recently,investigations on LC+CNT composites have shown thatthe orientational order can be transferred to the dispersedCNTs [16,32]. It has also been observed that the alignedCNT can cause an increase of the orientational order in theLCs [33]. Such composites have been proposed as memorydevices using their nanoelectromechanical properties [34].
Some research efforts have also been made on phase be-havior and phase transitions of LC+CNT composites [35–39]. LC+CNT composites were investigated using opti-cal microscopy and DSC, finding an enhancement of theisotropic to nematic (I-N) phase transition temperaturerevealing a “chimney”-type phase diagram over a narrowrange of CNT weight fraction ∼ 0.001–0.002 [35]. An I-N phase transition was observed in a LC+CNT compos-ite due to Joule heating produced by a dc-electric fieldthat rotates the CNT out of sample plane short-circuiting
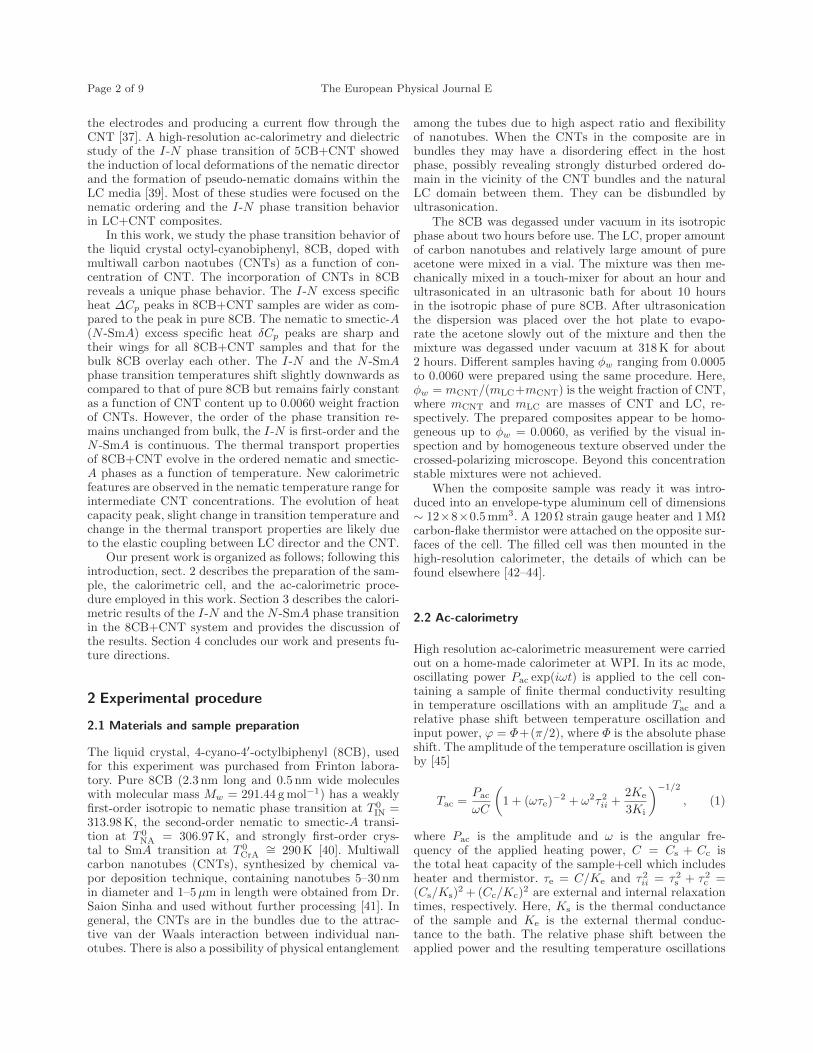
Page 2 of 9 The European Physical Journal E
the electrodes and producing a current flow through theCNT [37]. A high-resolution ac-calorimetry and dielectricstudy of the I-N phase transition of 5CB+CNT showedthe induction of local deformations of the nematic directorand the formation of pseudo-nematic domains within theLC media [39]. Most of these studies were focused on thenematic ordering and the I-N phase transition behaviorin LC+CNT composites.
In this work, we study the phase transition behavior ofthe liquid crystal octyl-cyanobiphenyl, 8CB, doped withmultiwall carbon naotubes (CNTs) as a function of con-centration of CNT. The incorporation of CNTs in 8CBreveals a unique phase behavior. The I-N excess specificheat ∆Cp peaks in 8CB+CNT samples are wider as com-pared to the peak in pure 8CB. The nematic to smectic-A(N -SmA) excess specific heat δCp peaks are sharp andtheir wings for all 8CB+CNT samples and that for thebulk 8CB overlay each other. The I-N and the N -SmAphase transition temperatures shift slightly downwards ascompared to that of pure 8CB but remains fairly constantas a function of CNT content up to 0.0060 weight fractionof CNTs. However, the order of the phase transition re-mains unchanged from bulk, the I-N is first-order and theN -SmA is continuous. The thermal transport propertiesof 8CB+CNT evolve in the ordered nematic and smectic-A phases as a function of temperature. New calorimetricfeatures are observed in the nematic temperature range forintermediate CNT concentrations. The evolution of heatcapacity peak, slight change in transition temperature andchange in the thermal transport properties are likely dueto the elastic coupling between LC director and the CNT.
Our present work is organized as follows; following thisintroduction, sect. 2 describes the preparation of the sam-ple, the calorimetric cell, and the ac-calorimetric proce-dure employed in this work. Section 3 describes the calori-metric results of the I-N and the N -SmA phase transitionin the 8CB+CNT system and provides the discussion ofthe results. Section 4 concludes our work and presents fu-ture directions.
2 Experimental procedure
2.1 Materials and sample preparation
The liquid crystal, 4-cyano-4′-octylbiphenyl (8CB), usedfor this experiment was purchased from Frinton labora-tory. Pure 8CB (2.3 nm long and 0.5 nm wide moleculeswith molecular mass Mw = 291.44 g mol−1) has a weaklyfirst-order isotropic to nematic phase transition at T 0
IN =313.98K, the second-order nematic to smectic-A transi-tion at T 0
NA = 306.97K, and strongly first-order crys-tal to SmA transition at T 0
CrA∼= 290K [40]. Multiwall
carbon nanotubes (CNTs), synthesized by chemical va-por deposition technique, containing nanotubes 5–30 nmin diameter and 1–5µm in length were obtained from Dr.Saion Sinha and used without further processing [41]. Ingeneral, the CNTs are in the bundles due to the attrac-tive van der Waals interaction between individual nan-otubes. There is also a possibility of physical entanglement
among the tubes due to high aspect ratio and flexibilityof nanotubes. When the CNTs in the composite are inbundles they may have a disordering effect in the hostphase, possibly revealing strongly disturbed ordered do-main in the vicinity of the CNT bundles and the naturalLC domain between them. They can be disbundled byultrasonication.
The 8CB was degassed under vacuum in its isotropicphase about two hours before use. The LC, proper amountof carbon nanotubes and relatively large amount of pureacetone were mixed in a vial. The mixture was then me-chanically mixed in a touch-mixer for about an hour andultrasonicated in an ultrasonic bath for about 10 hoursin the isotropic phase of pure 8CB. After ultrasonicationthe dispersion was placed over the hot plate to evapo-rate the acetone slowly out of the mixture and then themixture was degassed under vacuum at 318K for about2 hours. Different samples having φw ranging from 0.0005to 0.0060 were prepared using the same procedure. Here,φw = mCNT/(mLC+mCNT) is the weight fraction of CNT,where mCNT and mLC are masses of CNT and LC, re-spectively. The prepared composites appear to be homo-geneous up to φw = 0.0060, as verified by the visual in-spection and by homogeneous texture observed under thecrossed-polarizing microscope. Beyond this concentrationstable mixtures were not achieved.
When the composite sample was ready it was intro-duced into an envelope-type aluminum cell of dimensions∼ 12×8×0.5mm3. A 120Ω strain gauge heater and 1MΩcarbon-flake thermistor were attached on the opposite sur-faces of the cell. The filled cell was then mounted in thehigh-resolution calorimeter, the details of which can befound elsewhere [42–44].
2.2 Ac-calorimetry
High resolution ac-calorimetric measurement were carriedout on a home-made calorimeter at WPI. In its ac mode,oscillating power Pac exp(iωt) is applied to the cell con-taining a sample of finite thermal conductivity resultingin temperature oscillations with an amplitude Tac and arelative phase shift between temperature oscillation andinput power, ϕ = Φ+(π/2), where Φ is the absolute phaseshift. The amplitude of the temperature oscillation is givenby [45]
Tac =Pac
ωC
(1 + (ωτe)
−2 + ω2τ2ii +
2Ke
3Ki
)−1/2
, (1)
where Pac is the amplitude and ω is the angular fre-quency of the applied heating power, C = Cs + Cc isthe total heat capacity of the sample+cell which includesheater and thermistor. τe = C/Ke and τ2
ii = τ2s + τ2
c =(Cs/Ks)
2 + (Cc/Kc)2 are external and internal relaxation
times, respectively. Here, Ks is the thermal conductanceof the sample and Ke is the external thermal conduc-tance to the bath. The relative phase shift between theapplied power and the resulting temperature oscillations
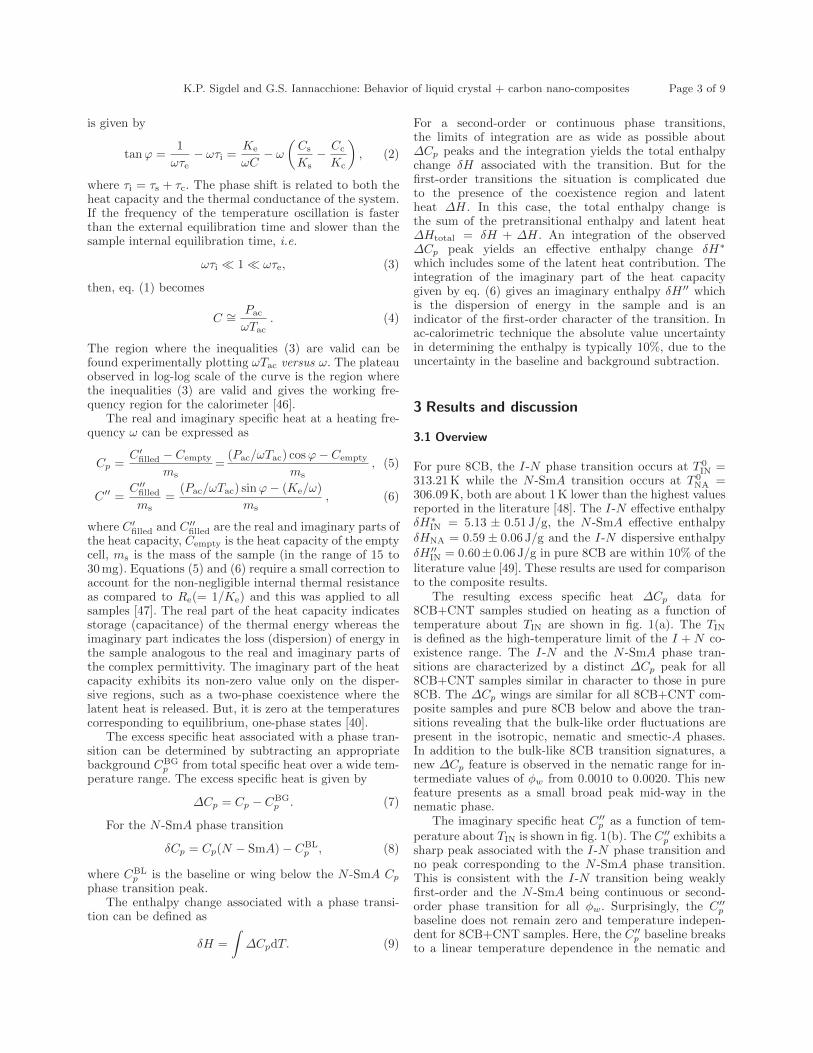
K.P. Sigdel and G.S. Iannacchione: Behavior of liquid crystal + carbon nano-composites Page 3 of 9
is given by
tanϕ =1
ωτe− ωτi =
Ke
ωC− ω
(Cs
Ks− Cc
Kc
), (2)
where τi = τs + τc. The phase shift is related to both theheat capacity and the thermal conductance of the system.If the frequency of the temperature oscillation is fasterthan the external equilibration time and slower than thesample internal equilibration time, i.e.
ωτi ≪ 1 ≪ ωτe, (3)
then, eq. (1) becomes
C ∼= Pac
ωTac. (4)
The region where the inequalities (3) are valid can befound experimentally plotting ωTac versus ω. The plateauobserved in log-log scale of the curve is the region wherethe inequalities (3) are valid and gives the working fre-quency region for the calorimeter [46].
The real and imaginary specific heat at a heating fre-quency ω can be expressed as
Cp =C ′
filled − Cempty
ms=
(Pac/ωTac) cos ϕ − Cempty
ms, (5)
C ′′ =C ′′
filled
ms=
(Pac/ωTac) sin ϕ − (Ke/ω)
ms, (6)
where C ′filled and C ′′
filled are the real and imaginary parts ofthe heat capacity, Cempty is the heat capacity of the emptycell, ms is the mass of the sample (in the range of 15 to30mg). Equations (5) and (6) require a small correction toaccount for the non-negligible internal thermal resistanceas compared to Re(= 1/Ke) and this was applied to allsamples [47]. The real part of the heat capacity indicatesstorage (capacitance) of the thermal energy whereas theimaginary part indicates the loss (dispersion) of energy inthe sample analogous to the real and imaginary parts ofthe complex permittivity. The imaginary part of the heatcapacity exhibits its non-zero value only on the disper-sive regions, such as a two-phase coexistence where thelatent heat is released. But, it is zero at the temperaturescorresponding to equilibrium, one-phase states [40].
The excess specific heat associated with a phase tran-sition can be determined by subtracting an appropriatebackground CBG
p from total specific heat over a wide tem-perature range. The excess specific heat is given by
∆Cp = Cp − CBGp . (7)
For the N -SmA phase transition
δCp = Cp(N − SmA) − CBLp , (8)
where CBLp is the baseline or wing below the N -SmA Cp
phase transition peak.The enthalpy change associated with a phase transi-
tion can be defined as
δH =
∫∆CpdT. (9)
For a second-order or continuous phase transitions,the limits of integration are as wide as possible about∆Cp peaks and the integration yields the total enthalpychange δH associated with the transition. But for thefirst-order transitions the situation is complicated dueto the presence of the coexistence region and latentheat ∆H. In this case, the total enthalpy change isthe sum of the pretransitional enthalpy and latent heat∆Htotal = δH + ∆H. An integration of the observed∆Cp peak yields an effective enthalpy change δH∗
which includes some of the latent heat contribution. Theintegration of the imaginary part of the heat capacitygiven by eq. (6) gives an imaginary enthalpy δH ′′ whichis the dispersion of energy in the sample and is anindicator of the first-order character of the transition. Inac-calorimetric technique the absolute value uncertaintyin determining the enthalpy is typically 10%, due to theuncertainty in the baseline and background subtraction.
3 Results and discussion
3.1 Overview
For pure 8CB, the I-N phase transition occurs at T 0IN =
313.21K while the N -SmA transition occurs at T 0NA =
306.09K, both are about 1K lower than the highest valuesreported in the literature [48]. The I-N effective enthalpyδH∗
IN = 5.13 ± 0.51 J/g, the N -SmA effective enthalpyδHNA = 0.59 ± 0.06 J/g and the I-N dispersive enthalpyδH ′′
IN = 0.60±0.06 J/g in pure 8CB are within 10% of theliterature value [49]. These results are used for comparisonto the composite results.
The resulting excess specific heat ∆Cp data for8CB+CNT samples studied on heating as a function oftemperature about TIN are shown in fig. 1(a). The TIN
is defined as the high-temperature limit of the I + N co-existence range. The I-N and the N -SmA phase tran-sitions are characterized by a distinct ∆Cp peak for all8CB+CNT samples similar in character to those in pure8CB. The ∆Cp wings are similar for all 8CB+CNT com-posite samples and pure 8CB below and above the tran-sitions revealing that the bulk-like order fluctuations arepresent in the isotropic, nematic and smectic-A phases.In addition to the bulk-like 8CB transition signatures, anew ∆Cp feature is observed in the nematic range for in-termediate values of φw from 0.0010 to 0.0020. This newfeature presents as a small broad peak mid-way in thenematic phase.
The imaginary specific heat C ′′p as a function of tem-
perature about TIN is shown in fig. 1(b). The C ′′p exhibits a
sharp peak associated with the I-N phase transition andno peak corresponding to the N -SmA phase transition.This is consistent with the I-N transition being weaklyfirst-order and the N -SmA being continuous or second-order phase transition for all φw. Surprisingly, the C ′′
p
baseline does not remain zero and temperature indepen-dent for 8CB+CNT samples. Here, the C ′′
p baseline breaksto a linear temperature dependence in the nematic and
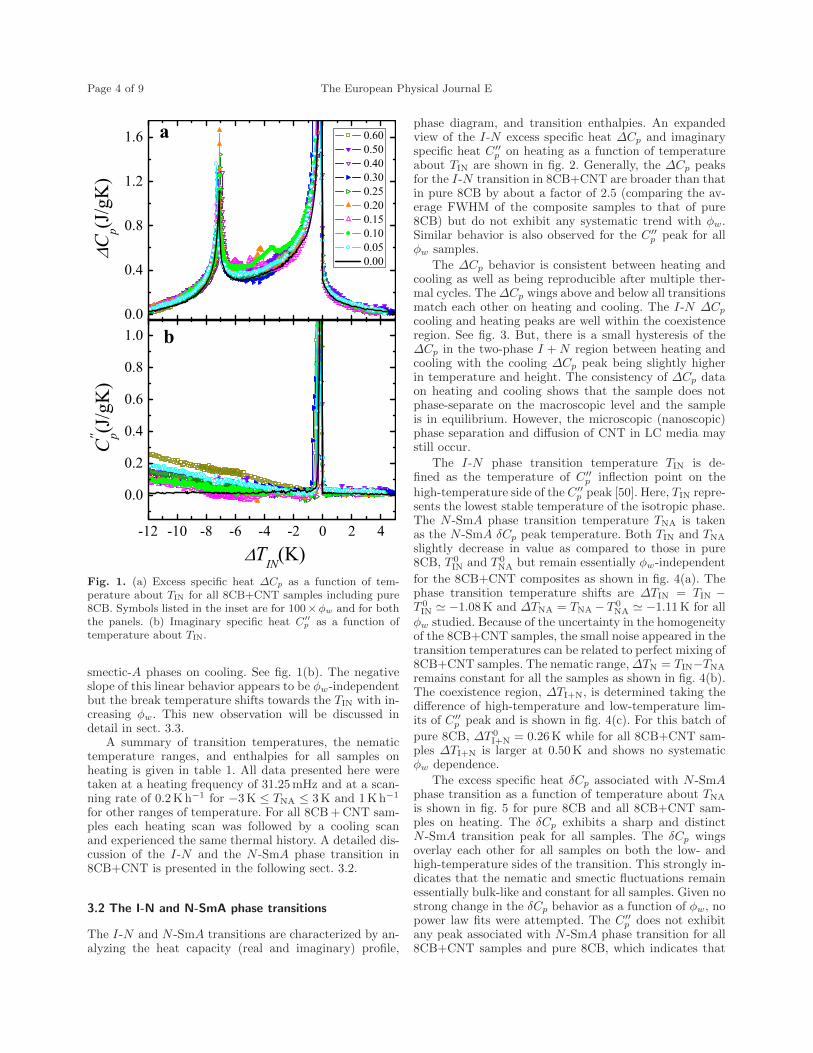
Page 4 of 9 The European Physical Journal E
Fig. 1. (a) Excess specific heat ∆Cp as a function of tem-perature about TIN for all 8CB+CNT samples including pure8CB. Symbols listed in the inset are for 100×φw and for boththe panels. (b) Imaginary specific heat C′′
p as a function oftemperature about TIN.
smectic-A phases on cooling. See fig. 1(b). The negativeslope of this linear behavior appears to be φw-independentbut the break temperature shifts towards the TIN with in-creasing φw. This new observation will be discussed indetail in sect. 3.3.
A summary of transition temperatures, the nematictemperature ranges, and enthalpies for all samples onheating is given in table 1. All data presented here weretaken at a heating frequency of 31.25mHz and at a scan-ning rate of 0.2K h−1 for −3K ≤ TNA ≤ 3K and 1Kh−1
for other ranges of temperature. For all 8CB + CNT sam-ples each heating scan was followed by a cooling scanand experienced the same thermal history. A detailed dis-cussion of the I-N and the N -SmA phase transition in8CB+CNT is presented in the following sect. 3.2.
3.2 The I-N and N-SmA phase transitions
The I-N and N -SmA transitions are characterized by an-alyzing the heat capacity (real and imaginary) profile,
phase diagram, and transition enthalpies. An expandedview of the I-N excess specific heat ∆Cp and imaginaryspecific heat C ′′
p on heating as a function of temperatureabout TIN are shown in fig. 2. Generally, the ∆Cp peaksfor the I-N transition in 8CB+CNT are broader than thatin pure 8CB by about a factor of 2.5 (comparing the av-erage FWHM of the composite samples to that of pure8CB) but do not exhibit any systematic trend with φw.Similar behavior is also observed for the C ′′
p peak for allφw samples.
The ∆Cp behavior is consistent between heating andcooling as well as being reproducible after multiple ther-mal cycles. The ∆Cp wings above and below all transitionsmatch each other on heating and cooling. The I-N ∆Cp
cooling and heating peaks are well within the coexistenceregion. See fig. 3. But, there is a small hysteresis of the∆Cp in the two-phase I + N region between heating andcooling with the cooling ∆Cp peak being slightly higherin temperature and height. The consistency of ∆Cp dataon heating and cooling shows that the sample does notphase-separate on the macroscopic level and the sampleis in equilibrium. However, the microscopic (nanoscopic)phase separation and diffusion of CNT in LC media maystill occur.
The I-N phase transition temperature TIN is de-fined as the temperature of C ′′
p inflection point on thehigh-temperature side of the C ′′
p peak [50]. Here, TIN repre-sents the lowest stable temperature of the isotropic phase.The N -SmA phase transition temperature TNA is takenas the N -SmA δCp peak temperature. Both TIN and TNA
slightly decrease in value as compared to those in pure8CB, T 0
IN and T 0NA but remain essentially φw-independent
for the 8CB+CNT composites as shown in fig. 4(a). Thephase transition temperature shifts are ∆TIN = TIN −T 0IN ≃ −1.08K and ∆TNA = TNA − T 0
NA ≃ −1.11K for allφw studied. Because of the uncertainty in the homogeneityof the 8CB+CNT samples, the small noise appeared in thetransition temperatures can be related to perfect mixing of8CB+CNT samples. The nematic range, ∆TN = TIN−TNA
remains constant for all the samples as shown in fig. 4(b).The coexistence region, ∆TI+N, is determined taking thedifference of high-temperature and low-temperature lim-its of C ′′
p peak and is shown in fig. 4(c). For this batch of
pure 8CB, ∆T 0I+N = 0.26K while for all 8CB+CNT sam-
ples ∆TI+N is larger at 0.50K and shows no systematicφw dependence.
The excess specific heat δCp associated with N -SmAphase transition as a function of temperature about TNA
is shown in fig. 5 for pure 8CB and all 8CB+CNT sam-ples on heating. The δCp exhibits a sharp and distinctN -SmA transition peak for all samples. The δCp wingsoverlay each other for all samples on both the low- andhigh-temperature sides of the transition. This strongly in-dicates that the nematic and smectic fluctuations remainessentially bulk-like and constant for all samples. Given nostrong change in the δCp behavior as a function of φw, nopower law fits were attempted. The C ′′
p does not exhibitany peak associated with N -SmA phase transition for all8CB+CNT samples and pure 8CB, which indicates that
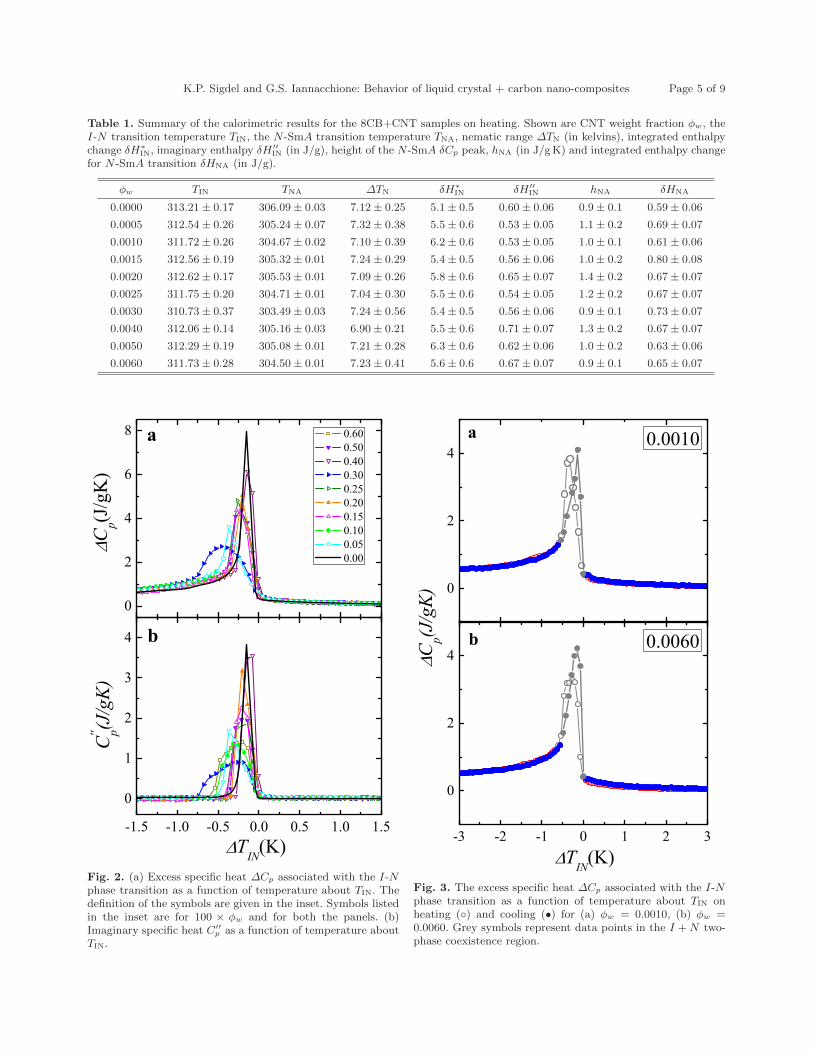
K.P. Sigdel and G.S. Iannacchione: Behavior of liquid crystal + carbon nano-composites Page 5 of 9
Table 1. Summary of the calorimetric results for the 8CB+CNT samples on heating. Shown are CNT weight fraction φw, theI-N transition temperature TIN, the N -SmA transition temperature TNA, nematic range ∆TN (in kelvins), integrated enthalpychange δH∗
IN, imaginary enthalpy δH ′′IN (in J/g), height of the N -SmA δCp peak, hNA (in J/gK) and integrated enthalpy change
for N -SmA transition δHNA (in J/g).
φw TIN TNA ∆TN δH∗IN δH ′′
IN hNA δHNA
0.0000 313.21± 0.17 306.09± 0.03 7.12± 0.25 5.1± 0.5 0.60± 0.06 0.9± 0.1 0.59± 0.06
0.0005 312.54± 0.26 305.24± 0.07 7.32± 0.38 5.5± 0.6 0.53± 0.05 1.1± 0.2 0.69± 0.07
0.0010 311.72± 0.26 304.67± 0.02 7.10± 0.39 6.2± 0.6 0.53± 0.05 1.0± 0.1 0.61± 0.06
0.0015 312.56± 0.19 305.32± 0.01 7.24± 0.29 5.4± 0.5 0.56± 0.06 1.0± 0.2 0.80± 0.08
0.0020 312.62± 0.17 305.53± 0.01 7.09± 0.26 5.8± 0.6 0.65± 0.07 1.4± 0.2 0.67± 0.07
0.0025 311.75± 0.20 304.71± 0.01 7.04± 0.30 5.5± 0.6 0.54± 0.05 1.2± 0.2 0.67± 0.07
0.0030 310.73± 0.37 303.49± 0.03 7.24± 0.56 5.4± 0.5 0.56± 0.06 0.9± 0.1 0.73± 0.07
0.0040 312.06± 0.14 305.16± 0.03 6.90± 0.21 5.5± 0.6 0.71± 0.07 1.3± 0.2 0.67± 0.07
0.0050 312.29± 0.19 305.08± 0.01 7.21± 0.28 6.3± 0.6 0.62± 0.06 1.0± 0.2 0.63± 0.06
0.0060 311.73± 0.28 304.50± 0.01 7.23± 0.41 5.6± 0.6 0.67± 0.07 0.9± 0.1 0.65± 0.07
Fig. 2. (a) Excess specific heat ∆Cp associated with the I-Nphase transition as a function of temperature about TIN. Thedefinition of the symbols are given in the inset. Symbols listedin the inset are for 100 × φw and for both the panels. (b)Imaginary specific heat C′′
p as a function of temperature aboutTIN.
Fig. 3. The excess specific heat ∆Cp associated with the I-Nphase transition as a function of temperature about TIN onheating () and cooling (•) for (a) φw = 0.0010, (b) φw =0.0060. Grey symbols represent data points in the I +N two-phase coexistence region.
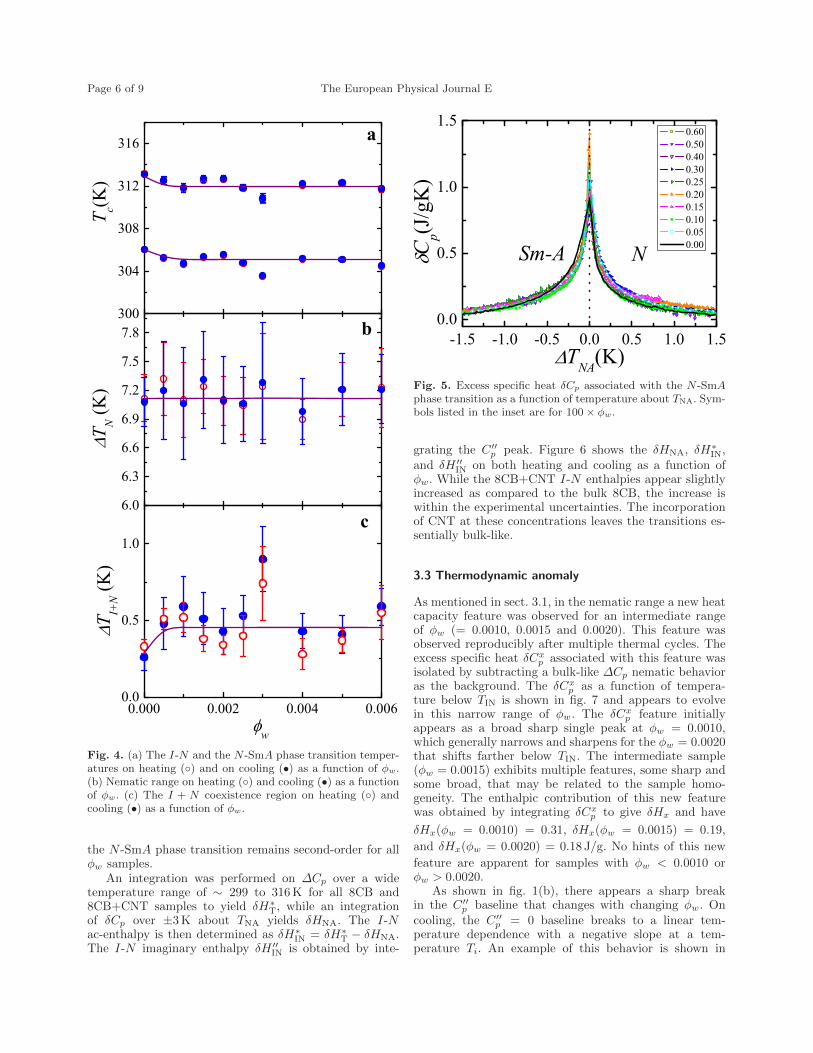
Page 6 of 9 The European Physical Journal E
Fig. 4. (a) The I-N and the N -SmA phase transition temper-atures on heating () and on cooling (•) as a function of φw.(b) Nematic range on heating () and cooling (•) as a functionof φw. (c) The I + N coexistence region on heating () andcooling (•) as a function of φw.
the N -SmA phase transition remains second-order for allφw samples.
An integration was performed on ∆Cp over a widetemperature range of ∼ 299 to 316K for all 8CB and8CB+CNT samples to yield δH∗
T, while an integrationof δCp over ±3K about TNA yields δHNA. The I-Nac-enthalpy is then determined as δH∗
IN = δH∗T − δHNA.
The I-N imaginary enthalpy δH ′′IN is obtained by inte-
Fig. 5. Excess specific heat δCp associated with the N -SmAphase transition as a function of temperature about TNA. Sym-bols listed in the inset are for 100× φw.
grating the C ′′p peak. Figure 6 shows the δHNA, δH∗
IN,and δH ′′
IN on both heating and cooling as a function ofφw. While the 8CB+CNT I-N enthalpies appear slightlyincreased as compared to the bulk 8CB, the increase iswithin the experimental uncertainties. The incorporationof CNT at these concentrations leaves the transitions es-sentially bulk-like.
3.3 Thermodynamic anomaly
As mentioned in sect. 3.1, in the nematic range a new heatcapacity feature was observed for an intermediate rangeof φw (= 0.0010, 0.0015 and 0.0020). This feature wasobserved reproducibly after multiple thermal cycles. Theexcess specific heat δCx
p associated with this feature wasisolated by subtracting a bulk-like ∆Cp nematic behavioras the background. The δCx
p as a function of tempera-ture below TIN is shown in fig. 7 and appears to evolvein this narrow range of φw. The δCx
p feature initiallyappears as a broad sharp single peak at φw = 0.0010,which generally narrows and sharpens for the φw = 0.0020that shifts farther below TIN. The intermediate sample(φw = 0.0015) exhibits multiple features, some sharp andsome broad, that may be related to the sample homo-geneity. The enthalpic contribution of this new featurewas obtained by integrating δCx
p to give δHx and have
δHx(φw = 0.0010) = 0.31, δHx(φw = 0.0015) = 0.19,
and δHx(φw = 0.0020) = 0.18 J/g. No hints of this new
feature are apparent for samples with φw < 0.0010 orφw > 0.0020.
As shown in fig. 1(b), there appears a sharp breakin the C ′′
p baseline that changes with changing φw. Oncooling, the C ′′
p = 0 baseline breaks to a linear tem-perature dependence with a negative slope at a tem-perature Ti. An example of this behavior is shown in
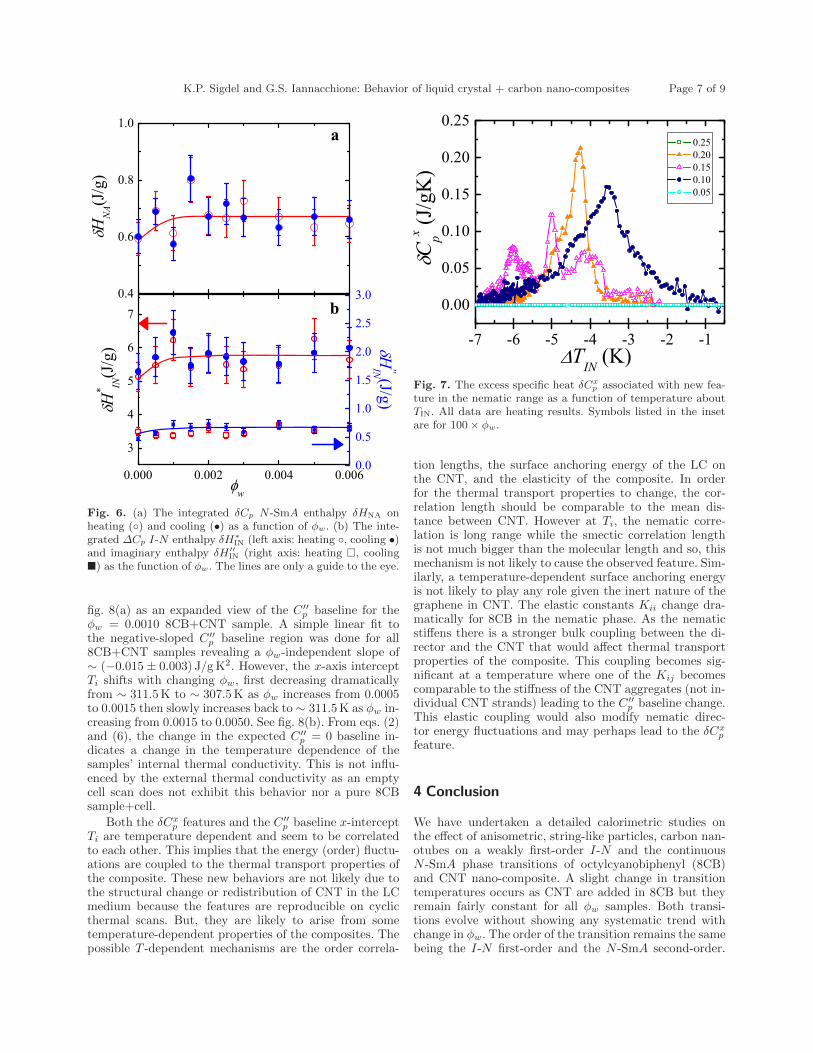
K.P. Sigdel and G.S. Iannacchione: Behavior of liquid crystal + carbon nano-composites Page 7 of 9
Fig. 6. (a) The integrated δCp N -SmA enthalpy δHNA onheating () and cooling (•) as a function of φw. (b) The inte-grated ∆Cp I-N enthalpy δH∗
IN (left axis: heating , cooling •)and imaginary enthalpy δH ′′
IN (right axis: heating , cooling) as the function of φw. The lines are only a guide to the eye.
fig. 8(a) as an expanded view of the C ′′p baseline for the
φw = 0.0010 8CB+CNT sample. A simple linear fit tothe negative-sloped C ′′
p baseline region was done for all8CB+CNT samples revealing a φw-independent slope of∼ (−0.015 ± 0.003) J/g K2. However, the x-axis interceptTi shifts with changing φw, first decreasing dramaticallyfrom ∼ 311.5K to ∼ 307.5K as φw increases from 0.0005to 0.0015 then slowly increases back to ∼ 311.5K as φw in-creasing from 0.0015 to 0.0050. See fig. 8(b). From eqs. (2)and (6), the change in the expected C ′′
p = 0 baseline in-dicates a change in the temperature dependence of thesamples’ internal thermal conductivity. This is not influ-enced by the external thermal conductivity as an emptycell scan does not exhibit this behavior nor a pure 8CBsample+cell.
Both the δCxp features and the C ′′
p baseline x-interceptTi are temperature dependent and seem to be correlatedto each other. This implies that the energy (order) fluctu-ations are coupled to the thermal transport properties ofthe composite. These new behaviors are not likely due tothe structural change or redistribution of CNT in the LCmedium because the features are reproducible on cyclicthermal scans. But, they are likely to arise from sometemperature-dependent properties of the composites. Thepossible T -dependent mechanisms are the order correla-
Fig. 7. The excess specific heat δCxp associated with new fea-
ture in the nematic range as a function of temperature aboutTIN. All data are heating results. Symbols listed in the insetare for 100× φw.
tion lengths, the surface anchoring energy of the LC onthe CNT, and the elasticity of the composite. In orderfor the thermal transport properties to change, the cor-relation length should be comparable to the mean dis-tance between CNT. However at Ti, the nematic corre-lation is long range while the smectic correlation lengthis not much bigger than the molecular length and so, thismechanism is not likely to cause the observed feature. Sim-ilarly, a temperature-dependent surface anchoring energyis not likely to play any role given the inert nature of thegraphene in CNT. The elastic constants Kii change dra-matically for 8CB in the nematic phase. As the nematicstiffens there is a stronger bulk coupling between the di-rector and the CNT that would affect thermal transportproperties of the composite. This coupling becomes sig-nificant at a temperature where one of the Kij becomescomparable to the stiffness of the CNT aggregates (not in-dividual CNT strands) leading to the C ′′
p baseline change.This elastic coupling would also modify nematic direc-tor energy fluctuations and may perhaps lead to the δCx
p
feature.
4 Conclusion
We have undertaken a detailed calorimetric studies onthe effect of anisometric, string-like particles, carbon nan-otubes on a weakly first-order I-N and the continuousN -SmA phase transitions of octylcyanobiphenyl (8CB)and CNT nano-composite. A slight change in transitiontemperatures occurs as CNT are added in 8CB but theyremain fairly constant for all φw samples. Both transi-tions evolve without showing any systematic trend withchange in φw. The order of the transition remains the samebeing the I-N first-order and the N -SmA second-order.
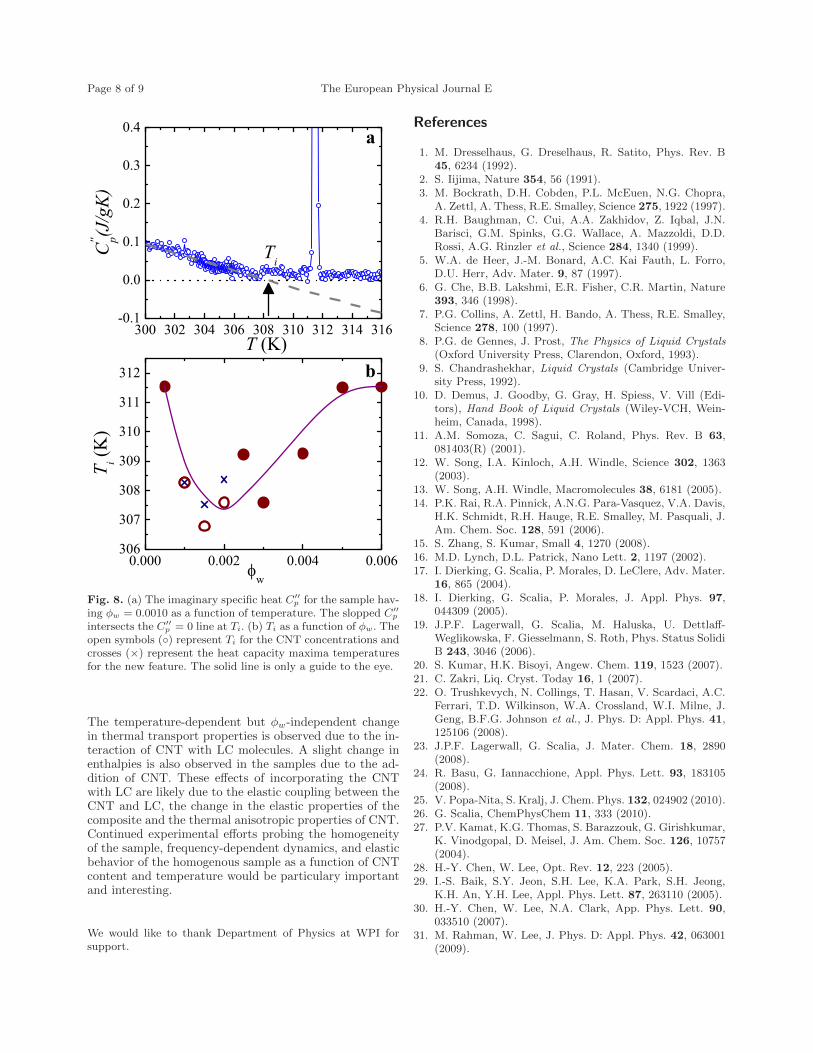
Page 8 of 9 The European Physical Journal E
Fig. 8. (a) The imaginary specific heat C′′p for the sample hav-
ing φw = 0.0010 as a function of temperature. The slopped C′′p
intersects the C′′p = 0 line at Ti. (b) Ti as a function of φw. The
open symbols () represent Ti for the CNT concentrations andcrosses (×) represent the heat capacity maxima temperaturesfor the new feature. The solid line is only a guide to the eye.
The temperature-dependent but φw-independent changein thermal transport properties is observed due to the in-teraction of CNT with LC molecules. A slight change inenthalpies is also observed in the samples due to the ad-dition of CNT. These effects of incorporating the CNTwith LC are likely due to the elastic coupling between theCNT and LC, the change in the elastic properties of thecomposite and the thermal anisotropic properties of CNT.Continued experimental efforts probing the homogeneityof the sample, frequency-dependent dynamics, and elasticbehavior of the homogenous sample as a function of CNTcontent and temperature would be particulary importantand interesting.
We would like to thank Department of Physics at WPI forsupport.
References
1. M. Dresselhaus, G. Dreselhaus, R. Satito, Phys. Rev. B45, 6234 (1992).
2. S. Iijima, Nature 354, 56 (1991).3. M. Bockrath, D.H. Cobden, P.L. McEuen, N.G. Chopra,
A. Zettl, A. Thess, R.E. Smalley, Science 275, 1922 (1997).4. R.H. Baughman, C. Cui, A.A. Zakhidov, Z. Iqbal, J.N.
Barisci, G.M. Spinks, G.G. Wallace, A. Mazzoldi, D.D.Rossi, A.G. Rinzler et al., Science 284, 1340 (1999).
5. W.A. de Heer, J.-M. Bonard, A.C. Kai Fauth, L. Forro,D.U. Herr, Adv. Mater. 9, 87 (1997).
6. G. Che, B.B. Lakshmi, E.R. Fisher, C.R. Martin, Nature393, 346 (1998).
7. P.G. Collins, A. Zettl, H. Bando, A. Thess, R.E. Smalley,Science 278, 100 (1997).
8. P.G. de Gennes, J. Prost, The Physics of Liquid Crystals(Oxford University Press, Clarendon, Oxford, 1993).
9. S. Chandrashekhar, Liquid Crystals (Cambridge Univer-sity Press, 1992).
10. D. Demus, J. Goodby, G. Gray, H. Spiess, V. Vill (Edi-tors), Hand Book of Liquid Crystals (Wiley-VCH, Wein-heim, Canada, 1998).
11. A.M. Somoza, C. Sagui, C. Roland, Phys. Rev. B 63,081403(R) (2001).
12. W. Song, I.A. Kinloch, A.H. Windle, Science 302, 1363(2003).
13. W. Song, A.H. Windle, Macromolecules 38, 6181 (2005).14. P.K. Rai, R.A. Pinnick, A.N.G. Para-Vasquez, V.A. Davis,
H.K. Schmidt, R.H. Hauge, R.E. Smalley, M. Pasquali, J.Am. Chem. Soc. 128, 591 (2006).
15. S. Zhang, S. Kumar, Small 4, 1270 (2008).16. M.D. Lynch, D.L. Patrick, Nano Lett. 2, 1197 (2002).17. I. Dierking, G. Scalia, P. Morales, D. LeClere, Adv. Mater.
16, 865 (2004).18. I. Dierking, G. Scalia, P. Morales, J. Appl. Phys. 97,
044309 (2005).19. J.P.F. Lagerwall, G. Scalia, M. Haluska, U. Dettlaff-
Weglikowska, F. Giesselmann, S. Roth, Phys. Status SolidiB 243, 3046 (2006).
20. S. Kumar, H.K. Bisoyi, Angew. Chem. 119, 1523 (2007).21. C. Zakri, Liq. Cryst. Today 16, 1 (2007).22. O. Trushkevych, N. Collings, T. Hasan, V. Scardaci, A.C.
Ferrari, T.D. Wilkinson, W.A. Crossland, W.I. Milne, J.Geng, B.F.G. Johnson et al., J. Phys. D: Appl. Phys. 41,125106 (2008).
23. J.P.F. Lagerwall, G. Scalia, J. Mater. Chem. 18, 2890(2008).
24. R. Basu, G. Iannacchione, Appl. Phys. Lett. 93, 183105(2008).
25. V. Popa-Nita, S. Kralj, J. Chem. Phys. 132, 024902 (2010).26. G. Scalia, ChemPhysChem 11, 333 (2010).27. P.V. Kamat, K.G. Thomas, S. Barazzouk, G. Girishkumar,
K. Vinodgopal, D. Meisel, J. Am. Chem. Soc. 126, 10757(2004).
28. H.-Y. Chen, W. Lee, Opt. Rev. 12, 223 (2005).29. I.-S. Baik, S.Y. Jeon, S.H. Lee, K.A. Park, S.H. Jeong,
K.H. An, Y.H. Lee, Appl. Phys. Lett. 87, 263110 (2005).30. H.-Y. Chen, W. Lee, N.A. Clark, App. Phys. Lett. 90,
033510 (2007).31. M. Rahman, W. Lee, J. Phys. D: Appl. Phys. 42, 063001
(2009).
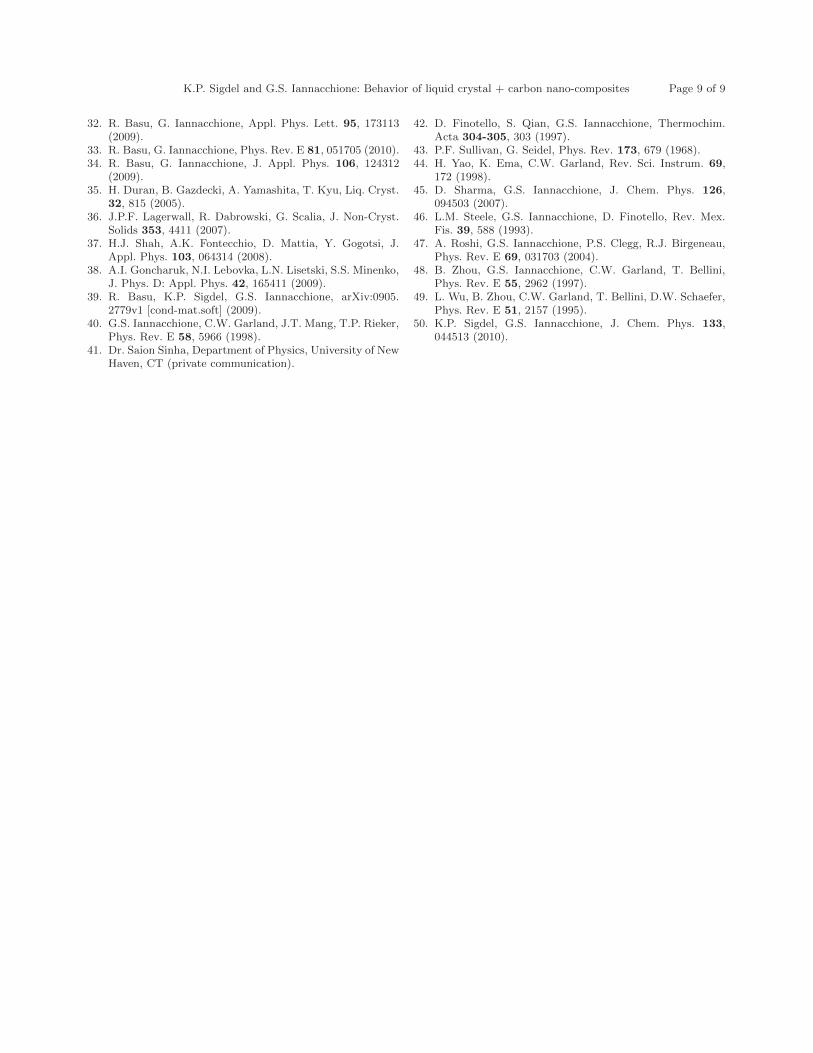
K.P. Sigdel and G.S. Iannacchione: Behavior of liquid crystal + carbon nano-composites Page 9 of 9
32. R. Basu, G. Iannacchione, Appl. Phys. Lett. 95, 173113(2009).
33. R. Basu, G. Iannacchione, Phys. Rev. E 81, 051705 (2010).34. R. Basu, G. Iannacchione, J. Appl. Phys. 106, 124312
(2009).35. H. Duran, B. Gazdecki, A. Yamashita, T. Kyu, Liq. Cryst.
32, 815 (2005).36. J.P.F. Lagerwall, R. Dabrowski, G. Scalia, J. Non-Cryst.
Solids 353, 4411 (2007).37. H.J. Shah, A.K. Fontecchio, D. Mattia, Y. Gogotsi, J.
Appl. Phys. 103, 064314 (2008).38. A.I. Goncharuk, N.I. Lebovka, L.N. Lisetski, S.S. Minenko,
J. Phys. D: Appl. Phys. 42, 165411 (2009).39. R. Basu, K.P. Sigdel, G.S. Iannacchione, arXiv:0905.
2779v1 [cond-mat.soft] (2009).40. G.S. Iannacchione, C.W. Garland, J.T. Mang, T.P. Rieker,
Phys. Rev. E 58, 5966 (1998).41. Dr. Saion Sinha, Department of Physics, University of New
Haven, CT (private communication).
42. D. Finotello, S. Qian, G.S. Iannacchione, Thermochim.Acta 304-305, 303 (1997).
43. P.F. Sullivan, G. Seidel, Phys. Rev. 173, 679 (1968).44. H. Yao, K. Ema, C.W. Garland, Rev. Sci. Instrum. 69,
172 (1998).45. D. Sharma, G.S. Iannacchione, J. Chem. Phys. 126,
094503 (2007).46. L.M. Steele, G.S. Iannacchione, D. Finotello, Rev. Mex.
Fis. 39, 588 (1993).47. A. Roshi, G.S. Iannacchione, P.S. Clegg, R.J. Birgeneau,
Phys. Rev. E 69, 031703 (2004).48. B. Zhou, G.S. Iannacchione, C.W. Garland, T. Bellini,
Phys. Rev. E 55, 2962 (1997).49. L. Wu, B. Zhou, C.W. Garland, T. Bellini, D.W. Schaefer,
Phys. Rev. E 51, 2157 (1995).50. K.P. Sigdel, G.S. Iannacchione, J. Chem. Phys. 133,
044513 (2010).