krishna veni k s
TRANSCRIPT
Awm
TD
a
A
R
R
4
A
K
R
W
M
N
1
WtTatma
0d
e c o l o g i c a l e n g i n e e r i n g 3 5 ( 2 0 0 9 ) 487–496
avai lab le at www.sc iencedi rec t .com
journa l homepage: www.e lsev ier .com/ locate /eco leng
pplying remote sensing techniques to monitor shiftingetland vegetation: A case study of Danshui River estuaryangrove communities, Taiwan
sai-Ming Lee ∗, Hui-Chung Yehepartment of Natural Resources, Chinese Culture University, 55, Huagang Road, Taipei, Taiwan
r t i c l e i n f o
rticle history:
eceived 1 September 2007
eceived in revised form
January 2008
ccepted 11 January 2008
eywords:
emote sensing techniques
etland ecosystems
angrove vegetation
DVI
a b s t r a c t
The purpose of this study is to apply different remote sensing techniques to monitor shifting
mangrove vegetation in the Danshui River estuary in Taipei, Taiwan, in order to evaluate a
long-term wetland conservation strategy compromising between comprehensive wetland
ecosystem management and urban development. In the Danshui estuary, mangrove domi-
nated by Kandelia candel is the major vegetation, and a large area of marsh with freshwater
grasses has been protected in three reserves along the river shore. This study applied satel-
lite imagery from different remote sensors of various resolutions for spectral analysis in
order to compare shifting wetland vegetation communities at different times. A two-stage
analytical process was used for extracting vegetation area and types. In the first-stage, a
normalized difference vegetation index (NDVI) was adopted to analyze SPOT, Landsat, and
QuickBird imagery to obtain the spatial distribution of vegetation covers. In the second
stage, a maximum likelihood classification (MLC) program was used to classify mangrove
and non-mangrove areas. The results indicated that the spatial distribution of mangroves
expanded 15.18 and 40 ha in two monitoring sites in 10 years, demonstrating the success of
establishing reserves for protecting mangrove habitats. The analytical results also indicated
that satellite imagery can easily discern the difference in characteristics between imagery
of mangrove and other vegetation types, and that the logistical disadvantages of monitoring
long-term vegetation community changes as well as evaluating an inaccessible area may be
overcome by applying remote sensing techniques.
and the bark is used for tanning material; some species have
. Introduction
etlands are considered to be some of the most impor-ant ecosystems on earth (Mitsch and Gosselink, 1993).hey are known as transition zones between terrestrial andquatic environments and are valuable as sources, sinks, and
ransformers of numerous chemical, biological, and geneticaterials (Mitsch and Gosselink, 1993). Mangrove wetlandsre dominant coastal ecosystems in subtropical and tropi-
∗ Corresponding author. Tel.: +886 2 28615440; fax: +886 2 28615440.E-mail address: [email protected] (T.-M. Lee).
925-8574/$ – see front matter © 2008 Elsevier B.V. All rights reserved.oi:10.1016/j.ecoleng.2008.01.007
© 2008 Elsevier B.V. All rights reserved.
cal regions throughout the world. Mangrove is an ecologicalterm referring to a diverse aggregation of trees and shrubsthat form the dominant plant communities in tidal salinewetlands along sheltered coasts. In many countries man-groves are major sources of timber, thatch, and fuel wood,
food or medicinal value (Blasco et al., 1996). Since mangrovesoffer broad biological, economic, scientific, environmental,aesthetic, and ethical values (Mitsch and Gosselink, 1993;
r i n g
2.1. Study site
488 e c o l o g i c a l e n g i n e e
Mitsch, 2005; Mitsch et al., 2005), the effects of wetland succes-sion might be very important to both ecosystem and wetlandmanagement. Mangroves provide many ecological benefits,including controlling tide level (Varnell et al., 2003), stabilizingshorelines (Lee and Shih, 2004; Willis et al., 2005), support-ing coastal fisheries for fish and shellfish, and providingdiverse habitat to support wildlife communities (Zhou, 1995;Lewis, 2005). Therefore, many successful ecological engineer-ing and adaptive management approaches were conductedfor increasing wetland vegetation areas in order to accom-plish those biological functions in various wetland restorationand management projects (Hackney, 2000; Mitsch et al., 2002;Lewis, 2000; Teal and Weinstein, 2002; Lewis, 2005; Teal andWeishar, 2005).
The mangroves along the Danshui River estuary in north-ern Taiwan are thought to comprise the largest area of Kandeliacandel mangrove woodland in the Northern Hemisphere (Hsu,2002), and they are unique because of their northernmostgeographical position. In the 1970s, the removal of these man-groves for urban development was a controversial issue. Threeprotected wetland areas were established to preserve theremaining valuable estuarine mangroves in the 1980s, and themangroves expanded to twice their original area under pro-tection during these two decades to form sound and diverseestuarine ecosystem habitats. Since mangrove distributionwas illustrated by paper maps before the 1980s, the exactarea and distribution were difficult to verify. Therefore, weattempted to detect shifting of spatial distributions and areachanges of mangroves by using remote sensing techniques tofacilitate resolution of issues surrounding the conservation ofnature versus urban development.
Conventional detection of land cover change is time-consuming and labor-intensive. Rapid progress in remotesensing technology has brought land cover change detec-tion into a new era. The spatial distribution of land coverat different times can be analyzed by using remote sens-ing imagery; compared to conventional labor-intensive fieldinvestigation, remote sensing information not only saves timebut also enhances the possibility of classifying the vegeta-tion through spectral and texture analyses (Pozdnyakova etal., 2002; Vasconcelos et al., 2002; Kokaly et al., 2003; Roberts etal., 2003). To monitor land cover changes effectively, rapid andaccurate mapping techniques are required. Remote sensingimagery provide advantages in this respect and are often usedto monitor long-term environmental changes (Coulibaly andGoıta, 2006; Green et al., 1998) by combining GIS mapping tech-niques for establishing resource databases (Lehner and Doll,2004). Applying remote sensing information is a useful tool forstudying how land use change affects wetland distribution oncoastlines (Chen, 2002; Bird et al., 2004; Zhao et al., 2004; Wanget al., 2006). Hess et al. (2003) applied synthetic aperture radarimagery to map inundation extent and vegetation under bothlow water and high water conditions in the central Amazonbasin. Remote sensing is also an important tool for map-ping and monitoring vegetation. Schmidt and Skidmore (2003)used hyperspectral reflectance in the visible-to-shortwave-
infrared spectral range to differentiate vegetation associationsand obtained satisfactory results. Remote sensing imagerywas widely adopted to identify different land cover classes ofwatersheds as well as wetlands and help to monitor the condi-3 5 ( 2 0 0 9 ) 487–496
tion of natural habitats and to generate biodiversity maps forconservation planning (Fuller et al., 1998; Tiner, 2004). Relatedstudies include using satellite imagery to evaluate the charac-teristics of wetland vegetation association and the extent ofwetland vegetation (Ramırez-Garcıa et al., 1998; Murray et al.,2003), to examine the relationship between coastal changesand mangrove distribution (Allison and Lee, 2004; Fromard etal., 2004; Nakamura et al., 2004), to evaluate water quality insubtropical marshes or swamps (Tilley et al., 2003; Mohamedet al., 2004) and methane emission from high-latitude bogs(Takeuchi et al., 2003).
Vegetation indices are widely used as indicators for analyz-ing the variations of land cover among vegetation and otherfactors (Ahl et al., 2004; Geerken et al., 2005; Liu and Kafatos,2005; Ben-Ze’ev et al., 2006; Koh et al., 2006; Morawitz et al.,2006; Tucker et al., 2005). The normalized difference vegetationindex (NDVI) is one of the most popular methods for vege-tation monitoring (Binh et al., 2005). Green et al. (1997) usedNDVI to estimate leaf area index (LAI) and considered remotesensing imagery a useful tool for wetland distribution analy-sis in order to minimize logistical and practical difficulties offield work in inaccessible mangrove areas. Much research hasdemonstrated a positive correlation between LAI and NDVI(Chaurasia et al., 2006; Chen et al., 2006; Davi et al., 2006;Heiskanen, 2006). Different time series imagery and differentsource imagery are often used to compare changes in envi-ronment (Binh et al., 2005; Fensholt et al., 2006; Hountondjiet al., 2006; Karnieli et al., 2006; Piao et al., 2006). Becausevegetation indices are derived from remote sensing imagery,the resolution of imagery highly affects the analytical results.Therefore, integrating spectral analysis as well as texture anal-ysis would be a feasible approach to enhance quality whenapplying satellite imagery from various sources.
Since remote sensing techniques have been widely used tomonitor spatial variation in wetlands at different times, weadopted two sets of imagery for assessing shifting vegetationover 10 years. The remote sensing sources we used in thisstudy included digital aerial imagery and satellite imagery,imagery analysis techniques were integrated with geographicinformation systems (GIS) to perform spatial differentiationof vegetation changes. In this study, fair-resolution SPOT andLandsat imagery were used for analyzing early-stage man-grove vegetation distribution, and QuickBird satellite imagerywere used to represent the later stages of mangrove dis-tribution. A MicroImage TNTmips was the major imageryclassification software, and GIS tool ArcGIS9.0 (ESRI, 2006)was used to delineate wetland vegetation as training areasfrom a high-resolution digital aerial imagery. Data qualitywas compared in order to examine the suitability of applyingdifferent-resolution imagery. Area changes and spatial shift-ing of mangroves were also defined in order to assess theinfluence of urban development in the neighborhood.
2. Materials and methods
This study focuses on the large wetland area of mangrovewoodlands and marsh located along the Danshui River estu-
i n g 3 5 ( 2 0 0 9 ) 487–496 489
amlmcgpwaiumPwfaoRotpwthd
2
Abfke((als2assQdaaipt
pcbcopb0co
e c o l o g i c a l e n g i n e e r
ry, Taipei, Taiwan. Kandelia candel is the major species ofangrove and along with Phragmites communis occupies a
arge area along the riverbanks to form the largest Kandeliaangrove community in the world. Because of these unique
haracteristics of the large area and extreme northern geo-raphic location, three nature reserves were established torotect the mangrove ecosystem. Danshui Mangrove Reserve,ith an area of 76.4 ha, is the largest, with mangrove cover-
ge at over 50% or 39.5 ha in area. Guandu Reserve is locatedn between the Danshui River and the Keelung River, a trib-tary of the Danshui River, with an area of 55 ha. Kandeliaangroves and marsh dominated by Cyperus malaccensis and
hragmites communis are the major vegetation types of thisetland site, which also provides various habitats for water-
owl and other wetland biota and is, therefore, consideredn important bird area in the Taipei metropolitan area. Bothf these wetland reserves were established in 1986. Wazeweieserve is located on the opposite riverbank, with a total areaf 11.5 ha and a mangrove area less than 8 ha. Mangroves inhis reserve are not included in the shifting mangrove analysiserformed in this study. Although the mangrove vegetationas well protected during these two decades (1986–2006),
he impact caused by rapid urbanization of the neighbor-ood affected the distribution of mangroves and could not beiscounted.
.2. Imagery data sources
variety of sensors and imagery processing methods haveeen used in the remote sensing of mangroves with satis-actory results (Green et al., 1997; Kovacs et al., 2004). Threeinds of data sources were used to derive mangrove veg-tation areas and non-vegetation areas for 1995 and 2004:1) SPOT (row 960, column 1040, date 1995.1.6) and Landsatrow 480, column 520, date 1995.1.9) imagery georeferencedccording to Taiwan Datum 97 (TWD97) system with the uppereft corner located at 2787000N, 290000E. (2) High-resolutionatellite imagery QuickBird with the multispectral imagery at783900N, 295100E (date of 2004.2.18) and (3) a series of digitalerial imagery (date of 2004.8.7) as the reference. Both SPOTatellite imagery with the pixel spacing of 12.5 m and Land-at with pixel spacing of 25 m, represented the year 1995, anduickBird with pixel spacing of 2.8 m represented 2004. Theigital aerial imagery with pixel spacing of 25 cm was useds a reference for delineating and testing the site boundarynd selecting training areas for imagery analysis. The satellitemagery from different remote sensors was used to com-are the spatial variation of mangrove vegetation at differentimes.
To register all imagery for comparison, ground controloints were chosen from throughout the imagery. Most of theontrol points were located at distinctive positions such asuildings and bridges. GPS was applied in the field, and theoordinates were input to conduct geometric correction for allf the imagery. The georeferencing and imagery preparationrocesses were based on high-resolution digital aerial imagery
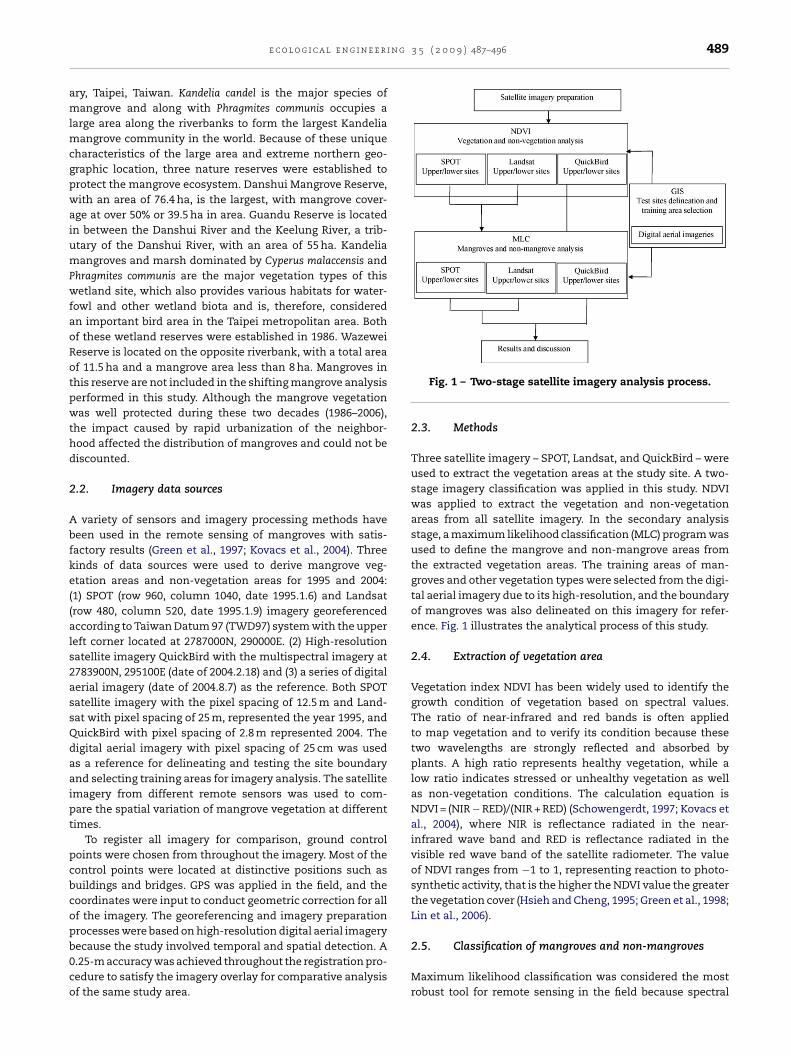
ecause the study involved temporal and spatial detection. A.25-m accuracy was achieved throughout the registration pro-edure to satisfy the imagery overlay for comparative analysisf the same study area.Fig. 1 – Two-stage satellite imagery analysis process.
2.3. Methods
Three satellite imagery – SPOT, Landsat, and QuickBird – wereused to extract the vegetation areas at the study site. A two-stage imagery classification was applied in this study. NDVIwas applied to extract the vegetation and non-vegetationareas from all satellite imagery. In the secondary analysisstage, a maximum likelihood classification (MLC) program wasused to define the mangrove and non-mangrove areas fromthe extracted vegetation areas. The training areas of man-groves and other vegetation types were selected from the digi-tal aerial imagery due to its high-resolution, and the boundaryof mangroves was also delineated on this imagery for refer-ence. Fig. 1 illustrates the analytical process of this study.
2.4. Extraction of vegetation area
Vegetation index NDVI has been widely used to identify thegrowth condition of vegetation based on spectral values.The ratio of near-infrared and red bands is often appliedto map vegetation and to verify its condition because thesetwo wavelengths are strongly reflected and absorbed byplants. A high ratio represents healthy vegetation, while alow ratio indicates stressed or unhealthy vegetation as wellas non-vegetation conditions. The calculation equation isNDVI = (NIR − RED)/(NIR + RED) (Schowengerdt, 1997; Kovacs etal., 2004), where NIR is reflectance radiated in the near-infrared wave band and RED is reflectance radiated in thevisible red wave band of the satellite radiometer. The valueof NDVI ranges from −1 to 1, representing reaction to photo-synthetic activity, that is the higher the NDVI value the greaterthe vegetation cover (Hsieh and Cheng, 1995; Green et al., 1998;Lin et al., 2006).
2.5. Classification of mangroves and non-mangroves
Maximum likelihood classification was considered the mostrobust tool for remote sensing in the field because spectral
490 e c o l o g i c a l e n g i n e e r i n g 3 5 ( 2 0 0 9 ) 487–496
Fig. 2 – Satellite imagery testing areas, Danshui River Estuary, Taiwan. Two subsites, an upper stream site and a lowerfor
stream site, were selected. Training areas were also selectedinformation in each class meets the normal distribution cri-teria (Wang et al., 2004; Wentz et al., 2006). In this study weadopted MLC to compare vegetation distribution in imageryfrom different remote sensors in different time periods. Aninitial MLC was performed on these imagery using two cat-egories: mangrove and non-mangrove. Three bands of SPOT,seven bands of Landsat, and four bands of QuickBird for eachimagery were conducted to test the matching classificationpairs.
Two subset areas, upper channel and downstream tributaryareas, were selected for vegetation classification. Vegetationin the upper channel area is mostly in the Danshui MangroveReserve, and the downstream area includes Guandu Reserve, aneighborhood residential area, and a natural recreation park.Several mangrove and non-mangrove training areas delin-eated from digital aerial imagery were selected to obtaincutouts from SPOT, Landsat, and QuickBird imagery for man-grove classification. Imagery adjustment by visual and field
information were also adopted to maintain the consistenceof classification performance on this imagery. This insuredthat the spectral signals in the testing areas corresponded tothe same ground target, and all test sample sites and trainingmangrove and non-mangrove area classification.
data were revisited on the ground to confirm accuracy of mea-surement. Fig. 2 illustrates the upper stream and lower testingareas and the distribution of training areas.
3. Results and discussion
3.1. Accuracy of imagery analysis
This study focuses on the area changes and spatial shift-ing of mangrove along the Danshui River estuary. We werenot able to obtain high-resolution satellite imagery before the1990s to compare area changes with high-resolution imagerycurrently available. Therefore, the analytical quality of SPOTwith pixel spacing of 12.5 m and Landsat with pixel spacing of25 m were examined in the first-stage imagery extraction, thencompared to QuickBird with pixel spacing of 2.8 m in order todefine the analytical threshold and to evaluate the associated
accuracy. Fig. 3 shows the vegetation and non-vegetation areasextracted from the two subset areas. The cutoff area for veg-etation and non-vegetation analysis of Landsat imagery with87 × 47 pixels at the upstream site and 68 × 115 pixels at the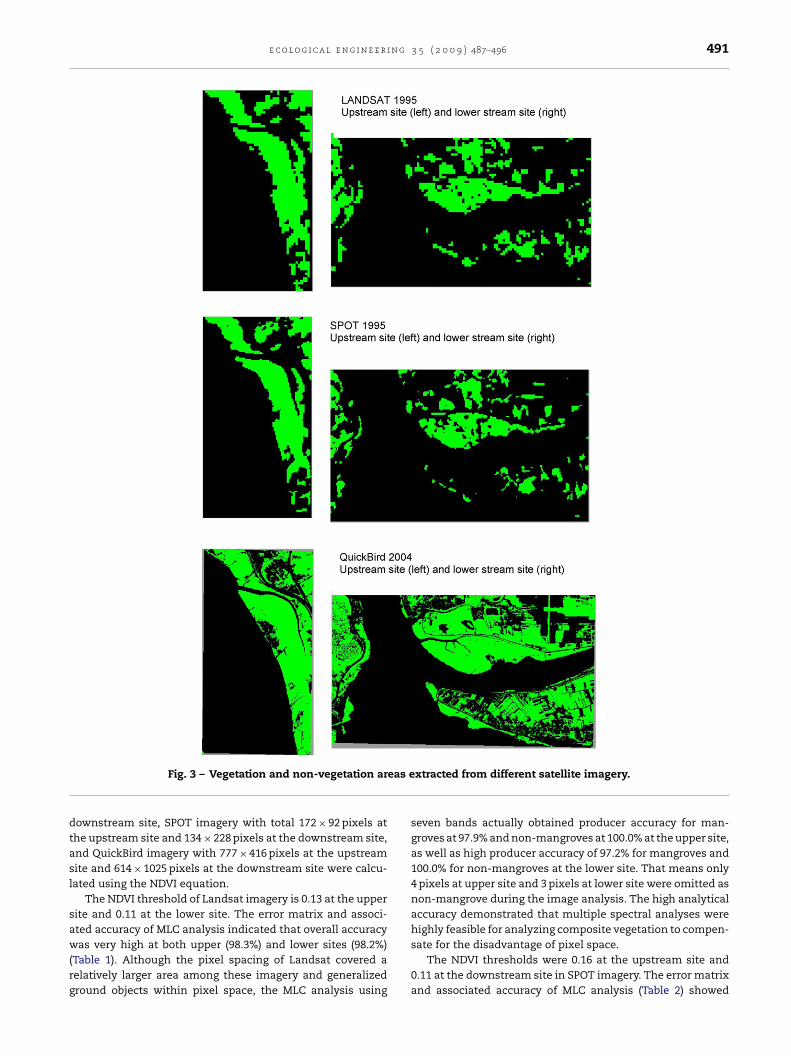
e c o l o g i c a l e n g i n e e r i n g 3 5 ( 2 0 0 9 ) 487–496 491
eas e
dtasl
saw(rg
Fig. 3 – Vegetation and non-vegetation ar
ownstream site, SPOT imagery with total 172 × 92 pixels athe upstream site and 134 × 228 pixels at the downstream site,nd QuickBird imagery with 777 × 416 pixels at the upstreamite and 614 × 1025 pixels at the downstream site were calcu-ated using the NDVI equation.
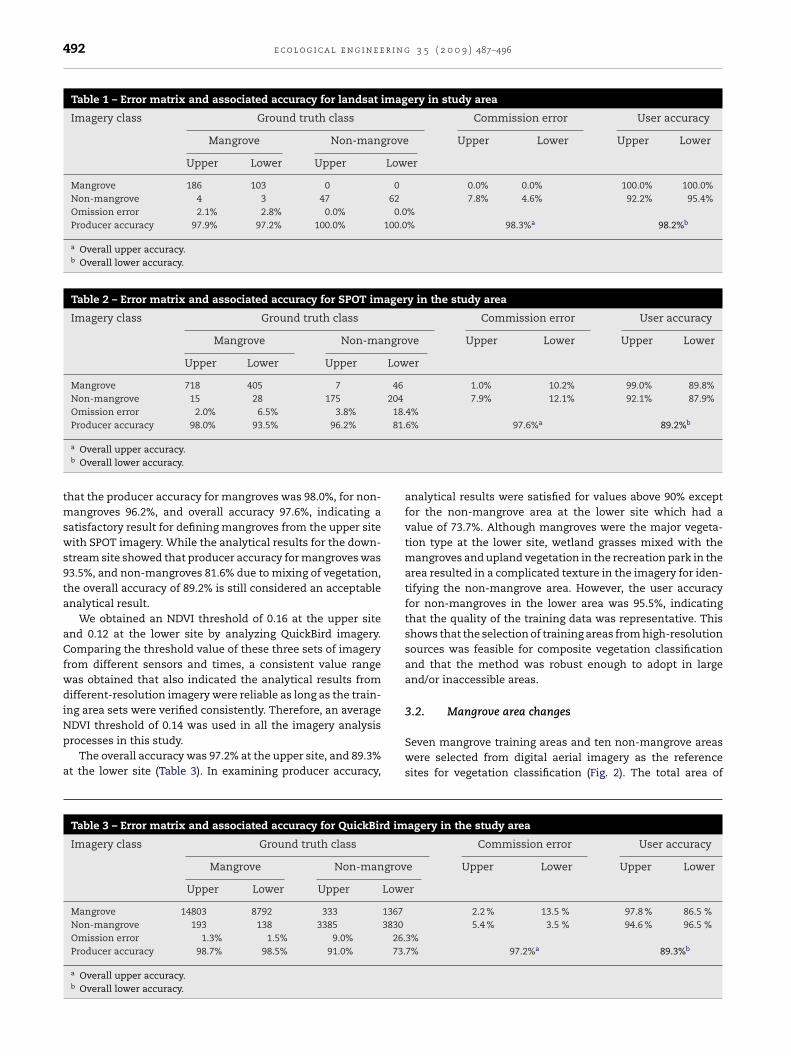
The NDVI threshold of Landsat imagery is 0.13 at the upperite and 0.11 at the lower site. The error matrix and associ-ted accuracy of MLC analysis indicated that overall accuracy
as very high at both upper (98.3%) and lower sites (98.2%)Table 1). Although the pixel spacing of Landsat covered aelatively larger area among these imagery and generalizedround objects within pixel space, the MLC analysis using
xtracted from different satellite imagery.
seven bands actually obtained producer accuracy for man-groves at 97.9% and non-mangroves at 100.0% at the upper site,as well as high producer accuracy of 97.2% for mangroves and100.0% for non-mangroves at the lower site. That means only4 pixels at upper site and 3 pixels at lower site were omitted asnon-mangrove during the image analysis. The high analyticalaccuracy demonstrated that multiple spectral analyses werehighly feasible for analyzing composite vegetation to compen-
sate for the disadvantage of pixel space.The NDVI thresholds were 0.16 at the upstream site and0.11 at the downstream site in SPOT imagery. The error matrixand associated accuracy of MLC analysis (Table 2) showed
492 e c o l o g i c a l e n g i n e e r i n g 3 5 ( 2 0 0 9 ) 487–496
Table 1 – Error matrix and associated accuracy for landsat imagery in study area
Imagery class Ground truth class Commission error User accuracy
Mangrove Non-mangrove Upper Lower Upper Lower
Upper Lower Upper Lower
Mangrove 186 103 0 0 0.0% 0.0% 100.0% 100.0%Non-mangrove 4 3 47 62 7.8% 4.6% 92.2% 95.4%Omission error 2.1% 2.8% 0.0% 0.0%Producer accuracy 97.9% 97.2% 100.0% 100.0% 98.3%a 98.2%b
a Overall upper accuracy.b Overall lower accuracy.
Table 2 – Error matrix and associated accuracy for SPOT imagery in the study area
Imagery class Ground truth class Commission error User accuracy
Mangrove Non-mangrove Upper Lower Upper Lower
Upper Lower Upper Lower
Mangrove 718 405 7 46 1.0% 10.2% 99.0% 89.8%Non-mangrove 15 28 175 204 7.9% 12.1% 92.1% 87.9%Omission error 2.0% 6.5% 3.8% 18.4%Producer accuracy 98.0% 93.5% 96.2% 81.6% 97.6%a 89.2%b
a Overall upper accuracy.b Overall lower accuracy.
that the producer accuracy for mangroves was 98.0%, for non-mangroves 96.2%, and overall accuracy 97.6%, indicating asatisfactory result for defining mangroves from the upper sitewith SPOT imagery. While the analytical results for the down-stream site showed that producer accuracy for mangroves was93.5%, and non-mangroves 81.6% due to mixing of vegetation,the overall accuracy of 89.2% is still considered an acceptableanalytical result.
We obtained an NDVI threshold of 0.16 at the upper siteand 0.12 at the lower site by analyzing QuickBird imagery.Comparing the threshold value of these three sets of imageryfrom different sensors and times, a consistent value rangewas obtained that also indicated the analytical results fromdifferent-resolution imagery were reliable as long as the train-ing area sets were verified consistently. Therefore, an average
NDVI threshold of 0.14 was used in all the imagery analysisprocesses in this study.The overall accuracy was 97.2% at the upper site, and 89.3%at the lower site (Table 3). In examining producer accuracy,
Table 3 – Error matrix and associated accuracy for QuickBird im
Imagery class Ground truth class
Mangrove Non-mangrov
Upper Lower Upper Lowe
Mangrove 14803 8792 333 1367Non-mangrove 193 138 3385 3830Omission error 1.3% 1.5% 9.0% 26.Producer accuracy 98.7% 98.5% 91.0% 73.
a Overall upper accuracy.b Overall lower accuracy.
analytical results were satisfied for values above 90% exceptfor the non-mangrove area at the lower site which had avalue of 73.7%. Although mangroves were the major vegeta-tion type at the lower site, wetland grasses mixed with themangroves and upland vegetation in the recreation park in thearea resulted in a complicated texture in the imagery for iden-tifying the non-mangrove area. However, the user accuracyfor non-mangroves in the lower area was 95.5%, indicatingthat the quality of the training data was representative. Thisshows that the selection of training areas from high-resolutionsources was feasible for composite vegetation classificationand that the method was robust enough to adopt in largeand/or inaccessible areas.
3.2. Mangrove area changes
Seven mangrove training areas and ten non-mangrove areaswere selected from digital aerial imagery as the referencesites for vegetation classification (Fig. 2). The total area of
agery in the study area
Commission error User accuracy
e Upper Lower Upper Lower
r
2.2 % 13.5 % 97.8 % 86.5 %5.4 % 3.5 % 94.6 % 96.5 %
3%7% 97.2%a 89.3%b

i n g
celaTimawwawHm
e c o l o g i c a l e n g i n e e r
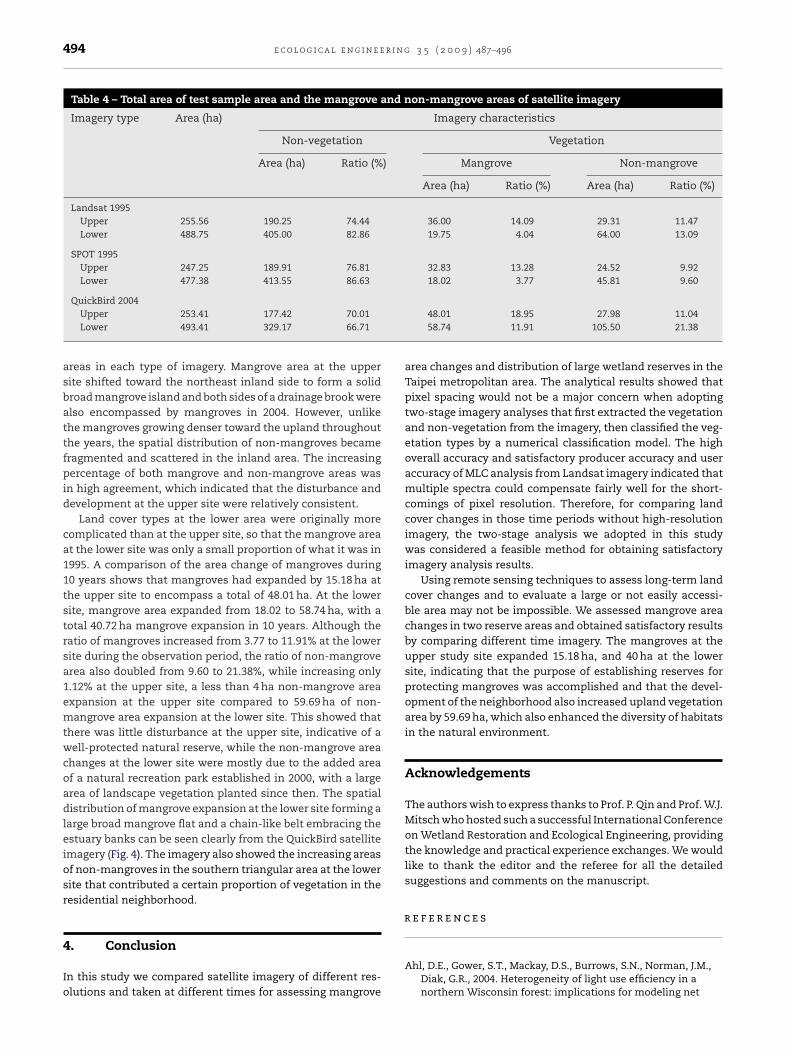
utouts from each image was slightly different due to differ-nces among pixel numbers and pixel spacing area. Table 4ists the total area of testing areas, non-vegetation areas,nd mangrove and non-mangrove areas of satellite imagery.he total area of mangroves extracted from the upper site
n Landsat imagery was 36.00 ha, while the area of non-angroves was 29.31 ha, with the proportion of mangroves
nd non-mangroves 14.09 and 11.47%, respectively. Comparedith SPOT imagery, the total area of mangroves was 32.83 ha,hile the area of non-mangroves was 24.52 ha. The percent-
ge differences between the two different-resolution imageryere 0.81% for mangrove and 1.55% for non-mangrove areas.owever, in a comparison of the area of mangrove and non-angrove at the lower site, the percentage difference within
Fig. 4 – Vegetation classification for mangrove areas and n
3 5 ( 2 0 0 9 ) 487–496 493
the two imagery was 0.27% for mangrove, a relatively closeagreement with the upper site difference, but 3.49% for thenon-mangrove area. The higher difference between the twoimagery in the percentage of non-mangrove area in the lowersite was due to the pixel spacing of Landsat imagery wasfour times that of SPOT pixel. Therefore, the changes in man-grove area between the years 1995 and 2004 were derivedfrom SPOT imagery and QuickBird to limit the resolutionerror.
Between 1995 and 2004, the mangrove area at the upper
site expanded from 32.83 to 48.01 ha with an annual rate ofincreases of 4.62%, while the non-mangrove area expandedfrom 24.52 to 27.98 ha, at a rate of 1.41% per year. Fig. 4 illus-trates the spatial distribution of mangrove and non-mangroveon-mangrove areas among different satellite imagery.
494 e c o l o g i c a l e n g i n e e r i n g 3 5 ( 2 0 0 9 ) 487–496
Table 4 – Total area of test sample area and the mangrove and non-mangrove areas of satellite imagery
Imagery type Area (ha) Imagery characteristics
Non-vegetation Vegetation
Area (ha) Ratio (%) Mangrove Non-mangrove
Area (ha) Ratio (%) Area (ha) Ratio (%)
Landsat 1995Upper 255.56 190.25 74.44 36.00 14.09 29.31 11.47Lower 488.75 405.00 82.86 19.75 4.04 64.00 13.09
SPOT 1995Upper 247.25 189.91 76.81 32.83 13.28 24.52 9.92Lower 477.38 413.55 86.63 18.02 3.77 45.81 9.60
r
QuickBird 2004Upper 253.41 177.42 70.01Lower 493.41 329.17 66.71
areas in each type of imagery. Mangrove area at the uppersite shifted toward the northeast inland side to form a solidbroad mangrove island and both sides of a drainage brook werealso encompassed by mangroves in 2004. However, unlikethe mangroves growing denser toward the upland throughoutthe years, the spatial distribution of non-mangroves becamefragmented and scattered in the inland area. The increasingpercentage of both mangrove and non-mangrove areas wasin high agreement, which indicated that the disturbance anddevelopment at the upper site were relatively consistent.
Land cover types at the lower area were originally morecomplicated than at the upper site, so that the mangrove areaat the lower site was only a small proportion of what it was in1995. A comparison of the area change of mangroves during10 years shows that mangroves had expanded by 15.18 ha atthe upper site to encompass a total of 48.01 ha. At the lowersite, mangrove area expanded from 18.02 to 58.74 ha, with atotal 40.72 ha mangrove expansion in 10 years. Although theratio of mangroves increased from 3.77 to 11.91% at the lowersite during the observation period, the ratio of non-mangrovearea also doubled from 9.60 to 21.38%, while increasing only1.12% at the upper site, a less than 4 ha non-mangrove areaexpansion at the upper site compared to 59.69 ha of non-mangrove area expansion at the lower site. This showed thatthere was little disturbance at the upper site, indicative of awell-protected natural reserve, while the non-mangrove areachanges at the lower site were mostly due to the added areaof a natural recreation park established in 2000, with a largearea of landscape vegetation planted since then. The spatialdistribution of mangrove expansion at the lower site forming alarge broad mangrove flat and a chain-like belt embracing theestuary banks can be seen clearly from the QuickBird satelliteimagery (Fig. 4). The imagery also showed the increasing areasof non-mangroves in the southern triangular area at the lowersite that contributed a certain proportion of vegetation in theresidential neighborhood.
4. Conclusion
In this study we compared satellite imagery of different res-olutions and taken at different times for assessing mangrove
48.01 18.95 27.98 11.0458.74 11.91 105.50 21.38
area changes and distribution of large wetland reserves in theTaipei metropolitan area. The analytical results showed thatpixel spacing would not be a major concern when adoptingtwo-stage imagery analyses that first extracted the vegetationand non-vegetation from the imagery, then classified the veg-etation types by a numerical classification model. The highoverall accuracy and satisfactory producer accuracy and useraccuracy of MLC analysis from Landsat imagery indicated thatmultiple spectra could compensate fairly well for the short-comings of pixel resolution. Therefore, for comparing landcover changes in those time periods without high-resolutionimagery, the two-stage analysis we adopted in this studywas considered a feasible method for obtaining satisfactoryimagery analysis results.
Using remote sensing techniques to assess long-term landcover changes and to evaluate a large or not easily accessi-ble area may not be impossible. We assessed mangrove areachanges in two reserve areas and obtained satisfactory resultsby comparing different time imagery. The mangroves at theupper study site expanded 15.18 ha, and 40 ha at the lowersite, indicating that the purpose of establishing reserves forprotecting mangroves was accomplished and that the devel-opment of the neighborhood also increased upland vegetationarea by 59.69 ha, which also enhanced the diversity of habitatsin the natural environment.
Acknowledgements
The authors wish to express thanks to Prof. P. Qin and Prof. W.J.Mitsch who hosted such a successful International Conferenceon Wetland Restoration and Ecological Engineering, providingthe knowledge and practical experience exchanges. We wouldlike to thank the editor and the referee for all the detailedsuggestions and comments on the manuscript.
e f e r e n c e s
Ahl, D.E., Gower, S.T., Mackay, D.S., Burrows, S.N., Norman, J.M.,Diak, G.R., 2004. Heterogeneity of light use efficiency in anorthern Wisconsin forest: implications for modeling net
i n g
A
B
B
B
B
C
C
C
C
D
EF
F
F
G
G
G
H
e c o l o g i c a l e n g i n e e r
primary production with remote sensing. Remote Sensing ofEnvironment 93 (1–2), 168–178.
llison, M.A., Lee, M.T., 2004. Sediment exchange betweenAmazon mudbanks and shore-fringing mangroves in FrenchGuiana. Marine Geology 208 (2–4), 169–190.
en-Ze’ev, E., Karnieli, A., Agam, N., Kaufman, Y., Holben, B.,2006. Assessing vegetation condition in the presence ofbiomass burning smoke by applying the Aerosol-freeVegetation Index (AFRI) on MODIS imagery. InternationalJournal of Remote Sensing 27 (15), 3203–3221.
inh, T.N.K.D., Vromant, N., Hung, N.T., Hens, L., Boon, E.K., 2005.Land cover changes between 1968 and 2003 in Cai Nuoc, CaMau Peninsula, Vietnam. Environment, Development andSustainability 7, 519–536.
ird, M., Chua, S., Fifield, L.K., The, T.S., Lai, J., 2004. Evolution ofthe Sungei Buloh-Kranji mangrove coast, Singapore. AppliedGeography 24 (3), 181–198.
lasco, F., Saenger, P., Janodet, E., 1996. Mangroves as indicatorsof coastal change. Catena 27, 167–178.
haurasia, S., Bhattacharya, B., Dadhwal, V., Parihar, J.S., 2006.Field-scale leaf area index estimation using IRS-1D LISS-IIIdata. International Journal of Remote Sensing 27 (4),637–644.
hen, P.Y., Fedosejevs, G., Tiscareno-lopez, M., Arnold, J.G., 2006.Assessment of MODIS-EVI, MODIS-NDVI andVEGETATION-NDVI composite data using agriculturalmeasurements: an example at corn field in western Mexico.Environmental Monitoring and Assessment 119, 69–82.
hen, T.S., 2002. A remote sensing imagery analysis for the Tatuesturary. Endemic Species Research 4 (1), 61–74 (in Chinesewith English abstract).
oulibaly, L., Goıta, K., 2006. Evaluation of the potential of variousspectral indices and textural features derived from satelliteimagery for surficial deposits mapping. International Journalof Remote Sensing 27 (20), 4567–4584.
avi, H., Soudani, K., Deckx, T., Dufrene, E., Le Dantec, V.,FranCois, C., 2006. Estimation of forest leaf area index fromSPOT imagery using NDVI distribution over forest stands.International Journal of Remote Sensing 27 (5), 885–902.
SRI, 2006. http://www.esri.com/software/arcgis/index.html.ensholt, R., Nielsen, T.T., Stisen, S., 2006. Evaluation of AVHRR
PAL and GIMMS 10-day composite NDVI time series productsusing SPOT-4 vegetation data for the African continent.International Journal of Remote Sensing 27 (13),2719–2733.
romard, F., Vega, C., Proisy, C., 2004. Half a century of dynamiccoastal change affecting mangrove shorelines of FrenchGuiana. A case study based on remote sensing data analysesand field surveys. Marine Geology 208 (1–4), 265–280.
uller, R.M., Groom, G.B., Mugisha, S., Ipulet, P., Pomeroy, D.,Katende, A., Bailey, R., Ogutu-Ohwayo, R., 1998. Theintegration of field survey and remote sensing for biodiversityassessment: a case study in the tropical forests and wetlandsof Sango Bay, Uganda. Biological Conservation 86 (3),379–391.
eerken, R., Batikha, N., Celis, D., Depauw, E., 2005.Differentiation of rangeland vegetation and assessment of itsstatus: field investigations and MODIS and SPOT VEGETATIONdata analyses. International Journal of Remote Sensing 26(20), 4499–4526.
reen, E.P., Mumby, Clark, C.D., Mumby, P.J., Edwards, A.J., Ellis,A.C., 1998. Remote sensing techniques for mangrove mapping.International Journal of Remote Sensing 19 (5), 935–956.
reen, E.P., Mumby, P.J., Edwards, A.J., Clark, C.D., Ellis, A.C., 1997.
Estimating leaf area index of mangroves from satellite data.Aquatic Botany 58 (1), 11–19.ackney, C.T., 2000. Restoration of coastal habitats: expectationand reality. Ecological Engineering 15, 165–170.
3 5 ( 2 0 0 9 ) 487–496 495
Heiskanen, J., 2006. Estimating aboveground tree biomass andleaf area index in a mountain birch forest using ASTERsatellite data. International Journal of Remote Sensing 27 (6),1135–1158.
Hess, L.L., Melack, J.M., Novo, E.M.L.M., Barbosa, C.C.F., Gastil, M.,2003. Dual-season mapping of wetland inundation andvegetation for the central Amazon basin. Remote Sensing ofEnvironment 87 (4), 404–428.
Hountondji, Y.C., Sokpon, N., Ozer, P., 2006. Analysis of thevegetation trends using low resolution remote sensing data inBurkina Faso (1982–1999) for the monitoring of desertification.International Journal of Remote Sensing 27 (5),871–884.
Hsieh, H.C., Cheng, C.C., 1995. An analysis of vegetationgreenness of Fu-shan with SPOT XS multitemporal data.Bulletin of Taiwan Forest Research Institute New Series 10 (1),105–120 (in Chinese with English abstract).
Hsu, W.B., 2002. The Guide Book of the Nature Environment atGuandu—The Culture and Ecology. The Yu-shan SocietyPublication Inc, pp. 122 (in Chinese).
Karnieli, A., Bayasgalan, M., Bayarjargal, Y., Agam, N.,Khudulmur, S., Tucker, C.J., 2006. Comments on the use of thevegetation health index over Mongolia. International Journalof Remote Sensing 27 (10), 2017–2024.
Koh, C.N., Lee, P.F., Lin, R.S., 2006. Bird species richness patternsof northern Taiwan: primary productivity, human populationdensity, and habitat heterogeneity. Diversity & Distributions12 (5), 546–554.
Kokaly, R.F., Despain, D.G., Clark, R.N., Livo, K.E., 2003. Mappingvegetation in Yellowstone National Park using spectral featureanalysis of AVIRIS data. Remote Sensing of Environment 84(3), 437–456.
Kovacs, J.M., Flores-Verdugo, F., Wang, J.F., Aspden, L.P., 2004.Estimating leaf area index of a degraded mangrove forestusing high spatial resolution satellite data. Aquatic Botany 80(1), 13–22.
Lee, H.Y., Shih, S.S., 2004. Impacts of vegetation changes on thehydraulic and sediment transport characteristics in Guandumangrove wetland. Ecological Engineering 23, 85–94.
Lehner, B., Doll, P., 2004. Development and validation of a globaldatabase of lakes, reservoirs and wetlands. Journal ofHydrology 296 (1–4), 1–22.
Lewis, R.R., 2000. Ecological based goal setting in mangrove forestand tidal marsh restoration. Ecological Engineering 15,191–198.
Lewis, R.R., 2005. Ecological engineering for successfulmanagement and restoration of mangrove forests. EcologicalEngineering 24, 403–418.
Lin, W.T., Lin, C.Y., Chou, W.C., 2006. Assessment of vegetationrecovery and soil erosion at landslides caused by acatastrophic earthquake: a case study in central Taiwan.Ecological Engineering 28, 79–89.
Liu, X., Kafatos, M., 2005. Land-cover mixing and spectralvegetation indices. International Journal of Remote Sensing26 (15), 3321–3327.
Mitsch, W.J., 2005. Wetland creation, restoration, andconservation. A Wetland Invitational at the Olentangy RiverWetland Research Park. Ecological Engineering 24,243–251.
Mitsch, W.J., Gosselink, J.G., 1993. Wetlands, 2nd ed. Van NostrandReinhold, New York.
Mitsch, W.J., Lefeuvre, J.C., Bouchard, V., 2002. Ecologicalengineering applied to river and wetland restoration.Ecological Engineering 18, 529–541.
Mitsch, W.J., Zhang, L., Anderson, C.J., Altor, A.E., Hernandez,M.E., 2005. Creating riverine wetlands: ecological succession,nutrient retention, and pulsing effects. Ecological Engineering25, 510–527.
r i n g
496 e c o l o g i c a l e n g i n e eMohamed, Y.A., Bastiaanssen, W.G.M., Savenije, H.H.G., 2004.Spatial variability of evaporation and moisture storage in theswamps of the upper Nile studied by remote sensingtechniques. Journal of Hydrology 289 (1–4), 145–164.
Morawitz, D., Blewett, T., Cohen, A., Alberti, M., 2006. Using NDVIto assess vegetative land cover change in central Puget Sound.Environmental Monitoring and Assessment 114, 85–106.
Murray, M.R., Zisman, S.A., Furley, P.A., Munro, D.M., Gibson, J.,Ratter, J., Bridgewater, S., Minty, C.D., Place, C.J., 2003. Themangroves of Belize: Part 1. distribution, composition andclassification. Forest Ecology and Management 174,265–279.
Nakamura, F., Kameyama, S., Mizugaki, S., 2004. Rapid shrinkageof Kushiro Mire, the largest mire in Japan, due to increasedsedimentation associated with land-use development in thecatchment. Catena 55 (2), 213–229.
Piao, S.L., Fang, J.Y., Zhou, L.M., Ciais, P., Zhu, B., 2006. Variationsin satellite-derived phenology in China’s temperatevegetation. Global Change Biology 12 (4), 672–685.
Pozdnyakova, L., Oudemans, P.V., Hughes, M.G., Gimenez, D.,2002. Estimation of spatial and spectral properties ofphytophthora root rot and its effects on cranberry yield.Computers and Electronics in Agriculture 37, 57–70.
Ramırez-Garcıa, P., Lopez-Blanco, J., Ocana, D., 1998. Mangrovevegetation assessment in the Santiago River Mouth, Mexico,by means of supervised classification using Landsat TMimagery. Forest Ecology and Management 105 (1–3),217–229.
Roberts, D.A., Keller, M., Soares, J.V., 2003. Studies of land-cover,land-use, and biophysical properties of vegetation in theLarge Scale Biosphere Atmosphere experiment in Amazonia.Remote Sensing of Environment 87 (4), 377–388.
Schmidt, K.S., Skidmore, A.K., 2003. Spectral discrimination ofvegetation types in a coastal wetland. Remote Sensing ofEnvironment 85 (1), 92–108.
Schowengerdt, R.A., 1997. Remote Sensing: Models and Methodsfor Imagery Processing, 2nd ed. Academic Press.
Takeuchi, W., Tamura, M., Yasuoka, Y., 2003. Estimation ofmethane emission from West Siberian wetland by scaling
technique between NOAA AVHRR and SPOT HRV. RemoteSensing of Environment 85 (1), 21–29.Teal, J.M., Weinstein, M.P., 2002. Ecological engineering, design,and construction considerations for marsh restorations inDelaware Bay, USA. Ecological Engineering 18, 607–618.
3 5 ( 2 0 0 9 ) 487–496
Teal, J.M., Weishar, L., 2005. Ecological engineering, adaptivemanagement, and restoration management in Delaware Baysalt marsh restoration. Ecological Engineering 25, 304–314.
Tilley, D.R., Ahmed, M., Son, J.H., Badrinarayanan, H., 2003.Hyperspectral reflectance of emergent macrophytes as anindicator of water column ammonia in an oligohaline,subtropical marsh. Ecological Engineering 21 (2–3), 153–163.
Tiner, R.W., 2004. Remotely-sensed indicators for monitoring thegeneral condition of “natural habitat” in watersheds: anapplication for Delaware’s Nanticoke River watershed.Ecological Indicators 4 (4), 227–243.
Tucker, C., Pinzon, J., Brown, M., Slayback, D., Pak, E., Mahoney, R.,Vermote, E., El Saleous, N., 2005. An extended AVHRR 8-knNDVI dataset compatible with MODIS and SPOT vegetationNDVI data. International Journal of Remote Sensing 26 (20),1198–4485.
Varnell, L.M., Evans, D.A., Havens, K.J., 2003. A geomorphologicalmodel of intertidal cove marshes with application to wetlandsmanagement. Ecological Engineering 19, 339–347.
Vasconcelos, M.J.P., Biai, J.C.M., Araujo, A., Diniz, M.A., 2002. Landcover change in two protected areas of Guinea-Bissau(1956–1998). Applied Geography 22 (2), 139–156.
Wang, L., Sousa, W.P., Gong, P., Biging, G.S., 2004. Comparison ofIKONOS and QuickBird imagery for mapping mangrovespecies on the Caribbean coast of Panama. Remote Sensing ofEnvironment 91, 432–440.
Wang, Z.M., Zhang, B., Zhang, S.Q., Li, X.Y., Liu, D.W., Song, K.S.,Li, J.P., Li, F., Duan, H.T., 2006. Changes of land use and ofecosystem service values in Sanjiang Plain, northeast China.Environmental Monitoring and Assessment 112, 69–91.
Wentz, E.A., Stefanov, W.L., Gries, C., Hope, D., 2006. Landuse andland cover mapping from diverse data sources for an aridurban environments. Computers, Environment and UrbanSystems 30, 320–346.
Willis, J.M., Hester, M.W., Shaffer, G.P., 2005. A mesocosmevaluation of processed drill cuttings for wetland restoration.Ecological Engineering 25, 41–50.
Zhao, B., Kreuter, U., Li, B., Ma, Z.J., Chen, J.K., Nakagoshi, N., 2004.An ecosystem service value assessment of land-use change
on Chongming Island, China. Land Use Policy 21 (2),139–148.Zhou, G., 1995. Influences of tropical forest changes onenvironmental quality in Hainan province, P.R. of China.Ecological Engineering 4, 223–229.