kri - #networkednation - khazanah research institute
TRANSCRIPT

#NetworkedNation
NAVIGATING CHALLENGES, REALISING OPPORTUNITIES
OF DIGITAL TRANSFORMATION


#NetworkedNation
NAVIGATING CHALLENGES, REALISING OPPORTUNITIES
OF DIGITAL TRANSFORMATION

ii KHAZANAH RESEARCH INSTITUTE
©2021 Khazanah Research Institute June 2021 #NetworkedNation: Navigating Challenges, Realising Opportunities of Digital Transformation – Kuala Lumpur, Malaysia: Khazanah Research Institute This work is available under the Creative Commons Attribution 3.0 Unported license (CC BY3.0) http://creativecommons.org/licenses/by/3.0/. Under the Creative Commons Attribution license, you are free to copy, distribute, transmit, and adapt this work, including for commercial purposes, under the following attributions: Attribution – Please cite the work as follows: Khazanah Research Institute. 2021. #NetworkedNation: Navigating Challenges, Realising Opportunities of Digital Transformation. Kuala Lumpur: Khazanah Research Institute. License: Creative Commons Attribution CC BY 3.0. Translations – If you create a translation of this work, please add the following disclaimer along with the attribution: This translation was not created by Khazanah Research Institute and should not be considered an official Khazanah Research Institute translation. Khazanah Research Institute shall not be liable for any content or error in this translation. Published June 2021. Published by Khazanah Research Institute at Level 25, Mercu UEM, Jalan Stesen Sentral 5, Kuala Lumpur Sentral 50470 Kuala Lumpur, Malaysia. Phone: +603 2034 000; fax: +603 2265 0088; email: [email protected] All queries on rights and licenses should be addressed to the Chairman’s Office, Khazanah Research Institute at the address stated above. Information on Khazanah Research Institute publications and digital products can be found at www.KRInstitute.org Cover artwork from Shutterstock
KHAZANAH RESEARCH INSTITUTE iii
The chapters of this book were written by members of the #NetworkedNation research team,
comprising researchers and interns of the Khazanah Research Institute (KRI): Dr Rachel Gong,
Amos Tong, Ashraf Shaharudin, Claire Lim, Emir Izat Abdul Rashid, Gregory Ho Wai Son, Hui San
Chiam, Muhammad Nazhan Kamaruzuki, Shenyi Chua and Tan Zhai Gen. The editorial team
comprised Dr Rachel Gong, Ashraf Shaharudin and Nazihah Muhamad Noor.
This book was authorised for publication by the Board of Trustees of KRI, namely Tan Sri Nor
Mohamed Yakcop, Datuk Shahril Ridza Ridzuan and Datuk Hisham Hamdan.
ACKNOWLEDGEMENTS
Chapter 1 – Digital Inclusion: Assessing Meaningful Internet Connectivity in Malaysia
The author would like to thank Hady Hud, Dr Nungsari Ahmad Radhi, Rinalia Abdul Rahim and
reviewers from Bank Negara Malaysia for their valuable comments. The author is also grateful
for the research assistance provided by Shariman Arif Mohamad Yusof, Ashraf Shaharudin, Amos
Tong, Anne Sharmila Selvam, Claire Lim, Emir Izat Abdul Rashid and Shenyi Chua. The author
would like to gratefully acknowledge the data shared by Bank Negara Malaysia, Pos Malaysia
Berhad and Telekom Malaysia Berhad.
Chapter 2 – The Quality of Mobile Broadband and Key Policy Recommendations
The author would like to thank Mohd Amirul Rafiq Abdul Rahim, Theebalakshmi Kunasekaran, Ir
Dr Khairayu Badron and Dr Mohamed Awang Lah for their valuable comments. Further thanks
are extended to the participants of the internet speed experiment conducted by the author.
Chapter 3 – Digital Platform Work: How Digital Access and Competencies Affect Job-
Seeking
The authors would like to thank Siti Aiysyah Tumin, Amanina Abdur Rahman, Mohd Redzuan
Affandi Abdul Rahim and Syuibah Abirah Mohamed Tarmizi for their valuable comments. The
authors are also grateful for the research assistance provided by Amos Tong. The authors would
like to gratefully acknowledge the data shared by the Malaysia Digital Economy Corporation
(MDEC).
Chapter 4 – Digitalisation of Firms: Challenges in the Digital Economy
The authors would like to thank Aidonna Jan Ayub, Siti Aiysyah Tumin, Tan Zhai Gen and
reviewers at the LSE Saw Swee Hock Southeast Asia Centre (LSE SEAC) for their valuable
comments.
Chapter 5 – Open Government Data in Malaysia: Principles, Benefits, Challenges and The
Way Forward
The author would like to thank Adam Manaf Mohamed Firouz, Chee Yoke Ling, Kuang Keng Kuek
Ser, Khairil Yusof, Dr Lim Chee Han, Nur Thuraya Sazali, Puteri Marjan Megat Muzafar, Siti Aiysyah
Tumin, Dr Sonny Zulhuda, Mohd Amirul Rafiq Abdul Rahim, Sri Murniati and Yin Shao Loong for
their valuable comments. Special thanks to the Malaysian Administrative Modernisation and
Management Planning Unit (MAMPU), particularly Dr Fazidah Abu Bakar, Zuraidah Abdul
Rahman and Zulkfli Ahmad, and the Malaysia Open Science Platform (MOSP), particularly Dr
Nuzatil Sharleeza, for helping the author to understand better the landscape and challenges of
open government data in Malaysia.

iv KHAZANAH RESEARCH INSTITUTE
Chapter 6 – Personal Data Privacy: Surveillance and Security
The authors would like to thank Ashraf Shaharudin, Muhammad Nazhan Kamaruzuki, Nazihah
Muhamad Noor, Amos Tong, John Loh, Rueben Ananthan Santhana Dass and Dr Mary Beth Altier
for their valuable comments.
Chapter 7 – Digital Governance: Classification of Information Disorder
The authors would like to thank Prof. Rosa M. Benito, Harris Zainul, Gayathry Venkiteswaran,
Adam Manaf Mohamed Firouz and Nazihah Muhamad Noor for their valuable comments. The
authors would like to gratefully acknowledge the research assistance from Amos Tong, Shenyi
Chua, Goh Ming Jun, Lai Kah Chun, Timothy Chan Ying Jie and Wan Amirah Wan Usamah.
Chapter 8 – Artificial Intelligence in the Courts: AI Sentencing in Sabah and Sarawak
The authors would like to thank Aidonna Jan Ayub, Ong Kar Jin and representatives of the courts
of Sabah and Sarawak and SAINS for their valuable comments.
The team wishes to acknowledge the help and contributions from our colleagues: Anne Sharmila
Selvam, Mohd Amirul Rafiq Abdul Rahim, Shariman Arif Mohamad Yusof and Theebalakshmi
Kunasekaran for their research assistance; Adam Manaf Mohamed Firouz, Hazman Azim Mokhtar
and Ilyana Syafiqa Mukhriz Mudaris for their assistance in the preparation of the book; Hazilah
Abdul Karim, Nicholas Khaw and Siti Najyah Johar Salim from the Chairman’s Office for their
operational support; and the many others whose interactions with us have directly or indirectly
inspired us in shaping our research.
Finally, we would like to acknowledge Tan Sri Nor Mohamed Yakcop, Chairman of KRI for
supporting and encouraging the team to pursue digital policy research in KRI. We would also like
to express our appreciation to Dr Jomo Kwame Sundaram, Senior Research Advisor of KRI, for his
advice and insight throughout the course of this research project.
While we have benefited tremendously from insights from various individuals and organisations
in our research, any fault lies with the authors.

KHAZANAH RESEARCH INSTITUTE v
CONTENTS
INTRODUCTION 1
CHAPTER 1
By Rachel Gong
DIGITAL INCLUSION: ASSESSING
MEANINGFUL INTERNET CONNECTIVITY
IN MALAYSIA 65
CHAPTER 2
By Muhammad Nazhan Kamaruzuki
THE QUALITY OF MOBILE BROADBAND
AND KEY POLICY RECOMMENDATIONS 639
CHAPTER 3
By Tan Zhai Gen and Rachel Gong
DIGITAL PLATFORM WORK: HOW DIGITAL
ACCESS AND COMPETENCIES AFFECT JOB-
SEEKING 66
CHAPTER 4
By Amos Tong and Rachel Gong
DIGITALISATION OF FIRMS: CHALLENGES
IN THE DIGITAL ECONOMY 91
CHAPTER 5
By Ashraf Shaharudin
OPEN GOVERNMENT DATA IN MALAYSIA:
PRINCIPLES, BENEFITS, CHALLENGES AND
THE WAY FORWARD 103
CHAPTER 6
By Rachel Gong, Shenyi Chua and Hui San Chiam
PERSONAL DATA PRIVACY:
SURVEILLANCE AND SECURITY 136
CHAPTER 7
By Gregory Ho Wai Son and Emir Izat Abdul
Rashid
DIGITAL GOVERNANCE: CLASSIFICATION
OF INFORMATION DISORDER 152
CHAPTER 8
By Claire Lim and Rachel Gong
ARTIFICIAL INTELLIGENCE IN THE
COURTS: AI SENTENCING IN SABAH
AND SARAWAK 187
AFTERWORD 198


1 KHAZANAH RESEARCH INSTITUTE
INTRODUCTION
“It is time to stop debating whether the
[i]nternet is an effective tool for political
expression, and to move on to the much more
urgent question of how digital technology can
be structured, governed, and used to
maximize the good it can do in the world and
minimize the evil.”
Rebecca Mackinnon1
1 Mackinnon, Rebecca. 2012. Consent of the Networked: The Worldwide Struggle for Internet Freedom. New York: Basic
Books Inc, Division of Harper Collins. https://dl.acm.org/doi/10.5555/2222824.

KHAZANAH RESEARCH INSTITUTE 2
INTRODUCTION
When this research project was conceived in 2019, our team of policy researchers recognised the
growing importance of digital technologies in Malaysia. As the country progressed in its efforts to
develop 5G infrastructure, digitalise systems operations and automate the workforce, it would
need digital policies that could maximise the potential of new applications and govern the
responsible use of data and technology.
Little did we know how the Covid-19 pandemic that began in 2020 would both accelerate and
expand digital adoption and our reliance on digital tools, extending to remote education at
primary school level, enabling microenterprises such as home bakeries to survive and allowing
people to check in with loved ones when we could not cross state borders.
The digital policy questions raised when we began the project remain pressing concerns for the
nation, even as we move into the next normal where digital connectivity and technologies are
more essential to social, economic and political life. In fact, we begin to see new policy questions
emerge as we grapple with the implications of having a connection that is “always on” and
technology that is constantly monitoring us and collecting data on us.
This book is a compilation of our efforts to tackle some of these questions, comprising research
published in stand-alone form from September 2020 till April 2021. It is a snapshot along the path
of Malaysia’s digital transformation, intended as a reference for researchers, policymakers and
anyone interested in digital issues. We acknowledge that technology progresses, or at least
changes, faster than research, policies or law, so the specifics of the statistics and examples used
may soon be obsolete, if they are not already. Nonetheless, fundamental policy issues improving
governance and addressing inequalities remain worth considering.
Digital inclusion was a policy objective from the start of the project. We posited that the digital
divide was, like income inequality and educational opportunity, an inequity that needed
immediate attention. Left unaddressed, lack of meaningful access to digital connectivity and
competencies would exacerbate existing socio-economic inequalities. Admittedly, it is a challenge
to conclusively determine whether it is digital inequalities that make socio-economic inequalities
worse or socio-economic inequalities that make digital inequalities worse. But the two go hand
in hand, making closing the digital divide a desirable policy outcome.
The first four chapters in this book address various aspects of digital inclusion. Chapter 1, Digital
Inclusion: Assessing Meaningful Internet Connectivity in Malaysia, explores the digital divide in
Malaysia by examining three aspects of digital inequalities from a demand-side perspective: first,
internet penetration rates (access); second, data pricing (affordability); and third, several ways
in which Malaysians use the internet (application). The chapter also discusses why closing the
digital divide requires more than just technical solutions and offers some policy considerations
for meaningful connectivity and digital inclusion.
Chapter 2, The Quality of Mobile Broadband and Key Policy Recommendations, examines mobile
broadband performance in Malaysia, highlighting the differences in service provider-reported
versus user-experienced download speeds. The chapter discusses raising minimum standards for
broadband and strategic use of the Universal Service Provision fund as ways to improve
infrastructure development and service provision.
INTRODUCTION
3 KHAZANAH RESEARCH INSTITUTE
In Chapter 3, Digital Platform Work: How Digital Access and Competencies Affect Job-seeking, we
turn our attention to platform economies by studying the demographics of digital platform job-
seekers in Malaysia and how digital access and competencies influence job-seeking activity in the
digital job market. The chapter suggests that besides policies to close the digital divide, improved
labour policies and social protections are also needed to support the growing platform economy.
Digital inclusion goes beyond individuals and households. Chapter 4, Digitalisation of Firms:
Challenges in the Digital Economy, identifies challenges that firms, especially micro-, small- and
medium-sized enterprises, face in digitalising their operations and argues that policies should be
developed to encourage universal digitalisation by businesses to bridge the digital divide
between firms and to prevent large platforms from monopolising the market.
Our second policy objective was to examine good digital governance. Digital technologies both
consume and produce vast quantities of data. Big data analysis and predictive algorithms are now
a big part of our daily lives, both online and offline. Complex analysis is used to predict what kind
of restaurants we may want to order from, so that they can be prioritised in a customised “just
for you” recommendation on an app. Hidden biases in data, such as race, are turning out to have
a larger predictive effect than anticipated, for example, in hiring software that filters CVs and job
applications. Data may have been first commodified by the private sector, but the public sector
will find data increasingly necessary to deliver services. The use of data to develop digital or data
intelligence requires good governance to ensure equitable, non-exploitative use of data in the
public interest.
The final four chapters of this book address various aspects of digital governance. Chapter 5, Open
Government Data In Malaysia: Principles, Benefits, Challenges and The Way Forward, summarises
an extensive research and policy agenda to make public data open by default. The chapter
provides an overview of important features of open government data, discusses the benefits of
open government data and reviews the challenges in establishing an open government data
ecosystem in Malaysia. It then proposes actionable items for policymakers to consider, including
enacting a Right to Information law, streamlining government data policy, improving data privacy
and security protection and facilitating inclusive and meaningful use of government data.
Chapter 6, Personal Data Privacy: Surveillance and Security, presents a different set of data
concerns by focusing on the collection and use of personal data. It describes the ways in which
unregulated constant tracking by digital platforms extract not only personal data but also
behavioural surplus from platform users. Behavioural surplus is data generated as a by-product
of particular digital behaviour. Like body language, behavioural surplus adds to digital behaviour
details such as the time or place a digital action was taken, whose wide use in predictive
algorithms has largely gone unregulated by governments. Left unchecked, these algorithms can
go from predictive to manipulative.

INTRODUCTION
KHAZANAH RESEARCH INSTITUTE 4
In Chapter 7, Digital Governance: Classification of Information Disorder, we turn our attention to
yet another concern in our interactions with data, exploring the problem of information disorder,
that is, how information can be distorted. The chapter raises questions of how false and/or
malicious information can be classified, spotted, and rectified. Although the case study is specific
to Covid-19, the principles of identifying information disorder, fact-checking information and
establishing reliable networks of information sharing can have broad application to other forms
of news and information flow.
Finally, Chapter 8, Artificial Intelligence in the Courts: AI Sentencing in Sabah and Sarawak, uses
the application of AI in court sentencing for cases of drug possession and rape as a case study to
explore the challenges and ethics of AI. Besides identifying potential sources of bias in AI systems,
the chapter reviews efforts undertaken by the courts of Sabah and Sarawak to mitigate risks of
bias in their AI application.
The topics contained in this book are not intended to be comprehensive, but as a starting point
for further discussion and research on digital policy concerns of the nation. We hope that readers
will find our discussions useful and that researchers will be able to build upon this body of work
as Malaysia continues on its journey of digital transformation.
Dr Rachel Gong
On behalf of the KRI Networked Nation team
June 2021

5 KHAZANAH RESEARCH INSTITUTE
CHAPTER
01 DIGITAL INCLUSION: ASSESSING MEANINGFUL INTERNET CONNECTIVITY IN MALAYSIA
1.1 Introduction 6
1.2 What is the digital divide? 7
1.2.1 What is meaningful connectivity? 8
1.2.2 How is broadband defined? 9
1.3 Assessing access 12
1.3.1 Global comparison: internet penetration statistics 12
1.3.2 National demographics: internet penetration by gender and age 13
1.3.3 State subscription rates: trends in fixed and mobile broadband 15
1.4 Assessing affordability 18
1.4.1 Absolute pricing: how much does internet access cost in Malaysia? 19
1.4.2 Relative pricing: is internet access affordable in Malaysia? 20
1.5 Assessing application 22
1.5.1 What are Malaysians doing online? 22
1.5.2 Communication, social networks and video streaming 23
1.5.3 Online banking 24
1.5.4 Online shopping 25
1.6 Further research and policy considerations 26
1.6.1 What is digital inclusion? 27
1.7 Conclusion 31
1.8 Postscript 31
Appendix 1.1: Data pricing calculations 32
References 34

KHAZANAH RESEARCH INSTITUTE 6
DIGITAL INCLUSION: ASSESSING MEANINGFUL INTERNET
CONNECTIVITY IN MALAYSIA2
By Rachel Gong
“The fight for the web is one of the most important causes of our time. Today [in 2019], half
of the world is online. It is more urgent than ever to ensure the other half are not left behind
offline, and that everyone contributes to a web that drives equality, opportunity and
creativity.”
Sir Tim Berners-Lee3
Introduction
Sabahan student Veveonah Mosibin made international headlines4 in June 2020 when her video
of spending 24 hours in a tree to take her online examinations went viral. The Malaysian
Communications and Multimedia Commission (MCMC) responded by releasing a statement
indicating that plans had been made to build a new telecommunications tower5 where she lived,
which would improve the 3G coverage and service in the area, and to upgrade coverage in the
area to 4G under the Universal Service Provision (USP) fund.
Considering that Malaysia’s national internet penetration rates are well over 100%, indicating
that the average Malaysian has at least one way of accessing the internet, and that internet
penetration in Sabah in 2019 was 80.7%6, is Veveonah’s story an outlier, or is it indicative of a
deeper structural inequality masked by macro-statistics?
This chapter explores the digital divide in Malaysia by examining three aspects of digital
inequalities from a demand-side perspective: first, internet penetration rates (access); second,
data pricing (affordability); and third, several ways in which Malaysians use the internet
(application). The chapter also discusses why closing the digital divide requires more than just
technical solutions and offers some research and policy considerations regarding meaningful
connectivity and digital inclusion.
2 An earlier version of this chapter authored by Rachel Gong was published by KRI on 7 September 2020 as a Discussion
Paper titled “Digital Inclusion: Assessing Meaningful Internet Connectivity in Malaysia”. 3 webfoundation (2019) 4 BBC (2020) 5 MCMC (2020b) 6 MCMC (2020a)

CHAPTER 1
DIGITAL INCLUSION: ASSESSING MEANINGFUL INTERNET CONNECTIVITY IN MALAYSIA
7 KHAZANAH RESEARCH INSTITUTE
Even before the Covid-19 pandemic created pressures to accelerate nationwide digitalisation,
Malaysia was well on its path of digital transformation. The National Fiberisation and
Connectivity Plan (NFCP) had been established, aiming to “put in place robust, pervasive, high
quality and affordable digital connectivity throughout the country”7. Efforts to improve digital
financial services and go cashless saw the average Malaysian making 150 e-payment transactions
in 2019, compared to just 83 in 20158, and schools and universities were trying out online classes
in line with the National e-Learning Policy 2.09. The pandemic has accelerated this process, and it
is imperative that efforts to develop a digital economy do not neglect the fundamentals of a digital
society, namely meaningful connectivity and digital inclusion.
Box 1.1: Definitions of digitisation, digitalisation and digital transformation
• Digitisation: the process of making a digital (i.e. electronic) version of something
analogue, e.g. scanning a document or converting a paper ledger into an electronic
spreadsheet.
• Digitalisation: the process “in which many domains of social life are restructured around
digital communication and media infrastructures”10. This process changes the world of
work, making “the acquisition of digital skills…a prerequisite for individual, industry, and
regional success”11 e.g. automated filtering of resumes and first-round interviews taking
place via video-conferencing.
• Digital transformation: the process of technological adoption and cultural change that
have broader socio-technological implications, e.g. influencers on social media becoming
primary news sources as paid print journalism declines.
What is the digital divide?
Research on digital inequalities in the late 1990s and early 2000s described a “digital divide” that
was primarily focused on digital inequalities in terms of internet access12. As internet connectivity
spread quickly in developed nations and the digital divide closed, at least in terms of access,
researchers turned their attention to other areas of digital inequalities, such as affordability,
quality of service and digital literacy13.
7 MCMC (n.d.) 8 Author’s correspondence with Bank Negara Malaysia (BNM) 9 MOHE (n.d.) 10 Brennen and Kreiss (2016) 11 Muro et al. (2017) 12 DiMaggio, Hargittai, Celeste, et al. (2001), Robinson et al. (2015) 13 Hargittai, Piper, and Morris (2018)
CHAPTER 1
DIGITAL INCLUSION: ASSESSING MEANINGFUL INTERNET CONNECTIVITY IN MALAYSIA
KHAZANAH RESEARCH INSTITUTE 8
Most of this early research used socio-economic factors such as income and educational
attainment to predict internet use14, but as access became more ubiquitous, researchers flipped
their models and began to use internet access as a predictor of socio-economic and socio-political
outcomes. Initially, research indicated that people who were better off were more likely to use
the internet. Later research indicated that people who used the internet were likely to improve
their life outcomes, leading to a reinforcing cycle that could worsen existing inequalities.
Studies have shown, broadly speaking, that increases in internet accessibility are positively
associated with improvements in socio-economic outcomes, such as educational attainment, job
opportunities15, political engagement16 and health literacy17. These positive relationships have
been found not just in countries with developed infrastructure but in developing countries as
well.
As more and more of society’s functions become dependent on internet connectivity and
computer processing power, the debate continues as to whether digital inequalities are the result
of existing socio-economic inequalities or the cause of continued and worsened social
inequalities. These are not mutually exclusive explanations, but both point towards the same
policy implication—that one of the priorities of digital policy should be universal, affordable high-
speed internet access.
In 2016, the United Nations (UN) affirmed “the importance of applying a comprehensive human
rights-based approach in providing and in expanding access to Internet and request[ed] all States
to make efforts to bridge the many forms of digital divide”18. The UN declared internet access a
human right and several countries such as Costa Rica, Finland, Greece and India have made it a
legal requirement that all their citizens have access to the internet. This does not mean that
service is provided at no cost; rather it means that government policy values internet access as a
public utility, like water and electricity.
1.2.1. What is meaningful connectivity?
An important shift in the conversation on the digital divide is a move away from a binary view of
internet access and towards a spectrum measuring multidimensional aspects of meaningful
connectivity. The UN’s Broadband Commission for Sustainable Development defines meaningful
universal connectivity as “broadband adoption that is not just available, accessible, relevant and
affordable, but that is also safe, trusted, empowering users and leading to positive impact”19.
The Alliance for Affordable Internet (A4AI) has proposed a meaningful connectivity standard that
takes into account four dimensions, as shown in Table 1.1.
14 Howard, Busch, and Sheets (2010), Willis and Tranter (2006) 15 DiMaggio and Bonikowski (2008), Hjort and Poulsen (2019), Kuhn and Mansour (2014) 16 Samsudin A. Rahim (2018) 17 Neter and Brainin (2012) 18 UNHRC (2016) 19 ITU (2019)

CHAPTER 1
DIGITAL INCLUSION: ASSESSING MEANINGFUL INTERNET CONNECTIVITY IN MALAYSIA
9 KHAZANAH RESEARCH INSTITUTE
Table 1.1 Four dimensions of meaningful connectivity
Dimension of internet access Minimum threshold
Regular internet use Daily use
An appropriate device Access to a smartphone
Enough data An unlimited broadband connection at home or a place of work or study
A fast connection 4G mobile connectivity
Source: A4AI (2020)
Usage of this standard would mean that instead of evaluating the digital divide in terms of a single
binary measure of internet penetration, policymakers would assess progress to reduce the divide
along these four dimensions. At the time of writing, this standard has been tested in Colombia,
Ghana and Indonesia20.
1.2.2. How is broadband defined?
One of the difficulties in assessing the extent of the digital divide lies in the ways that terms are
defined and measured. For starters, the definition of broadband internet, which is commonly
understood to mean a high-speed connection that is always available (as compared to the early
days of the internet when users had to manually dial in each time they wanted to connect), is
inconsistently specified.
The International Telecommunication Union (ITU), a UN agency, in 2003 defined broadband as a
combination of connection capacity and speed, “at 1.5 or 2.0 Mbps”21. In 2018, this definition was
revised to “access in which the connection(s) capabilities support data rates greater than 2
Mbps”22. The United States of America’s Federal Communications Commission (FCC), in its 2018
Broadband Deployment Report, defined broadband connections as having a minimum 25Mbps
download speeds and 3Mbps upload speeds23.
The Malaysian government, in its National Broadband Initiative (NBI) in 2010, defined broadband
along two categories: broadband to high impact economic areas and businesses with a minimum
speed of 10Mbps and broadband to the general population with average speeds of 2Mbps24. The
NFCP has set a target for internet service providers to deliver average speeds of 30Mbps for
download and 10Mbps for upload25. The definitions used in this chapter follow the 2019 MCMC
specifications of fixed broadband with speeds starting at 1Mbps and mobile broadband with
speed starting at 650kbps26.
20 A4AI (2020) 21 ITU (2003) 22 ITU (2018) 23 FCC (2018) 24 MCMC (2010) 25 MCMC (n.d.) 26 MCMC (2020a)

CHAPTER 1
DIGITAL INCLUSION: ASSESSING MEANINGFUL INTERNET CONNECTIVITY IN MALAYSIA
KHAZANAH RESEARCH INSTITUTE 10
Broadband can be further divided into fixed broadband and mobile broadband, as illustrated in
Figure 1.1. Fixed broadband refers to a connection tied to an unmoving location, for example, at
home, school or the office. Mobile broadband refers to a connection that is portable, usually
associated with a SIM card and accessed via a smartphone.
Figure 1.1: Broadband classification
Source: Author’s visualisation
Mobile broadband can be classified according to what generation of development it belongs to.
For simplicity, the following classifications are based on only the data transfer capabilities of each
generation. The first generation of mobile technology was analogue, that is, voice only. The second
generation (2G) allowed mobile users to transfer small bits of digital data, typically via text
messages; 3G allowed mobile users to transfer data at up to speeds of 21.6Mbps although in
practice speeds of 2Mbps were the norm. 4G was a big jump up from 3G, with speeds theoretically
able to reach over 100Mbps, and 5G is expected to jump an even bigger order of magnitude, with
data transfer speeds reaching over 1Gbps.
Until 5G infrastructure is widely installed and compatible devices reach the consumer market at
affordable prices, the average mobile broadband user will be limited to 3G or 4G service, which is
generally enough for typical consumer use such as checking email and social media, streaming
audio or video, or playing games. Table 1.2 summarises the development of internet service
provision in Malaysia.

CHAPTER 1
DIGITAL INCLUSION: ASSESSING MEANINGFUL INTERNET CONNECTIVITY IN MALAYSIA
11 KHAZANAH RESEARCH INSTITUTE
Table 1.2: A brief history of internet service provision in Malaysia
1985 The Malaysian Institute of Microelectronics System (MIMOS) is established as Malaysia’s first
internet service provider (ISP)a
1986 Rangkaian Komputer Malaysia (RangKom) is set up between academic institutionsa
1991 JARING (Joint Advanced Integrated Networking) is launched as a separate entity which absorbed
RangKom and commercialised Internet accessb
1992 A satellite link is established between Malaysia and the United States with speeds of 64kbpsb
1994 JARING upgraded the average connection speed in Malaysia to 1.5Mbps, accessible via fixed
telephone lines in 16 major citiesb
1996 Telekom Malaysia Berhad (TM) is awarded Malaysia’s second ISP license, established TMNetb
1998 TIME, Maxis, Mutiara (later known as Digi), Celcom and Prismanet received ISP licensesc
The government passed the Communications and Multimedia Act 1998 (CMA) and Malaysian
Communications and Multimedia Commission Act (1998), which established the Malaysian
Communications and Multimedia Commission (MCMC)d
The Universal Service Provision (USP) fund is established to fund infrastructure costs of the Rural
Broadband Initiative (RBB). ISPs contribute 6% of weighted net revenue to the USP funde
2001 TM launched Streamyx that provided national coverage and at a minimum speed of 384kpbsf
2008 The Government formed the Broadband Implementation Strategy in 2008 which consisted of two
key strands: High Speed Broadband (HSBB) and Broadband to the General Population (BBGP)h
Public-private partnership (PPP) is established with TM for HSBB Phase 1 to provide speeds of
10Mbps to 100Mbps in strategic areash
2010 The government launched the National Broadband Initiative (NBI)g
TM launched its HSBB service, Unifi, providing 48 exchange coverage areas across Malaysiag
2015 Further PPPs are developed for Phase 2 of HSBB and Sub-Urban Broadband Project (SUBB) to
upgrade copper lines and improve speeds in suburban areasi
2018 Mandatory Standard on Access Pricing (MSAP) is implemented to regulate wholesale prices of
broadbandj
The Ministry of Communications and Multimedia launched the National Fiberisation and
Connectivity Plan (NFCP) to further improve high-speed broadband coverage nationwidej
Source: aMohamed b. Awang-Lah (1987), bNorfaezah binti Abd Halim (2010), cMCMC (2015b), dMCMC (2016b), eMCMC (2006), fTelekom Malaysia (2002), gMCMC (2010a), hNor Akmar Shah Minan (2009), iTelekom Malaysia (2015), jRaju (2019)

CHAPTER 1
DIGITAL INCLUSION: ASSESSING MEANINGFUL INTERNET CONNECTIVITY IN MALAYSIA
KHAZANAH RESEARCH INSTITUTE 12
Assessing access
The first of the three aspects of the digital divide explored in this chapter is access, measured in
terms of internet penetration, user demographics and broadband subscription rates.
1.3.1. Global comparison: internet penetration statistics
According to the Department of Statistics (DOS), household internet use in Malaysia has increased
from 21% in 2009 to 90% in 201927. However, it is unclear from this statistic whether that refers
to a fixed connection or a mobile connection.
The MCMC reports slightly different statistics, indicating that broadband penetration rates per
100 inhabitants have increased from 17% in 2010 to 131% in 201928. In other words, for every
100 people in Malaysia, there are approximately 131 registered broadband subscriptions, most
of them in the form of SIM cards. It should be noted that this number is the sum of both fixed and
mobile subscriptions, which are not perfect substitutes. While it is highly likely that an individual
with a fixed broadband subscription also has a mobile broadband subscription, the reverse is not
as likely.
The DOS and MCMC numbers differ because of the distinct ways these agencies calculate internet
penetration. The DOS method employs a household survey in which respondents are asked
whether they used the internet in their household in the last three months. The MCMC method
takes the number of registered broadband accounts and divides it by the population of the
country, as estimated by DOS. Statistics from both agencies are reported to the ITU to evaluate
different measures of internet penetration. Table 1.3 compares Malaysia’s internet penetration
rates to selected countries in 2017 and 2018.
Malaysia outperforms the global average in terms of internet users and mobile broadband
penetration but falls behind in terms of fixed broadband penetration. Based on DOS’s 2018 figures
provided to the ITU, 81.2% of individuals in Malaysia use the internet, compared to a global
average of 73.6% across 82 reporting countries. The 2018 numbers MCMC provided to the ITU
supply further detail, indicating a fixed broadband penetration rate of 8.6%, compared to a global
average of 15.5% across 178 reporting countries, and a mobile broadband penetration rate of
134.5%, compared to a global average of 111.2% across 179 reporting countries. The statistics
indicate that mobile broadband is preferred over fixed broadband globally, even in countries with
developed fixed line infrastructure.
27 DOS (2012, 2020a) 28 MCMC (2010a, 2020a)

CHAPTER 1
DIGITAL INCLUSION: ASSESSING MEANINGFUL INTERNET CONNECTIVITY IN MALAYSIA
13 KHAZANAH RESEARCH INSTITUTE
Table 1.3: Malaysia’s internet penetration rates compared to selected countries, 2017, 2018
Country Internet users (%, 2017)
Internet users (%, 2018)
Fixed broadband (%, 2018)
Mobile broadband (%, 2018)
MALAYSIA 80.1 81.2 8.6 134.5
Selected benchmarks
South Korea 95.1 96.0 41.6 129.7
UK 94.6 94.9 39.6 118.4
US 87.3 - 33.8 129.0
Australia 86.5 - 30.7 113.6
China 54.3 - 28.5 115.5
India 34.5 - 1.3 86.9
Comparable GDP per capita
Kazakhstan 76.4 78.9 13.4 142.3
Poland 76.0 77.5 16.1 134.8
Mexico 63.9 65.8 14.6 95.2
Comparable population
Canada 91.0 - 39.0 89.6
Saudi Arabia 82.1 93.3 20.2 122.6
Ghana 39.0 - 0.2 137.5
Selected ASEAN
Singapore 84.4 88.2 28.0 148.8
The Philippines 60.0 - 3.7 126.2
Vietnam 58.1 70.3 13.6 147.2
Thailand 52.9 56.8 13.2 180.2
Indonesia 32.3 39.9 3.3 119.3
Note: Hyphen “-” indicates no data available.
Source: ITU (2019)
1.3.2. National demographics: internet penetration by gender and age
Figure 1.2 shows the proportion of women in the Malaysian population and the proportion of
female internet users from 2012 to 2018. The proportion of women in the population remains
steady around 48.0%, but the proportion of female internet users declined over time from 43.6%
to 41.0%. This is a worrying trend as it indicates a possible increase in the digital gender divide.
The digital gender divide is not limited to Malaysia. Across the 100 countries, including Malaysia,
assessed in the Inclusive Internet Index 2020, men are 12.9% more likely than women to have
internet access29. The index indicates that this digital gender gap becomes wider as income levels
and women’s participation in the labour force decrease. An expert survey conducted by the A4AI
and the World Wide Web Foundation in 2018 found that Malaysia had a gender-responsive
broadband policy in place, which included “gender-specific targets for internet access and digital
skills training, with adequate budget set aside to implement the policy”30. The implementation
and outcomes of this policy will need to be evaluated to determine its effectiveness.
29 EIU (2020) 30 webfoundation (2018)

CHAPTER 1
DIGITAL INCLUSION: ASSESSING MEANINGFUL INTERNET CONNECTIVITY IN MALAYSIA
KHAZANAH RESEARCH INSTITUTE 14
Figure 1.2: Percentage of women in Malaysia vs
internet users
Figure 1.3: Percentage of population aged >50 in
Malaysia vs internet users
Source: DOS population estimates, MCMC Internet Users Survey 2012, 2014, 2016, 2018
Figure 1.3 shows the proportion of the Malaysian population aged 50 and above and the
proportion of internet users in this age group from 2012 to 2018. This proportion of this age
group in the general population increased slightly from 17.2% to 19.3% during this time period,
but the proportion of internet users in this age group increased much more rapidly from 4.2% to
16.0% as internet usage increases overall.
While those in their 20s continue to form the biggest age group among internet users, data
suggest that the digital age gap is closing. The age of the average internet user in Malaysia
increased from 29.7 years in 2012 to 36.2 years in 201831. As the time period under analysis is
just 2012 – 2018, this effect is likely not only due to internet users moving up into the next age
group, but also likely indicates that more seniors are coming online.
On the one hand, this is an encouraging finding, indicating that Malaysians of all ages are adopting
digital technologies. On the other hand, older internet users who have limited technological
exposure and experience may find themselves at greater risk of becoming victims of cybercrime,
especially fraud and scams, or distributors of misinformation on social media. Reports indicate
that there are seniors unfamiliar with terminology, including cashless and online payments who
are struggling to find appropriate education, guidance and support32. Seniors also report less
experience with computers, the internet and technology in general33. As such they could be
uncomfortable with the pace at which digital technology evolves and may be reluctant to try
relatively more complicated tools such as cashless online payment apps even as they embrace
social media and messaging apps34.
31 MCMC (2014, 2019b) 32 Wong et al. (2018), Yaakob, Wan Hassan, and Daud (2016), Yeoh (2019) 33 Hui (2016) 34 Andalib and Hashim (2018), Wong et al. (2018)
0%
5%
10%
15%
20%
25%
30%
35%
40%
45%
50%
2012 2014 2016 2018
Population Internet Users
0%
5%
10%
15%
20%
25%
30%
35%
40%
45%
50%
2012 2014 2016 2018
Population Internet Users

CHAPTER 1
DIGITAL INCLUSION: ASSESSING MEANINGFUL INTERNET CONNECTIVITY IN MALAYSIA
15 KHAZANAH RESEARCH INSTITUTE
1.3.3. State subscription rates: trends in fixed and mobile broadband
The following figures show trends in broadband subscription rates at state-level from 2011 –
2019. Figure 1.4 shows state trends in broadband subscription rates while Figure 1.5 shows state
trends in mobile broadband subscription rates. Both figures are sorted in descending order of
fixed broadband subscription rates for ease of comparison.
Kuala Lumpur has the highest subscription rates among the states for both fixed and mobile
broadband. The fixed broadband subscription rate peaked in Kuala Lumpur in 2014 at 23.1% but
then declined as mobile broadband gained popularity. As at 2019, Kuala Lumpur, Selangor, Pulau
Pinang and Putrajaya outperform the national average in terms of fixed broadband subscription
rates.
Mobile broadband penetration in Kuala Lumpur is significantly higher than all the other states;
the mobile broadband subscription rate in Kuala Lumpur in 2019 is 249.6%, implying that, on
average, every resident has at least two SIM cards. There are at least two possible explanations
for this high number. First, Kuala Lumpur has a larger number of large firms that are likely to
register SIM cards for their employees’ work use. Second, the use of temporary prepaid SIM cards
by tourists may have inflated the subscription rates.
Overall trends show fixed broadband subscription rates remaining relatively flat over the years,
with a national rate of 9.0% in 2019 versus 7.6% in 2011. These statistics indicate that there are
approximately nine registered fixed broadband subscriptions for every 100 inhabitants.
However, since the average household size in Malaysia is 3.9 people35, it would be reasonable to
assume that approximately 35% of the population has access to a fixed broadband connection.
Mobile broadband subscription rates, on the other hand, show substantial growth beginning in
2015, which accounts for the steep growth from a national rate of 11.6% in 2011 to 122.7% in
2019. This growth can be attributed to at least three developments circa 2015. First, there was
the roll out of 4G beginning in 2013 that supplemented the migration from 2G to 3G, all of which
improved mobile broadband quality of service. Second, smartphones prices dropped, which made
them more widely affordable. Third, telephone companies (telcos) responded by heavily
promoting mobile data packages36.
35 DOS (2020b) 36 MCMC (2016)

CHAPTER 1
DIGITAL INCLUSION: ASSESSING MEANINGFUL INTERNET CONNECTIVITY IN MALAYSIA
KHAZANAH RESEARCH INSTITUTE 16
Figure 1.4: Fixed broadband subscription rates by state, 2011 – 2019
Ku
WP Kuala Lumpur
Selangor Pulau Pinang WP Putrajaya
Johor Melaka Negeri Sembilan
WP Labuan Perak Sarawak
Perlis Kedah Pahang
Terengganu Sabah Kelantan
Source: Author’s calculations based on MCMC data
0%
8%
16%
24%
2011 2013 2015 2017 2019
National
State
0%
8%
16%
24%
2011 2013 2015 2017 2019
0%
8%
16%
24%
2011 2013 2015 2017 2019
0%
8%
16%
24%
2011 2013 2015 2017 2019
0%
8%
16%
24%
2011 2013 2015 2017 20190%
8%
16%
24%
2011 2013 2015 2017 2019
0%
8%
16%
24%
2011 2013 2015 2017 2019
0%
8%
16%
24%
2011 2013 2015 2017 2019
0%
8%
16%
24%
2011 2013 2015 2017 2019
0%
8%
16%
24%
2011 2013 2015 2017 2019
0%
8%
16%
24%
2011 2013 2015 2017 2019
0%
8%
16%
24%
2011 2013 2015 2017 20190%
8%
16%
24%
2011 2013 2015 2017 2019
0%
8%
16%
24%
2011 2013 2015 2017 2019
0%
8%
16%
24%
2011 2013 2015 2017 2019
0%
8%
16%
24%
2011 2013 2015 2017 2019

CHAPTER 1
DIGITAL INCLUSION: ASSESSING MEANINGFUL INTERNET CONNECTIVITY IN MALAYSIA
17 KHAZANAH RESEARCH INSTITUTE
Figure 1.5: Mobile broadband subscription rates by state, 2011 – 2019
WP Kuala Lumpur
Selangor
Pulau Pinang
WP Putrajaya
Johor
Melaka
Negeri Sembilan
WP Labuan
Perak
Sarawak
Perlis
Kedah
Pahang
Terengganu
Sabah
Kelantan
Source: Author’s calculations based on MCMC data
0 %
50 %
100 %
150 %
200 %
250 %
2011 2013 2015 2017 2019
National
State
0
50
100
150
200
250
2011 2013 2015 2017 2019
0
50
100
150
200
250
2011 2013 2015 2017 2019
0
50
100
150
200
250
2011 2013 2015 2017 2019
0
50
100
150
200
250
2011 2013 2015 2017 2019
0
50
100
150
200
250
2011 2013 2015 2017 2019
0
50
100
150
200
250
2011 2013 2015 2017 2019
0
50
100
150
200
250
2011 2013 2015 2017 2019
0
50
100
150
200
250
2011 2013 2015 2017 2019
0
50
100
150
200
250
2011 2013 2015 2017 2019
0
50
100
150
200
250
2011 2013 2015 2017 20190
50
100
150
200
250
2011 2013 2015 2017 2019
0
50
100
150
200
250
2011 2013 2015 2017 2019
0
50
100
150
200
250
2011 2013 2015 2017 2019
0
50
100
150
200
250
2011 2013 2015 2017 20190
50
100
150
200
250
2011 2013 2015 2017 2019
250% 250% 250%
250% 250% 250%
250% 250% 250%
250% 250% 250%
250% 250% 250%

CHAPTER 1
DIGITAL INCLUSION: ASSESSING MEANINGFUL INTERNET CONNECTIVITY IN MALAYSIA
KHAZANAH RESEARCH INSTITUTE 18
Table 1.4 shows the states’ median household income and fixed and mobile broadband
subscription rates as at 2019, sorted by state median household incomes. States whose median
household income is above the national average are likely to have fixed and mobile broadband
subscription rates that also outperform the national average, although the direction of causality
cannot be conclusively determined. The data suggest that there is a significant positive
relationship between fixed broadband subscription rates and median household income, and that
this relationship is weaker between mobile broadband subscription rates and median household
income.
Table 1.4: Broadband subscription rates and median household incomes, by state, 2019
State Fixed broadband (%) Mobile broadband (%) Median household income (RM)
MALAYSIA 9.0 122.7 5,873
WP Kuala Lumpur 16.4 249.6 10,549
WP Putrajaya 12.5 102.1 9,983
Selangor 15.8 130.5 8,210
WP Labuan 8.1 107.8 6,726
Johor 9.9 142.0 6,427
Pulau Pinang 12.9 143.3 6,169
Melaka 9.9 116.3 6,054
Terengganu 4.7 96.4 5,545
Negeri Sembilan 9.0 137.4 5,005
Perlis 5.5 108.5 4,594
Sarawak 5.9 107.4 4,544
Pahang 4.7 102.3 4,440
Kedah 5.3 100.0 4,325
Perak 8.0 116.2 4,273
Sabah 3.1 82.0 4,235
Kelantan 2.5 93.0 3,563
Note: Figures diverge slightly from MCMC statistics due to rounding.
Source: Household Income Survey (HIS) 2019, author’s calculations based on MCMC 2020
Using Household Income Survey (HIS) data from 2012, 2014 and 2016, state median household
incomes and fixed broadband subscription rates, the latter lagged by a year, were found to be
positively correlated (r(46) = .72, p<.001) while state median household incomes and mobile
broadband subscription rates, also lagged by a year, were found to have a weaker positive
correlation, (r(46) = .59, p<.001).
Assessing affordability
The second of the three aspects of the digital divide explored in this chapter is data affordability,
measured using data pricing for both fixed and mobile broadband and considered in absolute and
relative terms.

CHAPTER 1
DIGITAL INCLUSION: ASSESSING MEANINGFUL INTERNET CONNECTIVITY IN MALAYSIA
19 KHAZANAH RESEARCH INSTITUTE
1.4.1. Absolute pricing: how much does internet access cost in Malaysia?
Mobile broadband plans are typically priced according to how much data is allocated over a fixed
period, e.g. 20GB per month. Fixed broadband plans are typically priced according to the speed
at which data are transferred, e.g. 100Mbps, and do not limit the amount of data transferred.
Figure 1.6: Mobile broadband prices per GB and subscription rates, 2012 – 2019
Source: Author’s calculations based on web and MCMC data
Figure 1.6 shows the absolute price per GB of mobile data from 2012 to 2019. As might be
expected, as the price of mobile data drops, the total number of mobile broadband subscriptions
increase. From 2012 to 201837, prepaid subscriptions comprised, on average, 79.4% of all mobile
broadband subscriptions. Prepaid subscriptions are slowly declining, making up 72.7% of all
mobile broadband subscriptions in 201838. Postpaid plans are generally better value than prepaid
plans, but usually require a payment commitment and come at higher prices.
Figure 1.7 shows the monthly price of a fixed broadband subscription with unlimited data from
2012 to 2019. Fixed broadband prices do not appear to have affected subscription rates very
much, even when the price of the cheapest unlimited data subscription dropped by about 40%
from 2016 to 2019. This decrease in price was partly attributable to the implementation of the
Minimum Standard on Access Prices (MSAP). The MSAP regulates the price of wholesale
broadband prices, effectively driving down the price of retail broadband.
37 2019 data were not available at the time of writing. 38 MCMC (2016, 2019)
0%
20%
40%
60%
80%
100%
120%
140%
RM0
RM5
RM10
RM15
RM20
RM25
RM30
RM35
RM40
2012 2013 2014 2015 2016 2017 2018 2019
Postpaid Price Prepaid Price Subscription Rate

CHAPTER 1
DIGITAL INCLUSION: ASSESSING MEANINGFUL INTERNET CONNECTIVITY IN MALAYSIA
KHAZANAH RESEARCH INSTITUTE 20
Figure 1.7: Fixed broadband prices and subscription rates, 2012 – 2019
Source: Author’s calculations based on web archive and MCMC data
Reports indicate that, as a result of the implementation of the MSAP, “demand for fixed residential
and commercial broadband services rose by 18 to 22 percent”39 from August 2018 to August 2019
and that “the number of fixed broadband subscription[s] with the uploading speed of more than
100 Mbps rose eight-fold to 1.2 million subscribers in 2018”40. However, the upgrade in quality
of service at lower prices does not necessarily correspond to an increase in the number of new
fixed broadband subscribers. As seen in Figure 1.7, the total number of fixed broadband
subscribers increased by approximately 10.2% from 2018 to 2019.
1.4.2. Relative pricing: is internet access affordable in Malaysia?
In order to close the affordability gap, it is necessary but not sufficient for absolute data pricing
to decrease over time. Internet access could remain at a relatively higher cost for low income
groups, hence the need to assess not just price, but price relative to income.
In addition to its proposed standards for meaningful connectivity, the A4AI also uses a “1 for 2”
measure to access affordability: “Affordable internet is where 1GB of mobile broadband data is
priced at 2% or less of average monthly income”41. This measure was adopted by the UN’s
Broadband Commission for Sustainable Development in 2018 as part of its goal to close the global
digital divide.
To assess whether broadband prices in Malaysia meet this affordability threshold, a variation of
the “1 for 2” measure was applied to the cheapest mobile data plans and to the cheapest unlimited
data fixed broadband plans available from 2012 to 2019. Median individual monthly income was
estimated and used for the calculation instead of gross national income per capita.
39 Bernama (2019) 40 Bernama (2019) 41 A4AI (2019)
0%
2%
4%
6%
8%
10%
12%
14%
16%
18%
20%
RM0
RM20
RM40
RM60
RM80
RM100
RM120
RM140
RM160
2012 2013 2014 2015 2016 2017 2018 2019
Price Subscription Rate

CHAPTER 1
DIGITAL INCLUSION: ASSESSING MEANINGFUL INTERNET CONNECTIVITY IN MALAYSIA
21 KHAZANAH RESEARCH INSTITUTE
Using this benchmark, Malaysia performs well in terms of mobile broadband affordability. In
2019, the price per GB of data for both prepaid and postpaid mobile broadband is less than 0.3%
of every state’s median individual monthly income with prepaid data being slightly more
expensive than postpaid data, as shown in Table 1.5. In Kelantan, where a mobile data plan is the
most expensive, relative to the rest of the country, 1GB of prepaid mobile data costs 0.25% of the
state’s median individual monthly income. This is well below the A4AI’s 2% affordability
threshold and indicates that mobile data in Malaysia is generally very affordable.
Fixed broadband data does not appear to be as affordable as mobile broadband data. Table 1.5
shows data pricing as a percentage of each state’s median individual monthly income in 2019.
Table 1.5: Data pricing as a percentage of median monthly individual income, 2019
State Prepaid mobile
(per GB)
Postpaid mobile
(per GB)
Fixed broadband
(per GB)
Fixed broadband
(unlimited data)
WP Kuala Lumpur 0.09% 0.06% 0.08% 1.52%
WP Putrajaya 0.09 0.06 0.09 1.60
Selangor 0.11 0.07 0.10 1.95
WP Labuan 0.13 0.09 0.13 2.38
Johor 0.14 0.09 0.13 2.49
Pulau Pinang 0.15 0.10 0.14 2.60
Melaka 0.15 0.11 0.14 2.65
Terengganu 0.16 0.12 0.15 2.89
Negeri Sembilan 0.18 0.13 0.17 3.20
Perlis 0.20 0.13 0.19 3.49
Sarawak 0.20 0.13 0.19 3.53
Pahang 0.20 0.13 0.19 3.61
Kedah 0.21 0.14 0.20 3.70
Perak 0.21 0.14 0.20 3.75
Sabah 0.21 0.14 0.20 3.78
Kelantan 0.25 0.17 0.24 4.50
Source: Author’s calculations based on web archive data and HIS 2019
At first glance, it seems that fixed broadband is only affordable at the 2% threshold in Kuala
Lumpur, Putrajaya and Selangor. This analysis suggests a plausible explanation for why an
individual might not want to subscribe to fixed broadband especially if they are already paying
for a mobile broadband subscription.
However, this interpretation of the data for fixed broadband pricing is not strictly comparable to
mobile data pricing for two reasons. First, this is a variation of the affordability measure that does
not consider the price per GB of data, instead calculating the price of access to unlimited data.
Second, fixed broadband access is accessible in the household by more than one person, but the
price is calculated for an individual subscriber. Thus, if multiple household members use large
quantities of data, it is likely that the price per GB of fixed broadband data would be lower than
the price per GB of mobile broadband data.

CHAPTER 1
DIGITAL INCLUSION: ASSESSING MEANINGFUL INTERNET CONNECTIVITY IN MALAYSIA
KHAZANAH RESEARCH INSTITUTE 22
Assuming that the average internet user uses approximately 9GB of data per month at home and
the average Malaysian household comprises four people, at least two of whom use that much data,
the estimated price per GB of fixed broadband data does become comparable to the price of
prepaid mobile data, as shown in Table 1.542. Nonetheless, as mobile services are the preferred
means of internet access in Malaysia, take-up of fixed broadband for supplementary internet
access remains low.
This analysis implies that data affordability is not the barrier to getting people connected, as
mobile data plans are extremely affordable. However, internet users solely on mobile plans may
not be able to take advantage of the benefits of fixed broadband connectivity unless they are able
to pay for two broadband subscriptions.
Assessing application
The third of the three aspects of the digital divide explored in this chapter is application,
measured using indicators of five of the top ten online activities in Malaysia—communicating by
text, visiting social networking platforms, video streaming, online banking and online shopping.
The following analyses use selected data to gain insight into how Malaysians use the internet.
Unless specifically stated, these data are not nationally representative, and should not be used to
generalise across the Malaysian population. They simply indicate trends and the distribution of
online activities for subsets of internet users in Malaysia.
1.5.1. What are Malaysians doing online?
Figure 1.8 shows the ten most popular online activities among internet users in Malaysia in 2018,
sorted by the proportion of internet users who report engaging in such activities. Communicating
by text ranked first, followed by visiting social networking platforms. Streaming videos online
was the fourth most popular online activity, with online banking and online shopping in ninth and
tenth place, respectively.
Figure 1.8: Online activities, 2018
Source: MCMC Internet Users Survey 2018
42 See Appendix 1.1: data pricing calculations for further details on this estimate.
53.3
54.2
56.3
60.2
60.6
61.9
77.6
85.5
85.6
96.5
0 20 40 60 80 100
Online shopping/booking
Online banking and financial activities
Read online publication
Study
Communicate by voice/video
Work related
Watch or download video/online TV
To get information
Visit social networking platform
Communicate by text
%

CHAPTER 1
DIGITAL INCLUSION: ASSESSING MEANINGFUL INTERNET CONNECTIVITY IN MALAYSIA
23 KHAZANAH RESEARCH INSTITUTE
1.5.2. Communication, social networks and video streaming
In 2019, mobile internet users in Malaysia used approximately 14GB of data each month43. Figure
1.9 shows the share of internet data used by four of the most popular data-intensive mobile apps
in 2019. These four apps—YouTube, Facebook, Instagram, and WhatsApp—rank among the top
ten mobile apps, in terms of data volume, used by unifi Mobile users in 2019.
Figure 1.9: Unifi Mobile data usage for top four apps, by state, 2019
Note: Share of data usage is limited to these four apps and does not represent total mobile data usage.
Source: Author’s calculations based on data provided by TM Berhad upon request
These data are in line with the 2018 MCMC survey findings as three of these four apps are the
preferred apps used for the two most popular online activities of 2018. WhatsApp was the most
popular text communication app, being used by 98.1% of internet users who used such apps.
Facebook and Instagram were the two most popular social networking apps, used by,
respectively, 97.3% and 57.0% of social network users.
The fourth most popular online activity, video streaming, generated the most amount of data,
which is expected as videos are data-intensive. Across all states, YouTube generated the biggest
share of data volume, averaging 50% of data used by these four apps. While there are other apps
and platforms used for video streaming such as Astro Go, iFlix and Netflix, YouTube was the most
data-intensive app among unifi Mobile users.
Facebook was the most popular social networking platform among internet users in 2018, but in
2019 Instagram generated more data volume than Facebook among unifi Mobile users. This may
not indicate Instagram’s increased popularity among users, but simply be due to the Instagram’s
content being more data-intensive than Facebook’s content.
43 This approximation is based on numbers in the Axiata, Digi and Maxis 2019 annual reports.
0% 10% 20% 30% 40% 50% 60% 70% 80% 90% 100%
WP Labuan
Perlis
WP Putrajaya
Melaka
Negeri Sembilan
Terengganu
Kelantan
Kedah
Pahang
Pulau Pinang
Perak
Sarawak
Sabah
WP Kuala Lumpur
Johor
SelangorYouTube

CHAPTER 1
DIGITAL INCLUSION: ASSESSING MEANINGFUL INTERNET CONNECTIVITY IN MALAYSIA
KHAZANAH RESEARCH INSTITUTE 24
Although it is the most commonly used app for the most common online activity (communication
by text), WhatsApp data made up the smallest proportion of data traffic among the four apps. This
is to be expected because, photo and video sharing notwithstanding, the majority of WhatsApp
exchanges occur through text and voice, which have a smaller data footprint than videos.
While the data sample used in this analysis are not nationally representative, there is no reason
to expect internet use behaviour to differ significantly across service providers. It is reasonable
to assume that the data volume would be proportionally similar across service providers. This
implies that the lion’s share of internet data—and digital content—in Malaysia is being driven by
Google and Facebook, the latter which owns Instagram and WhatsApp, and all together make up
four of the most data-intensive apps in the country.
1.5.3. Online banking
Online banking and financial activities comprised the ninth most popular online activity in 2018.
Figure 1.10 shows the indexed growth trends of bank accounts, active online accounts44, and
online financial transactions from 2011 to 2019. Figure 1.11 shows active online accounts as a
percentage of total number of bank accounts from 2011 to 2019. The growth rate of online
accounts, which increased starting in 2015, can be expected to continue or increase given the
efforts made by Bank Negara Malaysia (BNM) to move Malaysia towards adopting electronic
payments and becoming a cashless society.
Figure 1.10: Growth trends of bank accounts, online
accounts, and online transactions, 2011 – 2019
(2011 = 1)
Figure 1.11: Online accounts as a percentage of
total bank accounts, 2011 – 2019
Source: Author’s calculations based on data provided by BNM upon request
44 Active online accounts are defined as internet/mobile banking subscriptions with at least one online transaction per
month.
0
1
2
3
4
5
6
7
8
9
10
2011 2012 2013 2014 2015 2016 2017 2018 2019
Bank Acc
Online Bank Acc
Online Transaction
0%
5%
10%
15%
20%
25%
30%
35%
40%
45%
50%
2011 2012 2013 2014 2015 2016 2017 2018 2019

CHAPTER 1
DIGITAL INCLUSION: ASSESSING MEANINGFUL INTERNET CONNECTIVITY IN MALAYSIA
25 KHAZANAH RESEARCH INSTITUTE
The number of online transactions per month has increased almost nine-fold over the last nine
years while the number of online accounts has increased five-fold. Online accounts remain less
than half the total number of bank accounts in 2019, indicating that there is still room for growth
in digital financial services. The Covid-19 pandemic is likely accelerating the transition to cashless
systems.
Not only do electronic payment systems provide cost savings and improve efficiency, but they are
also a means of extending financial services to unbanked communities. In addition to digital
banking services provided by traditional banks, BNM has issued licenses to 47 non-bank e-money
issuers to provide electronic payment systems, including e-wallets such as Boost, GrabPay, and
TouchNGo45. Widespread take-up of digital financial services at all levels of society is important
in facilitating the transition to a cashless society.
Implementing BNM’s Interoperable Credit Transfer Framework (ICTF) would allow cross-
platform transactions from bank accounts to non-bank e-wallet accounts. In a market with
multiple e-wallets, such interoperability would improve efficiency and convenience by allowing
an e-wallet user to seamlessly pay and receive funds from users of other participating e-wallets.
Not only would this facilitate personal and commercial transactions, it could also facilitate the
disbursal of social assistance and social protections, including the PRIHATIN economic stimulus
package (PRIHATIN) funds, to financially under-served populations in rural and remote areas.
1.5.4. Online shopping
Online shopping was the tenth most popular online activity in 2018 and is likely to rise in the
rankings as a result of the pandemic. Figure 1.12 shows the distribution by state of the number of
Pos Laju e-commerce deliveries per thousand people in 2018 and the median monthly household
income in 2016 relative to their respective national averages, which are scaled to zero. This
means that Selangor’s median household income in 2016 was approximately RM2,000 more than
the national average median household income and the number of e-commerce deliveries per
thousand people in Selangor in 2018 was approximately 600 packages more than the national
average of deliveries per thousand people.
A pattern emerges between household income and online shopping, where states with higher
median household incomes receive more e-commerce deliveries per thousand people, Negeri
Sembilan being an exception to the rule. It should be noted that this chart represents e-commerce
deliveries fulfilled by one specific courier whose market share may not be consistent across
states. Nonetheless, the data reveal how income inequalities and digital inequalities are linked.
45 Data on the take-up rates and geographic distribution of these electronic payment systems were not available at the
time of writing.

CHAPTER 1
DIGITAL INCLUSION: ASSESSING MEANINGFUL INTERNET CONNECTIVITY IN MALAYSIA
KHAZANAH RESEARCH INSTITUTE 26
These economic and digital inequalities can have public health consequences. Digital inequality
scholars point out that those on the privileged side of the digital divide can work from home, stay
in touch with friends and family online, and have their groceries, meals and household supplies
ordered online and delivered. They are better equipped to remain sheltered and connected, thus
lowering their exposure and risk to the coronavirus46. Nor are health concerns related solely to
the coronavirus. Socially-isolated individuals with limited or no internet connectivity during
quarantines or movement control orders may face mental health challenges such as anxiety or
loneliness and may not be able to get the regular healthcare they need without access to
telemedicine.
Figure 1.12: Pos Laju e-commerce deliveries per thousand people, relative to national averages, by state, 2018
Note: Delivery data for WP Labuan is captured under Sabah and WP Putrajaya under Selangor.
Source: Author’s calculations based on Pos Malaysia data and HIS 2016
Further research and policy considerations
Three aspects of the digital divide in Malaysia have been examined in this chapter: internet
penetration rates (access), data pricing (affordability), and internet use (application).
Generally, as at 2019, Malaysia is a highly digitally networked nation, with 90% of households
using the internet, mostly through mobile broadband plans on smartphones. Internet usage
trends show the digital generation gap closing, but the digital gender gap widening.
Mobile data plans are affordable and popular, with national mobile broadband subscription rates
exceeding 130% while national fixed broadband subscription rates lag behind at 9.0%. However,
internet users solely on mobile plans may not be able to take advantage of the benefits of fixed
broadband connectivity unless they are able to pay for two broadband subscriptions. Despite data
affordability, there remains a positive relationship between median household income and both
fixed and mobile broadband subscription rates.
46 Robinson et al. (2020)
-3,000 -2,000 -1,000 0 1,000 2,000 3,000 4,000
Kelantan
Sabah
Kedah
Perlis
Perak
Terengganu
Pahang
Sarawak
Pulau Pinang
Melaka
Johor
Negeri Sembilan
Selangor
WP Kuala Lumpur
Volume Per '000 Median HH Income National Averages

CHAPTER 1
DIGITAL INCLUSION: ASSESSING MEANINGFUL INTERNET CONNECTIVITY IN MALAYSIA
27 KHAZANAH RESEARCH INSTITUTE
The most popular online activities among internet users in Malaysia are still oriented around
communication, socialising, and media consumption, but economic activities rank highly as well,
with approximately one in two internet users engaging in work-related activities, banking, and
shopping online.
What then of the story of Veveonah Mosibin that opened this chapter? First and foremost, her
story demonstrates that there remains a need for improved network coverage and quality of
service, important supply-side considerations that are outside the scope of this chapter.
Her story also underlines why the digital divide is a pressing policy issue that needs to be
considered from a demand-side perspective. As discussed earlier, improving digital access,
affordability, and literacy could lead to gains in educational attainment, economic opportunity,
and health literacy, all of which are important as Malaysia recovers from the Covid-19 pandemic
and continues its development and growth, including its efforts towards digital inclusion.
1.6.1. What is digital inclusion?
Digital inclusion is a broad policy-driven approach towards ensuring that “all individuals and
communities, including the most disadvantaged, have access to and use of Information and
Communication Technologies (ICTs). This includes [five] elements:
1) affordable, robust broadband internet service;
2) internet-enabled devices that meet the needs of the user;
3) access to digital literacy training;
4) quality technical support; and
5) applications and online content designed to enable and encourage self-sufficiency,
participation and collaboration.
Digital inclusion must evolve as technology advances. Digital inclusion requires intentional
strategies and investments to reduce and eliminate historical, institutional and structural
barriers to access and use technology”47.
Digital inclusion is about more than closing the digital divide. Building more infrastructure,
improving network performance, and developing devices and apps that are easier to use and
more secure are important technical solutions to the problem of the digital divide. But digital
inclusion also requires social solutions, including addressing social inequality, rethinking social
norms and behaviours, and thinking proactively about the societal implications of digitalisation,
including education, healthcare, and social cohesion.
Providing affordable digital access is just the first step in the digital transformation of a society.
Researchers and policymakers must consider the societal implications of an increasingly digital
population before jumping ahead to automation, artificial intelligence and 5G. Digital literacy,
data privacy, cybersafety and surveillance are just some of the issues that need to be addressed
as part of the nation’s digital inclusion efforts.
47 NDIA (n.d.)

CHAPTER 1
DIGITAL INCLUSION: ASSESSING MEANINGFUL INTERNET CONNECTIVITY IN MALAYSIA
KHAZANAH RESEARCH INSTITUTE 28
The findings of this chapter invite further investigation on the uses, benefits and risks of digital
technologies in a networked, data-driven society. The following topics are presented for both
research and policy consideration:
Consideration #1: Internet access as a public utility
Internet access is important for more than just economic outcomes, and is key to social
development. As described earlier, the UN has declared internet access a human right and several
countries have made it a legal requirement that all their citizens have access to the internet. This
policy implies that governments should take the lead on the funding and provision of
infrastructure in non-profitable areas, especially rural areas deemed unprofitable to private
service providers.
In Malaysia, this is managed using the Universal Service Provision (USP) fund under Section 204
of the Communications and Multimedia Act (CMA) 1998. Telecommunications licensees whose
annual revenue exceeds RM2 million contribute 6% of their weighted net revenue to the USP
fund. This fund is currently the central source of funding for the NFCP but, should this prove
insufficient to ensure universal coverage of populated areas, additional funds should be allocated
for the provision of internet infrastructure.
The public sector should be cautious of entering into public-private partnerships where private
companies take the lead on both funding and service provision. Facebook’s Free Basics
programme was intended to bring free internet access to rural areas in India by allowing users to
access a limited set of websites and apps. India’s telecommunications regulators rejected this plan
because it violated net neutrality, meaning that it privileged some services (including Facebook)
instead of allowing equal access to all online content48.
Consideration #2: Measurement of meaningful metrics
As described earlier, the A4AI has proposed a new standard on meaningful connectivity, which
includes four dimensions: enough speed, an appropriate device, enough data, and daily access.
The organisation has proposed a method of applying this standard and has tested it in Colombia,
Ghana, and Indonesia49. The adoption of these metrics to complement internet penetration rates
would allow policymakers to identify specific dimensions where a digital divide might exist and
to address those gaps accordingly.
The A4AI standard also calls for a gender-disaggregated measure along these dimensions to
examine where gender inequalities might exist. Because national identification numbers used to
register broadband subscriptions include information on gender, Malaysia is well-placed to
gather this data as a means of evaluating the efficacy of its gender-responsive broadband policies.
Existing surveys included data on gender, but data analysis was not always done with gender-
disaggregation in mind. Allowing researchers access to existing microdata that includes gender
information would permit historical analysis of digital gender inequalities to better assess if the
gaps are closing.
48 Bhatia (2016) 49 A4AI (2020)

CHAPTER 1
DIGITAL INCLUSION: ASSESSING MEANINGFUL INTERNET CONNECTIVITY IN MALAYSIA
29 KHAZANAH RESEARCH INSTITUTE
Consideration #3: The benefits of fixed broadband
Several studies have found that mobile broadband is a substitute for fixed broadband while fixed
broadband is a complement to mobile broadband50. This corroborates the finding that mobile
connectivity is becoming far and away the preferred means of internet access, driven by the
advance and falling prices of mobile devices and mobile services globally51.
Nonetheless, fixed broadband has several advantages over mobile broadband, typically offering
higher data transfer speeds, better network stability and unlimited data. For a household that
generates high amounts of media streaming traffic, whether streaming movies for entertainment,
attending video conferences for work or attending university or school classes, a fixed broadband
subscription would be a useful supplement to individual mobile subscriptions. This is particularly
important in Malaysia where the most popular online activities are all data-intensive.
Furthermore, fixed broadband access, whether at home, work or school, is associated with a non-
mobile access device, such as a desktop or laptop computer, on which, arguably, users are more
likely to be engaging in educational and/or productive work, compared to mobile access devices
such as tablets and smartphones. The next generation of workers are likely to develop and hone
their digital skills such as data analysis, coding and design on non-mobile devices that have
greater processing power and better network performance. As such, the provision of internet
infrastructure should not be entirely focused on mobile service provision while fixed broadband
service provision is neglected.
Consideration #4: Subsidies for devices, not just data
Analysis for the Inclusive Internet Index corroborates the finding that Malaysia’s data pricing
plans are generally affordable. However, it also finds that Malaysia does not perform as well with
respect to the affordability of access devices, e.g. entry-level smartphones52. Malaysian schools
wrestled with online education in response to the Covid-19 pandemic as 37% of students did not
have appropriate learning devices at home53.
As with considerations of the value of fixed broadband connectivity, so with considerations of
non-mobile access devices such as personal computers. Research indicates that having access to
an internet-enabled device is more effective than reducing mobile prices in increasing broadband
penetration54. Programmes subsidising or providing devices to under-served groups could be
developed alongside programmes subsidising broadband subscriptions. Once network
infrastructure has been established, the USP fund could be redirected for this purpose, which is
still in line with its objective to provide access to internet access throughout the country.
50 Bae, Choi, and Hahn (2014), Prieger (2013), Srinuan, Srinuan, and Bohlin (2012) 51 Roessler (2018) 52 EIU (2020) 53 Hawati Abdul Hamid and Jarud Romadan Khalidi (2020) 54 Hawthorne and Grzybowski (2019)

CHAPTER 1
DIGITAL INCLUSION: ASSESSING MEANINGFUL INTERNET CONNECTIVITY IN MALAYSIA
KHAZANAH RESEARCH INSTITUTE 30
Consideration #5: Reformatting of legal codes
The UN Broadband Commission for Sustainable Development notes that there are potential
downsides to digital connectivity, especially for vulnerable groups such as women, children and
seniors. These downsides include online harassment, stalking, bullying, hate speech, exploitation,
fraud and scams. Legal frameworks and digital laws that take into account digital technologies
have to be developed or amended from existing laws to better protect internet users from these
risks. This entails a review of existing laws written in and for an analogue world to ensure they
can be appropriately applied in a digitalised society.
Also needed are regulations around data governance that protect individual privacy and national
data sovereignty. The existing Personal Data Protection Act (PDPA) restricts how personally
identifying data may be distributed but is rarely enforced55. The European Union’s General Data
Protection Regulation (GDPR) provides a model that limits personal data collection to only what
is necessary, does not allow data to be used for purposes other than what was originally intended,
and limits how long data can be stored.
Consideration #6: Focusing on fundamentals first
There is much to be said about (and for) technological developments and innovative applications
such as 5G and artificial intelligence leading to the development of smart cities that respond to
citizen actions and needs in real-time. However, before they can benefit from those technologies,
Malaysians should first have meaningful universal connectivity.
For example, much has been made of the improved performance of 5G connectivity that will
enable things like remote surgery and sensor-controlled factories. But in order to provide 5G
service, additional infrastructure must be built and 5G poles must be even more closely placed to
each other than current telecommunications towers providing 3G and 4G service.
Furthermore, internet users will need newer and more expensive devices that are 5G-compatible.
This implies that urban and industrial areas are more likely to benefit from 5G compared to rural
and agricultural areas, further increasing socio-economic inequality.
A more digitally inclusive policy should prioritise improving digital education and the suite of
digital services available to internet users at all strata of society. This includes (1) improving
digital literacy, e.g. avoiding scams and verifying information on social media; (2) improving
digital skills, e.g. software, coding and data analysis; and (3) improving digital services provision,
e.g. government and financial services websites and apps.
55 Gong and Chiam (2019)

CHAPTER 1
DIGITAL INCLUSION: ASSESSING MEANINGFUL INTERNET CONNECTIVITY IN MALAYSIA
31 KHAZANAH RESEARCH INSTITUTE
Conclusion
This chapter presents an overview of state of broadband connectivity and internet use in Malaysia
as at 2019, but as with much in the field of digital technology the statistics cited within will soon
be obsolete, if they are not already. However, the problem of digital inequalities and the
challenges to meaningful connectivity and digital inclusion are prevailing and pressing policy
issues. Research must keep up with rapidly changing trends in order to understand how
technological advances affect social and economic outcomes. Policy must be flexible enough to
adjust to new and unintended consequences of digital transformation. Technology, especially
digital technology, evolves quickly, and the appropriate policy response should be to move fast
without breaking things.
Postscript
The Malaysia Digital Economy Blueprint56 launched in February 2021 represents a national
digital transformation policy to enable Malaysia to be a regional leader in the digital economy.
The blueprint defines the digital economy as “economic and social activities that involve the
production and use of digital technology by individuals, businesses, and government.” As such, it
takes a broad approach to digitalisation, focusing on six key areas: the public sector, firms, digital
infrastructure, human capital, digital inclusion, and a secure and ethical digital ecosystem.
Many of the thrusts and strategies outlined in the blueprint are aligned with the policy
considerations discussed in this chapter, which was first published as a paper in September 2020.
In particular, the blueprint mandates broadband as basic infrastructure (Consideration #1),
prioritises the provision of digital public sector services (Consideration #6), and recognises that
data affordability is not enough—devices must be provided as well, specifically to students
(Consideration #3). The blueprint also acknowledges the need to review laws and regulations to
accelerate the rollout of digital infrastructure, to facilitate entry to and innovation in the market,
and strengthen data protections (Consideration #5).
The blueprint does not fully detail how these policies will be implemented, particularly as they
require coordination and cooperation across government agencies, corporations, and social
institutions. There is room for further discussion and improvements to these strategies, but in
principle they bode well for the development of not just a digital economy, but a digital society in
Malaysia.
56 EPU (2021)

CHAPTER 1
DIGITAL INCLUSION: ASSESSING MEANINGFUL INTERNET CONNECTIVITY IN MALAYSIA
KHAZANAH RESEARCH INSTITUTE 32
Appendix 1.1: Data pricing calculations
The data pricing analysis in this chapter is based on a dataset compiled from archives of
technology and/or news websites that listed or compared broadband pricing plans in Malaysia
from 2012 to 2019. The data were retrieved from multiple sources by a researcher and the details
were verified by a second researcher.
Next, researchers estimated the cheapest available mobile data plans in Malaysia using a
modification of the ITU’s method57 of determining the cheapest handset-based mobile prepaid
broadband plan per country. The ITU’s method identifies the cheapest plan(s) providing at least
1GB of broadband data over a 30-day period from the largest mobile network operator in each
country. The modified version used here does not restrict data pricing plans to the single largest
mobile provider in the country or to a 1GB minimum. However, only the three major service
providers (Celcom, Digi and Maxis) were considered and the cheapest among the three was
selected for analysis. Price per GB of mobile data was then calculated based on the cheapest plan.
This process was repeated for the cheapest available fixed broadband plan with unlimited data
and a fibre connection, thus eliminating asymmetric digital subscriber line (ADSL) plans that use
copper wires from consideration. The cheapest fibre plans came at the lowest speeds, with the
lowest speed being a 5Mbps plan in 2014. Since these plans came with unlimited data, price per
GB was not calculated.
The team then calculated 2019 affordability based on the A4AI’s 1 for 2 standard, using median
monthly income instead of gross national income per capita. Median monthly income was sourced
from DOS’s 2019 HIS and adjusted from the household to the individual level by dividing the
median household monthly income by the average number of income recipients per household
in 2019 i.e. 1.8.
An estimate of price per GB of fixed broadband data was derived based on the following
assumptions. First, average mobile broadband data usage in terms of total data volume is
representative of the average internet user, regardless of whether they also have a fixed
broadband subscription. Second, approximately two thirds of usage occur at home. Third, if
internet users have a fixed broadband subscription at home, they will use that while at home
instead of their mobile broadband subscription. Fourth, the average household includes two
internet users. Thus, estimating the average monthly mobile data use to be 14GB in 2019 based
on annual reports from Axiata, Digi, and Maxis, this means that the average fixed broadband home
subscriber uses 2/3 * 14 * 2 = 18.67GB per month.
57 ITU (n.d.)

CHAPTER 1
DIGITAL INCLUSION: ASSESSING MEANINGFUL INTERNET CONNECTIVITY IN MALAYSIA
33 KHAZANAH RESEARCH INSTITUTE
Table A1 shows the cheapest price of prepaid mobile, postpaid mobile and fixed mobile data as
well as the median monthly household income by state in 2019.
Table A1. Data prices and median household income, by state, 2019
State Prepaid mobile (per GB)
Postpaid mobile (per GB)
Fixed broadband (unlimited data)
Median monthly household income
WP Kuala Lumpur 5.00 3.27 89.00 10,549
WP Putrajaya 5.00 3.27 89.00 9,983
Selangor 5.00 3.27 89.00 8,210
WP Labuan 5.00 3.27 89.00 6,726
Johor 5.00 3.27 89.00 6,427
Pulau Pinang 5.00 3.27 89.00 6,169
Melaka 5.00 3.27 89.00 6,054
Terengganu 5.00 3.27 89.00 5,545
Negeri Sembilan 5.00 3.27 89.00 5,005
Perlis 5.00 3.27 89.00 4,594
Sarawak 5.00 3.27 89.00 4,544
Pahang 5.00 3.27 89.00 4,440
Kedah 5.00 3.27 89.00 4,325
Perak 5.00 3.27 89.00 4,273
Sabah 5.00 3.27 89.00 4,235
Kelantan 5.00 3.27 89.00 3,563
Sources: Author’s calculations based on web archive data and HIS 2019
RM

CHAPTER 1
DIGITAL INCLUSION: ASSESSING MEANINGFUL INTERNET CONNECTIVITY IN MALAYSIA
KHAZANAH RESEARCH INSTITUTE 34
References
A4AI, Alliance for Affordable Internet. 2019. “Affordability Report 2019.” Annual Report. Affordability Report. Washington DC: Web Foundation. a4i.org. https://a4ai.org/affordability-report/report/2019/.
Alliance for Affordable Internet. 2020. “Meaningful Connectivity: A New Standard to Raise the Bar for Internet Access.” Alliance for Affordable Internet.
Andalib, Sara, and Noor Hazarina Hashim. 2018. “The Influence of Dispositional Resistance to Change on Seniors’ Mobile Banking Adoption in Malaysia.” Journal of Soft Computing and Decision Support Systems 5 (6):1–12.
Axiata. 2020. “Axiata Integrated Annual Report 2019.” Axiata. Bae, Jinsoo, Yun Jeong Choi, and Jong-Hee Hahn. 2014. “Fixed and Mobile Broadband: Are They
Substitutes or Complements?” Working Paper. South Korea: Economic Research Institute Yonsei University.
BBC. 2020. “Malaysian Student Sits Exams in a Tree to Access Wifi.” BBC News, June 18, 2020, sec. News from Elsewhere. https://www.bbc.com/news/blogs-news-from-elsewhere-53079907.
Bernama. 2019. “Demand for Broadband Services Grew 18-22 Pct in a Year – Gobind.” Media. Malaysiakini. October 8, 2019. https://www.malaysiakini.com/news/494929.
Bhatia, Rahul. 2016. “The inside Story of Facebook’s Biggest Setback.” The Guardian, May 12, 2016, sec. Technology. https://www.theguardian.com/technology/2016/may/12/facebook-free-basics-india-zuckerberg.
Brennen, J. Scott, and Daniel Kreiss. 2016. “Digitalization.” In The International Encyclopedia of Communication Theory and Philosophy, 556–66. Chichester: Wiley-Blackwell. https://doi.org/10.1002/9781118766804.wbiect111.
Digi. 2020. “Integrated Annual Report 2019 Digi.Com Berhad.” Digi. https://images.digi.com.my/annualreport/download/DIGI_IAR_2019_FINAL.pdf.
DiMaggio, Paul, and Bart Bonikowski. 2008. “Make Money Surfing the Web? The Impact of Internet Use on the Earnings of US Workers.” American Sociological Review 73 (2):227–50. https://doi.org/0.1177/000312240807300203.
DiMaggio, Paul, Eszter Hargittai, Coral Celeste, and Steven Shafer. 2001. “From Unequal Access to Differentiated Use: A Literature Review and Agenda for Research on Digital Inequality.” Social Inequality, January, 71.
DiMaggio, Paul, Eszter Hargittai, W. Russell Neuman, and John P. Robinson. 2001. “Social Implications of the Internet.” Annual Review of Sociology 27 (1):307–36. https://doi.org/10.1146/annurev.soc.27.1.307.
DOS. 2012. “Household Income and Basic Amenities Survey Report 2009.” Annual Survey. Malaysia. https://www.dosm.gov.my/v1/images/stories/files/LatestReleases/household/Press_Release_household2009_BI.pdf.
———. 2020a. “ICT Use And Access By Individuals and Households Survey Report, Malaysia, 2019.” Annual Survey. Malaysia: Department of Statistics Malaysia. https://www.dosm.gov.my/v1/index.php/index.php?r=column/cthemeByCat&cat=395&bul_id=SFRacTRUMEVRUFo1Ulc4Y1JlLzBqUT09&menu_id=amVoWU54UTl0a21NWmdhMjFMMWcyZz09.
———. 2020b. “Households Income and Basic Amenities Survey Report 2019.” Annual Survey. Malaysia: Department of Statistics Malaysia.
EIU. 2020. “The Inclusive Internet Index 2020 Executive Summary.” The Economist Intelligence Unit. https://theinclusiveinternet.eiu.com/assets/external/downloads/3i-executive-summary.pdf.

CHAPTER 1
DIGITAL INCLUSION: ASSESSING MEANINGFUL INTERNET CONNECTIVITY IN MALAYSIA
35 KHAZANAH RESEARCH INSTITUTE
EPU. 2021. “Malaysia Digital Economy Blueprint.” Policy Paper. Putrajaya: Economic Planning Unit, Prime Minister’s Department. https://www.epu.gov.my/sites/default/files/2021-02/Malaysia-digital-economy-blueprint.pdf.
Federal Communications Commission. 2018. “2018 Broadband Deployment Report.” Government. Federal Communications Commission. February 5, 2018. https://www.fcc.gov/reports-research/reports/broadband-progress-reports/2018-broadband-deployment-report.
Gong, Rachel, and Hui San Chiam. 2019. “Personal Data Privacy and Surveillance Capitalism.” Kuala Lumpur: Khazanah Research Institute. http://krinstitute.org/Views-@-Personal_Data_Privacy_and_Surveillance_Capitalism.aspx.
Hafisah Yaakob, Wan Hartini Wan Hassan, and Siti Rohana Daud. 2016. “Digitial Divide Among Elderly Workers - A Comparative Study Between Public and Private Sectors in Melaka.” Asian Journal of University Education 12 (1):53–81.
Hargittai, Eszter, Anne Marie Piper, and Meredith Ringel Morris. 2018. “From Internet Access to Internet Skills: Digital Inequality among Older Adults.” Universal Access in the Information Society, May, 881–90. https://doi.org/10.1007/s10209-018-0617-5.
Hawati, Abdul Hamid, and Romadan Khalidi Jarud. 2020. “Covid-19 and Unequal Learning.” Kuala Lumpur: Khazanah Research Institute. http://krinstitute.org/assets/contentMS/img/template/editor/20200426_Covid_Education_v3.pdf.
Hawthorne, Ryan, and Lukasz Grzybowski. 2019. “Narrowing the ‘Digital Divide’: The Role of Complementarities between Fixed and Mobile Data in South Africa.” SSRN Scholarly Paper ID 3418635. Rochester, NY: Social Science Research Network. https://papers.ssrn.com/abstract=3418635.
Hjort, Jonas, and Jonas Poulsen. 2019. “The Arrival of Fast Internet and Employment in Africa.” American Economic Review 109 (3):1032–79.
Howard, Philip N., Laura Busch, and Penelope Sheets. 2010. “Comparing Digital Divides: Internet Access and Social Inequality in Canada and the United States.” Canadian Journal of Communication 35 (1):109–28.
Hui, Kam Yong. 2016. “Determinants of Smartphone Adoption Among Older Adults in Malaysia.” Universiti Tunku Abdul Rahman. http://eprints.utar.edu.my/2081/1/1205857.pdf.
ITU. 2003. “The Birth of Broadband.” Https://Www.Itu.Int/Osg/Spu/Publications/Birthofbroadband/Faq.Html#:~:Text=Birth%20of%20Broadband-,Frequently%20Asked%20Questions,A.&text=113%20of%20the%20ITU%20Standardization,Per%20second%20(Mbits)%E2%80%9D. September 2003.
———. 2018. “Definition of Broadband Access.” International Telecommunications Union. https://www.itu.int/en/ITU-T/committees/scv/Documents/T17-SCV-LS-0015.pdf.
———. 2019. “State of Broadband Report 2019.” Geneva: International Telecommunication Union and United Nations Education, Scientific and Cultural Organization. https://www.broadbandcommission.org/Documents/StateofBroadband19.pdf?mc_cid=ba1bfdab1d&mc_eid=e546476035.
———. n.d. “ICT Price Basket Methodology.” n.d. https://www.itu.int/en/ITU-D/Statistics/Pages/definitions/pricemethodology.aspx.
Kuhn, Peter, and Hani Mansour. 2014. “Is Internet Job Search Still Ineffective?” The Economic Journal 124 (581):1213–33. https://doi.org/doi/abs/10.1111/ecoj.12119.
Malaysian Communications and Multimedia Commission. 2019. “Industry Performance Report 2018.”
Maxis. 2020. “Maxis Integrated Annual Report 2019.” Maxis. https://maxis.listedcompany.com/misc/ar2019.pdf.

CHAPTER 1
DIGITAL INCLUSION: ASSESSING MEANINGFUL INTERNET CONNECTIVITY IN MALAYSIA
KHAZANAH RESEARCH INSTITUTE 36
MCMC. 2006. “Universal Service Provision Annual Report.” MCMC: MCMC. https://www.skmm.gov.my/skmmgovmy/files/attachments/USP06.pdf.
———. 2010a. “MCMC Annual Report 2010.” General Annual Report. MCMC Annual Report. Kuala Lumpur: MCMC. https://www.mcmc.gov.my/skmmgovmy/media/General/pdf/MCMC_AR_2010(English).pdf.
———. 2010b. “National Broadband Initiative.” https://www.mcmc.gov.my/sectors/broadband/national-broadband-initiative.
———. 2014. “Internet Users Survey 2012.” Annual Survey. Malaysia: MCMC. https://www.mcmc.gov.my/skmmgovmy/media/General/pdf/InternetUsersSurvey2012.pdf.
———. 2015a. “Internet Users Survey 2014.” Annual Survey. Malaysia: MCMC. https://www.mcmc.gov.my/skmmgovmy/media/General/pdf/Internet-Users-Survey-2014.pdf.
———. 2015b. “Public Consultation Paper.” MCMC. https://www.mcmc.gov.my/skmmgovmy/media/General/pdf/PC-Paper-Rates-Rules.pdf.
———. 2016a. “Industry Performance Report 2015.” Annual Report. Malaysia: Malaysian Communications and Multimedia Commission. https://www.mcmc.gov.my/skmmgovmy/media/General/pdf/IPR_2015.pdf.
———. 2016b. “MCMC Annual Report 2015.” General Annual Report. MCMC Annual Report. Kuala Lumpur: MCMC. https://www.mcmc.gov.my/skmmgovmy/media/General/pdf/MCMC-Annual-Report-2015-ENG.pdf.
———. 2017. “Internet Users Survey 2016.” Annual Survey. Malaysia: MCMC. https://www.mcmc.gov.my/skmmgovmy/media/General/pdf/IUS2015-Appendix_281216_final-20171016.pdf.
———. 2019. “Internet Users Survey 2018.” Annual Survey 1823–2523. Malaysia: MCMC. https://www.mcmc.gov.my/skmmgovmy/media/General/pdf/Internet-Users-Survey-2018.pdf.
———. 2020a. “4Q 2019 Communications and Multimedia Facts & Figures.” Technical Report. Communications and Multimedia Facts and Figures. Malaysia: Malaysian Communications and Multimedia Commission. skmm.gov. https://www.mcmc.gov.my/skmmgovmy/media/General/pdf/4Q-2019-C-M-Infographic.pdf.
———. 2020b. “MCMC Ambil Tindakan Isu Liputan Internet Kampung Sapatalang, Pitas Di Sabah | Malaysian Communications And Multimedia Commission (MCMC).” Malaysian Communications And Multimedia Commission (MCMC) | Suruhanjaya Komunikasi Dan Multimedia Malaysia (SKMM). June 17, 2020. https://www.mcmc.gov.my/en/media/press-releases/mcmc-ambil-tindakan-isu-liputan-internet-kampung-s.
———. n.d. “National Fiberisation and Connectivity Plan 1.” Https://Www.Nfcp.My/Nfcp/Media/Docs/NFCP-1_Frequently-Asked-Questions.Pdf. n.d. https://www.nfcp.my/Nfcp/media/Docs/NFCP-1_Frequently-Asked-Questions.pdf.
Mohamed b. Awang-Lah. 1987. “RangKoM- The Malaysian Computer Network.” presented at the International Academic Network Workshop, Princeton, New Jersey, November 9. https://docs.google.com/file/d/0B5ofp_5bTa1SeWt2STlfaW1HMHM/edit.
MOHE. n.d. “Dasar e-Pembelajaran Negara 2.0.” Jabatan Pendidikan Tinggi, Kementerian Pendidikan Tinggi. http://smart2.ums.edu.my/pluginfile.php/2/course/section/2/Depan-20_2.pdf.

CHAPTER 1
DIGITAL INCLUSION: ASSESSING MEANINGFUL INTERNET CONNECTIVITY IN MALAYSIA
37 KHAZANAH RESEARCH INSTITUTE
Muro, Mark, Sifan Liu, Jacob Whiton, and Siddharth Kulkarni. 2017. “Digitalization and the American Workforce.” Washington, DC: Brookings Institution. https://www.brookings.edu/wp-content/uploads/2017/11/mpp_2017nov15_digitalization_full_report.pdf.
National Digital Inclusion Alliance. n.d. “Definitions | National Digital Inclusion Alliance.” Organization. Digital Inclusion. n.d. https://www.digitalinclusion.org/definitions/.
Neter, Efrat, and Esther Brainin. 2012. “EHealth Literacy: Extending the Digital Divide to the Realm of Health Information.” Journal of Medical Internet Research 14 (1):e19. https://doi.org/10.2196/jmir.1619.
Nor Akmar Shah Minan. 2009. “HSBB: Malaysia’s Drive for High Speed Broad.” ..MyConvergence Volume 3 (1):4–9.
Norfaezah binti Abd Halim. 2010. “Sejarah Intenet Malaysia.” Pusat Teknologi Maklumat Dan Komunikasi Universiti Malaysia Pahang. May 12, 2010. http://archive.ump.edu.my/ptmk/index.php/artikel/69-telekomunikasi/198-sejarah-internet-malaysia.html.
Prieger, James E. 2013. “The Broadband Digital Divide and the Economic Benefits of Mobile Broadband for Rural Areas.” Telecommunications Policy 37 (6):483–502. https://doi.org/10.1016/j.telpol.2012.11.003.
Raju, Janakky. 2019. “Double the Speed, Half the Price.” ../MyConvergence, 2019. Robinson, Laura, Shelia R. Cotten, Hiroshi Ono, Anabel Quan-Haase, Gustavo Mesch, Wenhong
Chen, Jeremy Schulz, Timothy M. Hale, and Michael J. Stern. 2015. “Digital Inequalities and Why They Matter.” Information, Communication & Society 18 (5):569–82. https://doi.org/10.1080/1369118X.2015.1012532.
Robinson, Laura, Jeremy Schulz, Aneka Khilmani, Hiroshi Ono, Shelia R. Cotten, Noah McClain, Lloyd Levine, et al. 2020. “Digital Inequalities in Time of Pandemic: COVID-19 Exposure Risk Profiles and New Forms of Vulnerability.” First Monday 25 (7). https://firstmonday.org/ojs/index.php/fm/article/view/10845/9563.
Roessler, Philip. 2018. “The Mobile Phone Revolution and Digital Inequality: Scope, Determinants and Consequences.” 15. Pathways for Prosperity Commission. Background Paper Series. Oxford, United Kingdom: Oxford University.
Samsudin A. Rahim. 2018. “Digital Experience and Citizen Participation in Bridging Ethnic Divide: An Analysis of Young Generation in Malaysia.” Jurnal Komunikasi: Malaysian Journal of Communication 34 (4):154–67. https://doi.org/10.17576/JKMJC-2018-3404-09.
Srinuan, Pratompong, Chalita Srinuan, and Erik Bohlin. 2012. “Fixed and Mobile Broadband Substitution in Sweden.” Telecommunications Policy, Services, regulation and the changing structure of mobile telecommunication markets, 36 (3):237–51. https://doi.org/10.1016/j.telpol.2011.12.011.
Telekom Malaysia. 2015. “TM Signs HSBB 2 and SUBB Agreements with the Government to Further Connect Malaysians Nationwide.” Telekom Malaysia, 2015. https://www.tm.com.my/AboutTM/NewsRelease/Pages/TM-SIGNS-HSBB-2-AND-SUBB-AGREEMENTS-WITH-THE-GOVERNMENT-TO-FURTHER-CONNECT-MALAYSIANS-NATIONWIDE.aspx.
TM Group. 2002. “Annual Report 2001.” Telekom Malaysia Berhad. https://www.tm.com.my/AboutTm/InvestorRelations/Documents/Annual%20and%20Sustainability/TM2001_AR_ENG.pdf.
UNHRC. 2016. “Promotion and Protection of All Human Rights, Civil, Political, Economic, Social and Cultural Rights, Including the Right to Development.” Koninklijke Brill NV. https://doi.org/10.1163/2210-7975_HRD-9970-2016149.
webfoundation. 2019. “30 Years on, What’s next #ForTheWeb?” World Wide Web Foundation. March 12, 2019. https://webfoundation.org/2019/03/web-birthday-30/.

CHAPTER 1
DIGITAL INCLUSION: ASSESSING MEANINGFUL INTERNET CONNECTIVITY IN MALAYSIA
KHAZANAH RESEARCH INSTITUTE 38
Willis, Suzanne, and Bruce Tranter. 2006. “Beyond the ‘Digital Divide’: Internet Diffusion and Inequality in Australia.” Journal of Sociology 42 (1):43–59. https://doi.org/10.1177/1440783306061352.
Wong, Chui Yin, Rahimah Ibrahim, Tengku Aizan Hamid, and Evi Indriasari Mansor. 2018. “Mismatch between Older Adults’ Expectation and Smartphone User Interface.,” 16.
World Wide Web Foundation. 2018. “The Case #ForTheWeb.” Washington DC: Web Foundation. http://webfoundation.org/docs/2018/11/The-Case-For-The-Web-Report.pdf.
Yeoh, Angelin. 2019. “Helping the Elderly in Malaysia Keep up with Technology.” The Star, December 9, 2019. https://www.thestar.com.my/tech/tech-news/2019/12/09/helping-the-elderly-in-malaysia-keep-up-with-technology.

39 KHAZANAH RESEARCH INSTITUTE
CHAPTER
02 THE QUALITY OF MOBILE BROADBAND AND KEY POLICY RECOMMENDATIONS
2.1 Introduction 40
2.2 Quality of service report 41
2.2.1 Mobile broadband in Malaysia 42
2.2.2 Aside from network coverage, what other factors affect the quality of service? 43
2.2.3 Quality performance reports from MCMC 44
2.2.4 Malaysia Mobile Network Experience Report, September 2019 from Opensignal 47
2.2.5 Difference in network quality between 4G and 3G 48
2.2.6 Analysis of the disparity between MCMC and Opensignal reports 50
2.3 Download speed test 52
2.3.1 Background of the download speed test 52
2.3.2 Observation 1: Download speeds are significantly better early in the day 52
2.3.3 Observation 2: The quality of service in urban areas requires further attention 54
2.3.4 Observation 3: The lowest recorded speeds were below the minimum standard 54
2.3.5 Observation 4: No participant recorded download speeds above 100Mbps, even with the best network coverage 55
2.4 Conclusion and discussion on key policies 56
2.4.1 Key policy 1: Provide a high quality
network service in all locations 57
2.4.2 Key policy 2: A pre-emptive approach in strategically developing communications infrastructure 58
2.4.3 Key policy 3: Wider and more strategic use of funds 59
Appendix 2.1: The method of conducting the download speed test 61
References 62

KHAZANAH RESEARCH INSTITUTE 40
THE QUALITY OF MOBILE BROADBAND AND KEY POLICY
RECOMMENDATIONS58
By Muhammad Nazhan Kamaruzuki
“An efficient telecommunications network is the foundation upon which an information
society is built.”
Talal Abu Ghazali59
Introduction
In the year 2019, up to 96% of internet users in Malaysia relied on mobile broadband to access
the internet60. Among the most popular online activities are texting, browsing social media,
streaming videos and looking up information. Up to 40% of mobile broadband customers use the
service for internet tethering61, which allows for broadband users to connect their internet
service to other devices using specific smartphone features. For example, users can rely on their
cell phones to connect personal computers to the internet in the absence of a Wi-Fi connection.
The state of the mobile telecommunications infrastructure in Malaysia is far more developed
compared to previous decades. Communication through voice calls is now more advanced with
the availability of video calls. Even games on mobile phones are also evolving into online games
with more attractive graphics as well as allowing communication between players. For some,
mobile gaming has become a source of income. These developments have all been supported by
the advancement of broadband technology, especially mobile broadband.
The advancement of broadband technology has not only benefited the fields of entertainment and
communication. Its impact towards social and economic development cannot be ignored.
Broadband technology helps to facilitate education, healthcare, banking and online transactions
as well as the provision of government services through smartphone applications62.
The movement restrictions imposed throughout Malaysia in response to the Covid-19 pandemic
has seen quality internet access emerge as a significant barrier preventing online learning for
some students, coupledd with a lack of access to internet compatible electronic devices63. Poor
mobile broadband quality may jeopardise educational and developmental opportunities among
an entire section of the population. Thus, the provision of quality broadband service should be
prioritised due to its importance to the Malaysian population.
58 An earlier version of this chapter authored by Muhammad Nazhan Kamaruzuki was published in Malay by KRI on 12
February 2021 as a Discussion Paper titled “Kualiti Jalur Lebar Mudah Alih dan Teras Pembangunannya”. 59 Talal Abu Ghazali (2004) 60 MCMC (2020b) 61 MCMC (2020b) 62 ITU (2015) 63 Hawati and Jarud (2020)

CHAPTER 2
THE QUALITY OF MOBILE BROADBAND AND KEY POLICY RECOMMENDATIONS
41 KHAZANAH RESEARCH INSTITUTE
This chapter discusses the quality of broadband services provided by telecommunications
companies in Malaysia. A performance analysis is important to determine the standards of service
provided to consumers. Poor service results in a greater likelihood of online activities being
disrupted and may not even be worth the costs of subscription. More importantly, it may harm
the economic and social development of people who are already disadvantaged. This chapter also
assesses whether there exists a technology gap in Malaysia based on user location and whether
users receive good network coverage and service throughout the day.
Several indicators can be used to assess the quality of mobile broadband service. However, this
chapter focuses on download speeds as the most basic indicator of quality. Download speeds
determine the amount of data that can be transferred to the user (via electronic devices like
smartphones) in a given time period. Data is then processed and translated in the form of texts,
audio, images, videos or functions in an online game. Higher broadband speeds indicate a higher
quality. Download speeds are typically measured in kilobytes per second (kbps) or megabytes
per second (Mbps). In this chapter, download speeds will be measured in Mbps for the purposes
of standardisation.
The issue of service quality can be examined based on reports published by the Malaysian
Communications and Multimedia Commission (MCMC) as well as Opensignal. Both reports
contain data related to download speeds from several telecommunications companies in
Malaysia but differ in their methodology. This chapter also presents the results of a small-scale
test conducted by the author alongside a group of users to evaluate the quality of broadband
performance in greater depth.
A discussion of several key policies based on results and analysis conducted is presented in the
final section of this chapter. The first key policy is the provision of the best coverage in each area
even if it may not be profitable. The second key policy is a pre-emptive approach to the
improvement and upgrading of infrastructure in order to reduce service outages, especially in
times of crisis such as the current Covid-19 pandemic. Since infrastructure investment requires
government funding and intervention, the third key policy is the wider use of funds alongside
strategic arrangements between government and industry players.
Quality of service report
Users typically have the choice of internet service through either mobile broadband or fixed
broadband. Fixed line broadband requires a physical connection to internet cables and has a
higher download speed than mobile broadband. However, not every region can be connected to
landlines especially with fibre optics. The cost of mobile broadband subscriptions is typically
based on data packages and quotas while the cost of fixed lines is based on speed.
Telecommunications companies also offer wireless broadband that use mobile broadband
networks such as 4G LTE. This service is common in areas that do not have fiberised fixed
broadband. The data capacity of such wireless broadband package is usually higher than mobile
broadband subscriptions. Wireless broadband requires the use of routers and connects users via
Wi-Fi while mobile broadband is connected directly to user devices via SIM cards on which users
can use 2G, 3G and 4G networks.

CHAPTER 2
THE QUALITY OF MOBILE BROADBANDS AND KEY POLICY RECOMMENDATIONS
KHAZANAH RESEARCH INSTITUTE 42
2.2.1. Mobile broadband in Malaysia
Mobile broadband began to grow after 3G networks were introduced in the early 2000s in
Malaysia64. 3G technology can accommodate the use of mobile internet via radio frequencies
compared to the previous technology, 2G, which is limited to voice calls and text messaging. 3G
technology also allows the use of smartphone applications that require more stable internet
services such as video calls65 with a speed of up to 21.6Mbps66. With the advancement of mobile
internet, 4G and 4G LTE networks were introduced in the Malaysian market in 2013 promising
faster speeds than the 3G network67.
When it comes to 4G network, there are several terms that refer to specific technologies and their
capabilities. The International Telecommunication Union – Radiocommunications Sector (ITU-R)
sets a minimum download speed of 100Mbps (while moving) and 1,000Mbps (while static) for
4G networks. However, telecommunications companies using Long Term Evolution (LTE)
technology are not able to meet this minimum68. Therefore, LTE refers to technologies that are
closer to achieving the 4G standards set by the ITU-R. In turn, 4G LTE-A or Long Term Evolution
– Advanced technologies are even more sophisticated than LTE, which almost meet the 4G
standards set by the ITU-R. In Malaysia, LTE and LTE-A networks are allowed to be labelled as 4G
although only 4G LTE-A can give a speed of more than 100Mbps to consumers69. In 2019, the
MCMC reported 4G LTE coverage in Malaysia reached a rate of 82.2% in remote areas70 but there
is no information regarding the coverage of 4G LTE-A.
Nowadays, the world awaits the emergence of 5G that promises greater capabilities and speeds
than the mobile broadband technology we now enjoy. 5G technology can provide a download
speed of more than 1,000Mbps, which is several times faster than 3G and 4G, and is able to
accommodate the use of the Internet of Things on a large scale such as in an industrial area and
in smart cities71. Malaysia did not miss out on the introduction of 5G technology, with the launch
of a technology demonstration project in Langkawi, Kedah in January 202072.
64 Sevia Mahdaliza and Mohd Ariff Bin Arifin (2008) 65 GSMArena (n.d) 66 Gong (2020) 67 Nor Aziati Abdul Hamid et al. (2016) 68 Rodiadee Nordin (2016), Shahrul Yusof (2019), Robert (2021) 69 Rodiadee Nordin (2016), Shahrul Yusof (2019), MCMC (2020a) 70 MCMC (2020c) 71 Gong (2020) 72 Bernama (2020)

CHAPTER 2
THE QUALITY OF MOBILE BROADBAND AND KEY POLICY RECOMMENDATIONS
43 KHAZANAH RESEARCH INSTITUTE
However, while new technologies are being developed in Malaysia, the quality of existing mobile
broadband services need to be constantly evaluated and improved upon as there are still
concerns regarding coverage and quality of service from consumers73. A study from the Malaysian
Consumer Forum (CFM) reported that during the Movement Control Order (MCO), user feedback
claimed that they did not enjoy promised internet speeds. There were even complaints from users
who could not acquire any network access in their homes and places of residence due to the
absence of nearby telecommunication towers74. The media has also reported a lower grade of
mobile broadband services in Malaysia compared to countries considered less economically
developed, such as Vietnam, Cambodia and Myanmar75.
2.2.2. Aside from network coverage, what other factors affect the quality of service?
Signal degradation problems can occur even when a user is in an area with good network
coverage. These problems occur when there are physical obstructions such as concrete, bricks,
walls and metal frames that interfere with the propagation and reduce the power density of
electromagnetic waves, resulting in a phenomenon known as path loss76. This can adversely affect
the quality of service, especially indoors.
In addition, a large volume of data traffic by many users can also result in network congestion,
which then affects service. A study found that this was common in high density urban areas in the
Klang Valley, contributing to service performances lower than those in the suburbs77.
Generally, increased traffic can be addressed with more spectrum allocation to service companies
as well as the construction of base stations that manage data traffic in an area78. Network
problems within a building may require radio frequency testing to be carried out to see what
types of improvements are needed79. Small cell antennae are a great way to improve coverage in
buildings, but this requires telecommunications companies, building owners and tenants, facility
managers as well as local governments to come to a consensus.
Infrastructure reliability remains a factor when it comes to the quality of good mobile broadband
services in an area. For example, optical fibres in the backhaul can support mobile broadband
services in accommodating larger data traffic, while more innovative technologies such as small
cell technology and smart active antennae are needed in dense urban areas and that have limited
space for the construction of base stations80. Currently only 40% of telecommunication towers
are connected to fibre optic cables, contributing to the poor quality of mobile broadband
services81.
73 CFM (2019) 74 CFM (2020) 75 Ng (2020), Kugan (2019) 76 CAS Dataloggers (2016) 77 WCC and UTM (2017) 78 WCC and UTM (2017) 79 CAS Dataloggers (2016) 80 CAS Dataloggers (2016), Carpenter (n.d) 81 MCMC (2019d)

CHAPTER 2
THE QUALITY OF MOBILE BROADBANDS AND KEY POLICY RECOMMENDATIONS
KHAZANAH RESEARCH INSTITUTE 44
Reliable infrastructure development requires continuous commitment from industry players. In
2018, the MCMC reported that telecommunications companies’ capital expenditure for
infrastructure upgrading had decreased compared to the previous year and that the ratio of said
expenditure to revenue in 2018 was below the global average82.
Apart from addressing the lack of infrastructure in certain areas, the commitment to providing
better network services should be further strengthened. Although mobile broadband network
coverage was high (91.8%of Malaysia is covered by a 4G network83) this does not always correlate
to a satisfactory quality of service. This is because some areas do not have telecommunications
towers in their vicinity while in other areas, there may be issues of internal coverage preventing
peak performance even with towers nearby.
2.2.3. Quality performance reports from MCMC
MCMC is the government agency responsible for regulating telecommunications in Malaysia
including mobile broadband services. In line with this responsibility, MCMC has published several
reports on the development of the telecom industry in Malaysia.
These reports include The Quality of Service Network Performance Reports84 that assess the
quality of telecommunications services in the provision of voice calling and broadband services
in Malaysia. Based on selected indicators, the reports examine the quality of fixed line broadband
and mobile broadband services as well as voice calling from several telecommunication
companies in Malaysia.
In 2019, the report named Maxis as the best mobile broadband service company in Malaysia in
terms of best average download speed, best overall download speed, lowest network sensitivity
as well as the lowest percentage of data packet loss.
Mandatory parameters or standards that must be complied with by mobile broadband service
providers in Malaysia are as follows85:
1. Download speeds (or broadband speeds) of at least 1Mbps 80% of the time;
2. Response time or round-trip time (RTT) of a data packet that does not exceed 250ms
(milliseconds) 70% of the time; and
3. Data packet loss that does not exceed 3%.
When it comes to the measurement of download speeds that indicate the rate of transfer of data
to a user’s device in a given time, the higher the value, the better. In contrast, when it comes to
response times and packet losses measuring the time period in which the data will appear and
how much data fails to reach the user (which cause lagging and buffering), the lower the value
the better. According to the MCMC report, all wireless and mobile broadband services offered by
companies in Malaysia met the mandatory standards in 2019.
82 MCMC (2018) 83 MCMC (2020d) 84 MCMC (n.d) 85 MCMC (2019a, 2019e)

CHAPTER 2
THE QUALITY OF MOBILE BROADBAND AND KEY POLICY RECOMMENDATIONS
45 KHAZANAH RESEARCH INSTITUTE
Nonetheless, there is still room for this standard to be made more relevant to current needs by
taking into consideration increased data traffic, indoor use and use on the move (such as through
navigation applications). This encourages telecommunication companies to constantly ensure
acceptable service through continuous infrastructure improvement and effective response to
quality issues.
The mandatory standard for internet speed in Malaysia came into force in 2016 and was then
renewed in 2018. In 2019, there were recommendations to amend these mandatory standards to
include achieving minimum download speeds of 30Mbps86. Among the countries that set higher
download speed standards compared to Malaysia are Poland (30Mbps for 100% of households),
the USA (25Mbps), Qatar (100Mbps for 96% of households) and Germany (10 Mbps for 98% of
households)87. In these countries, meeting the standards is a condition of spectrum distribution
to telecommunication companies88 .
Data on quality achievement of mobile broadband services is reported by each state and
telecommunications company based on download speed indicators, the RTT of packets and data
packet loss. This chapter focuses on download speed indicators.
Figure 2.1 shows the average data download speed per telecommunications company by state in
2019. Based on Figure 2.1, Maxis has the highest speed in Malaysia and in all states except in
Terengganu and Johor (where Digi has a higher download speed).
86 MCMC (2019f) 87 WCC and UTM (2017) 88 WCC and UTM (2017)

CHAPTER 2
THE QUALITY OF MOBILE BROADBANDS AND KEY POLICY RECOMMENDATIONS
KHAZANAH RESEARCH INSTITUTE 46
Figure 2.1: Average download speed by state and telecommunications company (Mbps), 2019
Maxis Digi
Celcom U Mobile
Yes TM/Unifi Mobile
Note: Labuan data is not reported Source: MCMC (2020a), rounded to one decimal place
32.3
42.6
36.4
35.9
35.2
35.2
34.3
33.5
33.5
32.7
30.3
27.3
27.2
25.5
22.3
0 20 40
Malaysia
Pahang
Sarawak
Selangor
Melaka
KL/Putrajaya
Perlis
Kelantan
N. Sembilan
Kedah
Terengganu
Perak
P. Pinang
Johor
Sabah
Mbps
25.3
33.8
33.1
31.9
31.5
30.9
26.8
26.3
25.8
25.1
21.8
20.9
20.0
19.3
16.3
0 20 40
Malaysia
Pahang
Terengganu
N. Sembilan
Kelantan
Johor
Kedah
Melaka
Sarawak
Selangor
KL/Putrajaya
Perak
Perlis
P. Pinang
Sabah
Mbps
23.2
36.1
33.0
32.5
30.4
27.5
20.4
19.9
19.3
18.7
16.0
15.8
14.3
14.3
13.3
0 20 40
Malaysia
Pahang
KL/Putrajaya
Selangor
Terengganu
Kelantan
Johor
N. Sembilan
Sabah
P. Pinang
Perak
Perlis
Kedah
Melaka
Sarawak
Mbps
14.4
26.2
19.3
18.8
18.4
17.9
16.0
14.3
12.7
12.5
11.9
11.7
11.7
10.9
10.2
0 20 40
Malaysia
Kedah
N. Sembilan
Pahang
Perak
Terengganu
Perlis
Sabah
P. Pinang
Selangor
Melaka
KL/Putrajaya
Kelantan
Sarawak
Johor
Mbps
16.2
25.1
20.8
17.3
17.1
16.5
16.0
15.4
15.4
15.1
14.7
14.3
13.2
13.1
10.5
0 20 40
Malaysia
KL/Putrajaya
Johor
Kelantan
Melaka
Pahang
Perak
P. Pinang
Selangor
N. Sembilan
Terengganu
Sabah
Perlis
Kedah
Sarawak
Mbps
11.3
15.7
13.1
12.7
12.4
11.7
11.3
11.1
11.1
10.7
10.6
10.5
9.7
6.7
5.0
0 20 40
Malaysia
KL/Putrajaya
Selangor
Perak
Kedah
Terengganu
Melaka
P. Pinang
Pahang
Perlis
Sarawak
Johor
Sabah
Kelantan
N. Sembilan
Mbps
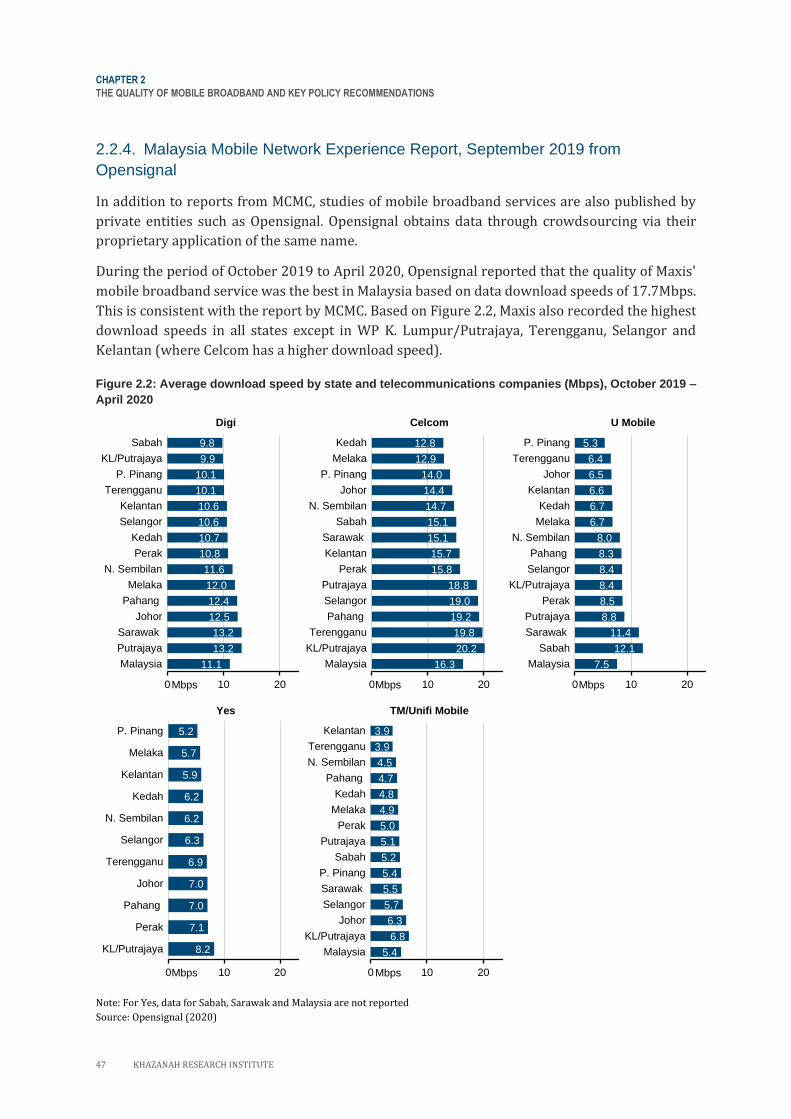
CHAPTER 2
THE QUALITY OF MOBILE BROADBAND AND KEY POLICY RECOMMENDATIONS
47 KHAZANAH RESEARCH INSTITUTE
2.2.4. Malaysia Mobile Network Experience Report, September 2019 from
Opensignal
In addition to reports from MCMC, studies of mobile broadband services are also published by
private entities such as Opensignal. Opensignal obtains data through crowdsourcing via their
proprietary application of the same name.
During the period of October 2019 to April 2020, Opensignal reported that the quality of Maxis'
mobile broadband service was the best in Malaysia based on data download speeds of 17.7Mbps.
This is consistent with the report by MCMC. Based on Figure 2.2, Maxis also recorded the highest
download speeds in all states except in WP K. Lumpur/Putrajaya, Terengganu, Selangor and
Kelantan (where Celcom has a higher download speed).
Figure 2.2: Average download speed by state and telecommunications companies (Mbps), October 2019 –
April 2020
Digi Celcom U Mobile
Yes TM/Unifi Mobile
Note: For Yes, data for Sabah, Sarawak and Malaysia are not reported
Source: Opensignal (2020)
11.1
13.2
13.2
12.5
12.4
12.0
11.6
10.8
10.7
10.6
10.6
10.1
10.1
9.9
9.8
0 10 20
Malaysia
Putrajaya
Sarawak
Johor
Pahang
Melaka
N. Sembilan
Perak
Kedah
Selangor
Kelantan
Terengganu
P. Pinang
KL/Putrajaya
Sabah
Mbps
16.3
20.2
19.8
19.2
19.0
18.8
15.8
15.7
15.1
15.1
14.7
14.4
14.0
12.9
12.8
0 10 20
Malaysia
KL/Putrajaya
Terengganu
Pahang
Selangor
Putrajaya
Perak
Kelantan
Sarawak
Sabah
N. Sembilan
Johor
P. Pinang
Melaka
Kedah
Mbps
7.5
12.1
11.4
8.8
8.5
8.4
8.4
8.3
8.0
6.7
6.7
6.6
6.5
6.4
5.3
0 10 20
Malaysia
Sabah
Sarawak
Putrajaya
Perak
KL/Putrajaya
Selangor
Pahang
N. Sembilan
Melaka
Kedah
Kelantan
Johor
Terengganu
P. Pinang
Mbps
8.2
7.1
7.0
7.0
6.9
6.3
6.2
6.2
5.9
5.7
5.2
0 10 20
KL/Putrajaya
Perak
Pahang
Johor
Terengganu
Selangor
N. Sembilan
Kedah
Kelantan
Melaka
P. Pinang
Mbps
5.4
6.8
6.3
5.7
5.5
5.4
5.2
5.1
5.0
4.9
4.8
4.7
4.5
3.9
3.9
0 10 20
Malaysia
KL/Putrajaya
Johor
Selangor
Sarawak
P. Pinang
Sabah
Putrajaya
Perak
Melaka
Kedah
Pahang
N. Sembilan
Terengganu
Kelantan
Mbps
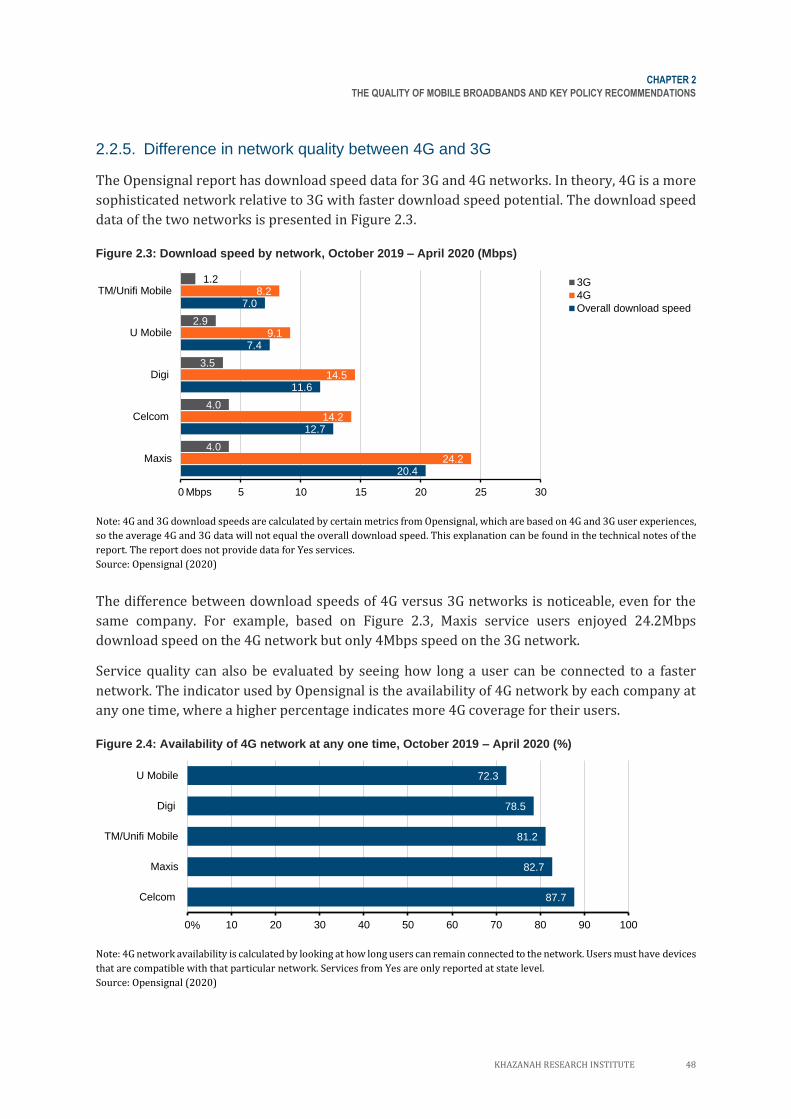
CHAPTER 2
THE QUALITY OF MOBILE BROADBANDS AND KEY POLICY RECOMMENDATIONS
KHAZANAH RESEARCH INSTITUTE 48
2.2.5. Difference in network quality between 4G and 3G
The Opensignal report has download speed data for 3G and 4G networks. In theory, 4G is a more
sophisticated network relative to 3G with faster download speed potential. The download speed
data of the two networks is presented in Figure 2.3.
Figure 2.3: Download speed by network, October 2019 – April 2020 (Mbps)
Note: 4G and 3G download speeds are calculated by certain metrics from Opensignal, which are based on 4G and 3G user experiences,
so the average 4G and 3G data will not equal the overall download speed. This explanation can be found in the technical notes of the
report. The report does not provide data for Yes services.
Source: Opensignal (2020)
The difference between download speeds of 4G versus 3G networks is noticeable, even for the
same company. For example, based on Figure 2.3, Maxis service users enjoyed 24.2Mbps
download speed on the 4G network but only 4Mbps speed on the 3G network.
Service quality can also be evaluated by seeing how long a user can be connected to a faster
network. The indicator used by Opensignal is the availability of 4G network by each company at
any one time, where a higher percentage indicates more 4G coverage for their users.
Figure 2.4: Availability of 4G network at any one time, October 2019 – April 2020 (%)
Note: 4G network availability is calculated by looking at how long users can remain connected to the network. Users must have devices
that are compatible with that particular network. Services from Yes are only reported at state level.
Source: Opensignal (2020)
20.4
12.7
11.6
7.4
7.0
24.2
14.2
14.5
9.1
8.2
4.0
4.0
3.5
2.9
1.2
0 5 10 15 20 25 30
Maxis
Celcom
Digi
U Mobile
TM/Unifi Mobile3G
4G
Overall download speed
Mbps
87.7
82.7
81.2
78.5
72.3
0 10 20 30 40 50 60 70 80 90 100
Celcom
Maxis
TM/Unifi Mobile
Digi
U Mobile
%
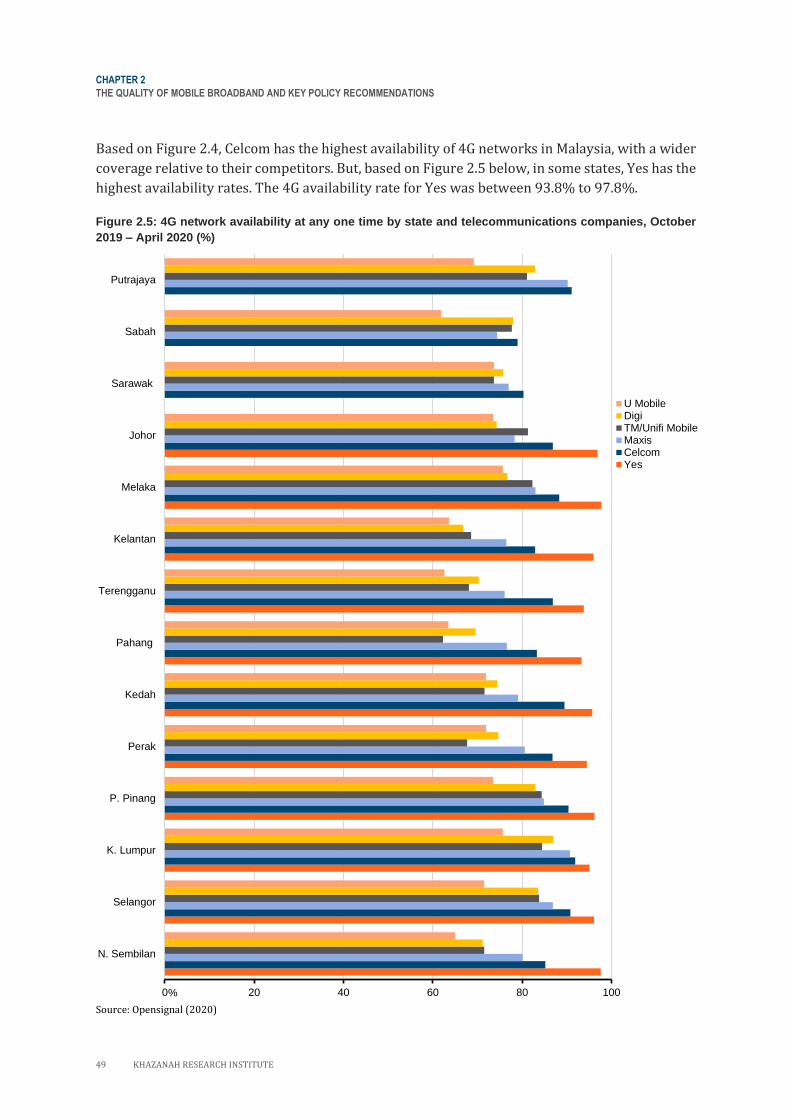
CHAPTER 2
THE QUALITY OF MOBILE BROADBAND AND KEY POLICY RECOMMENDATIONS
49 KHAZANAH RESEARCH INSTITUTE
Based on Figure 2.4, Celcom has the highest availability of 4G networks in Malaysia, with a wider
coverage relative to their competitors. But, based on Figure 2.5 below, in some states, Yes has the
highest availability rates. The 4G availability rate for Yes was between 93.8% to 97.8%.
Figure 2.5: 4G network availability at any one time by state and telecommunications companies, October
2019 – April 2020 (%)
Source: Opensignal (2020)
0 20 40 60 80 100
N. Sembilan
Selangor
K. Lumpur
P. Pinang
Perak
Kedah
Pahang
Terengganu
Kelantan
Melaka
Johor
Sarawak
Sabah
Putrajaya
U MobileDigiTM/Unifi MobileMaxisCelcomYes
%

CHAPTER 2
THE QUALITY OF MOBILE BROADBANDS AND KEY POLICY RECOMMENDATIONS
KHAZANAH RESEARCH INSTITUTE 50
2.2.6. Analysis of the disparity between MCMC and Opensignal reports
Difference in download speeds between the two reports
The download speeds indicated in the MCMC report is much higher than in the Opensignal report.
For example, the MCMC reported average Maxis download speed in Malaysia at 32.3Mbps but the
data recorded by the Opensignal report indicates instead a figure of 17.7Mbps.
These differences may be due to data collection methods. Opensignal data is crowdsourced by
users based on the actual speed they experienced. The Opensignal app operates when activated
by users or while other applications are in use with the permission from the app developers89.
Most of the data was taken when users were indoors, reflecting regular internet use. Their
measurements did not involve the use of special software or equipment such as radio frequency
devices90.
In contrast, the data provided by MCMC was based on self-reporting by telecommunication
companies in accordance with testing guidelines provided by MCMC91. These guidelines involved
testing in at least 15 locations across the country based on several criteria including user feedback
as well as the specific configuration of specific testing equipment at predetermined test
locations92.
Inconsistent download speeds dependent on location
Based on the MCMC report, the quality of service is highly dependent on user location even when
subscribing to the same telecommunications company. For example, a Celcom customer enjoying
a high-speed average of 36.1Mbps in Pahang may not enjoy the same speed in Melaka, since the
average speed in Melaka is only 14.28Mbps, which is over 50% slower than in Pahang. Similar
circumstances can be gleaned from the Opensignal report. Users who wish to access high internet
speeds anywhere in the country may need to subscribe to more than one network by different
companies. This, of course, would entail a hefty cost to the average consumer.
It is a common perception that network service is superior in urban areas compared to rural areas
due to the higher consumer demand and thus higher returns from investment on infrastructure
development in urban areas93. From this, it is intuitive to assume that the quality of network
service in the city especially in the Klang Valley would be better due to the presence and constant
development of telecommunication infrastructure.
89 Opensignal (2019) 90 Opensignal (2019) 91 MCMC (2016) 92 MCMC (2016) 93 MCMC (2006)

CHAPTER 2
THE QUALITY OF MOBILE BROADBAND AND KEY POLICY RECOMMENDATIONS
51 KHAZANAH RESEARCH INSTITUTE
However, there are some states outside the Klang Valley region recording higher download
speeds for certain companies. Opensignal data shows the fastest data download speed for U
Mobile networks are in Sabah and Sarawak. Studies show that the percentage of internet users94
in the city is growing and on average tend to be users of mobile broadband95. This can cause a
drastic uptick of internet traffic in urban areas and contribute to the decline in the quality of
network services there.
Even though consumers are covered by a 4G network, download speeds are not necessarily
high
Based on Opensignal, Yes leads the 4G network availability in most states (see Figure 2.5), ahead
of key industry players, namely Maxis, Celcom and Digi. However, based on Figure 2.2, the
download speed enjoyed by Yes users in any state does not exceed 10Mbps. The 4G speed enjoyed
by Yes users is only slightly higher than the 3G network speed of other companies.
As discussed earlier, 4G services need to be supported by the development of reliable
infrastructure including fibre optic base stations. This raises the question of whether the potential
of 4G network by Yes and other companies remains distorted due to such technical limitations.
Moreover, the term 4G itself consists of multiple versions with different technical aspects and
capabilities. Generally, it can be divided into 4G LTE and 4G LTE-A as discussed, with LTE-A
having better speed than LTE. However, the Opensignal data does not report on these types of 4G
networks in any detail.
More specific data at the local level is needed to better reflect the reality of network service
In terms of analysis, speed data from both MCMC and Opensignal are only down to the state level.
Moreover, the MCMC report does not isolate data for WP Kuala Lumpur and Putrajaya. There is a
need to monitor the quality of network services at more specific localities such as at the district,
city and neighbourhood level. Service outages can occur even within buildings or in high density
areas even with good network coverage.
Such data will further reflect the reality of quality of service that users enjoy, and more accurate
analysis can be made. Based on the MCMC report, the best telecommunication company in
Malaysia in 2019, Maxis, recorded an average download speed of 32.32Mbps but in Sabah the
company recorded only 22.27Mbps. Is the quality of the already low average speed felt equally
across all areas in the state, or do some areas have it worse?
94 MCMC (2019b) 95 MCMC (2020c)

CHAPTER 2
THE QUALITY OF MOBILE BROADBANDS AND KEY POLICY RECOMMENDATIONS
KHAZANAH RESEARCH INSTITUTE 52
Download speed test
2.3.1. Background of the download speed test
As discussed, data in the MCMC and Opensignal report is limited to the state level. Neither have
information on services at more local levels such as individual districts, towns or
neighbourhoods. Such data requirements can better reflect the quality of broadband service that
consumers enjoy.
To investigate this, a small-scale download speed test was conducted together with a group of
mobile broadband service users. The objective of this test was to assess the quality of service
enjoyed by users of mobile broadband services in different locations. There were 10 participants
in the test. All of them used broadband services from the same company as well as the same plan.
Other information about this test can be referred to in Table 2.1.
Table 2.1: Information on the download speed test
Information
Network service 4G
Date and time
7 June 2020 Session 1: 9am – 11am Session 2: 4pm – 5pm Session 3: 9pm – 10pm
Number of participants 10 participants
Location Participants respective residences and locations
Application used to assess quality
Opensignal
Quality of service indicator
Download speed (Mbps) Upload speed (Mbps) PING RTT Note: Indicators above are shown by the application, but only the download speed indicator will be discussed in this chapter
It should be noted that the results of this test may not be representative of the experiences of all
users in a location due to the small sample size. The objective of this test was only to observe
whether users always achieve the download speed promised by service providers and to
determine how download speed in different locations differ.
2.3.2. Observation 1: Download speeds are significantly better early in the day
Test results showed download speeds in the morning were faster than in the afternoon and
evening. More than half of the participants (6/10) recorded an average to high download speed
reading in the morning.

CHAPTER 2
THE QUALITY OF MOBILE BROADBAND AND KEY POLICY RECOMMENDATIONS
53 KHAZANAH RESEARCH INSTITUTE
Figure 2.6: Average download speed recorded by participants from their respective locations
Note: The reading for the participant located in Sungai Merab could not be completed even after three attempts. The participant was
also unable to receive any network service from their location. Because of this, 0Mbps was recorded as the download speed for the
participant.
Based on Figure 2.6, significant download speed differences were observed even on the same day.
Download speed in Bandar Kinrara 3, Puchong in the morning was recorded at 17.34Mbps which
decreased to 0.52Mbps by evening. The participant in Kampung Jelutong, Hulu Selangor enjoyed
an average download speed of 50.20Mbps in the morning which then dropped to 38.14Mbps in
the afternoon and further to 31.42Mbps at night. Since increased data traffic can result in a
reduction in download speed, it is possible that the number of broadband users in the morning is
fewer than at other times of the day.
50.2
22.9
17.3
25.5
12.3
10.8
4.4
1.7
0.3
0.0
38.1
20.6
0.5
6.4
4.2
2.3
2.8
3.9
0.2
0.0
31.4
2.2
16.9
0.4
13.9
2.0
3.8
3.8
1.0
0.0
0 10 20 30 40 50 60
Kampung Jelutong, Hulu Selangor
Desa Petaling, Kuala Lumpur
Bandar Kinrara 3, Puchong
Bandar Mahkota Cheras, Kajang dan Ayer 8,Putrajaya
Bukit Damansara, Kuala Lumpur
Kampung Delek, Klang
Taman Tenaga, Kajang
Presint 11, Putrajaya
Taman Sahabat, Telok Panglima Garang
Sungai Merab, Kajang
Night
Afternoon
Morning
Mbps
Putrajayaand

CHAPTER 2
THE QUALITY OF MOBILE BROADBANDS AND KEY POLICY RECOMMENDATIONS
KHAZANAH RESEARCH INSTITUTE 54
2.3.3. Observation 2: The quality of service in urban areas requires further attention
Generally, urban areas with many users are thought to have more telecommunications
infrastructure due to higher demand and a higher return on investment potential. Companies are
thought to be more interested in providing networks there which indirectly contributes to a gap
in telecommunication infrastructure between urban and rural areas96. Thus, the general
assumption is that the network quality in urban areas is good by default. However, observations
from the test conducted highlights that this assumption is not necessarily true.
Table 2.2: Average download speeds recorded by participants within and outside Klang Valley
Download speed (Mbps)
Participant Location Morning Evening Night Daily
average
Participant 1 Kampung Jelutong, Hulu Selangor 50.20 38.14 31.42 39.92
Participant 2 Desa Petaling, Kuala Lumpur 22.90 20.58 2.21 15.23
Participant 3 Bandar Kinrara 3, Puchong 17.34 0.52 16.88 11.58
Participant 4 Bandar Mahkota Cheras, Kajang and Ayer 8, Putrajaya
25.49 6.36 0.35 10.73
Participant 5 Bukit Damansara, Kuala Lumpur 12.26 4.16 13.87 10.10
Participant 6 Kampung Delek, Klang 10.85 2.32 2.04 5.07
Participant 7 Taman Tenaga, Kajang 4.45 2.78 3.75 3.66
Participant 8 Presint 11, Putrajaya 1.72 3.90 3.84 3.15
Participant 9 Taman Sahabat, Telok Panglima Garang
0.32 0.22 0.97 0.50
Participant 10 Sungai Merab, Kajang 0.00 0.00 0.00 0.00
Note: Download speed data presented is taken from an average of five tests per session. The data in grey shaded rows are from
participants within Klang Valley. Participant 4 was in Ayer 8, Putrajaya in the afternoon.
The results of the tests in Table 2.2 above demonstrate that participants who were in the Klang
Valley area received varying levels of service quality. For example, as a daily average, Participant
8 in Precinct 11, Putrajaya received only a download speed of 3.15Mbps, but the speeds recorded
by Participant 5 in Bukit Damansara was significantly higher at 10.1Mbps.
2.3.4. Observation 3: The lowest recorded speeds were below the minimum
standard
In Malaysia, service companies need to ensure the minimum mobile broadband download speed
of 1Mbps almost all the time97. Table 2.3 compares the 1Mbps speed requirement with the
average speed experienced by the test participants.
96 MCMC (2006) 97 MCMC (2020a)

CHAPTER 2
THE QUALITY OF MOBILE BROADBAND AND KEY POLICY RECOMMENDATIONS
55 KHAZANAH RESEARCH INSTITUTE
Table 2.3: Average download speeds recorded by participants below the minimum standard
Download speed (Mbps)
Participant Location Morning Evening Night Daily
average
Participant 1 Kampung Jelutong, Hulu Selangor 50.20 38.14 31.42 39.92
Participant 2 Desa Petaling, Kuala Lumpur 22.90 20.58 2.21 15.23
Participant 3 Bandar Kinrara 3, Puchong 17.34 0.52 16.88 11.58
Participant 4 Bandar Mahkota Cheras, Kajang and Ayer 8, Putrajaya
25.49 6.36 0.35 10.73
Participant 5 Bukit Damansara, Kuala Lumpur 12.26 4.16 13.87 10.10
Participant 6 Kampung Delek, Klang 10.85 2.32 2.04 5.07
Participant 7 Taman Tenaga, Kajang 4.45 2.78 3.75 3.66
Participant 8 Presint 11, Putrajaya 1.72 3.90 3.84 3.15
Participant 9 Taman Sahabat, Telok Panglima Garang
0.32 0.22 0.97 0.50
Participant 10 Sungai Merab, Kajang 0.00 0.00 0.00 0.00
Note: Download speed data presented is taken from an average of at least five tests per session. Data in grey shaded rows are
participants who experience download speeds below 1 Mbps during at least on one session.
Two participants experienced speeds below 1Mbps on average per day, namely Participant 9
located in Taman Sahabat, Teluk Panglima Garang and Participant 10 at Sungai Merab, Kajang. As
mentioned in the notes for Figure 2.6, Participant 10 was unable to complete an entire speed test
session due to network issues and was automatically recorded in this study as 0Mbps. In addition,
two participants (3 and 4) had download speeds below 1Mbps in at least one of the sessions.
These speed differences can be caused by various factors such as the distance of the participants
from the telecommunication towers or base stations. It is not impossible that these areas are still
lacking in basic infrastructure. It is also possible that low speeds are caused by path loss that
occurs when participants are inside their home, which is a common problem in high-rise units. If
path loss is indeed a major factor, it may indicate that alternative infrastructure may be needed.
2.3.5. Observation 4: No participant recorded download speeds above 100Mbps,
even with the best network coverage
Another concerning observation was the maximum download speed or peak download speed of
100Mbps. The maximum download speed indicates whether or not users enjoy the benefit of the
4G network technology. According to the MCMC report, a maximum download speed above
100Mbps can be obtained in areas that have LTE Advanced (LTE-A) network through
smartphones that are compatible with the network98.
98 MCMC (2020a; 2019c)

CHAPTER 2
THE QUALITY OF MOBILE BROADBANDS AND KEY POLICY RECOMMENDATIONS
KHAZANAH RESEARCH INSTITUTE 56
Based on the test conducted, none of the participants recorded an average download speed of
100Mbps or higher. Even for individual reading, no participant recorded a reading of 100Mbps
or higher. There were participants who achieved 4G LTE-A coverage but their highest download
speeds seemed to fall short of 100Mbps. 4G LTE-A coverage can be determined by a 4G+ signal
symbol on the participant's phone screen.
Table 2.4: Download speed recorded by network type
Download speed (Mbps)
Participant Location Signal Symbol Lowest Highest Daily
Average
Participant 1 Kampung Jelutong, Hulu Selangor 4G 12.00 68.20 39.92
Participant 2 Desa Petaling, Kuala Lumpur 4G+ 0.35 40.90 15.23
Participant 3 Bandar Kinrara 3, Puchong H+ 0.00 20.10 11.58
Participant 4 Bandar Mahkota Cheras, Kajang and Ayer 8, Putrajaya
4G+ 0.00 35.70 10.73
Participant 5 Bukit Damansara, Kuala Lumpur 4G 0.17 68.20 10.10
Participant 6 Kampung Delek, Klang 4G+ 0.88 14.50 5.07
Participant 7 Taman Tenaga, Kajang 4G+ 1.12 5.88 3.66
Participant 8 Presint 11, Putrajaya H+ 0.00 6.34 3.15
Participant 9 Taman Sahabat, Telok Panglima Garang
4G+ 0.10 1.46 0.50
Participant 10 Sungai Merab, Kajang NA 0.00 0.00 0.00
Note: Data in grey shaded rows represent participants with access to a 4G LTE-A network.
It should be acknowledged that indoor signal degradation may be the potential cause for the poor
speed of the LTE-A network. However, this raises the question of whether the situation should
simply be ignored when users are left with a quality of service that is unstable and much poorer
than is marketed by service providers? Because of this, official data is needed not only on 4G and
4G LTE coverage but also 4G LTE-A as a basic indicator for monitoring digital infrastructure
development policies. For the record, the MCMC reported that Malaysia had an 82.2% 4G LTE
network coverage rate in populated areas as of 201999 but coverage for the 4G LTE-A is not stated.
Conclusion and discussion on key policies
This section discusses the quality issues of mobile broadband services based on data from reports
published by MCMC and Opensignal as well as observations from a small-scale test conducted for
this chapter.
99 MCMC (2020e)

CHAPTER 2
THE QUALITY OF MOBILE BROADBAND AND KEY POLICY RECOMMENDATIONS
57 KHAZANAH RESEARCH INSTITUTE
Both MCMC and Opensignal reports indicate that download speeds are inconsistent and heavily
dependent on location, even for the same service. Download speed data shows that there are still
issues in the quality of mobile internet services including those in urban areas, with some states
outside the Klang Valley recording better download speeds. Although users get 4G network
coverage, they do not necessarily enjoy higher speeds than what 3G networks offer.
Moreover, existing reports lack download speed data in more detailed localities such as at the
neighbourhood, city and district level. More granular data would allow better analysis on the
quality of service that users experience in reality.
In addition to the two reports, a download speed test was conducted to review and evaluate the
quality of service that users enjoy. Observations from the test conducted found that the download
speeds were inconsistent throughout the day. Moreover, users who are in cities do not necessarily
enjoy better quality than those outside cities. There are also users who experienced broadband
speed below the minimum standards. In fact, no user enjoyed a download speed of more than
100Mbps even with 4G LTE-A.
The reports and test reflect the need for improvement in the quality of mobile broadband services
in Malaysia through infrastructure development in all locations. This is important because
societal dependence on the use of mobile phones and mobile internet for their daily activities is
not limited to communication and entertainment alone. There are many economic opportunities
and social benefits from internet use such as carrying out online business and online learning.
Thus, there are several key policies that need to be implemented when it comes to providing
infrastructure, telecommunications facilities and the Internet.
2.4.1. Key policy 1: Provide a high quality network service in all locations
Every user should be entitled to a high quality service regardless of the location whether in a rural
area or in a city. This is because internet is becoming a basic necessity at par with water and
electricity. Ideally, the 4G LTE-A network standards should be the minimum available to
consumers nationwide. This is to ensure that consumers get the best consistent coverage and
quality of service no matter where they are.
The commitment to 4G infrastructure development should continue to be supported alongside
the development of 5G network. Every residence should be guaranteed access to the internet
especially the mobile broadband coverage through the provision of cellular towers, satellite
coverage or other appropriate measures. In this context, the government should ideally provide
incentives and facilitate telecommunications companies in providing the best infrastructure
possible, including in areas deemed unprofitable.

CHAPTER 2
THE QUALITY OF MOBILE BROADBANDS AND KEY POLICY RECOMMENDATIONS
KHAZANAH RESEARCH INSTITUTE 58
The National Fiberisation and Connectivity Plan (NFCP), launched in early 2019, is a commitment
by the Malaysian government to provide sustainable, comprehensive, high quality and affordable
digital connectivity for the population100. The NFCP has several targets and the five-year plan is
estimated to cost RM21.6 billion101. In terms of mobile broadband targets, the NFCP still declares
3G as the minimum network level in some parts of the country. This should be reconsidered in
the NFCP because 3G networks have been rendered relatively obsolete in terms of internet
download speeds. Industry players may also be less interested in continuing to commit to service
improvements for ‘outdated’ technology.
However, since the Covid-19 pandemic showed how urgently internet upgrades are needed, the
NFCP targets have been improved through the National Digital Network (JENDELA)102. JENDELA
targets 100% 4G coverage in residential areas. It also aims to end 3G network by 2021 and replace
it entirely with 4G network. While 4G coverage extension, especially 4G LTE-A, is important,
equally important is ensuring consumers can actually enjoy the promised benefits of 4G network.
The JENDELA plan has outlined the principle of blanket approval from local authorities and state
governments for the construction of internet infrastructure and making it a public utility103. These
two measures would have tremendous impact on national development planning, especially in
residential planning. For example, housing developers would need to ensure stable broadband
access in each of their residential units just like they do with other utilities such as water and
electricity. It is hoped that these measures will also assist in cutting through bureaucratic red tape
when it comes to infrastructure development and upgrading.
In tandem with the plan, the existing mandatory standards should also be renewed to be more
relevant to current needs. Is the minimum download speed still enough to cover the use of data
intensive activities such as working from home and online learning? Are existing standards in line
with the effort to get 4G coverage in full? How should new factors such as 4G LTE-A coverage rate
and signal degradation be taken into consideration?
2.4.2. Key policy 2: A pre-emptive approach in strategically developing
communications infrastructure
Most internet users in Malaysia rely on mobile broadband service and data usage will likely only
increase over time. Getting the most advanced network coverage is no guarantee of good service.
Network quality can be disrupted due to signal degradation and increased data traffic, such as in
buildings and in densely populated areas. Download speed can also be impacted by a surge in
internet usage as during the MCO.
100 MCMC (n.d) 101 MCMC (2019d) 102 PMO (2020) 103 MCMC (2020f)

CHAPTER 2
THE QUALITY OF MOBILE BROADBAND AND KEY POLICY RECOMMENDATIONS
59 KHAZANAH RESEARCH INSTITUTE
Indeed, throughout the Covid-19 pandemic, tales abound of Malaysians struggling to gain internet
access. In Sabah, a student was forced to climb a tree for better connectivity to sit for an
examination104. In the same state, there have been news reports of students falling from a hanging
bridge while trying to gain internet access105. In Kelantan, a man had to build a tent on a hill so
his son could sit there while attending online classes as it was the only spot where they could get
stable access to internet106. Even in ‘smart cities’ like Cyberjaya, there are still internet quality
problems making it necessary for some users to hang their internet connection devices outside
high-rise residential units107.
Therefore, industry players and the government need to act appropriately to prevent similar
outcomes in the future whether caused by a pandemic or other calamities. Signal degradation and
internet traffic surge can be expected and measures to mitigate such risks should be in place.
Although mobile broadband infrastructure requires fibre optic connections, less than half of
telecommunication towers are integrated with the appropriate technology, and as a result, some
are not yet capable of delivering 4G network108. Through the blanket approval principle, it is
hoped that the infrastructure upgrading work to solve service quality issues can be simplified.
In addition, the government should provide incentives for companies to remain committed to
improving and maintaining infrastructure already in place. This includes monitoring
infrastructure reliability, signal degradation problems and data traffic, and allocating the
spectrum strategically. It would be undesirable for infrastructure built to be left poorly
maintained to the extent that it negatively impacts the quality of service. In addition, emergency
plans and redundant infrastructure should be available and put in place in the event of natural
disasters or maintenance work that could potentially impact the quality of service.
2.4.3. Key policy 3: Wider and more strategic use of funds
The bulk of the costs of the NFCP and JENDELA is funded by the Universal Service Provision (USP),
with the rest coming from government funds. Prior to these two plans, the USP was also used to
fund the National Broadband Initiatives (NBI) Plan launched in 2010. The NBI was the
government's initial commitment to expand high-speed broadband services.
The USP is a fund collected from 6% of the net revenue of Malaysian telecommunications
companies. It aims to implement initiatives that can bridge the digital divide between urban and
rural areas, to balance the tendency of telecommunication companies to only develop
infrastructure in areas with commercial returns109. Most initiatives through the USP fund are
carried out in rural areas, including the construction of telecommunication towers and
community internet centres.
104 BBC (2020) 105 Mikail (2020) 106 Rohana Idris (2020) 107 Buletin TV3 (2020) 108 TV3MALAYSIA Official (2020) 109 MCMC (n.d)

CHAPTER 2
THE QUALITY OF MOBILE BROADBANDS AND KEY POLICY RECOMMENDATIONS
KHAZANAH RESEARCH INSTITUTE 60
However, this fund can also be expanded to upgrade urban infrastructure to address quality
issues. This should be done in strategic partnership between industry players and the
government so that the use of USP funds does not neglect the development of rural areas. The
development includes realising various aspects of the digital inclusion agenda such as providing
access to digital devices, building technologically-literate communities and improving digital
services (such as government, health and financial services)110.
At the same time, the government should be cautious in funding programmes in cooperation with
the private sector which allows for complete autonomy in managing internet programmes. This
is not only a matter of investment returns but also about mitigating unintended impacts on
society. For example, the Indian government has rejected Facebook's Free Basics program that
limits user access and disproportionately benefits certain platforms over others111.
It is hoped that with these core policies, building digital infrastructure can be undertaken
efficiently and with no one left behind.
110 Gong (2020) 111 Gong (2020)
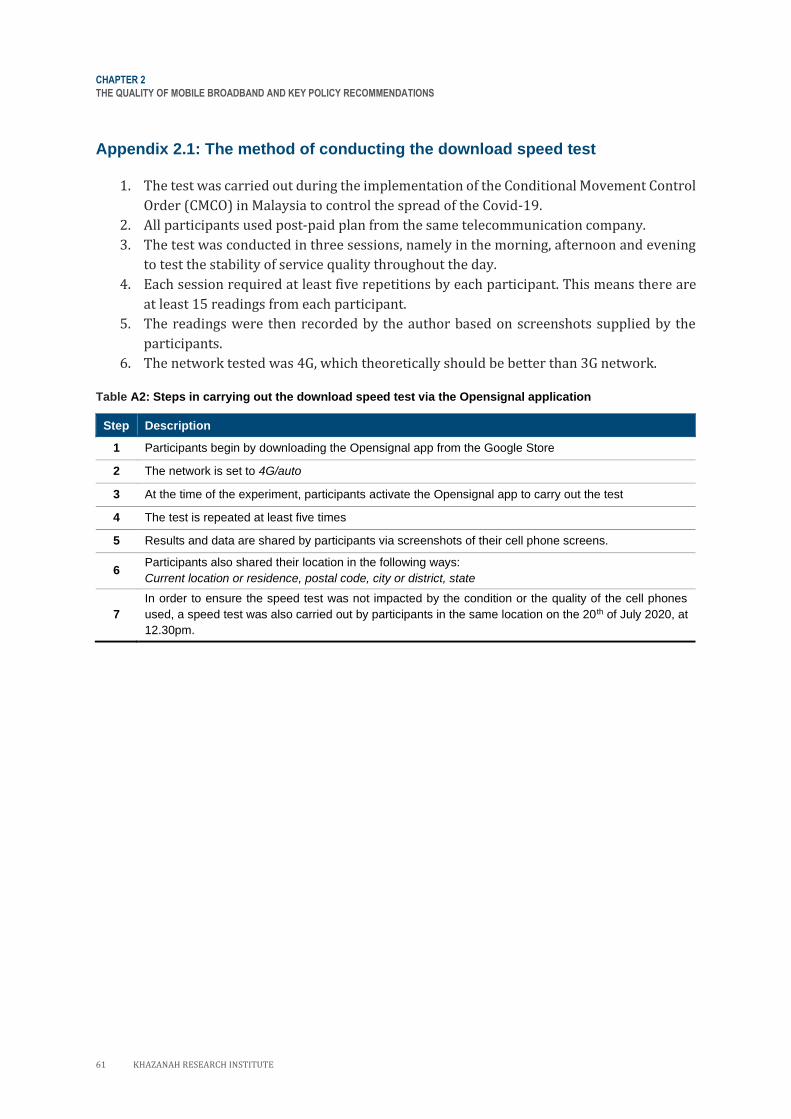
CHAPTER 2
THE QUALITY OF MOBILE BROADBAND AND KEY POLICY RECOMMENDATIONS
61 KHAZANAH RESEARCH INSTITUTE
Appendix 2.1: The method of conducting the download speed test
1. The test was carried out during the implementation of the Conditional Movement Control
Order (CMCO) in Malaysia to control the spread of the Covid-19.
2. All participants used post-paid plan from the same telecommunication company.
3. The test was conducted in three sessions, namely in the morning, afternoon and evening
to test the stability of service quality throughout the day.
4. Each session required at least five repetitions by each participant. This means there are
at least 15 readings from each participant.
5. The readings were then recorded by the author based on screenshots supplied by the
participants.
6. The network tested was 4G, which theoretically should be better than 3G network.
Table A2: Steps in carrying out the download speed test via the Opensignal application
Step Description
1 Participants begin by downloading the Opensignal app from the Google Store
2 The network is set to 4G/auto
3 At the time of the experiment, participants activate the Opensignal app to carry out the test
4 The test is repeated at least five times
5 Results and data are shared by participants via screenshots of their cell phone screens.
6 Participants also shared their location in the following ways:
Current location or residence, postal code, city or district, state
7
In order to ensure the speed test was not impacted by the condition or the quality of the cell phones
used, a speed test was also carried out by participants in the same location on the 20th of July 2020, at
12.30pm.

CHAPTER 2
THE QUALITY OF MOBILE BROADBANDS AND KEY POLICY RECOMMENDATIONS
KHAZANAH RESEARCH INSTITUTE 62
References
BBC. 2020. “Malaysian Student Sits Exams in a Tree to Access Wifi.” BBC News, June 18, 2020, sec. News from Elsewhere. https://www.bbc.com/news/blogs-news-from-elsewhere-53079907.
Bernama. 2020. “PROJEK DEMONSTRASI 5G KEJAYAAN BESAR UNTUK SKMM,” January 19, 2020. https://www.penerangan.gov.my/japenv2/index.php/2020/01/19/projek-demonstrasi-5g-kejayaan-besar-untuk-skmm-gobind/.
Buletin TV3. 2020. MASALAH INTERNET | Ganggu Produktiviti, Susah Bekerja. https://www.youtube.com/watch?v=FXU3MJ2rwYk.
Carpenter, Tom. n.d. “Mobile and Optical Fiber - the Need to Work Together.” n.d. https://www.ppc-online.com/blog/mobile-and-optical-fiber-the-need-to-work-together.
CAS Dataloggers. 2016. “The Basics of Signal Attenuation,” November, 9. CFM. 2019. “ADUAN RANGKAIAN DAN HARGA PERKHIDMATAN JALUR LEBAR BERKELAJUAN
TINGGI (HSBB) CATAT PENINGKATAN BAGI TAHUN 2018 -.” consumerinfo (blog). March 28, 2019. https://consumerinfo.my/aduan-rangkaian-dan-harga-perkhidmatan-jalur-lebar-berkelajuan-tinggi-hsbb-catat-peningkatan-bagi-tahun-2018/?lang=ms.
———. 2020. “BANCIAN CFM: TIGA DARIPADA LIMA RAKYAT MALAYSIA TIDAK MENDAPAT KELAJUAN INTERNET SEPERTI YANG DIJANJIKAN -.” September 25, 2020. http://www.consumerinfo.my/bancian-cfm-tiga-daripada-lima-rakyat-malaysia-tidak-mendapat-kelajuan-internet-seperti-yang-dijanjikan/?lang=ms.
Gong, Rachel. 2020. “Digital Inclusion: Assessing Meaningful Internet Connectivity in Malaysia.” Kuala Lumpur: Khazanah Research Institute. http://www.krinstitute.org/assets/contentMS/img/template/editor/20200907%20Inclusion%20v4.0.pdf.
GSMArena. n.d. “Network Coverage in Malaysia - 2G/3G/4G Mobile Networks.” n.d. https://www.gsmarena.com/network-bands.php3?sCountry=Malaysia.
Hawati, Abdul Hamid, and Romadan Khalidi Jarud. 2020. “Covid-19 and Unequal Learning.” Kuala Lumpur: Khazanah Research Institute. http://krinstitute.org/assets/contentMS/img/template/editor/20200426_Covid_Education_v3.pdf.
ITU. 2015. “Broadband Situation in Rural and Remote Areas.” International Telecommunication Union and United Nations Education, Scientific and Cultural Organization. https://www.itu.int/en/ITU-D/Technology/Documents/RuralCommunications/Broadband_Situations_in_Rural_and_Remote_Areas_Full.pdf.
Kugan. 2019. “OpenSignal: Malaysia 4G Internet Speed Faster than Indonesia & Thailand.” MalaysianWireless. March 2, 2019. https://www.malaysianwireless.com/2019/03/opensignal-malaysia-4g-speeds/.
MCMC. 2006. “Universal Service Provision Annual Report 2006.” Cyberjaya: Suruhanjaya Komunikasi dan Multimedia Malaysia. https://www.mcmc.gov.my/skmmgovmy/files/00/00617ae4-133a-4657-b8b2-a953edef6c64/files/assets/basic-html/page-29.html.

CHAPTER 2
THE QUALITY OF MOBILE BROADBAND AND KEY POLICY RECOMMENDATIONS
63 KHAZANAH RESEARCH INSTITUTE
———. 2016. “GUIDELINES TO THE COMMISSION DETERMINATION ON THE MANDATORY STANDARDS FOR QUALITY OF SERVICE (WIRELESS BROADBAND ACCESS SERVICE), DETERMINATION 1 OF 2016.” Cyberjaya: Suruhanjaya Komunikasi dan Multimedia Malaysia. mcmc.gov. https://www.mcmc.gov.my/skmmgovmy/media/General/pdf/Guideline-Wireless-Broadband-Access-Service.pdf.
———. 2018. “Internet Users Survey 2018.” 1823–2523. Malaysian Communications and Multimedia Commission. https://www.mcmc.gov.my/skmmgovmy/media/General/pdf/Internet-Users-Survey-2018.pdf.
———. 2019a. “Industry Performance Report 2018.” Cyberjaya: Malaysian Communications and Multimedia Commission. https://www.mcmc.gov.my/skmmgovmy/media/General/pdf/Industry-Performance-Report-2018.pdf.
———. 2019b. “Internet Users Survey 2018.” Annual Survey 1823–2523. Malaysia: MCMC. https://www.mcmc.gov.my/skmmgovmy/media/General/pdf/Internet-Users-Survey-2018.pdf.
———. 2019c. “Network Performance Report 2018: Measuring Malaysia Broadband and Voice Performance.” Cyberjaya: Suruhanjaya Komunikasi dan Multimedia Malaysia. https://www.skmm.gov.my/skmmgovmy/media/General/pdf/Network-Performance-Report-2018_1.pdf.
———. 2019d. “Optimising Existing 4G Networks Key In Laying The Foundation For 5G Deployment.” Malaysian Communications And Multimedia Commission (MCMC) | Suruhanjaya Komunikasi Dan Multimedia Malaysia (SKMM). March 27, 2019. https://www.mcmc.gov.my/en/media/press-releases/optimising-existing-4g-networks-key-in-laying-the.
———. 2019e. “MCMC Clarifies Allegations On National Fiberisation And Connectivity Plan | Malaysian Communications And Multimedia Commission (MCMC).” Malaysian Communications And Multimedia Commission (MCMC) | Suruhanjaya Komunikasi Dan Multimedia Malaysia (SKMM). September 3, 2019. https://www.mcmc.gov.my/en/media/press-releases/mcmc-clarifies-allegations-on-national-fiberisatio.
———. 2019f. “PROPOSAL FOR REVIEW OF THE MANDATORY STANDARDS FOR QUALITY OF SERVICE (WIRELESS BROADBAND ACCESS SERVICE) (DETERMINATION NO. 1 OF 2016).” Suruhanjaya Komunikasi dan Multimedia Malaysia. https://www.mcmc.gov.my/skmmgovmy/media/General/pdf/Public-Inquiry-MSQoS-Wireless-Broadband.pdf.
———. 2020a. “Network Performance Report 2019: Measuring Malaysia Broadband and Voice Performance.” Cyberjaya: Malaysian Communications and Multimedia Commission. https://www.mcmc.gov.my/en/resources/reports/qos-network-performance-reports.
———. 2020b. “Broadband Demand Survey 2019.” Cyberjaya: Suruhanjaya Komunikasi dan Multimedia Malaysia. https://www.mcmc.gov.my/en/resources/statistics/broadband-demand-survey.
———. 2020c. “Communication and Multimedia: Facts Figures 1Q 2020.” Cyberjaya: Suruhanjaya Komunikasi dan Multimedia Malaysia. https://www.mcmc.gov.my/skmmgovmy/media/General/pdf/1Q-2020-C-M-Facts-and-Figures.PDF.

CHAPTER 2
THE QUALITY OF MOBILE BROADBANDS AND KEY POLICY RECOMMENDATIONS
KHAZANAH RESEARCH INSTITUTE 64
———. 2020d. “Monthly Bulletin: August 2020.” Monthly Bulletin. Cyberjaya: Suruhanjaya
Komunikasi dan Multimedia Malaysia. https://www.mcmc.gov.my/skmmgovmy/media/General/pdf/C-M-Monthly-Bulletin-August-2020.pdf.
———. 2020e. “Industry Performance Report 2019.” Cyberjaya: Malaysian Communications and Multimedia Commission. https://www.mcmc.gov.my/skmmgovmy/media/General/pdf/BM-MCMC_IPR_2.pdf.
———. 2020f. “Rangkaian 3G Di Malaysia Tamat Akhir 2021 | Malaysian Communications And Multimedia Commission (MCMC).” Suruhanjaya Komunikasi Dan Multimedia Malaysia. December 30, 2020. https://www.mcmc.gov.my/ms/media/press-clippings/rangkaian-3g-di-malaysia-tamat-akhir-2021.
———. n.d. “NFCP - Home.” Suruhanjaya Komunikasi Dan Multimedia Malaysia (SKMM). n.d. https://www.nfcp.my/.
———. n.d. “Pemberian Perkhidmatan Sejagat.” Suruhanjaya Komunikasi dan Multimedia Malaysia. n.d. https://www.mcmc.gov.my/ms/sectors/universal-service-provision.
———. n.d. “Reports | Malaysian Communications And Multimedia Commission (MCMC).” Malaysian Communications And Multimedia Commission (MCMC) | Suruhanjaya Komunikasi Dan Multimedia Malaysia (SKMM). n.d. https://www.mcmc.gov.my/en/resources/reports.
Mikail, Yun. 2020. “3 Pelajar Cari Akses Internet Kelas ‘online’ Jatuh Jambatan.” Berita Harian. November 26, 2020. https://www.bharian.com.my/berita/nasional/2020/11/758832/3-pelajar-cari-akses-internet-kelas-online-jatuh-jambatan.
Ng, Nicole. 2020. “Is the MCO Causing Slower Internet for Malaysians? We Investigate.” CILISOS - Current Issues Tambah Pedas! (blog). April 14, 2020. https://cilisos.my/is-the-mco-causing-slower-internet-for-malaysians-we-investigate/.
Nor Aziati Abdul Hamid, Siew Hoon Ang, Nor Hazana Abdullah, Yunos Ngadiman, and M.F. Ahmad. 2016. “The Adoption of 4G Mobile Network Services in Klang Valley.” In Proceedings of 2016 the 6th International Workshop on Computer Science and Engineering. WCSE. https://doi.org/10.18178/wcse.2016.06.042.
Opensignal. 2019. “Methodology Overview.” Opensignal. June 12, 2019. https://www.opensignal.com/methodology-overview.
———. 2020. “Malaysia Mobile Network Experience Report April 2020.” London: Opensignal. https://www.opensignal.com/reports/2019/09/malaysia/mobile-network-experience.
Prime Minister’s Office. 2020. “Kenyataan Media Mengenai Jalinan Digital Negara (JENDELA).” Pejabat Perdana Menteri Malaysia (blog). August 29, 2020. https://www.pmo.gov.my/2020/08/kenyataan-media-mengenai-jalinan-digital-negara-jendela/.
Robert, Triggs. 2021. “4G vs LTE: What Is the Difference?” Media. Android Authority. January 16, 2021. https://www.androidauthority.com/4g-vs-lte-274882/.
Rodiadee Nordin. 2016. “50 Dalil Kenapa LTE Bukan Rangkaian 4G.” Media. Majalah Sains (blog). June 19, 2016. https://www.majalahsains.com/50-dalil-kenapa-lte-bukan-rangkaian-4g/.
Rohana Idris. 2020. “Berkhemah Di Atas Bukit Cari ‘line’ Nak Jawab Periksa [METROTV] | Harian Metro.” November 29, 2020. https://www.hmetro.com.my/mutakhir/2020/11/647378/berkhemah-di-atas-bukit-cari-line-nak-jawab-periksa-metrotv.

CHAPTER 2
THE QUALITY OF MOBILE BROADBAND AND KEY POLICY RECOMMENDATIONS
65 KHAZANAH RESEARCH INSTITUTE
Sevia Mahdaliza and Mohd Ariff Bin Arifin. 2008. “3G Telecommunication Technology in Malaysia.
In: Wireless Communication Technology In Malaysia.” In Wireless Communications Technology in Malaysia, 12. Johor Bahru: Penerbit UTM. http://eprints.utm.my/id/eprint/14290/.
Shahrul Yusof. 2019. “Apakah perbezaan di antara 4G dan LTE.” Harian Teknologi (blog). March 14, 2019. https://hteknologi.com/blog/beza-antara-4g-dan-lte/.
Talal Abu Ghazali. 2004. “A Brief Insight on ICT Development.” Speech presented at the The Arab ICT Regulators Forum, Jordan, March 21. https://media.tagorg.com/UploadFiles/Speeches/2004/A%20_BRIEF%20_INSIGHT%20_ON%20_ICT%20_DEVELOPMENT_%20ROLE.pdf.
TV3MALAYSIA Official. 2020. Pelan Jalinan Digital Negara (JENDELA) | Soal Rakyat (Sabtu, 24 Oktober 2020). https://www.youtube.com/watch?v=dp28gP_T_mc.
WCC and UTM. 2017. “Perspectives on Malaysia Broadband Development 2020.” Wireless Communication Centre and Universiti Teknologi Malaysia. https://www.malaysianwireless.com/wp-content/uploads/2017/08/UTM_Perspective-on-Malaysia-Mobile-Broadband-Development-2020.pdf.

KHAZANAH RESEARCH INSTITUTE 66
CHAPTER
03 DIGITAL PLATFORM WORK: HOW DIGITAL ACCESS AND COMPETENCIES AFFECT JOB-SEEKING
3.1 Introduction 67
3.2 Technological progress and the future of work 68
3.3 Benefits and risks of digital platform work 69
3.4 Data and methods 70
3.4.1 The eRezeki platform 70
3.4.2 Caveats and limitations 72
3.4.3 Data and hypotheses 72
3.5 Findings 76
3.5.1 Digital platform job-seekers in Malaysia are predominantly women, young and highly educated 76
3.5.2 Degree holders are the most active digital platform job-seekers 76
3.5.3 Fixed broadband and computer access are crucial for job-seeking 78
3.5.4 Email and digital payment skills indicate high job-seeking activity 78
3.5.5 Young job-seekers, women, and non-degree holders benefit most from digital access and digital competencies 79
3.6 Policy discussion 82
3.6.1 Policy improvement 1: Increasing digital access 83
3.6.2 Policy improvement 2: Making digital skills training accessible 84
3.6.3 Policy improvement 3: Strengthening portable social protection 85
3.7 Conclusion 86
References 88

67 KHAZANAH RESEARCH INSTITUTE
DIGITAL PLATFORM WORK: HOW DIGITAL ACCESS AND
COMPETENCIES AFFECT JOB-SEEKING112
By Tan Zhai Gen and Rachel Gong
“The gig economy could create opportunity for some people, but it could also amplify the
same problems that made the world of work terrifying in the first place; insecurity,
increased risk, lack of stability, and diminishing workers' rights...”
Sarah Kessler113
Introduction
Movement restrictions and closure of public places and shops during the Covid-19 pandemic have
led to a boom in sales and services purchases through online platforms, such as food and groceries
delivery apps. These online platforms rely on informal short-term workers114 to supply these
services, which also provide incomes for workers who have lost their jobs due to the economic
downturn. While some of these workers may choose to go back into formal employment as the
economy recovers, a growing group of them is likely to remain in this new economy.
The rise of these temporary workers is enabled by improvements in digital platform technologies
matching workers to tasks, thus increasing the variety and volume of tasks available due to
greater access to the internet and remote work opportunities. These tasks can range from
complex digital work (for example, designing a website) to repetitive digital micro-tasks (for
example, labelling images) to tasks that are digitally-enabled but not done digitally (for example,
food delivery). Digital platform technologies have allowed workers to find tasks and incomes
locally and globally.
This chapter examines the demographics of digital platform job-seekers in Malaysia and the
factors that influence their job-seeking activity in the digital job market. Demographics here refer
to the age, gender and education level of these job-seekers and factors influencing job-seeking
activity consist of digital access and digital competencies. In addition to increasing understanding
of digital platform workers in emerging countries like Malaysia, this chapter also identifies policy
areas that can enable workers to enjoy the benefits of digital platforms while mitigating the risks
from lack of social protection.
112 An earlier version of this chapter authored by Tan Zhai Gen and Rachel Gong was published by KRI on 20 January
2021 as a Discussion Paper titled “Digital Platform Work: How digital access and competencies affect job-seeking”. 113 Kessler (2018) 114 Nur Thuraya Sazali and Tan (2019)

CHAPTER 3
DIGITAL PLATFORM WORK: HOW DIGITAL ACCESS AND COMPETENCIES AFFECT JOB-SEEKING
KHAZANAH RESEARCH INSTITUTE 68
Technological progress and the future of work
The advancement of digital and communication technologies has led to the unbundling of the
economy, no longer requiring talent and human capital crucial for the core business to be located
close to the site of business and essentially allowing the decentralisation of work to various places
around the world115. Core services, such as product design and project management, can be
performed and even outsourced through accessible high-speed internet connections and capable
tele-conferencing software. This has been accelerated by the Covid-19 pandemic which severely
limited face-to-face interactions and international travel.
Digital platform companies have used these technologies to create tools and platforms to enable
communication and task organisation between companies and workers, including organising
tasks to be performed by freelancers and contingent workers. The levels of centralisation and
agency that workers have depend on the nature of the task and the business process—workers
in some platforms do not have much control over choosing the task that is algorithmically
distributed to them, while workers in other platforms may have a lot more control over the task
they pick to do.116.
Despite the differences in how workers are organised, these platforms allow firms and employers
to tap into talent pools from all around the world while saving on some of the cost of employment.
Digital platform workers, who are frequently informal and non-standard workers, are able to
earn income from anywhere in the world and work flexibly. In particular, high-skill workers in
developing nations are able to use their skills to complete tasks offered globally and earn
significantly higher income due to exchange rate differences, especially when the demand for
their skills may be low locally117.
Globally, workers in the digital platform economy have rapidly increased in the last decade. In
2015, the number of global microtask platform workers was estimated to be at 48 million, of
which 10% were estimated to be active118. These workers have also been increasing at a rate of
14% per year119. Traditional surveys found that as many as 11% of the total workforce earned
income through digital platform work in the United Kingdom (UK), with at least 3% doing it at
least weekly120, while roughly 0.5% of the United States (US) labour force was employed by online
labour platforms121.
115 Baldwin (2019) 116 Sutherland and Jarrahi (2018); Ticona, Mateescu, and Rosenblat (2018) 117 Berg et al. (2018); Gurumurthy et al. (2019) 118 Kuek et al. (2015) 119 Kässi and Lehdonvirta (2018) 120 Huws and Joyce (2016) 121 Katz and Krueger (2016)

CHAPTER 3
DIGITAL PLATFORM WORK: HOW DIGITAL ACCESS AND COMPETENCIES AFFECT JOB-SEEKING
69 KHAZANAH RESEARCH INSTITUTE
A global survey on digital microtask platform workers carried out between 2015 and 2017 by the
International Labour Organization (ILO) found that workers were mainly from urban areas,
where four out of five workers are from urban or suburban communities122. In developing
countries, these workers were younger compared to developed countries, with more men than
women. The workers were well-educated, with 37% holding degrees and 20% holding post-
graduate degrees. In Asia, nearly 80% of workers had bachelor’s degrees or higher. Looking at
the five largest microtask platforms in 2015, it was found that software development and
technology were the most sought-after skills, comprising a third of all vacancies123—possibly a
reason for the large proportion of highly-skilled workers on these platforms.
Benefits and risks of digital platform work
One of the main attractions of digital platform work is the flexibility to choose which tasks to
complete and when to complete them, benefiting full time digital platform workers, part-time
digital platform workers who already have full-time jobs and those who have important care-
work to perform124. For workers in developing countries, this is an opportunity to use their skills
and talents globally, especially when the demand for their skills is low or non-existent locally125.
Income from developed countries is also typically higher compared to local income due to
exchange rate differences. Digital platforms also allow the rise of the “passion economy”, which
enables entrepreneurship among those who exploit the digital platform technology to only work
on tasks that they are interested in126.
From a policy standpoint, digital platform work can reduce “brain drain” by allowing highly-
skilled workers in developing countries to work remotely for higher wages than they would
otherwise earn locally, with some scholars considering this a “silver bullet” for development.
There are also job opportunities that do not require high skills, allowing non-specialist workers
to participate in platform work in developing countries127. Thus, some governments place high
value on digital platform work as a source of employment128.
However, workers venturing into digital platform work are also exposed to new vulnerabilities.
The nature of this work is informal and the workers are part of informal employment—the work
is temporary and workers are seen as contract workers and not permanent employees of the
digital platform or the firm that pays them for the completion of tasks129. This means workers
lack the various employer-linked protections that safeguard the current and future well-being of
the workers, such as health insurance, as these protections are typically only provided for formal
employees.
122 Berg et al. (2018) 123 Kässi and Lehdonvirta (2018) 124 Berg et al. (2018) 125 Kessler (2018); Berg et al. (2018) 126 Davidson (2020) 127 Schriner and Oerther (2014) 128 Lehdonvirta et al. (2018) 129 Bloodworth (2019); Kessler (2018); Berg et al. (2018); Ticona, Mateescu, and Rosenblat (2018); Graham, Hjorth,
and Lehdonvirta (2017); Nur Thuraya Sazali and Tan (2019)

CHAPTER 3
DIGITAL PLATFORM WORK: HOW DIGITAL ACCESS AND COMPETENCIES AFFECT JOB-SEEKING
KHAZANAH RESEARCH INSTITUTE 70
Some digital platforms do not provide basic workplace safety protections, exposing workers to
physical and mental harm, especially in countries where basic occupational health and safety
protection regulations and implementation are weak, or exclude contract or temporary workers.
For example, microtask digital platform workers hired to evaluate social media posts for violent
content have been exposed to horrific photos and videos as part of their work, without being
given mental health support. Workers on care work platforms may also lack occupational
support, especially when meeting potentially abusive clients or clients in dangerous areas130.
The algorithmic control of workers on some digital microtask platforms has also led to the
dehumanisation of workers, leading to workers being compelled to constantly be on-call by their
clients to remain “competitive” on these platforms131. Because these workers are not hired
directly by the digital platforms, they do not receive benefits such as health insurance and
retirement funds. Not having these benefits increases their vulnerability when economic shocks
happen132.
Many workers also found that work on these digital microtask platforms provided few
opportunities for skills training and upgrading, as the nature of work on the platforms did not
challenge workers to upskill and did not incentivise upskilling133. In fact, there is potential for
these workers to experience de-skilling, especially when the digital microtask work is repetitive
and does not require the higher level skills the workers may already possess. On the other hand,
there have also been reports of some workers in developing countries who improved their
English language skills through digital platform work134.
Data and methods
3.4.1. The eRezeki platform
To study the demography of digital platform workers in Malaysia and the factors that influence
job-seeking amongst digital platform workers, we analysed data from eRezeki. eRezeki135 is a task
aggregating digital platform hosted by the Malaysia Digital Economy Corporation (MDEC), a key
government agency in charge of supporting the digital economy development in Malaysia.
eRezeki was set up in the 2015, aimed at increasing job and income opportunities for Malaysians
in the platform economy136. Table 3.1 shows some of the indicators on the participants and
partner digital platforms of eRezeki. The platform targets blue collar workers, individuals from
B40 households (households in the bottom 40% of the country’s income distribution),
unemployed individuals, pensioners, veterans and individuals with disabilities. MDEC actively
recruits users to the eRezeki platform in rural areas, leveraging on existing telecentre facilities,
and through polytechnics and universities in the different parts of the country.
130 Ticona, Mateescu, and Rosenblat (2018) 131 Kessler (2018) 132 Hawk (2018) 133 Berg et al. (2018) 134 Kuek et al. (2015), Berg et al. (2018) 135 MDEC (n.d) 136 Frost & Sullivan (2020)

CHAPTER 3
DIGITAL PLATFORM WORK: HOW DIGITAL ACCESS AND COMPETENCIES AFFECT JOB-SEEKING
71 KHAZANAH RESEARCH INSTITUTE
Table 3.1: Summary of eRezeki performance as of 31 December 2018
Indicators 2016 2017 2018 Cumulative
(2016 – 2018)
Number of B40 community members registered 105,808 154,872 107,314 367,994
Income received by B40 community (RM m) 17.70 95.6 217.02 330.32
Total number of local partners 17 68 86 86
Total number of global partners 5 6 24 24
Source: Frost & Sullivan (2020)
The eRezeki platform filters tasks from partner digital platforms to registered eRezeki job-
seekers based on their stated interests and capabilities. Job-seekers can view a variety of tasks
sourced from partner digital platforms, and are directed to the partner digital platform site after
clicking on the task they are interested in.
Tasks are split into three groups: digital microtasks, digital work and digitally-enabled work
platforms. Digital microtasks are work done digitally and are more repetitive in nature, such as
data entry or image labelling. Digital work is complex work done on a computer, such as coding,
app development or graphic design. Digitally-enabled work is work not necessarily done on a
computer, but enabled through digital means, such as app-based delivery services, ride-hailing or
plumbing services. Digital microtasks and digital work come from both global and local sources
while digitally-enabled work is done and paid locally.
The level of digital skills, competencies and qualifications required for each group of tasks can
differ greatly. Digital microtasks such as image labelling require no special skills. Digital work
such as app development require highly technical and specialised skills. Skills requirements can
even vary within each group of tasks. While some digitally-enabled work such as that offered via
ride-hailing platforms require only a driving license, other digitally-enabled work such as
electrical work and care work requires workers to have official certificates, such as Sijil
Kemahiran Malaysia – Level 3. Some platforms also require workers to complete mandatory
training sessions with qualified trainers before being listed on the platforms, such as workers to
help with car battery maintenance.
The eRezeki user database analysed in this chapter contains data on job-seekers who registered
in the system in 2017 and 2018. It includes their demographic details, namely gender, age and
education level. The database also contains self-reported language skills, digital access (such as
broadband access and computers), basic digital competencies and the tasks that job-seekers are
interested in doing. The system records the date of account creation, date of last login and, most
importantly, the number of jobs viewed and clicked on up until 31 December 2019. However, it
does not categorise job seekers by groups of tasks, thus we were not able to distinguish these in
our analysis.

CHAPTER 3
DIGITAL PLATFORM WORK: HOW DIGITAL ACCESS AND COMPETENCIES AFFECT JOB-SEEKING
KHAZANAH RESEARCH INSTITUTE 72
3.4.2. Caveats and limitations
Another important caveat is that the system only detects clicks made in the eRezeki platform, and
does not include data on whether the job was actually assigned and completed on the partner
platform site. Nor does the database contain information on what type of job was viewed or
clicked on—only the number of jobs per user. Job-seekers could click at the job link on the eRezeki
site and land on the partner platform site, but not actually take the task at the partner platform
site.
The eRezeki platform is not representative of the Malaysian labour force or even the Malaysian
digital platform job market. However, to the best of our knowledge, it is the only comprehensive
database of digital platform job-seekers that provides information on job-seekers’ demographics,
skills and job-seeking activity. Digital platform workers can be difficult to survey due to the nature
of their mobile and ad-hoc work, so the eRezeki database is a valuable consolidated data set of
digital job-seekers across the country.
Thus, despite its limitations, analysis of the eRezeki user database gives an important glimpse
into the demographics of digital platform job-seekers in Malaysia. The eRezeki user database
contains data on job-seekers over a wide range of digital platforms as it includes job-seekers
interested in different types of digital tasks both locally and globally. We do not expect the
behaviour of eRezeki job-seekers to be significantly different from the general labour force or the
digital labour force.
3.4.3. Data and hypotheses
We seek to understand the factors influencing job-seekers’ job-seeking activity in the digital job
market. In the absence of a variable that measures job success, we use a proxy to measure how
actively a person is looking for a job in the eRezeki platform. Our assumption is that, given the
variety of digital work available, more active job-seekers are likely to be more successful at
finding jobs than less active job-seekers, all other things being equal.
The eRezeki system offers us a way to measure job-seeking activity; it tracks the number of jobs
a user views and clicks on. The outcome variable is the average number of clicks per month in the
database. The average number of clicks is used instead of the absolute number of clicks to enable
comparison across job-seekers regardless of when they joined the platform.
For this analysis, we used a cleaned subset of eRezeki data that includes only users with complete
profiles. User demographics in this cleaned dataset are proportionally similar to the full, pre-
cleaned dataset, e.g. women make up 54.2% of the cleaned dataset and 53.8% in the full dataset.
Table 3.2 shows the different characteristics of job-seekers analysed in this chapter. We see how
demographic differences are reflected in the average number of clicks per month. Additionally,
digital access and digital competencies also influence how active job-seekers are on eRezeki.
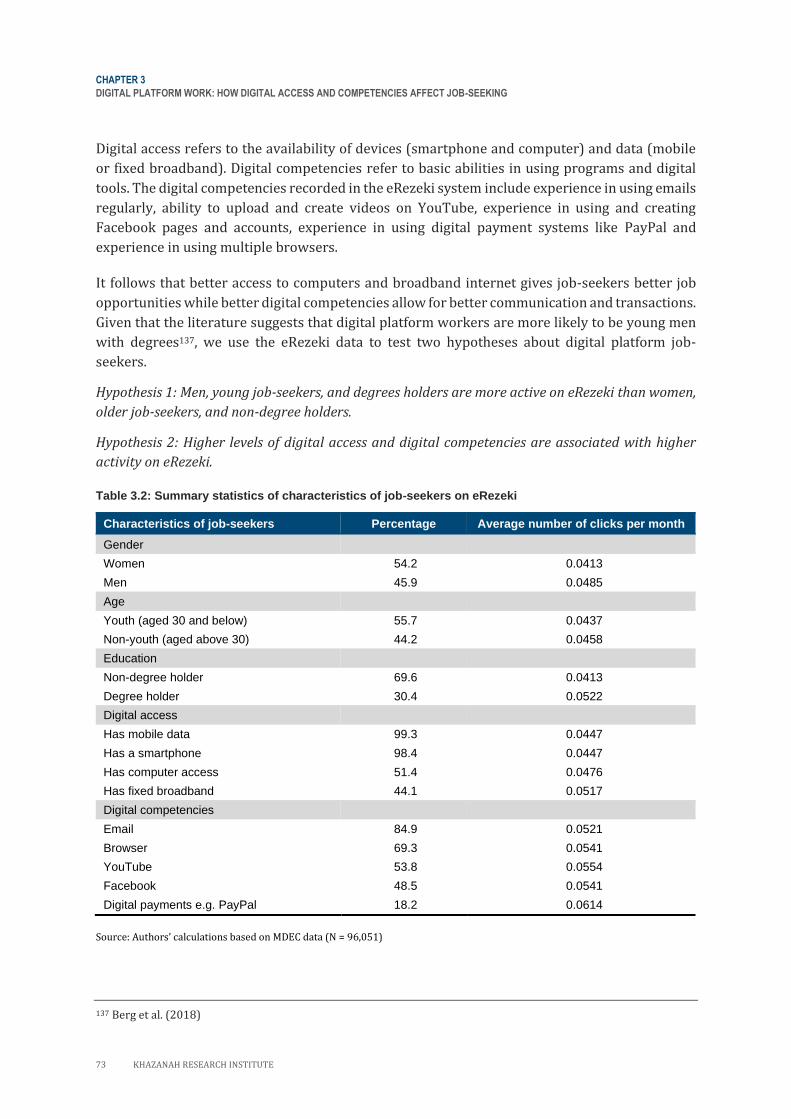
CHAPTER 3
DIGITAL PLATFORM WORK: HOW DIGITAL ACCESS AND COMPETENCIES AFFECT JOB-SEEKING
73 KHAZANAH RESEARCH INSTITUTE
Digital access refers to the availability of devices (smartphone and computer) and data (mobile
or fixed broadband). Digital competencies refer to basic abilities in using programs and digital
tools. The digital competencies recorded in the eRezeki system include experience in using emails
regularly, ability to upload and create videos on YouTube, experience in using and creating
Facebook pages and accounts, experience in using digital payment systems like PayPal and
experience in using multiple browsers.
It follows that better access to computers and broadband internet gives job-seekers better job
opportunities while better digital competencies allow for better communication and transactions.
Given that the literature suggests that digital platform workers are more likely to be young men
with degrees137, we use the eRezeki data to test two hypotheses about digital platform job-
seekers.
Hypothesis 1: Men, young job-seekers, and degrees holders are more active on eRezeki than women,
older job-seekers, and non-degree holders.
Hypothesis 2: Higher levels of digital access and digital competencies are associated with higher
activity on eRezeki.
Table 3.2: Summary statistics of characteristics of job-seekers on eRezeki
Characteristics of job-seekers Percentage Average number of clicks per month
Gender
Women 54.2 0.0413
Men 45.9 0.0485
Age
Youth (aged 30 and below) 55.7 0.0437
Non-youth (aged above 30) 44.2 0.0458
Education
Non-degree holder 69.6 0.0413
Degree holder 30.4 0.0522
Digital access
Has mobile data 99.3 0.0447
Has a smartphone 98.4 0.0447
Has computer access 51.4 0.0476
Has fixed broadband 44.1 0.0517
Digital competencies
Email 84.9 0.0521
Browser 69.3 0.0541
YouTube 53.8 0.0554
Facebook 48.5 0.0541
Digital payments e.g. PayPal 18.2 0.0614
Source: Authors’ calculations based on MDEC data (N = 96,051)
137 Berg et al. (2018)

CHAPTER 3
DIGITAL PLATFORM WORK: HOW DIGITAL ACCESS AND COMPETENCIES AFFECT JOB-SEEKING
KHAZANAH RESEARCH INSTITUTE 74
The modal eRezeki user, contrary to observed global trends, is young (i.e. aged 30 and below) but
more likely to be a woman and a non-degree holder. This is expected given that eRezeki is
targeted at underserved populations of the regular job market. However, when it comes to job-
seeking activity, we see that on average non-youths are more active than youths, men are more
active than women, and degree holders are more active than non-degree holders. These trends
reflect the typical labour market dynamics in Malaysia138.
The distribution of the average number of clicks per month for these platforms is typical of many
digital platforms, where a majority of job-seekers are inactive. This may not actually reflect low
activity as some job-seekers may prefer not to use eRezeki to access the partner platforms and
instead interact directly with the partner platforms.
The distribution of average number of clicks shown in Figure 3.1 reinforces the findings from
Table 3.2, namely that higher percentages of youths, women and non-degree holding job-seekers
are less active compared to non-youths, men and degree-holding job-seekers, respectively.
138 KRI (2019); (2018)

CHAPTER 3
DIGITAL PLATFORM WORK: HOW DIGITAL ACCESS AND COMPETENCIES AFFECT JOB-SEEKING
75 KHAZANAH RESEARCH INSTITUTE
Figure 3.1: Distribution of average number of clicks per month, by demographics
Source: Authors’ calculations based on MDEC data
By education level
0
10
20
30
40
50
60
70
80
0 0.001 -0.100
0.101 -0.200
0.201 -0.300
0.301 -0.400
> 0.401
Perc
enta
ge o
f w
ork
ers
Clicks per month
Non-Youth
Youth
%
0
10
20
30
40
50
60
70
80
0 0.001 -0.100
0.101 -0.200
0.201 -0.300
0.301 -0.400
> 0.401
Perc
enta
ge o
f w
ork
ers
Clicks per month
DegreeNon-degree
By gender
0
10
20
30
40
50
60
70
80
0 0.001 -0.100
0.101 -0.200
0.201 -0.300
0.301 -0.400
> 0.401
Perc
enta
ge o
f w
ork
ers
Clicks per month
Men
Women
%
%
By age

CHAPTER 3
DIGITAL PLATFORM WORK: HOW DIGITAL ACCESS AND COMPETENCIES AFFECT JOB-SEEKING
KHAZANAH RESEARCH INSTITUTE 76
Findings
3.5.1. Digital platform job-seekers in Malaysia are predominantly women, young and
highly educated
We first compare the demographics of digital job-seekers using the eRezeki platform to the
demographics of digital platform workers globally. Compared to global microtask platform
workers where only 20% of workers from developing countries are women while slightly less
than 50% of workers in developed countries are women139, 54% of job-seekers on eRezeki are
women. The share of Malaysian job-seekers on eRezeki also differs from the Malaysian labour
force, where around 39% of the total labour force are women and 61% of the total labour force
are men140.
The age distribution of eRezeki job-seekers is skewed towards younger workers, the median age
of job-seekers being 29 while the mean age of job-seekers is 30 years old.
In terms of education, 69.6% of eRezeki job-seekers do not have university degrees141, while
30.4% of job-seekers have university degrees or higher. In 2019, around 12.7% of the national
labour force had degrees or higher142. This indicates that job-seekers on eRezeki have a higher
education level in general compared to the Malaysian workforce. Globally, 37% of workers have
degrees and 20% have post-graduate degrees. These proportions are higher for Asia, where 80%
of workers have degrees and better, much higher than the eRezeki workforce143.
These discrepancies are to be expected, given eRezeki’s original aim of providing sources of
supplementary income rather than full-time jobs. Initially, jobs on the platform were primarily
digital microtasks but the evolution of work in the platform economy led to an increase in
digitally-enabled tasks and digital work which might change the demographics of the digital
labour force. For example, women who need to prioritise care work may prefer to do digital
microtasks which do not take much time, while degree holders may prefer to do digital work that
is more time-consuming.
As discussed earlier, our data do not allow us to separate these three types of digital platform
work, but future research could investigate these to determine the growth trajectories of these
different types of work as well as the demographics of job-seekers interested in each.
3.5.2. Degree holders are the most active digital platform job-seekers
Using average number of clicks per month as a comparable measure across demographic groups,
we see that degree holders have the highest average number of clicks per month at 0.0522 clicks,
while non-degree holders have the lowest number of clicks per month at 0.0413 clicks. In other
words, degree holders on average are 1.3 times more active on eRezeki than non-degree holders
(Table 3.3).
139 Berg et al. (2018) 140 DOS (2020a) 141 Job-seekers who have university degrees refer to job-seekers with education levels of Bachelor degree and above. 142 DOS (2020a) 143 Berg et al. 2018

CHAPTER 3
DIGITAL PLATFORM WORK: HOW DIGITAL ACCESS AND COMPETENCIES AFFECT JOB-SEEKING
77 KHAZANAH RESEARCH INSTITUTE
Studies using global surveys have found that most workers on global digital platforms have
university degrees144. This is due possibly to the high-skilled nature of work on these platforms,
such as coding, that require skills associated with degrees. Degree holders in developing countries
use digital platforms to access tasks which match their skills but may not be available in their own
country. Thus, degree-holding job-seekers in Malaysia may have more opportunities than non-
degree-holding job-seekers to tap into the global market for digital tasks.
Table 3.3: Average clicks per month, by demographics
Demographics Average clicks per month Relative ratio
Gender
Women 0.0413 1.0
Men 0.0485 1.2
Age
Youth 0.0437 1.0
Non-youth 0.0458 1.0
Education Level
Non-degree 0.0413 1.0
Degree 0.0522 1.3
Source: Authors’ calculations based on MDEC data
However, while women in Malaysia are more likely to have degrees than men145, women still have
a lower average number of clicks per month compared to men, suggesting that gender may affect
job-seeking activity more than education. In fact, women job-seekers with degrees have average
clicks per month higher than men without degrees but still lower than men with degrees (Table
3.4).
Table 3.4: Average number of clicks per month, by demographics
Characteristics of job-seekers Gender
Men Women
Education
Degree holder 0.0538 0.0511
Non-degree holder 0.0465 0.0364
Source: Authors’ calculations based on MDEC data
144 Berg et al. 2018 145 DOS (2020a)

CHAPTER 3
DIGITAL PLATFORM WORK: HOW DIGITAL ACCESS AND COMPETENCIES AFFECT JOB-SEEKING
KHAZANAH RESEARCH INSTITUTE 78
3.5.3. Fixed broadband and computer access are crucial for job-seeking
Digital access also affects job-seeking activity rates on eRezeki. In particular, job-seekers with
fixed broadband access have the highest average number of clicks per month, while job-seekers
without computers have the lowest average number of clicks (Table 3.5). The biggest difference
in the average number of clicks is between those with computer access and those without: job-
seekers with computer access are 1.5 times more active than those without computer access.
Table 3.5: Average clicks per month, by digital access availability
Digital access Average clicks per month Relative ratio
Has computer access
No 0.0318 1.0
Yes 0.0476 1.5
Has fixed broadband
No 0.0390 1.0
Yes 0.0517 1.3
Has mobile data
No 0.0383 1.0
Yes 0.0447 1.2
Has smartphone
No 0.0358 1.0
Yes 0.0447 1.2
Source: Authors’ calculations based on MDEC data
The large differences resulting from the availability of fixed broadband and computers highlight
the importance of digital access in tapping into higher value digital work, especially international
digital work which requires a stable internet connection and a computer instead of more unstable
mobile data and a smartphone. Computers enable workers to perform more complex tasks, while
a stable broadband connection enables seamless communication and allows workers to perform
tasks that require continuous internet access.
3.5.4. Email and digital payment skills indicate high job-seeking activity
In terms of digital competencies, job-seekers with experience in using email and digital payments
are more active on eRezeki. Job-seekers with experience in digital payment systems like PayPal
have the highest average number of clicks per month, while job-seekers who are not familiar with
email have the lowest average number of clicks. Job-seekers with experience using email have the
greatest advantage, where job-seekers who are familiar with email are 1.8 times more active than
those who are not (Table 3.6).
Email is fundamental for digital communication. However, 15.1% of eRezeki job-seekers are not
familiar with email. On the other hand, only 18.2% are familiar with digital payment systems.
Thus, a majority of job-seekers are likely to face difficulties using secure systems to obtain
payments, especially from international clients.

CHAPTER 3
DIGITAL PLATFORM WORK: HOW DIGITAL ACCESS AND COMPETENCIES AFFECT JOB-SEEKING
79 KHAZANAH RESEARCH INSTITUTE
Table 3.6: Average clicks per month, by digital competencies
Digital competencies Average clicks per month Relative ratio
Experienced using email
No 0.0366 1.0
Yes 0.0521 1.8
Experienced in using browser
No 0.0406 1.0
Yes 0.0541 1.5
Experienced in digital payments
No 0.0473 1.0
Yes 0.0614 1.4
Experienced in YouTube
No 0.0433 1.0
Yes 0.0554 1.4
Experienced in Facebook
No 0.0459 1.0
Yes 0.0541 1.2
Source: Authors’ calculations based on MDEC data
3.5.5. Young job-seekers, women, and non-degree holders benefit most from digital
access and digital competencies
Thus far, we have examined how different aspects of digital access and digital competencies are
associated with increased levels of job-seeking activity on eRezeki by job-seekers as a whole.
Specifically, we have seen the value of having fixed broadband and access to a computer, and of
skills with email and digital payment systems. The following tables show how these aspects of
access and skills affect different demographic groups, suggesting that young job-seekers, women
and non-degree holders see greater increases in job-seeking activities corresponding to increases
in digital access and digital competencies compared to non-youth job-seekers, men and degree
holders.
Table 3.7 shows how fixed broadband access affects job-seeking activity levels for different
demographic groups. Among young job-seekers, having fixed broadband is associated with 1.4
times more activity than when not having fixed broadband. Among non-youth job-seekers, the
corresponding ratio is only 1.3 times. Similarly, women with fixed broadband were 1.4 times
more active than women without fixed broadband, while men with fixed broadband were only
1.3 times more active than men without. Finally, non-degree holders with fixed broadband were
1.4 times more active than without compared to degree holders with broadband who were only
1.1 times more active than if they did not have fixed broadband.
Despite the larger relative increase for women and non-degree holders, men and degree holders
with fixed broadband access were still more active than women and non-degree holders with
fixed broadband access.

CHAPTER 3
DIGITAL PLATFORM WORK: HOW DIGITAL ACCESS AND COMPETENCIES AFFECT JOB-SEEKING
KHAZANAH RESEARCH INSTITUTE 80
Table 3.7: Average number of clicks per month, availability of fixed broadband access
Demographics
Average clicks per month Relative increase due to availability of broadband No broadband
available Broadband available
Age
Youth 0.0379 0.0518 1.4
Non-youth 0.0406 0.0515 1.3
Gender
Women 0.0360 0.0488 1.4
Men 0.0430 0.0547 1.3
Education Level
Non-degree 0.0361 0.0502 1.4
Degree 0.0498 0.0537 1.1
Source: Authors’ calculations based on MDEC data
Table 3.8 shows how having access to a computer affects job-seeking activity levels for different
demographic groups. Among young job-seekers, having computer access is associated with 1.6
times more activity than when not having access to a computer. Among non-youth job-seekers,
the corresponding ratio is only 1.5 times more. Similarly, women with computer access were 1.6
times more active than women without computer access, while men with computer access were
only 1.4 times more active than men without. Finally, non-degree holders with computer access
were 1.5 times more active than non-degree holders without, compared to degree holders with
computer access who were only 1.2 times more active than if they did not have computer access.
Despite the larger relative increase for women and non-degree holders, men and degree holders
with computer access were more active than women and non-degree holders with computer
access.
Table 3.8: Average number of clicks per month, availability of computer
Demographics
Average clicks per month Relative increase due to availability of computer No computer
available
Computer
available
Age
Youth 0.0296 0.0466 1.6
Non-youth 0.0336 0.0490 1.5
Gender
Women 0.0273 0.0446 1.6
Men 0.0367 0.0512 1.4
Education Level
Non-degree 0.0305 0.0449 1.5
Degree 0.0455 0.0525 1.2
Source: Authors’ calculations based on MDEC data
Table 3.9 shows how digital payment systems skills affects job-seeking activity levels for different
demographic groups. Among young job-seekers, having digital payment systems skills is
associated with 1.4 times more activity than when not having digital payment systems skills.

CHAPTER 3
DIGITAL PLATFORM WORK: HOW DIGITAL ACCESS AND COMPETENCIES AFFECT JOB-SEEKING
81 KHAZANAH RESEARCH INSTITUTE
Among non-youth job-seekers, the corresponding ratio is only 1.3 times more. Similarly, women
with digital payment systems skills were 1.4 times more active than women without digital
payment systems skills, while men with digital payment systems skills were only 1.3 times more
active than men without. Finally, non-degree holders with digital payment systems skills were
1.5 times more active than without compared to degree holders with digital payment systems
skills who were only 1.1 times more active than if they did not have digital payment systems skills.
Despite the larger relative increase for women, men with digital payment system skills were still
more active in absolute terms than women with digital payment system skills.
Table 3.9: Average number of clicks per month, availability of digital payment skills
Demographics
Average clicks per month Relative increase due to experience in digital
payments No experience in digital payments
Experience in digital payments
Age
Youth 0.0408 0.0583 1.4
Non-youth 0.0434 0.0549 1.3
Gender
Women 0.0387 0.0545 1.4
Men 0.0459 0.0586 1.3
Education Level
Non-degree 0.0385 0.0586 1.5
Degree 0.0514 0.0543 1.1
Source: Authors’ calculations based on MDEC data
Table 3.10 shows how email experience affects job-seeking activity levels for different
demographic groups. Among youth job-seekers, having email experience is associated with 1.7
times more activity than when not having email experience. Among non-youth job-seekers, the
corresponding ratio is 1.9 times. Women with email experience were 2.2 times more active than
women without email experience, while men with email experience were only 1.5 times more
active than men without. Finally, non-degree holders with email experience were 1.8 times more
active than without compared to degree holders with email experience who were only 1.3 times
more active than if they did not have email experience.
Despite the larger relative increase for women and non-degree holders, men and degree holders
with email experience were still more active than women and non-degree holders with email
experience.
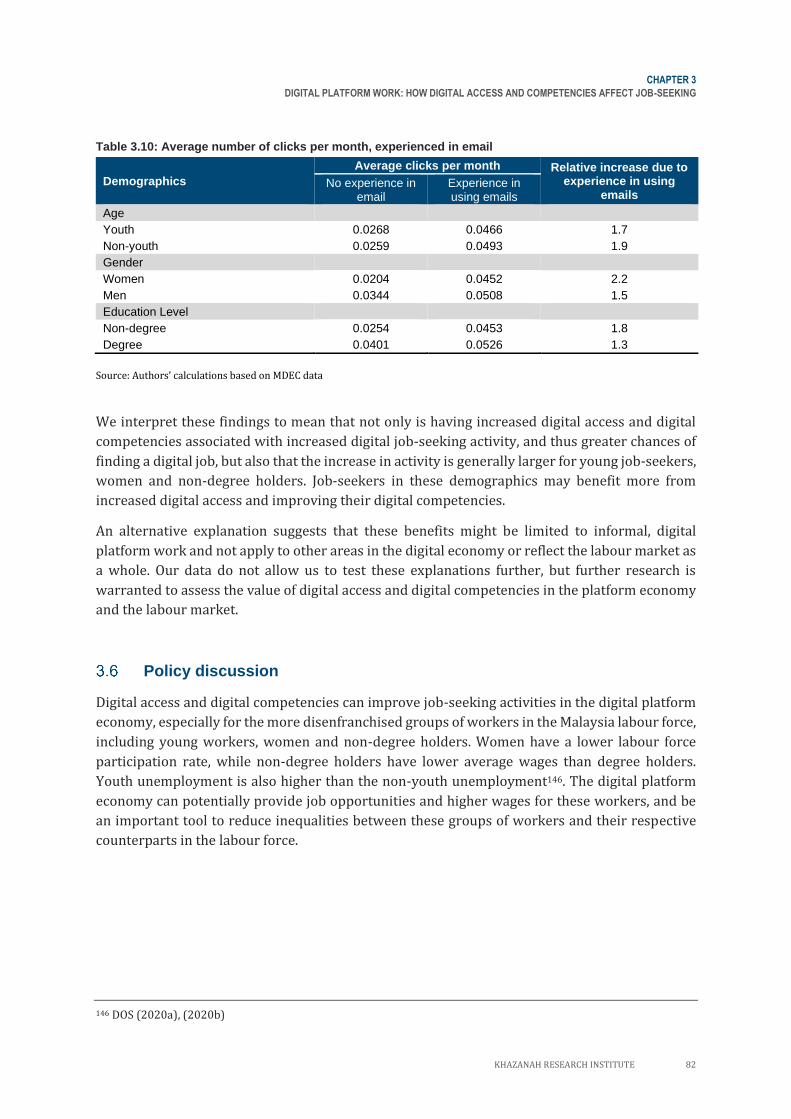
CHAPTER 3
DIGITAL PLATFORM WORK: HOW DIGITAL ACCESS AND COMPETENCIES AFFECT JOB-SEEKING
KHAZANAH RESEARCH INSTITUTE 82
Table 3.10: Average number of clicks per month, experienced in email
Source: Authors’ calculations based on MDEC data
We interpret these findings to mean that not only is having increased digital access and digital
competencies associated with increased digital job-seeking activity, and thus greater chances of
finding a digital job, but also that the increase in activity is generally larger for young job-seekers,
women and non-degree holders. Job-seekers in these demographics may benefit more from
increased digital access and improving their digital competencies.
An alternative explanation suggests that these benefits might be limited to informal, digital
platform work and not apply to other areas in the digital economy or reflect the labour market as
a whole. Our data do not allow us to test these explanations further, but further research is
warranted to assess the value of digital access and digital competencies in the platform economy
and the labour market.
Policy discussion
Digital access and digital competencies can improve job-seeking activities in the digital platform
economy, especially for the more disenfranchised groups of workers in the Malaysia labour force,
including young workers, women and non-degree holders. Women have a lower labour force
participation rate, while non-degree holders have lower average wages than degree holders.
Youth unemployment is also higher than the non-youth unemployment146. The digital platform
economy can potentially provide job opportunities and higher wages for these workers, and be
an important tool to reduce inequalities between these groups of workers and their respective
counterparts in the labour force.
146 DOS (2020a), (2020b)
Demographics
Average clicks per month Relative increase due to experience in using
emails No experience in
email Experience in using emails
Age
Youth 0.0268 0.0466 1.7
Non-youth 0.0259 0.0493 1.9
Gender
Women 0.0204 0.0452 2.2
Men 0.0344 0.0508 1.5
Education Level
Non-degree 0.0254 0.0453 1.8
Degree 0.0401 0.0526 1.3

CHAPTER 3
DIGITAL PLATFORM WORK: HOW DIGITAL ACCESS AND COMPETENCIES AFFECT JOB-SEEKING
83 KHAZANAH RESEARCH INSTITUTE
There are several existing programmes aimed at encouraging women to re-join the labour force
(e.g. Career Comeback Programme147) and to help fresh graduates find jobs (e.g.
Graduates@Work) as well as provide general skills training (e.g. Let’s Learn Digital148). Additional
policy improvements can be made to ensure that job opportunities within the platform economy
can reduce, not increase, inequalities. We propose three such improvements below.
3.6.1. Policy improvement 1: Increasing digital access
Our findings indicate that digital access, specifically access to fixed broadband and computers,
increases job-seeking activity in the platform economy. Digital infrastructure and devices are
fundamental to ensuring reliable, high quality connectivity that enables the platform economy to
run, from the perspectives of both the platforms and the workers. Ensuring basic internet access
via a smartphone is good; providing means to access higher quality, more reliable fixed
broadband on computers is better.
Increased provision of affordable fixed broadband and computers could be crucial to growing the
platform economy, especially for digital work that depends on a stable internet connection and a
device with higher processing power. In 2019, only 51.4% of Malaysian households had
laptops149, while only 8.6% individuals had fixed broadband access150. Our analysis indicates that
a lower share of non-degree holders has access to fixed broadband and computers compared to
degree holders. This is possibly a consequence of having lower wages and being unable to afford
computers and broadband, and likely leads to lower participation in the platform job market,
which could perpetuate the problem.
The government has recognised the importance of high quality broadband connectivity and has
introduced the National Digital Network Plan (JENDELA) aimed at improving mobile broadband
service. This is important, as is improving fixed broadband infrastructure and service. Increasing
fixed broadband access and take-up across the country is key to increasing participation in digital
work in the platform economy, especially for non-urban workers and non-degree holders.
Another policy approach we have previously advocated is to consider subsidising not just fixed
broadband subscriptions but also subsidising devices, including computers151. Research has
found that increasing access to internet-enabled devices such as computers is more effective than
reducing mobile data prices in increasing broadband access—thus, subsidising both broadband
and computer devices can both encourage job-seeking activity152.
147 Talent Corp (n.d) 148 MDEC (2020) 149 DOS (2020c) 150 Gong (2020); ITU (2019) 151 Gong (2020) 152 Schriner and Oerther (2014)

CHAPTER 3
DIGITAL PLATFORM WORK: HOW DIGITAL ACCESS AND COMPETENCIES AFFECT JOB-SEEKING
KHAZANAH RESEARCH INSTITUTE 84
3.6.2. Policy improvement 2: Making digital skills training accessible
Digitally enabled work that is managed via platforms, such as food delivery and household
services, is rapidly growing. The global platform economy is projected to increase by 17% on
average each year between 2019 to 2023 to a gross size of USD455 billion153. In Malaysia, the
sharing economy was estimated to have grown from RM394 million in 2016 to RM949 million in
2018, an increase of 2.4 times over three years154. Also increasing is the demand for digital work,
such as programming, design and creative content development. Our findings indicate that
increased digital competencies are associated with increased job-seeking activity in these job
markets.
Therefore, incentivising and enabling training for workers in this area is important for young
workers, women and degree holders who stand to gain more from developing their digital
competencies, as shown in our analysis.
Furthermore, training is a crucial safeguard for the future of the labour market in general when
technological change will radically change the nature of jobs and needed skills in the future155.
Without continual skills development and training, workers, especially those performing routine
or semi-skilled tasks, can quickly become obsolete.
However, digital platform workers who are not classified as employees may not have access to
training opportunities as they are excluded from the core business of the platforms and their
clients156. This reduces their ability to learn new digital competencies, resulting in jobs being
quickly taken up by the few who do have the necessary skills, and leaving them unable to catch
up because they do not have the funding or guidance to upskill themselves.
Budget 2020 introduced Digital Social Responsibility (DSR), a commitment by the business sector
to enhance the future workforce capacity with digital skills training and funding for communities
in need, with private sector contributions to DSR activities being tax exempted157. This was
followed by the “GigUp“ programme announced in the Digital Economy Blueprint, providing
subsidies for online skills training platforms for companies to train the gig workers they employ,
including digital platform workers158. This policy could be further expanded given how it could
help workers, especially under difficult circumstances caused by the pandemic, to take advantage
of digital platform work opportunities. This includes expanding training to digital platform
workers who are not tied to any formal companies and in-person training courses159.
153 Mastercard and Kaiser Associates 2019 154 MDEC (2019) 155 KRI (2017); Frey and Osborne (2017); Kochan and Dyer (2019) 156 Graham, Hjorth, and Lehdonvirta (2017) 157 MOF (2019) 158 EPU (2021) 159 Tan Zhai Gen and Dr Rachel Gong (2021)

CHAPTER 3
DIGITAL PLATFORM WORK: HOW DIGITAL ACCESS AND COMPETENCIES AFFECT JOB-SEEKING
85 KHAZANAH RESEARCH INSTITUTE
A gap in Malaysia has been the lack of digital skills training opportunities for digital platform
workers. Training has typically been organised by employers as part of improving business
productivity160. Thus, it is unavailable for digital platform workers who are considered
freelancers and contract workers by digital platforms and also by the clients of digital platforms.
Government funds to incentivise skills training, such as Human Resource Development Fund
(HRDF), are available only to employers, leaving out self-employed workers and digital platform
workers.
Programmes such as MDEC’s Digital Skills Training Directory161 in collaboration with the Social
Security Organisation (SOCSO) under the PENJANA Hiring Initiative provide digital skills training
to job candidates, but only if they are selected by SOCSO-registered employers.
Decoupling training provision from the notion that it is the responsibility and prerogative of only
employers is an important step to creating a more inclusive skills training system for the whole
labour force. A general training provision programme that directly assists workers in the
changing labour market is needed, established in collaboration with formal employers, digital
platforms, community colleges, unions and public training programmes162. In particular,
subsidising more training partnerships like MDEC’s Let’s Learn Digital between employers or
government agencies and education providers such as local community colleges could make
training more affordable for a wider segment of the workforce, including non-degree holders.
For digital platform workers, stakeholders in the platform economy (e.g. digital platform
companies, employers who use these digital platforms and skills training institutions) should
work together to improve the digital competencies of workers to improve productivity. Training
should be inclusive and not focus on degree holders to the detriment of non-degree holders. As
illustrated in our analysis, training on basic network and computing skills like using digital
payment systems can potentially contribute to greater participation in the job market.
Financial incentives and vouchers are an important policy mechanism in putting training into the
hands of the workers themselves instead of their employers163. For example, the Singaporean
government provides SGD200 each year to workers to join training courses which are accredited
by the government in a scheme called SkillsFuture. The scheme also provides guidance on the
skills and trainings tailored to the worker’s specific training needs.
3.6.3. Policy improvement 3: Strengthening portable social protection
The vulnerability of digital platform workers to shocks also has to be addressed, given the
informal status of their work, as social protection in Malaysia, as in many other countries, is built
around standard employment relationships164. Social protection ranges from occupational
hazard protection to health insurance and retirement funds, which traditionally have been
provided by employers.
160 KRI (2017) 161 Digital News Asia (2020) 162 Autor, Mindell, and Reynolds (2020) 163 KRI (2017) 164 Nur Thuraya Sazali and Tan (2019); Kochan and Dyer (2019)

CHAPTER 3
DIGITAL PLATFORM WORK: HOW DIGITAL ACCESS AND COMPETENCIES AFFECT JOB-SEEKING
KHAZANAH RESEARCH INSTITUTE 86
In the absence of clear terms of employee classifications and rights, allowing platform workers to
advocate for their own needs and social protection would require the cooperation of government,
employers, platforms and unions, whose interests may not always align165. Nonetheless, labour
unions in Germany and the US, for example, have opened up their doors to freelancers and
informal workers to provide a way to organise and bargain for health insurance through these
unions. Grab, a ride-hailing platform, has worked with the Singaporean government by
contributing to drivers’ Medisave, the Singaporean national health insurance, commensurate
with distance driven. Malaysia’s Self-Employment Social Security Scheme provided by SOCSO is a
step forward to protect the self-employed, beyond the traditional direction of the agency to
provide employment security via employer contributions.
Given the rise of digital platform work, informalisation of work in general and workers switching
jobs more frequently throughout their lives, an improvement to social protection policy would
see social protection tied to the worker instead of tied to an employer166. These “portable
benefits” would balance the flexibility of modern jobs with the security of traditional
employment. For example, Malaysia’s Employee Provident Fund (EPF) is tied to workers
themselves, and has introduced new schemes that allow for self-contribution from self-employed
workers.
However, the precarious nature of platform work can disincentivise workers from voluntarily
contributing to such social protection programmes. Programmes that supplement or match
worker contributions to a pension fund could help to incentivise voluntary contributions167.
Greater cooperation from all stakeholders will be important to educate workers regarding the
importance of social protection as insurance against shocks. Government assistance and
appropriate contributions from digital platforms will be needed to fund such programmes, at
least initially. At the very least, a form of occupational hazard insurance is necessary to ensure
continuity of income for platform workers who might sustain injuries while on the job.
Conclusion
As advancement in digital technology continues, digital platforms will be an increasingly viable
mechanism for firms to obtain temporary workers—both formal and informal—all around the
world, while workers can earn incomes from outside their local area. This provides exposure for
workers, while expanding opportunities for flexible part-time jobs and additional incomes. In
some developing countries, workers with skills that are not in much demand in the local economy
may be able to remain in their local area while working remotely, reducing out-migration and the
“brain drain” in these countries.
However, there are important issues which need to be addressed—the informal and transient
nature of digital platform work typically implies a lack of social protection and limited skills-
upgrading opportunities for workers. The lack of employment-related protection, such as worker
health and safety protection also increase workers’ vulnerabilities.
165 Kochan and Dyer (2019) 166 KRI (2017); Kochan and Dyer (2019) 167 Hinz et al. (2013)

CHAPTER 3
DIGITAL PLATFORM WORK: HOW DIGITAL ACCESS AND COMPETENCIES AFFECT JOB-SEEKING
87 KHAZANAH RESEARCH INSTITUTE
What factors affect job-seeking for digital platform work? Degree holders are more active on
eRezeki compared to non-degree holders. Digital access, in terms of fixed broadband and
computer access, increases job-seeking activity. In terms of digital competencies, experience in
using email and digital payment systems is important in increasing job-seeking activity. The
increased activity associated with digital access and competencies is greater for disenfranchised
workers in the workforce, namely, women, youth and non-degree holders.
This chapter discussed three areas for improving labour policy with respect to digital platform
work. First, increasing fixed broadband and computer access for digital platform workers can
increase job-seeking activity, especially among the less active segments of the labour force.
Second, incentivising training programmes for digital platform workers and decoupling training
from employers can benefit independent workers and job-seekers. Third, extending portable
social protection to digital platform workers can reduce the precarious nature of digital platform
work, requiring collaboration between digital platforms, government agencies and unions.
CHAPTER 3
DIGITAL PLATFORM WORK: HOW DIGITAL ACCESS AND COMPETENCIES AFFECT JOB-SEEKING
KHAZANAH RESEARCH INSTITUTE 88
References
Autor, David, David Mindell, and Elisabeth Reynolds. 2020. “MIT Work of the Future Task Force.” Cambridge, MA: MIT.
Baldwin, Richard. 2019. The Globotics Upheaval: Globalization, Robotics, and the Future of Work. New York, NY: Oxford University Press.
Berg, Janine, Marianne Furrer, Ellie Harmon, Uma Rani, and S. Silberman. 2018. “Digital Labour Platforms and the Future of Work: Towards Decent Work in the Online World.” International Labour Organization, 135.
Bloodworth, James. 2019. Hired: Six Months Undercover in Low-Wage Britain. Main Edition. Atlantic Books.
Davidson, Adam. 2020. The Passion Economy: The New Rules for Thriving in the Twenty-First Century. New York: Knopf.
Digital News Asia. 2020. “MDEC Launches Training Directory to Assist Malaysians with Learning New Digital Skills.” Digital News Asia. October 19, 2020. https://www.digitalnewsasia.com/digital-economy/mdec-launches-training-directory-assist-malaysians-learning-new-digital-skills.
DOS. 2020a. “Labour Force Survey Report, Malaysia, 2019.” Department of Statistics Malaysia. https://newss.statistics.gov.my/newss-portalx/ep/epFreeDownloadContentSearch.seam?cid=687720.
———. 2020b. Salaries and Wages Survey Report 2019. Putrajaya: Department of Statistics Malaysia.
———. 2020c. “Households Income and Basic Amenities Survey Report 2019.” Annual Survey. Malaysia: Department of Statistics Malaysia.
EPU. 2021. “Malaysia Digital Economy Blueprint.” Policy Paper. Putrajaya: Economic Planning Unit, Prime Minister’s Department. https://www.epu.gov.my/sites/default/files/2021-02/Malaysia-digital-economy-blueprint.pdf.
Frey, Carl Benedikt, and Michael A. Osborne. 2017. “The Future of Employment: How Susceptible Are Jobs to Computerisation?” Technological Forecasting and Social Change 114 (January):254–80. https://doi.org/10.1016/j.techfore.2016.08.019.
Frost & Sullivan. 2020. “A Study on the Impact of the ERezeki Programme to Targeted Communities in Malaysia.” Frost and Sullivan.
Gong, Rachel. 2020. “Digital Inclusion: Assessing Meaningful Internet Connectivity in Malaysia.” Kuala Lumpur: Khazanah Research Institute. http://www.krinstitute.org/assets/contentMS/img/template/editor/20200907%20Inclusion%20v4.0.pdf.
Graham, Mark, Isis Hjorth, and Vili Lehdonvirta. 2017. “Digital Labour and Development: Impacts of Global Digital Labour Platforms and the Gig Economy on Worker Livelihoods.” Transfer: European Review of Labour and Research 23 (2). SAGE Publications Ltd:135–62. https://doi.org/10.1177/1024258916687250.
Gurumurthy, Anita, Deepti Bharthur, Nandini Chami, Jai Vipra, and Ira Anjali Anwar. 2019. “Platform Planet: Developmnent in the Intelligence Economy.” India: IT for Change. https://itforchange.net/platformpolitics/wp-content/uploads/2019/06/Platform-Planet-Development-in-the-Intelligence-Economy_ITfC2019.pdf.
Hawk, Steve. 2018. “What an Economist Is Learning by Driving for Uber.” Stanford Graduate School of Business. February 16, 2018. https://www.gsb.stanford.edu/insights/what-economist-learning-driving-uber.
CHAPTER 3
DIGITAL PLATFORM WORK: HOW DIGITAL ACCESS AND COMPETENCIES AFFECT JOB-SEEKING
89 KHAZANAH RESEARCH INSTITUTE
Hinz, Richard, Robert Holzmann, David Tuesta, and Noriyuki Takayama. 2013. “Matching Contributions for Pensions.” Washington DC: World Bank. http://documents1.worldbank.org/curated/en/106841468177233641/pdf/Matching-contributions-for-pensions.pdf\.
Huws, Ursula, and Simon Joyce. 2016. “Size of the UK’s ‘Gig Economy’ Revealed for the First Time.” CROWD WORKING SURVEY. http://englishbulletin.adapt.it/wp-content/uploads/2016/02/crowd-working-surveypdf1.pdf.
ITU. 2019. “State of Broadband Report 2019.” Geneva: International Telecommunication Union and United Nations Education, Scientific and Cultural Organization. https://www.broadbandcommission.org/Documents/StateofBroadband19.pdf?mc_cid=ba1bfdab1d&mc_eid=e546476035.
Kässi, Otto, and Vili Lehdonvirta. 2018. “Online Labour Index: Measuring the Online Gig Economy for Policy and Research.” Technological Forecasting and Social Change 137 (December):241–48. https://doi.org/10.1016/j.techfore.2018.07.056.
Katz, Lawrence F, and Alan B Krueger. 2016. “The Rise and Nature of Alternative Work Arrangements in the United States, 1995-2015.” Working Paper 22667. National Bureau of Economic Research. https://doi.org/10.3386/w22667.
Kessler, Sarah. 2018. Gigged: The End of the Job and the Future of Work. New York: St. Martin’s Press.
Kochan, Tom, and L Dyer. 2019. Shaping the Future of Work. Updated for 2nd edition. Cambridge, MA: MITxPress.
KRI. 2017. An Uneven Future: An Exploration of the Future of Work in Malaysia. Kuala Lumpur: Khazanah Research Institute.
———. 2018. The School-to-Work Transition of Young Malaysians. Kuala Lumpur: Khazanah Research Institute.
———. 2019. The State of Households 2018: Different Realities. Kuala Lumpur: Khazanah Research Institute.
Kuek, Siou Chew, Cecilia Paradi-Guilford, Toks Fayomi, Saori Imaizumi, and Panos Ipeirotis. 2015. “The Global Opportunity in Online Outsourcing (English) | The World Bank.” Working Paper ACS14228. http://documents.worldbank.org/curated/en/138371468000900555/pdf/ACS14228-ESW-white-cover-P149016-Box391478B-PUBLIC-World-Bank-Global-OO-Study-WB-Rpt-FinalS.pdf.
Lehdonvirta, Vili, Otto Kässi, Isis Hjorth, Helena Barnard, and Mark Graham. 2018. “The Global Platform Economy: A New Offshoring Institution Enabling Emerging-Economy Microproviders:” Journal of Management, August, 567–99. https://doi.org/10.1177/0149206318786781.
Malaysia Digital Economy Corporation. 2019. “Malaysia’s Experience in Crowd Labour and Sharing Economy.” presented at the Crowdsourcing Week Global 2019.
MDEC. 2020. “Let’s Learn Digital.” MDEC. April 29, 2020. https://mdec.my/digital-economy-initiatives/for-the-people/talent-development/lets-learn-digital/.
———. n.d. “ERezeki | Now Everyone Can Benefit from the Digital Economy.” ERezeki. n.d. https://erezeki.my/.
MOF. 2019. “Budget 2020 Speech.” https://www.treasury.gov.my/pdf/budget/speech/bs20.pdf. Nur Thuraya Sazali, and Zhai Gen Tan. 2019. The Demise of Formal Employment? - A Literature
Update on Informality. Kuala Lumpur: Khazanah Research Institute. Schriner, Andrew, and Daniel Oerther. 2014. “No Really, (Crowd) Work Is the Silver Bullet.”
Procedia Engineering, Humanitarian Technology: Science, Systems and Global Impact 2014, HumTech2014, 78 (January):224–28. https://doi.org/10.1016/j.proeng.2014.07.060.

CHAPTER 3
DIGITAL PLATFORM WORK: HOW DIGITAL ACCESS AND COMPETENCIES AFFECT JOB-SEEKING
KHAZANAH RESEARCH INSTITUTE 90
Sutherland, Will, and Mohammad Hossein Jarrahi. 2018. “The Sharing Economy and Digital Platforms: A Review and Research Agenda.” International Journal of Information Management 43 (December):328–41. https://doi.org/10.1016/j.ijinfomgt.2018.07.004.
Talent Corp. (n.d). “Career Comeback Programme - Initiatives | TalentCorp Malaysia.” (n.d). https://www.talentcorp.com.my/initiatives/career-comeback-programme.
Tan Zhai Gen, and Dr Rachel Gong. 2021. “Gig Workers’ Training Must Be Inclusive | The Star.” March 1, 2021. https://www.thestar.com.my/opinion/letters/2021/03/01/gig-workers-training-must-be-inclusive.
Ticona, Julia, Alexandra Mateescu, and Alex Rosenblat. 2018. “Beyond Disruption: How Tech Shapes Labor Across Domestic Work & Ridehailing.” New York, NY, Atlanta, GA, and Washington, DC: Data & Society. https://datasociety.net/wp-content/uploads/2018/06/Data_Society_Beyond_Disruption_FINAL.pdf.

91 KHAZANAH RESEARCH INSTITUTE
CHAPTER
04
DIGITALISATION OF FIRMS: CHALLENGES IN THE DIGITAL ECONOMY
4.1 Introduction 92
4.2 All firms stand to benefit from digitalisation 93
4.3 Challenge #1: Inadequate digitalisation by firms of all sizes 94
4.4 Challenge #2: A digital divide between firms 95
4.5 Inclusive competition or exclusive domination? 96
4.5.1 Platforms: The new giants of the digital economy 96
4.6 The way forward 98
4.6.1 Reduction in the costs of digitalisation 98
4.6.2 Development of worker skills 98
4.6.3 Digitally relevant regulations 99
4.6.4 The role of digital governance 99
4.7 Conclusion 100
References 101

KHAZANAH RESEARCH INSTITUTE 92
DIGITALISATION OF FIRMS: CHALLENGES IN THE DIGITAL
ECONOMY168
By Amos Tong and Rachel Gong
“Economic institutions shape economic incentives: the incentives to become educated, to
save and invest, to innovate and adopt new technologies, and so on. It is the political process
that determines what economic institutions people live under, and it is the political
institutions that determine how this process works”.
Daron Acemoglu169
Introduction
Malaysians use digital technologies widely, but digital adoption by Malaysian businesses still lags
behind the global average; only 29% of businesses had a web presence while a meagre 5.2% of
businesses engaged in e-commerce in 2015170.
As more business establishments participate in the digital economy, firms that are left out of this
digital revolution will likely struggle to survive, let alone thrive171. While there is little dispute
about the net benefits of digitalisation, there are significant challenges to the digitalisation of
businesses in Malaysia.
The World Bank’s “Malaysia’s Digital Economy” report also states that there exists a digital divide
among businesses in Malaysia, as “small- and medium-sized establishments [are] less likely than
the average business establishment to access and use the internet” and that “businesses engaged
in e-commerce tend to be much larger than the average establishment”172.
Malaysia’s digital economy faces at least two challenges: (i) inadequate digitalisation by firms of
all sizes and (ii) a digital divide between firms. This could potentially result in Malaysian firms
not keeping pace with the demands of a global digital economy with small and medium-sized
enterprises (SMEs) being left behind. This chapter discusses these challenges in the digital
economy and suggests potential research and policy considerations to address them.
168 An earlier version of this chapter authored by Amos Tong and Rachel Gong was published by KRI on 5 October 2020
as a Views piece titled “Digitalisation of Firms: Challenges in the Digital Economy”. 169 Acemoglu and Robinson (2013) 170 WBG (2018a) 171 Digital Marketing Institute (2018) 172 WBG (2018a)

CHAPTER 4
DIGITALISATION OF FIRMS: CHALLENGES IN THE DIGITAL ECONOMY
93 KHAZANAH RESEARCH INSTITUTE
All firms stand to benefit from digitalisation
For large firms, the rationale behind digitalisation is clear: digitalisation improves efficiency,
competitiveness and economies of scale. Firms can use complex technologies such as the
automation of production processes and data-driven quality control processes to reduce costs
and increase profit margins.
However, the case for digitalisation among SMEs is not as clear. Digitalisation is perceived as
complex, costly and unnecessary. But digitalisation does not necessarily mean expensive
equipment and total automation. There are at least five areas of digitalisation that benefit firms
of all sizes, as shown in Table 4.1.
Table 4.1: Key areas for digitalisation
Key Area Definition and Explanation
Procurement and
inventory
Digital procurement software and inventory management systems reduce costs and
streamline business operations as they reduce the manpower required to manually
check and update inventory. For example, inventory restocking can be automated
using analytical models that predict price fluctuations and customer demand.
Accounting and taxes
Digital accounting software record transactions accurately and instantly without human
intervention, significantly reducing accounting errors that are commonly associated
with manual bookkeeping.
Digital marketing
Digital marketing campaigns can reach a wider customer base more efficiently,
effectively and cheaply than traditional advertising. For example, platforms such as
Facebook, Instagram, or YouTube enable firms to promote their businesses via digital
advertising with flexible pricing plans.
E-commerce
E-commerce (e.g. via platforms such as Lazada and Shopee) helps firms overcome
geographical limitations and lowers the cost of entry for entrepreneurs and SMEs,
allowing them to compete with established firms.
Electronic Point of
Sale (ePOS) and
contactless payment
systems
ePOS is a system that records sales, manages payments and monitors inventory,
enabling accurate, up-to-date information on business operations. The system enables
businesses to engage in data analytics (e.g. by generating reports on product
popularity), thus optimising business performance. Contactless payment systems,
such as digital wallets, can reduce transaction time, increase security and improve
customer experience.
Source: Adapted from MDEC (2020a)
It is clear that digitalisation is not size- or sector-specific and that all firms can increase
productivity by digitalising multiple aspects of business operations.

CHAPTER 4
DIGITALISATION OF FIRMS: CHALLENGES IN THE DIGITAL ECONOMY
KHAZANAH RESEARCH INSTITUTE 94
Challenge #1: Inadequate digitalisation by firms of all sizes
Between 2010 and 2016, Malaysia’s digital economy grew by 9% annually in value-added terms;
it is estimated to make up 20% of the economy in 2020. E-commerce alone is expected to exceed
RM110 billion—nearly 40% of the digital economy173—in 2020. However, efforts by businesses
to digitalise and join the digital economy are not keeping pace with this growth. The first
challenge in Malaysia’s digital economy is with respect to widespread digitalisation of firms of all
sizes.
Businesses in Malaysia are not adopting digital technologies as readily as the Malaysian
government and general population. Asia IoT Business Platform found that only about one in
three businesses in Malaysia have implemented digital transformation strategies, while fewer
than one in four businesses have a dedicated digital strategy team174. Malaysia also has “fewer
businesses with websites and fewer secure servers than per capita income would predict”175
compared to other countries. As at 2017, only 37.8% of establishments in Malaysia have a web
presence176.
A survey of 28 top publicly listed corporations also found that large firms in Malaysia do not
digitalise as rapidly as those of other countries. Among these 28 corporations, only five digitally
track their inventories in real-time, while 16 assess internal performance with data analytics.
When taken as a whole, top firms in Malaysia recorded a Digital Performance Index (DPI) of 1.7
as opposed to United States’ 2.5177.
The Managing Director of Microsoft Malaysia, K. Raman, highlighted two reasons why Malaysian
businesses may find it challenging to embrace digital transformation: a lack of technology
knowledge and organisational silos178. First, firms committed to digitalisation face myriad
challenges, such as not knowing where to start, how to implement their digital strategies, or
where to find technologically skilled employees.
Second, 49% of firms cited organisational silos as a critical challenge in digitalisation179. Some
firms may have organisational structures so rigid that each department is in its own silo, acting
independently and lacking coordination. This could be why 55% of Malaysian organisations do
not have an integrated enterprise-wide digital transformation strategy180.
173 WBG (2018a) 174 Sue Yuin Ho (2019) 175 WBG (2018a) 176 DOS (2018) 177 Lim Yin Sern et al. (2017) 178 Yapp (2020) 179 Modgil and Ltd (2019) 180 BusinessToday (2019)

CHAPTER 4
DIGITALISATION OF FIRMS: CHALLENGES IN THE DIGITAL ECONOMY
95 KHAZANAH RESEARCH INSTITUTE
A third challenge to widespread digitalisation among Malaysian firms, especially SMEs, is the
costs associated with digitalisation, such as internet connectivity, digital hardware, software
subscription fees and worker upskilling. About 50% of SMEs in Malaysia cite funding as a key
hindrance to digitalisation181. Accenture reported that among 28 leading Malaysian companies it
surveyed, 12 “have digital growth strategies in place”, but only two “have announced dedicated
budgets to implement these strategies”182. The World Bank suggested that this problem is
compounded by relatively expensive yet low quality broadband connectivity in Malaysia183.
Challenge #2: A digital divide between firms
All firms face challenges digitalising their business operations but SMEs have been found to lag
behind larger firms in adopting more complex digital solutions. For instance, although 77% of all
digitalised businesses are SMEs, SMEs only make up 25% of businesses achieving advanced
digitalisation184. The World Bank also stated that “large export-oriented firms dominate the
digital economy as they adopt e-commerce at higher rates than SMEs”185.
On the whole, Malaysian SMEs have increased their use of information and communication
technologies, with over 80% of businesses using computers and smartphones, and over 70%
using the internet in their business operations in 2018186. Malaysia’s SMEs also turned to
digitalisation at a rapid pace during the Covid-19 pandemic. SMEs registered with Boost, an e-
wallet service, recorded a 60% increase in 2020 alone, indicating an accelerating pace of
digitalisation among SMEs.
Digital adoption by SMEs is most concentrated in front-end computing devices and connectivity
(>85%), and least prevalent in back-end business processes such as inventory management
(14%) and order fulfilment software (11%). Furthermore, only 44% and 54% of SMEs use cloud
computing and data analytics, respectively187. For comparison, in 2014, 85% of SMEs in Singapore
used cloud computing188.
181 SME Corp and Huawei (n.d) 182 Lim et al. (2020) 183 WBG (2018b) 184 Consultancy Asia (2020) 185 WBG (2018a) 186 NESDC (2020) 187 SME Corp and Huawei (n.d) 188 Yu (2014)

CHAPTER 4
DIGITALISATION OF FIRMS: CHALLENGES IN THE DIGITAL ECONOMY
KHAZANAH RESEARCH INSTITUTE 96
Inclusive competition or exclusive domination?
Digital technologies were expected to bring down long-standing barriers and empower smaller
businesses, which would be “inclusive and rewarding for all”189. An open internet would
theoretically allow all firms equal access to information and markets at greater scale and lower
cost, which would benefit smaller business establishments. Achieving this ideal implied a future
of perfect competition within the digital economy.
However, the centrality of data in the digital economy means that larger firms that can capture
large volumes of data gain an upper hand over smaller businesses. Contemporary economic
theories emphasise economies of scale as a factor in minimising cost; the 21st century version of
economies of scale is big data. Big data is data “that is so large, fast or complex that it’s difficult or
impossible to process using traditional methods”190.
Due to their large size and access to capital, large firms are more likely to take advantage of big
data. For example, a large firm can build customised in-house digital solutions to complement
their digital transformation strategies. A dedicated data analytics department with access to
market and customer data could help a firm implement its digital strategy more efficiently and
effectively by adjusting the pace and structure of digitalisation according to the firm’s needs.
In this way, large firms can optimise their operations and maximise profit margins, effectively
shutting out competition. For instance, Amazon was accused of collecting and using data from
third-party sellers in order to undercut the competition and boost sales of its own products191.
This behaviour may lead to oligopolies, or even monopolies, in the digital economy.
4.5.1. Platforms: The new giants of the digital economy
The digital economy gave rise to a new breed of billion-dollar-corporations—intermediary
service providers or platforms—that subverts the conventional direct economic relationship
between firms and consumers. These intermediary service providers connect businesses and
customers, charging both parties a fee for this service. Ride-hailing behemoth Grab and food
delivery service FoodPanda are examples of platforms. These firms can monopolise entire market
segments due to network effects, their ability to extract, control and analyse data, and path
dependency (refer to Table 4.2).
189 MDEC (2019) 190 SAS (2020) 191 Bell (2020)

CHAPTER 4
DIGITALISATION OF FIRMS: CHALLENGES IN THE DIGITAL ECONOMY
97 KHAZANAH RESEARCH INSTITUTE
Table 4.2: How platforms monopolise the market
Term Definition and Explanation
Network effects A platform becomes more valuable as more users use it. For instance, if more
drivers join the Grab platform, consumers are more likely to find a ride. Thus,
drivers can earn more income, which will attract more drivers. This cycle
continues, making the platform more and more valuable for both consumers and
drivers.
Ability to extract, control
and analyse data
As the platforms connect producers and consumers, they are able to extract vast
quantities of data, which can be analysed to cut costs, improve advertising and
improve their product quality. Furthermore, customer analytics can uncover hidden
consumption trends and spending patterns, enabling better pricing strategies.
Path dependency The costs of switching to an alternative platform increases as consumers use the
platform more. Platforms can utilise user data to personalise suggestions,
advertising and even build entire social networks that will make it difficult for users
to switch to other alternatives.
Source: Adapted from UNCTAD (2019)
These platforms could further entrench their positions as market leaders by expanding their data
extraction infrastructure and engaging in anti-competitive behaviour such as predatory pricing,
which aims to destroy competition in the market. Furthermore, due to their sheer financial size,
these digital economy giants could venture into other sectors such as finance, insurance,
hospitality and tourism to diversify their business operations. This could increase the risk of anti-
competitive mergers and acquisitions through which large firms could diversify their business
operations and dominate multiple sectors concurrently.
Large platforms can gradually build super-apps that encompass a multitude of services, as Grab
is already doing in Southeast Asia. As of 2019, Grab has more than 60% of the ride-hailing market
share in Southeast Asia and 26.8% of e-wallet market share in Malaysia, making it the dominant
player in both industries192.
Grab’s dominant market position has indeed been scrutinised. After Grab’s purchase of Uber’s
Southeast Asia operations, it was fined RM86 million by the Malaysia Competition Commission
(MyCC) for “distorting competition” and “creating barriers to entry and expansion for Grab’s
existing and future competitors”193. The general concern for large platforms is that, left
unchecked, platforms could monopolise and dismantle competition in their sectors, neutralising
SMEs’ ability to compete in the digital economy.
192 Trefis Team (2019); Nathan (2018) 193 Al Jazeera (2019)

CHAPTER 4
DIGITALISATION OF FIRMS: CHALLENGES IN THE DIGITAL ECONOMY
KHAZANAH RESEARCH INSTITUTE 98
The way forward
Given these challenges, policies could be developed to encourage universal digitalisation by
businesses and to bridge the digital divide between firms in the digital economy. The goal of such
policies is to build an inclusive digital economy so that all parties can reap the benefits of the
digital age. We suggest the following areas for research and policy consideration:
4.6.1. Reduction in the costs of digitalisation
As described earlier, approximately 50% of business establishments in Malaysia cited cost as a
big challenge to digitalisation. The Malaysian government could consider reducing the barriers
to digitalisation by collaborating with technology solution providers to introduce lower pricing
packages for SMEs. Moreover, temporary tax incentives could be introduced for newly digitalised
SMEs to offset the initial financial investment.
The PENJANA economic recovery plan allocated RM700 million to eligible SMEs to defray
digitalisation costs194. Two key programmes under this plan are the SME Digitalisation Matching
Grant totalling RM100 million in partnership with telecommunications companies and the SME
Technology Transformation Fund totalling RM500 million in loans. Take-up rates for these
programmes are not yet available.
MDEC runs a wide variety of programmes intended to spur digitalisation among firms, such as
the SME Business Digitalisation Grant, the SMART Automation Grant, the Digital Transformation
Acceleration Programme and the Malaysia Tech Entrepreneur Programme195. However, some of
these programmes have restrictions. For instance, the SME Business Digitalisation Grant is
limited to 100,000 SMEs196. This means that only 11% of the 907,195 SMEs197 in Malaysia can
benefit from this initiative. Admittedly the take up rate of these programmes may be low as many
SMEs may be unaware of or uninterested in such programmes, a topic worth further
investigation. Nonetheless, the government could expand these programmes to all interested
SMEs.
The SME Business Digitalisation Grant also partnered with Boost to improve digitalisation among
SMEs. This partnership provides SMEs with digital payments, advertising and other marketing
services through Boost. However, this matching grant means that SMEs have to pay a minimum
of RM1,000 upfront, an amount many SMEs may find expensive29.
4.6.2. Development of worker skills
Almost 50% of SMEs in Malaysia cited employee skill set as a significant barrier to digitalisation.
For instance, 65% of SMEs said that their employees require training in IT-related technical
skills30.
194 EPU (2020) 195 MDEC (2020b) 196 MDEC (2020a) 197 NESDC (2020)

CHAPTER 4
DIGITALISATION OF FIRMS: CHALLENGES IN THE DIGITAL ECONOMY
99 KHAZANAH RESEARCH INSTITUTE
To overcome the digital skills mismatch faced by firms, the government could also aim to improve
the technical skills of the workforce. Existing training and upskilling programmes for workers
could be tailored towards specific digital and technical skills useful for digitalisation, such as
database management or digital marketing.
Training may be required not just in terms of developing competitive technical skills, but also in
business management in order to effectively implement digital technologies across different
sectors. For example, research has shown that addressing the skills mismatch is a key component
of addressing graduate unemployment198. Further research is needed to identify and prioritise
the development of skills relevant to the digital economy.
4.6.3. Digitally relevant regulations
There is a need for more research to determine if and/or which regulations need to be reviewed
and updated in the context of the digital economy. A combination of competition and data
protection regulations may help close the digital divide between firms.
Some platforms may offer their services for free but extract user information extensively. This
may not be considered anti-competitive in contemporary competition legislation. However, as
seen in the case of Amazon described earlier, platforms with a large user base and thus with
access to a large volume of data have a significant advantage over their competitors. Further
research is warranted on the extent of this phenomenon, which could be a form of predatory
pricing in the digital age. As some have already argued, the extraction and use of data by
businesses for commercial purposes should be regulated199.
A review of mergers and acquisitions of firms in the digital economy may also be warranted.
Firms in the digital economy may acquire smaller competing firms to accelerate the expansion of
their businesses and reduce competition. This behaviour should be strictly regulated to restrict
the abuse of market position by large oligopolies and monopolies in the digital economy.
4.6.4. The role of digital governance
Two critical components of the digital economy are infrastructure and data.
High quality digital infrastructure is necessary to support the increasing requirements of data
processing and data transfer involved in digitalisation. Government standards, such as the
Mandatory Standards for Quality of Service, have a key role to play in ensuring that reliable
infrastructure exists to support the digital economy and the digitalisation of firms. Further
research on these standards and current demand could help set minimum standards that are
appropriate for different locales and sectors of the economy.
198 KRI (2018) 199 Khan (2016); Zuboff (2019)
CHAPTER 4
DIGITALISATION OF FIRMS: CHALLENGES IN THE DIGITAL ECONOMY
KHAZANAH RESEARCH INSTITUTE 100
Data analytics can uncover consumption patterns, optimal pricing strategies and hidden
consumer preferences. Access to market research and proprietary user data may give larger firms
an advantage in the digital economy. Allowing open access to government data, such as
population demographics and geographical price trends, may allow SMEs to engage in data
analytics without the high overhead costs of proprietary market research. Research suggests that
open data benefits academic research200; additional research could assess the impact of open data
on the digitalisation of firms.
Conclusion
The digital economy presents an abundance of opportunities for Malaysia, but also brings to
surface tough challenges. Firms of all sizes across all sectors stand to benefit from digitalisation
by increasing productivity and becoming more efficient and competitive. Nonetheless, lack of
technical knowledge, organisational silos and costs remain barriers to digitalisation.
Digitalisation can provide increased opportunities for small businesses to expand their markets
or it can lead to a consolidation of the market in the hands of a few big companies. In a best case
scenario, increased competition could lower prices and increase product quality. But without
proper government oversight and regulation, monopolistic firms could arbitrarily set prices and
gain unfettered access to user data. By extracting user information and engaging in anti-
competitive activities, platforms could dominate the digital economy, leaving SMEs behind.
Thus, it is crucial that inclusive policies and anti-monopoly regulations be put in place to
encourage digitalisation by firms of all sizes and to close the digital divide between firms in
Malaysia. The Malaysian Digital Economy Blueprint launched in February 2021 aims to facilitate
digitalisation in firms of all sizes, proposing a “Digital Compass” to help guide firms through the
digitalisation process according to their skills and needs201. The Blueprint also calls for improved
digital training for senior managers, an agile regulatory approach and pro-competition measures
that include a review of competition laws by 2023. If effectively implemented, these strategies
could be instrumental in helping firms, especially SMEs, navigate the challenges of digitalisation.
200 Ashraf (2020) 201 EPU (2021)

CHAPTER 4
DIGITALISATION OF FIRMS: CHALLENGES IN THE DIGITAL ECONOMY
101 KHAZANAH RESEARCH INSTITUTE
References
Acemoglu, Daron, and James Robinson. 2013. Why Nations Fail. Al Jazeera. 2019. “‘Distorting Competition’: Malaysia Fines Ride Hailing Firm Grab.” Al Jazeera.
March 10, 2019. https://www.aljazeera.com/economy/2019/10/3/distorting-competition-malaysia-fines-ride-hailing-firm-grab.
Ashraf, Shaharudin. 2020. “Open Government Data for Academic Research.” Working Paper. Kuala Lumpur: Khazanah Research Institute. http://www.krinstitute.org/Working_Paper-@-Open_Government_Data_for_Academic_Research.aspx.
Bell, Karissa. 2020. “The Antitrust Case against Amazon Just Got Stronger.” Engadget. June 30, 2020. https://www.engadget.com/amazon-antitrust-hearing-third-party-sellers-201126053.html.
BusinessToday. 2019. “Most Malaysian Companies Lack Integrated Digital Transformation Strategy - Business Today.” Https://Www.Businesstoday.Com.My/ (blog). 2019. https://www.businesstoday.com.my/2019/09/18/the-digital-transformation-blueprint-software-defined-enterprises-in-asia-pacific/.
Consultancy Asia. 2020. “Malaysia’s Digital Economy Now Contributes One Fifth to GDP.” July 7, 2020. https://www.consultancy.asia/news/3370/malaysias-digital-economy-now-contributes-one-fifth-to-gdp.
Department of Statistics Malaysia. 2018. “Usage of IT and E-Commerce by Establishment 2018.” Annual Survey. Malaysia. https://www.dosm.gov.my/v1/uploads/files/2_Censuses%26Surveys/Services/ICTeC/2018/Panduan%20KP411_ICTeC_2018_Eng.pdf.
Digital Marketing Institute. 2018. “What’s the Cost of Not Going Digital For a Business? | DMI.” Digital Marketing Institute. June 17, 2018. https://my.digitalmarketinginstitute.com/blog/what-is-the-cost-of-not-going-digital-for-a-business.
EPU. 2020. “Short Term Economic Recovery Plan (PENJANA).” Booklet. Putrajaya: Economic Planning Unit. https://penjana.treasury.gov.my/pdf/PENJANA-Booklet-En.pdf.
———. 2021. “Malaysia Digital Economy Blueprint.” Policy Paper. Putrajaya: Economic Planning Unit, Prime Minister’s Department. https://www.epu.gov.my/sites/default/files/2021-02/Malaysia-digital-economy-blueprint.pdf.
Khan, Lina M. 2016. “Amazon’s Antitrust Paradox.” Yale Law Journal 126 (3):710–805. Khazanah Research Institute. 2018. The School-to-Work Transition of Young Malaysians. Kuala
Lumpur: Khazanah Research Institute. Lim, Vanessa W, Rachel L Lim, Yi Roe Tan, Alexius SE Soh, Xuan Tan, Norhudah Bte Othman, Sue
Borame Dickens, et al. 2020. “Government Trust, Perceptions of COVID-19 and Behaviour Change: Cohort Surveys, Singapore.” Bulletin of the World Health Organization, October, 18.
Lim Yin Sern, Teh Wee Vien, Loganantha Esparan, Bobby James, and Karyn Chua Su Yin. 2017. “Accenture, Faster Than Ever.” Digital Performance Index. Ireland: Accenture. Accenture. https://www.accenture.com/_acnmedia/PDF-63/Accenture-Faster-Than-Ever-Infographic.pdf%23zoom=50.
MDEC. 2019. “Who We Are.” MDEC. June 12, 2019. https://mdec.my/about-mdec/who-we-are/. ———. 2020a. “SME Business Digitalisation Grant.” MDEC. February 17, 2020.
https://mdec.my/digital-economy-initiatives/for-the-industry/sme-digitalisation-grant/.
———. 2020b. “SMEs Digitalisation.” MDEC. February 17, 2020. https://mdec.my/digital-economy-initiatives/for-the-industry/sme/.

CHAPTER 4
DIGITALISATION OF FIRMS: CHALLENGES IN THE DIGITAL ECONOMY
KHAZANAH RESEARCH INSTITUTE 102
Modgil, Shweta, and People Matters Pte Ltd. 2019. “49% of C-Suite Executives in Malaysia See Organizational Silos as Key Challenge: Report.” People Matters. July 22, 2019. https://www.peoplemattersglobal.com/news/c-suite/49-of-c-suite-executives-in-malaysia-see-organizational-silos-as-key-challenge-report-22428.
Nathan, Lydia. 2018. “E-Wallet Users See Rapid Growth in M’sia.” The Malaysian Reserve. December 21, 2018. https://themalaysianreserve.com/2018/12/21/e-wallet-users-see-rapid-growth-in-msia/.
NESDC. 2020. “SME Annual Report 2018/2019.” Annual Report. SME Annual Report. SAS. 2020. “Big Data: What It Is and Why It Matters.” 2020.
https://www.sas.com/en_my/insights/big-data/what-is-big-data.html. SME Corp, and Huawei. n.d. “Accelerating Malaysian Digital SME’s: Escaping the Computerisation
Trap.” Policy Paper. Kuala Lumpur: SME Corp and Huawei. Huawei. https://www.huawei.com/minisite/accelerating-malaysia-digital-smes/img/sme-corp-malaysia-huawei.pdf.
Sue Yuin Ho. 2019. “5 Key Opportunities for Digitalization in Malaysia - Asia IoT Business Platform.” Asia IoT Business Platform. February 26, 2019. http://iotbusiness-platform.com/blog/5-key-opportunities-for-digitalisation-in-malaysia/.
Trefis Team. 2019. “How Much Is Grab Worth?” Forbes. October 1, 2019. https://www.forbes.com/sites/greatspeculations/2019/01/10/how-much-is-grab-worth/.
UNCTAD. 2019. Digital Economy Report 2019: Value Creation and Capture : Implications for Developing Countries. https://unctad.org/system/files/official-document/der2019_en.pdf.
World Bank Group. 2018a. “Malaysia’s Digital Economy: A New Driver of Development.” Washington, DC: World Bank.
———. 2018b. “Malaysia Economic Monitor, June 2018: Navigating Change.” Washington DC: World Bank. https://openknowledge.worldbank.org/handle/10986/29926.
Yapp, Edwin. 2020. “Malaysia’s Digital Transformation Efforts Progress.” ComputerWeekly.Com. March 16, 2020. https://www.computerweekly.com/feature/Malaysias-digital-transformation-efforts-progress-amid-challenges.
Yu, Eileen. 2014. “Singapore SMBs to Spend $415M on Cloud.” ZDNet. September 3, 2014. https://www.zdnet.com/article/singapore-smbs-to-spend-415m-on-cloud/.
Zuboff, Shoshana. 2019. The Age of Surveillance Capitalism: The Fight for a Human Future at the New Frontier of Power. Public Affairs.

103 KHAZANAH RESEARCH INSTITUTE
CHAPTER
05 OPEN GOVERNMENT DATA IN MALAYSIA: PRINCIPLES, BENEFITS, CHALLENGES AND THE WAY FORWARD
5.1 Introduction 104
5.2 Features of open government data 105
5.3 Benefits of open government data 106
5.3.1 Economic potential 106
5.3.2 Government transparency, accountability and effectiveness 108
5.3.3 Knowledge generation 111
5.4 Open government data global evaluations 112
5.5 Government data ecosystem in Malaysia 113
5.5.1 Laws related to government information 113
5.5.2 Current open government data policy in Malaysia 114
5.5.3 Open government data governance 116
5.6 Open government data challenges in Malaysia 117
5.6.1 Supply-side challenges 117
5.6.2 Demand-side challenges 120
5.7 The way forward for Malaysia 121
5.7.1 Right to Information law 121
5.7.2 Streamlining government data policy 122
5.7.3 Data privacy and security protection 125
5.7.4 Inclusive and meaningful use of government data 127
5.8 Conclusion 130
References 131

KHAZANAH RESEARCH INSTITUTE 104
OPEN GOVERNMENT DATA IN MALAYSIA: PRINCIPLES, BENEFITS,
CHALLENGES AND THE WAY FORWARD202
By Ashraf Shaharudin
“[T]he three branches of the Government—the legislature, the executive and the judiciary—
should ensure that the means of obtaining information is made available to the people, so
that they can play a meaningful role in the participation of an open Government [and] an
open Government must be the hallmark of a truly democratic country.”203
HRH Sultan Azlan Shah, the Ninth Yang Dipertuan Agong
and the former Lord President of the Federal Court
Introduction
As Covid-19 raged across the whole world, disrupting every aspect of society, the enormous value
of data became clear, as did how ill-equipped most countries are to collect, integrate, analyse and
communicate data. Unfortunately, countries that lacked data infrastructure and competency pre-
pandemic are struggling to get the best of out of data during the pandemic, with resources and
decision-making capacity channelled to areas deemed more urgent. Thus, the Covid-19 crisis has
been a wake-up call for governments to accelerate the improvement in data policy, infrastructure
and competency.
The advancement of digital technology brings forth a great volume and a wide range of data.
Digital data superseded analogue data in 1998 and in 2014 amounted to 4.8 zettabytes (48 billion
trillion bytes)204, equivalent to the data consumed by 16 trillion two-hour HD movies. Meanwhile,
telecommunications capacity, measured in kilobits per second (kbps), has grown
exponentially205. With this development, potentials for policymakers, private sector and
researchers to generate economic and social value as well as to solve local and global challenges
with data are aplenty.
In May 2013, the then-United States (US) President Obama signed an executive order asserting
open and machine-readable data as the new default for government information to strengthen
democracy, promote the delivery of efficient and effective public services, and contribute to
economic growth206.
202 This chapter is based on three papers authored by Ashraf Shaharudin, published by KRI titled “Open Government
Data: Principles, Benefits and Evaluations”, “Open Government Data for Academic Research” and “Open Government
Data in Malaysia: Landscape, Challenges and Aspirations”. 203 Sultan Azlan Shah (2004) 204 World Bank (2016) 205 World Bank (2016) 206 White House, Office of the Press Secretary (2013)

CHAPTER 5
OPEN GOVERNMENT DATA IN MALAYSIA: PRINCIPLES, BENEFITS, CHALLENGES AND THE WAY FORWARD
105 KHAZANAH RESEARCH INSTITUTE
Soon after, in June 2013, the Group of Eight (G8)—composed of France, Germany, Italy, the United
Kingdom, Japan, the US, Canada and Russia—signed the Open Data Charter that lays out five
strategic principles including releasing government data openly by default and increasing the
quality, quantity and re-use of published data207. Malaysia started the open government data
initiative in 2014 with the launch of the Public Sector Open Data Portal208.
Features of open government data
Open government data is a concept that encompasses the best practices for government data-
sharing, appropriate for a digital age, to generate the maximum possible value from the data. In
theory, open government data is digital government data that is free from legal and technical
constraints to be used by anyone at anytime from anywhere209. Government data is any
information that is collected by the government either through direct responses such as census
and survey or through remote observation enabled by technology such as satellite imagery and
sensors210.
Table 5.1 lists the salient features of open data gathered from three references, namely the
Sunlight Foundation, the International Open Data Charter and the Open Knowledge Foundation.
Table 5.1: Salient features of open government data
Feature Aspects References
Completeness
All data is open by default, unless with valid justifications for
closure such as privacy and security concerns.
Permanence, i.e. data available online should remain online.
Comprehensive metadata included.
Initiative to digitise non-electronic data such as physical
artefacts is encouraged.
SF, IODC
Granularity
Highest possible level of granularity.
If possible, data is provided in its original and unmodified
form.
SF, IODC
Timeliness Data is made available as quickly as possible. SF, IODC
Accessibility
Open license.
Free of charge.
Downloadable via the Internet.
No legal/technical barrier.
SF, IODC, OKF
Machine processability Data in a form readily processable by a computer SF, IODC, OKF
Non-proprietary Data is available in a format in which no entity has exclusive
control. SF, OKF
Note: SF: Sunlight Foundation; IODC: International Open Data Charter; OKF: Open Knowledge Foundation.
Source: Open Knowledge Foundation (2013), International Open Data Charter (n.d.) and Sunlight Foundation (2010)
207 G8 (2013) 208 MAMPU (n.d.) 209 Synthesised in Ashraf (2020b) based on Open Knowledge Foundation (2013), International Open Data Charter (n.d.)
and Sunlight Foundation (2010) 210 Loosely following the definition taken by World Bank (2020). It is worth clarifying that this paper uses data and
information interchangeably for reasons discussed in Ashraf (2020b).

CHAPTER 5
OPEN GOVERNMENT DATA IN MALAYSIA: PRINCIPLES, BENEFITS, CHALLENGES AND THE WAY FORWARD
KHAZANAH RESEARCH INSTITUTE 106
Benefits of open government data
5.3.1. Economic potential
Data is a valuable yet non-exhaustible commodity. Data needs to be used for its value to be
realised. Merely collecting data, without using it, does not generate any value. The use of data by
a user does not reduce its availability for other users. In fact, data generates more (private or
public) value with greater use211, a scenario termed “the comedy of the commons”212. This stands
in contrast to common-pool resources such as fishery and forest resources, where their
consumption (in a non-sustainable way) will eventually reduce their availability, a scenario called
“the tragedy of the commons”.
Estimating the economic value of open government data is challenging, as it includes direct values
such as investment and market value as well as indirect values such as wider social and economic
benefits213. When more data is made open, more people (citizens, companies, researchers, etc.)
are given access to these non-exhaustible resources, generating more value214. Making data open
circumvents the issues of information asymmetry on at least two levels.
First, governments would not have to “pick winners” especially since they may not have full
information of which organisation/individual could generate value215. For example, there are
around 600 consumer and analytics applications used by around 42% of Londoners that are
powered by Transport of London (TfL)’s data since TfL made its data open over a decade ago.
This saved TfL from having to produce apps in-house. The use of TfL data by companies is
estimated to generate between GBP70m and GBP90m in gross value added (GVA) per year while
supporting around 500 high-value jobs216.
The Spanish government launched the Aporta Initiative in 2009 to “promote the opening of public
information and development of advanced services based on data”217. In 2016, there were 662
companies in the infomediary sector218 in Spain, generating EUR1.7b and employing 19,347
people. Three main areas within the sector are geographic information (23%), market research
(23%), and economics and finance (21%)219.
A study by Koski (2011) found that between 2000 and 2007, architectural and engineering-
related firms in countries where fundamental geographical information (GI) is provided free or
at marginal cost have grown on average about 15% more per year than firms in countries in which
GI is priced according to cost-recovery (average cost) principles220.
211 Nevertheless, while data can be used to generate either private or public value, the challenge is to reap the most
public value possible from government data while also allowing government data to be used for private gain. 212 Rose (1986) 213 Gruen, Houghton, and Tooth (2014) 214 Value can be non-market/non-traded value such as better policies, environment and mental health. 215 Frischmann (2006) 216 Deloitte (2017) 217 datos.gob.es (n.d.) 218 The sector that uses public and private data to create value-added products and services 219 datos.gob.es (2018) 220 For simple understanding, average cost is usually higher than marginal cost since average cost includes fixed cost.

CHAPTER 5
OPEN GOVERNMENT DATA IN MALAYSIA: PRINCIPLES, BENEFITS, CHALLENGES AND THE WAY FORWARD
107 KHAZANAH RESEARCH INSTITUTE
The European Union (EU) Open Data Portal (ODP) compiles applications developed by the EU
institutions and third parties that use the portal’s open data. There are 115 web applications, 13
mobile applications and two desktop applications listed in the portal so far, offering various
functions such as data visualisation and analysis, covering a wide range of topics including Covid-
19, economics, environment, agriculture and international aid.
Second, an organisation/individual would not be restricted by limited information to generate
the highest possible value. A large volume of data is needed to maximise the potential of emerging
technologies such as big data and machine learning. For example, a farm-analytics firm Climate
Corp., which is owned by Monsanto, one of the world’s largest agribusiness companies, used 60
years of crop yield data and 14 terabytes of information on soil types provided freely by the US
Department of Agriculture to price crop insurance221.
Sense-T, a partnership between the University of Tasmania, Commonwealth Scientific and
Industrial Research (CSIRO) and several Tasmanian authorities, brings researchers and industry
players to use data, sensing and telemetry technologies, and data analytics to solve problems on
the ground222. Past projects have mainly addressed issues in agriculture and aquaculture.
Examples include developing tools to help vineyards avoid disease and make better management
decisions and giving Tasmanian regulators real-time data about environmental conditions
around shellfish farms223. They are also working in other areas such as health, tourism, financial
services and logistics.
TradeData International and Sirca are two data-based business units of Australian higher
education institutions that have expanded to serve many private sector players and international
organisations since their establishment in 1997224. TradeData International provides
international trade data analytics services using mostly data from countries’ customs clearance
documentation for imports and export declarations225. Meanwhile, Sirca offers financial market
data analytics services to the financial industry as well as regulators226. The growth of these two
business units demonstrates the demand for better data-driven business insights in the private
sector.
With the growth of the solar industry in South Korea, a company called Haezoom uses data
provided by several Korean ministries, the National Academy of Sciences, and the Korean
Meteorological Administration to provide an impartial cost-benefit analysis of solar panel
installation to consumers. It also suggests credible manufacturers to purchase solar panels from.
The service allows consumers to make an informed decision in installing solar panels227.
221 Kesmodel (2013) 222 Sense-T (n.d.b) 223 Sense-T (n.d.a) 224 Gruen, Houghton, and Tooth (2014) 225 TradeData International (2015) 226 SIRCA (n.d.) 227 Center for Open Data Enterprise (n.d.)

CHAPTER 5
OPEN GOVERNMENT DATA IN MALAYSIA: PRINCIPLES, BENEFITS, CHALLENGES AND THE WAY FORWARD
KHAZANAH RESEARCH INSTITUTE 108
Countries that have higher gross domestic product (GDP) per capita have higher Open Data
Barometer (ODB)228 scores as shown in Figure 5.1 and Figure 5.2. While the relationship does not
necessarily imply causality, it indicates open government data as a likely feature of a developed
country.
It is worth noting that based on the level of GDP per capita, Malaysia is one of the
underperforming countries in open government data. Even though Malaysia’s GDP per capita is
above the global median, Malaysia’s ODB score is below half of the full ODB score. On the other
hand, Colombia and the Philippines are two countries with GDP per capita below the global
median but with ODB scores above 50.
Figure 5.1: GDP per capita (current prices in USD)
versus Open Data Barometer (ODB) score, 2016
Figure 5.2: Log-transformed GDP per capita
(current prices in USD) versus Open Data
Barometer (ODB) score, 2016
Source: World Bank (n.d.b); World Wide Web Foundation (2017)
5.3.2. Government transparency, accountability and effectiveness
With open government data, information related to government activities, such as government
spending and contracting, is accessible to the public. This allows better checks and balances and
well-informed policy advocacy, as well as holding public officials more accountable. It is widely
recognised that strong and inclusive institutions are key to economic prosperity229.
228 Open Data Barometer is one of the global open government data evaluations. The score ranges between 0 and 100,
where a higher score indicates a higher level of open data. The latest edition, published in 2018, was The Leaders
edition that looks specifically into 30 countries that have made commitments to open data either by adopting the Open
Data Charter or signing up for the G20 Anti-Corruption Open Data Principles. Malaysia is not in the 2018 edition. 229 Acemoglu and Robinson (2012)
R² = 0.4802
0
10,000
20,000
30,000
40,000
50,000
60,000
70,000
80,000
90,000
0 20 40 60 80 100
USD90,000
Malaysia Median:USD6,617
3.0
3.2
3.4
3.6
3.8
4.0
4.2
4.4
4.6
4.8
5.0
0 20 40 60 80 100
Philippines
R2 = 0.516
Median: 3.82
Colombia
Malaysia

CHAPTER 5
OPEN GOVERNMENT DATA IN MALAYSIA: PRINCIPLES, BENEFITS, CHALLENGES AND THE WAY FORWARD
109 KHAZANAH RESEARCH INSTITUTE
Fundar, a Mexican civil society organisation, has persuaded the Mexican Ministry of Agriculture
to open its data related to the Programme for Direct Assistance in Agriculture (PROCAMPO) and
discovered that 57% of the subsidy went to only the wealthiest 10% of recipients230. Fundar
maintains a website which publishes regularly updated information on the agricultural support
programmes in Mexico to promote accountability in subsidy delivery231.
The US Federal Reserve publishes full documentation of the FRB/US model including model
equations, coefficients and data. The FRB/US model is a large-scale model of the US economy that
contains all major components of the product and income sides of the US national accounts232. It
is used by the US government for forecasting and conducting analysis of monetary and fiscal
policies. The open documentation of the model allows anyone to use the model for their own
forecasting as well as to conduct checks and balances.
The Ministry of Finance of Timor-Leste with support from the governments of Japan, Australia
and the US, together with the Asian Development Bank maintains the Aid Transparency Portal
(ATP), which contains all aid information in Timor-Leste. The objective is to improve aid
transparency, accuracy and predictability and to ensure that the assistance provided is efficient
and effective233.
The Opentender platform234 provides comprehensive public procurement information from 33
jurisdictions (28 EU member states, Norway, the EU Institutions, Iceland, Switzerland and
Georgia) free of charge in an easy-to-use format to increase market transparency, decrease
transaction costs and facilitate government accountability235.
A higher level of open government data is correlated with better governance indicators (i.e.
control of corruption, government effectiveness, regulatory quality, and voice and accountability)
as shown in Figure 5.3 – Figure 5.6. The direction of causality could be either way or both—open
government data improves governance and/or good governance implements open government
data.
230 World Bank (2016) 231 FUNDAR (2010) 232 The Federal Reserve (2018) 233 ATP (n.d.) 234 Opentender platform is part of the DIGIWHIST project, funded by the European Union (EU) to empower society to
combat public sector corruption. Source: DIGIWHIST (n.d.b) 235 DIGIWHIST (n.d.a)

CHAPTER 5
OPEN GOVERNMENT DATA IN MALAYSIA: PRINCIPLES, BENEFITS, CHALLENGES AND THE WAY FORWARD
KHAZANAH RESEARCH INSTITUTE 110
Figure 5.3: Control of corruption estimate versus
Open Data Barometer (OBD) score, 2016
Figure 5.4: Government effectiveness estimate
versus Open Data Barometer (OBD) score, 2016
Note:
• ODB scores are scaled scores (i.e. maximum = 100)
• All governance indicators range from -2.5 (very bad) to 2.5 (excellent)
• Control of corruption: perceptions of the extent to which public power is exercised for private gain
• Government effectiveness: perceptions of the quality of public services, the quality of the civil service and the degree of its
independence from political pressures, the quality of policy formulation and implementation, and the credibility of the
government's commitment to such policies
Source: World Bank (n.d.c); World Wide Web Foundation (2017)
Figure 5.5: Regulatory quality estimate versus
Open Data Barometer (ODB) score, 2016
Figure 5.6: Voice and accountability estimate
versus Open Data Barometer (ODB) score, 2016
Note:
• ODB scores are scaled scores (i.e. maximum = 100)
• All governance indicators range from -2.5 (very bad) to 2.5 (excellent)
• Regulatory quality: perceptions of the ability of the government to formulate and implement sound policies and regulations
that permit and promote private sector development
• Voice and accountability: perceptions of the extent to which a country's citizens are able to participate in selecting their
government, as well as freedom of expression, freedom of association, and a free media
Source: World Bank (n.d.c); World Wide Web Foundation (2017)
-2.0
-1.5
-1.0
-0.5
0.0
0.5
1.0
1.5
2.0
2.5
0 20 40 60 80 100
Malaysia
R2 = 0.498
-2.5
-2.0
-1.5
-1.0
-0.5
0.0
0.5
1.0
1.5
2.0
2.5
0 20 40 60 80 100
Malaysia
R2 = 0.594
-2.5
-2.0
-1.5
-1.0
-0.5
0.0
0.5
1.0
1.5
2.0
2.5
0 20 40 60 80 100
Malaysia
R2 = 0.576 R² = 0.4768
-2.0
-1.5
-1.0
-0.5
0.0
0.5
1.0
1.5
2.0
0 20 40 60 80 100
Malaysia

CHAPTER 5
OPEN GOVERNMENT DATA IN MALAYSIA: PRINCIPLES, BENEFITS, CHALLENGES AND THE WAY FORWARD
111 KHAZANAH RESEARCH INSTITUTE
5.3.3. Knowledge generation
Open data allows society to harness collective intelligence in generating knowledge. Detailed,
timely and good quality data is a valuable resource for both fundamental and applied research in
the natural and social sciences. Researchers could save time and costs by utilising existing open
data instead of collecting their own data to conduct research. Open data, instead of privately
collected data, could also facilitate greater collaborations and replications among researchers in
different institutions.
Open government data is one way of achieving open science. The United Nations Educational,
Scientific and Cultural Organization (UNESCO) defines open science as “the movement to make
scientific research and data accessible to all”236. The objectives of open science include allowing a
more accurate verification of scientific findings through peer-review and replication, reducing
duplication in collecting data and promoting citizens’ engagement in science237. The Covid-19
pandemic has demonstrated the importance of open science to foster scientific collaboration and
accelerate public health response238. While open science requires efforts from various
stakeholders especially from the research community, governments have a big role in
encouraging open science including by making government data open.
Countries that have a higher level of open government data produce a higher number of and more
impactful academic publications (Figure 5.7 and Figure 5.8). Controlling for other variables such
as the level of economic development, research and development expenditure and the number of
researchers, open government data is found to be a significant driver of academic publications239.
Although the empirical analysis is done on academic research, it highlights the importance of
open data to research in general, including non-academic research.
Figure 5.7: H-index (all field) versus Open Data Barometer (OBD) score, 2016
Figure 5.8: H-index (social science) versus Open Data Barometer (OBD) score, 2016
Note: Country’s h-index is the country’s number of articles (h) that have received a least h citation based on Scopus database
Source: Scimago Lab (2020); World Wide Web Foundation (2017)
236 UNESCO (2017) 237 UNESCO (2017), OECD (n.d.; 2015). 238 See Ashraf (2020a) on the role of open science in responding to the Covid-19 crisis. 239 Ashraf (2020c)
R² = 0.6707
0
500
1,000
1,500
2,000
2,500
0 20 40 60 80 100
Malaysia
China
United States
R² = 0.6325
0
100
200
300
400
500
600
700
800
0 20 40 60 80 100
China
Malaysia
United States

CHAPTER 5
OPEN GOVERNMENT DATA IN MALAYSIA: PRINCIPLES, BENEFITS, CHALLENGES AND THE WAY FORWARD
KHAZANAH RESEARCH INSTITUTE 112
Around the world, several initiatives have been carried out to open up data for crowdsourcing
knowledge. For instance, New Zealand’s Land, Air, Water Aotearoa (LAWA) is a web-based
platform that provides a large amount of scientific data on land, air and water in the country240.
It is an initiative by New Zealand’s 16 regional councils, the Cawthron Institute and the Ministry
for the Environment supported by the Tindall Foundation and Massey University.
InfoAmazania combines governments and satellite data to provide rich datasets of the
endangered Amazon region. It is supported by the Earth Journalism Network, the International
Center for Journalists, the Amazon Conservation Team and Dejusticia. The public is also
encouraged to share data with the platform241.
Pulse Lab Jakarta, a joint initiative between the United Nations and the Ministry of National
Development Planning Indonesia, uses data from various sources including government datasets
to generate policy-relevant insights and visualisation tools. Past projects include designing an
interactive geospatial mapping tool of various financial services points and conducting a port
network analysis for maritime development policy in Indonesia242.
Open government data global evaluations
Malaysia did not perform well in multiple global evaluations of open government data (Table 5.2).
In the latest243 Open Data Barometer (ODB), Global Open Data Index (GODI) and Open Data
Inventory (ODIN), Malaysia was behind the Philippines, Singapore and Indonesia, as well as many
other developing countries. Malaysia ranked eighth from the bottom out of 94 places in the
2016/17 Global Open Data Index (GODI). Malaysia’s scores in the Open Data Barometer (ODB)
and the Open Budget Index (OBI) have also not improved significantly over the years244, reflecting
very little progress in making government data more open.
Table 5.2: Open government data evaluations ranking, selected countries
ODB 2016 (/115) GODI 2016/17 (/94) ODIN 2018/19 (/178) OBI 2019 (/118)
Mexico 11 Brazil 8 Singapore 1 South Africa 2 Brazil 18 Mexico 11 Mexico 22 Mexico 4 Philippines 22 Singapore 17 Philippines 41 Brazil 6 Singapore 23 India 32 Indonesia 49 Philippines 10 India 33 South Africa 43 India 55 Indonesia 18 Indonesia 38 Turkey 45 Brazil 56 Thailand 30 Turkey 40 Thailand 51 South Africa 65 Turkey 46 South Africa 46 Philippines 53 MALAYSIA 69 India 53 MALAYSIA 53 Indonesia 61 Turkey 74 MALAYSIA 55 Thailand 53 MALAYSIA 87 Thailand 126 Singapore N/A
Note:
• ODB: Open Data Barometer; GODI: Global Open Data Index; ODIN: Open Data Inventory; OBI: Open Budget Index
• Numbers in the brackets in the top row are the number of countries/places evaluated for each ranking
Source: World Wide Web Foundation (2017), Open Knowledge Foundation (2016), Open Data Watch (2019), International Budget
Partnership (2020) as compiled in Ashraf (2020b)
240 LAWA (n.d.) 241 InfoAmazonia (n.d.) 242 UN Global Pulse (n.d.) 243 At the time when Ashraf (2020b) was written. 244 Ashraf (2020b)
CHAPTER 5
OPEN GOVERNMENT DATA IN MALAYSIA: PRINCIPLES, BENEFITS, CHALLENGES AND THE WAY FORWARD
113 KHAZANAH RESEARCH INSTITUTE
Government data ecosystem in Malaysia
5.5.1. Laws related to government information
Official Secrets Act 1972
Except for the Official Secrets Act 1972245, Malaysia does not have any other overarching law for
government data. The Official Secrets Act provides broad and decentralised authority to
individual government bodies to declare information as restricted, confidential, or secret246. As
opposed to a Right to Information (RTI) law—which Malaysia currently does not have at the
national level—that sets openness as the normative approach towards government information
sharing, the Official Secrets Act implies circumspectness. It is therefore logical for public servants
to practice restraint in releasing government data when confronted with legal uncertainty247,
especially when there is no competing or superseding law that compels disclosure.
Statistics Act 1965
Meanwhile, the Statistics Act 1965 deals with the role of the Department of Statistics (DOS) and
the Chief Statistician248. The Statistics Act confers broad authority to DOS to “collect and interpret”
data related to any field necessary for public policy. However, the Act does not provide DOS with
the mandate to manage or direct the national statistical system249. Hence, individual agencies250
can and do collect their own data, administered by their own governance structure with devolved
data sharing authority protected under the Official Secrets Act.
In September 2020, the Malaysian government announced its plan to revise the Statistics Act to
strengthen the role of DOS to “develop a systematic mechanism for coordination, reach and
cooperation in data sharing”251. The Minister in the Prime Minister’s Department, Datuk Seri
Mustapa Mohamed, admitted that government data is presently scattered across different
databases held by various agencies. Therefore, the plan is to streamline data coordination
between government agencies under one agency. The Cabinet has approved the formation of a
National Statistics and Data Council, which will be the highest agency with regard to national data
and analysis252.
A reform to the Statistics Act is timely. However, one question remains: how are decisions to share
government data to stakeholders outside the government made? Under the current Statistics Act,
DOS has the power to share its data with anyone outside the government “where they consider it
in the public interest”. This essentially means that the Chief Statistician has broad discretion to
determine what data can be shared with the public. If the proposed coordination of government
data management comes to pass, depending on the form of the coordination and in the absence
of any other law on access to government data, it may imply granting substantial and
concentrated power to an individual to determine what government data can be shared.
245 Government of Malaysia (2006) 246 World Bank (2017a) 247 World Bank (2017a) 248 Government of Malaysia (1989) 249 World Bank (2017b) 250 In this chapter, “agencies” refer to federal government ministries, agencies and state government offices. 251 Nur Hanani (2020) 252 Syahirah (2020)

CHAPTER 5
OPEN GOVERNMENT DATA IN MALAYSIA: PRINCIPLES, BENEFITS, CHALLENGES AND THE WAY FORWARD
KHAZANAH RESEARCH INSTITUTE 114
Personal Data Protection Act 2010
With regard to personal data, Malaysia is one of the first countries in Southeast Asia253 to enact a
Personal Data Protection Act (PDPA) in 2010254. However, this Act does not apply to the federal
government and state governments, only to commercial transactions. Aside from the PDPA and
professional regulations such as the Malaysian Medical Council (MMC)’s Code of Professional
Conduct, there are no other laws that protect data privacy in Malaysia. The non-applicability of
the federal and state governments under the PDPA means the privacy of government data is not
protected by any law. With the increasing amount of data collected by governments, especially in
digital form and during the Covid-19 pandemic, it is pertinent for Malaysia to explore ways to fix
this gap in personal data protection.
5.5.2. Current open government data policy in Malaysia
Eleventh Malaysia Plan 2016 – 2020
The 11th Malaysia Plan seeks to enhance service delivery with citizens at the centre. One of the
strategies explicitly outlined is to leverage data by “proliferating open data among agencies,
encouraging cross-agency data sharing, and leveraging big data analytics (BDA)”. In this respect,
the plan aims to strengthen the role of the Malaysian Administrative Modernisation and
Management Planning Unit (MAMPU), an agency under the Prime Minister’s Department, to
spearhead the modernisation of the public sector255.
The Malaysian Administrative Modernisation & Management Planning Unit (MAMPU)
As the agency responsible for open government data initiative in Malaysia, MAMPU manages the
Malaysia Open Data Portal (data.gov.my), a one-stop portal for government data in Malaysia256.
In 2015, MAMPU distributed a General Circular: Public Sector Open Data Implementation to all
federal and state government agencies as well as local authorities to guide the implementation of
open government data. MAMPU defines open data as “data that can be used freely, can be shared
and reused by citizens, government and private agencies for any purposes”257.
Under the Public Sector Information and Communication Technology (ICT) Strategic Plan 2016 –
2020, MAMPU underlines a data-driven government as one of the plan’s cores258. The plan
outlines five programmes under two strategies related to government data (Table 5.3).
253 World Bank (2017b) 254 Government of Malaysia (2010) 255 EPU (2015) 256 MAMPU (n.d.). Open government data is not only published in the Malaysia Open Data Portal (data.gov.my). Many
ministries and agencies publish data in their own website, and some have their own open data portal such as eStatistik
by DOS. 257 Prime Minister’s Department (2015) 258 MAMPU (2016)

CHAPTER 5
OPEN GOVERNMENT DATA IN MALAYSIA: PRINCIPLES, BENEFITS, CHALLENGES AND THE WAY FORWARD
115 KHAZANAH RESEARCH INSTITUTE
Table 5.3: Strategic core 2 (data-driven government) in the Public Sector ICT Strategic Plan 2016 – 2020
Strategy Objective Programme
Utilisation of government data
Optimising the use and realising the value of public sector data
Expansion of the public sector open data initiative
Acceleration of public sector big data initiative
Government service delivery transformation with data analytics
Managing and coordinating public sector data
Managing public sector data efficiently and holistically
Development of public sector data governance
Development of data sharing and management hub
Source: MAMPU (2016)
There is an obvious hurdle in implementing strategies outlined in the Public Sector ICT Strategic
Plan. While MAMPU can initiate efforts to coordinate government data management and
encourage data sharing, it does not have a legal mandate to enforce those efforts.
The Department of Statistics Malaysia (DOS)
The Department of Statistics Malaysia (DOS) Transformation Plan 2015 – 2020 expresses the
department’s commitment to improving accessibility to its data259. DOS has bilateral memoranda
of understanding (MOU) with at least 12 universities for data sharing260. As previously
mentioned, although DOS is the national statistical agency, the department’s authority including
its open data policy is limited to the data it collects.
The Ministry of Communications and Multimedia (KKMM)
The Ministry of Communications and Multimedia (KKMM) identified open data as one of the key
areas in the Communications and Multimedia Blueprint 2018 – 2025261. On the surface, KKMM’s
open data agenda focuses on data from the private sector. However, while the blueprint listed
programmes specifically for data from the private sector, it also suggests “strengthen[ing] the
quality and coverage of open government data by reinforcing policy guidelines on open data
performance”262. It is unclear how open data initiatives by MAMPU and KKMM fit together.
The Ministry of Science, Technology and Innovation (MOSTI)
The National Policy on Science, Technology and Innovation 2021 – 2030 under the Ministry of
Science, Technology and Innovation (MOSTI) also highlights open data as one of its strategies263.
The focus of this policy is research data. In 2019, MOSTI (previously known as the Ministry of
Energy, Science, Technology, Environment and Climate Change) established the Malaysia Open
Science Platform (MOSP) to advance open science by formulating policy, nurturing capacity
building and developing infrastructure264. However, one aspect that is perhaps overlooked by
MOSTI is access to government data for research265.
259 DOS (2015) 260 World Bank (2017b) 261 KKMM (2018) 262 KKMM (2018) 263 MOSTI (2021a) 264 MOSP (2020) 265 Ashraf (2020c) discusses the value of government data for research and issues faced by academic researchers in
accessing government data

CHAPTER 5
OPEN GOVERNMENT DATA IN MALAYSIA: PRINCIPLES, BENEFITS, CHALLENGES AND THE WAY FORWARD
KHAZANAH RESEARCH INSTITUTE 116
Training for public servants
The Public Service Department (JPA) and the National Institute of Public Administration (INTAN)
started to institutionalise digital government training for public servants in 2016. Six new areas
of training have been introduced: (i) strategic digital management, (ii) big data service
management, (iii) digital government management, (iv) infrastructure management, (v) security
and privacy management, and (vi) quality and regulation. Inclusive of eight ICT areas introduced
previously, there are now 14 areas of training related to ICT competency266. This training,
however, is only for public servants managing ICT (Grade F in the public service classification)267.
In the Malaysia Digital Economy Blueprint launched in February 2021, the government
announced plans to expand digital training for public servants across all grades and schemes268.
5.5.3. Open government data governance
Since government data management in Malaysia is highly decentralised with every agency having
the authority to decide what data can be shared, open government data governance is also
decentralised (Figure 5.9).
Figure 5.9: Open government data structural organisation in Malaysia
Source: Prime Minister’s Department (2015) and personal communication with MAMPU in January 2021
266 JPA and INTAN (2016) 267 Personal communication with MAMPU in January 2021 268 EPU (2021)

CHAPTER 5
OPEN GOVERNMENT DATA IN MALAYSIA: PRINCIPLES, BENEFITS, CHALLENGES AND THE WAY FORWARD
117 KHAZANAH RESEARCH INSTITUTE
At the central government level, the highest committee looking after the open government data
initiative is the Public Sector Modernisation and Digitalisation Committee, chaired by the Chief
Secretary to the Government of Malaysia. Under said committee is the Public Sector Open Data
Coordination Committee, chaired by the Director General of MAMPU. In general, the Coordination
Committee carries out strategic planning and policy advisory roles. MAMPU has a Public Sector
Open Data Working Group under the committee. This group mainly handles the Public Sector
Open Data Platform, identifies potential datasets to be made open and provides advisory services
to government agencies.
Every ministry and government agency has its own Public Sector Open Data Coordination
Committee chaired by its respective Chief Information Officer or Chief Technology Officer and its
own Public Sector Open Data Working Group. The Coordination Committee devises an open data
strategy for the organisation and approves datasets that can be made open based on the
recommendation from the working group. In most ministries and agencies, the Public Sector
Open Data Coordination Committee comprises the same members as the ICT Development
Committee (Jawatankuasa Pemandu ICT)269.
Open government data challenges in Malaysia
5.6.1. Supply-side challenges
Supply-side challenges refer to the challenges faced by government agencies in supplying open
government data. These challenges can be grouped into three inter-related broad categories:
policy, infrastructure and human resource, and culture.
Overarching policy
The biggest supply-side challenge in implementing open government data is the absence of an
overarching and clear policy framework. Since the Official Secrets Act accords each agency the
prerogative to decide what data can be shared, and with no law compelling disclosure, open
government data initiatives rely largely on each agency’s leadership. Implementing open
government data is likely the lowest priority when there are other duties and issues that these
agencies may deem more important and urgent.
Moreover, the current process of releasing data is not very simple as it has to be recommended
by the Public Sector Open Data Working Group and approved by the Public Sector Open Data
Coordination Committee at the agency level, which is often the same committee that has to handle
other ICT matters. Internal data management regulations are not always consistent; for example,
repeated requests for the same or similar data do not usually lead to by-default approval270.
269 Prime Minister’s Department (2015) and personal communication with MAMPU in January 2021 270 World Bank (2017a)

CHAPTER 5
OPEN GOVERNMENT DATA IN MALAYSIA: PRINCIPLES, BENEFITS, CHALLENGES AND THE WAY FORWARD
KHAZANAH RESEARCH INSTITUTE 118
MAMPU, through the Public Sector Open Data Coordination Committee at the central government
level, can only encourage and facilitate government agencies to implement open government
data. It does not have an overriding power to dictate the individual agency’s open data policy. For
example, on a case-by-case basis, DOS provides access to its microdata, but such access is subject
to several constraints such as only a third of the indicators or the sample requested by data users
being released271. MAMPU has no say on this policy.
Many matters that are important to ensure successful and safe implementation of the open data
initiative such as data privacy and security are regulated at the agency level272. Agencies also
determine fees for their data273. Depending on their financial autonomy, the revenues collected
are either (partially) kept by the agencies or transferred to the Consolidated Fund controlled by
the Ministry of Finance274.
Integration of databases held by different agencies is still sparse275. For example, databases
maintained by the Ministry of Human Resources and the Ministry of Home Affairs are not
necessarily easily harmonised276. Inter-agency data sharing is decided on a case-by-case basis
with senior managerial approval necessary for most cases277. Even data inventories that
catalogue what data an agency holds are not accessible by other agencies except with
management authorisation on a case-by-case basis278. The same issue happens between federal
agencies and state agencies279.
Currently, there is no mechanism to assess the implementation of open government data, even
though the Public Sector Open Data Coordination Committee at both the central and agency level
is supposed to monitor its progress280. This is not a unique problem; lack of monitoring and
evaluation is noted as a common issue in the implementation of government ICT initiatives281.
271 World Bank (2017a) 272 World Bank (2017a) 273 World Bank (2017a) and personal communication with MAMPU in January 2021 274 For example, according to the Companies Commission of Malaysia Act 2001, “the Commission shall pay to the
Federal Consolidated Fund an amount not exceeding thirty per cent out of the current annual surplus of the
Commission at such time”. Hence, some portion of the revenue collected through data fees are kept by the Companies
Commission. Source: Government of Malaysia (2018) 275 World Bank (2017a) 276 World Bank (2017b) 277 World Bank (2017a) 278 World Bank (2017a) and personal communication with MAMPU in January 2021 279 World Bank (2017b) 280 Personal communication with MAMPU in January 2021 281 Sudirman and Yusof (2017)

CHAPTER 5
OPEN GOVERNMENT DATA IN MALAYSIA: PRINCIPLES, BENEFITS, CHALLENGES AND THE WAY FORWARD
119 KHAZANAH RESEARCH INSTITUTE
Infrastructure and human capital
Implementing open government data involves mobilising digital infrastructure and human
resources that in most governments are already scarce282. It involves more work having to deal
with legacy systems such as data format that requires modification283. In Malaysia, many agencies
indicate that they have a small ICT team284. Meanwhile, MAMPU also has limited capacity to reach
out to and support every government agency, with fewer than five management and professional
level staff responsible for the open data initiative285.
The quality of open government data varies widely across agencies, which, aside from reflecting
the priority of the agency and its organisational culture, partly indicates differences in data
infrastructure and human capital across agencies. However, there is no systematic competency
framework to track and measure ICT skill levels among public servants286. It is not known
whether there is a framework to assess the adequacy of digital infrastructure across agencies.
Without a systematic assessment of the current status and actual needs of digital infrastructure
and human capital across agencies, it is uncertain how resources are allocated appropriately to
each agency to achieve the government’s ICT aspirations.
Public sector awareness and culture
There is low intrinsic motivation among Malaysian public servants to implement open
government data287. This is not surprising as there is no overarching policy that institutionalises
open government data as an essential public service as opposed to merely being a “nice-to-have”
public offering. Some public servants may view making data open an additional burden imposed
by MAMPU288. Some think that data published by the government is enough, given that it is not
widely used by the public289.
There is also the fear of misinterpretation, manipulation and misuse of government data among
public servants290. Some are also concerned that foreign parties may appropriate a bigger
advantage over local stakeholders as the result of open government data291. These concerns are
not trivial. They must be properly addressed to ensure not only buy-in from public servants but
also inclusive and safe use of government data.
282 Barry and Bannister (2014); Ruijer and Meijer (2020); Martin (2014) 283 Barry and Bannister (2014) and personal communication with MAMPU in January 2021 284 World Bank (2017a) 285 Mustapa, Hamid, and Nasaruddin (2019) and personal communication with MAMPU in January 2021 286 World Bank (2017a) 287 World Bank (2017a) 288 Based on general sentiment assessed during Malaysia Open Data User Group forum in December 2020, which was
attended by representatives from government agencies 289 World Bank (2017a) and based on observations gathered during a Malaysia Open Data User Group forum in
December 2020 290 World Bank (2017a) 291 World Bank (2017a)

CHAPTER 5
OPEN GOVERNMENT DATA IN MALAYSIA: PRINCIPLES, BENEFITS, CHALLENGES AND THE WAY FORWARD
KHAZANAH RESEARCH INSTITUTE 120
5.6.2. Demand-side challenges
Demand-side challenges are challenges faced by data users in accessing and using government
data. These challenges can be the result of shortcomings of data users or data providers.
Latent demand for data
Latent demand refers to the “demand for a product or service that a consumer cannot satisfy
because they do not have enough money, because the product or service is not available, or
because they do not know that it is available”292. Latent demand is a major demand issue when it
comes to government data. An argument that there is no demand for government data, hence
there is no necessity to publish data, is rather untenable when the supply of the right data, i.e.
data that is useful and needed, is not accessible or when potential data users do not know what
data they can demand.
In Malaysia, civil society groups and researchers noted that granular, complete, timely and
historical data is not accessible293 and some data is not free294. Moreover, a lot of data published
on agency websites is not in an open format, for example in PDF instead of a machine-processable
format. Additionally, most government agencies do not publish data inventories295, making it
difficult for the public to know what data can be requested if it is not publicly available.
Furthermore, the process to request publicly unavailable data from government agencies is not
clear. Many external stakeholders consider requesting data an unpredictable and inefficient
process296. Many agencies do not publish the standard procedure for data requests on their
website.
Digital skills
Coursera, a popular massive open online course (MOOC) provider, conducts benchmark
assessments of skills proficiency around the world called the Global Skills Index (GSI)297. In its
latest and second edition published in 2020, the index evaluated 60 countries in 11 fields of study
in business, technology and data science. The GSI is not necessarily representative of a country
because it only reflects Coursera learners. That said, the findings are still insightful as Coursera
learners are mostly those who want to learn a new skill or enhance their skills by their own
initiative. The GSI adopts proficiency measurements based on a machine learning method called
the Glicko algorithm to assess how proficient each learner is in each competency and how
challenging each assessment is.
Skills in the technology domain include computer networking, databases, human-computer
interaction, operating systems, security engineering and software engineering. Skills in the data
science domain include data management, data visualisation, machine learning, mathematics,
statistical programming and statistics.
292 Cambridge English Dictionary (n.d.) 293 Ashraf (2020c); World Bank (2017a) 294 World Bank (2017a) 295 World Bank (2017a) and personal communication with MAMPU in January 2021 296 World Bank (2017a) 297 Coursera (2020)

CHAPTER 5
OPEN GOVERNMENT DATA IN MALAYSIA: PRINCIPLES, BENEFITS, CHALLENGES AND THE WAY FORWARD
121 KHAZANAH RESEARCH INSTITUTE
In the technology domain, Malaysia ranked 49 out of 60 countries and is behind the Philippines,
Thailand, Singapore, Indonesia and Vietnam. In the data science domain, Malaysia ranked 43 and
is behind Thailand, the Philippines and Singapore. As mentioned, the GSI is not representative of
the entire population but the fact that Malaysia is behind many countries including neighbouring
and other developing countries is a call for action. In the context of open government data, users
without the right skills will not be able to utilise government data for meaningful change. In a
broader context, the lack of technology and data skills may become a hindrance for Malaysia to
develop high-value industries and catch up with global technological advancement.
The way forward for Malaysia
5.7.1. Right to Information law
A Right to Information (RTI) law, which is also referred to by different names such as Freedom of
Information (FOI) law and Public Information Disclosure law, is a law that formalises the right of
the people to access information held by public bodies. It typically provides clear processes and
requirements for people to request information and for public bodies to respond to such requests.
As of 2019, 126 out of 193 United Nations member states and two non-member states have an
RTI decree, whether in a form of a law or an actionable regulation298. Around 90% of the world’s
population and 96% of the population in the Asia Pacific live in a country with an RTI law or
regulation299. In Southeast Asia, Thailand (since 1997), Indonesia (since 2008), Timor-Leste
(since 2016) and Vietnam (since 2016) have an RTI law whereas the Philippines (since 2016)
have an actionable RTI regulation300. Malaysia, unfortunately, is among the few countries that still
do not have an RTI law or an actionable regulation at the national level. However, Malaysia does
have a pending RTI law, with stakeholders’ consultation started in 2018301. The law was expected
to be tabled in the Parliament mid-2020302 but this has yet to occur303. The states of Selangor and
Penang already have state-level RTI laws.
While RTI laws typically operate through reactive disclosure of government information (i.e. on-
demand disclosure), open government data calls for proactive disclosure of information. At the
heart of open government data is collaboration as opposed to litigation304. In practice, RTI laws
are commonly used to obtain data related to the government’s operations and accountability.
Meanwhile, open government data involves opening up a wider range of data held by the
government including socioeconomic and environmental data305.
298 Open Society (2019); Global RTI Rating (n.d.) 299 Article 19 (2018) 300 Open Society (2019) 301 Parliament of Malaysia (2019) 302 Kannan and Babulal (2019) 303 At the time of writing 304 Noveck (2017) 305 Noveck (2017)

CHAPTER 5
OPEN GOVERNMENT DATA IN MALAYSIA: PRINCIPLES, BENEFITS, CHALLENGES AND THE WAY FORWARD
KHAZANAH RESEARCH INSTITUTE 122
Despite the different mechanism and approach to government data, open government data and
RTI laws are not in conflict; in fact, they complement each other. An RTI law is necessary to
compel disclosure306. Although open government data upholds the principle of ‘open by default’,
governments may be reluctant to disclose certain information. This is when an RTI law would
come into the picture to demand disclosure and provide legal recourse. Therefore, a policy
framework that blends the two can create a more effective system of government data-sharing
that fosters collaboration as well as checks and balances.
5.7.2. Streamlining government data policy
Institutionalised commitment
As discussed, one of the major stumbling blocks in implementing open government data in
Malaysia is the absence of a clear legal framework to institutionalise providing access to
government data as one of the core services of the government. In 2015, MAMPU distributed a
general circular to all agencies on the implementation of open government data. This circular is a
good starting point to familiarise agencies with the concept of open government data, but it has
weak enforcement power. In this regard, it is time for Malaysia to enact an RTI law that is fit for
a digital age and that embodies the principles of open government data.
Malaysia should also seal its commitment to open government data by adopting international
partnerships and declarations. Notably, Malaysia is not a member of the Open Government
Partnership (OGP) or the Open Data Charter (ODC). Through the OGP, participating countries
work with civil society organisations to co-create two-year open government action plans with
concrete commitments to be implemented. Among Southeast Asian countries, only Indonesia and
the Philippines are members of the OGP. Meanwhile, the ODC adopters pledge their commitment
to publishing timely and comprehensive, accessible and usable, comparable and interoperable
government data open by default, for improved governance and citizen engagement and for
inclusive development and innovation. In Southeast Asia, the Philippines is the only ODC adopter.
Clear and agile governance framework
Malaysia should consider introducing a cross-agency leadership role to oversee the open
government data agenda with key functions include carrying out (i) partnerships and community
engagement such as with researchers and civil society groups; (ii) internal coordination and
agencies engagement; (iii) data audit and ethics, value and risk assessment; (iv) dissemination
and communication of data; and (v) data collaboratives including with the private sector307.
306 Noveck (2017) 307 Inspired by Verhulst et al. (2020) with modifications

CHAPTER 5
OPEN GOVERNMENT DATA IN MALAYSIA: PRINCIPLES, BENEFITS, CHALLENGES AND THE WAY FORWARD
123 KHAZANAH RESEARCH INSTITUTE
In the spirit of collaboration of open government data, the government could consider forming a
consultative council comprising governmental and non-governmental stakeholders
representing various government agencies and various segments of society308. The role of the
council would be providing recommendations to the government on matters related to the
collection, management, publication and use of government data. The main goal of this council is
to serve as a platform in ensuring that the open government data policy is inclusive and
responsive to fast-changing technological advances309. The premise underlying the establishment
of this council is that the public, apart from the government as the data custodian, should have a
say on how data about them is collected, used and shared.
Concerns and barriers identified by public servants in implementing open government data
need to be addressed rather than dismissed310. Some of the concerns are legitimate such as how
opening up data may impact the country’s standing in international negotiations311. The
considerable work that needs to be put in by public servants and the learning process that needs
to take place have to be taken into account in planning the development path of the open
government data agenda312. The uneven levels of institutional maturity and technical capacity of
different agencies to carry out open government data have to be recognised313. In this regard,
differentiated milestones with specific action plans customised for and negotiated with
agencies according to their capacity should be considered.
A clear governance framework also includes proper decision-making and documentation
protocols to guide and record key decision points impacting data collection, processing, analysis
and sharing314. This is to ensure accountability of decisions and to identify pain points where
improvements could be made. In addition, agencies should also create a mechanism to track data
requests and details on how decisions on the data are made to avoid arbitrary denial315.
Open government data could be an entry point to strengthen coordination between agencies by
facilitating data sharing. Inter-agency data sharing avoids redundancy in data handling that
could lead to improving productivity and reducing the operating cost of agencies316. As the first
step to foster inter-agency data sharing, agencies should publish their data inventories and make
them accessible to other government agencies. It is also a good first step for agencies to identify
data that can be published publicly.
Digital infrastructure and skills
Digital infrastructure and skills across all agencies ought to be improved by increasing
investment in technology, reskilling existing public servants and hiring a high-skilled workforce
with competence in data management and digital technology.
308 Inspired by Young et al. (2020) with modifications 309 Verhulst and Young (2016) 310 Barry and Bannister (2014) 311 Personal communication with MAMPU in January 2021 312 Martin (2014) 313 World Bank (2020) 314 Verhulst et al. (2020) 315 World Bank (2017a) 316 Dawes (1996)

CHAPTER 5
OPEN GOVERNMENT DATA IN MALAYSIA: PRINCIPLES, BENEFITS, CHALLENGES AND THE WAY FORWARD
KHAZANAH RESEARCH INSTITUTE 124
One of the initiatives that the Malaysia Open Science Platform (MOSP) has started is providing
data stewardship training to existing librarians in public universities to equip them with the skills
to manage digital raw research data on the open science platform. MOSP targets to train 200 data
stewards by July 2021317. This initiative could be an inspiration for the government to carry out
a reskilling initiative for existing public servants.
Implementation of open government data involves several technical aspects beyond putting data
on a website. Apart from ensuring that the privacy and security of the data are protected, to
facilitate data integration, data should be interoperable. Interoperability is the ability to
seamlessly “transfer and render useful data and other information across systems, application or
components”318. Interoperability requires hardware and systems that are connected and data
that can understand each other. It is not enough for interconnected systems to pass bits from one
system to another if the data cannot “talk” to each other319.
To rapidly expand open government data, innovations to make the process of publishing data
easy for public servants should be developed. This includes automating the process of
inventorying, annotating and classifying data320. The government should also think of ways to
integrate data sourced from traditional means such as surveys and census with data sourced
from “non-traditional” ways such as satellite and environmental sensors data. This could allow
for greater refinement in policies as well as quick estimates for time-sensitive interventions321.
However, apart from technical considerations, this sort of integration also requires ethical
considerations.
With regard to infrastructure for open government data, some areas that the government could
look into further include procurement policies to ensure future purchases of information
technology (IT) systems support open data and a strategy to transition all IT systems in all
agencies to comply with open data standards322.
Monitoring, evaluation and review
Any policy must be properly monitored, evaluated and reviewed to achieve its goals. As noted
earlier, currently there is no mechanism to evaluate the implementation of open government data
by agencies. There is a risk of “open washing”, a scenario whereby governments only publish data
that is easy and uncontroversial simply to appear to be implementing open government data323.
Therefore, to ensure an open government data policy achieves its intended goals, assessment
metrics324 should include not only quantitative aspects such as the number of datasets published,
but also qualitative elements325 such as engagement with external stakeholders, human capital
development, documentation of decision provenance, and data privacy and security protection.
317 Personal communication with MOSP in October 2020 318 Gasser (2015) 319 Gasser (2015) 320 Janssen, Charalabidis, and Zuiderwijk (2012); Noveck (2017) 321 World Bank (2020) 322 Inspired by Government of Ontario (2015) 323 Mansell (2020); Noveck (2017) 324 Government of Ontario (2015) 325 World Bank (2017a)

CHAPTER 5
OPEN GOVERNMENT DATA IN MALAYSIA: PRINCIPLES, BENEFITS, CHALLENGES AND THE WAY FORWARD
125 KHAZANAH RESEARCH INSTITUTE
In the spirit of transparency that open government data represents, annual reports on the
progress made by each agency against the previous year’s commitments and priorities and goals
for the upcoming year should be made publicly available for the legislature and the public to
review326.
5.7.3. Data privacy and security protection
Data privacy and security law
Apart from the Personal Data Protection Act that currently does not cover data collected by the
government, Malaysia does not have other data privacy laws. On the contrary, several countries
around the world have a privacy law that extends to government data. The South African
Protection of Personal Information Act 2000, the Indian Personal Data Protection Bill 2019, and
the New Zealand’s Privacy Act 2020 (replacing Privacy Act 1993) are some of the data privacy
laws that apply to both governments and businesses. Some laws specifically protect the privacy
of data held by government agencies such as the Canadian Privacy Act 1985. It is time for Malaysia
to consider a data privacy law that covers government data. In the Malaysia Digital Economy
Blueprint, the government plans to review Personal Data Protection Act327—this must include
considering providing legal protection to government data privacy.
Data privacy and security framework
Beyond having laws, government agencies need a comprehensive framework for assessing and
mitigating data privacy and security risks. Some considerations in thinking about the framework
are discussed below.
First, shift from output assessment (e.g. “is the data safe?”) to process-oriented standards
(e.g. “have we assessed and acted upon risks at every stage of the data lifecycle?”)328. The process-
oriented framework calls for systematic evaluation of risks and mitigation measures that could
be employed at every stage of the data lifecycle.
At the collection stage, government agencies need to ask whether a particular piece of
information needs to be collected in the first place. Even if the piece of information is intended to
never be made public, there is a privacy concern about government holding that information and
potentially misusing it329. Some mechanisms for privacy protection in data collection are
governments limiting the use of a particular data for a narrowly-defined specific purpose or
setting up an independent privacy oversight board330.
326 Inspired by Government of Ontario (2015) 327 EPU (2021) 328 Green et al. (2017) 329 Green et al. (2017) 330 Altman et al. (2015)

CHAPTER 5
OPEN GOVERNMENT DATA IN MALAYSIA: PRINCIPLES, BENEFITS, CHALLENGES AND THE WAY FORWARD
KHAZANAH RESEARCH INSTITUTE 126
At the transformation and retention stages, standard protocols of private- and public-key
encryption may prevent unauthorised actions. In addition, at the retention stage, other mitigation
measures could include statutory breach reporting requirements and centralised databases that
enable controlled queries across databases maintained by different agencies331. When necessary,
retire data stored internally and remove data shared online when large privacy risks surface332.
At the data release stage, there are various technical tools that could be employed such as data
aggregation, data anonymisation and fields removal. However, decisions on which tools should
be used should consider privacy risks and data utility. To reiterate, data privacy protection should
not disproportionately diminish the potential value from the use of the data.
At the post-release stage, one mechanism of privacy protection is criminalising re-identification
as done by the Indian Personal Data Protection Bill 2019, which covers data held by government
agencies. Data use agreements can also include obligations to secure the data and liability for
harm arising from the misuse of data333. Aside from protecting privacy, data use agreements can
also mitigate concerns that government data would be misrepresented334.
Second, consider diverse and proportionate measures in deciding the most suitable measure
to protect data privacy based on the characteristics and context of the data. This can be done by
assessing three aspects: the range of threats to privacy; the vulnerabilities that exacerbate those
threats; and the likelihood of disclosure of personal data given those threats and
vulnerabilities335. The goal is to release as much data as possible without compromising privacy.
Imposing restrictions on data access may be better than not disclosing the data at all when the
restrictions can adequately address privacy risks336. For example, the US has a three-tier scheme
for data access: public, restricted public and non-public337. Public data is accessible to anyone
without restriction. Restricted public data is only accessible by select researchers under certain
conditions because the data contains sufficient granularity or linkages that make it possible to
reidentify individuals. Non-public level data is only accessible within the government.
331 Altman et al. (2015) 332 Green et al. (2017) 333 Altman et al. (2015) 334 Dulong de Rosnay and Janssen (2014) 335 Modified from Altman et al. (2015). Altman et al. includes a fourth aspect, which is the likelihood, extent, and severity
of harms inflicted as the result of personal data disclosure. However, in the author’s opinion, the goal of privacy
protection is to protect privacy. Whether harms would be inflicted and how severe would they be as the result of the
loss of privacy are out of the question. 336 Borgesius, Gray, and van Eechoud (2015) 337 Altman et al. (2015)
CHAPTER 5
OPEN GOVERNMENT DATA IN MALAYSIA: PRINCIPLES, BENEFITS, CHALLENGES AND THE WAY FORWARD
127 KHAZANAH RESEARCH INSTITUTE
Third, implement documentation standards of privacy protection practices. The
documentation should address privacy handling of datasets with common features as well as
datasets with uncommon features338. This documentation should be publicly accessible when
requested, to allow public and legislative scrutiny on privacy decisions. The government should
also have internal periodic legal and technical review of privacy practices339 as well as by third-
party auditors340 to ensure that those practices are adequate given that technologies and types of
data continue to evolve.
5.7.4. Inclusive and meaningful use of government data
Inclusive data collection
Although discussions on open government data are often framed in the context of providing
access to data, it is necessary to also pay attention to the data collection process to ensure the
agenda results in equitable outcomes. If data about social and economically disadvantaged groups
are either not collected, incomplete, inconsistent or unreliable, open government data may have
little benefit to these groups. In fact, the agenda may be detrimental to them. While the subject of
‘digital inequality’ has shifted from merely digital access to meaningful use, both angles, broadly
speaking, are based on active interaction with digital technology. Another angle that we should
consider is passive interaction, in particular, passive data contributions. Because the data of
digitally disenfranchised groups is not captured, they are considered “digitally invisible”341.
From a geographical perspective, there is evidence that shows places that are invisible in digital
representations are also invisible in practice to many people342. In the context of open
government data, we cannot improve the well-being or consider the issues of a group of people if
their data simply do not exist. Effectively, these people are invisible. Therefore, the first step to
ensure that open government data results in equity is to ensure inclusive data collection.
338 Borgesius, Gray, and van Eechoud (2015) 339 Green et al. (2017) 340 Altman et al. (2015) 341 This term was introduced by Longo et al. (2017) to the best of the author’s knowledge. However, Longo et al.
conceptualise digitally invisible groups as those who do not leave digital traces from the use of digital devices such as
mobile phone and transaction cards. The author extends the definition of the term to generally include groups who
have limited digital data representing them regardless of how the data is collected. This includes the type of data that
is typically collected through traditional means such as surveys but if the data does not capture certain groups, and
subsequently their data is not visible online, they can also be considered digitally invisible. 342 Graham and De Sabbata (2020)
CHAPTER 5
OPEN GOVERNMENT DATA IN MALAYSIA: PRINCIPLES, BENEFITS, CHALLENGES AND THE WAY FORWARD
KHAZANAH RESEARCH INSTITUTE 128
Equal use of data
To be able to use open government data meaningfully, one needs the ability to collect, treat,
analyse and communicate data343. It may even be necessary to belong to a certain social circle to
know the availability of particular government data344, especially if data published is not easily
findable. As a result, open government data mostly attracts certain groups of professionals such
as lawyers, researchers, journalists, civic technologists, consultants and corporate executives.
While these actors may play pivotal roles in transforming data to generate public value, it is
necessary to increase the diversity of users of open government data to generate more inclusive
public value345.
The government could make use of the proposed consultative council to foster inclusivity in the
open government data agenda by ensuring that permanent members of the council represent
various segments of society including the indigenous people of Peninsular Malaysia and Sabah
and Sarawak, people with disability, women, agricultural smallholders and civil society
organisations working with the underprivileged such as poor communities, migrant workers and
homeless people. Ideally, these representatives should advocate not only for the availability of
data about groups they represent but also recommend policy to encourage the use of data by
these groups or people who advocate for these groups. They could also bring to attention privacy
issues impacting their community.
The government should develop educational programmes to increase data literacy targeting
public servants, researchers, and civil society organisations. Aside from these targeted groups,
the government should also consider integrating data literacy in the school curriculum. Drawing
insights from financial literacy education, integrating financial literacy in school’s syllabus has a
more effective impact than targeted adult education346.
Public versus private value
While open government data reduces information asymmetries347, it may lead to or reinforce
asymmetries in power and opportunity348 with privileged groups exploiting data for private
value. In the US, the bulk of FOI requests are from corporations who use data for their business
interests instead of journalists or civil society organisations349.
While using government data to generate private value is not inherently negative, the role of
policymakers is to devise a policy that encourages the use of government data to generate public
value as well. This requires policymakers to rethink copyright and intellectual property rights350,
among other aspects. For example, the government could consider waiving claims to
intellectual property for any product that is anchored by government data and ensure that
government data is not transferred as intellectual property to a third party351.
343 Wessels et al. (2017) 344 Barrantes and Matos (2020) 345 Verhulst et al. (2020) 346 World Bank (2020) 347 Ashraf (2020b) 348 World Bank (2020) 349 Noveck (2017) 350 Seward (2020) 351 Government of Ontario (2015)

CHAPTER 5
OPEN GOVERNMENT DATA IN MALAYSIA: PRINCIPLES, BENEFITS, CHALLENGES AND THE WAY FORWARD
129 KHAZANAH RESEARCH INSTITUTE
Meaningful impact of open government data
If the public at large and even the public servants see no real value from open government data,
they likely see no reason to support it. Over time, the promise of open government data would
become less convincing. The government as well as other advocates of open government data
should identify opportunities to demonstrate its value. For example, in the US, opening the
entire corpus of data on food-borne illnesses allowed Chicago’s Department of Innovation and
Technology to build an algorithm that helped Chicago’s Department of Public Health allocate its
scarce resources for food safety violation’s inspections352. This is an example of how open
government data fosters inter-agency collaboration and produces value for public servants.
The government should integrate the open government data initiative with other government
initiatives to secure its relevancy. For example, MOSTI recently launched the Malaysia Grand
Challenge (MCG) that supports quality and high-impact research in ten priority areas including
energy, education, smart cities and transportation, and environment and biodiversity353. Open
government data could be one of the core components to support this initiative. In addition, each
government agency could identify and support niche areas where open government data could
be used to create innovations that are in line with the respective agency’s strategic priorities.
The government should nurture and foster collaboration with data intermediaries among non-
profit organisations/individuals (e.g. researchers and civil society organisations) who analyse or
transform government data into digestible information for public dissemination or use the data
for specific projects. This could empower these non-profits to generate public value from
government data, enhance the matching of the supply and demand of data354, and create
meaningful impact from the open government data agenda.
Feedback mechanism
As open government data is about collaboration, the agenda does not end with the government
sharing information. The government needs to actively solicit feedback355 not only with regard
to the open government data policy but also other policy areas that the public advocate based on
the data made publicly available.
One of the initiatives that the government could explore is to conduct surveys on the open
government data initiatives to gather general snapshots of users’ experience. Nevertheless,
surveys tend to lack details and context. Therefore, the government should also conduct more
deliberative methods to collect feedback356 such as through the consultative council, focus
group discussions, and public dialogues. Each government agency should also invite feedback on
their respective initiative, particularly on their data portals.
352 Spector (2016) 353 MOSTI (2021b) 354 Verhulst and Young (2016) 355 Janssen, Charalabidis, and Zuiderwijk (2012) 356 Young et al. (2020)

CHAPTER 5
OPEN GOVERNMENT DATA IN MALAYSIA: PRINCIPLES, BENEFITS, CHALLENGES AND THE WAY FORWARD
KHAZANAH RESEARCH INSTITUTE 130
Conclusion
A major impediment to open government data in Malaysia is the lack of clarity in the legal
framework concerning government data. Without legal clarity, public servants tend to err on the
side of caution and choose not to disclose data. It is timely for Malaysia to enact an RTI law to
promote transparency and collaboration. The law should be designed for a digital age and
consistent with the open government data agenda, particularly by encouraging proactive
disclosure of information. Measures that could be introduced include explicitly listing types of
information that should be automatically available, requesting every public body to determine
the information that should be regularly and automatically disclosed, and imposing automatic
public disclosure for information that has been requested either through an RTI request or in
Parliament.
Aside from the RTI law, Malaysia should also formulate privacy laws that extend to government
data since the Personal Data Protection Act 2010, which is the only privacy law that the country
has right now is not applicable to government data. With the proliferation of data collected by the
government, especially with the Covid-19 pandemic, a privacy law strengthens public trust.
Having such laws in place would compel government agencies to take data privacy and security
protection more seriously. Beyond having laws, a comprehensive framework for assessing and
mitigating data privacy and security risks need to be developed, taking into account risks at every
stage of the data lifecycle and proportionate measures to address those risks.
Apart from the legal framework, Malaysia should streamline the government data management
system. Although MAMPU has been the lead agency on the open government data agenda, it has
minimal power to direct and implement the open government data initiative in all government
agencies. Implementing open government data involves mobilising digital infrastructure and
human resources that are already scarce in most government agencies. Therefore, the
government should also increase investment in digital infrastructure and skill across all agencies.
To encourage meaningful use of open government data, the government needs to expand data
skills training and data literacy education in school. To increase the accessibility of government
data, the design of data portals merits attention. The government should also engage with data
intermediaries to ensure open government data meaningfully impacts real life.
The advancement of digital technology brings forth a great volume and wide range of data.
Malaysia should accelerate the expansion of open government data to generate as much value as
possible from government data, especially since the data is collected and managed using public
funds. However, while we strive to realise the promise of good governance and improved well-
being from open government data, we also have to look out for potential threats. Therefore, a
comprehensive government data policy that advances open government data while protecting
data privacy is needed. The governance of open government data also has to be agile, taking into
consideration fast-evolving technological developments as well as how society interacts with
technology.

CHAPTER 5
OPEN GOVERNMENT DATA IN MALAYSIA: PRINCIPLES, BENEFITS, CHALLENGES AND THE WAY FORWARD
131 KHAZANAH RESEARCH INSTITUTE
References
Acemoglu, Daron, and James A. Robinson. 2012. Why Nations Fail: The Origins of Power, Prosperity, and Poverty. 1st ed. New York: Currency.
Altman, Micah, Alexandra Wood, David R O’Brien, Salil Vadhan, and Urs Gasser. 2015. “Towards a Modern Approach to Privacy-Aware Government Data Releases.” Berkeley Technology Law Journal 30 (3). JSTOR:1967–2072.
Article 19. 2018. “Right to Know Day 2018: Progress on Information Access around the World.” ARTICLE 19. September 27, 2018. https://www.article19.org/resources/right-to-know-day-2018-progress-on-information-access-around-the-world/.
Ashraf, Shaharudin. 2020a. “Covid-19: With Data, We Can Respond Better.” Kuala Lumpur: Khazanah Research Institute. http://www.krinstitute.org/Views-@-Covid-19-;_With_Data,_We_Can_Respond_Better.aspx.
———. 2020b. “Open Government Data: Principles, Benefits and Evaluations.” Discussion Paper. Kuala Lumpur: Khazanah Research Institute. http://www.krinstitute.org/Discussion_Papers-@-Open_Government_Data-;_Principles,_Benefits_and_Evaluations.aspx.
———. 2020c. “Open Government Data for Academic Research.” Working Paper. Kuala Lumpur: Khazanah Research Institute. http://www.krinstitute.org/Working_Paper-@-Open_Government_Data_for_Academic_Research.aspx.
ATP. 2011. “ATP Public Portal.” Aid Transparency Portal. 2011. https://www.aidtransparency.gov.tl/portal/.
Barrantes, Roxana, and Paulo Matos. 2020. “Who Benefits from Open Models? The Role of ICT Access.” In Making Open Development Inclusive: Lessons from IDRC Research, 219. MIT Press.
Barry, Emily, and Frank Bannister. 2014. “Barriers to Open Data Release: A View from the Top.” Information Polity 19 (1,2). IOS Press:129–52. https://doi.org/10.3233/IP-140327.
Borgesius, Frederik Zuiderveen, Jonathan Gray, and Mireille van Eechoud. 2015. “Open Data, Privacy, and Fair Information Principles: Towards a Balancing Framework.” Berkeley Technology Law Journal 30 (3):2073–2131.
Cambridge English Dictionary. n.d. “Latent Demand - Cambridge English Dictionary.” n.d. https://dictionary.cambridge.org/dictionary/english/latent-demand.
Center for Open Data Enterprise. n.d. “East Asia & Pacific.” Open Data Impact Map. n.d. https://opendataimpactmap.org/eap.
Coursera. 2020. “Coursera Global Skills Index 2020.” Coursera. https://www.coursera.org/gsi. datos.gob.es. 2018. “6th Edition of the ASEDIE Report on the Infomediary Sector.” Organization.
datos.gob.es. March 2018. https://datos.gob.es/es/noticia/6a-edicion-del-informe-asedie-del-sector-infomediario.
———. n.d. “About the Aporta Initiative.” Organization. Datos.Gob.Es. n.d. https://datos.gob.es/en/about-aporta-initiative.
Dawes, Sharon S. 1996. “Interagency Information Sharing: Expected Benefits, Manageable Risks.” Journal of Policy Analysis and Management 15 (3). [Wiley, Association for Public Policy Analysis and Management]:377–94.
Deloitte. 2017. “Assessing the Value of TfL’s Open Data and Digital Partnerships.” Technical Report. London: Deloitte. http://content.tfl.gov.uk/deloitte-report-tfl-open-data.pdf.
DIGIWHIST. n.d. “About Opentender.” Organization. Opentender. n.d. https://opentender.eu/eu/about/about-opentender.
———. n.d. “About the Project – Digiwhist.” Organization. DIGIWHIST. n.d. http://digiwhist.eu/about-digiwhist/.
CHAPTER 5
OPEN GOVERNMENT DATA IN MALAYSIA: PRINCIPLES, BENEFITS, CHALLENGES AND THE WAY FORWARD
KHAZANAH RESEARCH INSTITUTE 132
DOSM. 2015. “Department of Statistics Malaysia Transformation Plan 2015-2020.” https://www.dosm.gov.my/v1/index.php?r=column/cone&menu_id=bWVOVWFVZDd4VlZqSS9lNVBaTkVzUT09.
Dulong de Rosnay, Melanie, and Katleen Janssen. 2014. “Legal and Institutional Challenges for Opening Data across Public Sectors: Towards Common Policy Solutions.” Journal of Theoretical and Applied Electronic Commerce Research 9 (3). Universidad de Talca:1–14.
EPU. 2015. “Eleventh Malaysia Plan 2016-2020.” Economic Planning Unit. ———. 2021. “Malaysia Digital Economy Blueprint.” Policy Paper. Putrajaya: Economic Planning
Unit, Prime Minister’s Department. https://www.epu.gov.my/sites/default/files/2021-02/Malaysia-digital-economy-blueprint.pdf.
Frischmann, Brett M. 2006. “An Economic Theory of Infrastructure and Commons Management.” Minnesota Law Review 89:917–60.
FUNDAR. 2010. “Preguntas Frecuentes (Frequent Questions).” Subsidios al campo. 2010. http://subsidiosalcampo.org.mx/acerca-de/faq/.
G8. 2013. “Policy Paper: G8 Open Data Charter and Technical Annex.” GOV.UK. June 18, 2013. https://www.gov.uk/government/publications/open-data-charter/g8-open-data-charter-and-technical-annex.
Gasser, Urs. 2015. “Interoperability in the Digital Ecosystem.” The Berkman Center for Internet & Society at Harvard University, Research Publication, , no. 2015–13. https://dx.doi.org/10.2139/ssrn.2639210.
Global RTI Rating. n.d. “By Country: RTI Rating.” Global Right to Information Rating. n.d. https://www.rti-rating.org/country-data/.
Government of Malaysia. 1989. “Statistics Act 1965 (Act 415) (Revised 1989).” https://www.dosm.gov.my/v1/uploads/files/4_Portal%20Content/1_About%20us/4_Legislation/Statistics_Act.pdf.
———. 2006. Official Secrets Act 1972 (Act 88) (Incorporating All Amendments up to 1 January 2006). http://www.agc.gov.my/agcportal/uploads/files/Publications/LOM/EN/Act%2088.pdf.
———. 2010. “Personal Data Protection Act 2010 (Act 709).” http://www.agc.gov.my/agcportal/uploads/files/Publications/LOM/EN/Act%20709%2014%206%202016.pdf.
———. 2018. “Companies Commission of Malaysia Act 2001 (Act 614).” https://www.ssm.com.my/Pages/Legal_Framework/Document/CCMA%20Act%20614_as%20at%201%20March%202018).pdf.
Government of Ontario. 2015. “Open by Default – A New Way Forward for Ontario.” Government of Ontario. December 25, 2015. https://www.ontario.ca/page/open-default-new-way-forward-ontario#section-1.
Graham, Mark, and Stefano De Sabbata. 2020. “The Geographic Contours of Openness.” In Making Open Development Inclusive: Lessons from IDRC Research. MIT Press.
Green, Ben Z., Gabe Cunningham, Ariel Ekblaw, Paul M. Kominers, Andrew Linzer, and Susan Patricia Crawford. 2017. “Open Data Privacy.” Berkman Klein Center for Internet & Society Research Publication. Berkman Klein Center for Internet & Society. https://dash.harvard.edu/handle/1/30340010.
Gruen, Nicholas, John Houghton, and Richard Tooth. 2014. “Open for Business: How Open Data Can Help Achieve G20 Growth Target.” Lateral Economics. https://www.omidyar.com/sites/default/files/file_archive/insights/ON%20Report_061114_FNL.pdf.
InfoAmazonia. n.d. “Home.” InfoAmazonia. n.d. https://infoamazonia.org/en/. International Budget Partnership. 2020. “Open Budget Survey 2019.” International Budget
Partnership. https://www.internationalbudget.org/open-budget-survey.

CHAPTER 5
OPEN GOVERNMENT DATA IN MALAYSIA: PRINCIPLES, BENEFITS, CHALLENGES AND THE WAY FORWARD
133 KHAZANAH RESEARCH INSTITUTE
International Open Data Charter. n.d. “History.” International Open Data Charter (blog). n.d. https://opendatacharter.net/history/.
Janssen, Marijn, Yannis Charalabidis, and Anneke Zuiderwijk. 2012. “Benefits, Adoption Barriers and Myths of Open Data and Open Government.” Information Systems Management 29 (4). Taylor & Francis:258–68. https://doi.org/10.1080/10580530.2012.716740.
JPA, and INTAN. 2016. “Pembangunan Modal Insan Dalam Menyokong Era Kerajaan Digital.” Kannan, Hashini Kavishtri, and Veena Babulal. 2019. “Govt to Draft Freedom of Information Act
to Replace Official Secrets Act.” NST Online, July 18, 2019. https://www.nst.com.my/news/nation/2019/07/505404/govt-draft-freedom-information-act-replace-official-secrets-act.
Kesmodel, David. 2013. “Monsanto to Buy Climate Corp. for $930 Million.” The Wall Street Journal, October 2, 2013. https://www.wsj.com/articles/monsanto-earnings-company-to-buy-climate-corp-for-930-million-loss-widens-1380719533.
KKMM. 2018. “Communications & Multimedia Blueprint 2018 - 2025 - Digitise and Humanise.” Ministry of Communications and Multimedia. https://www.kkmm.gov.my/images/171211_kkmm_blueprint2018_2025.pdf.
Koski, Heli. 2011. “Does Marginal Cost Pricing of Public Sector Information Spur Firm Growth?” The Research Institute of the Finnish Economy, Discussion Paper, , no. 1260 (September):20.
LAWA. n.d. “Land, Air, Water Aotearoa (LAWA).” Land, Air, Water Aotearoa (LAWA). n.d. https://www.lawa.org.nz/.
Longo, Justin, Evan Kuras, Holly Smith, David M. Hondula, and Erik Johnston. 2017. “Technology Use, Exposure to Natural Hazards, and Being Digitally Invisible: Implications for Policy Analytics.” Policy & Internet 9 (1):76–108. https://doi.org/10.1002/poi3.144.
MAMPU. 2016. “Pelan Strategik ICT Sektor Awam 2016-2020.” MAMPU. https://www.mampu.gov.my/ms/penerbitan-mampu/send/2-buku/680-pelan-strategik-ict-sektor-awam-2016-2020-versi-bm-2.
———. n.d. “MyGOV - Open Government Data - Policy, Strategy and Governance - Open Data.” The Malaysian Administrative Modernisation and Management Planning Unit. n.d. https://www.malaysia.gov.my/portal/content/30024.
Mansell, Robin. 2020. Making Open Development Inclusive: Lessons from IDRC Research. MIT Press. Martin, Chris. 2014. “Barriers to the Open Government Data Agenda: Taking a Multi-Level
Perspective.” Policy & Internet 6 (3):217–40. https://doi.org/10.1002/1944-2866.POI367.
MOSP. 2020. “What Is Malaysia Open Science Platform? – Malaysia Open Science Platform (MOSP).” Malaysia Open Science Platform. 2020. https://www.akademisains.gov.my/mosp/about/what-is-malaysia-open-science-platform/.
MOSTI. 2021a. “Dasar Sains, Teknologi dan Inovasi Negara 2021-2030.” Ministry of Science, Technology and Innovation. https://www.mosti.gov.my/web/dasar-halatuju/.
———. 2021b. 08.01.2021- MOSTI LANCAR MALAYSIA GRAND CHALLENGE (MGC) SEBAGAI PEMANGKIN NEGARA BERTEKNOLOGI TINGGI. Youtube Video. MOSTI. https://www.youtube.com/watch?v=IK_kvC8U3QI.
Mustapa, Mimi Nurakmal, Suraya Hamid, and Fariza Hanum Md Nasaruddin. 2019. “Exploring the Issues of Open Government Data Implementation in Malaysian Public Sectors.” International Journal on Advanced Science, Engineering and Information Technology 9 (4). Insight Society:1466–73.
Noveck, Beth Simone. 2017. “Rights-Based and Tech-Driven: Open Data, Freedom of Information, and the Future of Government Transparency.” Yale Hum. Rts. & Dev. LJ 19. HeinOnline:1.

CHAPTER 5
OPEN GOVERNMENT DATA IN MALAYSIA: PRINCIPLES, BENEFITS, CHALLENGES AND THE WAY FORWARD
KHAZANAH RESEARCH INSTITUTE 134
Nur Hanani, Azman. 2020. “Statistics Act 1965 to Be Amended.” The Malaysian Reserve, October 21, 2020, sec. News. https://themalaysianreserve.com/2020/10/21/statistics-act-1965-to-be-amended/.
OECD. 2015. “Making Open Science a Reality.” OECD Science, Technology and Industry Policy Papers, no. 25 (October). OECD. https://doi.org/10.1787/5jrs2f963zs1-en.
———. n.d. “Open Science.” Organisation for Economic Co-Operation and Development (OECD). n.d. https://www.oecd.org/science/inno/open-science.htm.
Open Data Watch. 2019. “Open Data Inventory 2018/19.” https://odin.opendatawatch.com/data/Download.
Open Knowledge Foundation. 2013. “Defining Open Data.” Blogs. Open Knowledge Foundation Blog. October 3, 2013. https://blog.okfn.org/2013/10/03/defining-open-data/.
———. 2016. “Global Open Data Index.” Portal. Global Open Data Index. 2016. https://index.okfn.org/place/.
Open Society. 2019. “Countries with ATI Laws.” Right2Info.Org. May 2019. https://www.right2info.org/resources/publications/countries-with-ati-laws-1/view.
Parliament of Malaysia. 2019. “Penyata Rasmi Parlimen Dewan Rakyat, Parlimen Keempat Belas, Penggal Kedua, Mesyuarat Ketiga (7 November 2019).” https://www.parlimen.gov.my/files/hindex/pdf/DR-07112019.pdf#page=13&zoom=100&search=freedom%20of%20information.
Prime Minister’s Department. 2015. “Pekeliling Am Bil. 1 Tahun 2015 - Pelaksanaan Data Terbuka Sektor Awam.” Prime Minister’s Department.
Rose, Carol. 1986. “The Comedy of the Commons: Custom, Commerce, and Inherently Public Property.” The University of Chicago Law Review 53 (3):711. https://doi.org/10.2307/1599583.
Ruijer, Erna, and Albert Meijer. 2020. “Open Government Data as an Innovation Process: Lessons from a Living Lab Experiment.” Public Performance & Management Review 43 (3). Taylor & Francis:613–35.
Scimago Lab. 2020. “Scimago Journal & Country Rank.” Scimago. 2020. https://www.scimagojr.com/countryrank.php.
Sense-T. n.d.a. “Past Projects - Sense-T - from Sensing to Intelligence.” Sense-T. n.d.a. https://www.sense-t.org.au/projects-and-research/past-projects.
———. n.d.b. “The Sense-T Journey - Sense-T - from Sensing to Intelligence.” Sense-T. n.d.b. https://www.sense-t.org.au/about/the-sense-t-journey.
Seward, Ruhiya Kristine. 2020. “Conclusion: Understanding the Inclusive Potential of Open Development.” In Making Open Development Inclusive: Lessons from IDRC Research. MIT Press.
SIRCA. n.d. “About Us.” Organization. SIRCA. n.d. https://www.sirca.org.au/about-sirca/. Spector, Julian. 2016. “Chicago Is Using Data to Predict Food Safety Violations. So Why Aren’t
Other Cities?” Bloomberg.Com, January 7, 2016. https://www.bloomberg.com/news/articles/2016-01-07/chicago-is-using-data-to-predict-food-safety-violations-why-aren-t-other-cities.
Sudirman, Suhaiza, and Zawiyah Mohammad Yusof. 2017. “Public Sector ICT Strategic Planning: Framework of Monitoring and Evaluating Process.” Asia-Pacific J. Inf. Technol. Multimed. 6 (1):85–99.
Sultan Azlan Shah. 2004. Constitutional Monarchy, Rule of Law, and Good Governance: Selected Essays and Speeches. Edited by Visu Sinnadurai. Kuala Lumpur, Malaysia : Petaling Jaya, Selangor Darul Ehsan, Malaysia: Professional Law Books ; Thomson Sweet & Maxwell Asia.
Sunlight Foundation. 2010. “Ten Principles For Opening Up Government Information.” Blogs. Sunlight Foundation. 2010. https://sunlightfoundation.com/policy/documents/ten-open-data-principles/.

CHAPTER 5
OPEN GOVERNMENT DATA IN MALAYSIA: PRINCIPLES, BENEFITS, CHALLENGES AND THE WAY FORWARD
135 KHAZANAH RESEARCH INSTITUTE
Syahirah, Syed Jaafar. 2020. “Statistics Act to Be Amended to Boost DOSM’s Role in Data Collection.” The Edge Markets, October 20, 2020. http://www.theedgemarkets.com/article/statistics-act-be-amended-boost-dosms-role-data-collection.
The Federal Reserve. 2018. “The Fed - FRB/US Model.” Board of Governors of the Federal Reserve System. 2018. https://www.federalreserve.gov/econres/us-models-about.htm.
TradeData International. 2015. “Understanding Trade Statistics.” Tradedata International. 2015. https://www.tradedata.net/understanding-trade-statistics/.
UN Global Pulse. n.d. “Pulse Lab Jakarta.” UN Global Pulse. n.d. https://www.unglobalpulse.org/lab/jakarta/.
UNESCO. 2017. “Open Science Movement.” United Nations Educational, Scientific and Cultural Organization (UNESCO). 2017. http://www.unesco.org/new/en/communication-and-information/portals-and-platforms/goap/open-science-movement/.
Verhulst, Stefaan, and Andrew Young. 2016. “Open Data Impact: When Demand and Supply Meet.” GovLab & Omidyar Network. http://odimpact.org/key-findings.html.
Verhulst, Stefaan, Andrew Young, Andrew Zahuranec, Susan Aaronson, Ania Calderon, and Matt Gee. 2020. “The Emergence of a Third Wave of Open Data.” The GovLab. https://opendatapolicylab.org/images/odpl/third-wave-of-opendata.pdf%20.
Wessels, Bridgette, Rachel Finn, Kush Wadhwa, and Thordis Sveinsdottir. 2017. Open Data and the Knowledge Society. Amsterdam University Press. https://doi.org/10.5117/9789462980181.
White House, Office of the Press Secretary. 2013. “Executive Order -- Making Open and Machine Readable the New Default for Government Information.” Informational. The White House. May 9, 2013. https://obamawhitehouse.archives.gov/the-press-office/2013/05/09/executive-order-making-open-and-machine-readable-new-default-government-.
World Bank. 2016. “World Development Report 2016: Digital Dividends.” Text/HTML. World Bank. 2016. https://www.worldbank.org/en/publication/wdr2016.
———. 2017a. “Open Data Readiness Assessment: Malaysia.” 115192. The World Bank. http://documents.worldbank.org/curated/en/529011495523087262/pdf/115192-WP-PUBLIC-MALAYSIA-DEVELOPMENT-EXPERIENCE-SERIES.pdf.
———. 2017b. “Malaysia Economic Monitor: Data for Development.” 116032. The World Bank. http://documents.worldbank.org/curated/en/993771497248234713/pdf/116032-REVISED-MEM-9-June-2017-FINAL-COPY-EDITED-96pgs-13-6-17.pdf.
———. 2020. “World Development Report 2021 Concept Note - Data for Better Lives.” World Bank. http://documents1.worldbank.org/curated/en/778921588767120094/pdf/World-Development-Report-2021-Data-for-Better-Lives-Concept-Note.pdf.
———. n.d.a. “World Development Indicators.” DataBank. n.d.a. https://databank.worldbank.org/source/world-development-indicators.
———. n.d.c. “Worldwide Governance Indicators.” DataBank. n.d.c. https://databank.worldbank.org/source/worldwide-governance-indicators.
World Wide Web Foundation. 2017. “Open Data Barometer: 2016 (Fourth Edition).” https://opendatabarometer.org/assets/downloads/Open%20Data%20Barometer%20-%20Global%20Report%20-%202nd%20Edition%20-%20PRINT.pdf.
Young, Andrew, Stefaan Verhulst, Nadiya Safonova, and Andrew Zahuranec. 2020. “The Data Assembly: Responsible Data Re-Use Framework.” The GovLab & Henry Luce Foundation. https://thedataassembly.org/files/nyc-data-assembly-report.pdf.

KHAZANAH RESEARCH INSTITUTE 136
CHAPTER
06
PERSONAL DATA PRIVACY: SURVEILLANCE AND SECURITY
6.1 What is personal data? 137
6.2 How is personal data generated and collected? 137
6.3 Surveillance capitalism: what other data are being collected? 139
6.3.1 Individual privacy violations 140
6.3.2 Bias and discrimination 140
6.3.3 Societal effects 141
6.4 What can individuals do? 142
6.4.1 Be aware of phishing attacks; verify requests for personal data 143
6.4.2 Be aware of social media settings; limit access to personal data 143
6.5 What can governments do? 144
6.5.1 Digital Economy Blueprint 145
6.6 Conclusion 146
References 148

137 KHAZANAH RESEARCH INSTITUTE
PERSONAL DATA PRIVACY: SURVEILLANCE AND SECURITY357
By Rachel Gong, Shenyi Chua and Hui San Chiam
“Personal information is increasingly used to enforce standards of behavior. Information
processing is developing, therefore, into an essential element of long-term strategies of
manipulation intended to mold and adjust individual conduct.”.
Shoshana Zuboff358
What is personal data?
Personal data refers to any data that contains personally identifiable information. Malaysia’s
Personal Data Protection Act 2010 (Act 709) defines personal data as “any information…that
relates directly or indirectly to a data subject, who is identified or identifiable from that
information…”359; Singapore’s Personal Data Protection Act 2012 defines it as “…data, whether
true or not, about an individual who can be identified from that data…”360; The European
Commission defines it as “any information that relates to an identified or identifiable living
individual”361 whereas the National Institute of Standards and Technology (NIST) of United States
defines it as “information that can be used to distinguish or trace an individual’s identity, either
alone or when combined with other information that is linked or linkable to a specific
individual”362.
The European Union’s General Data Protection Regulation (GDPR) lists some examples of
personal data including name, national identification number, location data and even internet
protocol (IP) addresses that identify how a user is connecting to the internet363.
How is personal data generated and collected?
The Covid-19 pandemic has accelerated Malaysia’s transition to a cashless society. Financial
institutions and e-wallet service providers reported a steep rise in the transaction volume of
contactless payments and e-wallet adoption during the Movement Control Order (MCO) as
Malaysians try to minimise physical contact.
357 This chapter is based on two Views pieces published by KRI, one authored by Shenyi Chua and Rachel Gong
published on 1 October 2020 titled “Privacy and Cybersecurity: Protecting Personal Data” and the other authored by
Rachel Gong and Hui San Chiam published on 31 July 2019 titled “Personal Data Privacy and Surveillance Capitalism”. 358 Zuboff (2019) 359 Government of Malaysia (2010) 360 Government of Singapore (2012)
361 The European Commission (n.d.)
362 Grassi, Garcia, and Fenton (2017)
363 The European Commission (n.d.)

CHAPTER 6
PERSONAL DATA PRIVACY: SURVEILLANCE AND SECURITY
KHAZANAH RESEARCH INSTITUTE 138
Several banks saw a rise in the popularity of their e-wallets during the pandemic. For example,
the sign-up rate for Maybank’s MAE wallet doubled since the beginning of the first MCO in March
2020364. Hong Leong Bank witnessed a 13-fold increase in the total transnational value of e-wallet
top-ups in two months from March to May 2020, as compared to the same period in 2019365.
Similarly, two popular e-wallets in Malaysia reported growth in their number of users and
transactions. GrabPay Malaysia has seen a 60% increase in new users with more than 8,000 new
merchants signing up to use its digital service366 and its contactless transactions have increased
1.7 times since the implementation of the MCO367. Additionally, Touch ‘n Go’s e-wallet saw an
increase in e-wallet adoption among merchants368 as well as a surge in e-commerce volumes and
online transactions369 during the first MCO period.
Transitioning to the digital economy results in more people being more connected to the internet.
Internet users share personal information with mobile applications or businesses in exchange for
ostensibly free goods or services. Not only is money stored in e-wallets operated by private
companies, but shared real-time location and personal information are stored in their databases,
too. Contact tracing apps may also store health information.
Generally, smartphone apps can track our movements (e.g. whether we are stationary or walking
around), record our location and read (some) text messages without any additional user action
or input370. Businesses process these data into useful information that helps them provide better
user experiences and services to their customers. For example, an individual uses an e-wallet to
pay for a flight planned via a travel app and receives a confirmation email, including personally
identifying information such as name, travel dates, locations and payment details. These details
are shared across multiple apps to automatically generate an event with details of the flight in the
calendar of the user’s smartphone.
Digital platforms, such as Facebook and Grab, establish a commercial network of interdependent
end users and providers to enable the provision of products, which include both goods and
services371. These platforms create value by providing online communication channels and
marketplaces that allow for rapid and inexpensive scaling. Multisided platforms such as Amazon
allow producers and consumers to interact directly to find and obtain a wider range of products
at lower marginal costs372. Amazon expanded its range of products from retail goods to publishing
to payments to online storage to the point that it now provides the backbone infrastructure for
many other digital platforms373.
364 The Star (2020a)
365 Hong Leong Bank (2020)
366 Boey (2020)
367 The Star (2020b)
368 Birruntha (2020)
369 Boey (2020)
370 Ng and Kent (2018); Valentino-DeVries et al. (2018)
371 Rossotto et al. (2018) 372 Asadullah, Faik, and Kankanhalli (2018) 373 Khan (2017)

CHAPTER 6
PERSONAL DATA PRIVACY: SURVEILLANCE AND SECURITY
139 KHAZANAH RESEARCH INSTITUTE
Expansion of this magnitude depends on a strong understanding of what users want and what
they are willing to give in order to get it. How much a user is willing to pay for a product is just
one factor to be considered; another factor is how much personal data a user is willing to give up
for convenience and personalisation. When someone opens the Google Assistant app and it
welcomes them with a greeting appropriate for the time of day, a localised weather and traffic
report, and a reminder to buy a birthday present for their mother, they take for granted the
degree to which their life is being monitored.
Constant tracking by digital platforms like Google and Facebook gives them access to more user
data than ever, both in terms of numbers of users and the types of data they collect on each user.
As a start, Facebook collects all the data of users who are logged in, including profile information,
shared photos, interactions and activities, likes and follows, network data, and location data. How
often users log in, how long we spend on the platform and what items we click on are also
tracked374. Facebook also uses cookies, little pieces of data, to track what its users do online even
when they are not logged in to Facebook375. There is justified concern that not only will user data
that are knowingly shared be used without informed consent but also that user data that are
unknowingly shared will be used without informed consent in ways unintended by the data
provider i.e. the platform user376.
Surveillance capitalism: what other data are being collected?
In her book The Age of Surveillance Capitalism: The Fight for a Human Future at the New Frontier
of Power, Shoshana Zuboff377 explains how digital platforms engage in surveillance capitalism.
Platforms like Google collect and analyse users’ “behavioural surplus” for purposes besides
service improvement, especially for predicting and modifying users’ behaviour in order to
generate more behavioural surplus. Behavioural surplus, also known as data exhaust, is
secondary data generated during a transaction. For example, an internet user searches for “flights
from Kuala Lumpur to Bali”. The search term constitutes primary behavioural data; behavioural
surplus includes data on what time of year (or day) the user conducted the search, how often the
search was repeated, on what sort of device the search was conducted, and so on. Big data analysis
of the primary data can be useful in identifying popular travel destinations, but analysis of the
secondary data can reveal a lot more about the people interested in travel.
374 Facebook (2018) 375 Pierson and Heyman (2011) 376 Whitley (2009) 377 Zuboff (2019)

CHAPTER 6
PERSONAL DATA PRIVACY: SURVEILLANCE AND SECURITY
KHAZANAH RESEARCH INSTITUTE 140
Because users are generally unaware of the amount of behavioural surplus they produce and
because analysis of such data had previously been extremely costly and time-consuming,
surveillance capitalism has gone unchecked until recently. Digital platforms were able to
experiment with big data analysis and expand their collection of behavioural surplus without any
regulations. But as governments, corporations and society are becoming more aware of how
powerful and pervasive big data analytics can be, the real issue is not simply digital platforms
hoarding user data. The real question is how society will choose to employ these technological
tools—how will we manage the use of data to help and not harm?
There is evidence that, without proper foresight and management, the misuse of personal data
can have adverse effects on multiple levels, discussed in subsequent sub-sections.
6.3.1. Individual privacy violations
The first level is at an individual level when users’ personal data reveal private information that
they had not intended to share.
Location data may seem innocuous, but in fact, this information reveals a lot about a person.
Regular travel patterns can be used to infer a person’s home address, place of work, leisure
preferences, or private vices. Ride-sharing apps employ geolocation surveillance intended to
protect drivers and passengers, but, in the case of Uber, location tracking has led to the exposure
of extramarital affairs378 and patterns of one-night stands379. In 2016, Uber faced a lawsuit when
a whistle-blower exposed how employees used location data to track politicians, celebrities and
even exes380. All these constitute violations of individual privacy rights.
Although Uber has ceased operations in Malaysia, local counterparts such as Grab, MyCar and
EzCab operate in much the same way. Per Grab’s privacy policies, the ride-hailing app collects
similar data, such as precise and approximate location information as well as trip updates381.
Therefore, it is reasonable to assume that many ride-hailing apps have similar capabilities for
tracking and analysing its users’ data. Without regulations, we are susceptible to violations of
individual privacy rights, not only by foreign digital service providers, but also local companies.
6.3.2. Bias and discrimination
The second level affects vulnerable segments of society whose shared characteristics make them
susceptible to bias and discrimination.
Digital platforms collect vast quantities of our regular micro behaviours that can then be analysed
to reveal unexpected correlations to meso-level trends, such as susceptibility to illness, risk of
traffic accidents382, or tendency towards criminal activity. Using machine learning for complex
big data analyses can be very useful, but it can also put vulnerable segments of society at risk of
discriminatory effects.
378 Trigg (2017) 379 Uber (2012) 380 Chiang (2017) 381 Grab (2019) 382 Kita and Kidziński (2019)

CHAPTER 6
PERSONAL DATA PRIVACY: SURVEILLANCE AND SECURITY
141 KHAZANAH RESEARCH INSTITUTE
Researchers have been exploring the use of Facebook user data to predict medical conditions383.
For example, identifying emotion-associated language markers allow inferences to be made about
a person’s susceptibility to clinical depression. These language markers are consistent with some
characteristics of depression: loss of drive and interest, reduced engagement and interactions,
and social withdrawal that eventually leads to social isolation384. Predictive algorithms such as
these can and have been used by health insurers to identify hidden health issues that require
medical services. These predictive algorithms can then be used to charge higher medical
insurance premium rates for customers with supposedly higher health risks even though they
may not actually be at higher risk385. Furthermore, the ease with which public social media data
can be obtained means that the data are susceptible to misinterpretation or misuse.
Malaysian law enforcement appears to be keen to adopt new digital technologies to improve
public safety. Earlier in 2019, the country’s first artificial intelligence-based facial recognition
camera system was introduced in Penang to identify criminals on the street386. The auxiliary
police force is also integrating on-body cameras with high-end facial recognition feature in
criminal identification387. Artificial intelligence software such as CloudWalk Technology use
predictive algorithms that draw from criminals’ facial characteristics, body language and gait
patterns across photos and videos to identify suspicious behaviour388. However, these tools are
unreliable because inherent biases in algorithms and the training data they rely on389 could
potentially lead to misidentification, racial profiling and discrimination in criminal sentencing390.
The city of San Francisco, concerned over potential misuse of this technology, banned the use of
facial recognition by all city agencies, including law enforcement391.
6.3.3. Societal effects
The third level of societal adverse effects occurs when aggregated personal data are used to
modify collective behaviour without users’ knowledge.
Platform monopolies like Facebook and Amazon have so much individual data in their hands that
their big data analyses can have far-reaching societal effects, as was the case when Cambridge
Analytica got hold of the personal data of millions of Facebook users392.
383 Eichstaedt et al. (2018) 384 Kupferberg, Bicks, and Hasler (2016) 385 Allen (2018) 386 The Star (2019a) 387 Tao (2018) 388 Mozur (2019) 389 Buolamwini (2017) 390 Angwin et al. (2016) 391 Conger, Fausset, and Kovaleski (2019) 392 Meredith (2018)

CHAPTER 6
PERSONAL DATA PRIVACY: SURVEILLANCE AND SECURITY
KHAZANAH RESEARCH INSTITUTE 142
In 2014, a researcher named Aleksandr Kogan developed an app for Facebook. Several hundred
thousand Facebook users who took a personality quiz using that app consented to share their
personal data with the app. Unbeknown to them, the app also collected the personal data of all
their friends, resulting in a pool of data for over eighty-seven million Facebook users. All this data
was available to Kogan, who sold it to Cambridge Analytica. Cambridge Analytica then used this
data to develop psychographic profiles of voters, which allowed it to micro-target political ads in
the 2016 US Presidential election, potentially giving the Trump campaign, with whom it was
affiliated, an unfair advantage. Individual privacy rights were violated and this affected the
political landscape of an entire nation. When this scandal became public, it rightly raised many
questions around data privacy and Facebook’s apparent lack of respect for its users’ personal data
rights. Big data-driven methods of political persuasion like this are increasing globally393.
Political actors have long used data to target messaging and influence behaviour, but never on
this scale and with this degree of micro-targeted advertising. In the 2016 UK referendum on the
EU, exploitation of Facebook data and misleading targeted ads supporting the “Leave” campaign
led to the unexpected referendum result among British voters394. Investigative journalist Carole
Cadwalladr explained how residents of the traditionally left-wing town of Ebbw Vale were
targeted with fake information about Turkish immigration on Facebook, resulting in a spike of
Leave voters395. Not only are messages customised to the concerns of specific profile groups, but
such groups are also often unaware that they have been targeted.
What can individuals do?
Oversharing personal data puts users at risk not only of potential stalking and attempts to
manipulate their behaviour396, but also of their personal information being added to a database
that may not be adequately secured and thus may be susceptible to hackers and data breaches.
Such breaches put them at further risk of identity theft and scams.
Securing a database from cybersecurity threats is out of the control of individual users so, until
comprehensive data protection legislation is passed, individuals are best served by learning
about the risks of data sharing and taking steps to minimise those risks.
In addition to reviewing app permissions and evaluating whether the degree of personal data
sharing is worth the benefits of the app, we suggest two more ways individual users can protect
their personal data in the following sub-sections.
393 Tactical Tech’s Data and Politics team (2019) 394 Cadwalladr (2018) 395 Cadwalladr (2019) 396 Zuboff (2019)

CHAPTER 6
PERSONAL DATA PRIVACY: SURVEILLANCE AND SECURITY
143 KHAZANAH RESEARCH INSTITUTE
6.4.1. Be aware of phishing attacks; verify requests for personal data
Phishing is a type of online scam often used to steal personal information such as login
credentials, bank account information or credit card numbers397. Phishing attacks can occur
through any form of communication, such as emails, phone calls, text messages, instant messages
received on social media sites or advertisements398. Phishing messages typically claim to come
from a legitimate source such as a bank or a government agency. Not only will phishers use the
email address, logo and other trademarks from the purported source to look authentic, they will
also fabricate stories to cause recipients to panic into either giving away personal data or allowing
their personal data to be tracked. Examples of phishing attacks include claiming a suspicious login
attempt or unauthorised changes to the user’s account have been detected or requesting
confirmation to verify sensitive personal information399.
According to the Malaysian Communications and Multimedia Commission (MCMC), the majority
of phishing attacks detected in Malaysia target internet banking users to trick them into revealing
their login credentials400.
Cybersecurity Malaysia (CSM) also reported receiving a total of 838 cases involving fraud,
intrusion and cyber-harassment in just three weeks of the MCO between 18 March and 7 April
2020401. Cybercriminals are often quick in reacting to global events, in this case making use of the
pandemic to launch Covid-19 themed phishing emails or fraudulent websites filled with fake
Covid-19 news402.
Before sharing any information, internet users should take additional steps to confirm who is
requesting their personal data and for what purpose. For example, users receiving a text message
about an unexpected financial transaction should contact their bank’s customer service
department to verify the message before responding to it. Users should also avoid clicking on
links from suspicious emails without first verifying their source403. Fraudulent websites look very
similar to original websites, differing by only a letter or punctuation mark. Examples include
changing the letter O to the number 0 or inserting additional characters and symbols that
legitimate web addresses will not have404.
6.4.2. Be aware of social media settings; limit access to personal data
Social media users tend to unknowingly overshare personal information on these platforms,
whether checking in at a restaurant for a meal, tweeting about a new job promotion or sharing
photos with location details in the background or in the photo geolocation tag. While these
activities are meant to foster meaningful connections with friends and family, there are privacy
risks to such online sharing activities.
397 MCMC (2020b); University of Massachusetts Amherst (n.d)
398 MCMC (2020b); University of Massachusetts Amherst (n.d)
399 MCMC (2020a)
400 MCMC (2020b)
401 Yuen (2020)
402 Yuen (2020)
403 U.S. Federal Trade Commission (2012)
404 Strawbridge (2018)

CHAPTER 6
PERSONAL DATA PRIVACY: SURVEILLANCE AND SECURITY
KHAZANAH RESEARCH INSTITUTE 144
Social media posts uploaded on the internet may include personal details that malicious actors
could exploit to access sensitive accounts or commit identity theft. For example, background
information such as schools attended, pet names or vacation photos could provide enough clues
for cybercriminals to work out a user’s passwords405.
Internet users should review privacy settings on their social media accounts to limit who can
access their personal information. For example, on Facebook, users may want to avoid setting
their posts to be public as this allows even non-Facebook users to access their information. Users
may also want to consider reviewing their friend/follower list regularly to remove unfamiliar
accounts that might be monitoring their posts.
What can governments do?
Risks of abuse and misuse notwithstanding, the collection and use of anonymised personal data
can be useful in many fields, including policy research. For example, location data can reveal
travel patterns indicating where traffic flow and public transportation should be improved.
However, considering that personal data can be—and have been—misused when it falls into the
wrong hands, there are several critical data governance questions we need to ask in this rapidly
digitalising world: who owns our personal data? Who has access to our personal data? Where and
how are our personal data being used and stored? What are the laws and regulations in place
governing the access, use and storage of our personal data, and are they enough to protect our
privacy?
The responsibility of strengthening cybersecurity falls on the shoulders of all parties. It requires
the efforts of both public and private sectors to coordinate and collaborate with each other in
terms of capacity building and policy design and implementation.
Currently, the Personal Data Protection Act (PDPA) 2010 only protects inappropriate use of
personal data for commercial purposes. Not only does it not regulate what types of data are
collected or how those data are used, it is rarely enforced406 and simply does not apply to personal
data processed outside of Malaysia407. Additionally, there is no Data Breach Notification Rule in
the PDPA 2010 yet so businesses that suffer a data breach are not legally obliged to notify the
authorities, the public, or the victims of the data leak408.
The Communications and Multimedia Ministry announced in March 2019 that it is in the process
of reviewing the PDPA to update it in line with the European Union’s GDPR409. This intention was
reiterated in the Digital Economy Blueprint (DEB) released in February 2021. The GDPR, in
addition to data security requirements already in the PDPA, limits personal data collection to only
what is necessary, allows companies to keep data only for current requirements, and prohibits
them from saving data for potential future use410.
405 Cybersecurity Malaysia (n.d)
406 Jabatan Perlindungan Data Peribadi (2019) 407 Naufal Fauzi (2019) 408 Tashny Sukumaran (2019) 409 The Star (2019b) 410 European Parliament (2016)

CHAPTER 6
PERSONAL DATA PRIVACY: SURVEILLANCE AND SECURITY
145 KHAZANAH RESEARCH INSTITUTE
The California Consumer Privacy Act (CCPA), modelled after the GDPR, is another example of a
law intended to provide data privacy protection. It allows residents of California to request a
record of their personal data that was collected, used, shared or sold by a California business411
and to opt out of the sale of their data. The law grants individuals the right to learn the specific
inferences made about them based on analysis of their personal data, including “predictions or
categorisations related to an individual’s behaviour, attitudes, psychology, intelligence or
abilities”412. Crucially, not only must companies reveal the personal data they have collected upon
request, they must also delete all data when asked by users413.
Existing data protection laws are not by themselves enough to combat surveillance capitalism
and to avoid the consolidation of a wealth of personal data in the hands of a few—at best
unwitting and at worst unscrupulous—powerful players. They lack provisions to address
children’s digital privacy, personal data processed in non-commercial transactions and outside of
Malaysia, as well as general online privacy issues such as geolocation data and browser cookies
that could potentially track internet users414. To that end, more research and, ironically, more
data, are needed to evaluate how limits can be placed on data collection and distribution while
allowing innovation and improving efficiency.
Digital technologies are evolving faster than policy and legislation, but this is no reason for
policymakers not to tackle data privacy considerations when developing digital policy. At the very
least, users should be explicitly informed as to what personal data, including behavioural surplus,
are being collected by digital platforms and to what ends their data are being used. Wherever
possible, users should be able to opt out of being tracked and having their personal data collected,
for example by internet cookies, without losing access or functionality.
6.5.1. Digital Economy Blueprint
The DEB recognises that the collection and use of personal data by businesses both raises ethical
concerns around privacy by those familiar with these issues and raises a need for improved
cybersecurity education among those who are not—at both individual and institutional levels. It
rightly notes that public trust in institutions, both government and business, remains weak and
commits to improving regulations to protect personal data and privacy.
The Blueprint reiterates the need to review, though it does not specify revise, the PDPA and sets
2025 as the target for the PDPA to be reviewed. Given the rapid increase of e-commerce and
widespread use of platforms for education and work as well as the push for 80% of the public
sector to deliver end-to-end digital services by 2022, it would seem that a review of Malaysia’s
primary data protection law should be hastened.
411 Cowan and Singer (2020) 412 Cowan and Singer (2020) 413 Myrow (2019) 414 Segaran (2020)
CHAPTER 6
PERSONAL DATA PRIVACY: SURVEILLANCE AND SECURITY
KHAZANAH RESEARCH INSTITUTE 146
Improvements to this law include requiring businesses in Malaysia to notify their clients about
data breaches involving personal data, as in the case of Malaysia Airlines’ frequent flier
programme’s third-party service provider415. Businesses in Malaysia are not currently required
to report such breaches to potentially affected individuals.
Cybersecurity will be paramount in minimising the risks of data breaches, especially since
redundant systems and backups are necessary to ensure the smooth functioning of government
and business. A traditional security mindset may assume cybersecurity protocols should be kept
secret to reduce threats and attacks, but a contemporary mindset should consider allowing
ethical hackers and other industry experts some access to rigorously test the security of a digital
system before security protocols are officially implemented.
The DEB includes aims to grow the cloud computing ecosystem in Malaysia, for both public and
private sectors, strengthening the capabilities of local data centre companies. Regulations will be
needed to determine who has access to personal data on the cloud and how much access they
should have. If the local servers are maintained by local companies with private interests,
regulations will be needed to limit their access to and use of a national database of personal data.
The DEB also contains plans to strengthen cross-border data transfer mechanisms, which will
likely be developed within the context of trade agreements. Data protection should not be
considered secondary to other trade considerations, as Malaysia should recognise the value of the
personal data generated within its borders.
Conclusion
As Malaysia, like the rest of the world, continues to adopt data-driven digital technologies, data
policies are needed to govern and protect personal data. Personal data has far-reaching uses,
both at the individual level (for example, to customise a user’s experience), and at the national
level (for example, to adjust electricity generation rates). It is important to assess and understand
not just the benefits but also the risks of using large amounts of personal data, and then to develop
policies, laws, and regulations that will protect personal data and individual privacy while
deriving public good from such data.
Government agencies tasked with implementing digitalisation would do well to consult with each
other and with industry experts, especially cybersecurity experts, as well as legal and human
rights experts, to consider the implications of the collection and use of personal data on an ever-
increasing scale. Ethical questions, such as who owns personal data once it is collected and stored,
who gets to use it, and how the benefits derived from its use can be distributed equitably, are not
just philosophical in nature—they have direct implications for how data frameworks and systems
are built and maintained.
415 Yu (2021)
CHAPTER 6
PERSONAL DATA PRIVACY: SURVEILLANCE AND SECURITY
147 KHAZANAH RESEARCH INSTITUTE
As with most social structures, the ownership, control and use of personal data are likely to be
unequally distributed, with power and resources consolidating in the hands of those who already
have power and resources to begin with, usually platforms and corporations. But policy-making
and public services may soon require access to personal data held by these platforms.
Governments have an important role to play in developing data policies that can reduce these
inequalities and ensure that personal data and privacy are properly protected.

CHAPTER 6
PERSONAL DATA PRIVACY: SURVEILLANCE AND SECURITY
KHAZANAH RESEARCH INSTITUTE 148
References
Allen, Marshall. 2018. “Health Insurers Are Vacuuming Up Details About You — And It Could Raise Your Rates.” ProPublica. July 17, 2018. https://www.propublica.org/article/health-insurers-are-vacuuming-up-details-about-you-and-it-could-raise-your-rates.
Angwin, Julia, Jeff Larson, Surya Mattu, and Lauren Kirchner. 2016. “Machine Bias.” ProPublica, May. https://www.propublica.org/article/machine-bias-risk-assessments-in-criminal-sentencing.
Asadullah, Ahmad, Isam Faik, and Atreyi Kankanhalli. 2018. “Digital Platforms: A Review and Future Directions,” September.
Birruntha, S. 2020. “E-Wallet Adoption on the Rise during MCO.” The Malaysian Reserve, May 21, 2020, sec. News. https://themalaysianreserve.com/2020/05/21/e-wallet-adoption-on-the-rise-during-mco/.
Boey, Elaine. 2020. “Finance - Digital Payments Give Users More Bang for Their Ringgit.” The Edge Markets, August 16, 2020. http://www.theedgemarkets.com/article/finance-digital-payments-give-users-more-bang-their-ringgit.
Buolamwini, Joy Adowaa. 2017. “Gender Shades : Intersectional Phenotypic and Demographic Evaluation of Face Datasets and Gender Classifiers.” Thesis, Massachusetts Institute of Technology. https://dspace.mit.edu/handle/1721.1/114068.
Cadwalladr, Carole. 2018. “AggregateIQ: The Obscure Canadian Tech Firm and the Brexit Data Riddle.” The Guardian, March 31, 2018, sec. UK news: The Cambridge Analytica Files. https://www.theguardian.com/uk-news/2018/mar/31/aggregateiq-canadian-tech-brexit-data-riddle-cambridge-analytica.
———. 2019. Facebook’s Role in Brexit -- and the Threat to Democracy. TED Talk. https://www.ted.com/talks/carole_cadwalladr_facebook_s_role_in_brexit_and_the_threat_to_democracy.
Chiang, Angel. 2017. “Former Uber Employee Files Suit for Retaliation in Reporting Insecure Data Privacy Practices.” American Bar Association, September 1, 2017. https://www.americanbar.org/groups/litigation/committees/privacy-data-security/practice/2017/former-uber-employee-files-suit-for-retaliation-insecure-data-privacy-practices/.
Conger, Kate, Richard Fausset, and Serge F. Kovaleski. 2019. “San Francisco Bans Facial Recognition Technology.” The New York Times, May 14, 2019, sec. U.S. https://www.nytimes.com/2019/05/14/us/facial-recognition-ban-san-francisco.html.
Cowan, Jill, and Natasha Singer. 2020. “How California’s New Privacy Law Affects You.” The New York Times, January 3, 2020, sec. U.S. https://www.nytimes.com/2020/01/03/us/ccpa-california-privacy-law.html.
Cybersecurity Malaysia. n.d. “Keep Yourself Safe from Online Identity Theft.” https://www.cybersecurity.my/data/content_files/11/763.pdf.
Eichstaedt, Johannes C., Robert J. Smith, Raina M. Merchant, Lyle H. Ungar, Patrick Crutchley, Daniel Preoţiuc-Pietro, David A. Asch, and H. Andrew Schwartz. 2018. “Facebook Language Predicts Depression in Medical Records.” Proceedings of the National Academy of Sciences 115 (44):11203–8. https://doi.org/10.1073/pnas.1802331115.
European Parliament. 2016. General Data Protection Regulation (GDPR). OJ L. Vol. 119. http://data.europa.eu/eli/reg/2016/679/oj/eng.
Facebook. 2018. “Facebook Data Policy.” Facebook. April 19, 2018. https://en-gb.facebook.com/about/privacy/update.
Government of Malaysia. 2010. “Personal Data Protection Act 2010 (Act 709).” http://www.agc.gov.my/agcportal/uploads/files/Publications/LOM/EN/Act%20709%2014%206%202016.pdf.
CHAPTER 6
PERSONAL DATA PRIVACY: SURVEILLANCE AND SECURITY
149 KHAZANAH RESEARCH INSTITUTE
Government of Singapore. 2012. “Personal Data Protection Act 2012.” December 7, 2012. https://sso.agc.gov.sg/Act/PDPA2012.
Grab. 2019. “Grab Privacy Policy.” Grab MY. March 14, 2019. https://www.grab.com/my/privacy/.
Grassi, Paul A, Michael E. Garcia, and James L. Fenton. 2017. “Digital Identity Guidelines.” NIST Special Publication 800-63-3, June, 75.
Hong Leong Bank. 2020. “Hong Leong Bank Introduces HLB Pocket Connect.” August 17, 2020. https://www.hlb.com.my/en/personal-banking/news-updates/hlb-introduces-hlb-pocket-connect.html.
Jabatan Perlindungan Data Peribadi. 2019. “Pengguna Data Yang Telah Dikenakan Tindakan Di Bawah Akta Perlindungan Data Peribadi 2010 (Akta 709) – Jabatan Perlindungan Data Peribadi.” September 22, 2019. https://www.pdp.gov.my/jpdpv2/berita_terkini/pengguna-data-yang-telah-dikenakan-tindakan-di-bawah-akta-perlindungan-data-peribadi-2010-akta-709/.
Khan, Lina M. 2017. “Amazon’s Antitrust Paradox.” The Yale Law Journal 126 (3):564–907. https://www.yalelawjournal.org/note/amazons-antitrust-paradox.
Kita, Kinga, and Łukasz Kidziński. 2019. “Google Street View Image of a House Predicts Car Accident Risk of Its Resident.” ArXiv:1904.05270 [Stat], April. http://arxiv.org/abs/1904.05270.
Kupferberg, Aleksandra, Lucy Bicks, and Gregor Hasler. 2016. “Social Functioning in Major Depressive Disorder.” Neuroscience & Biobehavioral Reviews 69 (October):313–32. https://doi.org/10.1016/j.neubiorev.2016.07.002.
MCMC. 2020a. “Identify Phishing E-Mail.” September 21, 2020. https://www.mcmc.gov.my/en/faqs/phishing-attack/2-identify-phishing-e-mail.
———. 2020b. “What Is Phishing?” September 21, 2020. https://www.mcmc.gov.my/en/faqs/phishing-attack/1-what-is-phishing.
Meredith, Sam. 2018. “Facebook-Cambridge Analytica: A Timeline of the Data Hijacking Scandal.” CNBC, April 10, 2018. https://www.cnbc.com/2018/04/10/facebook-cambridge-analytica-a-timeline-of-the-data-hijacking-scandal.html.
Mozur, Paul. 2019. “One Month, 500,000 Face Scans: How China Is Using A.I. to Profile a Minority.” The New York Times, April 14, 2019, sec. Technology. https://www.nytimes.com/2019/04/14/technology/china-surveillance-artificial-intelligence-racial-profiling.html.
Myrow, Rachel. 2019. “California Rings In The New Year With A New Data Privacy Law.” NPR.Org (blog). December 30, 2019. https://www.npr.org/2019/12/30/791190150/california-rings-in-the-new-year-with-a-new-data-privacy-law.
Naufal Fauzi. 2019. “Data Privacy Laws: Malaysia Has a Long Way to Go.” ISIS (blog). February 12, 2019. https://www.isis.org.my/2019/02/12/data-privacy-laws-malaysia-has-a-long-way-to-go/.
Ng, Vivian, and Catherine Kent. 2018. “Smartphone Data Tracking Is More than Creepy – Here’s Why You Should Be Worried.” Yahoo! Finance. February 7, 2018. https://ca.finance.yahoo.com/news/smartphone-data-tracking-more-creepy-104117812.html.
Pierson, Jo, and Rob Heyman. 2011. “Social Media and Cookies: Challenges for Online Privacy.” Info 13 (6):30–42. https://doi.org/10.1108/14636691111174243.

CHAPTER 6
PERSONAL DATA PRIVACY: SURVEILLANCE AND SECURITY
KHAZANAH RESEARCH INSTITUTE 150
Rossotto, Carlo Maria, Prasanna Lal Das, Elena Gasol Ramos, Eva Clemente Miranda, Mona Farid Badran, Martha Martinez Licetti, and Graciela Miralles Murciego. 2018. “Digital Platforms: A Literature Review and Policy Implications for Development.” Competition and Regulation in Network Industries 19 (1–2). https://doi.org/10.1177/1783591718809485.
Segaran, Darmain. 2020. “Child Digital Privacy in Malaysia: Risks, Regulation and Solutions.” Dataraxis (blog). January 7, 2020. https://www.dataraxis.co/blog-1/child-digital-privacy-in-malaysia-risks-regulation-and-solutions.
Strawbridge, Geraldine. 2018. “5 Ways to Identify a Phishing Website.” MetaCompliance. July 2, 2018. https://www.metacompliance.com/blog/5-ways-to-identify-a-phishing-website/.
Tactical Tech’s Data and Politics team. 2019. “Personal Data: Political Persuasion. Inside the Influence Industry. How It Works.”
Tao, Li. 2018. “Malaysian Police Wear Chinese Start-up’s AI Camera to Identify Suspected Criminals.” South China Morning Post, April 20, 2018. https://www.scmp.com/tech/social-gadgets/article/2142497/malaysian-police-wear-chinese-start-ups-ai-camera-identify.
Tashny Sukumaran. 2019. “Malindo Air Confirms Data Breach, Exposing Records of Millions of Passengers.” South China Morning Post, September 18, 2019, sec. News. https://www.scmp.com/news/asia/southeast-asia/article/3027780/malindo-air-confirms-data-breach-exposing-millions.
The European Commission. n.d. “What Is Personal Data?” Accessed September 4, 2020. https://ec.europa.eu/info/law/law-topic/data-protection/reform/what-personal-data_en.
The Star. 2019a. “Use of Biometric Facial Recognition Must Be Regulated.” The Star Online, January 3, 2019, Nation edition. https://www.thestar.com.my/news/nation/2019/01/03/use-of-biometric-facial-recognition-must-be-regulated/.
———. 2019b. “Gobind: Personal Data Protection Law Being Reviewed.” The Star Online, March 18, 2019, Nation edition. https://www.thestar.com.my/news/nation/2019/03/18/gobind-personal-data-protection-law-being-reviewed/.
———. 2020a. “Covid-19 Outbreak Steepens Adoption Curve of e-Wallets in Malaysia,” April 28, 2020. https://www.thestar.com.my/news/regional/2020/04/28/covid-19-outbreak-steepens-adoption-curve-of-e-wallets-in-malaysia.
———. 2020b. “Malaysia’s Online Retail Sales up 28.9% in April,” June 11, 2020. i. Trigg, Rose. 2017. “Cheating Frenchman Sues Uber for €45m Blaming Glitch in App for His
Divorce.” The Local, February 8, 2017. https://www.thelocal.fr/20170208/frenchman-sues-uber-for-45-million-after-glitch-lets-his-wife-track-him.
Uber. 2012. “Rides of Glory.” Uber’s Blog (blog). March 26, 2012. https://web.archive.org/web/20141118192805/http:/blog.uber.com/ridesofglory.
University of Massachusetts Amherst. n.d. “Phishing: Fraudulent Emails, Text Messages, Phone Calls & Social Media.” n.d. https://www.umass.edu/it/security/phishing-fraudulent-emails-text-messages-phone-calls.
U.S. Federal Trade Commission. 2012. “How to Keep Your Personal Information Secure.” Consumer Information. July 2012. https://www.consumer.ftc.gov/articles/0272-how-keep-your-personal-information-secure.

CHAPTER 6
PERSONAL DATA PRIVACY: SURVEILLANCE AND SECURITY
151 KHAZANAH RESEARCH INSTITUTE
Valentino-DeVries, Jennifer, Natasha Singer, Michael H. Keller, and Aaron Krolik. 2018. “Your Apps Know Where You Were Last Night, and They’re Not Keeping It Secret.” The New York Times, December 10, 2018, sec. Business. https://www.nytimes.com/interactive/2018/12/10/business/location-data-privacy-apps.html, https://www.nytimes.com/interactive/2018/12/10/business/location-data-privacy-apps.html.
Whitley, Edgar A. 2009. “Informational Privacy, Consent and the ‘Control’ of Personal Data.” Information Security Technical Report 14 (3):154–59. https://doi.org/10.1016/j.istr.2009.10.001.
Yu, Eileen. 2021. “Malaysia Airlines Suffers Data Security ‘incident’ Affecting Frequent Flyer Members.” ZDNet. February 3, 2021. https://www.zdnet.com/article/malaysia-airlines-suffers-data-security-incident-spanning-nine-years/.
Yuen, Meikeng. 2020. “Cybersecurity Cases Rise by 82.5%.” The Star. April 12, 2020. https://www.thestar.com.my/news/focus/2020/04/12/cybersecurity-cases-rise-by-825.
Zuboff, Shoshana. 2019. The Age of Surveillance Capitalism: The Fight for a Human Future at the New Frontier of Power. Public Affairs.

KHAZANAH RESEARCH INSTITUTE 152
CHAPTER
07 DIGITAL GOVERNANCE: CLASSIFICATION OF INFORMATION DISORDER
7.1 Introduction 153
7.1.1 Media: the fourth pillar of democracy 153
7.1.2 Information disorder 155
7.2 Objectives of research 157
7.3 Methods and results 158
7.3.1 Context of the case study 158
7.4 Human assessments 159
7.4.1 Descriptive results 160
7.4.2 Observations 161
7.4.3 Summary of reflection essays by coders 162
7.5 Natural Language Processing (NLP) 163
7.5.1 Data processing & analytical pipeline 163
7.5.2 Descriptive results 165
7.5.3 Topic analysis: LDA 167
7.5.4 LDA: Topic–Word Association 170
7.5.5 LDA: Topic–Tweet Association 173
7.5.6 Similarities and differences between human assessments and NLP 175
7.5.7 Further improvements with more data and research 177
7.6 Policy considerations 178
7.6.1 Vulnerabilities emerging from a digitalised society can be addressed with Augmented Intelligence 178
7.6.2 Principles of objective fact-checking 180
7.6.3 Civic responsibilities of handling information disorder 180
7.6.4 Digital and online media literacy 181
7.7 Conclusion 182
References 184

153 KHAZANAH RESEARCH INSTITUTE
DIGITAL GOVERNANCE: CLASSIFICATION OF INFORMATION
DISORDER416
By Gregory Ho Wai Son and Emir Izat Abdul Rashid
“The limits of my language mean the limits of my world”.
Ludwig Wittgenstein417
Introduction
7.1.1. Media: the fourth pillar of democracy
The early philosophy of Ludwig Wittgenstein418 asserts that all philosophical problems are
limited by the way in which language conveys logical meaning. However, his later philosophy419
took a turn and posits that the meaning of a word is its use in the language. The latter view
highlights the importance of the role of context in determining what people mean. Certainly, with
the advent of digital technology, the means of communication in society are very different from
Wittgenstein’s era. Nonetheless, the arguments raised in both his philosophies remain evermore
relevant in today’s information age.
Marshall McLuhan argues that it is impossible to understand social and cultural changes without
a knowledge of the workings of media420. McLuhan argues that media can be categorised in a
spectrum of “high definition” to “low definition” media421 Books for example, are high definition
media as they embody a large volume of information and allow for little interaction on the part of
the receiver during the process of transmitting information. Social media on the other hand, are
“low definition” in comparison as social media posts contain a smaller volume of information and
necessitate the participation of the receiver in a more immersive experience as part of the
transmitting process. For “low definition” media, meaning is an emergent process not only from
the original content, but also from the various media-receiver interactions (e.g. comments and
likes).
On democracy, Amyrta Sen observed that “no substantial famine has ever occurred in any
independent and democratic country with a relatively free press.”422 Apart from the three
branches of government—”Legislative”, “Executive” and “Judicial”—the “Press/Media” is also
recognised to be the fourth pillar of democracy. In an ideal democracy, the press plays the role of
seeking and disseminating information independently in order to facilitate debates over “truth”
and “shared meaning” in the public sphere.
416 An earlier version of this chapter authored by Gregory Ho Wai Son and Emir Izat Abdul Rashid was published by
KRI on 23 February 2021 as a Working Paper titled “Classification of Information Disorder”. 417 Original: Wittgenstein (1921), translation: Wittgenstein and dos Santos (1994) 418 Original: Wittgenstein (1921), translation: Wittgenstein and dos Santos (1994) 419 Original: Wittgenstein (1921), translation: Wittgenstein (2009) 420 McLuhan and Fiore (1967) 421 McLuhan (1994). McLuhan uses the terms “hot” and “cold” to refer to high and low definition media, respectively. 422 Sen (1999)

CHAPTER 7
DIGITAL GOVERNANCE: CLASSIFICATION OF INFORMATION DISORDER
KHAZANAH RESEARCH INSTITUTE 154
In an increasingly digitalised society, the advent of social media platforms such as Facebook or
Twitter has allowed media to be propagated with superior coverage, at unprecedented speeds
and at very minimal or no distribution costs. More importantly, there is also a notable transition
in the workings of media from high definition to low definition. This implied that the facilitation
of public debate over “shared meaning” has also transitioned from being dominated by
“mainstream press” to a more decentralised system where the “wisdom” (or “madness”) of the
crowd takes precedence.
For a population size of around 32.7 million people in 2020423, the Malaysian Communications
and Multimedia Commission (MCMC) estimates that there were about 24.6 million users of social
networking apps in the country in 2018424. Of the total number of social networking users, 97.3%
owned a Facebook account, 23.8% owned a Twitter account and 13.3% owned a LinkedIn
account.
While the widespread availability of social media most certainly enabled greater freedom of
expression, unbounded freedom of expression in the workings of media may not always yield
democratic or beneficial outcomes for society. For example, the use of social media has been
recognised to play an important role in fuelling violence in Myanmar in September 2017. There
were documented accounts of widespread circulation of parallel rumours of imminent attacks
which were designed to ignite violence between Muslim and Buddhist communities425.
Another issue that emerged with the use of social media is the spread of misinformation (and
disinformation). Social media platforms employ the use of algorithms whose objective function is
to maximise user engagement; a direct consequence of such algorithms is the filtering of media
or content for users based on “how much a user interacts with certain ‘friends’“ and “what type
of news feed a user interacts with”426. The result is the feeding of problematic media to users that
compels real-world actions. For example, the Pizzagate scandal in the US—initially began as a
conspiracy theory in 4Chan (an anonymous bulletin board website)—became viral in various
other social media platforms. This eventually resulted in a firearm incident in the Comet Ping
Pong Restaurant on 4 December 2016.
In the era of Covid-19, the perils of misinformation cannot be underestimated. In a joint statement
by various international agencies including the World Health Organization (WHO), United
Nations (UN), United Nations International Children's Emergency Fund (UNICEF) and the
International Federation of Red Cross and Red Crescent Societies (IFRC)427, misinformation has
been identified to be harmful—in that “…without the appropriate trust and correct information,
diagnostic tests go unused, immunization campaigns (or campaigns to promote effective
vaccines) will not meet their targets, and the virus will continue to thrive.” Similarly,
disinformation “...is polarizing public debate on topics related to Covid-19; amplifying hate
speech; heightening the risk of conflict, violence and human rights violations; and threatening
long-terms prospects for advancing democracy, human rights and social cohesion.”
423 DOS (2020) 424 MCMC (2019) 425 Rio (2020) 426 Bakshy, Messing and Adamic (2015) 427 “Managing the COVID-19 Infodemic: Promoting Healthy Behaviours and Mitigating the Harm from Misinformation
and Disinformation” (n.d.)
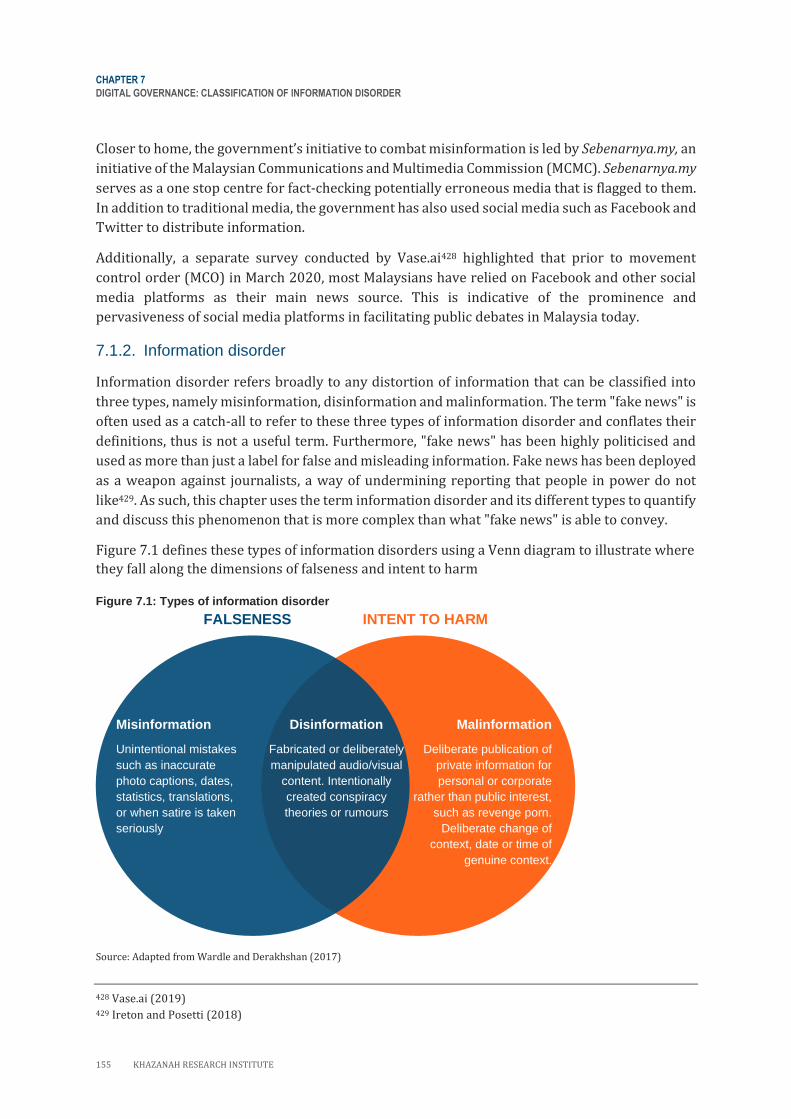
CHAPTER 7
DIGITAL GOVERNANCE: CLASSIFICATION OF INFORMATION DISORDER
155 KHAZANAH RESEARCH INSTITUTE
Closer to home, the government’s initiative to combat misinformation is led by Sebenarnya.my, an
initiative of the Malaysian Communications and Multimedia Commission (MCMC). Sebenarnya.my
serves as a one stop centre for fact-checking potentially erroneous media that is flagged to them.
In addition to traditional media, the government has also used social media such as Facebook and
Twitter to distribute information.
Additionally, a separate survey conducted by Vase.ai428 highlighted that prior to movement
control order (MCO) in March 2020, most Malaysians have relied on Facebook and other social
media platforms as their main news source. This is indicative of the prominence and
pervasiveness of social media platforms in facilitating public debates in Malaysia today.
7.1.2. Information disorder
Information disorder refers broadly to any distortion of information that can be classified into
three types, namely misinformation, disinformation and malinformation. The term "fake news" is
often used as a catch-all to refer to these three types of information disorder and conflates their
definitions, thus is not a useful term. Furthermore, "fake news" has been highly politicised and
used as more than just a label for false and misleading information. Fake news has been deployed
as a weapon against journalists, a way of undermining reporting that people in power do not
like429. As such, this chapter uses the term information disorder and its different types to quantify
and discuss this phenomenon that is more complex than what "fake news" is able to convey.
Figure 7.1 defines these types of information disorders using a Venn diagram to illustrate where
they fall along the dimensions of falseness and intent to harm
Figure 7.1: Types of information disorder
Source: Adapted from Wardle and Derakhshan (2017)
428 Vase.ai (2019) 429 Ireton and Posetti (2018)
Misinformation
Unintentional mistakes
such as inaccurate
photo captions, dates,
statistics, translations,
or when satire is taken
seriously
Malinformation
Deliberate publication of
private information for
personal or corporate
rather than public interest,
such as revenge porn.
Deliberate change of
context, date or time of
genuine context.
Disinformation
Fabricated or deliberately
manipulated audio/visual
content. Intentionally
created conspiracy
theories or rumours
FALSENESS INTENT TO HARM

CHAPTER 7
DIGITAL GOVERNANCE: CLASSIFICATION OF INFORMATION DISORDER
KHAZANAH RESEARCH INSTITUTE 156
“Falseness” simply represents the presence of content that is untrue. “Intent to harm” represents
the presence of content that either is specifically (or maliciously) constructed to bring physical
harm or is an “attack on dignity” to harm the reputation of a person, institution or social group.
Along these two dimensions, information disorder is then categorised as misinformation,
disinformation or malinformation, as described in Table 7.1.
Table 7.1: Three categories of information disorder
Category Description
Misinformation False information is present, but no harm is intended
Disinformation False information is knowingly shared to cause harm
Malinformation Genuine information is shared to cause harm, often by moving private information to the public sphere
Source: Adapted from Wardle and Derakhshan (2017)
However, the use of such terminology can sometimes be confusing or inconsistent in
experimental or analytical settings430. This is because the key to effectively employing the
definitions lie in the ability to confidently label content along two dimensions. Firstly, to label
some media content as containing “falseness”, the encoder must claim access to truth. Secondly,
to label some media content as containing “intent to harm”, the encoder must have the correct
interpretation of authorial intent. Where there is reasonable uncertainty with regards to these
two dimensions, it can be difficult to make a case for the presence of information disorder, or
which category of information disorder is present in some media.
Moreover, these difficulties necessarily extend beyond the experimental and analytical settings.
In a legal setting, the burden of proof falls on the part of the plaintiff who has to make a case for
which the defendant is guilty of either falseness or intent to harm. Additionally, the plaintiff has
to defend his position beyond reasonable doubt (“standard of proof”) in the case of criminal
proceedings. Whatever judgements arise from such cases also form a precedent for future cases.
On 11 April 2018, the Anti-Fake News Act 2018 (Act 803) was passed by the Malaysian
Parliament431. In an interview with the minister in the Prime Minister’s Department responsible
over the bill, Azalina Othman explained that the act was passed to deal with “…the issue of
dissemination of fake news is a global problem, following the technological communication
revolution, which is happening at a rapid pace. Of late, Malaysia has faced numerous challenges
as an effect from fake news which not only confuses the public but can also threaten the safety,
economy, prosperity and well-being of the people and the country”432.
This act has since been repealed on 9 October 2019. Explanatory statements accompanying the
bill to repeal Anti-Fake News Act 2018 (Act 803) states that Act 803 is no longer relevant given
changes in the Penal Code (Act 574), the Printing Presses and Publications Act 1984 (Act 301)
and the Communications and Multimedia Act 1998 (Act 588)433.
430 Wu et al. (2019) 431 AGC (2018b) 432 Ngah (2018) 433 Link to the bill.
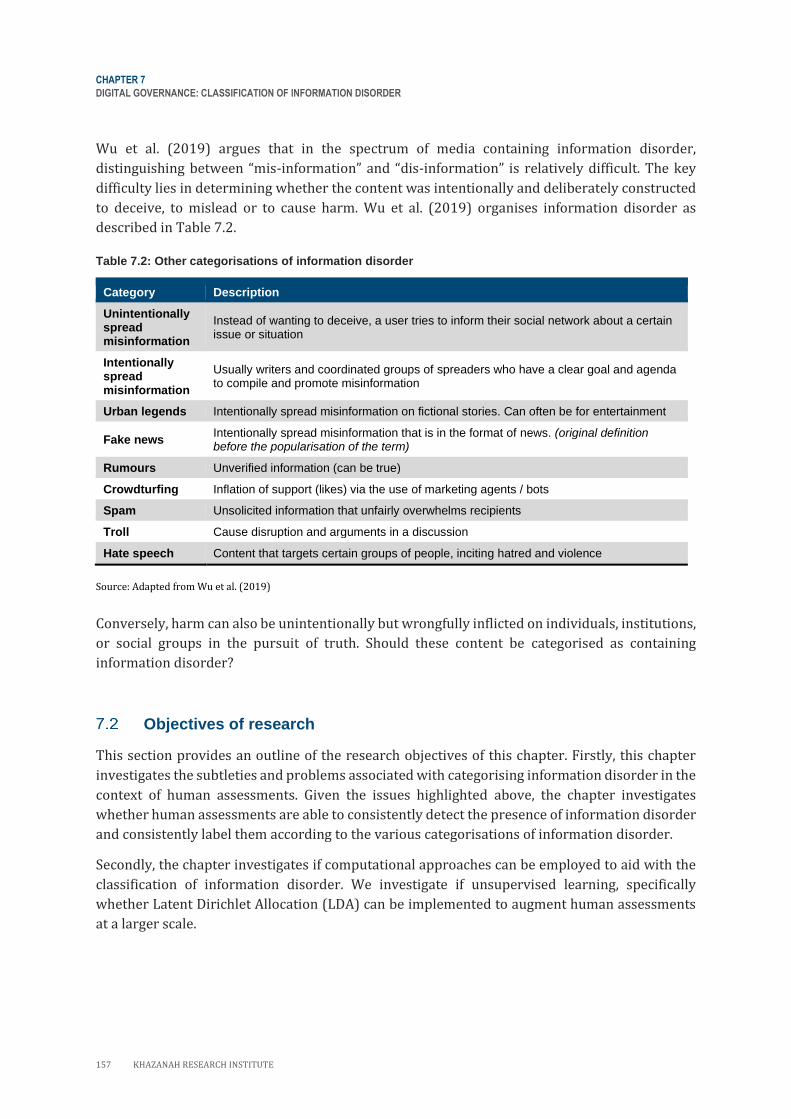
CHAPTER 7
DIGITAL GOVERNANCE: CLASSIFICATION OF INFORMATION DISORDER
157 KHAZANAH RESEARCH INSTITUTE
Wu et al. (2019) argues that in the spectrum of media containing information disorder,
distinguishing between “mis-information” and “dis-information” is relatively difficult. The key
difficulty lies in determining whether the content was intentionally and deliberately constructed
to deceive, to mislead or to cause harm. Wu et al. (2019) organises information disorder as
described in Table 7.2.
Table 7.2: Other categorisations of information disorder
Category Description
Unintentionally spread misinformation
Instead of wanting to deceive, a user tries to inform their social network about a certain issue or situation
Intentionally spread misinformation
Usually writers and coordinated groups of spreaders who have a clear goal and agenda to compile and promote misinformation
Urban legends Intentionally spread misinformation on fictional stories. Can often be for entertainment
Fake news Intentionally spread misinformation that is in the format of news. (original definition before the popularisation of the term)
Rumours Unverified information (can be true)
Crowdturfing Inflation of support (likes) via the use of marketing agents / bots
Spam Unsolicited information that unfairly overwhelms recipients
Troll Cause disruption and arguments in a discussion
Hate speech Content that targets certain groups of people, inciting hatred and violence
Source: Adapted from Wu et al. (2019)
Conversely, harm can also be unintentionally but wrongfully inflicted on individuals, institutions,
or social groups in the pursuit of truth. Should these content be categorised as containing
information disorder?
Objectives of research
This section provides an outline of the research objectives of this chapter. Firstly, this chapter
investigates the subtleties and problems associated with categorising information disorder in the
context of human assessments. Given the issues highlighted above, the chapter investigates
whether human assessments are able to consistently detect the presence of information disorder
and consistently label them according to the various categorisations of information disorder.
Secondly, the chapter investigates if computational approaches can be employed to aid with the
classification of information disorder. We investigate if unsupervised learning, specifically
whether Latent Dirichlet Allocation (LDA) can be implemented to augment human assessments
at a larger scale.

CHAPTER 7
DIGITAL GOVERNANCE: CLASSIFICATION OF INFORMATION DISORDER
KHAZANAH RESEARCH INSTITUTE 158
Given that the scale, openness and timeliness of social media have largely transformed the role of
media as the fourth pillar of democracy, this chapter examines if problems that emerge from an
increasingly digitalised society can also be battled using digitalised solutions that emerge from
data science and machine learning.
We do this by studying tweets regarding a specific Covid-19 patient who was the subject of
widespread public discussion in Malaysia in early 2020.
Methods and results
7.3.1. Context of the case study
At the time of data collection in early 2020, we only had access to a standard Twitter developer
account. The standard account has limitations with regards to the breadth, depth and timeframe
of search and extraction of tweets. With these limitations in mind, this chapter approaches
information disorder in Malaysia by use of a case study of “Kes-26”. “Kes-26” was the 26th person
in Malaysia to have tested positive for Covid-19 and was initially identified by the Ministry of
Health (MOH)434 to be the index case of over 20 other infections.
At the onset of Covid-19 in pre-lockdown Malaysia, “Kes-26” was interesting because its
prominence in social media led to speculations on the identity of the patient especially following
the circulation of a rumour of his attendance at a particular political event leading up to his
diagnosis435. Following these events, there were various forms of information disorder being
spread on social media concerning him. On 6 March 2020, “Kes-26” released a public statement,
sharing the facts and clarifying the statements that were being made about him.
The case study is based on a relatively small corpus of Twitter data. We generated the dataset by
collecting tweets surrounding ”Kes-26”. For data collection, we developed a crawler based on
Twitter’s API, which allows for a filtered collection of real-time tweets based on pre-
specified keywords. The keywords which were employed are summarised in Table 7.3.
Table 7.3: Keywords used for filtered collection of tweets
Keywords Description
“Kes-26”, “Kes 26”, “Case-26”, “Case 26” Keywords directly referring to Kes-26
“Hisham Hamdan”, “UDA Chair” The “identities” of Kes-26
Based on the filtered collection, we extracted a total of 2,015 tweets, posted by 1,569 unique twitter handles, over the period of 28 February 2020 to 10 March 2020.
434 KKM Portal MyHealth (2020) 435 Sarawak Report (2020)

CHAPTER 7
DIGITAL GOVERNANCE: CLASSIFICATION OF INFORMATION DISORDER
159 KHAZANAH RESEARCH INSTITUTE
Human assessments
The 2,015 tweets were distributed among seven coders in a way where each tweet was classified
by a minimum of three coders. Each coder classified 860+ tweets per person. To ensure that the
classification was done in a consistent and objective way, coders were:
1. Exposed to the events surrounding Kes-26
2. Exposed to the literature on the categorisation of information disorder
3. Given a randomised set of 100 tweets as a practice set before the actual classification
exercise. Post-practice, two meetings were held to discuss issues and iron out interpretive
dissonance on what each class represents.
Figure 7.2 represents the classification of information disorder that we employed in this exercise.
Figure 7.2: Classification of information disorder
Based on Figure 7.2, coders first classified if a particular tweet is “relevant” or “not relevant” to
“Kes-26”. As we were only interested to study Information Disorder within the context of our case
study, “non-relevant” tweets were filtered out in order to generate a dataset that is specific to
“Kes-26”. Some of the non-relevant tweets include tweets promoting mobile phone cases, tweets
reporting Covid-19 cases in other countries, or even legal cases in other countries.
For relevant tweets, coders then determined if the tweet contains information disorder, or if it
does not contain Information Disorder. If the tweet contains information disorder, coders had the
additional task of identifying if the tweet contains particular definitions of information disorder
based on our literature review436. These definitions are not mutually exclusive (the presence of
one definition does not necessitate the absence of another). The authors also made the decision
to add the following definitions inTable 7.4, based on feedback from the practice exercise.
436 These definitions were developed mainly from Wardle and Derakhshan (2017) and Wu et al. (2019).
Contains Information Disorder
Does not contain Information Disorder
Falseness
Intent to Harm
Spreading Rumours
Speculation on Identity
Classist Attack
Expressing “Hate’
Inciting Violence
Fake News
Sarcasm
Trolling
Relevant to “Kes-26”
Not relevant to “Kes-26”

CHAPTER 7
DIGITAL GOVERNANCE: CLASSIFICATION OF INFORMATION DISORDER
KHAZANAH RESEARCH INSTITUTE 160
Table 7.4: Additional classifications of information disorder
Category Description
Speculation on identity Intentionally trying to reveal the identity of a Covid patient
Classist attack Expressing prejudice against a particular group based on class
Expressing hate Use of pejorative and discriminatory language with reference to a person or group based on who they are437.
Inciting violence Advocating a crime, or injury to person or social group
Moreover, these additional definitions may have more serious implications than the earlier
definitions. For example, the spreading of rumours can be combated by sharing facts and the truth
to dispel misinformation. However, the strategy to combat content with pejorative language or
content even suggesting physical harm to a person or a social group may require more than just
the sharing of facts. The law of Malaysia makes provisions for this in Act 574 (Penal Code) Section
153438.
7.4.1. Descriptive results
This section summarises the descriptive results that emerge from the human assessments. Figure
7.3 describes the proportion of tweets that contain information disorder in the set of tweets
relevant to our case study.
Figure 7.3: Proportion of tweets with information disorder
Source: Authors’ calculation
437 UN (2019) 438 AGC (2018a)

CHAPTER 7
DIGITAL GOVERNANCE: CLASSIFICATION OF INFORMATION DISORDER
161 KHAZANAH RESEARCH INSTITUTE
Out of the total 2,015 tweets that were extracted, 884 were considered to be not relevant to our
case study439. Of the remaining 1,131 tweets relevant to the case study, only 467 (41.3%) were
considered to contain some form of information disorder . However, the quantification of what
proportion of tweets contain information disorder would also vary across country, topic and time
periods. Another study that employed human assessments over a much larger volume of tweets
has found about 23.46% of tweets to be perceived as not credible440.
For the 470 tweets that contained some form of information disorder, Figure 7.4 describes the
consistency of human assessments441.
Figure 7.4: Consistency of human assessments
Source: Authors’ calculation
7.4.2. Observations
Firstly, over the period of 28 February 2020 to 10 March 2020—of the tweets that were relevant
to “Kes-26”—most tweets (664 [58.7%] out of 1,131) did not contain information disorder.
Secondly, coders were able to consistently differentiate tweets which contained information
disorder and tweets which did not442.
439 We only consider definitions to be “present” for tweets where there is full agreement or majority (2/3 or 3/4)
agreement. 440 Mitra and Gilbert (2015) 441 In considering information disorder, we employed a more stringent measure. A tweet is considered to contain some
form of information disorder if there is at least one human that identifies the presence of a particular definition of
information disorder. 442 Majority and Full Agreement is observed to be at 86.4%.
0
50
100
150
200
250
300
350
400
Falseness Intent toharm
SpreadingRumors
Expressing'hate'
Speculationon Identity
Sarcasm Troll ClassistAttack
IncitingViolence
Fake news
Num
ber
of tw
eets
Full Agreement Majority Agreement Half and Below Half

CHAPTER 7
DIGITAL GOVERNANCE: CLASSIFICATION OF INFORMATION DISORDER
KHAZANAH RESEARCH INSTITUTE 162
Thirdly, certain dimensions of information disorder were classified relatively more consistently
than others. The dimensions of “falseness”, “spreading rumours”, “expressing hate” and
“speculation on identity” all had a sizeable amount of full and majority agreement. However, when
it comes to the presence of “intent to harm”, “trolling”, “classist attacks”, “inciting violence” and
“fake news”, the classifications the coders decided on did not agree with one another. In fact, there
were close to zero cases of full agreements over the aforementioned dimensions.
The presence of such ambiguity in the classification of these dimensions could be a signal of the
difficulties people face in reading intent and subsequently making a judgement based on that.
Of the 470 tweets containing Information Disorder, the presence of “falseness” far outweighs
“intent to harm”. For the tweets where “falseness” and (or) “intent to harm” are recognised to be
present at majority and full agreement, Figure 7.5 describes the distribution of information
disorder as defined by Wardle and Derakhshan (2017) in our human assessments.
Figure 7.5: Information disorder in the case study of “Kes-26”
Source: Authors’ calculation
Potentially, this implies that the information disorder tweets were mostly misinformation—
tweets containing content that have an element of falseness but was not constructed maliciously
with intent to harm. Unfortunately, we are unable to determine if this is a feature of the case study,
or if it is a result of ambiguity in the classification of “intent to harm”, as outlined in the next
section.
7.4.3. Summary of reflection essays by coders
Coders involved in the human assessment were also asked to write a reflective essay to
summarise their experience in this classification exercise. This section seeks to summarise key
reflections emerging from the exercise.
Misinformation91%
Disinformation3%
Malinformation6%
CHAPTER 7
DIGITAL GOVERNANCE: CLASSIFICATION OF INFORMATION DISORDER
163 KHAZANAH RESEARCH INSTITUTE
First, all coders experienced difficulties with regards to assessing intent and motive. It was
argued that to be able to objectively determine if a person intends to harm another, the motive of
writing the particular tweet has to be made known. In some cases, coders were able to rely on
verbal cues, such as the CAPITALISATION OF ALL LETTERS or the use of strong emotional words.
However, to truly know a person’s motivations is almost impossible: the practice of classifying
content based on the authorial intent can be somewhat subjective.
Second, even when one had access to all the facts, there is still ambiguity that arises from the use
of language. In social media platforms like Facebook or Twitter, what is posted is often unscripted,
unfiltered sentiment of the populus. In many cases, what has been said can be very different from
what one intends to say. Moreover, in a world where truth can often be relative, should people be
labelled as spreading misinformation based on an incorrect or inaccurate use of words that both
they themselves and the rest of the world do not fully understand?
Third, Malaysia is a multilingual country—a melting pot of different ethnic groups and cultures.
Many tweets were written in a combination of at least two or more languages with use of
shorthand, abbreviations and memes. In many cases, coders had to understand how these
features were used in order to gauge the intent behind the tweets.
Natural Language Processing (NLP)
Up to this point, the human assessments have emphasised the importance of understanding
context, the structure and rules of language, and having the ability to correctly identify motive
and intent in order to objectively identify the presence of information disorder .
However, in a digitalised society where millions of new tweets are generated every single day,
the scale and time-sensitivity of having humans assess large volumes of tweets would be severely
impractical and expensive. A digitalised society requires digitalised solutions or augmentations
that can greatly ease the workload of classifying information disorder.
In this section we explore the use of NLP techniques as a potential enabler to augment human
assessments. NLP represents a body of statistical tools, techniques and algorithms used to
process natural language based data (normally unstructured) like text, documents or speeches.
7.5.1. Data processing & analytical pipeline
A visual description of our data processing and analytical pipeline is illustrated in Figure 7.6.

CHAPTER 7
DIGITAL GOVERNANCE: CLASSIFICATION OF INFORMATION DISORDER
KHAZANAH RESEARCH INSTITUTE 164
Figure 7.6: Data processing and analytical pipeline
Based on Table 7.3, we extracted a total of 2,015 tweets, posted by 1,569 unique twitter handles,
over the period of 28 February 2020 to 10 March 2020. The tweets were filtered to obtain a
dataset that only contained tweets that were relevant to our case study443. This dataset is
henceforth referred to as the “Kes-26” corpus. The corpus is then subjected to standard NLP data
pre-processing techniques. Table 7.5 describes the various pre-processing steps that were
conducted preceding the analytical steps.
Table 7.5: NLP data pre-processing steps
Step Processes Description
Data cleaning Removing html tags, Twitter handles and special characters Correcting spelling errors
These elements have to be addressed as they contribute to more noise in the dataset
Handling “stop words”
Removing stop words Stop words (“a”, “and”, “the”) are words that appear very frequently, but have little significance analytically
Contraction mapping
Map contractions, abbreviations and shorthand
Contractions (“you’re”, “you’ve”) are shortened words or syllables. These elements are mapped to ensure consistency in the use of words
443 Relevent tweets were defined based on human assessments.
Model Evaluation
Analysis: Latent Dirichlet Allocation Tweet–Topic Distribution
C1 C
2 . . . C
n
T1
T2
•
•
•
Tn
Tweet–Word Distribution W
1 W
2 . . . W
n
C1
C2
•
•
•
Cn
Words Topics β W K θ α γ
Pre-Processing
1. Data cleaning 2. Removing stop words 3. Contraction mapping 4. Tweet–Word Matrix
W1 W
2 . . . W
n
T1
T2
•
•
•
Tn
Human Assessments
Filter: Relevant content

CHAPTER 7
DIGITAL GOVERNANCE: CLASSIFICATION OF INFORMATION DISORDER
165 KHAZANAH RESEARCH INSTITUTE
After the pre-processing stage, the corpus is then tokenised444 to generate a traditional
document–term matrix (which is henceforth defined as the tweet–word matrix [TW matrix]).
Elements of the TW matrix are computed according to the frequency of appearance for each word
in each tweet. In the traditional NLP literature, the TW matrix is classified as a “Bag of Words”
model. One consequence of employing “Bag of Words” models, is that these models dissolve any
information in semantics, structure, sequence and context when coarse-grained445. As described
in Figure 7.6, the most basic form of the TW matrix is simply a frequency count of the occurrence
of each word in each tweet.
7.5.2. Descriptive results
Before analysing the data further, we first used information retrieval methods, namely “Term
Frequency–Inverse Document Frequency” (TF–IDF) and correlation analysis to extract a general
overview of the Kes-26 corpus.
The frequency of a word seems intuitive at first—the more a word is repeated, the more we know
what kind of words are being used; however, word frequencies are often unhelpful to capture the
words that could make a sentence meaningful. For example, in our data set, the word “kes”, “26”,
“hisham”, “covid”, and “case” are in the top 20 words used, by virtue of these words being used
as parameters for the filtered collection of tweets. However, those words do not provide any
meaningful information regarding the tweet data sets as they were employed on Twitter’s API
specifically to retrieve tweets which contain these words.
To generate a general description, we employed TF–IDF instead of word frequency to gauge the
Kes-26 corpus. TF–IDF assigns an index value to every word in the corpus based on the following
inputs:
𝑇𝐹𝑖,𝑗 = 𝑛𝑖,𝑗
∑ 𝑛𝑘 𝑖,𝑗
…(1)
𝐼𝐷𝐹(𝑤) = log (𝑁
𝑑𝑓𝑖)
…(2)
𝑇𝐹 − 𝐼𝐷𝐹 = 𝑛𝑖,𝑗
∑ 𝑛𝑘 𝑖,𝑗
𝑥 log (𝑁
𝑑𝑓𝑖)
…(3)
A TF–IDF446 value increases proportionally with the number of times a particular word is
repeated in a single tweet, but is offset by the number of times the word is being used in other
tweets. For example, common words that are being used many times in one tweet, but also at the
same time being used across the tweet data set, will most likely be lower than words that are
being used less in a single tweet but less prevalent across the data set. An ideally high TF–IDF
score will be words that are used a lot in a single tweet but is not repeated again in the data set.
444 Breaking sentences into linguistic units–case words 445 Sarkar (2016)
446 The algorithmic form of this equation applies log (𝑁
𝑑𝑓+1) to avoid division over 0.

CHAPTER 7
DIGITAL GOVERNANCE: CLASSIFICATION OF INFORMATION DISORDER
KHAZANAH RESEARCH INSTITUTE 166
Figure 7.7 describes the top 10 highest valued words based on TF–IDF447 while Figure 7.8
describes the top 10 highest word frequencies of the corpus.
Figure 7.7: Top 10 TF-IDF valued words in the corpus Figure 7.8: Top 10 words by frequency in the corpus
Source: Authors’ calculation
High TF–IDF words paint a better picture for the overall sentiment of the tweet data set than word
frequencies. For example, the words “tak”, “kontak”, “rapat” reflect common features that provide
little contextual information. On the other hand, words like the f-word, “dodgy”, “adumak” or
“halahaiii” reflect stronger emotional responses that relate to the context of the corpus.
Next, to infer trends in the underlying topics and ideas that were discussed in the corpus, the TW
matrix is reorganised according to bi-gram448 pairs of words (instead of individual words, bigram
tokenisation breaks the sentence into word pairs). Then the correlation coefficient ρ is computed
for each word pair. Using ρ, we generated a correlation network of words (Figure 7.9) “naturally”
occurring in the corpus.
Figure 7.9 describes the word map based on the frequency of words appearing in succession. As
observed in the correlation network, words that frequently appear together agglomerate closer
together to form “islands”. “Islands” represent themes, entities, events and other features of the
corpus.
The two major word “islands” are composed of official Malay words, which we conclude are
announcements or reports from news agencies and MOH. On the other hand, the word “super”
and “spreader”—a recurring allegation—appears to form their own word island. Other notable
word islands represent the identities associated with “Kes-26”, places which he has visited, the
characteristics of Covid-19, and other related themes.
447 Malaysia is a melting pot of many cultures, religions and languages. For every non-English word that is used in our
analysis, a corresponding definition may be found in Appendix A of our Working Paper titled “Classification of
Information Disorder”. 448 A bi-gram represents a sequence of two adjacent words appearing in each tweet.
0 2 4 6 8
dodgy
angers
takpelah
adumak
rentetan
halahaiii
aduhlah
hate
fuck
wildin
0 250 500 750 1,000 1,250 1,500
kes
26
rapat
kkmputrajaya
covid
kontak
tak
19
case
uda

CHAPTER 7
DIGITAL GOVERNANCE: CLASSIFICATION OF INFORMATION DISORDER
167 KHAZANAH RESEARCH INSTITUTE
Figure 7.9: Correlation network between words (ρ > 0.5)
Source: Authors’ calculation
The generation of this correlation network makes no prior assumptions on the themes save for
the “filtered words” applied in the Twitter’s API. This indicates that the method may be employed
as a precursory diagnostic tool that may help in human assessments, provided that the “filtered
words” were selected accurately.
7.5.3. Topic analysis: LDA
For human assessments of information disorder , two ingredients are necessary—access to truth
and the ability to correctly diagnose authorial intent. In this section, we explore the possibility
of classifying information disorder without making any a priori assumptions on the
characteristics of information disorder .
To do this, we employ the use of unsupervised classification, a set of techniques in machine
learning whose goal is to correctly group objects based on shared “similarity(-ies)” over a set of
dimensions. In particular, we employ the use of a topic modelling method called Latent
Dirichlet449 Allocation (LDA) as first described in Blei, Ng and Jordan (2003) in the context of
machine learning.
449 The Dirichlet distribution is generalised from the Beta distribution for multiple random variables.

CHAPTER 7
DIGITAL GOVERNANCE: CLASSIFICATION OF INFORMATION DISORDER
KHAZANAH RESEARCH INSTITUTE 168
Box 7.1: A layman's explanation of LDA
When you read a document—a book, a news article, or any sort of publication—how would
you know what that document is about?
You might know based on reading the title of the document, by looking at the cover picture or
by reading snippets of document itself. However, the best way to truly know what a document
is about is to go through its content word by word and page by page.
Consider the following two KRI publications: the article on the left was written by Gregory Ho
and Dr Suraya Ismail, while the article on the right was written by Siti Aiysyah Tumin.
Source: Ho and Ismail (2020) and Tumin (2020)
The article on the left focuses on the perils of using the B40 demarcation given stark
disparities in Malaysian household wellbeing. On the other hand, the article on the right
focuses on the struggles faced by Malaysian firms during the Covid-19 pandemic and the
government’s policy responses to address these difficulties.
You could arrive at this interpretation by reading each sentence and evaluating the arguments
based on what else you know about the topic. However, what might be the basis of your
interpretation?
One approach would be to argue that the use of certain words can be associated with certain
topics. For example, the words income, consumption, wellbeing or food are words that you
might expect to see in an article describing household wellbeing. On the other hand, you
would expect to see words like SMEs, stimulus, liquidity or cash flow in the article describing
the survival of firms in a pandemic.

CHAPTER 7
DIGITAL GOVERNANCE: CLASSIFICATION OF INFORMATION DISORDER
169 KHAZANAH RESEARCH INSTITUTE
Figure 7B. 1: A human depiction of topics
Latent Dirichlet Allocation (LDA) is a statistical method utilizing unsupervised learning to
discover Topic-Word associations, among other things. While LDA does not categorise topics
in the same way that a human does, LDA is able to identify the statistical characteristics of
word associations between different topics based on text data.
Figure 7B. 2: LDA's Topic-Word Association
Using a metric called Coherence, LDA can quantify the degree to which topics use the same
words, something called semantic similarity . For example, how the word-cluster –
Distribution, food, poverty, group, aspirational, consumption, or income is distinguishable from
another word-cluster – Businesses, need, stimulus, SMEs, firms, or employed.
Based on these Topic-Word associations, it is then possible to describe any media as a
composition of its generated LDA features. For example, let there be a fictitious hypothetical
media which “highlights the shrinking middle-class as a result of struggling SMEs”.

CHAPTER 7
DIGITAL GOVERNANCE: CLASSIFICATION OF INFORMATION DISORDER
KHAZANAH RESEARCH INSTITUTE 170
LDA can attribute Topics (representing a cluster of words) to a body of text with the goal of
describing what the body of text is about. Typically step 1 begins with LDA describing the text
as mainly about Topics 1 and 2. At this point, the computer does not know what Topics 1 and
2 are about, at least not in the same way a human would interpret the two topics. Hence, in
the next step, a human then looks at the classification generated by the machine and gives
each topic a human name based on our background knowledge and contextual understanding.
Figure 7B. 3: Human assignment of meaning to machine labelled topics
In our study, we compared the classification of misinformation made by both human
assessments and LDA. For more information, please refer to our Discussion Paper:
Classification of Information Disorder.
7.5.4. LDA: Topic–Word Association
Within the framework of LDA, every word is associated with topics based on β. As a result, each
topic can then be described as a distribution of words450. By rank-ordering the β-values for each
topic, we can then explore the semantic structure of what the topic represents. For each of the
five topics, LDA assigns β-values for a total of 1,828 words. Figure 7.10 describes the top 10 words
by each topic.
450 Technically, a K-dimensional discrete representation.

CHAPTER 7
DIGITAL GOVERNANCE: CLASSIFICATION OF INFORMATION DISORDER
171 KHAZANAH RESEARCH INSTITUTE
Figure 7.10: Top 10 terms for each topic group according to their assigned β-values
Source: Authors’ calculation
While top terms are a good start to gauge the composition of the distinct topic groups, the sheer
scale in the number of words can be informationally overwhelming. The use of TF–IDF can further
simplify the process by singling out words that are more polarised in the distribution. High
polarisation indicates clear distinctions between groups while high frequency words with larger
spread distribution indicates that the word is being used across the entire data set. For example,
Figure 7.11 and Figure 7.12 describes the β-value of five highest TF–IDF words and five highest
frequency words, respectively, against the topic number.
0 0.02 0.04 0.06
uda
chairman
covid
hamdan
19
hisham
case
patient
khazanah
kkmputrajaya
β
Topic 1
0 0.02 0.04 0.06
rapat
kontak
malaysia
positif
covid19
kluster
covid
kkm
19
1
β
Topic 2
0 0.02 0.04 0.06
hisham
case
shanghai
covid
cases
siapa
pesakit
malaysia
virus
19
β
Topic 3
0 0.02 0.04 0.06
orang
tak
spreader
super
ramai
betul
kena
nak
org
jadi
β
Topic 4
0 0.02 0.04 0.06
punca
semua
hari
kkmputrajaya
dalam
pergi
baru
hospital
naik
gelombang
β
Topic 5

CHAPTER 7
DIGITAL GOVERNANCE: CLASSIFICATION OF INFORMATION DISORDER
KHAZANAH RESEARCH INSTITUTE 172
Figure 7.11: High TF–IDF topic–word distribution Figure 7.12: High Frequency topic–word distribution
Source: Authors’ calculation
0.0000 0.0001 0.0002 0.0003 0.0004 0.0005
1
2
3
4
5
adumak
0.0000 0.0001 0.0002 0.0003 0.0004 0.0005
1
2
3
4
5
angers
0.0000 0.0001 0.0002 0.0003 0.0004 0.0005
1
2
3
4
5
dodgy
0.0000 0.0001 0.0002 0.0003 0.0004 0.0005
1
2
3
4
5
rentetan
0.0000 0.0001 0.0002 0.0003 0.0004 0.0005
1
2
3
4
5
β
takpelah
0 0.01 0.02 0.03 0.04 0.05
1
2
3
4
5
19
0 0.01 0.02 0.03 0.04 0.05
1
2
3
4
5
covid
0.00 0.01 0.02 0.03 0.04 0.05
1
2
3
4
5
super
0.00 0.01 0.02 0.03 0.04 0.05
1
2
3
4
5
hisham
0 0.01 0.02 0.03 0.04 0.05
1
2
3
4
5
β
uda

CHAPTER 7
DIGITAL GOVERNANCE: CLASSIFICATION OF INFORMATION DISORDER
173 KHAZANAH RESEARCH INSTITUTE
Firstly, high TF–IDF words are observed to be more polarised than high frequency words. This is
expected because words that appear less frequently in the corpus give more informational value
as compared to words that appear in most tweets. Hence, specific words can be associated more
closely to the individual tweet. The words “dodgy” and “takpelah” both have similar distribution
(highly probable to be classified in topic 4), while “adumak” and “angers” (highly probable to be
classified in topic 3). Interestingly, none of the high TF–IDF words belong in topic 2, a strong sign
that topic 2 is less likely to have “outlier” words.
High frequency words on the other hand are less polarised. For “covid” and “19”, there is a high
spread. This shows that the usage of those two words is common throughout the data set. By the
same token, the word “covid” and “19” have a similar β-value trend except for a slight bump in
topic 4 for “covid”. These two similar distributions indicate a strong keyword relation—“covid”
and “19” appears together often, but “covid” can also be used without “19”, hence the small
difference in topic 4.
It is observed that the word “super” dominated topic 4, alongside “dodgy” and “takpelah”, while
“hisham” is overwhelmingly in topic 3, shared by “adumak” and “angers”. Similar probability
distributions indicate that these words share some form of “commonality” that a human
otherwise could not be able to decipher.
The word–topic distribution shows the algorithm’s remarkable ability to detect similarities
between seemingly unrelated words. The word–topic distribution does not suggest that some
words are intrinsically related with information disorder. It shows that tweets containing
information disorder share word similarities, as indicated by highly polarised word–topic
distribution and strong keyword relations between other words.
Based on the results, we can establish some word patterns using a word–topic probability
distribution; the distribution can be used to detect distinct groups of word–topic combinations.
However, dividing words into topics is not enough to fully capture the depth of the topics. Using
certain words together does not encapsulate the context of the tweet. These words should be
analysed concurrently with the tweet–topic distribution to understand further the composition
of each group.
7.5.5. LDA: Topic–Tweet Association
Within the framework of LDA, every tweet can be associated with topics based on γ. γ represents
the probability that a certain tweet belongs in a particular topic. Figure 7.13 describes the Topic–
Tweet distribution for the 1,131 relevant tweets over all five topics.

CHAPTER 7
DIGITAL GOVERNANCE: CLASSIFICATION OF INFORMATION DISORDER
KHAZANAH RESEARCH INSTITUTE 174
Figure 7.13: Topic–Tweet distribution for all five topics
Source: Authors’ calculation
Figure 7.13 can be described as a histogram which represents the degree of intra-topic
polarisation. As γ probabilities represent topic–tweet associations, they are not mutually
exclusive. Thus, each tweet can be described as being composed of multiple topics. To quantify
the degree of polarisation in each topic, a polarisation index451 is used. The measure of
polarisation, denoted by d is computed as follows:
𝑑 = |𝑔𝑐𝑢 − 𝑔𝑐𝑙|
|𝛾𝑚𝑎𝑥 − 𝛾𝑚𝑖𝑛|
where:
𝑔𝑐𝑙 = ∫ 𝑝(𝛾)𝛾 𝑑𝛾
0.5
0
∫ 𝑝(𝛾) 𝑑𝛾0.5
0
𝑔𝑐𝑢 = ∫ 𝑝(𝛾)𝛾 𝑑𝛾
1
0.5
∫ 𝑝(𝛾) 𝑑𝛾1
0.5
451 As proposed in Morales et al. (2015)

CHAPTER 7
DIGITAL GOVERNANCE: CLASSIFICATION OF INFORMATION DISORDER
175 KHAZANAH RESEARCH INSTITUTE
The polarisation index is a measure of normalised distance between the upper and lower gravity
centres (gcu and gcl) of each topic. At extremes, the index yields d=0 where there is no separation
between gravity centres (the topic is described by identical tweets) and d=1 where there is
maximal separation between gravity centres (the topic consists of tweets that are at extreme ends
and are completely and perfectly opposed).
Figure 7.14: Topic polarisation index
Source: Authors’ calculation
As observed in Figure 7.14, topic 2 records the highest polarisation compared to other topics. The
polarisation index for topic 2 is also significantly different from all other topics, which indicates
the potential use of the LDA algorithm to classify tweets according to γ-values of topic 2. The
implications of this observation will be discussed further in the next section.
7.5.6. Similarities and differences between human assessments and NLP
One other major use for tweet–topic association is to establish some relationship between our
manual human assessments and natural language processing. Since γ-values are attached for each
tweet and each tweet has its own categorical Information Disorder criteria based on human
assessments, this section examines the corroboration between the two methods.
Tweet–Topic association also allows each tweet to be described as a composition of topics based
on its semantic structure. Figure 7.15 through Figure 7.20 below summarises the intersection
between mean Tweet–Topic compositions of LDA and the results of human assessments.
0
0.1
0.2
0.3
0.4
0.5
0.6
0.7
1 2 3 4 5 All topicsTopic Group

CHAPTER 7
DIGITAL GOVERNANCE: CLASSIFICATION OF INFORMATION DISORDER
KHAZANAH RESEARCH INSTITUTE 176
Figure 7.15: Tweet–Topic composition (No
Information Disorder)
Figure 7.16: Tweet–Topic composition
(Falseness)
Figure 7.17:Tweet–Topic composition (Intent to
Harm)
Figure 7.18: Tweet–Topic composition
(Expressing Hate)
Figure 7.19: Tweet–Topic composition (Inciting
Violence)
Figure 7.20: Tweet–Topic composition
(Spreading Rumours)
Source: Authors’ calculation
It is observed from Figure 7.15 that the tweets which the coders identified to have no information
disorder exhibits a more “uniform” distribution. Tweets that were identified as containing
information disorder of the various categories did not exhibit a uniform distribution as illustrated
in Figure 7.15 to Figure 7.20.
0
0.1
0.2
0.3
0.4
1 2 3 4 5
0
0.1
0.2
0.3
0.4
1 2 3 4 5
0
0.1
0.2
0.3
0.4
1 2 3 4 5
0
0.1
0.2
0.3
0.4
1 2 3 4 5
0
0.1
0.2
0.3
0.4
1 2 3 4 5
0
0.1
0.2
0.3
0.4
1 2 3 4 5

CHAPTER 7
DIGITAL GOVERNANCE: CLASSIFICATION OF INFORMATION DISORDER
177 KHAZANAH RESEARCH INSTITUTE
Across all information disordered tweets, topic 2 has a mean γ-value close to zero. This means
that a tweet with low to almost zero γ-value of topic 2 is a necessary factor for information
disorder . The mean γ distribution for “spreading rumours”, “intent to harm” and “expressing
hate” is almost identical except with higher values for topics 4 and 5 for “intent to harm”. The
reason for the similarity could be attributed to the fact that the tweets that fall under these
categories tend to be labelled together. “Falseness” has a slight difference (topic 5 being slightly
higher than the rest); this is because people tweeting false information might have done so
without ill intentions. “Inciting violence” distribution shows a great disparity between topics 1
and 5 and with topic 2. The magnitude of mean γ-value for topic 5 is slightly above 0.4, topic 1
slightly above 0.3 and topic 2 almost zero.
Compared with “no information disorder” tweets, it seemed that the harmful category of tweets
is linked with low mean γ-values for topic 2, and high γ-values for topics 1 and 5. High mean γ-
values for topic 4 seemed to be linked closely with falseness and misinformation as it registered
lower γ-values for “inciting violence”.
However, topic 3’s role in classifying information disorder remains ambiguous as it is almost the
same across all categories. The vast difference between the mean γ-values of different topics
shows that we can establish some distinction between the tweets using topic modelling via LDA.
While the results above do not show a one-to-one relationship between human assessments and
natural language processing, the results suggest that there is a way to cluster information
disorder using the various techniques documented here.
From our analysis, there is a clear difference in the semantic structure in sentences based on the
bag-of-words model between different types of information disorder categories we have
established in our earlier discussion. Tweet–topic distribution showed the algorithm’s ability via
LDA to detect semantic resemblance between different types of information disordered tweets.
By describing the semantic structure of information disorder , the description may be further
studied to better inform human assessments of information disorder .
7.5.7. Further improvements with more data and research
While our computational methods show promising results to detect information disorder in
tweets, the next step to increase the efficiency for information disorder detection is through the
use of sentiment analysis. Sentiment analysis analyses people’s opinions, sentiments, evaluations,
attitudes and emotions from written language452.
452 Liu (n.d.)

CHAPTER 7
DIGITAL GOVERNANCE: CLASSIFICATION OF INFORMATION DISORDER
KHAZANAH RESEARCH INSTITUTE 178
The core of sentiment analysis is the sentiment lexicon (a library of words with an attached
sentiment rating). There are a few accessible lexicons available for non-commercial use such as
the NRC Word-Emotion Lexicon Association453, the Bing lexicon454 and the AFINN lexicon455; all,
however, are in English. The development of an easily accessible sentiment library in Bahasa
Melayu is therefore an important element of mining opinions in Malay that could enable further
opinion-based analysis to be conducted. Further research in sentiment analysis could prove to be
useful for our study.
Our LDA analysis results are encouraging, although more data would allow for higher quality of
results. Due to our limited access to Twitter APIs, we were only able to access just over 2,000
tweets, with nearly half of them irrelevant to the subject of our study. A larger data set can
contribute to a greater number of topics from LDA, giving us greater clarity in the distinctions
between the topics.
While language is essential for information dispersion, there are also other important internet
media besides text for the spread of information: most notably images, videos and audio. Further
research in natural language processing, image processing, speech recognition and computer
vision is needed to approach misinformation from different prongs of data analytics. The reason
we could perform great analysis on language is because of its highly structured nature.
Developing detection models of unstructured data such as images and videos of fake news are
future areas to explore.
Policy considerations
The way we live and function in society is intrinsically tied to the use of language. The acceleration
and democratisation of communication in a highly digitalised world has revealed several
vulnerabilities in the social fabric of countries and communities. While there are many policy
considerations, this chapter focuses only on four policy recommendations which we believe could
have the largest effects in combating information disorder .
7.6.1. Vulnerabilities emerging from a digitalised society can be addressed with
Augmented Intelligence
Firstly, without a means to first classify information disorder, it would be extremely difficult to
detect and measure its spread on social media. For example, the Mueller Report456 highlights
evidence of Russian involvement in US elections using social media as a tool to spread
mis/dis/malinformation. This reveals the threat that social media may pose to a functioning
democracy. Without a means to classify information disorder, there is no means to even detect
activities such as disinformation campaigns. Our democracy is left vulnerable to manipulation
from both inside or outside the country.
453 Saif Mohammad and Turney (2012) 454 Liu (2010) 455 Nielsen (2011) 456 Mueller (2019)

CHAPTER 7
DIGITAL GOVERNANCE: CLASSIFICATION OF INFORMATION DISORDER
179 KHAZANAH RESEARCH INSTITUTE
However, with millions of tweets, Facebook posts and other user generated media produced
every day, the prospects of having humans to go through and label them manually would be futile.
Moreover, our case study indicates that while humans are able to consistently identify the
presence of information disorder with respect to factual claims, the identification of “intent”
proves to be more inconsistent.
The analysis from topic modelling indicates that LDA distinguishes factual claims and non-factual
claims in similar ways when compared to human assessments. This has two potential
implications:
1. LDA may be employed to statistically generate “features” of information disorder . These
statistical features can then be employed as a filter to detect the presence of information
disorder on a real time basis.
2. The use of LDA as a decision filter to first pre-select questionable media on social media
platforms can potentially simplify the workload of fact-checkers.
Vulnerabilities emerging from a digitalised society require digitalised tools that can augment
human decision making. Big data analytics have the potential to access different segments of
society tweeting about the same news trend. Detailed data collection from social media—
voluntary surveys of user information such as residence, income level and education level—can
allow future research to identify some key correlating factors that contribute to vulnerabilities
towards misinformation and fake news. Big data analytics will allow us to study social trends with
real time detailed data sets—which also comes with the need to invest in computer hardware
infrastructure as well as the human capital that could design and manage sophisticated
algorithmic models in a relatively short amount of time.
7.6.2. Principles of objective fact-checking
Secondly, the role that reporters and journalists play in being the “fourth pillar of democracy” has
been eroded by the advent of social media. Most Malaysians now heavily rely on Facebook and
other social media platforms as their main news source457. Reporters and journalists are held to
a set of standards when discharging their duties—they can also be sued and be held accountable
for what they publish. Meanwhile, the advent of social media platforms has democratised the
powers previously held by reporters and journalists, without the corresponding responsibilities
of holding to standards of publishing. Reporters and journalists no longer have monopoly in
gatekeeping the diffusion of information in this day and age.
As pointed out by Harris and Farlina (2020), there are many weaknesses with regard to
Sebenarnya.my’s effectiveness. For example, Sebenarnya.my relies a lot on “tips” and has a heavy
emphasis on government agencies as a source of truth. It does not have a robust fact-checking
environment in which a diverse membership can contribute towards better fact-checking a
certain media.
457 Vase.ai (2019)

CHAPTER 7
DIGITAL GOVERNANCE: CLASSIFICATION OF INFORMATION DISORDER
KHAZANAH RESEARCH INSTITUTE 180
While government efforts and intentions to combat information disorder have been observed in
this pandemic, the means through which “questionable media” is classified is not clear. Harris and
Farlina (2020) also highlight that the proximity of Sebenarnya.my to authorities could undermine
the perceived validity of their exercise, should trust in government erode.
The International Fact-Checking Network (IFCN)458 outlines the following principles that are
foundational to fact-checking:
1. A commitment to Non-Partisanship and Fairness: Claims are fact-checked using the
same standards for every fact-check. All sides are taken into account. Evidence dictates
conclusions.
2. A commitment to Standards and Transparency of Sources: All sources are published
so that readers are able to verify and externally validate the findings.
3. A commitment to Transparency of Funding and Organisation: Fact-checkers reveal
their source of funding, qualifications and affiliations.
4. A commitment to Standards and Transparency of Methodology: Fact-checkers explain
the methodology that they use to select, research, write, edit, publish and correct their
fact-checks.
5. A commitment to an Open and Honest Corrections Policy: Fact-checkers publish their
corrections policy, correct clearly and transparently in line with the policy.
In this regard, the perceived trustworthiness of Sebenarnya.my could be improved by making
some or all of these dimensions explicit. The goal of making this information accessible is to
indicate to readers that fact-checkers are credible individuals, that perform fact-checking in a
non-biased way, using a consistent method to arrive at conclusions.
7.6.3. Civic responsibilities of handling information disorder
Thirdly, lies may spread much faster, deeper and wider compared to truth. In a mass study459
which looked at 126,000 verified stories tweeted by over 3 million people, from the inception of
twitter in 2006 to 2017:
1. Truth rarely diffused to more than 1,000 people, while the top 1% of false-news cascaded
to between 1,000 and 100,000 people.
2. Truth took about six times as long as falsehood to reach 1,500 people, and 20 times as
long to reach a cascade depth460 of 10.
3. Truth never exceeded a cascade depth of 10, while falsehood reached a depth of 19 which
is nearly 10 times faster.
458 Poynter (n.d) 459 Vosoughi, Roy, and Aral (2018) 460 Cascade depths refer to independent sharing of unbroken retweet chains with a common, singular origin.

CHAPTER 7
DIGITAL GOVERNANCE: CLASSIFICATION OF INFORMATION DISORDER
181 KHAZANAH RESEARCH INSTITUTE
While not explicitly studied in this chapter461, the characteristics of falsehood diffusion brings into
question the role that Sebenarnya.my and other government initiatives play in combating
information disorder in Malaysia. In particular, even if Sebenarnya.my can hypothetically detect
and classify all “compromised” media, the dissemination of its results might not be as deep, as
wide or as fast as the spreading of “false news”, whose damage might have already been done by
the time they are categorised as false.
In an ideal world, to effectively combat the spread of false news, the results of fact-checking have
to be seen by all individuals who have potentially viewed the false news. To inch closer to this
ideal, Sebenarnya.my has to be empowered to work together with social media platforms to first
flag false news and to disseminate the results of the fact-checking exercise in a timely manner to
all platform users who might have viewed or interacted with questionable media.
Recently in the 2020 US elections, Twitter took action to censor tweets with false information
regarding the election462 by inserting a disclaimer notifying users that the content of a tweet may
be disputed. In the extreme case, Twitter went as far as to remove President Trump’s Twitter
account. Twitter’s role in regulating social media is the result of multiple collaborations with
various news agencies from all over the political spectrums: from Fox News to CNN to Associated
Press (a non-partisan not-for-profit news agency). Therefore, regulating social media content
requires a decentralised responsible collaboration from a diverse set of bodies (such as
government, civil societies and private sectors).
7.6.4. Digital and online media literacy
Regulating information and fact-checking are highly reliant on the choices that people make
whether to believe or disbelieve the information that is presented to them. The spread of
misinformation at the end of the day is the result of willing actors propagating the message463.
Therefore, combating misinformation should also factor in user participation—which can be
approached from two paths: critical thinking and institutional trust.
Digital literacy and the ability to discern false information on the internet requires critical
thinking and source evaluation. Therefore, civic education in schools and in public should
emphasise the role of individuals in society and their responsibilities to be informed citizens.
School curriculums should prioritise the role of critical thinking in education. In 2015, Stanford
History Education ran a study of under-resourced schools in Los Angeles and Minneapolis
suburbs and found that the student’s ability to reason from online information is “bleak”464.
Introducing online literacy educational programmes in schools and to the wider general public
especially underserved communities is a way forward to foster an online-intelligent society.
461 We intend to study this phenomena in a future publication. 462 Gadde and Kayvon Beykpour (2020) 463 Marwick (2018) 464 Wineburg and McGrew (2016)

CHAPTER 7
DIGITAL GOVERNANCE: CLASSIFICATION OF INFORMATION DISORDER
KHAZANAH RESEARCH INSTITUTE 182
Reducing the trust gap among people and government institutions is crucial to minimise the effect
of information disorder. Low institutional trust was shown to have an effect in the lower
likelihood to adopt preventative behaviours during the 2018 Ebola outbreak in Eastern Congo465.
The study showed that greater institutional mistrust is correlated with widespread
misinformation (belief that Ebola was not real was prevalent) causing behaviours such as refusal
to vaccinate or seek medical assistance and lower compliance to messages from authorities,
increasing the risk of spread of the Ebola virus. Therefore, public confidence in institutions is
essential to stem the prevalence of information disorder and minimising its harmful real-world
effects.
In Malaysia, a 2020 study by Ipsos found that 59% of Malaysians do not trust the government466.
Although decreasing that trust gap is not within the scope of the study, one of the ways to improve
government trust is to improve e-government facilities467. Several areas of e-government
facilities need to be re-evaluated to rebuild institutional-based trust and process-based trust
through commitment to transparency, efficiency and grassroots participation. There is an urgent
need for stronger collaboration and relationship between the government and its people. Closing
the trust gap contributes to the effectiveness for authorities to spread important information
without becoming fake news.
Conclusion
“The problems are solved, not by giving new information, but by arranging what we have
known since long.” – Ludwig Wittgenstein468
Digitalisation has transformed the dynamics by which information is curated and diffused.
Consumers of media are no longer just passive recipients but also curators of information, thus
setting the landscape of public opinion formation in society. In this chapter, we have shown how
information disorder emerging from a digitalised society can be addressed with digital tools.
In a digitalised society, there is a growing need to be able to quantify and classify information
disorder. Our research compared human assessments against computational approaches,
specifically unsupervised learning using Latent Dirichlet Allocation (LDA). Evidence from our
experiment indicates that humans are better able to classify content than they are to classify
intent. We also found that computational approaches can augment the human effort to classify
information disorder.
465 Vinck et al. (2019) 466 Ipsos (2020) 467 Tolbert and Mossberger (2006) 468 Original: Wittgenstein (1921), translation: Wittgenstein (2009)

CHAPTER 7
DIGITAL GOVERNANCE: CLASSIFICATION OF INFORMATION DISORDER
183 KHAZANAH RESEARCH INSTITUTE
However, computational approaches alone are not enough to combat information disorder. While
some countries favour censorship as a blanket approach to combat information disorder, we
propose that information disorder might be better addressed with greater transparency instead.
As information disorder thrives in an environment of opacity and malicious intent, we call for,
among other things, a more rigorous fact-checking ecosystem underpinned by IFCN’s Code of
Principles that represents the discipline of approaching a view in an independent, transparent
and objective way.

CHAPTER 7
DIGITAL GOVERNANCE: CLASSIFICATION OF INFORMATION DISORDER
KHAZANAH RESEARCH INSTITUTE 184
References
Bakshy, E., S. Messing, and L. A. Adamic. 2015. “Exposure to Ideologically Diverse News and Opinion on Facebook.” Science 348 (6239):1130–32. https://doi.org/10.1126/science.aaa1160.
Blei, David M., Andrew Y. Ng, and Michael I. Jordan. 2003. “Latent Dirichlet Allocation.” Journal of Machine Learning Research 3 (Jan):993–1022.
Caroline Tolbert and Karen Mossberger. 2006. “The Effects of E-Govenment on Trust and Confidence in Government.” Public Adminstration Review, May, 354–69.
DOS. 2020. “Current Population Estimates, Malaysia, 2020.” July 15, 2020. https://www.dosm.gov.my/v1/index.php?r=column/cthemeByCat&cat=155&bul_id=OVByWjg5YkQ3MWFZRTN5bDJiaEVhZz09&menu_id=L0pheU43NWJwRWVSZklWdzQ4TlhUUT09.
Gadde, Vijaya and Kayvon Beykpour. 2020. “Additional Steps We’re Taking Ahead of the 2020 US Election.” Social Media. Twitter (blog). November 12, 2020. https://blog.twitter.com/en_us/topics/company/2020/2020-election-changes.html.
Harris, Zainul, and Said Farlina. 2020. The COVID-19 Infodemic in Malaysia. Policy Paper. Institute of Strategic and International Studies Malaysia. https://www.isis.org.my/2020/08/24/the-covid-19-infodemic-in-malaysia-scale-scope-and-policy-responses/.
Ho, Gregory, and Ismail, Suraya. 2020. “Are Both the B40 and M40 ‘Poor’? Evidence from an Intergrated Income-Expenditure Analysis.” Khazanah Research Institute, License: Creative Commons Attribution CC BY, February.
Ipsos. 2020. “Do Malaysians Lack Trust in Government and Institutions?” Press Release. Kuala Lumpur, Malaysia: Ipsos Sdn Bhd.
Ireton, Cherilyn, and Julie Posetti. 2018. Journalism, Fake News & Disinformation: Handbook for Journalism Education and Training. UNESCO Publishing. https://books.google.com.my/books?hl=en&lr=&id=wW5vDwAAQBAJ&oi=fnd&pg=PA5&dq=journalism+fake+news+and+&ots=UYh6Ug61EG&sig=ZHq9kcy6JHX92rdkHxEnBjALljQ&redir_esc=y#v=onepage&q=journalism%20fake%20news%20and&f=false.
Liu, Bing. 2010. “Sentiment Analysis and Subjectivity.” In Handbook of Natural Language Processing, Second, 629–61. Machine Learning and Pattern Recognition Series. Cambridge, UK: CRC Press.
———. n.d. Sentiment Analysis and Opinion Mining. Syntheis Lectures on Human Language Technologies 16. Morgan and Claypool Publishers.
“Managing the COVID-19 Infodemic: Promoting Healthy Behaviours and Mitigating the Harm from Misinformation and Disinformation.” n.d. Accessed October 20, 2020. https://www.who.int/news/item/23-09-2020-managing-the-covid-19-infodemic-promoting-healthy-behaviours-and-mitigating-the-harm-from-misinformation-and-disinformation.
Marwick, Alice E. 2018. “Why Do People Share Fake News? A Sociotechnical Model of Media Effects.” Georgetown Law Technology Review 2 (2):474–512.
McLuhan, Marshall, and Quentin Fiore. 1967. “The Medium Is the Message.” New York 123:126–28.
McLuhan, Marshall, and MARSHALL AUTOR MCLUHAN. 1994. Understanding Media: The Extensions of Man. MIT press.
MCMC. 2019. “Internet Users Survey 2018.” Annual Survey 1823–2523. Malaysia: MCMC. https://www.mcmc.gov.my/skmmgovmy/media/General/pdf/Internet-Users-Survey-2018.pdf.
Mitra, Tanushree, and Eric Gilbert. 2015. “Credbank: A Large-Scale Social Media Corpus with Associated Credibility Annotations.” In ICWSM, 258–67.

CHAPTER 7
DIGITAL GOVERNANCE: CLASSIFICATION OF INFORMATION DISORDER
185 KHAZANAH RESEARCH INSTITUTE
MOH. 2020. “KKM Portal MyHealth on Twitter.” Social Media. Twitter. 2020. https://twitter.com/MyHEALTHKKM/status/1235880123384991744.
Morales, Alfredo Jose, Javier Borondo, Juan Carlos Losada, and Rosa M. Benito. 2015. “Measuring Political Polarization: Twitter Shows the Two Sides of Venezuela.” Chaos: An Interdisciplinary Journal of Nonlinear Science 25 (3). AIP Publishing LLC:033114.
Mueller, Robert S. 2019. The Mueller Report: Report on the Investigation into Russian Interference in the 2016 Presidential Election. WSBLD.
Ngah, Nazura. 2018. “FAQs: What You Need to Know about the Anti-Fake News Bill 2018.” NST Online. March 26, 2018. https://www.nst.com.my/news/nation/2018/03/349691/faqs-what-you-need-know-about-anti-fake-news-bill-2018.
Nielsen, Finn. 2011. “A New ANEW: Evaluation of a Word List for Sentiment Analysis in Microblogs.” ArXiv, Making Sense of Microposts, Making Sense of Microposts (1):6.
Poynter. n.d. “IFCN Code of Principles.” n.d. https://www.ifcncodeofprinciples.poynter.org/know-more/the-commitments-of-the-code-of-principles.
Rio, Victoire. 2020. “The Role of Social Media in Fomenting Violence: Myanmar.” Policy Brief No.78. Policy Brief. Tokyo: Toda Peace Institute. https://toda.org/assets/files/resources/policy-briefs/t-pb-78_victoire-rio_role-of-social-media-in-fomenting-violence-myanmar.pdf.
Saif Mohammad, and Peter Turney. 2012. “Crowdsourcing a Word-Emotion Association Lexicon.” Computational Intelligence, September.
Sarawak Report. 2020. “EXCLUSIVE - Health Rules Demand PM8 And All Co-Conspirators Must Immediately Self-Isolate For 14 Days?” Sarawak Report. March 1, 2020. http://www.sarawakreport.org/2020/03/health-rules-demand-pm8-and-all-co-conspirators-must-immediately-self-isolate-14-days/.
Sarkar, Dipanjan. 2016. “Text Analytics with Python.” Springer. Sen, Amartya Kumar. 1999. “Democracy as a Universal Value.” Journal of Democracy 10 (3). Johns
Hopkins University Press:3–17. Tumin, Siti Aiysyah. 2020. “Firms: Survival in Times of Crisis.” Khazanah Research Institute,
License: Creative Commons Attribution CC BY, March 27, 2020. UN. 2019. “United Nations Strategy and Plan of Action on Hate Speech.” Strategy Paper. United
Nations. https://www.un.org/en/genocideprevention/documents/UN%20Strategy%20and%20Plan%20of%20Action%20on%20Hate%20Speech%2018%20June%20SYNOPSIS.pdf.
Vase.ai. 2019. “Malaysia’s 2019 Media Consumption Report.” Learning Resources | Vase Actionable Intelligence. September 6, 2019. https://vase.ai/resources/malaysias-media-consumption-2019/.
Vinck, Patrick, Phuong N. Pham, Kenedy K. Bindu, Juliet Bedford, and Eric J. Nilles. 2019. “Institutional Trust and Misinformation in the Response to the 2018–19 Ebola Outbreak in North Kivu, DR Congo: A Population-Based Survey.” The Lancet Infectious Diseases 19 (5). Elsevier:529–36.
Vosoughi, Soroush, Deb Roy, and Sinan Aral. 2018. “The Spread of True and False News Online.” Science 359 (6380). American Association for the Advancement of Science:1146–51. https://doi.org/10.1126/science.aap9559.
Wardle, Claire, and Hossein Derakhshan. 2017. “Information Disorder: Toward an Interdisciplinary Framework for Research and Policymaking.” Council of Europe report DGI. https://rm.coe.int/information-disorder-toward-an-interdisciplinary-framework-for-researc/168076277c.
Wineburg, Sam, and Sarah McGrew. 2016. “Evaluating Information: The Cornerstone of Civic Online Reasoning.” Stanford History Education Group, Robert R. McCormick Foundation.

CHAPTER 7
DIGITAL GOVERNANCE: CLASSIFICATION OF INFORMATION DISORDER
KHAZANAH RESEARCH INSTITUTE 186
Wittgenstein, Ludwig. 1921. “Logisch-Philosophische Abhandlung.” Annalen Der Naturphilosophie 14:185–262.
———. 2009. Philosophical Investigations. John Wiley & Sons. Wittgenstein, Ludwig, and Luiz Henrique Lopes dos Santos. 1994. Tractatus Logico-Philosophicus.
Edusp. Wu, Liang, Fred Morstatter, Kathleen M. Carley, and Huan Liu. 2019. “Misinformation in Social
Media: Definition, Manipulation, and Detection.” ACM SIGKDD Explorations Newsletter 21 (2). ACM New York, NY, USA:80–90. https://doi.org/10.1145/3373464.3373475.
187 KHAZANAH RESEARCH INSTITUTE
CHAPTER
08
ARTIFICIAL INTELLIGENCE IN THE COURTS: AI SENTENCING IN SABAH AND SARAWAK
8.1 Introduction 188
8.2 Bias 189
8.2.1 Training data 189
8.2.2 Software development 191
8.2.3 Definition of subjective concepts, e.g. fairness 191
8.3 Lack of Transparency and Accountability 192
8.4 The Justice Code 192
8.4.1 Primacy of law/flexibility of the common law to make changes 193
8.4.2 Right to a fair trial 193
8.5 Responsible AI development 193
8.5.1 Collaboration between users and software developers 194
8.5.2 Stakeholder consultations 194
8.5.3 Continuous improvements to the system 194
8.5.4 Development of ethical frameworks 194
8.6 Conclusion 195
References 196

KHAZANAH RESEARCH INSTITUTE 188
ARTIFICIAL INTELLIGENCE IN THE COURTS: AI SENTENCING IN
SABAH AND SARAWAK469
By Claire Lim and Rachel Gong
“First Law—A robot may not injure a human being or, through inaction, allow a human
being to come to harm. Second Law—A robot must obey the orders given it by human beings
except where such orders would conflict with the First Law. Third Law—A robot must
protect its own existence as long as such protection does not conflict with the First or Second
Laws.”
Isaac Asimov470
Introduction
The Covid-19 pandemic has accelerated the need for many industries to undertake digital
transformation. Even the traditionally conservative judicial system has embraced the new
normal, for example, by holding court trials online471. However, adapting to technological change
is not foreign to the Malaysian judiciary. Earlier this year, even before the pandemic forced
industries to embrace digital transformation, the Sabah and Sarawak courts launched a pilot
artificial intelligence (AI) tool472 as a guide to help judges with sentencing decisions.
AI refers to machines which are able to make decisions with human-like intelligence and tackle
tasks that are arduous to do manually. It is important to note the distinction between predictive
statistical analysis and machine learning-based AI. Predictive statistical analysis uses historical
data to find patterns in order to predict future outcomes; it requires human intervention to query,
make assumptions and test the data473. Machine learning-based AI is able to make assumptions,
learn and test autonomously474.
In recent years, although there has been much hype about the rise of AI transforming industries
to improve efficiency and productivity, some of these systems actually fall within data analytics
or predictive analytics rather than true machine learning-based AI. The Sabah and Sarawak
courts’ tool at present falls more within the category of predictive statistical analysis, but aims to
move towards machine learning-based AI.
469 An earlier version of this chapter authored by Claire Lim and Rachel Gong was published by KRI on 18 August 2020
as a Views piece titled “Artificial Intelligence in the Courts: AI sentencing in Sabah and Sarawak”. 470 Asimov (1942) 471 Khairah N. Karim (2020) 472 Wong (2020) 473 Wade et al. (2020) 474 Reavie (2018)

CHAPTER 8
ARTIFICIAL INTELLIGENCE IN THE COURTS: AI SENTENCING IN SABAH AND SARAWAK
189 KHAZANAH RESEARCH INSTITUTE
The impetus behind this recent push to utilise AI in the court system is to achieve greater
consistency in sentencing. The AI tool is currently being trialled on two offences: drug possession
under Section 12(2) of the Dangerous Drug Act and rape under Section 376(1) of the Penal Code.
The algorithm analyses data from cases of these two offences which are registered in Sabah and
Sarawak between 2014 and 2019, identifies patterns which it will apply to the present case and
produces a sentencing recommendation that judges can choose to adopt or deviate from.
According to the courts, the reason behind choosing s12(2) of the Dangerous Drug Act and
s376(1) of the Penal Code for the pilot is that the dataset for those two offences is the richest
dataset that they have.
As with any new technology, the development of AI’s tremendous potential has to be
counterbalanced against certain risks. An analysis of cases which used AI sentencing tool as at 29
May 2020 shows that judges followed the recommendation in approximately 33% of cases475.
This chapter discusses the risks of bias and lack of transparency and accountability that surround
AI and considers mitigating measures to address these risks with reference to the Sabah and
Sarawak courts’ AI sentencing tool.
Bias
8.2.1. Training data
Machines are generally assumed to be objective. However, a major concern with AI is its potential
to replicate and exaggerate bias. Experiments with AI technology such as Microsoft’s Tay476 and
Google’s autocomplete suggestions477 which rely on human engagement for input data show that
machines are not immune to society’s prejudices. Tay, a Twitter chatbot, was corrupted in hours
by users who flooded it with misogynistic and racist posts and began putting out its own offensive
posts. Google’s offensive autocomplete predictions were based on actual searches entered into its
searchbox. A popular phrase to describe this phenomenon is “garbage-in, garbage out” i.e. an AI
system is only as good as the data that it is trained on.
Amazon’s recruiting tool478 which was trained on historical recruitment data consistently
downgraded female candidates, consequently perpetuating existing gender bias. In effect, “we
can’t expect an AI algorithm that has been trained on data that comes from society to be better
than society – unless we’ve explicitly designed it to be”479.
475 The authors gratefully acknowledge the case data statistics as provided by the courts of Sabah and Sarawak. Exact
case numbers were not available for release at the time of writing. 476 Vincent (2016) 477 Lapowsky (2018) 478 Vincent (2018) 479 Marr (2019)

CHAPTER 8
ARTIFICIAL INTELLIGENCE IN THE COURTS: AI SENTENCING IN SABAH AND SARAWAK
KHAZANAH RESEARCH INSTITUTE 190
Global efforts are ongoing to “cure automated systems of hidden biases and prejudices”480. In
2012, Project ImageNet played a key role in providing developers with a library of images to train
computers to recognise visual concepts. Scientists from Stanford University, Princeton University
and the University of North Carolina paid digital workers a small fee to label more than 14 million
images, creating a large dataset which they released to the public for free. While greatly advancing
AI development, researchers later found problems in the dataset, for example, an algorithm
trained on the dataset may identify a “programmer” as a white man because of the pool of images
labelled in that way. The ImageNet team set about analysing the data to uncover these biases and
took steps such as identifying words that projected a meaning on an image (e.g. “philanthropist”)
and assessing the demographic and geographic diversity in the image set. The effort showed that
algorithms can be re-engineered to be fairer.
A separate study was conducted by ProPublica on Correctional Offender Management Profiling
for Alternative Sanctions (COMPAS), a recidivism risk assessment algorithm used by the US courts
to aid in sentencing. The study criticised COMPAS as being racially biased against African-
Americans and argued that COMPAS was more likely to “falsely flag black defendants as future
criminals, wrongly labelling them this way at almost twice the rate as white defendants” and that
“white defendants were mislabelled as low risk more often than black defendants”. ProPublica’s
conclusions have since been rebutted by Northpointe (the makers of COMPAS) and various
academics481 who noted that the program “correctly predicted recidivism in both white and black
defendants at similar rates”482.
Bias has also been demonstrated in facial recognition AI tools. Despite Amazon, IBM and
Microsoft’s decisions to pause the sale of their facial recognition tools to US law enforcement483,
a Black man was wrongly arrested484 for a crime he didn’t commit because facial recognition had
identified him as the perpetrator.
Conscious of this risk of bias, the Sabah and Sarawak courts and their software developer
(Sarawak Information Systems Sdn Bhd, SAINS, a Sarawak state government-owned company)
held stakeholder consultations during the development process to identify prominent concerns.
For example, stakeholders were concerned that the “race” variable might create bias in future
sentencing decisions, so the courts made the decision to remove the variable from the algorithm
as it was not a significant factor in the sentencing process.
Such mitigating measures are valuable, but they do not make the system perfect. A dataset of five
years of cases seems somewhat limited in comparison with the extensive databases used in global
efforts such as Project ImageNet. Furthermore, it is unclear whether the removal of the race
variable from the algorithm has any significant effect on its recommendations.
480 Knight (2019) 481 Flores, Bechtel, and Lowenkamp (2016) 482 Yong (2018) 483 Heilweil (2020) 484 Allyn (2020)

CHAPTER 8
ARTIFICIAL INTELLIGENCE IN THE COURTS: AI SENTENCING IN SABAH AND SARAWAK
191 KHAZANAH RESEARCH INSTITUTE
8.2.2. Software development
AI training data is not the only place where bias can occur. It is very difficult to strip human bias
from algorithms themselves485, partly because it still requires humans to develop them. Bias can
creep in at any stage. One of the earliest instances is at the problem structuring stage486 where,
when creating a deep learning model, computer scientists need to decide what they want the
model to achieve, and the parameters set by the scientists may reflect their intentions or
subconscious prejudices.
To mitigate this, SAINS has worked collaboratively with the Sabah and Sarawak judiciary to test
the results of the AI sentencing tool. During the development process, the judiciary analysed the
recommendations produced by the AI tool and debated whether they would have reached the
same conclusions. This helped the software developers, who have no legal training, understand
the needs of the legal system and make changes to the AI algorithm accordingly. SAINS and the
Sabah and Sarawak judiciary have emphasised that this learning, consultative and collaborative
process is an ongoing one as they seek to make further improvements to the AI tool.
8.2.3. Definition of subjective concepts, e.g. fairness
Another AI challenge that the MIT Technology Review has identified is the difficulty of defining
fairness in mathematical terms487. Other commentators488 have suggested that at the heart of the
debate is the ethical question of what it means for an algorithm to be fair, and the mathematical
limits to how fair an algorithm can ever be.
The Sabah and Sarawak courts’ AI tool also raises similar concerns with the definition of
subjective matters into quantifiable, mathematical terms. For example, one of the variables in the
AI tool is whether the victim in a rape case has “suffered psychological distress”. It is arguable
that all rape victims suffer psychological distress, but in varying degrees. However, the AI tool’s
algorithm only recognises the binary inputs of “yes” or “no”. This highlights the clash of applying
mathematical principles to the law where nuances and subtleties in individual cases are very
important. Recognising these weaknesses in AI, the Sabah and Sarawak judiciary has thus far only
used the AI tool as a guideline; judges make the final sentencing decision.
An analysis of the cases heard in Sabah and Sarawak as at 29 May 2020 shows that judges
departed from the AI sentencing recommendation in 67% of the cases. Reasons for deviation
included accounting for mitigating factors which the algorithm had not been designed to consider
and the recommended sentence not being considered a strong enough deterrent. This highlights
the limitations of an algorithm and indicates that the human element is still needed in sentencing.
485 Knight (2019) 486 Hao (2019) 487 Hao (2019) 488 Corbett-Davies et al. (2016)

CHAPTER 8
ARTIFICIAL INTELLIGENCE IN THE COURTS: AI SENTENCING IN SABAH AND SARAWAK
KHAZANAH RESEARCH INSTITUTE 192
Lack of Transparency and Accountability
Humans find it hard to explain their subconsciously biased decisions, and machines which make
biased decisions are even “less visible and less open to correction”489. AI has an issue with
transparency—the “black box” problem where the actual mechanics within the box cannot be
observed. Machine learning models often build complex models based on large datasets, so that
their eventual conclusions may be unexplainable as they cannot be attributed to any specific
factors or combination of factors.
Deep Patient, a programme used at a New York hospital, proved to be “incredibly good”490 at
predicting disease without expert instruction, including psychiatric disorders which are difficult
for physicians to anticipate. Its creators are unable to explain how it does this. This has serious
consequences, for example, if an AI is unable to explain why it provided a higher sentence for
offenders of certain ethnicities, or if a bank loan was rejected for no clear reason. This could be
exacerbated by companies using the shield of proprietary information to prevent researchers
from accessing details of how the algorithm works. For AI to move towards safe mainstream
usage, it needs to be more understandable and accountable to its creators and users so that
potentially life-changing actions resulting from AI can be justified.
This black box problem exists with the Sabah and Sarawak courts’ AI tool. The software
developers are unable to predict and explain how the algorithm derives certain patterns, why the
algorithm attaches more weightage to one variable over another and, consequently, the reasoning
behind the eventual recommendation. Thus, the collaborative and consultative process between
the judiciary and software development team becomes even more important. The algorithm can
be tested and tweaked until it consistently produces recommendations that the judiciary would
independently arrive at, but this iterative process is more likely to be driven by trial and error
than a reasoned understanding of what variables to weight.
To increase accountability, the Sabah and Sarawak judiciary have a standard operating procedure
(SOP) in place to regulate the way in which each judge responds to the recommendations. For
example, judges have to provide their reasoning for why they decided to adopt or deviate from
the AI tool’s recommendation in their judgment decisions. At this stage, it is difficult to ascertain
how comprehensive this SOP is as it is not publicly available.
The Justice Code
These risks of bias and lack of transparency and accountability exist in any industry implementing
AI, but several fundamental principles of the legal system give rise to unique challenges in using
AI.
489 Vincent (2018) 490 Knight (2017)

CHAPTER 8
ARTIFICIAL INTELLIGENCE IN THE COURTS: AI SENTENCING IN SABAH AND SARAWAK
193 KHAZANAH RESEARCH INSTITUTE
8.4.1. Primacy of law/flexibility of the common law to make changes
As AI tools become more widespread, there is a risk that they “may even transcend the act of
judging and affect essential functioning elements of the rule of law and judicial systems”491. This
is because the common law system practised by Malaysia relies on flexibility in the courts to carry
out case-by-case reasoning to adapt dynamically to changing needs, and not be bound by
precedent if there is good reason to deviate. The EU Charter emphasises that in common law
systems, “[l]egal rules therefore do not evolve in a linear fashion, distinguishing them from
empirical laws…in legal theory, two contradictory decisions can prove to be valid if the legal
reasoning is sound”492.
The Sabah and Sarawak judiciary takes the view that the AI tool is compatible with the principles
of sentencing because it incorporates the thought process of sentencing in its parameters, for
example, accounting for previous criminal convictions. However, it is important to consider the
extent to which AI sentencing recommendations may neglect individual mitigating or aggravating
circumstances.
8.4.2. Right to a fair trial
All parties in a case have a right to a fair trial and any new technology introduced must be
compatible with this fundamental right. The way the Sabah and Sarawak’s AI tool is used in
practice is that when the accused has decided to plead guilty, the court will make the involved
parties aware that the AI tool will be used to provide a sentencing recommendation. It is stressed
that this is merely a recommendation and that parties are invited to submit alternative sentencing
suggestions upon hearing the recommendation. The judge then decides whether or not to follow
the recommendation and will provide a brief explanation for his/her decision.
During the first case where the AI was used, the accused’s lawyer mounted a constitutional
challenge493 against its use arguing that the recommendation may influence the court’s decision
despite its proposed function as a guideline. The judge noted the objection but proceeded with
the use of the AI tool, eventually passing a sentence that was more severe than the AI
recommendation. At the time of writing, the outcome of the challenge has not been finalised and
there is not enough information about the ease of appeals against the AI recommendation. More
data need to be gathered about the challenge/appeals process and its rates and outcomes.
Responsible AI development
In the absence of definite solutions to the bias and black box problems, it is important for
industries, not just the legal system, that wish to implement AI to properly monitor, evaluate and
eventually regulate their systems. Several mitigating measures undertaken by the Sabah and
Sarawak courts have been alluded to above and are elaborated upon below.
491 European Commission for the Efficiency of Justice (2018) 492 European Commission for the Efficiency of Justice (2018) 493 The Star (2020)

CHAPTER 8
ARTIFICIAL INTELLIGENCE IN THE COURTS: AI SENTENCING IN SABAH AND SARAWAK
KHAZANAH RESEARCH INSTITUTE 194
8.5.1. Collaboration between users and software developers
As demonstrated by the Sabah and Sarawak courts, there needs to be an ongoing consultative and
collaborative process between the AI users and the software development team. This is to ensure
that the software development team receives feedback on the challenges in the AI’s practical use
and that users will be more informed about its functionality, impact and limitations.
8.5.2. Stakeholder consultations
Stakeholder consultations should also be carried out to gather opinions and suggested
improvements to the algorithm. The Sabah and Sarawak courts carried out stakeholder
consultations with legal practitioners and legal association representatives during the
development of the pilot AI tool. These consultations are ongoing and are scheduled to occur
every 6 months. Arguably, wider scale consultations could be sought. In Canada, a national
consultation494 was launched to ensure that all citizens had the opportunity to have a say in the
country’s digital transformation.
8.5.3. Continuous improvements to the system
Resources need to be allocated to post-developmental monitoring and evaluation for continuous
human oversight. This is necessary to detect errors and improve accuracy in the algorithm.
There should also be an open and non-hierarchical organisational culture to encourage whistle-
blowers and enable fast reactions to problems reported in algorithmic development and
performance. The Sabah and Sarawak judiciary actively compile criticism and feedback on its AI
tool to help improve it further.
8.5.4. Development of ethical frameworks
A broad policy consideration is for computer science education syllabi to incorporate ethics495 as
an integral component to encourage developers to prioritise ethical concerns in parallel with
technical design.
Ethical standards and governance frameworks could also be set up within AI development teams
to prioritise transparency, fairness and accountability in designing and building algorithms. For
example, the EU has set up several principles that AI systems in the judicial system should be
designed in accordance with: (i) respect for fundamental rights and civil liberties (ii) non-
discrimination (iii) quality (iv) security, transparency, impartiality and fairness and (v) informed
user control496.
Guidelines could be drawn from The Partnership on AI497, a multi-stakeholder organisation
bringing together “academics, researchers, civil society organizations, companies building and
utilizing AI technology, and other groups working to better understand AI’s impacts”. It produces
thought leadership, insights, principles and frameworks on the latest developments of AI.
494 Government of Canada News Release (2018) 495 Grosz et al. (2019) 496 European Commission for the Efficiency of Justice (2018) 497 Partnership on AI: https://www.partnershiponai.org/

CHAPTER 8
ARTIFICIAL INTELLIGENCE IN THE COURTS: AI SENTENCING IN SABAH AND SARAWAK
195 KHAZANAH RESEARCH INSTITUTE
Conclusion
Despite its risks and limitations, digital transformation has the potential to bring about benefits
beyond increased efficiency or objectivity. The EU Charter provides the valuable guiding principle
that “[f]ar from being a simple instrument for improving the efficiency of judicial systems, AI
should strengthen the guarantees of the rule of law, together with the quality of public justice.” A
judge’s discretion remains crucial in Malaysia’s legal system. Cognisant of AI’s risks, outgoing
Chief Justice for Sabah and Sarawak Tan Sri David Wong stressed at the launch of the AI system
that it is meant to act purely as a guideline498. This is highlighted by the fact that judges still
deviated from the AI recommendation in 67% of cases. At this stage, the AI tool remains a
suggestion rather than a final decision.
It is hard to argue against the inevitability of widespread technological transformation of society.
As part of its digital transformation, Malaysia would benefit from digital governance policies to
enable the government to regulate the use of digital technologies; to help multiple sectors of
society to navigate risks and challenges—to say nothing of unintended outcomes—of
implementing these technologies; and to protect the public interest from their misuse. AI is just
one of the many areas that should be included in such digital governance policies.
498 Wong (2020)

CHAPTER 8
ARTIFICIAL INTELLIGENCE IN THE COURTS: AI SENTENCING IN SABAH AND SARAWAK
KHAZANAH RESEARCH INSTITUTE 196
References
Allyn, Bobby. 2020. “‘The Computer Got It Wrong’: How Facial Recognition Led To False Arrest of Black Man.” NPR, June 24, 2020. https://www.npr.org/2020/06/24/882683463/the-computer-got-it-wrong-how-facial-recognition-led-to-a-false-arrest-in-michig.
Asimov, Isaac. 1942. “The Runaround,” 1942. Corbett-Davies, Sam, Emma Pierson, Avi Feller, and Sharad Goel. 2016. “A Computer Program
Used for Bail and Sentencing Decisions Was Labeled Biased against Blacks. It’s Actually Not That Clear.” The Washington Post, October 17, 2016. https://www.washingtonpost.com/news/monkey-cage/wp/2016/10/17/can-an-algorithm-be-racist-our-analysis-is-more-cautious-than-propublicas/.
European Commission for the Efficiency of Justice. 2018. “European Ethical Charter on the Use of Artificial Intelligence in Judicial Systems and Their Environment.” Strasbourg: European Commission for the Efficiency of Justice. https://rm.coe.int/ethical-charter-en-for-publication-4-december-2018/16808f699c.
Flores, Anthony, Kristen Bechtel, and Christopher Lowenkamp. 2016. “False Positives, False Negatives, and False Analyses: A Rejoinder to ‘Machine Bias: There’s Software Used Across the Country to Predict Future Criminals. And It’s Biased Against Blacks.’” Federal Probation 80 (2). https://www.uscourts.gov/federal-probation-journal/2016/09/false-positives-false-negatives-and-false-analyses-rejoinder.
Government of Canada News Release. 2018. “Government of Canada Launches National Consultations on Digital and Data Transformation,” June 19, 2018. https://www.canada.ca/en/innovation-science-economic-development/news/2018/06/government-of-canada-launches-national-consultations-on-digital-and-data-transformation.html.
Grosz, Barbara, David Grant, Kate Vredenbrugh, Jeff Behrends, Lily Hu, Alison Simmons, and Jim Waldo. 2019. “Embedded EthiCS: Integrating Ethics Across CS Education.” Communications of the ACM, August 2019.
Hao, Karen. 2019. “This Is How AI Bias Really Happens—and Why It’s so Hard to Fix.” MIT Technology Review, February 4, 2019. https://www.technologyreview.com/2019/02/04/137602/this-is-how-ai-bias-really-happensand-why-its-so-hard-to-fix/.
Heilweil, Rebecca. 2020. “Big Tech Companies Back Away from Selling Facial Recognition to Police. That’s Progress.” Vox, June 11, 2020. https://www.vox.com/recode/2020/6/10/21287194/amazon-microsoft-ibm-facial-recognition-moratorium-police.
Khairah N. Karim. 2020. “Court of Appeal Goes Virtual for the First Time [NSTTV].” New Straits Times, April 23, 2020. https://www.nst.com.my/news/crime-courts/2020/04/586873/court-appeal-goes-virtual-first-time-nsttv.
Knight, Will. 2017. “The Dark Secret at the Heart of AI No One Really Knows How the Most Advanced Algorithms Do What They Do. That Could Be a Problem.” MIT Technology Review, April 11, 2017. https://www.technologyreview.com/2017/04/11/5113/the-dark-secret-at-the-heart-of-ai/.
———. 2019. “AI Is Biased. Here’s How Scientists Are Trying to Fix It.” Wired, December 19, 2019. https://www.wired.com/story/ai-biased-how-scientists-trying-fix/.
Lapowsky, Issy. 2018. “Google Autocomplete Still Makes Vile Suggestions.” Wired, February 12, 2018. https://www.wired.com/story/google-autocomplete-vile-suggestions/.
Marr, Bernard. 2019. “Artificial Intelligence Has A Problem With Bias, Here’s How To Tackle It.” Forbes, January 29, 2019. https://www.forbes.com/sites/bernardmarr/2019/01/29/3-steps-to-tackle-the-problem-of-bias-in-artificial-intelligence/#1306d00a7a12.

CHAPTER 8
ARTIFICIAL INTELLIGENCE IN THE COURTS: AI SENTENCING IN SABAH AND SARAWAK
197 KHAZANAH RESEARCH INSTITUTE
Reavie, Vance. 2018. “Do You Know The Difference Between Data Analytics And AI Machine Learning?” Forbes. August 1, 2018. https://www.forbes.com/sites/forbesagencycouncil/2018/08/01/do-you-know-the-difference-between-data-analytics-and-ai-machine-learning/.
The Star. 2020. “Coded Justice: Courts Start Use of AI to Aid Sentencing, Lawyer Claims It Is Unconstitutional,” February 19, 2020. https://www.thestar.com.my/news/nation/2020/02/19/coded-justice-courts-start-use-of-ai-to-aid-sentencing-lawyer-claims-it-is-unconstitutional.
Vincent, James. 2016. “Twitter Taught Microsoft’s AI Chatbot to Be a Racist Asshole in Less than a Day.” The Verge, March 24, 2016. https://www.theverge.com/2016/3/24/11297050/tay-microsoft-chatbot-racist.
———. 2018. “Amazon Reportedly Scraps Internal AI Recruiting Tool That Was Biased against Women.” The Verge, June 10, 2018. https://www.theverge.com/2018/10/10/17958784/ai-recruiting-tool-bias-amazon-report.
Wade, Michael, Amit Joshi, Mark J. Greeven, Robert Hooijberg, and Shlomo Ben-Hur. 2020. “How Intelligent Is Your AI?” MIT Sloan Management Review. June 22, 2020. https://sloanreview.mit.edu/article/how-intelligent-is-your-ai/.
Wong, David Dak Wah. 2020. “Speech By Justice David Wong Dak Wah Chief Judge Of Sabah And Sarawak On The Opening Of The Legal Year 2020 In Kuching.” Kuching: The High Court in Sabah and Sarawak. https://judiciary.kehakiman.gov.my/portals/web/home/article_view/0/1705/1.
Yong, Ed. 2018. “A Popular Algorithm Is No Better at Predicting Crimes Than Random People.” The Atlantic, January 17, 2018. https://www.theatlantic.com/technology/archive/2018/01/equivant-compas-algorithm/550646/.

KHAZANAH RESEARCH INSTITUTE 198
AFTERWORD
“Remember, governance is a big word that
includes human rights, freedom of speech,
economic transactions on a worldwide basis
— it touches everything. It’s everywhere, and
that’s why [i]nternet governance is topic A in
many corners.”
Vint Cerf499
499 O’Dell, J. 2011. “Vint Cerf: The Government Is Going Overboard in Internet Copyright Control.” VentureBeat (blog).
November 14, 2011. https://venturebeat.com/2011/11/14/vint-cerf/.

199 KHAZANAH RESEARCH INSTITUTE
AFTERWORD500
The Digital Economy Blueprint (DEB) was launched in February 2021 as the overarching national
action plan for digital development up until 2030. It gave some much-needed structure to
Malaysia’s ongoing digital transformation. Its six thrusts are aimed at the public sector, firms,
infrastructure, human capital, inclusivity and governance, making it clear that digital
transformation is an “all of society” process. In fact, the digital economy is defined in the Blueprint
as “economic and social activities that involve the production and use of digital technology by
individuals, businesses and government”.
This tacit understanding of the digital economy as involving “all of society” needs to be made
explicit as we move forward. An “all of society” digital transformation necessarily includes social
well-being and human rights as well as economic development and growth. A digital society
framework, not just a digital economy framework, brings a greater variety of community issues,
rights and needs to the table.
Reconceptualising a digital economy framework as a digital society framework is not just a matter
of semantics. It brings to the table stakeholders with non-economic interests in digital policy
issues that can affect many groups, especially those who are marginalised and vulnerable, in
unexpected and sometimes damaging ways. It amplifies the voices of those calling for digital
rights and those speaking out against digitally-enabled injustices.
Having a digital society mindset involves thinking about development and design not just for
efficiency but also for inclusivity. Apps and websites should be intuitive to use and able to work
on multiple devices so that everyone can use them. These principles of ease-of-use and
interoperability should drive user interface and user experience design in developing cross-
platform, cross-device technology to lower barriers of entry to digital adoption. With broadband
being considered a basic utility, the conversation around the digital divide can go beyond access
and affordability to meaningful connectivity and use.
Providing equitable digital opportunities would include closing gaps in user experience of
network performance, types of devices used and digital skills needed to derive optimal benefits
from digital connectivity and technologies. This would improve digital human capital
development, not just in terms of technical skills and social protections for the digital workforce
but also in terms of digital and media literacy needed to equip Malaysians to handle social
problems such as scams, cyberbullying and misinformation.
Data is rightly spotlighted in the Blueprint as a key commodity in the digital economy, and thus a
key building block of a digital society. A digital society framework facilitates data governance
policies that value data privacy and security as much as open data and big data analysis. Different
types of data require different policy priorities, and data policies are like most other policies—no
one size fits all. So we must reframe the way we think about data, not just in terms of types of data
(e.g. public versus private), but also in terms of the entire data value chain, from data generation
and collection to data retention and deletion.
500 This section draws extensively from an op-ed authored by Rachel Gong which was published in The Star on 22
February 2021, titled “Towards a Digital Society”.

AFTERWORD
KHAZANAH RESEARCH INSTITUTE 200
As AI advances, big data, automation and machine learning are likely to be used more not just in
supply chains but also in everyday decision-making processes and conveniences such as the
Internet of Things. Any number of objects not normally associated with data transfer (e.g. lights
or a fridge) can be equipped with sensors and connected for data exchange. A “society-first” policy
framework recognises the productivity gains of such technologies without neglecting laws and
regulations that guard against discriminatory outcomes, such as in AI-dependent hiring practices,
placement of rental ads and risk assessments for loans or insurance.
A digital society framework facilitates multi-disciplinary policy research. It allows researchers to
ask questions about the ways digital technologies have become part of our everyday lives and
what sort of influence they will have on our future. How much power will we allow algorithms to
have in determining what news we read or what values we share? Are these technologies
sustainable? How can they help us address future challenges, such as climate change? Are the
public interest gains from these technologies worth the risks?
We have only begun to scratch the surface of how digital technologies are impacting and
influencing our daily lives. Like most tools, digital technologies are neither inherently good nor
bad. Apps and algorithms can open up a world of possibilities, but without due consideration and
responsible governance, they can wreak havoc. The data that emerge from the use of digital
technologies can spur innovation but can also marginalise the vulnerable. Thus, in adopting
digital technologies, a public interest policy framework must also be in place to ensure we can
navigate the challenges and maximise the opportunities of digital transformation.


Level 25 Mercu UEM Jalan Stesen Sentral 5 Kuala Lumpur Sentral 50470 Kuala Lumpur MALAYSIA Tel: +603 2265 0000 Fax: +603 2265 0088 www.KRInstitute.org