koch, f. w., d. a. wiens, a. a. nyblade, p. j. shore, r. tibi, b. ateba, c. t. tabod, and j. m....
TRANSCRIPT
Geophys. J. Int. (2012) doi: 10.1111/j.1365-246X.2012.05497.x
GJI
Geo
dyna
mic
san
dte
cton
ics
Upper-mantle anisotropy beneath the Cameroon Volcanic Lineand Congo Craton from shear wave splitting measurements
Franklin W. Koch,1 Douglas A. Wiens,1 Andrew A. Nyblade,2 Patrick J. Shore,1
Rigobert Tibi,1,! B. Ateba,3 C.T. Tabod4 and J. M. Nnange5
1Department of Earth and Planetary Sciences, Washington University, Campus box 1169, 1 Brookings Drive, St. Louis, MO 63130-4899, USA.E-mail: [email protected] of Geosciences, Penn State University, University Park, PA, USA3Institute for Geological and Mining Research, Buea, Cameroon4Department of Physics, University of Yaounde I, PO Box 6052, Yaounde, Cameroon5Institute for Geological and Mining Research, BP 4110, Yaounde, Cameroon
Accepted 2012 April 3. Received 2012 April 1; in original form 2011 September 11
S U M M A R YThe Cameroon Volcanic Line (CVL) is an 1800-km-long line of Cenozoic volcanoes that doesnot show a chronological progression consistent with hotspot-related volcanism. We investigateseismic anisotropy to determine the upper-mantle lattice preferred orientation and constrainthe mantle flow pattern using a temporary array of 32 broad-band seismographs deployedthroughout Cameroon between 2005 and 2007 along with two additional permanent seismo-graphs in adjacent countries. We determine the fast direction and lag time beneath each stationby stacking SKS and SKKS splitting measurements from multiple events. The results indicatefour regions with different splitting parameters. The Congo Craton in southern Cameroonand the Garoua rift region in northeast Cameroon have northeast–southwest-oriented fast di-rections and split times of about 1 s. Between the Congo Craton and the CVL, in centralCameroon, the fast directions are variable and have small splitting times of 0.3 s or less.Along the CVL, where previous studies show a strong slow velocity anomaly in the mantle,the fast direction is oriented approximately north–south, with splitting times of about 0.7 s.We interpret measurements from southern Cameroon and northeast Cameroon as indicationsof lattice-preferred orientation frozen into the Congo Craton and subcontinental lithosphererelated to relict plate motion and deformation. The distinct pattern of splitting along the CVLsuggests the existence of small-scale convection in the asthenosphere related to the formationof the CVL, perhaps driven by the adjacent cold edge of the Congo Craton.
Key words: Mantle processes; Seismic anisotropy; Oceanic hotspots and intraplate volcan-ism; Dynamics of lithosphere and mantle; Africa.
1 I N T RO D U C T I O N
Linear volcanic mountain chains are usually explained by thehotspot model, in which volcanism is caused by partial meltingwithin rising plumes of hot material in the mantle (Wilson 1963).The classic hotspot volcanic chains, such as the Hawaiian Islands,generally show a distinct progression in the age of first volcanismresulting from the plate passing over the mantle magma source re-gion. A few volcanic chains, such as the Cook–Austral Islands in thePacific (Okal & Batiza 1987), clearly do not show an age progres-sion and thus cannot be easily interpreted in the framework of the
!Now at: P.C. Rizzo Associates Inc., 500 Penn Center Blvd, Pittsburgh, PA15235, USA.
simple hotspot model. These volcanic chains have been explainedby small-scale sublithospheric convection (Ballmer et al. 2009) anda ‘hot line’ of upwelling mantle material (Bonatti et al. 1977). Theymay also be explained by multiple shallow, closely spaced plumeletsshooting off of a superplume in the lower mantle or may be relatedto regional extension of the crust (Koppers et al. 2003).
The Cameroon Volcanic Line (CVL) is one of the most promi-nent examples of a volcanic chain that lacks the age progressioncharacteristic of the hotspot model. It consists of a linear trend ofalkali basalt sea mounts and volcanoes that stretch from Annobonin the Atlantic Ocean onto the continental part of the African Plate(Fitton & Dunlop 1985). The CVL extends across Cameroon andsplits into a Y shape, extending north to the Biu Plateau and eastacross the Adamawa Plateau (Fig. 1). The orientation of the line isroughly parallel to the trend of volcanoes formed by the Reunion
C" 2012 The Authors 1Geophysical Journal International C" 2012 RAS
Geophysical Journal International
2 F. W. Koch et al.
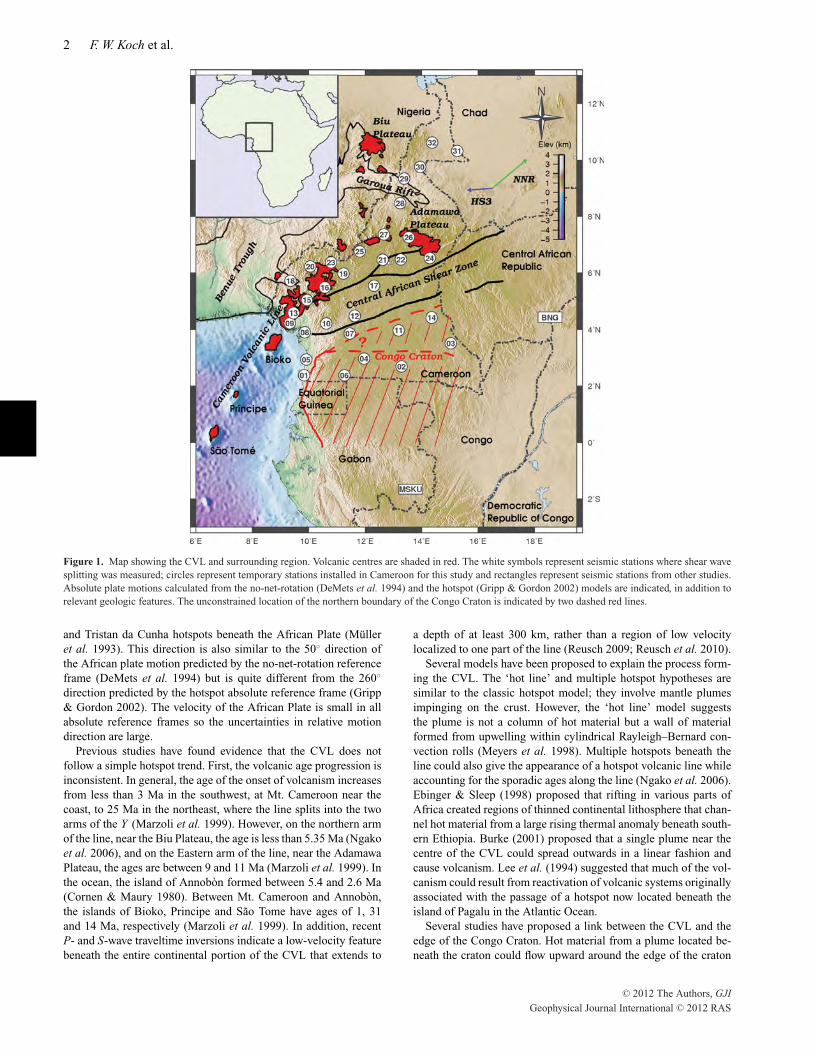
Figure 1. Map showing the CVL and surrounding region. Volcanic centres are shaded in red. The white symbols represent seismic stations where shear wavesplitting was measured; circles represent temporary stations installed in Cameroon for this study and rectangles represent seismic stations from other studies.Absolute plate motions calculated from the no-net-rotation (DeMets et al. 1994) and the hotspot (Gripp & Gordon 2002) models are indicated, in addition torelevant geologic features. The unconstrained location of the northern boundary of the Congo Craton is indicated by two dashed red lines.
and Tristan da Cunha hotspots beneath the African Plate (Mulleret al. 1993). This direction is also similar to the 50# direction ofthe African plate motion predicted by the no-net-rotation referenceframe (DeMets et al. 1994) but is quite different from the 260#
direction predicted by the hotspot absolute reference frame (Gripp& Gordon 2002). The velocity of the African Plate is small in allabsolute reference frames so the uncertainties in relative motiondirection are large.
Previous studies have found evidence that the CVL does notfollow a simple hotspot trend. First, the volcanic age progression isinconsistent. In general, the age of the onset of volcanism increasesfrom less than 3 Ma in the southwest, at Mt. Cameroon near thecoast, to 25 Ma in the northeast, where the line splits into the twoarms of the Y (Marzoli et al. 1999). However, on the northern armof the line, near the Biu Plateau, the age is less than 5.35 Ma (Ngakoet al. 2006), and on the Eastern arm of the line, near the AdamawaPlateau, the ages are between 9 and 11 Ma (Marzoli et al. 1999). Inthe ocean, the island of Annobon formed between 5.4 and 2.6 Ma(Cornen & Maury 1980). Between Mt. Cameroon and Annobon,the islands of Bioko, Principe and Sao Tome have ages of 1, 31and 14 Ma, respectively (Marzoli et al. 1999). In addition, recentP- and S-wave traveltime inversions indicate a low-velocity featurebeneath the entire continental portion of the CVL that extends to
a depth of at least 300 km, rather than a region of low velocitylocalized to one part of the line (Reusch 2009; Reusch et al. 2010).
Several models have been proposed to explain the process form-ing the CVL. The ‘hot line’ and multiple hotspot hypotheses aresimilar to the classic hotspot model; they involve mantle plumesimpinging on the crust. However, the ‘hot line’ model suggeststhe plume is not a column of hot material but a wall of materialformed from upwelling within cylindrical Rayleigh–Bernard con-vection rolls (Meyers et al. 1998). Multiple hotspots beneath theline could also give the appearance of a hotspot volcanic line whileaccounting for the sporadic ages along the line (Ngako et al. 2006).Ebinger & Sleep (1998) proposed that rifting in various parts ofAfrica created regions of thinned continental lithosphere that chan-nel hot material from a large rising thermal anomaly beneath south-ern Ethiopia. Burke (2001) proposed that a single plume near thecentre of the CVL could spread outwards in a linear fashion andcause volcanism. Lee et al. (1994) suggested that much of the vol-canism could result from reactivation of volcanic systems originallyassociated with the passage of a hotspot now located beneath theisland of Pagalu in the Atlantic Ocean.
Several studies have proposed a link between the CVL and theedge of the Congo Craton. Hot material from a plume located be-neath the craton could flow upward around the edge of the craton
C" 2012 The Authors, GJIGeophysical Journal International C" 2012 RAS
Anisotropy beneath the CVL 3
and cause partial melting and volcanism (King & Anderson 1998).The source of this material may be a superplume in the lower mantlebelow West Africa (Forte et al. 2010). Also, edge-driven convectionadjacent to the craton could cause upwelling and partial meltingat the surface several hundred kilometers from the craton (King &Ritsema 2000). Reusch et al. (2010) show that P- and S-wave to-mographic images of mantle velocity structure beneath Cameroonare consistent with an edge-driven flow model for the origin of theCVL.
In this study, we use seismic stations in Cameroon to study thecontinental portion of the CVL. We use shear-wave splitting mea-surements of SKS and SKKS waveforms to place constraints on theflow pattern in the upper mantle and help distinguish which pro-posed model best explains the origin of the CVL. Shear wave split-ting measurements from these phases are commonly interpreted asindicating azimuthal anisotropy along the near-vertical S wave paththrough the upper mantle (Silver & Chan 1991). Xenolith studiesand laboratory experiments indicate that upper-mantle anisotropyis most likely caused by the lattice-preferred orientation (LPO) ofolivine resulting from shear strain in the upper mantle (Mainprice& Silver 1993; Zhang & Karato 1995; Tommasi et al. 2000). ThisLPO may indicate shear strain associated with current mantle flowpatterns or may result from past shear strain, particularly in coldparts of the lithosphere not currently deforming (Silver & Chan1988). Alternatively, seismic anisotropy can develop from shape-preferred orientation of structures in the lithosphere. Melt-filledcracks are used to explain the splitting direction at several continen-tal rift zones (Gao et al. 1997), with the shape-preferred orientationcausing splitting parallel to the strike of the rift.
The pattern of mantle anisotropy has the potential to help dis-tinguish the various models put forward to explain the CVL. Forexample, a single hotspot should result in a pattern that, to first order,shows fast directions that are radial to the plume as the flow diverges,though the pattern may be more complicated in detail (Ballmer et al.2009). Multiple hotspots would result in little azimuthal anisotropyalong the CVL where the mantle flow would be vertical, but shouldshow fast directions perpendicular to the CVL farther from the line.If the volcanism is caused by partial melt flowing in a channel be-neath the CVL from a source plume, the shape-preferred orientationof the melt conduits would give anisotropy with a fast direction par-allel to the line. Upwelling from beneath the craton or convectionadjacent to it would result in a fast direction pointing away from thecraton and roughly perpendicular to the CVL. In these scenarios,there may be areas of reduced azimuthal anisotropy where mantleflow is nearly vertical.
2 G E O L O G I C S E T T I N G
Geological terranes near the CVL include the Congo Craton, theOubanguides Belt, and the Benue Trough. The Congo Craton oc-cupies a large part of Central Africa from Angola to Sudan. In theArchaean, the Gabon–Cameroon Shield and the Bomu–KibalianShield collided to make up the northwestern and northeastern partof the Congo Craton, respectively (Begg et al. 2009). Its northernedge extends into southern Cameroon and is referred to as the NtemComplex (Vicat et al. 1996; Fig. 1). The Ntem Complex consistspredominantly of Archaean rocks preserved in greenstone beltssurrounded by tonalite–trondhjemite–granodiorite (TTG) suites(Tchameni et al. 2000; Tchameni et al. 2001; Nsifa 2006). In thePalaeoproterozoic, contemporaneous with the Eburnean orogeniccycle, the region was reworked by the intrusion of mafic doleriticdikes (Tchameni et al. 2001; Nsifa 2006).
North of the Congo Craton in Cameroon lies the Pan AfricanOubanguides or North Equatorial Fold Belt (Poidevin 1983; Nzentiet al. 1988). The Oubanguides Belt is part of the NeoproterozoicPan African–Brazilian Belt, a region of deformation formed by col-lisions during the formation of Gondwana (Castaing et al. 1994;Toteu et al. 2004). Evidence from gravity studies indicates thatthe Pan African rocks overthrust the Ntem Complex in southernCameroon and towards the Central African Republic, but the loca-tion of this intracrustal discontinuity is not well known (Boukeke1994; Tadjou et al. 2004; Toteu et al. 2004; Tadjou et al. 2009).
The Central African Shear Zone (CASZ) is a mylonitic shearzone within the Oubanguides Belt (Toteu et al. 2004; Fig. 1). TheCASZ extends from the Darfur region of Sudan to the AdamawaPlateau and then toward southwestern Cameroon (Fairhead &Okereke 1987). Here, it is known as the Foumban Shear Zone be-fore it disappears under volcanic cover. The CASZ corresponds tothe Pernambuco lineament in Brazil (Burke et al. 1971; Browne &Fairhead 1983).
The Benue Trough is located northwest of the CVL. This featureis a zone of continental rifting that originated in the Cretaceous asthe failed third arm of the triple junction when Africa and SouthAmerica began spreading apart (Fairhead 1988). It follows a Y -shaped pattern similar to that of the CVL. One of the arms of theBenue Trough, the Garoua Rift, crosses the northeast end of theCVL. This feature is at the northern boundary of the AdawamaPlateau and is notable for its thin crust (Stuart et al. 1985; Tokamet al. 2010).
3 S E I S M I C DATA
32 broad-band seismic stations were installed throughout Cameroonbetween January 2005 and January 2007 (Tibi et al. 2005). Table 1gives the locations of the stations and the time periods they wereoperational, and Fig. 1 shows the location of the stations withinCameroon. Eight of the stations were installed in early 2005 andoperated for 2 yr, and the remaining 24 stations were installed inearly 2006 and ran for 1 yr. In addition to these temporary stations,we analysed data from an IRIS/USGS Global Seismographic Net-work station in Masuku, Gabon (MSKU), and we used previousSKS splitting results from the Geoscope station Bangui (BNG) inthe Central African Republic (Barruol & Ben-Ismail 2001).
The events used in this study were required to have clear SKSor SKKS arrivals above the noise level and no interference fromother phase arrivals. To meet these requirements, only events with amoment magnitude (Mw) greater than 5.5 and a distance of 90–140#
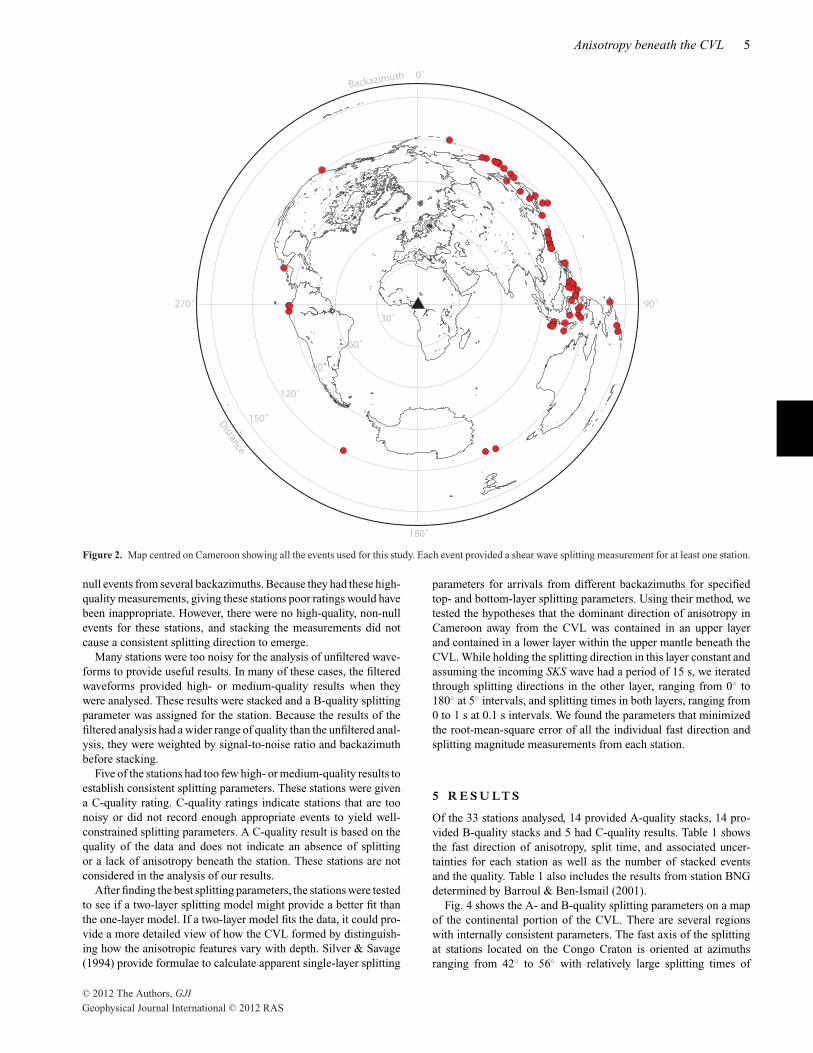
away from the seismographs were included in this study. Seismicrecords meeting these requirements were visually inspected to selectthe waveforms used in the analysis. Fig. 2 shows the distribution ofall the events used in this study. For each station, only a small subsetof the events shown provided high-quality splitting measurements.The events were not ideally distributed with azimuth, as most werelocated towards the east, but stations with A-quality final stacksshowed arrivals from a reasonable range of azimuths.
4 A NA LY S I S M E T H O D S
We used the method of Silver & Chan (1991) to determine thefast splitting direction and splitting magnitude for each SKS andSKKS waveform. This method analyzes ground particle motion bycalculating the covariance matrix of the horizontal components fordifferent possible splitting directions and delay times. The most
C" 2012 The Authors, GJIGeophysical Journal International C" 2012 RAS
4 F. W. Koch et al.
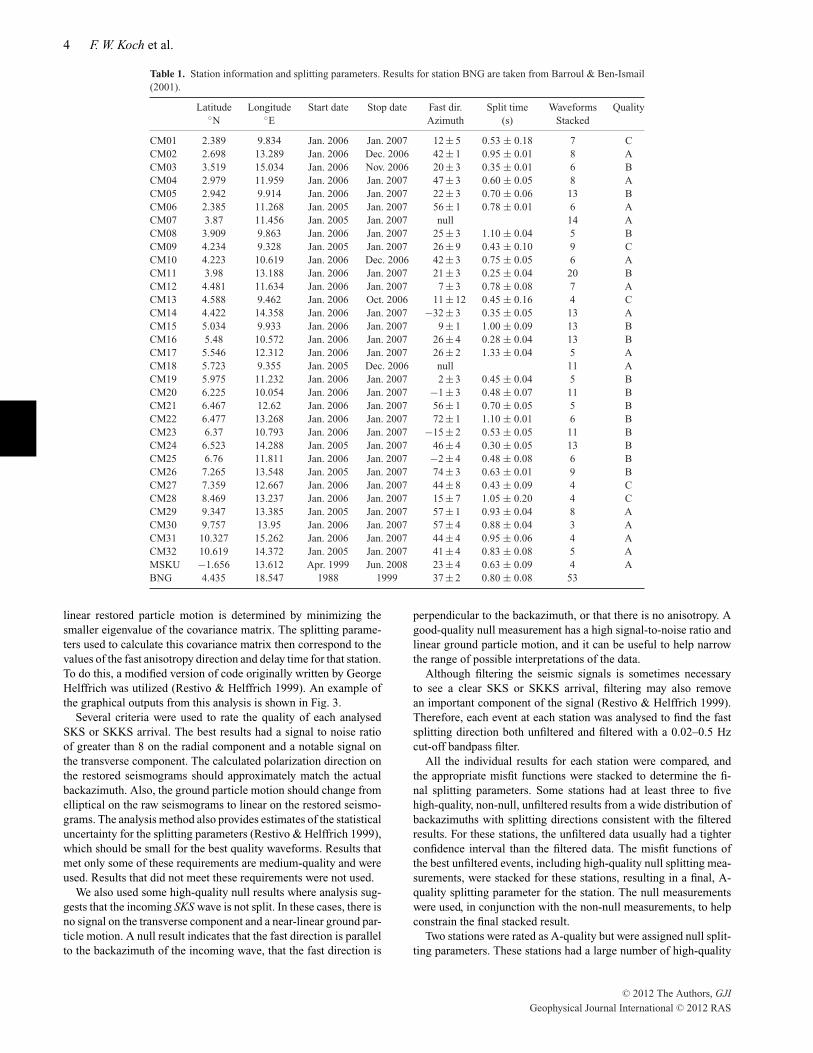
Table 1. Station information and splitting parameters. Results for station BNG are taken from Barroul & Ben-Ismail(2001).
Latitude Longitude Start date Stop date Fast dir. Split time Waveforms Quality#N #E Azimuth (s) Stacked
CM01 2.389 9.834 Jan. 2006 Jan. 2007 12 ± 5 0.53 ± 0.18 7 CCM02 2.698 13.289 Jan. 2006 Dec. 2006 42 ± 1 0.95 ± 0.01 8 ACM03 3.519 15.034 Jan. 2006 Nov. 2006 20 ± 3 0.35 ± 0.01 6 BCM04 2.979 11.959 Jan. 2006 Jan. 2007 47 ± 3 0.60 ± 0.05 8 ACM05 2.942 9.914 Jan. 2006 Jan. 2007 22 ± 3 0.70 ± 0.06 13 BCM06 2.385 11.268 Jan. 2005 Jan. 2007 56 ± 1 0.78 ± 0.01 6 ACM07 3.87 11.456 Jan. 2005 Jan. 2007 null 14 ACM08 3.909 9.863 Jan. 2006 Jan. 2007 25 ± 3 1.10 ± 0.04 5 BCM09 4.234 9.328 Jan. 2005 Jan. 2007 26 ± 9 0.43 ± 0.10 9 CCM10 4.223 10.619 Jan. 2006 Dec. 2006 42 ± 3 0.75 ± 0.05 6 ACM11 3.98 13.188 Jan. 2006 Jan. 2007 21 ± 3 0.25 ± 0.04 20 BCM12 4.481 11.634 Jan. 2006 Jan. 2007 7 ± 3 0.78 ± 0.08 7 ACM13 4.588 9.462 Jan. 2006 Oct. 2006 11 ± 12 0.45 ± 0.16 4 CCM14 4.422 14.358 Jan. 2006 Jan. 2007 $32 ± 3 0.35 ± 0.05 13 ACM15 5.034 9.933 Jan. 2006 Jan. 2007 9 ± 1 1.00 ± 0.09 13 BCM16 5.48 10.572 Jan. 2006 Jan. 2007 26 ± 4 0.28 ± 0.04 13 BCM17 5.546 12.312 Jan. 2006 Jan. 2007 26 ± 2 1.33 ± 0.04 5 ACM18 5.723 9.355 Jan. 2005 Dec. 2006 null 11 ACM19 5.975 11.232 Jan. 2006 Jan. 2007 2 ± 3 0.45 ± 0.04 5 BCM20 6.225 10.054 Jan. 2006 Jan. 2007 $1 ± 3 0.48 ± 0.07 11 BCM21 6.467 12.62 Jan. 2006 Jan. 2007 56 ± 1 0.70 ± 0.05 5 BCM22 6.477 13.268 Jan. 2006 Jan. 2007 72 ± 1 1.10 ± 0.01 6 BCM23 6.37 10.793 Jan. 2006 Jan. 2007 $15 ± 2 0.53 ± 0.05 11 BCM24 6.523 14.288 Jan. 2005 Jan. 2007 46 ± 4 0.30 ± 0.05 13 BCM25 6.76 11.811 Jan. 2006 Jan. 2007 $2 ± 4 0.48 ± 0.08 6 BCM26 7.265 13.548 Jan. 2005 Jan. 2007 74 ± 3 0.63 ± 0.01 9 BCM27 7.359 12.667 Jan. 2006 Jan. 2007 44 ± 8 0.43 ± 0.09 4 CCM28 8.469 13.237 Jan. 2006 Jan. 2007 15 ± 7 1.05 ± 0.20 4 CCM29 9.347 13.385 Jan. 2005 Jan. 2007 57 ± 1 0.93 ± 0.04 8 ACM30 9.757 13.95 Jan. 2006 Jan. 2007 57 ± 4 0.88 ± 0.04 3 ACM31 10.327 15.262 Jan. 2006 Jan. 2007 44 ± 4 0.95 ± 0.06 4 ACM32 10.619 14.372 Jan. 2005 Jan. 2007 41 ± 4 0.83 ± 0.08 5 AMSKU $1.656 13.612 Apr. 1999 Jun. 2008 23 ± 4 0.63 ± 0.09 4 ABNG 4.435 18.547 1988 1999 37 ± 2 0.80 ± 0.08 53
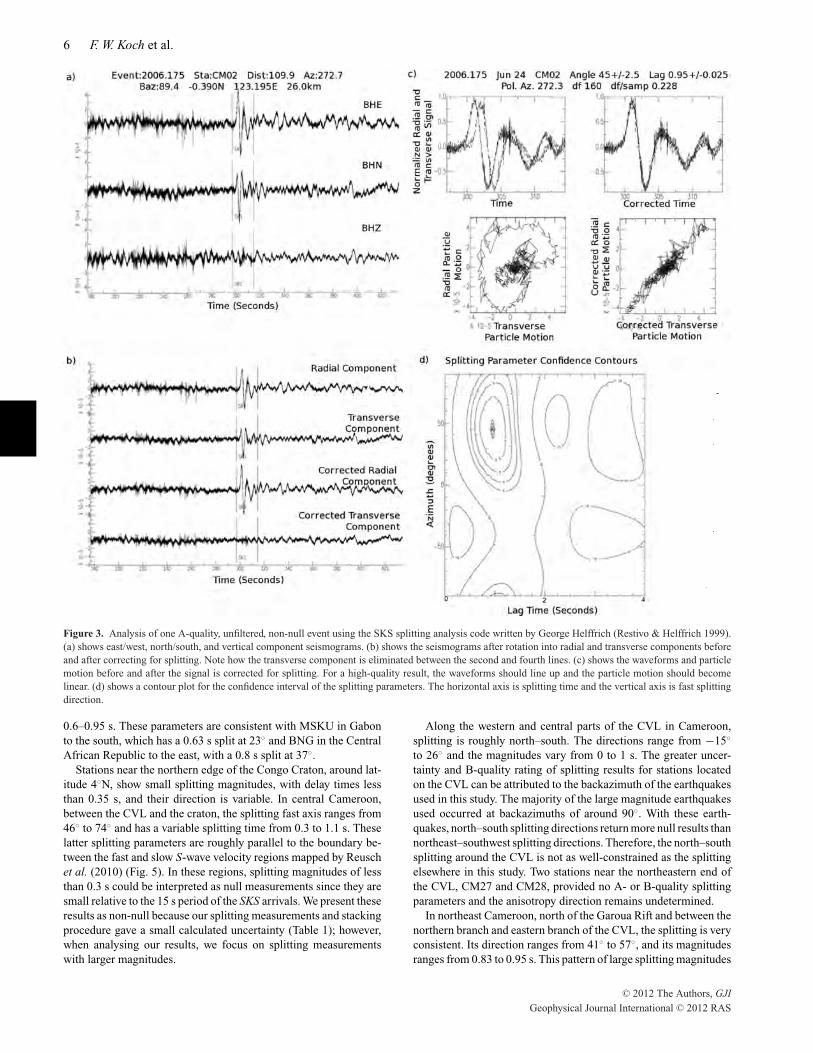
linear restored particle motion is determined by minimizing thesmaller eigenvalue of the covariance matrix. The splitting parame-ters used to calculate this covariance matrix then correspond to thevalues of the fast anisotropy direction and delay time for that station.To do this, a modified version of code originally written by GeorgeHelffrich was utilized (Restivo & Helffrich 1999). An example ofthe graphical outputs from this analysis is shown in Fig. 3.
Several criteria were used to rate the quality of each analysedSKS or SKKS arrival. The best results had a signal to noise ratioof greater than 8 on the radial component and a notable signal onthe transverse component. The calculated polarization direction onthe restored seismograms should approximately match the actualbackazimuth. Also, the ground particle motion should change fromelliptical on the raw seismograms to linear on the restored seismo-grams. The analysis method also provides estimates of the statisticaluncertainty for the splitting parameters (Restivo & Helffrich 1999),which should be small for the best quality waveforms. Results thatmet only some of these requirements are medium-quality and wereused. Results that did not meet these requirements were not used.
We also used some high-quality null results where analysis sug-gests that the incoming SKS wave is not split. In these cases, there isno signal on the transverse component and a near-linear ground par-ticle motion. A null result indicates that the fast direction is parallelto the backazimuth of the incoming wave, that the fast direction is
perpendicular to the backazimuth, or that there is no anisotropy. Agood-quality null measurement has a high signal-to-noise ratio andlinear ground particle motion, and it can be useful to help narrowthe range of possible interpretations of the data.
Although filtering the seismic signals is sometimes necessaryto see a clear SKS or SKKS arrival, filtering may also removean important component of the signal (Restivo & Helffrich 1999).Therefore, each event at each station was analysed to find the fastsplitting direction both unfiltered and filtered with a 0.02–0.5 Hzcut-off bandpass filter.
All the individual results for each station were compared, andthe appropriate misfit functions were stacked to determine the fi-nal splitting parameters. Some stations had at least three to fivehigh-quality, non-null, unfiltered results from a wide distribution ofbackazimuths with splitting directions consistent with the filteredresults. For these stations, the unfiltered data usually had a tighterconfidence interval than the filtered data. The misfit functions ofthe best unfiltered events, including high-quality null splitting mea-surements, were stacked for these stations, resulting in a final, A-quality splitting parameter for the station. The null measurementswere used, in conjunction with the non-null measurements, to helpconstrain the final stacked result.
Two stations were rated as A-quality but were assigned null split-ting parameters. These stations had a large number of high-quality
C" 2012 The Authors, GJIGeophysical Journal International C" 2012 RAS
Anisotropy beneath the CVL 5
Distance
Backazimuth
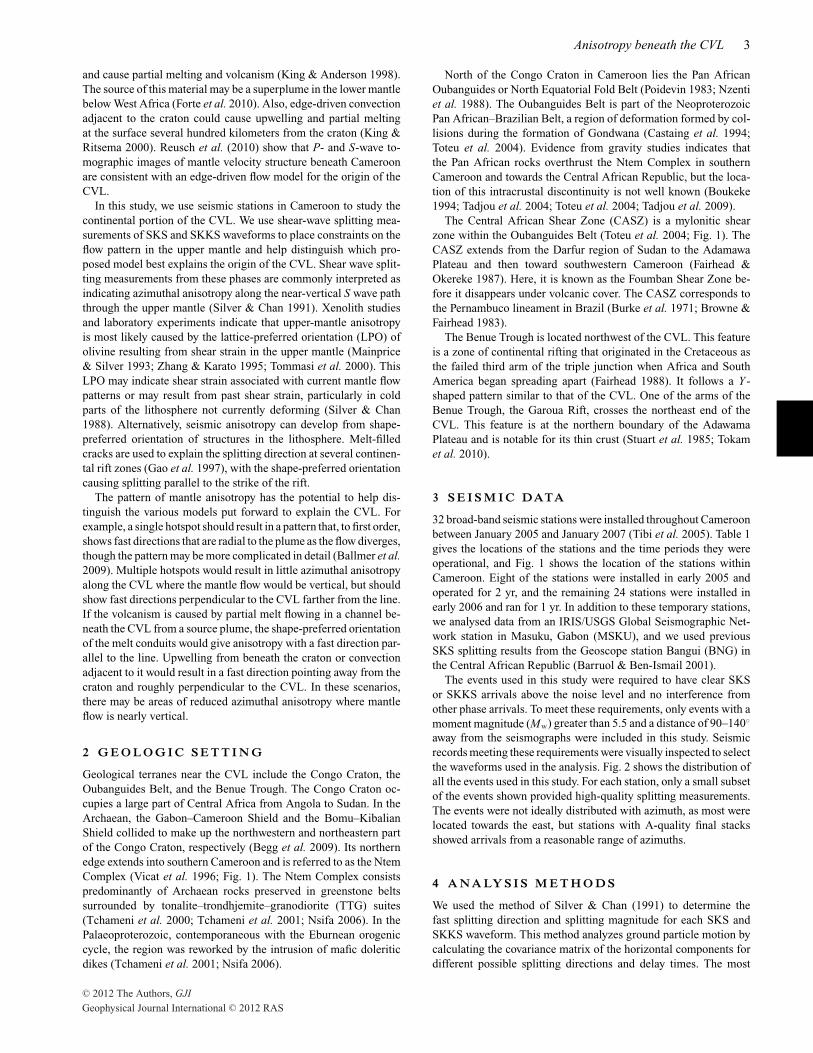
Figure 2. Map centred on Cameroon showing all the events used for this study. Each event provided a shear wave splitting measurement for at least one station.
null events from several backazimuths. Because they had these high-quality measurements, giving these stations poor ratings would havebeen inappropriate. However, there were no high-quality, non-nullevents for these stations, and stacking the measurements did notcause a consistent splitting direction to emerge.
Many stations were too noisy for the analysis of unfiltered wave-forms to provide useful results. In many of these cases, the filteredwaveforms provided high- or medium-quality results when theywere analysed. These results were stacked and a B-quality splittingparameter was assigned for the station. Because the results of thefiltered analysis had a wider range of quality than the unfiltered anal-ysis, they were weighted by signal-to-noise ratio and backazimuthbefore stacking.
Five of the stations had too few high- or medium-quality results toestablish consistent splitting parameters. These stations were givena C-quality rating. C-quality ratings indicate stations that are toonoisy or did not record enough appropriate events to yield well-constrained splitting parameters. A C-quality result is based on thequality of the data and does not indicate an absence of splittingor a lack of anisotropy beneath the station. These stations are notconsidered in the analysis of our results.
After finding the best splitting parameters, the stations were testedto see if a two-layer splitting model might provide a better fit thanthe one-layer model. If a two-layer model fits the data, it could pro-vide a more detailed view of how the CVL formed by distinguish-ing how the anisotropic features vary with depth. Silver & Savage(1994) provide formulae to calculate apparent single-layer splitting
parameters for arrivals from different backazimuths for specifiedtop- and bottom-layer splitting parameters. Using their method, wetested the hypotheses that the dominant direction of anisotropy inCameroon away from the CVL was contained in an upper layerand contained in a lower layer within the upper mantle beneath theCVL. While holding the splitting direction in this layer constant andassuming the incoming SKS wave had a period of 15 s, we iteratedthrough splitting directions in the other layer, ranging from 0# to180# at 5# intervals, and splitting times in both layers, ranging from0 to 1 s at 0.1 s intervals. We found the parameters that minimizedthe root-mean-square error of all the individual fast direction andsplitting magnitude measurements from each station.
5 R E S U LT S
Of the 33 stations analysed, 14 provided A-quality stacks, 14 pro-vided B-quality stacks and 5 had C-quality results. Table 1 showsthe fast direction of anisotropy, split time, and associated uncer-tainties for each station as well as the number of stacked eventsand the quality. Table 1 also includes the results from station BNGdetermined by Barroul & Ben-Ismail (2001).
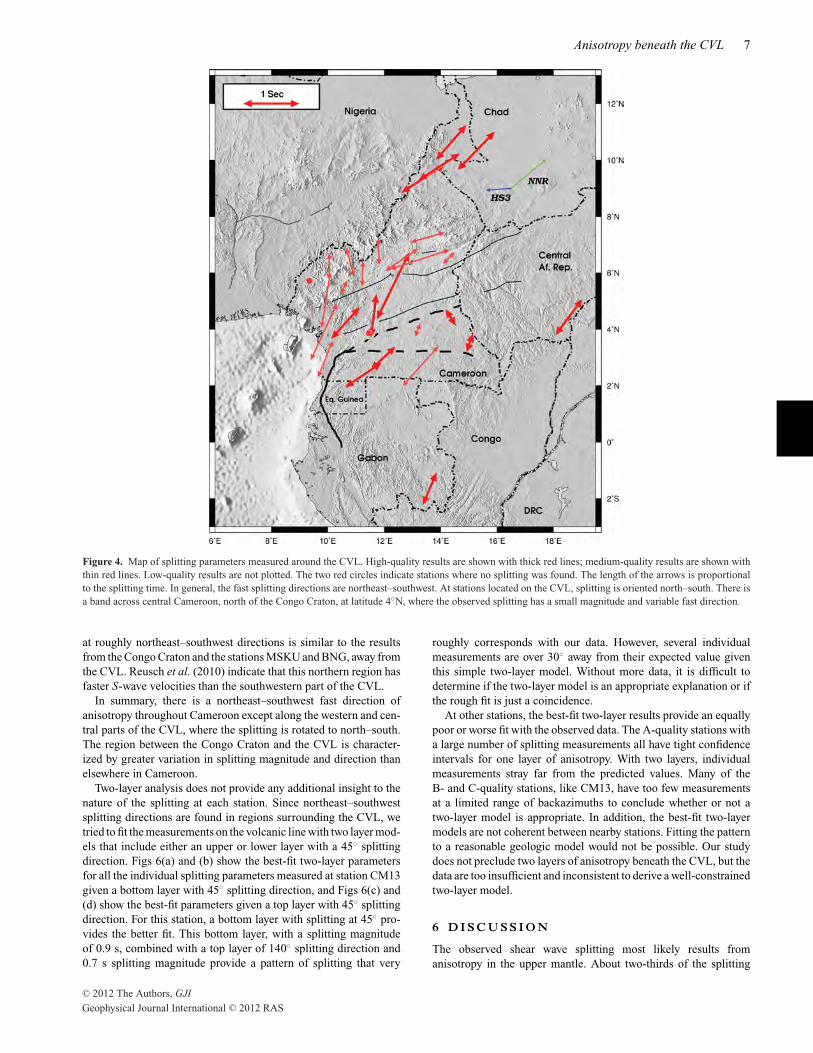
Fig. 4 shows the A- and B-quality splitting parameters on a mapof the continental portion of the CVL. There are several regionswith internally consistent parameters. The fast axis of the splittingat stations located on the Congo Craton is oriented at azimuthsranging from 42# to 56# with relatively large splitting times of
C" 2012 The Authors, GJIGeophysical Journal International C" 2012 RAS
6 F. W. Koch et al.
Figure 3. Analysis of one A-quality, unfiltered, non-null event using the SKS splitting analysis code written by George Helffrich (Restivo & Helffrich 1999).(a) shows east/west, north/south, and vertical component seismograms. (b) shows the seismograms after rotation into radial and transverse components beforeand after correcting for splitting. Note how the transverse component is eliminated between the second and fourth lines. (c) shows the waveforms and particlemotion before and after the signal is corrected for splitting. For a high-quality result, the waveforms should line up and the particle motion should becomelinear. (d) shows a contour plot for the confidence interval of the splitting parameters. The horizontal axis is splitting time and the vertical axis is fast splittingdirection.
0.6–0.95 s. These parameters are consistent with MSKU in Gabonto the south, which has a 0.63 s split at 23# and BNG in the CentralAfrican Republic to the east, with a 0.8 s split at 37#.
Stations near the northern edge of the Congo Craton, around lat-itude 4#N, show small splitting magnitudes, with delay times lessthan 0.35 s, and their direction is variable. In central Cameroon,between the CVL and the craton, the splitting fast axis ranges from46# to 74# and has a variable splitting time from 0.3 to 1.1 s. Theselatter splitting parameters are roughly parallel to the boundary be-tween the fast and slow S-wave velocity regions mapped by Reuschet al. (2010) (Fig. 5). In these regions, splitting magnitudes of lessthan 0.3 s could be interpreted as null measurements since they aresmall relative to the 15 s period of the SKS arrivals. We present theseresults as non-null because our splitting measurements and stackingprocedure gave a small calculated uncertainty (Table 1); however,when analysing our results, we focus on splitting measurementswith larger magnitudes.
Along the western and central parts of the CVL in Cameroon,splitting is roughly north–south. The directions range from $15#
to 26# and the magnitudes vary from 0 to 1 s. The greater uncer-tainty and B-quality rating of splitting results for stations locatedon the CVL can be attributed to the backazimuth of the earthquakesused in this study. The majority of the large magnitude earthquakesused occurred at backazimuths of around 90#. With these earth-quakes, north–south splitting directions return more null results thannortheast–southwest splitting directions. Therefore, the north–southsplitting around the CVL is not as well-constrained as the splittingelsewhere in this study. Two stations near the northeastern end ofthe CVL, CM27 and CM28, provided no A- or B-quality splittingparameters and the anisotropy direction remains undetermined.
In northeast Cameroon, north of the Garoua Rift and between thenorthern branch and eastern branch of the CVL, the splitting is veryconsistent. Its direction ranges from 41# to 57#, and its magnitudesranges from 0.83 to 0.95 s. This pattern of large splitting magnitudes
C" 2012 The Authors, GJIGeophysical Journal International C" 2012 RAS
Anisotropy beneath the CVL 7
Figure 4. Map of splitting parameters measured around the CVL. High-quality results are shown with thick red lines; medium-quality results are shown withthin red lines. Low-quality results are not plotted. The two red circles indicate stations where no splitting was found. The length of the arrows is proportionalto the splitting time. In general, the fast splitting directions are northeast–southwest. At stations located on the CVL, splitting is oriented north–south. There isa band across central Cameroon, north of the Congo Craton, at latitude 4#N, where the observed splitting has a small magnitude and variable fast direction.
at roughly northeast–southwest directions is similar to the resultsfrom the Congo Craton and the stations MSKU and BNG, away fromthe CVL. Reusch et al. (2010) indicate that this northern region hasfaster S-wave velocities than the southwestern part of the CVL.
In summary, there is a northeast–southwest fast direction ofanisotropy throughout Cameroon except along the western and cen-tral parts of the CVL, where the splitting is rotated to north–south.The region between the Congo Craton and the CVL is character-ized by greater variation in splitting magnitude and direction thanelsewhere in Cameroon.
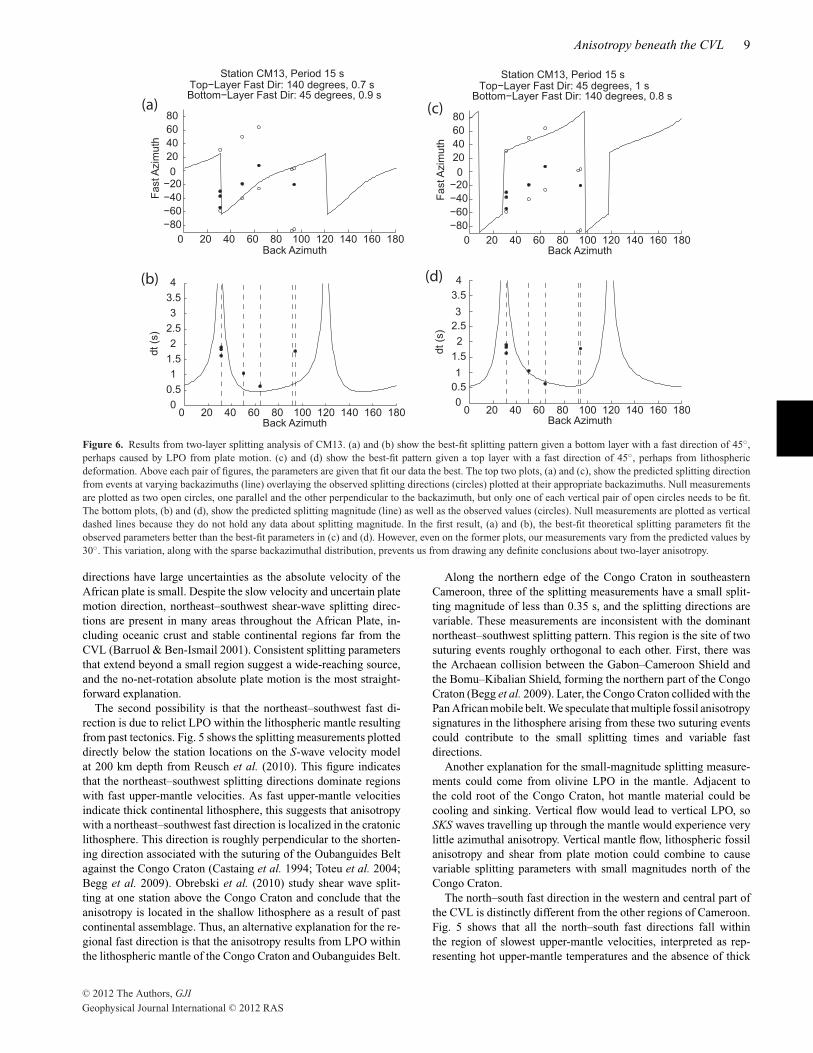
Two-layer analysis does not provide any additional insight to thenature of the splitting at each station. Since northeast–southwestsplitting directions are found in regions surrounding the CVL, wetried to fit the measurements on the volcanic line with two layer mod-els that include either an upper or lower layer with a 45# splittingdirection. Figs 6(a) and (b) show the best-fit two-layer parametersfor all the individual splitting parameters measured at station CM13given a bottom layer with 45# splitting direction, and Figs 6(c) and(d) show the best-fit parameters given a top layer with 45# splittingdirection. For this station, a bottom layer with splitting at 45# pro-vides the better fit. This bottom layer, with a splitting magnitudeof 0.9 s, combined with a top layer of 140# splitting direction and0.7 s splitting magnitude provide a pattern of splitting that very
roughly corresponds with our data. However, several individualmeasurements are over 30# away from their expected value giventhis simple two-layer model. Without more data, it is difficult todetermine if the two-layer model is an appropriate explanation or ifthe rough fit is just a coincidence.
At other stations, the best-fit two-layer results provide an equallypoor or worse fit with the observed data. The A-quality stations witha large number of splitting measurements all have tight confidenceintervals for one layer of anisotropy. With two layers, individualmeasurements stray far from the predicted values. Many of theB- and C-quality stations, like CM13, have too few measurementsat a limited range of backazimuths to conclude whether or not atwo-layer model is appropriate. In addition, the best-fit two-layermodels are not coherent between nearby stations. Fitting the patternto a reasonable geologic model would not be possible. Our studydoes not preclude two layers of anisotropy beneath the CVL, but thedata are too insufficient and inconsistent to derive a well-constrainedtwo-layer model.
6 D I S C U S S I O N
The observed shear wave splitting most likely results fromanisotropy in the upper mantle. About two-thirds of the splitting
C" 2012 The Authors, GJIGeophysical Journal International C" 2012 RAS
8 F. W. Koch et al.
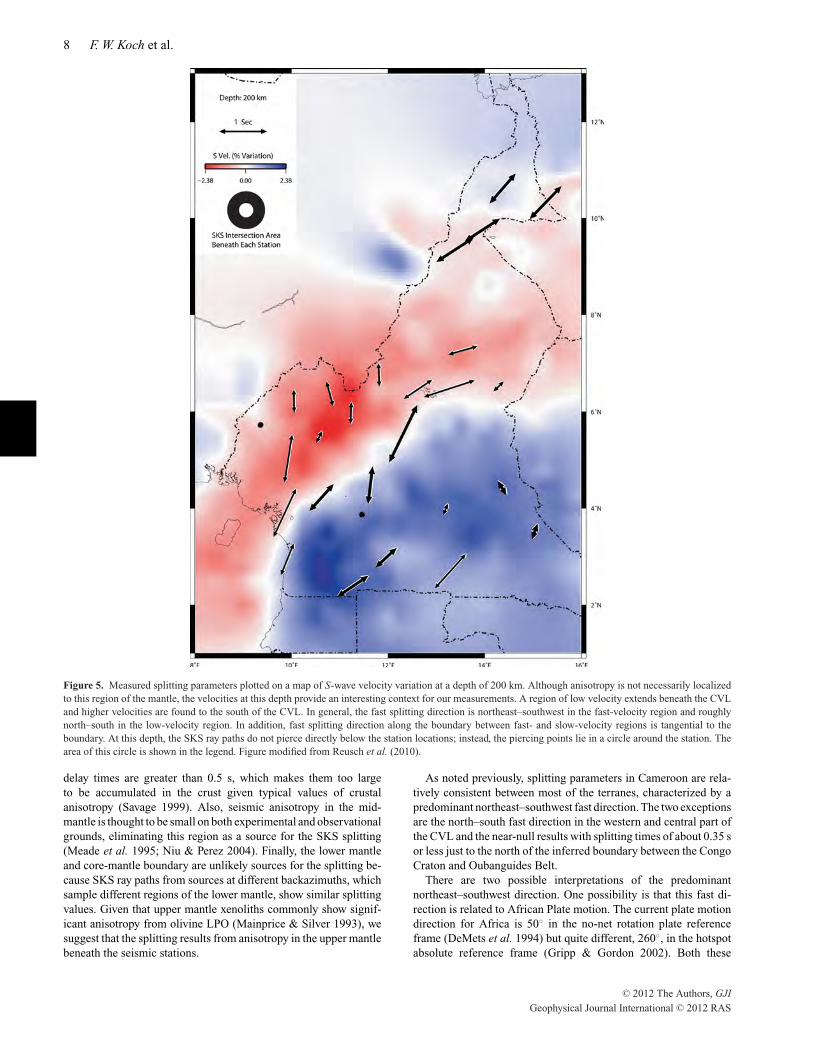
Figure 5. Measured splitting parameters plotted on a map of S-wave velocity variation at a depth of 200 km. Although anisotropy is not necessarily localizedto this region of the mantle, the velocities at this depth provide an interesting context for our measurements. A region of low velocity extends beneath the CVLand higher velocities are found to the south of the CVL. In general, the fast splitting direction is northeast–southwest in the fast-velocity region and roughlynorth–south in the low-velocity region. In addition, fast splitting direction along the boundary between fast- and slow-velocity regions is tangential to theboundary. At this depth, the SKS ray paths do not pierce directly below the station locations; instead, the piercing points lie in a circle around the station. Thearea of this circle is shown in the legend. Figure modified from Reusch et al. (2010).
delay times are greater than 0.5 s, which makes them too largeto be accumulated in the crust given typical values of crustalanisotropy (Savage 1999). Also, seismic anisotropy in the mid-mantle is thought to be small on both experimental and observationalgrounds, eliminating this region as a source for the SKS splitting(Meade et al. 1995; Niu & Perez 2004). Finally, the lower mantleand core-mantle boundary are unlikely sources for the splitting be-cause SKS ray paths from sources at different backazimuths, whichsample different regions of the lower mantle, show similar splittingvalues. Given that upper mantle xenoliths commonly show signif-icant anisotropy from olivine LPO (Mainprice & Silver 1993), wesuggest that the splitting results from anisotropy in the upper mantlebeneath the seismic stations.
As noted previously, splitting parameters in Cameroon are rela-tively consistent between most of the terranes, characterized by apredominant northeast–southwest fast direction. The two exceptionsare the north–south fast direction in the western and central part ofthe CVL and the near-null results with splitting times of about 0.35 sor less just to the north of the inferred boundary between the CongoCraton and Oubanguides Belt.
There are two possible interpretations of the predominantnortheast–southwest direction. One possibility is that this fast di-rection is related to African Plate motion. The current plate motiondirection for Africa is 50# in the no-net rotation plate referenceframe (DeMets et al. 1994) but quite different, 260#, in the hotspotabsolute reference frame (Gripp & Gordon 2002). Both these
C" 2012 The Authors, GJIGeophysical Journal International C" 2012 RAS
Anisotropy beneath the CVL 9
Figure 6. Results from two-layer splitting analysis of CM13. (a) and (b) show the best-fit splitting pattern given a bottom layer with a fast direction of 45#,perhaps caused by LPO from plate motion. (c) and (d) show the best-fit pattern given a top layer with a fast direction of 45#, perhaps from lithosphericdeformation. Above each pair of figures, the parameters are given that fit our data the best. The top two plots, (a) and (c), show the predicted splitting directionfrom events at varying backazimuths (line) overlaying the observed splitting directions (circles) plotted at their appropriate backazimuths. Null measurementsare plotted as two open circles, one parallel and the other perpendicular to the backazimuth, but only one of each vertical pair of open circles needs to be fit.The bottom plots, (b) and (d), show the predicted splitting magnitude (line) as well as the observed values (circles). Null measurements are plotted as verticaldashed lines because they do not hold any data about splitting magnitude. In the first result, (a) and (b), the best-fit theoretical splitting parameters fit theobserved parameters better than the best-fit parameters in (c) and (d). However, even on the former plots, our measurements vary from the predicted values by30#. This variation, along with the sparse backazimuthal distribution, prevents us from drawing any definite conclusions about two-layer anisotropy.
directions have large uncertainties as the absolute velocity of theAfrican plate is small. Despite the slow velocity and uncertain platemotion direction, northeast–southwest shear-wave splitting direc-tions are present in many areas throughout the African Plate, in-cluding oceanic crust and stable continental regions far from theCVL (Barruol & Ben-Ismail 2001). Consistent splitting parametersthat extend beyond a small region suggest a wide-reaching source,and the no-net-rotation absolute plate motion is the most straight-forward explanation.
The second possibility is that the northeast–southwest fast di-rection is due to relict LPO within the lithospheric mantle resultingfrom past tectonics. Fig. 5 shows the splitting measurements plotteddirectly below the station locations on the S-wave velocity modelat 200 km depth from Reusch et al. (2010). This figure indicatesthat the northeast–southwest splitting directions dominate regionswith fast upper-mantle velocities. As fast upper-mantle velocitiesindicate thick continental lithosphere, this suggests that anisotropywith a northeast–southwest fast direction is localized in the cratoniclithosphere. This direction is roughly perpendicular to the shorten-ing direction associated with the suturing of the Oubanguides Beltagainst the Congo Craton (Castaing et al. 1994; Toteu et al. 2004;Begg et al. 2009). Obrebski et al. (2010) study shear wave split-ting at one station above the Congo Craton and conclude that theanisotropy is located in the shallow lithosphere as a result of pastcontinental assemblage. Thus, an alternative explanation for the re-gional fast direction is that the anisotropy results from LPO withinthe lithospheric mantle of the Congo Craton and Oubanguides Belt.
Along the northern edge of the Congo Craton in southeasternCameroon, three of the splitting measurements have a small split-ting magnitude of less than 0.35 s, and the splitting directions arevariable. These measurements are inconsistent with the dominantnortheast–southwest splitting pattern. This region is the site of twosuturing events roughly orthogonal to each other. First, there wasthe Archaean collision between the Gabon–Cameroon Shield andthe Bomu–Kibalian Shield, forming the northern part of the CongoCraton (Begg et al. 2009). Later, the Congo Craton collided with thePan African mobile belt. We speculate that multiple fossil anisotropysignatures in the lithosphere arising from these two suturing eventscould contribute to the small splitting times and variable fastdirections.
Another explanation for the small-magnitude splitting measure-ments could come from olivine LPO in the mantle. Adjacent tothe cold root of the Congo Craton, hot mantle material could becooling and sinking. Vertical flow would lead to vertical LPO, soSKS waves travelling up through the mantle would experience verylittle azimuthal anisotropy. Vertical mantle flow, lithospheric fossilanisotropy and shear from plate motion could combine to causevariable splitting parameters with small magnitudes north of theCongo Craton.
The north–south fast direction in the western and central part ofthe CVL is distinctly different from the other regions of Cameroon.Fig. 5 shows that all the north–south fast directions fall withinthe region of slowest upper-mantle velocities, interpreted as rep-resenting hot upper-mantle temperatures and the absence of thick
C" 2012 The Authors, GJIGeophysical Journal International C" 2012 RAS
10 F. W. Koch et al.
continental lithosphere by Reusch et al. (2010). We can interpret thenorth–south splitting in the western and central CVL as resultingfrom LPO due to mantle flow within the asthenosphere; in this re-gion the continental lithosphere, which shows northeast–southwestfast directions based on surrounding measurements, is thin or ab-sent. In comparison, the northeastern CVL, in the region of theAdamawa Plateau, has a smaller velocity anomaly and shows amore typical northeast–southwest fast direction. The splitting re-sults along the CVL are inconsistent with mantle flow along theaxis of the line, precluding models where hot material flows lat-erally from East Africa (Ebinger & Sleep 1998) or from a singlehotspot in the middle of the line (Burke 2001). Also, anisotropyfrom melt-filled cracks oriented along the strike of the CVL can beruled out. Gao et al. (1997) suggest this interpretation to explainrift-parallel seismic anisotropy. It does not apply at the CVL wheresplitting is rotated away from the direction of the line.
North–south mantle flow could be attributed to convection drivenby thermal gradients between the asthenosphere and the adjacentCongo Craton (Reusch et al. 2010). In the simplest case, one mightexpect the edge-driven flow pattern in the mantle to be roughlyperpendicular to the CVL and the edge of the Congo Craton, ornorthwest–southeast, rather than the observed north–south direc-tion. It is possible that the north–south fast direction reflects acombination of flow in the mantle perpendicular to the CVL, ina northwest–southeast direction, and northeast–southwest-orientedanisotropy characteristic of the surrounding parts of Africa. How-ever, as described previously, it is impossible to separate these twocontributions into a simple two-layer model for anisotropy beneaththe CVL with our limited data. We examined the possibility thatthe northeast–southwest component was an upper layer, reflectinganisotropic lithosphere deformation. We also tried this componentas a lower layer that could be interpreted as LPO from relict platemotion. Neither of these models provided satisfactory results, sug-gesting an interpretation more complex than two anisotropic layers.
We suggest that the pattern of convection and of strain-inducedupper-mantle LPO due to the thermal gradient at the edge of theCongo Craton is not as simple as envisioned in typical conceptualmodels. Eddies induced in the low-viscosity asthenosphere by theedge of the cold craton may not necessarily involve a well-developedconvective roll with flow perpendicular to the craton edge. The ob-served splitting pattern in the CVL likely results from more com-plicated small-scale asthenospheric convection in this locally hotregion driven at least in part by the cold edge of the Congo Craton,but perhaps also influenced by other factors in the upper mantle.The splitting measurements just north of the craton reinforce thisidea. The magnitude of azimuthal anisotropy is small, reflecting theregion where mantle material sinks, but the directions are variableas if the convection is not a simple, cylindrical roll.
7 C O N C LU S I O N S
Previous studies of the CVL suggest that this volcanic line was notformed by a simple hotspot model. We have used SKS and SKKSsplitting measurements to help constrain mantle deformation andflow beneath the CVL and surrounding regions. Splitting parametersfrom this paper preclude models that involve mantle flow along theaxis of the CVL, either from East Africa or a single hotspot inthe middle of the line. These models would require fast splittingdirections to be parallel to the direction of the line or radial froma single point. Instead, we see fast directions roughly north–southbeneath the CVL surrounded by northeast–southwest fast directionsin areas of Africa with thick, stable lithosphere.
Away from the CVL, explanations for the predominantnortheast–southwest seismic anisotropy include olivine LPO relatedto absolute plate motion and lithospheric fabric related to previoustectonics. Although we cannot constrain the depth of the anisotropy,there is a strong correspondence between these northeast–southwestsplitting parameters and the fast, cold lithosphere in Fig. 5. Simi-lar splitting parameters are seen in other stable, cratonic regions ofAfrica (Barruol & Ben-Ismail 2001).
At the CVL, the splitting results support small-scale convectionin the asthenosphere. The convection could be driven by the coldedge of the Congo Craton, as in the model presented by King &Ritsema (2000) and favoured by Reusch et al. (2010). This wouldfit with the north–south splitting direction along the volcanic lineand the small-magnitude splits north of the craton.
One factor limiting our interpretation is the lack of knowledgeabout the oceanic section of the CVL, which stretches far into theAtlantic Ocean away from African continental crust. Without know-ing the SKS splitting parameters for the oceanic part of the CVL, itsrelationship to the rest of the line and therefore the entire CVL’s re-lationship to the Congo Craton cannot be determined with certainty.Thus, our analysis is limited to the contrast between the continentalCVL and the Congo Craton. Future studies of the oceanic sectionof the CVL may provide additional insights. Also, splitting obser-vations from Nigeria, north of the CVL, could constrain our model.These measurements could expose the far side of a coherent convec-tive cell north of the Congo Craton, or they could show the familiarnortheast–southwest pattern.
A C K N OW L E D G M E N T S
We thank Graham Stuart, Matthew Fouch and one anonymous re-viewer for their input. We thank Garrett Euler, Alain-Pierre Tokam,Angela Reusch, Mike Fort and many other individuals for assistancewith fieldwork. Portable seismic instrumentation for this project wasobtained from the PASSCAL program of the Incorporated ResearchInstitutions in Seismology (IRIS), and data handling assistance wasprovided by the IRIS Data Management System. We thank GeorgeHelffrich for use of his shear wave splitting analysis code, and PaulWessel, Walter H. F. Smith and the other authors of GMT. This workwas funded by the National Science Foundation under grants EAR0310272 and EAR 0310094.
R E F E R E N C E S
Ballmer, M.D., van Hunen, J., Ito, G., Bianco, T.A. & Tackley, P.J., 2009.Intraplate volcanism with complex age-distance patterns: a case forsmall-scale sublithospheric convection, Geochem. Geophys. Geosyst., 10,Q06015, doi:10.1029/2009GC002386.
Barruol, G. & Ben-Ismail, W., 2001. Upper mantle anisotropy beneath theAfrican IRIS and Geoscope stations, Geophys. J. Int., 146, 549–561.
Begg, G.C. et al., 2009. The lithospheric architecture of Africa: seismic to-mography, mantle petrology, and tectonic evolution, Geosphere, 5, 23–50.
Bonatti, E., Harrison, C.G.A., Fisher, D.E., Honnorez, J., Schilling, J.-G.,Stipp, J.J. & Zentilli, M., 1977. Easter volcanic chain (Southeast Pacific):A mantle hot line, J. geophys. Res., 82, 2357–2478.
Boukeke, D.B., 1994. Structures crustales d’ Afrique Centrale deduites desanomalies gravimetriques et magnetiques: le domaine precambrien de laRepublique Centrafricaine et du Sud Cameroun, PhD thesis, Univ. ParisXI, Orsay.
Browne, J.D. & Fairhead, J.D., 1983. Gravity study of the Central AfricanRift System: a model of continental disruption, 1, The Ngaoundere andAbu Gabra Rifts, Tectonophysics, 94, 187–203.
C" 2012 The Authors, GJIGeophysical Journal International C" 2012 RAS
Anisotropy beneath the CVL 11
Burke, K., 2001. Origin of the Cameroon line of volcano-capped swells,J. Geol., 109, 349–362.
Burke, K., Dessauvagie, T.F.J. & Whiteman, A.J., 1971. The opening of theGulf of Guinea and the geological history of the Benue Trough and Nigerdelta, Nature Phys. Sci., 233, 51–55.
Castaing, C., Feybesse, J.L., Thieblemont, D., Triboulet, C. & Chevre-mont, P., 1994. Palaeogeographical reconstructions of the Pan-African/Brasiliano orogen: closure of an oceanic domain or intracontinen-tal convergence between major blocks?, Precambrian Res., 67, 327–344.
Cornen, G. & Maury, R.C., 1980. Petrology of the volcanic island of An-nobon, Gulf of Guinea, Marine Geol., 36, 253–267.
DeMets, C., Gordon, R.G., Argus, D.F. & Stein, S., 1994. Effect of recentrevisions to the geomagnetic reversal time scale on estimate of currentplate motions, Geophys. Res. Lett., 21, 2191–2194.
Ebinger, C.J. & Sleep, N.H., 1998. Cenozoic magmatism throughout eastAfrica resulting from impact of a single plume, Nature, 395, 788–791.
Fairhead, J.D., 1988. Mesozoic plate tectonic reconstructions of the CentralSouth Atlantic Ocean—the role of the West and Central African Riftsystem, Tectonophysics, 155, 181–191.
Fairhead, J.D. & Okereke, C.S., 1987. A regional gravity study of the WestAfrican rift system in Nigeria and Cameroon and its tectonic interpreta-tion, Tectonophysics, 143, 141–159.
Fitton, J.D. & Dunlop, H.M., 1985. The Cameroon line, West Africa, andits bearing on the origin of oceanic and continental alkali basalt, Earthplanet. Sci. Lett., 72, 23–38.
Forte, A.M., Quere, S., Moucha, R., Simmons, N.A., Grand, S.P., Mitrovica,J.X. & Rowley, D.B., 2010. Joint seismic-geodynamic-mineral physicalmodelling of African geodynamics: a reconciliation of deep-mantle con-vection with surface geophysical constraints, Earth planet. Sci. Lett., 295,329–341.
Gao, S. et al., 1997. SKS splitting beneath continental rift zones, J. geophys.Res., 102, 22 781–22 798.
Gripp, A.E. & Gordon, R.G., 2002. Young tracks of hotspots and currentplate velocities, Geophys. J. Int., 150, 321–361.
King, S.D. & Anderson, D.L., 1998. Edge-driven convection, Earth planet.Sci. Lett., 160, 289–296.
King, S.D. & Ritsema, J., 2000. African hot spot volcanism: small-scale con-vection in the upper mantle beneath the cratons, Science, 290, 1137–1140.
Koppers, A.A.P., Staudigel, H., Pringle, M. & Wijbrans, J.R., 2003. Short-lived and discontinuous intraplate volcanism in the South Pacific: hotspots or extensional volcanism? Geochem. Geophys. Geosyst., 4, 1089,doi:10.1029/2003GC000533.
Lee, D.-C., Halliday, A., Fitton, J.G. & Poli, G., 1994. Isotopic variationswith distance and time in the volcanic islands of the Cameroon line:evidence for a mantle plume origin, Earth planet. Sci. Lett., 123, 119–138.
Mainprice, D. & Silver, P.G., 1993. Interpretation of SKS-waves using sam-ples from the subcontinental lithosphere, Phys. Earth planet. Inter., 78,257–280.
Marzoli, A., Renne, P.R., Piccirillo, E.M., Francesca, C., Bellieni, G., Melfi,A.J., Nyobe, J.B. & N’ni, J., 1999. Silicic magmas from the continentalCameroon Volcanic Line (Oku, Bambouto and Ngaoundere): Ar-40-Ar-39 dates, petrology, Sr-Nd-O isotopes and their petrogenetic significance,Contr. Mineral. Petrol., 135, 133–150.
Meade, C., Silver, P.G. & Kaneshima, S., 1995. Laboratory and seismo-logical observations of lower mantle isotropy, Geophys. Res. Lett., 22,1293–1296.
Meyers, J.B., Rosendahl, B.R., Harrison, C.G.A. & Ding, Z.-D., 1998.Deep-imaging seismic and gravity results from the offshore CameroonVolcanic Line, and speculation of African hotlines, Tectonophysics, 284,31–63.
Muller, R.D., Royer, J. & Lawver, L.A., 1993. Revised plate motions relativeto hotspots from combined Atlantic and Indian Ocean hotspot tracks,Geology, 21, 275–278.
Ngako, V., Njonfang, E., Tongwa, A.T., Affaton, P. & Nnange, J.M., 2006.The North-South Paleozoic to Quaternary trend of alkaline magmatismfrom Niger-Nigeria to Cameroon: complex interaction between hotspotsand Precambrian faults, J. African Earth Sci., 45, 241–256.
Niu, F. & Perez, A.M., 2004. Seismic anisotropy in the lower mantle: a
comparison of waveform splitting of SKS and SKKS, Geophys. Res.Lett., 31, L24612, doi:10.1029/2004GL021196.
Nsifa, N.E., 2006. Magmatisme et Evolution geodynamique de l’Archeen auProterozoıque de la bordure nord-ouest du Craton du Congo (Complexedu Ntem) au Sud-Ouest Cameroun, PhD thesis, Universite de Yaounde.
Nzenti, J.P., Barbey, P., Macaudiere, J. & Soba, D., 1988. Origin and evolu-tion of the late precambrian high-grade Yaounde Gneisses (Cameroon),Precambrian Res., 38, 91–109.
Obrebski, M., Kiselev, S., Vinnik, L. & Montagner, J.-P., 2010. Anisotropicstratification beneath Africa from joint inversion of SKS and P receiverfunctions, J. geophys. Res., 115, B09313, doi:10.1029/2009JB006923.
Okal, E.A. & Batiza, R., 1987. Hotspots: the first 25 years, in Seamounts,Islands, and Atolls, pp. 405, eds Keating, B., Fryer, P., Batiza, R. &Beohlert, G., American Geophysical Union, Washington, DC.
Poidevin, J.L., 1983. La tectonique pan-africaine a la bordure nord du cratoncongolais: l’orogenese des Oubanguides, in 12th colloque on the AfricanGeology.
Restivo, A. & Helffrich, G., 1999. Teleseismic shear wave splitting mea-surements in noisy environments, Geophys. J. Int., 137, 821–830.
Reusch, A.M., 2009. Using seismic data to interpret the mechanism forCenozoic volcanism beneath Ross Island, Antarctica and the CameroonVolcanic Line, West Africa, PhD thesis, Pennsylvania State University,University Park, PA.
Reusch, A.M., Nyblade, A.A., Wiens, D.A., Shore, P.J., Ateba, B.,Tabod, C.T. & Nnange, J.M., 2010. Upper mantle structure be-neath Cameroon from body wave tomography and the origin of theCameroon Volcanic Line, Geochem. Geophys. Geosyst., 11, Q10W07,doi:10.1029/2010GC003200.
Savage, M.K., 1999. Seismic anisotropy and mantle deformation: what havewe learned from shear wave splitting?, Rev. Geophys., 37, 65–106.
Silver, P.G. & Chan, W.W., 1988. Implications for continental structure andevolution from seismic anisotropy, Nature, 335, 34–39.
Silver, P.G. & Chan, W.W., 1991. Shear wave splitting and subcontinentalmantle deformation, J. geophys. Res., 96, 16 429–16 454.
Silver, P.G. & Savage, M.K., 1994. The interpretation of shear-wave splittingparameters in the presence of two anistropic layers, Geophys. J. Int., 119,949–963.
Stuart, G., Fairhead, J.D., Dorbath, C. & Dorbath, C., 1985. A seismicrefraction study of the crustal structure associated with the Adamawaplateau and Garoua rift, Cameroon, West Africa, Geophys. J. R. astr. Soc.,81, 1–12.
Tadjou, J.M., Manguelle-Dicoum, E., Tabod, C.T., Nouayou, R., Kamguia,J., Njandjock, N.P. & Ndougsa, M.T., 2004. Gravity modelling along thenorthern margin of the Congo Craton, South Cameroon, J. CameroonAcad. Sci., 4, 51–60.
Tadjou, J.M., Nousayou, R., Kamguia, J., Kande, H.L. & Manguelle-Dicoum, E., 2009. Gravity analysis of the boundary between the CongoCraton and the Pan-African Belt of Cameroon, Austrian J. Earth Sci.,102, 71–79.
Tchameni, R., Mezger, K., Nsifa, N.E. & Pouclet, A., 2000. Neoarchaeancrustal evolution in the Congo craton: evidence from K-rich granitoidsof the Ntem complex, Southern Cameroon, J. African Earth Sci., 30,133–147.
Tchameni, R., Mezger, K., Nsifa, N.E. & Pouclet, A., 2001. Crustal origin ofEarly Proterozoic syenites in the Congo Craton (Ntem Complex), SouthCameroon, Lithos, 57, 23–42.
Tibi, R., Larson, A., Nyblade, A.A., Shore, P.J., Wiens, D.A., Nnange, J.M.,Tabod, C.T. & Ateba, B., 2005. A broadband seismological investigationof the Cameroon volcanic line, EOS, Trans. Am. geophys. Un., 86, 52,Fall Meeting Suppl. Abstract V13B-0659.
Tokam, A.-P.K., Tabod, C.T., Nyblade, A.A., Julia, J., Wiens, D.A. &Pasyanos, M.E., 2010. Structure of the crust beneath Cameroon, WestAfrica, from the inversion of Rayleigh wave group velocities and receiverfunctions, Geophys. J. Int, 183, 1061–1076.
Tommasi, A., Mainprice, D., Canova, G. & Chastel, Y., 2000. Viscoplasticself-consistent and equilibrium-based modeling of olivine lattice pre-ferred orientations: implications for the upper mantle seismic anisotropy,J. geophys. Res., 105, 7893–7908.
C" 2012 The Authors, GJIGeophysical Journal International C" 2012 RAS

12 F. W. Koch et al.
Toteu, S.F., Penaye, J. & Djomani, Y.H.P., 2004. Geodynamic evolution ofthe Pan-African belt in central Africa with special reference to Cameroon,Canadian J. Earth Sci., 41, 73–85.
Vicat, J.P., Leger, J.M., Nsifa, E., Piguet, P., Nzenti, J.P., Tchameni, R.& Pouclet, A., 1996. Distinction within the Congo craton in South-WestCameroon of two doleritic episodes initiating the Eburnean (Paleoprotero-
zoic) and Pan-African (Neoproterozoic) orogenic cycles, Compte Rendude l’Academie des Sci., Serie IIA, 323, 575–582.
Wilson, J.T., 1963. A possible origin of the Hawaiian islands, Canadian J.Phys., 41, 863–870.
Zhang, S. & Karato, S.-I., 1995. Lattice preferred orientation of olivineaggregates deformed in simple shear, Nature, 377, 774–777.
C" 2012 The Authors, GJIGeophysical Journal International C" 2012 RAS