kinetics of catalytic decarboxylation of naphthenic acids over
TRANSCRIPT
Citation: Hassan, N.O.; Challiwala,
M.; Beshir, D.M.; Elbashir, N.O.
Kinetics of Catalytic Decarboxylation
of Naphthenic Acids over HZSM-5
Zeolite Catalyst. Catalysts 2022, 12,
495. https://doi.org/10.3390/
catal12050495
Academic Editor: Anton Naydenov
Received: 21 March 2022
Accepted: 20 April 2022
Published: 28 April 2022
Publisher’s Note: MDPI stays neutral
with regard to jurisdictional claims in
published maps and institutional affil-
iations.
Copyright: © 2022 by the authors.
Licensee MDPI, Basel, Switzerland.
This article is an open access article
distributed under the terms and
conditions of the Creative Commons
Attribution (CC BY) license (https://
creativecommons.org/licenses/by/
4.0/).
catalysts
Article
Kinetics of Catalytic Decarboxylation of Naphthenic Acids overHZSM-5 Zeolite CatalystNihad Omer Hassan 1, Mohamed Challiwala 2,3, Dhallia Mamoun Beshir 1 and Nimir O. Elbashir 1,2,3,*
1 Department of Petroleum Transportation and Refining Engineering, Sudan University of Science andTechnology, Khartoum P.O. Box 407, Sudan; [email protected] (N.O.H.);[email protected] (D.M.B.)
2 Chemical Engineering and Petroleum Engineering Program, Texas A&M University at Qatar,Doha P.O. Box 23874, Qatar; [email protected]
3 TEES Gas & Fuels Research Center, Texas A&M University, TAMU 3251, College Station, TX 77843, USA* Correspondence: [email protected]
Abstract: Naphthenic acids are naturally occurring carboxylic acids in crude oil with cyclic oraromatic rings in their structure. These carboxylic acids are responsible for the acidity of crude oil,leading to corrosion problems in refinery equipment and the deactivation of catalysts while creatinga continuous need for maintenance. Therefore, removing naphthenic acids has become an importantrequirement in refining acidic crude oil. In this paper, experiments are conducted to investigate theuse of HZSM-5 zeolite catalyst to reduce the total acid number (TAN) of a typical acidic crude oilobtained from Al-Fula blocks in Western Sudan. TAN is an important metric signifying the acidity ofcrude oil. A full factorial design of the experiment (DOE) framework enabled a better understandingof the efficacy of the catalyst at three parametric levels (reaction temperature: 250-270-300 ◦C, reactiontime: 2-3-4 h, and oil:catalyst weight ratio: 20-22-25 g/g). The results demonstrate that the HZSM-5 zeolite catalyst provides up to 99% removal of naphthenic acids via the decarboxylation route.Additionally, the removal efficiency increases with increasing temperature and residence time. Theacidity of the crude oil was shown to decrease after treatment with the catalyst for four hrs.; from6.5 mg KOH/g crude to 1.24; 0.39 and 0.17 mg KOH/g at 250; 270 and 300 ◦C, respectively. A sharpdecrease of TAN was observed at the oil catalyst mass ratio of 20 g/g at 250 ◦C, and almost completeconversion of acids was achieved after 4 hrs. Another experiment at 270 ◦C showed a converserelationship between the oil:catalyst ratio and acid removal; suggesting the activation of side reactionsat higher temperature conditions catalyzed by excess acid. Finally; a Langmuir–Hinshelwood (LH)kinetic model has been developed to enable rapid prediction of the performance of the HZSM-5zeolite catalyst for decarboxylation reaction. The model has also been validated and tested in ASPEN®
software for future simulation and scalability studies.
Keywords: naphthenic acids; TAN; catalytic decarboxylation; zeolite catalyst; acidity; corrosion
1. Introduction
Crude oil is a complex mixture of hydrocarbons and inorganics, such as sulfur, chlo-rine, nitrogen compounds, trace metals, and naphthenic acids [1]. In terms of acidityclassification, crude oil could be non-acidic (high quality) or acidic (low quality). Theacidity of the crude oil is characterized by its total acid number (TAN). As per the AmericanStandard for Testing and Materials (ASTM) D664–1989, the TAN is determined by calculat-ing the milligrams of KOH required to neutralize the acidity of one gram oil sample [2].Crude oils with TAN of more than 0.5 mg KOH/g are considered acidic, and above 1 mgKOH/g are classified as highly acidic [3–7]. High TAN crude oils are generally found inmany places worldwide, such as the United States, Venezuela, the North Sea, Canada,West Africa, India, China, and Russia [8,9]. The acidic crude oils are less desirable andhave lower prices than conventional crude oils because they cause significant corrosion
Catalysts 2022, 12, 495. https://doi.org/10.3390/catal12050495 https://www.mdpi.com/journal/catalysts
Catalysts 2022, 12, 495 2 of 23
issues [9,10]. Therefore, they create a continuous need for maintenance and could alsoresult in the poisoning of the catalysts in the downstream refining process [11]. However,the depletion of high-quality crude oil has shifted attention towards utilizing acidic crudeoil by making it economically acceptable [12].
The presence of naphthenic acids, among many other carboxylic acids, makes thecrude oil acidic [13–15]. The naphthenic acids are cyclic or aromatic compounds witha general formula CnH2n+ZO2, where n is the number of carbon atoms, and Z refers tohydrogen deficiency due to the formation of rings. Z has a value of 0, or a negative evennumber integer, which varies between (0 and −12) [16–20]. The characterization andidentification of individual naphthenic acids in crude oil is an essential subject of severalresearch studies as they have significant structure and composition complexity [18,19].
Factors, such as temperature, concentration, and molecular weight influence thecorrosion characteristics of naphthenic acids. For example, at a temperature between200 and 400 ◦C, high acidity is observed, beyond which the decomposition of acid takesplace [15–17]. Similarly, the higher the concentration of the carboxylic acids and the lowerthe molecular weight (generally between 125–425 g/mol), the higher the acidic nature,which leads to corrosion [10]. Therefore, removing naphthenic acid from the crude oilis an important step to reduce the overall acidity of the crude oil. Many studies havebeen published on this subject. They are broadly classified under the following categories:(a) blending and inhibition, (b) physical methods, such as adsorption and liquid-liquidextraction, and (c) chemical methods, such as esterification, neutralization, and catalyticdecarboxylation [4,21].
Many refineries blend two different TAN crude oils to resolve the acidity problem;however, this method is suitable for slightly high TAN crude oil [22]. On the other hand,inhibition methods have two categories: (a) adding corrosion inhibitors or (b) upgradingequipment material to withstand corrosion. Inhibitors create problems in downstreamprocesses, as they tend to form emulsions and poison the catalyst. Corrosion-resistantmaterials, such as chromium and molybdenum can be used to upgrade the equipment, butthey are too expensive [2,23]. Although physical methods, such as adsorption and liquidextraction are viable options, they are not desirable because of the continuous need for newadsorbents and to meet the criteria for waste disposal [21]. Chemical conversion methodsvia neutralization with a base to convert the acid to salt and water has also been studied;however, since they cause emulsion challenges, an additional separation process would berequired. Esterification is also a costly option, as it requires a large quantity of alcohol forthe reaction [4,22].
Catalytic decarboxylation is a chemical conversion method that utilizes a catalyst toconvert acids to hydrocarbons and carbon dioxide. Essentially, the C-C bond in carboxylicacid is broken down to release CO2 gas in this reaction. Another possible definitionis replacing the carboxyl group (-COOH) with a hydrogen atom while releasing CO2gas [1,23,24]. Fu et al. [25] simulated decarboxylation reaction and hypothesized thatthe C-C bond existing in the acid structure is the weakest and most accessible to break.Among these C-C bonds, the one attached to the carboxyl group is the easiest to break, andtherefore, the carboxyl group is removed as CO2. Catalytic decarboxylation of differenttypes of carboxylic acids, such as benzoic acid by zeolite, acetic acid by ZrO2, and aceticacid by tungsten-based catalysts, have been reported in the literature [1,26,27].
As shown in Table 1, several studies published earlier focused on developing low-temperature, high selectivity, and more stable catalysts for the catalytic decarboxylationprocess [3]. Alkaline earth metal oxide, zinc oxide (ZnO), zeolite, Mg-Al hydrotalcite/γ-Al2O3, acidic solid, graphitic carbon nitride, and hybridized basic graphitic carbon nitridecoated on the acidic ferrierite zeolite have been shown good performance for catalyticdecarboxylation. The alkaline earth metal oxides (considered a low-temperature catalyst)demonstrated the complete removal of naphthenic acids. However, one limitation ofthese reactions is the co-production of metal naphthenates that tend to dissolve in thecrude oil and may lead to the fouling of the transportation pipelines. Consequently, high-
Catalysts 2022, 12, 495 3 of 23
pressure drops in the transportation network will result in maintenance challenges andhigh pumping costs [3,24]. Acidic solid catalysts have demonstrated effective performancefor decarboxylation of naphthenic acids with conversion up to 97%. Zeolite is a well-known acidic catalyst. Zeolite catalysts have attracted substantial scientific attention dueto their high surface area, adsorption capacity, non-toxic nature, non-corrosive nature,high-temperature stability, pore-structure, ease of regeneration, and ability to facilitatecations exchange. Moreover, Zeolites contain strong acid sites (bronsted acid sites) that canaid in reactions where proton transfer is required [25,28,29].
In an earlier study, Zhang et al. [1] demonstrated using ZSM-5 zeolite catalyst for thedecarboxylation of model naphthenic acid. Takemura et al. [28] used zeolite for catalyticdecarboxylation of benzoic acid. Zeolite catalysts find application in many processes,such as catalytic cracking, isobutane alkylation, isomerization of light gasoline and lightalkenes, and conversion of methanol to gasoline or olefins is relatively more accessible andconvenient for naphthenic acid removal [30].
Previous publications on catalytic decarboxylation over zeolite catalysts used modelnaphthenic acids dissolved in dodecane or model naphthenic acids dissolved in dieseloil [1,25]. Moreover, most of these studies were conducted on very small-scale reactors,e.g., a 9 mL batch reactor in Zhang et al.’s [1] study, and an 80 mL autoclave in Takemuraet al.’s [27] study. The uniqueness of the current study is that it has been conducted in alarger reactor (500 mL volume). More importantly, this work aimed to remove naphthenicacid from a real and highly acidic heavy crude oil instead of model compounds. Inaddition, a wider range of operating conditions (temperature, reaction time, and oil:catalystratio) were tested in the current work using a systematic Design of Experiments (DOE)framework. Finally, the study also covers the development of Langmuir–Hinshelwood(LH) kinetics of catalytic decarboxylation process utilizing the HZSM-5 zeolite catalystbased on experimental results. The model has also been incorporated in ASPEN® processsimulation to validate the performance and enable future scalability studies.
Table 1. Selected catalysts and the targeted naphthenic acid systems for the decarboxylation reactions.
Model Oil Catalyst System Total AcidConversion (%) Temperature (◦C) Reference
Benzoic acid Zeolite 80 mL Autoclave - 400 [27]
Model naphthenicacids dissolved
in dodecane
Alkaline earthmetal oxide
(CaO, MgO, BaO, SrO)
3/8- inch stainlesssteel tube reactor ~100 200–300 [31]
Model naphthenicAcids dissolved
in dodecaneZSM5 zeolite catalyst 9 mL Sealed glass
batch reactor 65% 200–300 [1]
2-naphthoic acid,cyclohexane
carboxylic acid,and cyclohexanepropionic acid.
Magnesium oxide(MgO)
2 mL sealed glasstube batch
reactors—stainlesssteel reactor (0.4
cm i.d. and 29 cmin length)
92.5% 150–250 [3]
Model naphthenicacids in diesel oil
Acidic solid catalyst(activated alumina
(γ-Al203)-quartz sands)
Fixed bed reaction 97% 460 [25]
Crude oil andindustrial
naphthenic acids
Mg–Alhydrotalcite/c-Al2O3
200 mL Autoclave 80% 330 [32]
Catalysts 2022, 12, 495 4 of 23
Table 1. Cont.
Model Oil Catalyst System Total AcidConversion (%) Temperature (◦C) Reference
Heavy crude oiland
naphthenic acids
Co-Mo/γ-Al2O3catalyst
Fixed bed reactor(1.0 cm in innerdiameter and 45
cm in length)
76.6% 250 [6]
Dodecane solvent(model chemicalhaving a similar
average molecularweight with crudeoil) NAs (mixturesof cyclopentyl and
cyclohexylcarboxylic
acids mainly)
Graphitic carbonnitride
100 mL Batchreactor 37.2% 250 [9]
A mixture ofdodecane solventand benzoic acid
(BA) and a mixtureof NAs
Hybridizedheterogeneous basic
graphitic carbonnitride coated on
the acidicferrierite zeolite
100 mL Batchreactor 54.4% 300 [33]
Bitumen derivedheavy vacuum gas
oil (HVGO)
Alkaline earth metaloxides and ZnO 300-mL Autoclave 8.5% 350 [24]
2. Results and Discussions
This section discusses the experimental results of the decarboxylation of naphthenicacid in the acidic crude oil sample. Firstly, the effect of reaction parameters, i.e., temperature,time, and oil:catalyst ratio, are presented. The evaluation is conducted in terms of reductionin TAN number. Next, a systematic DOE framework of 33 designs is implemented toidentify suitable conditions for each parameter that result in the highest reduction of TAN.Finally, an LH kinetics model is developed to rapidly predict the results in future simulationand scalability assessments.
2.1. Naphthenic Acid Removal Assessment2.1.1. Effect of Reaction Temperature
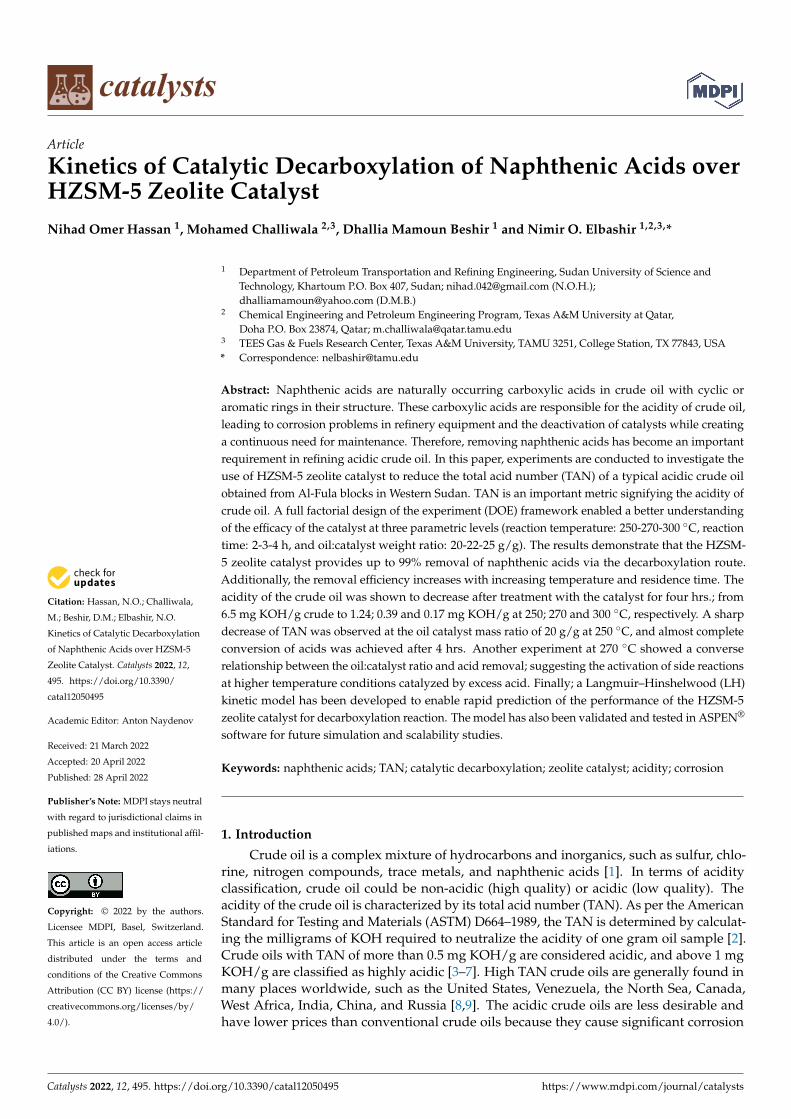
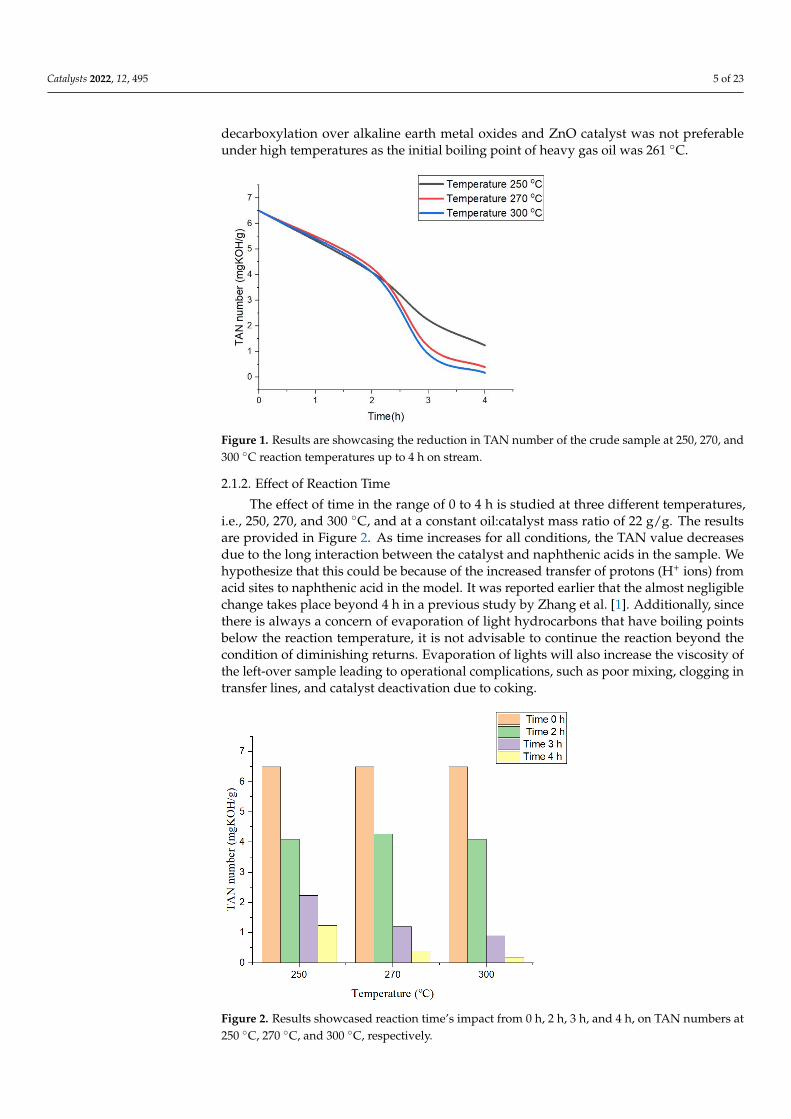
The effect of temperature on the deacidification process is studied at three levels:250 ◦C, 270 ◦C, and 300 ◦C, at oil:catalyst mass ratio of 22 g/g over a time on a stream of4 hrs. The result of TAN dependency on reaction temperature is provided in Figure 1. Asignificant decrease in TAN occurs at all temperature conditions during the four hours ofreaction. Specifically, the crude oil original TAN of 6.5 mg KOH/g decreases to 1.24, 0.39,and 0.17 at 250 ◦C, 270 ◦C, and 300 ◦C, respectively, during the decarboxylation reactionusing the HZSM-5 catalyst. Additionally, all three temperatures have the same effect on theremoval process during the first and second hours of the operation, wherein, the TAN isapproximately 4.1 mg KOH/g after two hours for all three temperatures. A noticeable effectof temperature is seen at 270 ◦C, and 300 ◦C temperatures, wherein up to 80% additionalTAN removal takes place compared to 250 ◦C after 4 h. However, Zhang et al. [1] reportedsimilar results for a different catalyst. Zhang et al. [1] reported that the naphthenic acidremoval rate increases with increased temperature and reaches a maximum value at 300 ◦C.These results also corroborate with Ding et al. [24]. They reported that the naphthenic acidremoval rate increased with temperature from 250 to 360 ◦C. It should be noted that thecatalytic decarboxylation reaction is not preferable over 300 ◦C, as beyond this temperature,hydrocarbons present in the crude oil may decompose. Ding et al. [24] stated that catalytic
Catalysts 2022, 12, 495 5 of 23
decarboxylation over alkaline earth metal oxides and ZnO catalyst was not preferableunder high temperatures as the initial boiling point of heavy gas oil was 261 ◦C.
Catalysts 2022, 12, x FOR PEER REVIEW 5 of 24
Figure 1. Results are showcasing the reduction in TAN number of the crude sample at 250, 270, and
300 °C reaction temperatures up to 4 h on stream.
2.1.2. Effect of Reaction Time
The effect of time in the range of 0 to 4 h is studied at three different temperatures,
i.e., 250, 270, and 300 °C, and at a constant oil:catalyst mass ratio of 22 g/g. The results are
provided in Figure 2. As time increases for all conditions, the TAN value decreases due to
the long interaction between the catalyst and naphthenic acids in the sample. We
hypothesize that this could be because of the increased transfer of protons (H+ ions) from
acid sites to naphthenic acid in the model. It was reported earlier that the almost negligible
change takes place beyond 4 h in a previous study by Zhang et al. [1]. Additionally, since
there is always a concern of evaporation of light hydrocarbons that have boiling points
below the reaction temperature, it is not advisable to continue the reaction beyond the
condition of diminishing returns. Evaporation of lights will also increase the viscosity of
the left-over sample leading to operational complications, such as poor mixing, clogging
in transfer lines, and catalyst deactivation due to coking.
Figure 2. Results showcased reaction time’s impact from 0 h, 2 h, 3 h, and 4 h, on TAN numbers at
250 °C, 270 °C, and 300 °C, respectively.
Figure 1. Results are showcasing the reduction in TAN number of the crude sample at 250, 270, and300 ◦C reaction temperatures up to 4 h on stream.
2.1.2. Effect of Reaction Time
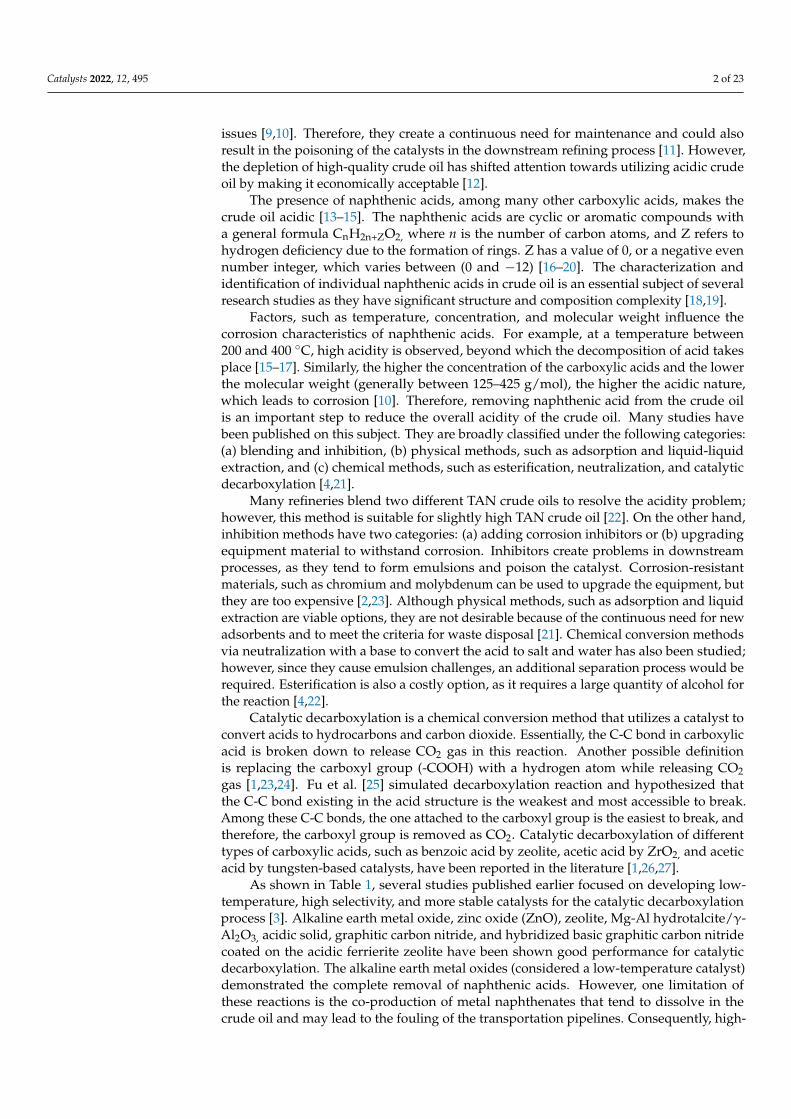
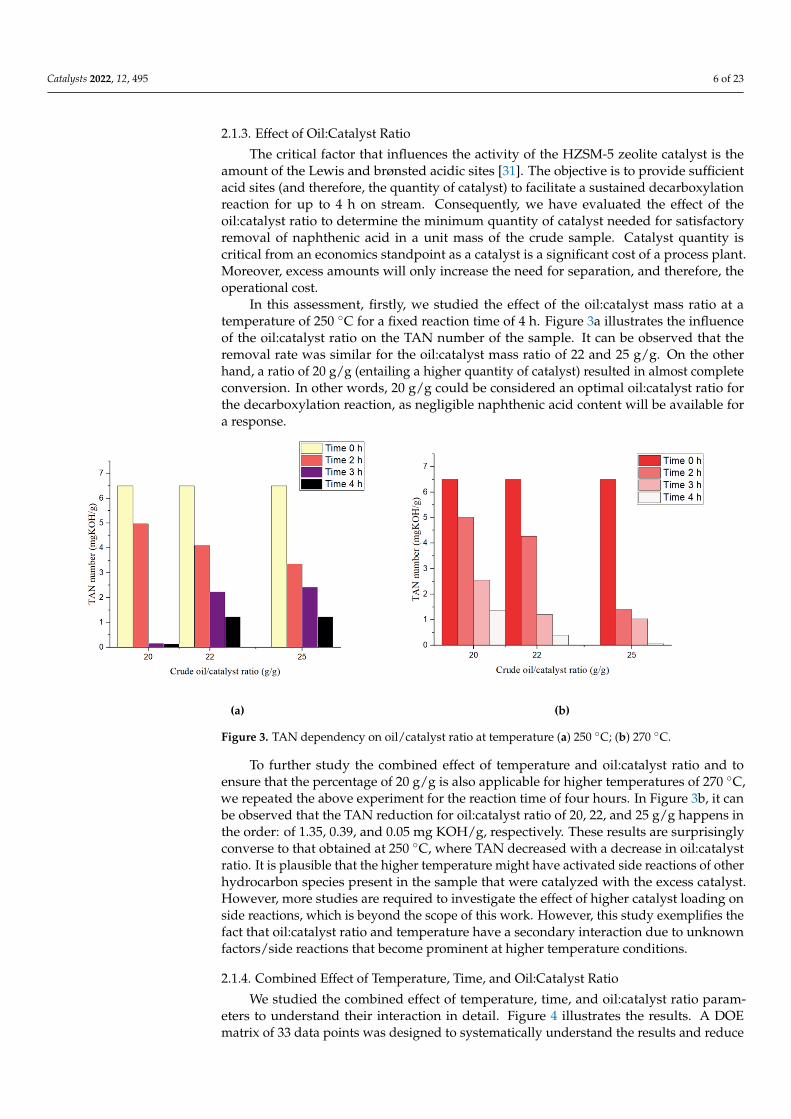
The effect of time in the range of 0 to 4 h is studied at three different temperatures,i.e., 250, 270, and 300 ◦C, and at a constant oil:catalyst mass ratio of 22 g/g. The resultsare provided in Figure 2. As time increases for all conditions, the TAN value decreasesdue to the long interaction between the catalyst and naphthenic acids in the sample. Wehypothesize that this could be because of the increased transfer of protons (H+ ions) fromacid sites to naphthenic acid in the model. It was reported earlier that the almost negligiblechange takes place beyond 4 h in a previous study by Zhang et al. [1]. Additionally, sincethere is always a concern of evaporation of light hydrocarbons that have boiling pointsbelow the reaction temperature, it is not advisable to continue the reaction beyond thecondition of diminishing returns. Evaporation of lights will also increase the viscosity ofthe left-over sample leading to operational complications, such as poor mixing, clogging intransfer lines, and catalyst deactivation due to coking.
Catalysts 2022, 12, x FOR PEER REVIEW 5 of 24
Figure 1. Results are showcasing the reduction in TAN number of the crude sample at 250, 270, and
300 °C reaction temperatures up to 4 h on stream.
2.1.2. Effect of Reaction Time
The effect of time in the range of 0 to 4 h is studied at three different temperatures,
i.e., 250, 270, and 300 °C, and at a constant oil:catalyst mass ratio of 22 g/g. The results are
provided in Figure 2. As time increases for all conditions, the TAN value decreases due to
the long interaction between the catalyst and naphthenic acids in the sample. We
hypothesize that this could be because of the increased transfer of protons (H+ ions) from
acid sites to naphthenic acid in the model. It was reported earlier that the almost negligible
change takes place beyond 4 h in a previous study by Zhang et al. [1]. Additionally, since
there is always a concern of evaporation of light hydrocarbons that have boiling points
below the reaction temperature, it is not advisable to continue the reaction beyond the
condition of diminishing returns. Evaporation of lights will also increase the viscosity of
the left-over sample leading to operational complications, such as poor mixing, clogging
in transfer lines, and catalyst deactivation due to coking.
Figure 2. Results showcased reaction time’s impact from 0 h, 2 h, 3 h, and 4 h, on TAN numbers at
250 °C, 270 °C, and 300 °C, respectively.
Figure 2. Results showcased reaction time’s impact from 0 h, 2 h, 3 h, and 4 h, on TAN numbers at250 ◦C, 270 ◦C, and 300 ◦C, respectively.
Catalysts 2022, 12, 495 6 of 23
2.1.3. Effect of Oil:Catalyst Ratio
The critical factor that influences the activity of the HZSM-5 zeolite catalyst is theamount of the Lewis and brønsted acidic sites [31]. The objective is to provide sufficientacid sites (and therefore, the quantity of catalyst) to facilitate a sustained decarboxylationreaction for up to 4 h on stream. Consequently, we have evaluated the effect of theoil:catalyst ratio to determine the minimum quantity of catalyst needed for satisfactoryremoval of naphthenic acid in a unit mass of the crude sample. Catalyst quantity iscritical from an economics standpoint as a catalyst is a significant cost of a process plant.Moreover, excess amounts will only increase the need for separation, and therefore, theoperational cost.
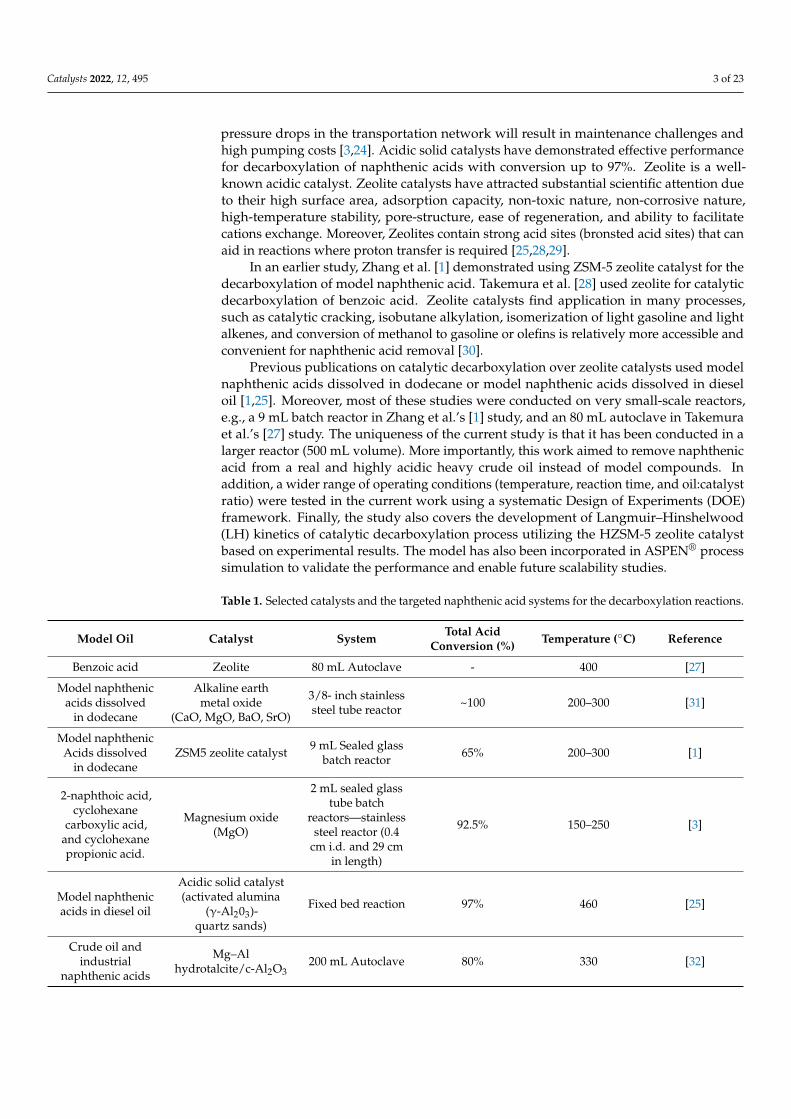
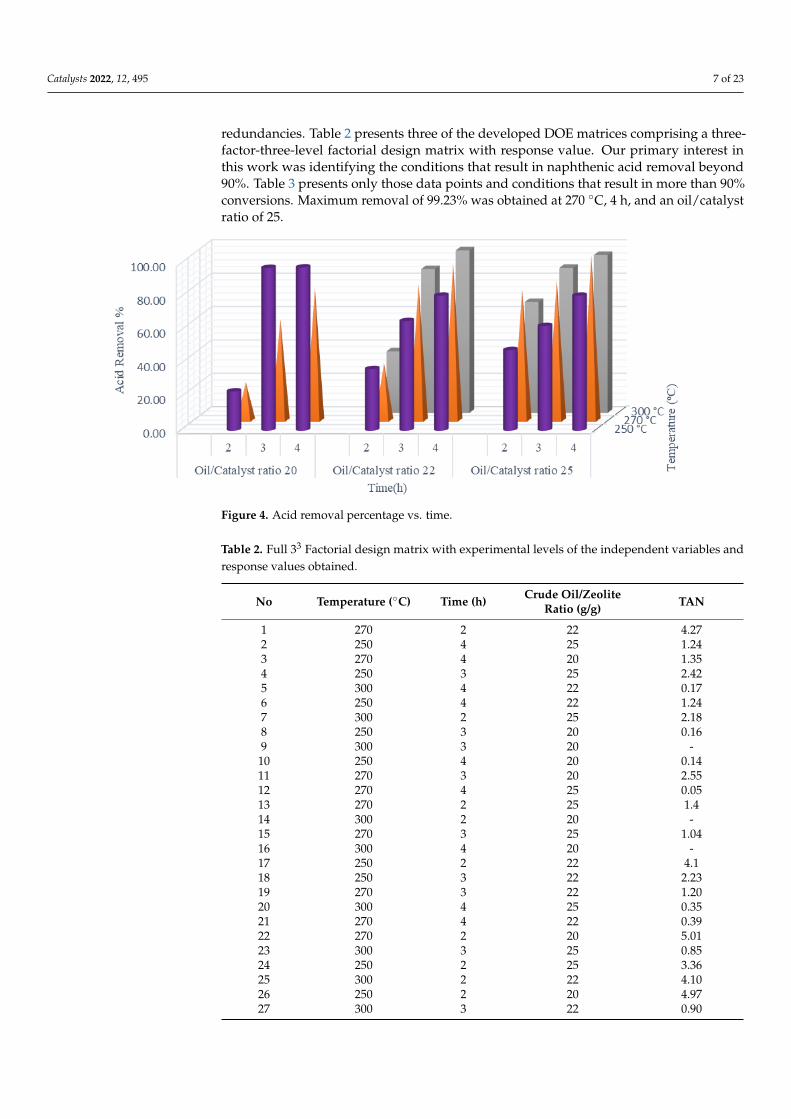
In this assessment, firstly, we studied the effect of the oil:catalyst mass ratio at atemperature of 250 ◦C for a fixed reaction time of 4 h. Figure 3a illustrates the influenceof the oil:catalyst ratio on the TAN number of the sample. It can be observed that theremoval rate was similar for the oil:catalyst mass ratio of 22 and 25 g/g. On the otherhand, a ratio of 20 g/g (entailing a higher quantity of catalyst) resulted in almost completeconversion. In other words, 20 g/g could be considered an optimal oil:catalyst ratio forthe decarboxylation reaction, as negligible naphthenic acid content will be available fora response.
Catalysts 2022, 12, x FOR PEER REVIEW 6 of 24
2.1.3. Effect of Oil:Catalyst Ratio
The critical factor that influences the activity of the HZSM-5 zeolite catalyst is the
amount of the Lewis and brønsted acidic sites [31]. The objective is to provide sufficient
acid sites (and therefore, the quantity of catalyst) to facilitate a sustained decarboxylation
reaction for up to 4 h on stream. Consequently, we have evaluated the effect of the
oil:catalyst ratio to determine the minimum quantity of catalyst needed for satisfactory
removal of naphthenic acid in a unit mass of the crude sample. Catalyst quantity is critical
from an economics standpoint as a catalyst is a significant cost of a process plant.
Moreover, excess amounts will only increase the need for separation, and therefore, the
operational cost.
In this assessment, firstly, we studied the effect of the oil:catalyst mass ratio at a
temperature of 250 °C for a fixed reaction time of 4 h. Figure 3a illustrates the influence of
the oil:catalyst ratio on the TAN number of the sample. It can be observed that the removal
rate was similar for the oil:catalyst mass ratio of 22 and 25 g/g. On the other hand, a ratio
of 20 g/g (entailing a higher quantity of catalyst) resulted in almost complete conversion.
In other words, 20 g/g could be considered an optimal oil:catalyst ratio for the
decarboxylation reaction, as negligible naphthenic acid content will be available for a
response.
(a) (b)
Figure 3. TAN dependency on oil/catalyst ratio at temperature (a) 250 °C; (b) 270 °C.
To further study the combined effect of temperature and oil:catalyst ratio and to
ensure that the percentage of 20 g/g is also applicable for higher temperatures of 270 °C,
we repeated the above experiment for the reaction time of four hours. In Figure 3b, it can
be observed that the TAN reduction for oil:catalyst ratio of 20, 22, and 25 g/g happens in
the order: of 1.35, 0.39, and 0.05 mg KOH/g, respectively. These results are surprisingly
converse to that obtained at 250 °C, where TAN decreased with a decrease in oil:catalyst
ratio. It is plausible that the higher temperature might have activated side reactions of
other hydrocarbon species present in the sample that were catalyzed with the excess
catalyst. However, more studies are required to investigate the effect of higher catalyst
loading on side reactions, which is beyond the scope of this work. However, this study
exemplifies the fact that oil:catalyst ratio and temperature have a secondary interaction
due to unknown factors/side reactions that become prominent at higher temperature
conditions.
Figure 3. TAN dependency on oil/catalyst ratio at temperature (a) 250 ◦C; (b) 270 ◦C.
To further study the combined effect of temperature and oil:catalyst ratio and toensure that the percentage of 20 g/g is also applicable for higher temperatures of 270 ◦C,we repeated the above experiment for the reaction time of four hours. In Figure 3b, it canbe observed that the TAN reduction for oil:catalyst ratio of 20, 22, and 25 g/g happens inthe order: of 1.35, 0.39, and 0.05 mg KOH/g, respectively. These results are surprisinglyconverse to that obtained at 250 ◦C, where TAN decreased with a decrease in oil:catalystratio. It is plausible that the higher temperature might have activated side reactions of otherhydrocarbon species present in the sample that were catalyzed with the excess catalyst.However, more studies are required to investigate the effect of higher catalyst loading onside reactions, which is beyond the scope of this work. However, this study exemplifies thefact that oil:catalyst ratio and temperature have a secondary interaction due to unknownfactors/side reactions that become prominent at higher temperature conditions.
2.1.4. Combined Effect of Temperature, Time, and Oil:Catalyst Ratio
We studied the combined effect of temperature, time, and oil:catalyst ratio param-eters to understand their interaction in detail. Figure 4 illustrates the results. A DOEmatrix of 33 data points was designed to systematically understand the results and reduce
Catalysts 2022, 12, 495 7 of 23
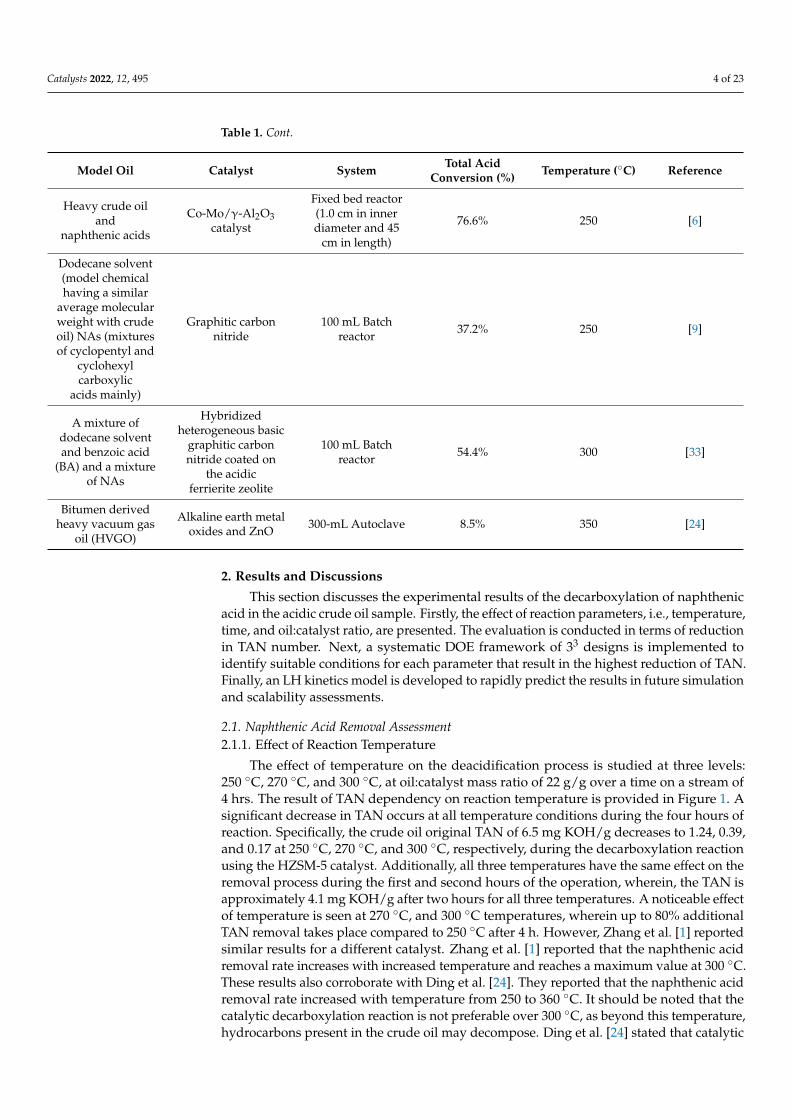
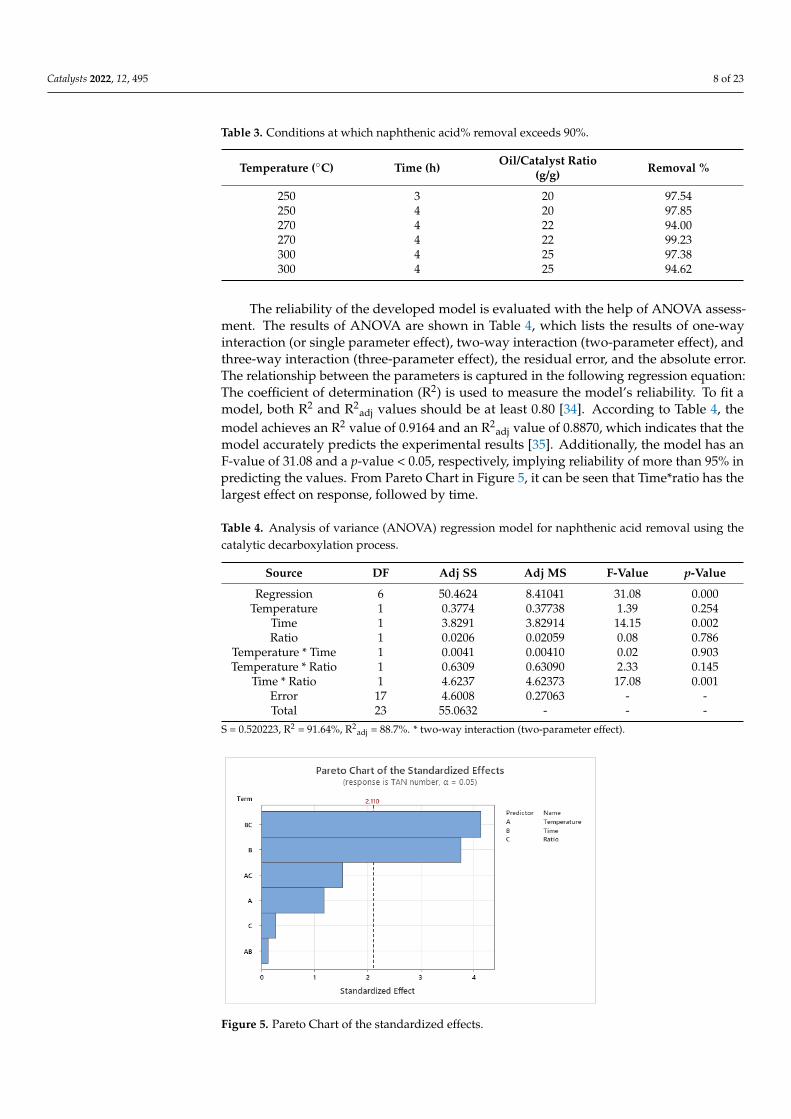
redundancies. Table 2 presents three of the developed DOE matrices comprising a three-factor-three-level factorial design matrix with response value. Our primary interest inthis work was identifying the conditions that result in naphthenic acid removal beyond90%. Table 3 presents only those data points and conditions that result in more than 90%conversions. Maximum removal of 99.23% was obtained at 270 ◦C, 4 h, and an oil/catalystratio of 25.
Catalysts 2022, 12, x FOR PEER REVIEW 7 of 24
2.1.4. Combined Effect of Temperature, Time, and Oil:Catalyst Ratio
We studied the combined effect of temperature, time, and oil:catalyst ratio
parameters to understand their interaction in detail. Figure 4 illustrates the results. A DOE
matrix of 33 data points was designed to systematically understand the results and reduce
redundancies. Table 2 presents three of the developed DOE matrices comprising a three-
factor-three-level factorial design matrix with response value. Our primary interest in this
work was identifying the conditions that result in naphthenic acid removal beyond 90%.
Table 3 presents only those data points and conditions that result in more than 90%
conversions. Maximum removal of 99.23% was obtained at 270 °C, 4 h, and an oil/catalyst
ratio of 25.
Figure 4. Acid removal percentage vs. time.
Table 2. Full 33 Factorial design matrix with experimental levels of the independent variables and
response values obtained.
No Temperature (°C) Time (h) Crude Oil/Zeolite Ratio
(g/g) TAN
1 270 2 22 4.27
2 250 4 25 1.24
3 270 4 20 1.35
4 250 3 25 2.42
5 300 4 22 0.17
6 250 4 22 1.24
7 300 2 25 2.18
8 250 3 20 0.16
9 300 3 20 -
10 250 4 20 0.14
11 270 3 20 2.55
12 270 4 25 0.05
13 270 2 25 1.4
14 300 2 20 -
15 270 3 25 1.04
16 300 4 20 -
17 250 2 22 4.1
18 250 3 22 2.23
19 270 3 22 1.20
20 300 4 25 0.35
Figure 4. Acid removal percentage vs. time.
Table 2. Full 33 Factorial design matrix with experimental levels of the independent variables andresponse values obtained.
No Temperature (◦C) Time (h) Crude Oil/ZeoliteRatio (g/g) TAN
1 270 2 22 4.272 250 4 25 1.243 270 4 20 1.354 250 3 25 2.425 300 4 22 0.176 250 4 22 1.247 300 2 25 2.188 250 3 20 0.169 300 3 20 -10 250 4 20 0.1411 270 3 20 2.5512 270 4 25 0.0513 270 2 25 1.414 300 2 20 -15 270 3 25 1.0416 300 4 20 -17 250 2 22 4.118 250 3 22 2.2319 270 3 22 1.2020 300 4 25 0.3521 270 4 22 0.3922 270 2 20 5.0123 300 3 25 0.8524 250 2 25 3.3625 300 2 22 4.1026 250 2 20 4.9727 300 3 22 0.90
Catalysts 2022, 12, 495 8 of 23
Table 3. Conditions at which naphthenic acid% removal exceeds 90%.
Temperature (◦C) Time (h) Oil/Catalyst Ratio(g/g) Removal %
250 3 20 97.54250 4 20 97.85270 4 22 94.00270 4 22 99.23300 4 25 97.38300 4 25 94.62
The reliability of the developed model is evaluated with the help of ANOVA assess-ment. The results of ANOVA are shown in Table 4, which lists the results of one-wayinteraction (or single parameter effect), two-way interaction (two-parameter effect), andthree-way interaction (three-parameter effect), the residual error, and the absolute error.The relationship between the parameters is captured in the following regression equation:The coefficient of determination (R2) is used to measure the model’s reliability. To fit amodel, both R2 and R2
adj values should be at least 0.80 [34]. According to Table 4, themodel achieves an R2 value of 0.9164 and an R2
adj value of 0.8870, which indicates that themodel accurately predicts the experimental results [35]. Additionally, the model has anF-value of 31.08 and a p-value < 0.05, respectively, implying reliability of more than 95% inpredicting the values. From Pareto Chart in Figure 5, it can be seen that Time*ratio has thelargest effect on response, followed by time.
Table 4. Analysis of variance (ANOVA) regression model for naphthenic acid removal using thecatalytic decarboxylation process.
Source DF Adj SS Adj MS F-Value p-Value
Regression 6 50.4624 8.41041 31.08 0.000Temperature 1 0.3774 0.37738 1.39 0.254
Time 1 3.8291 3.82914 14.15 0.002Ratio 1 0.0206 0.02059 0.08 0.786
Temperature * Time 1 0.0041 0.00410 0.02 0.903Temperature * Ratio 1 0.6309 0.63090 2.33 0.145
Time * Ratio 1 4.6237 4.62373 17.08 0.001Error 17 4.6008 0.27063 - -Total 23 55.0632 - - -
S = 0.520223, R2 = 91.64%, R2adj = 88.7%. * two-way interaction (two-parameter effect).
Catalysts 2022, 12, x FOR PEER REVIEW 9 of 24
Figure 5. Pareto Chart of the standardized effects.
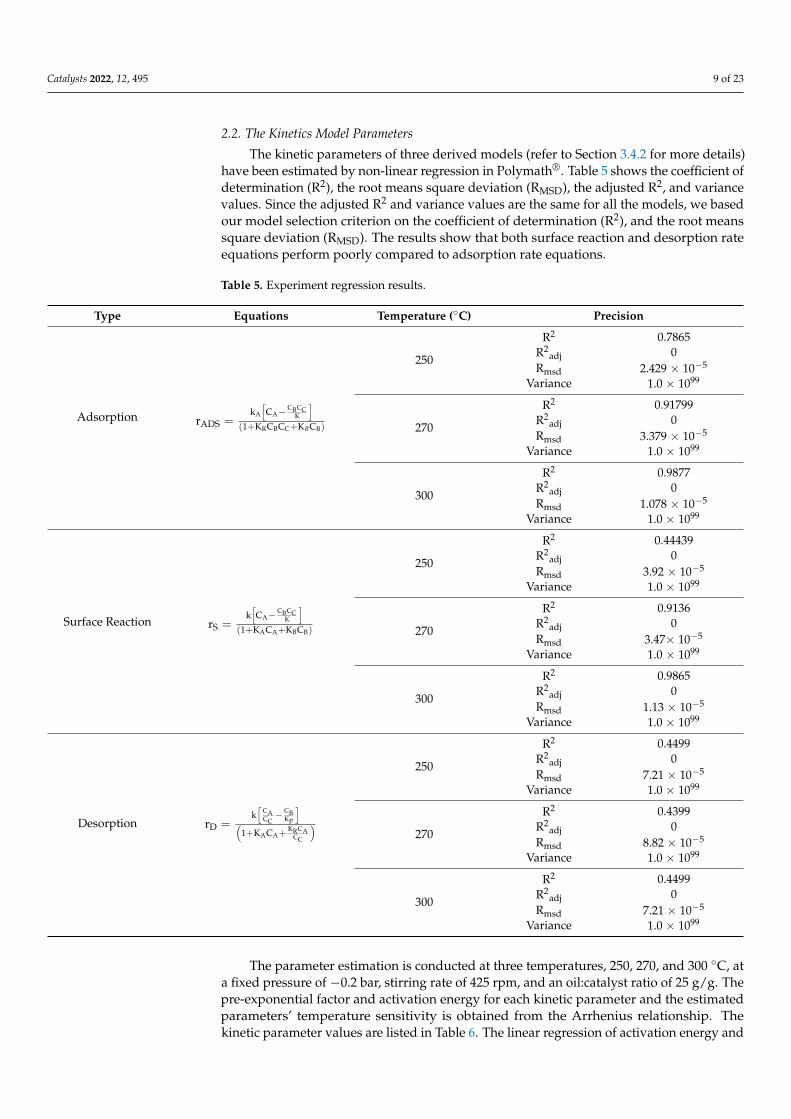
2.2. The Kinetics Model Parameters
The kinetic parameters of three derived models (refer to Section 3.4.2 for more
details) have been estimated by non-linear regression in Polymath® . Table 5 shows the
coefficient of determination (R2), the root means square deviation (RMSD), the adjusted R2,
and variance values. Since the adjusted R2 and variance values are the same for all the
models, we based our model selection criterion on the coefficient of determination (R2),
and the root means square deviation (RMSD). The results show that both surface reaction
and desorption rate equations perform poorly compared to adsorption rate equations.
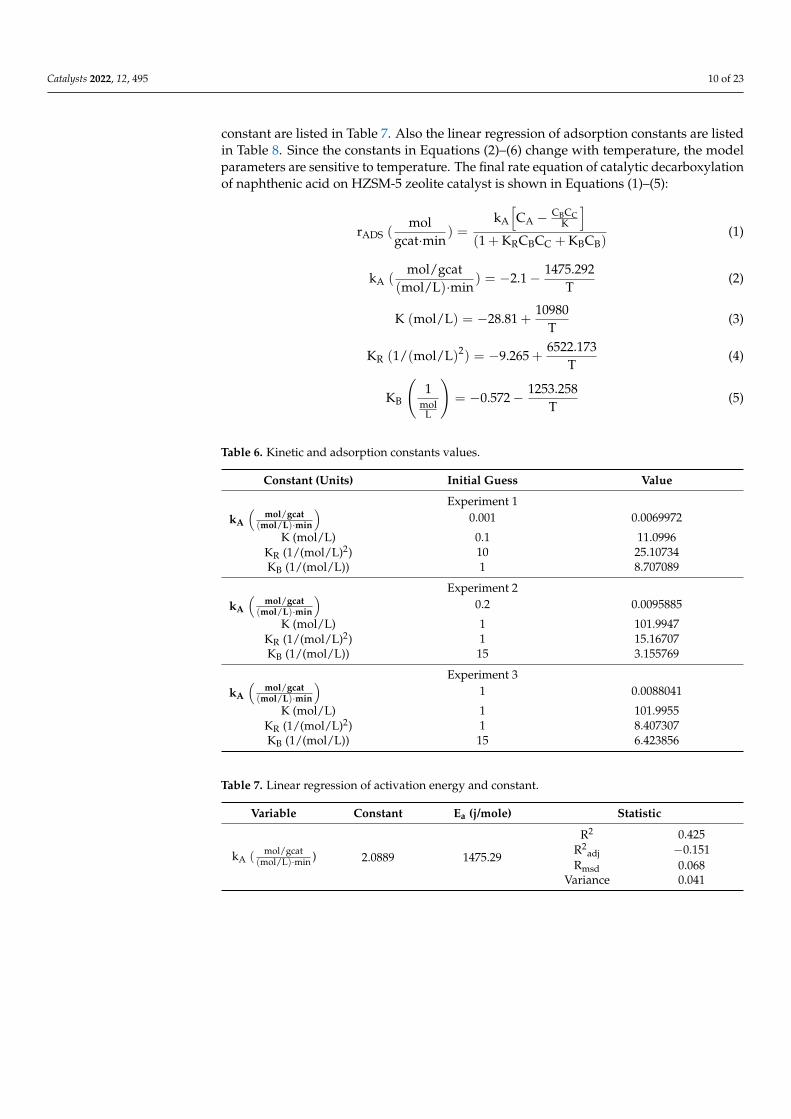
The parameter estimation is conducted at three temperatures, 250, 270, and 300 °C,
at a fixed pressure of −0.2 bar, stirring rate of 425 rpm, and an oil:catalyst ratio of 25 g/g.
The pre-exponential factor and activation energy for each kinetic parameter and the
estimated parameters’ temperature sensitivity is obtained from the Arrhenius
relationship. The kinetic parameter values are listed in Table 6. The linear regression of
activation energy and constant are listed in Table 7. Also the linear regression of
adsorption constants are listed in Table 8.Since the constants in Equations (2)–(6) change
with temperature, the model parameters are sensitive to temperature. The final rate
equation of catalytic decarboxylation of naphthenic acid on HZSM-5 zeolite catalyst is
shown in Equations (1)–(5):
rADS(mol
gcat. min) =
kA [CA −CBCC
K]
(1 + KRCBCC + KBCB) (1)
kA(mol/gcat
(mol/L). min) = −2.1 −
1475.292
T
(2)
K (mol/L) = −28.81 +10980
T
(3)
KR(1/(mol/L)2) = −9.265 +6522.173
T
(4)
KB (1
molL
) = −0.572 − 1253.258
T
(5)
Figure 5. Pareto Chart of the standardized effects.
Catalysts 2022, 12, 495 9 of 23
2.2. The Kinetics Model Parameters
The kinetic parameters of three derived models (refer to Section 3.4.2 for more details)have been estimated by non-linear regression in Polymath®. Table 5 shows the coefficient ofdetermination (R2), the root means square deviation (RMSD), the adjusted R2, and variancevalues. Since the adjusted R2 and variance values are the same for all the models, we basedour model selection criterion on the coefficient of determination (R2), and the root meanssquare deviation (RMSD). The results show that both surface reaction and desorption rateequations perform poorly compared to adsorption rate equations.
Table 5. Experiment regression results.
Type Equations Temperature (◦C) Precision
Adsorption rADS =kA
[CA−
CBCCK
](1+KRCBCC+KBCB)
250
R2 0.7865R2
adj 0Rmsd 2.429 × 10⁻⁵
Variance 1.0 × 1099
270
R2 0.91799R2
adj 0Rmsd 3.379 × 10⁻⁵
Variance 1.0 × 1099
300
R2 0.9877R2
adj 0Rmsd 1.078 × 10⁻⁵
Variance 1.0 × 1099
Surface Reaction rS =k[CA−
CBCCK
](1+KACA+KBCB)
250
R2 0.44439R2
adj 0Rmsd 3.92 × 10⁻⁵
Variance 1.0 × 1099
270
R2 0.9136R2
adj 0Rmsd 3.47× 10⁻⁵
Variance 1.0 × 1099
300
R2 0.9865R2
adj 0Rmsd 1.13 × 10⁻⁵
Variance 1.0 × 1099
Desorption rD =k[
CACC− CB
KP
](
1+KACA+KRCA
CC
)
250
R2 0.4499R2
adj 0Rmsd 7.21 × 10⁻⁵
Variance 1.0 × 1099
270
R2 0.4399R2
adj 0Rmsd 8.82 × 10⁻⁵
Variance 1.0 × 1099
300
R2 0.4499R2
adj 0Rmsd 7.21 × 10⁻⁵
Variance 1.0 × 1099
The parameter estimation is conducted at three temperatures, 250, 270, and 300 ◦C, ata fixed pressure of −0.2 bar, stirring rate of 425 rpm, and an oil:catalyst ratio of 25 g/g. Thepre-exponential factor and activation energy for each kinetic parameter and the estimatedparameters’ temperature sensitivity is obtained from the Arrhenius relationship. Thekinetic parameter values are listed in Table 6. The linear regression of activation energy and
Catalysts 2022, 12, 495 10 of 23
constant are listed in Table 7. Also the linear regression of adsorption constants are listedin Table 8. Since the constants in Equations (2)–(6) change with temperature, the modelparameters are sensitive to temperature. The final rate equation of catalytic decarboxylationof naphthenic acid on HZSM-5 zeolite catalyst is shown in Equations (1)–(5):
rADS (mol
gcat·min) =
kA
[CA − CBCC
K
](1 + KRCBCC + KBCB)
(1)
kA (mol/gcat
(mol/L)·min) = −2.1− 1475.292
T(2)
K (mol/L) = −28.81 +10980
T(3)
KR (1/(mol/L)2) = −9.265 +6522.173
T(4)
KB
(1
molL
)= −0.572− 1253.258
T(5)
Table 6. Kinetic and adsorption constants values.
Constant (Units) Initial Guess Value
Experiment 1kA
(mol/gcat
(mol/L)·min
)0.001 0.0069972
K (mol/L) 0.1 11.0996KR (1/(mol/L)2) 10 25.10734KB (1/(mol/L)) 1 8.707089
Experiment 2kA
(mol/gcat
(mol/L)·min
)0.2 0.0095885
K (mol/L) 1 101.9947KR (1/(mol/L)2) 1 15.16707KB (1/(mol/L)) 15 3.155769
Experiment 3kA
(mol/gcat
(mol/L)·min
)1 0.0088041
K (mol/L) 1 101.9955KR (1/(mol/L)2) 1 8.407307KB (1/(mol/L)) 15 6.423856
Table 7. Linear regression of activation energy and constant.
Variable Constant Ea (j/mole) Statistic
kA (mol/gcat
(mol/L)·min ) 2.0889 1475.29
R2 0.425R2
adj −0.151Rmsd 0.068
Variance 0.041
Catalysts 2022, 12, 495 11 of 23
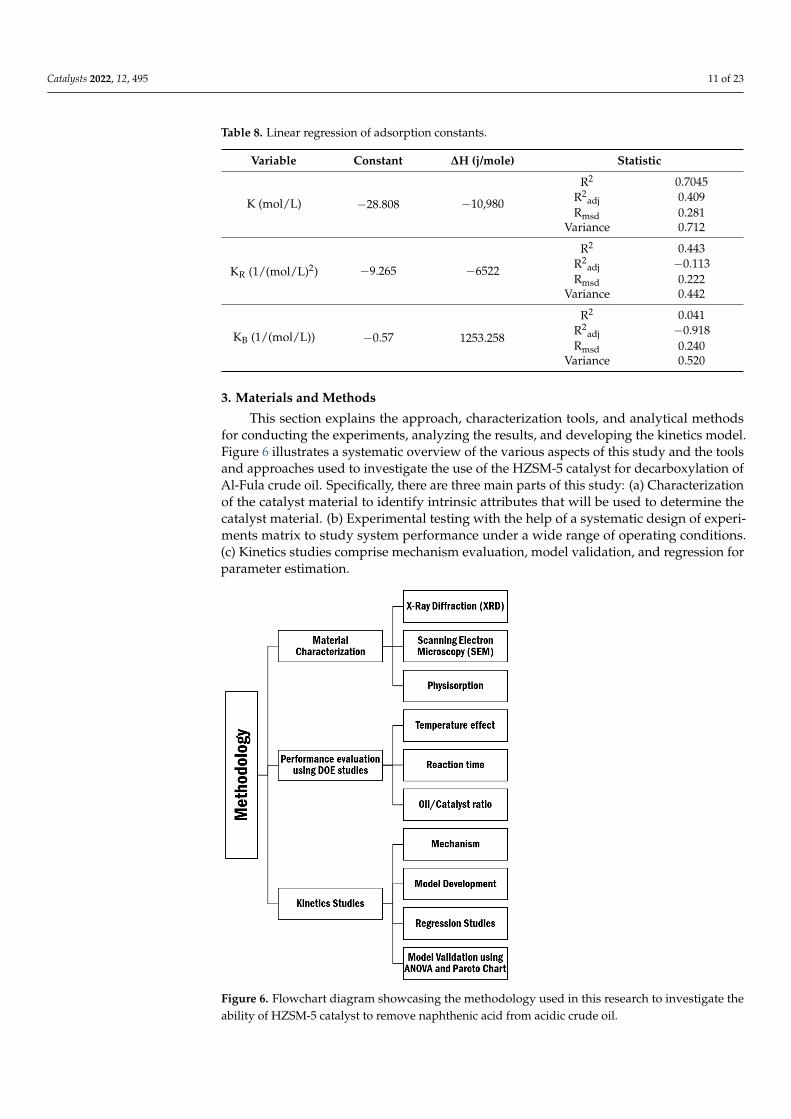
Table 8. Linear regression of adsorption constants.
Variable Constant ∆H (j/mole) Statistic
K (mol/L) −28.808 −10,980
R2 0.7045R2
adj 0.409Rmsd 0.281
Variance 0.712
KR (1/(mol/L)2) −9.265 −6522
R2 0.443R2
adj −0.113Rmsd 0.222
Variance 0.442
KB (1/(mol/L)) −0.57 1253.258
R2 0.041R2
adj −0.918Rmsd 0.240
Variance 0.520
3. Materials and Methods
This section explains the approach, characterization tools, and analytical methodsfor conducting the experiments, analyzing the results, and developing the kinetics model.Figure 6 illustrates a systematic overview of the various aspects of this study and the toolsand approaches used to investigate the use of the HZSM-5 catalyst for decarboxylation ofAl-Fula crude oil. Specifically, there are three main parts of this study: (a) Characterizationof the catalyst material to identify intrinsic attributes that will be used to determine thecatalyst material. (b) Experimental testing with the help of a systematic design of experi-ments matrix to study system performance under a wide range of operating conditions.(c) Kinetics studies comprise mechanism evaluation, model validation, and regression forparameter estimation.
Catalysts 2022, 12, x FOR PEER REVIEW 12 of 24
Figure 6. Flowchart diagram showcasing the methodology used in this research to investigate the
ability of HZSM-5 catalyst to remove naphthenic acid from acidic crude oil.
3.1. Materials
Al-Fula crude oil, representing the acidic crude oil used in this study, was obtained
from the Central Petroleum Laboratories (CPL) of the Sudan Ministry of Energy and Oil.
The physicochemical properties of this crude oil are listed in Table 9. HZSM-5 Zeolite
catalyst was procured from a proprietary source, while chemicals, such as toluene,
isopropanol, and potassium acid phthalate were obtained from the Shifak Company in
Sudan.
Table 9. The physiochemical properties and the corresponding ASTM standard are used for
quantification.
Properties Result Method
Density @ 15 °C, kg/m3 927.5 ASTM D4052
Specific Gravity 0.9283 ASTM D4052
API° 20.93 ASTM D4052
Viscosity @100 °C, mm2/s 38.07 ASTM D7024
Pour point, °C −1 ASTM D5853
Carbon residue, m% 4.41 SH/T 0170-92
Water Content, m% 0.50 ASTM D4006
Salt Content As Nacl mg/L 3.6 ASTM D6470
Acid number, mg KOH/g 6.5 ASTM D664
Sulfur, m% 0.127 ASTM D4294
3.2. Catalyst Characterization
We have conducted X-ray diffraction analysis (XRD), Scanning Electron Microscopy
(SEM), and physisorption analysis to fingerprint the various aspects of the catalyst that
entail its functionality. The XRD analysis was conducted to study the chemical
Figure 6. Flowchart diagram showcasing the methodology used in this research to investigate theability of HZSM-5 catalyst to remove naphthenic acid from acidic crude oil.
Catalysts 2022, 12, 495 12 of 23
3.1. Materials
Al-Fula crude oil, representing the acidic crude oil used in this study, was obtainedfrom the Central Petroleum Laboratories (CPL) of the Sudan Ministry of Energy and Oil.The physicochemical properties of this crude oil are listed in Table 9. HZSM-5 Zeolite cata-lyst was procured from a proprietary source, while chemicals, such as toluene, isopropanol,and potassium acid phthalate were obtained from the Shifak Company in Sudan.
Table 9. The physiochemical properties and the corresponding ASTM standard are used for quantification.
Properties Result Method
Density @ 15 ◦C, kg/m3 927.5 ASTM D4052Specific Gravity 0.9283 ASTM D4052
API◦ 20.93 ASTM D4052Viscosity @100 ◦C, mm2/s 38.07 ASTM D7024
Pour point, ◦C −1 ASTM D5853Carbon residue, m% 4.41 SH/T 0170-92Water Content, m% 0.50 ASTM D4006
Salt Content As Nacl mg/L 3.6 ASTM D6470Acid number, mg KOH/g 6.5 ASTM D664
Sulfur, m% 0.127 ASTM D4294
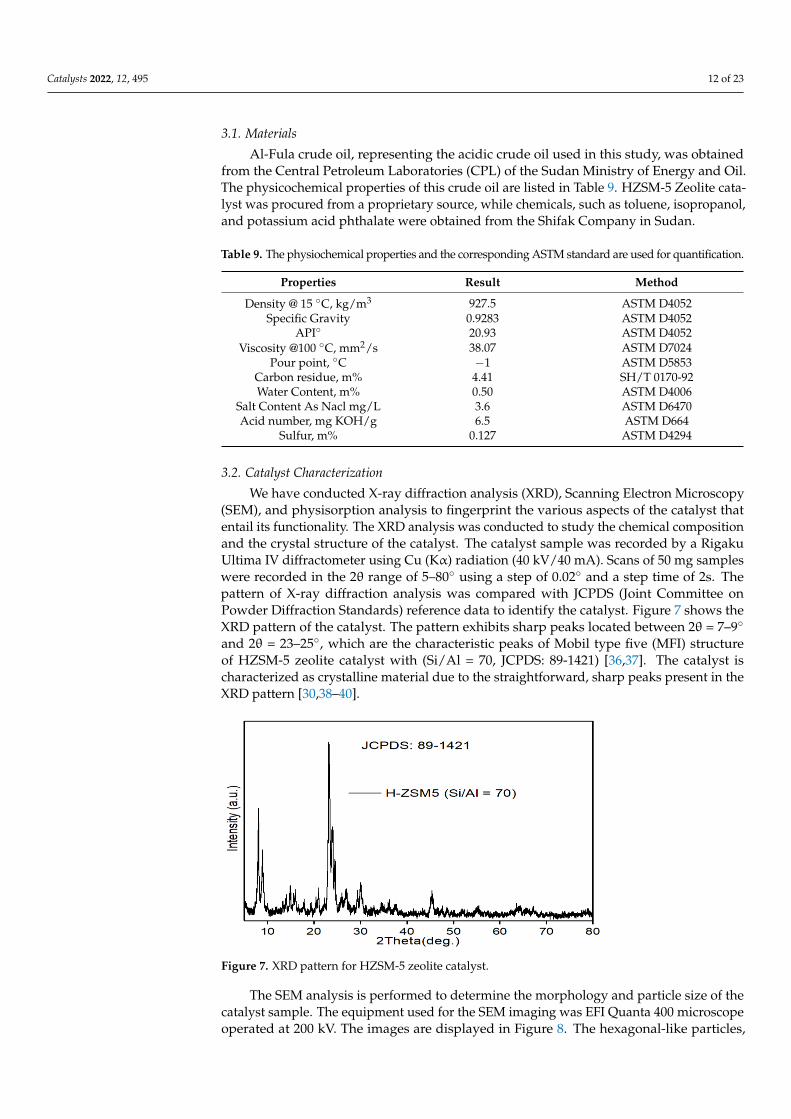
3.2. Catalyst Characterization
We have conducted X-ray diffraction analysis (XRD), Scanning Electron Microscopy(SEM), and physisorption analysis to fingerprint the various aspects of the catalyst thatentail its functionality. The XRD analysis was conducted to study the chemical compositionand the crystal structure of the catalyst. The catalyst sample was recorded by a RigakuUltima IV diffractometer using Cu (Kα) radiation (40 kV/40 mA). Scans of 50 mg sampleswere recorded in the 2θ range of 5–80◦ using a step of 0.02◦ and a step time of 2s. Thepattern of X-ray diffraction analysis was compared with JCPDS (Joint Committee onPowder Diffraction Standards) reference data to identify the catalyst. Figure 7 shows theXRD pattern of the catalyst. The pattern exhibits sharp peaks located between 2θ = 7–9◦
and 2θ = 23–25◦, which are the characteristic peaks of Mobil type five (MFI) structureof HZSM-5 zeolite catalyst with (Si/Al = 70, JCPDS: 89-1421) [36,37]. The catalyst ischaracterized as crystalline material due to the straightforward, sharp peaks present in theXRD pattern [30,38–40].
Catalysts 2022, 12, x FOR PEER REVIEW 13 of 24
composition and the crystal structure of the catalyst. The catalyst sample was recorded by
a Rigaku Ultima IV diffractometer using Cu (Kα) radiation (40 kV/40 mA). Scans of 50 mg
samples were recorded in the 2θ range of 5–80° using a step of 0.02° and a step time of 2s.
The pattern of X-ray diffraction analysis was compared with JCPDS (Joint Committee on
Powder Diffraction Standards) reference data to identify the catalyst. Figure 7 shows the
XRD pattern of the catalyst. The pattern exhibits sharp peaks located between 2θ = 7–9°
and 2θ = 23–25°, which are the characteristic peaks of Mobil type five (MFI) structure of
HZSM-5 zeolite catalyst with (Si/Al = 70, JCPDS: 89-1421) [36,37]. The catalyst is
characterized as crystalline material due to the straightforward, sharp peaks present in
the XRD pattern [30,38–40].
Figure 7. XRD pattern for HZSM-5 zeolite catalyst.
The SEM analysis is performed to determine the morphology and particle size of the
catalyst sample. The equipment used for the SEM imaging was EFI Quanta 400
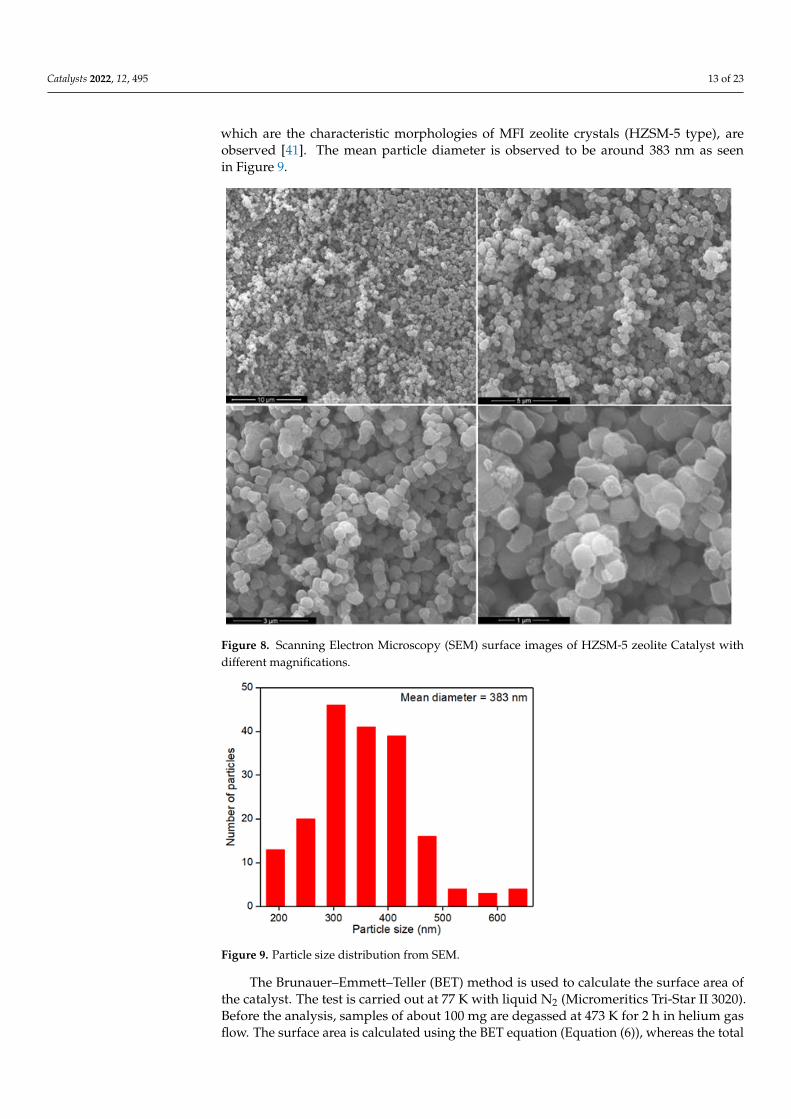
microscope operated at 200 kV. The images are displayed in Figure 8. The hexagonal-like
particles, which are the characteristic morphologies of MFI zeolite crystals (HZSM-5 type),
are observed [41]. The mean particle diameter is observed to be around 383 nm as seen in
Figure 9.
The Brunauer–Emmett–Teller (BET) method is used to calculate the surface area of
the catalyst. The test is carried out at 77 K with liquid N2 (Micromeritics Tri-Star II 3020).
Before the analysis, samples of about 100 mg are degassed at 473 K for 2 h in helium gas
flow. The surface area is calculated using the BET equation (Equation (6)), whereas the
total pore volume and average pore radius are obtained from the Barrett–Joyner–Halenda
(BJH) method. BET equation [42]:
1
[𝑛((𝑃0 𝑃) − 1)⁄ ]=
1
𝑛𝑚𝐶+ [
𝐶 − 1
𝑛𝑚𝐶] ×
𝑃
𝑃0 (6)
where n, nm, and C are the adsorbed amount, the monolayer capacity, and a constant,
respectively.
Figure 7. XRD pattern for HZSM-5 zeolite catalyst.
The SEM analysis is performed to determine the morphology and particle size of thecatalyst sample. The equipment used for the SEM imaging was EFI Quanta 400 microscopeoperated at 200 kV. The images are displayed in Figure 8. The hexagonal-like particles,
Catalysts 2022, 12, 495 13 of 23
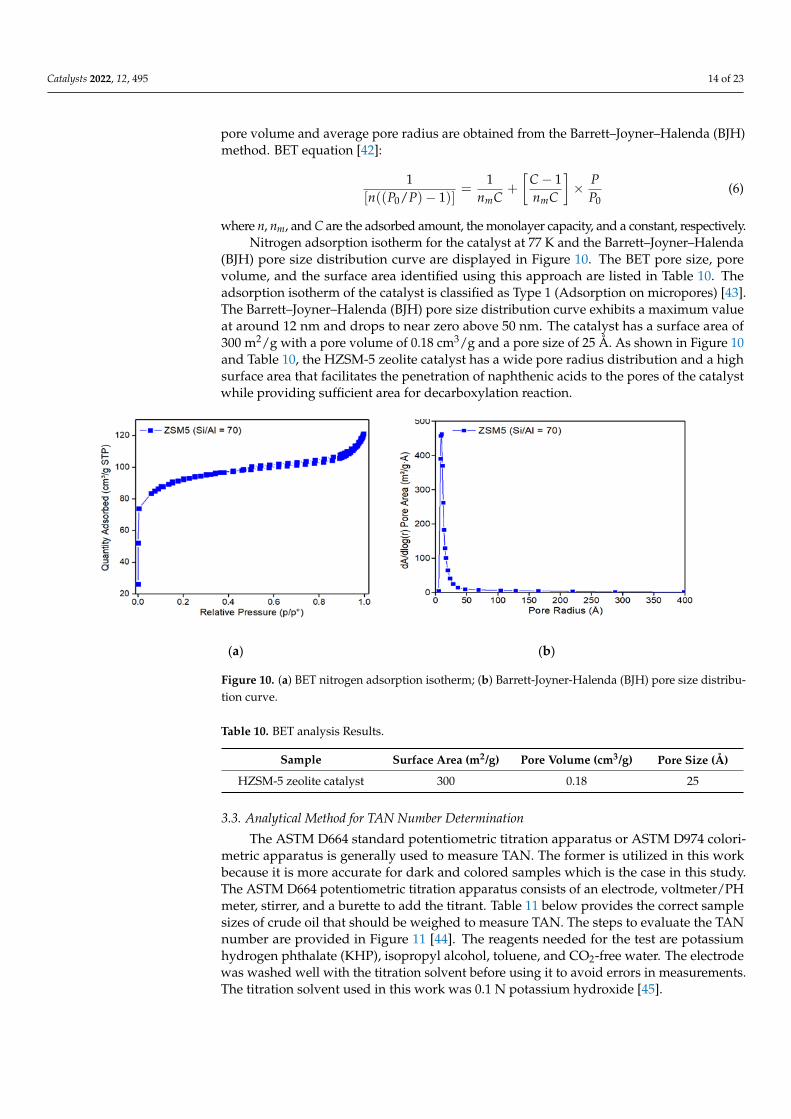
which are the characteristic morphologies of MFI zeolite crystals (HZSM-5 type), areobserved [41]. The mean particle diameter is observed to be around 383 nm as seenin Figure 9.
Catalysts 2022, 12, x FOR PEER REVIEW 14 of 24
Figure 8. Scanning Electron Microscopy (SEM) surface images of HZSM-5 zeolite Catalyst with
different magnifications.
Figure 9. Particle size distribution from SEM.
Nitrogen adsorption isotherm for the catalyst at 77 K and the Barrett–Joyner–Halenda
(BJH) pore size distribution curve are displayed in Figure 10. The BET pore size, pore
volume, and the surface area identified using this approach are listed in Table 10. The
adsorption isotherm of the catalyst is classified as Type 1 (Adsorption on micropores) [43].
The Barrett–Joyner–Halenda (BJH) pore size distribution curve exhibits a maximum value
at around 12 nm and drops to near zero above 50 nm. The catalyst has a surface area of
300 m2/g with a pore volume of 0.18 cm3/g and a pore size of 25 Å . As shown in Figure 10
and Table 10, the HZSM-5 zeolite catalyst has a wide pore radius distribution and a high
Figure 8. Scanning Electron Microscopy (SEM) surface images of HZSM-5 zeolite Catalyst withdifferent magnifications.
Catalysts 2022, 12, x FOR PEER REVIEW 14 of 24
Figure 8. Scanning Electron Microscopy (SEM) surface images of HZSM-5 zeolite Catalyst with
different magnifications.
Figure 9. Particle size distribution from SEM.
Nitrogen adsorption isotherm for the catalyst at 77 K and the Barrett–Joyner–Halenda
(BJH) pore size distribution curve are displayed in Figure 10. The BET pore size, pore
volume, and the surface area identified using this approach are listed in Table 10. The
adsorption isotherm of the catalyst is classified as Type 1 (Adsorption on micropores) [43].
The Barrett–Joyner–Halenda (BJH) pore size distribution curve exhibits a maximum value
at around 12 nm and drops to near zero above 50 nm. The catalyst has a surface area of
300 m2/g with a pore volume of 0.18 cm3/g and a pore size of 25 Å . As shown in Figure 10
and Table 10, the HZSM-5 zeolite catalyst has a wide pore radius distribution and a high
Figure 9. Particle size distribution from SEM.
The Brunauer–Emmett–Teller (BET) method is used to calculate the surface area ofthe catalyst. The test is carried out at 77 K with liquid N2 (Micromeritics Tri-Star II 3020).Before the analysis, samples of about 100 mg are degassed at 473 K for 2 h in helium gasflow. The surface area is calculated using the BET equation (Equation (6)), whereas the total
Catalysts 2022, 12, 495 14 of 23
pore volume and average pore radius are obtained from the Barrett–Joyner–Halenda (BJH)method. BET equation [42]:
1[n((P0/P)− 1)]
=1
nmC+
[C− 1nmC
]× P
P0(6)
where n, nm, and C are the adsorbed amount, the monolayer capacity, and a constant, respectively.Nitrogen adsorption isotherm for the catalyst at 77 K and the Barrett–Joyner–Halenda
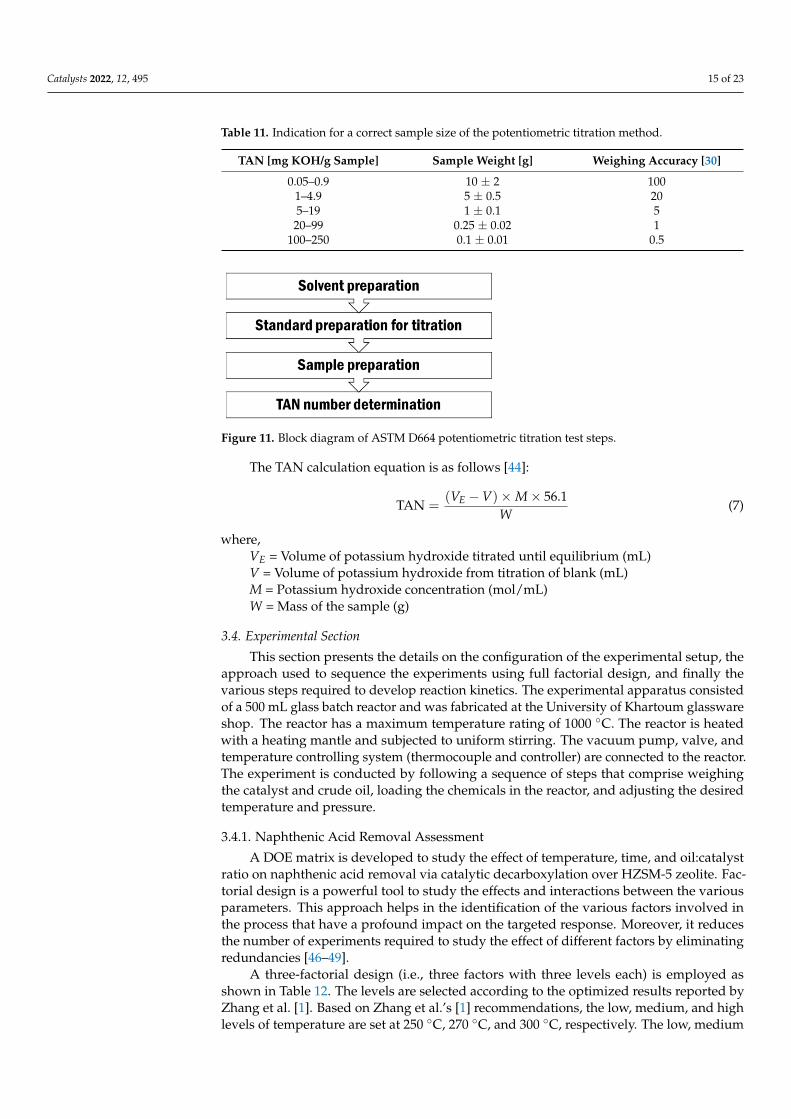
(BJH) pore size distribution curve are displayed in Figure 10. The BET pore size, porevolume, and the surface area identified using this approach are listed in Table 10. Theadsorption isotherm of the catalyst is classified as Type 1 (Adsorption on micropores) [43].The Barrett–Joyner–Halenda (BJH) pore size distribution curve exhibits a maximum valueat around 12 nm and drops to near zero above 50 nm. The catalyst has a surface area of300 m2/g with a pore volume of 0.18 cm3/g and a pore size of 25 Å. As shown in Figure 10and Table 10, the HZSM-5 zeolite catalyst has a wide pore radius distribution and a highsurface area that facilitates the penetration of naphthenic acids to the pores of the catalystwhile providing sufficient area for decarboxylation reaction.
Catalysts 2022, 12, x FOR PEER REVIEW 15 of 24
surface area that facilitates the penetration of naphthenic acids to the pores of the catalyst
while providing sufficient area for decarboxylation reaction.
Table 10. BET analysis Results.
Sample Surface Area (m2/g) Pore Volume (cm3/g) Pore Size (Å)
HZSM-5 zeolite catalyst 300 0.18 25
(a) (b)
Figure 10. (a) BET nitrogen adsorption isotherm; (b) Barrett-Joyner-Halenda (BJH) pore size
distribution curve.
3.3. Analytical Method for TAN Number Determination
The ASTM D664 standard potentiometric titration apparatus or ASTM D974
colorimetric apparatus is generally used to measure TAN. The former is utilized in this
work because it is more accurate for dark and colored samples which is the case in this
study. The ASTM D664 potentiometric titration apparatus consists of an electrode,
voltmeter/PH meter, stirrer, and a burette to add the titrant. Table 11 below provides the
correct sample sizes of crude oil that should be weighed to measure TAN. The steps to
evaluate the TAN number are provided in Figure 11 [44]. The reagents needed for the test
are potassium hydrogen phthalate (KHP), isopropyl alcohol, toluene, and CO2-free water.
The electrode was washed well with the titration solvent before using it to avoid errors in
measurements. The titration solvent used in this work was 0.1 N potassium hydroxide
[45].
The TAN calculation equation is as follows [44]:
𝑇𝐴𝑁 =(𝑉𝐸 − 𝑉) × 𝑀 × 56.1
𝑊 (7)
Where,
VE = Volume of potassium hydroxide titrated until equilibrium (mL)
V = Volume of potassium hydroxide from titration of blank (mL)
M = Potassium hydroxide concentration (mol/mL)
W = Mass of the sample (g)
Table 11. Indication for a correct sample size of the potentiometric titration method.
TAN [mg KOH/g Sample] Sample Weight [g] Weighing Accuracy [30]
0.05–0.9 10 ± 2 100
1–4.9 5 ± 0.5 20
5–19 1 ± 0.1 5
Figure 10. (a) BET nitrogen adsorption isotherm; (b) Barrett-Joyner-Halenda (BJH) pore size distribu-tion curve.
Table 10. BET analysis Results.
Sample Surface Area (m2/g) Pore Volume (cm3/g) Pore Size (Å)
HZSM-5 zeolite catalyst 300 0.18 25
3.3. Analytical Method for TAN Number Determination
The ASTM D664 standard potentiometric titration apparatus or ASTM D974 colori-metric apparatus is generally used to measure TAN. The former is utilized in this workbecause it is more accurate for dark and colored samples which is the case in this study.The ASTM D664 potentiometric titration apparatus consists of an electrode, voltmeter/PHmeter, stirrer, and a burette to add the titrant. Table 11 below provides the correct samplesizes of crude oil that should be weighed to measure TAN. The steps to evaluate the TANnumber are provided in Figure 11 [44]. The reagents needed for the test are potassiumhydrogen phthalate (KHP), isopropyl alcohol, toluene, and CO2-free water. The electrodewas washed well with the titration solvent before using it to avoid errors in measurements.The titration solvent used in this work was 0.1 N potassium hydroxide [45].
Catalysts 2022, 12, 495 15 of 23
Table 11. Indication for a correct sample size of the potentiometric titration method.
TAN [mg KOH/g Sample] Sample Weight [g] Weighing Accuracy [30]
0.05–0.9 10 ± 2 1001–4.9 5 ± 0.5 205–19 1 ± 0.1 520–99 0.25 ± 0.02 1
100–250 0.1 ± 0.01 0.5
Catalysts 2022, 12, x FOR PEER REVIEW 16 of 24
20–99 0.25 ± 0.02 1
100–250 0.1 ± 0.01 0.5
Figure 11. Block diagram of ASTM D664 potentiometric titration test steps.
3.4. Experimental Section
This section presents the details on the configuration of the experimental setup, the
approach used to sequence the experiments using full factorial design, and finally the
various steps required to develop reaction kinetics. The experimental apparatus consisted
of a 500 mL glass batch reactor and was fabricated at the University of Khartoum
glassware shop. The reactor has a maximum temperature rating of 1000 C. The reactor is
heated with a heating mantle and subjected to uniform stirring. The vacuum pump, valve,
and temperature controlling system (thermocouple and controller) are connected to the
reactor. The experiment is conducted by following a sequence of steps that comprise
weighing the catalyst and crude oil, loading the chemicals in the reactor, and adjusting
the desired temperature and pressure.
3.4.1. Naphthenic Acid Removal Assessment
A DOE matrix is developed to study the effect of temperature, time, and oil:catalyst
ratio on naphthenic acid removal via catalytic decarboxylation over HZSM-5 zeolite.
Factorial design is a powerful tool to study the effects and interactions between the
various parameters. This approach helps in the identification of the various factors
involved in the process that have a profound impact on the targeted response. Moreover,
it reduces the number of experiments required to study the effect of different factors by
eliminating redundancies [46–49].
A three-factorial design (i.e., three factors with three levels each) is employed as
shown in Table 12. The levels are selected according to the optimized results reported by
Zhang et al. [1]. Based on Zhang et al.’s [1] recommendations, the low, medium, and high
levels of temperature are set at 250 °C, 270 °C, and 300 °C, respectively. The low, medium
and high levels of time are set at 2, 3 and 4 h, respectively. The low, medium, and high
levels of oil:catalyst ratio are set at 25, 22, and 20 g/g, respectively. On the other hand, TAN
is selected as a response variable. The experimental design matrix is generated by
MINITAB® software, and the results are analyzed by analysis of variance (ANOVA) and
coefficient of determination (R2).
Table 12. DOE matrix of the low, medium, and high levels of temperature, time, and oil:catalyst
ratio using 33 Factorial frameworks.
Factors Low Level
(−)
Medium Level
(0)
High Level
(+)
Temperature (T in °C) 250 270 300
Time (t in h) 2 3 4
Crude Oil/Zeolite ratio (R in g/g) 25 22 20
Figure 11. Block diagram of ASTM D664 potentiometric titration test steps.
The TAN calculation equation is as follows [44]:
TAN =(VE −V)×M× 56.1
W(7)
where,VE = Volume of potassium hydroxide titrated until equilibrium (mL)V = Volume of potassium hydroxide from titration of blank (mL)M = Potassium hydroxide concentration (mol/mL)W = Mass of the sample (g)
3.4. Experimental Section
This section presents the details on the configuration of the experimental setup, theapproach used to sequence the experiments using full factorial design, and finally thevarious steps required to develop reaction kinetics. The experimental apparatus consistedof a 500 mL glass batch reactor and was fabricated at the University of Khartoum glasswareshop. The reactor has a maximum temperature rating of 1000 ◦C. The reactor is heatedwith a heating mantle and subjected to uniform stirring. The vacuum pump, valve, andtemperature controlling system (thermocouple and controller) are connected to the reactor.The experiment is conducted by following a sequence of steps that comprise weighingthe catalyst and crude oil, loading the chemicals in the reactor, and adjusting the desiredtemperature and pressure.
3.4.1. Naphthenic Acid Removal Assessment
A DOE matrix is developed to study the effect of temperature, time, and oil:catalystratio on naphthenic acid removal via catalytic decarboxylation over HZSM-5 zeolite. Fac-torial design is a powerful tool to study the effects and interactions between the variousparameters. This approach helps in the identification of the various factors involved inthe process that have a profound impact on the targeted response. Moreover, it reducesthe number of experiments required to study the effect of different factors by eliminatingredundancies [46–49].
A three-factorial design (i.e., three factors with three levels each) is employed asshown in Table 12. The levels are selected according to the optimized results reported byZhang et al. [1]. Based on Zhang et al.’s [1] recommendations, the low, medium, and highlevels of temperature are set at 250 ◦C, 270 ◦C, and 300 ◦C, respectively. The low, medium
Catalysts 2022, 12, 495 16 of 23
and high levels of time are set at 2, 3 and 4 h, respectively. The low, medium, and highlevels of oil:catalyst ratio are set at 25, 22, and 20 g/g, respectively. On the other hand,TAN is selected as a response variable. The experimental design matrix is generated byMINITAB® software, and the results are analyzed by analysis of variance (ANOVA) andcoefficient of determination (R2).
Table 12. DOE matrix of the low, medium, and high levels of temperature, time, and oil:catalyst ratiousing 33 Factorial frameworks.
Factors Low Level(−)
Medium Level(0)
High Level(+)
Temperature (T in ◦C) 250 270 300Time (t in h) 2 3 4
Crude Oil/Zeoliteratio (R in g/g) 25 22 20
The primary purpose of ANOVA is to identify which design parameters affect thequality characteristic. This method identifies whether the results of the experiment aresignificant. ANOVA table consists of a sum of squares, a corresponding degree of freedom,the F value, and the p-value [34].
The Pareto chart lists the effect of each variable from largest to smallest effect. The ref-erence line in the chart depends on the value of alpha which equals 1 minus the confidencelevel for the analysis. When the bar in the Pareto chart crosses the reference line, the effectwill be considered significant [50].
The percentage of acid removed is evaluated using the initial and the final TAN valuesas per the following equation [20]:
Acid removal% =Initial TAN− Final TAN
Initial TAN× 100 (8)
3.4.2. Kinetic Modeling and Regression Analysis
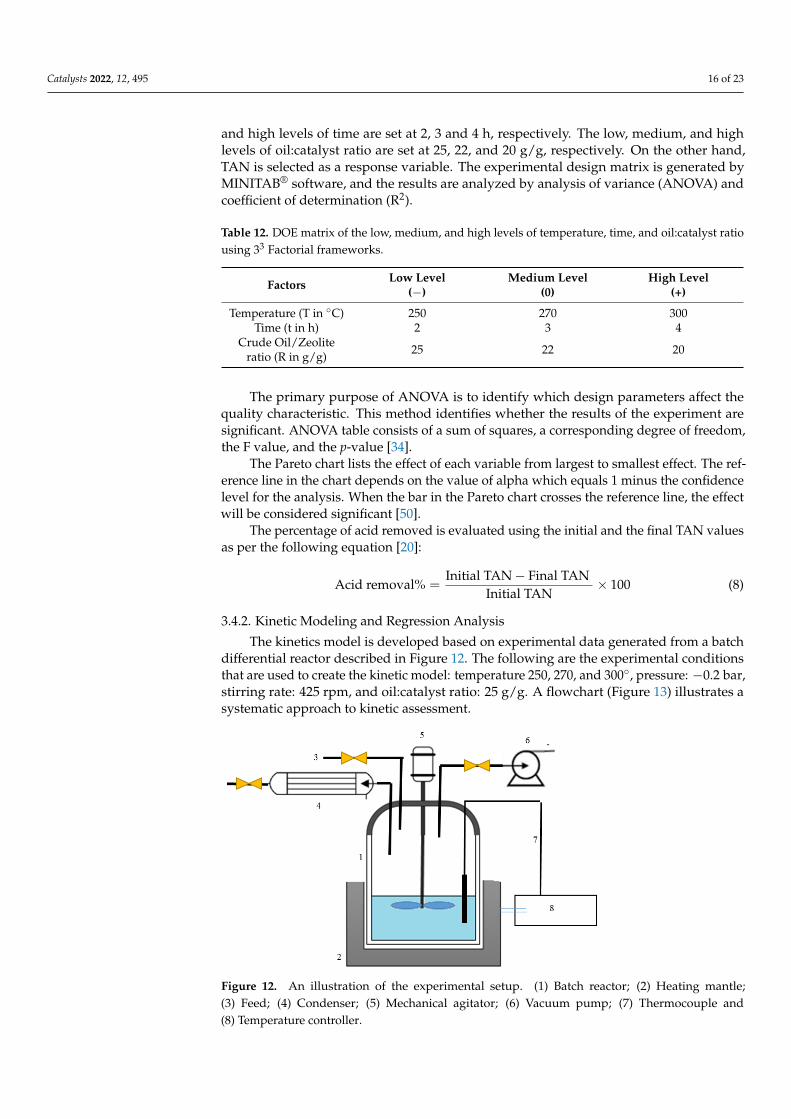
The kinetics model is developed based on experimental data generated from a batchdifferential reactor described in Figure 12. The following are the experimental conditionsthat are used to create the kinetic model: temperature 250, 270, and 300◦, pressure: −0.2 bar,stirring rate: 425 rpm, and oil:catalyst ratio: 25 g/g. A flowchart (Figure 13) illustrates asystematic approach to kinetic assessment.
Catalysts 2022, 12, x FOR PEER REVIEW 17 of 24
The primary purpose of ANOVA is to identify which design parameters affect the
quality characteristic. This method identifies whether the results of the experiment are
significant. ANOVA table consists of a sum of squares, a corresponding degree of
freedom, the F value, and the p-value [34].
The Pareto chart lists the effect of each variable from largest to smallest effect. The
reference line in the chart depends on the value of alpha which equals 1 minus the
confidence level for the analysis. When the bar in the Pareto chart crosses the reference
line, the effect will be considered significant [50].
The percentage of acid removed is evaluated using the initial and the final TAN
values as per the following equation [20]:
Acid removal% =Initial TAN − Final TAN
Initial TAN× 100 (8)
3.4.2. Kinetic Modeling and Regression Analysis
The kinetics model is developed based on experimental data generated from a batch
differential reactor described in Figure 12. The following are the experimental conditions
that are used to create the kinetic model: temperature 250, 270, and 300°, pressure: −0.2
bar, stirring rate: 425 rpm, and oil:catalyst ratio: 25 g/g. A flowchart (Figure 13) illustrates
a systematic approach to kinetic assessment.
Figure 12. An illustration of the experimental setup. (1) Batch reactor; (2) Heating mantle; (3) Feed;
(4) Condenser; (5) Mechanical agitator; (6) Vacuum pump; (7) Thermocouple and (8) Temperature
controller.
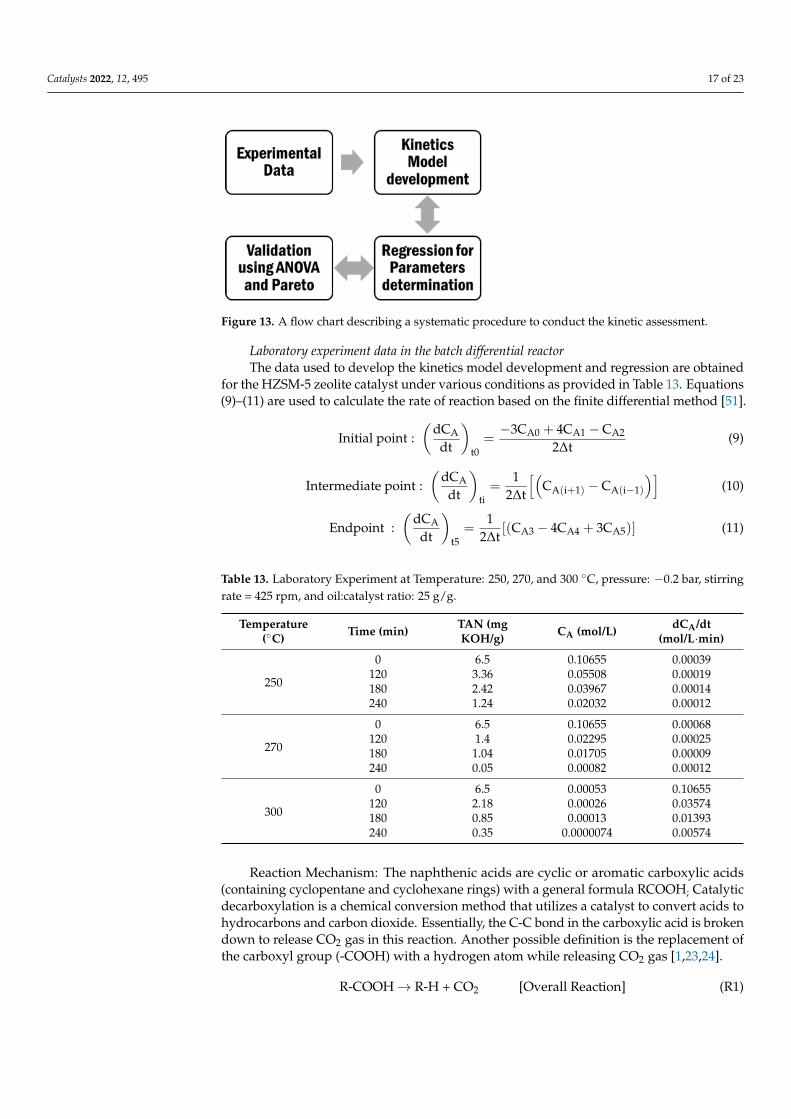
Figure 13. A flow chart describing a systematic procedure to conduct the kinetic assessment.
Figure 12. An illustration of the experimental setup. (1) Batch reactor; (2) Heating mantle;(3) Feed; (4) Condenser; (5) Mechanical agitator; (6) Vacuum pump; (7) Thermocouple and(8) Temperature controller.
Catalysts 2022, 12, 495 17 of 23
Catalysts 2022, 12, x FOR PEER REVIEW 17 of 24
The primary purpose of ANOVA is to identify which design parameters affect the
quality characteristic. This method identifies whether the results of the experiment are
significant. ANOVA table consists of a sum of squares, a corresponding degree of
freedom, the F value, and the p-value [34].
The Pareto chart lists the effect of each variable from largest to smallest effect. The
reference line in the chart depends on the value of alpha which equals 1 minus the
confidence level for the analysis. When the bar in the Pareto chart crosses the reference
line, the effect will be considered significant [50].
The percentage of acid removed is evaluated using the initial and the final TAN
values as per the following equation [20]:
Acid removal% =Initial TAN − Final TAN
Initial TAN× 100 (8)
3.4.2. Kinetic Modeling and Regression Analysis
The kinetics model is developed based on experimental data generated from a batch
differential reactor described in Figure 12. The following are the experimental conditions
that are used to create the kinetic model: temperature 250, 270, and 300°, pressure: −0.2
bar, stirring rate: 425 rpm, and oil:catalyst ratio: 25 g/g. A flowchart (Figure 13) illustrates
a systematic approach to kinetic assessment.
Figure 12. An illustration of the experimental setup. (1) Batch reactor; (2) Heating mantle; (3) Feed;
(4) Condenser; (5) Mechanical agitator; (6) Vacuum pump; (7) Thermocouple and (8) Temperature
controller.
Figure 13. A flow chart describing a systematic procedure to conduct the kinetic assessment.
Figure 13. A flow chart describing a systematic procedure to conduct the kinetic assessment.
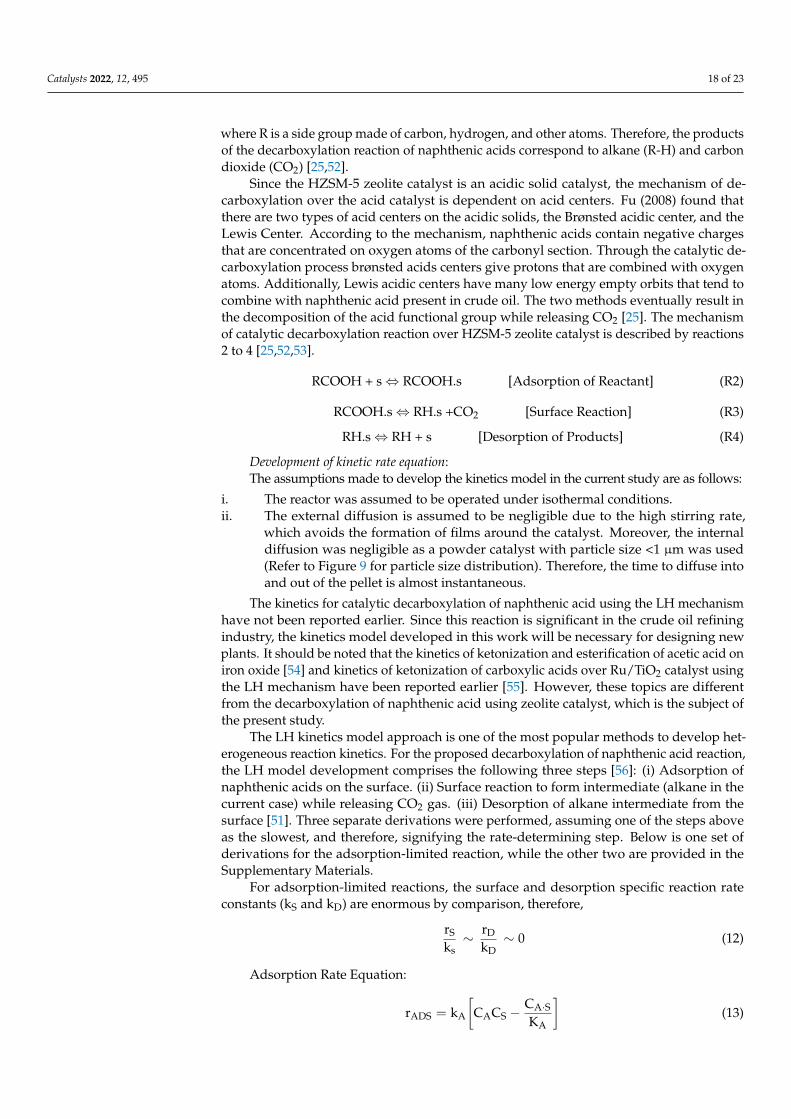
Laboratory experiment data in the batch differential reactorThe data used to develop the kinetics model development and regression are obtained
for the HZSM-5 zeolite catalyst under various conditions as provided in Table 13. Equations(9)–(11) are used to calculate the rate of reaction based on the finite differential method [51].
Initial point :(
dCA
dt
)t0=−3CA0 + 4CA1 −CA2
2∆t(9)
Intermediate point :(
dCA
dt
)ti=
12∆t
[(CA(i+1) −CA(i−1)
)](10)
Endpoint :(
dCA
dt
)t5=
12∆t
[(CA3 − 4CA4 + 3CA5)] (11)
Table 13. Laboratory Experiment at Temperature: 250, 270, and 300 ◦C, pressure: −0.2 bar, stirringrate = 425 rpm, and oil:catalyst ratio: 25 g/g.
Temperature(◦C) Time (min) TAN (mg
KOH/g) CA (mol/L) dCA/dt(mol/L·min)
250
0 6.5 0.10655 0.00039120 3.36 0.05508 0.00019180 2.42 0.03967 0.00014240 1.24 0.02032 0.00012
270
0 6.5 0.10655 0.00068120 1.4 0.02295 0.00025180 1.04 0.01705 0.00009240 0.05 0.00082 0.00012
300
0 6.5 0.00053 0.10655120 2.18 0.00026 0.03574180 0.85 0.00013 0.01393240 0.35 0.0000074 0.00574
Reaction Mechanism: The naphthenic acids are cyclic or aromatic carboxylic acids(containing cyclopentane and cyclohexane rings) with a general formula RCOOH; Catalyticdecarboxylation is a chemical conversion method that utilizes a catalyst to convert acids tohydrocarbons and carbon dioxide. Essentially, the C-C bond in the carboxylic acid is brokendown to release CO2 gas in this reaction. Another possible definition is the replacement ofthe carboxyl group (-COOH) with a hydrogen atom while releasing CO2 gas [1,23,24].
R-COOH→ R-H + CO2 [Overall Reaction] (R1)
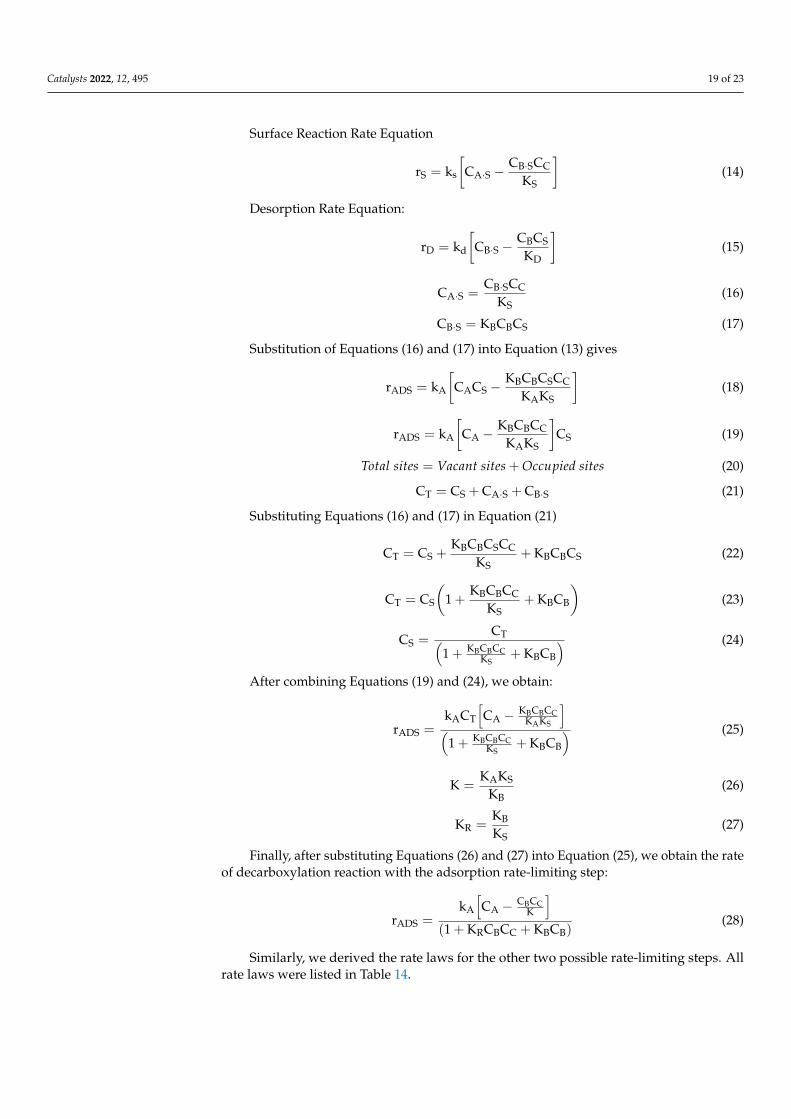
Catalysts 2022, 12, 495 18 of 23
where R is a side group made of carbon, hydrogen, and other atoms. Therefore, the productsof the decarboxylation reaction of naphthenic acids correspond to alkane (R-H) and carbondioxide (CO2) [25,52].
Since the HZSM-5 zeolite catalyst is an acidic solid catalyst, the mechanism of de-carboxylation over the acid catalyst is dependent on acid centers. Fu (2008) found thatthere are two types of acid centers on the acidic solids, the Brønsted acidic center, and theLewis Center. According to the mechanism, naphthenic acids contain negative chargesthat are concentrated on oxygen atoms of the carbonyl section. Through the catalytic de-carboxylation process brønsted acids centers give protons that are combined with oxygenatoms. Additionally, Lewis acidic centers have many low energy empty orbits that tend tocombine with naphthenic acid present in crude oil. The two methods eventually result inthe decomposition of the acid functional group while releasing CO2 [25]. The mechanismof catalytic decarboxylation reaction over HZSM-5 zeolite catalyst is described by reactions2 to 4 [25,52,53].
RCOOH + s⇔ RCOOH.s [Adsorption of Reactant] (R2)
RCOOH.s⇔ RH.s +CO2 [Surface Reaction] (R3)
RH.s⇔ RH + s [Desorption of Products] (R4)
Development of kinetic rate equation:The assumptions made to develop the kinetics model in the current study are as follows:
i. The reactor was assumed to be operated under isothermal conditions.ii. The external diffusion is assumed to be negligible due to the high stirring rate,
which avoids the formation of films around the catalyst. Moreover, the internaldiffusion was negligible as a powder catalyst with particle size <1 µm was used(Refer to Figure 9 for particle size distribution). Therefore, the time to diffuse intoand out of the pellet is almost instantaneous.
The kinetics for catalytic decarboxylation of naphthenic acid using the LH mechanismhave not been reported earlier. Since this reaction is significant in the crude oil refiningindustry, the kinetics model developed in this work will be necessary for designing newplants. It should be noted that the kinetics of ketonization and esterification of acetic acid oniron oxide [54] and kinetics of ketonization of carboxylic acids over Ru/TiO2 catalyst usingthe LH mechanism have been reported earlier [55]. However, these topics are differentfrom the decarboxylation of naphthenic acid using zeolite catalyst, which is the subject ofthe present study.
The LH kinetics model approach is one of the most popular methods to develop het-erogeneous reaction kinetics. For the proposed decarboxylation of naphthenic acid reaction,the LH model development comprises the following three steps [56]: (i) Adsorption ofnaphthenic acids on the surface. (ii) Surface reaction to form intermediate (alkane in thecurrent case) while releasing CO2 gas. (iii) Desorption of alkane intermediate from thesurface [51]. Three separate derivations were performed, assuming one of the steps aboveas the slowest, and therefore, signifying the rate-determining step. Below is one set ofderivations for the adsorption-limited reaction, while the other two are provided in theSupplementary Materials.
For adsorption-limited reactions, the surface and desorption specific reaction rateconstants (kS and kD) are enormous by comparison, therefore,
rS
ks∼ rD
kD∼ 0 (12)
Adsorption Rate Equation:
rADS = kA
[CACS −
CA·SKA
](13)
Catalysts 2022, 12, 495 19 of 23
Surface Reaction Rate Equation
rS = ks
[CA·S −
CB·SCC
KS
](14)
Desorption Rate Equation:
rD = kd
[CB·S −
CBCS
KD
](15)
CA·S =CB·SCC
KS(16)
CB·S = KBCBCS (17)
Substitution of Equations (16) and (17) into Equation (13) gives
rADS = kA
[CACS −
KBCBCSCC
KAKS
](18)
rADS = kA
[CA −
KBCBCC
KAKS
]CS (19)
Total sites = Vacant sites + Occupied sites (20)
CT = CS + CA·S + CB·S (21)
Substituting Equations (16) and (17) in Equation (21)
CT = CS +KBCBCSCC
KS+ KBCBCS (22)
CT = CS
(1 +
KBCBCC
KS+ KBCB
)(23)
CS =CT(
1 + KBCBCCKS
+ KBCB
) (24)
After combining Equations (19) and (24), we obtain:
rADS =kACT
[CA − KBCBCC
KAKS
](
1 + KBCBCCKS
+ KBCB
) (25)
K =KAKS
KB(26)
KR =KB
KS(27)
Finally, after substituting Equations (26) and (27) into Equation (25), we obtain the rateof decarboxylation reaction with the adsorption rate-limiting step:
rADS =kA
[CA − CBCC
K
](1 + KRCBCC + KBCB)
(28)
Similarly, we derived the rate laws for the other two possible rate-limiting steps. Allrate laws were listed in Table 14.
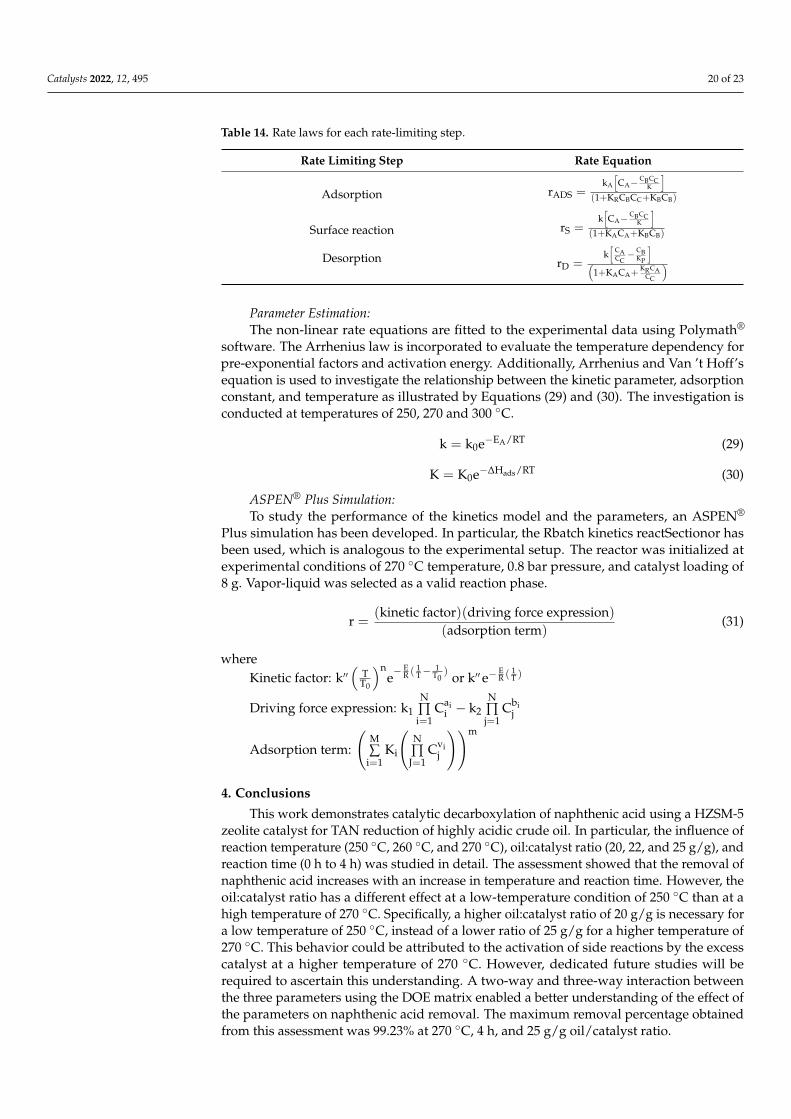
Catalysts 2022, 12, 495 20 of 23
Table 14. Rate laws for each rate-limiting step.
Rate Limiting Step Rate Equation
Adsorption rADS =kA
[CA−
CBCCK
](1+KRCBCC+KBCB)
Surface reaction rS =k[CA−
CBCCK
](1+KACA+KBCB)
Desorption rD =k[
CACC− CB
KP
](
1+KACA+KRCA
CC
)
Parameter Estimation:The non-linear rate equations are fitted to the experimental data using Polymath®
software. The Arrhenius law is incorporated to evaluate the temperature dependency forpre-exponential factors and activation energy. Additionally, Arrhenius and Van ’t Hoff’sequation is used to investigate the relationship between the kinetic parameter, adsorptionconstant, and temperature as illustrated by Equations (29) and (30). The investigation isconducted at temperatures of 250, 270 and 300 ◦C.
k = k0e−EA/RT (29)
K = K0e−∆Hads/RT (30)
ASPEN® Plus Simulation:To study the performance of the kinetics model and the parameters, an ASPEN®
Plus simulation has been developed. In particular, the Rbatch kinetics reactSectionor hasbeen used, which is analogous to the experimental setup. The reactor was initialized atexperimental conditions of 270 ◦C temperature, 0.8 bar pressure, and catalyst loading of8 g. Vapor-liquid was selected as a valid reaction phase.
r =(kinetic factor)(driving force expression)
(adsorption term)(31)
whereKinetic factor: k′′
(TT0
)ne−
ER (
1T−
1T0
) or k′′ e−ER (
1T )
Driving force expression: k1N∏i=1
Caii − k2
N∏j=1
Cbij
Adsorption term:
(M∑
i=1Ki
(N∏
J=1Cvi
j
))m
4. Conclusions
This work demonstrates catalytic decarboxylation of naphthenic acid using a HZSM-5zeolite catalyst for TAN reduction of highly acidic crude oil. In particular, the influence ofreaction temperature (250 ◦C, 260 ◦C, and 270 ◦C), oil:catalyst ratio (20, 22, and 25 g/g), andreaction time (0 h to 4 h) was studied in detail. The assessment showed that the removal ofnaphthenic acid increases with an increase in temperature and reaction time. However, theoil:catalyst ratio has a different effect at a low-temperature condition of 250 ◦C than at ahigh temperature of 270 ◦C. Specifically, a higher oil:catalyst ratio of 20 g/g is necessary fora low temperature of 250 ◦C, instead of a lower ratio of 25 g/g for a higher temperature of270 ◦C. This behavior could be attributed to the activation of side reactions by the excesscatalyst at a higher temperature of 270 ◦C. However, dedicated future studies will berequired to ascertain this understanding. A two-way and three-way interaction betweenthe three parameters using the DOE matrix enabled a better understanding of the effect ofthe parameters on naphthenic acid removal. The maximum removal percentage obtainedfrom this assessment was 99.23% at 270 ◦C, 4 h, and 25 g/g oil/catalyst ratio.
Catalysts 2022, 12, 495 21 of 23
The kinetics model developed in this work utilized the LH approach to derive rateexpression while assuming adsorption rate, desorption rate, and surface reactions as rate-limiting steps. The rate expression based on the adsorption rate-limiting step provided thebest regression results and validation using ANOVA and Pareto charts. The rate expressiondeveloped in this work will aid future simulation studies and scalability assessments,especially for designing new refineries based on acidic crude oil.
Supplementary Materials: The following supporting information can be downloaded at: https://www.mdpi.com/article/10.3390/catal12050495/s1.
Author Contributions: N.O.H. is the first author and she conducted the research work. Her contribu-tion is on the “Conceptualization; methodology; formal analysis, data curation, and writing—originaldraft preparation. M.C. supported N.O.H. efforts in conducting formal analysis; writing—reviewand editing; D.M.B. is a co-supervisor for N.O.H. and her contribution is Conceptualization andSupervision; N.O.E. is the supervisor for N.O.H. thesis and his contribution is on the conceptualiza-tion, resources, supervision, writing—review and editing. All authors have read and agreed to thepublished version of the manuscript.
Funding: This research received no external funding.
Data Availability Statement: All data is included in the paper.
Acknowledgments: The authors express their gratitude to Texas A&M Gas & Fuels Research Centerand the technical labs of the University of Khartoum.
Conflicts of Interest: The authors declare no conflict of interest.
Nomenclature
A RCOOHAdj SS Adjusted sums of squaresAdj MS Adjusted mean squaresANOVA Analysis of varianceB RHC CO2CA·S The concentration of component A adsorb on siteCB·S The concentration of component B adsorb on siteCO2 Carbon dioxideCS Vacant sitesCT Total sites availableDF Degree of FreedomE Activation EnergyF-Value Test statistics use in the analysis of variance∆Hads heat of adsorptionk Kinetic constantK Equilibrium constantKHP Potassium Hydrogen PhthalateP Pressurep-Value Analysis of variance test gives the significance of each factorR Gas constantR2 Coefficient of determinationR2
adj Adjusted Coefficient of determinationrADS Rate of adsorptionrD Rate of desorptionRmsd root-mean-square deviationrS Rate of surface reactionT TemperatureTAN Total acid number
Catalysts 2022, 12, 495 22 of 23
References1. Zhang, A.; Ma, Q.; Wang, K.; Tang, Y.; Goddard, W.A. Improved Processes to Remove Naphthenic Acids; California Inst. of Technology
(CalTech): Pasadena, CA, USA, 2005.2. Patrick, B.N. Understanding Naphthenic Acid Corrosion in Refinery Settings; California Digital Library: Berkeley, CA, USA, 2015.3. Zhang, A.; Ma, Q.; Wang, K.; Liu, X.; Shuler, P.; Tang, Y. Naphthenic acid removal from crude oil through catalytic decarboxylation
on magnesium oxide. Appl. Catal. A Gen. 2006, 303, 103–109. [CrossRef]4. Rana, B.S.; Cho, D.-W.; Cho, K.; Kim, J.-N. Total Acid Number (TAN) reduction of high acidic crude oil by catalytic esterification
of naphthenic acids in fixed-bed continuous flow reactor. Fuel 2018, 231, 271–280. [CrossRef]5. Liu, G.Q.; Zhang, X.L.; Qu, D.R.; Zheng, Y.G.; Jiang, S.L.; Jiang, X.; Yang, Q.X.; Han, F.L. Naphthenic acid corrosion characteristic
and corrosion product film resistance of carbon steel and Cr5Mo low alloy steel in secondary vacuum gas oil. Corros. Eng. Sci.Technol. 2016, 51, 445–454. [CrossRef]
6. Cho, K.; Rana, B.S.; Cho, D.-W.; Beum, H.T.; Kim, C.-H.; Kim, J.-N. Catalytic removal of naphthenic acids over Co-Mo/γ-Al2O3catalyst to reduce total acid number (TAN) of highly acidic crude oil. Appl. Catal. A Gen. 2020, 606, 117835. [CrossRef]
7. Harun, N.S.C.; Shohaimi, N.A.M.; Daud, S. Total Acid Number Reduction of Acidic Petroleum Crude Oil by Using2-Methylimidazole in Polyethylene Glycol and Ca/Al2O3 Catalyst. Mater. Sci. Forum 2021, 1025, 337–342. [CrossRef]
8. Wang, Y.-Z.; Li, J.-Y.; Sun, X.-Y.; Duan, H.-L.; Song, C.-M.; Zhang, M.-M.; Liu, Y.-P. Removal of naphthenic acids from crude oilsby fixed-bed catalytic esterification. Fuel 2013, 116, 723–728. [CrossRef]
9. Park, J.; Zafar, F.; Kim, C.H.; Choi, J.; Bae, J.W. Synergy effects of basic graphitic-C3N4 over acidic Al2O3 for a liquid-phasedecarboxylation of naphthenic acids. Fuel Process. Technol. 2018, 184, 36–44. [CrossRef]
10. Mandal, P.C.; Wahyudiono, P.C.; Sasaki, M.; Goto, M. Reduction of total acid number (TAN) of naphthenic acid (NA) usingsupercritical water for reducing corrosion problems of oil refineries. Fuel 2012, 94, 620–623. [CrossRef]
11. Wu, C. Computational Study on Removal of Naphthenic Acids from Petroleum-Based Systems; University of Calgary: Calgary, Alberta,2017.
12. Santos, D.F.; Chaves, A.R.; Ostroski, I.C. Naphthenic acid removal in model and real aviation kerosene mixture. Chem. Eng.Commun. 2020, 208, 1405–1418. [CrossRef]
13. Derungs, W. Naphthenic acid corrosion—An old enemy of the petroleum industry. Corrosion 1956, 12, 41–46. [CrossRef]14. Barth, T.; Moen, L.; Dyrkorn, C. Comparison of acid numbers and carboxylic acid molecular compositions in biodegraded and
normal crude oils. Prepr. Am. Chem. Society. Div. Pet. Chem. 1998, 43, 134–136.15. Jaffé, R.; Gallardo, M.T. Application of carboxylic acid biomarkers as indicators of biodegradation and migration of crude oils
from the Maracaibo Basin, Western Venezuela. Org. Geochem. 1993, 20, 973–984. [CrossRef]16. Headley, J.V.; Peru, K.M.; Barrow, M.P. Mass spectrometric characterization of naphthenic acids in environmental samples: A
review. Mass Spectrom. Rev. 2008, 28, 121–134. [CrossRef] [PubMed]17. Grewer, D.M.; Young, R.F.; Whittal, R.M.; Fedorak, P.M. Naphthenic acids and other acid-extractables in water samples from
Alberta: What is being measured? Sci. Total Environ. 2010, 408, 5997–6010. [CrossRef]18. Yang, C.; Zhang, G.; Serhan, M.; Koivu, G.; Yang, Z.; Hollebone, B.; Lambert, P.; Brown, C.E. Characterization of naphthenic acids
in crude oils and refined petroleum products. Fuel 2019, 255, 115849. [CrossRef]19. Rowland, S.J.; West, C.E.; Scarlett, A.G.; Jones, D.; Boberek, M.; Pan, L.; Ng, M.; Kwong, L.; Tonkin, A. Monocyclic and
monoaromatic naphthenic acids: Synthesis and characterisation. Environ. Chem. Lett. 2011, 9, 525–533. [CrossRef]20. Messele, S.A.; Chelme-Ayala, P.; El-Din, M.G. Catalytic ozonation of naphthenic acids in the presence of carbon-based metal-free
catalysts: Performance and kinetic study. Catal. Today 2021, 361, 102–108. [CrossRef]21. Kang, S.S.; Kang, J.W. Extraction of naphthenic acid from low-grade crude oil using diol compounds. Fuel 2020, 275, 117828.
[CrossRef]22. Adams, F.V.; Chukwuneke, C.E.; Agboola, B.O. Recent Techniques for the Removal of Naphthenic Acid from Heavy Crude Oils.
Process. Heavy Crude Oils Chall. Oppor. 2019, 2019, 185. [CrossRef]23. Dias, H.P.; Gonçalves, G.R.; Freitas, J.C.; Gomes, A.O.; de Castro, E.V.; Vaz, B.G.; Aquije, G.M.; Romão, W. Catalytic decarboxyla-
tion of naphthenic acids in crude oils. Fuel 2015, 158, 113–121. [CrossRef]24. Ding, L.; Rahimi, P.; Hawkins, R.; Bhatt, S.; Shi, Y. Naphthenic acid removal from heavy oils on alkaline earth-metal oxides and
ZnO catalysts. Appl. Catal. A Gen. 2009, 371, 121–130. [CrossRef]25. Fu, X.; Dai, Z.; Tian, S.; Long, J.; Hou, S.; Wang, X. Catalytic Decarboxylation of Petroleum Acids from High Acid Crude Oils over
Solid Acid Catalysts. Energy Fuels 2008, 22, 1923–1929. [CrossRef]26. Coto, B.; Suárez, I.; Tenorio, M.J.; Nieto, S.; Alvarez, N.; Peña, J.L. Oil acidity reduction by extraction with imidazolium ionic
liquids: Experimental, COSMO description and reutilization study. Sep. Purif. Technol. 2020, 254, 117529. [CrossRef]27. Takemura, Y.; Nakamura, A.; Taguchi, H.; Ouchi, K. Catalytic decarboxylation of benzoic acid. Ind. Eng. Chem. Prod. Res. Dev.
1985, 24, 213–215. [CrossRef]28. Zhuman, B.; Anis, S.F.; Saepurahman; Singravel, G.; Hashaikeh, R. Catalytic Cracking of n-Hexadecane Using Carbon
Nanostructures/Nano-Zeolite-Y Composite Catalyst. Catalysts 2020, 10, 1385. [CrossRef]29. Xu, B.; Sievers, C.; Hong, S.B.; Prins, R.; van Bokhoven, J.A. Catalytic activity of Brønsted acid sites in zeolites: Intrinsic activity,
rate-limiting step, and influence of the local structure of the acid sites. J. Catal. 2006, 244, 163–168. [CrossRef]
Catalysts 2022, 12, 495 23 of 23
30. Silva, V.; Crispim, A.; Queiroz, M.; Laborde, H.; Rodrigues, M.; Menezes, R. Characterization structural and morphology ZSM-5zeolite by hydrothermal synthesis. In Proceedings of the Seventh International Latin American Conference on Powder Technology,Atibaia, SP, Brazil, 8–10 November 2009.
31. Oh, H.-Y.; Park, J.-H.; Rhee, Y.-W.; Kim, J.-N. Decarboxylation of naphthenic acid using alkaline earth metal oxide. J. Ind. Eng.Chem. 2011, 17, 788–793. [CrossRef]
32. Wang, Y.-Z.; Zhong, D.-L.; Duan, H.-L.; Song, C.-M.; Han, X.-T.; Ma, X.-R. Removal of naphthenic acids from crude oils bycatalytic decomposition using Mg–Al hydrotalcite/γ-Al2O3 as a catalyst. Fuel 2014, 134, 499–504. [CrossRef]
33. Zafar, F.; Park, J.; Kim, C.H.; Bae, J.W. Contributions of acidic-basic sites on hybridized FER@g-C3N4 for liquid-phase decarboxy-lation of naphthenic acids. Fuel 2021, 296, 120679. [CrossRef]
34. Shukri, N.M.; Jaafar, J.; Abu Bakar, W.A.W.; Majid, Z.A. Optimization of basic catalyst with ammoniated polyethylene glycolfor the removal of naphthenic acid from petroleum crude oil by Box–Behnken design. Clean Technol. Environ. Policy 2015, 17,2387–2400. [CrossRef]
35. Mathews, P.G. Design of Experiments with MINITAB; ASQ Quality Press: Milwaukee, WI, USA, 2005.36. Shah, K.K.; Saikia, J.; Saikia, D.; Talukdar, A.K. Synthesis and characterization of isomorphously zirconium substituted Mobil
Five (MFI) zeolite. Mater. Chem. Phys. 2012, 134, 43–49. [CrossRef]37. Deng, S.; Lv, G.; Zhai, Y.; Yang, Z.; Zhu, Y.; Li, H.; Wang, F.; Zhang, X. Framework Fe-Doped Mobil Five (MFI) Zeolites as Highly
Active and Stable Fenton-Like Catalysts for Basic Dyes Degradation. J. Nanosci. Nanotechnol. 2020, 20, 1520–1529. [CrossRef][PubMed]
38. Kwok, K.M.; Chen, L.; Zeng, H.C. Design of hollow spherical Co@ hsZSM5@ metal dual-layer nanocatalysts for tandem CO2hydrogenation to increase C2+ hydrocarbon selectivity. J. Mater. Chem. A 2020, 8, 12757–12766. [CrossRef]
39. Marsiezade, N.; Javanbakht, V. Novel hollow beads of carboxymethyl cellulose/ZSM-5/ZIF-8 for dye removal from aqueoussolution in batch and continuous fixed bed systems. Int. J. Biol. Macromol. 2020, 162, 1140–1152. [CrossRef] [PubMed]
40. Hassanpour, S.; Taghizadeh, M.; Yaripour, F. Preparation, Characterization, and Activity Evaluation of H-ZSM-5 Catalysts inVapor-Phase Methanol Dehydration to Dimethyl Ether. Ind. Eng. Chem. Res. 2010, 49, 4063–4069. [CrossRef]
41. Wang, X.; Zhang, J.; Zhang, T.; Xiao, H.; Song, F.; Han, Y.; Tan, Y. Mesoporous ZnZSM-5 zeolites synthesized by one-stepdesilication and reassembly: A durable catalyst for methanol aromatization. RSC Adv. 2016, 6, 23428–23437. [CrossRef]
42. Thommes, M. Textural Characterization of Zeolites and Ordered Mesoporous Materials by Physical Adsorption. Stud. Surf. Sci.Catal. 2007, 168, 495–523. [CrossRef]
43. Dollimore, D.; Spooner, P.; Turner, A. The bet method of analysis of gas adsorption data and its relevance to the calculation ofsurface areas. Surf. Technol. 1976, 4, 121–160. [CrossRef]
44. Khan, M.K.; Riaz, A.; Yi, M.; Kim, J. Removal of naphthenic acids from high acid crude via esterification with methanol. FuelProcess. Technol. 2017, 165, 123–130. [CrossRef]
45. ASTM D664-11; Standard Test Method for Acid Number of Petroleum Products by Potentiometric Titration. ASTM InternationalWest Conshohocken: West conshohocken, PA, USA, 2004.
46. Nascimento, G.; Duarte, M.; Schuler, A.; Barbosa, C. Synthesis, characterization, and application of the mesoporous molecularsieve Sr-MCM-41 in the removal of naphthenic acids from a model mixture of aviation kerosene by adsorption. Braz. J. Pet. Gas2014, 8, 1405–1418. [CrossRef]
47. Campos, N.F.; Barbosa, C.M.; Rodríguez-Díaz, J.M.; Duarte, M.M. Removal of naphthenic acids using activated charcoal: Kineticand equilibrium studies. Adsorpt. Sci. Technol. 2018, 36, 1405–1421. [CrossRef]
48. Hendges, L.T.; Costa, T.C.; Temochko, B.; González, S.Y.G.; Mazur, L.P.; Marinho, B.A.; da Silva, A.; Weschenfelder, S.E.; de Souza,A.A.U.; de Souza, S.M.G.U. Adsorption and desorption of water-soluble naphthenic acid in simulated offshore oilfield producedwater. Process Saf. Environ. Prot. 2020, 145, 262–272. [CrossRef]
49. Sabyasachi, M.; Venkatesh, M.; Ajay, K.D.; Dena, W.M.; John, V.H.; Kerry, M.P. Photocatalysis of naphthenic acids in water. J.Water Resour. Prot. 2010, 2010, 644–650.
50. Bingol, D.; Tekin, N.; Alkan, M. Brilliant Yellow dye adsorption onto sepiolite using a full factorial design. Appl. Clay Sci. 2010, 50,315–321. [CrossRef]
51. Fogler, H.S. Essentials of Chemical Reaction Engineering: Essenti Chemica Reactio Engi; Pearson Education: New Delhi, India, 2010.52. Brown, B.R. The mechanism of thermal decarboxylation. Q. Rev. Chem. Soc. 1951, 5, 131–146. [CrossRef]53. Chumaidi, A.; Dewajani, H.; Sulaiman, M.A.; Angestine, F.; Putri, A.; Pravitasari, S.A. Effect of temperature and Mg-Zn catalyst
ratio on decarboxylation reaction to produce green diesel from kapok oil with saponification pretreatment using NaOH. IOP Conf.Ser. Mater. Sci. Eng. 2021, 1073, 012002. [CrossRef]
54. Rajadurai, S. Pathways for Carboxylic Acid Decomposition on Transition Metal Oxides. Catal. Rev. 1994, 36, 385–403. [CrossRef]55. Pham, T.N.; Shi, D.; Resasco, D.E. Reaction kinetics and mechanism of ketonization of aliphatic carboxylic acids with different
carbon chain lengths over Ru/TiO2 catalyst. J. Catal. 2014, 314, 149–158. [CrossRef]56. Kumar, K.V.; Porkodi, K.; Rocha, F. Langmuir–Hinshelwood kinetics—A theoretical study. Catal. Commun. 2008, 9, 82–84.
[CrossRef]