kidney, splanchnic, and leg protein turnover in humans. insight from leucine and phenylalanine...
TRANSCRIPT
Kidney and Splanchnic Protein Turnover in Humans
1481
J. Clin. Invest.© The American Society for Clinical Investigation, Inc.0021-9738/96/09/1481/12 $2.00Volume 98, Number 6, September 1996, 1481–1492
Kidney, Splanchnic, and Leg Protein Turnover in Humans
Insight from Leucine and Phenylalanine Kinetics
Paolo Tessari, Giacomo Garibotto,* Sandro Inchiostro, Cristina Robaudo,* Stefano Saffioti,* Monica Vettore, Michela Zanetti, Rodolfo Russo,* and Giacomo Deferrari*
Department of Metabolic Diseases, University of Padova; and *Division of Nephrology, Department of Internal Medicine,University of Genova, Italy
Abstract
The rate of kidney protein turnover in humans is notknown. To this aim, we have measured kidney protein syn-thesis and degradation in postabsorptive humans using thearterio-venous catheterization technique combined with
14
C-leucine,
15
N-leucine, and
3
H-phenylalanine tracer infu-sions. These measurements were compared with those ob-
tained across the splanchnic bed, the legs (
<
muscle) and inthe whole body. In the kidneys, protein balance was nega-tive, as the rate of leucine release from protein degradation(16.8
6
5.1
m
mol/min
?
1.73 m
2
) was greater (
P
,
0.02) thanits uptake into protein synthesis (11.6
6
5.1
m
mol/min
?
1.73m
2
). Splanchnic net protein balance was
<
0 since leucinefrom protein degradation (32.1
6
9.9
m
mol/min
?
1.73 m
2
) andleucine into protein synthesis (30.8
6
11.5
m
mol/min
?
1.73m
2
) were not different. In the legs, degradation exceededsynthesis (27.4
6
6.6 vs. 20.3
6
6.5
m
mol/min
?
1.73 m
2
,
P
,
0.02). The kidneys extracted
a
-ketoisocaproic acid, ac-counting for
<
70% of net splanchnic
a
-ketoisocaproic acidrelease. The contributions by the kidneys to whole-body leu-cine rate of appearance, utilization for protein synthesis,and oxidation were
<
11%,
<
10%, and
<
26%, respectively;those by the splanchnic area
<
22%,
<
27%, and
<
18%;those from estimated total skeletal muscle
<
37%,
<
34%,and
<
48%. Estimated fractional protein synthetic rateswere
<
42%/d in the kidneys,
<
12% in the splanchnic area,and
<
1.5% in muscle. This study reports the first estimatesof kidney protein synthesis and degradation in humans, alsoin comparison with those measured in the splanchnic area,the legs, and the whole-body. (
J. Clin. Invest.
1996. 98:1481–1492.) Key words: kidney
•
splanchnic bed
•
muscle
•
organcatheterization
•
leucine kinetics
Introduction
Body proteins turn over at different rates, therefore their indi-vidual contribution to whole-body amino acid kinetics is quan-
titatively and qualitatively heterogeneous (1). Whole-bodyturnover studies, by definition, do not allow to quantitate pro-tein and/or amino acid metabolism in individual organs and/ortissues. These data can be obtained only by using organ cathe-terization and/or tissue biopsy during amino acid isotope infu-sions. Knowledge of rates of regional protein turnover in hu-mans is important not only from a physiological standpoint,but also for the investigation of the site(s) and the mecha-nism(s) of altered protein turnover in disease.
Most in vivo regional studies of protein turnover have beenfocused on skeletal muscle, which is the main deposit of bodyproteins (2, 3). Besides muscle, however, the kidneys andsplanchnic organs may also play an important role in body pro-tein homeostasis (1, 4). It is well known from in vitro studiesthat renal tissues have a high fractional protein turnover rate(5, 6), therefore they might contribute to whole-body proteinsynthesis and degradation more than what would be expectedfrom their small mass. Furthermore, it is necessary to know thephysiological rates of renal protein synthesis and degradationto learn to which extent and by which mechanisms changes ofrenal mass occur in pathological states such as compensatoryhypertrophy (7) or diabetes (8). To date, no in vivo estimatesof kidney protein synthesis and degradation are available ei-ther in animals or in humans. Furthermore, although the kid-neys may selectively take up or release individual amino acids(9, 10), no study has ever specifically addressed this issue froma kinetic standpoint.
Also, splanchnic organs may play a crucial role in the regu-lation of body protein turnover, because of their mass, theirspecific protein turnover rates, and their anatomical location(1, 4). In one human study (11), fractional protein syntheticrates in liver and in the colonic mucosa, calculated through thebiopsy technique, were reported to be relatively high (
<
20–25%/d in the liver;
<
9%/d in colon). In that study, however,protein degradation was not simultaneously measured. Ratesof amino acid uptake (i.e., total disposal) and release (i.e., pro-teolysis) across the splanchnic bed were also measured bycombining the arterio-hepatic vein catheterization techniquewith phenylalanine and/or leucine isotope infusion in normalsubjects (12, 13). However, since these two essential amino ac-ids are also degraded by splanchnic tissues (14–16), their up-take couldn’t be equated to protein synthesis. More recently,the splanchnic catheterization approach was combined withisotope infusions to estimate splanchnic protein synthesis anddegradation in insulin-deprived and insulin-infused type 1 dia-betics (17). Splanchnic protein synthesis was greater during in-sulin deficiency than during insulin infusion (17). Although theinsulin-infused insulin-dependent diabetes mellitus patientsmay behave as metabolically normal; as a matter of fact nodata are yet available on splanchnic protein synthesis, degra-dation, and net balance measured simultaneously in normalhumans.
Address correspondence to Prof. Paolo Tessari, M.D., Cattedra diMalattie del Ricambio, Dept. of Medicina Clinica, via Giustiniani 2,35128 Padova, Italy. FAX: 39-49-8754179.
Received for publication 9 February 1996 and accepted in revisedform 10 July 1996.
1482
Tessari et al.
Therefore, this study was undertaken to measure aminoacid (and protein) turnover across the kidneys, the splanchnicarea, and the legs, in metabolically normal postabsorptive hu-mans. The studies were performed by using the arterio-venous(A-V)
1
catheterization technique combined with infusions ofleucine and phenylalanine tracers. Leucine kinetics was inves-tigated comprehensively, since we measured also its oxidationby means of
14
C-bicarbonate production across the sampledorgans, as well as the metabolism of its deamination product,
a
-ketoisocaproic acid (KIC).
Methods
Subjects
10 subjects (5 men and 5 women, age 37
6
4 yr, range 21–50 yr) werestudied in the postabsorptive state. All were within 110% of theirideal body weight based on Metropolitan Life Insurance tables (18).Starting from at least 1 mo before admission, they were on a dietwhich provided 30–35 kcal/d and 0.9–1 grams of protein/kg of bodyweight, as assessed by dietary history and urea excretion. Routinelaboratory tests, glomerular filtration rate, acid-base balance, electro-lyte measurements, and oral glucose tolerance tests were normal. Nosubject had either history or clinical evidence of gastrointestinal orhepatic disease, congestive heart failure, kidney disease, diabetesmellitus, or other endocrinopathies.
Five subjects (three men, two women) had arterial hypertension.Their mean blood pressure ranged between 125 and 135 mmHg. Arenal vein catheterization for renin activity was considered helpful fordiagnostic purposes. The final diagnosis was benign arterial hyperten-sion. The remaining five subjects had cardiac valvular disease, and aright-sided cardiac catheterization was considered necessary for diag-nostic hemodynamic evaluation.
According to the diagnostic procedure per se, which is performedthrough a femoral approach, all patients underwent a femoral veincatheterization. All hypertensive subjects underwent the renal veincatheterization study, and three of them also underwent that of thehepatic vein. Conversely, all subjects with valvular heart disease un-derwent the hepatic vein study, and two of them also underwent thatof the renal vein. Thus, the number of subjects who underwent theleg, the renal, and the hepatic vein catheterization study was 10, 7,and 8, respectively.
All subjects were informed about nature, purposes, procedure,and possible risks of the study before their voluntary consent was ob-tained. The study was part of a larger protocol approved by the Ethi-cal Committee of the Department of Internal Medicine, at the Uni-versity Hospital of Genova. The procedures were in accordance withthe Helsinki Declaration.
Isotopes
l
-[1-
14
C]Leucine (55 mCi/mmol) (
14
C-Leu),
14
C-sodium bicarbonate(100 mCi/mmol), and
l
-[2,6-
3
H]phenylalanine (
3
H-Phe) were pur-chased from DuPont-NEN (European Division, Brussels, Belgium).
l
-[
15
N]Leucine (
15
N-Leu) was purchased from Tracer Technologies(Somerville, MA). All the stable isotope were
.
99% mole percentenriched. All isotopes were proven to be sterile and pyrogen-free be-fore use.
Procedures
The patients were studied in the recumbent position in the postab-sorptive state. At about 08:00 a.m., a peripheral vein was cannulatedwith a Teflon catheter and used for isotope infusions. A preinfusion
sample was collected to measure basal isotope enrichments. Thereaf-ter, primed-constant isotope infusions were started by means of cali-brated pumps. The constant isotope infusion rates were the following:
14
C-Leu
5
6,298
6
748 dpm/kg
?
min;
3
H-Phe
5
8,578
6
479 dpm/kg
?
min;
15
N-Leu
5
0.32
6
0.04
m
mol/kg
?
min. Priming doses of all trac-ers (in the amount equivalent to
<
30 times the continuous infusionrates per minute), as well as a priming dose of
14
C-bicarbonate (
<
3
m
Ci), were administered at time 0.After 120 min, the procedures for catheter positioning were
started. A Teflon catheter was inserted percutaneously into a radialartery. Two introducer sets (8.5 F), 1 cm away from each other, wereplaced into the femoral vein. A Cobra 7F catheter (William Cook Eu-rope, Bjaeverskov, Denmark) was then guided under fluoroscopiccontrol through a femoral vein, either to the right ventricular cavityor to a renal vein. Short Teflon sheaths, surrounding the cathetersfrom their insertion sites to a level just above the inguinal ligament,allowed simultaneous sampling of femoral blood flow. After the diag-nostic procedure was completed, another catheter was introduced toallow simultaneous sampling from the renal and the hepatic veins.The position of the catheters was ascertained visually through imageintensification before starting blood withdrawal. The total exposuredue to the radioactive isotopes was estimated to be
,
100 mrad (19).The total radiation dose absorbed from fluoroscopy was estimated tobe
<
20–30 mrad. Such an estimate resulted from the characteristic ofthe instrumentation (which provided an absorbed dose of
<
120–130mrad per h
2
1
) and the time used to position the venous catheter(s)(about 5 min for each site). Also, it should be considered that the ab-sorbed radiation involved the draining vein rather than the organ it-self. The catheters were kept patent by flushing with saline intermit-tently. Blood samples were effectively taken after
<
210 min from thestart of isotope infusion. Three sets of blood samples were obtainedat
z
20-min intervals from the radial artery as well as the renal, he-patic, and femoral veins for the biochemical analyses. Each set ofsamples was drawn almost simultaneously from the different vessels.Substrate and isotope concentrations, specific activities (SA) enrich-ments, and expired
14
CO
2
were at steady state by this time (data notreported). Achievement of steady state after primed-continuous iso-tope infusions of either comparable or shorter duration also has beenreported in many published amino acid turnover studies (for reviewssee references 20 and 21). Blood samples were withdrawn into hep-arinized syringes kept in ice. At the same time points, additional sam-ples were taken for measurements of organ blood flow, as describedbelow. Urine flow was collected via a bladder catheter. Therefore, thetotal duration of the study was
z
4 h.Arterial blood pressure and electrocardiogram were continuously
monitored during the study. Room temperature was maintained be-tween 20 and 22
8
C.
Analytical measurements
Two sets of blood samples (2 ml each) were collected into tubes con-taining 2 ml of 20% perchloric acid (PCA). The amounts of blood aswell as of PCA were accurately measured with calibrated pipettes toallow a precise measurement of blood dilution. The tubes were imme-diately and vigorously shaken. After centrifugation at 4
8
C, the super-natant was stored at
2
20
8
C until assay. SA of leucine (22), phenylala-nine (23), and KIC (22), as well as KIC concentration (22), weredetermined by applying the referenced HPLC plasma methods towhole-blood. Blood KIC concentration was calculated by multiplyingthe HPLC value by two, in order to correct for PCA dilution of blood(as outlined above). Whole-blood leucine, phenylalanine, and otheramino acid concentrations were measured with ion exchange chroma-tography by using an amino acid analyzer (Fisons Instruments ItaliaSPA, Milan, Italy) (9) and lithium buffers. We found a tight correla-tion (data here not reported) between values of leucine and phenyla-lanine concentrations measured by the two methods (i.e., the whole-blood HPLC assay and the ion exchange chromatography). The latterdata were used for calculations.
15
N-Leu mole percent enrichment(MPE) was determined in the supernatant of deproteinized blood by
1.
Abbreviations used in this paper:
A-V, arterio-venous; KIC,
a
-keto-isocaproic acid; MPE, mole percent enrichment; PCA, perchloricacid; SA, specific activity.
Kidney and Splanchnic Protein Turnover in Humans
1483
gas chromatography mass spectrometry as
tert
-butyl-dimethyl-silylderivative and electron impact ionization (24), by monitoring thefragments [m/z] 201⁄200. Enrichment was expressed as tracer/tracer
1
tracee ratio. Blood isotope concentrations were calculated by multi-plying SA or MPE times unlabeled substrate concentrations. In onesubject, no measurements of KIC concentrations, KIC SA,
15
N-leu-cine enrichment, and
14
C-bicarbonate concentrations (see below)were available. Arterial and deep venous blood concentrations of
14
C-bicarbonate were measured as described (25). Arterial plasma in-sulin (26) and glucagon (27) concentrations were determined by ra-dioimmunoassay as indicated.
Organ blood flow measurements
Hepatic blood flow was estimated by the continuous infusion tech-nique (28) using indocyanine green dye (Becton Dickinson, Cock-eysville, MD). Renal plasma flow was measured by the clearance ofexogenously infused PAH (9). Three sequential clearance periods of20 min each were obtained. Renal arterial plasma flow was calculatedfrom the clearance and extraction of PAH using Wolf’s equation (29).True renal arterial blood flow was calculated by dividing plasma flowover [1
2
hematocrit].Leg blood flow was estimated from the arterial-venous difference
of oxygen and VO
2
(30, 31). By this technique, blood flow data areexpressed per two legs.
Calculations and data presentation
All kinetic data were expressed in
m
mol/min
?
1.73 m
2
, i.e., they were nor-malized as if each patient’s body surface was the same (i.e., 1.73 m
2
).There are several theoretical possibilities to calculate amino acid
kinetics across organs. In this study, we have used three different modelsto calculate organ leucine kinetics: (1) a six-compartment model of leu-cine and KIC, recently described (25); (2) the forearm model describedby Cheng et al. (32); and (3) a noncompartmental model of leucineand KIC, based on organ extractions of combined
14
C-leucine and
14
C-KIC, as well as on venous KIC SA as intracellular precursor pool.Organ phenylalanine kinetics was calculated using the A-V model de-scribed by Barrett and Gelfand (3).
Compartmental leucine and KIC model.
This model is based on aphysiologic organ compartmentation of leucine and KIC. For each com-pound, three compartments, one arterial, one intracellular, and onevenous, are assumed (25). Model equations have been presented and dis-cussed in detail elsewhere (25). Briefly, the model assumptions are heresummarized. (
a
) The SA of
14
C-KIC, measured in the venous blooddraining the sampled organ (i.e., the femoral, the hepatic, and the re-nal vein) is taken as representative of intracellular
14
C-leucine as well as
14
C-KIC SA of that organ. This assumption is based on recent animaland human studies (33–39) in which venous KIC SA or enrichment werecompared with the leucine SA or enrichment directly measured either inthe intracellular space (33–37) or in the leucyl-tRNA, i.e., the precur-sor of protein synthesis (34, 35), or incorporated into a fast turningover, liver-synthesized protein such as VLDL apoB-100 at steady state(38, 39). (
b
) The
15
N-leucine tracer extracted by each organ is used tocalculate leucine inward ([F2] model parameter) and outward [F3]movement across the cell membrane, as well as leucine and KIC in-terconversion rates ([F7 and F8], respectively) (25). Conversely, thefraction of
15
N-leucine tracer not taken up by the forearm is used tocalculate the leucine which bypasses intracellular metabolism and isreleased directly into the vein [F12]. (
c) A single, well-mixed intracel-lular leucine pool is also assumed, from and into which all entries and ex-its take place. The same assumptions are made in regard to a homoge-neous intracellular KIC pool. (d) No interstitial leucine and KICcompartment is considered. In other words, the 14C-leucine, the 14C-KIC,and the 15N-leucine isotopes are assumed to enter their correspondingintracellular compartments at the arterial values. Conversely, theyare assumed to be released from their intracellular compartments atthe measured deep venous values. (e) No release of tracer(s) recycledfrom protein breakdown into the intracellular leucine compartment isassumed to occur within the duration of study. (f) There is no inde-
pendent production of KIC inside the cell except that deriving fromeither leucine or blood. (g) Finally, we assumed that the metabolicbehavior of the 14C-tracer(s) is the same as that of unlabeled material.
Cheng’s A-V model (32). The original model has been adaptedto the use of radioactive 14C-leucine isotope. Moreover, since we didnot infuse a di-labeled 13C-, 15N-leucine (32), but a mono-labeled 15N-leucine, the enrichment of this latter tracer was used instead. Themodified equations are reported here:
; (1)
; (2)
; (3)
; (4)
; (5)
; (6)
; (7)
; (8)
; (9)
;
(10)
; (11)
; (12)
; (13)
; (14)
; (15)
; (16)
where Leuart and Leuven are the concentrations (nmol/ml) of leucinein artery and vein, respectively; F is blood flow; KICart and KICven areKIC concentrations (nmol/ml) in artery and vein, respectively; SA isgiven in dpm/nmol; MPE indicates 15N-leucine MPE; [14C-Bicven] and[14C-Bicart] are 14C-bicarbonate concentrations (dpm/ml) in artery andvein, respectively; Leu N and Leu C flux indicate leucine flux calcu-lated with 15N-leucine and with 14C-leucine tracers, respectively.
All data were expressed in mmol/min?1.73 m2.Noncompartmental model of leucine and KIC. This model repre-
sents a simplification of the six-compartment model described above.No compartmentation of leucine and KIC is assumed, but both theleucine and the KIC species are considered together in the calcula-tion of total leucine-carbon uptake and release across organs. In anal-ogy to the compartmental model, venous KIC SA is considered as theprecursor pool to calculate all intracellular kinetic rates.
Thus, the rate of disappearance across the organ of total leucine-carbon (Leu-C) (i.e., leucine plus KIC) is calculated from the sum of14C-leucine and 14C-KIC net extraction, divided by venous KIC SA
; (17)
where *[Leu 1 KIC] is the sum of concentrations (dpm/ml) of radio-active leucine and KIC in the arterial (art) or venous (ven) blood, re-spectively; KIC SAven is venous KIC SA in dpm/nmol; and [F] is or-gan blood flow (in ml/min?1.73 m2).
Leucine influx L1( ) Leuart F×=
Leucine efflux L2( ) Leuven F×=
Leucine uptake L1 L2–=
KIC influx K1( ) KICart F×=
KIC efflux K2( ) KICven F×=
KIC release K1 K2–=
Oxidation Ox( )C Bicven–
14[ ] C14
Bicart–[ ]–
KIC SAven
-------------------------------------------------------------------------- F×=
Leu N flux L1 MPE Leuart( ) MPE Leuven( ) 1–⁄[ ]× B T2+= =
Leu C flux L1 Leu SAart[ ] Leu SAven[ ]⁄ 1–×B T2 Leu SAven KIC SAven–( ) Leu SAven⁄[ ]×+
==
Leu N flux Leu C fluxT2 T2 Leu SAven KIC SAven–( ) Leu Saven⁄[ ]×–T2 1( Leu Saven([ KIC SAven ) Leu SAven ]⁄––×
==
–
Reamination (T2) Leu N flux Leu C flux–( )1[ Leu SAven KIC SAven–( ) Leu SAven⁄[ ]–
------------------------------------------------------------------------------------------------------------=
Net transamination (T) Ox K2 K1–+=
Deamination (T1) T T2+=
Breakdown (B) N Leu flux T2–=
Protein synthesis (PS) L1 B T L2––+=
Net protein balance (NB) S B–=
Leu-C Rd* Leu KIC+[ ] art * Leu KIC+[ ] ven–
KIC SAven
---------------------------------------------------------------------------------------- F×=
1484 Tessari et al.
Net leucine-carbon balance (NB) was calculated as the [arterial 2venous] difference of leucine 1 KIC concentration [Leu 1 KIC] (ex-pressed in nmol/ml), multiplied by flow:
, (18)
Organ leucine-carbon rate of appearance (Ra) was calculated by sub-tracting net balance from Rd:
. (19)
Leucine-carbon oxidation was calculated in the same fashion as theother models, i.e., by dividing the [venous 2 arterial] difference of14C-bicarbonate concentration (14C-Bic) (in dpm/ml) over venousKIC SA, and multiplying it by blood flow:
. (20)
The rate of leucine-carbon utilization for organ protein synthesis(Leu-C → PS) was then calculated by subtracting Leu-C oxidationfrom Leu-C Rd:
. (21)
Fractional amino acid extraction was calculated by dividing theamino acid venous-arterial concentration difference by its arterialconcentration:
. (22)
Fractional extraction is based only on unlabeled amino acid data. Toestimate the fraction of arterial amino acid delivery to organ which istaken up as Rd, we have calculated also fractional amino acid (AA)uptake as follows:
. (23)
Leu-C NB Leu KIC+[ ] art Leu KIC+[ ]– ven+( ) F×=
Leu-C Ra Leu-C Rd Leu-C NB–=
Leu-C OxC-Bic
14ven[ ] C-Bic
14art[ ]–
KIC SAven
------------------------------------------------------------------ F×=
Leu-C Ox→ Leu-C Rd[ ] Leu-C Ox[ ]–=
Fractional extractionAAven[ ] AAart[ ]–
AAart[ ]--------------------------------------------- 100×=
Fractional AA uptakeAA Rd
AAart[ ] * F----------------------------- 100×=
Splanchnic amino acid kinetics is the reflection of both liver and gutmetabolism. However, without sampling in the portal vein, the indi-vidual contributions by these districts cannot be calculated. There-fore, the kinetic data reflected the splanchnic area as a whole.
As outlined above, leg blood flow and therefore the leg kineticdata were referred to the two legs together. To extrapolate the datato whole body skeletal muscle, the data of two legs were multiplied bytwo (2, 12, 30).
Leg amino acid metabolism may include also that of skin andbone. However, at least from animal studies, skin may contribute byno more than 10% to leg protein turnover (40). Leg bone proteinturnover has never been determined in vivo, at least to our knowl-edge, therefore it was assumed to be < 0.
In regard to the kidneys, since blood flow included the two kidneys to-gether, the amino acid kinetic data also refer to the combined two kidneys.
Whole-body calculations. Whole-body amino acid kinetics wascalculated using conventional calculations, i.e., both primary and re-ciprocal pool models for leucine (41), as well as a primary pool modelfor phenylalanine (20). A fixed whole-body fixation factor for 14CO2
of 20% was used (42). No fixation factor of 14C-bicarbonate across or-gans was used, since in the only study in which this issue was investi-gated (43), no apparent 14C-bicarbonate extraction was observed.
The statistical analysis was performed using two-tailed pairedtests (either the Student t test when data distribution was normal, orthe Wilcoxon test when it was not normal) to compare, within thesame individuals, the arterial to the venous data, as well as two sets oforgan kinetic parameters (for instance: protein degradation [F5] vs.synthesis [F6]; leucine deamination [F7] vs. reamination [F8]; leucineinflow [F2] vs. outflow [F3] into/from cell). One-way ANOVA andthe Neumann-Keul’s test were used to compare three groups of data.All data were expressed as means6SE. A P value , 0.05 was consid-ered as statistically significant.
Results
Substrate and isotope concentrations, SA and blood flow
Kidneys. Blood flow in the kidneys was 946680 ml/min?1.73
Table I. Whole-Blood Leu, KIC and Phe Concentrations (nmol/ml), 14C-Leu, 14C-KIC, and 3H-Phe Isotope Concentrations (dpm/ml) and SA (dpm/nmol), 15N-Leu Concentration (nmol/ml), and MPE, and 14C-bicarbonate Concentrations (dpm/ml)
Kidneys Splanchnic bed Legs
Artery Renal vein Artery Hepatic vein Artery Femoral vein
Substrate concentrationsLeu 133.869.1 136.169.6* 139.3612.2 132.9610.9* 136.969.7 140.9610.5‡
KIC 29.361.7 26.160.8‡ 30.562.1 34.062.4‡ 29.261.6 28.561.1Phe 39.963.6 36.362.3‡ 38.363.6 33.463.1‡ 37.662.8 42.763.1‡
Isotope concentrations14C-Leu 341653 305643‡ 433642 338633‡ 390645 332640‡
14C-KIC 70612 5769‡ 8668 103614* 7469 716103H-Phe 389669 302649‡ 378666 233642‡ 360655 298650‡
15N-Leu 11.662.3 10.862.1* 12.662.3 7.961.4‡ 12.961.8 8.461.3‡
14C-Bic 117618 131620§ 151619 161620§ 133618 147622§
SA and MPE14C-Leu SA 2.5460.34 2.2660.3‡ 3.3160.51 2.6860.38‡ 12.9860.46 2.4860.39‡
14C-KIC SA 2.3760.4 2.1760.35‡ 2.8760.28 3.0360.33 2.5460.31 2.5160.363H-Phe SA 9.5461.19 8.3361.22‡ 9.5661.14 6.7660.74‡ 9.1860.94 6.6960.83‡
15N-Leu MPE 8.9461.72 8.2461.66‡ 9.2961.57 6.8761.06‡ 9.7161.25 6.1660.82
Arterial values are reported separately, because renal and hepatic veins were not sampled in all subjects. *P , 0.05; §P , 0.03; ‡P , 0.01 vs. the corre-sponding artery.
Kidney and Splanchnic Protein Turnover in Humans 1485
m2. Leucine concentration in the renal vein was slightly al-though significantly greater (by < 2%, P , 0.05) than in theartery (Table I), indicating net amino acid release. In contrast,renal vein phenylalanine concentration was significantlylower (by < 9%, P , 0.01) than in the artery, indicating netuptake.
Amino acid SA and enrichments in the renal vein were sig-nificantly lower (by < 10–15%, P , 0.01) than in the artery,indicating amino acid production (Table I). Conversely, 14C-leucine, 15N-leucine, and 3H-phenylalanine isotope concentra-tions in the artery were greater (P , 0.05 to P , 0.01) (by < 11%,< 7%, and < 22%, respectively) than in the renal vein, indicat-ing simultaneous amino acid uptake. Interestingly, the A-Visotope concentration differences across the kidneys werelower (P , 0.05 or less) than those measured across either thesplanchnic area or the legs (see below).
The kidney took up KIC from the circulation with a rela-tively high fractional extraction (< 12%) (Table I). However,both 14C-KIC isotope concentration and SA in the renal veinwere lower (by 220% and 28%, respectively, P , 0.01) thanthe corresponding arterial values, indicating simultaneous re-lease of unlabeled KIC.
14C-bicarbonate concentration in the renal vein was < 12%greater (P , 0.02) than in the artery, indicating 14CO2 produc-tion from 14C-leucine oxidation.
The kidney also took up citrulline and glutamine, while itreleased threonine, serine, alanine, cysteine, tyrosine, and argi-nine in addition to leucine (Table II). The A-V differences ofthe other amino acids were not significant.
Splanchnic bed. Blood flow across the splanchnic area was1,2936137 ml/min?1.73 m2. Leucine and phenylalanine concen-trations in the hepatic vein were significantly lower (by < 5%and by < 13%, respectively, P , 0.05) than in the artery(Table I), indicating net splanchnic amino acid uptake. Frac-tional extraction of leucine (< 4%) was significantly lower (byapproximately two-thirds) (P , 0.03) than that of phenylala-nine (< 12%). 14C-Leucine, 15N-leucine, and 3H-phenylalanine
isotope concentrations in the artery were < 28%, < 60%, and< 62% greater, respectively (P , 0.001), than those of the he-patic vein, also indicating amino acid uptake. However, aminoacid SA and enrichments in the hepatic vein were significantlylower (by < 20–33%) than in the artery, indicating simulta-neous amino acid release (Table I).
KIC substrate and 14C-isotope concentrations in the he-patic vein were < 10% and < 20% greater (P , 0.05 and P ,0.01, respectively) than those in the artery (Table I). KIC SAin the hepatic vein was slightly (by < 6%) but insignificantlygreater than in the artery (P 5 0.29). Taken together, thesedata indicated production as well as net release of KIC bysplanchnic organs into the hepatic vein. 14C-Bicarbonate con-centration was < 6% greater (P , 0.03) in the hepatic veinthan in the artery, indicating 14CO2 production from splanchnic14C-leucine oxidation.
The splanchnic area also took up threonine, serine, alanine,valine, cysteine, tyrosine, lysine, histidine, arginine, andglutamine, while it released citrulline and glutamate (Table II).
Legs. Blood flow across the combined two legs was901699 ml/min?1.73 m2. Leucine and phenylalanine concentra-tions in the femoral vein were significantly greater (by < 3%, P ,0.03, and by < 14%, P , 0.001, respectively) than in the artery(Table I), indicating net amino acid release. Amino acid SA andenrichments in the femoral vein were significantly lower (by< 17–37%, P , 0.01) than in the artery, also indicating aminoacid production (Table II). In contrast, 14C-leucine, 15N-leucine,and 3H-phenylalanine isotope concentrations in the artery weregreater (P , 0.001) (by < 18%, < 50%, and < 21%, respec-tively) than those in the hepatic vein, indicating simultaneousamino acid uptake. KIC substrate and 14C-isotope concentra-tions, as well as KIC SA in the femoral vein, were not differentfrom those in the artery (Table I). 14C-Bicarbonate concentra-tion was < 10% greater (P , 0.03) in the femoral vein than inthe artery, consistent with 14C-leucine oxidation by the legs.
The legs released several other amino acids, such as threo-nine, serine, glycine, alanine, valine, isoleucine, tyrosine,
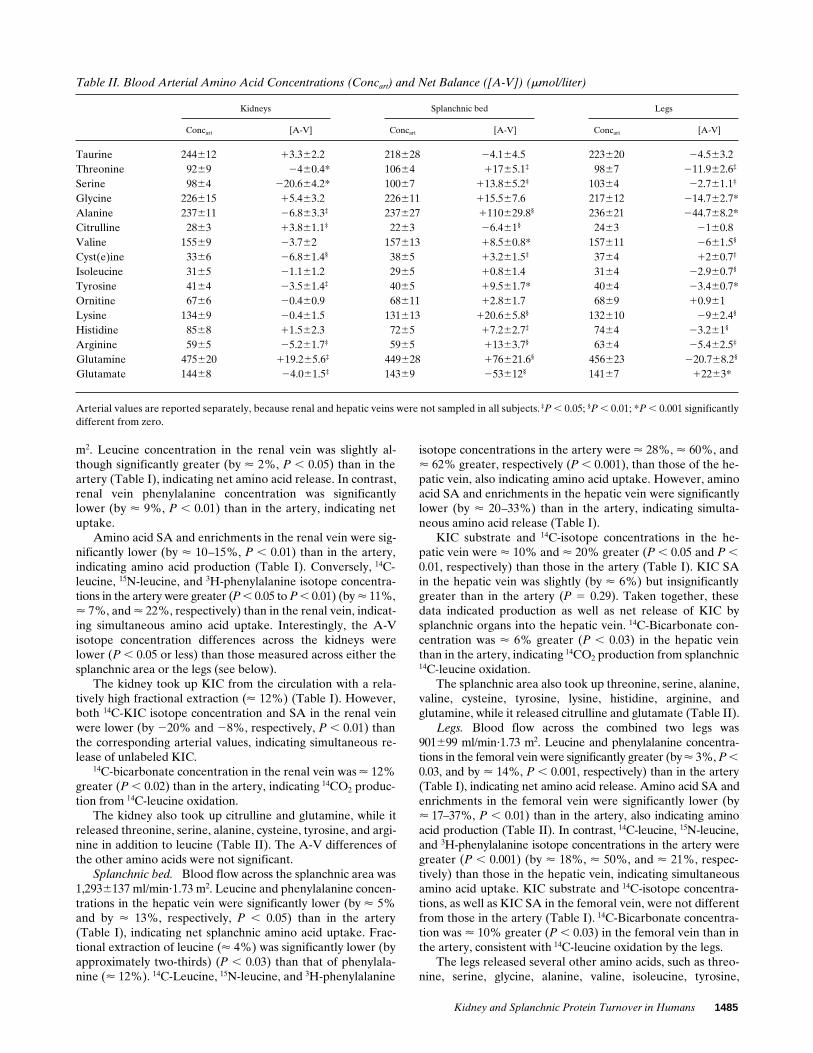
Table II. Blood Arterial Amino Acid Concentrations (Concart) and Net Balance ([A-V]) (mmol/liter)
Kidneys Splanchnic bed Legs
Concart [A-V] Concart [A-V] Concart [A-V]
Taurine 244612 13.362.2 218628 24.164.5 223620 24.563.2Threonine 9269 2460.4* 10664 11765.1‡ 9867 211.962.6‡
Serine 9864 220.664.2* 10067 113.865.2‡ 10364 22.761.1‡
Glycine 226615 15.463.2 226611 115.567.6 217612 214.762.7*Alanine 237611 26.863.3‡ 237627 1110629.8§ 236621 244.768.2*Citrulline 2863 13.861.1‡ 2263 26.461§ 2463 2160.8Valine 15569 23.762 157613 18.560.8* 157611 2661.5§
Cyst(e)ine 3366 26.861.4§ 3865 13.261.5‡ 3764 1260.7‡
Isoleucine 3165 21.161.2 2965 10.861.4 3164 22.960.7§
Tyrosine 4164 23.561.4‡ 4065 19.561.7* 4064 23.460.7*Ornitine 6766 20.460.9 68611 12.861.7 6869 10.961Lysine 13469 20.461.5 131613 120.665.8§ 132610 2962.4§
Histidine 8568 11.562.3 7265 17.262.7‡ 7464 23.261§
Arginine 5965 25.261.7‡ 5965 11363.7§ 6364 25.462.5‡
Glutamine 475620 119.265.6‡ 449628 176621.6§ 456623 220.768.2§
Glutamate 14468 24.061.5‡ 14369 253612§ 14167 12263*
Arterial values are reported separately, because renal and hepatic veins were not sampled in all subjects. ‡P , 0.05; §P , 0.01; *P , 0.001 significantlydifferent from zero.
1486 Tessari et al.
lysine, histidine, arginine, and glutamine (Table II), while theytook up cyst(e)ine and glutamate.
Arterial plasma insulin and glucagon concentrations werestable throughout the study (insulin: 1262 mU/ml; glucagon:99610 pg/ml).
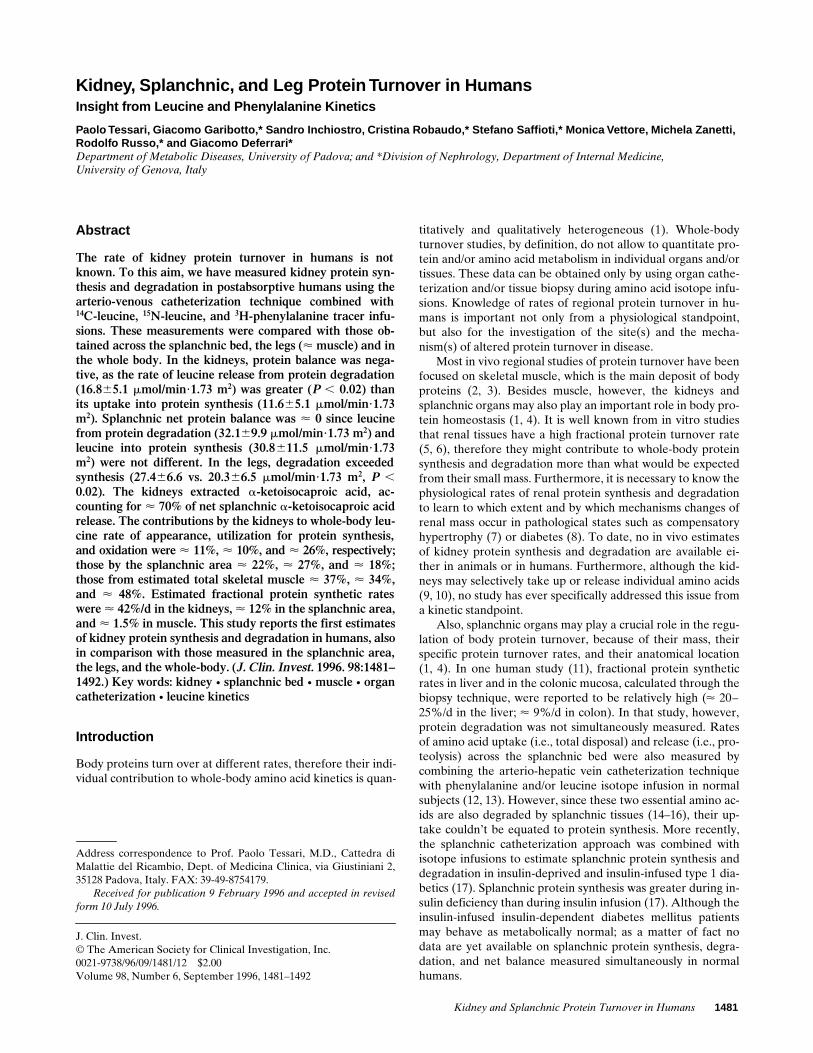
Organ leucine kinetics: Compartmental model data (Table III)
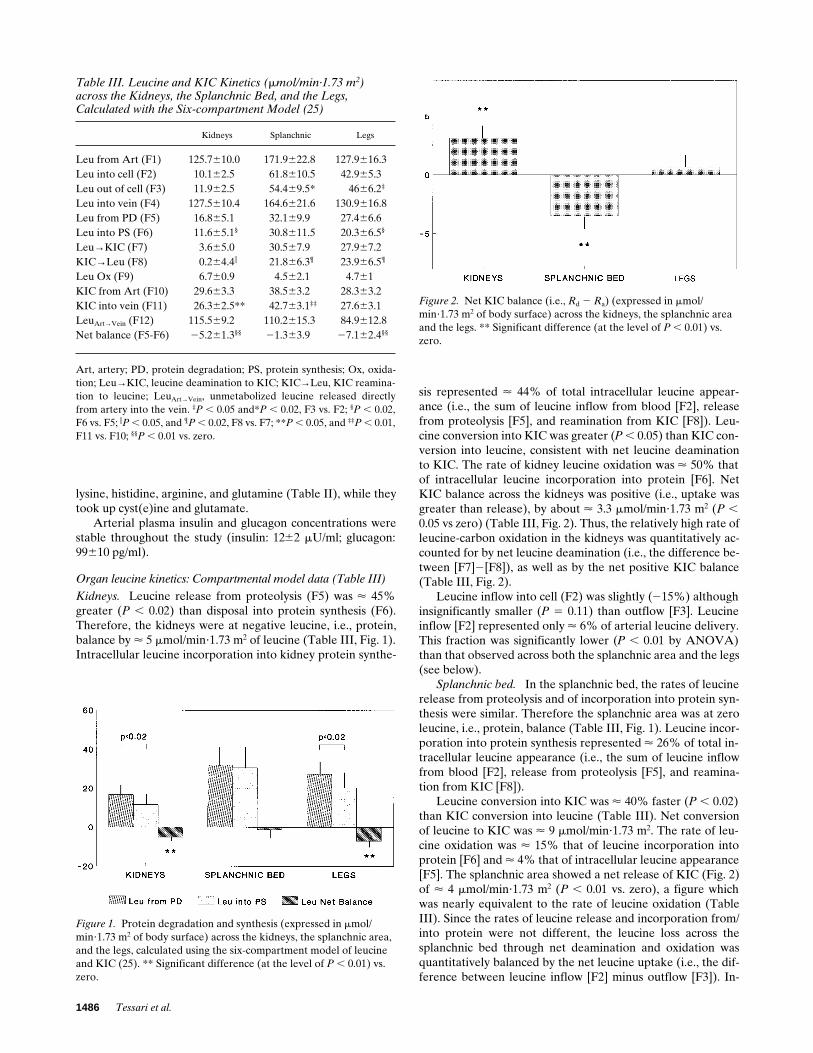
Kidneys. Leucine release from proteolysis (F5) was < 45%greater (P , 0.02) than disposal into protein synthesis (F6).Therefore, the kidneys were at negative leucine, i.e., protein,balance by < 5 mmol/min?1.73 m2 of leucine (Table III, Fig. 1).Intracellular leucine incorporation into kidney protein synthe-
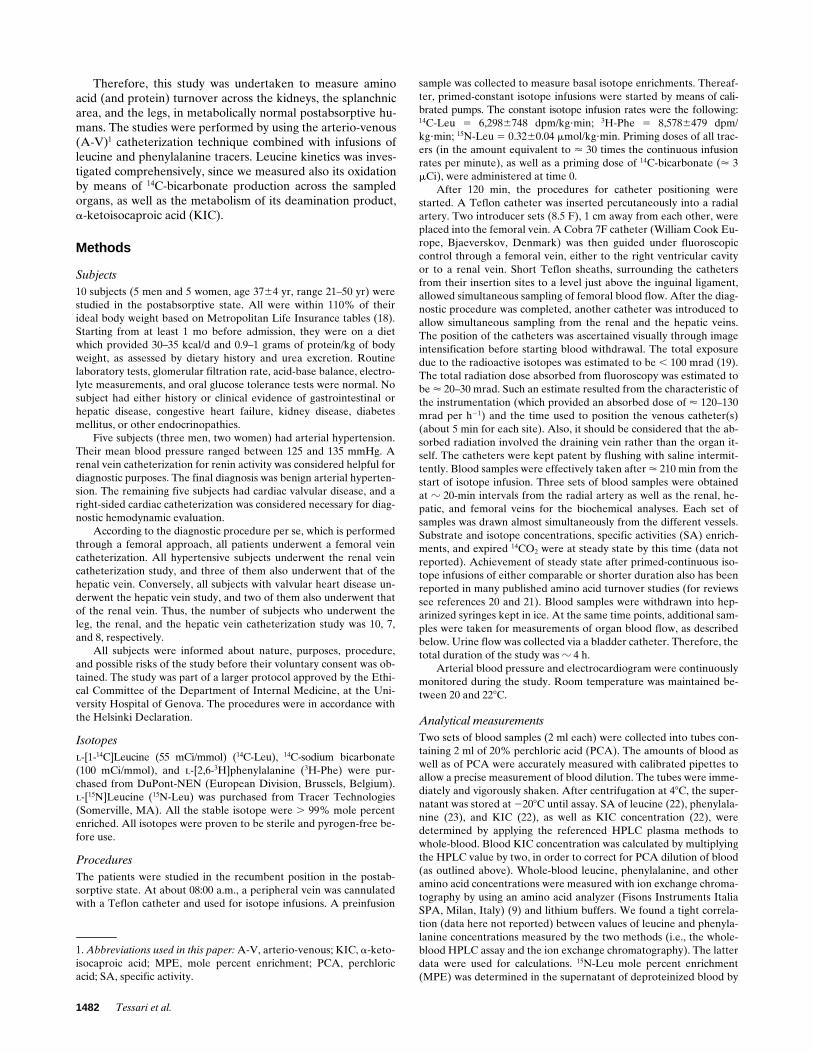
sis represented < 44% of total intracellular leucine appear-ance (i.e., the sum of leucine inflow from blood [F2], releasefrom proteolysis [F5], and reamination from KIC [F8]). Leu-cine conversion into KIC was greater (P , 0.05) than KIC con-version into leucine, consistent with net leucine deaminationto KIC. The rate of kidney leucine oxidation was < 50% thatof intracellular leucine incorporation into protein [F6]. NetKIC balance across the kidneys was positive (i.e., uptake wasgreater than release), by about < 3.3 mmol/min?1.73 m2 (P ,0.05 vs zero) (Table III, Fig. 2). Thus, the relatively high rate ofleucine-carbon oxidation in the kidneys was quantitatively ac-counted for by net leucine deamination (i.e., the difference be-tween [F7]2[F8]), as well as by the net positive KIC balance(Table III, Fig. 2).
Leucine inflow into cell (F2) was slightly (215%) althoughinsignificantly smaller (P 5 0.11) than outflow [F3]. Leucineinflow [F2] represented only < 6% of arterial leucine delivery.This fraction was significantly lower (P , 0.01 by ANOVA)than that observed across both the splanchnic area and the legs(see below).
Splanchnic bed. In the splanchnic bed, the rates of leucinerelease from proteolysis and of incorporation into protein syn-thesis were similar. Therefore the splanchnic area was at zeroleucine, i.e., protein, balance (Table III, Fig. 1). Leucine incor-poration into protein synthesis represented < 26% of total in-tracellular leucine appearance (i.e., the sum of leucine inflowfrom blood [F2], release from proteolysis [F5], and reamina-tion from KIC [F8]).
Leucine conversion into KIC was < 40% faster (P , 0.02)than KIC conversion into leucine (Table III). Net conversionof leucine to KIC was < 9 mmol/min?1.73 m2. The rate of leu-cine oxidation was < 15% that of leucine incorporation intoprotein [F6] and < 4% that of intracellular leucine appearance[F5]. The splanchnic area showed a net release of KIC (Fig. 2)of < 4 mmol/min?1.73 m2 (P , 0.01 vs. zero), a figure whichwas nearly equivalent to the rate of leucine oxidation (TableIII). Since the rates of leucine release and incorporation from/into protein were not different, the leucine loss across thesplanchnic bed through net deamination and oxidation wasquantitatively balanced by the net leucine uptake (i.e., the dif-ference between leucine inflow [F2] minus outflow [F3]). In-
Figure 1. Protein degradation and synthesis (expressed in mmol/min?1.73 m2 of body surface) across the kidneys, the splanchnic area, and the legs, calculated using the six-compartment model of leucine and KIC (25). ** Significant difference (at the level of P , 0.01) vs. zero.
Figure 2. Net KIC balance (i.e., Rd 2 Ra) (expressed in mmol/min?1.73 m2 of body surface) across the kidneys, the splanchnic area and the legs. ** Significant difference (at the level of P , 0.01) vs. zero.
Table III. Leucine and KIC Kinetics (mmol/min·1.73 m2) across the Kidneys, the Splanchnic Bed, and the Legs, Calculated with the Six-compartment Model (25)
Kidneys Splanchnic Legs
Leu from Art (F1) 125.7610.0 171.9622.8 127.9616.3Leu into cell (F2) 10.162.5 61.8610.5 42.965.3Leu out of cell (F3) 11.962.5 54.469.5* 4666.2‡
Leu into vein (F4) 127.5610.4 164.6621.6 130.9616.8Leu from PD (F5) 16.865.1 32.169.9 27.466.6Leu into PS (F6) 11.665.1§ 30.8611.5 20.366.5§
Leu→KIC (F7) 3.665.0 30.567.9 27.967.2KIC→Leu (F8) 0.264.4i 21.866.3¶ 23.966.5¶
Leu Ox (F9) 6.760.9 4.562.1 4.761KIC from Art (F10) 29.663.3 38.563.2 28.363.2KIC into vein (F11) 26.362.5** 42.763.1‡‡ 27.663.1LeuArt→Vein (F12) 115.569.2 110.2615.3 84.9612.8Net balance (F5-F6) 25.261.3§§ 21.363.9 27.162.4§§
Art, artery; PD, protein degradation; PS, protein synthesis; Ox, oxida-tion; Leu→KIC, leucine deamination to KIC; KIC→Leu, KIC reamina-tion to leucine; LeuArt→Vein, unmetabolized leucine released directlyfrom artery into the vein. ‡P , 0.05 and*P , 0.02, F3 vs. F2; §P , 0.02,F6 vs. F5; iP , 0.05, and ¶P , 0.02, F8 vs. F7; **P , 0.05, and ‡‡P , 0.01,F11 vs. F10; §§P , 0.01 vs. zero.
Kidney and Splanchnic Protein Turnover in Humans 1487
Table IV. Leu and KIC Kinetics (mmol/min·1.73 m2) across the Kidneys, the Splanchnic Bed and the Legs, Calculated with the A-V Model Proposed by Cheng et al. (32)
Kidneys Splanchnic bed Legs
Leu from breakdown 13.364.7* 50.2610.5 27.967.1*Leu into synthesis 9.165.3 48.8612.2 20.868.1Leu net balance 24.261.5‡ 21.464.8 27.162.5‡
Leu oxidation 6.760.9 4.562.1 4.761Leu deamination 20.967.6 45.6616.4§ 46.0612.2§
Leu reamination 23.466.5 36.9616.1 42.1611.5Net transamination 2.561.9 8.863.1‡ 3.961.5‡
See Methods for details. *P , 0.05, breakdown vs. synthesis; §P , 0.05,deamination vs. reamination; ‡P , 0.05, significantly different fromzero.
deed, leucine inflow [F2] was < 15% greater (P , 0.02) thanoutflow [F3]. Leucine inflow [F2] represented < 36% of thearterial leucine delivery.
Legs. The rate of intracellular leucine release from pro-teolysis [F5] was greater (P , 0.02) than that of leucine incor-poration into protein synthesis [F6], consistent with a negativeleucine, i.e., protein, net balance (Table III, Fig. 1). Leucine in-corporation into protein synthesis represented < 28% of totalintracellular leucine appearance (i.e., the sum of leucine inflowfrom blood [F2], release from proteolysis [F5], and reamina-tion from KIC [F8]). Leucine conversion into KIC was < 20%faster (P , 0.02) than KIC conversion into leucine. Net con-version of leucine to KIC was < 5 mmol/min?1.73 m2. The rateof leucine oxidation was < 27% that of intracellular leucine in-corporation into protein [F6]. Net KIC balance was not differ-ent from zero (Fig. 2). Therefore, net leucine loss throughtransamination and subsequent oxidation was nearly matchedby the difference between leucine release from proteolysis andinflow, minus utilization into protein synthesis and outflow.Leucine inflow [F2] represented < 34% of arterial leucine de-livery. Leucine inflow [F2] was < 7% smaller (P , 0.05) thanoutflow [F3].
Alternative leucine A-V models (Tables IV and V)
The kinetic data calculated using Cheng’s model (32) areshown on Table IV. The rates of leucine release from proteindegradation and incorporation into protein synthesis in thesplanchnic bed tended to be greater (P 5 0.085, and P 5 0.13,respectively, by the Student’s paired t test) than the corre-sponding six-compartment model estimates, while they weresimilar in the other organs. However, net leucine balanceacross organs was of the same magnitude using either model.In the legs, both leucine deamination and reamination rateswere < 60–70% greater (P , 0.01) with the Cheng model thanwith the compartmental model (see Tables III and IV). Alsosplanchnic leucine deamination and reamination rates were< 50–70% greater with Cheng’s model, although the differ-ence was not statistically significant by paired tests. However,in the kidney there were no differences in the leucine transam-ination rates between the two models. The negative rates ofTable IV were not different from zero. Net leucine deamina-tion was of the same magnitude using either model in all organs.
Table V reports the leucine kinetic data calculated by alsoincluding KIC in organ leucine–carbon exchange (see Meth-
ods). Again, both the kidneys and the legs were at negativeleucine-carbon, i.e., protein net balance, since release fromproteolysis exceeded incorporation into protein synthesis.Conversely, the splanchnic area was at zero leucine, i.e., pro-tein balance, since protein degradation was not different fromprotein synthesis. Therefore, there were some quantitative,but not qualitative, differences among estimates of organ pro-tein synthesis and degradation obtained using the various leu-cine models.
Organ phenylalanine kinetics (Table V)
The kidneys were at positive phenylalanine balance by < 4mmol/min?1.73 m2, because Rd exceeded Ra (P , 0.01). Alsothe splanchnic bed was at positive phenylalanine balance, byz 5 mmol/min?1.73 m2 (P , 0.001). In contrast, leg phenylala-nine Ra exceeded Rd (P , 0.001) by z 5 mmol/min?1.73 m2.
Fractional uptake of leucine and phenylalanine across organs
In both kidneys and splanchnic area, fractional phenylalanineuptake was significantly greater than that of either leucine orthe sum of leucine plus KIC (Table VI). Actually, in the kid-
Table V. Leucine and Phenylalanine Kinetics across the Kidneys, the Splanchnic Bed, and the Legs, Calculated with Noncompartmental A-V models
Kidneys Splanchnic bed Legs
Leucine dataLeu-C Ra 16.965.1 37.869.9 27.766.7Leu-C Rd 18.365.2 41.3610.3 25.166.3Leu-C Ox 6.760.9 4.562.1 4.161Leu-C → PS 11.665.1* 35.8610.2 20.466.5*NB 25.361.3* 21.963.7 27.262.6*
PhenylalanineRa 4.461.6 13.162.1 10.161.3Rd 8.162.4‡ 17.962.7§ 5.161.2§
NB 13.761.7i 14.961.2 25.060.7¶
The leucine data were expressed as leucine-carbon (Leu-C) kinetics,i.e., it was calculated including KIC in organ uptake and release, and us-ing venous KIC SA as the intracellular leucine precursor pool (seeMethods for details). Phenylalanine kinetics was calculated using Gel-fand’s A-V model (3). Ox; leucine oxidation; Leu-C → PS, rate of leu-cine carbon disposal into protein sythesis; NB, net leucine balance. Alldata are expressed as mmol/min·1.73 m2. ‡P , 0.05; §P , 0.02 Rd vs. Ra;*P , 0.02; **P , 0.002 PS vs. Ra; iP , 0.05; ¶P , 0.01 significantly dif-ferent from zero.
Table VI. Fractional Uptake of Leucine, of the Sum of Leucine and KIC, and of Phenylalanine across Kidneys, the Splanchnic Bed, and the Legs
Kidneys Splanchnic bed Legs
Leucine 9.362.5 21.862.2 15.562.5Leucine1KIC 10.762.4* 14.962.9* 13.662.4*Phenylalanine 19.964.2‡ 36.762.7§ 15.564.1
‡P , 0.05; §P , 0.01 phenylalanine vs. leucine fractional uptake withinthe same organ; *P , 0.05 leucine vs. leucine1KIC fractional uptakewithin the same organ.
1488 Tessari et al.
neys leucine was released rather than taken up (Table II). Incontrast, in the legs fractional uptake of the two amino acidswas similar (Table VI).
Organ contributions to whole-body leucine kinetics
Table VII reports whole-body leucine Ra (primary and recip-rocal pool model), oxidation, incorporation into protein syn-thesis, as well as phenylalanine Ra. While the data of leucinekinetics are well in the range of published reports (1, 4, 5, 12,13, 20, 21, 40–42), Ra of phenylalanine was somewhat higherthan that expected (13, 20, 44–46). Such a high rate may be re-lated to whole-blood measurements of phenylalanine SA,which was somewhat lower than in plasma.
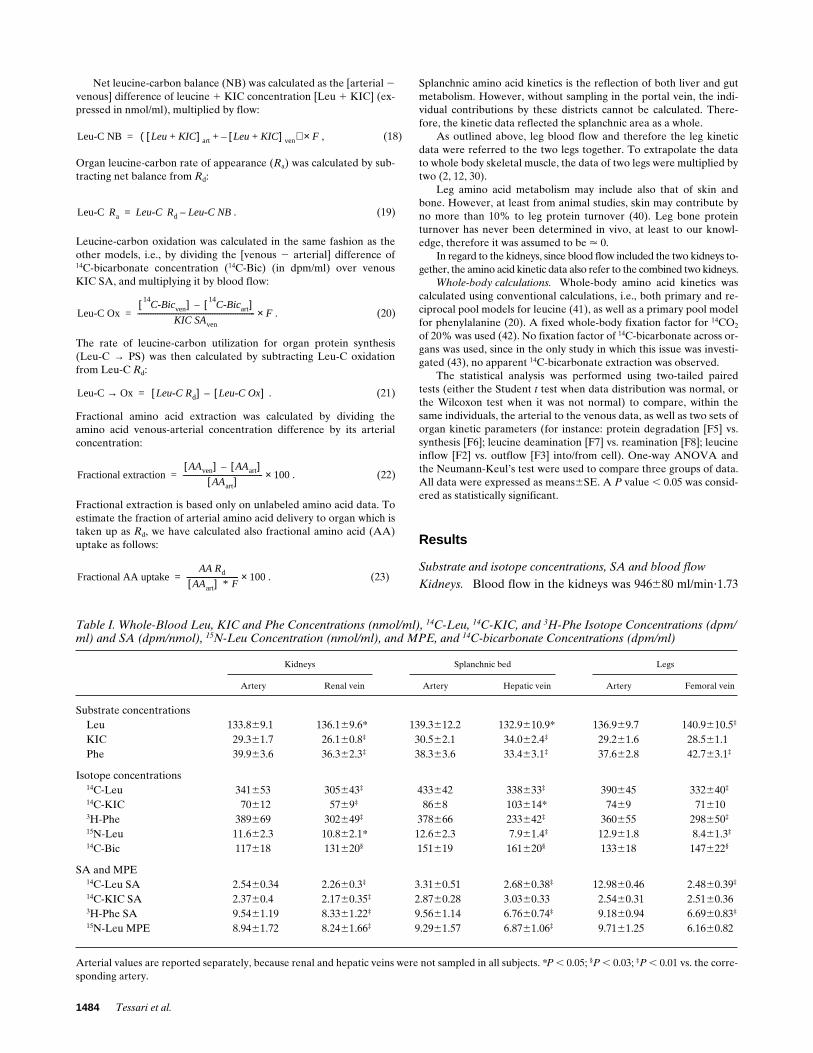
The percent contributions by kidneys, splanchnic organs, andestimated total skeletal muscle, calculated using the compart-ment model, to whole-body leucine kinetics are depicted inFig. 3. The two kidneys accounted for 11.464.2% of whole-bodyproteolysis, for 10.164.5% of protein synthesis, and for25.666.0% of leucine oxidation. The splanchnic area ac-counted for 22.166.7% of whole-body proteolysis, for 26.8610.2% of protein synthesis, and for 17.967.3% of leucine oxi-dation. Estimated total skeletal muscle accounted for 35.86
10.6% of whole-body proteolysis, for 32.2612.9% of protein syn-thesis, and for 48.3612.9% of leucine oxidation. The three re-gions together accounted for < 70% of whole-body proteolysis,for < 70% of whole-body protein synthesis, and for < 90% ofwhole-body leucine oxidation. Using Cheng’s model, the con-tributions by the splanchnic bed to body protein degradationand synthesis rose to < 35% and to < 39%, respectively, whilethey were grossly similar in the two other organs.
Discussion
This study reports the first estimates of kidney protein turn-over in humans, both in absolute terms and in comparison withthose of splanchnic organs and the legs. Organ protein degra-dation and synthesis were calculated through the kinetics ofthe essential amino acid leucine using a six-compartment leu-cine and KIC model. The data were analyzed also using non-compartmental leucine models.
Kidney protein synthesis and degradation
Despite their small mass, the kidneys play an important role inamino acid homeostasis (1, 4–6, 9). Both leucine transaminaseand oxidase activities were found to be high in kidney tissuepreparations (5, 6, 47). From in vitro studies fractional turn-over rates of tubular proteins were estimated to be < 30%/d(5, 6). However, no study had previously investigated renalamino acid (and protein) kinetics in humans.
Our data show directly that kidney protein turnover is high.Despite the fact that renal weight is z 1% that of total skeletalmuscle, and , 13% that of splanchnic organs (48, 49), the ratesof leucine release from kidney protein degradation and uptakefor kidney protein synthesis (six-compartment model) rangedbetween < 12 and < 17 mmol/min?1.73 m2, which corre-sponded to one-third/one-half of protein degradation and syn-thesis estimated either in total skeletal muscle or across the en-tire splanchnic area. The kidneys accounted for significantfractions of whole-body protein degradation (< 11%), synthe-sis (< 10%), and leucine oxidation (< 26%) (Fig. 3). Thesequantitative data may have practical implications in the inter-pretation of results from studies of whole-body protein turn-over in patients with chronic renal failure. In these patients,loss of active renal metabolic activities could account for theobserved reduction of whole-body leucine flux and oxidation(50). Furthermore, since protein synthesis is an energy-requir-ing process (51), such a high protein synthetic rate by the kidneycould explain, at least in part, its high oxygen consumption (48).
Another relevant observation of our study is that renalamino acid, i.e., protein balance, was negative in the postab-sorptive state (Fig. 1). Actually, protein degradation ([F5]) was< 45% greater than synthesis ([F6]). The apparent net kidneyleucine loss ranged between < 5 and 8 mmol/min, or < 7–12mmol/d (Fig. 1). This figure appears to be high with respect tothe estimated kidney protein content (52). However, a possible,consistent overestimation of kidney negative protein balancemay arise from unaccounted intrarenal degradation of filteredpeptides, polypeptides and low molecular weight proteins,which may occur in the proximal tubule through the lysosomeproteolytic system (53). Thus, it is possible that the actual rateof kidney protein degradation is much less than what is appar-ent from the data. Our experimental approach does not enableus to quantitate the potential recycling of leucine (as well as ofother amino acids) derived from intrarenal protein degrada-
Figure 3. Percent contributions by kidneys, splanchnic area, and esti-mated total skeletal muscle (calculated using the six-compartment model) to body leucine release from protein degradation (Leu from PD), leucine disposal into protein synthesis (Leu to PS), and oxida-tion (Ox) (all calculated using the reciprocal pool model of leucine).
Table VII. Whole-body Leucine (Using Both the Primary and the Reciprocal Pool Model) and Phenylalanine Kinetics
mmol/min·1.73 m2 mmol/min·kg
Leu Ra
(primary pool) 143.4612.4 2.2560.19Leu Ra*
(reciprocal pool) 167.1618.2 2.6960.31Leu N Ra* 176611 2.7560.14Leu Ox 29.164.9 0.4760.08Leu to protein 137.9614.7 2.2260.26Phe Ra 59.965.5 0.9760.09
*In one subject, blood KIC concentrations and SA and 15N-leucine en-richments were not measured.
Kidney and Splanchnic Protein Turnover in Humans 1489
tion. Nevertheless, the measurements of kidney protein syn-thesis and of leucine oxidation should be correct.
The net KIC extraction by the kidneys was relatively high(< 3.3 mmol/min?1.73 m2), corresponding to < 11% of arterialdelivery (Fig. 2). Interestingly, renal extraction accounted forthe majority (< 70%) of net KIC release by the splanchnic bed(Fig. 2), suggesting an important KIC trafficking betweenthese two regions. Our data are thus compatible with the oper-ation of a splanchnic-kidney KIC cycle in vivo in humans. TheKIC extracted by the kidneys was likely used for energy, sinceKIC reamination to leucine was nearly undetectable (TableIII). The extracted KIC, combined with net leucine deamina-tion (i.e., [F7] 2 [F8]) (3.461.3 mmol/min?1.73 m2, P , 0.05 vs.zero), quantitatively accounted for renal leucine oxidation (< 6.5mmol/min?1.73 m2), as otherwise required by the mass-balanceequations of the compartmental model.
About one-fourth of whole-body leucine oxidation tookplace in the kidneys (Fig. 3). As discussed above, a significantfraction of renal leucine oxidation might have arisen from re-cycled leucine, therefore it might not reflect renal protein ca-tabolism. Studies in vitro have shown that the kidney is rich inall the enzymatic machinery involved in leucine catabolismand/or oxidation, in particular in the medullary thick ascend-ing limb (54). Whatever its source could be, oxidation of leu-cine (as well as of other amino acids) in this nephron segmentmay provide energy to sustain active ion transport (48).
Intrarenal leucine incorporation into proteins represented< 43% of total intracellular leucine appearance (i.e., the sumof leucine inflow from blood [F2], from protein degradation[F5], and from KIC reamination [F8]) (Table III). Such a frac-tion was nearly twofold greater than that calculated across ei-ther the splanchnic area (< 25%) or estimated total skeletalmuscle (< 22%). These data suggest a greater dependency ofkidney protein synthesis on the leucine supplied from proteol-ysis rather than from arterial delivery, suggesting a high pro-tein anabolic efficiency and/or an extensive intracellular leu-cine recycling from different sources, as suggested above.
In the kidneys, the rate of leucine deamination was mark-edly lower than that calculated in either skeletal muscle (P ,0.005) or the splanchnic area (P , 0.15) (Table III). Also, therate of renal leucine reamination to KIC [F8] was lower thanthat measured across either muscle (P , 0.025) or splanchnictissues (P , 0.15) (Table III). Although these renal transami-nation rates may appear surprisingly low because of the ex-pected high leucine transaminase activity of kidney tubules(47), they would be high if related to the estimated small kid-ney protein mass.
Fractional 15N-leucine extraction across the kidneys (< 9%)was lower (P , 0.001) than that determined across either thelegs or the splanchnic area (< 35%) (Table I). Consequently,the calculated leucine inflow from blood to cell [F2] repre-sented only < 8% of arterial leucine delivery [F1], a fractionwhich was much smaller (P , 0.001) than that observed eitherin muscle or in the splanchnic area (< 35%). Such a low frac-tional extraction of leucine may depend on several factors.One could be the high renal blood flow, both absolute and rel-ative to the small kidney mass, which could limit amino acidextractions. Another could be due to a possible recycling intovein of the 15N-leucine tracer, upon which trans-membraneleucine exchange (F2 and F3), as well as leucine and KIC inter-conversions (F7 and F8), are calculated (see Methods). A high15N-nitrogen recycling would indeed lead to underestimation
of these rates (25). It should be observed that 15N-nitrogencould recycle either through shuttling of unmodified 15N-leu-cine molecules across the cell membrane or through KICreamination to leucine. The potential recycling via KIC mightbe greater with the mono-labeled 15N-leucine tracer, used inthis study, than with the di-labeled 15N, 13C-leucine tracer usedby others (32, 55, 56). The design of our study does not allowfor the exclusion of any of these possibilities. However, itshould be observed that fractional extractions of the 14C-leu-cine and 3H-phenylalanine tracers also were low across thekidneys (see Results), suggesting an underlying common meta-bolic characteristic of renal tissues.
Splanchnic protein synthesis and degradation
Splanchnic amino acid and protein turnover had been investi-gated previously in humans using a variety of techniques (1, 4,12, 13, 29, 30, 45, 46, 57). In this study, we have comparedsplanchnic protein degradation and synthesis, net protein bal-ance, leucine transmembrane exchange, oxidation, and bidi-rectional leucine interconversion with KIC with the corre-sponding rates measured across the kidneys and the legs inpostabsorptive humans.
Our data show that, in the postabsorptive state, splanchnicprotein balance was neutral, since protein degradation was notdifferent from synthesis (Table III, Fig. 1). In contrast, in mus-cle protein degradation exceeded synthesis, confirming manyprevious observations (3, 12, 21, 44, 58–61). Thus, at least un-der conditions of mild substrate deprivation such as those ofthe overnight fast, a net loss of visceral proteins did not occur,likely because amino acids were supplied to the splanchnicarea by peripheral tissues such as skeletal muscle. This conceptwas supported not only by the leucine kinetic data but also bythe behavior of net balance of several amino acids, which wasnegative in muscle but positive (i.e., in the direction of net up-take) across the splanchnic bed (Table II). This latter finding isin agreement with previous observations (30, 57).
By assuming that average leucine content of splanchnicproteins is z 9% (1, 4, 62), total splanchnic protein synthesiswould correspond to < 70 grams/d. This figure, which includesboth gut and liver protein synthesis, is in good agreement witha recent organ catheterization/isotope infusion study per-formed in insulin-treated euglycemic diabetic subjects (17),who might behave as metabolically normal at euglycemia. Inrelative terms and using the six-compartment model, splanch-nic protein synthesis accounted for a significant fraction (< 27%)of whole-body protein synthesis (Fig. 3), nearly matching thatcontributed by total skeletal muscle (< 33%).
The leucine used for protein synthesis was < 50% the rateof leucine inflow from artery (Table III), a fraction similar tothat observed in muscle (< 45%) but lower than that of thekidneys (< 100%) (see above), suggesting a high dependenceof protein synthesis from arterial leucine delivery in both vis-ceral and muscle tissues. This is in agreement with studiesshowing that, at least in muscle, leucyl-tRNA enrichment is in-termediate between that of intracellular free leucine and ofplasma leucine (35, 63). In absolute terms, net leucine deami-nation in estimated total skeletal muscle (< 9.4 mmol/min?1.73m2) was quantitatively similar to that of the splanchnic area (< 9.3mmol/min?1.73 m2), because of the high total muscle mass. It isinteresting to note that these in vivo quantitative data are notin agreement with the common concept that muscle is the ma-jor site of leucine transamination (1, 14, 15), but they underline
1490 Tessari et al.
the important contribution also by splanchnic organs to leu-cine-KIC interconversions.
Splanchnic leucine oxidation (< 4.5 mmol/min?1.73 m2)was quantitatively similar to net KIC release (< 4.7 mmol/min?1.73 m2). Thus, about one-half of splanchnic net leucineconversion to KIC (< 9 mmol/min?1.73 m2) was oxidized lo-cally, whereas the remaining one-half was exported as KIC(Fig. 2), likely to be used by other organs, mainly the kidneys.In contrast, in muscle the leucine deaminated to KIC was en-tirely oxidized locally, since no net KIC release was observed.On the whole, splanchnic tissues were more prone than skele-tal muscle to diverge leucine towards either oxidation or KICproduction.
The total amount of leucine oxidized by the splanchnicarea (< 4.5 mmol/min?1.73 m2) was about one-half of that oxi-dized by total skeletal muscle (< 9.4 mmol/min?1.73 m2). Fromin vitro studies (14, 15), it was reported that the oxidative ca-pacity of the liver was higher than that of muscle. Althoughour cumulative in vivo data indicate that the majority of leu-cine oxidation occurs in muscle, they are not in contrast with invitro findings, if one considers that the estimated weight eitherof the liver (< 1.5 kg) or of total visceral organs (< 2.6 kg) (49)in an < 69-kg human (i.e., the mean weight of our subjects) arerespectively, < 5.4% and < 9.4% the weight of skeletal muscle(which is < 40% of whole-body weight, or < 28 kg in 69-kgsubjects) (2). Thus, the rate of leucine oxidation, if expressedper gram of tissue protein, would be very high in splanchnictissues in agreement with in vitro findings (14, 15).
Leucine inflow from blood into splanchnic intracellularspaces represented < 35% of arterial leucine delivery, a frac-tion similar to that observed in muscle. Thus, also in thesplanchnic area about two-thirds of the arterial leucine deliv-ery bypassed intracellular metabolism, in agreement with re-cent animal studies (56).
The kidneys extracted phenylalanine, while they releasedleucine, in agreement with previous findings (9). In quantita-tive terms, the extracted phenylalanine was likely converted totyrosine, possibly accounting for the observed net tyrosine re-lease (Table II).
Fractional extraction of phenylalanine by the splanchnicbed and by the kidneys was significantly greater than that ofleucine-carbon (Table VI), suggesting a selective amino acidhandling by these organs. In contrast, leg fractional extractionsof the two amino acids were similar (Table VI). A selective ex-traction of leucine versus phenylalanine by splanchnic organshad been shown recently in noninvasive, whole-body multipleisotope studies (45, 46). The greater phenylalanine extractionsby kidney and splanchnic tissues might be related to their highphenylalanine catabolic, i.e., hydroxylase and oxidase, activi-ties (16, 64).
The total contributions by the three catheterized regions towhole-body leucine kinetics ranged between < 70% (proteinsynthesis and degradation) and < 90% (leucine oxidation)(Fig. 3). It is likely that the remaining fractions were contrib-uted by lungs, heart, and truncular skin as well as by head tis-sues.
We attempted to estimate fractional protein turnover rates ofthe three organs using the following assumptions (4, 48, 49, 52).
Kidneys. (a) Leucine percent abundance in mixed kidneyproteins is 8.5% on molar basis (Garibotto, G., unpublisheddata); (b) proteins account for < 15% of kidney wet weight(52); (c) the mass (5 weight) of the combined two kidneys is
3.8 grams% per kg of body weight (4); therefore (d) the esti-mated total leucine content of two kidneys is < 37 mmol in 69-kgsubjects (4, 48, 49, 52).
Splanchnic tissues. (a) Leucine accounts for < 9% (grams/100 grams) of mixed splanchnic proteins (62); this figure is theapproximate mean between < 8.2% (average leucine contentof gut proteins) and < 9.7% (average leucine content of liverproteins) calculated in pigs (62); (b) the weight of visceral or-gans (liver and gut) is assumed to account for < 4.1% of totalbody weight (49); (c) proteins represent < 20% of averageweight of splanchnic tissues.
Legs. (a) Leucine accounts for 9% (grams/100 grams) ofskeletal muscle proteins (1, 4, 62); (b) skeletal muscle accountsfor 38% of total body nitrogen (49); (c) total body nitrogen canbe calculated as 34 grams/kg of whole body weight (49); (d)one leg corresponds to one-fourth of total skeletal muscle,therefore of nitrogen (1–4); and (e) the possible contributionsby skin (40) and bone to leg amino acid turnover are ne-glected, as discussed above.
In the kidney, estimated fractional protein degradation andsynthesis were < 61% and < 42%/d, respectively, in thesplanchnic area < 13 and 12%/day, in muscle < 2.1 and 1.5%/d.The latter muscle estimates are in good agreement with pub-lished reports in adult mammals (1–4, 12, 21, 32, 34, 35, 37, 40,44, 49, 61, 65).
Although the comparison among various possible leucinekinetic models fell beyond the main purpose of this study, thechoice of a model is itself important in the calculations of or-gan protein kinetics. As reported above, we have also used thenoncompartmental model proposed by Cheng et al. (32), aswell as a simpler A-V leucine and KIC approach (Table V).The data of net leucine, i.e., protein balance, as well as of netleucine deamination, were virtually the same using eithermodel. However, we found some other interesting quantitative(although not qualitative) differences. Using Cheng’s model,splanchnic protein synthesis and degradation tended to begreater than those calculated either with the six-compartmentor with the simpler A-V leucine-carbon model (Tables III–V).Therefore, also the contribution to whole-body rates (see Re-sults) as well as fractional splanchnic protein degradation (< 21%vs. < 13%) and synthesis (< 19% vs. < 12%) would be greaterusing this model. Transamination rates in the legs and thesplanchnic area were also greater with Cheng’s than with thesix-compartment model. One reason for the lower rates esti-mated by the compartmental model may be the use of hepatic-venous KIC SA as the precursor pool to calculate intracellularrates, as opposed to venous leucine enrichment(s) used inCheng’s model (see Methods). Since the splanchnic bed pro-duced both labeled and unlabeled KIC, venous KIC SA (usedin the denominator) was greater than that of venous leucine,therefore splanchnic kinetic rates were lower with our model(see Tables III and IV). On the other hand, the reasons whyleg transamination rates were lower using the compartmentalthan Cheng’s model are not immediately apparent. They mightdepend on compartmentation and/or on the different way ofcalculation. Interestingly, however, the ratio between leucineloss through deamination versus protein synthesis (< 2.98)measured across the forearm of fasted humans (66) was closer toour leg data also calculated with the same model (< 2.21), thanto those calculated with the compartmental model (< 1.37).The persisting discrepancies might be due either to differencesbetween leg versus forearm metabolism, to sampling in arterial
Kidney and Splanchnic Protein Turnover in Humans 1491
blood (our study) versus arterialized plasma (66), or to themono-labeled (our study) versus the di-labeled (32, 66) leucinestable isotope.
In conclusion, this study provides the first report of leucine,therefore, protein turnover, measured across the human kid-ney, also in comparison with that of the legs and the splanchnicarea. These normal reference data could be useful in the inves-tigation of the sites and the possible mechanisms of proteinwasting, observed in many systemic as well as organ diseases.
Acknowledgments
Dr. Luisa De Biasi is acknowledged for her collaboration in somestudies.
This study was supported by grants from the Italian National Re-search Council (CNR) (Target Project Biotechnology and Bioinstru-mentatation; Target Project Aging, SP 3, N8 92.00278, PF40).
References
1. Waterlow, J.C., P.J. Garlick, and D.J. Millward. 1978. Protein turnover inmammalian tissues and in the whole body. North Holland Publishing Co., Am-sterdam, New York, Oxford.
2. Bjorntorp, P., and L. Sjostrom. 1978. Carbohydrate metabolism in man.Speculation and some quantitative consideration. Metab. Clin. Exp. 27:1853–1863.
3. Barrett, E.J., and R.A. Gelfand. 1989. The in vivo study of cardiac andskeletal muscle protein turnover. Diabetes Metab. Rev. 5:133–148.
4. Munro, H.N., and M.C. Crim. 1988. The proteins and amino acids. InModern Nutrition in Health and Disease. M.E. Shils and V.R. Young, editors.Lea & Febiger, Philadelphia. 1–37.
5. May, R., B. Logue, B. Edwards, and S. Patel. 1993. An in vitro methodfor the determination of protein turnover in incubated proximal tubule seg-ments. Kidney Int. 43:1156–1159.
6. Goldspink, D.F., and F.J. Kelly. 1984. Protein turnover and growth in thewhole body, liver and kidney of the rat from the foetus to senility. Biochem. J.217:507–516.
7. Ogden, D.A. 1983. Consequences of renal donation in man. Am. J. Kid-ney Dis. 2:501–511.
8. Mogensen, C.E., and M.J.F. Andersen. 1973. Increased kidney size andglomerular filtration rate in early juvenile diabetes. Diabetes. 22:706–712.
9. Tizianello, A., G. Deferrari, G. Garibotto, G. Gurreri, and C. Robaudo.1980. Renal metabolism of amino acids and ammonia in subjects with normalrenal function and in patients with chronic renal insufficiency. J. Clin. Invest. 65:1162–1173.
10. Wahren, J., and P. Felig. 1975. Renal substrate exchange in human dia-betes mellitus. Diabetes. 24:730–734.
11. Heys, S.D., K.G.M. Park, M.A. McNurlan, R.A. Keenan, J.D.B. Miller,O. Eremin, and P.J. Garlick. 1982. Protein synthesis rates in colon and liver.Stimulation by gastrointestinal pathologies. Gut. 33:976–981.
12. Gelfand, R.A., M.G. Glickman, P. Castellino, R.J. Louard, and R.A.DeFronzo. 1988. Measurement of l-[1-14C]leucine kinetics in splanchnic and legtissues in man. Diabetes. 37:1365–1372.
13. Fong, Y., D.E. Matthews, W. He, M.A. Marano, L.L. Moldawer, andS.F. Lowry. 1994. Whole body and splanchnic leucine, phenylalanine and glu-cose kinetics during endotoxemia in humans. Am. J. Physiol. 266:R419–R425.
14. Shinnick, F.L., and A.E. Harper. 1976. Branched-chain amino acid oxi-dation by isolated rat tissue preparations. Biochim. Biophys. Acta. 437:477–486.
15. Krebs, H.A., and P. Lund. 1977. Aspects of the regulation of the metab-olism of branched chain amino acids. Adv. Enzyme Regul. 15:375–394.
16. Rosenberg, L.E., and C.R. Scriver. 1980. Disorders of amino acid me-tabolism. In Metabolic Control and Disease. P.K. Bondy and L.E. Rosenberg,editors. Saunders, Philadelphia. 707–710.
17. Nair, K.S., C. Ford, K. Ekberg, E. Fernqvist-Forbes, and J. Wahren.1995. Protein dynamics in whole body and in splanchnic and leg tissues in type 1diabetic patients. J. Clin. Invest. 95:2926–2937.
18. Metropolitan Life Foundation. 1983. Metropolitan height and weight ta-bles. Stat. Bull. Metrop. Life Insur. Co. 64:2–17.
19. Classic, K.L., W.F. Schwenk, and M.W. Haymond. 1985. Radiobiologi-cal half-lives for carbon-14 and hydrogen-3 leucine in man. Proceedings of the4th International Radiopharmaceutical Dosimetry Symposium, Oak Ridge,TN. 681–687.
20. Bier, D.M. 1989. Intrinsically difficult problems: the kinetics of bodyproteins and amino acids in man. Diabetes Metab. Rev. 5:111–152.
21. Tessari, P. 1994. Effects of insulin on whole-body and regional aminoacid kinetics. Diabetes Metab. Rev. 10:253–285.
22. Horber, F.F., J. Kahl, L. Lecavalier, B. Krom, and M.W. Haymond.1989. Determination of leucine and a-ketoisocaproic acid concentrations andspecific activity in plasma and of leucine specific activity in proteins using highperformance liquid chromatography. J. Chromatogr. 495:81–94.
23. Tessari, P., S. Inchiostro, M. Vettore, L. Sabadin, and G. Biolo. 1991. Afast HPLC method for the measurement of plasma concentration and specificactivity of phenylalanine. Clin. Biochem. 24:425–428.
24. Schwenk, W.F., P.J. Berg, B. Beaufrere, J.M. Miles, and M.W. Hay-mond. 1984. Use of t-butyldimethylsilylation in the GC/MS analysis of physio-logic compounds found in plasma using electron impact ionization. Anal. Bio-chem. 141:101–109.
25. Tessari, P., S. Inchiostro, M. Zanetti, and R. Barazzoni. 1995. A modelof skeletal muscle leucine kinetics measured across the human forearm. Am. J.Physiol. 269:E127–E136.
26. Herbert, V., L. Kam-Seng, C.W. Gottlieb, and J. Bleicher. 1965. Coatedcharcoal immunoassay of insulin. J. Clin. Endocrinol. & Metab. 25:1375–1384.
27. Faloona, G.R., and R.H. Unger. 1985. Glucagon. In Methods in Hor-mone Radioimmunoassay. B.M. Jaffe and H.R. Behrmann, editors. AcademicPress, New York. 317–330.
28. Bradley, S.E. 1948. Measurement of hepatic blood flow. Methods Med.Res. 1:199–207.
29. Wolff, J.E., E.N. Bergman, and H.H. Williams. 1972. Net metabolism ofplasma amino acids by liver and portal-drained viscera. Am. J. Physiol. 223:438–446.
30. Wahren, J., P. Felig, and L. Hagenfeldt. 1986. Effect of protein ingestionon splanchnic and leg metabolism in normal man and in patients with diabetesmellitus. J. Clin. Invest. 57:987–999.
31. Garibotto, G., G. Deferrari, C. Robaudo, S. Saffioti, A. Sofia, R. Russo,and A. Tizianello. 1995. Disposal of exogenous amino acids by muscle in pa-tients with chronic renal failure. Am. J. Clin. Nutr. 62:136–142.
32. Cheng, K.N., F. Dworzak, G.C. Ford, M.J. Rennie, and D. Halliday.1985. Direct determination of leucine metabolism and protein breakdown inhumans using l-[1-13C, 15N]leucine and the forearm model. Eur. J. Clin. Invest.15:349–353.
33. Horber, F.F., C.M. Horber-Feyder, S. Krayer, W.F. Schwenk, and M.W.Haymond. 1989. Plasma reciprocal pool specific activity predicts that of intra-cellular free leucine for protein synthesis. Am. J. Physiol. 257:E385–E399.
34. Watt, P.W., M.E. Corbett, and M.J. Rennie. 1992. Stimulation of proteinsynthesis in pig skeletal muscle by infusion of amino acids during constant insu-lin availability. Am. J. Physiol. 263:E453–E460.
35. Watt, P.W., Y. Lindsay, C.M. Scrimgeour, P.A. Chien, J.N.A. Gibson,D.J. Taylor, and M.J. Rennie. 1991. Isolation of aminoacyl-tRNA and its label-ing with stable isotope tracers: use of human studies protein synthesis. Proc.Natl. Acad. Sci. USA. 88:5892–5896.
36. Layman, D.K., and R.R. Wolfe. 1987. Sample site selection for tracerstudies applying a unidirectional circulatory approach. Am. J. Physiol. 253:E173–E178.
37. Quinn Baumann, P., W.S. Stirewalt, B.D. O’Rourke, D. Howard, andK.S. Nair. 1994. Precursor pools of protein synthesis: a stable isotope study in aswine model. Am. J. Physiol. 267:E203–E209.
38. Parhofer, K.G., P. Hugh, R. Barrett, D.M. Bier, and G. Schonfeld. 1991.Determination of kinetic parameters of apolipoprotein B metabolism usingamino acids labeled with stable isotopes. J. Lipid Res. 32:1311–1323.
39. Cryer, D.R., T. Matsushima, J.B. Marsh, M. Yudkoff, P.M. Coates, andJ.A. Cortner. 1986. Direct measurement of apolipoprotein B synthesis in hu-man very low density lipoprotein using stable isotopes and mass spectrometry.J. Lipid Res. 27:508–516.
40. Biolo, G., A. Gastaldelli, X. Zhang, and R.R. Wolfe. 1994. Protein syn-thesis and breakdown in skin and muscle: a leg model of amino acid kinetics.Am. J. Physiol. 267:E467–E474.
41. Schwenk, W.F., B. Beaufrere, and M.W. Haymond. 1985. Use of recip-rocal pool specific activities to model leucine metabolism in humans. Am. J.Physiol. 249:E646–E650.
42. James, W.P.T., P.J. Garlick, P.M. Sender, and J.C. Waterlow. 1976.Studies of amino acid and protein metabolism in normal man with l-(U-14C)ty-rosine. Clin. Sci. Mol. Med. 50:525–532.
43. Okamura, K., L. Wentzel, P. Williams, and P. Flakoll. 1991. The fixationof CO2 by the liver, gut, kidney and hindlimb in vivo. Diabetes. 40:195a. (Abstr.).
44. Denne, S.C., E.A. Litchely, Y.M. Liu, G. Brechtel, and A.D. Baron.1981. Proteolysis in skeletal muscle and whole body in response to euglycemichyperinsulinemia in normal adults. Am. J. Physiol. 261:E809–E814.
45. Biolo, G., P. Tessari, S. Inchiostro, D. Bruttomesso, C. Fongher, L. Sa-badin, M. G. Fratton, A. Valerio, and A. Tiengo. 1992. Leucine and phenylala-nine kinetics during mixed meal ingestion. A multiple tracer approach. Am. J.Physiol. 262:E455–E463.
46. Matthews, D.E., M.A. Marano, and R.G. Campbell. 1993. Splanchnicbed utilization of leucine and phenylalanine in humans. Am. J. Physiol. 264:E109–E118.
47. Ichihara, A., and E. Koyama. 1966. Transaminase of branched-chainamino acids. J. Biochem. 59:160–169.
48. Cohen Julius, J., and E. Kamm-Donald. 1976. Renal metabolism: rela-tion to renal function. In The Kidney. B. Brenner and F.C. Rector, editors.
1492 Tessari et al.
Saunders, Philadelphia. 126–205.49. Young, V.R. 1964. The role of skeletal and cardiac muscle in the regula-
tion of protein metabolism. In Mammalian Protein Metabolism. H.N. Munroand J.B. Allison, editors. Vol. 4. Academic Press, New York. Chapter 40:585–659.
50. Castellino, P., A. Solini, L. Luzi, J. Grant-Barr, D.J. Smith, A.S. Pet-rides, and R.A. DeFronzo. 1992. Glucose and amino acid metabolism in pa-tients with chronic renal failure. Am. J. Physiol. 262:F168–F176.
51. Reeds, P.J., M.F. Fuller, and B.A. Nicholson. 1985. Metabolic basis ofenergy expenditure with particular reference to protein. In Substrate and En-ergy Metabolism in Man. J.S. Garrow and D. Halliday, editors. John Libbey,London, Paris. 46–57.
52. Lloyd, L.E., B.E. McDonald, and E.W. Crampton. 1978. General com-position of the animal body and its tissues. In Fundamentals of Nutrition. 2ndEd. W.H. Freeman and Co. San Francisco. Section I, Chapter 4:36–46.
53. Maak, T. 1975. Renal handling of low molecular weight proteins. Am. J.Med. 58:57–64.
54. Tring-Trang-Tan, M.M., O. Levillain, and L. Bankir. 1988. Contributionof leucine to oxidative metabolism of the rat medullary thick ascending limb.Pflügers Archiv. 411:676–680.
55. Matthews, D.E., D.M. Bier, M.J. Rennie, R.H.T. Edwards, D. Halliday,D.J. Millward, and G.C. Clugston. 1980. Regulation of leucine metabolism inman: a stable isotope study. Science (Wash. DC). 214:1129–1131.
56. Yu, Y.M., D.A. Wagner, E.E. Tredget, J.A. Walaszewski, J.F. Burke,and V.R. Young. 1990. Quantitative role of splanchnic region in leucine metab-olism: l-[1-13C, 15N]leucine and substrate balance studies. Am. J. Physiol. 259:E36–E51.
57. Eriksson, L.S., L. Hagelfeldt, P. Felig, and J. Wahren. 1983. Leucine up-take by splanchnic and leg tissues in man: relative independence of insulin lev-els. Clin. Sci. 65:491–498.
58. Tessari, P., S. Inchiostro, G. Biolo, E. Vincenti, and L. Sabadin. 1991.Effects of acute systemic hyperinsulinemia on forearm muscle proteolysis inhealthy man. J. Clin. Invest. 88:27–33.
59. Gelfand, R.A., and E.J. Barrett. 1987. Effect of physiologic hyperin-sulinemia on skeletal muscle protein synthesis and breakdown in man. J. Clin.Invest. 80:1–6.
60. Arfviddsson, B., H. Zachrisson, A.C. Möller-Loswick, A. Hyltander, R.Sandström, and K. Lundholm. 1991. Effect of systemic hyperinsulinemia onamino acid flux across human legs in postabsorptive state. Am. J. Physiol. 260:E46–E52.
61. Heslin, M.J.E., E. Newman, R.F. Wolf, and P.W.T. Pisters. 1992. Effectof hyperinsulinemia on whole body and skeletal muscle leucine carbon kineticsin humans. Am. J. Physiol. 262:E911–E918.
62. Munro, H.N., and A. Fleck. 1969. Analysis of tissues and body fluids fornitrogenous constituents. In Mammalian Protein Metabolism. H.N. Munro, ed-itor. Academic Press, New York. 424–508.
63. Martin, A.F., M. Rabinowitz, R. Blough, G. Prior, and R. Zak. 1977.Measurement of half life of cardiac myosin heavy chain with leucyl-tRNA usedas a precursor pool. J. Biol. Chem. 252:3422–3429.
64. Tourian, A., A.J. Goddart, and T.T. Puck. 1969. Phenylalanine hydroxy-lase activity in mammalian cells. J. Cell. Physiol. 73:159–165.
65. Halliday, D., and R.O. McKeran. 1975. Measurement of muscle proteinsynthetic rate from serial muscle biopsies and total body protein turnover inman by continuous intravenous infusion of l-[a-15N]lysine. Clin. Sci. 49:581–590.
66. Cheng, K.N., P.J. Pacy, F. Dworzak, G.C. Ford, and D. Halliday. 1987.Influence of fasting on leucine and muscle protein metabolism across the hu-man forearm determined using l-[1-13C, 15N]leucine as the tracer. Clin. Sci. 73:241–246.