kg tshabalala et al 2012 jvtbd9303031401 1
TRANSCRIPT
Enhanced green emission from UV down-converting Ce31–Tb31 co-activatedZnAl2O4 phosphor
K. G. Tshabalala, I. M. Nagpure, H. C. Swart, and O. M. Ntwaeaborwaa)
Department of Physics, University of the Free State, P. O. Box 339, Bloemfontein, ZA 9300, South Africa
S.-H. Cho and J.-K. ParkNano Materials Center, Korea Institute of Science and Technology, 39-1 Hawolkok, Seoul 136-791,South Africa
(Received 10 November 2011; accepted 3 March 2012; published 22 March 2012)
Ce3þ–Tb3þ co-activated ZnAl2O4 powder phosphors were prepared by a solution combustion
method using urea as a fuel. X-ray diffraction characterization showed that all the powders crystal-
lized in the well known cubic spinel phase of ZnAl2O4. An enhanced down-converted green emis-
sion associated with the 5D4!7F5 transitions of Tb3þ ions was observed at 543 nm from the
ZnAl2O4:Ce3þ, Tb3þ powders with different concentrations of Ce3þ and Tb3þ. It was inferred from
the fluorescence decay data that the enhancement was due to energy transfer from Ce3þ to Tb3þ. Fur-
ther, cathodoluminescence intensity degradation of the ZnAl2O4:Ce3þ, Tb3þ powder phosphors was
investigated when the powders were irradiated with 2 keV electrons. X-ray photoelectron spectros-
copy was used to analyze the chemical and electronic states of individual elements before and after
electron irradiation. The ZnAl2O4:Ce3þ, Tb3þ phosphor was evaluated to be used as a UV down-
converting layer in conventional silicon photovoltaic cells or as a source of green light in field emis-
sion display technologies. VC 2012 American Vacuum Society.
[http://dx.doi.org/10.1116/1.3696720]
I. INTRODUCTION
Zinc aluminate (ZnAl2O4) with a cubic spinel crystal struc-
ture is a family of metal aluminate semiconducting materials
and it is widely used as ceramic or catalyst. It has a wide band
gap of �3.8 eV, which makes it suitable for application in
optoelectronics. It is used in modern research as a host for
rare earth (e.g., Ce3þ and Tb3þ) and alkali earth metal (e.g.,
Mn2þ and Co2þ)1�5 ion activators to prepare phosphors,
which can be used in different types of light emitting devices.
In our preliminary study, we investigated the effects of differ-
ent parameters, such as low activator concentrations, anneal-
ing temperatures and excitation wavelengths on the efficiency
of green emission from ZnAl2O4:Ce3þ, Tb3þ (Ref. 6). In the
present study, we set out to determine systematically the max-
imum concentration of Tb3þ or Ce3þ singly activated and, in
turn, the maximum concentration of Tb3þ–Ce3þ co-activated
ZnAl2O4 that could result in an efficient energy transfer from
Ce3þ to Tb3þ by an UV down-conversion process. The objec-
tive of this study was to prepare efficient phosphors that can
be used as UV down-converting layers to improve the absorp-
tion efficiency and, hence, the general performance of the
conventional silicon photovoltaic cells. In addition, the phos-
phors were evaluated for possible application in low voltage
cathodoluminescent devices, such as field emission displays.
In this instance, the phosphors were irradiated with 2 keV
electrons and the effects of prolonged electron irradiation on
the CL intensity and the chemical changes taking place on the
surface were monitored.
II. EXPERIMENT
Ce3þ and Tb3þ co-activated ZnAl2O4 phosphors with dif-
ferent concentrations of Ce3þ and Tb3þ were prepared by a
combustion method. More details on the preparation of
ZnAl2O4: Ce3þ, Tb3þ phosphors by the combustion method
can be found in the literature.6 In a typical preparation, stoi-
chiometric amounts of zinc nitrate hexahydrate Zn(NO3)2
6H2O, aluminum nitrate nanohydrate (Al(NO3)3 9H2O), urea
(CH4N2O), cerium nitrate hexahydrate (Ce(NO3)3 6H2O),
and=or terbium nitrate hexahydrate (Tb(NO3)3 6H2O) of AR
grate from Sigma Aldrich (South Korea) were dissolved in
de-ionized water. The combustion reaction was carried out
in a muffle furnace maintained at 500 �C. ZnAl2O4:Ce3þ,
ZnAl2O4:Tb3þ, and ZnAl2O4:Ce3þ, Tb3þ powder phosphors
with different concentrations of Ce3þ and Tb3þ were
prepared.
X-ray diffraction (XRD) measurements were carried out
using a PANalytical X’Pert PRO diffractometer using Cu
Ka radiation (k¼ 1.5406 A). An accelerating voltage was
set at 40 kV and current at 30 mA. Photoluminescence (ex-
citation and emission) measurements were carried out at
room temperature using Hitachi F-7000 fluorescence spec-
trometer coupled with a monochromatized xenon lamp with
an output power of 150 W. The fluorescence decay data
were recorded using an inverted-type scanning confocal
microscope (MicroTime-200, Picoquant, Germany). A
single-mode pulsed laser diode (375 nm wavelength with an
instrumental response function of �240 ps in full-width at
half-maximum, 40 MHz repetition rate, and an average
power of �1 lW) was used as an excitation source. Catho-
doluminescent (CL) data were collected using Ocean Optics
S2000 CL spectrometer mounted on one of the ports of a
vacuum chamber of the PHI 549 Auger spectrometer. The
a)Author to whom correspondence should be addressed; electronic mail:
031401-1 J. Vac. Sci. Technol. B 30(3), May/Jun 2012 1071-1023/2012/30(3)/031401/6/$30.00 VC 2012 American Vacuum Society 031401-1
Author complimentary copy. Redistribution subject to AIP license or copyright, see http://jvb.aip.org/jvb/copyright.jsp
data were collected when the powders were irradiated with
2 keV electrons continuously for 10 h at the chamber pres-
sure of 1.3� 10�8 Torr. The chemical and electron states of
the irradiated and un-irradiated powders were analyzed
using PHI 5000 versa probe x-ray photoelectron spectrome-
ter (XPS). High resolution XPS peaks of individual ele-
ments were fitted using a MULTIPACK v8.2c data analysis
software.
III. RESULTS AND DISCUSSIONS
A. X-ray diffraction
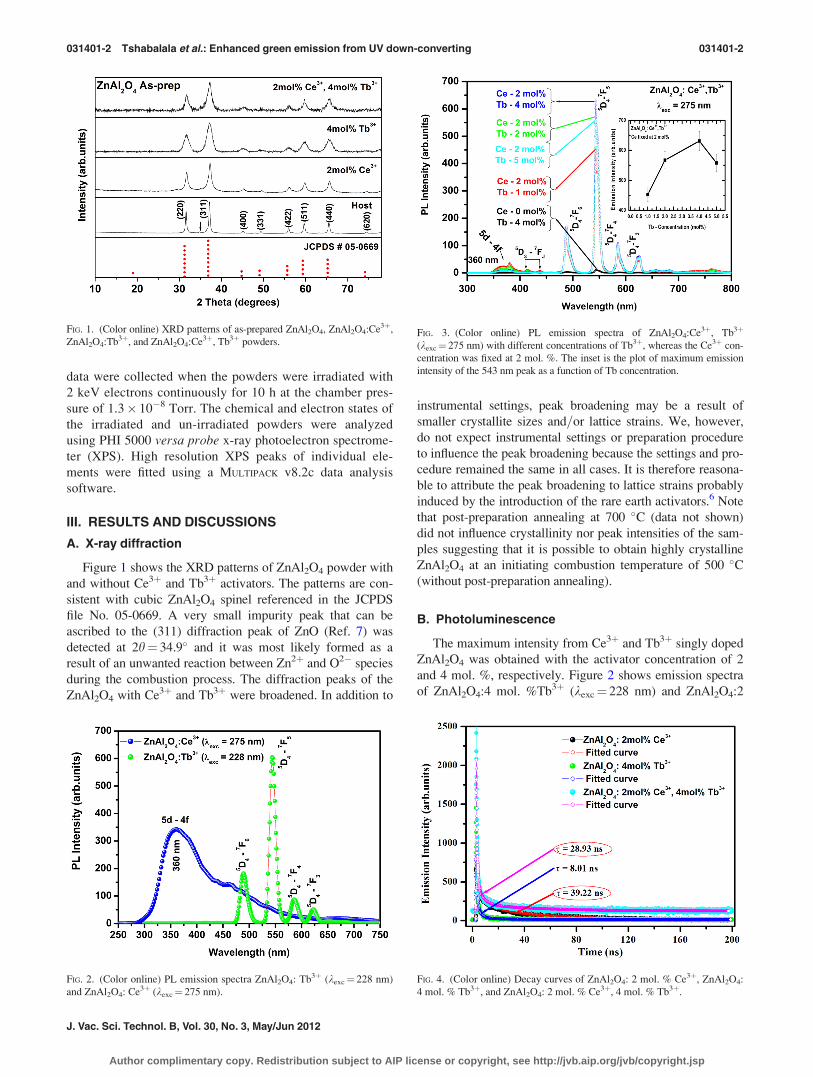
Figure 1 shows the XRD patterns of ZnAl2O4 powder with
and without Ce3þ and Tb3þ activators. The patterns are con-
sistent with cubic ZnAl2O4 spinel referenced in the JCPDS
file No. 05-0669. A very small impurity peak that can be
ascribed to the (311) diffraction peak of ZnO (Ref. 7) was
detected at 2h¼ 34.9� and it was most likely formed as a
result of an unwanted reaction between Zn2þ and O2� species
during the combustion process. The diffraction peaks of the
ZnAl2O4 with Ce3þ and Tb3þ were broadened. In addition to
instrumental settings, peak broadening may be a result of
smaller crystallite sizes and=or lattice strains. We, however,
do not expect instrumental settings or preparation procedure
to influence the peak broadening because the settings and pro-
cedure remained the same in all cases. It is therefore reasona-
ble to attribute the peak broadening to lattice strains probably
induced by the introduction of the rare earth activators.6 Note
that post-preparation annealing at 700 �C (data not shown)
did not influence crystallinity nor peak intensities of the sam-
ples suggesting that it is possible to obtain highly crystalline
ZnAl2O4 at an initiating combustion temperature of 500 �C(without post-preparation annealing).
B. Photoluminescence
The maximum intensity from Ce3þ and Tb3þ singly doped
ZnAl2O4 was obtained with the activator concentration of 2
and 4 mol. %, respectively. Figure 2 shows emission spectra
of ZnAl2O4:4 mol. %Tb3þ (kexc¼ 228 nm) and ZnAl2O4:2
FIG. 1. (Color online) XRD patterns of as-prepared ZnAl2O4, ZnAl2O4:Ce3þ,
ZnAl2O4:Tb3þ, and ZnAl2O4:Ce3þ, Tb3þ powders.
FIG. 2. (Color online) PL emission spectra ZnAl2O4: Tb3þ (kexc¼ 228 nm)
and ZnAl2O4: Ce3þ (kexc¼ 275 nm).
FIG. 3. (Color online) PL emission spectra of ZnAl2O4:Ce3þ, Tb3þ
(kexc¼ 275 nm) with different concentrations of Tb3þ, whereas the Ce3þ con-
centration was fixed at 2 mol. %. The inset is the plot of maximum emission
intensity of the 543 nm peak as a function of Tb concentration.
FIG. 4. (Color online) Decay curves of ZnAl2O4: 2 mol. % Ce3þ, ZnAl2O4:
4 mol. % Tb3þ, and ZnAl2O4: 2 mol. % Ce3þ, 4 mol. % Tb3þ.
031401-2 Tshabalala et al.: Enhanced green emission from UV down-converting 031401-2
J. Vac. Sci. Technol. B, Vol. 30, No. 3, May/Jun 2012
Author complimentary copy. Redistribution subject to AIP license or copyright, see http://jvb.aip.org/jvb/copyright.jsp
mol. %Ce3þ (kexc¼ 275 nm). The well known characteristic
emissions associated with the 5D4–7FJ (J¼ 3–6) transitions
of Tb3þ were observed with the major emission at 543
nm (5D4–7F5 transition). The PL emission spectrum of
ZnAl2O4:Ce3þ consists of broad emission band with a maxi-
mum at 360 nm. This emission can be associated with 5d1
! 4f1 transitions of Ce3þ (Refs. 8–10). Figure 3 compares the
PL emission (kexc¼ 275 nm) spectra of the co-activated
ZnAl2O4:Ce3þ, Tb3þ powders to that of Tb3þ (4 mol. %) sin-
gly activated ZnAl2O4. The concentration of Ce3þ was fixed
at 2 mol. % and that of Tb3þ was varied from 1 to 5 mol. %
in ZnAl2O4:Ce3þ, Tb3þ. The intensity of the emission at 543
nm from ZnAl2O4:Tb3þ was much smaller than that from
ZnAl2O4:Ce3þ, Tb3þ. The broad emission from Ce3þ at
�360 nm was almost quenched, whereas the major emission
from Tb3þ at 543 nm was improved due to Ce3þ co-doping.
Consistent with the PL data of Ce3þ and Tb3þ singly doped
samples (Fig. 2), this emission was maximized when 2 mol.
% of Ce3þ was co-doped with 4 mol. % as shown in the inset.
The enhancement of the 543 nm emission from Tb3þ and the
simultaneously quenching of Ce3þ emission at �360 nm sug-
gest that Ce3þ acted to harvest high energy UV photons from
the excitation source and were subsequently down-converted
to low energy visible photons to enhance the emission from
Tb3þ. As previously reported11 energy transfer from Ce3þ to
Tb3þ by the down-conversion process is probably by phonon
mediated processes. The UV down-converting phosphors can
be used as coatings in conventional silicon photovoltaic (PV)
cells to absorb UV photons from sunlight and down-convert
them to visible photons that can be easily captured and con-
verted to electrical energy by silicon. This can improve the
general performance of PV cells. Chung and Holloway12
reported improved performance of the PV cells when the cells
were coated with a photoluminescent Y2O3:Eu3þ layer.
C. Fluorescence decay
Figure 4 shows fluorescence decay curves of ZnAl2O4: 2
mol. %Ce3þ (kem¼ 410 nm), ZnAl2O4: 4 mol. %Tb3þ
(kem¼ 543 nm) and ZnAl2O4: 2 mol. %Ce3þ, 4 mol. %Tb3þ
(kem¼ 410 nm) powders recorded when the powders were
excited at 375 nm using a single mode pulsed diode laser. The
average lifetimes calculated using the procedure reported in
Ref. 7 were 39.22, 8.01, and 28.93 ns for ZnAl2O4: 2 mol.
%Ce3þ, ZnAl2O4: 4 mol. %Tb3þ, and ZnAl2O4:2 mol.
%Ce3þ, 4 mol. %Tb3þ, respectively. Notice that the lifetime
of the 410 nm emission of ZnAl2O4:2 mol. %Ce3þ, 4 mol.
%Tb3þ was 10.29 ns shorter than that of ZnAl2O4: 2 mol.
%Ce3þ. The shortening of this emission suggests that some of
the absorbed UV photons were transferred to Tb3þ at a rate
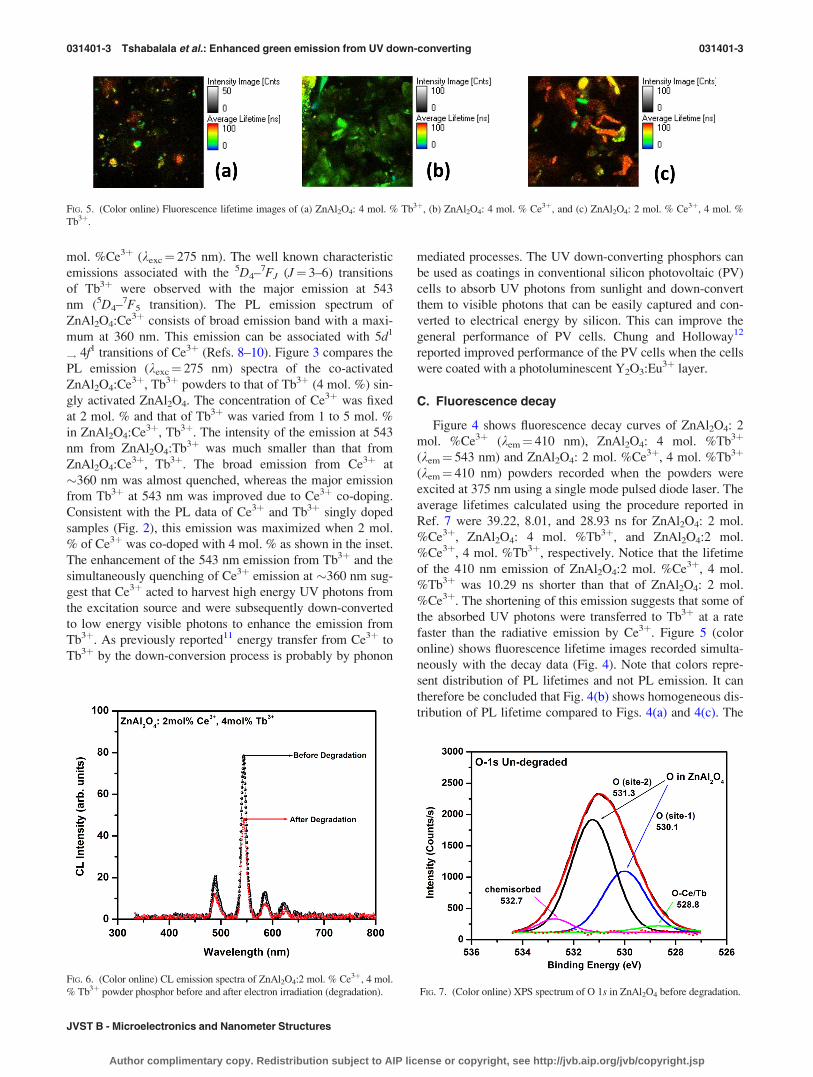
faster than the radiative emission by Ce3þ. Figure 5 (color
online) shows fluorescence lifetime images recorded simulta-
neously with the decay data (Fig. 4). Note that colors repre-
sent distribution of PL lifetimes and not PL emission. It can
therefore be concluded that Fig. 4(b) shows homogeneous dis-
tribution of PL lifetime compared to Figs. 4(a) and 4(c). The
FIG. 5. (Color online) Fluorescence lifetime images of (a) ZnAl2O4: 4 mol. % Tb3þ, (b) ZnAl2O4: 4 mol. % Ce3þ, and (c) ZnAl2O4: 2 mol. % Ce3þ, 4 mol. %
Tb3þ.
FIG. 6. (Color online) CL emission spectra of ZnAl2O4:2 mol. % Ce3þ, 4 mol.
% Tb3þ powder phosphor before and after electron irradiation (degradation). FIG. 7. (Color online) XPS spectrum of O 1s in ZnAl2O4 before degradation.
031401-3 Tshabalala et al.: Enhanced green emission from UV down-converting 031401-3
JVST B - Microelectronics and Nanometer Structures
Author complimentary copy. Redistribution subject to AIP license or copyright, see http://jvb.aip.org/jvb/copyright.jsp
vertical grayscale bar represents intensity, whereas the rain-
bow color bar represents fluorescence lifetime. The colors
were averaged to represent the fluorescence lifetimes.
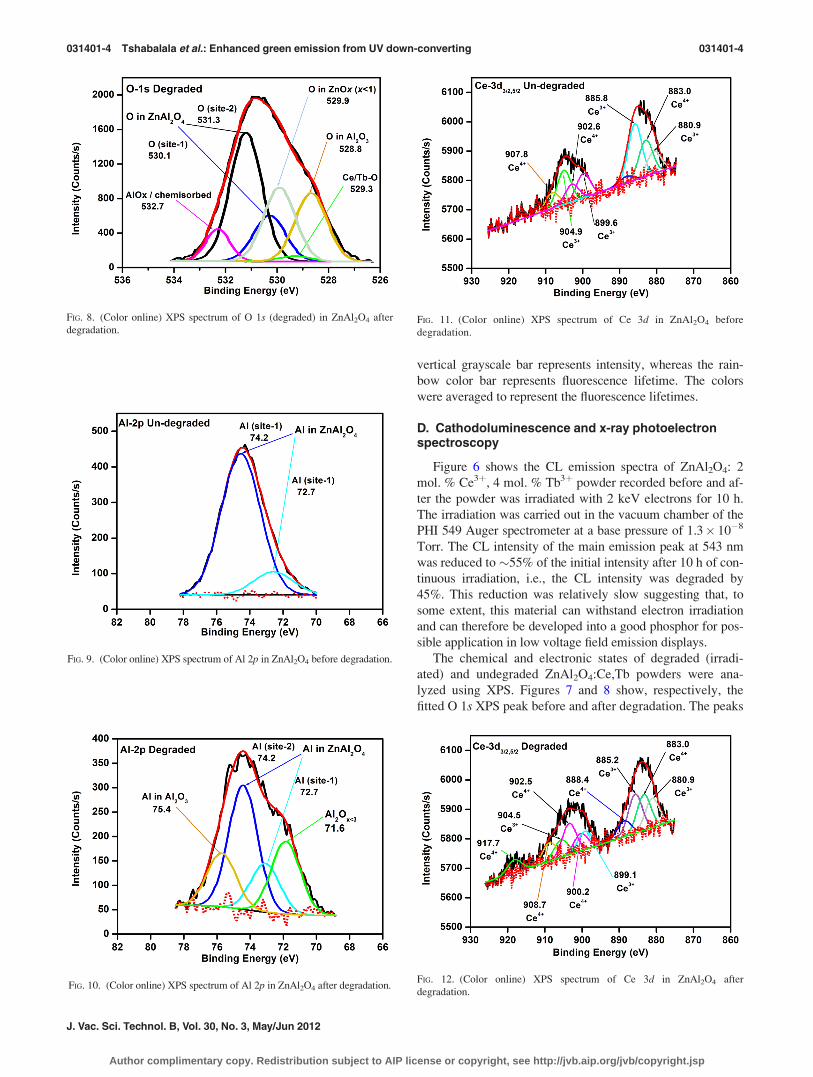
D. Cathodoluminescence and x-ray photoelectronspectroscopy
Figure 6 shows the CL emission spectra of ZnAl2O4: 2
mol. % Ce3þ, 4 mol. % Tb3þ powder recorded before and af-
ter the powder was irradiated with 2 keV electrons for 10 h.
The irradiation was carried out in the vacuum chamber of the
PHI 549 Auger spectrometer at a base pressure of 1.3� 10�8
Torr. The CL intensity of the main emission peak at 543 nm
was reduced to �55% of the initial intensity after 10 h of con-
tinuous irradiation, i.e., the CL intensity was degraded by
45%. This reduction was relatively slow suggesting that, to
some extent, this material can withstand electron irradiation
and can therefore be developed into a good phosphor for pos-
sible application in low voltage field emission displays.
The chemical and electronic states of degraded (irradi-
ated) and undegraded ZnAl2O4:Ce,Tb powders were ana-
lyzed using XPS. Figures 7 and 8 show, respectively, the
fitted O 1s XPS peak before and after degradation. The peaks
FIG. 8. (Color online) XPS spectrum of O 1s (degraded) in ZnAl2O4 after
degradation.
FIG. 9. (Color online) XPS spectrum of Al 2p in ZnAl2O4 before degradation.
FIG. 10. (Color online) XPS spectrum of Al 2p in ZnAl2O4 after degradation.
FIG. 11. (Color online) XPS spectrum of Ce 3d in ZnAl2O4 before
degradation.
FIG. 12. (Color online) XPS spectrum of Ce 3d in ZnAl2O4 after
degradation.
031401-4 Tshabalala et al.: Enhanced green emission from UV down-converting 031401-4
J. Vac. Sci. Technol. B, Vol. 30, No. 3, May/Jun 2012
Author complimentary copy. Redistribution subject to AIP license or copyright, see http://jvb.aip.org/jvb/copyright.jsp
at 530.1 and 531.3 eV in Fig. 7 are O peaks in the ZnAl2O4
lattice,16 whereas the 532.7 and 528.8 eV peaks can, respec-
tively, be assigned to O atoms chemically bonded to chemi-
sorbed and Ce=Tb–O.13,14 As shown in Fig. 8, additional
peaks developed at 529.9 and 528.8 eV after 10 h of electron
irradiation and they can be assigned to O in newly formed
oxygen-deficient ZnOx<1 and Al2O3 compounds. These
compounds were possibly formed as a result of chemical
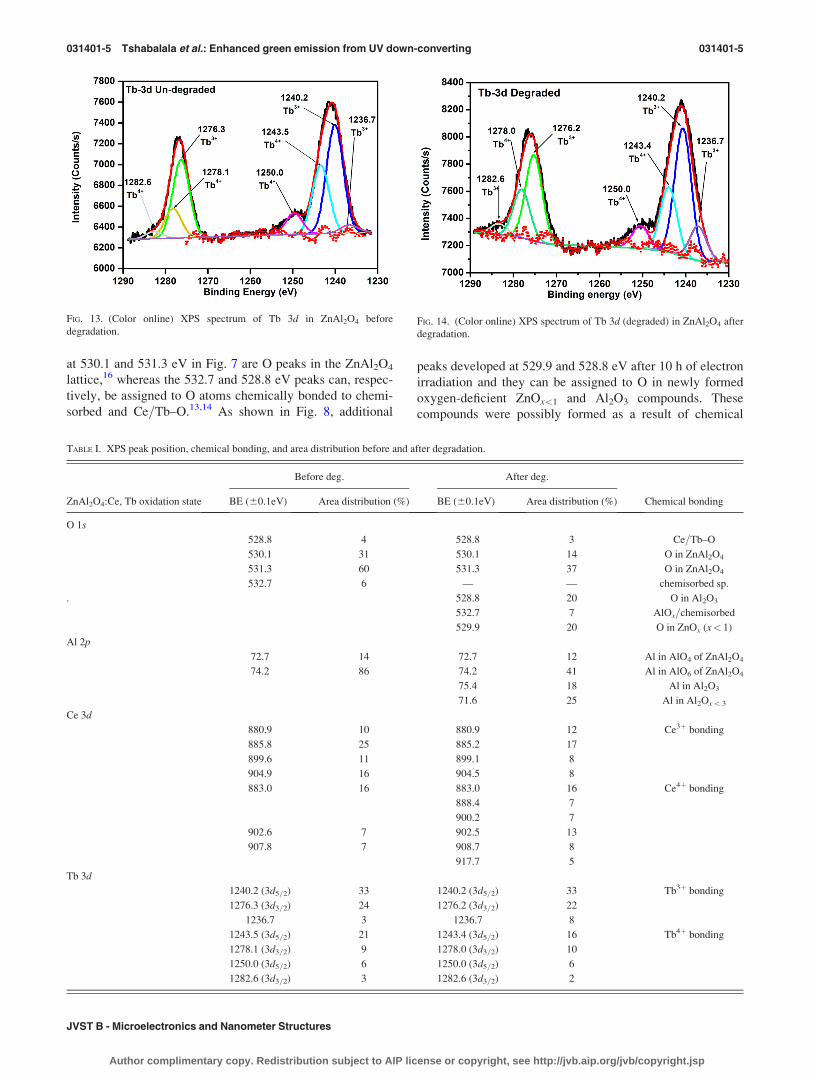
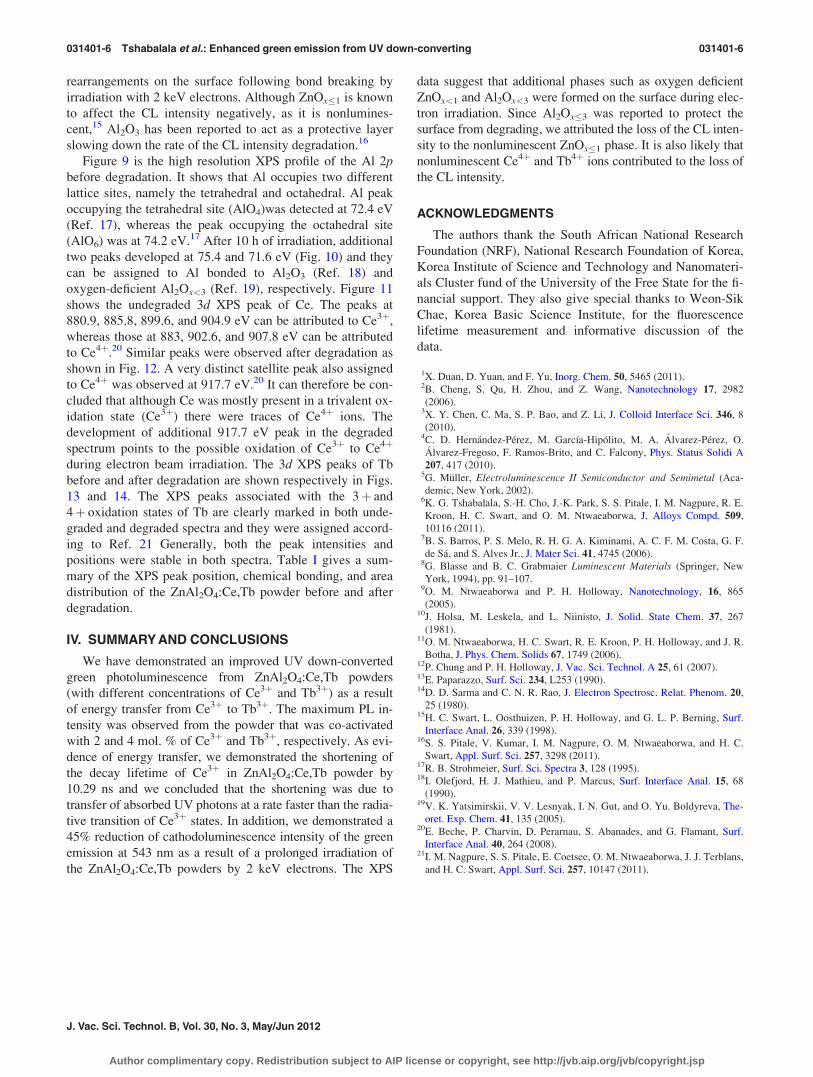
FIG. 13. (Color online) XPS spectrum of Tb 3d in ZnAl2O4 before
degradation.
TABLE I. XPS peak position, chemical bonding, and area distribution before and after degradation.
Before deg. After deg.
ZnAl2O4:Ce, Tb oxidation state BE (60.1eV) Area distribution (%) BE (60.1eV) Area distribution (%) Chemical bonding
O 1s
528.8 4 528.8 3 Ce=Tb–O
530.1 31 530.1 14 O in ZnAl2O4
531.3 60 531.3 37 O in ZnAl2O4
532.7 6 — — chemisorbed sp.
. 528.8 20 O in Al2O3
532.7 7 AlOx=chemisorbed
529.9 20 O in ZnOx (x< 1)
Al 2p
72.7 14 72.7 12 Al in AlO4 of ZnAl2O4
74.2 86 74.2 41 Al in AlO6 of ZnAl2O4
75.4 18 Al in Al2O3
71.6 25 Al in Al2Ox < 3
Ce 3d
880.9 10 880.9 12 Ce3þ bonding
885.8 25 885.2 17
899.6 11 899.1 8
904.9 16 904.5 8
883.0 16 883.0 16 Ce4þ bonding
888.4 7
900.2 7
902.6 7 902.5 13
907.8 7 908.7 8
917.7 5
Tb 3d
1240.2 (3d5=2) 33 1240.2 (3d5=2) 33 Tb3þ bonding
1276.3 (3d3=2) 24 1276.2 (3d3=2) 22
1236.7 3 1236.7 8
1243.5 (3d5=2) 21 1243.4 (3d5=2) 16 Tb4þ bonding
1278.1 (3d3=2) 9 1278.0 (3d3=2) 10
1250.0 (3d5=2) 6 1250.0 (3d5=2) 6
1282.6 (3d3=2) 3 1282.6 (3d3=2) 2
FIG. 14. (Color online) XPS spectrum of Tb 3d (degraded) in ZnAl2O4 after
degradation.
031401-5 Tshabalala et al.: Enhanced green emission from UV down-converting 031401-5
JVST B - Microelectronics and Nanometer Structures
Author complimentary copy. Redistribution subject to AIP license or copyright, see http://jvb.aip.org/jvb/copyright.jsp
rearrangements on the surface following bond breaking by
irradiation with 2 keV electrons. Although ZnOx�1 is known
to affect the CL intensity negatively, as it is nonlumines-
cent,15 Al2O3 has been reported to act as a protective layer
slowing down the rate of the CL intensity degradation.16
Figure 9 is the high resolution XPS profile of the Al 2pbefore degradation. It shows that Al occupies two different
lattice sites, namely the tetrahedral and octahedral. Al peak
occupying the tetrahedral site (AlO4)was detected at 72.4 eV
(Ref. 17), whereas the peak occupying the octahedral site
(AlO6) was at 74.2 eV.17 After 10 h of irradiation, additional
two peaks developed at 75.4 and 71.6 eV (Fig. 10) and they
can be assigned to Al bonded to Al2O3 (Ref. 18) and
oxygen-deficient Al2Ox<3 (Ref. 19), respectively. Figure 11
shows the undegraded 3d XPS peak of Ce. The peaks at
880.9, 885.8, 899.6, and 904.9 eV can be attributed to Ce3þ,
whereas those at 883, 902.6, and 907.8 eV can be attributed
to Ce4þ.20 Similar peaks were observed after degradation as
shown in Fig. 12. A very distinct satellite peak also assigned
to Ce4þ was observed at 917.7 eV.20 It can therefore be con-
cluded that although Ce was mostly present in a trivalent ox-
idation state (Ce3þ) there were traces of Ce4þ ions. The
development of additional 917.7 eV peak in the degraded
spectrum points to the possible oxidation of Ce3þ to Ce4þ
during electron beam irradiation. The 3d XPS peaks of Tb
before and after degradation are shown respectively in Figs.
13 and 14. The XPS peaks associated with the 3þ and
4þ oxidation states of Tb are clearly marked in both unde-
graded and degraded spectra and they were assigned accord-
ing to Ref. 21 Generally, both the peak intensities and
positions were stable in both spectra. Table I gives a sum-
mary of the XPS peak position, chemical bonding, and area
distribution of the ZnAl2O4:Ce,Tb powder before and after
degradation.
IV. SUMMARY AND CONCLUSIONS
We have demonstrated an improved UV down-converted
green photoluminescence from ZnAl2O4:Ce,Tb powders
(with different concentrations of Ce3þ and Tb3þ) as a result
of energy transfer from Ce3þ to Tb3þ. The maximum PL in-
tensity was observed from the powder that was co-activated
with 2 and 4 mol. % of Ce3þ and Tb3þ, respectively. As evi-
dence of energy transfer, we demonstrated the shortening of
the decay lifetime of Ce3þ in ZnAl2O4:Ce,Tb powder by
10.29 ns and we concluded that the shortening was due to
transfer of absorbed UV photons at a rate faster than the radia-
tive transition of Ce3þ states. In addition, we demonstrated a
45% reduction of cathodoluminescence intensity of the green
emission at 543 nm as a result of a prolonged irradiation of
the ZnAl2O4:Ce,Tb powders by 2 keV electrons. The XPS
data suggest that additional phases such as oxygen deficient
ZnOx<1 and Al2Ox<3 were formed on the surface during elec-
tron irradiation. Since Al2Ox�3 was reported to protect the
surface from degrading, we attributed the loss of the CL inten-
sity to the nonluminescent ZnOx�1 phase. It is also likely that
nonluminescent Ce4þ and Tb4þ ions contributed to the loss of
the CL intensity.
ACKNOWLEDGMENTS
The authors thank the South African National Research
Foundation (NRF), National Research Foundation of Korea,
Korea Institute of Science and Technology and Nanomateri-
als Cluster fund of the University of the Free State for the fi-
nancial support. They also give special thanks to Weon-Sik
Chae, Korea Basic Science Institute, for the fluorescence
lifetime measurement and informative discussion of the
data.
1X. Duan, D. Yuan, and F. Yu, Inorg. Chem. 50, 5465 (2011).2B. Cheng, S. Qu, H. Zhou, and Z. Wang, Nanotechnology 17, 2982
(2006).3X. Y. Chen, C. Ma, S. P. Bao, and Z. Li, J. Colloid Interface Sci. 346, 8
(2010).4C. D. Hernandez-Perez, M. Garcıa-Hipolito, M. A. Alvarez-Perez, O.
Alvarez-Fregoso, F. Ramos-Brito, and C. Falcony, Phys. Status Solidi A
207, 417 (2010).5G. Muller, Electroluminescence II Semiconductor and Semimetal (Aca-
demic, New York, 2002).6K. G. Tshabalala, S.-H. Cho, J.-K. Park, S. S. Pitale, I. M. Nagpure, R. E.
Kroon, H. C. Swart, and O. M. Ntwaeaborwa, J. Alloys Compd. 509,
10116 (2011).7B. S. Barros, P. S. Melo, R. H. G. A. Kiminami, A. C. F. M. Costa, G. F.
de Sa, and S. Alves Jr., J. Mater Sci. 41, 4745 (2006).8G. Blasse and B. C. Grabmaier Luminescent Materials (Springer, New
York, 1994), pp. 91–107.9O. M. Ntwaeaborwa and P. H. Holloway, Nanotechnology, 16, 865
(2005).10J. Holsa, M. Leskela, and L. Niinisto, J. Solid. State Chem. 37, 267
(1981).11O. M. Ntwaeaborwa, H. C. Swart, R. E. Kroon, P. H. Holloway, and J. R.
Botha, J. Phys. Chem. Solids 67, 1749 (2006).12P. Chung and P. H. Holloway, J. Vac. Sci. Technol. A 25, 61 (2007).13E. Paparazzo, Surf. Sci. 234, L253 (1990).14D. D. Sarma and C. N. R. Rao, J. Electron Spectrosc. Relat. Phenom. 20,
25 (1980).15H. C. Swart, L. Oosthuizen, P. H. Holloway, and G. L. P. Berning, Surf.
Interface Anal. 26, 339 (1998).16S. S. Pitale, V. Kumar, I. M. Nagpure, O. M. Ntwaeaborwa, and H. C.
Swart, Appl. Surf. Sci. 257, 3298 (2011).17R. B. Strohmeier, Surf. Sci. Spectra 3, 128 (1995).18I. Olefjord, H. J. Mathieu, and P. Marcus, Surf. Interface Anal. 15, 68
(1990).19V. K. Yatsimirskii, V. V. Lesnyak, I. N. Gut, and O. Yu. Boldyreva, The-
oret. Exp. Chem. 41, 135 (2005).20E. Beche, P. Charvin, D. Perarnau, S. Abanades, and G. Flamant, Surf.
Interface Anal. 40, 264 (2008).21I. M. Nagpure, S. S. Pitale, E. Coetsee, O. M. Ntwaeaborwa, J. J. Terblans,
and H. C. Swart, Appl. Surf. Sci. 257, 10147 (2011).
031401-6 Tshabalala et al.: Enhanced green emission from UV down-converting 031401-6
J. Vac. Sci. Technol. B, Vol. 30, No. 3, May/Jun 2012
Author complimentary copy. Redistribution subject to AIP license or copyright, see http://jvb.aip.org/jvb/copyright.jsp